1 Genome-wide characterization of genetic and functional dysregulation in autism spectrum disorder Arjun Krishnan* ,1 , Ran Zhang* ,2 , Victoria Yao 3 , Chandra L. Theesfeld 1 , Aaron K. Wong 4 , Alicja Tadych 1 , Natalia Volfovsky 4 , Alan Packer 4 , Alex Lash #,4 , Olga G. Troyanskaya #,1,3,4 1 Lewis-Sigler Institute for Integrative Genomics, Princeton University, Princeton, NJ 08544. 2 Department of Molecular Biology, Princeton University, Princeton, NJ 08544. 3 Department of Computer Science, Princeton University, Princeton, NJ 08544. 4 Simons Center for Data Analysis, Simons Foundation, New York, NY 10010. * The first two authors are co-first authors and are listed alphabetically. # Corresponding authors. Abstract Autism spectrum disorder (ASD) is a range of major neurodevelopmental disabilities with a strong genetic basis. Yet, owing to extensive genetic heterogeneity, multiple modes of inheritance and limited study sizes, sequencing and quantitative genetics approaches have had limited success in characterizing the complex genetics of ASD. Currently, only a small fraction of potentially causal genes—about 65 genes out of an estimated several hundred—are known based on strong genetic evidence. Hence, there is a critical need for complementary approaches to further characterize the genetic basis of ASD, enabling development of better screening and therapeutics. Here, we use a machine-learning approach based on a human brain-specific functional gene interaction network to present a genome-wide prediction of autism-associated genes, including hundreds of candidate genes for which there is minimal or no prior genetic evidence. Our approach is validated in an independent case-control sequencing study of approximately 2,500 families. Leveraging these genome-wide predictions and the brain- specific network, we demonstrate that the large set of ASD genes converges on a smaller number of key cellular pathways and specific developmental stages of the brain. Specifically, integration with spatiotemporal transcriptome expression data implicates early fetal and midfetal stages of the developing human brain in ASD etiology. Likewise, analysis of the connectivity of top autism genes in the brain-specific interaction network reveals the breadth of autism- associated functional modules, processes, and pathways in the brain. Finally, we identify likely pathogenic genes within the most frequent autism-associated copy-number-variants (CNVs) and propose genes and pathways that are likely mediators of autism across multiple CNVs. All the predictions, interactions, and functional insights from this work are available to biomedical researchers at asd.princeton.edu. . CC-BY-NC-ND 4.0 International license It is made available under a was not peer-reviewed) is the author/funder, who has granted bioRxiv a license to display the preprint in perpetuity. The copyright holder for this preprint (which . http://dx.doi.org/10.1101/057828 doi: bioRxiv preprint first posted online Jun. 9, 2016;

Welcome message from author
This document is posted to help you gain knowledge. Please leave a comment to let me know what you think about it! Share it to your friends and learn new things together.
Transcript

1
Genome-wide characterization of genetic and functional dysregulation in autism spectrum disorder Arjun Krishnan*,1, Ran Zhang*,2, Victoria Yao3, Chandra L. Theesfeld1, Aaron K. Wong4, Alicja Tadych1, Natalia Volfovsky4, Alan Packer4, Alex Lash#,4, Olga G. Troyanskaya#,1,3,4 1Lewis-Sigler Institute for Integrative Genomics, Princeton University, Princeton, NJ 08544. 2Department of Molecular Biology, Princeton University, Princeton, NJ 08544. 3Department of Computer Science, Princeton University, Princeton, NJ 08544. 4Simons Center for Data Analysis, Simons Foundation, New York, NY 10010.
* The first two authors are co-first authors and are listed alphabetically. # Corresponding authors.
Abstract Autism spectrum disorder (ASD) is a range of major neurodevelopmental disabilities with a strong genetic basis. Yet, owing to extensive genetic heterogeneity, multiple modes of inheritance and limited study sizes, sequencing and quantitative genetics approaches have had limited success in characterizing the complex genetics of ASD. Currently, only a small fraction of potentially causal genes—about 65 genes out of an estimated several hundred—are known based on strong genetic evidence. Hence, there is a critical need for complementary approaches to further characterize the genetic basis of ASD, enabling development of better screening and therapeutics. Here, we use a machine-learning approach based on a human brain-specific functional gene interaction network to present a genome-wide prediction of autism-associated genes, including hundreds of candidate genes for which there is minimal or no prior genetic evidence. Our approach is validated in an independent case-control sequencing study of approximately 2,500 families. Leveraging these genome-wide predictions and the brain-specific network, we demonstrate that the large set of ASD genes converges on a smaller number of key cellular pathways and specific developmental stages of the brain. Specifically, integration with spatiotemporal transcriptome expression data implicates early fetal and midfetal stages of the developing human brain in ASD etiology. Likewise, analysis of the connectivity of top autism genes in the brain-specific interaction network reveals the breadth of autism-associated functional modules, processes, and pathways in the brain. Finally, we identify likely pathogenic genes within the most frequent autism-associated copy-number-variants (CNVs) and propose genes and pathways that are likely mediators of autism across multiple CNVs. All the predictions, interactions, and functional insights from this work are available to biomedical researchers at asd.princeton.edu.
.CC-BY-NC-ND 4.0 International licenseIt is made available under a was not peer-reviewed) is the author/funder, who has granted bioRxiv a license to display the preprint in perpetuity.
The copyright holder for this preprint (which. http://dx.doi.org/10.1101/057828doi: bioRxiv preprint first posted online Jun. 9, 2016;

2
Introduction Complex human diseases such as autism are driven by a multitude of genetic variants across the genome that manifest as a range of developmental and functional perturbations, often in specific tissues and cell types1,2. Sequencing-based discovery efforts3–8 have produced valuable catalogues of genetic variants that point toward potential causal genes of autism. In particular, recent large exome sequencing studies of autism simplex families, as well as case-control cohorts, have combined the evidence from both de novo and transmitted loss-of-function mutations to implicate around 65 genes in autism risk9. However, this represents only a fraction of the estimated 400-1,000 genes likely involved in autism susceptibility10,11. To discover the complete genetic basis of autism and identify the dysregulated cellular and developmental functions of the brain underlying the disease, we need approaches that leverage previously implicated genes in the context of brain-specific biology to discover the full complement of autism-associated genes.
Molecular interaction networks are effective summaries of our knowledge about cellular processes and powerful computational tools for investigating disease genes complementary to sequencing or genetic studies. Previous network-based analyses that focused on autism12–22 (reviewed in23) demonstrate the promise of functional genomics approaches. These methods, however, are limited by the underlying networks themselves. Commonly used networks are based on sets of genes or proteins that are co-expressed in a single developmental context or on protein physical interaction networks that lack tissue-specificity and are still largely incomplete in human. Existing methods, while invaluable, are nevertheless focused on known risk genes or genes with strong prior genetic evidence of ASD association, thus limiting the potential for discovering the full spectrum of disease associated genes.
We address these challenges with an evidence-weighted machine learning approach that utilizes a brain-specific functional interaction network24. The brain-specific network was built by integrating thousands of genomic experiments to create a genome-wide probabilistic graph representing how genes function together in pathways in the brain, or, intuitively, a molecular-level functional map of the brain24. The evidence-weighted disease-gene classifier, described here, learns the connectivity patterns of known ASD genes in this brain network and then uses these data-driven signals specific to ASD-associated genes to predict the level of potential ASD association for every gene in the genome. Using this approach, here we provide predictions of ASD-associated genes, including candidate genes that have minimal or no prior genetic evidence. Many of these candidate genes have been validated by sequencing studies as bona fide ASD-associated genes since the initial predictions were made. Through integrated analysis of the network and our top predictions, we identify developmental stages implicated in ASD, characterize frequent autism-associated CNVs, and discover functional modules potentially dysregulated in the autistic brain. The genome-wide complement of autism candidate genes produced in this study can then be used to systematically prioritize genes for re-sequencing and validation through genetic association, as well as guide the analysis of whole genome sequencing results. This has the potential to accelerate discovery of the full genetic spectrum underlying ASD needed to refine genetic diagnosis and develop treatments.
.CC-BY-NC-ND 4.0 International licenseIt is made available under a was not peer-reviewed) is the author/funder, who has granted bioRxiv a license to display the preprint in perpetuity.
The copyright holder for this preprint (which. http://dx.doi.org/10.1101/057828doi: bioRxiv preprint first posted online Jun. 9, 2016;

3
Results We use a human brain-specific functional interaction network (developed recently24) to predict ASD candidate genes across the genome and then use these predictions to systematically explore the developmental and functional features of the molecular phenotype of autism (Figure 1). Our predictions provide biomedical researchers with a diverse set of ASD candidate genes that they can explore in the context of the underlying brain functional network to further understand autism genetics and develop more focused genetic screening toolkits.
Genome-wide prediction of autism-associated genes We recently developed a gene-interaction network model containing predicted functional relationships for all pairs within 25,825 genes in the human genome specifically in the context of human tissues, including the brain24. The brain-specific network was built using a Bayesian method that extracts and integrates brain-specific functional signals from thousands of gene expression, protein-protein interaction, and regulatory-sequence datasets. Intuitively, the Bayesian approach first learns a “weight” for each input dataset based on how relevant and accurate it is in reflecting how cellular pathways function in the brain. Then the method predicts a probability of functional relationship, reflecting how likely each pair of genes in the genome is to participate in the same pathway in the brain, calculated by probabilistically weighted integration of relevant signals across input datasets (see Supplemental Note 1 for more details).
We developed an evidence-weighted network-based machine-learning method that uses this brain-specific network to systematically discover novel candidate ASD-associated genes across the genome. We first curated 594 genes linked with autism from a number of publicly available databases prior to 2014, ranging from high-confidence genetic associations (e.g., SFARI Gene25 and OMIM26) to automatically text-mined frequent ASD-gene co-occurrences in published abstracts (e.g., Gene2Mesh (gene2mesh.ncibi.org) and DGA27). We grouped these genes into four evidence levels based on the strength of evidence associating them with ASD (E1-4; Table S1). Using these genes along with their evidence levels as positive gold-standard examples and genes annotated to non-mental-health diseases in OMIM as negative examples, we trained an evidence-weighted Support Vector Machine (SVM) classifier using the connectivity of these gold-standard genes to all the genes in the human brain-specific network as features (Figure 1; see Methods). Intuitively, this approach first identifies network patterns that characterize known ASD-related genes while taking into account the level of “trust” in each gene’s association with autism. The patterns consist of genes in the network that are differentially (strongly or weakly) connected to known ASD genes (positives) relative to genes linked to non-mental-health diseases (negatives). The classifier then uses these patterns to calculate a score of potential ASD association for each gene in the genome, identifying novel ASD candidate genes as those that highly resemble known ASD genes in their interaction pattern in the network (Figure S1; Table S2). This produces a comprehensive, genome-wide ranked list of autism candidate genes (Table S3) that is robust to variations in our training gold standard (Figure S2). To improve interpretability of these ASD gene predictions, we estimated probabilities (using isotonic
.CC-BY-NC-ND 4.0 International licenseIt is made available under a was not peer-reviewed) is the author/funder, who has granted bioRxiv a license to display the preprint in perpetuity.
The copyright holder for this preprint (which. http://dx.doi.org/10.1101/057828doi: bioRxiv preprint first posted online Jun. 9, 2016;

4
regression) and permutation-based P values (and corresponding FDR Q values) for each gene (Figure S3, see Methods).
Evaluating only on held-out high-confidence (E1) genes through five-fold cross-validation (repeatedly training a model on 4/5th of E1 genes and testing on the hidden 1/5th), we found that our approach was accurate (AUC = 0.80; Figure 2a). Moreover, this evidence-weighted classifier trained using E1-4 significantly outperformed an unweighted classifier trained using only high-confidence E1 genes (AUC = 0.73), a weighted classifier using only E1 and E2 (AUC = 0.76), and a weighted classifier using E1 and E2 supplemented with random genes that match E3 and E4 in annotation, expression, and gene-length characteristics (AUC = 0.74), thus unequivocally establishing that including lower-confidence genes (E3 and E4) in an evidence-weighted framework helps in significantly improving performance (Figure 2a). Intuitively, this demonstrates that although the individual genes in these lower confidence sets (E3 and E4) are not validated (a substantial fraction may not end up being associated with ASD pathogenesis), as a unit, they still contain signal that is informative for ASD. Our computational approach effectively leverages these signals to improve ASD gene prediction performance.
In addition to computational evaluation by cross-validation, we performed a systematic empirical evaluation based on results from an external exome-sequencing study of 2,517 families7. We focused on de novo likely-gene-disrupting (LGD; also known as loss-of-function) mutations identified in these families with one autistic child (proband), and, in most cases, an unaffected sibling (Table S4). Genes harboring LGD mutations in probands are significantly enriched towards the top of our ranking independent of any specific cutoff (permutation test P = 2.3e-5, see Methods); this enrichment is even more pronounced for recurrent proband LGDs (mutations found more than once among autistic children), which are highly likely to be true autism-associated genes (P = 1e-5). In contrast, this enrichment is absent for genes with LGD mutations in unaffected siblings (P = 0.081), showing that our predictions are specifically ranking LGD-target genes related to autism over those potentially unrelated to the disease (Figure 2b). For further analysis, we focus on the top decile of predicted ASD-associated genes (median FDR < 0.025), which reflects the above trend: these ~2,500 genes are significantly enriched for LGD mutations in probands (binomial test P = 2.7e-9; Figure 2c; see Methods), but not in unaffected siblings (P = 0.12). The enrichment is even more striking for proband recurrent LGDs (P = 5.7e-10), with about 60% of these proband recurrent LGDs present in the top decile. It is important to note that our prediction method does not use the quantitative genetics data as input, and predictions for each gene are made through cross-validation where any potential information about that gene’s known connection to autism (its presence in E1-E4) is “hidden” from the method. In fact, the trends observed in this analysis hold even when the evaluation standard is strictly limited only to ‘novel’ genes not used in our training set that were observed in families still unpublished at the time of our analysis (Figure S4) or when tested on genes identified in a study independent of the SSC8 (P = 4.12e-6). These trends are also not non-specifically biased by long, brain-expressed genes (Supplemental Notes 2 and 3; see Methods). In contrast to prior network-based methods, our approach is able to identify novel candidate genes with no prior genetic link to ASD (Figure S5), while maintaining accuracy (Figures S6).
Our top-ranked first decile predictions include a significant number of experimentally identified targets of major ASD-associated regulators (FMRP28, TOP129, and CHD830), as well as
.CC-BY-NC-ND 4.0 International licenseIt is made available under a was not peer-reviewed) is the author/funder, who has granted bioRxiv a license to display the preprint in perpetuity.
The copyright holder for this preprint (which. http://dx.doi.org/10.1101/057828doi: bioRxiv preprint first posted online Jun. 9, 2016;
5
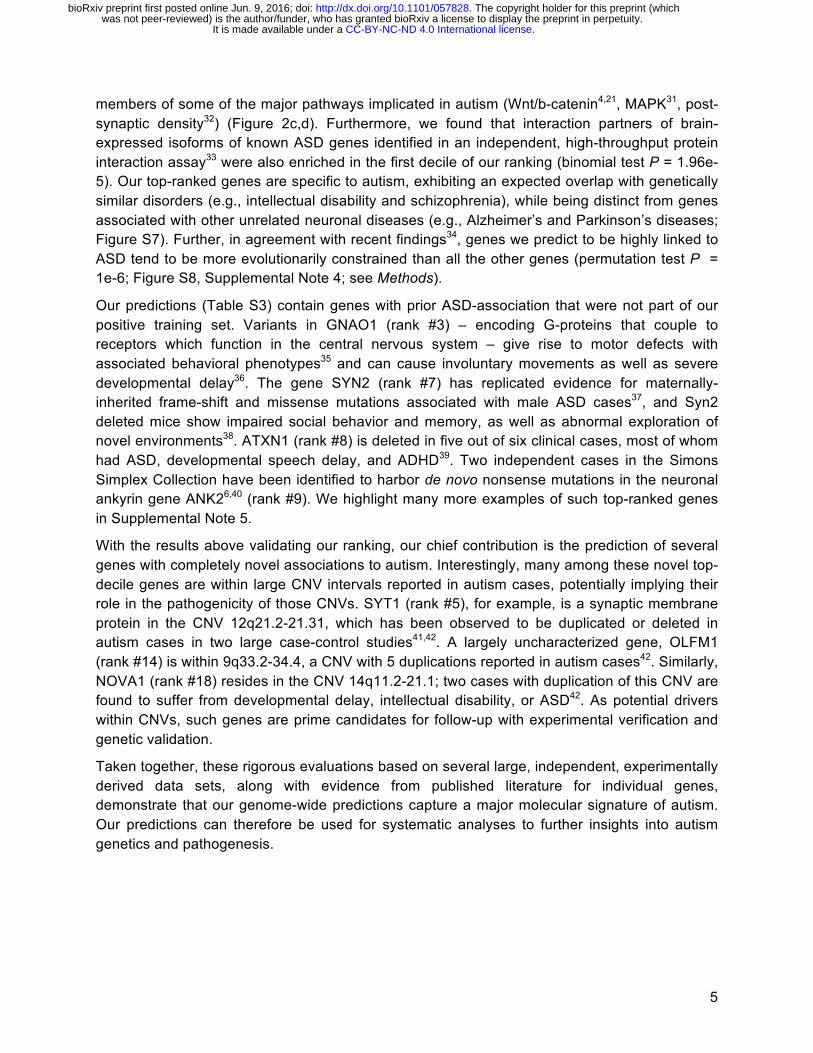
members of some of the major pathways implicated in autism (Wnt/b-catenin4,21, MAPK31, post-synaptic density32) (Figure 2c,d). Furthermore, we found that interaction partners of brain-expressed isoforms of known ASD genes identified in an independent, high-throughput protein interaction assay33 were also enriched in the first decile of our ranking (binomial test P = 1.96e-5). Our top-ranked genes are specific to autism, exhibiting an expected overlap with genetically similar disorders (e.g., intellectual disability and schizophrenia), while being distinct from genes associated with other unrelated neuronal diseases (e.g., Alzheimer’s and Parkinson’s diseases; Figure S7). Further, in agreement with recent findings34, genes we predict to be highly linked to ASD tend to be more evolutionarily constrained than all the other genes (permutation test P = 1e-6; Figure S8, Supplemental Note 4; see Methods).
Our predictions (Table S3) contain genes with prior ASD-association that were not part of our positive training set. Variants in GNAO1 (rank #3) – encoding G-proteins that couple to receptors which function in the central nervous system – give rise to motor defects with associated behavioral phenotypes35 and can cause involuntary movements as well as severe developmental delay36. The gene SYN2 (rank #7) has replicated evidence for maternally-inherited frame-shift and missense mutations associated with male ASD cases37, and Syn2 deleted mice show impaired social behavior and memory, as well as abnormal exploration of novel environments38. ATXN1 (rank #8) is deleted in five out of six clinical cases, most of whom had ASD, developmental speech delay, and ADHD39. Two independent cases in the Simons Simplex Collection have been identified to harbor de novo nonsense mutations in the neuronal ankyrin gene ANK26,40 (rank #9). We highlight many more examples of such top-ranked genes in Supplemental Note 5.
With the results above validating our ranking, our chief contribution is the prediction of several genes with completely novel associations to autism. Interestingly, many among these novel top-decile genes are within large CNV intervals reported in autism cases, potentially implying their role in the pathogenicity of those CNVs. SYT1 (rank #5), for example, is a synaptic membrane protein in the CNV 12q21.2-21.31, which has been observed to be duplicated or deleted in autism cases in two large case-control studies41,42. A largely uncharacterized gene, OLFM1 (rank #14) is within 9q33.2-34.4, a CNV with 5 duplications reported in autism cases42. Similarly, NOVA1 (rank #18) resides in the CNV 14q11.2-21.1; two cases with duplication of this CNV are found to suffer from developmental delay, intellectual disability, or ASD42. As potential drivers within CNVs, such genes are prime candidates for follow-up with experimental verification and genetic validation.
Taken together, these rigorous evaluations based on several large, independent, experimentally derived data sets, along with evidence from published literature for individual genes, demonstrate that our genome-wide predictions capture a major molecular signature of autism. Our predictions can therefore be used for systematic analyses to further insights into autism genetics and pathogenesis.
.CC-BY-NC-ND 4.0 International licenseIt is made available under a was not peer-reviewed) is the author/funder, who has granted bioRxiv a license to display the preprint in perpetuity.
The copyright holder for this preprint (which. http://dx.doi.org/10.1101/057828doi: bioRxiv preprint first posted online Jun. 9, 2016;
6
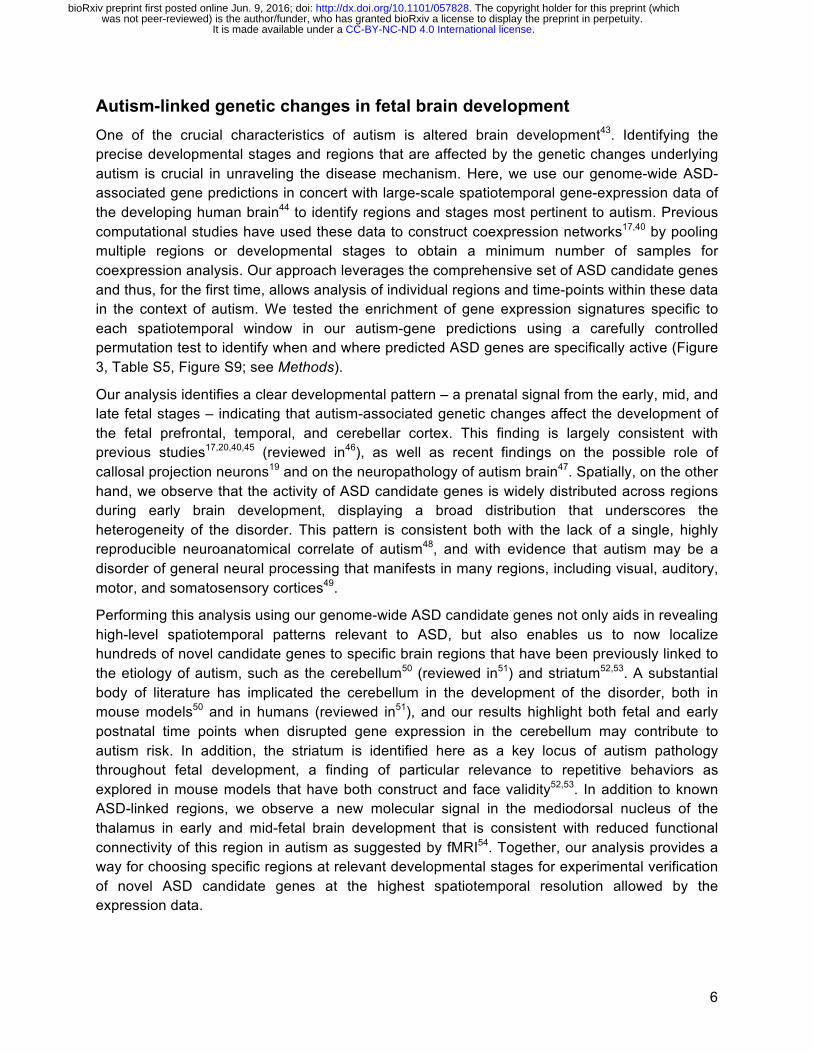
Autism-linked genetic changes in fetal brain development One of the crucial characteristics of autism is altered brain development43. Identifying the precise developmental stages and regions that are affected by the genetic changes underlying autism is crucial in unraveling the disease mechanism. Here, we use our genome-wide ASD-associated gene predictions in concert with large-scale spatiotemporal gene-expression data of the developing human brain44 to identify regions and stages most pertinent to autism. Previous computational studies have used these data to construct coexpression networks17,40 by pooling multiple regions or developmental stages to obtain a minimum number of samples for coexpression analysis. Our approach leverages the comprehensive set of ASD candidate genes and thus, for the first time, allows analysis of individual regions and time-points within these data in the context of autism. We tested the enrichment of gene expression signatures specific to each spatiotemporal window in our autism-gene predictions using a carefully controlled permutation test to identify when and where predicted ASD genes are specifically active (Figure 3, Table S5, Figure S9; see Methods).
Our analysis identifies a clear developmental pattern – a prenatal signal from the early, mid, and late fetal stages – indicating that autism-associated genetic changes affect the development of the fetal prefrontal, temporal, and cerebellar cortex. This finding is largely consistent with previous studies17,20,40,45 (reviewed in46), as well as recent findings on the possible role of callosal projection neurons19 and on the neuropathology of autism brain47. Spatially, on the other hand, we observe that the activity of ASD candidate genes is widely distributed across regions during early brain development, displaying a broad distribution that underscores the heterogeneity of the disorder. This pattern is consistent both with the lack of a single, highly reproducible neuroanatomical correlate of autism48, and with evidence that autism may be a disorder of general neural processing that manifests in many regions, including visual, auditory, motor, and somatosensory cortices49.
Performing this analysis using our genome-wide ASD candidate genes not only aids in revealing high-level spatiotemporal patterns relevant to ASD, but also enables us to now localize hundreds of novel candidate genes to specific brain regions that have been previously linked to the etiology of autism, such as the cerebellum50 (reviewed in51) and striatum52,53. A substantial body of literature has implicated the cerebellum in the development of the disorder, both in mouse models50 and in humans (reviewed in51), and our results highlight both fetal and early postnatal time points when disrupted gene expression in the cerebellum may contribute to autism risk. In addition, the striatum is identified here as a key locus of autism pathology throughout fetal development, a finding of particular relevance to repetitive behaviors as explored in mouse models that have both construct and face validity52,53. In addition to known ASD-linked regions, we observe a new molecular signal in the mediodorsal nucleus of the thalamus in early and mid-fetal brain development that is consistent with reduced functional connectivity of this region in autism as suggested by fMRI54. Together, our analysis provides a way for choosing specific regions at relevant developmental stages for experimental verification of novel ASD candidate genes at the highest spatiotemporal resolution allowed by the expression data.
.CC-BY-NC-ND 4.0 International licenseIt is made available under a was not peer-reviewed) is the author/funder, who has granted bioRxiv a license to display the preprint in perpetuity.
The copyright holder for this preprint (which. http://dx.doi.org/10.1101/057828doi: bioRxiv preprint first posted online Jun. 9, 2016;

7
Brain-specific functional modules disrupted in ASD In concert with studying the developmental aspects of autism, a detailed understanding of the underlying effects of autism-associated genetic changes on cellular functions and pathways will result in a more complete picture of the molecular basis of ASD. Typical pathway analysis of known ASD-associated genes falls short of this goal, with the ability to only highlight functionally annotated genes, while providing little information about the hundreds of uncharacterized genes, let alone how all these genes and associated pathways are functionally interconnected in the brain. The human brain-specific functional gene interaction network that underlies our autism gene predictions lends itself naturally towards addressing this challenge. First, we define an autism-associated network by restricting the genome-wide brain network to the top 10% (~2,500) of the predicted ASD-associated genes. Then, we use a strategy based on shared k-nearest-neighbors (SKNN) and the Louvain community-finding algorithm55 to cluster and partition the network into distinct and significantly cohesive functional modules predicted by our approach to be affected by ASD-associated genetic changes (Figure 4, Figure S10; see Methods). Based on the intuition that genes that functionally cluster together tend to have common local neighbors in the network56, the SKNN method calculates the number of shared nearest neighbors between ASD candidate genes in the brain network. The Louvain algorithm then finds communities of ASD candidates with shared local neighborhoods. Thus, the SKNN-based strategy has the advantages of alleviating the effect of high-degree genes and accentuating local network structure by connecting genes that are likely to be functionally clustered together.
The primary contribution of this analysis is a systematic way of associating individual genes – several among them being novel and uncharacterized – to specific processes and phenotypes that might underlie autism etiology (Figure 4, Table S6). This includes cellular functions (e.g., synaptic transmission and neuronal function8,12,31,57 (cluster 1, C1)), signaling pathways (e.g., canonical Wnt4,21 (C2), gamma interferon58 (C6 and C7),), and fundamental cell biological processes (e.g. histone modification and chromatin remodeling7,8 (C4) and cell cycle regulation (C5)) that have been repeatedly implicated in autism. The clusters delineated here also connect genes with key autism-associated phenotypes. For example, genes involved in enteric nervous system development (C1) might underlie the gastrointestinal symptoms common and persistent in children with autism59. Similarly, hypersensitivity to a range of stimuli is a well-established aspect of the autism phenotype60, and the genes identified in C3 include those involved in a whole assortment of perceptions (e.g., chemical stimuli, sound, light, smell, pain, temperature). Also noteworthy given a strong association of sleep dysregulation with autism61, is circadian rhythm captured in C9.
These findings suggest functional roles for genes associated with ASD pathogenesis and provide a framework to better understand the genes that underlie the emergence of important and often poorly understood phenotypes in animal models. Approximately 20% of the genes within each cluster are completely uncharacterized (lack any annotation to specific processes/pathways in the Gene Ontology), and this analysis suggests specific functional roles for these genes. For example, DIP2C (#180) and RSBN1 (#85) are top-ranked uncharacterized genes in C8 and C4, respectively, that are also specifically expressed during early fetal development. The grouping of DIP2C in C8, its fetal gene expression, and the identification of a
.CC-BY-NC-ND 4.0 International licenseIt is made available under a was not peer-reviewed) is the author/funder, who has granted bioRxiv a license to display the preprint in perpetuity.
The copyright holder for this preprint (which. http://dx.doi.org/10.1101/057828doi: bioRxiv preprint first posted online Jun. 9, 2016;

8
de novo LGD mutation in DIP2C in an autistic proband in the Simons Simplex Collection6 together link DIP2C to autism through the Rho and IGFR pathways. Likewise, RSBN1 is tightly linked to chromatin remodeling and histone modification genes in C4. Its mouse homolog exhibits a punctate nuclear location62, consistent with a nuclear function for the protein. These and many other uncharacterized genes (Table S6) are candidates for experimental follow-up in specific functional contexts to characterize the cellular dysregulation in autism.
Identifying ASD-associated genes within recurrent autism-associated CNVs Copy number variations (CNVs) are important risk factors for autism. However, identifying which among the genes in these chromosomal intervals are pathogenic remains challenging. Our genome-wide prediction enables us to systematically prioritize genes within CNVs and reveal candidates for experimental verification. We applied this approach to eight of the most common autism-associated CNVs: 16p11.2, 15q11-13, 15q13.3, 1q21.1, 22q11, 7q11.23, 17q12, 3q29 (Figure 5). Further delving into the candidate genes, we garnered existing functional and genetic evidence and provide hypotheses about how perturbations of genes from different CNVs might converge at the molecular level by affecting specific biological pathways, leading to ASD.
First, examining the genes that we prioritize within each of the eight autism-associated CNVs (genes within a CNV that are ranked in the first decile of our genome-wide ASD-gene ranking), we find that our network-based approach pinpoints many genes with previous genetic or functional evidence linking them to autism (Figure 5, Table S7). Across the CNVs, genes with prior genetic evidence (strongest, direct) are ranked significantly higher than those with functional evidence (indirect) (one-sided Wilcoxon rank-sum test P = 0.012), which are significantly ranked higher than CNV genes with no evidence of ASD association (P = 0.04; ‘genetic’ ranked higher than ‘no evidence’ P = 1e-6; Figure S11). Our method also implicates novel ASD candidates within these CNVs, which, based on the above trend, are strong candidates for further experimental follow-up. Experiments may particularly be a priority in cases where known functions of a highly ranked gene dovetail with biological processes that have already been implicated in the downstream effects of these CNVs. For example, a recent report suggests that changes in copy number at the 16p11.2 locus – the most widely studied and one of the most common CNVs linked to autism63 – may affect RhoA signaling and dynamics of the actin cytoskeleton64. One of our top-ranked genes in 16p11.2 is PPP4C (ranked third within the interval), which is known to regulate Rho GTPases and levels of filamentous actin65, suggesting a mechanism whereby haploinsufficiency for PPP4C might contribute to the phenotypes associated with 16p11.2 deletion. Another potential link between 16p11.2 and ASD is the highly ranked transcription factor MAZ (ranked fourth within the interval; see Discussion). Strikingly, 10 out of the 23 top-predicted (first decile) genes across the eight CNVs, including MAZ, are significantly highly expressed in the mediodorsal nucleus of the thalamus (MD) during early-midfetal development, a spatiotemporal window that we associate with autism in this study (Fisher’s exact test P < 1.2e-9).
With multiple CNVs and a number of candidate genes within each, a further challenge is to identify their convergence on similar cellular functions that might be dysregulated to result in
.CC-BY-NC-ND 4.0 International licenseIt is made available under a was not peer-reviewed) is the author/funder, who has granted bioRxiv a license to display the preprint in perpetuity.
The copyright holder for this preprint (which. http://dx.doi.org/10.1101/057828doi: bioRxiv preprint first posted online Jun. 9, 2016;

9
autism. Here, we attempt to shed light on this mechanism by leveraging the top-ranked genes within the CNVs and the brain-specific network to identify pathways and cellular processes that may be disrupted by ASD-associated CNVs. Intuitively, we hypothesize that genes involved in these disrupted pathways (referred to as ‘intermediate genes’) would be critical bridges between ASD candidate genes within CNVs and the major autism phenotype genes within the brain functional network. Practically, we identified such intermediate genes as those along the shortest paths in the brain network specifically linking the predicted ASD-associated genes within each CNV to the 19 high-confidence (E1) autism genes25,26 that represent the core molecular etiology of autism (illustrated in Figure S12; see Methods). The intermediate genes we identified thus likely represent cellular functions that CNVs impinge on to contribute to the autism phenotype. We then outlined the biological processes enriched in these intermediate genes that were also co-mentioned with autism in the literature (see Methods). Through this analysis, we were able to propose, in a data-driven way, genes and processes that underlie the functional connection of ASD-associated CNVs with the ASD molecular phenotype (Figure 6, Table S8).
Multiple previous studies support our findings. For example, SNAP25, one of the intermediate genes mediating 16p11.2’s linkage with cognition/axonogenesis, is reported to bind PRRT2 in 16p11.2 to regulate neuronal processes66. Besides these well-established CNV-gene-process linkages, many intermediate genes identified are themselves associated with autism. SMARCA2, which mediates 15q11-13’s association with regulation of transcription, is part of the BAF complex and is implicated in autism67. AFF2, linked with 16p11.2, is identified in multiple autism studies with rare mutations68,69. EPHB2, linking 7q11.23 with axonogenesis, harbors two de novo variants in ASD probands in separate sequencing studies. LPHN1 – linked to 1q21.1 – and SF3B1 – linked to 3q29 – were identified recently to be among 239 genes most likely involved in ASD based on de novo mutation and absence of mutation in healthy controls34. CACNB2, linked to 15q13.3, was recently added to category 3 in the SFARI Gene database25. We also noticed that all three genes linking 17q12 to cell cycle (BRCA1, MSH2, H2AFX) are either directly or indirectly involved in DNA damage repair, which was highlighted in a postmortem gene expression study as an autism-associated process70. This observation is in agreement with the hypothesis that dysregulation of mismatch repair might contribute to the generation of somatic mutations in the brain that contribute to autism risk. The full set of intermediate genes and enriched processes (Table S8) provide a rich resource for experimental follow-up studies.
A web-interface to explore autism-gene predictions We have developed a dynamic web interface – asd.princeton.edu – that provides an interactive portal to all autism-gene predictions from this study along with the results from the subsequent analyses, including spatiotemporal brain signatures, functional modules, and prioritized CNVs. Using this interface, autism researchers can explore the results from this study not just as ranked genes, but also their inter-connections in the context of the human brain-specific network. The interface allows gene-based search, dynamic network visualization, and ability to export results (Figure S13).
.CC-BY-NC-ND 4.0 International licenseIt is made available under a was not peer-reviewed) is the author/funder, who has granted bioRxiv a license to display the preprint in perpetuity.
The copyright holder for this preprint (which. http://dx.doi.org/10.1101/057828doi: bioRxiv preprint first posted online Jun. 9, 2016;

10
Discussion The genetic heterogeneity underlying ASD is daunting, with multiple modes of inheritance, a sizeable contribution from de novo events, and hundreds of both rare and common variants likely contributing to the disease71. Further compounded by diverse clinical phenotypes and limited sample sizes, it is unlikely that all risk genes would be identified by sequencing studies and statistical association alone. Sequencing screens mainly identify mutations with large effect size, and statistical quantitative genetic studies rely on relatively high mutation frequency, both of which are missing in gene variants with modest frequency and effect size. Moreover, all these methods fail to model epistatic effects that could underlie the ASD phenotype.
In this study, we present a powerful, genome-wide computational approach to facilitate ASD gene discovery. By combining evidence from thousands of gene expression, protein-protein interaction, transcription regulation and genetic perturbation data, we recently built a gene network that serves as a robust scaffold of brain-specific gene interactions and cellular functions24. Here, we take advantage of this brain-specific functional interaction network to provide a ranking of all genes in the human genome by their potential pathogenic involvement in ASD (Figure 1). The validity of this comprehensive complement of genes is attested by an independent exome sequencing study published after our initial analyses were completed (and, therefore, not included in our training sets), with the strong autism candidates from the study (recurrent de novo LGD mutations) ranking near the top of our prioritized list (Figure 2). Therefore, our ranking can, for example, be used to prioritize novel autism-risk genes for experimental functional characterization or choose gene candidates for targeted sequencing in new studies, thus increasing specificity and reducing cost. Our predictions can further help guide the analysis of whole exome/genome sequencing results, by prioritizing which genes harboring missense mutations or nearby noncoding variants should be followed-up by downstream experimental investigation.
Traditional disease-gene prediction methods72 use only the most-confident genes or all genes irrespective of the evidence linking them to disease. Our evidence-weighted machine learning method, which we used to make these genome-wide ASD candidate gene predictions, brings new prospects for incorporating a large number of genes with various levels of confidence of autism-association identified from multiple experimental/sequencing efforts. Even within a single study, different types of variants – LGD, missense, synonymous – potentially confer variable amounts of risk. Our weighted approach embraces this diffuse knowledge of disease genetics, and we demonstrate that our method is able to identify ASD-related signals among the noisy and weak gene associations present in the literature and make more accurate predictions (Figure 2a). Because the method is highly generalizable, it can be readily applied to the study of many other complex diseases.
In addition to prioritizing hundreds of novel ASD candidate genes, we have used the underlying network to link individual ASD genes to perturbed cellular functions and higher-level phenotypes (such as brain development, sensory perception, and circadian rhythm), thus aiming to bridge the genotype-phenotype gap in autism. In fact, our genome-wide prediction ranks LGD genes in SSC probands with lower non-verbal IQ (<100) significantly higher than LGD genes in probands with higher non-verbal IQ (>=100; one-sided Wilcoxon rank-sum test P = 0.013). Similarly, LGD
.CC-BY-NC-ND 4.0 International licenseIt is made available under a was not peer-reviewed) is the author/funder, who has granted bioRxiv a license to display the preprint in perpetuity.
The copyright holder for this preprint (which. http://dx.doi.org/10.1101/057828doi: bioRxiv preprint first posted online Jun. 9, 2016;

11
genes highly ranked by our method are also associated with severe restricted repetitive behavior73 (permutation test P = 0.02). Using a combination of our whole-genome ranking of ASD candidate genes and spatiotemporal gene expression data of the human brain44, we have gained insights into specific stages in human brain development that might be critically affected by mutations in autism-associated genes. We provide the functional and developmental contexts of our top-decile predictions in Table S9. Furthermore, this analysis showcases how biomedical researchers can use our genome-wide ASD candidate gene predictions as a framework for analyzing their data from high- or low-throughput assays, allowing high-resolution study of autism genetics in the functional and physiological contexts of their interest. For example, a researcher who has generated gene expression or proteomics data from a new high-resolution spatiotemporal window in the brain (either human or in a model organism) can use our approach to assess the molecular relevance of that window to ASD. This approach – identifying a characteristic gene signature from the samples and estimating its enrichment in our genome-wide ASD-gene ranking (similar to results presented in Figure 3) – can provide results of increasing specificity with increasing spatiotemporal resolution in the available data. (S)he could then focus on the highly-ranked genes in her/his expression signature in combination with the specific functional contexts identified for these genes (‘ASD-associated functional modules’ as presented in Figure 4) to generate hypotheses and design experiments to further characterize autism.
Finally, we have used the genome-wide predictions to prioritize potentially “causal” genes within large regions of autism-associated CNVs and illustrate how genes from different CNVs converge onto a set of common genes and pathways that could mediate the cellular perturbations associated with autism. This analysis provides experimentally-testable hypotheses for further research into the molecular mechanisms underlying the connection to ASD for the most common ASD-associated CNVs. For example, one of the top ranked ASD candidate genes in 16p11.2 is the transcription factor MAZ (ranked fourth in the 16p11.2 interval), which has not been previously characterized in the context of autism. On the genome-scale, computationally predicted targets of MAZ (genes with MAZ’s DNA-binding motif74 in their upstream sequences) are statistically over-represented in our ASD-associated gene predictions (P = 2.5e-93), and are involved in the regulation of neuron differentiation and axonogenesis. MAZ and its predicted targets also show specific spatiotemporal expression in the early mid-fetal stage of development in the primary motor cortex (M1C; Figure 3), a stage demonstrated to be relevant to autism40. Together these observations lead to a specific hypothesis: the disruption of normal MAZ function (or one of its targets) in the primary motor cortex at the early mid-fetal developmental stage can lead to the autism phenotype by perturbing the transcription of neuronal differentiation and neurodevelopmental genes.
In addition to specific analyses and hypotheses that we describe in this study, we have made all the genome-wide predictions, ASD-associated brain developmental stages, functional modules, and prioritized CNVs from this study, as well as their brain network contexts, available to the biomedical community via a dynamic web interface at asd.princeton.edu. Researchers can explore the top predicted candidate genes and processes as well as any genes they are specifically interested in (such as genes found in sequencing or GWAS studies) in the context of our network and generate new sets of related genes or processes. The top-ranked genes
.CC-BY-NC-ND 4.0 International licenseIt is made available under a was not peer-reviewed) is the author/funder, who has granted bioRxiv a license to display the preprint in perpetuity.
The copyright holder for this preprint (which. http://dx.doi.org/10.1101/057828doi: bioRxiv preprint first posted online Jun. 9, 2016;
12
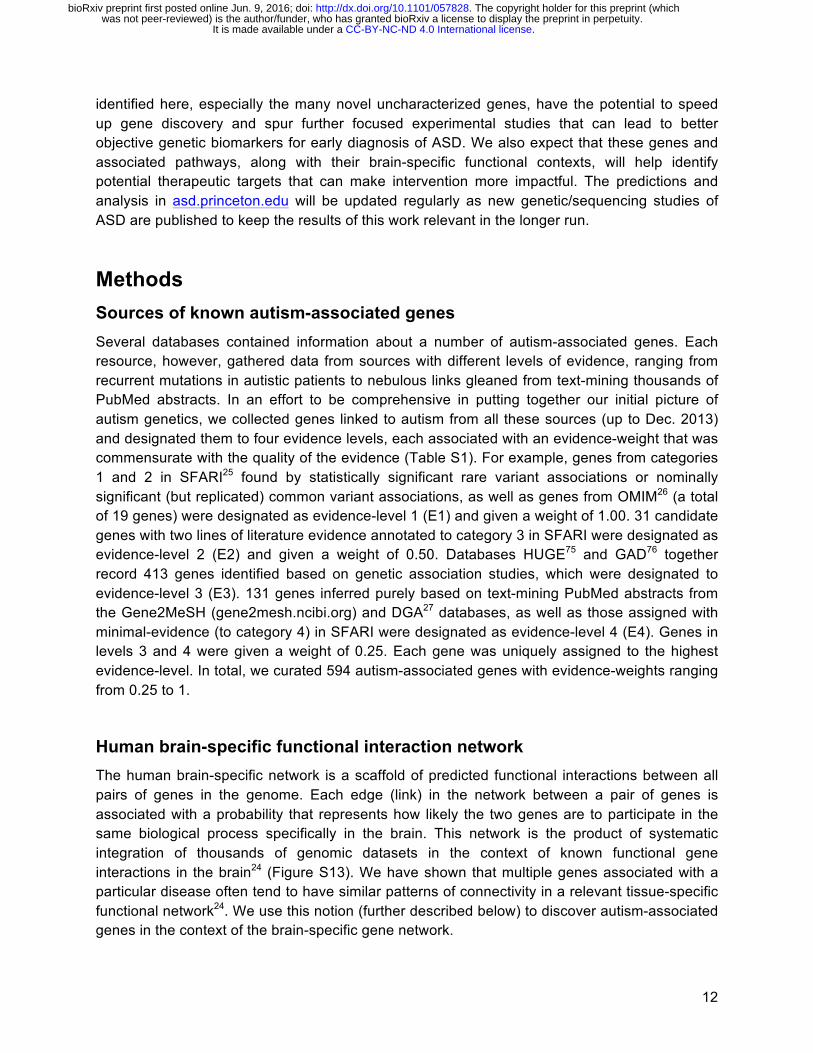
identified here, especially the many novel uncharacterized genes, have the potential to speed up gene discovery and spur further focused experimental studies that can lead to better objective genetic biomarkers for early diagnosis of ASD. We also expect that these genes and associated pathways, along with their brain-specific functional contexts, will help identify potential therapeutic targets that can make intervention more impactful. The predictions and analysis in asd.princeton.edu will be updated regularly as new genetic/sequencing studies of ASD are published to keep the results of this work relevant in the longer run.
Methods Sources of known autism-associated genes
Several databases contained information about a number of autism-associated genes. Each resource, however, gathered data from sources with different levels of evidence, ranging from recurrent mutations in autistic patients to nebulous links gleaned from text-mining thousands of PubMed abstracts. In an effort to be comprehensive in putting together our initial picture of autism genetics, we collected genes linked to autism from all these sources (up to Dec. 2013) and designated them to four evidence levels, each associated with an evidence-weight that was commensurate with the quality of the evidence (Table S1). For example, genes from categories 1 and 2 in SFARI25 found by statistically significant rare variant associations or nominally significant (but replicated) common variant associations, as well as genes from OMIM26 (a total of 19 genes) were designated as evidence-level 1 (E1) and given a weight of 1.00. 31 candidate genes with two lines of literature evidence annotated to category 3 in SFARI were designated as evidence-level 2 (E2) and given a weight of 0.50. Databases HUGE75 and GAD76 together record 413 genes identified based on genetic association studies, which were designated to evidence-level 3 (E3). 131 genes inferred purely based on text-mining PubMed abstracts from the Gene2MeSH (gene2mesh.ncibi.org) and DGA27 databases, as well as those assigned with minimal-evidence (to category 4) in SFARI were designated as evidence-level 4 (E4). Genes in levels 3 and 4 were given a weight of 0.25. Each gene was uniquely assigned to the highest evidence-level. In total, we curated 594 autism-associated genes with evidence-weights ranging from 0.25 to 1.
Human brain-specific functional interaction network
The human brain-specific network is a scaffold of predicted functional interactions between all pairs of genes in the genome. Each edge (link) in the network between a pair of genes is associated with a probability that represents how likely the two genes are to participate in the same biological process specifically in the brain. This network is the product of systematic integration of thousands of genomic datasets in the context of known functional gene interactions in the brain24 (Figure S13). We have shown that multiple genes associated with a particular disease often tend to have similar patterns of connectivity in a relevant tissue-specific functional network24. We use this notion (further described below) to discover autism-associated genes in the context of the brain-specific gene network.
.CC-BY-NC-ND 4.0 International licenseIt is made available under a was not peer-reviewed) is the author/funder, who has granted bioRxiv a license to display the preprint in perpetuity.
The copyright holder for this preprint (which. http://dx.doi.org/10.1101/057828doi: bioRxiv preprint first posted online Jun. 9, 2016;
13
Learning and cross-validation of the network-based classifier
We use a machine learning approach to predict autism-association genes. Our approach has two steps: 1) Building a statistical model that captures the connectivity patterns of known autism genes in the brain-specific network, and 2) Using this model to subsequently predict whether each of the other “unknown/unlabeled” genes in the network looks like an autism gene based on its connectivity in the network. We trained an evidence-weighted linear support vector machine (SVM) classifier using the gold standard of known autism-associated genes (along with their weights) as positives and 1189 genes associated with non-mental-health diseases (from OMIM, with weights equal to 1) as negatives. The brain-specific interaction probabilities of each gene to all the genes in the brain network were used as features. Given the network features (xi) and a positive/negative label (yi) for all the m training genes, the linear SVM solves the following optimization problem77:
min𝒘!!𝒘!𝒘 + 𝑙! ∙𝑚𝑎𝑥(0, 1 − 𝑦!𝒘!𝒙𝒊)!!
!!! ,
where Ii is a penalty parameter specific to each gene that influences how costly it is to misclassify that gene. By setting Ii equal to the evidence-weight of the labeled gene (where negatives have Ii of 1), we ensure that we train a model that rarely misclassifies high-confidence genes while giving certain latitude in correctly classifying low-confidence genes.
To evaluate this approach, we employed a stringent five-fold cross-validation scheme: in each fold, we trained a model on 4/5th of the labeled (positive and negative) genes and evaluated the model on only high-confidence (E1) positives (and all negatives) in the remaining 1/5th of the labeled genes. The model with weights equal to 1.00, 0.50, 0.25, and 0.25 for E1, E2, E3, and E4 genes had an area under the receiver-operator-curve (AUC) of 0.80. Taking model variance into account by repeating 5-fold cross-validation 50 times, we demonstrate that this model performs significantly better than one trained only using high-confidence genes (weights 1, 0, 0, 0; AUC = 0.73; P < 2.2e-16, one-sided Wilcox rank based test; weights 1, 1, 0, 0; AUC = 0.76; P < 2.4e-15), and one trained with real E1-2 supplemented with random genes simultaneously matched with E3-4 for gene length, brain expression, and neuronal gene ontology (AUC = 0.75, P < 2.2e-16). Therefore, we used the evidence-weighted model further to make predictions.
Genome-wide prediction using evidence-weighted network classifier
We coupled whole-genome prediction with 5-fold cross-validation: a prediction for each labeled gene (positive/negative) was recorded only from the fold that did not include the gene for training, thereby relying only on its network-based similarity to other genes instead of its own prior evidence; a prediction for an unlabeled gene was recorded as the average of predictions from the five folds. Each prediction corresponded to the distance of the gene from the hyperplane that separates positive genes from negative genes, and these distances were used to rank all the genes in the genome. For interpretability, the distances were also converted to probabilities using isotonic regression (see below). This produced a genome-wide ranking of 25,825 genes based on their predicted level of association with autism.
.CC-BY-NC-ND 4.0 International licenseIt is made available under a was not peer-reviewed) is the author/funder, who has granted bioRxiv a license to display the preprint in perpetuity.
The copyright holder for this preprint (which. http://dx.doi.org/10.1101/057828doi: bioRxiv preprint first posted online Jun. 9, 2016;
14
Evaluation of autism gene ranking on independent de novo mutations
De novo mutations from exome-sequencing study
The Simons Simplex Collection78 (SSC) contains more than 2,500 families, each of which has a single child with ASD (referred to as proband). Most of these families have at least one unaffected sibling. A recent study used whole exome sequencing of the SSC to identify de novo LGD mutations in autistic children and their unaffected siblings7. 350 and 174 genes were targets of LGD mutations in autistic probands and unaffected siblings, respectively. Among the 350 LGD genes in probands, 27 were observed in more than one proband (recurrent LGD), indicating that these are very likely to be true autism-associated genes. We used these sets of genes – proband recurrent LGD (27), proband LGD (350) and sibling LGD (174) – to benchmark our genome-wide autism gene ranking. When testing each LGD set, we used 462 genes containing synonymous mutations in unaffected siblings (sibling SYN) as a control. Further, to account for potential biases in exome sequencing coverage, when defining a genomic background, we removed the 8,054 genes in which no rare variants from reference were reliably detected anywhere within genic boundaries.
Since preliminary de novo mutation data on 682 SSC families were published in three separate reports in 20123,4,6, and it was likely that some of these data were represented in our training set of autism-associated genes, we created an “unpublished” evaluation data set from SSC which was released after our prediction. This data set was created from the new SSC families in 2014 study7 (i.e., 1,835 families after removing the previously published 682 from the total of 2,517 families), which performed whole exome sequencing to identify de novo LGD mutations in autistic children and their unaffected siblings. We used this “unpublished” set of mutations to re-test the significance of our findings derived based on the entire SSC cohort (Figure S4).
We also obtained the 107 likely ASD-associated genes from a study independent of the SSC8 and used this set to evaluate our predictions.
Decile enrichment test
After removing SSC genes without rare variants from the autism gene prediction rankings, the remaining genome-wide gene ranking was first divided into deciles. For a given set of LGD genes, we used the binomial test to assess whether a larger fraction of the LGD genes occurred in the first decile when compared to the expected fraction based on the occurrence of sibling SYN genes. Reassuringly, sibling SYN genes are roughly apportioned 10% to each decile, indicating that it is a good control set.
Rank-based enrichment test
To demonstrate robustness of our evaluation to specific rank cutoffs (as our decile enrichment test assesses genes above a 10% rank cutoff), we also formulated a rank-based test. This test takes the entire genome-wide ranking and assesses if the set of LGD genes have a skewed distribution towards the top of the ranking relative to the control set. First, based on the genome-wide autism-association ranking, we calculated an exponential score si for each gene i based on its autism-associated rank rank(i) as follows:
.CC-BY-NC-ND 4.0 International licenseIt is made available under a was not peer-reviewed) is the author/funder, who has granted bioRxiv a license to display the preprint in perpetuity.
The copyright holder for this preprint (which. http://dx.doi.org/10.1101/057828doi: bioRxiv preprint first posted online Jun. 9, 2016;

15
𝑠! =𝑏!! − 1𝑏 − 1
,𝑤ℎ𝑒𝑟𝑒 𝑟! =𝑁 − 𝑟𝑎𝑛𝑘 𝑖 + 1
𝑁,
N is the total number of genes equal to 25,825, and b was set to 100. The score si ranges between 1 for the top-ranked gene dropping exponentially to 0 for the lowest ranked gene. The rank-based test then proceeds in three steps: (1) calculate the observed difference (dobs) between the mean rank-based score of the test LGD gene set (e.g. proband LGD) and the control gene set (sibling SYN); (2) shuffle the gene labels in the test and control gene sets 100,000 times and, each time, record the difference between mean(test) and mean(control) (dpermut); (3) calculate a P value for the observed difference (dobs) equal to the fraction of permuted differences dpermut that were equal to or greater than dobs; also calculate an effect size for dobs as a z-score:
𝑧 = 𝑑!"# − 𝜇
𝜎,
where µ and σ are the mean and standard deviation of the distribution of dpermut values.
Evaluation controlling for gene length
Genes linked to ASD are known to be longer in size than genomic background29. To test if our genome-wide ranking is driven by prioritizing long genes, we repeated our LGD evaluation while controlling for gene length. We sorted all genes by their length, divided the genes into bins of 500 genes (of very similar lengths), randomized ASD ranks of genes within each bin, and calculated the top-decile enrichment of LGD-target genes. A P value was calculating by repeating this procedure 10,000 times and calculating the fraction of times the permuted top-decile enrichment P value was less than or equal to the observed P value.
Evaluation controlling for bias in brain-/neural-functional annotations
To demonstrate that brain/neural genes are not biasing our results, we evaluated our predictions on whether they can prioritize proband LGD genes within a non-neural-annotated gene set. We created this set by including proband LGD genes that are neither annotated to neural/brain-related functions in Gene Ontology nor part of our training gold standard. Fisher’s exact test was then used to calculate significance.
Evolutionary constraint of ASD-associated genes
Evolutionary constraint estimates of genes were obtained from two different studies79,80, one providing a quantitative (RVIS) score for each gene, and the other providing a single set of 1,003 constrained genes. The Wilcoxon rank-sum test was used to assess the difference between the RVIS scores for genes in our top-decile compared to the rest of the ranking, and the Fisher’s exact test was used to calculate the enrichment of the constrained gene set in our top decile. We also evaluated both sets using a rank-based permutation test that does not involve any rank cutoffs. For the RVIS score, a test statistic equal to the Spearman correlation coefficient between genes ranked by our method and by RVIS scores was calculated; a P value for this statistic was estimated by permuting the ASD candidate gene ranking a million times and calculating the fraction of times the permuted correlation was less than or equal to the observed one. For the constrained genes, a test statistic equal to the mean rank-based scores (si) of genes in the set was calculated; a P value for this statistic was then estimated by
.CC-BY-NC-ND 4.0 International licenseIt is made available under a was not peer-reviewed) is the author/funder, who has granted bioRxiv a license to display the preprint in perpetuity.
The copyright holder for this preprint (which. http://dx.doi.org/10.1101/057828doi: bioRxiv preprint first posted online Jun. 9, 2016;
16
permuting ASD gene ranks a million times and calculating the fraction of times the permuted statistic was greater than or equal to the observed one.
Developmental expression of autism-associated genes in the brain
Defining spatiotemporal expression signatures
The spatiotemporal developmental gene-expression data for the human brain was obtained from Brainspan44. Raw data from this study were downloaded from NCBI GEO81 accession GSE25219. CEL files were background corrected, normalized, and summarized using RMA82 based on a custom CDF83, and expression for each gene was averaged across replicates. Further analysis was restricted to 13 stages from early fetal (10-13 weeks post-conception) to late adulthood (≥ 60 years) that contained expression data for all 16 brain-regions. We first established a gene-expression signature for each of the 208 spatiotemporal windows (combination of 16 regions and 13 stages) that was specific to that window with respect to other stages as well as other regions. For example, a signature for the striatum (region) at the late midfetal stage, was calculated in three steps:
1) For each gene i, two modified z-scores were calculated by comparing 𝑒!!" , the gene’s expression in that region (striatum) and stage (late-midfetal), to the distribution of its expression values across i) all regions at late-midfetal stage (to get 𝑧!
!"#$%&), and ii) all stages of striatum (to get 𝑧!
!"#$%).
𝑧!!"#$%& =
𝑒!!" −𝑚!!"#$%&
1.486 ∗𝑀𝐴𝐷!!"#$%& ; 𝑧!
!"#$% =𝑒!!" −𝑚!
!"#$%
1.486 ∗𝑀𝐴𝐷!!"#$% ,
where 𝑚!!"#$%& and 𝑚!
!"#$%, respectively, are the median expression levels of gene i across all
regions and all stages; 𝑀𝐴𝐷!!"#$%& and 𝑀𝐴𝐷!
!"#$% are the corresponding median absolute deviations (MAD). Since median and MAD are stable measures of central tendency and variance of a distribution without being influenced by outliers, scaling using these measures aids in identifying expression values that are particularly high.
(2) These two z-scores were then combined into a meta z-score 𝑧!!" that tends to be high when the expression of the gene deviates substantially from its nominal expression along both the spatial and temporal axes.
𝑧!!" =𝑧!!"#$%& + 𝑧!
!"#$%
2
(3) Finally, the set of genes with 𝑧!!" ≥ 2 were used as the gene-expression signature (of late midfetal striatum, in this example).
We employed this procedure to compute a signature for all 208 combinations of regions and stages.
.CC-BY-NC-ND 4.0 International licenseIt is made available under a was not peer-reviewed) is the author/funder, who has granted bioRxiv a license to display the preprint in perpetuity.
The copyright holder for this preprint (which. http://dx.doi.org/10.1101/057828doi: bioRxiv preprint first posted online Jun. 9, 2016;

17
Rank-based enrichment test of spatiotemporal signatures
This test was very similar to the rank-based test detailed above. For each signature, a test statistic equal to the mean exponential rank-based autism-association scores (si; described above) of genes in that signature was calculated. Mean scores based on random signatures of the same size sampled from the union of all genes in all signatures were then used to set up an empirical distribution. A P value for the signature was calculated ultimately as the fraction of permuted mean scores that were equal to or greater than the observed mean score for the real signature. We carried out this test for all 208 region-stage combinations and corrected for multiple tests using the Benjamini-Hochberg correction84 to get Q values.
Clustering the autism-associated brain network
In order to identify autism-associated functional modules in the brain, we created a subset of the brain-specific functional network containing the top 2,500 autism-associated genes from our genome-wide ranking and all the edges between them. Then, we used an approach based on shared k-nearest-neighbors (SKNN) and the Louvain community-finding algorithm55 to cluster the network into distinct modules of tightly connected genes. Given a graph G with V nodes/genes and E edges, with each edge between genes i and j associated with a weight pij, this technique proceeds the following way: (1) calculate a new weight for the edge between each pair of nodes i and j that is equal to the number of k nearest neighbors (based on the original weights pij) shared by i and j; (2) choose the top 5% of the edges based on the new edge weights and apply a graph clustering algorithm. This approach has two key desirable characteristics: a) choosing top k instead of all edges deemphasizes high-degree ‘hub’ nodes and brings equal attention to highly specific edges between low-degree nodes; and b) emphasizing local network-structure by connecting nodes that share a number of local neighbors automatically links genes that are highly likely to be part of the same cluster. We used a k of 50 to obtain the shared-nearest-neighbor autism-associated brain network and used the Louvain algorithm to cluster this network into distinct modules. We confirmed that the node membership and cluster sizes are robust by testing a range of values for k from 10 to 100. To stabilize clustering across different runs of the Louvain algorithm, we ran the algorithm a 100 times and calculated cluster co-membership for all pairs of genes that was equal to the fraction of times (out of 100) the pair was assigned to the same cluster. These co-membership scores were used to layout the network in Figure 4 (using Cytoscape85), which represents all clusters that contained at least 10 genes, defined by a co-membership score ≥ 0.9. We confirmed the statistical significance of this score using a permutation test, randomizing the k-nearest neighbors of each node in the network of top ASD-genes and redoing the clustering procedure (Figure S8).
One-sided Fisher’s exact test was used to find GO biological processes86 enriched in each cluster. Benjamini-Hochberg correction was used to correct for multiple tests and GO terms with Q ≤ 0.1 were deemed significant. The entire table of enriched GO terms is provided in Table S6.
.CC-BY-NC-ND 4.0 International licenseIt is made available under a was not peer-reviewed) is the author/funder, who has granted bioRxiv a license to display the preprint in perpetuity.
The copyright holder for this preprint (which. http://dx.doi.org/10.1101/057828doi: bioRxiv preprint first posted online Jun. 9, 2016;

18
Prioritizing genes in autism-associated CNVs
We selected the eight most statistically significant and frequent autism-associated CNVs15 and obtained the genes in the intervals from UCSC87. An expert independently annotated genes in each interval with genetic or functional evidence for association with autism from existing literature. Genetic evidence refers to direct genetic evidence implicating a gene in autism or a related disorder (e.g., schizophrenia, epilepsy). Functional evidence refers to the annotation of a gene to a function, process, or pathway involved in autism, but without direct genetic evidence.
Identification of CNV-specific intermediate genes
The goal here was to identify key genes and the related cellular functions that may be deregulated by each CNV by tracing a biomolecular path from the CNV to the molecular phenotype of autism. We first marked the most autism-associated genes in each CNV as those within the top 10% of our genome-wide autism-associated gene ranking. Then, we defined the 19 E1 (high-confidence) genes as the core genes representing the molecular phenotype of autism. Taking advantage of the underlying brain-specific network, for each CNV, we calculated the betweenness centrality (BC) of each network gene as the fraction of shortest paths from the top-ranked CNV genes to the core autism genes that also pass through that gene. The brain network was pre-filtered to contain only around top 1% of its edges, and path length was calculated as the reciprocal of the functional linkage score. Genes with high BC are molecular mediators between the CNV and autism. We identified genes with high BC that were also specific to the given CNV (with T total genes and t top-ranked genes) by keeping the core autism genes constant and repeating the BC calculation for random set of t genes from random genomic intervals with T genes. Finally, a permutation-based P value was computed for each network gene as the fraction of times that gene’s BC with random intervals was equal to or greater than that with the real CNV (n = 100,000). Upon Benjamini-Hochberg correction for testing the BC of thousands of genes, those with Q ≤ 0.1 were identified as mediator genes specific to the given CNV.
Text mining for autism-associated processes
We queried all available PubMed abstracts from 2000 to May 2015 for (autism OR ASD OR autistic), and retrieved these autism-associated abstracts. GO biological processes terms were mapped to each abstract using simple text search, and a given term was declared as associated with autism if it was found in at least two abstracts.
Functional impact of multiple CNVs
The next goal was to use the CNV-specific mediator genes to determine cellular functions that are likely deregulated by multiple CNVs. For this, we used the Fisher’s exact test to find sets of genes annotated to autism-associated GO biological processes that overlapped significantly with the CNV-specific mediator gene set. Processes/pathways that were significantly associated (Q ≤ 0.05) with two or more CNVs, and annotated to at least two mediator genes were analyzed further and were summarized to general terms based on gene overlap, term description, and their relationships in the ontology.
.CC-BY-NC-ND 4.0 International licenseIt is made available under a was not peer-reviewed) is the author/funder, who has granted bioRxiv a license to display the preprint in perpetuity.
The copyright holder for this preprint (which. http://dx.doi.org/10.1101/057828doi: bioRxiv preprint first posted online Jun. 9, 2016;

19
Identification of MAZ targets
Computationally predicted targets were generated by using FIMO88 to map the binding site of MAZ (obtained from HOCOMOCO74) to the 1,000bp upstream regions of all the genes in the genome. 2,446 genes with a match at Q ≤ 0.01 were selected as potential targets of MAZ. Enrichment analysis for MAZ targets against the autism-gene predictions was applied using the one-sided Fisher’s exact test against the top 2,500 ranked gene predictions (top decile).
ASD webserver
The web interface is implemented using the D3 library89 for visualization, which enables use on any modern web browser without plugin installation.
Probability estimates for predicted autism-related genes
We estimated priors for several biological pathways and gene sets known to be enriched for autism-associated genes by calculating the fraction of genes with de novo LGD mutations occurring in quad family probands over all de novo LGDs. These pathways and sets include CHD8 targets, chromatin remodeling genes, FMRP targets, MAPK pathway genes, post-synaptic density genes, TOP1 targets and Wnt/beta-catenin pathway genes.
To improve interpretability for our autism predictions, we calibrated the SVM scores using isotonic regression. Isotonic regression, or monotonic regression, minimizes the same condition as a least-squares regression while imposing a monotonicity constraint (i.e., if gene A has a higher rank in original predictions relative to gene B, then isotonic regression enforces that the fitted probability estimate for gene A will also be higher than that of gene B), and it has been previously shown to have more power when sufficient data is available90. The response variable (probability of a gene being autism-related) was estimated based on their enrichment among the SSC proband LGDs. To prevent overfitting in our probability estimation, we used 10-fold cross validation to find the “knots” for the regression results of each held-out fold. We fit an isotonic regression curve through all knots, with hermite spline interpolation between knots, and provide the resulting estimated probabilities on the web interface.
Permutation-based P values and Q values for our genome-wide predictions
In order to improve the interpretability of our genome-wide ranking, we calculated a permutation-based P value and a corresponding Q value for each gene (Table S3), and provide these in our ASD web-server. We permuted labels of gold standards and retrained the model 1000 times. P values were calculated as the probability of the gene being predicted to be as extreme as it is (considering both ‘highly ASD-associated’ and ‘highly non-ASD associated’, n = 1,000), and were corrected to Q values by the Benjamini-Hochberg method84.
Webserver updates
We will keep the ASD gene predictions on our web server updated for the community. As the set of annotated ASD candidate genes increases, we will retrain our model with the most up-to-date ASD candidate gene collection. We have already retrained our model with the entire collection of known ASD genes up to Oct. 2015 (with the same gene evidence weighting
.CC-BY-NC-ND 4.0 International licenseIt is made available under a was not peer-reviewed) is the author/funder, who has granted bioRxiv a license to display the preprint in perpetuity.
The copyright holder for this preprint (which. http://dx.doi.org/10.1101/057828doi: bioRxiv preprint first posted online Jun. 9, 2016;

20
criteria), and those predictions are available at asd.princeton.edu/v2. We see that the new genome-wide gene ranking is largely consistent with the predictions used in this study, with a correlation of 0.93 in overall gene ranking and 83.3% of genes in the top decile matching the original predictions.
Acknowledgements We are grateful to all of the families at the participating Simons Simplex Collection (SSC) sites, as well as the SSC principal investigators.
We thank all members of the Troyanskaya Lab for valuable discussions. We thank John Spiro and other members of the Simons Foundation for constant feedback on the work and manuscript.
This work was primarily supported by US National Institutes of Health (NIH) grants R01 GM071966 and R01 HG005998 to O.G.T. V.Y. was supported in part by US NIH grant T32 HG003284. This work was supported in part by US NIH grant P50 GM071508. O.G.T. is a senior fellow of the Genetic Networks program of the Canadian Institute for Advanced Research (CIFAR).
.CC-BY-NC-ND 4.0 International licenseIt is made available under a was not peer-reviewed) is the author/funder, who has granted bioRxiv a license to display the preprint in perpetuity.
The copyright holder for this preprint (which. http://dx.doi.org/10.1101/057828doi: bioRxiv preprint first posted online Jun. 9, 2016;

21
Figures
Figure 1: Genome-wide prediction of autism-associated genes. Our ASD-gene predictions are based on a machine learning approach that (1) uses a gold-standard of known disease genes – those linked to autism with varying levels of evidence (E1-4) as positives, and other genes linked to non-mental-health diseases as negatives – in the context of a (2) human brain-specific functional interaction network to (3) build an evidence-weighted network-based classifier capturing autism-specific gene interaction patterns, and (4) predict the probability of autism association of each gene across the genome. We demonstrate the accuracy and utility of our genome-wide complement of autism-associated genes by (5) validating these predictions with de novo autism-associated mutations from an independent sequencing study; elucidating the spatiotemporal developmental gene-expression patterns of top-ranked autism genes; laying out the landscape of autism-associated brain-specific functional modules (network clusters); and prioritizing candidate causal genes within large intervals of recurrent autism-associated copy-number variants.
.CC-BY-NC-ND 4.0 International licenseIt is made available under a was not peer-reviewed) is the author/funder, who has granted bioRxiv a license to display the preprint in perpetuity.
The copyright holder for this preprint (which. http://dx.doi.org/10.1101/057828doi: bioRxiv preprint first posted online Jun. 9, 2016;

22
0.00.10.20.30.40.50.6
(27; P = 5.7e−10)
Frac
tion
of g
enes
0.00
0.05
0.10
0.15
0.20
0.25(350; P = 2.7e−09)
0.00
0.05
0.10
0.15(174; P = 0.12)
0.0
0.1
0.2
0.3
0.4
0.5(784; P = 6.5e−135)
Frac
tion
of g
enes
0.00
0.05
0.10
0.15
0.20(1887; P = 9.2e−35)
0.00.10.20.30.40.50.6
(132; P = 1.4e−34)
0.0
0.1
0.2
0.3(136; P = 2.7e−11)
Frac
tion
of g
enes
0.0
0.1
0.2
0.3(249; P = 5.8e−16)
0.0
0.1
0.2
0.3(1391; P = 9.1e−81)
Proband de novo recurrent LGD
Probandde novo LGD
Siblingde novo LGD
FMRP targets TOP1 targets CHD8 targets
Wnt/β-catenin pathway MAPK pathway Postsynaptic
density genes
c
d
e
a
E1:E2:E3:E4:
rand34:
Very-high-confidence genes (evidence level 1)High-confidence genes (evidence level 2)Medium-confidence genes (evidence level 3)Minimal-confidence genes (evidence level 4)Random genes with similar expression / annotation / gene-length characteristics of E3+E4 genes.
●●
●
●
0.65 0.70 0.75 0.80 0.85
AUC
E1
E1 + E2
E1 + E2 + rand34
E1 + E2 + E3 + E4
1e−05
2.3e−05
0.081
(27) (350) (174)0
2
4
6
8
z−score
All familiesAll genes
pro rec LGDpro LGDsib LGD
1e−05
5.4e−05
0.051
(16) (321) (169)
z−score
0
2
4
6
Novel genes
0.0048 0.0015
0.1
(8) (231) (113)0.0
0.5
1.0
1.5
2.0
2.5
3.0
Unpub. familiesAll genes
0.0016
0.0072
0.072
(7) (214) (110)0.0
0.5
1.0
1.5
2.0
2.5
3.0
3.5Novel genes
1e−05
2.3e−05
0.081
(27) (350) (174)0
2
4
6
8
z−score
All familiesAll genes
pro rec LGDpro LGDsib LGD
1e−05
5.4e−05
0.051
(16) (321) (169)z−score
0
2
4
6
Novel genes
0.0048 0.0015
0.1
(8) (231) (113)0.0
0.5
1.0
1.5
2.0
2.5
3.0
Unpub. familiesAll genes
0.0016
0.0072
0.072
(7) (214) (110)0.0
0.5
1.0
1.5
2.0
2.5
3.0
3.5Novel genes
(27) (350) (174)
1e-05
2.3e-05
0.081
b
1e−05
1e−05
0.082
(27) (350) (174)0
2
4
6
8zscore
All
pro rec LGDpro LGDsib LGD
0.0047 0.0018
0.1
(8) (231) (113)0
1
2
3
Post−training
Proband de novo recurrent LGDProband de novo LGDSibling de novo LGD
.CC-BY-NC-ND 4.0 International licenseIt is made available under a was not peer-reviewed) is the author/funder, who has granted bioRxiv a license to display the preprint in perpetuity.
The copyright holder for this preprint (which. http://dx.doi.org/10.1101/057828doi: bioRxiv preprint first posted online Jun. 9, 2016;

23
Figure 2: Evaluation of autism-gene predictions. (a) Plot of area under the ROC curve (AUC) of autism gene prediction with different versions of training gold-standards. Including lower confidence genes in an evidence-weighted framework helps in predicting autism genes, whereas replacing them with a random set of genes with matched expression, annotation, and gene length characteristics (rand34) decreases performance. The evidence-weighted classifier (purple) significantly outperforms all the other classifiers (Wilcoxon rank-sum test; P < 1e-14). (b) Rank-based enrichment test on mutation data from an independent sequencing study (SSC 2014). The plot shows the z-score quantifying the enrichment of the three gene-sets of interest (labeled in the legend below) towards the top of our genome-wide ranking of genes (see Methods). The number of genes in the gene-sets is given in parenthesis below each bar. Our top-ranked genes are significantly enriched in gene targets of de novo likely-gene-disrupting (LGD; also known as loss-of-function) mutations observed in probands (autistic children; second bar). This enrichment is striking for targets of recurrent LGD mutations in probands (first bar), and diminishes for LGD-targets in unaffected siblings of the autistic probands (third bar). The P values recorded at top of each bar were calculated using a permutation test described in Methods in detail. (c-d) All evaluations presented here were carried out by dividing our genome-wide predictions into deciles and using a one-sided binomial test to calculate the significance of a specific gene-set of interest among the first decile (top 10%) of the predictions. Each bar plot shows the fraction of genes in the gene-set (y-axis) that occur within each of the 10 deciles (x-axis), with the first decile colored in red. The name of the gene-set is given on top of each plot along with the total number of genes in the gene-set and the P value from the binomial test in parenthesis just below. (c) Mutation data from the 2014 SSC study (used in b) evaluated within the top 10% of our predictions shows a trend – significant enrichment of proband LGD mutations (first and second plots) and non-enrichment of sibling LGD mutations (third plot) – that is consistent with those observed with rank-based test (shown in b). (d) Targets of major ASD-associated regulatory proteins: Experimentally determined gene targets of FMRP, CHD8 and TOP1 are also significantly enriched in the top 10% of our predictions. (e) Members of major ASD-associated pathways/complexes: Similar significant enrichment was also observed for genes involved in Wnt signaling, MAPK signaling, and the postsynaptic density complex.
.CC-BY-NC-ND 4.0 International licenseIt is made available under a was not peer-reviewed) is the author/funder, who has granted bioRxiv a license to display the preprint in perpetuity.
The copyright holder for this preprint (which. http://dx.doi.org/10.1101/057828doi: bioRxiv preprint first posted online Jun. 9, 2016;

24
Figure 3: ASD-associated genetic changes in the spatiotemporal development of the brain. The heatmap shows the enrichment of spatiotemporal gene expression signatures towards the top of the genome-wide ranking of ASD genes. The 16 brain regions and 13 developmental stages considered label the rows and columns, respectively. The regions are further marked on illustrations of the human brain at the top right. Each cell in the heatmap (row, column) corresponds to a spatiotemporal signature – a set of genes highly expressed specifically in that region (row) at that developmental stage (column). The intensity of the color in each cell (scale below) represents the log-transformed significance of ASD-association of that signature. A rank-based scoring followed by a permutation test was used to calculate P values, which were then converted to Q values to account for multiple hypothesis testing (see Methods). The heatmap shows a striking prenatal signal suggesting major effect of ASD-associated mutations on fetal brain development.
Early
Fetal
2Ea
rly M
idfeta
l 1
Early
Midf
etal 2
Late
Midfeta
lLa
te Fe
talNe
onata
l Earl
y Infa
ncy
Late
Infan
cyEa
rly C
hildh
ood
Middle-
Late
Child
hood
Adole
scne
ceYo
ung A
dulth
ood
Middle
Adult
hood
Late
Adult
hood
MFCV1CHIPAMYOFCITCA1CSTCCBCVFCMDM1CS1CIPCSTRDFC
Medial Prefrontal CortexPrimary Visual CortexHippocampusAmygdalaOrbital Prefrontal CortexInferior Temporal CortexPrimary Auditory CortexSuperior Temporal CortexCerebellar CortexVentrolateral Prefrontal CortexMediodorsal Nucleus of ThalamusPrimary Motor CortexPrimary Somatosensory CortexPosterior Inferior Parietal CortexStriatumDorsolateral Prefrontal Cortex
V1C
MFC
HIPAMY
STRMD
DFCM1C
S1C
VFC
CBCOFC
ITC
IPC
A1C
STC
–log(Q-value)0 4
.CC-BY-NC-ND 4.0 International licenseIt is made available under a was not peer-reviewed) is the author/funder, who has granted bioRxiv a license to display the preprint in perpetuity.
The copyright holder for this preprint (which. http://dx.doi.org/10.1101/057828doi: bioRxiv preprint first posted online Jun. 9, 2016;

25
Figure 4: Autism-associated brain-specific functional modules. The network of brain-specific functional interactions among the top 2,500 ASD-associated genes were clustered using a shared-nearest-neighbor-based community-finding algorithm (see Methods) to elucidate several modules of genes (left). Nine of the clusters that contained 10 or more genes, labeled C1 through C9, were tested for functional enrichment using genes annotated to Gene Ontology biological process terms. Representative processes/pathways enriched within each cluster are presented here alongside the cluster label. Since C6 and C7 shared a number of strong links across the clusters, they were merged before calculating functional enrichment. The enriched functions provide a landscape of cellular functions potentially dysregulated by ASD-associated mutations.
C1
C2
C3
C4C5
C6/C7
C8
C9 C3 ion transport & drug metabolismneurological blood pressure regulation
sensory perceptionC4
histone modificationchromatin remodelingimmune response
C8 Rho GTPase, IGF & PI3K signaling
C1synaptic transmission and plasticity locomotory behaviorG-protein/cAMP signaling enteric nervous system development
C2 embryonic development & morphogenesisSmoothened (Hedgehog) signaling
C5mRNA splicing & transportG1/S transition in cell cycleprotein ubiquitination & amino acid metabolismantigen processing & presentation
C6
C7actin cytoskeletonG2/M transition in cell cycle
glucose metabolismplatelet degranulationIFN-γ signaling
C9MAPK, TGFβ & TLR signaling
circadian rhythmendoderm development
.CC-BY-NC-ND 4.0 International licenseIt is made available under a was not peer-reviewed) is the author/funder, who has granted bioRxiv a license to display the preprint in perpetuity.
The copyright holder for this preprint (which. http://dx.doi.org/10.1101/057828doi: bioRxiv preprint first posted online Jun. 9, 2016;

26
Figure 5: Prioritization of genes within eight recurrent ASD-associated CNVs. Each plot corresponds to one of the eight CNVs ordered based on their observed frequency in autistic cases15 (given above each plot). The plots show the genes in each CNV interval in their genomic order (y-axis) and each gene’s ASD-association rank in our genome-wide predictions (x-axis) from top (low) ranks on the left to bottom (high) ranks on the right. The points corresponding to the genes are also colored red and blue based on whether there exists
●
●
●
●
●
16p11.2
SLC7A5P1SPN
QPRTC16orf54
ZG16KIF22MAZ
PRRT2PAGR1MVP
CDIPTSEZ6L2ASPHD1KCTD13
TMEM219TAOK2HIRIP3INO80EDOC2A
C16orf92FAM57BALDOAPPP4CTBX6YPEL3GDPD3MAPK3
CORO1A
0 10000 20000
●
●
●
15q11−13
HERC2P3GOLGA6L6
NBEAP1CXADRP2
LOC727924OR4M2OR4N4
OR4N3PGOLGA8DPGOLGA6L1TUBGCP5CYFIP1NIPA2NIPA1
GOLGA8IHERC2P2
LOC440243GOLGA8EPGOLGA6L2
MKRN3MAGEL2
NDNNPAP1SNRPNSNURFPAR5
SNURF−SNRPNUBE3AATP10A
0 10000 20000
●
●
15q13.3
ARHGAP11B
HERC2P10
FAN1
MTMR10
TRPM1
LOC283710
KLF13
OTUD7A
CHRNA7
0 10000 20000
●
1q21.1
PRKAB2
PDIA3P
FMO5
CHD1L
BCL9
ACP6
GJA5
GJA8
GPR89B
GPR89C
NBPF24
NBPF8
0 10000 20000
●
●
●
●●
22q11
DGCR2DGCR14TSSK2GSC2
SLC25A1CLTCL1HIRA
MRPL40C22orf39UFD1LCDC45CLDN5TBX1
GNB1LC22orf29TXNRD2COMTARVCF
TANGO2DGCR8TRMT2ARANBP1ZDHHC8
LOC388849LINC00896
RTN4RDGCR6L
TMEM191BRIMBP3USP41ZNF74
SCARF2KLHL22MED15PI4KA
SERPIND1SNAP29CRKLAIFM3LZTR1THAP7P2RX6SLC7A4
0 10000 20000
●
●
●
●
7q11.23
FKBP6FZD9
BAZ1BBCL7BTBL2
MLXIPLVPS37DDNAJC30WBSCR22
STX1AABHD11CLDN3CLDN4
WBSCR27WBSCR28
ELNLIMK1EIF4HLAT2RFC2CLIP2
GTF2IRD1GTF2I
0 10000 20000
●
17q12
ZNHIT3
MYO19
PIGW
GGNBP2
DHRS11
MRM1
LHX1
AATF
ACACA
C17orf78
TADA2A
DUSP14
SYNRG
DDX52
HNF1B
0 10000 20000
3q29
TFRCZDHHC19SLC51APCYT1A
TCTEX1D2TM4SF19UBXN7RNF168C3orf43WDR53FBXO45LRRC33CEP19PIGXPAK2
SENP5NCBP2
NCBP2−AS2PIGZMFI2DLG1BDH1
0 10000 20000
ASD
0.58% 0.20% 0.20% 0.18%
0.03%0.05%0.10%0.18%
●
●
●
●
●
●
16p11.2
SLC7A5P1SPN
QPRTC16orf54
ZG16KIF22MAZ
PRRT2PAGR1MVP
CDIPTSEZ6L2ASPHD1KCTD13
TMEM219TAOK2HIRIP3INO80EDOC2A
C16orf92FAM57BALDOAPPP4CTBX6YPEL3GDPD3MAPK3
CORO1A
0 10000 20000
●
●
●
●
15q11−13
HERC2P3GOLGA6L6
NBEAP1CXADRP2
LOC727924OR4M2OR4N4
OR4N3PGOLGA8DPGOLGA6L1TUBGCP5CYFIP1NIPA2NIPA1
GOLGA8IHERC2P2
LOC440243GOLGA8EPGOLGA6L2
MKRN3MAGEL2
NDNNPAP1SNRPNSNURFPAR5
UBE3AATP10A
0 10000 20000
●
●
15q13.3
ARHGAP11B
HERC2P10
FAN1
MTMR10
TRPM1
LOC283710
KLF13
OTUD7A
CHRNA7
0 10000 20000
●
1q21.1
PRKAB2
PDIA3P
FMO5
CHD1L
BCL9
ACP6
GJA5
GJA8
GPR89B
GPR89C
NBPF24
NBPF8
0 10000 20000
●
22q11
DGCR2DGCR14TSSK2GSC2
SLC25A1CLTCL1HIRA
MRPL40C22orf39UFD1LCDC45CLDN5TBX1
GNB1LC22orf29TXNRD2COMTARVCF
TANGO2DGCR8TRMT2ARANBP1ZDHHC8
LOC388849LINC00896
RTN4RDGCR6L
TMEM191BRIMBP3USP41ZNF74
SCARF2KLHL22MED15PI4KA
SERPIND1SNAP29CRKLAIFM3LZTR1THAP7P2RX6SLC7A4
0 10000 20000
●
●
●
●
7q11.23
FKBP6FZD9
BAZ1BBCL7BTBL2
MLXIPLVPS37DDNAJC30WBSCR22
STX1AABHD11CLDN3CLDN4
WBSCR27WBSCR28
ELNLIMK1EIF4HLAT2RFC2CLIP2
GTF2IRD1GTF2I
0 10000 20000
●
17q12
ZNHIT3
MYO19
PIGW
GGNBP2
DHRS11
MRM1
LHX1
AATF
ACACA
C17orf78
TADA2A
DUSP14
SYNRG
DDX52
HNF1B
0 10000 20000
3q29
TFRCZDHHC19SLC51APCYT1A
TCTEX1D2TM4SF19UBXN7RNF168C3orf43WDR53FBXO45LRRC33CEP19PIGXPAK2
SENP5NCBP2
NCBP2−AS2PIGZMFI2DLG1BDH1
0 10000 20000
●
●
●
●
●
●
16p11.2
SLC7A5P1SPN
QPRTC16orf54
ZG16KIF22MAZ
PRRT2PAGR1MVP
CDIPTSEZ6L2ASPHD1KCTD13
TMEM219TAOK2HIRIP3INO80EDOC2A
C16orf92FAM57BALDOAPPP4CTBX6YPEL3GDPD3MAPK3
CORO1A
0 10000 20000
●
●
●
●
15q11−13
HERC2P3GOLGA6L6
NBEAP1CXADRP2
LOC727924OR4M2OR4N4
OR4N3PGOLGA8DPGOLGA6L1TUBGCP5CYFIP1NIPA2NIPA1
GOLGA8IHERC2P2
LOC440243GOLGA8EPGOLGA6L2
MKRN3MAGEL2
NDNNPAP1SNRPNSNURFPAR5
UBE3AATP10A
0 10000 20000
●
●
15q13.3
ARHGAP11B
HERC2P10
FAN1
MTMR10
TRPM1
LOC283710
KLF13
OTUD7A
CHRNA7
0 10000 20000
●
1q21.1
PRKAB2
PDIA3P
FMO5
CHD1L
BCL9
ACP6
GJA5
GJA8
GPR89B
GPR89C
NBPF24
NBPF8
0 10000 20000
●
22q11
DGCR2DGCR14TSSK2GSC2
SLC25A1CLTCL1HIRA
MRPL40C22orf39UFD1LCDC45CLDN5TBX1
GNB1LC22orf29TXNRD2COMTARVCF
TANGO2DGCR8TRMT2ARANBP1ZDHHC8
LOC388849LINC00896
RTN4RDGCR6L
TMEM191BRIMBP3USP41ZNF74
SCARF2KLHL22MED15PI4KA
SERPIND1SNAP29CRKLAIFM3LZTR1THAP7P2RX6SLC7A4
0 10000 20000
●
●
●
●
7q11.23
FKBP6FZD9
BAZ1BBCL7BTBL2
MLXIPLVPS37DDNAJC30WBSCR22
STX1AABHD11CLDN3CLDN4
WBSCR27WBSCR28
ELNLIMK1EIF4HLAT2RFC2CLIP2
GTF2IRD1GTF2I
0 10000 20000
●
17q12
ZNHIT3
MYO19
PIGW
GGNBP2
DHRS11
MRM1
LHX1
AATF
ACACA
C17orf78
TADA2A
DUSP14
SYNRG
DDX52
HNF1B
0 10000 20000
3q29
TFRCZDHHC19SLC51APCYT1A
TCTEX1D2TM4SF19UBXN7RNF168C3orf43WDR53FBXO45LRRC33CEP19PIGXPAK2
SENP5NCBP2
NCBP2−AS2PIGZMFI2DLG1BDH1
0 10000 20000
functional evidencegenetic evidence
.CC-BY-NC-ND 4.0 International licenseIt is made available under a was not peer-reviewed) is the author/funder, who has granted bioRxiv a license to display the preprint in perpetuity.
The copyright holder for this preprint (which. http://dx.doi.org/10.1101/057828doi: bioRxiv preprint first posted online Jun. 9, 2016;

27
previously known (direct) genetic or (indirect) functional links between the genes and autism, independently curated by an ASD expert. The detailed ranking and evidence for CNV genes are in Table S7. The dashed lines are visual aids to read the gene names (in bold) of the colored point. Across the CNVs, genes with independent genetic evidence (red) and those with functional evidence (blue) tend to be ranked near the top of our genome-wide predictions (towards the left of each plot), compared to all the other genes that lack any evidence (grey).
.CC-BY-NC-ND 4.0 International licenseIt is made available under a was not peer-reviewed) is the author/funder, who has granted bioRxiv a license to display the preprint in perpetuity.
The copyright holder for this preprint (which. http://dx.doi.org/10.1101/057828doi: bioRxiv preprint first posted online Jun. 9, 2016;

28
Figure 6: Convergence of cellular functions disrupted by multiple CNVs identified through key intermediate genes in the brain network. The network diagram above illustrates the intermediate genes linking the eight CNVs (black rectangles) to the molecular phenotype of ASD. The dotted grey lines represent high confidence functional links in the brain that mediate the linkage of top CNV genes’ to ASD genes; these linkages go through key intermediate genes (black circles, see Methods). Enrichment analysis groups the intermediate genes into a small number of autism related processes (illustrated as colored clouds). For visual clarity, only representative examples of processes associated with at least two CNVs are included. The functions of these intermediate genes illustrate the hypothesis that multiple CNVs might disrupt a core group of ASD-related biological processes and pathways.
.CC-BY-NC-ND 4.0 International licenseIt is made available under a was not peer-reviewed) is the author/funder, who has granted bioRxiv a license to display the preprint in perpetuity.
The copyright holder for this preprint (which. http://dx.doi.org/10.1101/057828doi: bioRxiv preprint first posted online Jun. 9, 2016;
29
References 1. Winter, E. E., Goodstadt, L. & Ponting, C. P. Elevated rates of protein secretion,
evolution, and disease among tissue-specific genes. Genome Res. 14, 54–61 (2004).
2. Goh, K.-I. et al. The human disease network. Proc. Natl. Acad. Sci. U. S. A. 104, 8685–90 (2007).
3. Sanders, S. J. et al. De novo mutations revealed by whole-exome sequencing are strongly associated with autism. Nature 485, 237–241 (2012).
4. O’Roak, B. J. et al. Sporadic autism exomes reveal a highly interconnected protein network of de novo mutations. Nature 485, 246–250 (2012).
5. Neale, B. M. et al. Patterns and rates of exonic de novo mutations in autism spectrum disorders. Nature 485, 242–245 (2012).
6. Iossifov, I. et al. De novo gene disruptions in children on the autistic spectrum. Neuron 74, 285–299 (2012).
7. Iossifov, I. et al. The contribution of de novo coding mutations to autism spectrum disorder. Nature 515, 216–21 (2014).
8. De Rubeis, S. et al. Synaptic, transcriptional and chromatin genes disrupted in autism. Nature 515, 209–15 (2014).
9. Sanders, S. J. et al. Insights into Autism Spectrum Disorder Genomic Architecture and Biology from 71 Risk Loci. Neuron 87, 1215–1233 (2015).
10. Ronemus, M., Iossifov, I., Levy, D. & Wigler, M. The role of de novo mutations in the genetics of autism spectrum disorders. Nat. Rev. Genet. 15, 133–141 (2014).
11. He, X. et al. Integrated model of de novo and inherited genetic variants yields greater power to identify risk genes. PLoS Genet. 9, e1003671 (2013).
12. Gilman, S. R. et al. Rare de novo variants associated with autism implicate a large functional network of genes involved in formation and function of synapses. Neuron 70, 898–907 (2011).
13. Lee, T.-L. L., Raygada, M. J. & Rennert, O. M. Integrative gene network analysis provides novel regulatory relationships, genetic contributions and susceptible targets in autism spectrum disorders. Gene 496, 88–96 (2012).
14. Kou, Y., Betancur, C., Xu, H., Buxbaum, J. D. & Ma’ayan, A. Network- and attribute-based classifiers can prioritize genes and pathways for autism spectrum disorders and intellectual disability. Am. J. Med. Genet. Part C Semin. Med. Genet. 160C, 130–142 (2012).
15. Moreno-De-Luca, D. et al. Using large clinical data sets to infer pathogenicity for rare copy number variants in autism cohorts. Mol. Psychiatry 18, 1090–5 (2013).
16. Ben-David, E. & Shifman, S. Combined analysis of exome sequencing points toward a major role for transcription regulation during brain development in autism. Mol. Psychiatry 18, 1054–6 (2013).
17. Parikshak, N. N. et al. Integrative functional genomic analyses implicate specific molecular pathways and circuits in autism. Cell 155, 1008–21 (2013).
18. Liu, L. et al. DAWN: a framework to identify autism genes and subnetworks using gene expression and genetics. Mol. Autism 5, 22 (2014).
.CC-BY-NC-ND 4.0 International licenseIt is made available under a was not peer-reviewed) is the author/funder, who has granted bioRxiv a license to display the preprint in perpetuity.
The copyright holder for this preprint (which. http://dx.doi.org/10.1101/057828doi: bioRxiv preprint first posted online Jun. 9, 2016;

30
19. Li, J. et al. Integrated systems analysis reveals a molecular network underlying autism spectrum disorders. Mol. Syst. Biol. 10, 774 (2014).
20. Chang, J., Gilman, S. R., Chiang, A. H., Sanders, S. J. & Vitkup, D. Genotype to phenotype relationships in autism spectrum disorders. Nat. Neurosci. 18, 191–198 (2014).
21. Hormozdiari, F., Penn, O., Borenstein, E. & Eichler, E. E. The discovery of integrated gene networks for autism and related disorders. Genome Res. 25, 142–154 (2015).
22. Liu, L., Lei, J. & Roeder, K. NETWORK ASSISTED ANALYSIS TO REVEAL THE GENETIC BASIS OF AUTISM. Ann. Appl. Stat. 9, 1571–1600 (2015).
23. Parikshak, N. N., Gandal, M. J. & Geschwind, D. H. Systems biology and gene networks in neurodevelopmental and neurodegenerative disorders. Nat. Rev. Genet. 16, 441–458 (2015).
24. Greene, C. S. et al. Understanding multicellular function and disease with human tissue-specific networks. Nat. Genet. 47, 569–76 (2015).
25. Abrahams, B. S. et al. SFARI Gene 2.0: a community-driven knowledgebase for the autism spectrum disorders (ASDs). Mol. Autism 4, 36 (2013).
26. Hamosh, A., Scott, A. F., Amberger, J. S., Bocchini, C. A. & McKusick, V. A. Online Mendelian Inheritance in Man (OMIM), a knowledgebase of human genes and genetic disorders. Nucleic Acids Res. 33, D514–7 (2005).
27. Peng, K. et al. The Disease and Gene Annotations (DGA): an annotation resource for human disease. Nucleic Acids Res. 41, D553–60 (2013).
28. Darnell, J. C. et al. FMRP stalls ribosomal translocation on mRNAs linked to synaptic function and autism. Cell 146, 247–61 (2011).
29. King, I. F. et al. Topoisomerases facilitate transcription of long genes linked to autism. Nature 501, 58–62 (2013).
30. Cotney, J. et al. The autism-associated chromatin modifier CHD8 regulates other autism risk genes during human neurodevelopment. Nat. Commun. 6, 6404 (2015).
31. Pinto, D. et al. Convergence of genes and cellular pathways dysregulated in autism spectrum disorders. Am. J. Hum. Genet. 94, 677–94 (2014).
32. Bayés, A. et al. Characterization of the proteome, diseases and evolution of the human postsynaptic density. Nat. Neurosci. 14, 19–21 (2011).
33. Corominas, R. et al. Protein interaction network of alternatively spliced isoforms from brain links genetic risk factors for autism. Nat. Commun. 5, (2014).
34. Iossifov, I. et al. Low load for disruptive mutations in autism genes and their biased transmission. Proc. Natl. Acad. Sci. U. S. A. 112, E5600–7 (2015).
35. Jiang, M. et al. Multiple neurological abnormalities in mice deficient in the G protein Go. Proc. Natl. Acad. Sci. 95, 3269–3274 (1998).
36. Saitsu, H. et al. Phenotypic spectrum of GNAO1 variants: epileptic encephalopathy to involuntary movements with severe developmental delay. Eur. J. Hum. Genet. 24, 129–34 (2016).
37. Corradi, A. et al. SYN2 is an autism predisposing gene: loss-of-function mutations alter synaptic vesicle cycling and axon outgrowth. Hum. Mol. Genet. 23, 90–103 (2014).
.CC-BY-NC-ND 4.0 International licenseIt is made available under a was not peer-reviewed) is the author/funder, who has granted bioRxiv a license to display the preprint in perpetuity.
The copyright holder for this preprint (which. http://dx.doi.org/10.1101/057828doi: bioRxiv preprint first posted online Jun. 9, 2016;

31
38. Greco, B. et al. Autism-related behavioral abnormalities in synapsin knockout mice. Behav. Brain Res. 251, 65–74 (2013).
39. Celestino-Soper, P. B. et al. Deletions in chromosome 6p22.3-p24.3, including ATXN1, are associated with developmental delay and autism spectrum disorders. Mol. Cytogenet. 5, 17 (2012).
40. Willsey, A. J. et al. Coexpression networks implicate human midfetal deep cortical projection neurons in the pathogenesis of autism. Cell 155, 997–1007 (2013).
41. Pinto, D. et al. Functional impact of global rare copy number variation in autism spectrum disorders. Nature 466, 368–372 (2010).
42. Kaminsky, E. B. et al. An evidence-based approach to establish the functional and clinical significance of copy number variants in intellectual and developmental disabilities. Genet. Med. 13, 777–84 (2011).
43. Courchesne, E. et al. Mapping early brain development in autism. Neuron 56, 399–413 (2007).
44. Kang, H. J. et al. Spatio-temporal transcriptome of the human brain. Nature 478, 483–489 (2011).
45. Uddin, M. et al. Brain-expressed exons under purifying selection are enriched for de novo mutations in autism spectrum disorder. Nat. Genet. 46, 742–7 (2014).
46. Jeremy Willsey, A. & State, M. W. Autism spectrum disorders: from genes to neurobiology. Curr. Opin. Neurobiol. 30C, 92–99 (2014).
47. Stoner, R. et al. Patches of disorganization in the neocortex of children with autism. N. Engl. J. Med. 370, 1209–19 (2014).
48. Haar, S., Berman, S., Behrmann, M. & Dinstein, I. Anatomical Abnormalities in Autism? Cereb. Cortex (2014). at <http://www.ncbi.nlm.nih.gov/pubmed/25316335>
49. Dinstein, I., Heeger, D. J. & Behrmann, M. Neural variability: friend or foe? Trends Cogn. Sci. 19, 322–328 (2015).
50. Tsai, P. T. et al. Autistic-like behaviour and cerebellar dysfunction in Purkinje cell Tsc1 mutant mice. Nature 488, 647–51 (2012).
51. Wang, S. S.-H., Kloth, A. D. & Badura, A. The Cerebellum, Sensitive Periods, and Autism. Neuron 83, 518–532 (2014).
52. Peça, J. et al. Shank3 mutant mice display autistic-like behaviours and striatal dysfunction. Nature 472, 437–42 (2011).
53. Rothwell, P. E. et al. Autism-associated neuroligin-3 mutations commonly impair striatal circuits to boost repetitive behaviors. Cell 158, 198–212 (2014).
54. Di Martino, A. et al. The autism brain imaging data exchange: towards a large-scale evaluation of the intrinsic brain architecture in autism. Mol. Psychiatry 19, 659–67 (2014).
55. Blondel, V. D., Guillaume, J.-L., Lambiotte, R. & Lefebvre, E. Fast unfolding of communities in large networks. J. Stat. Mech. Theory Exp. 2008, P10008 (2008).
56. Goldberg, D. S. & Roth, F. P. Assessing experimentally derived interactions in a small world. Proc. Natl. Acad. Sci. U. S. A. 100, 4372–6 (2003).
57. Voineagu, I. et al. Transcriptomic analysis of autistic brain reveals convergent molecular pathology. Nature 474, 380–4 (2011).
.CC-BY-NC-ND 4.0 International licenseIt is made available under a was not peer-reviewed) is the author/funder, who has granted bioRxiv a license to display the preprint in perpetuity.
The copyright holder for this preprint (which. http://dx.doi.org/10.1101/057828doi: bioRxiv preprint first posted online Jun. 9, 2016;

32
58. Masi, A. et al. Cytokine aberrations in autism spectrum disorder: a systematic review and meta-analysis. Mol. Psychiatry 20, 440–6 (2015).
59. Bresnahan, M. et al. Association of maternal report of infant and toddler gastrointestinal symptoms with autism: evidence from a prospective birth cohort. JAMA psychiatry 72, 466–74 (2015).
60. Hazen, E. P., Stornelli, J. L., O’Rourke, J. A., Koesterer, K. & McDougle, C. J. Sensory symptoms in autism spectrum disorders. Harv. Rev. Psychiatry 22, 112–24
61. Cohen, S., Conduit, R., Lockley, S. W., Rajaratnam, S. M. & Cornish, K. M. The relationship between sleep and behavior in autism spectrum disorder (ASD): a review. J. Neurodev. Disord. 6, 44 (2014).
62. Takahashi, T. et al. Rosbin: a novel homeobox-like protein gene expressed exclusively in round spermatids. Biol. Reprod. 70, 1485–92 (2004).
63. Weiss, L. A. et al. Association between microdeletion and microduplication at 16p11.2 and autism. N. Engl. J. Med. 358, 667–75 (2008).
64. Lin, G. N. et al. Spatiotemporal 16p11.2 protein network implicates cortical late mid-fetal brain development and KCTD13-Cul3-RhoA pathway in psychiatric diseases. Neuron 85, 742–54 (2015).
65. Martin-Granados, C., Philp, A., Oxenham, S. K., Prescott, A. R. & Cohen, P. T. W. Depletion of protein phosphatase 4 in human cells reveals essential roles in centrosome maturation, cell migration and the regulation of Rho GTPases. Int. J. Biochem. Cell Biol. 40, 2315–32 (2008).
66. de Vries, B. et al. PRRT2 mutation causes benign familial infantile convulsions. Neurology 79, 2154–5 (2012).
67. Ronan, J. L., Wu, W. & Crabtree, G. R. From neural development to cognition: unexpected roles for chromatin. Nat. Rev. Genet. 14, 347–59 (2013).
68. Mondal, K. et al. Excess variants in AFF2 detected by massively parallel sequencing of males with autism spectrum disorder. Hum. Mol. Genet. 21, 4356–64 (2012).
69. Jiang, Y. et al. Detection of clinically relevant genetic variants in autism spectrum disorder by whole-genome sequencing. Am. J. Hum. Genet. 93, 249–63 (2013).
70. Chow, M. L. et al. Age-dependent brain gene expression and copy number anomalies in autism suggest distinct pathological processes at young versus mature ages. PLoS Genet. 8, e1002592 (2012).
71. Chen, J. A., Peñagarikano, O., Belgard, T. G., Swarup, V. & Geschwind, D. H. The emerging picture of autism spectrum disorder: genetics and pathology. Annu. Rev. Pathol. 10, 111–44 (2015).
72. Vanunu, O., Magger, O., Ruppin, E., Shlomi, T. & Sharan, R. Associating genes and protein complexes with disease via network propagation. PLoS Comput. Biol. 6, e1000641 (2010).
73. Hus, V., Gotham, K. & Lord, C. Standardizing ADOS domain scores: separating severity of social affect and restricted and repetitive behaviors. J. Autism Dev. Disord. 44, 2400–12 (2014).
74. Kulakovskiy, I. V et al. HOCOMOCO: a comprehensive collection of human transcription factor binding sites models. Nucleic Acids Res. 41, D195–202 (2013).
.CC-BY-NC-ND 4.0 International licenseIt is made available under a was not peer-reviewed) is the author/funder, who has granted bioRxiv a license to display the preprint in perpetuity.
The copyright holder for this preprint (which. http://dx.doi.org/10.1101/057828doi: bioRxiv preprint first posted online Jun. 9, 2016;

33
75. Yu, W., Gwinn, M., Clyne, M., Yesupriya, A. & Khoury, M. J. A navigator for human genome epidemiology. Nat. Genet. 40, 124–5 (2008).
76. Becker, K. G., Barnes, K. C., Bright, T. J. & Wang, S. A. The genetic association database. Nat. Genet. 36, 431–2 (2004).
77. Fan, R., Wang, X. & Lin, C. LIBLINEAR : A Library for Large Linear Classification. 9, 1871–1874 (2012).
78. Fischbach, G. D. & Lord, C. The Simons Simplex Collection: a resource for identification of autism genetic risk factors. Neuron 68, 192–5 (2010).
79. Petrovski, S., Wang, Q., Heinzen, E. L., Allen, A. S. & Goldstein, D. B. Genic intolerance to functional variation and the interpretation of personal genomes. PLoS Genet. 9, e1003709 (2013).
80. Samocha, K. E. et al. A framework for the interpretation of de novo mutation in human disease. Nat. Genet. 46, 944–50 (2014).
81. Barrett, T. et al. NCBI GEO: archive for functional genomics data sets--update. Nucleic Acids Res. 41, D991–5 (2013).
82. Bolstad, B. M., Irizarry, R. A., Astrand, M. & Speed, T. P. A comparison of normalization methods for high density oligonucleotide array data based on variance and bias. Bioinformatics 19, 185–93 (2003).
83. Dai, M. et al. Evolving gene/transcript definitions significantly alter the interpretation of GeneChip data. Nucleic Acids Res. 33, e175 (2005).
84. Benjamini, Y. & Hochberg, Y. Controlling the False Discovery Rate: A Practical and Powerful Approach to Multiple Testing. J. R. Stat. Soc. Ser. B 57, 289–300 (1995).
85. Shannon, P. et al. Cytoscape: a software environment for integrated models of biomolecular interaction networks. Genome Res. 13, 2498–504 (2003).
86. The Gene Ontology Consortium. The Gene Ontology: enhancements for 2011. Nucleic Acids Res. 40, D559–64 (2012).
87. Kent, W. J. et al. The Human Genome Browser at UCSC. Genome Res. 12, 996–1006 (2002).
88. Grant, C. E., Bailey, T. L. & Noble, W. S. FIMO: scanning for occurrences of a given motif. Bioinformatics 27, 1017–8 (2011).
89. Bostock, M., Ogievetsky, V. & Heer, J. D3: Data-Driven Documents. IEEE Trans. Vis. Comput. Graph. 17, 2301–9 (2011).
90. Niculescu-Mizil, A. & Caruana, R. Predicting good probabilities with supervised learning. in Proceedings of the 22nd international conference on Machine learning - ICML ’05 625–632 (ACM Press, 2005). at <http://dl.acm.org/citation.cfm?id=1102351.1102430>
.CC-BY-NC-ND 4.0 International licenseIt is made available under a was not peer-reviewed) is the author/funder, who has granted bioRxiv a license to display the preprint in perpetuity.
The copyright holder for this preprint (which. http://dx.doi.org/10.1101/057828doi: bioRxiv preprint first posted online Jun. 9, 2016;
Related Documents