TECHNISCHE UNIVERSITÄT MÜNCHEN Lehrstuhl für Experimentelle Genetik Genome-wide association study to search for SNPs affecting gene expression in a general population Divya Deepak Mehta Vollständiger Abdruck der von der Fakultät Wissenschaftszentrum Weihenstephan für Ernährung, Landnutzung und Umwelt der Technischen Universität München zur Erlangung des akademischen Grades eines Doktors der Naturwissenschaften genehmigten Dissertation. Vorsitzender: Univ.-Prof. Dr. A. Gierl Prüfer der Dissertation: 1. Univ.-Prof. Dr. Th. Meitinger 2. apl. Prof. Dr. J. Adamski 3. Univ.-Prof. Dr. H -R. Fries Die Dissertation wurde am 19.12.2008 bei der Technischen Universität München eingereicht und durch die Fakultät Wissenschaftszentrum Weihenstephan für Ernährung, Landnutzung und Umwelt am 10.10.2009 angenommen.

Welcome message from author
This document is posted to help you gain knowledge. Please leave a comment to let me know what you think about it! Share it to your friends and learn new things together.
Transcript
TECHNISCHE UNIVERSITÄT MÜNCHEN
Lehrstuhl für Experimentelle Genetik
Genome-wide association study to search for SNPs
affecting gene expression in a general population
Divya Deepak Mehta
Vollständiger Abdruck der von der Fakultät Wissenschaftszentrum Weihenstephan für
Ernährung, Landnutzung und Umwelt der Technischen Universität München zur
Erlangung des akademischen Grades eines
Doktors der Naturwissenschaften
genehmigten Dissertation.
Vorsitzender: Univ.-Prof. Dr. A. Gierl
Prüfer der Dissertation:
1. Univ.-Prof. Dr. Th. Meitinger
2. apl. Prof. Dr. J. Adamski
3. Univ.-Prof. Dr. H -R. Fries
Die Dissertation wurde am 19.12.2008 bei der Technischen Universität München
eingereicht und durch die Fakultät Wissenschaftszentrum Weihenstephan für Ernährung,
Landnutzung und Umwelt am 10.10.2009 angenommen.
Table of Contents
ZUSAMMENFASSUNG.............................................................................................................................. 1
1.0 SUMMARY............................................................................................................................................. 2
2.0 INTRODUCTION .................................................................................................................................. 3
2.1 RNAISSANCE AND GENE REGULATION ................................................................................................. 5 2.2 VARIATION IN HUMAN GENE EXPRESSION............................................................................................. 8 2.2.1 HERITABILITY OF GENE EXPRESSION VARIATION ............................................................................... 8 2.2.2 CIS AND TRANS EFFECTS .................................................................................................................... 9 2.2.2.1 CIS-ACTING ELEMENTS ................................................................................................................. 10 2.2.2.2 TRANS-ACTING FACTORS .............................................................................................................. 11 2.2.3 GENE EXPRESSION VARIATION AT THE LEVEL OF ISOFORMS ............................................................ 11 2.3 GENETIC MAPPING OF GENE EXPRESSION VARIATION ......................................................................... 12 2.3.1 LINKAGE STUDIES............................................................................................................................ 12 2.3.2 ASSOCIATION STUDIES..................................................................................................................... 13 2.3.2.1 POPULATION-BASED ASSOCIATION STUDIES ................................................................................. 14 2.3.2.1.1 POPULATION STRATIFICATION: LOOKOUT FOR “SUSHI” GENES ................................................ 14 2.3.2.2 GENOME-WIDE ASSOCIATION STUDIES.......................................................................................... 15
3.0 AIMS OF THE INVESTIGATION .................................................................................................... 17
4.0 MATERIALS AND METHODS......................................................................................................... 19
4.1 MATERIALS ........................................................................................................................................ 19 4.1.1 RNA RESOURCES............................................................................................................................. 19 4.1.1.1 THE KORA F3/S3 POPULATION.................................................................................................... 19 4.2 METHODS ........................................................................................................................................... 20 4.2.1 RNA ISOLATION .............................................................................................................................. 21 4.2.2 RNA QUALITY CHECK USING AGILENT BIOANALYZER NANO 6000 KIT........................................... 22 4.2.3 THE RIN (RNA INTEGRITY NUMBER) ............................................................................................. 23 4.2.4 RNA QUANTIFICATION USING THE INVITROGEN RIBOGREEN KIT..................................................... 23 4.2.5 GLOBIN REDUCTION EXPERIMENTAL PROCEDURE............................................................................ 24 4.2.6 RNA AMPLIFICATION, REVERSE TRANSCRIPTION AND LABELING .................................................... 26 4.2.7 ILLUMINA MICROARRAY PROCEDURES............................................................................................. 29 4.2.7.1 WHOLE GENOME GENE EXPRESSION WITH SENTRIX BEAD CHIP .................................................... 29 4.2.7.2 MICROARRAY LOADING................................................................................................................ 29
4.2.8 ILLUMINA BEAD STUDIO CONTROL SUMMARY REPORT .................................................................... 32 4.2.9 GENOTYPING ................................................................................................................................... 33 4.2.10 STATISTICAL ANALYSIS ................................................................................................................. 33
5.0 RESULTS.............................................................................................................................................. 35
5.1 DYNAMIC RANGE OF DETECTION ........................................................................................................ 35 5.2 NORMALIZATION OF GENE EXPRESSION DATA .................................................................................... 36 5.3 FILTERING OF EXPRESSION DATA ........................................................................................................ 37 5.4 TECHNICAL AND BIOLOGICAL REPLICATES ......................................................................................... 39 5.5 VARIABILITY IN GENE EXPRESSION LEVELS ........................................................................................ 40 5.6 GENES EXPRESSED IN WHOLE BLOOD.................................................................................................. 43 5.7 CELL-SPECIFIC GENE EXPRESSION PATTERNS...................................................................................... 45 5.8 GLOBIN – TO REDUCE OR NOT REDUCE?.............................................................................................. 47 5.9 GENDER-SPECIFIC DIFFERENCES IN GENE EXPRESSION........................................................................ 50 5.10 AGE-RELATED GENE EXPRESSION PATTERNS .................................................................................... 53 5.11 CIS AND TRANS REGULATORS OF GENE EXPRESSION ......................................................................... 54 5.12 FUNCTIONAL VALIDATION OF GWAS CANDIDATE SNPS USING EXPRESSION PROFILES.................... 63 5.12.1 CONFIRMATION OF KNOWN ESNPS AND IDENTIFICATION OF NOVEL ESNPS.................................. 64 5.12.2 AN EXAMPLE WHERE EXPRESSION PROFILES ALLOWED PRIORITIZATION OF A CANDIDATE GENE... 66 5.12.3 TESTING FOR EFFECTS OF CIS AND TRANS SNPS IN THE CANDIDATE GENES................................... 66 5.13 USE OF GENE EXPRESSION TO FUNCTIONALLY VALIDATE GWAS CANDIDATE GENES....................... 69 5.13.1 FUNCTIONAL VALIDATION OF SLC2A9 INFLUENCING URIC ACID CONCENTRATIONS..................... 69 5.13.2 FUNCTIONAL VALIDATION OF WDR66 ASSOCIATED WITH MPV IN A GWAS ............................... 71 5.14 IDENTIFICATION OF NOVEL REGULATORY PATHWAY ........................................................................ 72 5.14.1 USE OF EXPRESSION PROFILES TO IDENTIFY IGE REGULATION PATHWAY ...................................... 72
6.0 DISCUSSION AND CONCLUSIONS................................................................................................ 74
6.1 ADVANTAGES AND DISADVANTAGES OF USING WHOLE BLOOD IN TRANSCRIPTOMICS ........................ 74 6.2 ESTABLISHMENT OF THE KORA GENE EXPRESSION DATASET ............................................................ 75 6.2.1 USE OF THE KORA DATASET TO MEASURE VARIABILITY OF GENE EXPRESSION .............................. 76 6.2.2 GENDER-SPECIFIC GENE EXPRESSION SIGNATURES IN THE KORA DATASET.................................... 77 6.2.2.1 ESTABLISHMENT OF A GENDER PREDICTOR................................................................................... 77 6.3 AGE -SPECIFIC GENE EXPRESSION SIGNATURES IN THE KORA DATASET ............................................ 78 6.4 IDENTIFICATION OF CIS AND TRANS EQTLS ........................................................................................ 80 6.5 USE OF THE KORA GENE EXPRESSION RESOURCE TO IDENTIFY NOVEL ESNPS .................................. 82 6.6 FUNCTIONAL VALIDATION OF SLC2A9 .............................................................................................. 83 6.7 GENOME-WIDE ASSOCIATION STUDIES - CAVEATS AND FUTURE PERSPECTIVES .................................. 85 6.8 VALUE OF GENE EXPRESSION DATA .................................................................................................... 86

7.0 BIBLIOGRAPHY................................................................................................................................. 88
9.0 LIST OF ABBREVIATIONS............................................................................................................ 100
10.0 ACKNOWLEDGEMENTS ............................................................................................................. 102

Zusammenfassung
Die quantitative Erfassung von Gentranskription liefert wertvolle Hinweise bei der
Untersuchung genetischer Risikofaktoren von haüfigen Erkrankungen. Ziel dieser Arbeit
war es, DNA-Varianten in der Normalbevölkerung zu identifizieren, welche die
Genaktivität beeinflussen. Dazu wurde eine genomweite Assoziationsstudie (GWAS) von
381 Individuen der KORA Kohorte durchgeführt. Expressionsmuster im Vollblut führten
zur Identifikation von neuen eQTLs und halfen bei der funktionellen Validierung von
Kandidatengenen, die durch GWAS für quantitative Phänotypen identifiziert wurden.
Zudem konnten mit Hilfe der eQTLs neue regulatorische Zusammenhänge beschrieben
werden. Insgesamt lieferten die funktionellen Daten der Genaktivität wertvolle Hinweise,
um die Konsequenzen der genetischen Varianz besser zu verstehen.
1
1.0 Summary
The aim of this study was to identify SNPs affecting gene expression in the general
population. To achieve this, a genome-wide association study (GWAS) was performed
from peripheral blood of 381 individuals belonging to the German KORA (Kooperative
Gesundheitsforschung in der Region Augsburg) cohort.
A total of 371 identified peripheral blood eQTLs (expression quantitative trait loci) were
compared to published eQTLs from HapMap lymphoblast cell lines. An overlap of 30%
of eQTLs between the KORA and HapMap could be demonstrated. The remaining 70%
of identified KORA eQTLs indicate a high degree of tissue-specific expression. The
expression profiles allowed functional inference of 5% of complex trait associated SNPs
at the level of transcription. In addition to discovery of novel whole blood eQTLs, the
expression profiles allowed functional validation of two candidate genes identified in
independent GWAS for uric acid levels and mean platelet volume (Doring, Gieger et al.
2008). Interrogation of SNPs reported in published GWAS with expression profiles
generated in this study allowed discovery of 11 novel eSNPs. Furthermore, the
transcriptional profiles allowed identification of a novel mechanism of IgE regulation in
whole blood (Weidinger, Gieger et al. 2008).
Integration of gene expression data with genotype data has the potential to directly
identify experimentally supported candidate susceptibility genes for disease (Schadt,
Lamb et al. 2005). The application of gene expression profiles to augment several
genome-wide association results and to identify novel biological pathways was
demonstrated in this study.
2
2.0 Introduction
The fundamental aim of genetics is to understand the relation between phenotypes and
genotypes (Botstein and Risch 2003). It has long been recognized that inherited DNA
polymorphisms are responsible for clustering of common diseases in families (Newton-
Cheh and Hirschhorn 2005). The earliest reported association between inherited variation
and disease risk in 1956 was that of individuals with duodenal ulcer being more likely to
have blood type O (Willer, Sanna et al. 2008). In the 1970s it was proposed that common
functional variation could explain some of the inherited variation in susceptibility to
common diseases (Harris 1970). One such earliest identified effect still remains one of
the strongest known associations between common genetic variation and complex traits:
90% of individuals with type 1 diabetes carried either a DR3 or a DR4 allele at the HLA
locus as compared to 20% of controls (Redondo, Fain et al. 2001). This early identified
strong effect set high expectations for the strength of effects to be found in subsequent
genetic studies. In the 1980’s linkage studies using DNA polymorphisms to connect
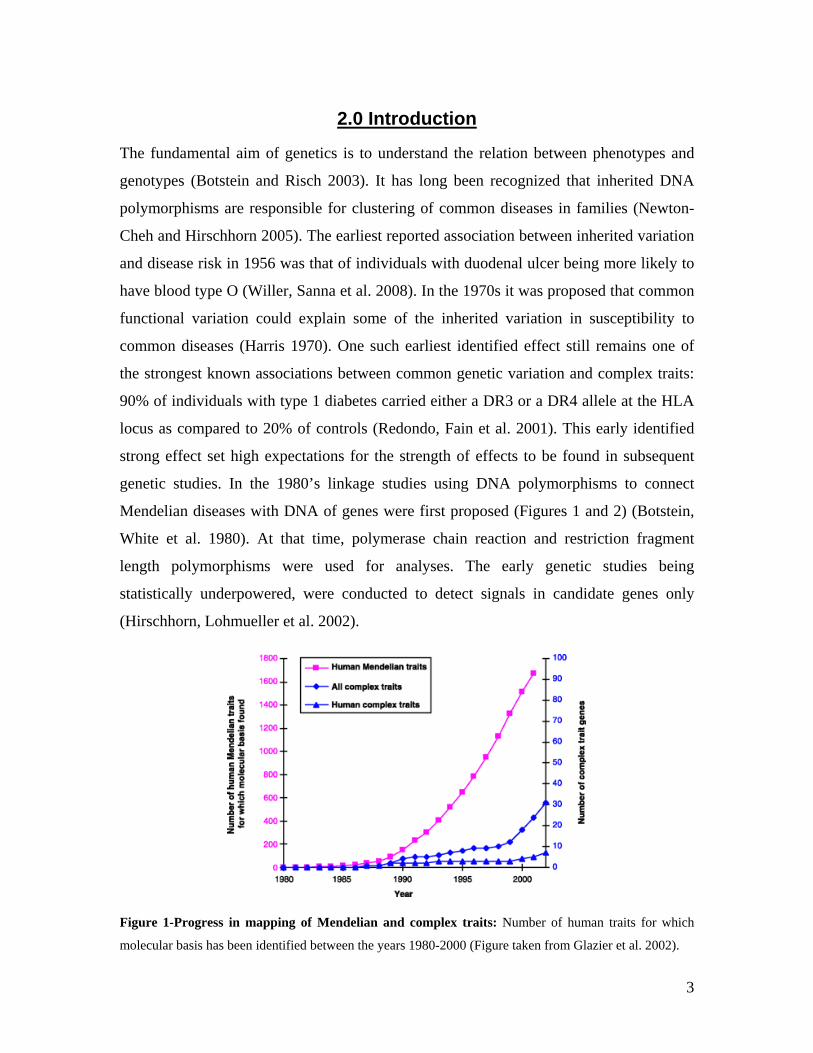
Mendelian diseases with DNA of genes were first proposed (Figures 1 and 2) (Botstein,
White et al. 1980). At that time, polymerase chain reaction and restriction fragment
length polymorphisms were used for analyses. The early genetic studies being
statistically underpowered, were conducted to detect signals in candidate genes only
(Hirschhorn, Lohmueller et al. 2002).
Figure 1-Progress in mapping of Mendelian and complex traits: Number of human traits for which
molecular basis has been identified between the years 1980-2000 (Figure taken from Glazier et al. 2002).
3
Total Number of genes and diseases studied from 2000 till July 2008
0
500
1000
1500
2000
2500
2000
2001
2002
2003
2004
2005
2006
2007
Jul-0
8
Year of study
Number ofgenes Studied
Number ofdiseases
HuGE Navigator
Total Number of genes and diseases studied from 2000 till July 2008
0
500
1000
1500
2000
2500
2000
2001
2002
2003
2004
2005
2006
2007
Jul-0
8
Year of study
Number ofgenes Studied
Number ofdiseases
HuGE Navigator
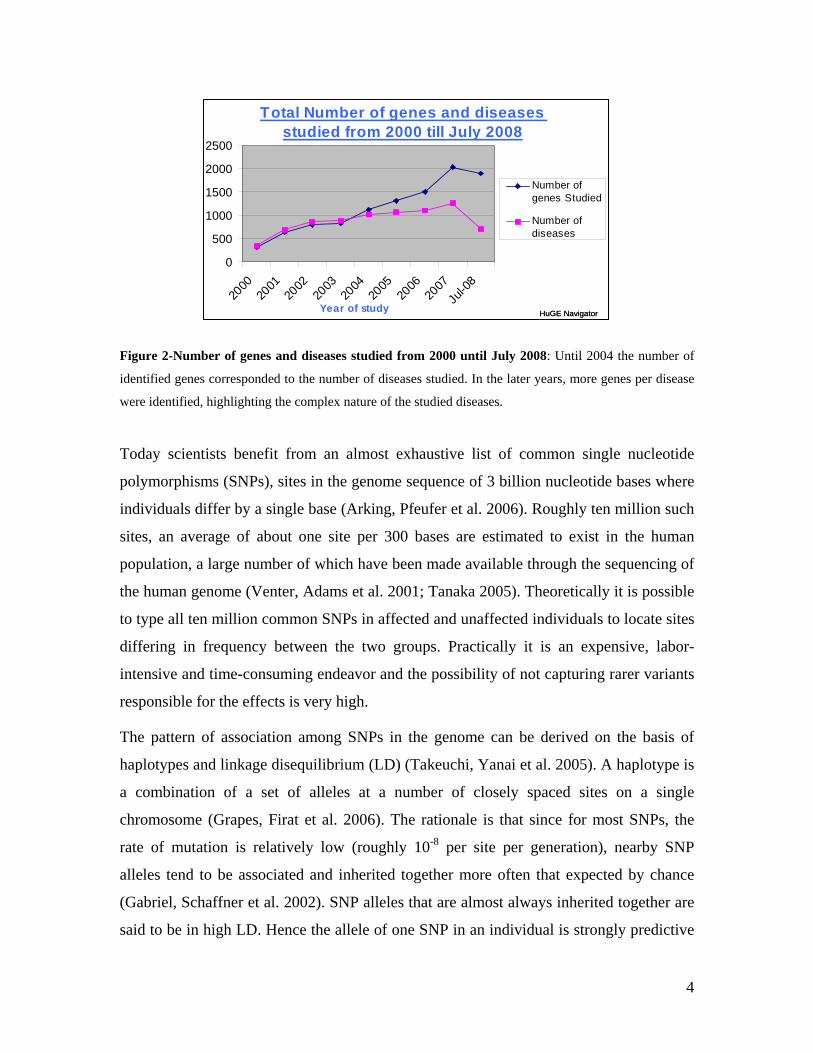
Figure 2-Number of genes and diseases studied from 2000 until July 2008: Until 2004 the number of
identified genes corresponded to the number of diseases studied. In the later years, more genes per disease
were identified, highlighting the complex nature of the studied diseases.
Today scientists benefit from an almost exhaustive list of common single nucleotide
polymorphisms (SNPs), sites in the genome sequence of 3 billion nucleotide bases where
individuals differ by a single base (Arking, Pfeufer et al. 2006). Roughly ten million such
sites, an average of about one site per 300 bases are estimated to exist in the human
population, a large number of which have been made available through the sequencing of
the human genome (Venter, Adams et al. 2001; Tanaka 2005). Theoretically it is possible
to type all ten million common SNPs in affected and unaffected individuals to locate sites
differing in frequency between the two groups. Practically it is an expensive, labor-
intensive and time-consuming endeavor and the possibility of not capturing rarer variants
responsible for the effects is very high.
The pattern of association among SNPs in the genome can be derived on the basis of
haplotypes and linkage disequilibrium (LD) (Takeuchi, Yanai et al. 2005). A haplotype is
a combination of a set of alleles at a number of closely spaced sites on a single
chromosome (Grapes, Firat et al. 2006). The rationale is that since for most SNPs, the
rate of mutation is relatively low (roughly 10-8 per site per generation), nearby SNP
alleles tend to be associated and inherited together more often that expected by chance
(Gabriel, Schaffner et al. 2002). SNP alleles that are almost always inherited together are
said to be in high LD. Hence the allele of one SNP in an individual is strongly predictive
4
of the allele of other SNPs located nearby in high LD (Enard, Khaitovich et al. 2002). In
theory a small number of SNPs can produce several different combinations with other
SNP alleles, but in reality fewer combinations make up the bulk of the haplotypes
observed in humans (Gabriel, Schaffner et al. 2002). As a result, only a few carefully
chosen representative “tag SNPs” need to be typed in order to predict the likely variants
in that region (Halperin, Kimmel et al. 2005).
The International HapMap Consortium used tag SNPs to produce four human haplotype
maps by genotyping lymphoblast cell lines of 270 people from four populations with
diverse geographic ancestry (Tanaka 2005). Population-based genetic studies such as the
HapMap have been successfully utilized to map genetic factors affecting gene expression
and other cellular phenotypes (Cheung, Conlin et al. 2003; Stranger, Forrest et al. 2007).
The multifactorial nature of complex trait implies that each involved individual genetic
variant generally has only a modest effect and the interaction of genetic variants with
each other and with the environment determine the observed end phenotype (Newton-
Cheh, Hirschhorn, 2005). Newly discovered genetic variants have the potential to explain
at least some of the inherited variation in susceptibility to common disease and bring us
one step closer to the elucidation of underlying biological causal mechanisms.
2.1 RNAissance and gene regulation
The accepted principle of unidirectional flow of genetic information from DNA to RNA
to protein now forms the central dogma of molecular biology in almost all organisms
(Crick 1970). It was evident that DNA was the carrier of genetic information containing
the blueprints for proteins, but DNA itself could only have been formed with the aid of
enzymes, which are proteins. Proteins, on the other hand, were the end products of the
flow of genetic information that begins with DNA. The observation of DNA in the
nucleus and synthesis of protein in the cytoplasm of eukaryotic cells suggested the
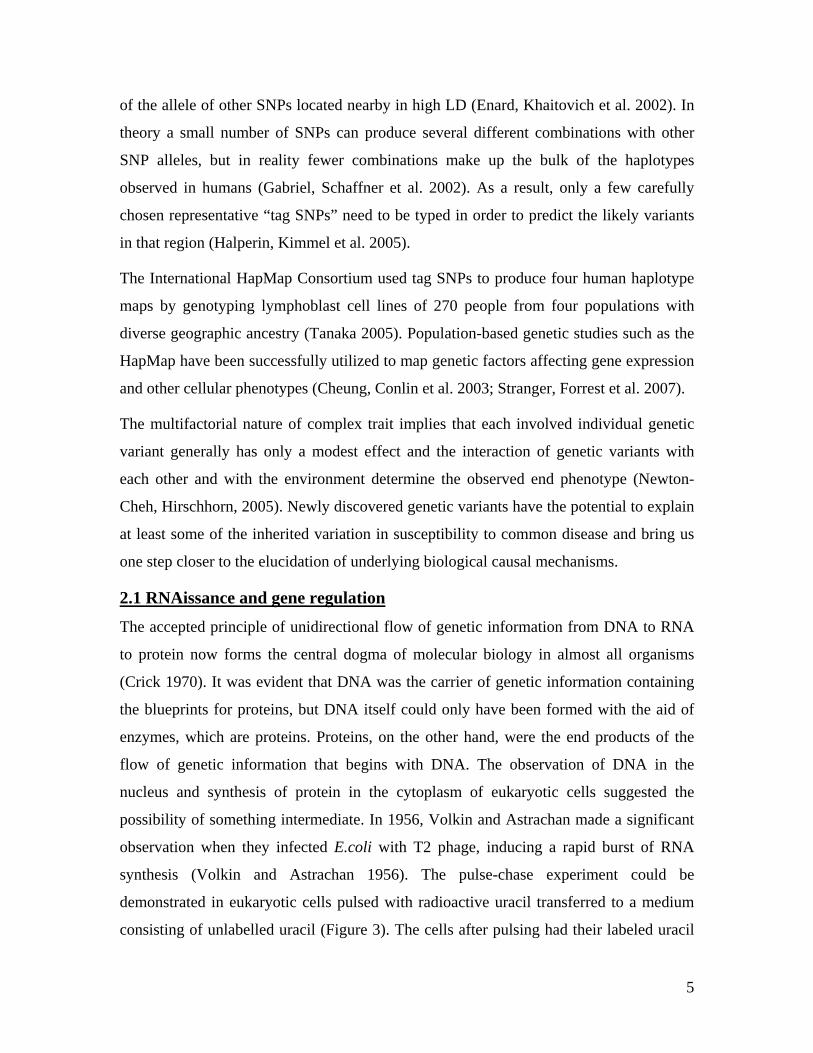
possibility of something intermediate. In 1956, Volkin and Astrachan made a significant
observation when they infected E.coli with T2 phage, inducing a rapid burst of RNA
synthesis (Volkin and Astrachan 1956). The pulse-chase experiment could be
demonstrated in eukaryotic cells pulsed with radioactive uracil transferred to a medium
consisting of unlabelled uracil (Figure 3). The cells after pulsing had their labeled uracil
5
in the nucleus but the cells after the chase (removal) had their labeled RNA in the
cytoplasm (Gros, Hiatt et al. 1961). This was a clear indication that RNA was first
synthesized in the nucleus and later moved to the cytoplasm, making it an ideal candidate
as an information- transfer intermediate between DNA and protein (Volkin 2001).
Figure 3-Pulse-chase experiment: The cells after pulsing had labeled uracil within the nucleus but after
the chase have labeled RNA in the cytoplasm, indicating that RNA is synthesized in the nucleus and then
moves to the cytoplasm (Figure taken from Griffiths 2005).
Transcription of DNA into RNA occurs in the nucleus and translation of RNA into
protein occurs in the cytoplasm (Carmo-Fonseca 2007). Only a small portion of DNA in
cells is transcribed into RNA and furthermore only a fraction of the RNA and proteins
encoded in the genome are expressed. The control of a gene’s transcript and its protein
product is termed as gene regulation (Struhl 1999). Gene regulation is highly complex
with an interplay of several combinatorial interactions and multiple components of the
cell participating in the process (Chabot, Shrit et al. 2007). Mechanisms controlling
mammalian gene expression can be categorized into two broad levels:
a. Transcriptional and post-transcriptional regulation of gene expression: Regulatory
mechanisms at the transcriptional level include transcriptional initiation, chromatin
condensation and DNA methylation (Bird 2002; Wray, Hahn et al. 2003). For most
genes, transcriptional initiation appears to be the principal determinant of the overall
mRNA gene expression profile (Jin, Riley et al. 2001). After DNA is transcribed and
mRNA is formed, post-transcriptional mechanisms modulate how much of the mRNA is
translated into proteins. This is moderated at the level of RNA processing (such as
splicing), mRNA transport, mRNA stability, protein processing, targeting and stability.
6
b. Translational and post-translational regulation of gene expression : Translation is the
first stage of protein biosynthesis comprising of four phases including activation,
initiation, elongation and termination (Salehi and Mashayekhi 2007). Post- translational
regulation includes chemical modifications of proteins after translation such as enzymatic
processing of amino acids from the protein (Rucker and McGee 1993).
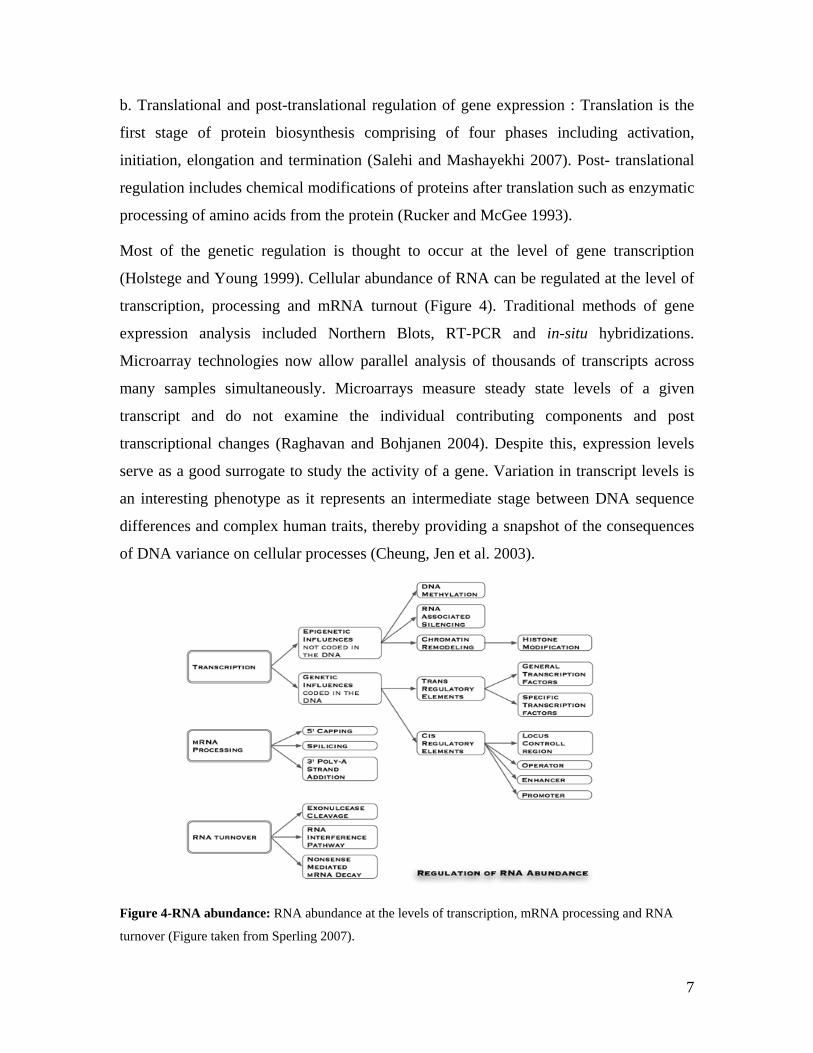
Most of the genetic regulation is thought to occur at the level of gene transcription
(Holstege and Young 1999). Cellular abundance of RNA can be regulated at the level of
transcription, processing and mRNA turnout (Figure 4). Traditional methods of gene
expression analysis included Northern Blots, RT-PCR and in-situ hybridizations.
Microarray technologies now allow parallel analysis of thousands of transcripts across
many samples simultaneously. Microarrays measure steady state levels of a given
transcript and do not examine the individual contributing components and post
transcriptional changes (Raghavan and Bohjanen 2004). Despite this, expression levels
serve as a good surrogate to study the activity of a gene. Variation in transcript levels is
an interesting phenotype as it represents an intermediate stage between DNA sequence
differences and complex human traits, thereby providing a snapshot of the consequences
of DNA variance on cellular processes (Cheung, Jen et al. 2003).
Figure 4-RNA abundance: RNA abundance at the levels of transcription, mRNA processing and RNA
turnover (Figure taken from Sperling 2007).
7
2.2 Variation in human gene expression
The extent, nature and sources of variation in transcript levels across the entire human
genome are largely unknown (Cheung, Conlin et al. 2003). Variation in gene expression
may be a result of regulatory or environmental effects but usually it is a complex
interplay between the two. The completion of the human genome project has resulted in
greater attention to genetic variation among individuals and variations at the level of
DNA sequence as well as gene expression levels are currently being investigated.
Analyses of gene expression patterns have already been successful in definition of tumor
types, prediction of cancer classes and identification of molecular markers for cancer
(Golub, Slonim et al. 1999). Interrogation of gene expression phenotypes in humans will
provide a resource that will greatly facilitate the fine mapping of disease variants in
human populations.
2.2.1 Heritability of gene expression variation
The expression level of genes is known to be highly variable and heritable in humans
(Cheung, Jen et al. 2003; Schadt, Monks et al. 2003) and other organisms such as yeast
(Brem, Yvert et al. 2002), mice (Schadt, Monks et al. 2003) and rat (Petretto, Mangion et
al. 2006). Natural variation in gene expression is an outcome of the complex interactions
between genetic polymorphisms, physiological variations and environmental
components. A fundamental question is what proportion of the variation of the gene
expression can be attributed to genetic factors. It is inherently difficult to minimize the
contribution of non-genetic factors in humans. An inference of variation in gene
expression due to genetic determinants can be addressed by estimation of heritability of
genes by familial aggregation studies (Cheung, Jen et al. 2003).
Evidence for familial aggregation of expression phenotype was observed when variation
among unrelated individuals, siblings and monozygotic twins were compared in an
experiment (Cheung, Jen et al. 2003). Cheung and colleagues analyzed 35 unrelated
individuals from the Centre d’Etude du Polymorphisme Humain (CEPH) lymphoblast
cell lines. To investigate the genetic basis of variation in gene expression, the authors
examined the gene transcript levels of the 5 highest variable genes (ST3GALV1,
ACTG2, GK, HNRPA2B1 and DHFR) among 49 unrelated individuals, 41 siblings from
8
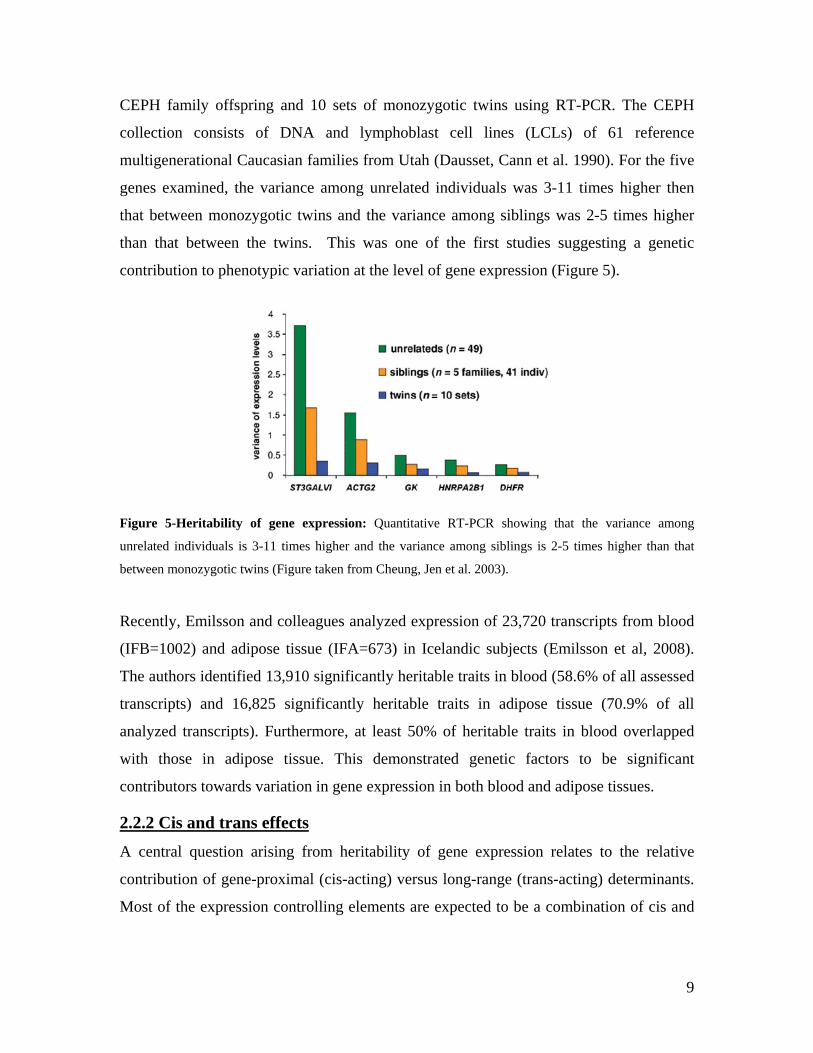
CEPH family offspring and 10 sets of monozygotic twins using RT-PCR. The CEPH
collection consists of DNA and lymphoblast cell lines (LCLs) of 61 reference
multigenerational Caucasian families from Utah (Dausset, Cann et al. 1990). For the five
genes examined, the variance among unrelated individuals was 3-11 times higher then
that between monozygotic twins and the variance among siblings was 2-5 times higher
than that between the twins. This was one of the first studies suggesting a genetic
contribution to phenotypic variation at the level of gene expression (Figure 5).
Figure 5-Heritability of gene expression: Quantitative RT-PCR showing that the variance among
unrelated individuals is 3-11 times higher and the variance among siblings is 2-5 times higher than that
between monozygotic twins (Figure taken from Cheung, Jen et al. 2003).
Recently, Emilsson and colleagues analyzed expression of 23,720 transcripts from blood
(IFB=1002) and adipose tissue (IFA=673) in Icelandic subjects (Emilsson et al, 2008).
The authors identified 13,910 significantly heritable traits in blood (58.6% of all assessed
transcripts) and 16,825 significantly heritable traits in adipose tissue (70.9% of all
analyzed transcripts). Furthermore, at least 50% of heritable traits in blood overlapped
with those in adipose tissue. This demonstrated genetic factors to be significant
contributors towards variation in gene expression in both blood and adipose tissues.
2.2.2 Cis and trans effects
A central question arising from heritability of gene expression relates to the relative
contribution of gene-proximal (cis-acting) versus long-range (trans-acting) determinants.
Most of the expression controlling elements are expected to be a combination of cis and
9
trans-acting sequences acting in concert to regulate expression levels (Cheung, Jen et al.
2003).
2.2.2.1 Cis-acting elements
A substantial proportion of variation in gene expression levels might be explained by
variation in cis (Jin, Riley et al. 2001). Cis-elements are DNA sequences located within
the promoter of a gene, just upstream of the transcriptional start site (Trinklein, Aldred et
al. 2003). Vertebrate gene expression is regulated by different classes of cis-regulatory
DNA sequences including enhancers, silencers, insulators and promoters (Butler and
Kadonaga 2002; Felsenfeld 2003).
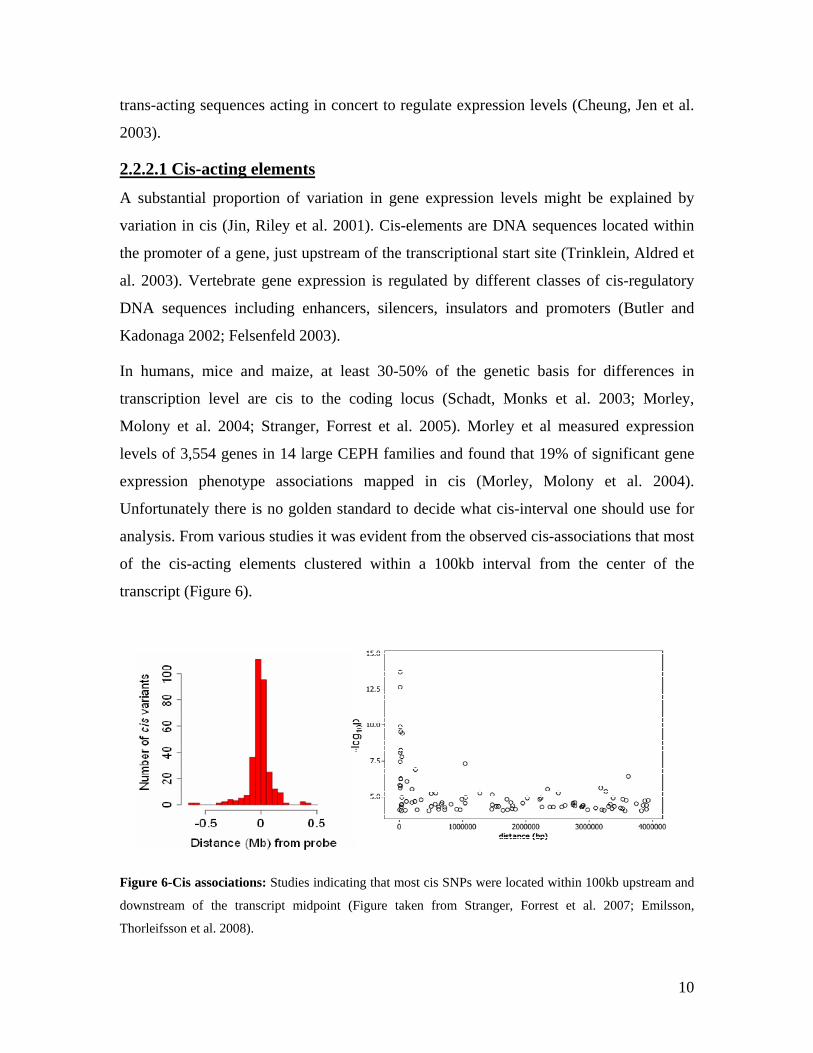
In humans, mice and maize, at least 30-50% of the genetic basis for differences in
transcription level are cis to the coding locus (Schadt, Monks et al. 2003; Morley,
Molony et al. 2004; Stranger, Forrest et al. 2005). Morley et al measured expression
levels of 3,554 genes in 14 large CEPH families and found that 19% of significant gene
expression phenotype associations mapped in cis (Morley, Molony et al. 2004).
Unfortunately there is no golden standard to decide what cis-interval one should use for
analysis. From various studies it was evident from the observed cis-associations that most
of the cis-acting elements clustered within a 100kb interval from the center of the
transcript (Figure 6).
Figure 6-Cis associations: Studies indicating that most cis SNPs were located within 100kb upstream and
downstream of the transcript midpoint (Figure taken from Stranger, Forrest et al. 2007; Emilsson,
Thorleifsson et al. 2008).
10
2.2.2.2 Trans-acting factors
Trans factors are thought to bind to the cis-acting sequences to control gene expression.
The detection of trans factors has not been very successful in humans due to the often
indirect and weaker consequences of trans effects (Brem, Yvert et al. 2002). Trans effects
are known to be sensitive to environmental regulation and hence have been shown to vary
between experiments (Goring, Curran et al. 2007). In human studies most of the sample
sizes do not provide enough power and are constrained by the multiple testing problems,
which make finding trans-effects difficult. To combat this, Stranger et al analyzed trans
effects by adopting a candidate variant approach. Prior relevance was assigned to SNPs
known to be associated with cis regulation, protein sequence variation or mRNA
structure. The authors demonstrated a 3-6 fold enrichment in the contribution of cis-
regulatory variants among the trans variants, thereby suggesting that trans associations
were largely cis-regulated effects (Stranger, Nica et al. 2007).
2.2.3 Gene expression variation at the level of isoforms
Sequencing of the human genome showed that humans have ~30,000 genes and this
finding raised the possibility that alternative splicing rather than an increased number of
expressed genomic loci was responsible for the functional complexity in vertebrates
(Modrek and Lee 2002). Transcript alterations within coding regions of a gene may
greatly alter protein sequences, structure and function. Changes in non-coding regions
can have a wide-range of regulatory consequences (Liu and Altman 2003). Splicing
effects in several genes such as CFTR and IRF5 result in both monogenic and complex
disorders in humans (Field, Bonnevie-Nielsen et al. 2005). The estimate that 40-60% of
human genes undergo alternative splicing, does not take into account how many different
splice forms exist for each gene (Kim, Klein et al. 2004).
Recent advances in microarray technology allow investigation of genome-wide
alternative splicing events (Lee and Roy 2004). Small to large scale microarrays have
been designed utilizing probes spanning predicted exon junctions (Modrek, Resch et al.
2001), probes targeted toward individual exons (Frey, Mohammad et al. 2005) or a
combination thereof (Srinivasan, Shiue et al. 2005). One of the leading microarray
companies, Illumina, previously used target probes mapping to the 3’UTR of a gene and
11
hence using this microarray it was not possible to identify specific isoform changes.
However, the updated microarray has newly designed probes, allowing discrimination of
different transcripts for the same gene. Another leading microarray company, Affymetrix,
released Affymetrix Gene Chip Exon 1.0 ST arrays designed to interrogate exon-level
expression for human, mouse and rat, thereby allowing an even higher resolution of gene
expression at the level of the isoform (Gardina, Clark et al. 2006).
Recently, Kwan and colleagues performed a genome-wide analysis of common genetic
variation controlling differential expression of transcript isoforms in the HapMap
population using a comprehensive exon tiling microarray containing 17,897 genes
(Kwan, Benovoy et al. 2008). They detected 324 genes showing significant associations
between the flanking SNPs and transcript levels. Of these, 39% reflected changes in
whole genome gene expression and 55% reflected transcript isoform changes such as
splicing variants and differential 3’ and 5’ untranslated regions (Kwan, Benovoy et al.
2008). This finding indicated that further investigation into alternative splicing was
required to obtain an accurate picture of the true complexity of variation in gene
expression.
2.3 Genetic mapping of gene expression variation
Variation in gene expression indicates the presence of regulatory effects and the mapping
of these effects in the genome provides evidence for a genetic basis in gene expression
variation (Deutsch, Lyle et al. 2005). Recent genetic studies in model organisms such as
yeast, maize and mice have discovered extensive functional genetic variation than
previously estimated (Brem, Yvert et al. 2002; Bystrykh, Weersing et al. 2005; Schadt,
Molony et al. 2008).For genetic analysis, gene expression is considered to be a typical
quantitative trait locus and there are 2 major methods used for mapping of these traits in
humans: linkage and association (Cheung, Jen et al. 2003).
2.3.1 Linkage studies
Linkage is defined as “the existence or establishment of connection of two things (Elston
1998). Thomas Hunt Morgan observed that the amount of crossing over between linked
genes differed and this led him to the idea that crossover frequency might indicate the
distance separating genes on the chromosome (Allen 1978; Skaletsky, Kuroda-
12
Kawaguchi et al. 2003). His student Albert Sturtevant proposed that the greater the
distance between linked genes, the greater the chance that non-sister chromatids would
cross over in the region between the genes (Morgan 1915). This idea set the foundation
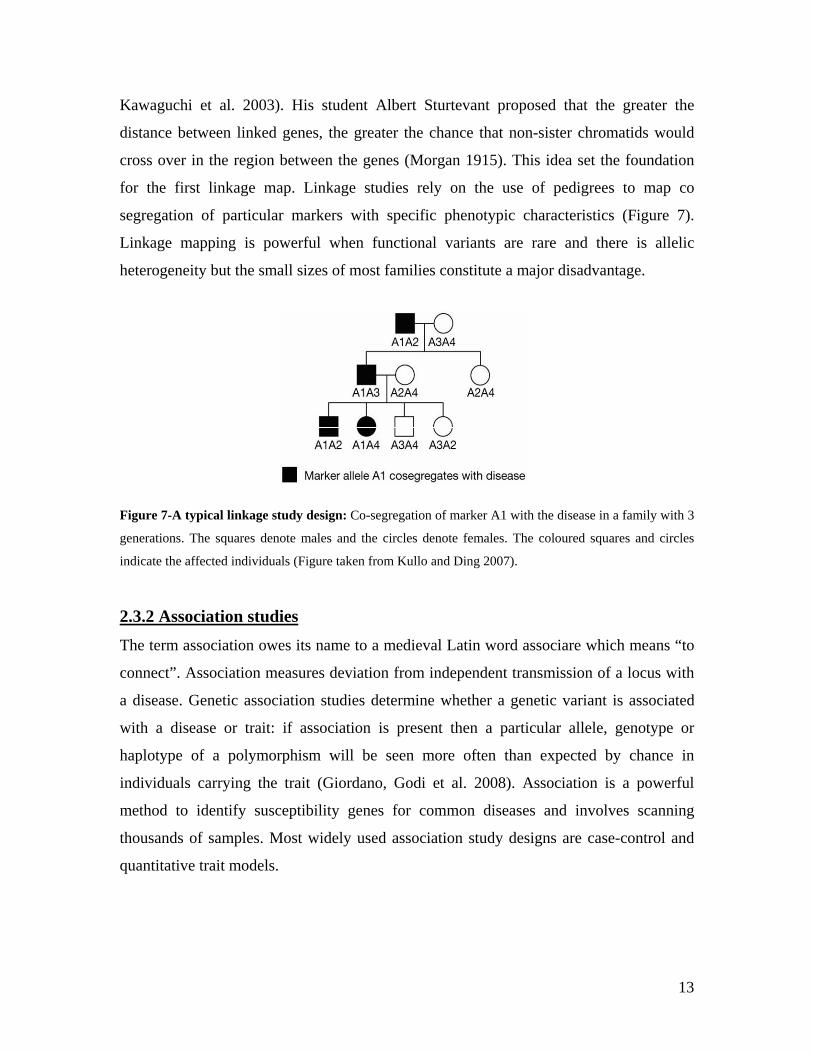
for the first linkage map. Linkage studies rely on the use of pedigrees to map co
segregation of particular markers with specific phenotypic characteristics (Figure 7).
Linkage mapping is powerful when functional variants are rare and there is allelic
heterogeneity but the small sizes of most families constitute a major disadvantage.
Figure 7-A typical linkage study design: Co-segregation of marker A1 with the disease in a family with 3
generations. The squares denote males and the circles denote females. The coloured squares and circles
indicate the affected individuals (Figure taken from Kullo and Ding 2007).
2.3.2 Association studies
The term association owes its name to a medieval Latin word associare which means “to
connect”. Association measures deviation from independent transmission of a locus with
a disease. Genetic association studies determine whether a genetic variant is associated
with a disease or trait: if association is present then a particular allele, genotype or
haplotype of a polymorphism will be seen more often than expected by chance in
individuals carrying the trait (Giordano, Godi et al. 2008). Association is a powerful
method to identify susceptibility genes for common diseases and involves scanning
thousands of samples. Most widely used association study designs are case-control and
quantitative trait models.
13
2.3.2.1 Population-based association studies
Population-based association studies can be cohort and/or case-control studies. In
population-based cohort studies, samples of a defined population are selected for
longitudinal assessment of exposure-outcomes or merely quantitative traits (Szklo 1998).
Advantages of using cohorts include estimations of distributions and prevalence of risk
factors in a defined population, comparison of future distributions to the baseline
measurements and finally an unbiased setting to evaluate all variables of interest.
Case-control is a classical epidemiological study design using subjects having the disease
and determining if there are characteristics of these patients that differ from those who do
not have the disease or trait (Tsai, Keller et al. 1994). Differences between allele
frequencies and/or genotypic polymorphisms and/or haplotypes indicate that the genetic
marker may increase risk of disease or likelihood of the trait or be in linkage
disequilibrium with a polymorphism which does.
One major problem arising with population-based study designs is that of confounding
due to population stratification (Hopper, Bishop et al. 2005).
2.3.2.1.1 Population stratification: lookout for “SUSHI” genes
Population stratification is a situation arising when a study population contains two or
more ethnic subgroups having different allele frequencies, and coincidently different
levels of a phenotype (Hamer and Sirota 2000).
An example highlighting the problem of population stratification is that of a geneticist
aiming to study the "trait" of ability to eat with chopsticks in the San Francisco
population. He discovers that allele HLA-A1 was positively associated with ability to use
chopsticks and names the gene “SUSHI” (successful use of selected hand instruments).
The reason for this false association was simply that the allele HLA-AI was more
common among Asians than Caucasian (Hamer and Sirota 2000).
Population stratification can be overcome by using homogeneous populations, matched
case-control pairs, exclusion of genetic markers whose allele frequencies differ between
populations and applying statistical methods like genomic control (Hoggart, Parra et al.
2003).
14
2.3.2.2 Genome-wide association studies
The key concern in association studies is to harness recent improvements in our
knowledge of the human genome sequence together with advances in genotyping
technologies to accelerate discovery of susceptibility loci in a cost-effective manner
(Wang, Barratt et al. 2005). The prospect of testing virtually all ~10 million common
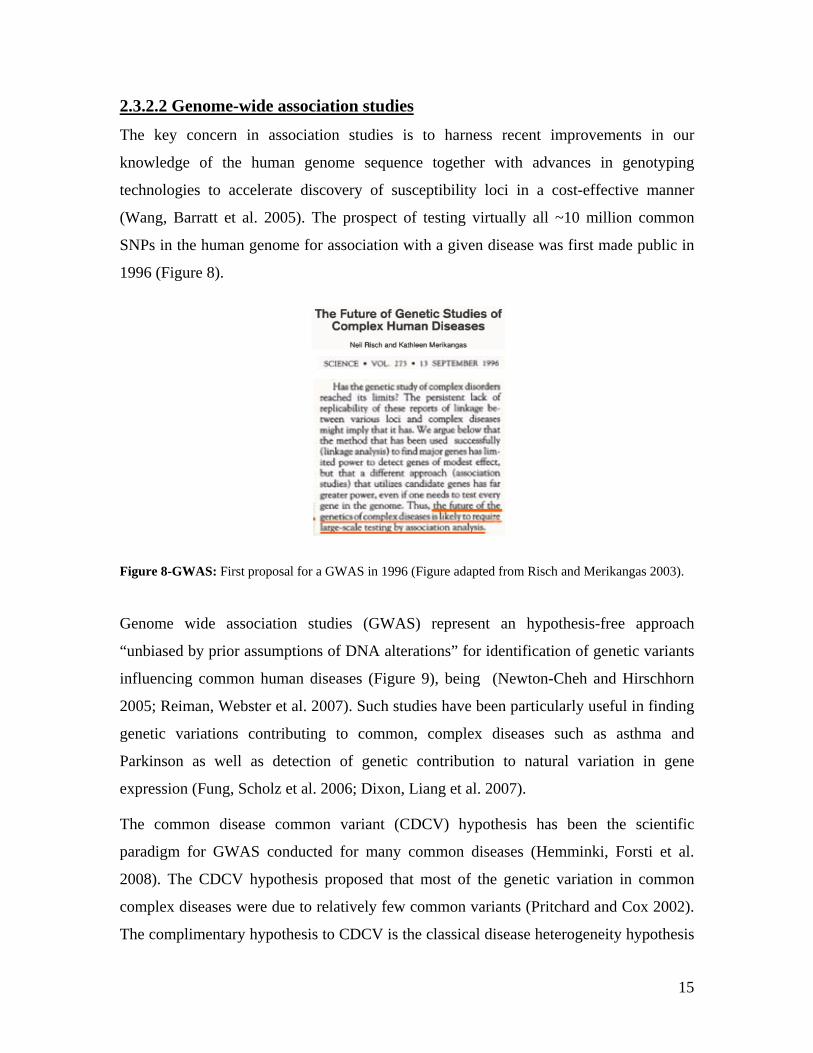
SNPs in the human genome for association with a given disease was first made public in
1996 (Figure 8).
Figure 8-GWAS: First proposal for a GWAS in 1996 (Figure adapted from Risch and Merikangas 2003).
Genome wide association studies (GWAS) represent an hypothesis-free approach
“unbiased by prior assumptions of DNA alterations” for identification of genetic variants
influencing common human diseases (Figure 9), being (Newton-Cheh and Hirschhorn
2005; Reiman, Webster et al. 2007). Such studies have been particularly useful in finding
genetic variations contributing to common, complex diseases such as asthma and
Parkinson as well as detection of genetic contribution to natural variation in gene
expression (Fung, Scholz et al. 2006; Dixon, Liang et al. 2007).
The common disease common variant (CDCV) hypothesis has been the scientific
paradigm for GWAS conducted for many common diseases (Hemminki, Forsti et al.
2008). The CDCV hypothesis proposed that most of the genetic variation in common
complex diseases were due to relatively few common variants (Pritchard and Cox 2002).
The complimentary hypothesis to CDCV is the classical disease heterogeneity hypothesis
15
(multiple rare-variant hypothesis) in which disease susceptibility is due to distinct genetic
variants in different individuals and disease-susceptibility alleles have low population
frequencies (Smith and Lusis 2002). Whether common variants or alternatively many
independent rare variants will account for the contributions of specific genes in diseases
is still unknown (Ji, Foo et al. 2008).
GWAS have successfully identified a number of common variants associated with
quantitative traits but the signals collectively explained only a small fraction of inter-
individual risk (Skaletsky, Kuroda-Kawaguchi et al. 2003; Frayling 2007). For example,
a GWAS using a total of 30147 subjects identified 20 variants associated with adult
height (Weedon, Lango et al. 2008). Combined, the 20 SNPs explained only ~3% of
height variation resulting in height alteration between 0.2-0.6 cm per allele.
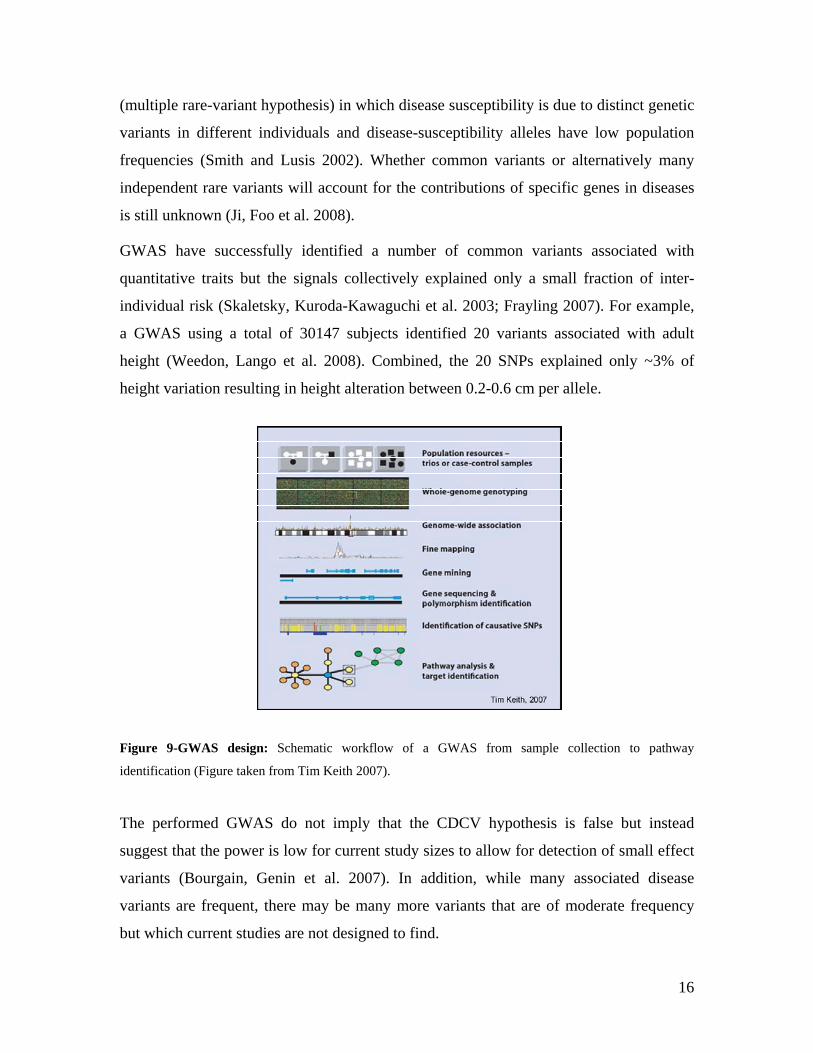
Figure 9-GWAS design: Schematic workflow of a GWAS from sample collection to pathway
identification (Figure taken from Tim Keith 2007).
The performed GWAS do not imply that the CDCV hypothesis is false but instead
suggest that the power is low for current study sizes to allow for detection of small effect
variants (Bourgain, Genin et al. 2007). In addition, while many associated disease
variants are frequent, there may be many more variants that are of moderate frequency
but which current studies are not designed to find.
16

3.0 Aims of the Investigation
Alterations in the expression levels of genes are known to result in diseases such as
Huntington disease (FitzPatrick, Ramsay et al. 2002; Deutsch, Lyle et al. 2005). An
understanding of these putative changes could be beneficial for the detection and
diagnosis of complex diseases. However one of the prerequisites of such studies is the
knowledge of the magnitude and diversity of gene expression in the unperturbed state.
The KORA (Cooperative Health Research in the Region Augsburg) is a research platform
for population based research in the fields of epidemiology, health economics and health
care (Holle, Happich et al. 2005). This platform was established in 1996 and since then it
has been successfully used in case-control and quantitative studies (Schiebel,
Winkelmann et al. 1997; Pfeufer, Jalilzadeh et al. 2005; Arking, Pfeufer et al. 2006).
The goal of this investigation was to identify SNPs affecting gene expression in the
KORA population. In order to accomplish this genome-wide gene expression data was
generated from whole blood in 497 KORA individuals and was used to conduct the
following studies:
1. Analysis of gene expression at the RNA level:
a) Analysis of whole blood to assess variability in gene expression patterns within
a normal population: To check for enrichment of functional categories of
transcripts exhibiting the highest and lowest variable among the individuals.
b) Analysis of gene expression profiles to confirm and propose new biochemical
pathways: The goal was to utilize genome-wide expression profiles to confirm
known regulatory pathways and possible identification of novel regulatory
mechanisms
2. Analysis of gene expression at the phenotypic level:
a) Identification of age and gender-specific expression: Analysis of expression
profiles generated in this study to check for gender- and age-specific signatures.
The aim was to question if small changes in expression levels could be used to
predict gender and age in humans.
17
b) Functional validation of candidate genes identified in a genome-wide scan: The
ability of transcriptional profiles to augment results from genome-wide
association scans and to allow functional inference of the possible causal locus
was interrogated.
3. Analysis of gene expression at the DNA level:
a) Identification of cis and trans regulators of expression: Cis and trans regulators
usually act in concert to regulate expression of genes. The aim was to identify cis
and trans expression quantitative trait loci (eQTLs) in whole blood.
b) Comparison of the resulting blood eQTL results with lymphoblast cell lines
eQTL data available from the International HapMap project: The idea was to
confirm and replicate identified eQTLs in a different tissue and another
population which is a prerequisite for any successful association study.
c) Utilization of the KORA gene expression dataset to test for eSNPs: The goal
was to test and confirm for the effects of published SNPs on gene expression to
allow discovery of causal SNPs.
18
4.0 Materials and Methods
4.1 Materials
4.1.1 RNA resources
4.1.1.1 The KORA F3/S3 population
Study approval was obtained from the Ethics Committee of the Bavarian Medical
Association (Bayerische Landesärztekammer) and the Bavarian commissioner for data
protection and privacy (Bayerischer Datenschutzbeauftragter). In total, four surveys have
been conducted. KORA S3 consists of representative samples of 4,856 subjects. In
2003/04, 2,974 participants returned for follow-up (KORA F3). All participants provided
written consent after being informed about the study. The subjects came from the study
region of Augsburg in the southern part of Germany. It has a population of about 600,000
inhabitants of which 430,000 are between the ages of 25 and 74. All participants
underwent cross-sectional surveys and regular medical examination by trained staff.
Blood was collected from the KORA cohort (n=497) in PAX tubes and couriered to the
Helmholtz Research Center in Neuherberg within 3-4 hours of collection. RNA was
extracted from whole blood and amplified, reverse transcribed and biotin-labeled to
cRNA. The cRNA was quantified using Ribogreen and Bioanalyzer before it was
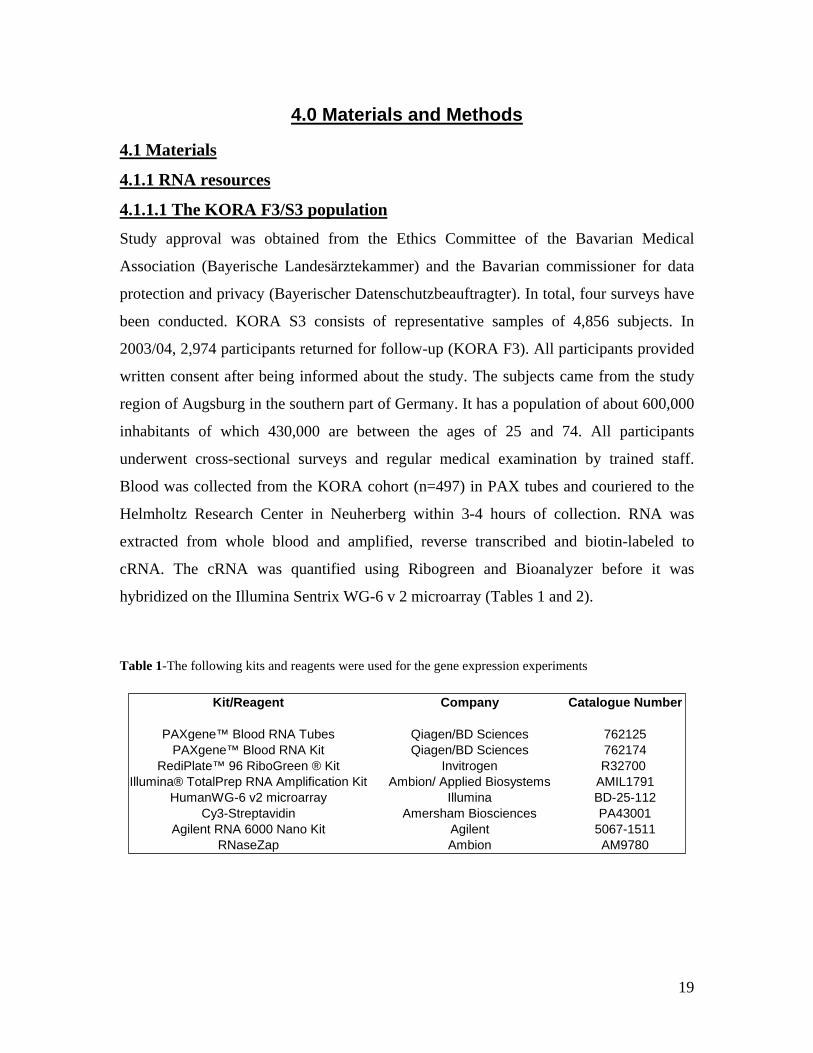
hybridized on the Illumina Sentrix WG-6 v 2 microarray (Tables 1 and 2).
Table 1-The following kits and reagents were used for the gene expression experiments
Kit/Reagent Company Catalogue Number
PAXgene™ Blood RNA TubesPAXgene™ Blood RNA Kit
RediPlate™ 96 RiboGreen ® KitIllumina® TotalPrep RNA Amplification Kit A
HumanWG-6 v2 microarrayCy3-Streptavidin
Agilent RNA 6000 Nano KitRNaseZap
Qiagen/BD Sciences 762125Qiagen/BD Sciences 762174
Invitrogen R32700 mbion/ Applied Biosystems AMIL1791
Illumina BD-25-112Amersham Biosciences PA43001
Agilent 5067-1511Ambion AM9780
19
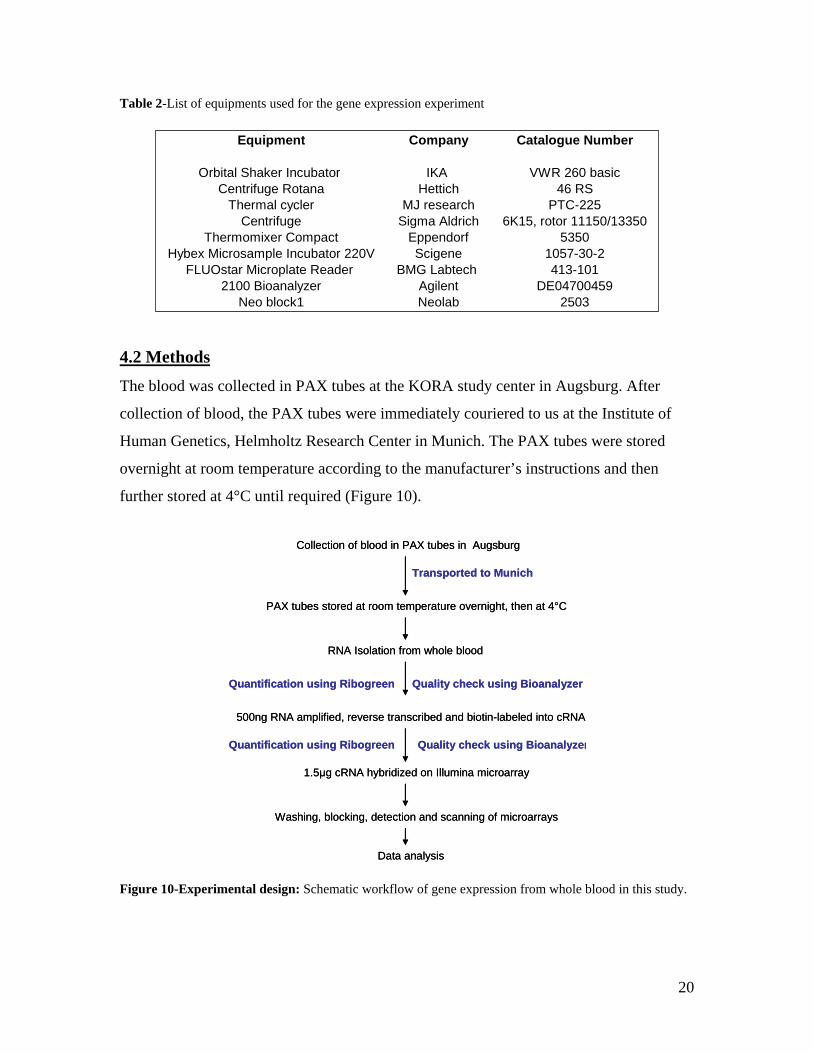
Table 2-List of equipments used for the gene expression experiment
Equipment Company Catalogue Number
Or basic
51150/13350
THybex 2
FLUOs 1459
Collection of blood in PAX tubes in Augsburg
PAX tubes stored at room temperature overnight, then at 4°C
RNA Isolation from whole blood
500ng RNA amplified, reverse transcribed and biotin-labeled into cRNA
1.5μg cRNA hybridized on Illumina microarray
Washing, blocking, detection and scanning of microarrays
Data analysis
Quality check using Bioanalyzer
Quality check using Bioanalyzer
Quantification using Ribogreen
Quantification using Ribogreen
Transported to Munich
bital Shaker Incubator IKA VWR 260 Centrifuge Rotana Hettich 46 RS
Thermal cycler MJ research PTC-22Centrifuge Sigma Aldrich 6K15, rotor 1
hermomixer Compact Eppendorf 5350 Microsample Incubator 220V Scigene 1057-30-
tar Microplate Reader BMG Labtech 413-102100 Bioanalyzer Agilent DE04700
Neo block1 Neolab 2503
4.2 Methods
The blood was collected in PAX tubes at the KORA study center in Augsburg. After
collection of blood, the PAX tubes were immediately couriered to us at the Institute of
Human Genetics, Helmholtz Research Center in Munich. The PAX tubes were stored
overnight at room temperature according to the manufacturer’s instructions and then
further stored at 4°C until required (Figure 10).
Figure 10-Experimental design: Schematic workflow of gene expression from whole blood in this study.
20
4.2.1 RNA isolation
The PAX tubes were stored at 4°C after overnight incubation at room temperature. For
RNA isolation, the PAX tubes were removed from 4°C and placed at room temperature
for 2-3 hours. All reagents were provided in the PAXgene™ Blood RNA Kit. All
centrifugations were carried out at 20°C. Protocol (according to the manufacturer’s
instruction manual):
The PAXgene Blood RNA tubes were centrifuged for 10 minutes at 4000 x g. The
supernatant was removed by decanting. 5ml RNase-free water was added to the pellet,
thoroughly resuspended by vortexing and centrifuged for 10 minutes at 4000 x g. The
supernatant was removed and discarded. The pellet was resuspended in 350µl
resuspension buffer BR1 by vortexing. The sample was pipetted into a 1.5 ml
microcentrifuge tube and 300µl Buffer BR2 and 40μl Proteinase K was added. The
contents were mixed by vortexing for 5 seconds and incubated for 10 minutes at 55°C
using a shaker–incubator at 1000rpm. The lysate was pipetted into the lilac coloured PAX
gene shredder column placed in a microcentrifuge tube and centrifuged for 3 minutes at
14000 rpm. The supernatant was transferred to a 1.5 ml microcentrifuge tube without
disturbing the pellet. 350μl 100% ethanol was added to the tubes, mixed by vortexing,
and centrifuged briefly (1–2 seconds). The samples was added to the PAXgene column
placed in a 2 ml processing tube and centrifuged for 1 minute at 14000 rpm. The
PAXgene column was placed in a new 2ml processing tube and the old processing tube
containing flow-through was discarded. The PAXgene column was placed in a new 2ml
processing tube, and the old processing tube containing flow-through was discarded.
350μl buffer BR3 was added to the PAXgene spin column and centrifuged at 14000 rpm
for 1 minute.
DNase Treatment - The solid DNase 1 (RNFD) was first dissolved in 550μl of the DNase
resuspension buffer (DRB) to make the stock solution. For each sample, 10μl DNase I
stock solution was added to 70μl buffer RDD, mixed by flicking the tube, and centrifuged
briefly to bring to the bottom. 80µl DNase I incubation mix was added onto the PAXgene
spin column membrane and incubated at room temperature for 15 minutes.
21

350μl buffer BR3 was added to the PAXgene spin column and centrifuged at 14000 rpm
for 1 minute. The flow through was discarded and 500μl buffer BR4 was added to the
column and centrifuged at 14000 rpm for 1 minute. After discarding the flow through,
500μl buffer BR4 was again added to the column and centrifuged at 14000 rpm for 2
minutes. The red spin column was transferred to a 1.5 ml elution tube, 40μl buffer BR5
was pipetted to the center of the column and the tube was centrifuged at 14000 rpm for 1
minute. Another 40μl buffer BR5 was added to the column and centrifuged at 14000 rpm
for 1 minute to elute RNA. The eluate was incubated at 65°C for 5 minutes in a heating
block (to denature the RNA for downstream applications) and then chilled immediately
on ice. The RNA quality was checked for all samples after isolation using an Agilent
Bioanalyzer and the stock RNA was stored at -80°C
4.2.2 RNA quality check using Agilent Bioanalyzer Nano 6000 kit
Agilent Nano chips contain an interconnected set of micro channels used for separation
of nucleic acid fragments based on their size as they are driven through it
electrophoretically. All reagents and samples were equilibrated at room temperature for
30 minutes before use. Procedure (according to the Agilent Bioanalyzer protocol)
The electrodes were decontaminated by washing with RNAse ZAP for 1 minute and with
RNAse free water for 10 seconds. 550 of the red Agilent Nano gel matrix was added to
the spin filter and centrifuged for 10 minutes at 5000 rpm. 65μl of the filtered gel was
aliquoted in microcentrifuge tubes. For each use, 1μl of the blue dye was freshly added to
the filtered 65μl gel aliquot and mixed by vortexing followed by a centrifugation step of
10 minutes at 5000 rpm. The chip was placed on the priming station and 9.0μl of the gel-
dye mix was pipetted into the well marked . The plunger was positioned at 1 ml and the
chip priming station was closed for 30 seconds. The syringe plunger was pressed down
until it was held by the clip. After 30 seconds the plunger was released with the clip
release mechanism. The priming station was opened and 9.0μl of the gel-dye mix was
pipetted in each of the wells marked G. 5μl of the green Nano marker was added to the 12
probe wells and to the ladder well marked as . The RNA probes and the ladder was heat
denatured at 70°C for 2 minutes to minimize secondary structures. 1μl of the mixture was
added to the ladder well . 1μl of the RNA probes were added to the 12 wells. The chip
22
was placed in the adapter of the provided vortex mixer and vortexed for 1 minute at 2400
rpm. The chip was inserted in the Agilent 2100 Bioanalyzer and read.
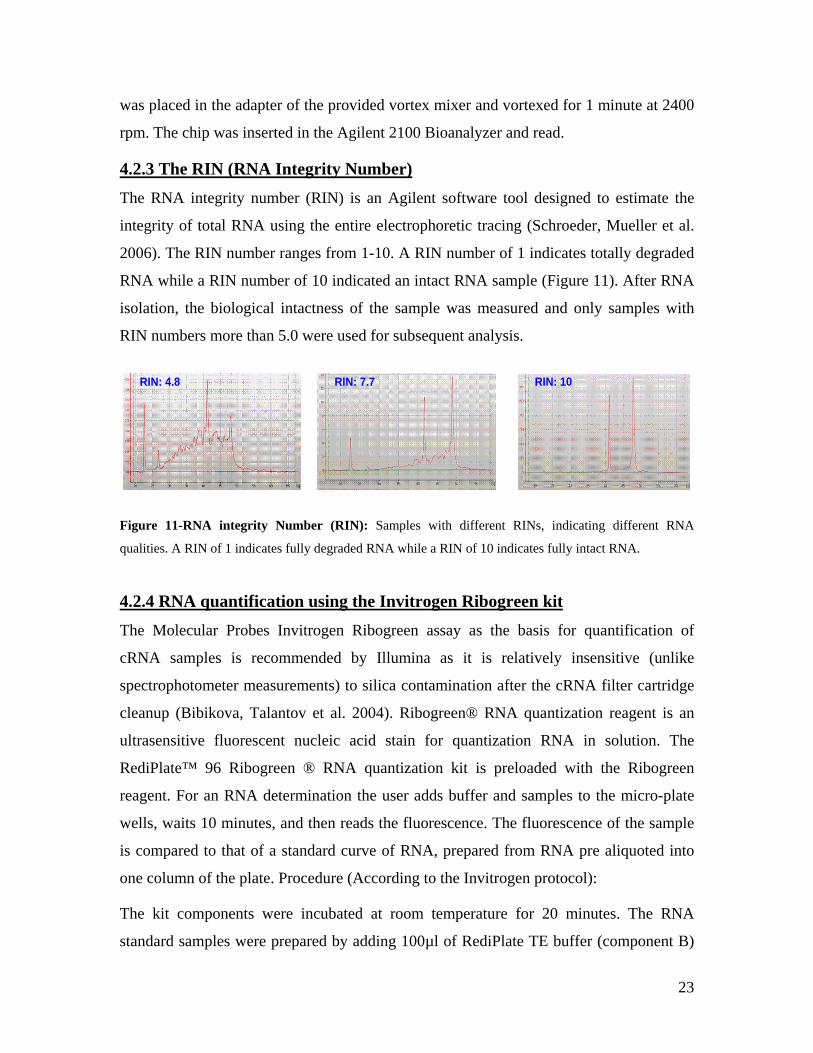
4.2.3 The RIN (RNA Integrity Number)
The RNA integrity number (RIN) is an Agilent software tool designed to estimate the
integrity of total RNA using the entire electrophoretic tracing (Schroeder, Mueller et al.
2006). The RIN number ranges from 1-10. A RIN number of 1 indicates totally degraded
RNA while a RIN number of 10 indicated an intact RNA sample (Figure 11). After RNA
isolation, the biological intactness of the sample was measured and only samples with
RIN numbers more than 5.0 were used for subsequent analysis.
RIN: 4.8 RIN: 7.7 RIN: 10RIN: 4.8 RIN: 7.7 RIN: 10RIN: 4.8 RIN: 7.7 RIN: 10
Figure 11-RNA integrity Number (RIN): Samples with different RINs, indicating different RNA
qualities. A RIN of 1 indicates fully degraded RNA while a RIN of 10 indicates fully intact RNA.
4.2.4 RNA quantification using the Invitrogen Ribogreen kit
The Molecular Probes Invitrogen Ribogreen assay as the basis for quantification of
cRNA samples is recommended by Illumina as it is relatively insensitive (unlike
spectrophotometer measurements) to silica contamination after the cRNA filter cartridge
cleanup (Bibikova, Talantov et al. 2004). Ribogreen® RNA quantization reagent is an
ultrasensitive fluorescent nucleic acid stain for quantization RNA in solution. The
RediPlate™ 96 Ribogreen ® RNA quantization kit is preloaded with the Ribogreen
reagent. For an RNA determination the user adds buffer and samples to the micro-plate
wells, waits 10 minutes, and then reads the fluorescence. The fluorescence of the sample
is compared to that of a standard curve of RNA, prepared from RNA pre aliquoted into
one column of the plate. Procedure (According to the Invitrogen protocol):
The kit components were incubated at room temperature for 20 minutes. The RNA
standard samples were prepared by adding 100µl of RediPlate TE buffer (component B)
23
to each well in column 1 (with black tabs) and mixing by pipetting ~10 times. 180µl TE
buffer (component B) was added to the required columns of the RediPlate and mixed
well. 20µl of RNA standard (black strip) was added from each of the standard RNA wells
(prepared above) into the assay wells and mixed well. The last RNA standard (well H)
contained no RNA and served as the control to measure background fluorescence. 5µl of
the RNA samples and 195µl TE buffer was added to the assay wells and well mixed. The
loaded microplate was incubated for 10 minutes at room temperature protected from
light.
Using a fluorescence-based microplate reader (excitation ~480 nm, emission ~520 nm),
the Ribogreen plate was read. For each value of sample fluorescence, the value derived
from the no-RNA control was subtracted. Using the data from the RNA standards, the
amount of RNA versus the fluorescence intensity was plotted and a line was fitted to the
data points. Using the standard curve, the amount of RNA was determined from the
fluorescence intensity measured for each sample.
4.2.5 Globin reduction experimental procedure
The amount of input RNA was 4µg (volume up to 14µl).
Reagent preparation: 2ml of 100% isopropanol was added to the RNA binding buffer
concentrate and stored at room temperature. 4ml of 100% ethanol was added to the RNA
wash solution concentrate, mixed well and then stored at room temperature. The RNA
bead buffer was combined with the RNA binding beads for each reaction as follows: 10µl
RNA binding beads and 4µl RNA bead buffer and mixed briefly. To this mixture 6µl
100% isopropanol was added, mixed thoroughly by vortexing and stored at room
temperature. This mixture was labeled as the bead resuspension mixture.
Preparation of streptavidin magnetic beads: The incubator was set to 50°C and the 2x
hybridization buffer and the streptavidin bead buffer were heated at 50°C for at least 15
minutes. The streptavidin magnetic beads were vortexed and suspended and 30μl of the
beads per sample was transferred into a 1.5ml non-stick tube provided in the kit. The
mixture was centrifuged for 1 second at 2000 rpm. The tubes were placed on a magnetic
stand for 5 minutes to allow complete capture of the beads. Once the solution turned
transparent, the supernatant was carefully aspirated with a pipette without disturbing the
24
beads. The supernatant was discarded and the tubes were removed from the magnetic
stand. 30µl of the streptavidin bead buffer was added to the magnetic beads and vortexed
vigorously to resuspend the beads. The prepared streptavidin magnetic beads were placed
at 50°C in an incubation oven for at least 15 minutes.
Hybridization of globin mRNA and globin capture oligonucleotides: 14µl of the starting
RNA material (4µg) was placed in a 1.5ml non-stick tube and 1µl of capture oligo mix
was added. 15µl of 50°C preheated 2x hybridization buffer was added to each sample,
vortexed and centrifuged to collect at the bottom of the tube. The samples were incubated
in a pre warmed 50°C incubator and the globin capture oligo mix was allowed to
hybridize to the globin mRNA for 15 minutes.
Removal of globin mRNA: The streptavidin magnetic beads were removed from the
50°C incubator and resuspended by gently vortexing and centrifugation. 30µl of prepared
streptavidin magnetic beads were added to the incubated samples. The mixture was
vortexed, centrifuged, flicked gently to re suspend the beads and the RNA bead mixture
was incubated at 50°C for 30 minutes. The samples were removed from the incubator,
vortexed to mix and centrifuged. The tubes were placed on the magnetic stand to capture
the streptavidin magnetic beads for 5 minutes until the solution turned transparent. The
supernatant was carefully aspirated using a pipette without disturbing the streptavidin
magnetic beads. The supernatant, containing the globin mRNA-depleted RNA was
transferred to a new 1.5ml tube and placed on ice.
Purification of globinclear RNA: 100µl of prepared RNA binding buffer was added to
each enriched RNA sample. 20µl of the bead resuspension mix was vortexed and
immediately added to each sample. The mixture was vigorously vortexed for 10 seconds
to fully mix the reagents and to allow the RNA binding beads to bind the RNA. The
samples were briefly centrifuged for 1 second at 4000 rpm to collect at the bottom and
then placed on a magnetic stand for 5 minutes to capture the beads. Once the solution
turned transparent, the supernatant was carefully aspirated using a pipette without
disturbing the RNA binding beads and was discarded.
The tubes were removed from the magnetic stand and 200µl of RNA wash solution was
added to each sample, vortexed and briefly centrifuged for 1 second at 4000 rpm. The
25
RNA binding beads were captured on the magnetic stand, the supernatant was aspirated,
discarded and the tube was removed from the magnetic stand. After brief centrifugation
the tube was placed again on the magnetic stand and any remaining liquid was removed
with a small bore pipette tip. The tubes were removed from the magnetic stand and the
beads were allowed to air-dry for 5 minutes with the caps left open. 30µl of the elution
buffer was added to each sample, vortexed vigorously to resuspend the beads and
incubated at 58°C for 5 minutes. After incubation, the tubes were vortexed and
centrifuged to collect the mixture at the bottom of the tube. The RNA binding beads were
captured by placing the tubes on the magnetic stand for 5 minutes. The supernatant was
transferred to a new 1.5ml tube and stored at -20°C.
4.2.6 RNA amplification, reverse transcription and labeling
The RNA obtained from whole blood is usually not enough for a microarray experiment
and furthermore it is not labeled. Therefore, a step of amplification combined with
reverse transcription and labeling with Biotin is required for the sample to be processed
on the microarray. The Illumina® Total Prep RNA amplification kit generates
biotinylated, amplified RNA for hybridization with Illumina Sentrix® arrays.
The experimental procedure was in accordance with the Ambion Illumina® Total Prep
kit manual. The recommended amount of input RNA is between 50-500ng of total RNA.
The minimum amount of input RNA which can be used is 25ng and the maximum
volume of the RNA is 11µl.
A standardized amount of 500ng of total RNA was used as a starting material for all
reactions. (Note: This amount was decided on after multiple test runs with different
amounts of starting RNA. The efficiency of amplification between samples may differ so
the maximum amount of starting total RNA was optimal to ensure enough final amount
of labeled mRNA for the microarray procedures).
The RNA samples were concentrated or diluted as required to 11µl with nuclease free
water in a nonstick sterile, RNase-free 0.5ml microcentrifuge tube. The reverse
transcription master mix was prepared at room temperature in the following order: 1µl of
T7 oligo (dT)primer, 2µl of 10x first strand buffer, 4µl of dNTP mix, 1µl of RNase
inhibitor and 1µl of array script was added together.
26
The master mix was mixed well by gently vortexing, centrifuged briefly to collect at the
bottom and then placed on ice. 9µl of the reverse transcription master mix was added to
each RNA sample, mixed thoroughly by pipetting 2-3 times, flicking the tube 3-4 times
and then centrifuging briefly. The samples were then incubated for 2 hours at 42°C. After
incubation, the samples were centrifuged briefly and then placed on ice. On ice, the
second strand master mix was prepared in the following order: 63µl of nuclease-free
water, 10µlof 10x second strand buffer, 4µl of dNTP mix, 2µl of DNA polymerase and
1µl of RNase H was mixed well by gently vortexing, centrifuged briefly to collect at the
bottom and then placed on ice:
80 µl of the second strand master mix was transferred to each sample, mixed thoroughly
by pipetting 2-3 times, flicked 3-4 times and then centrifuged. The tubes were incubated
for 2 hours at 16°C in a pre-cooled PCR incubator. During the incubation time, nuclease-
free water was preheated to 55°C for 10 minutes for the elution steps and the cDNA
elution columns were placed in the wash tubes for the next step. After the 2 hour
incubation, the samples were placed on ice. 250µl of the cDNA binding buffer was added
to each sample, mixed thoroughly by pipetting, flicked and then spun down to collect at
the bottom. The samples were added to the center of a cDNA filet cartridge firmly
placed in a wash tube and centrifuged at 14000 rpm for 1 minute. The flow-through was
discarded and the cDNA filter cartridge was replaced in the wash tube. Note – At this
point check that 24ml 100% Ethanol has been added to the wash buffer stock.
500µl of the wash buffer was added to the samples and then centrifuged at 14000 rpm for
1 minute. The flow-through was discarded and the cDNA filter cartridges were
transferred to new cDNA elution tubes. 10µl of preheated nuclease-free water was added
to the center of the cDNA filer, incubated for 2 minutes at room temperature and then
centrifuged at 1400 rpm for 1 minute. An additional 10µl of preheated nuclease-free
water was added to the center of the cDNA filer, incubated for 2 minutes at room
temperature and then centrifuged at 1400 rpm for 1 minute. Note: The double stranded
cDNA was now in the eluate
At room temperature, the in vitro transcription mix was prepared as follows: 2.5µl of T7
10x reaction buffer, 2.5µl of T7 enzyme mix and 2.5µl of biotin-NTP mix was added.
27
The master mix was gently vortexed and centrifuged briefly for 1-2 seconds 20 µl of the
IVT master mix was added to each sample, mixed thoroughly by pipetting up and down,
flicked 3-4 times and then centrifuged to collect the reaction to the bottom of the tube.
Once assembled, the tubes were placed at 37°C in an incubator for 12 hours overnight.
Next day, 75µl of nuclease-free water was added to each sample to stop the reaction.
350µl cRNA binding buffer and 250µl 100% Ethanol was added to the tubes, pipetted 3
times to mix, transferred to the cRNA filters and centrifuged for 1 minute at 14000 rpm.
The flow-through was discarded and the cRNA filter was replaced in the cRNA
collection tube. 650µl of wash buffer was added to the filter and centrifuged for 1 minute
at 14000 rpm. The cRNA filter was then transferred into a fresh labeled cRNA collection
tube. 100 µl of preheated nuclease free water was added to the filter and incubated at
room temperature for 2 minutes. The samples were then centrifuged for 1-2 minutes at
14000 rpm. The 100µl eluate contained the cRNA which was then stored at -80°C until
further use.
28
4.2.7 Illumina microarray procedures
4.2.7.1 Whole genome gene expression with Sentrix bead chip
This system uses a “direct hybridization” assay, whereby gene-specific probes are used to
detect labeled RNA. Each bead in the array contains a 50-mer; sequence-specific oligo
probe synthesized using Illumina’s Oligator technology. The Sentrix bead platform offers
three whole-genome formats: 6-sample (used in this study), 8-sample and 12-sample.
Each array in the matrix holds thousands to tens of thousands of different oligonucleotide
probe sequences that are attached to 3-micron beads assembled into the micro-wells of
the bead chip substrate. Multiple copies of each bead type are present in the array, an
average of ~30 copies per probe.
4.2.7.2 Microarray loading
GEX HYB (hybridization buffer) and GEX HCB (humidifying buffer) were part of the
kit provided by Illumina. The GEX HYB and GEX HCB buffers were heated at 58°C in
the Illumina hybridization oven for 10 minutes to dissolve any salts.
1.5µg of labeled cRNA was added unto 10µl of total sample volume in a 1.5ml
microcentrifuge tube. 20µl of the HYB buffer was added to the samples and the assay
was heated at 65°C for 5 minutes. The rubber hybridization chamber gaskets were placed
into the hybridization chamber and 200µl GEX-HCB buffer was dispensed into the
humidifying buffer reservoirs. The chamber was sealed by closing the clips. The bead
chips were removed from their packages and placed in the hybridization chamber insert
such that the microarray barcode was aligned with the barcode symbol on the insert.
After the assay above was heated for 5 minutes, the tubes were vortexed, centrifuged and
allowed to cool to room temperature. The samples were loaded on the right side of the
microarray inlet port (Figure 12). The hybridization chamber inserts containing the
loaded samples on the microarray were placed into the hybridization chamber. The lid
was secured by closing down the clamps on the sides of the hybridization chamber. The
hybridization chambers were placed into the preheated 58°C Illumina hybridization oven
(provided by Illumina) with the rocker adjusted to a standard speed of 5.
29
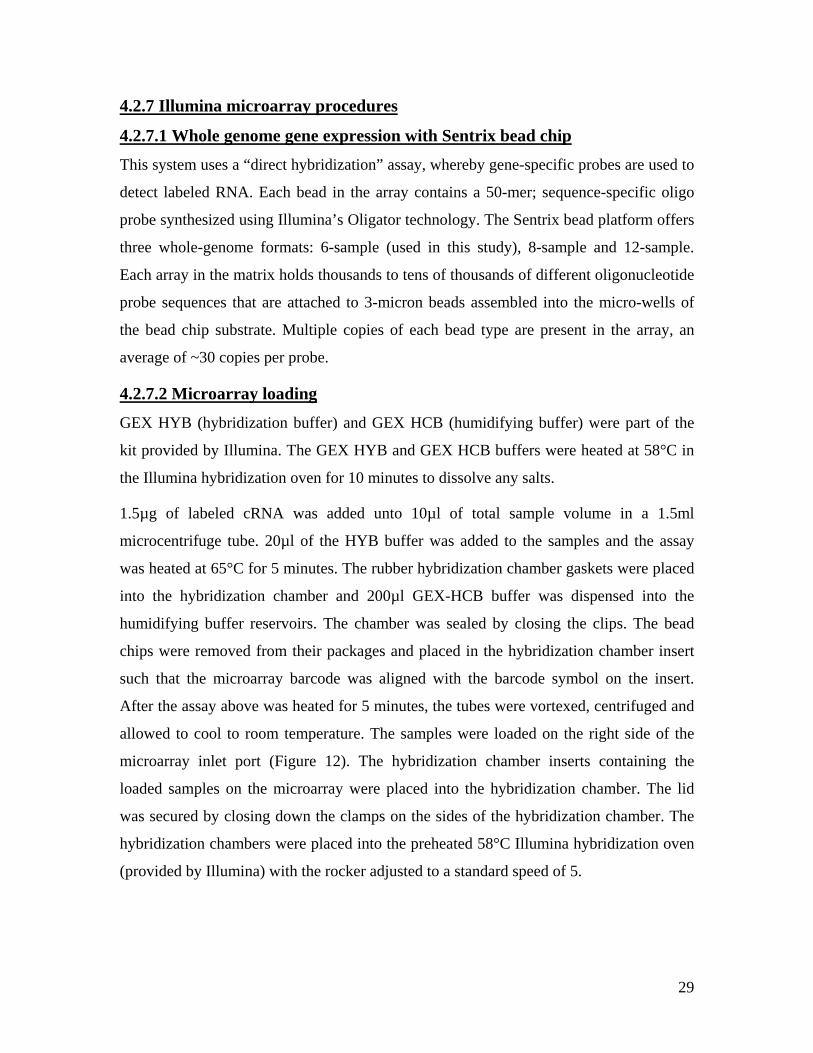
Figure 12-Illumina Sentrix Bead chip procedure: Setting up of the hybridization chamber and loading of
the cRNA samples on the microarray (self-taken photographs to illustrate the microarray procedures).
Preparation of the high temperature wash buffer for the next day:
50ml of the high temperature wash buffer concentrate was diluted with 450ml RNase free
water, placed into the Hybex water bath insert and heated to a temperature of 55°C
overnight.
Day 2 Washing, blocking and detection procedure
Buffers, wash chambers, slide racks, wash beaker, staining dish, wash trays and tweezers
were provided in the Illumina gene expression kit together with the microarrays.
7.25ml of E1BC wash buffer concentrate was added to 2.5l RNase free water to make the
E1BC wash buffer. 250ml of this wash buffer was poured into the staining dish with the
slide rack. The hybridization chamber was removed, opened, and the microarray was
taken out and submerged in a wash beaker containing 1.5l E1BC wash buffer. The cover
seal was gently and firmly pulled off and discarded. Bead chips were transferred to the
slide rack submerged in the staining dish containing diluted wash E1BC buffer, then
transferred into the overnight heated Hybex water bath insert containing high-temp wash
buffer and incubated static at 58°C for 10 minutes. After the 10-minutes incubation in
high-temp wash buffer, the slide rack was transferred to 250ml of the diluted E1BC in a
clean staining dish using a rack handle. Using the slide rack handle, the rack was plunged
in and out of the solution 10 times. The staining dish was placed on an orbital shaker set
30
to medium (so as not to allow for any spill) and shaken for 5 minutes. The rack was then
transferred to a clean staining dish containing 250ml fresh 100% ethanol and placed on
the orbital shaker and shaken at room temperature for 10 minutes. The rack was
transferred to a staining dish containing 250ml fresh E1BC buffer and plunged in and out
of the solution 10 times using the slide rack handle. The staining dish was placed on the
orbital shaker and shaken at room temperature for 2 minutes. Using tweezers, the bead
chips were then transferred into the wash trays facing upwards and 4ml block buffer was
added to each tray. The trays were then placed in the hybridization oven and rocked at a
speed of 5. 2ml of block buffer was prepared by addition of 2µl (1mg/ml) of streptavidin-
Cy3 per chip. Note – The streptavidin-Cy3 is a powder which must be diluted with 1ml
RNase free water to make a working solution of 1mg/ml streptavidin-Cy3. The Cy3
aliquots were stored at -20°C. 2ml block E1 buffer + streptavidin-Cy3 were pipetted into
a new bead chip wash tray. Using tweezers, the bead chip was grasped at the barcode end
via the well in the blocker wash tray, transferred to the wash tray containing the
streptavidin-Cy3 and placed flat so that the barcode was again near the tweezers well.
The wash tray was covered with the flat cover provided and placed on the rocker at
medium speed for 10 minutes. 250ml E1BC was dispensed into a clean staining dish
(with slide rack). Using tweezers, the bead chip was grasped at the barcode end and
removed from the wash tray. The bead chip was transferred into the slide rack submerged
in the staining dish and immediately submerged into the E1BC. Using the slide rack
handle, the rack was plunged in and out of the solution ten times. The orbital shaker was
set to medium-low and the staining dish was placed on the orbital shaker and mixed at
room temperature for 5 minutes. The bead rack was pulled out of the E1BC buffer and
transferred to the centrifuge rack containing paper towels. The centrifuge was balanced
with equal weight and the microarrays were centrifuged for 4 minute at 275 rcf to dry the
microarray. Once dry, the microarrays were stored in the dark until they were scanned.
Bead chips were imaged using the Illumina Bead Array reader, a two channel 0.8μm
resolution confocal laser scanner. The decode data which comes with the microarray
must first be loaded on the scanner computer. The chip was placed in the Bead Array
reader and the barcode was scanned. After scanning, the raw data was imported from the
Illumina Bead Studio software.
31

4.2.8 Illumina Bead studio control summary report
Bead chips have internal control features to monitor data quality. The controls consist of
sample-independent oligonucleotides spiked into the hybridization solution. The results
of these controls can be visualized in BEADSTUDIO software as a “control summary
report”
The following control categories were present in the Illumina hybridization solution:
1. Cy3-labeled hybridization controls: - These controls consisted of six probes with
corresponding Cy3-labeled oligonucleotides, producing a signal independent of both
the cellular RNA quality and success of the sample preparation reactions. The Cy3
hybridization controls were present at three concentrations, yielding gradient
hybridization responses.
2. Low stringency hybridization control: - This category contained four probes,
corresponding to the medium and high-concentration Cy3 hybridization control
targets. Each probe had two mismatch bases distributed in its sequence. If stringency
was adequate, these controls yielded very low signal. If stringency was too low, they
yielded signal approaching that of their perfect match counterparts in the Cy3
hybridization control category.
3. High stringency hybridization control: - The probe/target sequences had a very high
G+C content, and should thus hybridize even if hybridization stringency was too
high.
4. Biotin control: - This category consisted of two probes with complementary biotin-
tagged oligonucleotides acting as secondary staining controls.
5. Negative controls: - This category consisted of probes of random sequence having no
corresponding targets in the genomes. This provided a comprehensive measurement
of background, representing the imaging system background as well as any signal
resulting from non-specific binding of dye or cross-hybridization. The Bead Studio
used the signals and standard deviation of these probes to establish gene expression
detection limits: the detection p value.
6. Housekeeping controls: - The intactness of the biological specimen was monitored by
housekeeping gene controls. These controls consisted of probes for housekeeping
genes, two probes per gene that should be expressed in any cellular sample.
32
7. Sample Labeling Controls - These controls were optional, consisting of four probes
corresponding to artificial polyadenylated spike RNA. These spike RNA are
amplified and labeled in the same reaction as the sample, and thus acted as tracers for
reaction success.
The Bead studio control summary report was used for comparison of samples across the
listed control metrics to ensure a consistent ratio between relevant control values. Since
Illumina does not provide a golden standard for the Quality Control (QC) measurements,
we monitored these QC values over different experiments and noted an expected range of
QC values (hybridization controls: high: 40000-60000, medium: 8,000-20000, low: 400-
2000, low stringency: perfect match/ mismatch ratio >6, biotin: 6,000-20000, high
stringency: >30000, housekeeping genes: >5000 and gene value: > background and noise
values). A total of 386 whole-genome gene expression values were generated at the start.
The QC report across all microarray experiments was used to exclude 5 sample outliers
for further analysis, resulting in a total of 381 expression datasets.
4.2.9 Genotyping
Genotyping of the KORA S3/F3 individuals was performed by Dr. Peter Lichtner,
Institute of Human Genetics at Helmholtz Research Center in Neuherberg. For 1644 of
the KORA S3/F3 subjects, a genome-wide analysis was performed using Affymetrix
500K oligonucleotide array set consisting of two chips (Sty I and Nsp I) containing a
total of 500,568 SNPs. 335,152 SNPs passed all quality control criteria, and were
selected for the subsequent association analyses. Criteria leading to exclusion were
genotyping efficiency < 95% (n = 49,325) and minor allele frequency (MAF) < 5% (n =
101,323). The microarrays were hybridized with genomic DNA in accordance with the
manufacturer’s standard recommendations. Genotypes were determined using the
software BRLMM version 1.4.0 with standard settings proposed by Affymetrix.
4.2.10 Statistical analysis
The statistical analyses using R and PLINK were performed together with Diploma
student Katharina Heim. The Beadstudio analyses, functional categorizations, extraction
of genotypes using PLINK and HapMap database, generation of SNP lists, WG-
PERMER permutations, genomic inflation factor calculations and merging of results
33
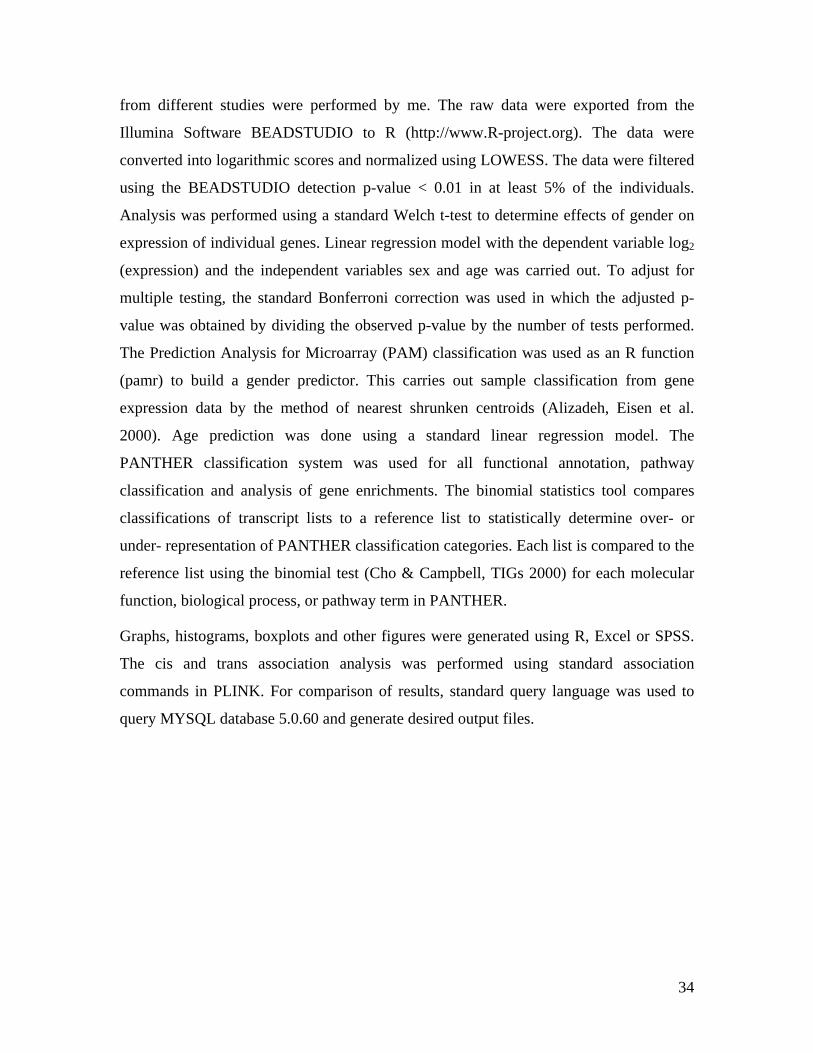
from different studies were performed by me. The raw data were exported from the
Illumina Software BEADSTUDIO to R (http://www.R-project.org). The data were
converted into logarithmic scores and normalized using LOWESS. The data were filtered
using the BEADSTUDIO detection p-value < 0.01 in at least 5% of the individuals.
Analysis was performed using a standard Welch t-test to determine effects of gender on
expression of individual genes. Linear regression model with the dependent variable log2
(expression) and the independent variables sex and age was carried out. To adjust for
multiple testing, the standard Bonferroni correction was used in which the adjusted p-
value was obtained by dividing the observed p-value by the number of tests performed.
The Prediction Analysis for Microarray (PAM) classification was used as an R function
(pamr) to build a gender predictor. This carries out sample classification from gene
expression data by the method of nearest shrunken centroids (Alizadeh, Eisen et al.
2000). Age prediction was done using a standard linear regression model. The
PANTHER classification system was used for all functional annotation, pathway
classification and analysis of gene enrichments. The binomial statistics tool compares
classifications of transcript lists to a reference list to statistically determine over- or
under- representation of PANTHER classification categories. Each list is compared to the
reference list using the binomial test (Cho & Campbell, TIGs 2000) for each molecular
function, biological process, or pathway term in PANTHER.
Graphs, histograms, boxplots and other figures were generated using R, Excel or SPSS.
The cis and trans association analysis was performed using standard association
commands in PLINK. For comparison of results, standard query language was used to
query MYSQL database 5.0.60 and generate desired output files.
34
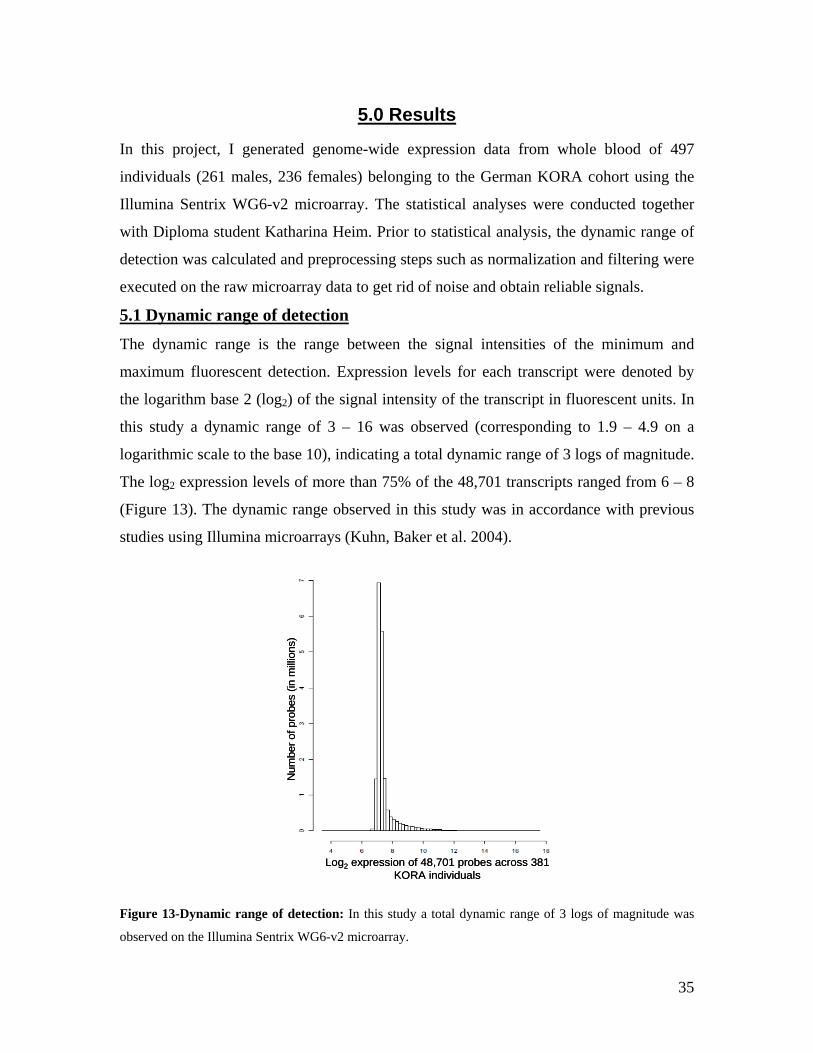
5.0 Results
In this project, I generated genome-wide expression data from whole blood of 497
individuals (261 males, 236 females) belonging to the German KORA cohort using the
Illumina Sentrix WG6-v2 microarray. The statistical analyses were conducted together
with Diploma student Katharina Heim. Prior to statistical analysis, the dynamic range of
detection was calculated and preprocessing steps such as normalization and filtering were
executed on the raw microarray data to get rid of noise and obtain reliable signals.
5.1 Dynamic range of detection
The dynamic range is the range between the signal intensities of the minimum and
maximum fluorescent detection. Expression levels for each transcript were denoted by
the logarithm base 2 (log2) of the signal intensity of the transcript in fluorescent units. In
this study a dynamic range of 3 – 16 was observed (corresponding to 1.9 – 4.9 on a
logarithmic scale to the base 10), indicating a total dynamic range of 3 logs of magnitude.
The log2 expression levels of more than 75% of the 48,701 transcripts ranged from 6 – 8
(Figure 13). The dynamic range observed in this study was in accordance with previous
studies using Illumina microarrays (Kuhn, Baker et al. 2004).
Num
ber o
f pro
bes
(in m
illio
ns)
Log2 expression of 48,701 probes across 381 KORA individuals
Num
ber o
f pro
bes
(in m
illio
ns)
Log2 expression of 48,701 probes across 381 KORA individuals
Figure 13-Dynamic range of detection: In this study a total dynamic range of 3 logs of magnitude was
observed on the Illumina Sentrix WG6-v2 microarray.
35
5.2 Normalization of gene expression data
The purpose of normalization is to minimize systemic variations so that biological
differences are clearly distinguishable. Rank invariant and locally weighted scatter plot
smoothing (LOWESS) normalizations were applied to the data. For rank invariant
normalization, a subset of probes whose rank does not change across the experiment are
identified and these define the normalization parameters (Technical Note: Illumina RNA
analysis, 2007). The LOWESS normalization is a moving average algorithm which
smoothes all of the points (Yang, Dudoit et al. 2002). Normalization was combined with
the scatter plot to allow better visualization of data points. Scatter plots are x versus y
intensity plots. It is expected that the majority of unchanged genes should display a
symmetrical distribution of data points and lie on the diagonal. How well the
normalization equation fits to the data is expressed by the square of the coefficient of
determination R. The closer R2 is to 1.00, the better the fit. In this study, the data were
normalized using the best-fitting LOWESS normalization, which resulted in an R2 of 0.94
(Figure 14).
Log 2
exp
ress
ion
valu
e of
sam
ple
2
Log 2
exp
ress
ion
valu
e of
sam
ple
2
Log2expression value of sample 1
Raw data – No normalization Rank invariant normalization LOWESS normalization A B
R2=0.67 R2=0.94R2=0.67
C
Log 2
exp
ress
ion
valu
e of
sam
ple
2
Log2expression value of sample 1Log2expression value of sample 1
Log 2
exp
ress
ion
valu
e of
sam
ple
2
Log 2
exp
ress
ion
valu
e of
sam
ple
2
Log2expression value of sample 1
Raw data – No normalization Rank invariant normalization LOWESS normalization A B
R2=0.67 R2=0.94R2=0.67
C
Log 2
exp
ress
ion
valu
e of
sam
ple
2
Log2expression value of sample 1Log2expression value of sample 1
Figure 14-Scatter plots of log2expression data of two individuals with (A) no normalization, (B) rank
invariant normalization and (C) LOWESS normalization: Each black dot represents log2 expression of
a transcript. No normalization results in a banana curve such as seen in (A) above, which might bias the
results. This indicates that normalization is required. The rank invariant normalization resulted in a square
of coefficient of determination (R2) of 0.64, indicating that the algorithm did not fit well to the data. The
highest R2 of 0.94 was obtained using LOWESS normalization.
36
5.3 Filtering of expression data
Filtering is a preprocessing step used to reduce noisy data. In this study filter criteria were
applied at the level of the input RNA and at the level of the probes detected on the
microarray. The quality of input RNA is crucial for gene expression results. The RNA
quality was measured using the RNA Integrity Number (RIN) from Agilent based on a
numbering system from 1-10, 1 depicting highly degraded RNA and 10 depicting intact
RNA. According to previous reports, a threshold of RIN > 5 was used for microarray
experiments (Schroeder, Mueller et al. 2006). Consequently a RIN threshold of >5 was
applied to the input RNA. This resulted in the removal of 116 samples from a total of 497
RNA samples, allowing a remaining of 381 good quality RNA for further analyses.
The Illumina hybridization buffer contains ~ 1616 negative control probes lacking
specific targets in the human transcriptome. The mean signal of these negative probes
defines the signal background. A detection p-value represents the confidence that a given
transcript is expressed above the background, thereby determining whether a transcript on
the array is called “detected”. Several signals might result from high array background
and/or low signal intensity hence the detection p-value acts as an overall quality control.
The Illumina BEADSTUDIO calculates and reports detection p-value thresholds of 0.05
and 0.01 (Figure 15). Detection p-values are computed on the rank of the Z value of a
probe relative to the Z values of the negative controls. Z value is calculated by
subtraction of the mean of the negative controls from one and dividing this value by the
standard deviation of negative control. A filter of detection p-value of <0.01 in at least
one sample (corresponding to 1% false discovery rate) was applied to select for
significantly detected probes. This resulted in reduction of the probes from 48,701 to
22,809. A further criterion of probes present in at least 5% of the individuals was applied,
resulting in 13,767 probes which were used for subsequent analyses (Figure 16).
The low intensity signals generally corresponding to low-abundant transcripts are usually
filtered as it is expected that the signal to noise ratio becomes too small. The data in this
study were filtered using a filter criterion of probes significantly detected in at least 5%
of individuals (19 individuals). This criterion was used so that all the weakly transcribed
genes would not be filtered out and meaningful signals could still be retained.
37
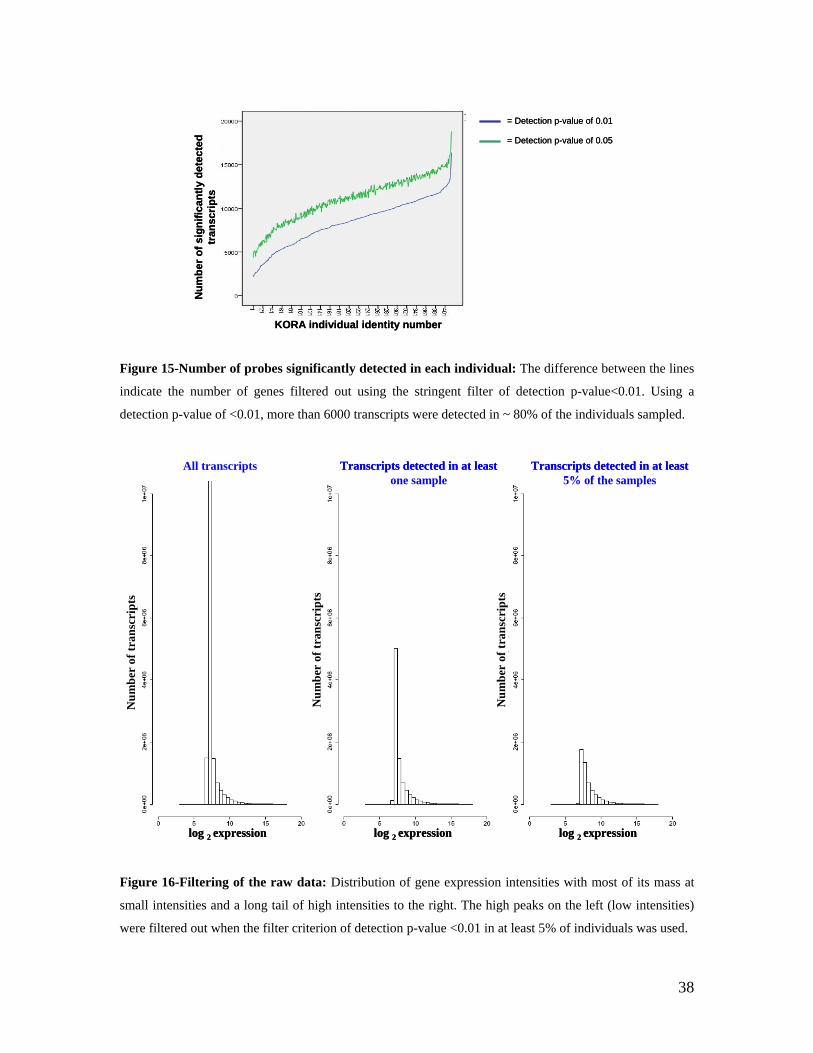
KORA individual identity number
Num
ber o
f sig
nific
antly
det
ecte
d tr
ansc
ripts
= Detection p-value of 0.05
= Detection p-value of 0.01
KORA individual identity number
Num
ber o
f sig
nific
antly
det
ecte
d tr
ansc
ripts
= Detection p-value of 0.05
= Detection p-value of 0.01
Figure 15-Number of probes significantly detected in each individual: The difference between the lines
indicate the number of genes filtered out using the stringent filter of detection p-value<0.01. Using a
detection p-value of <0.01, more than 6000 transcripts were detected in ~ 80% of the individuals sampled.
Num
ber
of tr
ansc
ript
s
Num
ber
of tr
ansc
ript
s
Num
ber
of tr
ansc
ript
s
log 2 expression
All transcripts Transcripts detected in at least one sample
Transcripts detected in at least 5% of the samples
log 2 expressionlog 2 expression
Num
ber
of tr
ansc
ript
s
Num
ber
of tr
ansc
ript
s
Num
ber
of tr
ansc
ript
s
log 2 expression
All transcripts Transcripts detected in at least one sample
Transcripts detected in at least 5% of the samples
log 2 expressionlog 2 expression
Figure 16-Filtering of the raw data: Distribution of gene expression intensities with most of its mass at
small intensities and a long tail of high intensities to the right. The high peaks on the left (low intensities)
were filtered out when the filter criterion of detection p-value <0.01 in at least 5% of individuals was used.
38
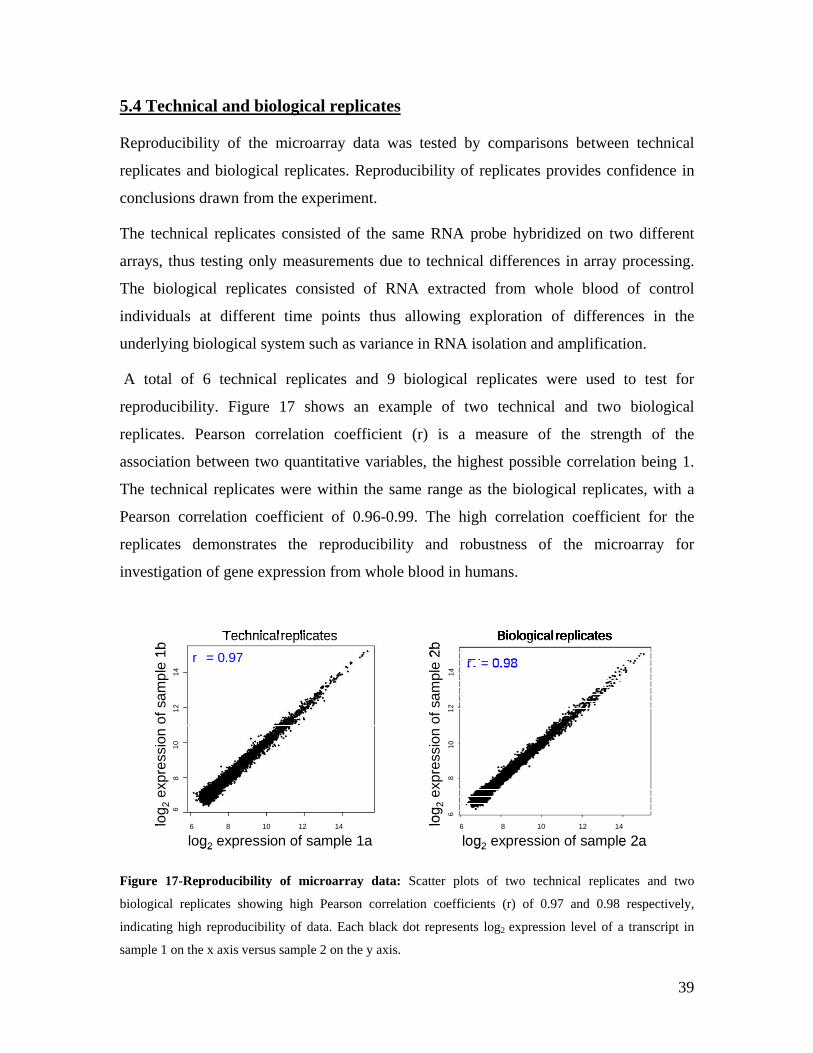
5.4 Technical and biological replicates
Reproducibility of the microarray data was tested by comparisons between technical
replicates and biological replicates. Reproducibility of replicates provides confidence in
conclusions drawn from the experiment.
The technical replicates consisted of the same RNA probe hybridized on two different
arrays, thus testing only measurements due to technical differences in array processing.
The biological replicates consisted of RNA extracted from whole blood of control
individuals at different time points thus allowing exploration of differences in the
underlying biological system such as variance in RNA isolation and amplification.
A total of 6 technical replicates and 9 biological replicates were used to test for
reproducibility. Figure 17 shows an example of two technical and two biological
replicates. Pearson correlation coefficient (r) is a measure of the strength of the
association between two quantitative variables, the highest possible correlation being 1.
The technical replicates were within the same range as the biological replicates, with a
Pearson correlation coefficient of 0.96-0.99. The high correlation coefficient for the
replicates demonstrates the reproducibility and robustness of the microarray for
investigation of gene expression from whole blood in humans.
Technicalreplicates BiologicalR2= 0.97 R2= 0.98
replicatesTechnicalreplicates Biologicalr = 0.97 r = 0.98
replicates
Sample 1a
Sam
ple
1b
Samp
39
le 2a
Sam
ple
2b
6
6 6
68 8
8
10
8
10
10 10
12
12 12
12
14
14
14
14
Technicalreplicates BiologicalR2= 0.97 R2= 0.98
replicatesTechnicalreplicates Biologicalr = 0.97 r = 0.98
replicates
log2 expression of sample 2a6
6 6
68 8
8
10
8
10
10 10
12
12 12
12
14
14
14
14 log 2
expr
essi
on o
f sam
ple
2b
log2 expression of sample 1a
log 2
expr
essi
on o
f sam
ple
1b
Technicalreplicates BiologicalR2= 0.97 R2= 0.98
replicatesTechnicalreplicates Biologicalr = 0.97 r = 0.98
replicates
Sample 1a
Sam
ple
1b
Sample 2a
Sam
ple
2b
6
6 6
68 8
8
10
8
10
10 10
12
12 12
12
14
14
14
14
Technicalreplicates BiologicalR2= 0.97 R2= 0.98
replicatesTechnicalreplicates Biologicalr = 0.97 r = 0.98
replicates
log2 expressio
n of sample 2a6
6 6
68 8
8
10
8
10
10 10
12 12
12
1414
14 log 2
expr
essi
on o
f sam
ple
2b
log2 expression of sample 1a
log 2
expr
essi
on o
f sam
ple
1b
12 14
Figure 17-Reproducibility of microarray data: Scatter plots of two technical replicates and two
biological replicates showing high Pearson correlation coefficients (r) of 0.97 and 0.98 respectively,
indicating high reproducibility of data. Each black dot represents log2 expression level of a transcript in
sample 1 on the x axis versus sample 2 on the y axis.
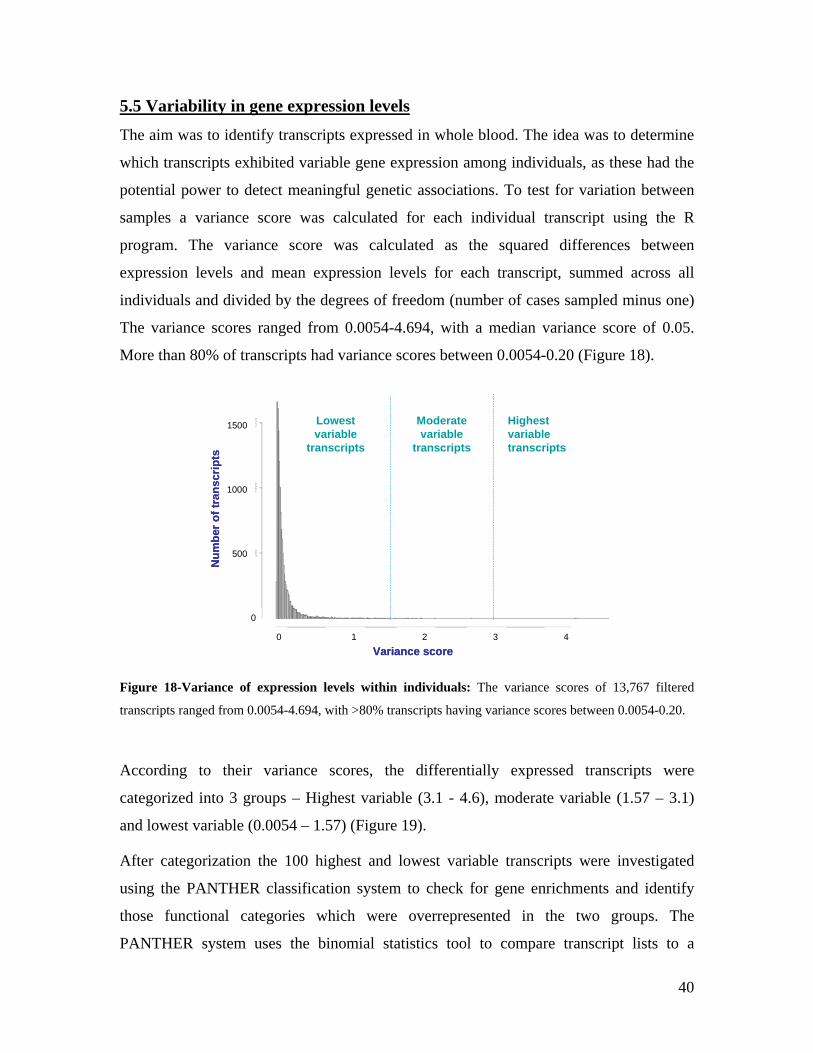
5.5 Variability in gene expression levels
The aim was to identify transcripts expressed in whole blood. The idea was to determine
which transcripts exhibited variable gene expression among individuals, as these had the
potential power to detect meaningful genetic associations. To test for variation between
samples a variance score was calculated for each individual transcript using the R
program. The variance score was calculated as the squared differences between
expression levels and mean expression levels for each transcript, summed across all
individuals and divided by the degrees of freedom (number of cases sampled minus one)
The variance scores ranged from 0.0054-4.694, with a median variance score of 0.05.
More than 80% of transcripts had variance scores between 0.0054-0.20 (Figure 18).
0
500
1000
1500
0 1 2 3 4
Variance score
Num
bero
f tra
nscr
ipts
Lowestvariable
transcripts
Moderate variable
transcripts
Highestvariable transcripts
0
500
1000
1500
0 1 2 3 4
Variance score
Num
bero
f tra
nscr
ipts
Lowestvariable
transcripts
Moderate variable
transcripts
Highestvariable transcripts
Figure 18-Variance of expression levels within individuals: The variance scores of 13,767 filtered
transcripts ranged from 0.0054-4.694, with >80% transcripts having variance scores between 0.0054-0.20.
According to their variance scores, the differentially expressed transcripts were
categorized into 3 groups – Highest variable (3.1 - 4.6), moderate variable (1.57 – 3.1)
and lowest variable (0.0054 – 1.57) (Figure 19).
After categorization the 100 highest and lowest variable transcripts were investigated
using the PANTHER classification system to check for gene enrichments and identify
those functional categories which were overrepresented in the two groups. The
PANTHER system uses the binomial statistics tool to compare transcript lists to a
40
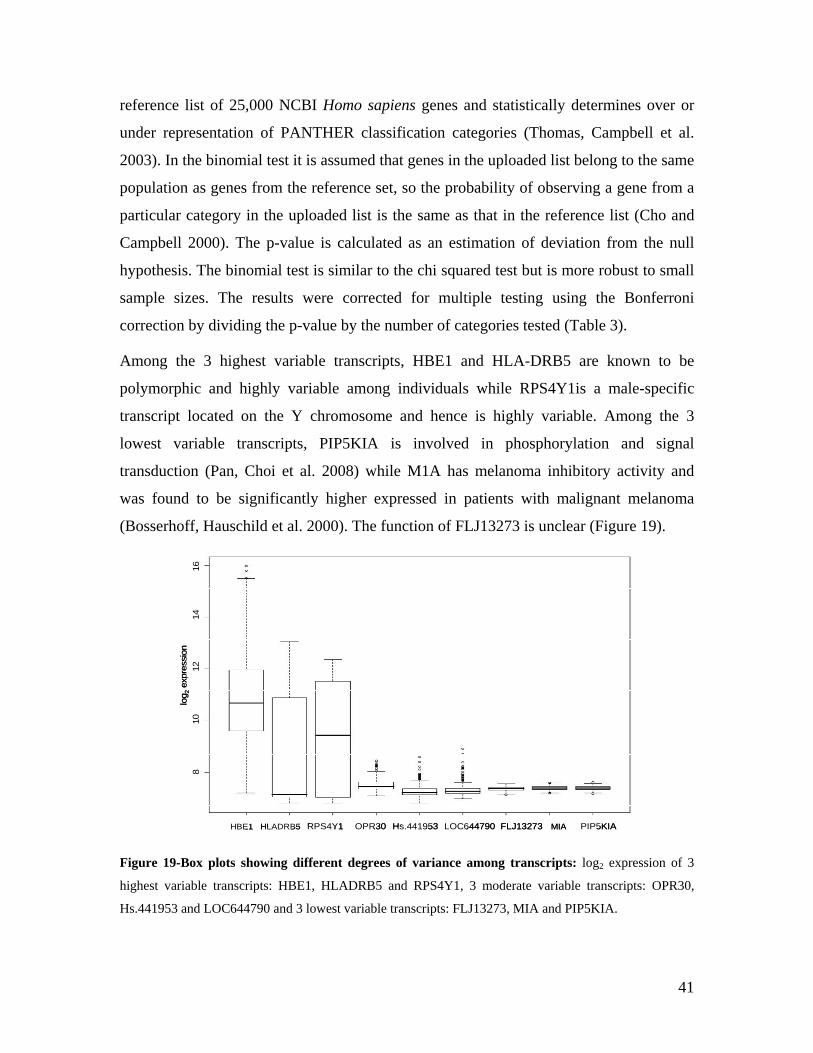
reference list of 25,000 NCBI Homo sapiens genes and statistically determines over or
under representation of PANTHER classification categories (Thomas, Campbell et al.
2003). In the binomial test it is assumed that genes in the uploaded list belong to the same
population as genes from the reference set, so the probability of observing a gene from a
particular category in the uploaded list is the same as that in the reference list (Cho and
Campbell 2000). The p-value is calculated as an estimation of deviation from the null
hypothesis. The binomial test is similar to the chi squared test but is more robust to small
sample sizes. The results were corrected for multiple testing using the Bonferroni
correction by dividing the p-value by the number of categories tested (Table 3).
Among the 3 highest variable transcripts, HBE1 and HLA-DRB5 are known to be
polymorphic and highly variable among individuals while RPS4Y1is a male-specific
transcript located on the Y chromosome and hence is highly variable. Among the 3
lowest variable transcripts, PIP5KIA is involved in phosphorylation and signal
transduction (Pan, Choi et al. 2008) while M1A has melanoma inhibitory activity and
was found to be significantly higher expressed in patients with malignant melanoma
(Bosserhoff, Hauschild et al. 2000). The function of FLJ13273 is unclear (Figure 19).
HBE1
P4Y1
PR3041
953
4479
0 FLJ13273HBE1 HLADRB5 RPS4Y1 OPR30 Hs.441953 LOC644790 PIP5KIAMIA
log 2
expr
essi
on8
1012
1416
HBE1
P4Y1
PR3041
953
4479
0 FLJ13273HBE1 HLADRB5 RPS4Y1 OPR30 Hs.441953 LOC644790 PIP5KIAMIA
log 2
expr
essi
on8
1012
1416
Figure 19-Box plots showing different degrees of variance among transcripts: log2 expression of 3
highest variable transcripts: HBE1, HLADRB5 and RPS4Y1, 3 moderate variable transcripts: OPR30,
Hs.441953 and LOC644790 and 3 lowest variable transcripts: FLJ13273, MIA and PIP5KIA.
41
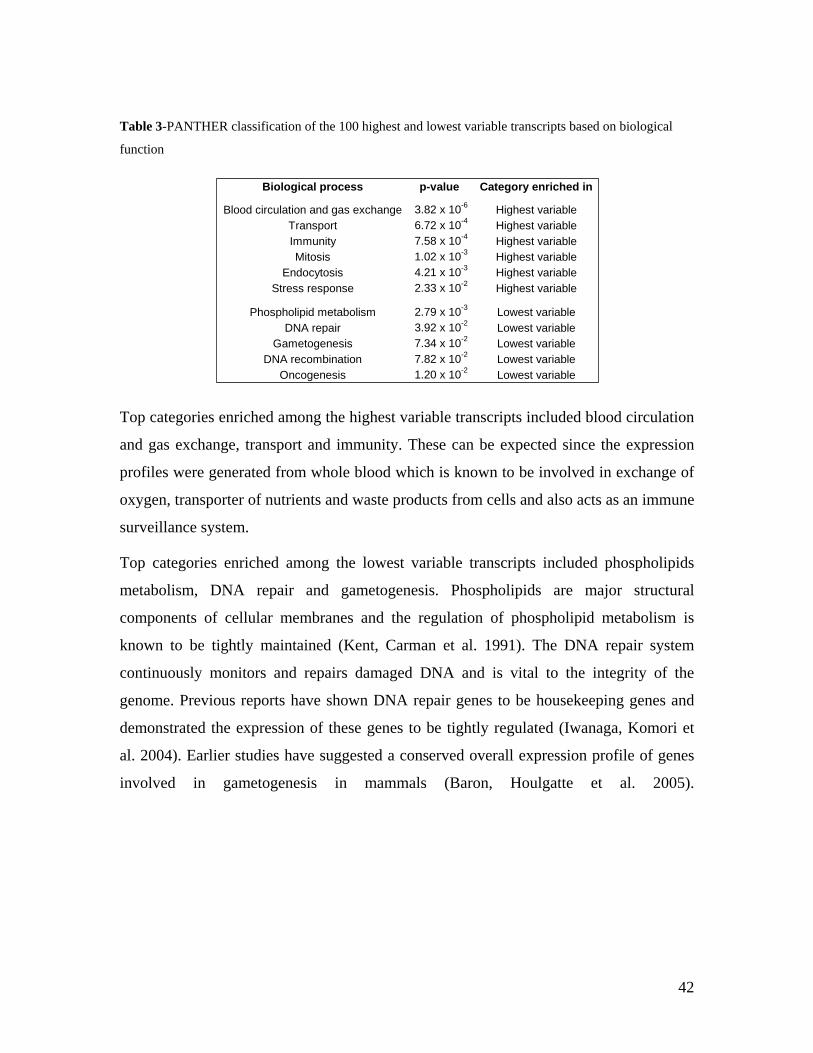
Table 3-PANTHER classification of the 100 highest and lowest variable transcripts based on biological
function
Biological process p-value Category
Blood circulation and gas exchange 3.82 x 10⁻⁶ Highest vaTransport 6.72 x 10⁻⁴ Highest vaImmunity 7.58 x 10⁻⁴ Highest vaMitosis 1.02 x 10⁻³ Highest va
Endocytosis 4.21 x 10⁻³ Highest vaStress response 2.33 x 10⁻² Highest va
Phospholipid metabolism 2.79 x 10⁻³ Lowest vaDNA repair 3.92 x 10⁻² Lowest va
Gametogenesis 7.34 x 10⁻² Lowest vaDNA recombination 7.82 x 10⁻² Lowest va
Oncogenesis 1.20 x 10⁻² Lowest va
enriched in
riableriableriableriableriableriable
riableriableriableriableriable
Top categories enriched among the highest variable transcripts included blood circulation
and gas exchange, transport and immunity. These can be expected since the expression
profiles were generated from whole blood which is known to be involved in exchange of
oxygen, transporter of nutrients and waste products from cells and also acts as an immune
surveillance system.
Top categories enriched among the lowest variable transcripts included phospholipids
metabolism, DNA repair and gametogenesis. Phospholipids are major structural
components of cellular membranes and the regulation of phospholipid metabolism is
known to be tightly maintained (Kent, Carman et al. 1991). The DNA repair system
continuously monitors and repairs damaged DNA and is vital to the integrity of the
genome. Previous reports have shown DNA repair genes to be housekeeping genes and
demonstrated the expression of these genes to be tightly regulated (Iwanaga, Komori et
al. 2004). Earlier studies have suggested a conserved overall expression profile of genes
involved in gametogenesis in mammals (Baron, Houlgatte et al. 2005).
42
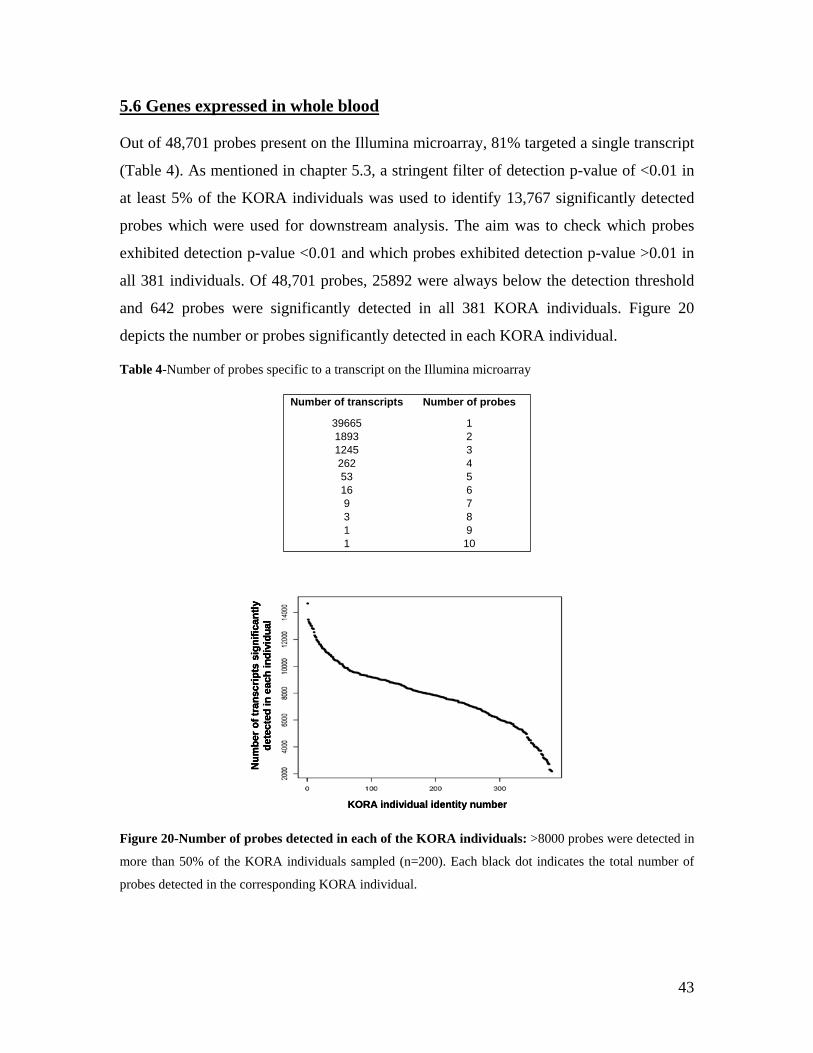
5.6 Genes expressed in whole blood
Out of 48,701 probes present on the Illumina microarray, 81% targeted a single transcript
(Table 4). As mentioned in chapter 5.3, a stringent filter of detection p-value of <0.01 in
at least 5% of the KORA individuals was used to identify 13,767 significantly detected
probes which were used for downstream analysis. The aim was to check which probes
exhibited detection p-value <0.01 and which probes exhibited detection p-value >0.01 in
all 381 individuals. Of 48,701 probes, 25892 were always below the detection threshold
and 642 probes were significantly detected in all 381 KORA individuals. Figure 20
depicts the number or probes significantly detected in each KORA individual.
Table 4-Number of probes specific to a transcript on the Illumina microarray
Number of transcripts Number of probes
39665 11893 21245 3262 453 516 69 73 81 91 10
KORA individual identity number
Num
ber o
f tra
nscr
ipts
sig
nific
antly
de
tect
ed in
eac
h in
divi
dual
KORA individual identity number
Num
ber o
f tra
nscr
ipts
sig
nific
antly
de
tect
ed in
eac
h in
divi
dual
Num
ber o
f tra
nscr
ipts
sig
nific
antly
de
tect
ed in
eac
h in
divi
dual
Figure 20-Number of probes detected in each of the KORA individuals: >8000 probes were detected in
more than 50% of the KORA individuals sampled (n=200). Each black dot indicates the total number of
probes detected in the corresponding KORA individual.
43
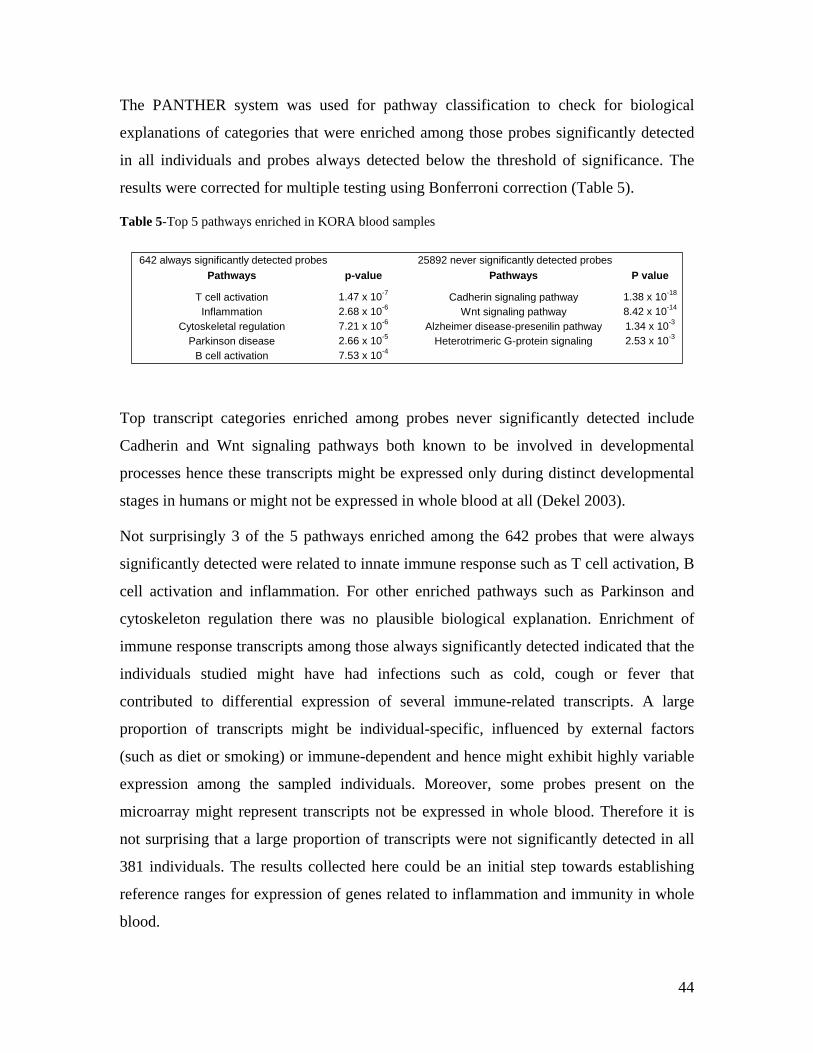
The PANTHER system was used for pathway classification to check for biological
explanations of categories that were enriched among those probes significantly detected
in all individuals and probes always detected below the threshold of significance. The
results were corrected for multiple testing using Bonferroni correction (Table 5).
Table 5-Top 5 pathways enriched in KORA blood samples
642 always significantly detected probes 25892 never significantly detectPathways p-value Pathway
T cell activation 1.47 x 10⁻⁷ Cadherin signaling pathwInflammation 2.68 x 10⁻⁶ Wnt signaling pathway
Cytoskeletal regulation 7.21 x 10⁻⁶ Alzheimer disease-presenilin pParkinson disease 2.66 x 10⁻⁵ Heterotrimeric G-protein sign
B cell activation 7.53 x 10⁻⁴
ed probess P value
ay 1.38 x 10⁻¹⁸
8.42 x 10⁻¹⁴
athway 1.34 x 10⁻³
aling 2.53 x 10⁻³
Top transcript categories enriched among probes never significantly detected include
Cadherin and Wnt signaling pathways both known to be involved in developmental
processes hence these transcripts might be expressed only during distinct developmental
stages in humans or might not be expressed in whole blood at all (Dekel 2003).
Not surprisingly 3 of the 5 pathways enriched among the 642 probes that were always
significantly detected were related to innate immune response such as T cell activation, B
cell activation and inflammation. For other enriched pathways such as Parkinson and
cytoskeleton regulation there was no plausible biological explanation. Enrichment of
immune response transcripts among those always significantly detected indicated that the
individuals studied might have had infections such as cold, cough or fever that
contributed to differential expression of several immune-related transcripts. A large
proportion of transcripts might be individual-specific, influenced by external factors
(such as diet or smoking) or immune-dependent and hence might exhibit highly variable
expression among the sampled individuals. Moreover, some probes present on the
microarray might represent transcripts not be expressed in whole blood. Therefore it is
not surprising that a large proportion of transcripts were not significantly detected in all
381 individuals. The results collected here could be an initial step towards establishing
reference ranges for expression of genes related to inflammation and immunity in whole
blood.
44
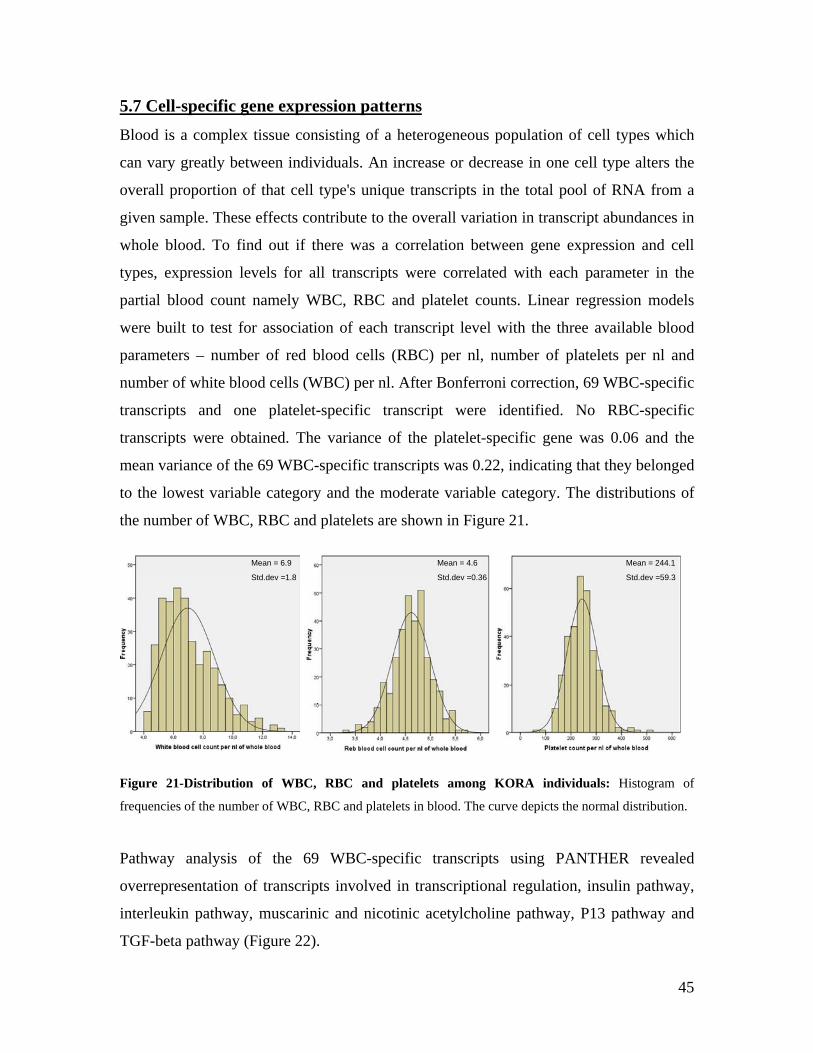
5.7 Cell-specific gene expression patterns
Blood is a complex tissue consisting of a heterogeneous population of cell types which
can vary greatly between individuals. An increase or decrease in one cell type alters the
overall proportion of that cell type's unique transcripts in the total pool of RNA from a
given sample. These effects contribute to the overall variation in transcript abundances in
whole blood. To find out if there was a correlation between gene expression and cell
types, expression levels for all transcripts were correlated with each parameter in the
partial blood count namely WBC, RBC and platelet counts. Linear regression models
were built to test for association of each transcript level with the three available blood
parameters – number of red blood cells (RBC) per nl, number of platelets per nl and
number of white blood cells (WBC) per nl. After Bonferroni correction, 69 WBC-specific
transcripts and one platelet-specific transcript were identified. No RBC-specific
transcripts were obtained. The variance of the platelet-specific gene was 0.06 and the
mean variance of the 69 WBC-specific transcripts was 0.22, indicating that they belonged
to the lowest variable category and the moderate variable category. The distributions of
the number of WBC, RBC and platelets are shown in Figure 21.
Mean = 6.9
Std.dev =1.8
Mean = 4.6
Std.dev =0.36
Mean = 244.1
Std.dev =59.3
Mean = 6.9
Std.dev =1.8
Mean = 4.6
Std.dev =0.36
Mean = 244.1
Std.dev =59.3
Figure 21-Distribution of WBC, RBC and platelets among KORA individuals: Histogram of
frequencies of the number of WBC, RBC and platelets in blood. The curve depicts the normal distribution.
Pathway analysis of the 69 WBC-specific transcripts using PANTHER revealed
overrepresentation of transcripts involved in transcriptional regulation, insulin pathway,
interleukin pathway, muscarinic and nicotinic acetylcholine pathway, P13 pathway and
TGF-beta pathway (Figure 22).
45
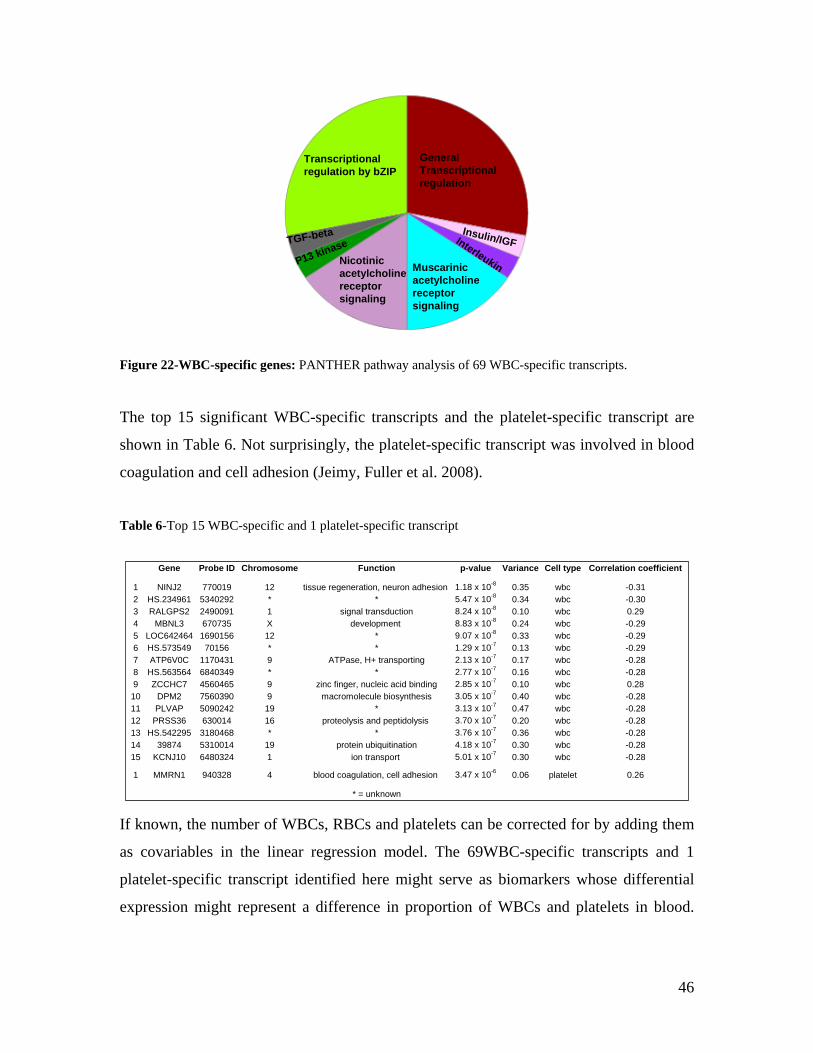
General Transcriptional regulation
InterleukinMuscarinic acetylcholine receptor signaling
P13 kinaseNicotinic acetylcholine receptor signaling
Transcriptional regulation by bZIP
TGF-beta Insulin/IGF
General Transcriptional regulation
InterleukinMuscarinic acetylcholine receptor signaling
P13 kinaseNicotinic acetylcholine receptor signaling
Transcriptional regulation by bZIP
TGF-beta Insulin/IGF
Figure 22-WBC-specific genes: PANTHER pathway analysis of 69 WBC-specific transcripts.
The top 15 significant WBC-specific transcripts and the platelet-specific transcript are
shown in Table 6. Not surprisingly, the platelet-specific transcript was involved in blood
coagulation and cell adhesion (Jeimy, Fuller et al. 2008).
Table 6-Top 15 WBC-specific and 1 platelet-specific transcript
Gene Probe ID Chromosome Function p-value Variance Cell type Correlation coefficient
1 NINJ2 770019 12 tissue regeneration, neuron adhesion 1.18 x 10⁻⁸ 0.35 wbc -0.312 HS.234961 5340292 * * 5.47 x 10⁻⁸ 0.34 wbc -0.303 RALGPS2 2490091 1 signal transduction 8.24 x 10⁻⁸ 0.10 wbc 0.294 MBNL3 670735 X development 8.83 x 10⁻⁸ 0.24 wbc -0.295 LOC642464 1690156 12 * 9.07 x 10-8 0.33 wbc -0.296 HS.573549 70156 * * 1.29 x 10⁻⁷ 0.13 wbc -0.297 ATP6V0C 1170431 9 ATPase, H+ transporting 2.13 x 10⁻⁷ 0.17 wbc -0.288 HS.563564 6840349 * * 2.77 x 10⁻⁷ 0.16 wbc -0.289 ZCCHC7 4560465 9 zinc finger, nucleic acid binding 2.85 x 10⁻⁷ 0.10 wbc 0.28
10 DPM2 7560390 9 macromolecule biosynthesis 3.05 x 10⁻⁷ 0.40 wbc -0.2811 PLVAP 5090242 19 * 3.13 x 10-7 0.47 wbc -0.2812 PRSS36 630014 16 proteolysis and peptidolysis 3.70 x 10⁻⁷ 0.20 wbc -0.2813 HS.542295 3180468 * * 3.76 x 10⁻⁷ 0.36 wbc -0.2814 39874 5310014 19 protein ubiquitination 4.18 x 10⁻⁷ 0.30 wbc -0.2815 KCNJ10 6480324 1 ion transport 5.01 x 10⁻⁷ 0.30 wbc -0.28
1 MMRN1 940328 4 blood coagulation, cell adhesion 3.47 x 10⁻⁶ 0.06 platelet 0.26
* = unknown
If known, the number of WBCs, RBCs and platelets can be corrected for by adding them
as covariables in the linear regression model. The 69WBC-specific transcripts and 1
platelet-specific transcript identified here might serve as biomarkers whose differential
expression might represent a difference in proportion of WBCs and platelets in blood.
46
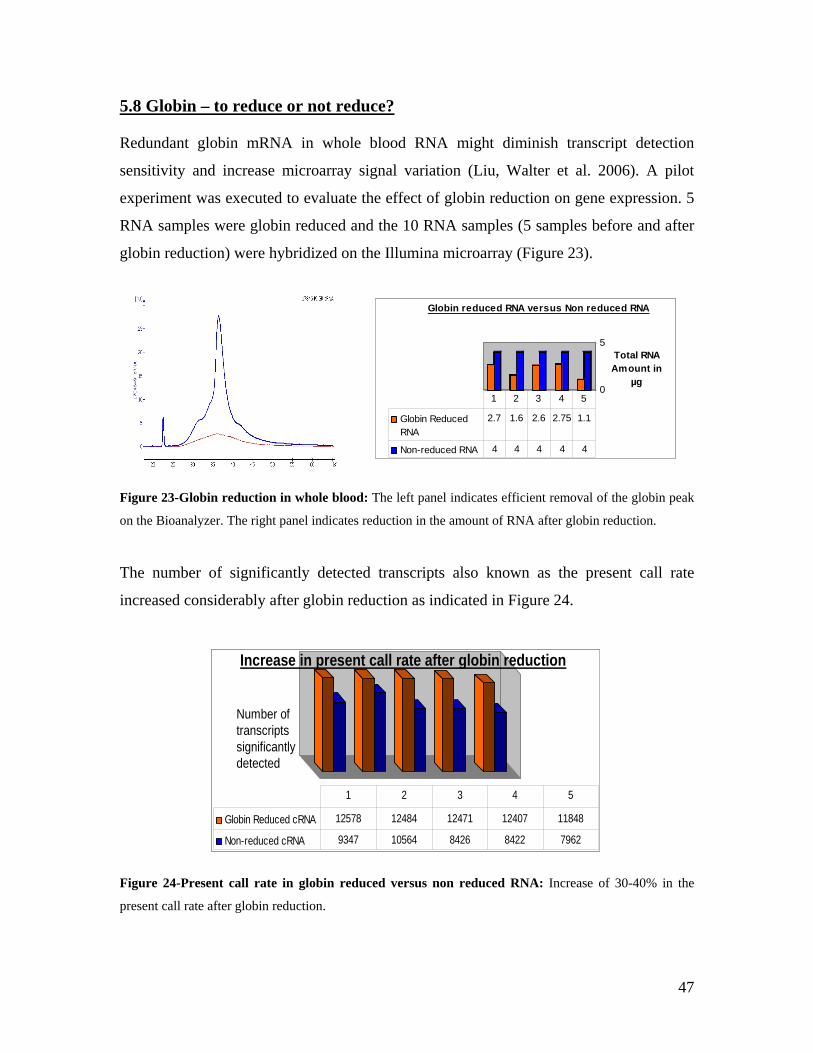
5.8 Globin – to reduce or not reduce?
Redundant globin mRNA in whole blood RNA might diminish transcript detection
sensitivity and increase microarray signal variation (Liu, Walter et al. 2006). A pilot
experiment was executed to evaluate the effect of globin reduction on gene expression. 5
RNA samples were globin reduced and the 10 RNA samples (5 samples before and after
globin reduction) were hybridized on the Illumina microarray (Figure 23).
0
5Total RNA Amount in
µg
Globin reduced RNA versus Non reduced RNA
Globin ReducedRNA
2.7 1.6 2.6 2.75 1.1
Non-reduced RNA 4 4 4 4 4
1 2 3 4 50
5Total RNA Amount in
µg
Globin reduced RNA versus Non reduced RNA
Globin ReducedRNA
2.7 1.6 2.6 2.75 1.1
Non-reduced RNA 4 4 4 4 4
1 2 3 4 5
Figure 23-Globin reduction in whole blood: The left panel indicates efficient removal of the globin peak
on the Bioanalyzer. The right panel indicates reduction in the amount of RNA after globin reduction.
The number of significantly detected transcripts also known as the present call rate
increased considerably after globin reduction as indicated in Figure 24.
Globin Reduced cRNA 12578 12484 12471 12407 11848
Non-reduced cRNA 9347 10564 8426 8422 7962
1 2 3 4 5
Number of transcripts significantly detected
Increase in present call rate after globin reduction
Globin Reduced cRNA 12578 12484 12471 12407 11848
Non-reduced cRNA 9347 10564 8426 8422 7962
1 2 3 4 5
Number of transcripts significantly detected
Increase in present call rate after globin reduction
Figure 24-Present call rate in globin reduced versus non reduced RNA: Increase of 30-40% in the
present call rate after globin reduction.
47
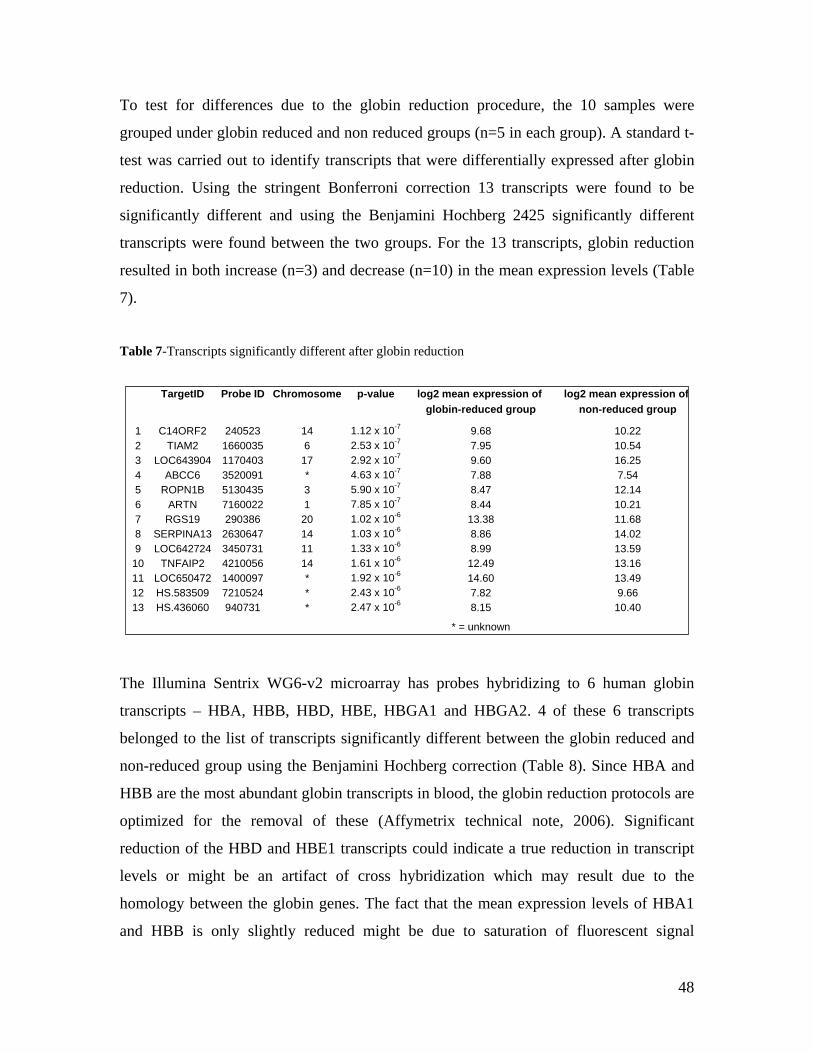
To test for differences due to the globin reduction procedure, the 10 samples were
grouped under globin reduced and non reduced groups (n=5 in each group). A standard t-
test was carried out to identify transcripts that were differentially expressed after globin
reduction. Using the stringent Bonferroni correction 13 transcripts were found to be
significantly different and using the Benjamini Hochberg 2425 significantly different
transcripts were found between the two groups. For the 13 transcripts, globin reduction
resulted in both increase (n=3) and decrease (n=10) in the mean expression levels (Table
7).
Table 7-Transcripts significantly different after globin reduction
TargetID Probe ID Chromosome p-value log2 mean expression of log2 mean expression of
globin-reduced group non-reduced group
1 C14ORF2 240523 14 1.12 x 10⁻⁷ 9.68 10.222 TIAM2 1660035 6 2.53 x 10⁻⁷ 7.95 10.543 LOC643904 1170403 17 2.92 x 10⁻⁷ 9.60 16.254 ABCC6 3520091 * 4.63 x 10-7 7.88 7.545 ROPN1B 5130435 3 5.90 x 10⁻⁷ 8.47 12.146 ARTN 7160022 1 7.85 x 10⁻⁷ 8.44 10.217 RGS19 290386 20 1.02 x 10⁻⁶ 13.38 11.688 SERPINA13 2630647 14 1.03 x 10⁻⁶ 8.86 14.029 LOC642724 3450731 11 1.33 x 10⁻⁶ 8.99 13.5910 TNFAIP2 4210056 14 1.61 x 10⁻⁶ 12.49 13.1611 LOC650472 1400097 * 1.92 x 10-6 14.60 13.4912 HS.583509 7210524 * 2.43 x 10-6 7.82 9.6613 HS.436060 940731 * 2.47 x 10-6 8.15 10.40
* = unknown
The Illumina Sentrix WG6-v2 microarray has probes hybridizing to 6 human globin
transcripts – HBA, HBB, HBD, HBE, HBGA1 and HBGA2. 4 of these 6 transcripts
belonged to the list of transcripts significantly different between the globin reduced and
non-reduced group using the Benjamini Hochberg correction (Table 8). Since HBA and
HBB are the most abundant globin transcripts in blood, the globin reduction protocols are
optimized for the removal of these (Affymetrix technical note, 2006). Significant
reduction of the HBD and HBE1 transcripts could indicate a true reduction in transcript
levels or might be an artifact of cross hybridization which may result due to the
homology between the globin genes. The fact that the mean expression levels of HBA1
and HBB is only slightly reduced might be due to saturation of fluorescent signal
48
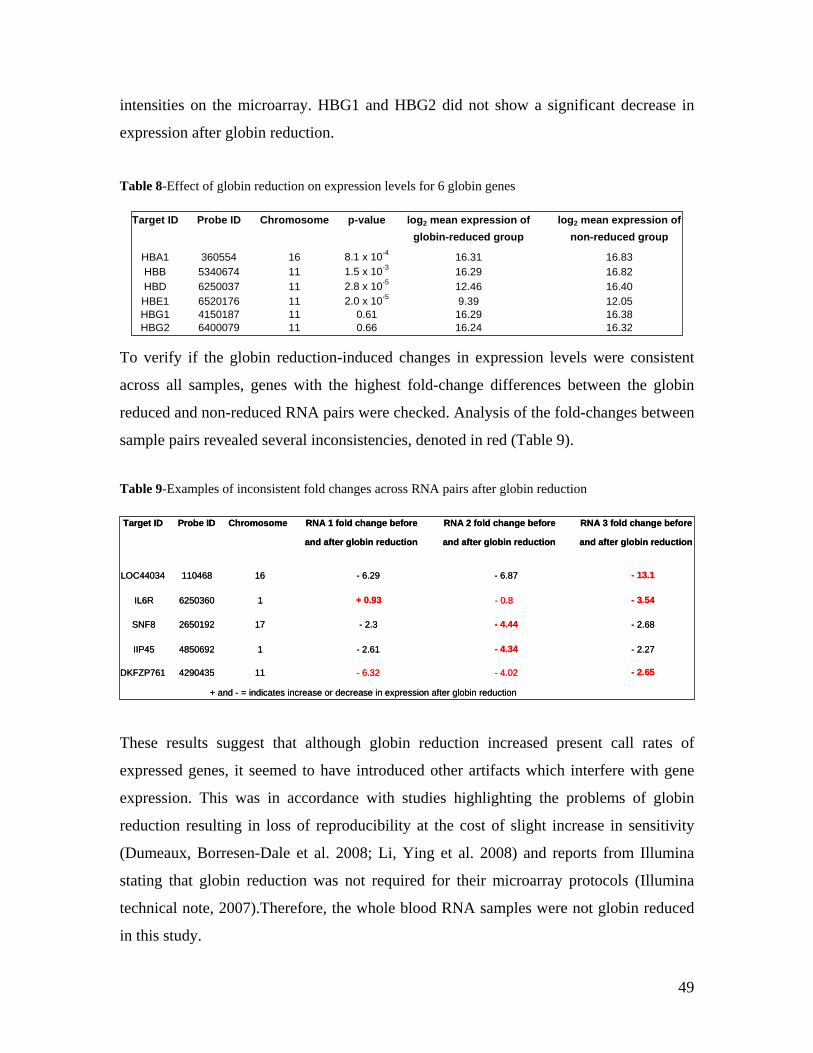
intensities on the microarray. HBG1 and HBG2 did not show a significant decrease in
expression after globin reduction.
Table 8-Effect of globin reduction on expression levels for 6 globin genes
Target ID Probe ID Chromosome p-value log2 mean expression of log2 mean expression ofglobin-reduced group non-reduced group
HBA1 360554 16 8.1 x 10⁻⁴ 16.31 16.83HBB 5340674 11 1.5 x 10⁻³ 16.29 16.82HBD 6250037 11 2.8 x 10⁻⁵ 12.46 16.40HBE1 6520176 11 2.0 x 10⁻⁵ 9.39 12.05HBG1 4150187 11 0.61 16.29 16.38HBG2 6400079 11 0.66 16.24 16.32
To verify if the globin reduction-induced changes in expression levels were consistent
across all samples, genes with the highest fold-change differences between the globin
reduced and non-reduced RNA pairs were checked. Analysis of the fold-changes between
sample pairs revealed several inconsistencies, denoted in red (Table 9).
Table 9-Examples of inconsistent fold changes across RNA pairs after globin reduction
Target ID Probe ID Chromosome RNA 1 fold change before RNA 2 fold change before RNA 3 fold change before
and after globin reduction and after globin reduction and after globin reduction
LOC44034 110468 16 - 6.29 - 6.87
IL6R 6250360 1
SNF8 2650192 17 - 2.3 - 2.68
IIP45 4850692 1 - 2.61 - 2.27
DKFZP761 4290435 11
+ and - = indicates increase or decrease in expression after globin reduction
- 13.1
+ 0.93 - 0.8 - 3.54
- 4.44
- 4.34
- 6.32 - 4.02 - 2.65
- 13.1
+ 0.93 - 0.8 - 3.54
- 4.44
- 4.34
- 6.32 - 4.02 - 2.65
These results suggest that although globin reduction increased present call rates of
expressed genes, it seemed to have introduced other artifacts which interfere with gene
expression. This was in accordance with studies highlighting the problems of globin
reduction resulting in loss of reproducibility at the cost of slight increase in sensitivity
(Dumeaux, Borresen-Dale et al. 2008; Li, Ying et al. 2008) and reports from Illumina
stating that globin reduction was not required for their microarray protocols (Illumina
technical note, 2007).Therefore, the whole blood RNA samples were not globin reduced
in this study.
49
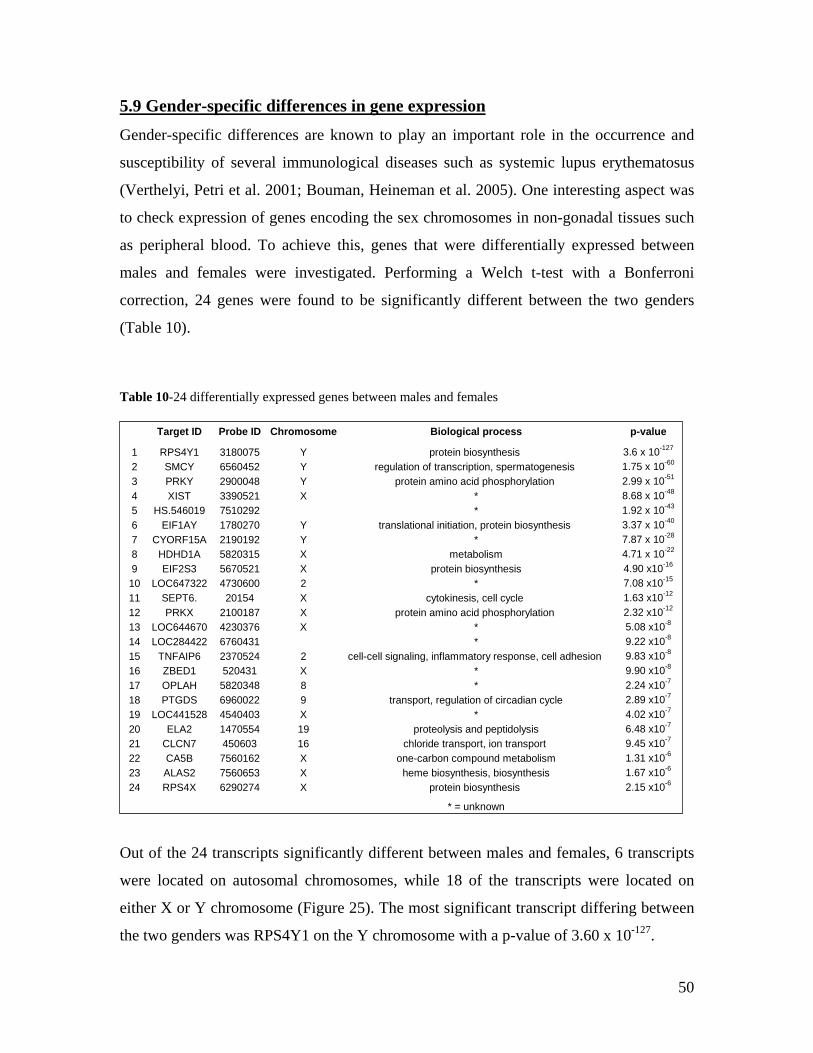
5.9 Gender-specific differences in gene expression
Gender-specific differences are known to play an important role in the occurrence and
susceptibility of several immunological diseases such as systemic lupus erythematosus
(Verthelyi, Petri et al. 2001; Bouman, Heineman et al. 2005). One interesting aspect was
to check expression of genes encoding the sex chromosomes in non-gonadal tissues such
as peripheral blood. To achieve this, genes that were differentially expressed between
males and females were investigated. Performing a Welch t-test with a Bonferroni
correction, 24 genes were found to be significantly different between the two genders
(Table 10).
Table 10-24 differentially expressed genes between males and females
Target ID Probe ID Chromosome Biological process p-value
1 RPS4Y1 3180075 Y protein biosynthesis 3.6 x 10-127
2 SMCY 6560452 Y regulation of transcription, spermatogenesis 1.75 x 10-60
3 PRKY 2900048 Y protein amino acid phosphorylation 2.99 x 10-51
4 XIST 3390521 X * 8.68 x 10-48
5 HS.546019 7510292 * 1.92 x 10-43
6 EIF1AY 1780270 Y translational initiation, protein biosynthesis 3.37 x 10-40
7 CYORF15A 2190192 Y * 7.87 x 10-28
8 HDHD1A 5820315 X metabolism 4.71 x 10⁻²²
9 EIF2S3 5670521 X protein biosynthesis 4.90 x10⁻¹⁶
10 LOC647322 4730600 2 * 7.08 x10-15
11 SEPT6. 20154 X cytokinesis, cell cycle 1.63 x10⁻¹²
12 PRKX 2100187 X protein amino acid phosphorylation 2.32 x10⁻¹²
13 LOC644670 4230376 X * 5.08 x10-8
14 LOC284422 6760431 * 9.22 x10-8
15 TNFAIP6 2370524 2 cell-cell signaling, inflammatory response, cell adhesion 9.83 x10⁻⁸
16 ZBED1 520431 X * 9.90 x10-8
17 OPLAH 5820348 8 * 2.24 x10-7
18 PTGDS 6960022 9 transport, regulation of circadian cycle 2.89 x10⁻⁷
19 LOC441528 4540403 X * 4.02 x10-7
20 ELA2 1470554 19 proteolysis and peptidolysis 6.48 x10⁻⁷
21 CLCN7 450603 16 chloride transport, ion transport 9.45 x10⁻⁷
22 CA5B 7560162 X one-carbon compound metabolism 1.31 x10⁻⁶
23 ALAS2 7560653 X heme biosynthesis, biosynthesis 1.67 x10⁻⁶
24 RPS4X 6290274 X protein biosynthesis 2.15 x10⁻⁶
* = unknown
Out of the 24 transcripts significantly different between males and females, 6 transcripts
were located on autosomal chromosomes, while 18 of the transcripts were located on
either X or Y chromosome (Figure 25). The most significant transcript differing between
the two genders was RPS4Y1 on the Y chromosome with a p-value of 3.60 x 10-127.
50
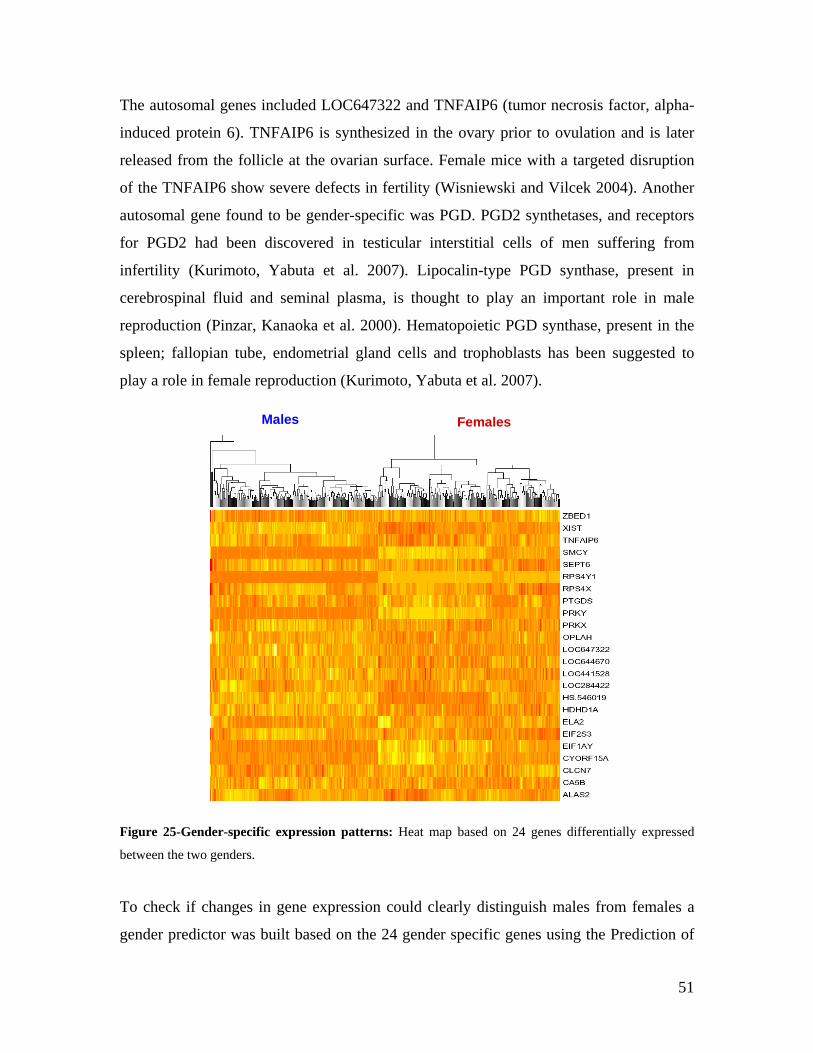
The autosomal genes included LOC647322 and TNFAIP6 (tumor necrosis factor, alpha-
induced protein 6). TNFAIP6 is synthesized in the ovary prior to ovulation and is later
released from the follicle at the ovarian surface. Female mice with a targeted disruption
of the TNFAIP6 show severe defects in fertility (Wisniewski and Vilcek 2004). Another
autosomal gene found to be gender-specific was PGD. PGD2 synthetases, and receptors
for PGD2 had been discovered in testicular interstitial cells of men suffering from
infertility (Kurimoto, Yabuta et al. 2007). Lipocalin-type PGD synthase, present in
cerebrospinal fluid and seminal plasma, is thought to play an important role in male
reproduction (Pinzar, Kanaoka et al. 2000). Hematopoietic PGD synthase, present in the
spleen; fallopian tube, endometrial gland cells and trophoblasts has been suggested to
play a role in female reproduction (Kurimoto, Yabuta et al. 2007).
Males Females
Males Females
Figure 25-Gender-specific expression patterns: Heat map based on 24 genes differentially expressed
between the two genders.
To check if changes in gene expression could clearly distinguish males from females a
gender predictor was built based on the 24 gender specific genes using the Prediction of
51
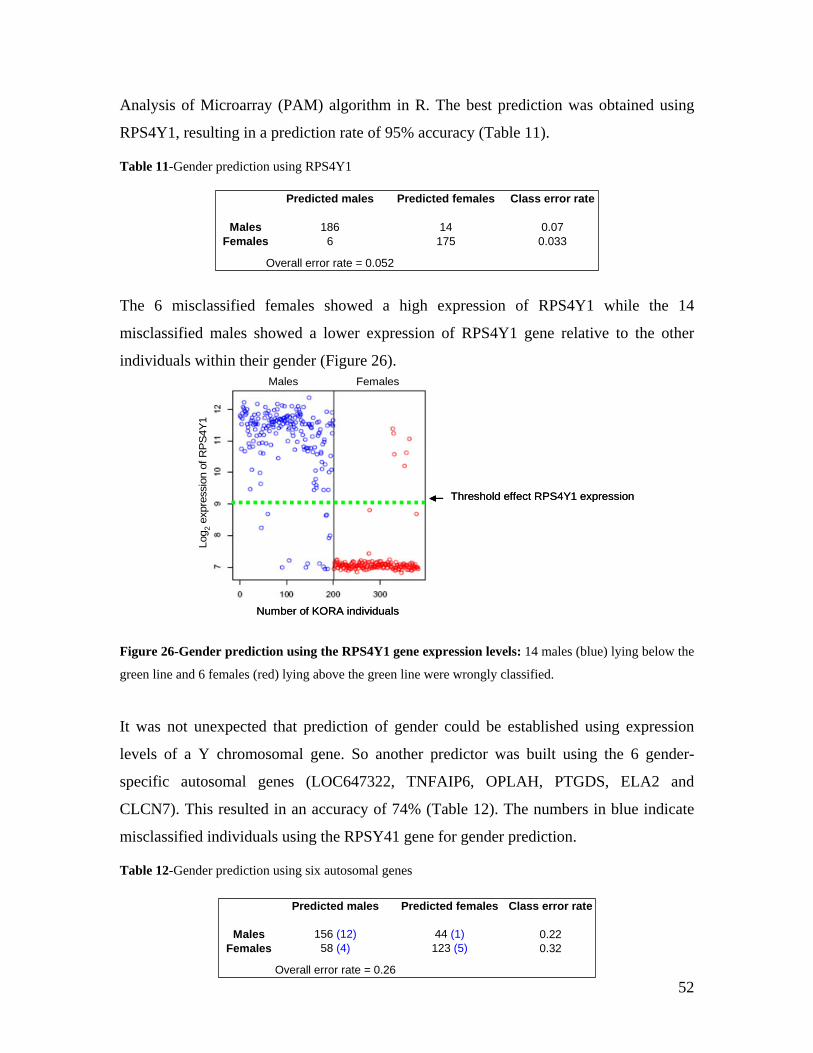
Analysis of Microarray (PAM) algorithm in R. The best prediction was obtained using
RPS4Y1, resulting in a prediction rate of 95% accuracy (Table 11).
Table 11-Gender prediction using RPS4Y1
Predicted males Predicted female
Males 186 14Females 6 175
Overall error rate = 0.052
s Class error rate
0.070.033
The 6 misclassified females showed a high expression of RPS4Y1 while the 14
misclassified males showed a lower expression of RPS4Y1 gene relative to the other
individuals within their gender (Figure 26). Males Females
Threshold effect RPS4Y1 expression
Log 2
expr
essi
on o
f RP
S4Y
1
Number of KORA individuals
Males Females
Threshold effect RPS4Y1 expression
Log 2
expr
essi
on o
f RP
S4Y
1
Number of KORA individuals
Figure 26-Gender prediction using the RPS4Y1 gene expression levels: 14 males (blue) lying below the
green line and 6 females (red) lying above the green line were wrongly classified.
It was not unexpected that prediction of gender could be established using expression
levels of a Y chromosomal gene. So another predictor was built using the 6 gender-
specific autosomal genes (LOC647322, TNFAIP6, OPLAH, PTGDS, ELA2 and
CLCN7). This resulted in an accuracy of 74% (Table 12). The numbers in blue indicate
misclassified individuals using the RPSY41 gene for gender prediction.
Table 12-Gender prediction using six autosomal genes
Predicted males Predicted females Class error rate
Males 156 (12) 44 (1) 0.22Females 58 (4) 123 (5) 0.32
Overall error rate = 0.26 52
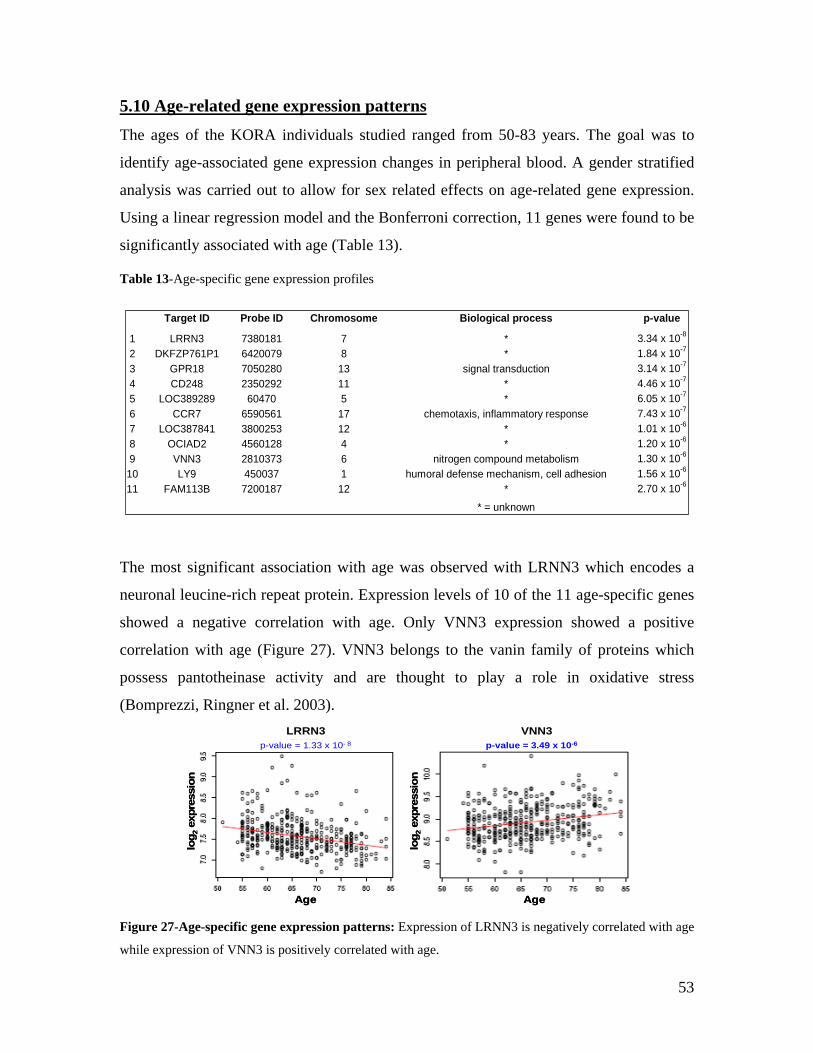
5.10 Age-related gene expression patterns
The ages of the KORA individuals studied ranged from 50-83 years. The goal was to
identify age-associated gene expression changes in peripheral blood. A gender stratified
analysis was carried out to allow for sex related effects on age-related gene expression.
Using a linear regression model and the Bonferroni correction, 11 genes were found to be
significantly associated with age (Table 13).
Table 13-Age-specific gene expression profiles
T p-value
1 L 3.34 x 10⁻⁸
2 DKFZ 1.84 x 10⁻⁷
3 3.14 x 10⁻⁷
4 4.46 x 10⁻⁷
5 LOC 6.05 x 10⁻⁷
6 CCR7 6590561 17 chemotaxis, inflammatory response 7.43 x 10⁻⁷
7 LOC387841 3800253 12 * 1.01 x 10-6
8 OCIAD2 4560128 4 * 1.20 x 10-6
9 VNN3 2810373 6 nitrogen compound metabolism 1.30 x 10⁻⁶
10 LY9 450037 1 humoral defense mechanism, cell adhesion 1.56 x 10⁻⁶
11 FAM113B 7200187 12 * 2.70 x 10-6
* = unknown
arget ID Probe ID Chromosome Biological process
RRN3 7380181 7 *P761P1 6420079 8 *
GPR18 7050280 13 signal transductionCD248 2350292 11 *
389289 60470 5 *
The most significant association with age was observed with LRNN3 which encodes a
neuronal leucine-rich repeat protein. Expression levels of 10 of the 11 age-specific genes
showed a negative correlation with age. Only VNN3 expression showed a positive
correlation with age (Figure 27). VNN3 belongs to the vanin family of proteins which
possess pantotheinase activity and are thought to play a role in oxidative stress
(Bomprezzi, Ringner et al. 2003). LRRN3 VNN3
log 2
expr
essi
on
log 2
expr
essi
on
p-value = 1.33 x 10- 8 p-value = 3.49 x 10⁻⁶
AgeAge
LRRN3 VNN3
log 2
expr
essi
on
log 2
expr
essi
on
p-value = 1.33 x 10- 8 p-value = 3.49 x 10⁻⁶
AgeAge
Figure 27-Age-specific gene expression patterns: Expression of LRNN3 is negatively correlated with age
while expression of VNN3 is positively correlated with age.
53
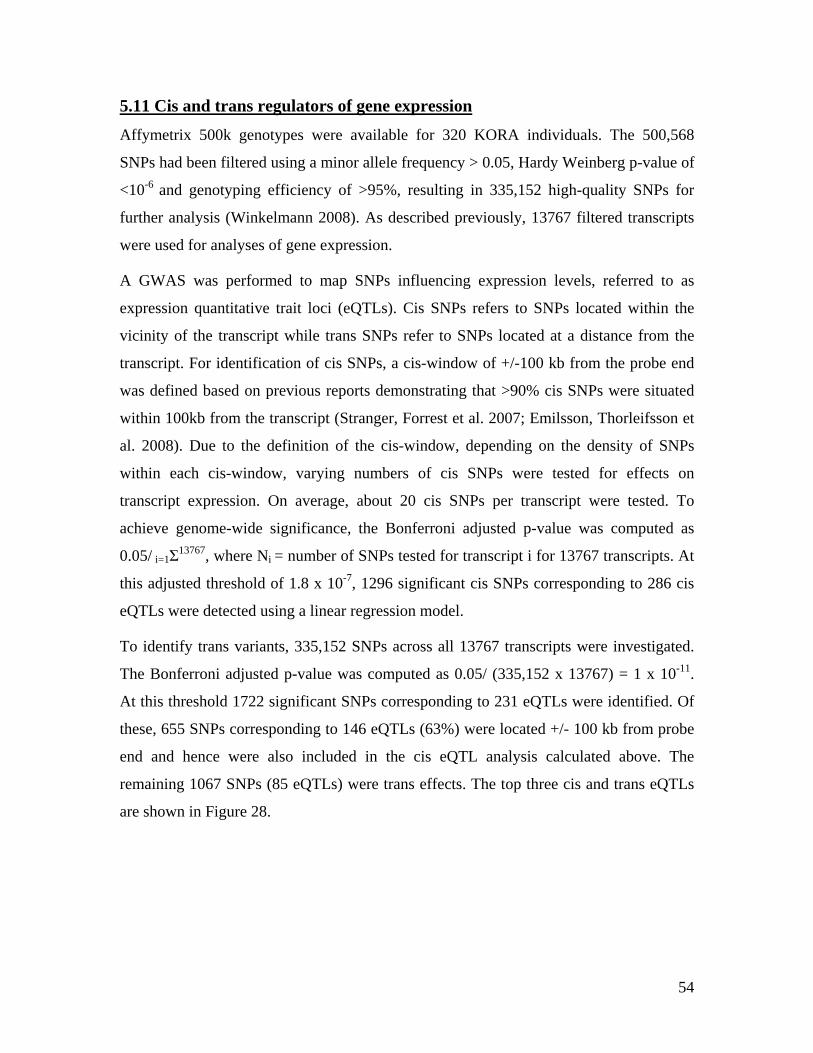
5.11 Cis and trans regulators of gene expression
Affymetrix 500k genotypes were available for 320 KORA individuals. The 500,568
SNPs had been filtered using a minor allele frequency > 0.05, Hardy Weinberg p-value of
<10-6 and genotyping efficiency of >95%, resulting in 335,152 high-quality SNPs for
further analysis (Winkelmann 2008). As described previously, 13767 filtered transcripts
were used for analyses of gene expression.
A GWAS was performed to map SNPs influencing expression levels, referred to as
expression quantitative trait loci (eQTLs). Cis SNPs refers to SNPs located within the
vicinity of the transcript while trans SNPs refer to SNPs located at a distance from the
transcript. For identification of cis SNPs, a cis-window of +/-100 kb from the probe end
was defined based on previous reports demonstrating that >90% cis SNPs were situated
within 100kb from the transcript (Stranger, Forrest et al. 2007; Emilsson, Thorleifsson et
al. 2008). Due to the definition of the cis-window, depending on the density of SNPs
within each cis-window, varying numbers of cis SNPs were tested for effects on
transcript expression. On average, about 20 cis SNPs per transcript were tested. To
achieve genome-wide significance, the Bonferroni adjusted p-value was computed as
0.05/ i=1Σ13767, where Ni = number of SNPs tested for transcript i for 13767 transcripts. At
this adjusted threshold of 1.8 x 10⁻⁷, 1296 significant cis SNPs corresponding to 286 cis
eQTLs were detected using a linear regression model.
To identify trans variants, 335,152 SNPs across all 13767 transcripts were investigated.
The Bonferroni adjusted p-value was computed as 0.05/ (335,152 x 13767) = 1 x 10-11.
At this threshold 1722 significant SNPs corresponding to 231 eQTLs were identified. Of
these, 655 SNPs corresponding to 146 eQTLs (63%) were located +/- 100 kb from probe
end and hence were also included in the cis eQTL analysis calculated above. The
remaining 1067 SNPs (85 eQTLs) were trans effects. The top three cis and trans eQTLs
are shown in Figure 28.
54
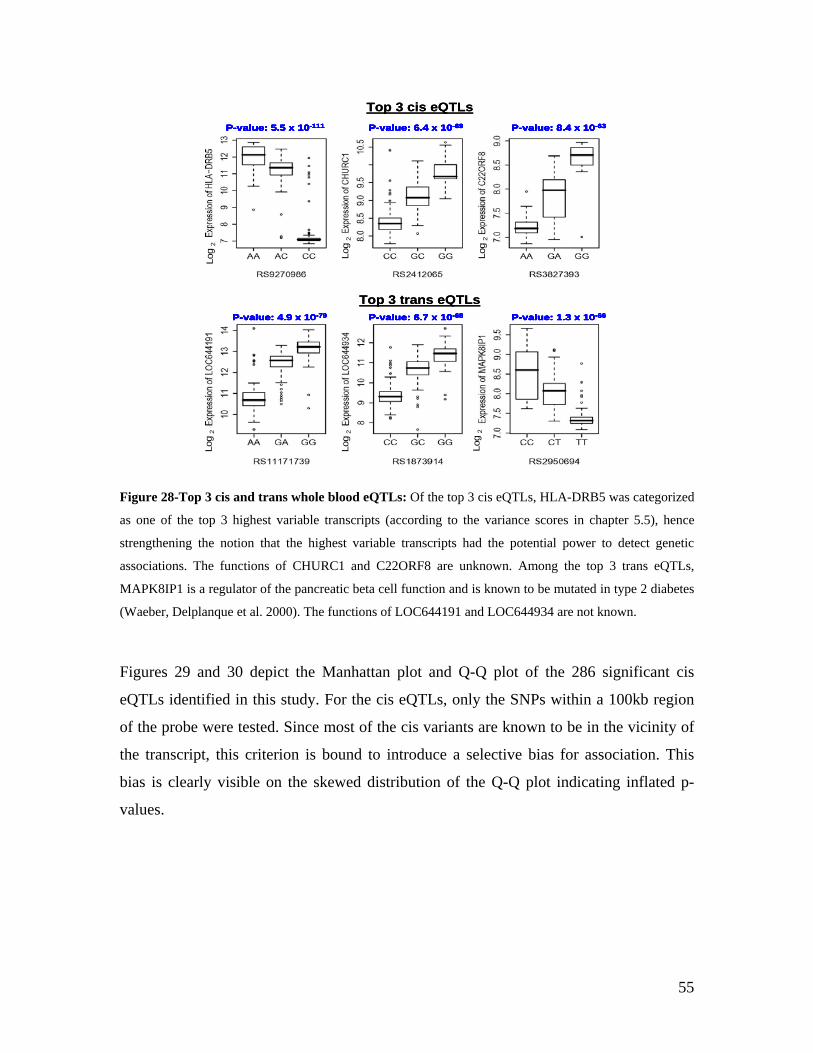
P-value: 4.9 x 10-79 P-value: 6.7 x 10-68 P-value: 1.3 x 10-66P-value: 4.9 x 10-79 P-value: 6.7 x 10-68 P-value: 1.3 x 10-66
Log
2
Log
2
Log
2
P-value: 5.5 x 10-111 P-value: 8.4 x 10-63P-value: 6.4 x 10-69P-value: 5.5 x 10-111 P-value: 8.4 x 10-63P-value: 6.4 x 10-69
Log
2
Log
2
Log
2
Top 3 cis eQTLs
Top 3 trans eQTLsP-value: 4.9 x 10-79 P-value: 6.7 x 10-68 P-value: 1.3 x 10-66P-value: 4.9 x 10-79 P-value: 6.7 x 10-68 P-value: 1.3 x 10-66
Log
2
Log
2
Log
2
P-value: 4.9 x 10-79 P-value: 6.7 x 10-68 P-value: 1.3 x 10-66P-value: 4.9 x 10-79 P-value: 6.7 x 10-68 P-value: 1.3 x 10-66
Log
2
Log
2
Log
2
P-value: 5.5 x 10-111 P-value: 8.4 x 10-63P-value: 6.4 x 10-69P-value: 5.5 x 10-111 P-value: 8.4 x 10-63P-value: 6.4 x 10-69
Log
2
Log
2
Log
2
P-value: 5.5 x 10-111 P-value: 8.4 x 10-63P-value: 6.4 x 10-69P-value: 5.5 x 10-111 P-value: 8.4 x 10-63P-value: 6.4 x 10-69
Log
2
Log
2
Log
2
Top 3 cis eQTLs
Top 3 trans eQTLs
Figure 28-Top 3 cis and trans whole blood eQTLs: Of the top 3 cis eQTLs, HLA-DRB5 was categorized
as one of the top 3 highest variable transcripts (according to the variance scores in chapter 5.5), hence
strengthening the notion that the highest variable transcripts had the potential power to detect genetic
associations. The functions of CHURC1 and C22ORF8 are unknown. Among the top 3 trans eQTLs,
MAPK8IP1 is a regulator of the pancreatic beta cell function and is known to be mutated in type 2 diabetes
(Waeber, Delplanque et al. 2000). The functions of LOC644191 and LOC644934 are not known.
Figures 29 and 30 depict the Manhattan plot and Q-Q plot of the 286 significant cis
eQTLs identified in this study. For the cis eQTLs, only the SNPs within a 100kb region
of the probe were tested. Since most of the cis variants are known to be in the vicinity of
the transcript, this criterion is bound to introduce a selective bias for association. This
bias is clearly visible on the skewed distribution of the Q-Q plot indicating inflated p-
values.
55
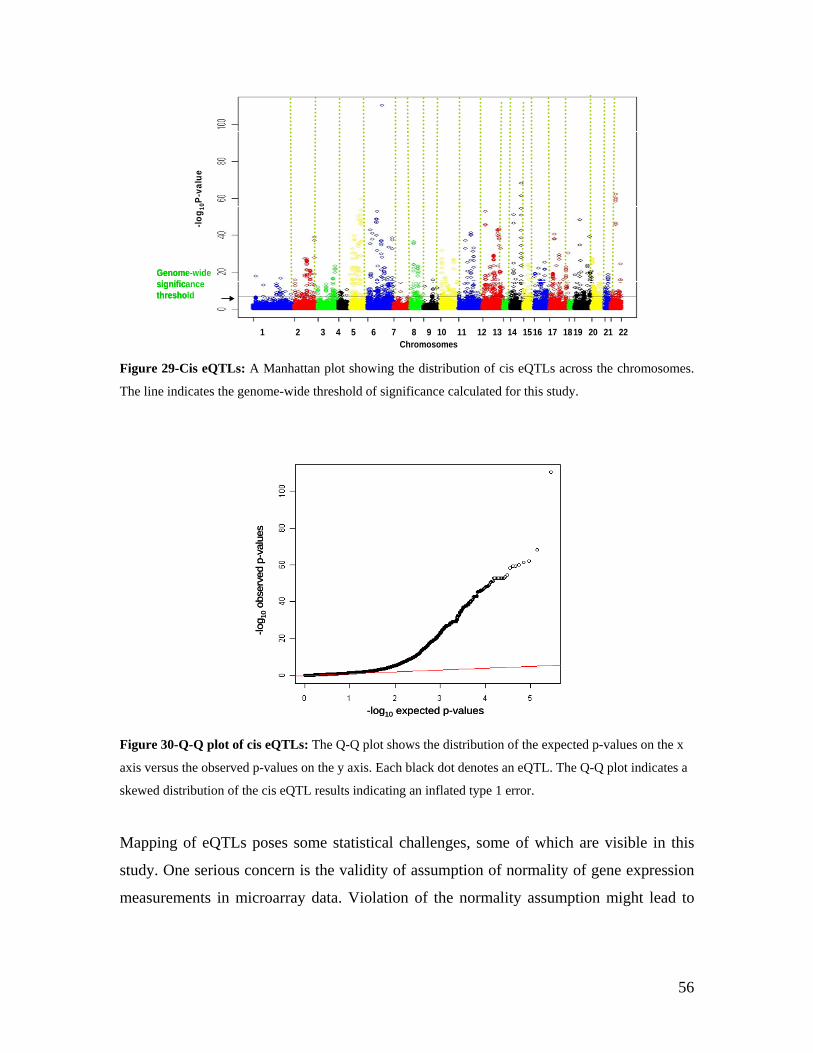
Genome-wide significance threshold
Chromosomes
-log 1
0P-v
alue
1 2 3 4 5 6 87 9 10 161511 12 1413 17 1819 20 21 22
Genome-wide significance threshold
Chromosomes
-log 1
0P-v
alue
1 2 3 4 5 6 87 9 10 161511 12 1413
17 1819 20 21 22
alues
Figure 29-Cis eQTLs: A Manhattan plot showing the distribution of cis eQTLs across the chromosomes.
The line indicates the genome-wide threshold of significance calculated for this study.
-log10 expected p-v
-log 1
0ob
serv
ed p
-val
ues
-log10 expected p-v
-log 1
0ob
serv
ed p
-val
ues
alues
Figure 30-Q-Q plot of cis eQTLs: The Q-Q plot shows the distribution of the expected p-values on the x
axis versus the observed p-values on the y axis. Each black dot denotes an eQTL. The Q-Q plot indicates a
skewed distribution of the cis eQTL results indicating an inflated type 1 error.
Mapping of eQTLs poses some statistical challenges, some of which are visible in this
study. One serious concern is the validity of assumption of normality of gene expression
measurements in microarray data. Violation of the normality assumption might lead to
56
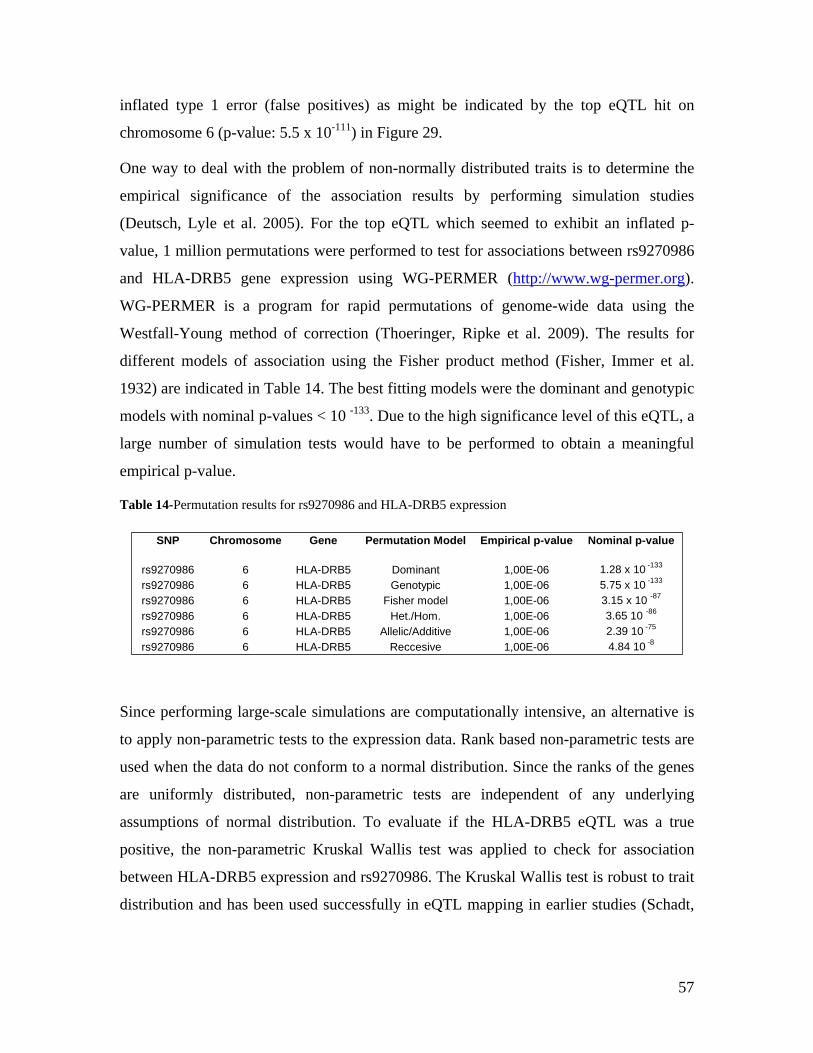
inflated type 1 error (false positives) as might be indicated by the top eQTL hit on
chromosome 6 (p-value: 5.5 x 10-111) in Figure 29.
One way to deal with the problem of non-normally distributed traits is to determine the
empirical significance of the association results by performing simulation studies
(Deutsch, Lyle et al. 2005). For the top eQTL which seemed to exhibit an inflated p-
value, 1 million permutations were performed to test for associations between rs9270986
and HLA-DRB5 gene expression using WG-PERMER (http://www.wg-permer.org).
WG-PERMER is a program for rapid permutations of genome-wide data using the
Westfall-Young method of correction (Thoeringer, Ripke et al. 2009). The results for
different models of association using the Fisher product method (Fisher, Immer et al.
1932) are indicated in Table 14. The best fitting models were the dominant and genotypic
models with nominal p-values < 10 -133. Due to the high significance level of this eQTL, a
large number of simulation tests would have to be performed to obtain a meaningful
empirical p-value.
Table 14-Permutation results for rs9270986 and HLA-DRB5 expression
SNP Chromosome Gene Permutation Model Empirical p-value Nominal p-value
rs9270986 6 HLA-DRB5 Dominant 1,00E-06 1.28 x 10 -133
rs9270986 6 HLA-DRB5 Genotypic 1,00E-06 5.75 x 10 -133
rs9270986 6 HLA-DRB5 Fisher model 1,00E-06 3.15 x 10 -87
rs9270986 6 HLA-DRB5 Het./Hom. 1,00E-06 3.65 10 -86
rs9270986 6 HLA-DRB5 Allelic/Additive 1,00E-06 2.39 10 -75
rs9270986 6 HLA-DRB5 Reccesive 1,00E-06 4.84 10 -8
Since performing large-scale simulations are computationally intensive, an alternative is
to apply non-parametric tests to the expression data. Rank based non-parametric tests are
used when the data do not conform to a normal distribution. Since the ranks of the genes
are uniformly distributed, non-parametric tests are independent of any underlying
assumptions of normal distribution. To evaluate if the HLA-DRB5 eQTL was a true
positive, the non-parametric Kruskal Wallis test was applied to check for association
between HLA-DRB5 expression and rs9270986. The Kruskal Wallis test is robust to trait
distribution and has been used successfully in eQTL mapping in earlier studies (Schadt,
57
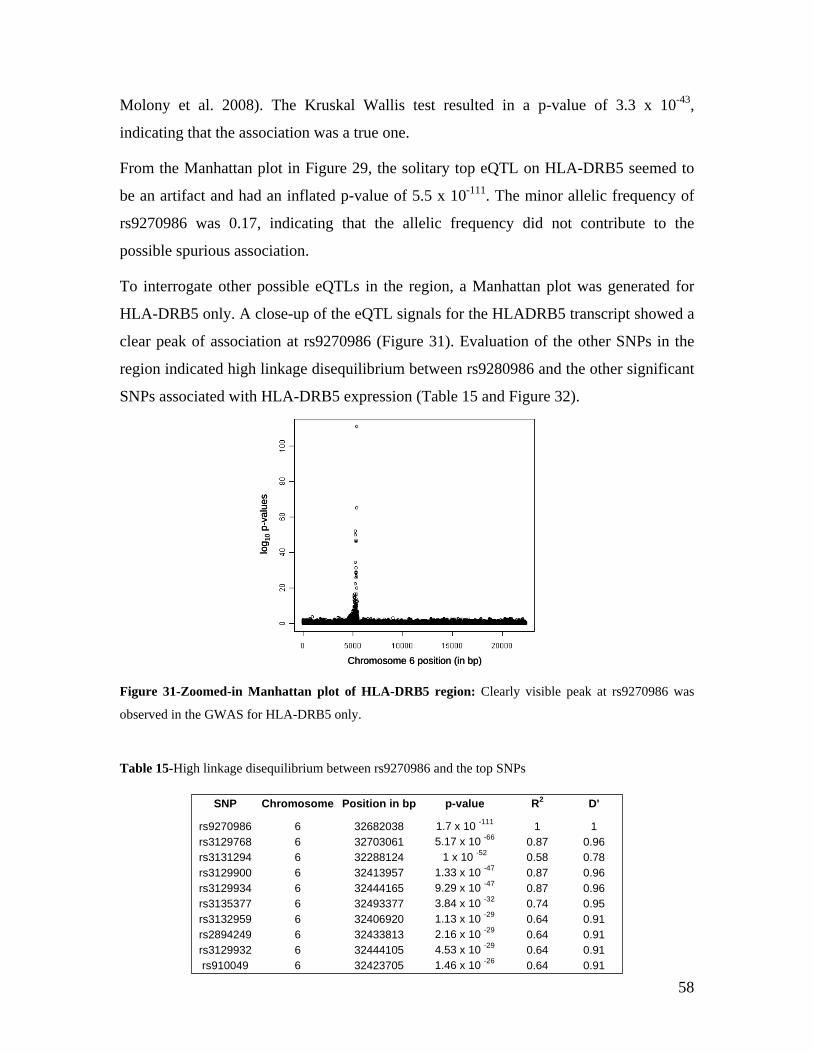
Molony et al. 2008). The Kruskal Wallis test resulted in a p-value of 3.3 x 10-43,
indicating that the association was a true one.
From the Manhattan plot in Figure 29, the solitary top eQTL on HLA-DRB5 seemed to
be an artifact and had an inflated p-value of 5.5 x 10-111. The minor allelic frequency of
rs9270986 was 0.17, indicating that the allelic frequency did not contribute to the
possible spurious association.
To interrogate other possible eQTLs in the region, a Manhattan plot was generated for
HLA-DRB5 only. A close-up of the eQTL signals for the HLADRB5 transcript showed a
clear peak of association at rs9270986 (Figure 31). Evaluation of the other SNPs in the
region indicated high linkage disequilibrium between rs9280986 and the other significant
SNPs associated with HLA-DRB5 expression (Table 15 and Figure 32).
log 1
0p-
valu
es
Chromosome 6 position (in bp)
log 1
0p-
valu
es
Chromosome 6 position (in bp)
Figure 31-Zoomed-in Manhattan plot of HLA-DRB5 region: Clearly visible peak at rs9270986 was
observed in the GWAS for HLA-DRB5 only.
Table 15-High linkage disequilibrium between rs9270986 and the top SNPs
SNP Chromosome Position in bp p-value R2 D'
rs9270986 6 32682038 1.7 x 10 -111 1 1rs3129768 6 32703061 5.17 x 10 -66 0.87 0.96rs3131294 6 32288124 1 x 10 -52 0.58 0.78rs3129900 6 32413957 1.33 x 10 -47 0.87 0.96rs3129934 6 32444165 9.29 x 10 -47 0.87 0.96rs3135377 6 32493377 3.84 x 10 -32 0.74 0.95rs3132959 6 32406920 1.13 x 10 -29 0.64 0.91rs2894249 6 32433813 2.16 x 10 -29 0.64 0.91rs3129932 6 32444105 4.53 x 10 -29 0.64 0.91
-26
58rs910049 6 32423705 1.46 x 10 0.64 0.91
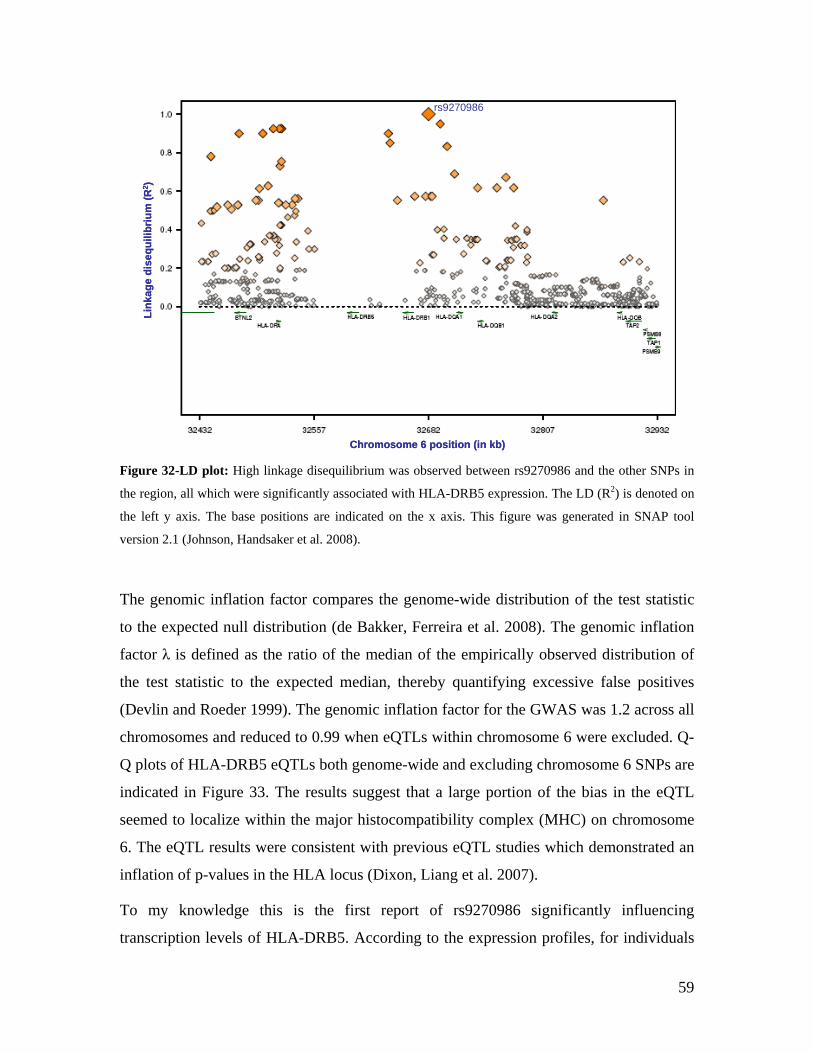
rs9270986
Link
age
dise
quili
briu
m (R
2 )
Chromosome 6 position (in kb)
rs9270986
Link
age
dise
quili
briu
m (R
2 )
Chromosome 6 position (in kb)
Figure 32-LD plot: High linkage disequilibrium was observed between rs9270986 and the other SNPs in
the region, all which were significantly associated with HLA-DRB5 expression. The LD (R2) is denoted on
the left y axis. The base positions are indicated on the x axis. This figure was generated in SNAP tool
version 2.1 (Johnson, Handsaker et al. 2008).
The genomic inflation factor compares the genome-wide distribution of the test statistic
to the expected null distribution (de Bakker, Ferreira et al. 2008). The genomic inflation
factor λ is defined as the ratio of the median of the empirically observed distribution of
the test statistic to the expected median, thereby quantifying excessive false positives
(Devlin and Roeder 1999). The genomic inflation factor for the GWAS was 1.2 across all
chromosomes and reduced to 0.99 when eQTLs within chromosome 6 were excluded. Q-
Q plots of HLA-DRB5 eQTLs both genome-wide and excluding chromosome 6 SNPs are
indicated in Figure 33. The results suggest that a large portion of the bias in the eQTL
seemed to localize within the major histocompatibility complex (MHC) on chromosome
6. The eQTL results were consistent with previous eQTL studies which demonstrated an
inflation of p-values in the HLA locus (Dixon, Liang et al. 2007).
To my knowledge this is the first report of rs9270986 significantly influencing
transcription levels of HLA-DRB5. According to the expression profiles, for individuals
59
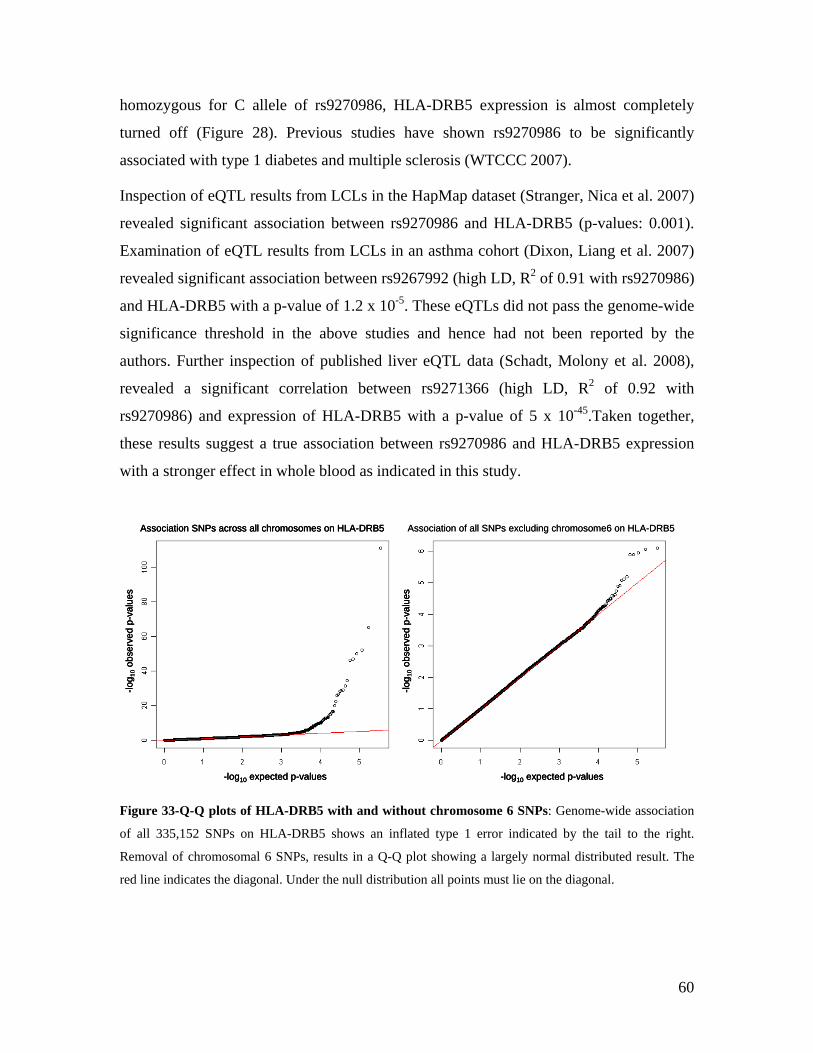
homozygous for C allele of rs9270986, HLA-DRB5 expression is almost completely
turned off (Figure 28). Previous studies have shown rs9270986 to be significantly
associated with type 1 diabetes and multiple sclerosis (WTCCC 2007).
Inspection of eQTL results from LCLs in the HapMap dataset (Stranger, Nica et al. 2007)
revealed significant association between rs9270986 and HLA-DRB5 (p-values: 0.001).
Examination of eQTL results from LCLs in an asthma cohort (Dixon, Liang et al. 2007)
revealed significant association between rs9267992 (high LD, R2 of 0.91 with rs9270986)
and HLA-DRB5 with a p-value of 1.2 x 10⁻⁵. These eQTLs did not pass the genome-wide
significance threshold in the above studies and hence had not been reported by the
authors. Further inspection of published liver eQTL data (Schadt, Molony et al. 2008),
revealed a significant correlation between rs9271366 (high LD, R2 of 0.92 with
rs9270986) and expression of HLA-DRB5 with a p-value of 5 x 10-45.Taken together,
these results suggest a true association between rs9270986 and HLA-DRB5 expression
with a stronger effect in whole blood as indicated in this study.
-log10 expected p-values
-log 1
0ob
serv
ed p
-val
ues
-log10 expected p-values
-log 1
0ob
serv
ed p
-val
ues
Association SNPs across all chromosomes on HLA-DRB5 Association of all SNPs excluding chromosome6 on HLA-DRB5
-log10 expected p-values
-log 1
0ob
serv
ed p
-val
ues
-log10 expected p-values
-log 1
0ob
serv
ed p
-val
ues
Association SNPs across all chromosomes on HLA-DRB5
-log10 expected p-values
-log 1
0ob
serv
ed p
-val
ues
-log10 expected p-values
-log 1
0ob
serv
ed p
-val
ues
Association SNPs across all chromosomes on HLA-DRB5 Association of all SNPs excluding chromosome6 on HLA-DRB5
Figure 33-Q-Q plots of HLA-DRB5 with and without chromosome 6 SNPs: Genome-wide association
of all 335,152 SNPs on HLA-DRB5 shows an inflated type 1 error indicated by the tail to the right.
Removal of chromosomal 6 SNPs, results in a Q-Q plot showing a largely normal distributed result. The
red line indicates the diagonal. Under the null distribution all points must lie on the diagonal.
60
A further method of validating the eQTLs identified in this study was to replicate these
findings in another population and another tissue. Since the expression data generated in
this study was from German individuals, the eQTL results were compared to the LCL
expression from 90 Caucasians belonging to the HapMap to avoid population biases
(Stranger, Nica et al. 2007) .
The filter criteria, cis-window, multiple testing correction and Illumina microarray
versions used in both experiments differed therefore a direct comparison of the published
data was not possible. For the HapMap dataset, the authors had analyzed eQTLs for
13647 transcripts which were found to be highly variable between the 4 HapMap
populations in a previous study (Stranger, Forrest et al. 2005). For cis SNPs, the authors
had selected a threshold of +/- 1Mb from the center of the probe. The results had been
corrected for multiple testing based on a 0.001 permutation threshold in the HapMap.
Finally, the HapMap used an older version of the Illumina Sentrix WG6 v1 microarray
(Stranger, Forrest et al. 2005). Since the overlap between the filtered transcripts in KORA
and HapMap was less than 50%, I decided to perform the same analysis using both
KORA and HapMap datasets.
All tests were performed using linear regression and Bonferroni correction. Details of the
comparisons between KORA and HapMap eQTLs are given in Table 16.
Overall, 119 cis eQTLs and 12 trans eQTLs were common between the two datasets. For
the common eQTLs, the direction of effect was checked for all the overlapping eQTLs
and was found to be the same in both the KORA and HapMap datasets for all except 7
transcripts (Supplementary Figure 1). For 5 of these 7 transcripts the difference in the
direction of the SNP effect on gene expression could be explained by either the difference
in DNA strand orientation or the frequency of the major allele in the dataset. For the
remaining 2 eQTLs, the difference in SNP effect on expression were attributable to
tissue-specific regulatory variation as has been observed in previous reports (Heap,
Trynka et al. 2009). Details of the comparisons of direction of effect for these 7
transcripts are provided in Supplementary Table 1.
61
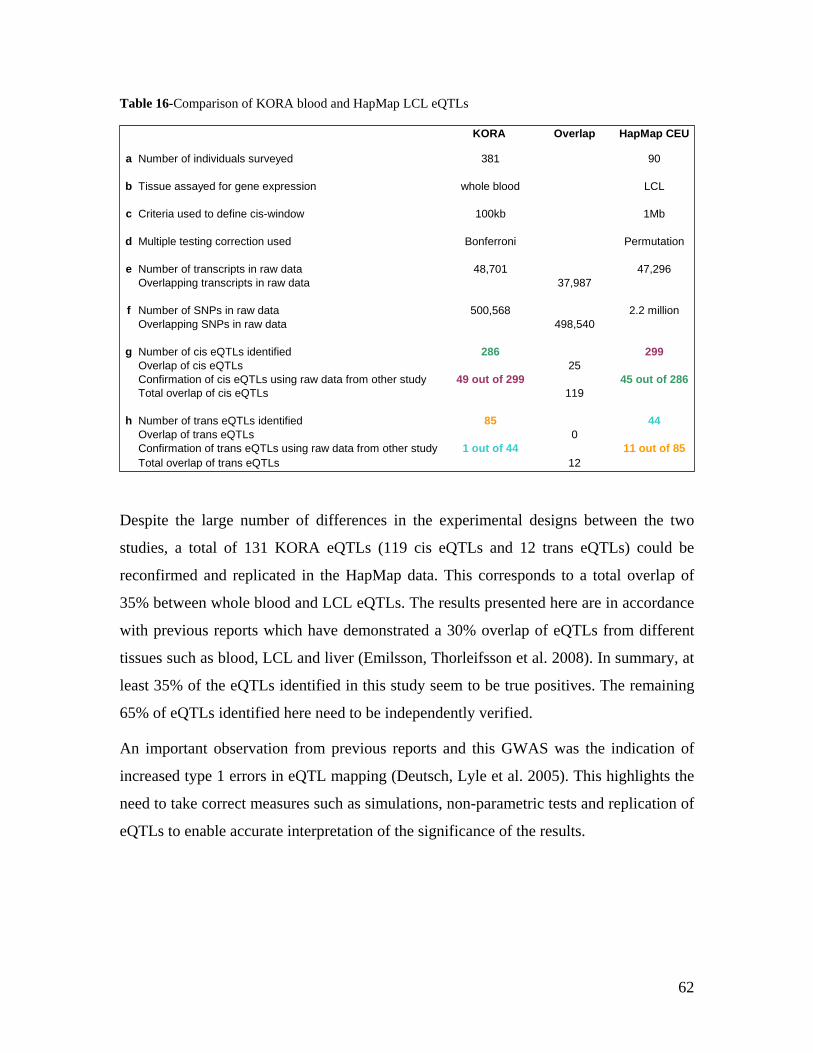
Table 16-Comparison of KORA blood and HapMap LCL eQTLs
KORA Overlap HapMap CEU
a Number of individuals surveyed 381 90
b Tissue assayed for gene expression whole blood LCL
c Criteria used to define cis-window 100kb 1Mb
d Multiple testing correction used Bonferroni Permutation
e Number of transcripts in raw data 48,701 47,296Overlapping transcripts in raw data 37,987
f Number of SNPs in raw data 500,568 2.2 millionOverlapping SNPs in raw data 498,540
g Number of cis eQTLs identified 286 299Overlap of cis eQTLs 25Confirmation of cis eQTLs using raw data from other study 49 out of 299 45 out of 286Total overlap of cis eQTLs 119
h Number of trans eQTLs identified 85 44Overlap of trans eQTLs 0Confirmation of trans eQTLs using raw data from other study 1 out of 44 11 out of 85Total overlap of trans eQTLs 12
Despite the large number of differences in the experimental designs between the two
studies, a total of 131 KORA eQTLs (119 cis eQTLs and 12 trans eQTLs) could be
reconfirmed and replicated in the HapMap data. This corresponds to a total overlap of
35% between whole blood and LCL eQTLs. The results presented here are in accordance
with previous reports which have demonstrated a 30% overlap of eQTLs from different
tissues such as blood, LCL and liver (Emilsson, Thorleifsson et al. 2008). In summary, at
least 35% of the eQTLs identified in this study seem to be true positives. The remaining
65% of eQTLs identified here need to be independently verified.
An important observation from previous reports and this GWAS was the indication of
increased type 1 errors in eQTL mapping (Deutsch, Lyle et al. 2005). This highlights the
need to take correct measures such as simulations, non-parametric tests and replication of
eQTLs to enable accurate interpretation of the significance of the results.
62
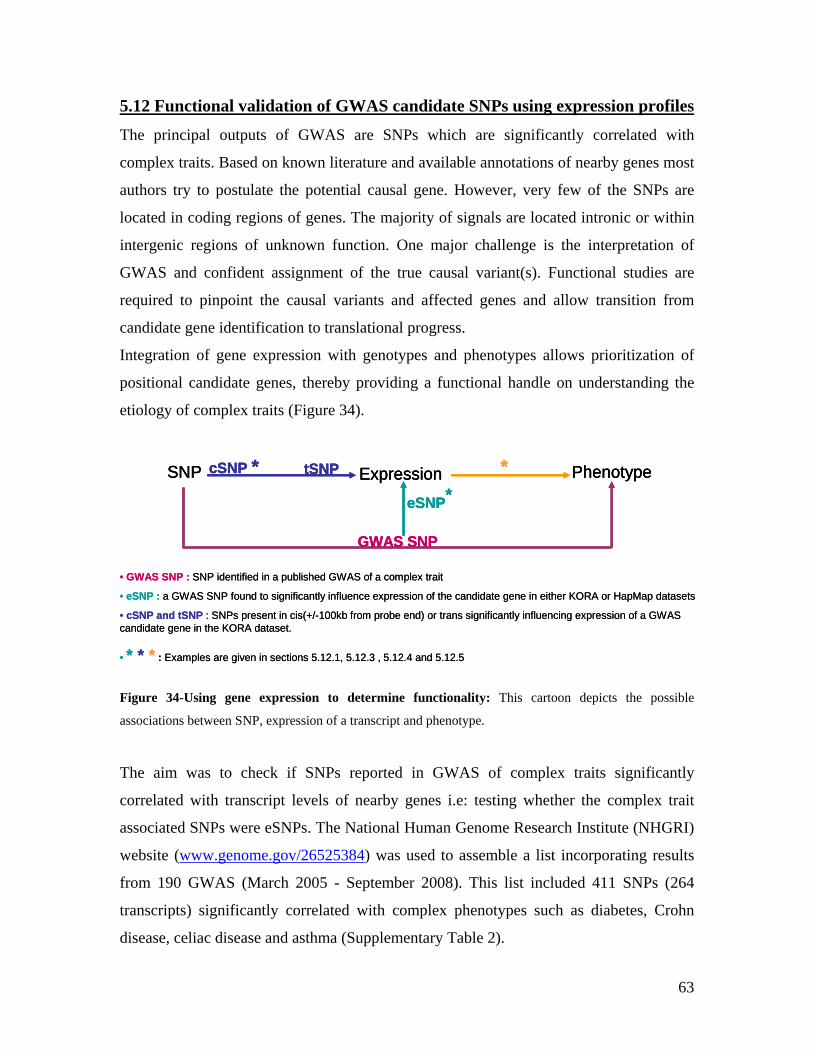
5.12 Functional validation of GWAS candidate SNPs using expression profiles
The principal outputs of GWAS are SNPs which are significantly correlated with
complex traits. Based on known literature and available annotations of nearby genes most
authors try to postulate the potential causal gene. However, very few of the SNPs are
located in coding regions of genes. The majority of signals are located intronic or within
intergenic regions of unknown function. One major challenge is the interpretation of
GWAS and confident assignment of the true causal variant(s). Functional studies are
required to pinpoint the causal variants and affected genes and allow transition from
candidate gene identification to translational progress.
Integration of gene expression with genotypes and phenotypes allows prioritization of
positional candidate genes, thereby providing a functional handle on understanding the
etiology of complex traits (Figure 34).
• GWAS SNP : SNP identified in a published GWAS of a complex trait
• eSNP : a GWAS SNP found to significantly influence expression of the candidate gene in either KORA or HapMap datasets
• cSNP and tSNP : SNPs present in cis(+/-100kb from probe end) or trans significantly influencing expression of a GWAS candidate gene in the KORA dataset.
• * * * : Examples are given in sections 5.12.1, 5.12.3 , 5.12.4 and 5.12.5
SNP PhenotypeExpression
GWAS SNP
eSNP*cSNP * tSNP *
• GWAS SNP : SNP identified in a published GWAS of a complex trait
• eSNP : a GWAS SNP found to significantly influence expression of the candidate gene in either KORA or HapMap datasets
• cSNP and tSNP : SNPs present in cis(+/-100kb from probe end) or trans significantly influencing expression of a GWAS candidate gene in the KORA dataset.
• * * * : Examples are given in sections 5.12.1, 5.12.3 , 5.12.4 and 5.12.5
SNP PhenotypeExpression
GWAS SNP
eSNP*cSNP * tSNP *SNP PhenotypeExpression
GWAS SNP
eSNP*cSNP * tSNP *
Figure 34-Using gene expression to determine functionality: This cartoon depicts the possible
associations between SNP, expression of a transcript and phenotype.
The aim was to check if SNPs reported in GWAS of complex traits significantly
correlated with transcript levels of nearby genes i.e: testing whether the complex trait
associated SNPs were eSNPs. The National Human Genome Research Institute (NHGRI)
website (www.genome.gov/26525384) was used to assemble a list incorporating results
from 190 GWAS (March 2005 - September 2008). This list included 411 SNPs (264
transcripts) significantly correlated with complex phenotypes such as diabetes, Crohn
disease, celiac disease and asthma (Supplementary Table 2).
63
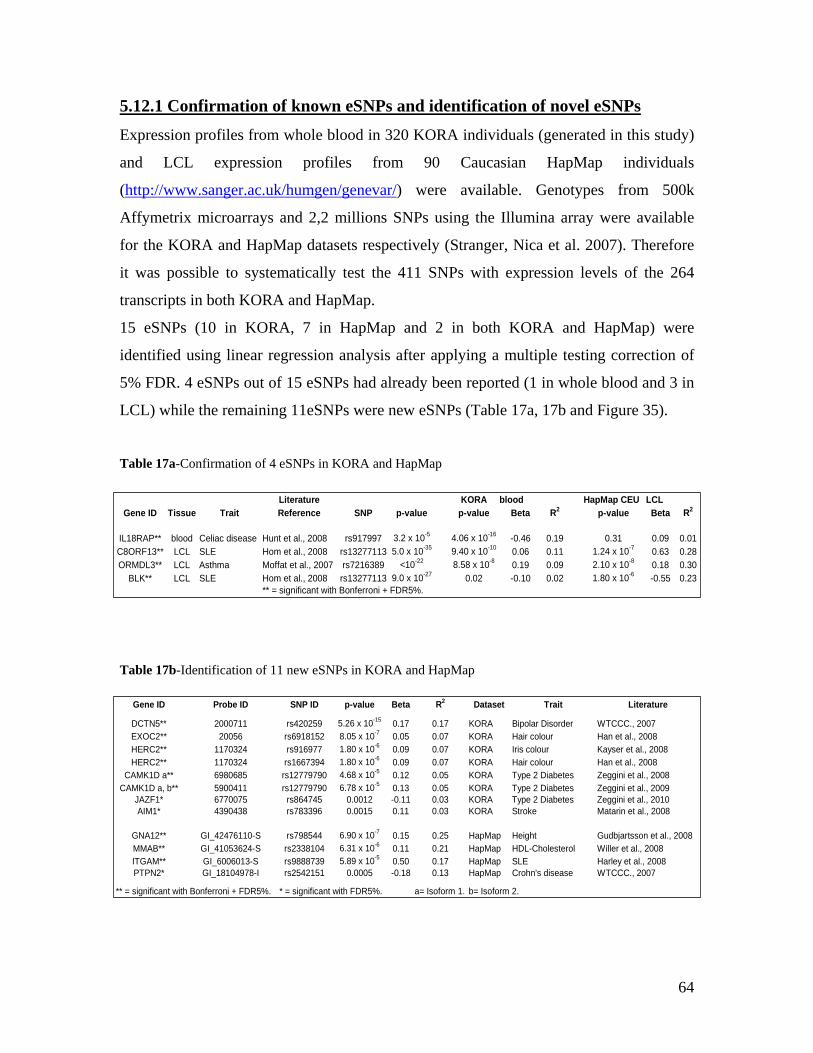
5.12.1 Confirmation of known eSNPs and identification of novel eSNPs
Expression profiles from whole blood in 320 KORA individuals (generated in this study)
and LCL expression profiles from 90 Caucasian HapMap individuals
(http://www.sanger.ac.uk/humgen/genevar/) were available. Genotypes from 500k
Affymetrix microarrays and 2,2 millions SNPs using the Illumina array were available
for the KORA and HapMap datasets respectively (Stranger, Nica et al. 2007). Therefore
it was possible to systematically test the 411 SNPs with expression levels of the 264
transcripts in both KORA and HapMap.
15 eSNPs (10 in KORA, 7 in HapMap and 2 in both KORA and HapMap) were
identified using linear regression analysis after applying a multiple testing correction of
5% FDR. 4 eSNPs out of 15 eSNPs had already been reported (1 in whole blood and 3 in
LCL) while the remaining 11eSNPs were new eSNPs (Table 17a, 17b and Figure 35).
Table 17a-Confirmation of 4 eSNPs in KORA and HapMap
Literature KORA bloodGene ID Tissue Trait Reference SNP p-value p-value Beta R2
IL18RAP** blood Celiac disease Hunt et al., 2008 rs917997 3.2 x 10⁻⁵ 4.06 x 10⁻¹⁶ -0.46 0.19C8ORF13** LCL SLE Hom et al., 2008 rs13277113 5.0 x 10⁻³⁵ 9.40 x 10⁻¹⁰ 0.06 0.11ORMDL3** LCL Asthma Moffat et al., 2007 rs7216389 <10-22 8.58 x 10⁻⁸ 0.19 0.09
BLK** LCL SLE Hom et al., 2008 rs13277113 9.0 x 10⁻²⁷ 0.02 -0.10 0.02** = significant with Bonferroni + FDR5%.
HapMap CEU LCLp-value Beta R2
0.31 0.09 0.011.24 x 10-7 0.63 0.282.10 x 10-8 0.18 0.301.80 x 10-6 -0.55 0.23
Table 17b-Identification of 11 new eSNPs in KORA and HapMap
Gene ID Probe ID SNP ID p-value Beta R2 Dataset Trait Literature
DCTN5** 2000711 rs420259 5.26 x 10⁻¹⁵ 0.17 0.17 KORA Bipolar Disorder WTCCC., 2007EXOC2** 20056 rs6918152 8.05 x 10⁻⁷ 0.05 0.07 KORA Hair colour Han et al., 2008HERC2** 1170324 rs916977 1.80 x 10⁻⁶ 0.09 0.07 KORA Iris colour Kayser et al., 2008HERC2** 1170324 rs1667394 1.80 x 10⁻⁶ 0.09 0.07 KORA Hair colour Han et al., 2008
CAMK1D a** 6980685 rs12779790 4.68 x 10⁻⁵ 0.12 0.05 KORA Type 2 Diabetes Zeggini et al., 2008CAMK1D a, b** 5900411 rs12779790 6.78 x 10⁻⁵ 0.13 0.05 KORA Type 2 Diabetes Zeggini et al., 2009
JAZF1* 6770075 rs864745 0.0012 -0.11 0.03 KORA Type 2 Diabetes Zeggini et al., 2010AIM1* 4390438 rs783396 0.0015 0.11 0.03 KORA Stroke Matarin et al., 2008
GNA12** GI_42476110-S rs798544 6.90 x 10⁻⁷ 0.15 0.25 HapMap Height Gudbjartsson et al., 2008MMAB** GI_41053624-S rs2338104 6.31 x 10⁻⁶ 0.11 0.21 HapMap HDL-Cholesterol Willer et al., 2008ITGAM** GI_6006013-S rs9888739 5.89 x 10⁻⁵ 0.50 0.17 HapMap SLE Harley et al., 2008PTPN2* GI_18104978-I rs2542151 0.0005 -0.18 0.13 HapMap Crohn's disease WTCCC., 2007
** = significant with Bonferroni + FDR5%. * = significant with FDR5%. a= Isoform 1. b= Isoform 2.
64
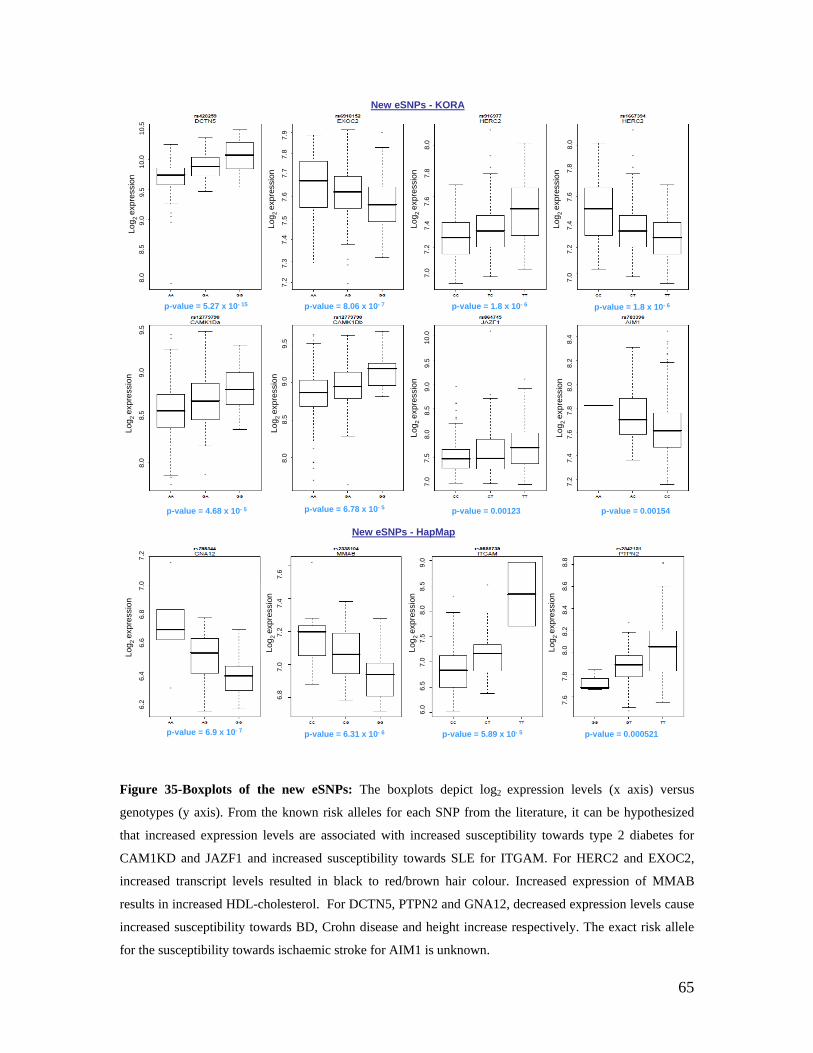
New eSNPs - KORA
p-value = 5.27 x 10- 15 p-value = 8.06 x 10- 7 p-value = 1.8 x 10- 6 p-value = 1.8 x 10- 6
p-value = 4.68 x 10- 5 p-value = 6.78 x 10- 5 p-value = 0.00123 p-value = 0.00154
8.0
8.5
9.0
9.5
8.0
8.5
9.0
9.5
7.0
7.5
8.0
8.5
10.0
7.3
9.0
9.5
7.2
7.4
7.6
7.8
8.4
8.0
8.2
8.0
8.5
9.0
9.5
10.0
10.5
7.2
7.4
7.6
7.8
7.5
7.7
7.9
7.2
7.4
7.6
7.8
7.0
8.0
7.2
7.4
7.6
7.8
7.0
8.0
Log 2
exp
ress
ion
Log 2
exp
ress
ion
Log 2
exp
ress
ion
Log 2
exp
ress
ion
Log 2
exp
ress
ion
Log 2
exp
ress
ion
Log 2
exp
ress
ion
Log 2
exp
ress
ion
New eSNPs - HapMap
p-value = 0.000521p-value = 6.9 x 10- 7 p-value = 6.31 x 10- 6 p-value = 5.89 x 10- 5
6.2
6.4
6.6
6.8
7.0
7.2
6.8
7.0
7.2
7.4
7.6
6.0
6.5
7.0
7.5
8.0
8.5
9.0
8.0
7.8
8.2
8.4
8.6
7.6
8.8
Log 2
exp
ress
ion
Log 2
exp
ress
ion
Log 2
exp
ress
ion
Log 2
exp
ress
ion
New eSNPs - KORA
p-value = 5.27 x 10- 15 p-value = 8.06 x 10- 7 p-value = 1.8 x 10- 6 p-value = 1.8 x 10- 6
p-value = 4.68 x 10- 5 p-value = 6.78 x 10- 5 p-value = 0.00123 p-value = 0.00154
8.0
8.5
9.0
9.5
8.0
8.5
9.0
9.5
7.0
7.5
8.0
8.5
10.0
7.3
9.0
9.5
7.2
7.4
7.6
7.8
8.4
8.0
8.2
8.0
8.5
9.0
9.5
10.0
10.5
7.2
7.4
7.6
7.8
7.5
7.7
7.9
7.2
7.4
7.6
7.8
7.0
8.0
7.2
7.4
7.6
7.8
7.0
8.0
Log 2
exp
ress
ion
Log 2
exp
ress
ion
Log 2
exp
ress
ion
Log 2
exp
ress
ion
Log 2
exp
ress
ion
Log 2
exp
ress
ion
Log 2
exp
ress
ion
Log 2
exp
ress
ion
New eSNPs - HapMap
p-value = 0.000521p-value = 6.9 x 10- 7 p-value = 6.31 x 10- 6 p-value = 5.89 x 10- 5
6.2
6.4
6.6
6.8
7.0
7.2
6.2
6.4
6.6
6.8
7.0
7.2
6.8
7.0
7.2
7.4
7.6
6.0
6.5
7.0
7.5
8.0
8.5
9.0
8.0
7.8
8.2
8.4
8.6
7.6
8.8
Log 2
exp
ress
ion
Log 2
exp
ress
ion
Log 2
exp
ress
ion
Log 2
exp
ress
ion
Figure 35-Boxplots of the new eSNPs: The boxplots depict log2 expression levels (x axis) versus
genotypes (y axis). From the known risk alleles for each SNP from the literature, it can be hypothesized
that increased expression levels are associated with increased susceptibility towards type 2 diabetes for
CAM1KD and JAZF1 and increased susceptibility towards SLE for ITGAM. For HERC2 and EXOC2,
increased transcript levels resulted in black to red/brown hair colour. Increased expression of MMAB
results in increased HDL-cholesterol. For DCTN5, PTPN2 and GNA12, decreased expression levels cause
increased susceptibility towards BD, Crohn disease and height increase respectively. The exact risk allele
for the susceptibility towards ischaemic stroke for AIM1 is unknown.
65
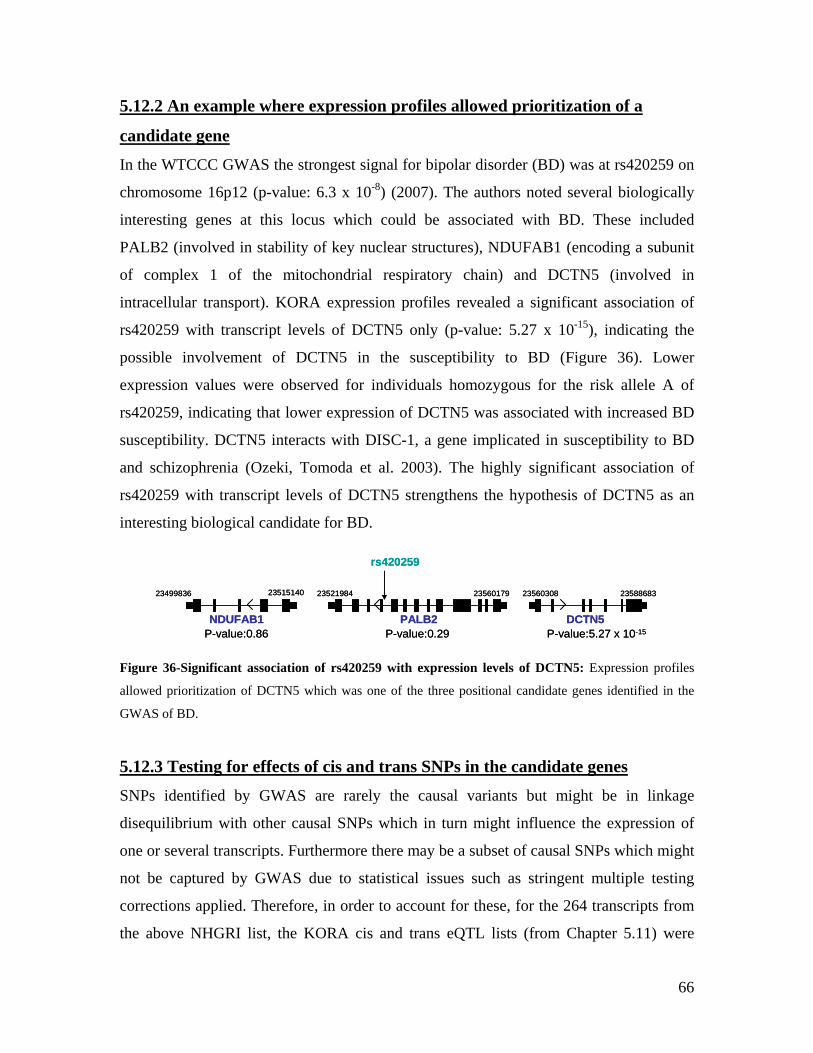
5.12.2 An example where expression profiles allowed prioritization of a
candidate gene
In the WTCCC GWAS the strongest signal for bipolar disorder (BD) was at rs420259 on
chromosome 16p12 (p-value: 6.3 x 10⁻⁸) (2007). The authors noted several biologically
interesting genes at this locus which could be associated with BD. These included
PALB2 (involved in stability of key nuclear structures), NDUFAB1 (encoding a subunit
of complex 1 of the mitochondrial respiratory chain) and DCTN5 (involved in
intracellular transport). KORA expression profiles revealed a significant association of
rs420259 with transcript levels of DCTN5 only (p-value: 5.27 x 10⁻¹⁵), indicating the
possible involvement of DCTN5 in the susceptibility to BD (Figure 36). Lower
expression values were observed for individuals homozygous for the risk allele A of
rs420259, indicating that lower expression of DCTN5 was associated with increased BD
susceptibility. DCTN5 interacts with DISC-1, a gene implicated in susceptibility to BD
and schizophrenia (Ozeki, Tomoda et al. 2003). The highly significant association of
rs420259 with transcript levels of DCTN5 strengthens the hypothesis of DCTN5 as an
interesting biological candidate for BD.
PALB2AB1 DCTN5NDUF
rs420259
P-valu
23499836
e:0.86 P-value:0.29 P-value:5.27 x 10⁻¹⁵
23560308 23588683235601792352198423515140
PALB2AB1 DCTN5NDUF
rs420259
P-valu
23499836
e:0.86 P-value:0.29 P-value:5.27 x 10⁻¹⁵
23560308 23588683235601792352198423515140
Figure 36-Significant association of rs420259 with expression levels of DCTN5: Expression profiles
allowed prioritization of DCTN5 which was one of the three positional candidate genes identified in the
GWAS of BD.
5.12.3 Testing for effects of cis and trans SNPs in the candidate genes
SNPs identified by GWAS are rarely the causal variants but might be in linkage
disequilibrium with other causal SNPs which in turn might influence the expression of
one or several transcripts. Furthermore there may be a subset of causal SNPs which might
not be captured by GWAS due to statistical issues such as stringent multiple testing
corrections applied. Therefore, in order to account for these, for the 264 transcripts from
the above NHGRI list, the KORA cis and trans eQTL lists (from Chapter 5.11) were
66
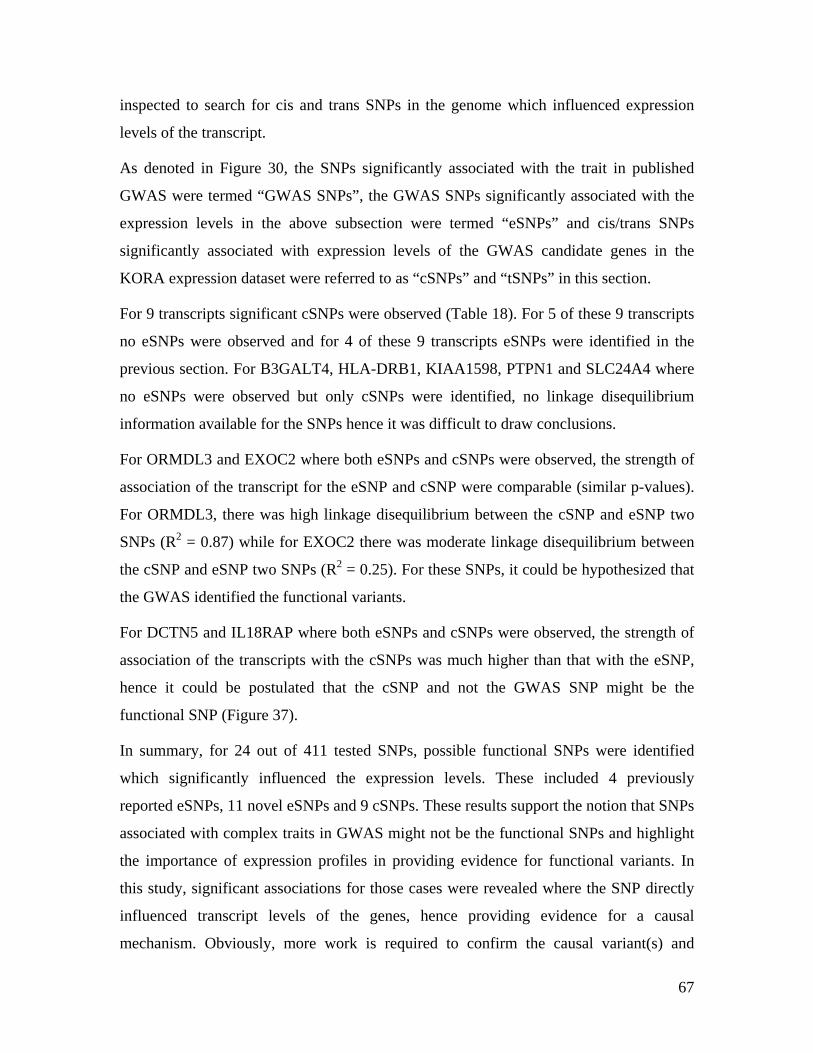
inspected to search for cis and trans SNPs in the genome which influenced expression
levels of the transcript.
As denoted in Figure 30, the SNPs significantly associated with the trait in published
GWAS were termed “GWAS SNPs”, the GWAS SNPs significantly associated with the
expression levels in the above subsection were termed “eSNPs” and cis/trans SNPs
significantly associated with expression levels of the GWAS candidate genes in the
KORA expression dataset were referred to as “cSNPs” and “tSNPs” in this section.
For 9 transcripts significant cSNPs were observed (Table 18). For 5 of these 9 transcripts
no eSNPs were observed and for 4 of these 9 transcripts eSNPs were identified in the
previous section. For B3GALT4, HLA-DRB1, KIAA1598, PTPN1 and SLC24A4 where
no eSNPs were observed but only cSNPs were identified, no linkage disequilibrium
information available for the SNPs hence it was difficult to draw conclusions.
For ORMDL3 and EXOC2 where both eSNPs and cSNPs were observed, the strength of
association of the transcript for the eSNP and cSNP were comparable (similar p-values).
For ORMDL3, there was high linkage disequilibrium between the cSNP and eSNP two
SNPs (R2 = 0.87) while for EXOC2 there was moderate linkage disequilibrium between
the cSNP and eSNP two SNPs (R2 = 0.25). For these SNPs, it could be hypothesized that
the GWAS identified the functional variants.
For DCTN5 and IL18RAP where both eSNPs and cSNPs were observed, the strength of
association of the transcripts with the cSNPs was much higher than that with the eSNP,
hence it could be postulated that the cSNP and not the GWAS SNP might be the
functional SNP (Figure 37).
In summary, for 24 out of 411 tested SNPs, possible functional SNPs were identified
which significantly influenced the expression levels. These included 4 previously
reported eSNPs, 11 novel eSNPs and 9 cSNPs. These results support the notion that SNPs
associated with complex traits in GWAS might not be the functional SNPs and highlight
the importance of expression profiles in providing evidence for functional variants. In
this study, significant associations for those cases were revealed where the SNP directly
influenced transcript levels of the genes, hence providing evidence for a causal
mechanism. Obviously, more work is required to confirm the causal variant(s) and
67
gene(s) at each observed loci, but it is nevertheless informative to provide evidence on
some of the likely functional candidate genes.
Table 18-Examples where expression profiles revealed cis SNPs to be significantly associated with
transcript levels of GWAS candidate genes
Transcript cis SNP KORA cisSNP P-value GWAS SNP KORA eSNP P-value LD, R2 Complex trait Reference
l Willer et al, 2008thritis Behrens et al, 2008
Larson et al, 2007WTCCC, 2007
Sulem et al, 2007
Moffat et al, 2007Han et al, 2008
WTCCC, 2007Hunt et al, 2008
B3GALT4 rs462618 6.5 x 10 -15 rs2254287 >0.05 0.02 LDL cholesteroHLA-DRB1 rs9272723 2.7 x 10 -39 rs2395148 >0.05 0 Juvenile arKIAA1598 rs11598817 5.9 x 10 -8 rs4776472 >0.05 0 Heart failure
PTPN1 rs4602269 1.3 x 10 -7 rs17696736 >0.05 0 Type 1 diabetesSLC24A4 rs4900132 3.4 x 10 -7 rs4904868 >0.05 0 Pigmentation
ORMDL3 rs869402 6.8 x 10 -8 rs7216389 8.5 x 10 -8 0.87 AsthmaEXOC2 rs6918152 4.3 x 10 -7 rs6918152 8 x 10 -7 0.25 Hair colour
DCTN5 rs35635 9.2 x 10 -23 rs420259 5.2 x 10 -15 0.64 Bipolar disorderIL18RAP rs4851004 7.9 x 10 -22 rs917997 4 x 10 -16 0.29 Celiac disease
IL18RAPIL18R1
13kb26kbrs917997rs48510048 x 10-22 1.8 x 10⁻⁶
* *
Another cis SNP rs35635 was found to be significantly
associated with transcript levels of DCTN5DCTN5ALB2 PLK1P
37kb28kbrs35635rs4202595.2 x 10-10 9.2 x 10⁻²³
Another cis SNP rs4851004 was found to be significantly
associated with transcript levels of IL18RAP
* *
IL18RAPIL R118
13kb26kbrs917997rs48510048 x 10-22 1.8 x 10⁻⁶
* *IL18RAPIL R118
13kb26kbrs917997rs48510048 x 10-22 1.8 x 10⁻⁶
* *
Another cis SNP rs35635 was found to be significantly
associated with transcript levels of DCTN5DCTN5ALB2 PLK1P
37kb28kbrs35635rs4202595.2 x 10-10 9.2 x 10⁻²³
Another cis SNP rs4851004 was found to be significantly
associated with transcript levels of IL18RAP
* *
Another cis SNP rs35635 was found to be significantly
associated with transcript levels of DCTN5DCTN5ALB2 PLK1
37kb28kbrs35635rs4202595.2 x 10-10 9.2 x 10⁻²³
P * *DCTN5ALB2 PLK1P
37kb28kbrs35635rs4202595.2 x 10-10 9.2 x 10⁻²³
Another cis SNP rs4851004 was found to be significantly
associated with transcript levels of IL18RAP
* *
Figure 37-Examples where expression profiles uncovered possible functional variants unidentified by
GWAS: Cis SNPs in the vicinity of the GWAS SNP were found to be significantly correlated with
expression levels of DCTN5 and IL18RAP.
68
5.13 Use of gene expression to functionally validate GWAS candidate genes
Gene expression data can be used for functional validation of candidate genes identified
in GWAS. In this context, the genome-wide expression profiles generated from the
KORA individuals in this study helped to validate two candidate genes identified in
independent GWAS for uric acid and mean platelet volume.
5.13.1 Functional validation of SLC2A9 influencing uric acid concentrations
A GWAS had been carried out in 1,644 individuals from the KORA F3 population.
335,152 high quality Affymetrix SNPs had been tested for associations with uric acid
levels. A quantitative trait locus in a 500-kb region with high linkage disequilibrium had
been identified, consisting of 40 autosomal SNPs. 26 of 40 significant SNPs (p-value<1.5
x 10-7) mapped within the transporter gene SLC2A9. The strongest signals had been
observed for SNPs in introns 4 and 6 of SLC2A9 (p-values: 3.39x 10⁻¹¹ and 1.62 x 10⁻¹²).
Sequencing of all exons in 48 male and 48 female samples selected equally from the
extremes of the serum uric acid distribution had resulted in the detection of two
synonymous changes in exons 2 and 8 and two missense variants in exons 6 and 8.
To investigate the transcript levels of SLC2A isoforms in blood relative to serum uric
acid concentrations, I analyzed genome-wide expression profiles from a subgroup of 117
KORA samples available then. It is known that alternative splicing of SLC2A9 results in
two isoforms, each with differential targeting and tissue specificity.
Five probes present on the Illumina Sentrix WG6-v2 microarray were examined: two
recognizing the two distinct isoforms of SLC2A9, one recognizing both isoforms, and
two corresponding to the neighboring genes DRD5 and WDR1. The sample size was too
small to show a significant genetic effect of SLC2A9 SNPs on intensity of transcription
signals. However, the probe hybridizing to the SLC2A9 isoform 2 transcript showed a
significant association with uric acid concentrations (Figure 38).
The uric acid variance explained by SLC2A9 expression levels was about 8% for isoform
2. For the isoform 2 of SLC2A9, gender-specific analyses showed a stronger association
in women (p-value: 0.005; effect: 6.813) compared to men (p-value: 0.151; effect: 3.490).
69
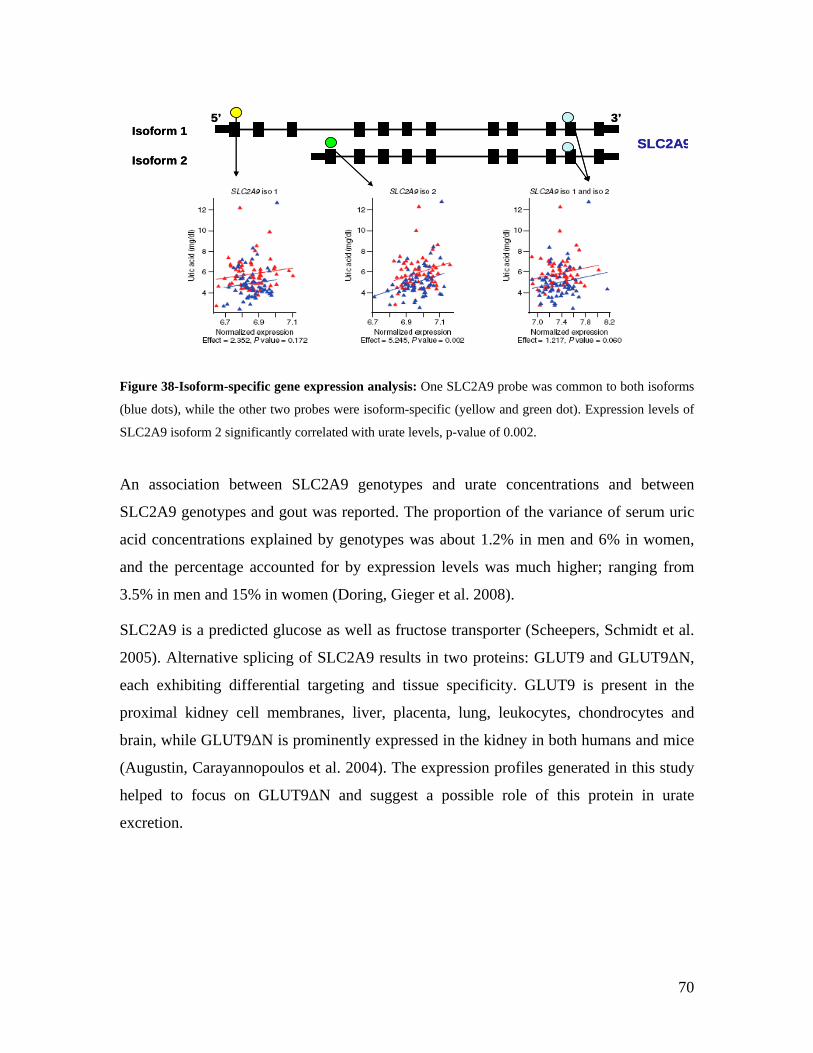
3’5’
SLC2A9Isoform 1
Isoform 2
3’5’
SLC2AIsoform 1
Isoform 29
Figure 38-Isoform-specific gene expression analysis: One SLC2A9 probe was common to both isoforms
(blue dots), while the other two probes were isoform-specific (yellow and green dot). Expression levels of
SLC2A9 isoform 2 significantly correlated with urate levels, p-value of 0.002.
An association between SLC2A9 genotypes and urate concentrations and between
SLC2A9 genotypes and gout was reported. The proportion of the variance of serum uric
acid concentrations explained by genotypes was about 1.2% in men and 6% in women,
and the percentage accounted for by expression levels was much higher; ranging from
3.5% in men and 15% in women (Doring, Gieger et al. 2008).
SLC2A9 is a predicted glucose as well as fructose transporter (Scheepers, Schmidt et al.
2005). Alternative splicing of SLC2A9 results in two proteins: GLUT9 and GLUT9ΔN,
each exhibiting differential targeting and tissue specificity. GLUT9 is present in the
proximal kidney cell membranes, liver, placenta, lung, leukocytes, chondrocytes and
brain, while GLUT9ΔN is prominently expressed in the kidney in both humans and mice
(Augustin, Carayannopoulos et al. 2004). The expression profiles generated in this study
helped to focus on GLUT9ΔN and suggest a possible role of this protein in urate
excretion.
70
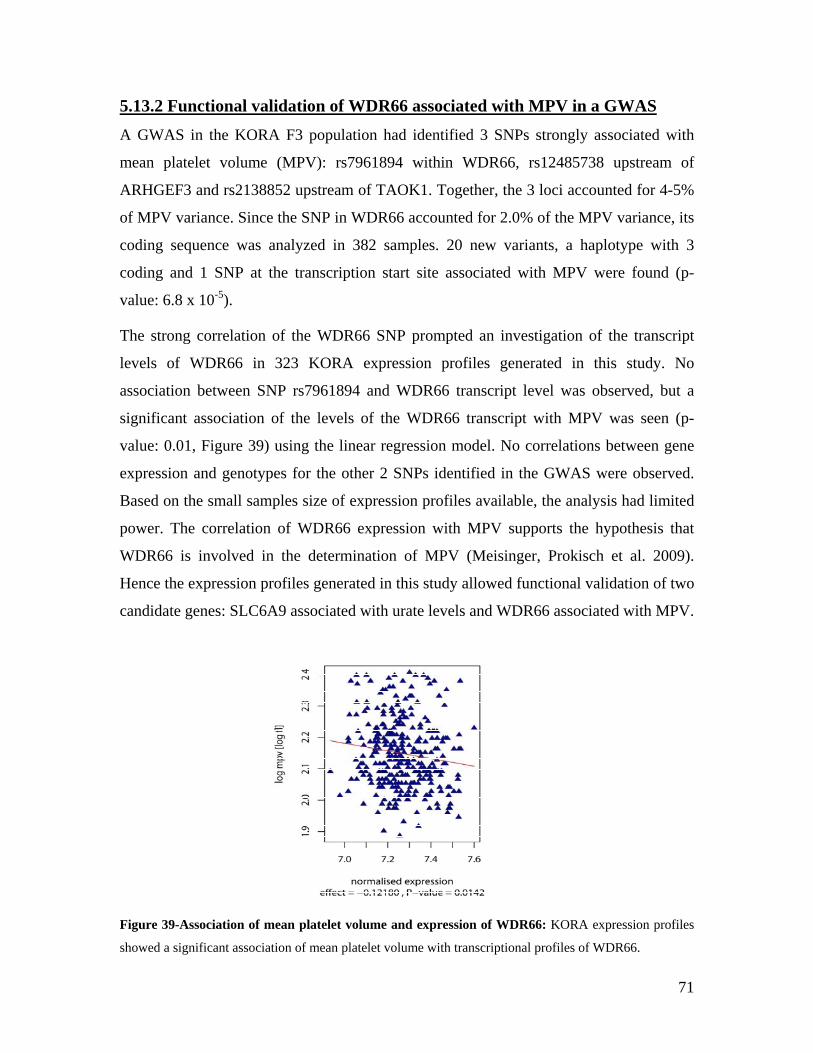
5.13.2 Functional validation of WDR66 associated with MPV in a GWAS
A GWAS in the KORA F3 population had identified 3 SNPs strongly associated with
mean platelet volume (MPV): rs7961894 within WDR66, rs12485738 upstream of
ARHGEF3 and rs2138852 upstream of TAOK1. Together, the 3 loci accounted for 4-5%
of MPV variance. Since the SNP in WDR66 accounted for 2.0% of the MPV variance, its
coding sequence was analyzed in 382 samples. 20 new variants, a haplotype with 3
coding and 1 SNP at the transcription start site associated with MPV were found (p-
value: 6.8 x 10⁻⁵).
The strong correlation of the WDR66 SNP prompted an investigation of the transcript
levels of WDR66 in 323 KORA expression profiles generated in this study. No
association between SNP rs7961894 and WDR66 transcript level was observed, but a
significant association of the levels of the WDR66 transcript with MPV was seen (p-
value: 0.01, Figure 39) using the linear regression model. No correlations between gene
expression and genotypes for the other 2 SNPs identified in the GWAS were observed.
Based on the small samples size of expression profiles available, the analysis had limited
power. The correlation of WDR66 expression with MPV supports the hypothesis that
WDR66 is involved in the determination of MPV (Meisinger, Prokisch et al. 2009).
Hence the expression profiles generated in this study allowed functional validation of two
candidate genes: SLC6A9 associated with urate levels and WDR66 associated with MPV.
Figure 39-Association of mean platelet volume and expression of WDR66: KORA expression profiles
showed a significant association of mean platelet volume with transcriptional profiles of WDR66.
71
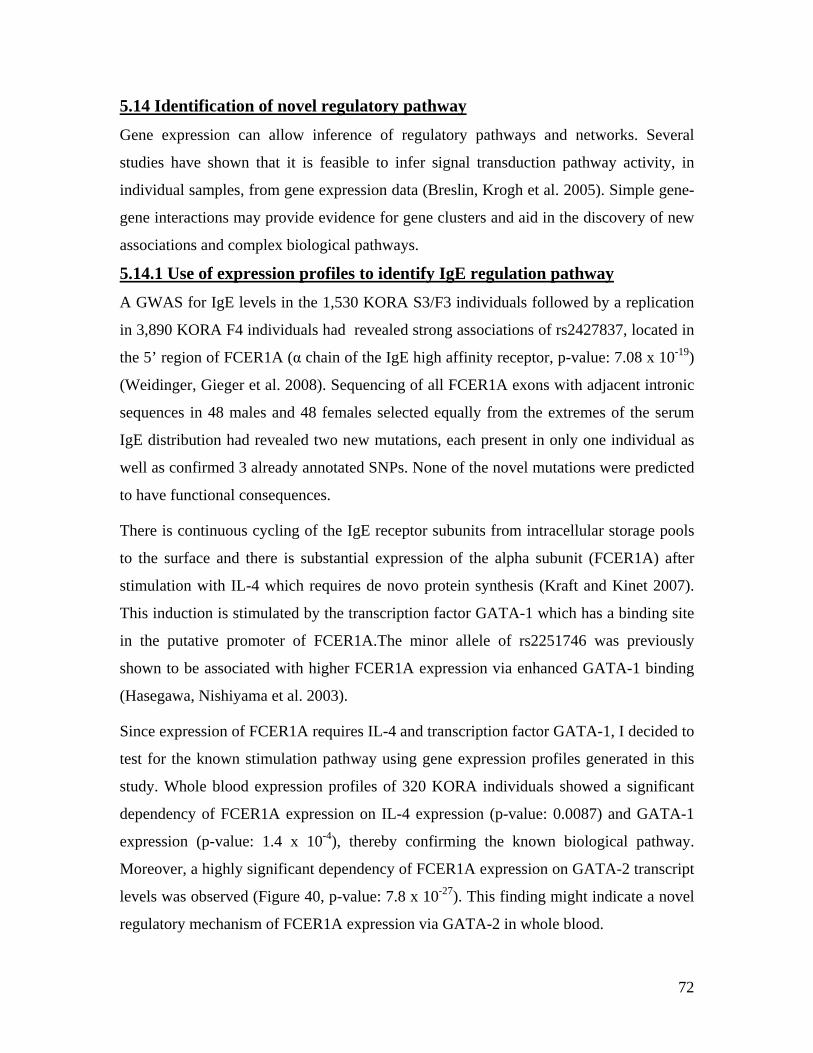
5.14 Identification of novel regulatory pathway
Gene expression can allow inference of regulatory pathways and networks. Several
studies have shown that it is feasible to infer signal transduction pathway activity, in
individual samples, from gene expression data (Breslin, Krogh et al. 2005). Simple gene-
gene interactions may provide evidence for gene clusters and aid in the discovery of new
associations and complex biological pathways.
5.14.1 Use of expression profiles to identify IgE regulation pathway
A GWAS for IgE levels in the 1,530 KORA S3/F3 individuals followed by a replication
in 3,890 KORA F4 individuals had revealed strong associations of rs2427837, located in
the 5’ region of FCER1A (α chain of the IgE high affinity receptor, p-value: 7.08 x 10⁻¹⁹)
(Weidinger, Gieger et al. 2008). Sequencing of all FCER1A exons with adjacent intronic
sequences in 48 males and 48 females selected equally from the extremes of the serum
IgE distribution had revealed two new mutations, each present in only one individual as
well as confirmed 3 already annotated SNPs. None of the novel mutations were predicted
to have functional consequences.
There is continuous cycling of the IgE receptor subunits from intracellular storage pools
to the surface and there is substantial expression of the alpha subunit (FCER1A) after
stimulation with IL-4 which requires de novo protein synthesis (Kraft and Kinet 2007).
This induction is stimulated by the transcription factor GATA-1 which has a binding site
in the putative promoter of FCER1A.The minor allele of rs2251746 was previously
shown to be associated with higher FCER1A expression via enhanced GATA-1 binding
(Hasegawa, Nishiyama et al. 2003).
Since expression of FCER1A requires IL-4 and transcription factor GATA-1, I decided to
test for the known stimulation pathway using gene expression profiles generated in this
study. Whole blood expression profiles of 320 KORA individuals showed a significant
dependency of FCER1A expression on IL-4 expression (p-value: 0.0087) and GATA-1
expression (p-value: 1.4 x 10⁻⁴), thereby confirming the known biological pathway.
Moreover, a highly significant dependency of FCER1A expression on GATA-2 transcript
levels was observed (Figure 40, p-value: 7.8 x 10⁻²⁷). This finding might indicate a novel
regulatory mechanism of FCER1A expression via GATA-2 in whole blood.
72
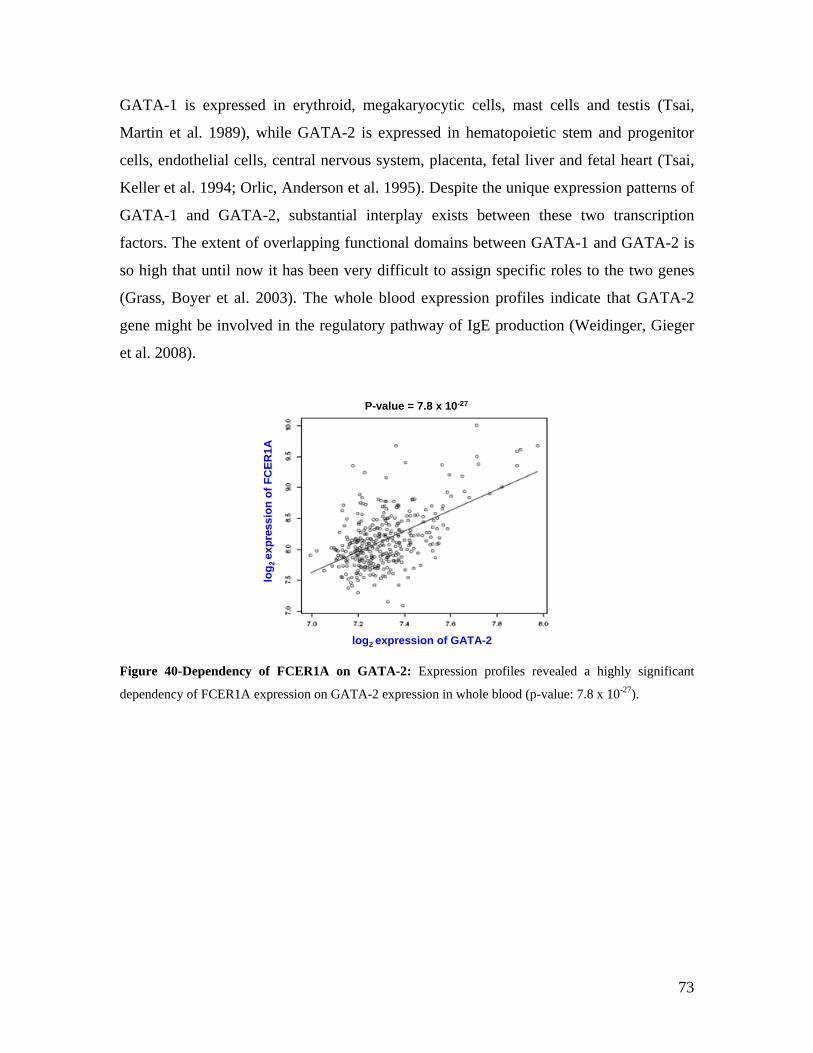
GATA-1 is expressed in erythroid, megakaryocytic cells, mast cells and testis (Tsai,
Martin et al. 1989), while GATA-2 is expressed in hematopoietic stem and progenitor
cells, endothelial cells, central nervous system, placenta, fetal liver and fetal heart (Tsai,
Keller et al. 1994; Orlic, Anderson et al. 1995). Despite the unique expression patterns of
GATA-1 and GATA-2, substantial interplay exists between these two transcription
factors. The extent of overlapping functional domains between GATA-1 and GATA-2 is
so high that until now it has been very difficult to assign specific roles to the two genes
(Grass, Boyer et al. 2003). The whole blood expression profiles indicate that GATA-2
gene might be involved in the regulatory pathway of IgE production (Weidinger, Gieger
et al. 2008).
log2 expression of GATA-2
log 2
exp
ress
ion
of F
CER
1A
P-value = 7.8 x 10⁻²⁷
log2 expression of GATA-2
log 2
exp
ress
ion
of F
CER
1A
P-value = 7.8 x 10⁻²⁷
Figure 40-Dependency of FCER1A on GATA-2: Expression profiles revealed a highly significant
dependency of FCER1A expression on GATA-2 expression in whole blood (p-value: 7.8 x 10⁻²⁷).
73
6.0 Discussion and conclusions
Natural variation in human gene expression has started to be explored only lately (Enard,
Khaitovich et al. 2002). There is experimental evidence that gene expression levels in
humans differ not only among diverse cell types within an individual but also between
different individuals (Schadt, Monks et al. 2003). This observation resulted in
investigation of gene expression as a quantitative phenotype. Genome-wide association
studies (GWAS) have identified polymorphic genetic variants influencing gene
expression levels (Morley, Molony et al. 2004). Most of the investigations of gene
expression in humans performed so far have focused primarily on lymphoblast cell lines
due to the limited availability of other cell types and tissues (Dermitzakis and Stranger
2006).
6.1 Advantages and disadvantages of using whole blood in transcriptomics
In this study genome-wide gene expression data was generated from whole blood. The
key reason for using peripheral blood (whole blood) as a marker to pursue “blood
transcriptomics” is that blood sampling is part of a routine physical examination and is
easily accessible. Peripheral blood cells are advantageous because they share more than
80% of the transcriptome with nine tissues including brain, colon, heart, kidney, liver,
lung, prostate, spleen and stomach (Liew, Ma et al. 2006). Blood cells function as
transporters and mediators of immune response and coagulation, making whole blood a
valuable resource for studying immune-related diseases. Furthermore, blood contacts and
interacts with all human tissues, conveying bioactive molecules ranging from oxygen,
nutrients, metabolites, cytokines and hormones (Mohr and Liew 2007).
The disadvantage of studying natural tissues such as whole blood is that they comprise of
a multitude of different cell types which might be present in varying ratios and
consequently result in a heterogeneous cell mixture. In general, gene expression assayed
in humans may be under the influence of external factors, thereby generating noisy data
which might interfere with results of genetic studies (Pritchard, Coil et al. 2006). The
central question of whole blood transcriptomics is to address the value of using a mixture
of cells versus a single cell type ((Dermitzakis and Stranger 2006; Goring, Curran et al.
2007).
74
In contrast to whole blood, lymphoblast cell lines (LCLs) have shown to be an accurate
representation of the in vivo state (Dermitzakis and Stranger 2006). The existence of a
single cell type reduces the range of factors influencing gene expression, thereby
increasing the power for genetic investigations (Dermitzakis and Stranger 2006; Goring,
Curran et al. 2007). The drawbacks of using LCLs are that gene expression in LCLs
represents Epstein Barr Virus (EBV) infection of B-cells, which might affect the
expression of some genes in an uncontrolled manner and influence certain biological
processes, biasing the outcome of the analysis (Liu, Walter et al. 2006). LCLs may also
exhibit extreme clonality with random patterns of monoallelic expression in single clones
(Plagnol, Uz et al. 2008).
These are the several advantages and disadvantages of using different tissues and cell
types for analysis of gene expression variation. The ultimate goal would to establish a
large, comprehensive public resource of gene expression patterns across different tissues
and across different human populations.
6.2 Establishment of the KORA gene expression dataset
In this study, genome-wide expression data from whole blood of 497 KORA individuals
was generated, resulting in 497 x 48,701 data points. Low levels of population
stratification in the KORA population have demonstrated it to be a valuable asset in
association studies of complex diseases as well as pharmaco-genetic studies (Steffens,
Lamina et al. 2006). In large datasets such as one established in this study, a major
concern is that small systemic differences are capable of obscuring true associations
being sought (WTCCC 2007). To ensure high quality gene expression data, quality
control checks such as use of the Illumina BEADSTUDIO control summary reports and
Bioanalyzer analysis of RNA integrity were applied to identify samples with low signal
intensities on the microarray and/or degraded input RNA. Of 497 samples analyzed at
start, 116 samples failing quality control filters were excluded from further analysis. The
high correlation between the biological and technical replicates (0.96-0.99) indicated high
reproducibility and robustness of the Illumina microarray procedures such as RNA
extraction, amplification and hybridization.
Globin mRNA constitutes a significant portion of whole blood (~70% of whole blood
mRNA). It has been suggested that globin mRNA might dilute messages from low
75
frequency cell populations such as lymphocytes and monocytes whilst masking other
gene expression profiles, subsequently resulting in loss of low abundance transcripts.
Affymetrix microarray platforms have incorporated the globin reduction step into their
protocol, while for the Illumina microarray platforms this question was not adequately
addressed. In this study, globin reduction was not carried out as the pilot experiment
showed that this procedure introduced artifacts which altered gene expression in a non-
systematic manner. Several studies confirmed these results and demonstrated that globin
reduction resulted in loss of reproducibility at the cost of a slight increase in sensitivity
(Liang, Li et al. 2006; Dumeaux, Borresen-Dale et al. 2008).
6.2.1 Use of the KORA dataset to measure variability of gene expression
Variation in transcript levels has been suggested to have a heritable component and can
be measured using techniques such as microarrays (Cheung, Jen et al. 2003). The extent
of this variation was investigated across the entire genome to identify genes whose
transcript levels greatly differed among individuals and genes whose expression was
stable among individuals. The overall variability across 13,701 transcripts in 381
individuals was low with a mean variance of 0.10 and median variance of 0.05 (ranging
between 0.005-4.6). For several of the highest variable genes such as the highly
polymorphic HLA-DRB1 locus and the Y-specific RPS4Y1 locus there is biological
evidence of variation. HLA-DRB1 is a component of the major histocompatibilty
complex. One of the hallmarks of the major histocompatibility complex is the high
polymorphism and intralocus variability of its loci at the sequence level (Klein and
Figueroa 1986). In this study the HLA-DRB1 was shown to be highly variable at the
transcript level too. RPS4Y1 is located in the male-specific region of the Y chromosome
and not in the pseudoautosomal region (Skaletsky, Kuroda-Kawaguchi et al. 2003). Since
there were both males and females assayed in this study, it is not surprising that the male-
specific gene RPS4Y1 emerged as one of the top variable gene since it differed between
the two groups. For further genes such as DEFA1 and DEFA3 there is evidence of
structural variation since they are known copy numbers variants (Ballana, Gonzalez et al.
2007). The least variable genes belonged to categories such as nucleic acid binding
genes, transcription factors and cell junction genes. The least variable categories
represent categories such as nucleic acid binding and transcription factors whose
76
functions are essential and hence the gene expression of transcripts belonging to this
category is relatively stable. The highest variable genes belonged to classes of
cytoskeletal genes, defense/immune genes, and signaling genes. The highest variable
genes in unrelated individuals may reflect normal individual variation of gene expression
(which might be due to genetic polymorphisms affecting gene expression) or may reflect
various environmental exposures or biological processes.
6.2.2 Gender-specific gene expression signatures in the KORA dataset
Gender is one determinant of variation in physiology, morphology and disease
susceptibility in humans (Whitney, Diehn et al. 2003). Many immunological and
inflammatory diseases such as SLE and neuropsychiatric disorders such as depression
and attention deficit hyperactivity have a striking gender bias in incidence and severity
(Cutolo, Sulli et al. 1995; Verthelyi, Petri et al. 2001). The KORA gene expression
profiles were employed to identify gender-specific gene expression signatures. The
Welch’s t-test (an adaptation of Student's t-test for two samples having possibly unequal
variances) was used to search for genes whose expression differed significantly between
male and female donors. 24 significantly different genes were identified, 18 of which
were localized on the sex chromosomes. Y chromosomal genes were expected to differ
between the genders while expression differences for X chromosomal genes between the
two sexes indicate escape of X-inactivation. 8 of the 18 sex chromosome genes found to
differ between the two genders in this study overlapped with gender-specific genes found
in other studies in humans and mice (Whitney, Diehn et al. 2003; Vawter, Evans et al.
2004; Debey, Zander et al. 2006). None of the 6 autosomal genes associated with gender
had been previously reported. The fact that only 6 genes differing between males and
females were autosomal genes indicated that the two sexes did not differ greatly in gene
expression levels in whole blood.
6.2.2.1 Establishment of a gender predictor
To assess whether gene expression differences were enough to classify men and women
into distinct groups, a class-predictor was built using the gender-specific genes. The best
predictor was obtained using the Y-specific RPS4Y1 gene, resulting in an accuracy of
95%. This predictor could not be improved by adding the other 23 gender-specific genes.
77
Gender prediction may serve as a quality control to check for sample mixing. For
individuals whose gene expression levels for the gender-specific genes do not correspond
to others of the same gender, caution must be taken. Theoretically, gender misclassified
individuals can be excluded for downstream analysis. For the RPSY41 predictor, men
and women showed a threshold-effect of RPS4Y1 expression and the misclassified
individuals exhibited intermediate expression levels of RPS4Y1, thereby confirming that
there was no experimental sample mixing. The possibility of sex reversal in individuals
who were gender misclassified cannot be ruled out.
Previously a class predictor was built from peripheral blood mononuclear cells , based on
3 sex chromosomal genes, resulting in a 86% accuracy (Debey, Zander et al. 2006). The
whole blood gender-prediction described here proceeded in a prediction accuracy of 95%,
demonstrating the power of this approach to detect gender-specific changes.
To question whether males and females could be classified using non-gonadal gene
expression, another predictor was built using the transcriptional profiles of the 6 gender-
specific autosomal genes, resulting in a prediction rate of 74% accuracy. So far, to my
knowledge, no report of gender determination using autosomal gene expression profiles
has been described.
6.3 Age -specific gene expression signatures in the KORA dataset
Gene expression levels in many organisms change during the aging process and the
advent of microarrays has allowed genome-wide patterns of transcriptional changes
associated with aging to be studied in both model organisms and various human tissues
(Hekimi and Guarente 2003; Fraser, Khaitovich et al. 2005). Identification of age-related
genes might contribute towards the better understanding of molecular process of aging as
well as help comprehend age-related disorders such as neurodegenerative diseases.
Within a cohort age range of 50-83 years in this study, 11 transcripts were found to be
significantly associated with age using a linear regression model. Ten of these showed a
negative correlation in age, while only VNN 3 showed a positive correlation with age.
While there was no evidence of biological significance for ten of the age-specific genes,
VNN3 had been reported to show a 2-6 fold inducible expression on stress induction
(Berruyer, Martin et al. 2004). VNN3 is a member of the vanin family of proteins whose
78
exact function is not known. One study reported that vanin proteins possess pantotheinase
activity, which may play a role in processes pertaining to tissue repair in the context of
oxidative stress (Bomprezzi, Ringner et al. 2003). This is a noteworthy finding,
considering the long known free radical theory providing genetic support between
mechanisms of oxidative stress and ageing (Weedon, Lango et al. 2008). The free radical
theory of aging holds that aging is at least in part due to deleterious side effects of aerobic
respiration (Harman 1956). Specifically, mitochondrial activity leading to the production
of reactive oxygen species (ROS) could damage many cellular components, including
DNA, lipids, and proteins (Weedon, Lango et al. 2008). The free radical theory has
gained widespread support from studies in a plethora of model organisms showing that
decreasing ROS levels leads to an increase in lifespan indicate that ROS can strongly
modulate the aging process (Hekimi and Guarente 2003). The positive correlation
between VNN3 expression and age observed in this study could suggest an increase in
ROS with an increase in age.
Since age-specific genes were identified, the question was whether these could be used to
predict the age of an individual. Using the eleven age- specific gene signatures, an age-
predictor was built to predict the age of the donors. For 25% of individuals, the difference
between the real and predicted age was less than 2.5 years, for 50% of the people the
difference was between 2.5-8 years and for the remaining 25% of individuals the
difference was more than 8 years. Other age predictors built on human teeth resulted in a
mean error of 5 years with confidence intervals ranging from 7-14 years in one study and
resulted in a predictive success of +/- 5 years in about 45-48% of cases in another study
The ages of the studied individuals ranged from 13-76 years in both studies (Drusini,
Calliari et al. 1991; Tramini, Bonnet et al. 2001).
Age prediction might reflect the biological age rather than the chronological age of the
individuals studied. Furthermore, if the survival times of the surveyed individuals will be
known in the near future, then the human survival data could be matched with gene
expression profiles to predict longevity. Despite the interesting prospects of this work, the
power of this study to detect age-related gene-expression patterns was limited due to the
narrow age range of the sampled individuals (50-83 years). It would be interesting to
apply this age-predictor to larger sample sizes with broader age ranges.
79
6.4 Identification of cis and trans eQTLs
Genetic variants influencing gene expression in whole blood were assessed in this report.
Of 371 identified eQTLs, 77% were cis eQTLs while only 23% were trans eQTLs, an
observation consistent with previous reports showing that a major portion of regulatory
variation was attributable to cis regulation (Schadt, Monks et al. 2003; Morley, Molony et
al. 2004). Identification of fewer trans eQTLs is probably due to the fact that trans effects
are more indirect and therefore are usually weaker effects, requiring a larger cohort with
substantial power for detection (Stranger, Nica et al. 2007). For the KORA eQTLs
identified in this study, since only whole blood was interrogated, variation manifested
only in other cell types is not represented.
Despite differences between LCLs and whole blood, comparisons of the KORA with
HapMap (Stranger, Forrest et al. 2007) showed an overlap ~35% of eQTLs (32% cis and
3% of trans eQTLs). The larger overlap of cis eQTLs is in concordance with previous
reports that cis regulation was stable and consistent across different cell types and tissues
(Hubner, Wallace et al. 2005). The lesser extent of overlap of trans eQTLs is due to the
HapMap study design where the authors had selected only 25,000 putative functional
SNPs for their trans analyses. An overlap of >30% of eQTLs between different tissues
including adipose, LCLs, whole blood and liver has been previously demonstrated and
confirmed in this study (Stranger, Forrest et al. 2007; Emilsson, Thorleifsson et al. 2008).
The remaining 70% of the unshared fraction reflects the whole blood specific regulatory
variation. Of the overlapping eQTLs, > 97% exhibited allelic effects in the same direction
in both populations thereby demonstrating robust replication across the two populations
despite the small sample sizes surveyed. A further 2% of overlapping eQTLs showing
discordant direction of the allelic effect could be explained by differential allele
frequencies across the KORA and HapMap. Taken together, this amounted to a > 99%
replication of the overlapping eQTLs between KORA and HapMap and a <1% false
discovery rate. Such a large extent of overlap in the replicated eQTLs provides
confidence in the signals detected in this study.
Different studies use different definitions of cis-windows (100kb, 500kb, 1Mb), various
multiple testing methods (ranging from the stringent Bonferroni to the not so stringent
80
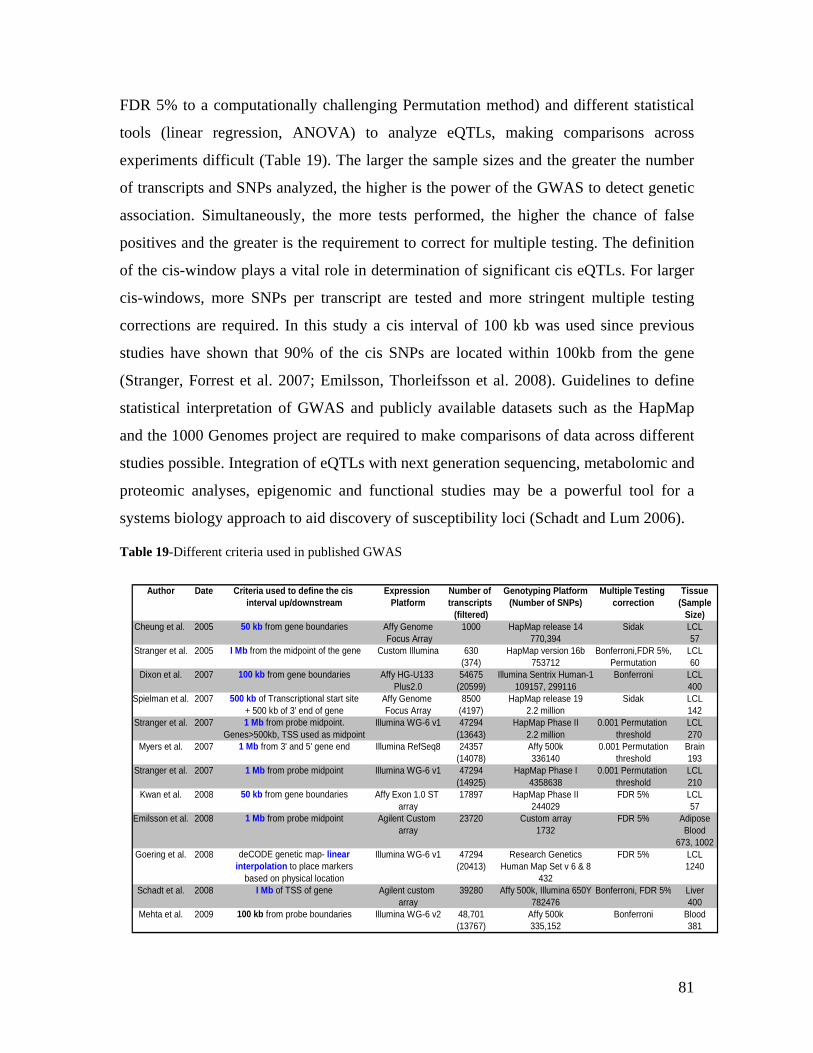
FDR 5% to a computationally challenging Permutation method) and different statistical
tools (linear regression, ANOVA) to analyze eQTLs, making comparisons across
experiments difficult (Table 19). The larger the sample sizes and the greater the number
of transcripts and SNPs analyzed, the higher is the power of the GWAS to detect genetic
association. Simultaneously, the more tests performed, the higher the chance of false
positives and the greater is the requirement to correct for multiple testing. The definition
of the cis-window plays a vital role in determination of significant cis eQTLs. For larger
cis-windows, more SNPs per transcript are tested and more stringent multiple testing
corrections are required. In this study a cis interval of 100 kb was used since previous
studies have shown that 90% of the cis SNPs are located within 100kb from the gene
(Stranger, Forrest et al. 2007; Emilsson, Thorleifsson et al. 2008). Guidelines to define
statistical interpretation of GWAS and publicly available datasets such as the HapMap
and the 1000 Genomes project are required to make comparisons of data across different
studies possible. Integration of eQTLs with next generation sequencing, metabolomic and
proteomic analyses, epigenomic and functional studies may be a powerful tool for a
systems biology approach to aid discovery of susceptibility loci (Schadt and Lum 2006).
Table 19-Different criteria used in published GWAS
Author Date Criteria used to define the cis Expression Number of Genotyping Platform Multiple Testing Tissueinterval up/downstream Platform transcripts (Number of SNPs) correction (Sample
(filtered) Size)Cheung et al. 2005 50 kb from gene boundaries Affy Genome 1000 HapMap release 14 Sidak LCL
Focus Array 770,394 57Stranger et al. 2005 I Mb from the midpoint of the gene Custom Illumina 630 HapMap version 16b Bonferroni,FDR 5%, LCL
(374) 753712 Permutation 60Dixon et al. 2007 100 kb from gene boundaries Affy HG-U133 54675 Illumina Sentrix Human-1 Bonferroni LCL
Plus2.0 (20599) 109157, 299116 400Spielman et al. 2007 500 kb of Transcriptional start site Affy Genome 8500 HapMap release 19 Sidak LCL
+ 500 kb of 3' end of gene Focus Array (4197) 2.2 million 142Stranger et al. 2007 1 Mb from probe midpoint. Illumina WG-6 v1 47294 HapMap Phase II 0.001 Permutation LCL
Genes>500kb, TSS used as midpoint (13643) 2.2 million threshold 270Myers et al. 2007 1 Mb from 3' and 5' gene end Illumina RefSeq8 24357 Affy 500k 0.001 Permutation Brain
(14078) 336140 threshold 193Stranger et al. 2007 1 Mb from probe midpoint Illumina WG-6 v1 47294 HapMap Phase I 0.001 Permutation LCL
(14925) 4358638 threshold 210Kwan et al. 2008 50 kb from gene boundaries Affy Exon 1.0 ST 17897 HapMap Phase II FDR 5% LCL
array 244029 57Emilsson et al. 2008 1 Mb from probe midpoint Agilent Custom 23720 Custom array FDR 5% Adipose
array 1732 Blood673, 1002
Goering et al. 2008 deCODE genetic map- linear Illumina WG-6 v1 47294 Research Genetics FDR 5% LCLinterpolation to place markers (20413) Human Map Set v 6 & 8 1240
based on physical location 432Schadt et al. 2008 I Mb of TSS of gene Agilent custom 39280 Affy 500k, Illumina 650Y Bonferroni, FDR 5% Liver
array 782476 400Mehta et al. 2009 100 kb from probe boundaries Illumina WG-6 v2 48,701 Affy 500k Bonferroni Blood
(13767) 335,152 381
81
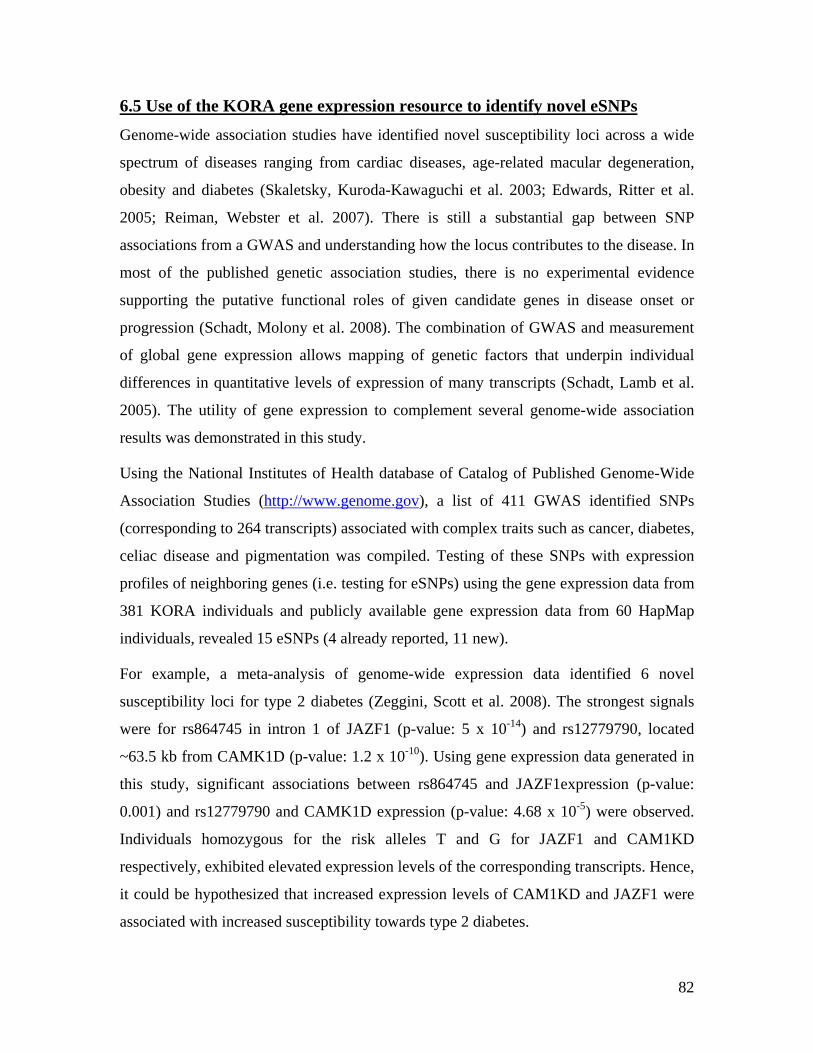
6.5 Use of the KORA gene expression resource to identify novel eSNPs
Genome-wide association studies have identified novel susceptibility loci across a wide
spectrum of diseases ranging from cardiac diseases, age-related macular degeneration,
obesity and diabetes (Skaletsky, Kuroda-Kawaguchi et al. 2003; Edwards, Ritter et al.
2005; Reiman, Webster et al. 2007). There is still a substantial gap between SNP
associations from a GWAS and understanding how the locus contributes to the disease. In
most of the published genetic association studies, there is no experimental evidence
supporting the putative functional roles of given candidate genes in disease onset or
progression (Schadt, Molony et al. 2008). The combination of GWAS and measurement
of global gene expression allows mapping of genetic factors that underpin individual
differences in quantitative levels of expression of many transcripts (Schadt, Lamb et al.
2005). The utility of gene expression to complement several genome-wide association
results was demonstrated in this study.
Using the National Institutes of Health database of Catalog of Published Genome-Wide
Association Studies (http://www.genome.gov), a list of 411 GWAS identified SNPs
(corresponding to 264 transcripts) associated with complex traits such as cancer, diabetes,
celiac disease and pigmentation was compiled. Testing of these SNPs with expression
profiles of neighboring genes (i.e. testing for eSNPs) using the gene expression data from
381 KORA individuals and publicly available gene expression data from 60 HapMap
individuals, revealed 15 eSNPs (4 already reported, 11 new).
For example, a meta-analysis of genome-wide expression data identified 6 novel
susceptibility loci for type 2 diabetes (Zeggini, Scott et al. 2008). The strongest signals
were for rs864745 in intron 1 of JAZF1 (p-value: 5 x 10-14) and rs12779790, located
~63.5 kb from CAMK1D (p-value: 1.2 x 10⁻¹⁰). Using gene expression data generated in
this study, significant associations between rs864745 and JAZF1expression (p-value:
0.001) and rs12779790 and CAMK1D expression (p-value: 4.68 x 10⁻⁵) were observed.
Individuals homozygous for the risk alleles T and G for JAZF1 and CAM1KD
respectively, exhibited elevated expression levels of the corresponding transcripts. Hence,
it could be hypothesized that increased expression levels of CAM1KD and JAZF1 were
associated with increased susceptibility towards type 2 diabetes.
82
To investigate for possible causal SNPs other than the GWAS reported SNPs, the KORA
eQTL lists were probed to check if there were any cis or trans SNPs influencing the
expression levels for the 264 candidate genes in the list. 9 cis SNPs were found to
significantly influence transcriptional profiles of the genes.
In summary, for 15 of the 411 tested SNPs, possible functional SNPs were identified
which were significantly associated with expression levels. This confirms that the GWAS
identified the functional SNPs in these instances. Expression profiles allowed functional
validation for those candidate genes where eSNPs were identified. The discovery of the 9
cis SNPs influencing expression levels of the candidate genes indicates that the GWAS
might have not captured the functional SNP.
It has been demonstrated here that functional validation of candidate genes using gene
expression profiles provides a more objective view into the role of the gene in a given
phenotype-associated region. Assaying gene expression and genetic variation
simultaneously in a large number of samples can be a powerful tool for unraveling the
function of previously mapped susceptibility alleles underlying common complex
diseases.
6.6 Functional validation of SLC2A9
Gene expression can be used as a tool to prioritize candidate genes identified in a genetic
study in terms of functional validation (Goring, Curran et al. 2007). In this context, the
KORA whole blood gene expression dataset was used to test a candidate gene, SLC2A9,
which had been detected in a genome-wide association study to identify pathways in
regulation of uric acid concentration. SLC2A9 is a predicted fructose and glucose
transporter (Li, Sanna et al. 2007). Investigation of transcript levels of SLC2A9 isoforms
in blood relative to serum uric acid concentrations resulted in identification of significant
association of the SLC2A9 isoform 2 expression levels with uric acid concentrations (p-
value: 0.002) .
The expression studies helped to focus the association signals to a specific isoform.
SLC2A9 isoform 1 is expressed in several tissues such as kidney, placenta, liver, lung,
leukocytes, chrondrocytes and brain, while SLC2A9 isoform 2 is prominently expressed
in the kidney in both humans and mice (Augustin, Carayannopoulos et al. 2004) (Figure
83
SLC2A9 isoform 1
SLC2A9 isoform 2
Actinpla
cent
a
brain
leuco
cytes
kidne
y
liver
lung
SLC2A9 isoform 1
SLC2A9 isoform 2
Actinpla
cent
a
brain
leuco
cytes
kidne
y
liver
lung
SLC2A9 isoform 1
SLC2A9 isoform 2
Actinpla
cent
a
brain
leuco
cytes
kidne
y
liver
lung
SLC2A9 isoform 1
SLC2A9 isoform 2
Actinpla
cent
a
brain
leuco
cytes
kidne
y
liver
lung
SLC2A9 isoform 1
SLC2A9 isoform 2
Actinpla
cent
a
brain
leuco
cytes
kidne
y
liver
lung
SLC2A9 isoform 1
SLC2A9 isoform 2
Actinpla
cent
a
brain
leuco
cytes
kidne
y
liver
41). Both isoforms are equally and sizably expressed in whole blood. The significant
association with the shorter protein argues for a prominent role of the SLC2A9 isoform 2
in uric acid excretion in the kidney.
lung
Figure 41-Expression of the two SLC2A9 isoforms: Isoform 2 of SLC2A9 is predominantly expressed in
the kidney, thereby suggesting that this isoform might be involved in urate excretion via the kidney (Figure
taken from Augustin et al. 2004).
The proportion of the variance of serum uric acid concentrations explained by expression
levels was much higher than that explained by genotypes: 3.5% in men and 15% in
women for expression, 1.2% in men and 6% in women for genotypes. The higher
accountability of variance of serum urate levels in women is an interesting observation
considering an early report in 1967, demonstrating a significant genetic component in the
control of serum uric acid only among female twins (Boyle, Greig et al. 1967).
At the time this study was published, Vitart and colleagues too identified significant
associations between SLC2A9 locus and urate levels in different populations (Vitart,
Rudan et al. 2008). In their study, the authors assayed transporter activity in Xenopus
laevis oocytes and demonstrated a 31-fold higher urate uptake by SLC2A9- expressing
versus control oocytes. Furthermore, urate uptake was sevenfold higher for SLC2A9-
expressing oocytes versus known urate transporter URAT1- expressing oocytes. It has
been shown by others that URAT1 is potentially involved in 50% of urate reabsorption
from glomerular filtrate by proximal tubules (Enomoto and Endou 2005). The results of
Vitart and colleagues suggest that SLC2A9 may also contribute to this process.
84

A recent study demonstrated that urate is transported by SLC2A9 45-to 60-fold faster
than glucose (Caulfield, Munroe et al. 2008). The identification of SLC2A9 as a high
capacity urate transporter will facilitate production of new drug targets to lower uric acid
levels in a range of conditions such as hyperuricemia, Lesch-Nyhan syndrome, gout and
diabetes.
6.7 Genome-wide association studies - caveats and future perspectives
One major caveat of the design of genome-wide association studies is whether it is
powerful enough to detect effects of both rare and common variants contributing to the
trait of interest. It is a challenging task to collect large cohorts of well-characterized
phenotypic quality and establish human panels of sufficient sizes with homogeneous
allele frequencies and linkage disequilibrium patterns. These difficulties have been
illustrated in the work of Reich et al, 2005 on multiple sclerosis, where an association on
chromosome 1 in African-Americans could not be replicated in another sample of Afro-
Caribbeans (Reich, Patterson et al. 2005).
Potential reasons for lack of reproducibility of association data could be:
- The association could be a false-positive association and hence cannot be replicated
- It could be a true association which cannot be replicated due to an underpowered
follow-up study (essentially a false negative)
- A true association in one population which may not be true in another population
due to genetic heterogeneity or different environmental background
Hence, caution must be exhibited when interpreting the results of a genetic association
study. Significance thresholds in the order of P<10-6 have been proposed for genome-
wide association studies to rigorously account for the multiple tests performed in the
course of the study (Dahlman, Eaves et al. 2002). GWAS findings that have not reached
genome-wide significance may be genuine associations and could perhaps be uncovered
by meta-analysis or SNP imputation (Zeggini, Scott et al. 2008).
There is a limit to how large population-based studies can get and there may be a class of
variants that are too rare to be captured by GWAS but are not sufficiently high risk to be
captured by population-based studies (Cambien and Tiret 2007). New approaches such as
next generation sequencing technologies and bioinformatics methods might prove useful
85
in identification of these rare variants. For GWAS, larger sample sizes need to be used,
biases should be taken into account, multiple-testing issues must be addressed and
replication studies need to be carried out to allow a statistically powered yet economical
experimental design (Newton-Cheh and Hirschhorn 2005; Wang, Barratt et al. 2005). To
cite Mark Iles “The successes in finding common variants associated with common
diseases are encouraging, but, as our findings show, we cannot yet be sure whether the
common disease-associated variants found so far represent the tip of the iceberg or the
bottom of the barrel”(Iles 2008).
6.8 Value of gene expression data
GWAS have identified susceptibility loci influencing a wide range of complex traits.
Based on literature and available annotations of genes in the vicinity of SNPs, authors
postulate the potential causal gene and its biological relevance to the trait. Majority of the
SNPs identified by GWAS so far are intronic or in intergenic regions with unknown
functionality. The challenge is the interpretation of GWAS results and confident
assignment of the true causal variant(s). Although statistical approaches provide a robust
assessment of significant observed association signals, functional data further supports
and complements the initial hypotheses by providing a direct evaluation of biological
processes. This highlights the need for further functional studies to pinpoint the causal
variants and affected genes to aid the transition from candidate gene identification to
translational progress.
Regulatory variation plays a key role in determining human phenotypic variation and is
known to influence disease susceptibility. Integration of gene expression data with
genotypic data allows prioritization of positional candidate genes, thereby providing a
functional handle allowing a deeper understanding on the etiology of complex traits.
For transcriptomics, it would be ideal to study gene expression in the affected tissue such
as brain in cases of neurodegenerative disorders or heart in case of cardiovascular
diseases. Obtaining diseases tissue samples are subject to several ethical, legal and social
issues. Post-mortem samples from tissues might retain their RNA quality and intact
histological architecture but might be affected by gene expression changes accompanying
death. Since obtaining such tissues might not be feasible, whole blood acts as a good
86
surrogate for baseline investigation of gene expression profiles. If gene expression
signatures observed in other tissues such as brain, heart, muscle, liver, lung etc are also
detected in whole blood; this would allow easy and quick analysis of expression profiles
as a part of routine blood sampling.
National Institutes of Health (NIH) has only recently proposed an ambitious Genotype-
Tissue Expression (GTEx) project, a database that will include expression analysis from
30 different tissues in 1,000 samples. Currently, this project is running in its 2-year pilot
phase with a primary goal of testing the feasibility of collecting high-quality RNA and
DNA from multiple tissues from 160 donors identified through low post-mortem autopsy
or organ transplant.
In this study, the value of whole blood transcriptomics to address the usefulness of using
a mixture versus a single cell type has been demonstrated. The KORA expression profiles
generated in this study allowed functional validation of 2 candidate genes SLC2A9
isoform 2 and WDR66, identified in independent GWAS for serum uric acid levels and
mean platelet volume respectively (Doring, Gieger et al. 2008; Meisinger, Prokisch et al.
2009). The expression profiles helped unravel a possible novel pathway of IgE regulation
via transcription factor GATA-2 in whole blood (Weidinger, Gieger et al. 2008). Using
whole blood expression profiles gender-specific profiles, age-specific signatures and
eQTLs were observed. Identification of novel whole blood eQTLs not observed in other
tissues highlights the power of using whole blood for expression analysis. Integration of
gene expression generated in this study with available genotypic information allowed
discovery of novel eSNPs, thereby uncovering the effects of variation in transcription on
disease. The data presented here strongly suggest that to uncover tissue-specific
expression profiles, it is essential to investigate gene expression in a multitude of
different tissues and cells in the hope that we will discover as much of the regulatory
variation as achievable.
87
7.0 Bibliography
Alizadeh, A. A., M. B. Eisen, et al. (2000). "Distinct types of diffuse large B-cell lymphoma identified by gene expression profiling." Nature 403(6769): 503-11.
Allen, A. M. (1978). "Epidemiologic methods in dermatology, part 1: describing the occurrence of disease in human populations." Int J Dermatol 17(3): 186-93.
Arking, D. E., A. Pfeufer, et al. (2006). "A common genetic variant in the NOS1 regulator NOS1AP modulates cardiac repolarization." Nat Genet 38(6): 644-51.
Augustin, R., M. O. Carayannopoulos, et al. (2004). "Identification and characterization of human glucose transporter-like protein-9 (GLUT9): alternative splicing alters trafficking." J Biol Chem 279(16): 16229-36.
Ballana, E., J. R. Gonzalez, et al. (2007). "Inter-population variability of DEFA3 gene absence: correlation with haplotype structure and population variability." BMC Genomics 8: 14.
Baron, D., R. Houlgatte, et al. (2005). "Large-scale temporal gene expression profiling during gonadal differentiation and early gametogenesis in rainbow trout." Biol Reprod 73(5): 959-66.
Berruyer, C., F. M. Martin, et al. (2004). "Vanin-1-/- mice exhibit a glutathione-mediated tissue resistance to oxidative stress." Mol Cell Biol 24(16): 7214-24.
Bibikova, M., D. Talantov, et al. (2004). "Quantitative gene expression profiling in formalin-fixed, paraffin-embedded tissues using universal bead arrays." Am J Pathol 165(5): 1799-807.
Bird, A. (2002). "DNA methylation patterns and epigenetic memory." Genes Dev 16(1): 6-21.
Bomprezzi, R., M. Ringner, et al. (2003). "Gene expression profile in multiple sclerosis patients and healthy controls: identifying pathways relevant to disease." Hum Mol Genet 12(17): 2191-9.
Bosserhoff, A. K., A. Hauschild, et al. (2000). "Elevated MIA serum levels are of relevance for management of metastasized malignant melanomas: results of a German multicenter study." J Invest Dermatol 114(2): 395-6.
Botstein, D. and N. Risch (2003). "Discovering genotypes underlying human phenotypes: past successes for mendelian disease, future approaches for complex disease." Nat Genet 33 Suppl: 228-37.
Botstein, D., R. L. White, et al. (1980). "Construction of a genetic linkage map in man using restriction fragment length polymorphisms." Am J Hum Genet 32(3): 314-31.
Bouman, A., M. J. Heineman, et al. (2005). "Sex hormones and the immune response in humans." Hum Reprod Update 11(4): 411-23.
Bourgain, C., E. Genin, et al. (2007). "Are genome-wide association studies all that we need to dissect the genetic component of complex human diseases?" Eur J Hum Genet 15(3): 260-3.
Boyle, J. A., W. R. Greig, et al. (1967). "Relative roles of genetic and environmental factors in the control of serum uric acid levels in normouricaemic subjects." Ann Rheum Dis 26(3): 234-8.
Brem, R. B., G. Yvert, et al. (2002). "Genetic dissection of transcriptional regulation in budding yeast." Science 296(5568): 752-5.
88
Breslin, T., M. Krogh, et al. (2005). "Signal transduction pathway profiling of individual tumor samples." BMC Bioinformatics 6: 163.
Butler, J. E. and J. T. Kadonaga (2002). "The RNA polymerase II core promoter: a key component in the regulation of gene expression." Genes Dev 16(20): 2583-92.
Bystrykh, L., E. Weersing, et al. (2005). "Uncovering regulatory pathways that affect hematopoietic stem cell function using 'genetical genomics'." Nat Genet 37(3): 225-32.
Cambien, F. and L. Tiret (2007). "Genetics of cardiovascular diseases: from single mutations to the whole genome." Circulation 116(15): 1714-24.
Carmo-Fonseca, M. (2007). "How genes find their way inside the cell nucleus." J Cell Biol 179(6): 1093-4.
Caulfield, M. J., P. B. Munroe, et al. (2008). "SLC2A9 is a high-capacity urate transporter in humans." PLoS Med 5(10): e197.
Chabot, A., R. A. Shrit, et al. (2007). "Using reporter gene assays to identify cis regulatory differences between humans and chimpanzees." Genetics 176(4): 2069-76.
Cheung, V. G., L. K. Conlin, et al. (2003). "Natural variation in human gene expression assessed in lymphoblastoid cells." Nat Genet 33(3): 422-5.
Cheung, V. G., K. Y. Jen, et al. (2003). "Genetics of quantitative variation in human gene expression." Cold Spring Harb Symp Quant Biol 68: 403-7.
Cho, R. J. and M. J. Campbell (2000). "Transcription, genomes, function." Trends Genet 16(9): 409-15.
Crick, F. (1970). "Central dogma of molecular biology." Nature 227(5258): 561-3. Cutolo, M., A. Sulli, et al. (1995). "Estrogens, the immune response and autoimmunity."
Clin Exp Rheumatol 13(2): 217-26. Dahlman, I., I. A. Eaves, et al. (2002). "Parameters for reliable results in genetic
association studies in common disease." Nat Genet 30(2): 149-50. Dausset, J., H. Cann, et al. (1990). "Centre d'etude du polymorphisme humain (CEPH):
collaborative genetic mapping of the human genome." Genomics 6(3): 575-7. de Bakker, P. I., M. A. Ferreira, et al. (2008). "Practical aspects of imputation-driven
meta-analysis of genome-wide association studies." Hum Mol Genet 17(R2): R122-8.
Debey, S., T. Zander, et al. (2006). "A highly standardized, robust, and cost-effective method for genome-wide transcriptome analysis of peripheral blood applicable to large-scale clinical trials." Genomics 87(5): 653-64.
Dekel, B. (2003). "Profiling gene expression in kidney development." Nephron Exp Nephrol 95(1): e1-6.
Dermitzakis, E. T. and B. E. Stranger (2006). "Genetic variation in human gene expression." Mamm Genome 17(6): 503-8.
Deutsch, S., R. Lyle, et al. (2005). "Gene expression variation and expression quantitative trait mapping of human chromosome 21 genes." Hum Mol Genet 14(23): 3741-9.
Devlin, B. and K. Roeder (1999). "Genomic control for association studies." Biometrics 55(4): 997-1004.
Dixon, A. L., L. Liang, et al. (2007). "A genome-wide association study of global gene expression." Nat Genet 39(10): 1202-7.
89
Doring, A., C. Gieger, et al. (2008). "SLC2A9 influences uric acid concentrations with pronounced sex-specific effects." Nat Genet 40(4): 430-6.
Drusini, A., I. Calliari, et al. (1991). "Root dentine transparency: age determination of human teeth using computerized densitometric analysis." Am J Phys Anthropol 85(1): 25-30.
Dumeaux, V., A. L. Borresen-Dale, et al. (2008). "Gene expression analyses in breast cancer epidemiology: the Norwegian Women and Cancer postgenome cohort study." Breast Cancer Res 10(1): R13.
Edwards, A. O., R. Ritter, 3rd, et al. (2005). "Complement factor H polymorphism and age-related macular degeneration." Science 308(5720): 421-4.
Elston, R. C. (1998). "Linkage and association." Genet Epidemiol 15(6): 565-76. Emilsson, V., G. Thorleifsson, et al. (2008). "Genetics of gene expression and its effect
on disease." Nature 452(7186): 423-8. Enard, W., P. Khaitovich, et al. (2002). "Intra- and interspecific variation in primate gene
expression patterns." Science 296(5566): 340-3. Enomoto, A. and H. Endou (2005). "Roles of organic anion transporters (OATs) and a
urate transporter (URAT1) in the pathophysiology of human disease." Clin Exp Nephrol 9(3): 195-205.
Felsenfeld, G. (2003). "Quantitative approaches to problems of eukaryotic gene expression." Biophys Chem 100(1-3): 607-13.
Field, L. L., V. Bonnevie-Nielsen, et al. (2005). "OAS1 splice site polymorphism controlling antiviral enzyme activity influences susceptibility to type 1 diabetes." Diabetes 54(5): 1588-91.
Fisher, R. A., F. R. Immer, et al. (1932). "The Genetical Interpretation of Statistics of the Third Degree in the Study of Quantitative Inheritance." Genetics 17(2): 107-24.
FitzPatrick, D. R., J. Ramsay, et al. (2002). "Transcriptome analysis of human autosomal trisomy." Hum Mol Genet 11(26): 3249-56.
Fraser, H. B., P. Khaitovich, et al. (2005). "Aging and gene expression in the primate brain." PLoS Biol 3(9): e274.
Frayling, T. M. (2007). "Genome-wide association studies provide new insights into type 2 diabetes aetiology." Nat Rev Genet 8(9): 657-62.
Frey, B. J., N. Mohammad, et al. (2005). "Genome-wide analysis of mouse transcripts using exon microarrays and factor graphs." Nat Genet 37(9): 991-6.
Fung, H. C., S. Scholz, et al. (2006). "Genome-wide genotyping in Parkinson's disease and neurologically normal controls: first stage analysis and public release of data." Lancet Neurol 5(11): 911-6.
Gabriel, S. B., S. F. Schaffner, et al. (2002). "The structure of haplotype blocks in the human genome." Science 296(5576): 2225-9.
Gardina, P. J., T. A. Clark, et al. (2006). "Alternative splicing and differential gene expression in colon cancer detected by a whole genome exon array." BMC Genomics 7: 325.
Giordano, M., M. Godi, et al. (2008). "A functional common polymorphism in the vitamin D-responsive element of the GH1 promoter contributes to isolated growth hormone deficiency." J Clin Endocrinol Metab 93(3): 1005-12.
90
Golub, T. R., D. K. Slonim, et al. (1999). "Molecular classification of cancer: class discovery and class prediction by gene expression monitoring." Science 286(5439): 531-7.
Goring, H. H., J. E. Curran, et al. (2007). "Discovery of expression QTLs using large-scale transcriptional profiling in human lymphocytes." Nat Genet 39(10): 1208-16.
Grapes, L., M. Z. Firat, et al. (2006). "Optimal haplotype structure for linkage disequilibrium-based fine mapping of quantitative trait loci using identity by descent." Genetics 172(3): 1955-65.
Grass, J. A., M. E. Boyer, et al. (2003). "GATA-1-dependent transcriptional repression of GATA-2 via disruption of positive autoregulation and domain-wide chromatin remodeling." Proc Natl Acad Sci U S A 100(15): 8811-6.
Gros, F., H. Hiatt, et al. (1961). "Unstable ribonucleic acid revealed by pulse labelling of Escherichia coli." Nature 190: 581-5.
Halperin, E., G. Kimmel, et al. (2005). "Tag SNP selection in genotype data for maximizing SNP prediction accuracy." Bioinformatics 21 Suppl 1: i195-203.
Hamer, D. and L. Sirota (2000). "Beware the chopsticks gene." Mol Psychiatry 5(1): 11-3.
Harman, D. (1956). "Aging: a theory based on free radical and radiation chemistry." J Gerontol 11(3): 298-300.
Harris, H. (1970). "The expression of genetic information by somatic cell nuclei." J Gen Microbiol 63(3): vi.
Hasegawa, M., C. Nishiyama, et al. (2003). "A novel -66T/C polymorphism in Fc epsilon RI alpha-chain promoter affecting the transcription activity: possible relationship to allergic diseases." J Immunol 171(4): 1927-33.
Heap, G. A., G. Trynka, et al. (2009). "Complex nature of SNP genotype effects on gene expression in primary human leucocytes." BMC Med Genomics 2: 1.
Hekimi, S. and L. Guarente (2003). "Genetics and the specificity of the aging process." Science 299(5611): 1351-4.
Hemminki, K., A. Forsti, et al. (2008). "The 'common disease-common variant' hypothesis and familial risks." PLoS ONE 3(6): e2504.
Hirschhorn, J. N., K. Lohmueller, et al. (2002). "A comprehensive review of genetic association studies." Genet Med 4(2): 45-61.
Hoggart, C. J., E. J. Parra, et al. (2003). "Control of confounding of genetic associations in stratified populations." Am J Hum Genet 72(6): 1492-1504.
Holle, R., M. Happich, et al. (2005). "KORA--a research platform for population based health research." Gesundheitswesen 67 Suppl 1: S19-25.
Holstege, F. C. and R. A. Young (1999). "Transcriptional regulation: contending with complexity." Proc Natl Acad Sci U S A 96(1): 2-4.
Hopper, J. L., D. T. Bishop, et al. (2005). "Population-based family studies in genetic epidemiology." Lancet 366(9494): 1397-406.
Hubner, N., C. A. Wallace, et al. (2005). "Integrated transcriptional profiling and linkage analysis for identification of genes underlying disease." Nat Genet 37(3): 243-53.
Iles, M. M. (2008). "What can genome-wide association studies tell us about the genetics of common disease?" PLoS Genet 4(2): e33.
91
Iwanaga, R., H. Komori, et al. (2004). "Differential regulation of expression of the mammalian DNA repair genes by growth stimulation." Oncogene 23(53): 8581-90.
Jeimy, S. B., N. Fuller, et al. (2008). "Multimerin 1 binds factor V and activated factor V with high affinity and inhibits thrombin generation." Thromb Haemost 100(6): 1058-67.
Ji, W., J. N. Foo, et al. (2008). "Rare independent mutations in renal salt handling genes contribute to blood pressure variation." Nat Genet 40(5): 592-9.
Jin, W., R. M. Riley, et al. (2001). "The contributions of sex, genotype and age to transcriptional variance in Drosophila melanogaster." Nat Genet 29(4): 389-95.
Johnson, A. D., R. E. Handsaker, et al. (2008). "SNAP: a web-based tool for identification and annotation of proxy SNPs using HapMap." Bioinformatics 24(24): 2938-9.
Kent, C., G. M. Carman, et al. (1991). "Regulation of eukaryotic phospholipid metabolism." Faseb J 5(9): 2258-66.
Kim, H., R. Klein, et al. (2004). "Estimating rates of alternative splicing in mammals and invertebrates." Nat Genet 36(9): 915-6; author reply 916-7.
Klein, J. and F. Figueroa (1986). "Evolution of the major histocompatibility complex." Crit Rev Immunol 6(4): 295-386.
Kraft, S. and J. P. Kinet (2007). "New developments in FcepsilonRI regulation, function and inhibition." Nat Rev Immunol 7(5): 365-78.
Kuhn, K., S. C. Baker, et al. (2004). "A novel, high-performance random array platform for quantitative gene expression profiling." Genome Res 14(11): 2347-56.
Kullo, I. J. and K. Ding (2007). "Mechanisms of disease: The genetic basis of coronary heart disease." Nat Clin Pract Cardiovasc Med 4(10): 558-69.
Kurimoto, K., Y. Yabuta, et al. (2007). "Global single-cell cDNA amplification to provide a template for representative high-density oligonucleotide microarray analysis." Nat Protoc 2(3): 739-52.
Kwan, T., D. Benovoy, et al. (2008). "Genome-wide analysis of transcript isoform variation in humans." Nat Genet 40(2): 225-31.
Lee, C. and M. Roy (2004). "Analysis of alternative splicing with microarrays: successes and challenges." Genome Biol 5(7): 231.
Li, L., L. Ying, et al. (2008). "Interference of globin genes with biomarker discovery for allograft rejection in peripheral blood samples." Physiol Genomics 32(2): 190-7.
Li, S., S. Sanna, et al. (2007). "The GLUT9 gene is associated with serum uric acid levels in Sardinia and Chianti cohorts." PLoS Genet 3(11): e194.
Liang, S., Y. Li, et al. (2006). "Detecting and profiling tissue-selective genes." Physiol Genomics 26(2): 158-62.
Liew, C. C., J. Ma, et al. (2006). "The peripheral blood transcriptome dynamically reflects system wide biology: a potential diagnostic tool." J Lab Clin Med 147(3): 126-32.
Liu, J., E. Walter, et al. (2006). "Effects of globin mRNA reduction methods on gene expression profiles from whole blood." J Mol Diagn 8(5): 551-8.
Liu, S. and R. B. Altman (2003). "Large scale study of protein domain distribution in the context of alternative splicing." Nucleic Acids Res 31(16): 4828-35.
92
Meisinger, C., H. Prokisch, et al. (2009). "A genome-wide association study identifies three loci associated with mean platelet volume." Am J Hum Genet 84(1): 66-71.
Modrek, B. and C. Lee (2002). "A genomic view of alternative splicing." Nat Genet 30(1): 13-9.
Modrek, B., A. Resch, et al. (2001). "Genome-wide detection of alternative splicing in expressed sequences of human genes." Nucleic Acids Res 29(13): 2850-9.
Mohr, S. and C. C. Liew (2007). "The peripheral-blood transcriptome: new insights into disease and risk assessment." Trends Mol Med 13(10): 422-32.
Morgan, T. H. (1915). "Localization of the Hereditary Material in the Germ Cells." Proc Natl Acad Sci U S A 1(7): 420-9.
Morley, M., C. M. Molony, et al. (2004). "Genetic analysis of genome-wide variation in human gene expression." Nature 430(7001): 743-7.
Newton-Cheh, C. and J. N. Hirschhorn (2005). "Genetic association studies of complex traits: design and analysis issues." Mutat Res 573(1-2): 54-69.
Orlic, D., S. Anderson, et al. (1995). "Pluripotent hematopoietic stem cells contain high levels of mRNA for c-kit, GATA-2, p45 NF-E2, and c-myb and low levels or no mRNA for c-fms and the receptors for granulocyte colony-stimulating factor and interleukins 5 and 7." Proc Natl Acad Sci U S A 92(10): 4601-5.
Ozeki, Y., T. Tomoda, et al. (2003). "Disrupted-in-Schizophrenia-1 (DISC-1): mutant truncation prevents binding to NudE-like (NUDEL) and inhibits neurite outgrowth." Proc Natl Acad Sci U S A 100(1): 289-94.
Pan, W., S. C. Choi, et al. (2008). "Wnt3a-mediated formation of phosphatidylinositol 4,5-bisphosphate regulates LRP6 phosphorylation." Science 321(5894): 1350-3.
Petretto, E., J. Mangion, et al. (2006). "Integrated gene expression profiling and linkage analysis in the rat." Mamm Genome 17(6): 480-9.
Pfeufer, A., S. Jalilzadeh, et al. (2005). "Common variants in myocardial ion channel genes modify the QT interval in the general population: results from the KORA study." Circ Res 96(6): 693-701.
Pinzar, E., Y. Kanaoka, et al. (2000). "Prostaglandin D synthase gene is involved in the regulation of non-rapid eye movement sleep." Proc Natl Acad Sci U S A 97(9): 4903-7.
Plagnol, V., E. Uz, et al. (2008). "Extreme clonality in lymphoblastoid cell lines with implications for allele specific expression analyses." PLoS ONE 3(8): e2966.
Pritchard, C., D. Coil, et al. (2006). "The contributions of normal variation and genetic background to mammalian gene expression." Genome Biol 7(3): R26.
Pritchard, J. K. and N. J. Cox (2002). "The allelic architecture of human disease genes: common disease-common variant...or not?" Hum Mol Genet 11(20): 2417-23.
Raghavan, A. and P. R. Bohjanen (2004). "Microarray-based analyses of mRNA decay in the regulation of mammalian gene expression." Brief Funct Genomic Proteomic 3(2): 112-24.
Redondo, M. J., P. R. Fain, et al. (2001). "Genetics of type 1A diabetes." Recent Prog Horm Res 56: 69-89.
Reich, D., N. Patterson, et al. (2005). "A whole-genome admixture scan finds a candidate locus for multiple sclerosis susceptibility." Nat Genet 37(10): 1113-8.
Reiman, E. M., J. A. Webster, et al. (2007). "GAB2 alleles modify Alzheimer's risk in APOE epsilon4 carriers." Neuron 54(5): 713-20.
93
Rucker, R. B. and C. McGee (1993). "Chemical modifications of proteins in vivo: selected examples important to cellular regulation." J Nutr 123(6): 977-90.
Salehi, Z. and F. Mashayekhi (2007). "Eukaryotic translation initiation factor 4E (eIF4E) expression in the brain tissue is induced by infusion of nerve growth factor into the mouse cisterna magnum: an in vivo study." Mol Cell Biochem 304(1-2): 249-53.
Schadt, E. E., J. Lamb, et al. (2005). "An integrative genomics approach to infer causal associations between gene expression and disease." Nat Genet 37(7): 710-7.
Schadt, E. E. and P. Y. Lum (2006). "Thematic review series: systems biology approaches to metabolic and cardiovascular disorders. Reverse engineering gene networks to identify key drivers of complex disease phenotypes." J Lipid Res 47(12): 2601-13.
Schadt, E. E., C. Molony, et al. (2008). "Mapping the genetic architecture of gene expression in human liver." PLoS Biol 6(5): e107.
Schadt, E. E., S. A. Monks, et al. (2003). "Genetics of gene expression surveyed in maize, mouse and man." Nature 422(6929): 297-302.
Scheepers, A., S. Schmidt, et al. (2005). "Characterization of the human SLC2A11 (GLUT11) gene: alternative promoter usage, function, expression, and subcellular distribution of three isoforms, and lack of mouse orthologue." Mol Membr Biol 22(4): 339-51.
Schiebel, K., M. Winkelmann, et al. (1997). "Abnormal XY interchange between a novel isolated protein kinase gene, PRKY, and its homologue, PRKX, accounts for one third of all (Y+)XX males and (Y-)XY females." Hum Mol Genet 6(11): 1985-9.
Schroeder, A., O. Mueller, et al. (2006). "The RIN: an RNA integrity number for assigning integrity values to RNA measurements." BMC Mol Biol 7: 3.
Skaletsky, H., T. Kuroda-Kawaguchi, et al. (2003). "The male-specific region of the human Y chromosome is a mosaic of discrete sequence classes." Nature 423(6942): 825-37.
Smith, D. J. and A. J. Lusis (2002). "The allelic structure of common disease." Hum Mol Genet 11(20): 2455-61.
Srinivasan, K., L. Shiue, et al. (2005). "Detection and measurement of alternative splicing using splicing-sensitive microarrays." Methods 37(4): 345-59.
Steffens, M., C. Lamina, et al. (2006). "SNP-based analysis of genetic substructure in the German population." Hum Hered 62(1): 20-9.
Stranger, B. E., M. S. Forrest, et al. (2005). "Genome-wide associations of gene expression variation in humans." PLoS Genet 1(6): e78.
Stranger, B. E., M. S. Forrest, et al. (2007). "Relative impact of nucleotide and copy number variation on gene expression phenotypes." Science 315(5813): 848-53.
Stranger, B. E., A. C. Nica, et al. (2007). "Population genomics of human gene expression." Nat Genet 39(10): 1217-24.
Struhl, K. (1999). "Fundamentally different logic of gene regulation in eukaryotes and prokaryotes." Cell 98(1): 1-4.
Szklo, M. (1998). "Population-based cohort studies." Epidemiol Rev 20(1): 81-90. Takeuchi, F., K. Yanai, et al. (2005). "Linkage disequilibrium grouping of single
nucleotide polymorphisms (SNPs) reflecting haplotype phylogeny for efficient selection of tag SNPs." Genetics 170(1): 291-304.
94
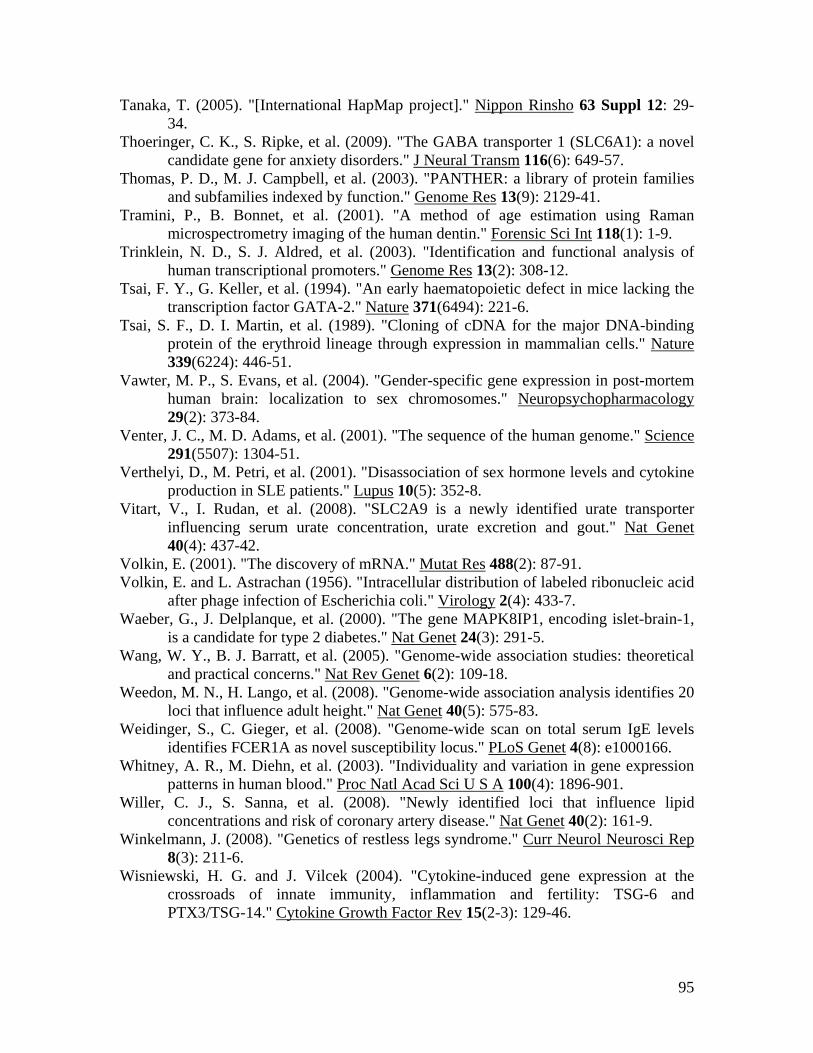
Tanaka, T. (2005). "[International HapMap project]." Nippon Rinsho 63 Suppl 12: 29-34.
Thoeringer, C. K., S. Ripke, et al. (2009). "The GABA transporter 1 (SLC6A1): a novel candidate gene for anxiety disorders." J Neural Transm 116(6): 649-57.
Thomas, P. D., M. J. Campbell, et al. (2003). "PANTHER: a library of protein families and subfamilies indexed by function." Genome Res 13(9): 2129-41.
Tramini, P., B. Bonnet, et al. (2001). "A method of age estimation using Raman microspectrometry imaging of the human dentin." Forensic Sci Int 118(1): 1-9.
Trinklein, N. D., S. J. Aldred, et al. (2003). "Identification and functional analysis of human transcriptional promoters." Genome Res 13(2): 308-12.
Tsai, F. Y., G. Keller, et al. (1994). "An early haematopoietic defect in mice lacking the transcription factor GATA-2." Nature 371(6494): 221-6.
Tsai, S. F., D. I. Martin, et al. (1989). "Cloning of cDNA for the major DNA-binding protein of the erythroid lineage through expression in mammalian cells." Nature 339(6224): 446-51.
Vawter, M. P., S. Evans, et al. (2004). "Gender-specific gene expression in post-mortem human brain: localization to sex chromosomes." Neuropsychopharmacology 29(2): 373-84.
Venter, J. C., M. D. Adams, et al. (2001). "The sequence of the human genome." Science 291(5507): 1304-51.
Verthelyi, D., M. Petri, et al. (2001). "Disassociation of sex hormone levels and cytokine production in SLE patients." Lupus 10(5): 352-8.
Vitart, V., I. Rudan, et al. (2008). "SLC2A9 is a newly identified urate transporter influencing serum urate concentration, urate excretion and gout." Nat Genet 40(4): 437-42.
Volkin, E. (2001). "The discovery of mRNA." Mutat Res 488(2): 87-91. Volkin, E. and L. Astrachan (1956). "Intracellular distribution of labeled ribonucleic acid
after phage infection of Escherichia coli." Virology 2(4): 433-7. Waeber, G., J. Delplanque, et al. (2000). "The gene MAPK8IP1, encoding islet-brain-1,
is a candidate for type 2 diabetes." Nat Genet 24(3): 291-5. Wang, W. Y., B. J. Barratt, et al. (2005). "Genome-wide association studies: theoretical
and practical concerns." Nat Rev Genet 6(2): 109-18. Weedon, M. N., H. Lango, et al. (2008). "Genome-wide association analysis identifies 20
loci that influence adult height." Nat Genet 40(5): 575-83. Weidinger, S., C. Gieger, et al. (2008). "Genome-wide scan on total serum IgE levels
identifies FCER1A as novel susceptibility locus." PLoS Genet 4(8): e1000166. Whitney, A. R., M. Diehn, et al. (2003). "Individuality and variation in gene expression
patterns in human blood." Proc Natl Acad Sci U S A 100(4): 1896-901. Willer, C. J., S. Sanna, et al. (2008). "Newly identified loci that influence lipid
concentrations and risk of coronary artery disease." Nat Genet 40(2): 161-9. Winkelmann, J. (2008). "Genetics of restless legs syndrome." Curr Neurol Neurosci Rep
8(3): 211-6. Wisniewski, H. G. and J. Vilcek (2004). "Cytokine-induced gene expression at the
crossroads of innate immunity, inflammation and fertility: TSG-6 and PTX3/TSG-14." Cytokine Growth Factor Rev 15(2-3): 129-46.
95
Wray, G. A., M. W. Hahn, et al. (2003). "The evolution of transcriptional regulation in eukaryotes." Mol Biol Evol 20(9): 1377-419.
WTCCC (2007). "Genome-wide association study of 14,000 cases of seven common diseases and 3,000 shared controls." Nature 447(7145): 661-78.
Yang, Y. H., S. Dudoit, et al. (2002). "Normalization for cDNA microarray data: a robust composite method addressing single and multiple slide systematic variation." Nucleic Acids Res 30(4): e15.
Zeggini, E., L. J. Scott, et al. (2008). "Meta-analysis of genome-wide association data and large-scale replication identifies additional susceptibility loci for type 2 diabetes." Nat Genet 40(5): 638-45.
96
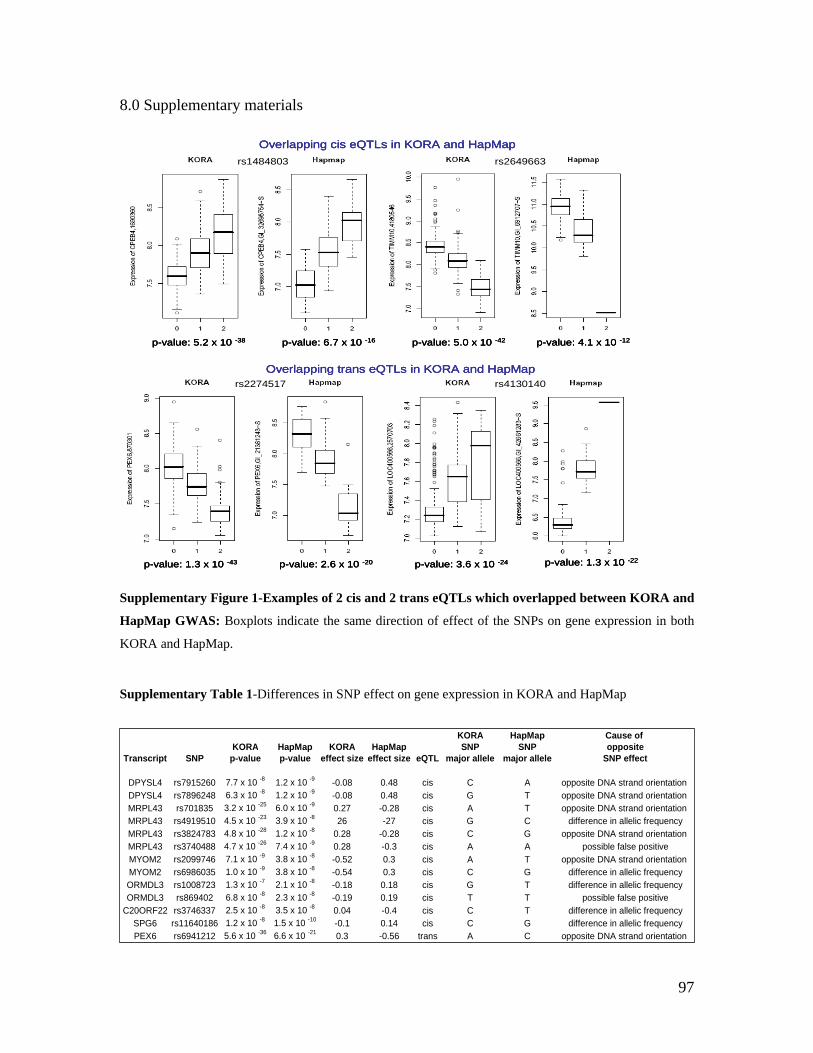
8.0 Supplementary materials
rs2649663rs1484803
Overlapping cis eQTLs in KORA and HapMap
p-value: 5.2 x 10 -38 p-value: 6.7 x 10 -16 p-value: 5.0 x 10 -42 p-value: 4.1 x 10 -12
rs4130140rs2274517Overlapping trans eQTLs in KORA and HapMap
p-value: 1.3 x 10 -43 p-value: 2.6 x 10 -20 p-value: 3.6 x 10 -24 p-value: 1.3 x 10 -22
rs2649663rs1484803
Overlapping cis eQTLs in KORA and HapMap
p-value: 5.2 x 10 -38 p-value: 6.7 x 10 -16 p-value: 5.0 x 10 -42 p-value: 4.1 x 10 -12
rs2649663rs1484803
Overlapping cis eQTLs in KORA and HapMap
p-value: 5.2 x 10 -38 p-value: 6.7 x 10 -16 p-value: 5.0 x 10 -42 p-value: 4.1 x 10 -12
rs4130140rs2274517Overlapping trans eQTLs in KORA and HapMap
p-value: 1.3 x 10 -43 p-value: 2.6 x 10 -20 p-value: 3.6 x 10 -24 p-value: 1.3 x 10 -22
rs4130140rs2274517Overlapping trans eQTLs in KORA and HapMap
p-value: 1.3 x 10 -43 p-value: 2.6 x 10 -20 p-value: 3.6 x 10 -24 p-value: 1.3 x 10 -22
Supplementary Figure 1-Examples of 2 cis and 2 trans eQTLs which overlapped between KORA and
HapMap GWAS: Boxplots indicate the same direction of effect of the SNPs on gene expression in both
KORA and HapMap.
Supplementary Table 1-Differences in SNP effect on gene expression in KORA and HapMap
KORA HapMap Cause of KORA HapMap KORA HapMap SNP SNP opposite
Transcript SNP p-value p-value effect size effect size eQTL major allele major allele SNP effect
DPYSL4 rs7915260 7.7 x 10 -8 1.2 x 10 -9 -0.08 0.48 cis C A opposite DNA strand orientation DPYSL4 rs7896248 6.3 x 10 -8 1.2 x 10 -9 -0.08 0.48 cis G T opposite DNA strand orientation MRPL43 rs701835 3.2 x 10 -25 6.0 x 10 -9 0.27 -0.28 cis A T opposite DNA strand orientation MRPL43 rs4919510 4.5 x 10 -23 3.9 x 10 -8 26 -27 cis G C difference in allelic frequencyMRPL43 rs3824783 4.8 x 10 -28 1.2 x 10 -8 0.28 -0.28 cis C G opposite DNA strand orientation MRPL43 rs3740488 4.7 x 10 -26 7.4 x 10 -9 0.28 -0.3 cis A A possible false positiveMYOM2 rs2099746 7.1 x 10 -9 3.8 x 10 -8 -0.52 0.3 cis A T opposite DNA strand orientation MYOM2 rs6986035 1.0 x 10 -9 3.8 x 10 -8 -0.54 0.3 cis C G difference in allelic frequencyORMDL3 rs1008723 1.3 x 10 -7 2.1 x 10 -8 -0.18 0.18 cis G T difference in allelic frequencyORMDL3 rs869402 6.8 x 10 -8 2.3 x 10 -8 -0.19 0.19 cis T T possible false positive
C20ORF22 rs3746337 2.5 x 10 -8 3.5 x 10 -8 0.04 -0.4 cis C T difference in allelic frequencySPG6 rs11640186 1.2 x 10 -8 1.5 x 10 -10 -0.1 0.14 cis C G difference in allelic frequencyPEX6 rs6941212 5.6 x 10 -36 6.6 x 10 -21 0.3 -0.56 trans A C opposite DNA strand orientation
97
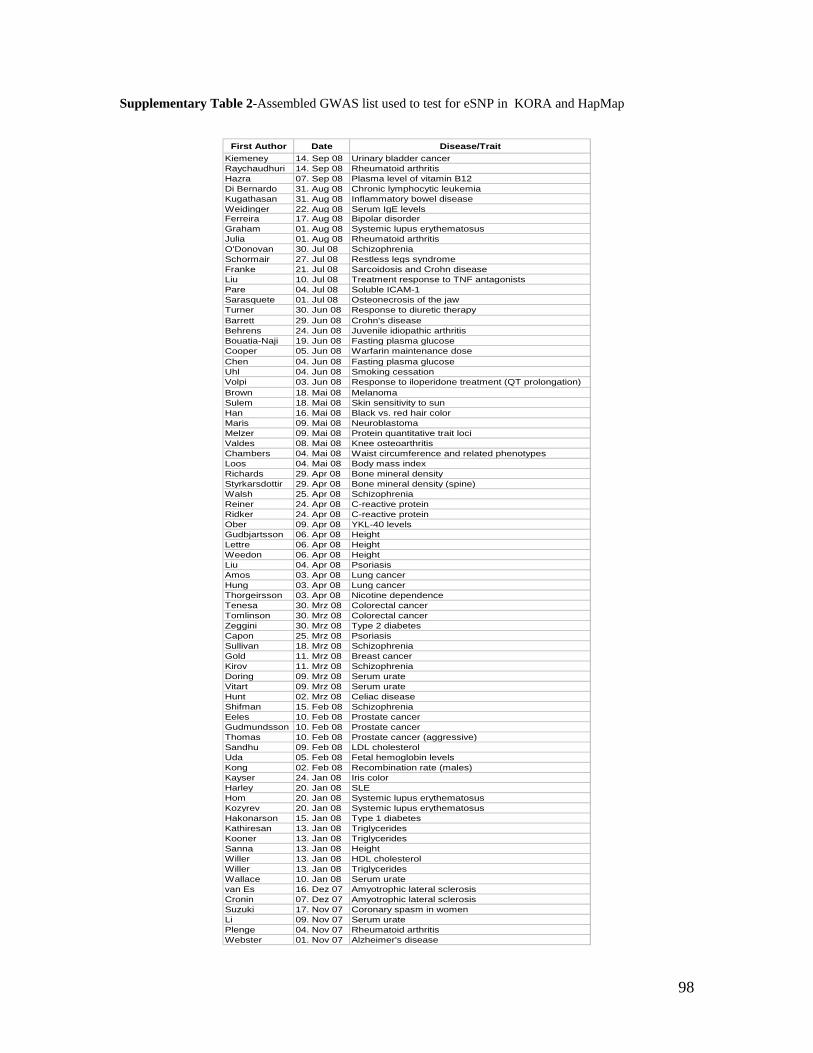
Supplementary Table 2-Assembled GWAS list used to test for eSNP in KORA and HapMap
First Author Date Disease/TraitKiemeney 14. Sep 08 Urinary bladder cancerRaychaudhuri 14. Sep 08 Rheumatoid arthritisHazra 07. Sep 08 Plasma level of vitamin B12Di Bernardo 31. Aug 08 Chronic lymphocytic leukemiaKugathasan 31. Aug 08 Inflammatory bowel diseaseWeidinger 22. Aug 08 Serum IgE levelsFerreira 17. Aug 08 Bipolar disorderGraham 01. Aug 08 Systemic lupus erythematosusJulia 01. Aug 08 Rheumatoid arthritisO'Donovan 30. Jul 08 SchizophreniaSchormair 27. Jul 08 Restless legs syndromeFranke 21. Jul 08 Sarcoidosis and Crohn diseaseLiu 10. Jul 08 Treatment response to TNF antagonistsPare 04. Jul 08 Soluble ICAM-1Sarasquete 01. Jul 08 Osteonecrosis of the jawTurner 30. Jun 08 Response to diuretic therapyBarrett 29. Jun 08 Crohn's diseaseBehrens 24. Jun 08 Juvenile idiopathic arthritisBouatia-Naji 19. Jun 08 Fasting plasma glucoseCooper 05. Jun 08 Warfarin maintenance doseChen 04. Jun 08 Fasting plasma glucoseUhl 04. Jun 08 Smoking cessationVolpi 03. Jun 08 Response to iloperidone treatment (QT prolongation)Brown 18. Mai 08 MelanomaSulem 18. Mai 08 Skin sensitivity to sunHan 16. Mai 08 Black vs. red hair colorMaris 09. Mai 08 NeuroblastomaMelzer 09. Mai 08 Protein quantitative trait lociValdes 08. Mai 08 Knee osteoarthritisChambers 04. Mai 08 Waist circumference and related phenotypesLoos 04. Mai 08 Body mass indexRichards 29. Apr 08 Bone mineral densityStyrkarsdottir 29. Apr 08 Bone mineral density (spine)Walsh 25. Apr 08 SchizophreniaReiner 24. Apr 08 C-reactive proteinRidker 24. Apr 08 C-reactive proteinOber 09. Apr 08 YKL-40 levelsGudbjartsson 06. Apr 08 HeightLettre 06. Apr 08 HeightWeedon 06. Apr 08 HeightLiu 04. Apr 08 PsoriasisAmos 03. Apr 08 Lung cancerHung 03. Apr 08 Lung cancerThorgeirsson 03. Apr 08 Nicotine dependenceTenesa 30. Mrz 08 Colorectal cancerTomlinson 30. Mrz 08 Colorectal cancerZeggini 30. Mrz 08 Type 2 diabetesCapon 25. Mrz 08 PsoriasisSullivan 18. Mrz 08 SchizophreniaGold 11. Mrz 08 Breast cancerKirov 11. Mrz 08 SchizophreniaDoring 09. Mrz 08 Serum urateVitart 09. Mrz 08 Serum urateHunt 02. Mrz 08 Celiac diseaseShifman 15. Feb 08 SchizophreniaEeles 10. Feb 08 Prostate cancerGudmundsson 10. Feb 08 Prostate cancerThomas 10. Feb 08 Prostate cancer (aggressive)Sandhu 09. Feb 08 LDL cholesterolUda 05. Feb 08 Fetal hemoglobin levelsKong 02. Feb 08 Recombination rate (males)Kayser 24. Jan 08 Iris colorHarley 20. Jan 08 SLEHom 20. Jan 08 Systemic lupus erythematosusKozyrev 20. Jan 08 Systemic lupus erythematosusHakonarson 15. Jan 08 Type 1 diabetesKathiresan 13. Jan 08 TriglyceridesKooner 13. Jan 08 TriglyceridesSanna 13. Jan 08 HeightWiller 13. Jan 08 HDL cholesterolWiller 13. Jan 08 TriglyceridesWallace 10. Jan 08 Serum uratevan Es 16. Dez 07 Amyotrophic lateral sclerosisCronin 07. Dez 07 Amyotrophic lateral sclerosisSuzuki 17. Nov 07 Coronary spasm in womenLi 09. Nov 07 Serum uratePlenge 04. Nov 07 Rheumatoid arthritisWebster 01. Nov 07 Alzheimer's disease
98
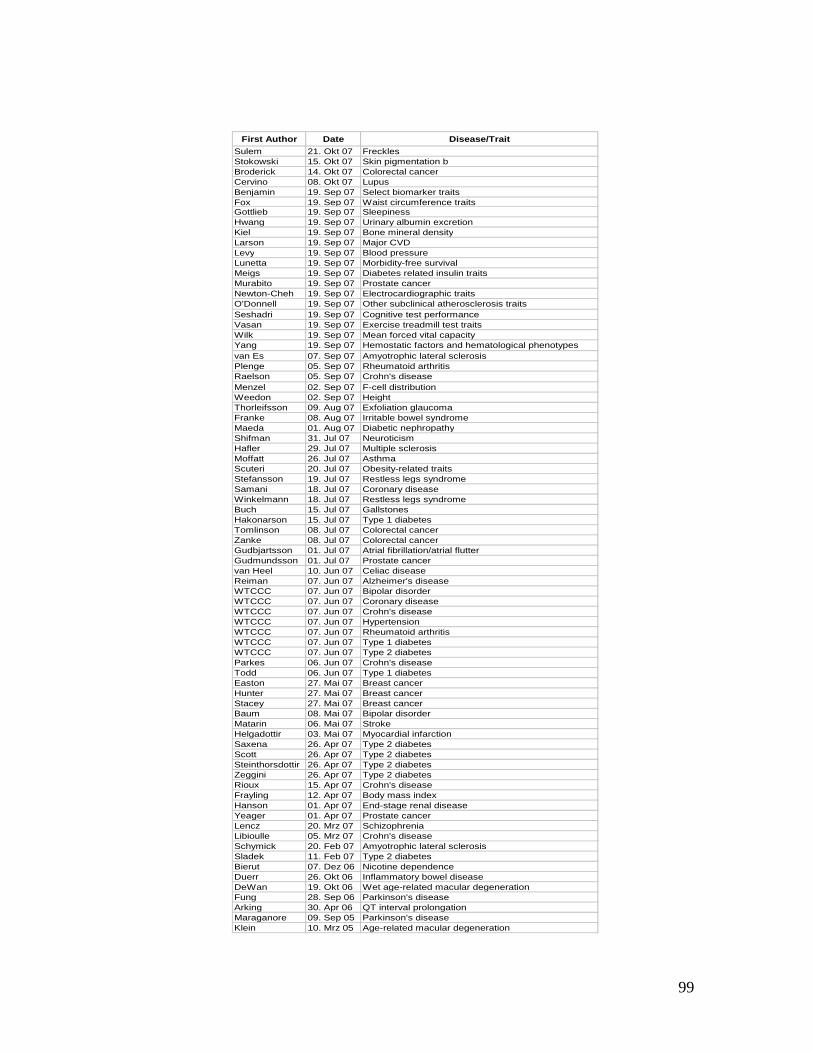
First Author Date Disease/TraitSulem 21. Okt 07 FrecklesStokowski 15. Okt 07 Skin pigmentation bBroderick 14. Okt 07 Colorectal cancerCervino 08. Okt 07 LupusBenjamin 19. Sep 07 Select biomarker traitsFox 19. Sep 07 Waist circumference traitsGottlieb 19. Sep 07 SleepinessHwang 19. Sep 07 Urinary albumin excretionKiel 19. Sep 07 Bone mineral densityLarson 19. Sep 07 Major CVDLevy 19. Sep 07 Blood pressureLunetta 19. Sep 07 Morbidity-free survivalMeigs 19. Sep 07 Diabetes related insulin traitsMurabito 19. Sep 07 Prostate cancerNewton-Cheh 19. Sep 07 Electrocardiographic traitsO'Donnell 19. Sep 07 Other subclinical atherosclerosis traitsSeshadri 19. Sep 07 Cognitive test performanceVasan 19. Sep 07 Exercise treadmill test traitsWilk 19. Sep 07 Mean forced vital capacity Yang 19. Sep 07 Hemostatic factors and hematological phenotypesvan Es 07. Sep 07 Amyotrophic lateral sclerosisPlenge 05. Sep 07 Rheumatoid arthritisRaelson 05. Sep 07 Crohn's diseaseMenzel 02. Sep 07 F-cell distributionWeedon 02. Sep 07 HeightThorleifsson 09. Aug 07 Exfoliation glaucomaFranke 08. Aug 07 Irritable bowel syndromeMaeda 01. Aug 07 Diabetic nephropathyShifman 31. Jul 07 NeuroticismHafler 29. Jul 07 Multiple sclerosisMoffatt 26. Jul 07 AsthmaScuteri 20. Jul 07 Obesity-related traitsStefansson 19. Jul 07 Restless legs syndromeSamani 18. Jul 07 Coronary diseaseWinkelmann 18. Jul 07 Restless legs syndromeBuch 15. Jul 07 GallstonesHakonarson 15. Jul 07 Type 1 diabetesTomlinson 08. Jul 07 Colorectal cancerZanke 08. Jul 07 Colorectal cancerGudbjartsson 01. Jul 07 Atrial fibrillation/atrial flutterGudmundsson 01. Jul 07 Prostate cancervan Heel 10. Jun 07 Celiac diseaseReiman 07. Jun 07 Alzheimer's diseaseWTCCC 07. Jun 07 Bipolar disorderWTCCC 07. Jun 07 Coronary diseaseWTCCC 07. Jun 07 Crohn's diseaseWTCCC 07. Jun 07 HypertensionWTCCC 07. Jun 07 Rheumatoid arthritisWTCCC 07. Jun 07 Type 1 diabetesWTCCC 07. Jun 07 Type 2 diabetesParkes 06. Jun 07 Crohn's diseaseTodd 06. Jun 07 Type 1 diabetesEaston 27. Mai 07 Breast cancerHunter 27. Mai 07 Breast cancerStacey 27. Mai 07 Breast cancerBaum 08. Mai 07 Bipolar disorderMatarin 06. Mai 07 StrokeHelgadottir 03. Mai 07 Myocardial infarctionSaxena 26. Apr 07 Type 2 diabetesScott 26. Apr 07 Type 2 diabetesSteinthorsdottir 26. Apr 07 Type 2 diabetesZeggini 26. Apr 07 Type 2 diabetesRioux 15. Apr 07 Crohn's diseaseFrayling 12. Apr 07 Body mass indexHanson 01. Apr 07 End-stage renal diseaseYeager 01. Apr 07 Prostate cancerLencz 20. Mrz 07 SchizophreniaLibioulle 05. Mrz 07 Crohn's diseaseSchymick 20. Feb 07 Amyotrophic lateral sclerosisSladek 11. Feb 07 Type 2 diabetesBierut 07. Dez 06 Nicotine dependenceDuerr 26. Okt 06 Inflammatory bowel diseaseDeWan 19. Okt 06 Wet age-related macular degenerationFung 28. Sep 06 Parkinson's diseaseArking 30. Apr 06 QT interval prolongationMaraganore 09. Sep 05 Parkinson's diseaseKlein 10. Mrz 05 Age-related macular degeneration
99
9.0 List of abbreviations
- °C : degrees celsius
- ATP : adenosine triphosphate
- CDCV : common disease common variant
- cDNA : complementary deoxyribonucleic acid
- CEPH/CEU : Centre d'Etude du Polymorphisme Humain
- cRNA : complementary ribonucleic acid
- Cy3 : cyanine 3
- DNA : deoxyribonucleic acid
- EBV : epstein-barr virus
- eQTL : expression quantitative trait loci
- F3/4 : follow-up 3/4
- GINI : German infant nutritional intervention program
- GWAS : genome wide association studies
- Hyb : hybridization
- IgE : immunoglobulin E
- ISAAC : International study of asthma and allergy in childhood
- kb : kilo base
- KORA : Cooperative health research in the region Augsburg
- LCL : lymphoblast cell line
- LD : linkage disequilibrium
- LISA : Influences of lifestyle-related factors on the immune system and the
development of allergies in childhood study.
- LOWESS : Locally weighted scatter plot smoothing
100

- Mb : Mega base
- MCR : Major histocompatibility region
- mg/dl : milligrams per deciliter
- ml : milliliter
- mpv : mean platelet volume
- mRNA : messenger ribonucleic acid
- ng : nanogram
- PAM : Prediction analysis for microarray
- PCR : Polymerase chain reaction
- QC : Quality control
- RIN : RNA integrity number
- RNA : Ribonucleic acid
- rpm : revolutions per minute
- RT-PCR : Real-time polymerase chain reaction
- S3/4 : Survey 3/4
- SAPHIR : Salzburg atherosclerosis prevention program in subjects at high
individual risk
- SHIP : Study of health in Pomerania
- SLE : Systemic lupus erythematosus
- SNPs : Single nucleotide polymorphisms
- UTR : Untranslated region
- μl : micro liter
101

102
10.0 Acknowledgements
Behind every successful PhD student is a group of people who made it possible. This
section is dedicated to all those people who made it possible for me.
First of I would like to extend my heartfelt gratitude to both Professor Thomas Meitinger
and Dr.Holger Prokisch for giving me the opportunity to work under their wings.
Professor Meitinger I would like to thank for all his guidance and critical but always
useful comments on my work. It was an honor to work under him and gain from his vast
knowledge and expertise. I thank Holger Prokisch for his excellent supervision and
enthusiasm and for valuable comments and inputs. I thank Katharina Heim for the
statistical analyses and for putting up with my millions of questions and requests. I thank
Professor Bertram Müller-Myhsok for his expert advice on the final statistical analyses. I
am thankful to Prof. H.-E Wichmann and the entire KORA team for giving me access to
the KORA resources. I would like to mention my gratitude towards Professor Adamski
for all his help and support. I am very grateful to Professor Fries and Professor Gierl for
their help and for agreeing to be my examiners. Furthermore, I acknowledge the efforts of
all the reviewers who have taken the time to read this thesis.
My gratitude extends to my work colleagues Uwe Ahting (for all his guidance in the lab
and beyond), Marieta Borzes (who never let me feel homesick), Anna Benet-Pages and
Nuria (for the help, encouragement and discussions), Bettina Ries (to let me to ein igeln
in her office). The love and support of all my friends and family especially my aunt
Anima Kapadia, best friend Swapna Lagisetty and cousin Priya Patil helped me through
these three years of my PhD.
I owe my deepest gratitude to Yogesh Bhanu (for always helping me, believing in me and
most importantly for his endless patience when it was most needed).
All this would have never been possible without the love and support of my mother
Minal Mehta and my father Deepak Mehta (who guided me through every step in my
career and life). I am forever indebted to my parents for their understanding. They are my
pillars of support and it is their encouragement which allows me to go on.
Saving the best for last, I would finally like to thank my nani (grandma) Susheela Choksi
for standing by me always.
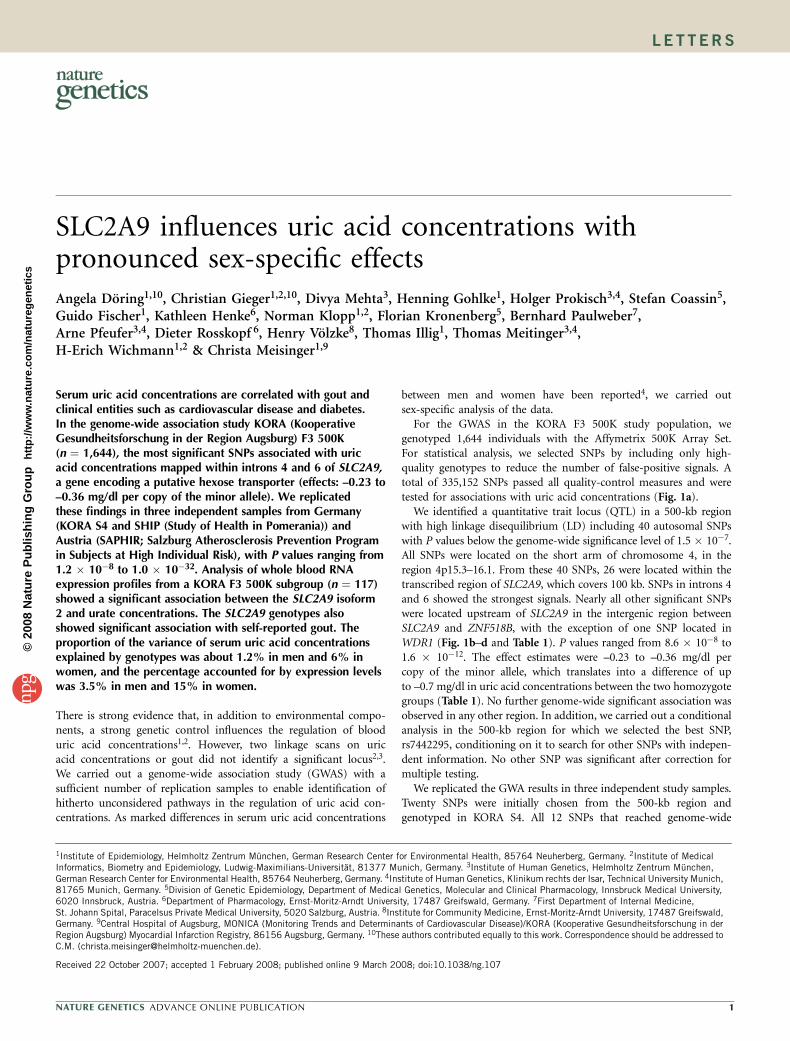
SLC2A9 influences uric acid concentrations withpronounced sex-specific effectsAngela Doring1,10, Christian Gieger1,2,10, Divya Mehta3, Henning Gohlke1, Holger Prokisch3,4, Stefan Coassin5,Guido Fischer1, Kathleen Henke6, Norman Klopp1,2, Florian Kronenberg5, Bernhard Paulweber7,Arne Pfeufer3,4, Dieter Rosskopf 6, Henry Volzke8, Thomas Illig1, Thomas Meitinger3,4,H-Erich Wichmann1,2 & Christa Meisinger1,9
Serum uric acid concentrations are correlated with gout andclinical entities such as cardiovascular disease and diabetes.In the genome-wide association study KORA (KooperativeGesundheitsforschung in der Region Augsburg) F3 500K(n ¼ 1,644), the most significant SNPs associated with uricacid concentrations mapped within introns 4 and 6 of SLC2A9,a gene encoding a putative hexose transporter (effects: –0.23 to–0.36 mg/dl per copy of the minor allele). We replicatedthese findings in three independent samples from Germany(KORA S4 and SHIP (Study of Health in Pomerania)) andAustria (SAPHIR; Salzburg Atherosclerosis Prevention Programin Subjects at High Individual Risk), with P values ranging from1.2 � 10�8 to 1.0 � 10�32. Analysis of whole blood RNAexpression profiles from a KORA F3 500K subgroup (n ¼ 117)showed a significant association between the SLC2A9 isoform2 and urate concentrations. The SLC2A9 genotypes alsoshowed significant association with self-reported gout. Theproportion of the variance of serum uric acid concentrationsexplained by genotypes was about 1.2% in men and 6% inwomen, and the percentage accounted for by expression levelswas 3.5% in men and 15% in women.
There is strong evidence that, in addition to environmental compo-nents, a strong genetic control influences the regulation of blooduric acid concentrations1,2. However, two linkage scans on uricacid concentrations or gout did not identify a significant locus2,3.We carried out a genome-wide association study (GWAS) with asufficient number of replication samples to enable identification ofhitherto unconsidered pathways in the regulation of uric acid con-centrations. As marked differences in serum uric acid concentrations
between men and women have been reported4, we carried outsex-specific analysis of the data.
For the GWAS in the KORA F3 500K study population, wegenotyped 1,644 individuals with the Affymetrix 500K Array Set.For statistical analysis, we selected SNPs by including only high-quality genotypes to reduce the number of false-positive signals. Atotal of 335,152 SNPs passed all quality-control measures and weretested for associations with uric acid concentrations (Fig. 1a).
We identified a quantitative trait locus (QTL) in a 500-kb regionwith high linkage disequilibrium (LD) including 40 autosomal SNPswith P values below the genome-wide significance level of 1.5 � 10�7.All SNPs were located on the short arm of chromosome 4, in theregion 4p15.3–16.1. From these 40 SNPs, 26 were located within thetranscribed region of SLC2A9, which covers 100 kb. SNPs in introns 4and 6 showed the strongest signals. Nearly all other significant SNPswere located upstream of SLC2A9 in the intergenic region betweenSLC2A9 and ZNF518B, with the exception of one SNP located inWDR1 (Fig. 1b–d and Table 1). P values ranged from 8.6 � 10�8 to1.6 � 10�12. The effect estimates were –0.23 to –0.36 mg/dl percopy of the minor allele, which translates into a difference of upto –0.7 mg/dl in uric acid concentrations between the two homozygotegroups (Table 1). No further genome-wide significant association wasobserved in any other region. In addition, we carried out a conditionalanalysis in the 500-kb region for which we selected the best SNP,rs7442295, conditioning on it to search for other SNPs with indepen-dent information. No other SNP was significant after correction formultiple testing.
We replicated the GWA results in three independent study samples.Twenty SNPs were initially chosen from the 500-kb region andgenotyped in KORA S4. All 12 SNPs that reached genome-wide
©20
08 N
atu
re P
ub
lish
ing
Gro
up
h
ttp
://w
ww
.nat
ure
.co
m/n
atu
reg
enet
ics
Received 22 October 2007; accepted 1 February 2008; published online 9 March 2008; doi:10.1038/ng.107
1Institute of Epidemiology, Helmholtz Zentrum Munchen, German Research Center for Environmental Health, 85764 Neuherberg, Germany. 2Institute of MedicalInformatics, Biometry and Epidemiology, Ludwig-Maximilians-Universitat, 81377 Munich, Germany. 3Institute of Human Genetics, Helmholtz Zentrum Munchen,German Research Center for Environmental Health, 85764 Neuherberg, Germany. 4Institute of Human Genetics, Klinikum rechts der Isar, Technical University Munich,81765 Munich, Germany. 5Division of Genetic Epidemiology, Department of Medical Genetics, Molecular and Clinical Pharmacology, Innsbruck Medical University,6020 Innsbruck, Austria. 6Department of Pharmacology, Ernst-Moritz-Arndt University, 17487 Greifswald, Germany. 7First Department of Internal Medicine,St. Johann Spital, Paracelsus Private Medical University, 5020 Salzburg, Austria. 8Institute for Community Medicine, Ernst-Moritz-Arndt University, 17487 Greifswald,Germany. 9Central Hospital of Augsburg, MONICA (Monitoring Trends and Determinants of Cardiovascular Disease)/KORA (Kooperative Gesundheitsforschung in derRegion Augsburg) Myocardial Infarction Registry, 86156 Augsburg, Germany. 10These authors contributed equally to this work. Correspondence should be addressed toC.M. ([email protected]).
NATURE GENETICS ADVANCE ONLINE PUBLICATION 1
LET TERS
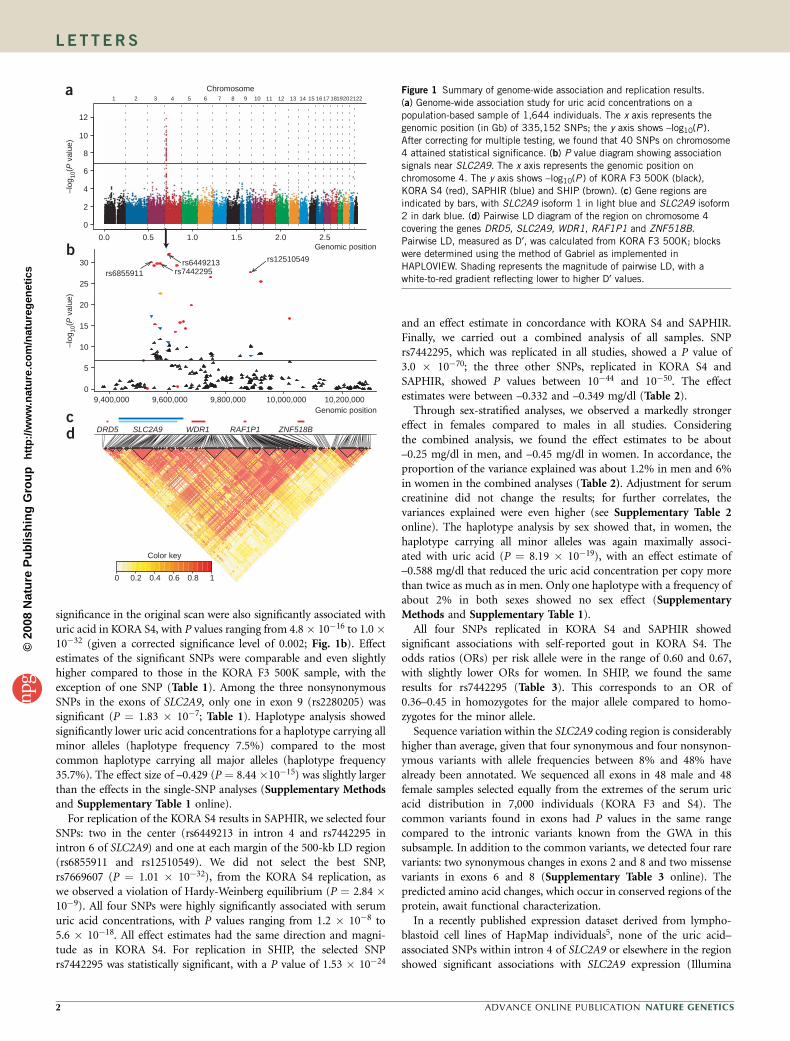
significance in the original scan were also significantly associated withuric acid in KORA S4, with P values ranging from 4.8� 10�16 to 1.0�10�32 (given a corrected significance level of 0.002; Fig. 1b). Effectestimates of the significant SNPs were comparable and even slightlyhigher compared to those in the KORA F3 500K sample, with theexception of one SNP (Table 1). Among the three nonsynonymousSNPs in the exons of SLC2A9, only one in exon 9 (rs2280205) wassignificant (P ¼ 1.83 � 10�7; Table 1). Haplotype analysis showedsignificantly lower uric acid concentrations for a haplotype carrying allminor alleles (haplotype frequency 7.5%) compared to the mostcommon haplotype carrying all major alleles (haplotype frequency35.7%). The effect size of –0.429 (P ¼ 8.44�10�15) was slightly largerthan the effects in the single-SNP analyses (Supplementary Methodsand Supplementary Table 1 online).
For replication of the KORA S4 results in SAPHIR, we selected fourSNPs: two in the center (rs6449213 in intron 4 and rs7442295 inintron 6 of SLC2A9) and one at each margin of the 500-kb LD region(rs6855911 and rs12510549). We did not select the best SNP,rs7669607 (P ¼ 1.01 � 10�32), from the KORA S4 replication, aswe observed a violation of Hardy-Weinberg equilibrium (P ¼ 2.84 �10�9). All four SNPs were highly significantly associated with serumuric acid concentrations, with P values ranging from 1.2 � 10�8 to5.6 � 10�18. All effect estimates had the same direction and magni-tude as in KORA S4. For replication in SHIP, the selected SNPrs7442295 was statistically significant, with a P value of 1.53 � 10�24
and an effect estimate in concordance with KORA S4 and SAPHIR.Finally, we carried out a combined analysis of all samples. SNPrs7442295, which was replicated in all studies, showed a P value of3.0 � 10�70; the three other SNPs, replicated in KORA S4 andSAPHIR, showed P values between 10�44 and 10�50. The effectestimates were between –0.332 and –0.349 mg/dl (Table 2).
Through sex-stratified analyses, we observed a markedly strongereffect in females compared to males in all studies. Consideringthe combined analysis, we found the effect estimates to be about–0.25 mg/dl in men, and –0.45 mg/dl in women. In accordance, theproportion of the variance explained was about 1.2% in men and 6%in women in the combined analyses (Table 2). Adjustment for serumcreatinine did not change the results; for further correlates, thevariances explained were even higher (see Supplementary Table 2online). The haplotype analysis by sex showed that, in women, thehaplotype carrying all minor alleles was again maximally associ-ated with uric acid (P ¼ 8.19 � 10�19), with an effect estimate of–0.588 mg/dl that reduced the uric acid concentration per copy morethan twice as much as in men. Only one haplotype with a frequency ofabout 2% in both sexes showed no sex effect (SupplementaryMethods and Supplementary Table 1).
All four SNPs replicated in KORA S4 and SAPHIR showedsignificant associations with self-reported gout in KORA S4. Theodds ratios (ORs) per risk allele were in the range of 0.60 and 0.67,with slightly lower ORs for women. In SHIP, we found the sameresults for rs7442295 (Table 3). This corresponds to an OR of0.36–0.45 in homozygotes for the major allele compared to homo-zygotes for the minor allele.
Sequence variation within the SLC2A9 coding region is considerablyhigher than average, given that four synonymous and four nonsynon-ymous variants with allele frequencies between 8% and 48% havealready been annotated. We sequenced all exons in 48 male and 48female samples selected equally from the extremes of the serum uricacid distribution in 7,000 individuals (KORA F3 and S4). Thecommon variants found in exons had P values in the same rangecompared to the intronic variants known from the GWA in thissubsample. In addition to the common variants, we detected four rarevariants: two synonymous changes in exons 2 and 8 and two missensevariants in exons 6 and 8 (Supplementary Table 3 online). Thepredicted amino acid changes, which occur in conserved regions of theprotein, await functional characterization.
In a recently published expression dataset derived from lympho-blastoid cell lines of HapMap individuals5, none of the uric acid–associated SNPs within intron 4 of SLC2A9 or elsewhere in the regionshowed significant associations with SLC2A9 expression (Illumina
©20
08 N
atu
re P
ub
lish
ing
Gro
up
h
ttp
://w
ww
.nat
ure
.co
m/n
atu
reg
enet
ics
DRD5 SLC2A9 WDR1 RAF1P1 ZNF518B
–log
10(P
val
ue)
0
5
10
15
20
25
30rs7442295rs6855911
rs6449213 rs12510549
Color key
0 0.2 0.4 0.6 0.8 1
c
b
a
d
0.0 0.5 1.0 1.5 2.0 2.5
0
2
4
6
8
10
12
1 2 3 4 5 6 7 8 9 10 11 12 13 14 15 1617 1819202122
Genomic position
Chromosome
–log
10(P
val
ue)
Genomic position
9,400,000 9,600,000 9,800,000 10,000,000 10,200,000
Figure 1 Summary of genome-wide association and replication results.
(a) Genome-wide association study for uric acid concentrations on a
population-based sample of 1,644 individuals. The x axis represents the
genomic position (in Gb) of 335,152 SNPs; the y axis shows –log10(P ).
After correcting for multiple testing, we found that 40 SNPs on chromosome
4 attained statistical significance. (b) P value diagram showing association
signals near SLC2A9. The x axis represents the genomic position on
chromosome 4. The y axis shows –log10(P ) of KORA F3 500K (black),
KORA S4 (red), SAPHIR (blue) and SHIP (brown). (c) Gene regions are
indicated by bars, with SLC2A9 isoform 1 in light blue and SLC2A9 isoform
2 in dark blue. (d) Pairwise LD diagram of the region on chromosome 4
covering the genes DRD5, SLC2A9, WDR1, RAF1P1 and ZNF518B.
Pairwise LD, measured as D¢, was calculated from KORA F3 500K; blocks
were determined using the method of Gabriel as implemented in
HAPLOVIEW. Shading represents the magnitude of pairwise LD, with awhite-to-red gradient reflecting lower to higher D¢ values.
2 ADVANCE ONLINE PUBLICATION NATURE GENETICS
LET TERS
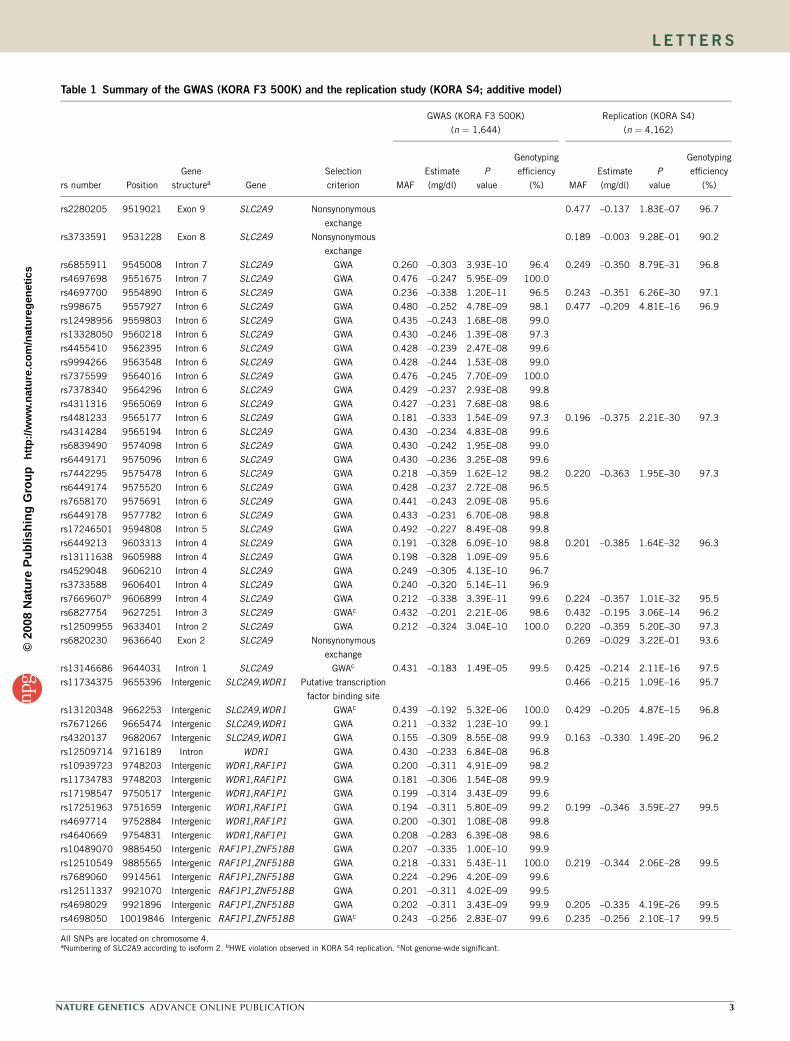
©20
08 N
atu
re P
ub
lish
ing
Gro
up
h
ttp
://w
ww
.nat
ure
.co
m/n
atu
reg
enet
ics
Table 1 Summary of the GWAS (KORA F3 500K) and the replication study (KORA S4; additive model)
GWAS (KORA F3 500K)
(n ¼ 1,644)
Replication (KORA S4)
(n ¼ 4,162)
rs number Position
Gene
structurea Gene
Selection
criterion MAF
Estimate
(mg/dl)
P
value
Genotyping
efficiency
(%) MAF
Estimate
(mg/dl)
P
value
Genotyping
efficiency
(%)
rs2280205 9519021 Exon 9 SLC2A9 Nonsynonymous
exchange
0.477 –0.137 1.83E–07 96.7
rs3733591 9531228 Exon 8 SLC2A9 Nonsynonymous
exchange
0.189 –0.003 9.28E–01 90.2
rs6855911 9545008 Intron 7 SLC2A9 GWA 0.260 –0.303 3.93E–10 96.4 0.249 –0.350 8.79E–31 96.8
rs4697698 9551675 Intron 7 SLC2A9 GWA 0.476 –0.247 5.95E–09 100.0
rs4697700 9554890 Intron 6 SLC2A9 GWA 0.236 –0.338 1.20E–11 96.5 0.243 –0.351 6.26E–30 97.1
rs998675 9557927 Intron 6 SLC2A9 GWA 0.480 –0.252 4.78E–09 98.1 0.477 –0.209 4.81E–16 96.9
rs12498956 9559803 Intron 6 SLC2A9 GWA 0.435 –0.243 1.68E–08 99.0
rs13328050 9560218 Intron 6 SLC2A9 GWA 0.430 –0.246 1.39E–08 97.3
rs4455410 9562395 Intron 6 SLC2A9 GWA 0.428 –0.239 2.47E–08 99.6
rs9994266 9563548 Intron 6 SLC2A9 GWA 0.428 –0.244 1.53E–08 99.0
rs7375599 9564016 Intron 6 SLC2A9 GWA 0.476 –0.245 7.70E–09 100.0
rs7378340 9564296 Intron 6 SLC2A9 GWA 0.429 –0.237 2.93E–08 99.8
rs4311316 9565069 Intron 6 SLC2A9 GWA 0.427 –0.231 7.68E–08 98.6
rs4481233 9565177 Intron 6 SLC2A9 GWA 0.181 –0.333 1.54E–09 97.3 0.196 –0.375 2.21E–30 97.3
rs4314284 9565194 Intron 6 SLC2A9 GWA 0.430 –0.234 4.83E–08 99.6
rs6839490 9574098 Intron 6 SLC2A9 GWA 0.430 –0.242 1.95E–08 99.0
rs6449171 9575096 Intron 6 SLC2A9 GWA 0.430 –0.236 3.25E–08 99.6
rs7442295 9575478 Intron 6 SLC2A9 GWA 0.218 –0.359 1.62E–12 98.2 0.220 –0.363 1.95E–30 97.3
rs6449174 9575520 Intron 6 SLC2A9 GWA 0.428 –0.237 2.72E–08 96.5
rs7658170 9575691 Intron 6 SLC2A9 GWA 0.441 –0.243 2.09E–08 95.6
rs6449178 9577782 Intron 6 SLC2A9 GWA 0.433 –0.231 6.70E–08 98.8
rs17246501 9594808 Intron 5 SLC2A9 GWA 0.492 –0.227 8.49E–08 99.8
rs6449213 9603313 Intron 4 SLC2A9 GWA 0.191 –0.328 6.09E–10 98.8 0.201 –0.385 1.64E–32 96.3
rs13111638 9605988 Intron 4 SLC2A9 GWA 0.198 –0.328 1.09E–09 95.6
rs4529048 9606210 Intron 4 SLC2A9 GWA 0.249 –0.305 4.13E–10 96.7
rs3733588 9606401 Intron 4 SLC2A9 GWA 0.240 –0.320 5.14E–11 96.9
rs7669607b 9606899 Intron 4 SLC2A9 GWA 0.212 –0.338 3.39E–11 99.6 0.224 –0.357 1.01E–32 95.5
rs6827754 9627251 Intron 3 SLC2A9 GWAc 0.432 –0.201 2.21E–06 98.6 0.432 –0.195 3.06E–14 96.2
rs12509955 9633401 Intron 2 SLC2A9 GWA 0.212 –0.324 3.04E–10 100.0 0.220 –0.359 5.20E–30 97.3
rs6820230 9636640 Exon 2 SLC2A9 Nonsynonymous
exchange
0.269 –0.029 3.22E–01 93.6
rs13146686 9644031 Intron 1 SLC2A9 GWAc 0.431 –0.183 1.49E–05 99.5 0.425 –0.214 2.11E–16 97.5
rs11734375 9655396 Intergenic SLC2A9,WDR1 Putative transcription
factor binding site
0.466 –0.215 1.09E–16 95.7
rs13120348 9662253 Intergenic SLC2A9,WDR1 GWAc 0.439 –0.192 5.32E–06 100.0 0.429 –0.205 4.87E–15 96.8
rs7671266 9665474 Intergenic SLC2A9,WDR1 GWA 0.211 –0.332 1.23E–10 99.1
rs4320137 9682067 Intergenic SLC2A9,WDR1 GWA 0.155 –0.309 8.55E–08 99.9 0.163 –0.330 1.49E–20 96.2
rs12509714 9716189 Intron WDR1 GWA 0.430 –0.233 6.84E–08 96.8
rs10939723 9748203 Intergenic WDR1,RAF1P1 GWA 0.200 –0.311 4.91E–09 98.2
rs11734783 9748203 Intergenic WDR1,RAF1P1 GWA 0.181 –0.306 1.54E–08 99.9
rs17198547 9750517 Intergenic WDR1,RAF1P1 GWA 0.199 –0.314 3.43E–09 99.6
rs17251963 9751659 Intergenic WDR1,RAF1P1 GWA 0.194 –0.311 5.80E–09 99.2 0.199 –0.346 3.59E–27 99.5
rs4697714 9752884 Intergenic WDR1,RAF1P1 GWA 0.200 –0.301 1.08E–08 99.8
rs4640669 9754831 Intergenic WDR1,RAF1P1 GWA 0.208 –0.283 6.39E–08 98.6
rs10489070 9885450 Intergenic RAF1P1,ZNF518B GWA 0.207 –0.335 1.00E–10 99.9
rs12510549 9885565 Intergenic RAF1P1,ZNF518B GWA 0.218 –0.331 5.43E–11 100.0 0.219 –0.344 2.06E–28 99.5
rs7689060 9914561 Intergenic RAF1P1,ZNF518B GWA 0.224 –0.296 4.20E–09 99.6
rs12511337 9921070 Intergenic RAF1P1,ZNF518B GWA 0.201 –0.311 4.02E–09 99.5
rs4698029 9921896 Intergenic RAF1P1,ZNF518B GWA 0.202 –0.311 3.43E–09 99.9 0.205 –0.335 4.19E–26 99.5
rs4698050 10019846 Intergenic RAF1P1,ZNF518B GWAc 0.243 –0.256 2.83E–07 99.6 0.235 –0.256 2.10E–17 99.5
All SNPs are located on chromosome 4.aNumbering of SLC2A9 according to isoform 2. bHWE violation observed in KORA S4 replication. cNot genome-wide significant.
NATURE GENETICS ADVANCE ONLINE PUBLICATION 3
LET TERS
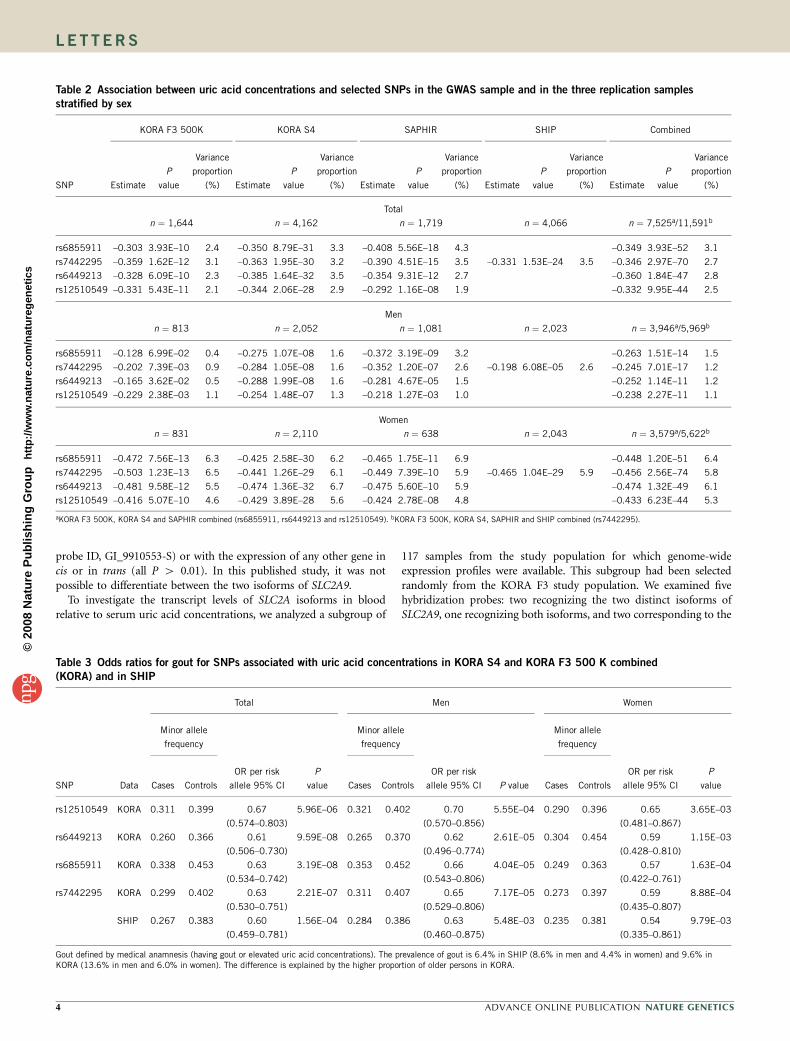
probe ID, GI_9910553-S) or with the expression of any other gene incis or in trans (all P 4 0.01). In this published study, it was notpossible to differentiate between the two isoforms of SLC2A9.
To investigate the transcript levels of SLC2A isoforms in bloodrelative to serum uric acid concentrations, we analyzed a subgroup of
117 samples from the study population for which genome-wideexpression profiles were available. This subgroup had been selectedrandomly from the KORA F3 study population. We examined fivehybridization probes: two recognizing the two distinct isoforms ofSLC2A9, one recognizing both isoforms, and two corresponding to the
©20
08 N
atu
re P
ub
lish
ing
Gro
up
h
ttp
://w
ww
.nat
ure
.co
m/n
atu
reg
enet
ics
Table 2 Association between uric acid concentrations and selected SNPs in the GWAS sample and in the three replication samples
stratified by sex
KORA F3 500K KORA S4 SAPHIR SHIP Combined
SNP Estimate
P
value
Variance
proportion
(%) Estimate
P
value
Variance
proportion
(%) Estimate
P
value
Variance
proportion
(%) Estimate
P
value
Variance
proportion
(%) Estimate
P
value
Variance
proportion
(%)
Total
n ¼ 1,644 n ¼ 4,162 n ¼ 1,719 n ¼ 4,066 n ¼ 7,525a/11,591b
rs6855911 –0.303 3.93E–10 2.4 –0.350 8.79E–31 3.3 –0.408 5.56E–18 4.3 –0.349 3.93E–52 3.1
rs7442295 –0.359 1.62E–12 3.1 –0.363 1.95E–30 3.2 –0.390 4.51E–15 3.5 –0.331 1.53E–24 3.5 –0.346 2.97E–70 2.7
rs6449213 –0.328 6.09E–10 2.3 –0.385 1.64E–32 3.5 –0.354 9.31E–12 2.7 –0.360 1.84E–47 2.8
rs12510549 –0.331 5.43E–11 2.1 –0.344 2.06E–28 2.9 –0.292 1.16E–08 1.9 –0.332 9.95E–44 2.5
Men
n ¼ 813 n ¼ 2,052 n ¼ 1,081 n ¼ 2,023 n ¼ 3,946a/5,969b
rs6855911 –0.128 6.99E–02 0.4 –0.275 1.07E–08 1.6 –0.372 3.19E–09 3.2 –0.263 1.51E–14 1.5
rs7442295 –0.202 7.39E–03 0.9 –0.284 1.05E–08 1.6 –0.352 1.20E–07 2.6 –0.198 6.08E–05 2.6 –0.245 7.01E–17 1.2
rs6449213 –0.165 3.62E–02 0.5 –0.288 1.99E–08 1.6 –0.281 4.67E–05 1.5 –0.252 1.14E–11 1.2
rs12510549 –0.229 2.38E–03 1.1 –0.254 1.48E–07 1.3 –0.218 1.27E–03 1.0 –0.238 2.27E–11 1.1
Women
n ¼ 831 n ¼ 2,110 n ¼ 638 n ¼ 2,043 n ¼ 3,579a/5,622b
rs6855911 –0.472 7.56E–13 6.3 –0.425 2.58E–30 6.2 –0.465 1.75E–11 6.9 –0.448 1.20E–51 6.4
rs7442295 –0.503 1.23E–13 6.5 –0.441 1.26E–29 6.1 –0.449 7.39E–10 5.9 –0.465 1.04E–29 5.9 –0.456 2.56E–74 5.8
rs6449213 –0.481 9.58E–12 5.5 –0.474 1.36E–32 6.7 –0.475 5.60E–10 5.9 –0.474 1.32E–49 6.1
rs12510549 –0.416 5.07E–10 4.6 –0.429 3.89E–28 5.6 –0.424 2.78E–08 4.8 –0.433 6.23E–44 5.3
aKORA F3 500K, KORA S4 and SAPHIR combined (rs6855911, rs6449213 and rs12510549). bKORA F3 500K, KORA S4, SAPHIR and SHIP combined (rs7442295).
Table 3 Odds ratios for gout for SNPs associated with uric acid concentrations in KORA S4 and KORA F3 500 K combined
(KORA) and in SHIP
Total Men Women
Minor allele
frequency
Minor allele
frequency
Minor allele
frequency
SNP Data Cases Controls
OR per risk
allele 95% CI
P
value Cases Controls
OR per risk
allele 95% CI P value Cases Controls
OR per risk
allele 95% CI
P
value
rs12510549 KORA 0.311 0.399 0.67
(0.574–0.803)
5.96E–06 0.321 0.402 0.70
(0.570–0.856)
5.55E–04 0.290 0.396 0.65
(0.481–0.867)
3.65E–03
rs6449213 KORA 0.260 0.366 0.61
(0.506–0.730)
9.59E–08 0.265 0.370 0.62
(0.496–0.774)
2.61E–05 0.304 0.454 0.59
(0.428–0.810)
1.15E–03
rs6855911 KORA 0.338 0.453 0.63
(0.534–0.742)
3.19E–08 0.353 0.452 0.66
(0.543–0.806)
4.04E–05 0.249 0.363 0.57
(0.422–0.761)
1.63E–04
rs7442295 KORA 0.299 0.402 0.63
(0.530–0.751)
2.21E–07 0.311 0.407 0.65
(0.529–0.806)
7.17E–05 0.273 0.397 0.59
(0.435–0.807)
8.88E–04
SHIP 0.267 0.383 0.60
(0.459–0.781)
1.56E–04 0.284 0.386 0.63
(0.460–0.875)
5.48E–03 0.235 0.381 0.54
(0.335–0.861)
9.79E–03
Gout defined by medical anamnesis (having gout or elevated uric acid concentrations). The prevalence of gout is 6.4% in SHIP (8.6% in men and 4.4% in women) and 9.6% inKORA (13.6% in men and 6.0% in women). The difference is explained by the higher proportion of older persons in KORA.
4 ADVANCE ONLINE PUBLICATION NATURE GENETICS
LET TERS

neighboring genes DRD5 and WDR1. The sample size was too smallto show a significant genetic effect of SLC2A9 SNPs on uric acidconcentrations or intensity of transcription signals (SupplementaryFig. 1 online). However, the probe hybridizing to the SLC2A9 isoform2 transcript showed a significant association with uric acid concen-trations (Fig. 2). The uric acid variance explained by SLC2A9expression levels was about 8% for isoform 2; for this isoformof SLC2A9 alone, sex-specific analyses showed a stronger associationin women (P ¼ 0.005; effect ¼ 6.813) compared to men (P ¼ 0.151;effect ¼ 3.490).
Both identification and replication studies showed strongest asso-ciations of common alleles with serum uric acid concentrations andself-reported gout within introns 4 and 6 of SLC2A9. Smallerindependent effects of other polymorphisms in the 500-kb regionincluding WDR1 and ZNF518B cannot be resolved. This result hasrecently been confirmed by a genome-wide study in a Sardinianpopulation6 and by the Wellcome Trust Case Control Consortium(WTCCC)7. Our explorative screen was not exhaustive; for instance, itdid not include the SNPs in SLC22A12 gene8,9, which have beenreported to influence uric acid concentrations.SLC2A9 encodes a transporter protein that belongs to class II of the
facilitative glucose transporter family10. Members of the GLUT familymediate sodium-independent specific hexose uptake into target cellsby facilitated diffusion. A potential substrate of GLUT9 is fructose, asGLUT9 has the highest similarity with the fructose transportersGLUT5 and GLUT11 from the same subclass II in the SLC2Afamily11,12. Fructose intake had been identified as a determinant ofuric acid concentrations some decades ago13. Fructose is phosphory-lated by fructokinase in hepatocytes while generating ADP, which isused for rapid production of uric acid14.
It has been shown that alternative splicing of SLC2A9 results in twoproteins, GLUT9 and GLUT9DN, each with differential targeting andtissue specificity15. Although GLUT9 is mainly localized to themembrane of proximal tubular kidney cells, the placenta, the liver,and to a lesser extent the lung, leukocytes, chrondrocytes andbrain15,16, GLUT9DN is prominently expressed in the kidney inboth humans and mice15,17.
Our expression studies help us to focus the association signals to asingle protein, GLUT9, and allow discrimination between two anno-tated isoforms of this gene. Both isoforms are equally and sizablyexpressed in whole blood. The significant association with the shorterprotein GLUT9DN argues for a prominent role of the SLC2A9 isoform
2 in the regulation of urate concentrations. The association with theisoform 2 suggests an involvement of the protein in urate excretion,implying that GLUT9DN handles additional or alternative substratesto the ones suggested by protein family relations.
We report an association between SLC2A9 genotypes and urateconcentrations, between SLC2A9 genotypes and gout, and betweenSLC2A9 expression and uric acid, with stronger associations inwomen. Carriers of the major alleles of the most significant SNPs,especially homozygous individuals representing about 60% ofour population (Supplementary Table 4 online), are prone todeveloping high serum uric acid concentrations. Our expressionanalyses suggest an involvement of the protein in uric acid excretionin the kidney and open new avenues for a better understanding ofthe heritable basis of hyperuricemia.
METHODSSubjects and study design. A detailed description of the GWAS population and
the replication samples is given in Supplementary Methods and Supplemen-
tary Table 5 online. The study populations represent samples from the general
population with no indication of stratification after analysis of the genome-
wide SNP dataset (see Supplementary Methods). For all studies, we obtained
informed consent from participants and approval from the local ethical
committees. The participants were of European origin.
KORA F3 500K and replication sample KORA S4. We recruited the study
population for the GWAS (KORA F3 500K) and replication cohort S4 from the
KORA S3 and S4 surveys. Both are independent population-based samples from
the general population, comprising individuals living in the region of Augsburg,
Southern Germany, aged 25–74 years, and examined in 1994–1995 (S3) and
1999–2001 (S4). In KORA S4, 4,261 persons participated (response 67%), and
DNA was available from 4,162 participants. The standardized examinations
applied in both surveys have been described in detail elsewhere18. For KORA F3
500K, we selected 1,644 subjects, who participated in a follow-up examination of
S3 (F3), then comprising individuals aged 35–79 years.
SAPHIR. The Salzburg Atherosclerosis Prevention Program in Subjects at High
Individual Risk (SAPHIR) is an observational study conducted in the years
1999–2002 involving 1,770 healthy unrelated subjects: 663 females from 50 to
70 years of age and 1,107 males from 40 to 60 years of age. Study participants
were recruited by health screening programs in large companies in and around
the city of Salzburg. At baseline, all study participants were subjected to a
comprehensive program19. DNA was available from 1,719 persons.
SHIP. The third replication sample was recruited from the Study of Health in
Pomerania (SHIP), which was conducted in the years 1997–2001. Study details
©20
08 N
atu
re P
ub
lish
ing
Gro
up
h
ttp
://w
ww
.nat
ure
.co
m/n
atu
reg
enet
ics
12
SLC2A9 iso 2 SLC2A9 iso 1
Uric
aci
d (m
g/dl
) 10
8
6
4
6.7 6.9Normalized expression
Effect = 5.245, P value = 0.002
7.1
12
DRD5
Uric
aci
d (m
g/dl
) 10
8
6
4
6.7 6.9Normalized expression
Effect = –1.222, P value = 0.465
7.1
12
WDR1
Uric
aci
d (m
g/dl
) 10
8
6
4
7.0 8.0Normalized expression
Effect = –0.254, P value = 0.360
9.0
12
Uric
aci
d (m
g/dl
) 10
8
6
4
6.7 6.9Normalized expression
Effect = 2.352, P value = 0.172
7.1
SLC2A9 iso 1 and iso 2
12
Uric
aci
d (m
g/dl
) 10
8
6
4
7.0 7.4Normalized expression
Effect = 1.217, P value = 0.060
7.8 8.2
Figure 2 Transcription analysis of SLC2A9 and association with serum uric acid concentrations. The indicated genes and probes were analyzed fromgenome-wide transcription profiles of 117 samples. The regression line is shown for females (blue) and males (red); female and male samples are indicated
by blue and red triangles, respectively. SLC2A9 is represented with three probes detecting the alternative first exons of isoforms 1 (iso 1, Illumina probe ID
1850100) and 2 (iso 2, ID 10128) and exon 12 (ID 4590201) at the distal end of both isoforms 1 and 2. The flanking genes DRD5 (ID 7560053) and
WDR1 (ID 3610767) are represented with a single probe each.
NATURE GENETICS ADVANCE ONLINE PUBLICATION 5
LET TERS
are given elsewhere20. We applied a two-stage sampling protocol that was
adopted from the MONICA/KORA study. In total, 4,310 persons (68.8% of
eligible subjects) aged 20 to 79 years participated, and DNA was available from
4,066 persons.
Uric acid measurements. We obtained nonfasting blood samples from study
participants in KORA and SHIP and fasting samples from those in SAPHIR.
Uric acid analyses were carried out in all studies on fresh samples using an
uricase method (KORA S4 and SAPHIR: UA Plus, Roche; SHIP: Uric acid PAP,
Boehringer; KORA F3 500K: URCA Flex, Dade Behring). A detailed description
is given in Supplementary Methods.
Definition of gout in KORA and SHIP. We asked the following question in a
standardized interview: ‘‘Did you suffer from gout or elevated uric acid levels in
the past 12 months (Y/N)?’’ Furthermore, the participants were asked to bring
all medications taken during the seven days preceding the interview. The
medication data were registered online (KORA) or in a computer-assisted
interview (SHIP). The drugs were categorized according to the Anatomical
Therapeutical Chemical (ATC) classification index (see URLs section below). A
participant was classified as having gout if he suffered from gout and/or
elevated uric acid levels and/or took uricosuric or uricostatic drugs. The
definition presents an overestimation of gout prevalence21.
KORA F3 500K genotyping and quality control. Genotyping for KORA F3
500K was done using Affymetrix Gene Chip Human Mapping 500K Array Set
consisting of two chips (Sty I and Nsp I). Genomic DNA was hybridized in
accordance with the manufacturer’s standard recommendations. Genotypes
were determined using BRLMM clustering algorithm. We carried out filtering
of both conspicuous individuals and SNPs to ensure robustness of association
analysis. Details on quality criteria are described in Supplementary Methods.
SNP genotyping and quality control in the replication samples. For KORA
S4, genotyping of SNPs was done with the iPLEX (Sequenom) method by
means of matrix-assisted laser desorption ionization time-of-flight mass
spectrometry method (MALDI-TOF MS, Mass Array, Sequenom) according
to the manufacturer’s instructions. For SAPHIR, genotyping was done within
the Genotyping Unit of the Gene Discovery Core Facility at the Innsbruck
Medical University, Austria using 5¢-nuclease allelic discrimination (Taqman)
assays (Applied Biosystems). For SHIP, the rs7442295 locus was amplified with
the oligonucleotide primers 5¢-GAATGTCTGCAGCAGGGAGGCAGTGGG
ACTTGAG-3¢ and 5¢-CAAAAGTCCTTCCCTTCCTGGACTTGAATGAAGT
C-3¢. The 277-bp amplicon was digested with MboII, resulting in two fragments
of 103 and 174 bp for the variant C allele.
In all studies, 5–15% of the samples were genotyped twice for quality control
purposes; no discordant genotypes were found. In KORA S4, for 3 of 20
replicated SNPs, a deviation from Hardy-Weinberg equilibrium was observed
(Po 0.01). In SAPHIR and SHIP, all replicated SNPs were in HWE. Details on
genotyping are described in the Supplementary Methods and Supplementary
Table 6 online.
SNP selection for replication. The power of the replication in KORA S4,
SAPHIR and SHIP was estimated for a difference in uric acid concentrations
per allele between 0.2 and 0.4 mg/dl and a nominal significance level of 0.05.
The power to detect a true association was above 85% in all replication samples.
For the replication in KORA S4, we selected SNPs that were significantly
associated with uric acid concentrations at the genome-wide level. To capture
the available genetic information, SNPs that did not reach genome-wide
significance were added (Supplementary Methods). In addition, exonic and
splice-site SNPs were included. For further replication in SAPHIR and SHIP, we
selected highly significant SNPs of the KORA F3 500K and the KORA
S4 replication.
Statistical analysis of genetic effects. In the KORA F3 500K sample, possible
population substructures were analyzed (Supplementary Methods). We used
additive genetic models assuming a trend per copy of the minor allele to specify
the dependency of uric acid concentrations on genotype categories. All models
were adjusted for age and gender. We used linear regression algorithms
implemented in the statistical analysis system R (KORA F3 500K) and SAS
version 9.1 (replications). To select significant SNPs in the genome-wide
screening and the replications, we used conservative Bonferroni thresholds,
which corresponded to a nominal level of 0.05. For the conditional analysis, the
SNP with the lowest P value in the GWAS was selected and included in the
linear regression as covariate. All other SNPs in the region were sequentially
tested for significance. We carried out haplotype reconstruction and haplotype
association analysis in the KORA S4 replication sample using the R-library
HaploStats22, which allows including all common haplotypes in the linear
regression and incorporating age and sex as covariates. The most common
haplotype served as reference. Details on haplotype analysis are described in
Supplementary Methods. SNPs selected for replication in SAPHIR and SHIP
were also analyzed by sex in all replication samples, and were additionally
adjusted for further correlates of uric acid in KORA S4 (Supplementary
Table 2). For each variable in the model, partial R (type II) were calculated
to estimate the variance proportion explained. We conducted several sensi-
tivity analyses in the replication study KORA S4. When excluding all persons
under uricosuric or uricostatic medication (n ¼ 124) from the analysis,
and in a second step, all persons suffering from cancer (n ¼ 181), we
found that the associations were even stronger for the four SNPs, which
were selected for further replication compared to the results from the
full dataset.
Mutational analysis. SLC2A9 exons were amplified with intronic primers
(Supplementary Table 7 online) and directly sequenced using a BigDye Cycle
sequencing kit (Applied Biosystems). Genomic DNA (B30 ng) was subjected
to PCR amplification carried out in a 15 ml volume containing 1� PCR Master
Mix (Promega) and 0.25 mM of each forward and reverse primer under the
following cycle conditions: initial step at 95 1C for 5 min, 30 cycles at 95 1C for
30 s, 58 1C (exon 1 62 1C) for 30 s and 72 1C for 30 s, and final extension at
72 1C for 5 min.
Gene expression analysis. We drew 2.5 ml of peripheral blood from indivi-
duals participating in the KORA study under fasting conditions. The blood
samples were collected directly in PAXgene Blood RNA tubes (PreAnalytiX)
between the hours of 10 a.m. and noon. The RNA extraction was done using
the PAXgene Blood RNA Kit (Qiagen). We carried out RNA and cRNA quality
control using the Bioanalyzer (Agilent), and quantification using Ribogreen
(Invitrogen). We reverse transcribed 300–500 ng of RNA into cRNA and biotin-
UTP–labeled the RNA using the Illumina TotalPrep RNA Amplification Kit
(Ambion). We hybridized 1,500 ng of cRNA to the Illumina Human-6 v2
Expression BeadChip. Washing steps were carried out in accordance with
Illumina protocol (technical note 1226030 Rev. B). We exported the raw
data from the ‘Beadstudio’ software (Illumina) to R. The data were converted
into logarithmic scores and normalized using the LOWESS method23. The
association between uric acid concentration and normalized expression was
computed with a linear regression adjusted for sex. Robustness of the
significant association between uric acid concentrations and SLC2A9 isoform
2 was shown by removing extreme uric acid concentrations from the analysis.
Bioinformatic analysis. All successfully replicated SNPs were subjected to an
in silico analysis for putative transcription factor binding sites using the
Genomatix Software Suite (Genomatix) as well as freely accessible bio-
informatics tools (see URLs section below). The results are shown in
Supplementary Methods.
URLs. Anatomical Therapeutical Chemical (ATC) classification index, http://
www.whocc.no/atcddd/; Bioinformatics tools, http://pupasuite.bioinfo.cipf.es.
Note: Supplementary information is available on the Nature Genetics website.
ACKNOWLEDGMENTSThe MONICA/KORA Augsburg studies were financed by the Helmholtz ZentrumMunchen, German Research Center for Environmental Health, Neuherberg,Germany and supported by grants from the German Federal Ministry ofEducation and Research (BMBF). Part of this work was financed by the GermanNational Genome Research Network (NGFN). Our research was supported withinthe Munich Center of Health Sciences (MC Health) as part of LMUinnovativ.SHIP is part of the Community Medicine Research net (CMR) of the Universityof Greifswald, Germany, which is funded by the Federal Ministry of Education
©20
08 N
atu
re P
ub
lish
ing
Gro
up
h
ttp
://w
ww
.nat
ure
.co
m/n
atu
reg
enet
ics
6 ADVANCE ONLINE PUBLICATION NATURE GENETICS
LET TERS
and Research, the Ministry of Cultural Affairs as well as the Social Ministry ofthe Federal State of Mecklenburg-West Pomerania. The SHIP genotyping wassupported by grant 03IP612 (InnoProfile) of the German Federal Ministry forEducation and Research (BMBF). Part of the work on SAPHIR was supported bythe ‘Genomics of Lipid-associated Disorders – GOLD’ of the Austrian GenomeResearch Programme (GEN-AU). We gratefully acknowledge the contribution ofP. Lichtner, G. Eckstein, T. Strom and K. Heim and all other members of theHelmholtz Zentrum Munchen genotyping staff in generating and analyzing theSNP and RNA dataset, as well as the contribution of A. Gehringer and M. Haakfrom the Division of Genetic Epidemiology, Innsbruck Medical University. Wethank all members of field staffs who were involved in the planning and conductof the MONICA/KORA Augsburg studies, the SHIP study and the SAPHIR study.Finally, we express our appreciation to all study participants.
AUTHOR CONTRIBUTIONSStudy design and biobanking KORA F3 500K: H.-E.W., T.M., C.G., T.I., C.M.,A.P. and G.F.; study design and biobanking replication studies: H.V. (SHIP), B.P.and F.K. (SAPHIR), A.D. and H.-E.W. (KORA); statistical analysis: C.G. and A.D.;Affymetrix genotyping: T.M. and T.I.; genotyping in the replication studies: F.K.,S.C., D.R., K.H., N.K. and H.G.; sequencing and gene expression analysis: T.M.,D.M., H.P. and A.P.; phenotype assessment: H.V., B.P., A.D., C.M. and H.-E.W.;bioinformatical analysis: S.C., H.G.; manuscript writing: C.M., A.D, C.G., T.M.,H.G., S.C. and F.K.
Published online at http://www.nature.com/naturegenetics
Reprints and permissions information is available online at http://npg.nature.com/
reprintsandpermissions
1. Wilk, J.B. et al. Segregation analysis of serum uric acid in the NHLBI Family HeartStudy. Hum. Genet. 106, 355–359 (2000).
2. Yang, Q. et al. Genome-wide search for genes affecting serum uric acid levels: theFramingham Heart Study. Metabolism 54, 1435–1441 (2005).
3. Cheng, L.S. et al. Genomewide scan for gout in Taiwanese aborigines reveals linkage tochromosome 4q25. Am. J. Hum. Genet. 75, 498–503 (2004).
4. Fang, J. & Alderman, M.H. Serum uric acid and cardiovascular mortality the NHANES Iepidemiologic follow-up study, 1971–1992. National Health and Nutrition Examina-tion Survey. J. Am. Med. Assoc. 283, 2404–2410 (2000).
5. Stranger, B.E. et al. Population genomics of human gene expression. Nat. Genet. 39,1217–1224 (2007).
6. Li, S. et al. The GLUT9 gene is associated with serum uric acid levels in Sardinia andChianti cohorts. PLoS Genet. 3, e194 (2007).
7. Wallace, C. et al. Genome-wide association study identifies genes for biomarkersof cardiovascular disease: serum urate and dyslipidemia. Am. J. Hum. Genet. 82,139–149 (2008).
8. Graessler, J. et al. Association of the human urate transporter 1 with reduced renal uricacid excretion and hyperuricemia in a German Caucasian population. Arthritis Rheum.54, 292–300 (2006).
9. Shima, Y., Teruya, K. & Ohta, H. Association between intronic SNP in urate-anionexchanger gene, SLC22A12, and serum uric acid levels in Japanese. Life Sci. 79,2234–2237 (2006).
10. Joost, H.G. & Thorens, B. The extended GLUT-family of sugar/polyol transport facil-itators: nomenclature, sequence characteristics, and potential function of its novelmembers. Mol. Membr. Biol. 18, 247–256 (2001).
11. Burant, C.F., Takeda, J., Brot-Laroche, E., Bell, G.I. & Davidson, N.O. Fructosetransporter in human spermatozoa and small intestine is GLUT5. J. Biol. Chem.267, 14523–14526 (1992).
12. Scheepers, A. et al. Characterization of the human SLC2A11 (GLUT11) gene:alternative promoter usage, function, expression, and subcellular distribution ofthree isoforms, and lack of mouse orthologue. Mol. Membr. Biol. 22, 339–351(2005).
13. Stirpe, F. et al. Fructose-induced hyperuricaemia. Lancet 2, 1310–1311 (1970).14. Hallfrisch, J. Metabolic effects of dietary fructose. FASEB J. 4, 2652–2660 (1990).15. Augustin, R. et al. Identification and characterization of human glucose transporter-
like protein-9 (GLUT9): alternative splicing alters trafficking. J. Biol. Chem. 279,16229–16236 (2004).
16. Richardson, S. et al. Molecular characterization and partial cDNA cloning of facilitativeglucose transporters expressed in human articular chondrocytes; stimulation of 2-deoxyglucose uptake by IGF-I and elevated MMP-2 secretion by glucose deprivation.Osteoarthritis Cartilage 11, 92–101 (2003).
17. Keembiyehetty, C. et al. Mouse glucose transporter 9 splice variants are expressed inadult liver and kidney and are up-regulated in diabetes. Mol. Endocrinol. 20, 686–697(2006).
18. Wichmann, H.E., Gieger, C. & Illig, T. KORA-gen–resource for population genetics,controls and a broad spectrum of disease phenotypes. Gesundheitswesen 67 Suppl. 1,S26–S30 (2005).
19. Heid, I.M. et al. Genetic architecture of the APM1 gene and its influence onadiponectin plasma levels and parameters of the metabolic syndrome in 1,727 healthyCaucasians. Diabetes 55, 375–384 (2006).
20. John, U. et al. Study of Health In Pomerania (SHIP): a health examination survey in aneast German region: objectives and design. Soz. Praventivmed. 46, 186–194 (2001).
21. Roddy, E., Zhang, W. & Doherty, M. The changing epidemiology of gout. Nat. Clin.Pract. Rheumatol. 3, 443–449 (2007).
22. Lake, S.L. et al. Estimation and tests of haplotype-environment interaction whenlinkage phase is ambiguous. Hum. Hered. 55, 56–65 (2003).
23. Yang, Y.H. et al. Normalization for cDNA microarray data: a robust composite methodaddressing single and multiple slide systematic variation. Nucleic Acids Res. 30, e15(2002).
©20
08 N
atu
re P
ub
lish
ing
Gro
up
h
ttp
://w
ww
.nat
ure
.co
m/n
atu
reg
enet
ics
NATURE GENETICS ADVANCE ONLINE PUBLICATION 7
LET TERS
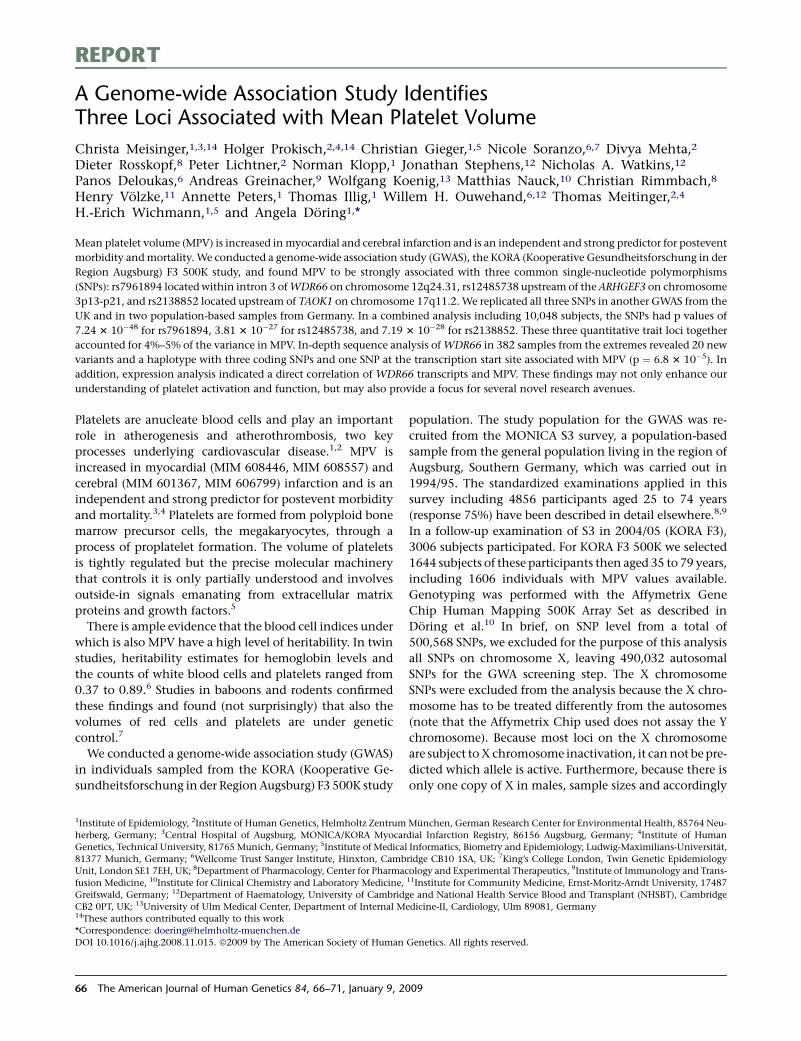
REPORT
A Genome-wide Association Study IdentifiesThree Loci Associated with Mean Platelet Volume
Christa Meisinger,1,3,14 Holger Prokisch,2,4,14 Christian Gieger,1,5 Nicole Soranzo,6,7 Divya Mehta,2
Dieter Rosskopf,8 Peter Lichtner,2 Norman Klopp,1 Jonathan Stephens,12 Nicholas A. Watkins,12
Panos Deloukas,6 Andreas Greinacher,9 Wolfgang Koenig,13 Matthias Nauck,10 Christian Rimmbach,8
Henry Volzke,11 Annette Peters,1 Thomas Illig,1 Willem H. Ouwehand,6,12 Thomas Meitinger,2,4
H.-Erich Wichmann,1,5 and Angela Doring1,*
Mean platelet volume (MPV) is increased in myocardial and cerebral infarction and is an independent and strong predictor for postevent
morbidity and mortality. We conducted a genome-wide association study (GWAS), the KORA (Kooperative Gesundheitsforschung in der
Region Augsburg) F3 500K study, and found MPV to be strongly associated with three common single-nucleotide polymorphisms
(SNPs): rs7961894 located within intron 3 of WDR66 on chromosome 12q24.31, rs12485738 upstream of the ARHGEF3 on chromosome
3p13-p21, and rs2138852 located upstream of TAOK1 on chromosome 17q11.2. We replicated all three SNPs in another GWAS from the
UK and in two population-based samples from Germany. In a combined analysis including 10,048 subjects, the SNPs had p values of
7.24 3 10�48 for rs7961894, 3.81 3 10�27 for rs12485738, and 7.19 3 10�28 for rs2138852. These three quantitative trait loci together
accounted for 4%–5% of the variance in MPV. In-depth sequence analysis of WDR66 in 382 samples from the extremes revealed 20 new
variants and a haplotype with three coding SNPs and one SNP at the transcription start site associated with MPV (p ¼ 6.8 3 10�5). In
addition, expression analysis indicated a direct correlation of WDR66 transcripts and MPV. These findings may not only enhance our
understanding of platelet activation and function, but may also provide a focus for several novel research avenues.
Platelets are anucleate blood cells and play an important
role in atherogenesis and atherothrombosis, two key
processes underlying cardiovascular disease.1,2 MPV is
increased in myocardial (MIM 608446, MIM 608557) and
cerebral (MIM 601367, MIM 606799) infarction and is an
independent and strong predictor for postevent morbidity
and mortality.3,4 Platelets are formed from polyploid bone
marrow precursor cells, the megakaryocytes, through a
process of proplatelet formation. The volume of platelets
is tightly regulated but the precise molecular machinery
that controls it is only partially understood and involves
outside-in signals emanating from extracellular matrix
proteins and growth factors.5
There is ample evidence that the blood cell indices under
which is also MPV have a high level of heritability. In twin
studies, heritability estimates for hemoglobin levels and
the counts of white blood cells and platelets ranged from
0.37 to 0.89.6 Studies in baboons and rodents confirmed
these findings and found (not surprisingly) that also the
volumes of red cells and platelets are under genetic
control.7
We conducted a genome-wide association study (GWAS)
in individuals sampled from the KORA (Kooperative Ge-
sundheitsforschung in der Region Augsburg) F3 500K study
1Institute of Epidemiology, 2Institute of Human Genetics, Helmholtz Zentrum
herberg, Germany; 3Central Hospital of Augsburg, MONICA/KORA Myocar
Genetics, Technical University, 81765 Munich, Germany; 5Institute of Medical
81377 Munich, Germany; 6Wellcome Trust Sanger Institute, Hinxton, Camb
Unit, London SE1 7EH, UK; 8Department of Pharmacology, Center for Pharmac
fusion Medicine, 10Institute for Clinical Chemistry and Laboratory Medicine,
Greifswald, Germany; 12Department of Haematology, University of Cambridg
CB2 0PT, UK; 13University of Ulm Medical Center, Department of Internal Me14These authors contributed equally to this work
*Correspondence: [email protected]
DOI 10.1016/j.ajhg.2008.11.015. ª2009 by The American Society of Human
66 The American Journal of Human Genetics 84, 66–71, January 9, 20
population. The study population for the GWAS was re-
cruited from the MONICA S3 survey, a population-based
sample from the general population living in the region of
Augsburg, Southern Germany, which was carried out in
1994/95. The standardized examinations applied in this
survey including 4856 participants aged 25 to 74 years
(response 75%) have been described in detail elsewhere.8,9
In a follow-up examination of S3 in 2004/05 (KORA F3),
3006 subjects participated. For KORA F3 500K we selected
1644 subjects of these participants then aged 35 to 79 years,
including 1606 individuals with MPV values available.
Genotyping was performed with the Affymetrix Gene
Chip Human Mapping 500K Array Set as described in
Doring et al.10 In brief, on SNP level from a total of
500,568 SNPs, we excluded for the purpose of this analysis
all SNPs on chromosome X, leaving 490,032 autosomal
SNPs for the GWA screening step. The X chromosome
SNPs were excluded from the analysis because the X chro-
mosome has to be treated differently from the autosomes
(note that the Affymetrix Chip used does not assay the Y
chromosome). Because most loci on the X chromosome
are subject to X chromosome inactivation, it can not be pre-
dicted which allele is active. Furthermore, because there is
only one copy of X in males, sample sizes and accordingly
Munchen, German Research Center for Environmental Health, 85764 Neu-
dial Infarction Registry, 86156 Augsburg, Germany; 4Institute of Human
Informatics, Biometry and Epidemiology, Ludwig-Maximilians-Universitat,
ridge CB10 1SA, UK; 7King’s College London, Twin Genetic Epidemiology
ology and Experimental Therapeutics, 9Institute of Immunology and Trans-11Institute for Community Medicine, Ernst-Moritz-Arndt University, 17487
e and National Health Service Blood and Transplant (NHSBT), Cambridge
dicine-II, Cardiology, Ulm 89081, Germany
Genetics. All rights reserved.
09
power are different from the autosomes. From the 490,032
autosomal SNPs, 335,152 (68.39%) SNPs passed all quality
control criteria and were selected for the subsequent associ-
ation analyses. Criteria leading to exclusion were genotyp-
ing efficiency <95% (N ¼ 49,325) and minor allele
frequency (MAF) <5% (N ¼ 101,323). An exact Fisher test
has been used to detect deviations from Hardy-Weinberg
equilibrium, and we excluded all SNPs with p values below
10�5 (N ¼ 4,232) after passing the other criteria.10
We used three independent samples for replication. The
first was a GWAS sample from the UK National Blood
Services collection of Common Controls (UKBS-CC) typed
with the same Affymetrix Chip. Details of genotyping and
quality criteria are given in the original study.11 In brief,
the UKBS-CC collection is an anonymized collection of
DNA samples from 3100 healthy blood donors. The collec-
tion has been established by the three British blood services
of England, Scotland, and Wales as part of the Wellcome
Trust Case Control Consortium (WTCCC) study.11 Data
from 1203 English individuals of panel 1 (UKBS-CC1) with
available genotypes wereused in this study, because noMPV
data were available for the Scottish and Welsh samples.
The second replication cohort was recruited from the
KORA S4 survey, an independent population-based sample
from the general population living in the regionof Augsburg,
Southern Germany, conducted in 1999/2001. The standard-
ized examinations applied in the survey (4261 participants,
response 67%) have been described in detail elsewhere.8,10
Genotyping of SNPs was performed with the iPLEX (Seque-
nom, San Diego, CA) method by means of matrix-assisted
laser desorption ionization-time of flight mass spectrom-
etry method (MALDI-TOF MS, Mass Array, Sequenom) ac-
cording to the manufacturer’s instructions. Details of geno-
typing and quality criteria are given elsewhere.10
The third replication sample, the Study of Health in
Pomerania (SHIP), is a cross-sectional population-based
health survey conducted between 1997 and 2001 in West
Pomerania, a region in the northeastern part of Germany.
The detailed objectives and the study design have been
published elsewhere.12 The final SHIP population
comprising 4310 participants (response 68.8%) was
invited to attend a 5-year follow-up examination, termed
SHIP1, which was conducted between 2002 and 2006
(3300 participants; response 76.6%). For replication anal-
ysis, the SHIP1 population was included. The SNPs were
genotyped with custom-made 50 nuclease allelic discrimi-
nation (Taqman) assays (AppliedBiosystems, Foster City,
CA). Quality control included the independent replication
of 3% of genotypes and the inclusion of 2% negative
controls on all DNA sample plates.
In all samples, MPV was measured on fresh venous EDTA
blood with an automatic analyzer (Coulter STKS in KORA
F3, KORA S4, and UKBS-CC1 and Sysmex SE-9000 analyzer
in SHIP; reference MPV values were 7.8–11.0 fl in KORA F3,
KORA S4, and UKBS-CC1 and 9.0–12.5 fl in SHIP).
A description of the GWA study population and the
replication samples is given in Table S1 available online.
The A
In all studies, informed consent was obtained from
participants and the studies were approved by the local
ethical committees.
We used additive genetic models assuming a trend per
copy of the minor allele to test the association of MPV
values and genotypes. MPV values were natural log trans-
formed before analysis to approximate the normal distribu-
tion. All models were adjusted for age and gender, and
additionally for collection center within the UK sample.
We used linear regression algorithms as implemented in
the statistical analysis packages R (KORA F3 500K), PLINK13
(KORA F3 500K, UKBS-CC1), and SAS version 9.1 (KORA S4,
SHIP). Imputation of genotypes in KORA F3 500K used to
fine-map the replicated regions in Figures 1B–1D was
performed with the software MACH based on HapMap II.
Meta-analysis statistics were obtained with a weighted
z-statistics method, where weights were proportional to
the square root of the number of individuals examined in
each sample and selected such that the squared weights
sum was 1. Calculations were implemented in the METAL
package. Combined betas and SEs were calculated with
Inverse Variance meta-analysis, together with Cochran’s
Q and I2 with R scripts.
To select significant SNPs in the genome-wide screening
and in the replication studies, we used conservative Bonfer-
roni thresholds that corresponded to an uncorrected signif-
icance level of 0.05. The associated quantile-quantile plot in
Figure S1 shows good agreement with the null distribution.
The GWAS identified several genomic locations as poten-
tially associated with MPV (Figure 1A). Of the 335,152 SNPs
tested by regression analysis, 10 representing 8 distinct
genetic regions reached p values below 10�5 (Table 1; Tables
S2 and S3). One SNP rs7961894 (p ¼ 2.09 3 10�11; Table 1;
Figure 1B), located within intron 3 of the WDR66 (WD
repeat domain 66) gene at 12q24.31, reached genome-
wide significance with a Bonferroni corrected significance
level of 1.5 3 10�7. The 10 SNPs were taken forward to repli-
cate them in the UKBS-CC1 GWAS sample, and at the same
time 8 SNPs (representing 8 different loci) were taken
forward for replication in the KORA S4 Study. One of those
SNPs could not be replicated in KORA S4 because of
problems with the assay design (Table S3). The SNPs,
which were successfully replicated in both studies, were
rs7961894 in WDR66, rs12485738 on 30 and 56 kb distance
from the transcription start sites of two short isoforms of the
ARHGEF3 gene at 3p13-p21 (Rho guanine nucleotide
exchange factor 3) (MIM 612115), and rs2138852 upstream
of the TAOK1 gene at 17q11.2 (TAO Kinase 1; Figures 1B–
1D; Table 1) (MIM 610266). None of the other tested SNPs
reached significance in the UKBS-CC1 or KORA S4 sample
given a corrected significance of 0.005 (Table S3). Finally,
only the three loci that have been successfully replicated
in both studies were taken forward to additional replication
in the SHIP study where these SNPs again showed a signifi-
cant association with MPV values (Table 1).
In further analysis in the GWA population, it was exam-
ined whether the three lead SNPs are associated with other
merican Journal of Human Genetics 84, 66–71, January 9, 2009 67
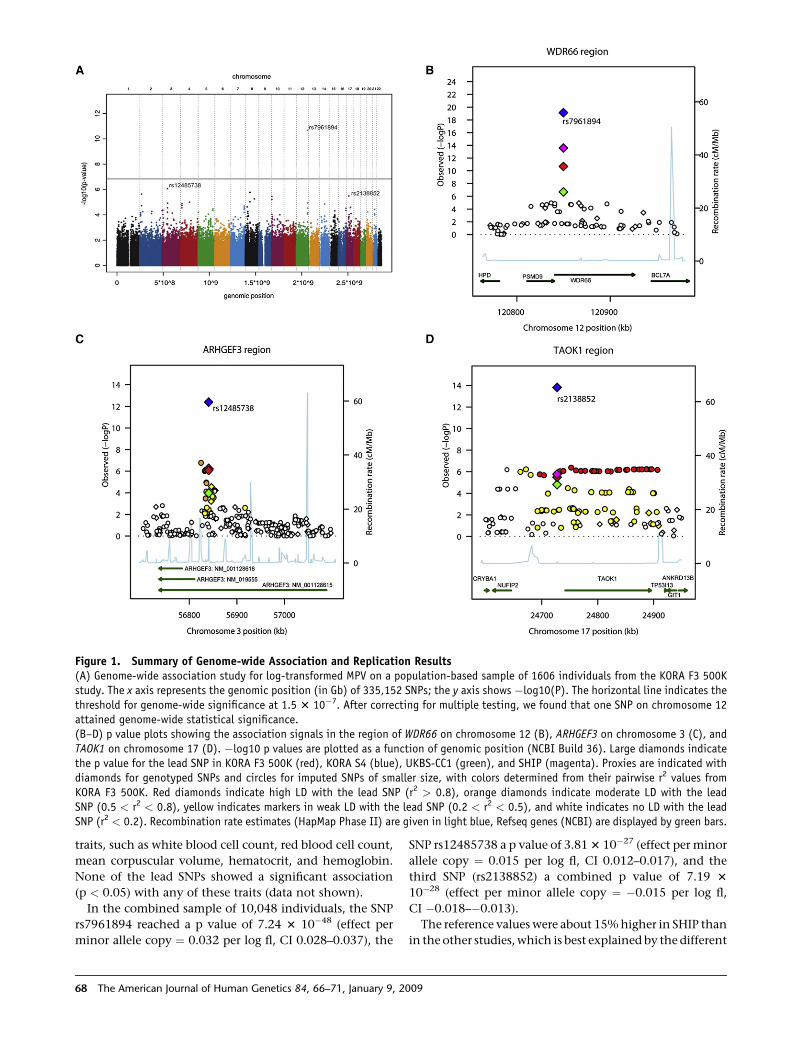
Figure 1. Summary of Genome-wide Association and Replication Results(A) Genome-wide association study for log-transformed MPV on a population-based sample of 1606 individuals from the KORA F3 500Kstudy. The x axis represents the genomic position (in Gb) of 335,152 SNPs; the y axis shows �log10(P). The horizontal line indicates thethreshold for genome-wide significance at 1.5 3 10�7. After correcting for multiple testing, we found that one SNP on chromosome 12attained genome-wide statistical significance.(B–D) p value plots showing the association signals in the region of WDR66 on chromosome 12 (B), ARHGEF3 on chromosome 3 (C), andTAOK1 on chromosome 17 (D). �log10 p values are plotted as a function of genomic position (NCBI Build 36). Large diamonds indicatethe p value for the lead SNP in KORA F3 500K (red), KORA S4 (blue), UKBS-CC1 (green), and SHIP (magenta). Proxies are indicated withdiamonds for genotyped SNPs and circles for imputed SNPs of smaller size, with colors determined from their pairwise r2 values fromKORA F3 500K. Red diamonds indicate high LD with the lead SNP (r2 > 0.8), orange diamonds indicate moderate LD with the leadSNP (0.5 < r2 < 0.8), yellow indicates markers in weak LD with the lead SNP (0.2 < r2 < 0.5), and white indicates no LD with the leadSNP (r2 < 0.2). Recombination rate estimates (HapMap Phase II) are given in light blue, Refseq genes (NCBI) are displayed by green bars.
traits, such as white blood cell count, red blood cell count,
mean corpuscular volume, hematocrit, and hemoglobin.
None of the lead SNPs showed a significant association
(p < 0.05) with any of these traits (data not shown).
In the combined sample of 10,048 individuals, the SNP
rs7961894 reached a p value of 7.24 3 10�48 (effect per
minor allele copy ¼ 0.032 per log fl, CI 0.028–0.037), the
68 The American Journal of Human Genetics 84, 66–71, January 9, 20
SNP rs12485738 a p value of 3.81 3 10�27 (effect per minor
allele copy ¼ 0.015 per log fl, CI 0.012–0.017), and the
third SNP (rs2138852) a combined p value of 7.19 3
10�28 (effect per minor allele copy ¼ �0.015 per log fl,
CI �0.018–�0.013).
The reference values were about 15% higher in SHIP than
in the other studies, which is best explained by the different
09
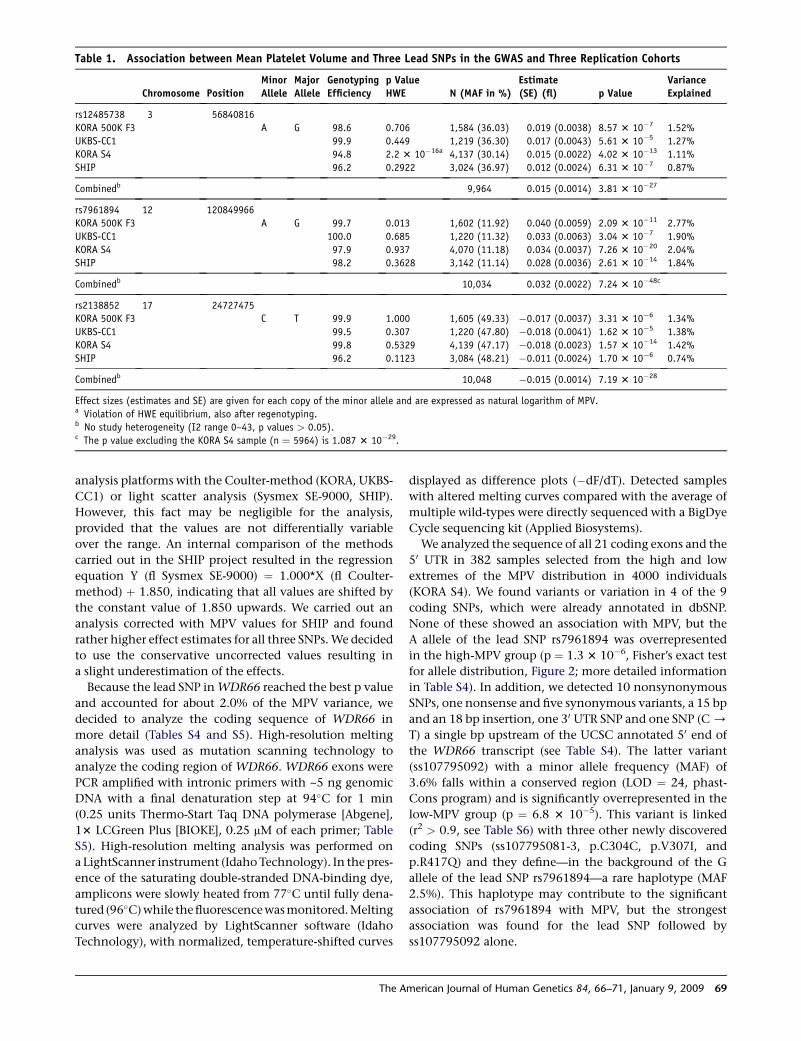
Table 1. Association between Mean Platelet Volume and Three Lead SNPs in the GWAS and Three Replication Cohorts
Chromosome PositionMinorAllele
MajorAllele
GenotypingEfficiency
p ValueHWE N (MAF in %)
Estimate(SE) (fl) p Value
VarianceExplained
rs12485738 3 56840816
KORA 500K F3 A G 98.6 0.706 1,584 (36.03) 0.019 (0.0038) 8.57 3 10�7 1.52%
UKBS-CC1 99.9 0.449 1,219 (36.30) 0.017 (0.0043) 5.61 3 10�5 1.27%
KORA S4 94.8 2.2 3 10�16a 4,137 (30.14) 0.015 (0.0022) 4.02 3 10�13 1.11%
SHIP 96.2 0.2922 3,024 (36.97) 0.012 (0.0024) 6.31 3 10�7 0.87%
Combinedb 9,964 0.015 (0.0014) 3.81 3 10�27
rs7961894 12 120849966
KORA 500K F3 A G 99.7 0.013 1,602 (11.92) 0.040 (0.0059) 2.09 3 10�11 2.77%
UKBS-CC1 100.0 0.685 1,220 (11.32) 0.033 (0.0063) 3.04 3 10�7 1.90%
KORA S4 97.9 0.937 4,070 (11.18) 0.034 (0.0037) 7.26 3 10�20 2.04%
SHIP 98.2 0.3628 3,142 (11.14) 0.028 (0.0036) 2.61 3 10�14 1.84%
Combinedb 10,034 0.032 (0.0022) 7.24 3 10�48c
rs2138852 17 24727475
KORA 500K F3 C T 99.9 1.000 1,605 (49.33) �0.017 (0.0037) 3.31 3 10�6 1.34%
UKBS-CC1 99.5 0.307 1,220 (47.80) �0.018 (0.0041) 1.62 3 10�5 1.38%
KORA S4 99.8 0.5329 4,139 (47.17) �0.018 (0.0023) 1.57 3 10�14 1.42%
SHIP 96.2 0.1123 3,084 (48.21) �0.011 (0.0024) 1.70 3 10�6 0.74%
Combinedb 10,048 �0.015 (0.0014) 7.19 3 10�28
Effect sizes (estimates and SE) are given for each copy of the minor allele and are expressed as natural logarithm of MPV.a Violation of HWE equilibrium, also after regenotyping.b No study heterogeneity (I2 range 0–43, p values > 0.05).c The p value excluding the KORA S4 sample (n ¼ 5964) is 1.087 3 10�29.
analysis platforms with the Coulter-method (KORA, UKBS-
CC1) or light scatter analysis (Sysmex SE-9000, SHIP).
However, this fact may be negligible for the analysis,
provided that the values are not differentially variable
over the range. An internal comparison of the methods
carried out in the SHIP project resulted in the regression
equation Y (fl Sysmex SE-9000) ¼ 1.000*X (fl Coulter-
method) þ 1.850, indicating that all values are shifted by
the constant value of 1.850 upwards. We carried out an
analysis corrected with MPV values for SHIP and found
rather higher effect estimates for all three SNPs. We decided
to use the conservative uncorrected values resulting in
a slight underestimation of the effects.
Because the lead SNP in WDR66 reached the best p value
and accounted for about 2.0% of the MPV variance, we
decided to analyze the coding sequence of WDR66 in
more detail (Tables S4 and S5). High-resolution melting
analysis was used as mutation scanning technology to
analyze the coding region of WDR66. WDR66 exons were
PCR amplified with intronic primers with ~5 ng genomic
DNA with a final denaturation step at 94�C for 1 min
(0.25 units Thermo-Start Taq DNA polymerase [Abgene],
13 LCGreen Plus [BIOKE], 0.25 mM of each primer; Table
S5). High-resolution melting analysis was performed on
a LightScanner instrument (Idaho Technology). In the pres-
ence of the saturating double-stranded DNA-binding dye,
amplicons were slowly heated from 77�C until fully dena-
tured (96�C) while the fluorescence was monitored. Melting
curves were analyzed by LightScanner software (Idaho
Technology), with normalized, temperature-shifted curves
The A
displayed as difference plots (�dF/dT). Detected samples
with altered melting curves compared with the average of
multiple wild-types were directly sequenced with a BigDye
Cycle sequencing kit (Applied Biosystems).
We analyzed the sequence of all 21 coding exons and the
50 UTR in 382 samples selected from the high and low
extremes of the MPV distribution in 4000 individuals
(KORA S4). We found variants or variation in 4 of the 9
coding SNPs, which were already annotated in dbSNP.
None of these showed an association with MPV, but the
A allele of the lead SNP rs7961894 was overrepresented
in the high-MPV group (p ¼ 1.3 3 10�6, Fisher’s exact test
for allele distribution, Figure 2; more detailed information
in Table S4). In addition, we detected 10 nonsynonymous
SNPs, one nonsense and five synonymous variants, a 15 bp
and an 18 bp insertion, one 30 UTR SNP and one SNP (C /
T) a single bp upstream of the UCSC annotated 50 end of
the WDR66 transcript (see Table S4). The latter variant
(ss107795092) with a minor allele frequency (MAF) of
3.6% falls within a conserved region (LOD ¼ 24, phast-
Cons program) and is significantly overrepresented in the
low-MPV group (p ¼ 6.8 3 10�5). This variant is linked
(r2 > 0.9, see Table S6) with three other newly discovered
coding SNPs (ss107795081-3, p.C304C, p.V307I, and
p.R417Q) and they define—in the background of the G
allele of the lead SNP rs7961894—a rare haplotype (MAF
2.5%). This haplotype may contribute to the significant
association of rs7961894 with MPV, but the strongest
association was found for the lead SNP followed by
ss107795092 alone.
merican Journal of Human Genetics 84, 66–71, January 9, 2009 69
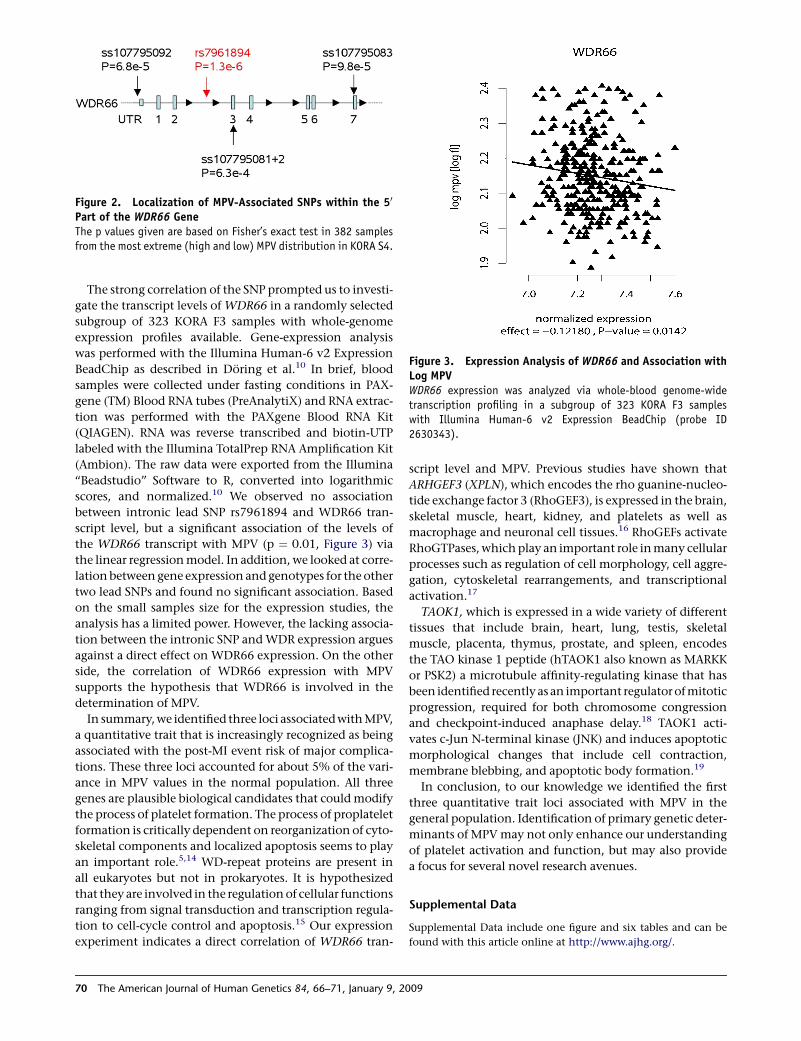
Figure 2. Localization of MPV-Associated SNPs within the 50
Part of the WDR66 GeneThe p values given are based on Fisher’s exact test in 382 samplesfrom the most extreme (high and low) MPV distribution in KORA S4.
Figure 3. Expression Analysis of WDR66 and Association withLog MPVWDR66 expression was analyzed via whole-blood genome-widetranscription profiling in a subgroup of 323 KORA F3 sampleswith Illumina Human-6 v2 Expression BeadChip (probe ID2630343).
The strong correlation of the SNP prompted us to investi-
gate the transcript levels of WDR66 in a randomly selected
subgroup of 323 KORA F3 samples with whole-genome
expression profiles available. Gene-expression analysis
was performed with the Illumina Human-6 v2 Expression
BeadChip as described in Doring et al.10 In brief, blood
samples were collected under fasting conditions in PAX-
gene (TM) Blood RNA tubes (PreAnalytiX) and RNA extrac-
tion was performed with the PAXgene Blood RNA Kit
(QIAGEN). RNA was reverse transcribed and biotin-UTP
labeled with the Illumina TotalPrep RNA Amplification Kit
(Ambion). The raw data were exported from the Illumina
‘‘Beadstudio’’ Software to R, converted into logarithmic
scores, and normalized.10 We observed no association
between intronic lead SNP rs7961894 and WDR66 tran-
script level, but a significant association of the levels of
the WDR66 transcript with MPV (p ¼ 0.01, Figure 3) via
the linear regression model. In addition, we looked at corre-
lation between gene expression and genotypes for the other
two lead SNPs and found no significant association. Based
on the small samples size for the expression studies, the
analysis has a limited power. However, the lacking associa-
tion between the intronic SNP and WDR expression argues
against a direct effect on WDR66 expression. On the other
side, the correlation of WDR66 expression with MPV
supports the hypothesis that WDR66 is involved in the
determination of MPV.
In summary, we identified three loci associated with MPV,
a quantitative trait that is increasingly recognized as being
associated with the post-MI event risk of major complica-
tions. These three loci accounted for about 5% of the vari-
ance in MPV values in the normal population. All three
genes are plausible biological candidates that could modify
the process of platelet formation. The process of proplatelet
formation is critically dependent on reorganization of cyto-
skeletal components and localized apoptosis seems to play
an important role.5,14 WD-repeat proteins are present in
all eukaryotes but not in prokaryotes. It is hypothesized
that they are involved in the regulation of cellular functions
ranging from signal transduction and transcription regula-
tion to cell-cycle control and apoptosis.15 Our expression
experiment indicates a direct correlation of WDR66 tran-
70 The American Journal of Human Genetics 84, 66–71, January 9, 20
script level and MPV. Previous studies have shown that
ARHGEF3 (XPLN), which encodes the rho guanine-nucleo-
tide exchange factor 3 (RhoGEF3), is expressed in the brain,
skeletal muscle, heart, kidney, and platelets as well as
macrophage and neuronal cell tissues.16 RhoGEFs activate
RhoGTPases, which play an important role in many cellular
processes such as regulation of cell morphology, cell aggre-
gation, cytoskeletal rearrangements, and transcriptional
activation.17
TAOK1, which is expressed in a wide variety of different
tissues that include brain, heart, lung, testis, skeletal
muscle, placenta, thymus, prostate, and spleen, encodes
the TAO kinase 1 peptide (hTAOK1 also known as MARKK
or PSK2) a microtubule affinity-regulating kinase that has
been identified recently as an important regulator of mitotic
progression, required for both chromosome congression
and checkpoint-induced anaphase delay.18 TAOK1 acti-
vates c-Jun N-terminal kinase (JNK) and induces apoptotic
morphological changes that include cell contraction,
membrane blebbing, and apoptotic body formation.19
In conclusion, to our knowledge we identified the first
three quantitative trait loci associated with MPV in the
general population. Identification of primary genetic deter-
minants of MPV may not only enhance our understanding
of platelet activation and function, but may also provide
a focus for several novel research avenues.
Supplemental Data
Supplemental Data include one figure and six tables and can be
found with this article online at http://www.ajhg.org/.
09
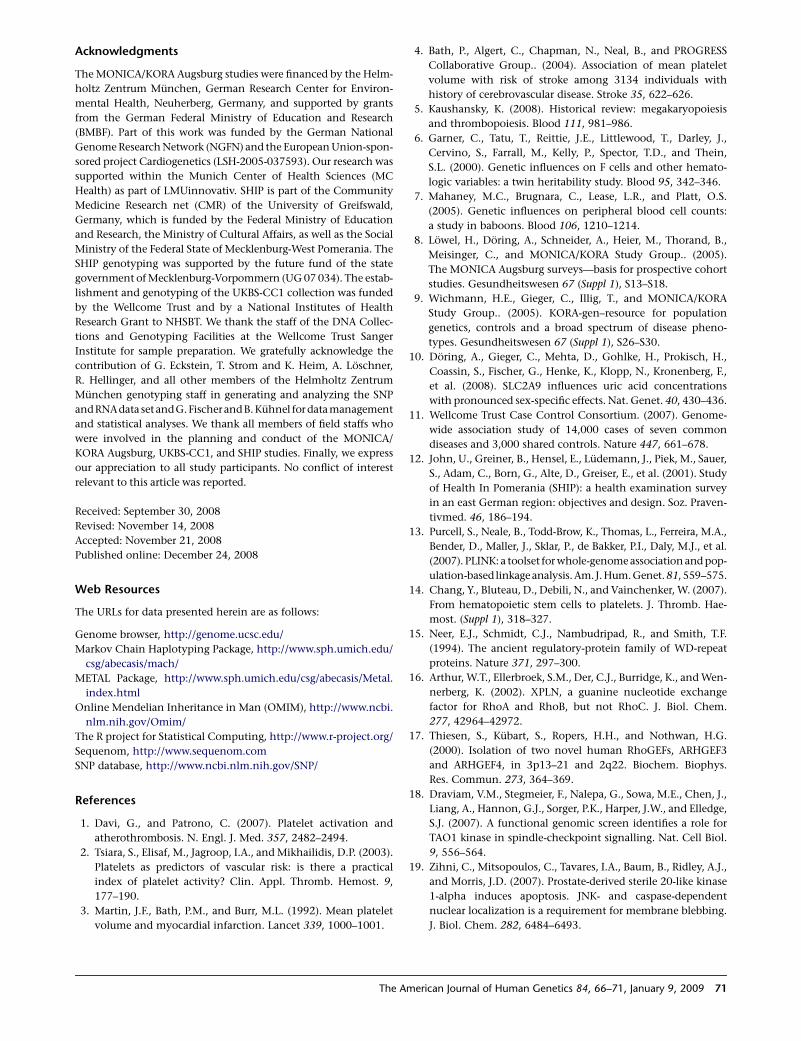
Acknowledgments
The MONICA/KORA Augsburg studies were financed by the Helm-
holtz Zentrum Munchen, German Research Center for Environ-
mental Health, Neuherberg, Germany, and supported by grants
from the German Federal Ministry of Education and Research
(BMBF). Part of this work was funded by the German National
Genome Research Network (NGFN) and the European Union-spon-
sored project Cardiogenetics (LSH-2005-037593). Our research was
supported within the Munich Center of Health Sciences (MC
Health) as part of LMUinnovativ. SHIP is part of the Community
Medicine Research net (CMR) of the University of Greifswald,
Germany, which is funded by the Federal Ministry of Education
and Research, the Ministry of Cultural Affairs, as well as the Social
Ministry of the Federal State of Mecklenburg-West Pomerania. The
SHIP genotyping was supported by the future fund of the state
government of Mecklenburg-Vorpommern (UG 07 034). The estab-
lishment and genotyping of the UKBS-CC1 collection was funded
by the Wellcome Trust and by a National Institutes of Health
Research Grant to NHSBT. We thank the staff of the DNA Collec-
tions and Genotyping Facilities at the Wellcome Trust Sanger
Institute for sample preparation. We gratefully acknowledge the
contribution of G. Eckstein, T. Strom and K. Heim, A. Loschner,
R. Hellinger, and all other members of the Helmholtz Zentrum
Munchen genotyping staff in generating and analyzing the SNP
andRNAdata setandG. FischerandB. Kuhnel for data management
and statistical analyses. We thank all members of field staffs who
were involved in the planning and conduct of the MONICA/
KORA Augsburg, UKBS-CC1, and SHIP studies. Finally, we express
our appreciation to all study participants. No conflict of interest
relevant to this article was reported.
Received: September 30, 2008
Revised: November 14, 2008
Accepted: November 21, 2008
Published online: December 24, 2008
Web Resources
The URLs for data presented herein are as follows:
Genome browser, http://genome.ucsc.edu/
Markov Chain Haplotyping Package, http://www.sph.umich.edu/
csg/abecasis/mach/
METAL Package, http://www.sph.umich.edu/csg/abecasis/Metal.
index.html
Online Mendelian Inheritance in Man (OMIM), http://www.ncbi.
nlm.nih.gov/Omim/
The R project for Statistical Computing, http://www.r-project.org/
Sequenom, http://www.sequenom.com
SNP database, http://www.ncbi.nlm.nih.gov/SNP/
References
1. Davi, G., and Patrono, C. (2007). Platelet activation and
atherothrombosis. N. Engl. J. Med. 357, 2482–2494.
2. Tsiara, S., Elisaf, M., Jagroop, I.A., and Mikhailidis, D.P. (2003).
Platelets as predictors of vascular risk: is there a practical
index of platelet activity? Clin. Appl. Thromb. Hemost. 9,
177–190.
3. Martin, J.F., Bath, P.M., and Burr, M.L. (1992). Mean platelet
volume and myocardial infarction. Lancet 339, 1000–1001.
The A
4. Bath, P., Algert, C., Chapman, N., Neal, B., and PROGRESS
Collaborative Group.. (2004). Association of mean platelet
volume with risk of stroke among 3134 individuals with
history of cerebrovascular disease. Stroke 35, 622–626.
5. Kaushansky, K. (2008). Historical review: megakaryopoiesis
and thrombopoiesis. Blood 111, 981–986.
6. Garner, C., Tatu, T., Reittie, J.E., Littlewood, T., Darley, J.,
Cervino, S., Farrall, M., Kelly, P., Spector, T.D., and Thein,
S.L. (2000). Genetic influences on F cells and other hemato-
logic variables: a twin heritability study. Blood 95, 342–346.
7. Mahaney, M.C., Brugnara, C., Lease, L.R., and Platt, O.S.
(2005). Genetic influences on peripheral blood cell counts:
a study in baboons. Blood 106, 1210–1214.
8. Lowel, H., Doring, A., Schneider, A., Heier, M., Thorand, B.,
Meisinger, C., and MONICA/KORA Study Group.. (2005).
The MONICA Augsburg surveys—basis for prospective cohort
studies. Gesundheitswesen 67 (Suppl 1), S13–S18.
9. Wichmann, H.E., Gieger, C., Illig, T., and MONICA/KORA
Study Group.. (2005). KORA-gen–resource for population
genetics, controls and a broad spectrum of disease pheno-
types. Gesundheitswesen 67 (Suppl 1), S26–S30.
10. Doring, A., Gieger, C., Mehta, D., Gohlke, H., Prokisch, H.,
Coassin, S., Fischer, G., Henke, K., Klopp, N., Kronenberg, F.,
et al. (2008). SLC2A9 influences uric acid concentrations
with pronounced sex-specific effects. Nat. Genet. 40, 430–436.
11. Wellcome Trust Case Control Consortium. (2007). Genome-
wide association study of 14,000 cases of seven common
diseases and 3,000 shared controls. Nature 447, 661–678.
12. John, U., Greiner, B., Hensel, E., Ludemann, J., Piek, M., Sauer,
S., Adam, C., Born, G., Alte, D., Greiser, E., et al. (2001). Study
of Health In Pomerania (SHIP): a health examination survey
in an east German region: objectives and design. Soz. Praven-
tivmed. 46, 186–194.
13. Purcell, S., Neale, B., Todd-Brow, K., Thomas, L., Ferreira, M.A.,
Bender, D., Maller, J., Sklar, P., de Bakker, P.I., Daly, M.J., et al.
(2007). PLINK: a toolset for whole-genome association and pop-
ulation-based linkageanalysis.Am. J. Hum. Genet. 81, 559–575.
14. Chang, Y., Bluteau, D., Debili, N., and Vainchenker, W. (2007).
From hematopoietic stem cells to platelets. J. Thromb. Hae-
most. (Suppl 1), 318–327.
15. Neer, E.J., Schmidt, C.J., Nambudripad, R., and Smith, T.F.
(1994). The ancient regulatory-protein family of WD-repeat
proteins. Nature 371, 297–300.
16. Arthur, W.T., Ellerbroek, S.M., Der, C.J., Burridge, K., and Wen-
nerberg, K. (2002). XPLN, a guanine nucleotide exchange
factor for RhoA and RhoB, but not RhoC. J. Biol. Chem.
277, 42964–42972.
17. Thiesen, S., Kubart, S., Ropers, H.H., and Nothwan, H.G.
(2000). Isolation of two novel human RhoGEFs, ARHGEF3
and ARHGEF4, in 3p13–21 and 2q22. Biochem. Biophys.
Res. Commun. 273, 364–369.
18. Draviam, V.M., Stegmeier, F., Nalepa, G., Sowa, M.E., Chen, J.,
Liang, A., Hannon, G.J., Sorger, P.K., Harper, J.W., and Elledge,
S.J. (2007). A functional genomic screen identifies a role for
TAO1 kinase in spindle-checkpoint signalling. Nat. Cell Biol.
9, 556–564.
19. Zihni, C., Mitsopoulos, C., Tavares, I.A., Baum, B., Ridley, A.J.,
and Morris, J.D. (2007). Prostate-derived sterile 20-like kinase
1-alpha induces apoptosis. JNK- and caspase-dependent
nuclear localization is a requirement for membrane blebbing.
J. Biol. Chem. 282, 6484–6493.
merican Journal of Human Genetics 84, 66–71, January 9, 2009 71
Genome-Wide Scan on Total Serum IgE Levels IdentifiesFCER1A as Novel Susceptibility LocusStephan Weidinger1,2.*, Christian Gieger3,4., Elke Rodriguez2, Hansjorg Baurecht2,5, Martin Mempel1,2,
Norman Klopp3, Henning Gohlke3, Stefan Wagenpfeil5,6, Markus Ollert1,2, Johannes Ring1, Heidrun
Behrendt2, Joachim Heinrich3, Natalija Novak7, Thomas Bieber7, Ursula Kramer8, Dietrich Berdel9,
Andrea von Berg9, Carl Peter Bauer10, Olf Herbarth11, Sibylle Koletzko12, Holger Prokisch13,14, Divya
Mehta13,14, Thomas Meitinger13,14, Martin Depner12, Erika von Mutius12, Liming Liang15, Miriam
Moffatt16, William Cookson16, Michael Kabesch12, H.-Erich Wichmann3,4, Thomas Illig3
1 Department of Dermatology and Allergy, Technische Universitat Munchen, Munchen, Germany, 2 Division of Environmental Dermatology and Allergy, Helmholtz
Zentrum Munchen, Neuherberg and ZAUM-Center for Allergy and Environment, Technische Universitat Munchen, Munchen, Germany, 3 Institute of Epidemiology,
Helmholtz Zentrum Munchen, German Research Center for Environmental Health, Neuherberg, Germany, 4 Institute of Medical Informatics, Biometry and Epidemiology,
Ludwig-Maximilians-Universitat Munchen, Munchen, Germany, 5 IMSE Institute for Medical Statistics and Epidemiology, Technische Universitat Munchen, Munchen,
Germany, 6 Graduate School of Information Science in Health (GSISH), Technische Universitat Munchen, Munchen, Germany, 7 Department of Dermatology and Allergy,
University of Bonn, Bonn, Germany, 8 IUF–Institut fur Umweltmedizinische Forschung at the Heinrich-Heine-University, Dusseldorf, Germany, 9 Marien-Hospital, Wesel,
Germany, 10 Department of Pediatrics, Technische Universitat Munchen, Munchen, Germany, 11 Department of Human Exposure Research and Epidemiology, UFZ–
Centre for Environmental Research Leipzig, Leipzig, Germany, 12 University Children’s Hospital, Ludwig-Maximilians-Universitat Munchen, Munchen, Germany,
13 Institute of Human Genetics, Helmholtz Zentrum Munchen, German Research Center for Environmental Health, Neuherberg, Germany, 14 Institute of Human Genetics,
Klinikum rechts der Isar, Technische Universitat Munchen, Munchen, Germany, 15 Center for Statistical Genetics, Department of Biostatistics, School of Public Health, Ann
Arbor, Michigan, United States of America, 16 National Heart and Lung Institute, Imperial College London, London, United Kingdom
Abstract
High levels of serum IgE are considered markers of parasite and helminth exposure. In addition, they are associated withallergic disorders, play a key role in anti-tumoral defence, and are crucial mediators of autoimmune diseases. Total IgE is astrongly heritable trait. In a genome-wide association study (GWAS), we tested 353,569 SNPs for association with serum IgElevels in 1,530 individuals from the population-based KORA S3/F3 study. Replication was performed in four independentpopulation-based study samples (total n = 9,769 individuals). Functional variants in the gene encoding the alpha chain ofthe high affinity receptor for IgE (FCER1A) on chromosome 1q23 (rs2251746 and rs2427837) were strongly associated withtotal IgE levels in all cohorts with P values of 1.85610220 and 7.08610219 in a combined analysis, and in a post-hoc analysisshowed additional associations with allergic sensitization (P = 7.7861024 and P = 1.9561023). The ‘‘top’’ SNP significantlyinfluenced the cell surface expression of FCER1A on basophils, and genome-wide expression profiles indicated aninteresting novel regulatory mechanism of FCER1A expression via GATA-2. Polymorphisms within the RAD50 gene onchromosome 5q31 were consistently associated with IgE levels (P values 6.286102724.4661028) and increased the risk foratopic eczema and asthma. Furthermore, STAT6 was confirmed as susceptibility locus modulating IgE levels. In this firstGWAS on total IgE FCER1A was identified and replicated as new susceptibility locus at which common genetic variationinfluences serum IgE levels. In addition, variants within the RAD50 gene might represent additional factors within cytokinegene cluster on chromosome 5q31, emphasizing the need for further investigations in this intriguing region. Our datafurthermore confirm association of STAT6 variation with serum IgE levels.
Citation: Weidinger S, Gieger C, Rodriguez E, Baurecht H, Mempel M, et al. (2008) Genome-Wide Scan on Total Serum IgE Levels Identifies FCER1A as NovelSusceptibility Locus. PLoS Genet 4(8): e1000166. doi:10.1371/journal.pgen.1000166
Editor: Vivian G. Cheung, University of Pennsylvania, United States of America
Received May 12, 2008; Accepted July 15, 2008; Published August 22, 2008
Copyright: � 2008 Weidinger et al. This is an open-access article distributed under the terms of the Creative Commons Attribution License, which permitsunrestricted use, distribution, and reproduction in any medium, provided the original author and source are credited.
Funding: The study was funded by the German Ministry of Education and Research (BMBF) as part of the National Genome Research Network (NGFN), theWellcome Trust, the German Ministry of Education and Research (BMBF), and the European Commission as part of GABRIEL (a multidisciplinary study to identifythe genetic and environmental causes of asthma in the European Community). Furthermore the study was supported by the Genetic Epidemiological ModellingCenter Munich (GEM Munich). The MONICA/KORA Augsburg studies were financed by the Helmholtz Zentrum Munchen, German Research Center forEnvironmental Health, Neuherberg, Germany and supported by grants from the German Federal Ministry of Education and Research (BMBF). The research wassupported within the Munich Center of Health Sciences (MC Health) as part of LMUinnovativ. The GINI/LISA studies were funded by grants of the BMU (for IUF,FKZ 20462296), and Federal Ministry for Education, Science, Research, and Technology (No. 01 EG 9705/2 and 01EG9732; No. 01 EE 9401-4) and additionalfinancial support from the Stiftung Kindergesundheit (Child Health Foundation). S.Weidinger and S.Wagenpfeil are supported by research grants KKF-07/04 andKKF-27/05 of the University Hospital Rechts der Isar, Technische Universitat Munchen. The first author in addition is supported by a grant from the Wilhelm-Vaillant-Stiftung.
Competing Interests: The authors have declared that no competing interests exist.
* E-mail: [email protected]
. These authors contributed equally to this work.
PLoS Genetics | www.plosgenetics.org 1 August 2008 | Volume 4 | Issue 8 | e1000166
Introduction
High levels of IgE have been considered for many years as
markers of parasite and helminth exposure to which they confer
resistance [1]. In Western lifestyle countries with less contact,
however, elevated IgE levels are associated with allergic disorders
[2]. Only recently, it has been established that IgE antibodies also
play a key role in anti-tumoral defence [3] and are crucial
mediators of autoimmune diseases [4], thus challenging the
traditional Th1/Th2 dogma.
High total serum IgE levels are closely correlated with the
clinical expression and severity of asthma and allergy [5,6]. The
regulation of serum IgE production is largely influenced by
familial determinants, and both pedigree- and twin-based studies
provided evidence of a strong genetic contribution to the
variability of total IgE levels [7,8]. Genetic susceptibility of IgE-
responsiveness is likely to be caused by a pattern of polymorphisms
in multiple genes regulating immunologic responses[9], but so far
only very few loci could be established consistently and robustly,
most notable FCER1B, IL-13 and STAT6 [10,11].
Family and case-control studies indicated that total serum IgE
levels are largely determined by genetic factors that are
independent of specific IgE responses and that total serum IgE
levels are under stronger genetic control than atopic disease
[8,12,13,14]. An understanding of the genetic mechanisms
regulating total serum IgE levels might also aid in the dissection
of the genetic basis of atopic diseases. In an attempt to identify
novel genetic variants that affect total IgE levels, we conducted a
genome-wide association study (GWAS) in 1,530 German adults
and replicated the top signals in altogether 9,769 samples of four
independent study populations.
Results
Genome-wide Association ScanFor the GWAS 1,530 individuals from the population-based
KORA S3/F3 500 K study with available total IgE levels were
typed with the Affymetrix 500 K Array Set. For statistical analysis,
we selected SNPs by including only high-quality genotypes to
reduce the number of false positive signals. A total of 353,569
SNPs passed all quality control measures and were tested for
associations with IgE levels. Figure 1 summarizes the results of the
KORA S3/F3 500 K analysis. No single SNPs reached genome-
wide significance, but the scan pointed to the gene encoding the
alpha chain of the high affinity receptor for IgE (FCER1A) on
chromosome 1 (Figure 1A). Particularly the quantile-quantile-plot
of the P values illustrates observed significant associations beyond
those expected by chance (Figure 1B).
Replication and Fine-MappingFor replication in the independent population-based KORA S4
cohort (N = 3,890), we used the following inclusion criteria: (i)
P,1024 in the genome wide analysis (39 SNPs, 35 expected); (ii)
P,1023 with at least one neighboring SNPs (6100 kb) with
P,1023 (45 SNPs). The specific results for all SNPs in the GWAS
and KORA S4 are given in supplementary table S3. Six SNPs were
significantly associated with total IgE levels in KORA S4 with P
values ranging from 2.4761024 to 3.2361029 (given a Bonferroni-
corrected significance level of 5.1061024). The strongest associations
were observed for rs2427837 (P = 3.2361029), which is located in
the 59 region of FCER1A, and rs12368672 (P = 2.0361026), which is
located in the 59 region of STAT6. In addition, all 4 RAD50 SNPs
which had been selected in the GWAS could be replicated.
Effect estimates of the SNPs in FCER1A and STAT6 were only
slightly lower compared to those in the KORA S3/F3 500 K
Figure 1. Results of the KORA S3/F3 500 K analysis. a) Genome-wide association study of chromosomal loci for IgE levels: the analysis isbased on a population-based sample of 1530 persons. The x-axisrepresents the genomic position of 353,569 SNPs, and the y-axis shows2log10 (P value). b) Quantile-quantile plot of P values: Each black dotrepresents an observed statistic (defined as the 2log10( P value)) versusthe corresponding expected statistic. The line corresponds to the nulldistribution.doi:10.1371/journal.pgen.1000166.g001
Author Summary
High levels of serum IgE are considered markers of parasiteand helminth exposure. In addition, they are associatedwith allergic disorders, play a key role in anti-tumoraldefence, and are crucial mediators of autoimmunediseases. There is strong evidence that the regulation ofserum IgE levels is under a strong genetic control.However, despite numerous loci and candidate geneslinked and associated with atopy-related traits, very fewhave been associated consistently with total IgE. This studydescribes the first large-scale, genome-wide scan on totalIgE. By examining .11,000 German individuals from fourindependent population-based cohorts, we show thatfunctional variants in the gene encoding the alpha chain ofthe high affinity receptor for IgE (FCER1A) on chromosome1q23 are strongly associated with total IgE levels. Inaddition, our data confirm association of STAT6 variationwith serum IgE levels, and suggest that variants within theRAD50 gene might represent additional factors withincytokine gene cluster on chromosome 5q31, emphasizingthe need for further investigations in this intriguing region.
Genome-Wide Association Study on Total IgE
PLoS Genetics | www.plosgenetics.org 2 August 2008 | Volume 4 | Issue 8 | e1000166
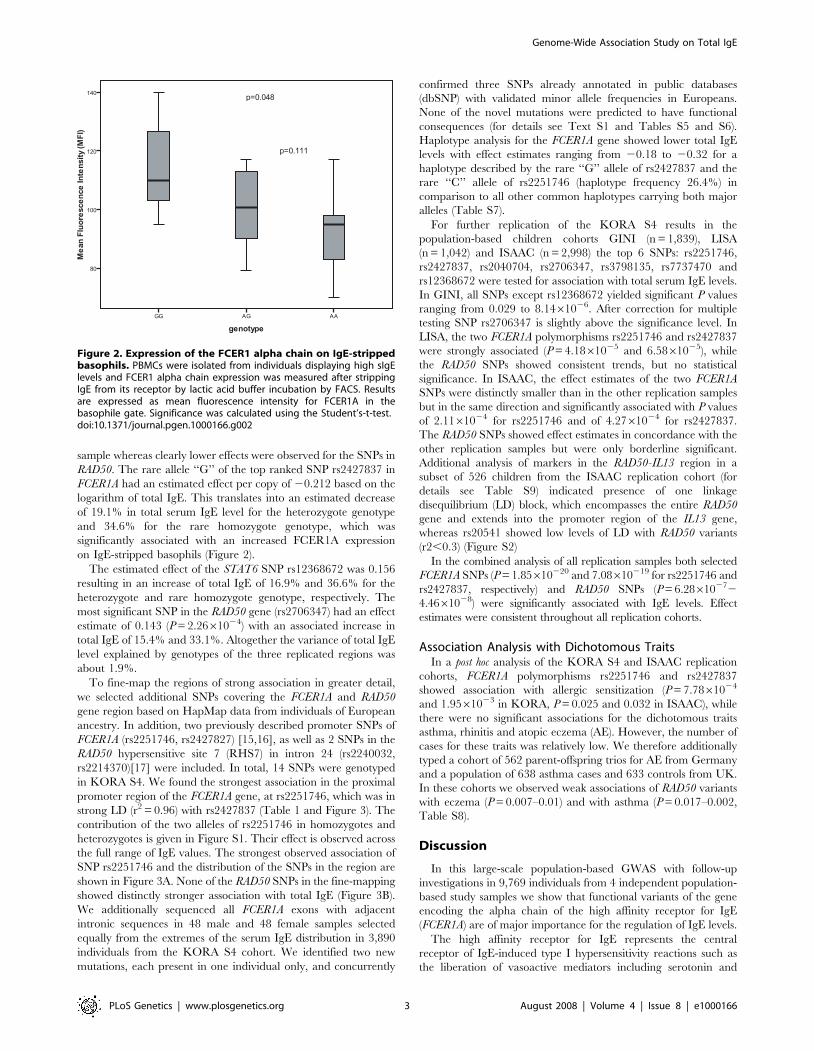
sample whereas clearly lower effects were observed for the SNPs in
RAD50. The rare allele ‘‘G’’ of the top ranked SNP rs2427837 in
FCER1A had an estimated effect per copy of 20.212 based on the
logarithm of total IgE. This translates into an estimated decrease
of 19.1% in total serum IgE level for the heterozygote genotype
and 34.6% for the rare homozygote genotype, which was
significantly associated with an increased FCER1A expression
on IgE-stripped basophils (Figure 2).
The estimated effect of the STAT6 SNP rs12368672 was 0.156
resulting in an increase of total IgE of 16.9% and 36.6% for the
heterozygote and rare homozygote genotype, respectively. The
most significant SNP in the RAD50 gene (rs2706347) had an effect
estimate of 0.143 (P = 2.2661024) with an associated increase in
total IgE of 15.4% and 33.1%. Altogether the variance of total IgE
level explained by genotypes of the three replicated regions was
about 1.9%.
To fine-map the regions of strong association in greater detail,
we selected additional SNPs covering the FCER1A and RAD50
gene region based on HapMap data from individuals of European
ancestry. In addition, two previously described promoter SNPs of
FCER1A (rs2251746, rs2427827) [15,16], as well as 2 SNPs in the
RAD50 hypersensitive site 7 (RHS7) in intron 24 (rs2240032,
rs2214370)[17] were included. In total, 14 SNPs were genotyped
in KORA S4. We found the strongest association in the proximal
promoter region of the FCER1A gene, at rs2251746, which was in
strong LD (r2 = 0.96) with rs2427837 (Table 1 and Figure 3). The
contribution of the two alleles of rs2251746 in homozygotes and
heterozygotes is given in Figure S1. Their effect is observed across
the full range of IgE values. The strongest observed association of
SNP rs2251746 and the distribution of the SNPs in the region are
shown in Figure 3A. None of the RAD50 SNPs in the fine-mapping
showed distinctly stronger association with total IgE (Figure 3B).
We additionally sequenced all FCER1A exons with adjacent
intronic sequences in 48 male and 48 female samples selected
equally from the extremes of the serum IgE distribution in 3,890
individuals from the KORA S4 cohort. We identified two new
mutations, each present in one individual only, and concurrently
confirmed three SNPs already annotated in public databases
(dbSNP) with validated minor allele frequencies in Europeans.
None of the novel mutations were predicted to have functional
consequences (for details see Text S1 and Tables S5 and S6).
Haplotype analysis for the FCER1A gene showed lower total IgE
levels with effect estimates ranging from 20.18 to 20.32 for a
haplotype described by the rare ‘‘G’’ allele of rs2427837 and the
rare ‘‘C’’ allele of rs2251746 (haplotype frequency 26.4%) in
comparison to all other common haplotypes carrying both major
alleles (Table S7).
For further replication of the KORA S4 results in the
population-based children cohorts GINI (n = 1,839), LISA
(n = 1,042) and ISAAC (n = 2,998) the top 6 SNPs: rs2251746,
rs2427837, rs2040704, rs2706347, rs3798135, rs7737470 and
rs12368672 were tested for association with total serum IgE levels.
In GINI, all SNPs except rs12368672 yielded significant P values
ranging from 0.029 to 8.1461026. After correction for multiple
testing SNP rs2706347 is slightly above the significance level. In
LISA, the two FCER1A polymorphisms rs2251746 and rs2427837
were strongly associated (P = 4.1861025 and 6.5861025), while
the RAD50 SNPs showed consistent trends, but no statistical
significance. In ISAAC, the effect estimates of the two FCER1A
SNPs were distinctly smaller than in the other replication samples
but in the same direction and significantly associated with P values
of 2.1161024 for rs2251746 and of 4.2761024 for rs2427837.
The RAD50 SNPs showed effect estimates in concordance with the
other replication samples but were only borderline significant.
Additional analysis of markers in the RAD50-IL13 region in a
subset of 526 children from the ISAAC replication cohort (for
details see Table S9) indicated presence of one linkage
disequilibrium (LD) block, which encompasses the entire RAD50
gene and extends into the promoter region of the IL13 gene,
whereas rs20541 showed low levels of LD with RAD50 variants
(r2,0.3) (Figure S2)
In the combined analysis of all replication samples both selected
FCER1A SNPs (P = 1.85610220 and 7.08610219 for rs2251746 and
rs2427837, respectively) and RAD50 SNPs (P = 6.28610272
4.4661028) were significantly associated with IgE levels. Effect
estimates were consistent throughout all replication cohorts.
Association Analysis with Dichotomous TraitsIn a post hoc analysis of the KORA S4 and ISAAC replication
cohorts, FCER1A polymorphisms rs2251746 and rs2427837
showed association with allergic sensitization (P = 7.7861024
and 1.9561023 in KORA, P = 0.025 and 0.032 in ISAAC), while
there were no significant associations for the dichotomous traits
asthma, rhinitis and atopic eczema (AE). However, the number of
cases for these traits was relatively low. We therefore additionally
typed a cohort of 562 parent-offspring trios for AE from Germany
and a population of 638 asthma cases and 633 controls from UK.
In these cohorts we observed weak associations of RAD50 variants
with eczema (P = 0.007–0.01) and with asthma (P = 0.017–0.002,
Table S8).
Discussion
In this large-scale population-based GWAS with follow-up
investigations in 9,769 individuals from 4 independent population-
based study samples we show that functional variants of the gene
encoding the alpha chain of the high affinity receptor for IgE
(FCER1A) are of major importance for the regulation of IgE levels.
The high affinity receptor for IgE represents the central
receptor of IgE-induced type I hypersensitivity reactions such as
the liberation of vasoactive mediators including serotonin and
Figure 2. Expression of the FCER1 alpha chain on IgE-strippedbasophils. PBMCs were isolated from individuals displaying high sIgElevels and FCER1 alpha chain expression was measured after strippingIgE from its receptor by lactic acid buffer incubation by FACS. Resultsare expressed as mean fluorescence intensity for FCER1A in thebasophile gate. Significance was calculated using the Student’s-t-test.doi:10.1371/journal.pgen.1000166.g002
Genome-Wide Association Study on Total IgE
PLoS Genetics | www.plosgenetics.org 3 August 2008 | Volume 4 | Issue 8 | e1000166
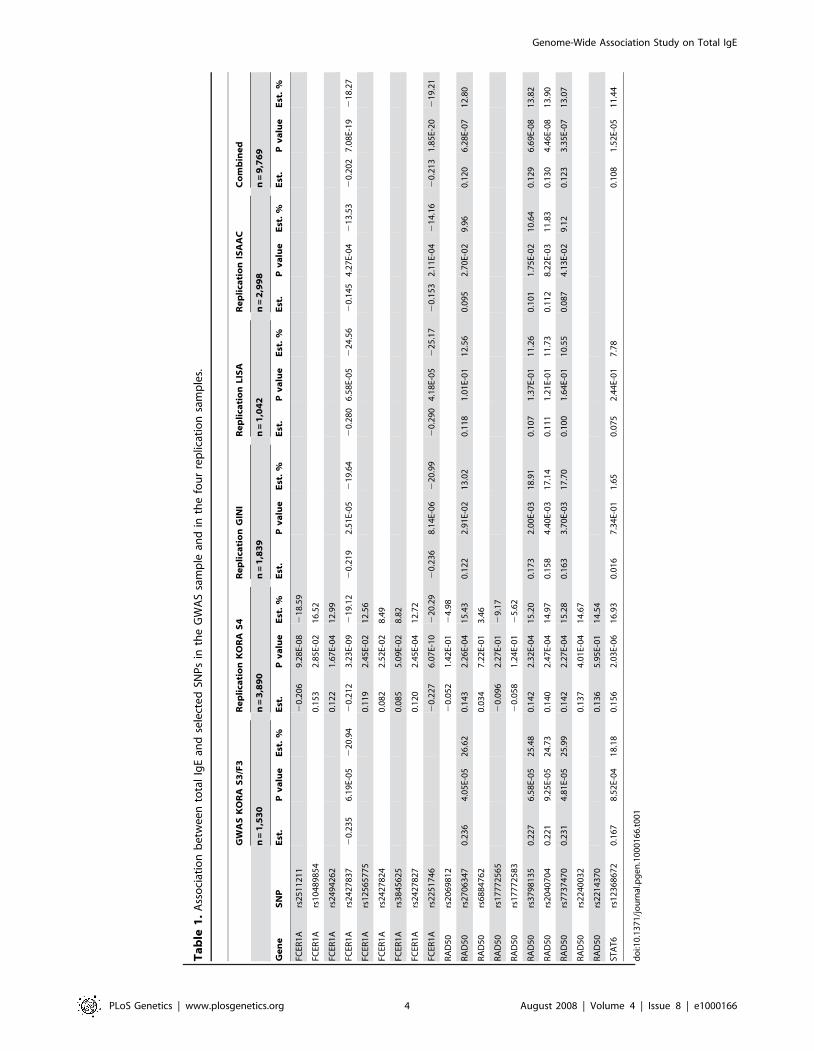
Ta
ble
1.
Ass
oci
atio
nb
etw
ee
nto
tal
IgE
and
sele
cte
dSN
Ps
inth
eG
WA
Ssa
mp
lean
din
the
fou
rre
plic
atio
nsa
mp
les.
GW
AS
KO
RA
S3
/F3
Re
pli
cati
on
KO
RA
S4
Re
pli
cati
on
GIN
IR
ep
lica
tio
nL
ISA
Re
pli
cati
on
ISA
AC
Co
mb
ine
d
n=
1,5
30
n=
3,8
90
n=
1,8
39
n=
1,0
42
n=
2,9
98
n=
9,7
69
Ge
ne
SN
PE
st.
Pv
alu
eE
st.
%E
st.
Pv
alu
eE
st.
%E
st.
Pv
alu
eE
st.
%E
st.
Pv
alu
eE
st.
%E
st.
Pv
alu
eE
st.
%E
st.
Pv
alu
eE
st.
%
FCER
1A
rs2
51
12
11
20
.20
69
.28
E-0
82
18
.59
FCER
1A
rs1
04
89
85
40
.15
32
.85
E-0
21
6.5
2
FCER
1A
rs2
49
42
62
0.1
22
1.6
7E-
04
12
.99
FCER
1A
rs2
42
78
37
20
.23
56
.19
E-0
52
20
.94
20
.21
23
.23
E-0
92
19
.12
20
.21
92
.51
E-0
52
19
.64
20
.28
06
.58
E-0
52
24
.56
20
.14
54
.27
E-0
42
13
.53
20
.20
27
.08
E-1
92
18
.27
FCER
1A
rs1
25
65
77
50
.11
92
.45
E-0
21
2.5
6
FCER
1A
rs2
42
78
24
0.0
82
2.5
2E-
02
8.4
9
FCER
1A
rs3
84
56
25
0.0
85
5.0
9E-
02
8.8
2
FCER
1A
rs2
42
78
27
0.1
20
2.4
5E-
04
12
.72
FCER
1A
rs2
25
17
46
20
.22
76
.07
E-1
02
20
.29
20
.23
68
.14
E-0
62
20
.99
20
.29
04
.18
E-0
52
25
.17
20
.15
32
.11
E-0
42
14
.16
20
.21
31
.85
E-2
02
19
.21
RA
D5
0rs
20
69
81
22
0.0
52
1.4
2E-
01
24
.98
RA
D5
0rs
27
06
34
70
.23
64
.05
E-0
52
6.6
20
.14
32
.26
E-0
41
5.4
30
.12
22
.91
E-0
21
3.0
20
.11
81
.01
E-0
11
2.5
60
.09
52
.70
E-0
29
.96
0.1
20
6.2
8E-
07
12
.80
RA
D5
0rs
68
84
76
20
.03
47
.22
E-0
13
.46
RA
D5
0rs
17
77
25
65
20
.09
62
.27
E-0
12
9.1
7
RA
D5
0rs
17
77
25
83
20
.05
81
.24
E-0
12
5.6
2
RA
D5
0rs
37
98
13
50
.22
76
.58
E-0
52
5.4
80
.14
22
.32
E-0
41
5.2
00
.17
32
.00
E-0
31
8.9
10
.10
71
.37
E-0
11
1.2
60
.10
11
.75
E-0
21
0.6
40
.12
96
.69
E-0
81
3.8
2
RA
D5
0rs
20
40
70
40
.22
19
.25
E-0
52
4.7
30
.14
02
.47
E-0
41
4.9
70
.15
84
.40
E-0
31
7.1
40
.11
11
.21
E-0
11
1.7
30
.11
28
.22
E-0
31
1.8
30
.13
04
.46
E-0
81
3.9
0
RA
D5
0rs
77
37
47
00
.23
14
.81
E-0
52
5.9
90
.14
22
.27
E-0
41
5.2
80
.16
33
.70
E-0
31
7.7
00
.10
01
.64
E-0
11
0.5
50
.08
74
.13
E-0
29
.12
0.1
23
3.3
5E-
07
13
.07
RA
D5
0rs
22
40
03
20
.13
74
.01
E-0
41
4.6
7
RA
D5
0rs
22
14
37
00
.13
65
.95
E-0
11
4.5
4
STA
T6
rs1
23
68
67
20
.16
78
.52
E-0
41
8.1
80
.15
62
.03
E-0
61
6.9
30
.01
67
.34
E-0
11
.65
0.0
75
2.4
4E-
01
7.7
80
.10
81
.52
E-0
51
1.4
4
do
i:10
.13
71
/jo
urn
al.p
ge
n.1
00
01
66
.t0
01
Genome-Wide Association Study on Total IgE
PLoS Genetics | www.plosgenetics.org 4 August 2008 | Volume 4 | Issue 8 | e1000166
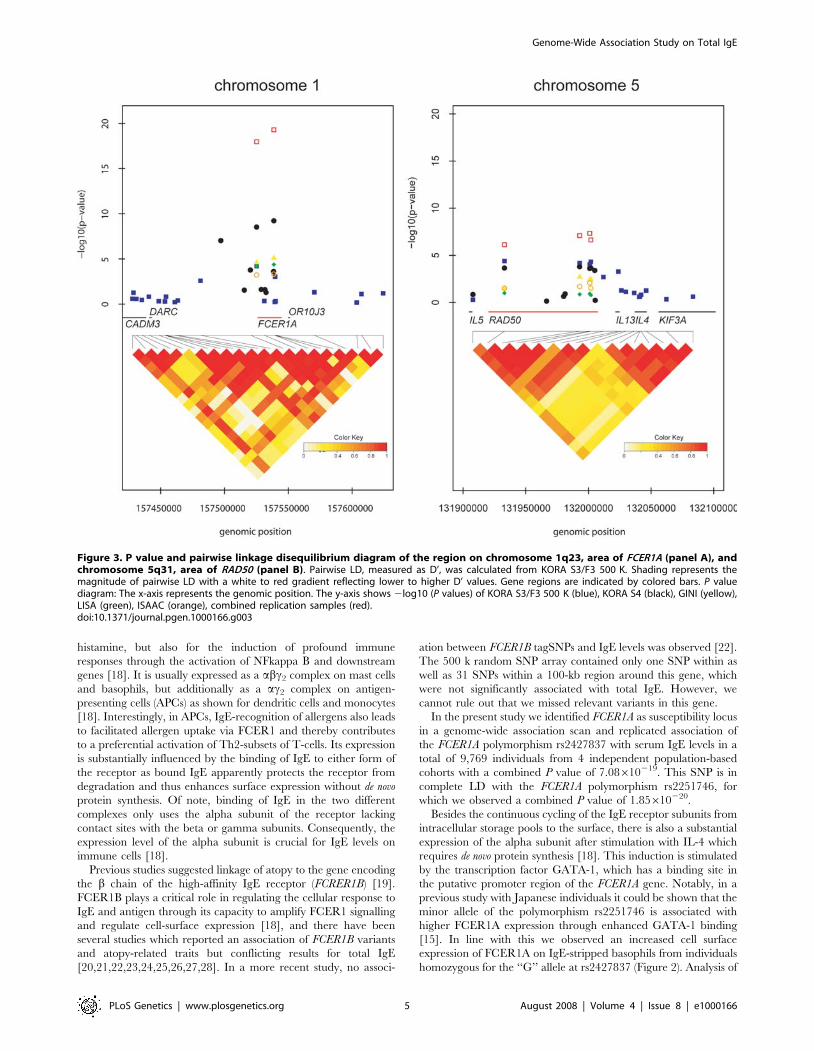
histamine, but also for the induction of profound immune
responses through the activation of NFkappa B and downstream
genes [18]. It is usually expressed as a abc2 complex on mast cells
and basophils, but additionally as a ac2 complex on antigen-
presenting cells (APCs) as shown for dendritic cells and monocytes
[18]. Interestingly, in APCs, IgE-recognition of allergens also leads
to facilitated allergen uptake via FCER1 and thereby contributes
to a preferential activation of Th2-subsets of T-cells. Its expression
is substantially influenced by the binding of IgE to either form of
the receptor as bound IgE apparently protects the receptor from
degradation and thus enhances surface expression without de novo
protein synthesis. Of note, binding of IgE in the two different
complexes only uses the alpha subunit of the receptor lacking
contact sites with the beta or gamma subunits. Consequently, the
expression level of the alpha subunit is crucial for IgE levels on
immune cells [18].
Previous studies suggested linkage of atopy to the gene encoding
the b chain of the high-affinity IgE receptor (FCRER1B) [19].
FCER1B plays a critical role in regulating the cellular response to
IgE and antigen through its capacity to amplify FCER1 signalling
and regulate cell-surface expression [18], and there have been
several studies which reported an association of FCER1B variants
and atopy-related traits but conflicting results for total IgE
[20,21,22,23,24,25,26,27,28]. In a more recent study, no associ-
ation between FCER1B tagSNPs and IgE levels was observed [22].
The 500 k random SNP array contained only one SNP within as
well as 31 SNPs within a 100-kb region around this gene, which
were not significantly associated with total IgE. However, we
cannot rule out that we missed relevant variants in this gene.
In the present study we identified FCER1A as susceptibility locus
in a genome-wide association scan and replicated association of
the FCER1A polymorphism rs2427837 with serum IgE levels in a
total of 9,769 individuals from 4 independent population-based
cohorts with a combined P value of 7.08610219. This SNP is in
complete LD with the FCER1A polymorphism rs2251746, for
which we observed a combined P value of 1.85610220.
Besides the continuous cycling of the IgE receptor subunits from
intracellular storage pools to the surface, there is also a substantial
expression of the alpha subunit after stimulation with IL-4 which
requires de novo protein synthesis [18]. This induction is stimulated
by the transcription factor GATA-1, which has a binding site in
the putative promoter region of the FCER1A gene. Notably, in a
previous study with Japanese individuals it could be shown that the
minor allele of the polymorphism rs2251746 is associated with
higher FCER1A expression through enhanced GATA-1 binding
[15]. In line with this we observed an increased cell surface
expression of FCER1A on IgE-stripped basophils from individuals
homozygous for the ‘‘G’’ allele at rs2427837 (Figure 2). Analysis of
Figure 3. P value and pairwise linkage disequilibrium diagram of the region on chromosome 1q23, area of FCER1A (panel A), andchromosome 5q31, area of RAD50 (panel B). Pairwise LD, measured as D’, was calculated from KORA S3/F3 500 K. Shading represents themagnitude of pairwise LD with a white to red gradient reflecting lower to higher D’ values. Gene regions are indicated by colored bars. P valuediagram: The x-axis represents the genomic position. The y-axis shows 2log10 (P values) of KORA S3/F3 500 K (blue), KORA S4 (black), GINI (yellow),LISA (green), ISAAC (orange), combined replication samples (red).doi:10.1371/journal.pgen.1000166.g003
Genome-Wide Association Study on Total IgE
PLoS Genetics | www.plosgenetics.org 5 August 2008 | Volume 4 | Issue 8 | e1000166
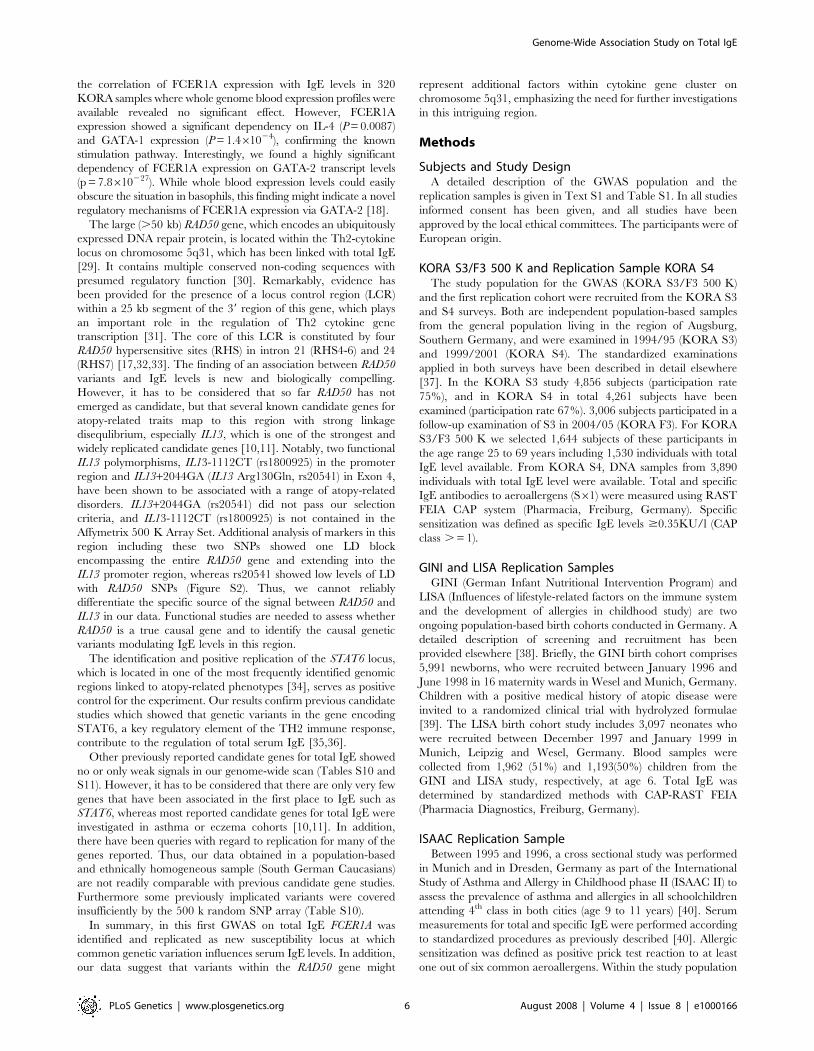
the correlation of FCER1A expression with IgE levels in 320
KORA samples where whole genome blood expression profiles were
available revealed no significant effect. However, FCER1A
expression showed a significant dependency on IL-4 (P = 0.0087)
and GATA-1 expression (P = 1.461024), confirming the known
stimulation pathway. Interestingly, we found a highly significant
dependency of FCER1A expression on GATA-2 transcript levels
(p = 7.8610227). While whole blood expression levels could easily
obscure the situation in basophils, this finding might indicate a novel
regulatory mechanisms of FCER1A expression via GATA-2 [18].
The large (.50 kb) RAD50 gene, which encodes an ubiquitously
expressed DNA repair protein, is located within the Th2-cytokine
locus on chromosome 5q31, which has been linked with total IgE
[29]. It contains multiple conserved non-coding sequences with
presumed regulatory function [30]. Remarkably, evidence has
been provided for the presence of a locus control region (LCR)
within a 25 kb segment of the 39 region of this gene, which plays
an important role in the regulation of Th2 cytokine gene
transcription [31]. The core of this LCR is constituted by four
RAD50 hypersensitive sites (RHS) in intron 21 (RHS4-6) and 24
(RHS7) [17,32,33]. The finding of an association between RAD50
variants and IgE levels is new and biologically compelling.
However, it has to be considered that so far RAD50 has not
emerged as candidate, but that several known candidate genes for
atopy-related traits map to this region with strong linkage
disequlibrium, especially IL13, which is one of the strongest and
widely replicated candidate genes [10,11]. Notably, two functional
IL13 polymorphisms, IL13-1112CT (rs1800925) in the promoter
region and IL13+2044GA (IL13 Arg130Gln, rs20541) in Exon 4,
have been shown to be associated with a range of atopy-related
disorders. IL13+2044GA (rs20541) did not pass our selection
criteria, and IL13-1112CT (rs1800925) is not contained in the
Affymetrix 500 K Array Set. Additional analysis of markers in this
region including these two SNPs showed one LD block
encompassing the entire RAD50 gene and extending into the
IL13 promoter region, whereas rs20541 showed low levels of LD
with RAD50 SNPs (Figure S2). Thus, we cannot reliably
differentiate the specific source of the signal between RAD50 and
IL13 in our data. Functional studies are needed to assess whether
RAD50 is a true causal gene and to identify the causal genetic
variants modulating IgE levels in this region.
The identification and positive replication of the STAT6 locus,
which is located in one of the most frequently identified genomic
regions linked to atopy-related phenotypes [34], serves as positive
control for the experiment. Our results confirm previous candidate
studies which showed that genetic variants in the gene encoding
STAT6, a key regulatory element of the TH2 immune response,
contribute to the regulation of total serum IgE [35,36].
Other previously reported candidate genes for total IgE showed
no or only weak signals in our genome-wide scan (Tables S10 and
S11). However, it has to be considered that there are only very few
genes that have been associated in the first place to IgE such as
STAT6, whereas most reported candidate genes for total IgE were
investigated in asthma or eczema cohorts [10,11]. In addition,
there have been queries with regard to replication for many of the
genes reported. Thus, our data obtained in a population-based
and ethnically homogeneous sample (South German Caucasians)
are not readily comparable with previous candidate gene studies.
Furthermore some previously implicated variants were covered
insufficiently by the 500 k random SNP array (Table S10).
In summary, in this first GWAS on total IgE FCER1A was
identified and replicated as new susceptibility locus at which
common genetic variation influences serum IgE levels. In addition,
our data suggest that variants within the RAD50 gene might
represent additional factors within cytokine gene cluster on
chromosome 5q31, emphasizing the need for further investigations
in this intriguing region.
Methods
Subjects and Study DesignA detailed description of the GWAS population and the
replication samples is given in Text S1 and Table S1. In all studies
informed consent has been given, and all studies have been
approved by the local ethical committees. The participants were of
European origin.
KORA S3/F3 500 K and Replication Sample KORA S4The study population for the GWAS (KORA S3/F3 500 K)
and the first replication cohort were recruited from the KORA S3
and S4 surveys. Both are independent population-based samples
from the general population living in the region of Augsburg,
Southern Germany, and were examined in 1994/95 (KORA S3)
and 1999/2001 (KORA S4). The standardized examinations
applied in both surveys have been described in detail elsewhere
[37]. In the KORA S3 study 4,856 subjects (participation rate
75%), and in KORA S4 in total 4,261 subjects have been
examined (participation rate 67%). 3,006 subjects participated in a
follow-up examination of S3 in 2004/05 (KORA F3). For KORA
S3/F3 500 K we selected 1,644 subjects of these participants in
the age range 25 to 69 years including 1,530 individuals with total
IgE level available. From KORA S4, DNA samples from 3,890
individuals with total IgE level were available. Total and specific
IgE antibodies to aeroallergens (S61) were measured using RAST
FEIA CAP system (Pharmacia, Freiburg, Germany). Specific
sensitization was defined as specific IgE levels $0.35KU/l (CAP
class . = 1).
GINI and LISA Replication SamplesGINI (German Infant Nutritional Intervention Program) and
LISA (Influences of lifestyle-related factors on the immune system
and the development of allergies in childhood study) are two
ongoing population-based birth cohorts conducted in Germany. A
detailed description of screening and recruitment has been
provided elsewhere [38]. Briefly, the GINI birth cohort comprises
5,991 newborns, who were recruited between January 1996 and
June 1998 in 16 maternity wards in Wesel and Munich, Germany.
Children with a positive medical history of atopic disease were
invited to a randomized clinical trial with hydrolyzed formulae
[39]. The LISA birth cohort study includes 3,097 neonates who
were recruited between December 1997 and January 1999 in
Munich, Leipzig and Wesel, Germany. Blood samples were
collected from 1,962 (51%) and 1,193(50%) children from the
GINI and LISA study, respectively, at age 6. Total IgE was
determined by standardized methods with CAP-RAST FEIA
(Pharmacia Diagnostics, Freiburg, Germany).
ISAAC Replication SampleBetween 1995 and 1996, a cross sectional study was performed
in Munich and in Dresden, Germany as part of the International
Study of Asthma and Allergy in Childhood phase II (ISAAC II) to
assess the prevalence of asthma and allergies in all schoolchildren
attending 4th class in both cities (age 9 to 11 years) [40]. Serum
measurements for total and specific IgE were performed according
to standardized procedures as previously described [40]. Allergic
sensitization was defined as positive prick test reaction to at least
one out of six common aeroallergens. Within the study population
Genome-Wide Association Study on Total IgE
PLoS Genetics | www.plosgenetics.org 6 August 2008 | Volume 4 | Issue 8 | e1000166
of 5,629 children, all children of German origin with DNA and
total IgE level available were included in this analysis (n = 2,998).
KORA S3/F3 500 K Genotyping and Quality ControlGenotyping for KORA S3/F3 500 K was performed using
Affymetrix Gene Chip Human Mapping 500 K Array Set
consisting of two chips (Sty I and Nsp I). Genomic DNA was
hybridized in accordance with the manufacturer’s standard
recommendations. Genotypes were determined using BRLMM
clustering algorithm. We performed filtering of both conspicuous
individuals and single nucleotide polymorphisms (SNPs) to ensure
robustness of association analysis. Details on quality criteria are
described in Text S1 and Table S2.
SNP Selection for Replication and Fine-MappingThe power of the replication was estimated for a difference in
log total IgE per allele of 0.2 and a nominal significance level of
0.05. The power to detect a true association was above 85% in
KORA S4, GINI and ISAAC; whereas in LISA it was about 55%.
No single SNPs in the GWAS reached genome-wide significance
using a Bonferroni threshold of 1.461027. To fine map the
replicated loci in KORA S4 we selected tagging SNPs and used
the pairwise tagging algorithm (r2.0.8) implemented in HAPLO-
VIEW 3.3 (HapMap data release #22, March 2007, on NCBI
B36 assembly, dbSNP b126) and additionally selected putative
functional SNPs in FCER1A and RAD50.
SNP Genotyping and Quality Control in the ReplicationSamples
In all replication samples genotyping of SNPs was realized with
the iPLEX (Sequenom San Diego, CA, USA) method by means of
matrix assisted laser desorption ionisation-time of flight mass
spectrometry method (MALDI-TOF MS, Mass Arraay, Seque-
nom, San Diego, CA, USA) according to the manufacturers
instructions. In KORA S4 for 7 of 84 replicated SNPs a deviation
from Hardy-Weinberg-Equilibrium was observed (P value,0.01).
In LISA, GINI and ISAAC all replicated SNPs were in HWE.
Details on genotyping are described in Text S1 and Table S4.
Mutational Analysis by Cycle SequencingFCER1A exons were amplified with intronic primers (Tables S5
and S6) and were directly sequenced using a BigDye Cycle
sequencing kit (Applied Biosystems). Genomic DNA (,30 ng) was
subjected to PCR amplification carried out in a 15 ml volume
containing 16 PCR Master Mix (Promega), 0.25 mM of each
forward and reverse primer under the following cycle conditions:
initial step at 95uC for 5 min, for 30 cycles at 95uC for 30 s, 58uC(exon 1 62uC) for 30 s, and 72uC for 30 s; and final extension at
72uC for 5 min.
Statistical Analysis of Genetic EffectsIn the KORA S3/F3 500 K sample possible population sub-
structures were analyzed (Text S1). Additive genetic models
assuming a trend per copy of the minor allele were used to specify
the dependency of logarithmic values of total IgE levels on genotype
categories. The result is a multiplicative model on the original scale
of total IgE with effects interpreted in percental changes. All models
were adjusted for gender and in the adult cohorts we adjusted
additionally for age. We used a linear regression algorithm
implemented in the statistical analysis system R (http://www.r-
project.org/) and SAS (Version 9.1.). To select significant SNPs in
the genome-wide screening and the replications we used conserva-
tive Bonferroni thresholds which corresponded to a nominal level of
0.05. Haplotype reconstruction and haplotype association analysis
was performed in the KORA S4 replication sample using the R-
library HaploStats that allows including all common haplotypes in the
linear regression and incorporating age and gender as covariates.
The most common haplotype served as reference. Details on
haplotype analysis are described in Text S1.
Gene Expression AnalysisPeripheral blood (2.5 ml) was drawn from individuals partici-
pating in the KORA study under fasting conditions. The blood
samples were collected between 10–12am directly in PAXgene
(TM) Blood RNA tubes (PreAnalytiX). The RNA extraction was
performed using the PAXgene Blood RNA Kit (Qiagen). RNA
and cRNA quality control was carried out using the Bioanalyzer
(Agilent) and quantification was done using Ribogreen (Invitro-
gen). 300–500 ng of RNA was reverse transcribed into cRNA and
biotin-UTP labeled using the Illumina TotalPrep RNA Amplifi-
cation Kit (Ambion). 1,500 ng of cRNA was hybridized to the
Illumina Human-6 v2 Expression BeadChip. Washing steps were
carried out in accordance with the Illumina technical note #11226030 Rev. B. The raw data were exported from the Illumina
‘‘Beadstudio’’ Software to R. The data were converted into
logarithmic scores and normalized using the LOWESS method
[41]. The association between FCER1A gene expression (indepen-
dent variable) and IgE level (dependent variable) was computed
using the linear regression model adjusted for gender.
Supporting Information
Figure S1 Box plot comparing the total IgE levels for the
genotypes at rs2251746. The x axis represents the three genotype
groups: TT (major homozygote), CT (heterozygote) and CC
(minor homozygote). The y axis is the total IgE level on a
logarithmic scale. Plot was created in R using the box plot function
from the graphics package.
Found at: doi:10.1371/journal.pgen.1000166.s001 (0.38 MB TIF)
Figure S2 Patterns of pairwise LD between the SNPs at the
RAD50-IL13 locus.
Found at: doi:10.1371/journal.pgen.1000166.s002 (0.03 MB TIF)
Table S1 Description of study populations.
Found at: doi:10.1371/journal.pgen.1000166.s003 (0.05 MB
DOC)
Table S2 KORA S3/F3 500K SNP exclusion. Detailed
breakdown of SNPs that were monomorphic or did not pass
quality control and therefore did not enter analysis.
Found at: doi:10.1371/journal.pgen.1000166.s004 (0.04 MB
DOC)
Table S3 Details on the association analysis of SNPs selected for
replication (additive model).
Found at: doi:10.1371/journal.pgen.1000166.s005 (0.25 MB
DOC)
Table S4 Genotyping details on replication and fine-mapping
stages.
Found at: doi:10.1371/journal.pgen.1000166.s006 (0.15 MB
DOC)
Table S5 Primers used to amplify the exons of FCER1A.
Found at: doi:10.1371/journal.pgen.1000166.s007 (0.04 MB
DOC)
Table S6 Mutational analysis of FCER1A exons.
Found at: doi:10.1371/journal.pgen.1000166.s008 (0.04 MB
DOC)
Genome-Wide Association Study on Total IgE
PLoS Genetics | www.plosgenetics.org 7 August 2008 | Volume 4 | Issue 8 | e1000166
Table S7 Associations between FCERA1 haplotypes and IgE
levels in KORA S4. Results correspond to the single SNP analyses
where presence of A (rs2427837) and C (rs2251746) alleles at
respective positions were strongly associated.
Found at: doi:10.1371/journal.pgen.1000166.s009 (0.05 MB
DOC)
Table S8 Association analysis of FCERA1 and RAD50 variants
with AE in 562 German AE trios and with asthma in 638 UK
asthma cases and 633 controls.
Found at: doi:10.1371/journal.pgen.1000166.s010 (0.06 MB
DOC)
Table S9 Extended SNP analysis in the RAD50-IL13 region in
a subset of 526 children from the ISAAC replication cohort and
association with total IgE levels.
Found at: doi:10.1371/journal.pgen.1000166.s011 (0.05 MB
DOC)
Table S10 Genes that have been associated with total IgE
ordered by their chromosomal position.
Found at: doi:10.1371/journal.pgen.1000166.s012 (0.16 MB
DOC)
Table S11 Affymetrix SNPs in selected candidate genes for total
IgE, which yielded a nominal p-value ,0.05 in the GWAS. Genes
are ordered by their chromosomal position.
Found at: doi:10.1371/journal.pgen.1000166.s013 (0.14 MB
DOC)
Text S1 Supplementary information.
Found at: doi:10.1371/journal.pgen.1000166.s014 (0.10 MB
DOC)
Acknowledgments
We are extremely grateful to all the patients and families who took part in
this study, the professionals who helped in recruiting them, and the
KORA, ISAAC, GINI and LISA teams, which include interviewers,
computer and laboratory technicians, clerical workers, research scientists,
volunteers, managers, receptionists and nurses. We also acknowledge the
contribution of P. Lichtner, G. Eckstein, T. Strom and K. Heim and other
members of the Helmholtz Zentrum Munchen genotyping staff in
generating and analyzing the SNP and RNA datasets.
Author Contributions
Conceived and designed the experiments: S Weidinger, N Klopp, T
Meitinger, HE Wichmann, T Illing. Performed the experiments: E
Rodriguez, M Mempel, N Klopp, H Prokisch, D Mehta. Analyzed the
data: S Weidinger, C Gieger, H Baurecht, H Gohlke, S Wagenpfeil, M
Depner, L Liang, T Illing. Contributed reagents/materials/analysis tools:
S Weidinger, H Gohlke, M Ollert, J Ring, H Behrendt, J Heinrich, N
Novak, T Bieber, U Kramer, D Berdel, A von Berg, CP Bauer, O
Herbarth, S Koletzko, T Meitinger, E von Mutius, MF Moffatt, W
Cookson, M Kabesch, HE Wichmann. Wrote the paper: S Weidinger, C
Gieger, MF Moffatt, M Kabesch, T Illing.
References
1. Cooper PJ, Ayre G, Martin C, Rizzo JA, Ponte EV, et al. (2008) Geohelminth
infections: a review of the role of IgE and assessment of potential risks of anti-IgE
treatment. Allergy 63: 409–417.
2. Gould HJ, Sutton BJ (2008) IgE in allergy and asthma today. Nat Rev Immunol
8: 205–217.
3. Gould HJ, Mackay GA, Karagiannis SN, O’Toole CM, Marsh PJ, et al. (1999)
Comparison of IgE and IgG antibody-dependent cytotoxicity in vitro and in a
SCID mouse xenograft model of ovarian carcinoma. Eur J Immunol 29:
3527–3537.
4. Dimson OG, Giudice GJ, Fu CL, Van den Bergh F, Warren SJ, et al. (2003)
Identification of a potential effector function for IgE autoantibodies in the organ-
specific autoimmune disease bullous pemphigoid. J Invest Dermatol 120:
784–788.
5. Limb SL, Brown KC, Wood RA, Wise RA, Eggleston PA, et al. (2005) Adult
asthma severity in individuals with a history of childhood asthma. J Allergy Clin
Immunol 115: 61–66.
6. Burrows B, Martinez FD, Halonen M, Barbee RA, Cline MG (1989) Association
of asthma with serum IgE levels and skin-test reactivity to allergens. N Engl J Med
320: 271–277.
7. Jacobsen HP, Herskind AM, Nielsen BW, Husby S (2001) IgE in unselected like-
sexed monozygotic and dizygotic twins at birth and at 6 to 9 years of age: high
but dissimilar genetic influence on IgE levels. J Allergy Clin Immunol 107:
659–663.
8. Strachan DP, Wong HJ, Spector TD (2001) Concordance and interrelationship
of atopic diseases and markers of allergic sensitization among adult female twins.
J Allergy Clin Immunol 108: 901–907.
9. Xu J, Postma DS, Howard TD, Koppelman GH, Zheng SL, et al. (2000) Major
genes regulating total serum immunoglobulin E levels in families with asthma.
Am J Hum Genet 67: 1163–1173.
10. Vercelli D (2008) Discovering susceptibility genes for asthma and allergy. Nat
Rev Immunol 8: 169–182.
11. Ober C, Hoffjan S (2006) Asthma genetics 2006: the long and winding road to
gene discovery. Genes Immun 7: 95–100.
12. Dizier MH, Hill M, James A, Faux J, Ryan G, et al. (1995) Detection of a
recessive major gene for high IgE levels acting independently of specific response
to allergens. Genet Epidemiol 12: 93–105.
13. Lebowitz MD, Barbee R, Burrows B (1984) Family concordance of IgE, atopy,
and disease. J Allergy Clin Immunol 73: 259–264.
14. Palmer LJ, Burton PR, Faux JA, James AL, Musk AW, et al. (2000) Independent
inheritance of serum immunoglobulin E concentrations and airway responsive-
ness. Am J Respir Crit Care Med 161: 1836–1843.
15. Hasegawa M, Nishiyama C, Nishiyama M, Akizawa Y, Mitsuishi K, et al. (2003)
A novel -66T/C polymorphism in Fc epsilon RI alpha-chain promoter affecting
the transcription activity: possible relationship to allergic diseases. J Immunol
171: 1927–1933.
16. Shikanai T, Silverman ES, Morse BW, Lilly CM, Inoue H, et al. (2002) Sequence
variants in the FcepsilonRI alpha chain gene. J Appl Physiol 93: 37–41.
17. Lee GR, Spilianakis CG, Flavell RA (2005) Hypersensitive site 7 of the TH2
locus control region is essential for expressing TH2 cytokine genes and for long-
range intrachromosomal interactions. Nat Immunol 6: 42–48.
18. Kraft S, Kinet JP (2007) New developments in FcepsilonRI regulation, function
and inhibition. Nat Rev Immunol 7: 365–378.
19. Cookson WO, Young RP, Sandford AJ, Moffatt MF, Shirakawa T, et al. (1992)
Maternal inheritance of atopic IgE responsiveness on chromosome 11q. Lancet
340: 381–384.
20. Hizawa N, Yamaguchi E, Jinushi E, Kawakami Y (2000) A common FCER1B
gene promoter polymorphism influences total serum IgE levels in a Japanese
population. Am J Respir Crit Care Med 161: 906–909.
21. Hizawa N, Yamaguchi E, Jinushi E, Konno S, Kawakami Y, et al. (2001)
Increased total serum IgE levels in patients with asthma and promoter
polymorphisms at CTLA4 and FCER1B. J Allergy Clin Immunol 108: 74–79.
22. Maier LM, Howson JM, Walker N, Spickett GP, Jones RW, et al. (2006)
Association of IL13 with total IgE: evidence against an inverse association of
atopy and diabetes. J Allergy Clin Immunol 117: 1306–1313.
23. Traherne JA, Hill MR, Hysi P, D’Amato M, Broxholme J, et al. (2003) LD
mapping of maternally and non-maternally derived alleles and atopy in
FcepsilonRI-beta. Hum Mol Genet 12: 2577–2585.
24. Ulbrecht M, Eisenhut T, Bonisch J, Kruse R, Wjst M, et al. (1997) High serum
IgE concentrations: association with HLA-DR and markers on chromosome
5q31 and chromosome 11q13. J Allergy Clin Immunol 99: 828–836.
25. Shirakawa T, Li A, Dubowitz M, Dekker JW, Shaw AE, et al. (1994) Association
between atopy and variants of the beta subunit of the high-affinity
immunoglobulin E receptor. Nat Genet 7: 125–129.
26. Shirakawa T, Mao XQ, Sasaki S, Enomoto T, Kawai M, et al. (1996)
Association between atopic asthma and a coding variant of Fc epsilon RI beta in
a Japanese population. Hum Mol Genet 5: 1129–1130.
27. Hoffjan S, Ostrovnaja I, Nicolae D, Newman DL, Nicolae R, et al. (2004)
Genetic variation in immunoregulatory pathways and atopic phenotypes in
infancy. J Allergy Clin Immunol 113: 511–518.
28. Palmer LJ, Rye PJ, Gibson NA, Moffatt MF, Goldblatt J, et al. (1999)
Association of FcepsilonR1-beta polymorphisms with asthma and associated
traits in Australian asthmatic families. Clin Exp Allergy 29: 1555–1562.
29. Marsh DG, Neely JD, Breazeale DR, Ghosh B, Freidhoff LR, et al. (1994)
Linkage analysis of IL4 and other chromosome 5q31.1 markers and total serum
immunoglobulin E concentrations. Science 264: 1152–1156.
30. Loots GG, Locksley RM, Blankespoor CM, Wang ZE, Miller W, et al. (2000)
Identification of a coordinate regulator of interleukins 4, 13, and 5 by cross-
species sequence comparisons. Science 288: 136–140.
31. Lee GR, Fields PE, Griffin TJ, Flavell RA (2003) Regulation of the Th2 cytokine
locus by a locus control region. Immunity 19: 145–153.
Genome-Wide Association Study on Total IgE
PLoS Genetics | www.plosgenetics.org 8 August 2008 | Volume 4 | Issue 8 | e1000166
1
A common FADS2 promoter polymorphism increases promoter activity
and facilitates binding of transcription factor ELK1
E. Lattka1, S. Eggers1, G. Moeller2, K. Heim3, M. Weber3, D. Mehta3, H. Prokisch3, 4,
T. Illig*1, J. Adamski2,5
1 Institute of Epidemiology,
2 Institute of Experimental Genetics, Genome Analysis Center, 3 Institute of Human Genetics, Helmholtz Zentrum München, German Research Center for
Environmental Health, Neuherberg, Germany 4 Institute of Human Genetics, Klinikum Rechts der Isar, Technische Universität München,
München, Germany 5 Lehrstuhl für Experimentelle Genetik, Technische Universität München, Freising-
Weihenstephan, Germany
* Corresponding author: T. Illig
Helmholtz Zentrum München
German Research Center for Environmental Health
Institute of Epidemiology
Ingolstädter Landstrasse 1
85764 Neuherberg
Germany
Phone: +49-89-3187-4249
Fax: +49-89-3187-4567
Mail: [email protected]
Running title: Functional analysis of FADS2 gene polymorphisms
by on October 23, 2009
ww
w.jlr.org
Dow
nloaded from
2
Abbreviations: FADS - fatty acid desaturase, HUFA - highly unsaturated fatty acid , SNP -
single nucleotide polymorphism, DIP - deletion/insertion polymorphism, LD - linkage
disequilibrium, SREBP - sterol regulatory element binding protein, PPAR - peroxisome
proliferator activated receptor, TFBS - transcription factor binding site, C20:4n-6 or
arachidonic acid - all-cis-5,8,11,14-eicosatetraenoic acid, C22:6n-3 or docosahexaenoic acid -
22:6(ω-3), all-cis-docosa-4,7,10,13,16,19-hexaenoic acid
by on October 23, 2009
ww
w.jlr.org
Dow
nloaded from
3
Abstract
Fatty acid desaturases play an important role in the formation of omega-6 and omega-3 highly
unsaturated fatty acids (HUFAs). The composition of HUFAs in the human metabolome is
important for membrane fluidity and for the modulation of essential physiological functions
such as inflammation processes and brain development. Several recent studies reported
significant associations of single nucleotide polymorphisms (SNPs) in the human FADS gene
cluster with HUFA levels and composition. The presence of the minor allele correlated with a
decrease of desaturase reaction products and an accumulation of substrates.
We performed functional studies with two of the associated polymorphisms (rs3834458 and
rs968567) and showed an influence of polymorphism rs968567 on FADS2 promoter activity
by luciferase reporter gene assays. Electrophoretic mobility shift assays proved allele-
dependent DNA-binding ability of at least two protein complexes to the region containing
SNP rs968567. One of the proteins binding to this region in an allele-specific manner was
shown to be the transcription factor ELK1. These results indicate that rs968567 influences
FADS2 transcription and offer first insights into the modulation of complex regulation
mechanisms of FADS2 gene transcription by SNPs.
Keywords: delta-6 desaturase, fatty acid metabolism, desaturation, single nucleotide
polymorphism
by on October 23, 2009
ww
w.jlr.org
Dow
nloaded from
4
Introduction
Fatty acids are among other metabolites essential components of the human metabolome. In
cells, phospholipids containing highly unsaturated fatty acids (HUFAs) such as arachidonic
acid (all-cis-5,8,11,14-eicosatetraenoic acid or C20:4n-6) and docosahexaenoic acid (22:6(ω-
3), all-cis-docosa-4,7,10,13,16,19-hexaenoic acid or C22:6n-3) have a positive effect on the
fluidity of cell membranes. On the molecular level, HUFAs fulfil several other central
functions like acting as second messengers in intracellular signalling pathways or regulating
transcription. On the physiological level, HUFAs are important for brain development,
acquisition of cognitive behaviours and development of visual functions in early life. In
addition, HUFAs are precursors for eicosanoids (leukotriens and prostaglandins) which play
an important role in inflammatory processes (1).
The production of HUFAs from dietary fatty acids includes several desaturation and
elongation steps. The desaturases involved in this reaction cascade, delta-6 desaturase and
delta-5 desaturase, are the rate-limiting enzymes. Both are expressed in the majority of human
tissues, with highest levels in liver and to a smaller amount in brain, heart and lung (2, 3).
Delta-6 desaturase inserts a double bond at position 6 and after an elongation step, delta-5
desaturase inserts an additional double bond at position 5 of the elongated fatty acid chain.
These conversions result in the formation of either arachidonic acid (C20:4n-6) in the omega-
6 pathway or of eicosapentaenoic acid (C20:5n-3) in the omega-3 pathway. These molecules
are either converted into eicosanoids or further elongated and desaturated, again with the help
of the delta-6 desaturase (1). The importance of delta-6 desaturase for the formation of
HUFAs and their influence on membrane integrity and fluidity was shown in a recent study
by Stoffel et al. who generated a fads2 -/- mouse (4). In this animal model, membrane polarity
of Sertoli and ovarian follicle cells was completely disturbed due to the lack of HUFAs in
knockout mice caused by the delta-6 desaturase deficiency. Furthermore, both male and
female mice were infertile and eicosanoid synthesis was disturbed. However, the
administration of a HUFA-rich diet (either C20:4n-6 or C20:5n-3/C22:6n-3) enabled the fads2
-/- mice to overcome the genetic defect, restored the fatty acid pattern in membrane lipids and
rescued spermatogenesis as well as normal follicle development. Similarly, eicosanoid
synthesis was restored by administration of arachidonic acid. Similar effects were observed in
another fads2 -/- mouse by Stroud et al. (5).
These studies showed that the level and composition of HUFAs in the body highly depends
on the conversion rate of the delta-6 desaturase, which is in turn regulated by supply with
by on October 23, 2009
ww
w.jlr.org
Dow
nloaded from
5
dietary fatty acids and hormone signalling. The effect of dietary fatty acids on desaturase
transcription regulation is mediated by two transcription factors, SREBP1 and PPARA (6).
The feedback regulation mechanisms by which dietary fatty acids act on SREBP1 processing
and stability which in turn influences FADS2 gene expression have been investigated
intensively (7-11). The induction of desaturases by PPARA was shown to occur both by
indirect and direct mechanisms (12-15). Besides the mediation of fatty acid effects, SREBP1
may also mediate the insulin effect on FADS2 gene expression, as was observed in
experimentally-induced diabetic rats (16, 17).
Although dietary and hormonal influences seem to play an important role in transcription
regulation of delta-6 desaturase, genetic factors are important as well for influencing the level
and composition of HUFAs in human tissues. Of special interest is the FADS gene cluster on
chromosome 11, with a head-to-head orientation of the FADS1 and the FADS2 genes, which
encode the delta-5 and delta-6 desaturase, respectively. A third putative desaturase gene,
FADS3, is located in the 6.0 kb telomeric side from the FADS2 gene in a tail-to-tail
orientation (18). Several candidate gene studies reported an association of a number of single
nucleotide polymorphisms (SNPs) in the FADS gene cluster with fatty acid composition in
human tissues (19-22). These results were strengthened recently by our study, which for the
first time compared genome-wide SNP data with metabolomics data and replicated the
previous findings by this new approach (23). Additionally, several genome-wide association
studies meanwhile reported an association of FADS polymorphisms with polyunsaturated
fatty acids (24) and more complex lipid traits like low-density lipoprotein, high-density
lipoprotein and triglycerides (25-27).
In the first association study (19), the minor alleles of 11 SNPs located in and around the
FADS1 and FADS2 genes were associated with enhanced levels of desaturase substrates in
serum phospholipids. In contrast, levels of desaturase products (especially arachidonic acid,
with a genetically explained variance of 28%) were lower. The same significant associations
were found for haplotype analyses. This observation speaks for a strong influence of the
genetic variants on the activity of the desaturases. Until now, functional data on the described
polymorphisms were not available. The aim of this study was to identify causative SNPs
within the FADS1/FADS2 haplotype and we therefore performed functional analyses of
polymorphisms in the FADS2 promoter region to gain insight into regulatory mechanisms of
the FADS2 gene resulting from the presence of these polymorphisms on the transcriptional
level. Based on their close proximity to the translation start site of FADS2, we selected the
one base pair deletion/insertion polymorphism (DIP) rs3834458 (position -942) and the SNP
by on October 23, 2009
ww
w.jlr.org
Dow
nloaded from

6
rs968567 (-299). In addition, both polymorphisms are located in a CpG-rich region predicted
to contain interesting binding sites for transcription factors known to be involved in fatty acid
metabolism such as SREBP1 and PPARA.
by on October 23, 2009
ww
w.jlr.org
Dow
nloaded from
7
Material and Methods
Bioinformatic analysis of transcription factor binding sites
The prediction of transcription factor binding sites (TFBS) in promoter sequences was
performed using the Genomatix MatInspector software with standard settings for the highest
matrix similarity (28). This programme uses a large library of weight matrices based on
known in vivo binding sites to predict TFBS in nucleotide sequences.
Plasmid constructions
To obtain constructs for luciferase assays, the FADS2 promoter sequence from position -1014
to -1 relative to the translation start site was amplified by PCR from human genomic DNA.
The PCR product was first cloned into the vector pGEM T-Easy (Promega) and then
subcloned into the reporter vector pGL4.12 (Promega). Constructs containing all possible
combinations of major and minor alleles of rs3834458 (T/Del, position -942) and rs968567
(C/T, position -299) were obtained by PCR mutagenesis. Truncated constructs (containing
region -414 to -1 and -214 to -1) were generated by PCR from the original respective
plasmids and subsequent cloning into pGL4.12. All constructs were verified by sequencing.
Luciferase reporter assays
HeLa, HEK293 and HepG2 cells were seeded at a density of 1x10⁵ cells per well in 12-well
plates in MEM or D-MEM medium with stable L-glutamine (PAA Laboratories),
respectively, containing 10% FBS (PAA Laboratories) and 1% penicillin/streptomycin
(Gibco) and incubated over night. All cell lines were transfected with 500 ng of the promoter
construct per assay using FuGene6 (Roche Diagnostics) according to the manufacturer’s
instructions in an appropriate ratio of FuGene/DNA. For normalisation, 50 ng of the pGL4.74
vector (Promega), which constitutively expresses Renilla luciferase, were cotransfected.
Transfected cells were incubated for 32 hours at 37 °C in a 5 % CO2 atmosphere. Cells were
then washed once in PBS buffer before 200 µl of 1X Passive Lysis Buffer (Promega) were
added. After gentle shaking for 30 minutes, the plate containing the lysed cells was frozen at -
80 °C over night. After thawing, luciferase activity was measured. For this, 50 µl of both Dual
Luciferase Reporter Assay System reagents (Promega) were added successively to 20 µl of
the lysate according to the manufacturer’s instructions. Measurements were done in a Tecan
GeniosPro microplate reader. Calculation of the intensity ratios of Firefly to Renilla luciferase
by on October 23, 2009
ww
w.jlr.org
Dow
nloaded from
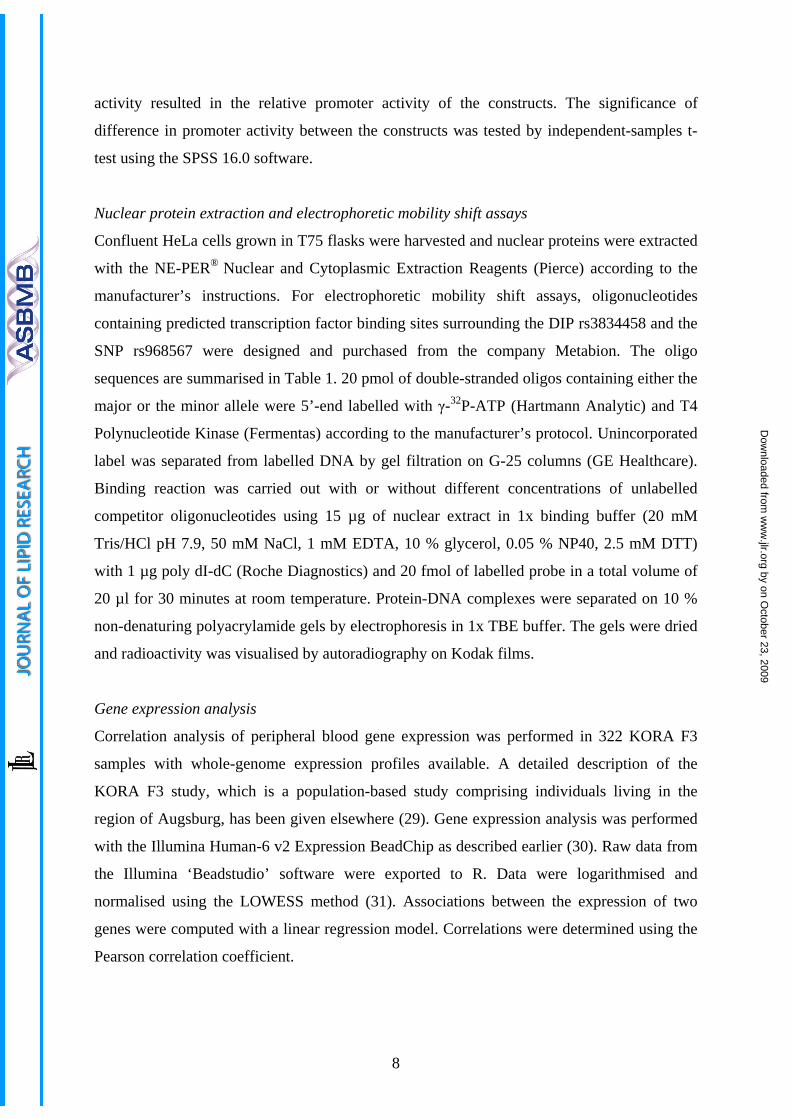
8
activity resulted in the relative promoter activity of the constructs. The significance of
difference in promoter activity between the constructs was tested by independent-samples t-
test using the SPSS 16.0 software.
Nuclear protein extraction and electrophoretic mobility shift assays
Confluent HeLa cells grown in T75 flasks were harvested and nuclear proteins were extracted
with the NE-PER® Nuclear and Cytoplasmic Extraction Reagents (Pierce) according to the
manufacturer’s instructions. For electrophoretic mobility shift assays, oligonucleotides
containing predicted transcription factor binding sites surrounding the DIP rs3834458 and the
SNP rs968567 were designed and purchased from the company Metabion. The oligo
sequences are summarised in Table 1. 20 pmol of double-stranded oligos containing either the
major or the minor allele were 5’-end labelled with γ-32P-ATP (Hartmann Analytic) and T4
Polynucleotide Kinase (Fermentas) according to the manufacturer’s protocol. Unincorporated
label was separated from labelled DNA by gel filtration on G-25 columns (GE Healthcare).
Binding reaction was carried out with or without different concentrations of unlabelled
competitor oligonucleotides using 15 µg of nuclear extract in 1x binding buffer (20 mM
Tris/HCl pH 7.9, 50 mM NaCl, 1 mM EDTA, 10 % glycerol, 0.05 % NP40, 2.5 mM DTT)
with 1 µg poly dI-dC (Roche Diagnostics) and 20 fmol of labelled probe in a total volume of
20 µl for 30 minutes at room temperature. Protein-DNA complexes were separated on 10 %
non-denaturing polyacrylamide gels by electrophoresis in 1x TBE buffer. The gels were dried
and radioactivity was visualised by autoradiography on Kodak films.
Gene expression analysis
Correlation analysis of peripheral blood gene expression was performed in 322 KORA F3
samples with whole-genome expression profiles available. A detailed description of the
KORA F3 study, which is a population-based study comprising individuals living in the
region of Augsburg, has been given elsewhere (29). Gene expression analysis was performed
with the Illumina Human-6 v2 Expression BeadChip as described earlier (30). Raw data from
the Illumina ‘Beadstudio’ software were exported to R. Data were logarithmised and
normalised using the LOWESS method (31). Associations between the expression of two
genes were computed with a linear regression model. Correlations were determined using the
Pearson correlation coefficient.
by on October 23, 2009
ww
w.jlr.org
Dow
nloaded from
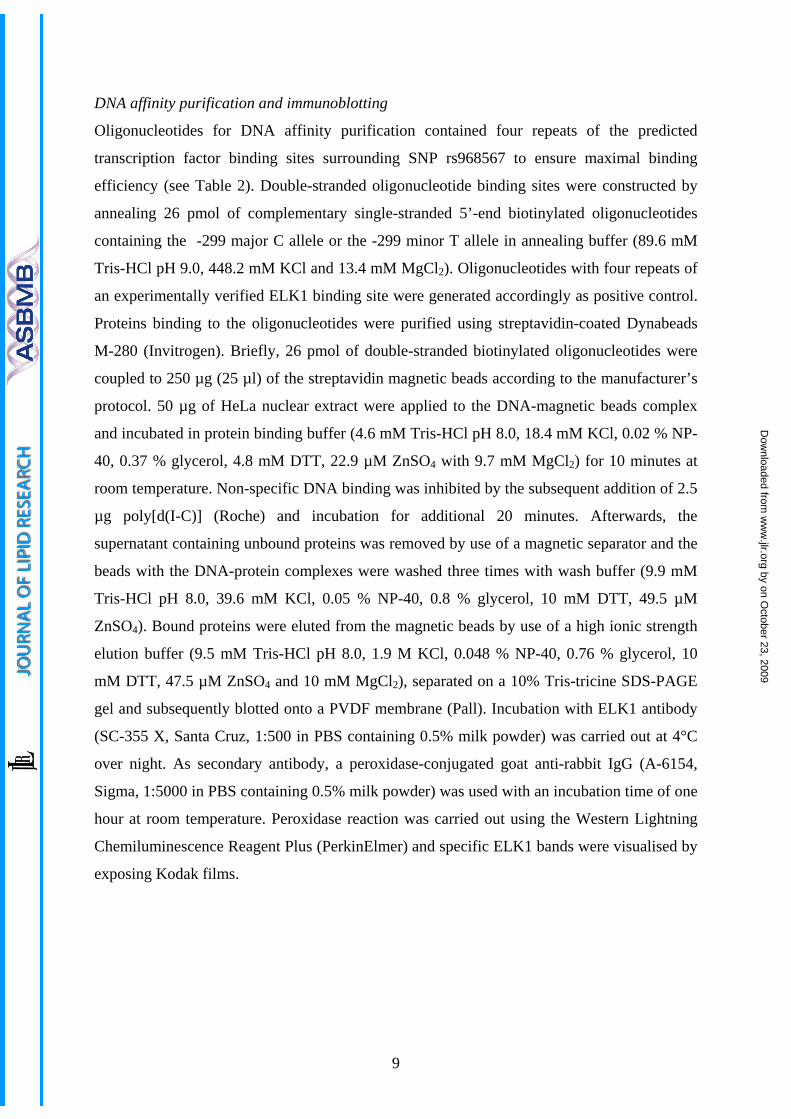
9
DNA affinity purification and immunoblotting
Oligonucleotides for DNA affinity purification contained four repeats of the predicted
transcription factor binding sites surrounding SNP rs968567 to ensure maximal binding
efficiency (see Table 2). Double-stranded oligonucleotide binding sites were constructed by
annealing 26 pmol of complementary single-stranded 5’-end biotinylated oligonucleotides
containing the -299 major C allele or the -299 minor T allele in annealing buffer (89.6 mM
Tris-HCl pH 9.0, 448.2 mM KCl and 13.4 mM MgCl2). Oligonucleotides with four repeats of
an experimentally verified ELK1 binding site were generated accordingly as positive control.
Proteins binding to the oligonucleotides were purified using streptavidin-coated Dynabeads
M-280 (Invitrogen). Briefly, 26 pmol of double-stranded biotinylated oligonucleotides were
coupled to 250 µg (25 µl) of the streptavidin magnetic beads according to the manufacturer’s
protocol. 50 µg of HeLa nuclear extract were applied to the DNA-magnetic beads complex
and incubated in protein binding buffer (4.6 mM Tris-HCl pH 8.0, 18.4 mM KCl, 0.02 % NP-
40, 0.37 % glycerol, 4.8 mM DTT, 22.9 µM ZnSO4 with 9.7 mM MgCl2) for 10 minutes at
room temperature. Non-specific DNA binding was inhibited by the subsequent addition of 2.5
µg poly[d(I-C)] (Roche) and incubation for additional 20 minutes. Afterwards, the
supernatant containing unbound proteins was removed by use of a magnetic separator and the
beads with the DNA-protein complexes were washed three times with wash buffer (9.9 mM
Tris-HCl pH 8.0, 39.6 mM KCl, 0.05 % NP-40, 0.8 % glycerol, 10 mM DTT, 49.5 µM
ZnSO4). Bound proteins were eluted from the magnetic beads by use of a high ionic strength
elution buffer (9.5 mM Tris-HCl pH 8.0, 1.9 M KCl, 0.048 % NP-40, 0.76 % glycerol, 10
mM DTT, 47.5 µM ZnSO4 and 10 mM MgCl2), separated on a 10% Tris-tricine SDS-PAGE
gel and subsequently blotted onto a PVDF membrane (Pall). Incubation with ELK1 antibody
(SC-355 X, Santa Cruz, 1:500 in PBS containing 0.5% milk powder) was carried out at 4°C
over night. As secondary antibody, a peroxidase-conjugated goat anti-rabbit IgG (A-6154,
Sigma, 1:5000 in PBS containing 0.5% milk powder) was used with an incubation time of one
hour at room temperature. Peroxidase reaction was carried out using the Western Lightning
Chemiluminescence Reagent Plus (PerkinElmer) and specific ELK1 bands were visualised by
exposing Kodak films.
by on October 23, 2009
ww
w.jlr.org
Dow
nloaded from
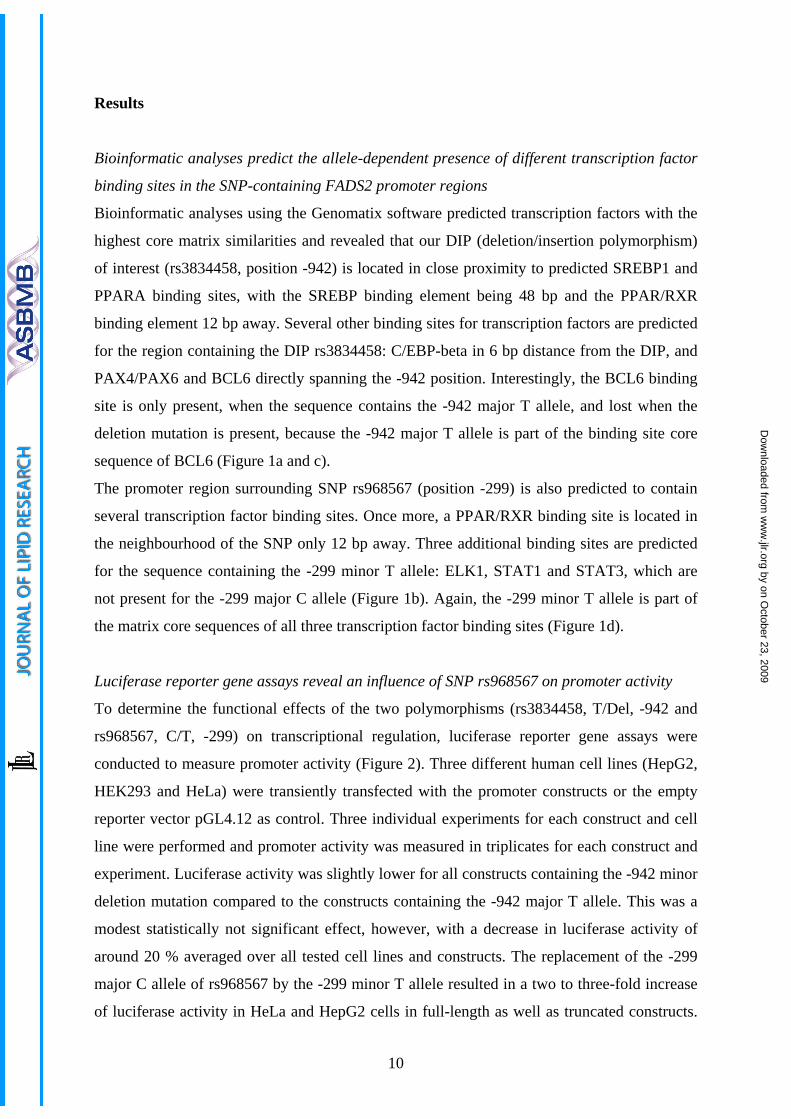
10
Results
Bioinformatic analyses predict the allele-dependent presence of different transcription factor
binding sites in the SNP-containing FADS2 promoter regions
Bioinformatic analyses using the Genomatix software predicted transcription factors with the
highest core matrix similarities and revealed that our DIP (deletion/insertion polymorphism)
of interest (rs3834458, position -942) is located in close proximity to predicted SREBP1 and
PPARA binding sites, with the SREBP binding element being 48 bp and the PPAR/RXR
binding element 12 bp away. Several other binding sites for transcription factors are predicted
for the region containing the DIP rs3834458: C/EBP-beta in 6 bp distance from the DIP, and
PAX4/PAX6 and BCL6 directly spanning the -942 position. Interestingly, the BCL6 binding
site is only present, when the sequence contains the -942 major T allele, and lost when the
deletion mutation is present, because the -942 major T allele is part of the binding site core
sequence of BCL6 (Figure 1a and c).
The promoter region surrounding SNP rs968567 (position -299) is also predicted to contain
several transcription factor binding sites. Once more, a PPAR/RXR binding site is located in
the neighbourhood of the SNP only 12 bp away. Three additional binding sites are predicted
for the sequence containing the -299 minor T allele: ELK1, STAT1 and STAT3, which are
not present for the -299 major C allele (Figure 1b). Again, the -299 minor T allele is part of
the matrix core sequences of all three transcription factor binding sites (Figure 1d).
Luciferase reporter gene assays reveal an influence of SNP rs968567 on promoter activity
To determine the functional effects of the two polymorphisms (rs3834458, T/Del, -942 and
rs968567, C/T, -299) on transcriptional regulation, luciferase reporter gene assays were
conducted to measure promoter activity (Figure 2). Three different human cell lines (HepG2,
HEK293 and HeLa) were transiently transfected with the promoter constructs or the empty
reporter vector pGL4.12 as control. Three individual experiments for each construct and cell
line were performed and promoter activity was measured in triplicates for each construct and
experiment. Luciferase activity was slightly lower for all constructs containing the -942 minor
deletion mutation compared to the constructs containing the -942 major T allele. This was a
modest statistically not significant effect, however, with a decrease in luciferase activity of
around 20 % averaged over all tested cell lines and constructs. The replacement of the -299
major C allele of rs968567 by the -299 minor T allele resulted in a two to three-fold increase
of luciferase activity in HeLa and HepG2 cells in full-length as well as truncated constructs.
by on October 23, 2009
ww
w.jlr.org
Dow
nloaded from
11
This effect was statistically significant in HepG2 (p<2.0E-05) and HeLa (p<1.0E-6) cells, but
not in HEK293 cells. Altogether, the results indicate a strong regulatory function of
polymorphism rs968567 in different cell lines.
Electrophoretic mobility shift assay (EMSA) demonstrates altered DNA-binding ability of
nuclear proteins to the FADS2 promoter due to SNP rs968567
Next we asked, if the polymorphisms effect the DNA-binding ability of nuclear proteins.
HeLa nuclear protein extracts were subjected to binding to oligonucleotides representing the
region surrounding SNP rs968567 with either the -299 major C allele or the -299 minor T
allele, and DNA-protein complexes were analysed by electrophoretic mobility shift assays
(Figure 3). Specific binding of nuclear protein to the respective oligonucleotide was tested by
adding increasing amounts of competing unlabelled oligonucleotide probe, containing the
respective other allele. Two bands corresponding to shifted complexes showed different
intensity, depending on which allele was present. Both bands showed weaker intensity when
the labelled oligonucleotide with the C allele was present, whereas a higher intensity was
achieved, when the labelled oligonucleotide contained the T allele. Competition of labelled C
allele with unlabelled T allele resulted in a significant decrease of band intensities already at
low concentrations of competitor. The upper band was still visible at very high competitor
concentrations, whereas the lower band vanished completely. In contrast, competition for
protein binding of labelled T allele with unlabelled C allele resulted in slightly decreased band
intensities only at high concentrations of competitor. At the highest competitor concentration,
the lower band vanished as well, but the upper band was much stronger than in the vice versa
competition experiment. These effects were observed in two independent experiments. The
results indicate that the -299 T allele increases binding affinity of the tested promoter region
for at least two protein complexes. The same experiment was conducted with oligonucleotides
containing the major and minor alleles of the rs3834458 polymorphism. Only very weak band
intensities, hinting to very weak binding of two nuclear proteins, could be observed and no
significant difference of competing effects between oligonucleotides was found (data not
shown).
Gene expression analysis shows statistically significant association between expression levels
of FADS2 and ELK1
Because we have found a significant impact on promoter activity and binding of nuclear
protein complexes only for SNP rs968567 and not for DIP rs3834458, we focused on the
by on October 23, 2009
ww
w.jlr.org
Dow
nloaded from
12
region surrounding SNP rs968567 for further characterisation. Prediction of transcription
factor binding sites in this region results in three binding sites when the rs968567 minor T
allele is present in the sequence: ELK1, STAT1 and STAT3. Regression analysis between
FADS2 whole blood mRNA expression levels and expression levels of these three
transcription factors in 322 subjects revealed a statistically significant association between
mRNA expression levels of FADS2 and ELK1 with a p-value of 2.29E-13 and an effect size
of 0.36 (Figure 4 a). No significant p-values were obtained for the correlation of FADS2 with
STAT1 and STAT3 expression levels. To test the plausibility of this approach, regression
analyses of FADS2 expression levels with PPARA and SREBP1, two transcription factors
already known to be involved in FADS2 transcription regulation, were performed as positive
controls. The expression levels of both transcription factors were significantly associated with
FADS2 expression (PPARA: p=4.22E-12, effect size=0.35 and SREBP1: p=2.93E-28, effect
size=0.52) and by this proved the reliability of our expression data. We furthermore tested the
association between FADS2 and ELK1 gene expression dependent on the rs968567 genotype.
The effect size of association between FADS2 and ELK1 in homozygous carriers of the
rs968567 major C allele (n=229) was 0.3 (p=4.13E-8). In heterozygous (CT) and homozygous
minor T allele carriers (n=93) it reached 0.36 (p=8.47E-6), and in homozygous minor T allele
carriers alone (n=8) the effect size increased to 0.84 (p=0.0055) (Figure 4 b). These results
strongly point to ELK1 as a newly identified regulator of FADS2 gene expression with a
higher impact of ELK1 in carriers of the rs968567 minor T allele.
DNA affinity purification with immunoblotting reveals allele-specific binding of ELK1 to the
region surrounding SNP rs968567
Our gene expression analyses in a population-based study revealed a significant association
between expression levels of FADS2 mRNA and ELK1 mRNA in whole blood, with a higher
effect size in carriers of the rs968567 minor T allele. Additionally, the Genomatix
MatInspector software predicted allele-specific binding of ELK1 to the region surrounding
SNP rs968567. We therefore tested the binding of ELK1 protein to the respective sequence by
performing DNA affinity purification of nuclear proteins from HeLa nuclear extract using
biotinylated oligonucleotides representing the region surrounding SNP rs968567 with either
the -299 major C allele or the -299 minor T allele. An oligonucleotide containing an
experimentally verified ELK1 binding site (32) was used as positive control. The supernatant
and wash fractions containing unbound proteins as well as the elution fraction with the bound
proteins were immunoblotted and a specific antibody against human ELK1 was used to detect
by on October 23, 2009
ww
w.jlr.org
Dow
nloaded from
13
presence of ELK1 protein in the fractions (Figure 5). A specific band corresponding to ELK1
was present in the elution fraction of the positive control, showing that ELK1 from HeLa
nuclear extract is able to bind to its consensus sequence under the used buffer conditions and
experimental setup. The appearance of ELK1 in the elution fraction of the -299 minor T
allele, which was lacking in the elution fraction of the -299 major C allele, confirms binding
of ELK1 to the FADS2 promoter sequence exclusively when the minor T allele is present.
by on October 23, 2009
ww
w.jlr.org
Dow
nloaded from
14
Discussion
Disorders of delta-6 desaturase activity affect essential physiological functions
Recent association studies showed an association of delta-6 and delta-5 desaturase gene
polymorphisms with HUFA level and composition in different human tissues, accompanied
by an accumulation of desaturase substrates and a decline in desaturase products (19-23). This
suggests that the desaturase activity is not only regulated by nutritional and hormonal
influences, but also by genetic factors. The observed change of HUFA levels and composition
in different human tissues due to the polymorphisms might alter several important
physiological processes and is thought to modulate the development of complex diseases. The
effect of FADS polymorphisms on brain development has been shown by Caspi et al. (33),
who reported a modulation of the positive effect of breastfeeding on development of
intelligence by polymorphisms in the FADS gene cluster in two independent birth cohorts.
The importance of an intact delta-6 desaturase function on eicosanoid synthesis and
membrane lipid composition was underlined by previous reports of two different fads2
knockout mice (4, 5). The assumption that there is a direct effect of FADS polymorphisms on
the outcome of fatty acid-related diseases, has been supported by Schaeffer at al. (19), who
reported an association of the FADS gene cluster with allergic rhinitis and atopic eczema,
however, without statistical significance after correction for multiple testing. Another study
recently reported an association of FADS genotypes with inflammation and coronary artery
disease (34). All these observations hint at a strong role of delta-6 desaturase in regulating
fatty acid composition in human tissues to maintain health. Approaches to investigate the
influence of genetic polymorphisms on the regulation of the human enzyme activity are
therefore needed to understand the role of delta-6/delta-5 desaturases in the development of
fatty acid-related complex diseases.
Detection of a critical polymorphism-containing region that influences delta-6 desaturase
activity
Many studies have reported associations of several SNPs in the FADS gene cluster with
HUFA levels and composition in different human tissues and have contributed to the
understanding of the influence of SNPs on the regulation of fatty acid synthesis (19-23).
However, the causative functional variant(s) are not known up to date. The analysis of linkage
disequilibrium (LD) structures in the FADS gene cluster suggests that all polymorphisms in
this region are in very high linkage disequilibrium and most of them are highly correlated.
by on October 23, 2009
ww
w.jlr.org
Dow
nloaded from
15
The real functional variant(s) could therefore cause associations of all other SNPs being in
high LD, and cannot be directly identified by association studies for this reason. Functional
approaches are needed to determine the effect of the associated SNPs on the molecular level
and by this identify the causative variant(s).
By performing luciferase reporter gene assays, we showed that one of the two analysed
FADS2 promoter polymorphisms (rs968567) is located in a region that seems to be important
for transcription regulation. While the minor deletion mutation of rs3834458 had only a little,
statistically not significant effect on promoter activity, the minor T allele of rs968567 highly
increased promoter activity compared to the construct containing both major alleles. The
effect was the same in all three tested cell lines, however, the response in HEK293 cells was
lower and not statistically significant for both polymorphisms. Because transcription
regulation is tissue-dependent (35), this is likely due to the tissue-specific expression pattern
of involved transcription factors. In order to investigate if altered binding of transcriptions
factors to the polymorphism-containing regions is the cause for the observed effects in the
luciferase assays, molecular interactions were analysed by electromobility shift assays.
Bioinformatic analyses predicted several putative binding sites in the polymorphism-
containing regions, and we consequently checked their functionality for protein binding.
Indeed, several protein complexes were shown to bind to the regions of interest by EMSA. In
the case of rs968567, a clear allele-specific binding affinity of at least two protein complexes
was shown by using a competitive method. The minor T allele of rs968567 facilitated the
binding in comparison to the major C allele. No differential binding affinity could be shown
for the region containing rs3834458. All these observations speak for a strong influence of the
rs968567 polymorphism on transcription regulation of the FADS2 gene.
Identification of ELK1 as a potential new regulator of FADS2 gene transcription
In this study it was shown that the FADS2 promoter region surrounding SNP rs968567
exhibits promoter activity, which increases when the major C allele of SNP rs968567 is
replaced by the minor T allele. We assumed that this effect could be caused by allele-specific
differential binding affinity of transcription factors. An in silico analysis of transcription
factor binding sites predicted three additional binding sites (ELK1, STAT1 and STAT3) in the
sequence when the major C allele of rs968567 was replaced by the minor T allele. This was
substantiated by EMSA experiments that revealed allele-specific binding of at least two
nuclear protein complexes to this promoter region. Linear regression analysis of whole blood
mRNA levels of the predicted transcription factors and expression levels of FADS2 mRNA
by on October 23, 2009
ww
w.jlr.org
Dow
nloaded from
16
resulted in a highly significant association between ELK1 and FADS2, with a much higher
effect size in subjects being homozygous for the rs968567 minor T allele. We used the
correlation of PPARA and SREBP1 with FADS2 as positive control, because these two
transcription factors are known to activate FADS2 transcription (1). The significant
association results of our positive controls approve reliability of the expression data and
substantiate the significant association between ELK1 and FADS2. ELK1 is a member of the
ETS domain family of transcription factors, was first cloned in 1989 (36) and is primarily
known for its role in the transcriptional regulation of immediate early genes including c-fos
(37) and egr-1 (38) by forming ternary complexes with serum response factor on the serum
response elements of gene promoters (39). To our knowledge, a role of ELK1 in lipid
metabolism has not been reported until now. We tested binding of ELK1 protein to the
predicted binding site in the FADS2 gene promoter by DNA affinity purification and
subsequent immunoblotting. Specific ELK1 bands in the elution fraction were only present
when the major C allele of SNP rs968567 was replaced by the minor T allele. This effect is in
clear accordance with the Genomatix MatInspector prediction and identifies ELK1 as a
putative new regulator of FADS2 gene transcription in an allele-specific manner. The fact that
correlation analysis between FADS2 and ELK1 mRNA expression gives significant results for
both alleles (however with lower effect size for the major C allele) suggests that ELK1 also
binds to the FADS2 promoter in the presence of the –299 major C allele, but with lower
affinity so that we were not able to detect ELK1 protein in that case in our immunoblotting
experiment. Another possibility would be an additional functional ELK1 binding site in
another region of the FADS2 gene, of which several are predicted by Genomatix
MatInspector.
Controversial impact of the rs3834458 deletion polymorphism on promoter activity
Nwankwo et al. published a study in 2003 (40), which already dealt with functional
investigations of the rs3834458 polymorphism. The authors aimed to identify the molecular
mechanism of FADS2 deficiency in skin fibroblasts from a patient with severe symptoms like
corneal ulceration, growth failure, skin abnormalities and photophobia previously shown to be
caused by a deficiency of delta-6 desaturase (41). By sequencing the FADS2 promoter region
of DNA derived from patient fibroblasts and comparing the sequence to DNA from three
healthy controls, they identified a thymidine insertion in the patient DNA, which corresponds
to the T allele of rs3834458. Luciferase reporter gene assays in a mouse fibroblast cell line
(NIH/3T3) with promoter sequences derived from patient (T allele present) and healthy
by on October 23, 2009
ww
w.jlr.org
Dow
nloaded from
17
control (T deletion) fibroblasts resulted in significantly decreased promoter activity when the
T allele was present. This result could not be replicated in neither of our three tested human
cell lines. Possible explanations could be that Nwankwo et al. used a mouse fibroblast cell
line (NIH/3T3) for their assays, which might express a different set of transcription factors
compared to our human cell lines or that another unrecognized polymorphism in the tested
sequences caused the effect in the study of Nwankwo et al.
Conclusion and outlook
In this study we showed that polymorphism rs968567 influences FADS2 gene promoter
activity and alters DNA-binding affinity of nuclear proteins. One of the proteins binding to
this region in an allele-specific manner was shown to be the transcription factor ELK1.
Further experiments are required to completely characterise the interaction of ELK1 with the
FADS2 gene promoter or other functional elements in the gene and its impact on FADS2 gene
expression in vivo.
by on October 23, 2009
ww
w.jlr.org
Dow
nloaded from
Functional validation of complex trait- associated SNPs using
transcriptomics
Divya Mehta, Katharina Heim, Thomas Illig, H-E Wichmann, Thomas Meitinger, Holger
Prokisch.
Abstract
GWAS have proven to be successful in uncovering genetic risk factors and unraveling
new biological pathways, however they have been unable to pinpoint with certainty the
causal gene(s) at the observed loci. Furthermore, the mechanisms of action by which
associated loci influence disease or other complex traits in most cases remains unclear.
Rarely does the associated variant change the coding sequence. In most cases the SNP
influences gene activity. Genome-wide association study of gene expression can be used
to address this question.
We generated expression profiles from whole blood of 320 KORA individuals with 500k
genotypes available. Using these expression profiles, we systematically analyzed all
SNPs so far found to be associated with disease or Quantitative Trait Loci for their
potential to effect transcription level of the neighboring genes. We compared the results
with published lymphocyte cell line data sets (Stranger et al, 2007, Dixon et al, 2008) and
liver expression data (Schadt et al, 2008). Altogether, 7.4% of the analyzed loci were
found to be regulated by the identified SNP. A substantial overlap of eQTLs between
different datasets was observed despite the different tissues of origin and different
microarray platforms used in the studies. We have demonstrated that whole blood
expression profiles serve as a useful resource to refine loci identified in GWAS and to
address the causality of the target loci.

CURRICULUM VITAE Name: Miss Divya Deepak Mehta Age - 26
Term address Home address Haus nummer 2 2/42 Nanik Nivas
31 Pariser Strasse 91-A B.Desai Road
Munich 81667 Mumbai – 400 026
Germany India
Mobile: 0049-17621649800 Tel: 0091- 22-23673421
Email: [email protected] , [email protected] Nationality: Indian
■ Education:
2009-2011 Postdoctoral researcher, Max Planck Institute of Psychiatry, Munich.
Research Group – Molecular genetics of Depression.
2005-2008 PhD student, Institute of Human Genetics, GSF/Helmholtz Research Center, Munich. Group of Prof.Dr.Thomas Meitinger.
Project Title – Genome wide association study to search for SNPs (Single Nucleotide Polymorphisms) affecting gene expression in the KORA population.
2003-2004 Degree- MSc In Human Molecular Genetics, Imperial College of Science, Technology and Medicine, University of London.
Grade: Ist Class with Distinction in MSc Thesis.
Final Research Project – Genetic Influence of Dopamine 4 Receptor on the etiology of Schizophrenia and treatment response at Kings College, London.
2000–2003 Degree - BSc (Honours) Genetics, University of Sheffield. Grade: 2:2.
Final research project: Culture and characterization of neural cell types from human embryonic stem cells. Supervisor: Prof.Harry.D.M.Moore.
1998–2000 Standard12 Higher Secondary Certificate Examination (equivalent to A Level), Jai Hind Institute of Science and Technology, India.
Physics 94%, Chemistry 89%, Biology 89%, Maths 70%, English 71%, Hindi 68%.
Overall → 80% (Distinction)
1986–1998 Standard10 Indian Certificate of Secondary Education (equivalent to GCSE), Villa Theresa High School, India
English 92%, Hindi 86%, History, Geography and Civics 88%, Mathematics 90%, Science (Physics, Chemistry and Biology) 86%, Accounts 92%.
Overall → 90% (Distinction)

■ Other examinations/certificates:
EMBO certificate in Statistical analysis, 2007, U.K.
Certificate in the 6th Bioinformatics Course 2005, Bertinoro, Italy.
TOEFL score of 623 out of 660.
4 year training at Aakar Bharati Academy of Art, Bombay and certificates in the Elementary and Intermediate Drawing Board Examinations.
Two-time winner of the Value for Education award.
■ Scholarship and awards:
University of Sheffield competitive academic scholarship for 3 years.
FEBS Youth Travel Fund to give a presentation at the FEBS Advanced Course “Mitochondrion in Health and Disease” in Aussois, France.
GfH travel grant to enable me to give a presentation at the European Society of Human Genetics conference in Barcelona.
ESHG fellowship to attend advanced course in Genetic Epidemiology in Paris,France.
■ Work experience:
May 2007: Participated in the DAAD-RISE Summer Internship program. I mentored a student from Cornell University, U.S.A, for 3 months.
June 2005: Worked on a 5 months research project at the University of Göttingen, Germany. Project : differential mRNA and protein expression of 3 candidate genes in a knockout mouse for Epilepsy.
October 2004: Worked in the Genetics Diagnostic Laboratory at the Jaslok hospital in Mumbai.
September 2002: Orientation program Meet and Greet assistant at the University of Sheffield: the aim was to greet the new international students and help with queries. This was very challenging and involved a lot of commitment, organization, communication skills and teamwork.
June 2002: Worked in the Genomics laboratory at Nicholas Piramal, one of India’s largest pharmaceutical companies. It was a short research project that involved PCR amplification of the CYP2D6 gene. This was in conjunction with a Pharmacogenomics project on ‘Development of SNP database for a panel of candidate genes involved in drug response in the Indian population’.
Voluntary Work- Organized a special Olympics program for mentally handicapped people. NASEOH (National Society for Equal Opportunities for the Handicapped) and LIFE (Let Individuals Feel for Everyone) certificates for raising funds for the less privileged.

■ Extra curricular activities:
University of Sheffield 2002-2003 – Elected Secretary of the International Students Committee. We were in charge of over 5,000 International students and 50 different social and cultural societies.
University of Sheffield 2001-2002 -Elected International Representative of the Hindu Students Forum.
Winner of the School Debate Competition- Democracy versus Dictatorship.
Won several certificates and medals in District Roller Skating Tournaments.
Winner of many certificates in Art, Drawing and Painting competitions.
■ Invited talks: 1) November 2008: Philadelphia, U.S.A. – Platform presentation at the American Society of Human Genetics
2) June 2008: Barcelona, Spain- European Society of Human Genetics conference.
3) October 2007: Cambridge, U.K. - EMBO course in microarray analysis.
4) August 2007: Munich, Germany – Ludwig MaximiliansUniversität.
5) April 2007: Aussois, France – Mitochondria in life, death and disease, FEBS advanced lecture course.
■ Poster presentations: 1) November 2006: Munich, Germany- Bioinformatics Munich: From genomes to systems biology.
2) November 2006: Heidelberg, Germany-NGFN conference.
3) August 2007: Boston, U.S.A. – American Chemical Society National Meeting.
■ Publications: 1. SLC2A9 influences uric acid concentrations with pronounced sex-specific
effects. Angela Döring*, Christian Gieger*, Divya Mehta, et al, Nature Genetics 40, 430 - 436 (2008).
2. Genome-Wide Scan on Total Serum IgE Levels Identifies FCER1A as Novel Susceptibility Locus. Weidinger et al, PloS Genetics, 2008.
3. A genome-wide association study identifies three loci associated with mean platelet volume, Meisinger, Prokisch et al, AJHG, 2009
4. A common FADS2 promoter polymorphism increases promoter activity and facilitates binding of transcription factor ELK1, Lattka et al, Journal of Lipid Research, 2009.
5. Single cell expression profiling of dopaminergic neurons in Parkinson disease, Elstner et al, Annals of Neurology, 2009.
6. Functional validation of eQTLs, in preparation.
Related Documents