RESEARCH ARTICLE Genome-wide association analysis and functional annotation of positional candidate genes for feed conversion efficiency and growth rate in pigs Justyna Horodyska 1,2 , Ruth M. Hamill 1 , Patrick F. Varley 3 , Henry Reyer 2 *, Klaus Wimmers 2,4 1 Teagasc, Food Research Centre, Ashtown, Dublin, Ireland, 2 Leibniz Institute for Farm Animal Biology (FBN), Institute for Genome Biology, Dummerstorf, Germany, 3 Hermitage Genetics, Kilkenny, Ireland, 4 Faculty of Agricultural and Environmental Sciences, University Rostock, Rostock, Germany * [email protected] Abstract Feed conversion efficiency is a measure of how well an animal converts feed into live weight and it is typically expressed as feed conversion ratio (FCR). FCR and related traits like growth rate (e.g. days to 110 kg—D110) are of high interest for animal breeders, farmers and society due to implications on animal performance, feeding costs and environmental sustainability. The objective of this study was to identify genomic regions associated with FCR and D110 in pigs. A total of 952 terminal line boars, showing an individual variation in FCR, were genotyped using 60K SNP-Chips. Markers were tested for associations with esti- mated breeding values (EBV) for FCR and D110. For FCR, the largest number of associated SNPs was located on chromosomes 4 (30 SNPs), 1 (25 SNPs), X (15 SNPs) and 6 (12 SNPs). The most prominent genomic regions for D110 were identified on chromosomes 15 (10 SNPs), 1 and 4 (both 9 SNPs). The most significantly associated SNPs for FCR and D110 mapped 129.8 Kb from METTL11B (chromosome 4) and 32Kb from MBD5 (chromo- some 15), respectively. A list of positional genes, closest to significantly associated SNPs, was used to identify enriched pathways and biological functions related to the QTL for both traits. A number of candidate genes were significantly overrepresented in pathways of immune cell trafficking, lymphoid tissue structure, organ morphology, endocrine system function, lipid metabolism, and energy production. After resequencing the coding region of selected positional and functional candidate genes, six SNPs were genotyped in a subset of boars. SNPs in PRKDC, SELL, NR2E1 and AKRIC3 showed significant associations with EBVs for FCR/D110. The study revealed a number of chromosomal regions and candidate genes affecting FCR/D110 and pointed to corresponding biological pathways related to lipid metabolism, olfactory reception, and also immunological status. PLOS ONE | https://doi.org/10.1371/journal.pone.0173482 June 12, 2017 1 / 15 a1111111111 a1111111111 a1111111111 a1111111111 a1111111111 OPEN ACCESS Citation: Horodyska J, Hamill RM, Varley PF, Reyer H, Wimmers K (2017) Genome-wide association analysis and functional annotation of positional candidate genes for feed conversion efficiency and growth rate in pigs. PLoS ONE 12(6): e0173482. https://doi.org/10.1371/journal.pone.0173482 Editor: Roberta Davoli, Universita degli Studi di Bologna, ITALY Received: July 6, 2016 Accepted: May 24, 2017 Published: June 12, 2017 Copyright: © 2017 Horodyska et al. This is an open access article distributed under the terms of the Creative Commons Attribution License, which permits unrestricted use, distribution, and reproduction in any medium, provided the original author and source are credited. Data Availability Statement: All relevant data is within the paper and its Supporting Information S1. Funding: This project has received funding from the European Union‘s Seventh Framework Programme for research, technological development and demonstration as part of the ECO-FCE project under grant agreement No. 311794. Hermitage Genetics is a partner of the ECO-FCE project and did not provide own funds for conducting this research. Hermitage Genetics, provided support in the form of salaries for authors

Welcome message from author
This document is posted to help you gain knowledge. Please leave a comment to let me know what you think about it! Share it to your friends and learn new things together.
Transcript
RESEARCH ARTICLE
Genome-wide association analysis and
functional annotation of positional candidate
genes for feed conversion efficiency and
growth rate in pigs
Justyna Horodyska1,2, Ruth M. Hamill1, Patrick F. Varley3, Henry Reyer2*,
Klaus Wimmers2,4
1 Teagasc, Food Research Centre, Ashtown, Dublin, Ireland, 2 Leibniz Institute for Farm Animal Biology
(FBN), Institute for Genome Biology, Dummerstorf, Germany, 3 Hermitage Genetics, Kilkenny, Ireland,
4 Faculty of Agricultural and Environmental Sciences, University Rostock, Rostock, Germany
Abstract
Feed conversion efficiency is a measure of how well an animal converts feed into live weight
and it is typically expressed as feed conversion ratio (FCR). FCR and related traits like
growth rate (e.g. days to 110 kg—D110) are of high interest for animal breeders, farmers
and society due to implications on animal performance, feeding costs and environmental
sustainability. The objective of this study was to identify genomic regions associated with
FCR and D110 in pigs. A total of 952 terminal line boars, showing an individual variation in
FCR, were genotyped using 60K SNP-Chips. Markers were tested for associations with esti-
mated breeding values (EBV) for FCR and D110. For FCR, the largest number of associated
SNPs was located on chromosomes 4 (30 SNPs), 1 (25 SNPs), X (15 SNPs) and 6 (12
SNPs). The most prominent genomic regions for D110 were identified on chromosomes 15
(10 SNPs), 1 and 4 (both 9 SNPs). The most significantly associated SNPs for FCR and
D110 mapped 129.8 Kb from METTL11B (chromosome 4) and 32Kb from MBD5 (chromo-
some 15), respectively. A list of positional genes, closest to significantly associated SNPs,
was used to identify enriched pathways and biological functions related to the QTL for both
traits. A number of candidate genes were significantly overrepresented in pathways of
immune cell trafficking, lymphoid tissue structure, organ morphology, endocrine system
function, lipid metabolism, and energy production. After resequencing the coding region of
selected positional and functional candidate genes, six SNPs were genotyped in a subset of
boars. SNPs in PRKDC, SELL, NR2E1 and AKRIC3 showed significant associations with
EBVs for FCR/D110. The study revealed a number of chromosomal regions and candidate
genes affecting FCR/D110 and pointed to corresponding biological pathways related to lipid
metabolism, olfactory reception, and also immunological status.
PLOS ONE | https://doi.org/10.1371/journal.pone.0173482 June 12, 2017 1 / 15
a1111111111
a1111111111
a1111111111
a1111111111
a1111111111
OPENACCESS
Citation: Horodyska J, Hamill RM, Varley PF, Reyer
H, Wimmers K (2017) Genome-wide association
analysis and functional annotation of positional
candidate genes for feed conversion efficiency and
growth rate in pigs. PLoS ONE 12(6): e0173482.
https://doi.org/10.1371/journal.pone.0173482
Editor: Roberta Davoli, Universita degli Studi di
Bologna, ITALY
Received: July 6, 2016
Accepted: May 24, 2017
Published: June 12, 2017
Copyright: © 2017 Horodyska et al. This is an open
access article distributed under the terms of the
Creative Commons Attribution License, which
permits unrestricted use, distribution, and
reproduction in any medium, provided the original
author and source are credited.
Data Availability Statement: All relevant data is
within the paper and its Supporting Information S1.
Funding: This project has received funding from
the European Union‘s Seventh Framework
Programme for research, technological
development and demonstration as part of the
ECO-FCE project under grant agreement No.
311794. Hermitage Genetics is a partner of the
ECO-FCE project and did not provide own funds for
conducting this research. Hermitage Genetics,
provided support in the form of salaries for authors
Background
Improving feed conversion efficiency (FCE) in pigs is a major goal in pig breeding as feed
accounts for a high proportion of the total production cost [1]. Selection for improved FCE is
also a key factor in reducing the environmental footprint of the pig industry [2]. FCE can be
defined as a measure of an animal’s efficiency in converting feed into live weight [3] and it is
typically expressed as feed conversion ratio (FCR, ratio of feed intake to weight gain) [4]. As
such, growth rate traits which determine the weight gain in different developmental stages are
closely related to FCR thus having a direct impact on efficiency [5]. However, phenotypic and
genetic correlations between FCR and its components (i.e. feed intake and body weight gain)
have been reported to be higher for FCR and feed intake compared to FCR and body weight
gain in different pig populations [5]. Apart from FCR, other indexes such as residual feed
intake (RFI), which can be described as the difference between an individual’s actual feed
intake and its predicted feed requirements for maintenance and growth, have been studied [2].
A number of quantitative trait loci (QTLs) affecting feed efficiency in pigs have been
detected (PigQTLdb, http://www.animalgenome.org/cgi-bin/QTLdb/SS/index). However,
most of them were identified using a linkage mapping approach resulting in wide genomic
QTL regions. Such linkage data is limited to within-family selection only [6]. A genome-wide
association study (GWAS) approach would offer the potential for improved accuracy and
refinement in the identification of QTL locations at the population level [7]. To date, only a
few studies have used the GWAS approach to identify QTLs for FCE traits in pigs. Sahana
et al. [6] detected a number of significant QTLs for FCR on porcine chromosomes (SSC) 4, 7,
8 and 14 in Duroc pigs. Another study identified only one QTL for FCR on SSC 4 in Duroc
boars [8]. A GWAS performed on Yorkshire boars revealed several QTLs influencing RFI
on SSC 7 and 14 [9]. Do et al. [10] additionally reported QTLs on SSC 3, 8, 9, 10, 15 and 17
for RFI in Yorkshire pigs. The same author also conducted a study on Duroc boars and identi-
fied significant regions for RFI on SSC 1, 8, 9, 13 and 18 [11]. While employing the GWAS
approach, the objective of this study was to identify genomic regions associated with feed effi-
ciency in an important commercial pig sire line (Maxgro, Hermitage Genetics).
Materials and methods
Animals and phenotypes
Animal care, slaughter and tissue collection of the animals used in this study were performed
in compliance with national regulations related to animal research and commercial slaugh-
tering and were approved by the local committees for the care and use of animals of the Tea-
gasc Research Center Ashtown and the Leibniz Institute for Farm Animal Biology. A total of
952 Maxgro boars, which is predominately Pietrain based terminal line, were used in this
study. These animals, born between year 2006 and 2012, were selected as replacement boars
in the artificial insemination (AI) stud and were supplied by Hermitage Genetics (Ireland).
The pigs were penned in groups of fourteen with a space allowance of 0.75 m2 per pig and
were fed a pelleted finisher diet (National Research Council, 2012) consisting of 177.8 g
crude protein, 5.0 g tP, 6.0 g Ca and 13.9 MJ DE, and 8.8 g ileal digestible lysine per kilogram.
They also had ad libitum access to water through nipple drinkers. Phenotypic data such as
FCR and D110 comprising 46 and 91 percent of the total number of animals used in the
study, respectively, were recorded by Hermitage Genetics following the method of Varley
et al [12]. Breeding values (EBV) for FCR (range: -0.44–0.32, mean: -0.09, SD: 0.09) and
D110 (range: -20.8–9.18, mean: -10.2, SD: 4.00) were estimated using Best Linear Unbiased
Prediction (BLUP) system [13] from a dataset that included multiple breeds, two sexes and a
GWAS for feed conversion efficiency
PLOS ONE | https://doi.org/10.1371/journal.pone.0173482 June 12, 2017 2 / 15
[PV], but did not have any additional role in the
study design, data collection and analysis, decision
to publish, or preparation of the manuscript. The
specific roles of these authors are articulated in the
‘author contributions’ section.
Competing interests: Patrick F. Varley is employed
by Hermitage Genetics. There are no patents,
products in development or marketed products to
declare. This does not alter our adherence to all the
PLOS ONE policies on sharing data and materials,
as detailed online in the guide for authors.
Abbreviations: BLUP, best linear unbiased
prediction; D110, days to 110 kg; EBV, estimated
breeding value; FCE, feed conversion efficiency;
FCR, feed conversion ratio; GWAS, genome-wide
association study; MAF, minor allele frequency;
QTL, quantitative trait locus; RFI, residual feed
intake; SNP, single nucleotide polymorphism; SSC,
Sus scrofa chromosome.
number of farms and AI studs. The models for the routine estimation of direct genetic effects
for both traits were multivariate and included fixed effects of contemporary group, pig breed
and sex. The affiliation of a pig to a litter was fit as an uncorrelated random effect in the pre-
diction. Moreover, the status of performance testing was also included as fixed effect. Specifi-
cally, for performance tested pigs individual feeding records were obtained using a single-
space computerised feeder (Mastleistungsprufung MLP-RAP; Schauer Agrotronic AG, Sur-
see, Switzerland) [12]. The pigs (age at start of the test—mean: 102.3 days, SD: 6.4 days; age
at end of the test—mean: 144.1 days, SD: 6.4 days) were weighted at the start (mean: 60.9 kg,
SD: 7.6 kg) and the end (mean: 109.3 kg, SD: 9.9 kg) of the test period for a minimum of 40
days (mean: 41.8 days, SD: 4.7 days). Based on these observations FCR was calculated. In
order to obtain the number of days needed to gain a final body weight of 110 kg, the pig’s
date of birth and slaughter weight, which is slightly above or below 110 kg, was entered into
the BLUP system and calculated. For the prediction of the EBVs FCR, both start weight and
end weight were fit as a covariate in order to consider weight related differences in feed effi-
ciency. Following the test period, boars were entered into the AI stud therefore no euthanasia
of boars occurred.
SNP array genotyping, quality control and statistical analysis
Approximately 50 ml of blood from Vena jugularis was collected from each boar by Hermitage
Genetics into a tube containing EDTA. Genomic DNA was extracted from the preserved
blood using QIAamp DNA Blood Mini Kit (QIAGEN Ltd., West Sussex, UK) according to
manufacturer’s instructions. Genotyping with PorcineSNP60 BeadChip (Illumina Inc., San
Diego, CA, USA) was performed in compliance with the SNP Infinium HD assay protocol
(http://www.illumina.com). Subsequently, data was analysed using GenomeStudio (Version
2011.1, Illumina Inc.). Individuals with call rate� 97% and SNPs with call frequency� 95%
and minor allele frequency (MAF)� 0.03 were excluded. The departure from Hardy-Wein-
berg equilibrium (HWE) was not considered as indicator for consistent genotyping errors as it
has been reported to be underpowered for this purpose [14].
After quality control, remaining SNPs were tested for an association with EBVs FCR and
D110. SNP-trait association analysis was implemented with a mixed linear model using JMP
Genomics 6 software (version 6, SAS INST., Inc., Cary, NC, 2002–2010). In order to correct
for population structure, the relationship matrix tool implemented in JMP Genomics 6 was
used to compute identity-by-state (IBS) relations between individuals based on genotype data
[15]. After compression of K matrices, these relations were included as a random effect in the
model. Moreover, this factor accounting for relatedness was applied to counteract high false-
positive rates and the misestimating of QTL effects assigned to the usage of EBVs for GWAS
[16]. Threshold p-values for suggestive and Bonferroni-adjusted genome-wide significance
were set to -log10[p-value] = 4.7 (1 divided by 48440 independent tests) and -log10[p-value] =
6 (0.05 divided by 48440 independent tests), respectively.
A list of genes closest to the significant SNPs (-log10[p-value]� 6) was created allowing a
maximum distance of 1Mb between the marker and genes, using the Ensembl database (http://
www.ensembl.org, release 78) and was uploaded into Ingenuity Pathways Analysis (IPA; Inge-
nuity1 Systems, http://www.ingenuity.com) in order to investigate relevant pathways and
functional categories. Benjamini-Hochberg corrected P values were used to map the genes to
the most significant molecular, cellular and physiological systems development functions
(P< 0.01). To get insights into the most relevant metabolic and signalling pathways based on
the designated list of genes, canonical pathways were displayed (Fisher’s exact test; P< 0.05),
although they did not differ significantly after Benjamini-Hochberg correction. Categories
GWAS for feed conversion efficiency
PLOS ONE | https://doi.org/10.1371/journal.pone.0173482 June 12, 2017 3 / 15
addressing human disease and disorder-associated pathways were excluded from the IPA
analysis.
Validation of candidate genes
Twelve genes with functions relevant to feed efficiency according to IPA were selected from
the candidate gene list for validation and further analysis. A set of primers for each gene
was designed based on published sequence data (Ensembl database) using Primer3 (http://
primer3.ut.ee/) (Table 1). Genomic DNA of low EBV FCR pigs (n = 10, mean: -0.182,
SD: 0.027) and high EBV FCR pigs (n = 10, mean: 0.040, SD: 0.032), with a p-value of
difference < 0.0001, was pooled (n = 2) and used as template for PCR. All PCR reactions were
carried out in a final volume of 50 μl and consisted of 10 μl PCR buffer (5x) (Promega, WI,
USA), 3 μl MgCl2 (25mM) (Promega), 0.4 μl dNTP mix (10mM each), 0.4 μl of each primer
(100 pmol, Eurofins MWG Operon, Germany), 0.4 μl Go Taq DNA Polymerase (100U, Pro-
mega), 30 ng of the DNA pool and filled with dH2O. The cycling conditions were as follows:
initial denaturation at 95˚C for 135 sec; 35 cycles of 95˚C for 45 sec, annealing for 45 sec (60˚C
for OPRD1,WDTC1, SMPD2 and 56˚C for the remaining primers), and 72˚C for 75 sec, subse-
quently final extension of 72˚C for 10 min. PCR products were subjected to electrophoresis on
1.5% agarose gels and visualised. PCR products were purified using the QIAquick PCR Purifi-
cation Kit (QIAGEN Ltd.) and sequenced commercially (Eurofins, MWG-Biotech). Chro-
matograms were analysed to identify segregating SNP.
Based on the PCR product sequencing of the twelve genes, six confirmed SNPs (located
inMBD5,OPRD1, AKR1C3,NR2E1, PRKDC and SELL) were selected for genotyping in 436
Maxgo boars as a representative subset of animals. The SNP genotyping was performed using
TaqMan1 SNP Genotyping Assays (Applied Biosystems, Foster City, CA, USA). Each 15 μl
PCR reaction consisted of 7.5 μl of TaqMan1 genotyping master mix (Applied Biosystems,
Foster City, CA, USA), 0.375 μl 40 x genotyping assay mix (Applied Biosystems), 6.125 μl
dH2O and 1 μl of genomic DNA (10 ng/μl). Thermal cycling was performed using ABI
PRISM1 7500 Real Time PCR System (Applied Biosystems) and the cycling conditions were
as follows: initial denaturation at 95˚C for 10 min, followed by 40 cycles of 95˚C for 15 sec
denaturation and 60˚C for 1 min annealing/extension. Genotype calling was carried out using
proprietary 7500 System SDS software (Applied Biosystems).
Table 1. Forward and reverse primers for PCR amplification of the twelve selected positional candidate genes located within 1Mb of the genome-
wide significant markers for EBVs FCR and D110.
Gene Ensembl reference Size (bp) Forward Reverse
CD164 ENSSSCG00000004414 713 TGTGTCTGTCCAGTTTCTTCGC TGAAGTCAGGCTGGGGATTACG
NR2E1 ENSSSCG00000004384 706 TCTCCCTTCCCTCTCTTCACCT ACCTACGCTGCCCTCTGATTTC
SMPD2 ENSSSCG00000004408 697 CCTCCTCTCTGACCCTCTCTCT TGGGGCTGTCTGTTTCTTCC
PRKDC ENSSSCG00000006274 735 AGGAAACACGCCTCAGTTGGTA ACGCAGGAGACAGAAGGAAAGC
SELL ENSSSCG00000006287 706 TCTCAAAACAAATGTCTGTGGCTGT GGTTATCTTCTGGGCAACTCACC
SELP ENSSSCG00000006288 350 ACCTGAATCCAACCTCTCTCCA TGCATCTGAAGTAGCAAGTCGT
OPRD1 ENSSSCG00000027401 718 GCTCCCATCCACATCTTCGTCA CCCCTCAATTCCACCTTCCTCA
WDTC1 ENSSSCG00000003570 567 CCAGGGACCAAGACAACCGA CACCATACCTCACAGCAACGC
AKR1C3 ENSSSCG00000030447 792 GCTGACACTTAGCAGTTGAGGAATA GGTGGAGGAAAGAGGAGTTAAATACA
KLF6 ENSSSCG00000028828 702 GACCAACAGCCTGAACTCGGA CCCTGAGTCTCACTTCCCCAAA
MBD5 ENSSSCG00000015667 773 ACTTGGAAGCCCTGATGTTTTCAC ACCCTATCGTTGACCTTGGTGAC
MMADHC ENSSSCG00000028646 696 GGATTCTCCGTTGATGATCTTGGC CCTTATTCTTCTTTCCCGCACAAAC
https://doi.org/10.1371/journal.pone.0173482.t001
GWAS for feed conversion efficiency
PLOS ONE | https://doi.org/10.1371/journal.pone.0173482 June 12, 2017 4 / 15
Allele frequencies were computed and deviations from HWE (p-value< 0.05) were tested
using Haploview software [17]. Mixed linear model using JMP Genomics 6 software (version
6, SAS INST., Inc., Cary, NC, 2002–2010) was used to evaluate associations between the four
SNPs with allele frequency as predicted and greater than 5% (rs340456509, rs80900450,
rs319738340 and rs81508945) and EBVs for FCR and D110 in the Maxgro boars (n = 436).
Compressed IBS relations were included as a random effect in the model. In order to deter-
mine additive and dominant effects for the particular SNP, indicator variables alpha (1 = homo-
zygote for the allele with higher least square means, -1 = homozygote for the allele with lower
least square means and 0 = heterozygote), and delta (1 = heterozygote and 0 = homozygote)
were created. Regression models were performed, using EBV FCR and EBV D110 as the
dependent variables and variable alpha and delta as the independent variables, to estimate the
additive and dominant effects for each significant SNP (REG procedure of the SAS v9.3 soft-
ware package). Based on the squared multiple correlation (R2) of the regression, the effect size
was expressed as the phenotypic variance attributable to the genetic variance at the designated
locus.
Results
Genome-wide association study
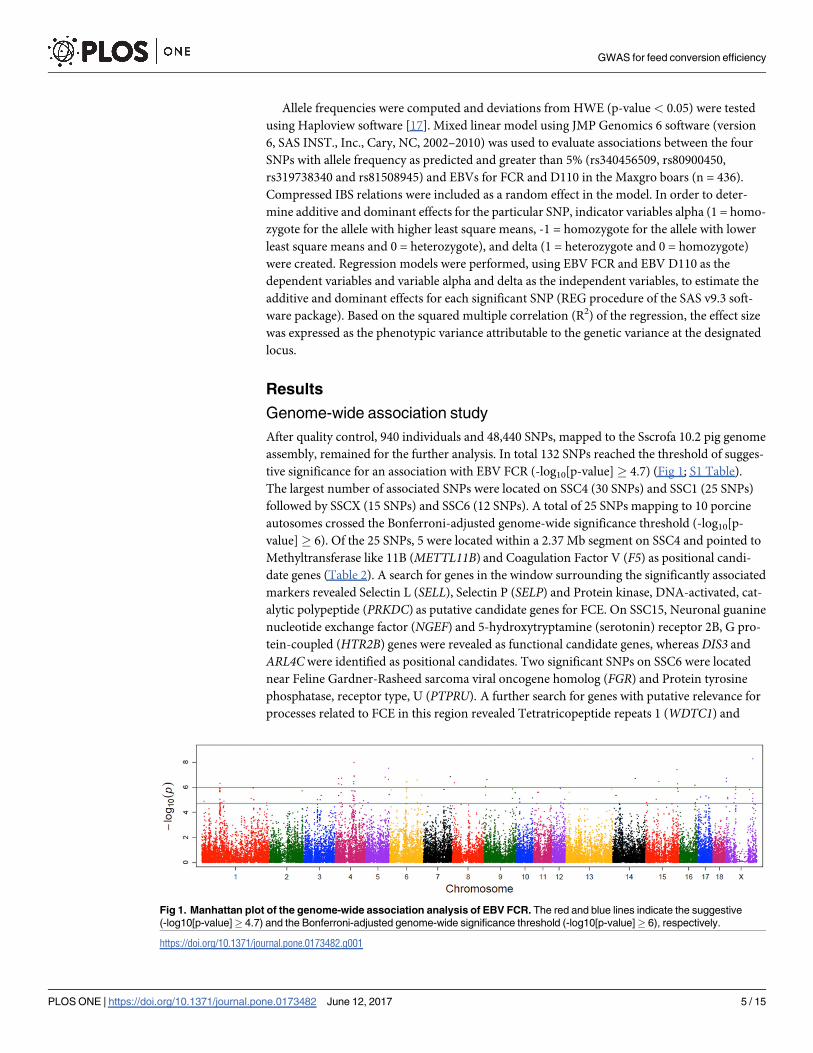
After quality control, 940 individuals and 48,440 SNPs, mapped to the Sscrofa 10.2 pig genome
assembly, remained for the further analysis. In total 132 SNPs reached the threshold of sugges-
tive significance for an association with EBV FCR (-log10[p-value]� 4.7) (Fig 1; S1 Table).
The largest number of associated SNPs were located on SSC4 (30 SNPs) and SSC1 (25 SNPs)
followed by SSCX (15 SNPs) and SSC6 (12 SNPs). A total of 25 SNPs mapping to 10 porcine
autosomes crossed the Bonferroni-adjusted genome-wide significance threshold (-log10[p-
value]� 6). Of the 25 SNPs, 5 were located within a 2.37 Mb segment on SSC4 and pointed to
Methyltransferase like 11B (METTL11B) and Coagulation Factor V (F5) as positional candi-
date genes (Table 2). A search for genes in the window surrounding the significantly associated
markers revealed Selectin L (SELL), Selectin P (SELP) and Protein kinase, DNA-activated, cat-
alytic polypeptide (PRKDC) as putative candidate genes for FCE. On SSC15, Neuronal guanine
nucleotide exchange factor (NGEF) and 5-hydroxytryptamine (serotonin) receptor 2B, G pro-
tein-coupled (HTR2B) genes were revealed as functional candidate genes, whereas DIS3 and
ARL4Cwere identified as positional candidates. Two significant SNPs on SSC6 were located
near Feline Gardner-Rasheed sarcoma viral oncogene homolog (FGR) and Protein tyrosine
phosphatase, receptor type, U (PTPRU). A further search for genes with putative relevance for
processes related to FCE in this region revealed Tetratricopeptide repeats 1 (WDTC1) and
Fig 1. Manhattan plot of the genome-wide association analysis of EBV FCR. The red and blue lines indicate the suggestive
(-log10[p-value]� 4.7) and the Bonferroni-adjusted genome-wide significance threshold (-log10[p-value]� 6), respectively.
https://doi.org/10.1371/journal.pone.0173482.g001
GWAS for feed conversion efficiency
PLOS ONE | https://doi.org/10.1371/journal.pone.0173482 June 12, 2017 5 / 15
Opioid receptor, delta 1 (OPRD1). Furthermore, a significant SNP mapped to SSC1 was
located in an uncharacterised gene and the nearest annotated gene was CD164 molecule, sialo-
mucin (CD164). Nuclear receptor subfamily 2, group E, member 1 (NR2E1) and Sphingomye-
lin phosphodiesterase 2, neutral membrane (SMPD2) were identified as functional candidate
genes in this region.
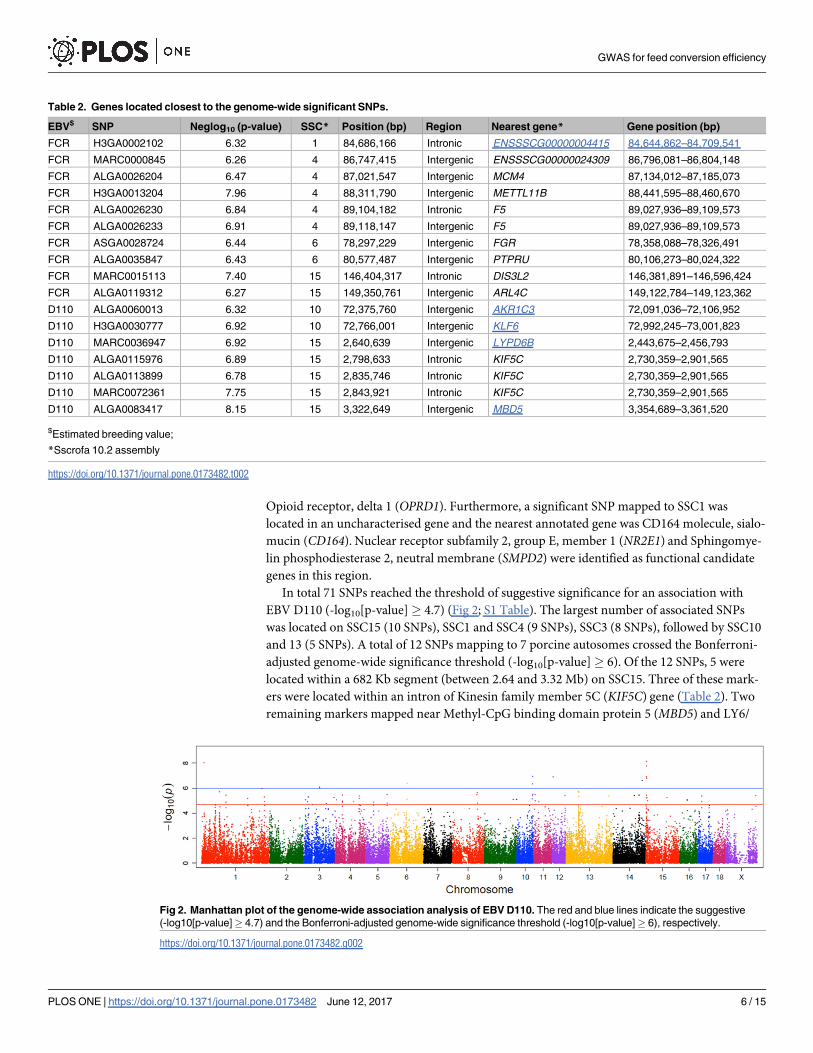
In total 71 SNPs reached the threshold of suggestive significance for an association with
EBV D110 (-log10[p-value]� 4.7) (Fig 2; S1 Table). The largest number of associated SNPs
was located on SSC15 (10 SNPs), SSC1 and SSC4 (9 SNPs), SSC3 (8 SNPs), followed by SSC10
and 13 (5 SNPs). A total of 12 SNPs mapping to 7 porcine autosomes crossed the Bonferroni-
adjusted genome-wide significance threshold (-log10[p-value]� 6). Of the 12 SNPs, 5 were
located within a 682 Kb segment (between 2.64 and 3.32 Mb) on SSC15. Three of these mark-
ers were located within an intron of Kinesin family member 5C (KIF5C) gene (Table 2). Two
remaining markers mapped near Methyl-CpG binding domain protein 5 (MBD5) and LY6/
Table 2. Genes located closest to the genome-wide significant SNPs.
EBV$ SNP Neglog10 (p-value) SSC* Position (bp) Region Nearest gene* Gene position (bp)
FCR H3GA0002102 6.32 1 84,686,166 Intronic ENSSSCG00000004415 84,644,862–84,709,541
FCR MARC0000845 6.26 4 86,747,415 Intergenic ENSSSCG00000024309 86,796,081–86,804,148
FCR ALGA0026204 6.47 4 87,021,547 Intergenic MCM4 87,134,012–87,185,073
FCR H3GA0013204 7.96 4 88,311,790 Intergenic METTL11B 88,441,595–88,460,670
FCR ALGA0026230 6.84 4 89,104,182 Intronic F5 89,027,936–89,109,573
FCR ALGA0026233 6.91 4 89,118,147 Intergenic F5 89,027,936–89,109,573
FCR ASGA0028724 6.44 6 78,297,229 Intergenic FGR 78,358,088–78,326,491
FCR ALGA0035847 6.43 6 80,577,487 Intergenic PTPRU 80,106,273–80,024,322
FCR MARC0015113 7.40 15 146,404,317 Intronic DIS3L2 146,381,891–146,596,424
FCR ALGA0119312 6.27 15 149,350,761 Intergenic ARL4C 149,122,784–149,123,362
D110 ALGA0060013 6.32 10 72,375,760 Intergenic AKR1C3 72,091,036–72,106,952
D110 H3GA0030777 6.92 10 72,766,001 Intergenic KLF6 72,992,245–73,001,823
D110 MARC0036947 6.92 15 2,640,639 Intergenic LYPD6B 2,443,675–2,456,793
D110 ALGA0115976 6.89 15 2,798,633 Intronic KIF5C 2,730,359–2,901,565
D110 ALGA0113899 6.78 15 2,835,746 Intronic KIF5C 2,730,359–2,901,565
D110 MARC0072361 7.75 15 2,843,921 Intronic KIF5C 2,730,359–2,901,565
D110 ALGA0083417 8.15 15 3,322,649 Intergenic MBD5 3,354,689–3,361,520
$Estimated breeding value;
*Sscrofa 10.2 assembly
https://doi.org/10.1371/journal.pone.0173482.t002
Fig 2. Manhattan plot of the genome-wide association analysis of EBV D110. The red and blue lines indicate the suggestive
(-log10[p-value]� 4.7) and the Bonferroni-adjusted genome-wide significance threshold (-log10[p-value]� 6), respectively.
https://doi.org/10.1371/journal.pone.0173482.g002
GWAS for feed conversion efficiency
PLOS ONE | https://doi.org/10.1371/journal.pone.0173482 June 12, 2017 6 / 15
PLAUR domain containing 6B (LYPD6B). A further search for genes revealed Methylmalonic
aciduria cblD type, with homocystinuria (MMADHC) with functional relations to D110. On
SSC10, Kruppel-like factor 6 (KLF6) and Aldo-keto reductase family 1, member C3 (AKR1C3)
were identified as positional candidate genes with a putative contribution to D110.
Functional enrichment among mapped genes
A total of 86 and 16 genes mapped within 1Mb upstream and downstream of significant mark-
ers for EBV FCR and D110, respectively, were uploaded into Ingenuity Pathways Analysis.
Functional annotation of the positional candidate genes to biological processes and canonical
pathways (top 5) is presented in Tables 3 and 4. The top canonical pathways significantly over-
represented among the positional candidate genes for EBV of FCR were related to cell cycle
control, estrogen receptor signaling, RXR and subfamily 1 nuclear receptors activation, granu-
locyte mediate inflammation, and sphingomyelin metabolism. Functional annotation revealed
organismal development and organ morphology, lymphoid tissue and hematological system
development, and immune cell trafficking to be significantly enriched among the genes located
in QTL regions for EBV FCR. Moreover, bile acid and androgen biosynthesis, TR/RXR Activa-
tion, methylglyoxal detoxification, and retinoate biosynthesis pathways were the top pathways
associated with the positional candidate genes for EBV D110. Furthermore, statistically associ-
ated biological functions with the positional candidate genes for EBV D110 were energy, lipid
and drug metabolism, endocrine system development, and small molecule biochemistry.
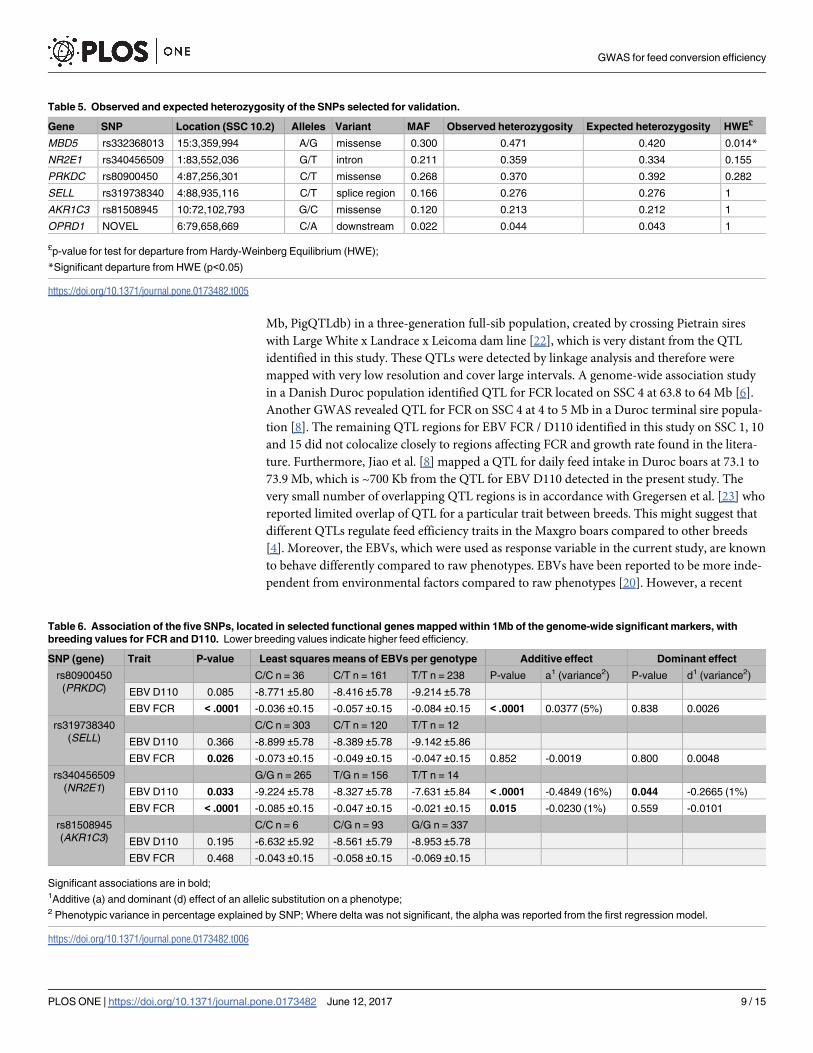
SNP array validation
Four SNPs located near the QTLs for EBV FCR (rs80900450, rs319738340, rs340456509 and a
novel SNP) in PRKDC, SELL,NR2E1 and OPRD1 respectively, and two SNPs mapped close to
the QTL for EBV D110 (rs332368013 and rs81508945) inMBD5 and AKR1C3 respectively
were confirmed to be polymorphic in target populations by sequencing. Subsequently, these
six SNPs were genotyped in 436 Maxgro boars. Allelic frequencies and HWE are presented in
Table 5. SNP inMBD5 significantly departured from HWE (P-value < 0.05) indicating a slight
deficiency of homozygotes in the studied population and SNP in OPRD1 displayed minor
allele frequency less than 5%. All SNPs, with the exception of the SNP inMBD5 and OPRD1were tested for association with breeding values for FCR and D110 (Table 6). SNP rs80900450
and rs319738340 showed significant association with EBV FCR. Moreover, SNP rs340456509
was found significantly associated with both traits. The occurrence of the G allele was shown
to be beneficial for both growth and feed efficiency. Significant additive effects of SNPs
rs80900450, rs81508945 and rs340456509 were observed. In addition, SNP rs340456509
showed a dominant effect for EBV D110, however only one percent of the phenotypic variance
was attributable to the dominant genetic variance.
Discussion
In this study, a genome-wide association analysis was performed to elucidate the genetic archi-
tecture of feed conversion efficiency and growth rate in pigs. A number of candidate genes
neighbouring the identified QTL regions were selected for downstream analysis. A further val-
idation confirmed significant associations between these genes and EBV FCR / D110. The
most prominent regions for EBV FCR were identified on SSC 1, 4, 6 and 15. For EBV D110,
the most promising QTLs were detected on porcine chromosome 10 and 15. None of the iden-
tified QTL regions overlap for both traits. Alignment of the genetic and physical maps on the
Sscrofa 10.2 genome assembly (PigQTLdb) enabled the identified QTLs from the present
study to be compared with previously described QTL regions. A QTL from this study located
GWAS for feed conversion efficiency
PLOS ONE | https://doi.org/10.1371/journal.pone.0173482 June 12, 2017 7 / 15
at 78.3 to 80.5 Mb on SSC 6 coincided with a QTL for FCR in a European Wild Boar x Meishan
cross mapped in the region of 127.3 cM (64.9 to 89 Mb, PigQTLdb) [18]. Additionally this
QTL overlapped with a QTL for body weight detected at 78.3 to 78.7 Mb in Iberian x Landrace
and Iberian x Meishan crosses [19]. This QTL has thus been independently discovered in dif-
ferent populations, which supports attributing it to biologically relevant common genetic
variation [20]. QTL located at 86.7 to 89.1 Mb on SSC 4 found in this study was in a close prox-
imity to QTL for FCR in a European Wild Boar x Pietrain cross mapped by Cepica et al. [21] at
75 cM (89.5 to 98.2 Mb, PigQTLdb). Another QTL on SSC 4 was detected at 20 cM (7.2 to 12.6
Table 3. Top molecular themes for the positional and functional candidate genes located within 1Mb of the genome-wide significant markers for
EBV of FCR and D110.
EBV Category B-H p-value* Genes
FCR Hematological System
Development and Function
8.53E-05-
9.68E-02
CEBPD, SRSF4, SELL, ATPIF1, FGR, SELE, F5, THEMIS2, EPB41, HTR2B, SELP,
ZBTB24, WASF2, PRKDC, FOXO3, OPRD1
FCR Immune Cell Trafficking 8.53E-05-9E-
02
SELP, SELL, FGR, SELE, F5, FOXO3, OPRD1
FCR Lymphoid Tissue Structure and
Development
2.89E-03-9E-
02
THEMIS2, SELP, SELL, SELE, F5, PRKDC
FCR Organ Morphology 2.89E-03-
9.68E-02
CEBPD, SELL, ECEL1, NR2E1, SELE, CHRNG, WASF1, GPR3, EIF4E2, HTR2B,
CHRND, SELP, KIFAP3, SEC63, SYTL1, PRKDC, FOXO3
FCR Organismal Development 2.89E-03-
9.14E-02
CEBPD, SELL, ATPIF1, NR2E1, FGR, SELE, F5, NPPC, WASF1, GPR3, THEMIS2,
EIF4E2, HTR2B, SELP, KIFAP3, WASF2, PRKDC, FOXO3
D110 Endocrine System Development
and Function
4.7E-06-
8.62E-02
AKR1C3, MBD5, ACVR2A, AKR1C1/AKR1C2, AKR1C4
D110 Small Molecule Biochemistry 4.7E-06-
6.21E-02
PFKP, AKR1C3, MBD5, ACVR2A, AKR1C1/AKR1C2, AKR1C4
D110 Energy Production 3.51E-05-
2.45E-02
AKR1C3, AKR1C1/AKR1C2, AKR1C4
D110 Lipid Metabolism 6.06E-05-
5.44E-02
AKR1C3, AKR1C1/AKR1C2, AKR1C4
D110 Drug Metabolism 3.68E-04-
3.01E-02
AKR1C3, AKR1C1/AKR1C2, AKR1C4
*Range of B-H multiple testing correction p-values of enriched biological functions within the category; candidate genes selected for downstream validation
are highlighted in bold
https://doi.org/10.1371/journal.pone.0173482.t003
Table 4. Top canonical pathways for the positional and functional candidate genes located within 1Mb of the genome-wide significant markers for
EBV of FCR and D110.
EBV Ingenuity Canonical Pathways P-value Genes
FCR Cell Cycle Control of Chromosomal Replication 4.66E-03 RPA2, MCM4
FCR Estrogen Receptor Signaling 1.27E-02 TAF12, MED18, PRKDC
FCR PXR/RXR Activation 2.59E-02 UGT1A1, FOXO3
FCR Granulocyte Adhesion and Diapedesis 2.62E-02 SELP, SELL, SELE
FCR Sphingomyelin Metabolism 2.96E-02 SMPD2
D110 Bile Acid Biosynthesis, Neutral Pathway 5.57E-08 AKR1C3, AKR1C1/AKR1C2, AKR1C4
D110 TR/RXR Activation 1.87E-05 PFKP, AKR1C3, AKR1C1/AKR1C2
D110 Androgen Biosynthesis 3.32E-05 AKR1C3, AKR1C4
D110 Methylglyoxal Degradation III 4.38E-05 AKR1C3, AKR1C1/AKR1C2
D110 Retinoate Biosynthesis I 1.91E-04 AKR1C3, AKR1C4
Candidate genes selected for downstream validation are highlighted in bold
https://doi.org/10.1371/journal.pone.0173482.t004
GWAS for feed conversion efficiency
PLOS ONE | https://doi.org/10.1371/journal.pone.0173482 June 12, 2017 8 / 15
Mb, PigQTLdb) in a three-generation full-sib population, created by crossing Pietrain sires
with Large White x Landrace x Leicoma dam line [22], which is very distant from the QTL
identified in this study. These QTLs were detected by linkage analysis and therefore were
mapped with very low resolution and cover large intervals. A genome-wide association study
in a Danish Duroc population identified QTL for FCR located on SSC 4 at 63.8 to 64 Mb [6].
Another GWAS revealed QTL for FCR on SSC 4 at 4 to 5 Mb in a Duroc terminal sire popula-
tion [8]. The remaining QTL regions for EBV FCR / D110 identified in this study on SSC 1, 10
and 15 did not colocalize closely to regions affecting FCR and growth rate found in the litera-
ture. Furthermore, Jiao et al. [8] mapped a QTL for daily feed intake in Duroc boars at 73.1 to
73.9 Mb, which is ~700 Kb from the QTL for EBV D110 detected in the present study. The
very small number of overlapping QTL regions is in accordance with Gregersen et al. [23] who
reported limited overlap of QTL for a particular trait between breeds. This might suggest that
different QTLs regulate feed efficiency traits in the Maxgro boars compared to other breeds
[4]. Moreover, the EBVs, which were used as response variable in the current study, are known
to behave differently compared to raw phenotypes. EBVs have been reported to be more inde-
pendent from environmental factors compared to raw phenotypes [20]. However, a recent
Table 5. Observed and expected heterozygosity of the SNPs selected for validation.
Gene SNP Location (SSC 10.2) Alleles Variant MAF Observed heterozygosity Expected heterozygosity HWE£
MBD5 rs332368013 15:3,359,994 A/G missense 0.300 0.471 0.420 0.014*
NR2E1 rs340456509 1:83,552,036 G/T intron 0.211 0.359 0.334 0.155
PRKDC rs80900450 4:87,256,301 C/T missense 0.268 0.370 0.392 0.282
SELL rs319738340 4:88,935,116 C/T splice region 0.166 0.276 0.276 1
AKR1C3 rs81508945 10:72,102,793 G/C missense 0.120 0.213 0.212 1
OPRD1 NOVEL 6:79,658,669 C/A downstream 0.022 0.044 0.043 1
£p-value for test for departure from Hardy-Weinberg Equilibrium (HWE);
*Significant departure from HWE (p<0.05)
https://doi.org/10.1371/journal.pone.0173482.t005
Table 6. Association of the five SNPs, located in selected functional genes mapped within 1Mb of the genome-wide significant markers, with
breeding values for FCR and D110. Lower breeding values indicate higher feed efficiency.
SNP (gene) Trait P-value Least squares means of EBVs per genotype Additive effect Dominant effect
rs80900450
(PRKDC)
C/C n = 36 C/T n = 161 T/T n = 238 P-value a1 (variance2) P-value d1 (variance2)
EBV D110 0.085 -8.771 ±5.80 -8.416 ±5.78 -9.214 ±5.78
EBV FCR < .0001 -0.036 ±0.15 -0.057 ±0.15 -0.084 ±0.15 < .0001 0.0377 (5%) 0.838 0.0026
rs319738340
(SELL)
C/C n = 303 C/T n = 120 T/T n = 12
EBV D110 0.366 -8.899 ±5.78 -8.389 ±5.78 -9.142 ±5.86
EBV FCR 0.026 -0.073 ±0.15 -0.049 ±0.15 -0.047 ±0.15 0.852 -0.0019 0.800 0.0048
rs340456509
(NR2E1)
G/G n = 265 T/G n = 156 T/T n = 14
EBV D110 0.033 -9.224 ±5.78 -8.327 ±5.78 -7.631 ±5.84 < .0001 -0.4849 (16%) 0.044 -0.2665 (1%)
EBV FCR < .0001 -0.085 ±0.15 -0.047 ±0.15 -0.021 ±0.15 0.015 -0.0230 (1%) 0.559 -0.0101
rs81508945
(AKR1C3)
C/C n = 6 C/G n = 93 G/G n = 337
EBV D110 0.195 -6.632 ±5.92 -8.561 ±5.79 -8.953 ±5.78
EBV FCR 0.468 -0.043 ±0.15 -0.058 ±0.15 -0.069 ±0.15
Significant associations are in bold;1Additive (a) and dominant (d) effect of an allelic substitution on a phenotype;2 Phenotypic variance in percentage explained by SNP; Where delta was not significant, the alpha was reported from the first regression model.
https://doi.org/10.1371/journal.pone.0173482.t006
GWAS for feed conversion efficiency
PLOS ONE | https://doi.org/10.1371/journal.pone.0173482 June 12, 2017 9 / 15
evaluation of the direct use of EBVs for GWAS revealed issues of power, type I error and QTL
effect sizes related to the incorporation of familial information in the estimation of EBV [16].
To account for these weaknesses linked to EBVs, the familial relationship (i.e. as genomic rela-
tionship matrix) was included in the statistical model as previously applied in other association
analyses using EBVs [24–26]. The comparison of results obtained from different GWAS meth-
ods revealed that the used methodologies provide a further source for variation of results
between different studies [27].
Pathways and biological functions of genes mapped near the significant
SNPs
Functional annotation revealed a number of pathways and biological processes significantly
overrepresented among the positional candidate genes for EBV FCR and D110. Nearby genes
to the significant markers for EBV FCR (SELP, SELL, FGR, SELE, F5, FOXO3 and OPRD1)
were identified to be involved in immune cell trafficking. Similarly, THEMIS2, SELP, SELL,
SELE, F5 and PRKDCwere clustered in lymphoid tissue structure and development category.
It is well documented that the activity of the immune system is linked to feed intake and there-
fore provide a relevant aspect for feed efficiency [28]. When immune response is activated, the
available energy resources are shifted away from skeletal muscle accretion and prioritised to
production of antibodies in order to fight the infection. This in turn might result in reduced
rates of weight gain and feed conversion [29]. In addition, functional annotation of the posi-
tional candidate genes for EBV FCR to biological processes revealed a cluster of seventeen
genes overrepresented in an organ morphology category (CEBPD, SELL, ECEL1,NR2E1, SELE,
CHRNG,WASF1, GPR3, EIF4E2,HTR2B,CHRND, SELP, KIFAP3, SEC63, SYTL1, PRKDC and
FOXO3). A study conducted by Njoku et al. [30] on Large White pigs revealed that visceral
organ growth is stimulated by feed intake. Moreover, low RFI pigs have been associated with
decreased visceral organ weight [31,32]. This is in agreement with Ferrell and Jenkins [33] pos-
tulating that a lower maintenance costs are associated with reduced visceral organ weight and
decreased feed intake. A number of genes (AKR1C3,MBD5,ACVR2A, AKR1C1/AKR1C2and
AKR1C4) located within 1Mb of the significant markers for EBV D110 were clustered in an
endocrine system function and development category. Previous study identified smaller thy-
roid glands in low residual feed intake pigs [34]. Moreover, Gabarrou et al. [35] reported a
decreased thyroid function in low RFI cockerels. Additionally, these genes belonging to Aldo-
Keto Reductase family were significantly overrepresented in lipid metabolism and energy pro-
duction. Lipid metabolism pathway as well as energy pathway were statistically associated with
residual feed intake in muscle and adipose tissue of pigs [36–38].
Candidate genes for feed conversion efficiency
Positional and functional genes located within 1 Mb of the GWAS SNPs significantly associ-
ated with breeding values for FCR/D110 were selected and examined. On SSC 4, SNP
rs80900450 and rs319738340 in PRKDC and SELL respectively, were significantly associated
with breeding value for FCR. PRKDC is a gene encoding the catalytic subunit of the DNA-
dependent protein kinase (DNA-PK), which plays a part in DNA double stranded break repair
[39]. PRKDC is involved in the signalling pathway responsible for the formation of fat from
carbohydrates in the liver [40]. Wong et al. [40] conducted a study, in which they postulated
that during fasting, inactivation of Fatty Acid Synthase (FAS) promoter occurs. However upon
feeding, the FAS promoter becomes activated by PRKDC gene. In PRKDC deficient scid (severe
combined immunodeficient) mice, feeding-induced transcriptional activation of the FAS gene
and lipogenesis were impaired. As a result, reduced triglyceride level and decreased adipose
GWAS for feed conversion efficiency
PLOS ONE | https://doi.org/10.1371/journal.pone.0173482 June 12, 2017 10 / 15
tissue in PRKDC deficient scid mice were observed [40]. L-selectin (SELL) plays a role in lym-
phocyte trafficking to lymph nodes and Peyer’s patches, as well as targeting lymphocytes and
neutrophils to an inflammation source [41]. The SELL encoded protein is a member of selec-
tins belonging to a family of transmembrane glycoproteins and its role is to support adhesion
of blood leucocytes to the vessel wall upon inflammatory and immunological response [42].
Significant reduction of L-selectin, which could affect the neutrophil’s ability to activate and
travel to a source of inflammation, was observed in morbidly obese patients [43]. Yang et al.
[44] proposed that L-selectin is responsible for mediating leukocyte homing to islets which
would suggest it might be associated with autoimmune disease such as diabetes mellitus.
Moreover, T668C SNP in SELL was associated with insulin-dependent diabetes mellitus [45].
Additionally, allele L206 of L-selectin gene was associated with inflammatory bowel disease
[46].
NR2E1 is a member of a ligand dependent transcriptional factors group, which controls a
number of biological and disease related processes. NR2E1 is abundantly expressed in the
brain where it is involved in neurogenesis [47]. Christie et al. [48] and Kumar et al. [49]
reported reduced neurogenesis in adult mice with NR1E1 deletion. Moreover, the NR2E1knockout mice had reduced volume of olfactory bulb [49], a first central structure involved in
processing of the olfactory information [50]. Interestingly, in the present study rs340456509
SNP in the NR1E2was significantly associated with breeding values for FCR and D110. Olfac-
tory bulb plays an important part in regulating food intake as it is targeted by signals responsi-
ble for the regulation of energy balance [50], therefore it is hugely relevant for feed conversion
efficiency.
AKR1C3 belongs to a large aldo and keto reductase enzyme family and is expressed in a
wide variety of tissues including liver and adipose tissue. The protein encoded by this gene
plays a role in conversion of active androgens, oestrogens and prostaglandins to their non-
active metabolites [51]. AKR1C3 has been associated with androgen inactivation induced
adiposity, where large adipocytes had higher expression level compared to small adipocytes
[52,53]. This finding was supported by a study conducted on obese patients having decreased
AKR1C3 expression upon diet induced weight loss [52]. Svensson et al. [52] also postulated
that there might be a link between the AKR1C3 gene and glucose intolerance. Moreover,
White et al. [51] found an association between rs2211623 SNP and liver inflammation, which
in turn might be related to insulin resistance. Nevertheless, in this study the selected SNP
rs81508945 SNP in the AKR1C3was not found significantly associated with the breeding val-
ues for FCR or D110.
MBD5 is a member of the methyl-CpG-binding domain (MBD) family of proteins. It is
highly expressed in neurons [54] and is involved in mediating DNA methylation [55]. MBD5
also plays an essential role in the regulation of postnatal growth and glucose homeostasis [56].
A study conducted onMBD5 knockout mice revealed severe growth retardation and persistent
hypoglycemia, hypoinsulinemia, enhanced glucose intolerance and elevated insulin sensitivity.
Moreover, mice lacking theMBD5 gene exhibited significantly smaller body size and reduction
of subcutaneous and perigonadal fat [56]. Nevertheless, in this study the selected SNP
rs332368013 in theMBD5was out of HWE. The protein encoded by OPRD1, a member of the
opioid family of G-protein-coupled receptor, is broadly distributed in a number of brain areas
involved in the regulation of energy homeostasis [57]. In particular, OPRD1 is highly expressed
in olfactory bulb and anterior olfactory nucleus [58]. OPRD1 knockout mice fed with high
energy diet were found to be resistant to weight gain and had lower fat mass. They also exhib-
ited higher energy expenditure due to increased thermogenic activity in the brown adipose tis-
sue [57]. Additionally, a number of SNPs within the OPRD1 gene were significantly associated
with anorexia nervosa [59,60]. Although it would be interesting to examine the role of OPRD1
GWAS for feed conversion efficiency
PLOS ONE | https://doi.org/10.1371/journal.pone.0173482 June 12, 2017 11 / 15
for feed efficiency and growth, the minor allele frequency of the identified novel SNP within
this gene was lower than 5 percent and thus it was excluded from the further analysis.
Conclusions
In summary, the present study demonstrated a number of chromosomal regions significantly
associated with feed conversion efficiency and growth rate in the examined terminal pig sire
line. Most of the regions were described for the first time, although some of them were located
not far from previously reported QTLs. Validation of putative candidate genes from GWAS
mapping near the significant SNPs confirmed a number of genes significantly associated with
feed conversion efficiency and its related trait, days to 110 kg. Feed efficiency is a highly com-
plex trait affected by a number of factors. This study suggests that the genetic predisposition of
analysed traits is driven by lipogenesis, olfactory reception, and also immunological status. In
depth characterisation of these genes to determine their molecular architecture and identify
the causative mutations would be of benefit. Moreover, it would be useful to validate these
SNPs in other commercial pig population regarding their effects on feed conversion efficiency
and growth rate.
Supporting information
S1 Table. Chromosomal position and minor allele frequency (MAF) of markers signifi-
cantly (-log10[p-value]� 4.7) associated with breeding value of days to 110 kg (BV_D11)
and breeding value of feed conversion ratio (BV_FCR) in a commercial pig population
(n = 940).
(PDF)
Author Contributions
Conceptualization: KW.
Data curation: JH PV RH HR.
Formal analysis: JH PV RH HR.
Funding acquisition: KW PV RH.
Investigation: JH RH HR PV KW.
Methodology: RH PV KW.
Project administration: HR RH KW.
Resources: RH PV KW.
Supervision: HR KW.
Validation: RH HR KW.
Visualization: JH HR.
Writing – original draft: JH HR.
Writing – review & editing: JH RH HR KW.
GWAS for feed conversion efficiency
PLOS ONE | https://doi.org/10.1371/journal.pone.0173482 June 12, 2017 12 / 15
References1. Patience JF, Rossoni-Serao MC, Gutierrez NA (2015) A review of feed efficiency in swine: biology and
application. Journal of Animal Science and Biotechnology 6.
2. Saintilan R, Merour I, Brossard L, Tribout T, Dourmad JY, Sellier P, et al. (2013) Genetics of residual
feed intake in growing pigs: Relationships with production traits, and nitrogen and phosphorus excretion
traits. Journal of Animal Science 91: 2542–2554. https://doi.org/10.2527/jas.2012-5687 PMID:
23482579
3. Wilkinson JM (2011) Re-defining efficiency of feed use by livestock. Animal 5: 1014–1022. https://doi.
org/10.1017/S175173111100005X PMID: 22440097
4. de Oliveira PSN, Cesar ASM, do Nascimento ML, Chaves AS, Tizioto PC, Tullio RR, et al. (2014) Identi-
fication of genomic regions associated with feed efficiency in Nelore cattle. Bmc Genetics 15.
5. Do DN, Strathe AB, Jensen J, Mark T, Kadarmideen HN (2013) Genetic parameters for different mea-
sures of feed efficiency and related traits in boars of three pig breeds. Journal of Animal Science 91:
4069–4079. https://doi.org/10.2527/jas.2012-6197 PMID: 23825329
6. Sahana G, Kadlecova V, Hornshoj H, Nielsen B, Christensen OF (2013) A genome-wide association
scan in pig identifies novel regions associated with feed efficiency trait. Journal of Animal Science 91:
1041–1050. https://doi.org/10.2527/jas.2012-5643 PMID: 23296815
7. Luo WZ, Cheng DX, Chen SK, Wang LG, Li Y, Ma XJ, et al. (2012) Genome-Wide Association Analysis
of Meat Quality Traits in a Porcine Large White x Minzhu Intercross Population. International Journal of
Biological Sciences 8: 580–595. https://doi.org/10.7150/ijbs.3614 PMID: 22532790
8. Jiao S, Maltecca C, Gray KA, Cassady JP (2014) Feed intake, average daily gain, feed efficiency, and
real-time ultrasound traits in Duroc pigs: II. Genomewide association. Journal of Animal Science 92:
2846–2860. https://doi.org/10.2527/jas.2014-7337 PMID: 24962532
9. Onteru SK, Gorbach DM, Young JM, Garrick DJ, Dekkers JCM, Rothschild MF (2013) Whole Genome
Association Studies of Residual Feed Intake and Related Traits in the Pig. Plos One 8.
10. Do DN, Strathe AB, Ostersen T, Pant SD, Kadarmideen HN (2014) Genome-wide association and path-
way analysis of feed efficiency in pigs reveal candidate genes and pathways for residual feed intake.
Frontiers in Genetics 5.
11. Do DN, Ostersen T, Strathe AB, Mark T, Jensen J, Kadarmideen HN (2014) Genome-wide association
and systems genetic analyses of residual feed intake, daily feed consumption, backfat and weight gain
in pigs. Bmc Genetics 15.
12. Varley PF, Sweeney T, Ryan MT, O’Doherty JV (2011) The effect of phosphorus restriction during the
weaner-grower phase on compensatory growth, serum osteocalcin and bone mineralization in gilts.
Livestock Science 135: 282–288.
13. Henderson CR (1975) Best linear unbiased estimation and prediction under a selection model. Bio-
metrics 31: 423–447. PMID: 1174616
14. Cox DG, Kraft P (2006) Quantification of the power of Hardy-Weinberg equilibrium testing to detect gen-
otyping error. Human Heredity 61: 10–14. https://doi.org/10.1159/000091787 PMID: 16514241
15. Yu JM, Pressoir G, Briggs WH, Bi IV, Yamasaki M, Doebley JF, et al. (2006) A unified mixed-model
method for association mapping that accounts for multiple levels of relatedness. Nature Genetics 38:
203–208. https://doi.org/10.1038/ng1702 PMID: 16380716
16. Ekine CC, Rowe SJ, Bishop SC, de Koning DJ (2014) Why breeding values estimated using familial
data should not be used for genome-wide association studies. G3 (Bethesda) 4: 341–347.
17. Barrett JC, Fry B, Maller J, Daly MJ (2005) Haploview: analysis and visualization of LD and haplotype
maps. Bioinformatics 21: 263–265. https://doi.org/10.1093/bioinformatics/bth457 PMID: 15297300
18. Yue G, Stratil A, Kopecny M, Schroffelova D, Schroffel J, Hojny J, et al. (2003) Linkage and QTL map-
ping for Sus scrofa chromosome 6. Journal of Animal Breeding and Genetics 120: 45–55.
19. Munoz G, Ovilo C, Silio L, Tomas A, Noguera JL, Rodriguez MC (2009) Single- and joint- population
analyses of two experimental pig crosses to confirm quantitative trait loci on Sus scrofa chromosome 6
and leptin receptor effects on fatness and growth traits. Journal of Animal Science 87: 459–468. https://
doi.org/10.2527/jas.2008-1127 PMID: 18952727
20. Becker D, Wimmers K, Luther H, Hofer A, Leeb T (2013) A Genome-Wide Association Study to Detect
QTL for Commercially Important Traits in Swiss Large White Boars. Plos One 8.
21. Cepica S, Stratil A, Kopecny M, Blazkova P, Schroffel J, Davoli R, et al. (2003) Linkage and QTL map-
ping for Sus scrofa chromosome 4. Journal of Animal Breeding and Genetics 120: 28–37.
22. Duthie C, Simm G, Doeschl-Wilson A, Kalm E, Knap PW, Roehe R (2008) Quantitative trait loci for
chemical body composition traits in pigs and their positional associations with body tissues, growth and
GWAS for feed conversion efficiency
PLOS ONE | https://doi.org/10.1371/journal.pone.0173482 June 12, 2017 13 / 15
feed intake. Animal Genetics 39: 130–140. https://doi.org/10.1111/j.1365-2052.2007.01689.x PMID:
18307580
23. Gregersen VR, Conley LN, Sorensen KK, Guldbrandtsen B, Velander IH, Bendixen C (2012) Genome-
wide association scan and phased haplotype construction for quantitative trait loci affecting boar taint in
three pig breeds. Bmc Genomics 13.
24. Jiang L, Liu X, Yang J, Wang HF, Jiang JC, Liu LL, et al. (2014) Targeted resequencing of GWAS loci
reveals novel genetic variants for milk production traits. Bmc Genomics 15.
25. Bosse M, Megens HJ, Frantz LAF, Madsen O, Larson G, Paudel Y, et al. (2014) Genomic analysis
reveals selection for Asian genes in European pigs following human-mediated introgression. Nature
Communications 5.
26. Jafarikia M, Methot S, Maignel L, Fortin F, Wyss S, Sullivan B, et al. (2015) Association of adiponectin
and adiponectin receptor genes with sow productivity estimated breeding values. Molecular Biology
Reports 42: 1391–1401. https://doi.org/10.1007/s11033-015-3917-3 PMID: 26210991
27. Wang HY, Misztal I, Aguilar I, Legarra A, Fernando RL, Vitezica Z, et al. (2014) Genome-wide associa-
tion mapping including phenotypes from relatives without genotypes in a single-step (ssGWAS) for 6-
week body weight in broiler chickens. Frontiers in Genetics 5.
28. Rakhshandeh A, Dekkers JCM, Kerr BJ, Weber TE, English J, Gabler NK (2012) Effect of immune system
stimulation and divergent selection for residual feed intake on digestive capacity of the small intestine in
growing pigs. Journal of Animal Science 90: 233–235. https://doi.org/10.2527/jas.53976 PMID: 23365340
29. Roberts NE, Almond GW (2003) Infection of growing swine with porcine reproductive and respiratory
syndrome virus and Mycoplasma hyopneumoniae—Effects on growth, serum metabolites, and insulin-
like growth factor-I. Canadian Veterinary Journal-Revue Veterinaire Canadienne 44: 31–37.
30. Njoku CP, Adeyemi OA, Sogunle OM, Aina ABJ (2015) Growth performance, carcass yield and organ
weight of growing pigs fed different levels of feed. Slovak Journal of Animal Science: 16–22.
31. Montagne L, Loisel F, Le Naou T, Gondret F, Gilbert H, Le Gall M (2014) Difference in short-term
responses to a high-fiber diet in pigs divergently selected for residual feed intake. Journal of Animal Sci-
ence 92: 1512–1523. https://doi.org/10.2527/jas.2013-6623 PMID: 24496835
32. Vigors S, Torres S, Kelly AK, O’Shea CJ, Doyle DN, O’Doherty J (2014) Residual feed intake in pigs is
associated with organ weight, nutrient digestibility and intestinal nutrient transporter gene expression.
ADSA-ASAS-CSAS Joint Annual Meeting.
33. Ferrell CL, Jenkins TG (1985) Cow type and the nutritional environment: nutritional aspects. J Anim Sci
61: 725–741. PMID: 4066531
34. Lefaucheur L, Lebret B, Ecolan P, Louveau I, Damon M, Prunier A, et al. (2011) Muscle characteristics
and meat quality traits are affected by divergent selection on residual feed intake in pigs. Journal of Ani-
mal Science 89: 996–1010. https://doi.org/10.2527/jas.2010-3493 PMID: 21148787
35. Gabarrou JF, Geraert PA, Williams J, Ruffier L, Rideau N (2000) Glucose-insulin relationships and thy-
roid status of cockerels selected for high or low residual food consumption. Br J Nutr 83: 645–651.
PMID: 10911773
36. Lkhagvadorj S, Qu L, Cai WG, Couture OP, Barb CR, Hausman GJ, et al. (2010) Gene expression pro-
filing of the short-term adaptive response to acute caloric restriction in liver and adipose tissues of pigs
differing in feed efficiency. American Journal of Physiology-Regulatory Integrative and Comparative
Physiology 298: R494–R507.
37. Gondret F, Vincent A, Houee-Bigot M, Siegel A, Lagarrigue S, Louveau I, et al. (2016) Molecular alter-
ations induced by a high-fat high-fiber diet in porcine adipose tissues: variations according to the ana-
tomical fat location. Bmc Genomics 17.
38. Vincent A, Louveau I, Gondret F, Trefeu C, Gilbert H, Lefaucheur L (2015) Divergent selection for resid-
ual feed intake affects the transcriptomic and proteomic profiles of pig skeletal muscle. Journal of Ani-
mal Science 93: 2745–2758. https://doi.org/10.2527/jas.2015-8928 PMID: 26115262
39. Yu YJ, Okayasu R, Weil MM, Silver A, McCarthy M, Zabriskie R, et al. (2001) Elevated breast cancer
risk in irradiated BALB/c mice associates with unique functional polymorphism of the Prkdc (DNA-
dependent protein kinase catalytic subunit) gene. Cancer Research 61: 1820–1824. PMID: 11280730
40. Wong RHF, Chang I, Hudak CSS, Hyun S, Kwan HY, Sul HS (2009) A Role of DNA-PK for the Meta-
bolic Gene Regulation in Response to Insulin. Cell 136: 1056–1072. https://doi.org/10.1016/j.cell.2008.
12.040 PMID: 19303849
41. Raffler NA, Rivera-Nieves J, Ley K (2005) L-selectin in inflammation, infection and immunity. Drug Dis-
covery Today: Therapeutic Strategies 2: 213–220.
42. Nelson RM, Aruffo A, Dolich S, Cecconi O, Mannori G, Bevilacqua MP (1992) Quantitative-determina-
tion of selectin-carbohydrate interactions. Cold Spring Harbor Symposia on Quantitative Biology 57:
271–279. PMID: 1285052
GWAS for feed conversion efficiency
PLOS ONE | https://doi.org/10.1371/journal.pone.0173482 June 12, 2017 14 / 15
43. Cottam DR, Schaefer PA, Fahmy D, Shaftan GW, Angus LDG (2002) The effect of obesity on neutrophil
Fc receptors and adhesion molecules (CD16, CD11b, CD62L). Obesity Surgery 12: 230–235. https://
doi.org/10.1381/096089202762552674 PMID: 11975218
44. Yang XD, Karin N, Tisch R, Steinman L, McDevitt HO (1993) Inhibition of insulitis and prevention of dia-
betes in nonobese diabetic mice by blocking l-selectin and very late antigen-4 adhesion receptors. Pro-
ceedings of the National Academy of Sciences of the United States of America 90: 10494–10498.
PMID: 7504266
45. Kretowski A, Kinalska I (2000) L-selectin gene T668C mutation in type 1 diabetes patients and their first
degree relatives. Immunology Letters 74: 225–228. PMID: 11064106
46. Khazen D, Jendoubi-Ayed S, Aleya WB, Sfar I, Mouelhi L, Matri S, et al. (2009) Polymorphism in ICAM-
1, PECAM-1, E-selectin, and L-selectin genes in Tunisian patients with inflammatory bowel disease.
European Journal of Gastroenterology & Hepatology 21: 167–175.
47. Benod C, Villagomez R, Filgueira CS, Hwang PK, Leonard PG, Poncet-Montange G, et al. (2014) The
Human Orphan Nuclear Receptor Tailless (TLX, NR2E1) Is Druggable. Plos One 9.
48. Christie BR, Li MA, Redila VA, Booth H, Wong BKY, Eadie BD, et al. (2006) Deletion of the nuclear
receptor Nr2e1 impairs synaptic plasticity and dendritic structure in the mouse dentate gyrus. Neurosci-
ence 137: 1031–1037. https://doi.org/10.1016/j.neuroscience.2005.08.091 PMID: 16289828
49. Kumar RA, McGhee KA, Leach S, Bonaguro R, Maclean A, Aguirre-Hernandez R, et al. (2008) Initial
association of NR2E1 with bipolar disorder and identification of candidate mutations in bipolar disorder,
schizophrenia, and aggression through resequencing. American Journal of Medical Genetics Part B-
Neuropsychiatric Genetics 147B: 880–889.
50. Aime P, Palouzier-Paulignan B, Salem R, Al Koborssy D, Garcia S, Duchamp C, et al. (2014) Modula-
tion of olfactory sensitivity and glucose-sensing by the feeding state in obese Zucker rats. Frontiers in
Behavioral Neuroscience 8.
51. White DL, Liu YH, Tsavachidis S, Tabasi ST, Kuzniarek J, Jiao L, et al. (2014) Sex Hormone Pathway
Gene Polymorphisms Are Associated With Risk of Advanced Hepatitis C-Related Liver Disease in
Males. Gastroenterology 146: S968–S968.
52. Svensson PA, Gabrielsson BG, Jernas M, Gummesson A, Sjoholm K (2008) Regulation of human aldo-
ketoreductase 1c3 (akr1c3) gene expression in the adipose tissue. Cellular & Molecular Biology Letters
13: 599–613.
53. Gonzalez-Muniesa P, Marrades MP, Martinez JA, Moreno-Aliaga MJ (2013) Differential Proinflamma-
tory and Oxidative Stress Response and Vulnerability to Metabolic Syndrome in Habitual High-Fat
Young Male Consumers Putatively Predisposed by Their Genetic Background. International Journal of
Molecular Sciences 14: 17238–17255. https://doi.org/10.3390/ijms140917238 PMID: 23975165
54. Kwon DY, Zhou ZL (2014) Trapping MBD5 to understand 2q23.1 microdeletion syndrome. Embo
Molecular Medicine 6: 993–994. https://doi.org/10.15252/emmm.201404324 PMID: 25001217
55. Walz K, Young JI (2014) The methyl binding domain containing protein MBD5 is a transcriptional regula-
tor responsible for 2q23.1 deletion syndrome. Rare Diseases 2(1):e967151. https://doi.org/10.4161/
2167549X.2014.967151 PMID: 26942102
56. Du YR, Liu B, Guo F, Xu GF, Ding YQ, Liu Y, et al. (2012) The Essential Role of Mbd5 in the Regulation
of Somatic Growth and Glucose Homeostasis in Mice. Plos One 7.
57. Czyzyk TA, Romero-Pico A, Pintar J, McKinzie JH, Tschop MH, Statnick MA, et al. (2012) Mice lacking
delta-opioid receptors resist the development of diet-induced obesity. Faseb Journal 26: 3483–3492.
https://doi.org/10.1096/fj.12-208041 PMID: 22593549
58. Yilmaz Z, Hardaway JA, Bulik CM (2015) Genetics and Epigenetics of Eating Disorders. Adv Genomics
Genet 5: 131–150. https://doi.org/10.2147/AGG.S55776 PMID: 27013903
59. Brown KMO, Bujac SR, Mann ET, Campbell DA, Stubbins MJ, Blundell JE (2007) Further evidence of
association of OPRD1 & HTR1D Polymorphisms with susceptibility to anorexia nervosa. Biological Psy-
chiatry 61: 367–373. https://doi.org/10.1016/j.biopsych.2006.04.007 PMID: 16806108
60. Bergen AW, van den Bree MB, Yeager M, Welch R, Ganjei JK, Haque K, et al. (2003) Candidate genes
for anorexia nervosa in the 1p33-36 linkage region: serotonin 1D and delta opioid receptor loci exhibit
significant association to anorexia nervosa. Mol Psychiatry 8: 397–406. https://doi.org/10.1038/sj.mp.
4001318 PMID: 12740597
GWAS for feed conversion efficiency
PLOS ONE | https://doi.org/10.1371/journal.pone.0173482 June 12, 2017 15 / 15
Related Documents


![PLoS BIOLOGY Unmasking Activation of the Zygotic Genome ...€¦ · PLoS BIOLOGY [11]. However, in none of these organisms have the molecular players actually regulating activation](https://static.cupdf.com/doc/110x72/612544d019f005295903256f/plos-biology-unmasking-activation-of-the-zygotic-genome-plos-biology-11-however.jpg)