Genome Biology 2003, 4:R13 comment reviews reports deposited research interactions information refereed research Research Genome-wide analysis of microsatellite repeats in humans: their abundance and density in specific genomic regions Subbaya Subramanian, Rakesh K Mishra and Lalji Singh Address: Centre for Cellular and Molecular Biology, Uppal Road, Hyderabad 500 007, India. Correspondence: Lalji Singh. E-mail: [email protected] Abstract Background: Simple sequence repeats (SSRs) are found in most organisms, and occupy about 3% of the human genome. Although it is becoming clear that such repeats are important in genomic organization and function and may be associated with disease conditions, their systematic analysis has not been reported. This is the first report examining the distribution and density of simple sequence repeats (1-6 base-pairs (bp)) in the entire human genome. Results: The densities of SSRs across the human chromosomes were found to be relatively uniform. However, the overall density of SSR was found to be high in chromosome 19. Triplets and hexamers were more predominant in exonic regions compared to intronic and intergenic regions, except for chromosome Y. Comparison of densities of various SSRs revealed that whereas trimers and pentamers showed a similar pattern (500-1,000 bp/Mb) across the chromosomes, di- tetra- and hexa-nucleotide repeats showed patterns of higher (2,000-3,000 bp/Mb) density. Repeats of the same nucleotide were found to be higher than other repeat types. Repeats of A, AT, AC, AAT, AAC, AAG, AGC, AAAC, AAAT, AAAG, AAGG, AGAT predominate, whereas repeats of C, CG, ACT, ACG, AACC, AACG, AACT, AAGC, AAGT, ACCC, ACCG, ACCT, CCCG and CCGG are rare. Conclusions: The overall SSR density was comparable in all chromosomes. The density of different repeats, however, showed significant variation. Tri- and hexa-nucleotide repeats are more abundant in exons, whereas other repeats are more abundant in non-coding regions. Published: 23 January 2003 Genome Biology 2003, 4:R13 The electronic version of this article is the complete one and can be found online at http://genomebiology.com/2003/4/2/R13 Received: 11 July 2002 Revised: 1 October 2002 Accepted: 11 November 2002 Background Microsatellites or simple sequence repeats (SSRs) are tandemly repeated DNA sequences found in varying abun- dance in most genomes [1,2]. These repeats have been exten- sively used for genetic mapping and population studies [3]. SSRs also provide molecular tools to understand spatial rela- tionships between chromosome segments, which in turn, aid in analyzing temporal relationships between species and genera [4]. On the evolutionary timescale SSRs are dynamic, as they undergo replication slippage, a mutation event that aids in their expansion or contraction. It is also suggested that SSRs undergo a life cycle - they are born, they grow and finally they die. The entire life cycle of an SSR may span tens or even hundreds of millions of years [5,6]. A growing number of neurological disorders are found to be the conse- quence of the expansion of a particular class of repeats, the trinucleotide repeats [7-9]. In humans about 3% of the genome is occupied by SSRs [10]. Open Access © 2003 Subramanian et al.; licensee BioMed Central Ltd. This is an Open Access article: verbatim copying and redistribution of this article are permitted in all media for any purpose, provided this notice is preserved along with the article's original URL.

Welcome message from author
This document is posted to help you gain knowledge. Please leave a comment to let me know what you think about it! Share it to your friends and learn new things together.
Transcript

Genome Biology 2003, 4:R13
com
ment
reviews
reports
deposited research
interactions
inform
ation
refereed research
ResearchGenome-wide analysis of microsatellite repeats in humans: theirabundance and density in specific genomic regions Subbaya Subramanian, Rakesh K Mishra and Lalji Singh
Address: Centre for Cellular and Molecular Biology, Uppal Road, Hyderabad 500 007, India.
Correspondence: Lalji Singh. E-mail: [email protected]
Abstract
Background: Simple sequence repeats (SSRs) are found in most organisms, and occupy about3% of the human genome. Although it is becoming clear that such repeats are important ingenomic organization and function and may be associated with disease conditions, theirsystematic analysis has not been reported. This is the first report examining the distribution anddensity of simple sequence repeats (1-6 base-pairs (bp)) in the entire human genome.
Results: The densities of SSRs across the human chromosomes were found to be relativelyuniform. However, the overall density of SSR was found to be high in chromosome 19. Triplets andhexamers were more predominant in exonic regions compared to intronic and intergenic regions,except for chromosome Y. Comparison of densities of various SSRs revealed that whereas trimersand pentamers showed a similar pattern (500-1,000 bp/Mb) across the chromosomes, di- tetra- andhexa-nucleotide repeats showed patterns of higher (2,000-3,000 bp/Mb) density. Repeats of thesame nucleotide were found to be higher than other repeat types. Repeats of A, AT, AC, AAT,AAC, AAG, AGC, AAAC, AAAT, AAAG, AAGG, AGAT predominate, whereas repeats of C,CG, ACT, ACG, AACC, AACG, AACT, AAGC, AAGT, ACCC, ACCG, ACCT, CCCG andCCGG are rare.
Conclusions: The overall SSR density was comparable in all chromosomes. The density ofdifferent repeats, however, showed significant variation. Tri- and hexa-nucleotide repeats aremore abundant in exons, whereas other repeats are more abundant in non-coding regions.
Published: 23 January 2003
Genome Biology 2003, 4:R13
The electronic version of this article is the complete one and can befound online at http://genomebiology.com/2003/4/2/R13
Received: 11 July 2002Revised: 1 October 2002Accepted: 11 November 2002
Background Microsatellites or simple sequence repeats (SSRs) are
tandemly repeated DNA sequences found in varying abun-
dance in most genomes [1,2]. These repeats have been exten-
sively used for genetic mapping and population studies [3].
SSRs also provide molecular tools to understand spatial rela-
tionships between chromosome segments, which in turn, aid
in analyzing temporal relationships between species and
genera [4]. On the evolutionary timescale SSRs are dynamic,
as they undergo replication slippage, a mutation event that
aids in their expansion or contraction. It is also suggested
that SSRs undergo a life cycle - they are born, they grow and
finally they die. The entire life cycle of an SSR may span tens
or even hundreds of millions of years [5,6]. A growing
number of neurological disorders are found to be the conse-
quence of the expansion of a particular class of repeats, the
trinucleotide repeats [7-9]. In humans about 3% of the
genome is occupied by SSRs [10].
Open Access
© 2003 Subramanian et al.; licensee BioMed Central Ltd. This is an Open Access article: verbatim copying and redistribution of this article are permitted inall media for any purpose, provided this notice is preserved along with the article's original URL.

SSRs are distributed throughout the genome in both coding
and non-coding regions [1]. Certain repeats are preferred
and are often predominant in certain genomic locations.
However, the significance of this observation is unclear.
Triplets predominate in coding regions [11]. The study of
repeat density and its distribution pattern in the genome is
expected to help in understanding their significance. There
is accumulating evidence to suggest that SSRs function to
regulate gene expression [12,13].
The availability of complete genome sequences for many
organisms has made it possible to carry out genome-wide
analyses. In the present study we have screened the entire
human genome to study the distribution and density of
microsatellite (1-6 bp) repeats.
Results We have analyzed the distribution of perfect SSRs spanning
12 bp or more in the complete human genome. Thus, for a
12 bp SSR, one occurrence may comprise a repeat of 12
monomers, or six dimers, or four trimers, or three tetramers
(or pentamers) or two hexamers. The SSR data presented
here includes both strands of the DNA sequence. AGAT, for
example, also includes GATA and the reverse complements
TATC and CTAT, and all possible non-overlapping base
combinations. Analyzed sequences were classified into three
genomic regions, namely exons (including untranslated
regions (UTRs)), introns and intergenic regions. For this
analysis, we calculated the total lengths of all mono-, di-,
tri-, tetra-, penta-, and hexa-nucleotide repeats in terms of
base pairs of SSR per megabase pair (Mb) of DNA.
Abundance of SSRs in the human genome We have determined the total number of loci for all the SSRs
in the human genome on a chromosome-by chromosome
basis, and then calculated the number of repeat units at each
locus. As expected, the total number of occurrences of SSRs
depends on the size of the chromosome. For example, chro-
mosome 1 has the highest and Y the lowest SSR occurrence.
We then analyzed density of each repeat as mentioned in
Materials and methods. We show that the overall SSR
density is comparable across chromosomes (Figure 1).
However, some chromosomes, such as 16, 17, 19 and 22,
showed a slight increase in SSR density. The highest SSR
density was found in chromosome 19 (20,351 bp/Mb) fol-
lowed by 17 (17,385 bp/Mb) and 22 (16,147 bp/Mb). It is
interesting to note that the Y chromosome, although
R13.2 Genome Biology 2003, Volume 4, Issue 2, Article R13 Subramanian et al. http://genomebiology.com/2003/4/2/R13
Genome Biology 2003, 4:R13
Figure 1 Overall SSR density across the human chromosome set. The density is expressed in base-pairs of SSR sequence per megabase-pairs of chromosomesequence.
1 2 3 4 5 6 7 8 9 10 11 12 13 14 15 16 17 18 19 20 21 22 X YChromosome
01,0002,0003,0004,0005,0006,0007,0008,0009,000
10,00011,00012,00013,00014,000
SS
R d
ensi
ty (
bp/M
b)
15,00016,00017,00018,00019,00020,00021,000

showing the smallest number of SSRs, has an SSR density
comparable to other autosomes and the X chromosome
(Figure 1).
We have carried out a comprehensive analysis of each SSR
found in the human genome, which is available as additional
data available with the online version of this paper (see addi-
tional data files). For a given repeat, the number of repeats
and total length of the repeated sequence are given, along
with the starting position of the repeat with respect to both
the contig id and the specific GenBank accession id. If the
repeat is found in a gene, the name of the gene and the
com
ment
reviews
reports
deposited research
interactions
inform
ation
refereed research
http://genomebiology.com/2003/4/2/R13 Genome Biology 2003, Volume 4, Issue 2, Article R13 Subramanian et al. R13.3
Genome Biology 2003, 4:R13
Figure 2 SSR density in exonic, intronic and intergenic regions on individual human chromosomes. (a) Monomers (b) dimers; (c) trimers; (d) tetramers;(e) pentamers; (f) hexamers. Blue bars, exons; red bars, introns; yellow bars, intergenic regions.
1 2 3 4 5 6 7 8 9 10111213141516171819202122 X Y1 2 3 4 5 6 7 8 9 10111213141516171819202122 X Y
1 2 3 4 5 6 7 8 9 10111213141516171819202122 X Y1 2 3 4 5 6 7 8 9 10111213141516171819202122 X Y
1 2 3 4 5 6 7 8 9 10111213141516171819202122 X Y
Monomers
Trimers
Pentamers Hexamers
Tetramers
Dimers
1 2 3 4 5 6 7 8 9 10111213141516171819202122 X YChromosome
Chromosome
Chromosome
Chromosome
Chromosome
Chromosome
0500
1,0001,5002,0002,5003,0003,5004,0004,5005,0005,5006,0006,5007,0007,5008,0008,500
SS
R d
ensi
ty (
bp/M
b)
SS
R d
ensi
ty (
bp/M
b)
SS
R d
ensi
ty (
bp/M
b)
SS
R d
ensi
ty (
bp/M
b)
SS
R d
ensi
ty (
bp/M
b)
SS
R d
ensi
ty (
bp/M
b)
0250500750
1,0001,2501,5001,7502,0002,2502,5002,7503,0003,2503,500
0
200
400
600
800
1,000
1,200
1,400
1,600
1,800
2,000
0
500
1,000
1,500
2,000
2,500
3,000
3,500
4,000
4,500
0
200
400
600
800
1,000
1,200
1,400
1,600
0
500
1,000
1,500
2,000
2,500
3,000
3,500
4,000
4,500
5,000
5,500
6,000
(a) (b)
(c) (d)
(e) (f)

respective regions are shown. In the event that a repeat lies
in an intergenic region, the nearest downstream gene and
the distance between the repeat and the gene is given. We
have also presented the association of SSRs with sequence-
tagged sites (STS) in terms of distance between the SSR and
the known STS marker. The details of each repeat type are
included in the additional data files.
Mononucleotide repeats All human chromosomes showed a more-or-less similar
density of monomer repeats (Figure 2a). Compared to other
chromosomes, exonic regions of chromosomes 7 and 16
showed maximum density - 6,063 bp/Mb and 5,928 bp/Mb,
respectively - while the exonic region of Y showed the lowest
(786 bp/Mb) density of monomer repeats. With the excep-
tion of chromosome 19, monomer repeat density in the non-
coding region was comparable in all other chromosomes.
Interestingly, however, the intronic density was slightly but
consistently higher than that of intergenic regions of all
chromosomes (Figure 2a). Chromosome 19 showed the
highest overall monomer density. Among the two types of
monomer repeats, poly(A) (or poly(T)) was far more abun-
dant than poly(C) (or G) in all chromosomes (Figure 3).
Chromosome 19 had the maximum repeat density of A (or T)
(7,429 bp/Mb) followed by chromosomes 17, 22 and 16.
Chromosome 16 contained the maximum density (96 bp/Mb)
of C (or G0 repeats (Figure 3).
Dinucleotide repeats Analysis of the repeats AC, AG, AT and CG showed two inter-
esting features: first, exonic regions showed lower overall
density of these repeats compared to non-coding regions,
and, second, within the non-coding region, as in the case of
monomer repeats, introns had a higher dimer repeat density
than the intergenic region (Figure 2b). The densities of
dimer repeats in both intronic and intergenic regions were
comparable and more-or-less uniform across the chromo-
somes. Among the dimer repeats, AC and AT were predomi-
nant, whereas CG repeats were rarest (Figure 4). The density
of AT repeats showed the greatest variation from one chro-
mosome to another. For instance, chromosomes 3, 4, 11, 12,
13, X and Y had an AT density comparable to that of AC,
whereas in all other chromosomes it was found to be much
less than AC. The density of AG repeats was remarkably
uniform across all chromosomes except for 19 and X, which
had marginally greater numbers of this repeat. For details of
individual dimer repeats in exonic, intronic and intergenic
regions, see additional data files.
R13.4 Genome Biology 2003, Volume 4, Issue 2, Article R13 Subramanian et al. http://genomebiology.com/2003/4/2/R13
Genome Biology 2003, 4:R13
Figure 3Density of each monomer repeat across the entire human chromosome set. A, blue; C, red.
1 2 3 4 5 6 7 8 9 10 11 12 13 14 15 16 17 18 19 20 21 22 X YChromosome
SS
R d
ensi
ty (
bp/M
b)
0
500
1,000
1,500
2,000
2,500
3,000
3,500
4,000
4,500
5,000
5,500
6,000
6,500
7,000
7,500
8,000

Trinucleotide repeats Analysis of all trimer repeats (AAC, AAG, AAT, ACC, ACG,
ACT, AGC, AGG, ATC, CCG) revealed a clear greater density
of approximately twofold in exonic regions compared to the
density in intronic and intergenic regions in all chromo-
somes except Y (Figure 2c). Whereas densities of trimers in
non-coding regions of all chromosomes were comparable,
chromosome 19 showed the maximum density in non-coding
regions. Analysis of densities of different trimers revealed
that repeats of AAT, AAC, AAG and AGG were most
common, in that order of abundance (Figure 5). ACG, ACT
and CCG repeats were found to be much rarer in the
genome. Density of the specific repeat type was found to be
rather uniform across all chromosomes. There were very few
deviations from this pattern; for example, chromosome 19
showed a density of the AAT repeat (446 bp/Mb) which is
much higher than that of other chromosomes. For details of
individual trimer repeats in exons, introns and intergenic
regions see additional data files.
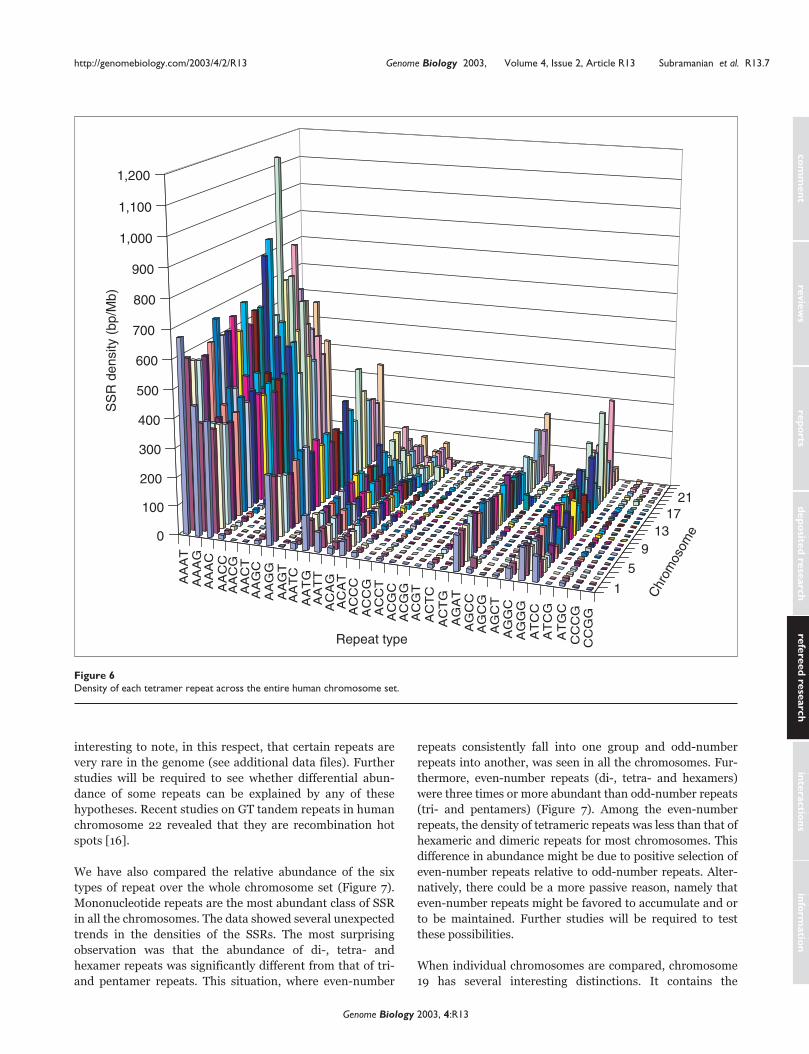
Tetranucleotide repeats The density of tetramer repeats in exonic regions is less than
in intronic and intergenic regions in most of the chromosomes.
Most human chromosomes showed a similar exonic density
pattern; however, chromosomes 7 and 22 showed a greater
density of these repeats (Figure 2d). Chromosome 19 con-
tained most tetranucleotide repeats in the non-coding
region. Repeat density in the intronic regions of other chro-
mosomes ranged between 2,085 bp/Mb (chromosome 5) to
3,172 bp/Mb (chromosome 22). Analysis of densities of each
tetrameric repeat type revealed that AAAT, AAAG, AAAC
and AAGG were the predominant types across the genome.
The overall densities of tetrameric repeats such as AACC,
AACT, AACG, AAGC, AAGT, AATC, ACCC, ACCG, ACCT,
ACGC, ACGG, ACGT, AGCC, AGCG, AGCT, ATCG, ATGC,
CCGG and CCCG were less. AGAT repeats, however, pre-
dominated on the Y chromosome (Figure 6). Details of indi-
vidual tetramer repeats in exons, introns and intergenic
regions are given in the additional data files.
Pentanucleotide repeats In chromosomes 4, 7, 13 and 14, pentamer repeat density in
the exonic regions was greater compared to that in the non-
coding regions. Chromosome 7 contained the maximum
exonic repeat density (921 bp/Mb). The exonic density of
pentamers ranged between 362 bp/Mb in the Y chromosome
com
ment
reviews
reports
deposited research
interactions
inform
ation
refereed research
http://genomebiology.com/2003/4/2/R13 Genome Biology 2003, Volume 4, Issue 2, Article R13 Subramanian et al. R13.5
Genome Biology 2003, 4:R13
Figure 4Density of each dimer repeat across the entire human chromosome set. AC, blue; AG, red; AT, yellow; CG, turquoise.
1 2 3 4 5 6 7 8 9 10 11 12 13 14 15 16 17 18 19 20 21 22 X YChromosome
SS
R d
ensi
ty (
bp/M
b)
0
200
400
600
800
1,000
1,200
1,400

to 885 bp/Mb in chromosome 15. The intergenic densities
were greater in chromosome 3, 10, 16, 17, 19 and Y
(Figure 2e). An outstanding feature of pentameric repeats
was noticed in the case of chromosome 19, where the
intronic and intergenic density was about twofold (1,195 and
1,201 bp/Mb respectively) greater than the exonic density
(633 bp/Mb). The abundance of all pentameric repeats,
including the repeat number in each locus, is given in the
additional data files.
Hexanucleotide repeats Like trimer repeats, hexamer repeats are also more abun-
dant in the exoninc region, except in the Y chromosome
(Figure 2f). Surprisingly, however, the density of hexameric
repeats was about two- to threefold more than that of
trimeric repeats in the exons. Chromosomes 7, 16 and 22
showed an increased density of exonic hexamer repeats
when compared to other chromosomes. The exonic repeat
density in other chromosomes, including Y, ranged from
2,176 bp to 4,628 bp/Mb. Most of the chromosomes showed
remarkably uniform hexameric densities in the intronic and
intergenic regions (Figure 2f). The details of densities of all
the hexameric repeat and the repeat lengths of each hexa-
meric repeat in human genome are given in the additional
data files.
Discussion SSRs contribute significantly to the human genome and are
present in an abundance comparable to the coding region.
Very little is known about the biological significance of this
part the genome. Comprehensive analysis of SSRs is likely to
be helpful in understanding their importance. Information
on their abundance, coupled with the distribution patterns
in the coding, as well as non-coding, regions of the genome
may give us some clue to the function of SSRs in gene regula-
tion. For example, allelic variations of HUMTH01, a TCAT
repeat, have been correlated with quantitative and qualita-
tive changes in the binding of ZNF191 protein which, in turn,
significantly influences the expression of quantitative
genetic traits [14]. In our earlier analysis we found that par-
ticular repeats are preferentially associated with sex chro-
mosomes and their frequency of occurrence in various
genomes reflects an evolutionary correlation [15].
In the present study we have analyzed the occurrence and
density of SSRs across the human genome. We present data
on an individual chromosome basis and each chromosomal
dataset has been split into exonic, intronic and intergenic
regions. The overall density of SSRs in each chromosome
was found to be comparable (Figure 1). The data have been
analyzed taking mono-, di-, tri-, tetra-, penta- and hexamers
as the six classes of repeats. Again, the density of each class
of repeat is comparable across various genomic regions
(Figure 2). However, different repeat motifs often show
tremendous variation in density in different genomic
regions, sometimes even in a chromosome-specific manner.
As is evident from Figures 3-6, within one class of repeats
there may be a lot of difference in the abundance of a partic-
ular sequence repeat. In the case of mononucleotide
repeats, for example, the density of poly(A) or poly(T) is
� 300-fold more than that of poly(G) or poly(C). Similarly,
in the case of dimeric repeats, AC and AT are the most
abundant and CG is the least abundant. While some of this
variation can be explained on the basis of the A/T richness
and the relative ease of strand separation compared to C/G
tracts [2], it cannot all be. The AC repeat, for example, is
twice as abundant as the AG repeat in all chromosomes.
Predominant repeats in the various classes are AAT, AAC
and AAG among trimers, AAAT, AAAC, and AAAG in the
case of tetramers, AAAAT and AAAAC in the case of pen-
tamers and AAAAAT, AAAAAC, AAAAAG and AAAAAG
among hexamers. It is possible that during SSR evolution
the poly(A) stretches present in the genome might have
mutated to produce the A-rich repeats. It is also possible
that the abundance of repeats is influenced by their sec-
ondary structures and the effect on DNA replication. If a
repeat sequence is selected during evolution for transcrip-
tional regulation or is a target of a binding protein for one
or more nuclear processes (such as chromatin organization,
DNA replication, transcription, recombination), its abun-
dance and distribution is expected to be controlled. It is
R13.6 Genome Biology 2003, Volume 4, Issue 2, Article R13 Subramanian et al. http://genomebiology.com/2003/4/2/R13
Genome Biology 2003, 4:R13
Figure 5Density of each trimer repeat across the entire human chromosome set.
14
710
1316
1922
0
50
100
150
200
250
300
350
400
450
Repeat type
Chromosom
e
AC
TA
CG
CC
GA
TG
AG
CA
CC
AA
GA
GG
AA
GA
AT
SS
R d
ensi
ty (
bp/M
b)
interesting to note, in this respect, that certain repeats are
very rare in the genome (see additional data files). Further
studies will be required to see whether differential abun-
dance of some repeats can be explained by any of these
hypotheses. Recent studies on GT tandem repeats in human
chromosome 22 revealed that they are recombination hot
spots [16].
We have also compared the relative abundance of the six
types of repeat over the whole chromosome set (Figure 7).
Mononucleotide repeats are the most abundant class of SSR
in all the chromosomes. The data showed several unexpected
trends in the densities of the SSRs. The most surprising
observation was that the abundance of di-, tetra- and
hexamer repeats was significantly different from that of tri-
and pentamer repeats. This situation, where even-number
repeats consistently fall into one group and odd-number
repeats into another, was seen in all the chromosomes. Fur-
thermore, even-number repeats (di-, tetra- and hexamers)
were three times or more abundant than odd-number repeats
(tri- and pentamers) (Figure 7). Among the even-number
repeats, the density of tetrameric repeats was less than that of
hexameric and dimeric repeats for most chromosomes. This
difference in abundance might be due to positive selection of
even-number repeats relative to odd-number repeats. Alter-
natively, there could be a more passive reason, namely that
even-number repeats might be favored to accumulate and or
to be maintained. Further studies will be required to test
these possibilities.
When individual chromosomes are compared, chromosome
19 has several interesting distinctions. It contains the
com
ment
reviews
reports
deposited research
interactions
inform
ation
refereed research
http://genomebiology.com/2003/4/2/R13 Genome Biology 2003, Volume 4, Issue 2, Article R13 Subramanian et al. R13.7
Genome Biology 2003, 4:R13
Figure 6Density of each tetramer repeat across the entire human chromosome set.
1
5
913
1721
Repeat type
SS
R d
ensi
ty (
bp/M
b)
Chr
omos
ome0
100
AA
AT
AA
AG
AA
AC
AA
CC
AA
CG
AA
CT
AA
GC
AA
GG
AA
GT
AA
TC
AA
TG
AA
TT
AC
AG
AC
AT
AC
CC
AC
CG
AC
CT
AC
GC
AC
GG
AC
GT
AC
TC
AC
TG
AG
AT
AG
CC
AG
CG
AG
CT
AG
GC
AG
GG
AT
CC
AT
CG
AT
GC
CC
CG
CC
GG
200
300
400
500
600
700
800
900
1,000
1,100
1,200

highest overall density of repeats, and, whereas exonic
regions are comparable in density, non-coding regions
contain a high abundance of mono-, tetra- and pentamer
repeats (Figures 1, 2). The other chromosome with a distinct
SSR profile is Y. Although the overall abundance of repeats
in Y is comparable to other chromosomes, the exonic region
contains significantly fewer occurrences of all SSRs com-
pared to other chromosomes.
An example of a repeat that is more abundant in Y than in
other chromosomes is one of the pentameric repeats. Penta-
nucleotide repeats have a density of approximately
700 bp/Mb in all chromosomes, with few deviations (of up
to twice this value). When we looked at the individual penta-
meric repeats, however, we came across significantly uneven
occurrences in different chromosomes (see additional data
files). The most striking example is AATGG. The density of
this repeat varies up to 1,000-fold in different chromosomes;
for example, 904 bp/Mb (chromosome 17), 738 bp/Mb
(chromosome Y), 0.44 bp/Mb (chromosome 21) and
0.9 bp/Mb (chromosome X). Distribution of these repeats
within a chromosome may not be uniform. We have shown
previously that in the Yq centromere and in the distal end of
the Yq euchromatic region there are 1,000 copies of this
pentameric repeat [17].
In humans, microsatellites in the form of trinucleotide
repeats can be found in genes that are associated with several
neurological diseases. The association of triplet repeats with
genes provides a basis for identifying genes that may be pre-
disposed to expansion. Expansion of repeats, which is sug-
gested to be a consequence of replication slippage, may also
influence the packaging of the DNA and may have regulatory
implications in some cases. Analysis of triplets has revealed
that these repeats are predominantly present in exons rather
than in introns and intergenic regions. A similar situation has
also been found for the hexameric repeats. If one assumes
that simple repeats are those that occur randomly on the
chromosome irrespective of their genomic location, the
occurrence of SSRs other than repeats of triplets or of other
multiples of three in a coding region will completely impair
the protein function by causing frameshift mutations. Earlier
studies by Toth et al. [1] and Metzgar et al. [18] on tandem
repeats have shown that triplets are predominantly associ-
ated with the coding regions of the genome. In coding
regions, trinucleotide and hexanucleotide repeats are more
frequent than mononucleotide, dinucleotide, tetranucleotide
or pentanucleotide repeats.
The study of SSRs in the human genome [19,20] is just
the first step towards understanding the biology of the
R13.8 Genome Biology 2003, Volume 4, Issue 2, Article R13 Subramanian et al. http://genomebiology.com/2003/4/2/R13
Genome Biology 2003, 4:R13
Figure 7Comparison of densities of SSRs from monomer to hexamer. Dark-blue diamonds, monomers; pink squares, dimers; yellow triangles, trimers; bluecrosses, tetramers; magenta stars, pentamers; brown circles, hexamers.
1 2 3 4 5 6 7 8 9 10 11 12 13 14 15 16 17 18 19 20 21 22 X YChromosome
0
500
1,000
1,500
2,000
2,500
3,000
3,500
4,000
4,500
5,000
5,500
6,000
6,500
SS
R d
ensi
ty (
bp/M
b)
7,000
7,500
8,000
non-coding DNA, which constitutes more than 98% of the
human genome. Similar studies will be needed for other
sequenced genomes to investigate whether SSRs may also
reflect the evolutionary history of different genomes. Several
observations presented here suggest that individual chromo-
somes may be characterized by unique SSR profiles. This is
also supported by the reports of chromosome-specific
repeats or chromosome-specific biding proteins [21]. These
observations may lead us to an understanding of the evolu-
tion and maintenance of chromosomes in general, and of
particular chromosomes, for example the sex chromosomes,
in particular.
The study of SSRs may help us understand numerous
aspects of genome organization and function. With the avail-
ability of several genomic sequences, we have just begun to
get a glimpse of the genomic organization of eukaryotes. We
need to know, for example, why some repeats are abundant
and others extremely rare. Is the abundance and distribution
of such repeats subject to natural selection? What is the
structural and functional basis of the chromosome-specific
differential abundance of particular SSRs? Studies on other
kinds of DNA sequences and repeats will be needed to
understand the evolution, organization and function of
the genome.
Materials and methods The complete human genome sequence downloaded from
the FTP site of GenBank [22] build number 29; 16 May,
2002 has been used to generate SSR data. SSRs of k-mer
repeats, (where k ranges from 1 to 6, that is, monomer to
hexamer repeats) were analyzed. All theoretically possible
501 SSR types [23] were analyzed for their abundance and
density per Mb. The reverse complements of these repeats
were also included in the analysis. We have analyzed the dis-
tribution of perfect repeats of length � 12 bp. The rationale
for choosing the small cutoff value was that the SSRs are
often disrupted by single base substitutions.
A JAVA-based program has been developed and used to scan
the entire genome to find the abundance and distribution of
these repeats in coding and non-coding regions. The occur-
rences of repeats in exons, introns and intergenic region
have been identified from the annotation of the human
genome sequence in the GenBank database. The repeat
density (bp/Mb) on each chromosome was calculated by
dividing the total chromosome length (in Mb) by the number
of base-pairs of sequence contributed by each SSR. In the
case of exonic density, both coding and non-coding exons
(UTRs) were included in the analysis. In the additional data
files we have referred to the 5� UTR (UTR1) as the sequence
present between the transcription start point and the begin-
ning of the start codon of the transcript. The 3� UTR (UTR2)
is the sequence between the stop codon and the last base of
the transcript.
Additional data files The details of each SSR are available as an additional data file
with the online version of this paper and at our website [24].
Acknowledgements The authors are thankful to Vamsi Madhav, Ranjan George, Harish Chan-dran, M.W. Pandit, Satish Kumar and the team at ilabs for their supportand in developing the software for the analysis of SSRs. We also like tothank anonymous referees whose comments have been extremely usefulin presentation of this analysis. Financial support from CSIR and DBT isgratefully acknowledged.
References 1. Toth G, Gaspari Z, Jurka J: Microsatellites in different eukary-
otic genomes: survey and analysis. Genome Res 2000, 10:967-981.
2. Gur-Arie R, Cohen CJ, Eitan Y, Shelef L, Hallerman EM, Kashi Y:Simple sequence repeats in Escherichia coli: abundance, dis-tribution, composition, and polymorphism. Genome Res 2000,10:62-71.
3. Dib C, Faure S, Fizames C, Samson D, Drouot N, Vignal A,Millasseau P, Marc S, Hazan J, Seboun E, Lathrop M, et al.: Acomprehensive genetic map of the human genomebased on 5,264 microsatellites. Nature 1996, 380:149-152.
4. Kashi Y, King D, Soller M: Simple sequence repeats as a sourceof quantitative genetic variation. Trends Genet 1997, 13: 74-78.
5. Messier W, Li SH, Stewart CB: The birth of microsatellites.Nature. 1996, 381:483.
6. Primmer CR, Ellegren H: Patterns of molecular evolution inavian microsatellites. Mol Biol Evol 1998, 15:997-1008.
7. Reddy PS, Housman DE: The complex pathology of trinu-cleotide repeats. Curr Opin Cell Biol 1997, 9:364-372.
8. Sinden RR: Neurodegenerative diseases: origins of instability.Nature 2001, 411:757-758.
9. Cummings CJ, Zoghbi HY: Fourteen and counting: unravelingtrinucleotide repeat diseases. Hum Mol Genet 2000, 9:909-916.
10. International Human Genome Sequencing Consortium: Initialsequencing and analysis of the human genome. Nature 2001409:860-921.
11. Borstnik B, Pumpernik D: Tandem repeats in protein codingregions of primate genes. Genome Res 2002, 12:909-915.
12. Kunzler P, Matsuo K, Schaffner W: Pathological, physiological,and evolutionary aspects of short unstable DNA repeats inthe human genome. Biol Chem Hoppe Seyler 1995, 4:201-211.
13. Moxon ER, Wills C: DNA microsatellites: agents of evolution?Sci Am 1999, 280:94-99.
14. Albanese V, Biguet NF, Kiefer H, Bayard E, Mallet J, Meloni R: Quan-titative effects on gene silencing by allelic variation at atetranucleotide microsatellite. Hum Mol Genet 2001, 10:1785-1792.
15. Subramanian S, Mishra RK, Singh L: Genome-wide analysis of Bkmsequences (GATA repeats): Predominant association withsex chromosomes and potential role in higher order chro-matin organization and function. Bioinformatics 2003, in press.
16. Majewski J, Ott J: GT repeats are associated with recombina-tion on human chromosome 22. Genome Res 2000, 10:1108-1114.
17. Thangaraj K, Subramanian S, Reddy AG, Singh L: A unique case ofdeletion and duplication in the long arm of the Y chromo-some in an individual with ambiguous genitalia. Am J MedGenet 2003, 166:205-207.
18. Metzgar D, Bytof J, Wills C: Selection against frameshift muta-tions limits microsatellite expansion in coding DNA. GenomeRes 2000, 10:72-80.
19. SSRD: Simple sequence repeats database of the humangenome [http://www.ingenovis.com/ssr]
20. Subramanian S, Madgula VM, George R, Mishra R K, Pandit MW,Kumar CS and Singh L: Triplet repeats in human genome: dis-tribution and their association with genes and othergenomic regions. Bioinformatics 2003, in press.
com
ment
reviews
reports
deposited research
interactions
inform
ation
refereed research
http://genomebiology.com/2003/4/2/R13 Genome Biology 2003, Volume 4, Issue 2, Article R13 Subramanian et al. R13.9
Genome Biology 2003, 4:R13
21. Larsson J, Chen JD, Rasheva V, Rasmuson-Lestander A, Pirrotta V:Painting of fourth, a chromosome-specific protein inDrosophila. Proc Natl Acad Sci USA 2001, 98:6273-6278.
22. GenBank: H. sapiens sequence download[ftp://ftp.ncbi.nlm.nih.gov/genomes/h_sapiens]
23. Jurka J, Pethiyagoda C: Simple repetitive DNA sequences fromprimates: compilation and analysis. J Mol Evol 1995, 40:120-126.
24. Detailed view of each repeat [http://www.ingenovis.com/ssrdetails]
R13.10 Genome Biology 2003, Volume 4, Issue 2, Article R13 Subramanian et al. http://genomebiology.com/2003/4/2/R13
Genome Biology 2003, 4:R13
Related Documents