Genome Landscape and Evolutionary Plasticity of Chromosomes in Malaria Mosquitoes Ai Xia 1. , Maria V. Sharakhova 1. , Scotland C. Leman 2 , Zhijian Tu 3 , Jeffrey A. Bailey 4 , Christopher D. Smith 5,6 , Igor V. Sharakhov 1 * 1 Department of Entomology, Virginia Tech, Blacksburg, Virginia, United States of America, 2 Department of Statistics, Virginia Tech, Blacksburg, Virginia, United States of America, 3 Department of Biochemistry, Virginia Tech, Blacksburg, Virginia, United States of America, 4 Program in Bioinformatics and Integrative Biology and Division of Transfusion Medicine, Department of Medicine, University of Massachusetts Medical School, Worcester, Massachusetts, United States of America, 5 Department of Biology, San Francisco State University, San Francisco, California, United States of America, 6 Drosophila Heterochromatin Genome Project, Lawrence Berkeley National Lab, Berkeley, California, United States of America Abstract Background: Nonrandom distribution of rearrangements is a common feature of eukaryotic chromosomes that is not well understood in terms of genome organization and evolution. In the major African malaria vector Anopheles gambiae, polymorphic inversions are highly nonuniformly distributed among five chromosomal arms and are associated with epidemiologically important adaptations. However, it is not clear whether the genomic content of the chromosomal arms is associated with inversion polymorphism and fixation rates. Methodology/Principal Findings: To better understand the evolutionary dynamics of chromosomal inversions, we created a physical map for an Asian malaria mosquito, Anopheles stephensi, and compared it with the genome of An. gambiae. We also developed and deployed novel Bayesian statistical models to analyze genome landscapes in individual chromosomal arms An. gambiae. Here, we demonstrate that, despite the paucity of inversion polymorphisms on the X chromosome, this chromosome has the fastest rate of inversion fixation and the highest density of transposable elements, simple DNA repeats, and GC content. The highly polymorphic and rapidly evolving autosomal 2R arm had overrepresentation of genes involved in cellular response to stress supporting the role of natural selection in maintaining adaptive polymorphic inversions. In addition, the 2R arm had the highest density of regions involved in segmental duplications that clustered in the breakpoint-rich zone of the arm. In contrast, the slower evolving 2L, 3R, and 3L, arms were enriched with matrix- attachment regions that potentially contribute to chromosome stability in the cell nucleus. Conclusions/Significance: These results highlight fundamental differences in evolutionary dynamics of the sex chromosome and autosomes and revealed the strong association between characteristics of the genome landscape and rates of chromosomal evolution. We conclude that a unique combination of various classes of genes and repetitive DNA in each arm, rather than a single type of repetitive element, is likely responsible for arm-specific rates of rearrangements. Citation: Xia A, Sharakhova MV, Leman SC, Tu Z, Bailey JA, et al. (2010) Genome Landscape and Evolutionary Plasticity of Chromosomes in Malaria Mosquitoes. PLoS ONE 5(5): e10592. doi:10.1371/journal.pone.0010592 Editor: William J. Murphy, Texas A&M University, United States of America Received February 23, 2010; Accepted April 14, 2010; Published May 12, 2010 Copyright: ß 2010 Xia et al. This is an open-access article distributed under the terms of the Creative Commons Attribution License, which permits unrestricted use, distribution, and reproduction in any medium, provided the original author and source are credited. Funding: This work was supported by National Institutes of Health grant 1R21AI081023-01 and startup funds from Virginia Tech (to I.V.S) and NIH 5R01HG000747-14 (to C.D.S). The funders had no role in study design, data collection and analysis, decision to publish, or preparation of the manuscript. Competing Interests: The authors have declared that no competing interests exist. * E-mail: [email protected] . These authors contributed equally to this work. Introduction A growing number of studies demonstrate that chromosomal inversions facilitate genetic differentiation during speciation [1,2]. An intriguing observation is that the rates of genome rearrange- ments in many organisms are chromosome sensitive [3,4]. This fact suggests that certain chromosomes have an increased role in adaptation and evolution of species, including insect pests and disease vectors. Among insects, extensive studies of chromosomal evolution have been performed only on Drosophila [5,6,7,8]. Although these studies provided important insights into the rates, patterns, and mechanisms of rearrangements, the evolutionary forces that govern the unequal distribution of rearrangements among chromosomes remain poorly understood. Malaria mosqui- toes are an excellent system for studying the dynamics of chromosomal evolution because inversions are highly nonuni- formly distributed among five chromosomal arms. In species of the Anopheles gambiae complex, 18 of the 31 common polymorphic inversions, associated with ecological adaptations, have been found on arm 2R suggesting the role of positive selection in accumulating inversions on the 2R arm. Only two polymorphic inversions have been found on the X chromosome within the An. gambiae complex [9]. A study of the distribution of 82 rare, mostly neutral, polymorphic inversions in An. gambiae s.s. found no inversions on the X chromosome, 67 inversions on the 2R arm, and only 15 inversions on the 2L, 3R, and 3L arms together [10]. Clustering of chromosomal polymorphism and cytological colo- calization of multiple breakpoints on the 2R arm indicates that this PLoS ONE | www.plosone.org 1 May 2010 | Volume 5 | Issue 5 | e10592

Welcome message from author
This document is posted to help you gain knowledge. Please leave a comment to let me know what you think about it! Share it to your friends and learn new things together.
Transcript
Genome Landscape and Evolutionary Plasticity ofChromosomes in Malaria MosquitoesAi Xia1., Maria V. Sharakhova1., Scotland C. Leman2, Zhijian Tu3, Jeffrey A. Bailey4, Christopher D.
Smith5,6, Igor V. Sharakhov1*
1 Department of Entomology, Virginia Tech, Blacksburg, Virginia, United States of America, 2 Department of Statistics, Virginia Tech, Blacksburg, Virginia, United States of
America, 3 Department of Biochemistry, Virginia Tech, Blacksburg, Virginia, United States of America, 4 Program in Bioinformatics and Integrative Biology and Division of
Transfusion Medicine, Department of Medicine, University of Massachusetts Medical School, Worcester, Massachusetts, United States of America, 5 Department of Biology,
San Francisco State University, San Francisco, California, United States of America, 6 Drosophila Heterochromatin Genome Project, Lawrence Berkeley National Lab,
Berkeley, California, United States of America
Abstract
Background: Nonrandom distribution of rearrangements is a common feature of eukaryotic chromosomes that is not wellunderstood in terms of genome organization and evolution. In the major African malaria vector Anopheles gambiae,polymorphic inversions are highly nonuniformly distributed among five chromosomal arms and are associated withepidemiologically important adaptations. However, it is not clear whether the genomic content of the chromosomal arms isassociated with inversion polymorphism and fixation rates.
Methodology/Principal Findings: To better understand the evolutionary dynamics of chromosomal inversions, we createda physical map for an Asian malaria mosquito, Anopheles stephensi, and compared it with the genome of An. gambiae. Wealso developed and deployed novel Bayesian statistical models to analyze genome landscapes in individual chromosomalarms An. gambiae. Here, we demonstrate that, despite the paucity of inversion polymorphisms on the X chromosome, thischromosome has the fastest rate of inversion fixation and the highest density of transposable elements, simple DNArepeats, and GC content. The highly polymorphic and rapidly evolving autosomal 2R arm had overrepresentation of genesinvolved in cellular response to stress supporting the role of natural selection in maintaining adaptive polymorphicinversions. In addition, the 2R arm had the highest density of regions involved in segmental duplications that clustered inthe breakpoint-rich zone of the arm. In contrast, the slower evolving 2L, 3R, and 3L, arms were enriched with matrix-attachment regions that potentially contribute to chromosome stability in the cell nucleus.
Conclusions/Significance: These results highlight fundamental differences in evolutionary dynamics of the sexchromosome and autosomes and revealed the strong association between characteristics of the genome landscape andrates of chromosomal evolution. We conclude that a unique combination of various classes of genes and repetitive DNA ineach arm, rather than a single type of repetitive element, is likely responsible for arm-specific rates of rearrangements.
Citation: Xia A, Sharakhova MV, Leman SC, Tu Z, Bailey JA, et al. (2010) Genome Landscape and Evolutionary Plasticity of Chromosomes in MalariaMosquitoes. PLoS ONE 5(5): e10592. doi:10.1371/journal.pone.0010592
Editor: William J. Murphy, Texas A&M University, United States of America
Received February 23, 2010; Accepted April 14, 2010; Published May 12, 2010
Copyright: � 2010 Xia et al. This is an open-access article distributed under the terms of the Creative Commons Attribution License, which permits unrestricteduse, distribution, and reproduction in any medium, provided the original author and source are credited.
Funding: This work was supported by National Institutes of Health grant 1R21AI081023-01 and startup funds from Virginia Tech (to I.V.S) and NIH5R01HG000747-14 (to C.D.S). The funders had no role in study design, data collection and analysis, decision to publish, or preparation of the manuscript.
Competing Interests: The authors have declared that no competing interests exist.
* E-mail: [email protected]
. These authors contributed equally to this work.
Introduction
A growing number of studies demonstrate that chromosomal
inversions facilitate genetic differentiation during speciation [1,2].
An intriguing observation is that the rates of genome rearrange-
ments in many organisms are chromosome sensitive [3,4]. This
fact suggests that certain chromosomes have an increased role in
adaptation and evolution of species, including insect pests and
disease vectors. Among insects, extensive studies of chromosomal
evolution have been performed only on Drosophila [5,6,7,8].
Although these studies provided important insights into the rates,
patterns, and mechanisms of rearrangements, the evolutionary
forces that govern the unequal distribution of rearrangements
among chromosomes remain poorly understood. Malaria mosqui-
toes are an excellent system for studying the dynamics of
chromosomal evolution because inversions are highly nonuni-
formly distributed among five chromosomal arms. In species of the
Anopheles gambiae complex, 18 of the 31 common polymorphic
inversions, associated with ecological adaptations, have been
found on arm 2R suggesting the role of positive selection in
accumulating inversions on the 2R arm. Only two polymorphic
inversions have been found on the X chromosome within the An.
gambiae complex [9]. A study of the distribution of 82 rare, mostly
neutral, polymorphic inversions in An. gambiae s.s. found no
inversions on the X chromosome, 67 inversions on the 2R arm,
and only 15 inversions on the 2L, 3R, and 3L arms together [10].
Clustering of chromosomal polymorphism and cytological colo-
calization of multiple breakpoints on the 2R arm indicates that this
PLoS ONE | www.plosone.org 1 May 2010 | Volume 5 | Issue 5 | e10592

arm is especially prone to rearrangements [9,10]. In contrast to the
polymorphic inversions, the majority of fixed inversions (5 of 10)
were found on the X chromosome in the An. gambiae complex
suggesting a role of these inversions in speciation. Although, the
high density of fixed inversions on the sex chromosome was found
within several mosquito species complexes [11], it is unclear
whether the X chromosome rearranges rapidly on a larger
evolutionary scale and whether it is enriched in genes important
for speciation. Previous studies of chromosomal evolution using
physical maps of distant Anopheles species, An. albimanus, An. gambiae,
and An. funestus have demonstrated that paracentric inversions and
whole-arm translocations are the major types of rearrangements
and that the 2R arm has the fastest rate of inversion fixation
among autosomes [12,13]. However, low densities of markers on
the physical maps of the X chromosomes in these studies preclude
us from drawing a definite conclusion about the relative rate of sex
chromosome evolution.
The high rate of rearrangements on the 2R arm could be
explained by 2R-biased distribution of repetitive DNA capable of
generating inversions. However, the transposable element (TE)
density in the An. gambiae genome was found to be lowest on the
2R arm [14]; thus, it is not clear whether the molecular content could
be associated with inversion polymorphism and fixation rates.
Moreover, simple measuring of the TE densities is not a robust
way for discerning differences between arms. Statistically sound
comparisons of molecular features among chromosomal arms can be
performed using Bayesian statistical models and procedures. Also, a
study of other potentially rearrangement-causing elements, such as
simple repeats and segmental duplications (SDs), is yet to be
performed in Anopheles. Nucleotide base composition can also play a
role in genome instability. For example, GC-rich regions have been
implicated in forming fragile hotspot regions for rearrangements
[15,16]. In addition, the nonrandom pattern of genome rearrange-
ments can be governed by the nuclear architecture. Because of the
nonrandom nuclear organization, certain loci may colocalize and
have increased opportunities to interact and generate specific
rearrangements in certain types of tumors in humans [17,18].
Additionally, other interactions may be inhibitory. Matrix-associated
regions (MARs) of DNA can bind directly to lamin—a major protein
of the nuclear envelope—and can potentially increase chromosome
stability in the cell nucleus [19,20].
An. gambiae and An. funestus are the major malaria vectors in
Africa, and An. stephensi is the principal malaria vector in Asia.
Taxonomically, these species belong to different series within the
subgenus Cellia: Pyretophorus (An. gambiae), Myzomyia (An. funestus),
and Neocellia (An. stephensi) [21]. A comparative study of
mitochondrial genomes suggested that An. gambiae and An. funestus
diverged from each other at least 36 million years ago [22].
Interestingly, the common polymorphic inversions tend to cluster
on the chromosomal arm 2R in all three species [9,23,24,25],
suggesting that natural selection has a better chance to operate on
the genetic content of this arm. The common inversions 2Rb,
2Rbc, 2Rcu, 2Ru, 2Rd, and 2La of An. gambiae are frequent in the
arid Sahel Savanna and almost absent in humid equatorial Africa
[9]. It has been argued that these inversions confer adaptive fitness
to the drier environment [10,26]. Therefore, it would be
interesting to see if the 2R and 2L arms are enriched in genes
that could be responsible for this adaptation. A comparison of sizes
between rare and common polymorphic inversions has revealed
that common inversions are less frequent at shorter lengths
[10,27], reflecting a smaller selective advantage when an inversion
captures fewer genes [28]. This model predicts the positive
correlation between gene density and the abundance of common
inversions in a chromosomal arm.
Here, we developed a physical map for an Asian malaria mosquito,
Anopheles stephensi, and compared gene orders among An. gambiae, An.
funestus, and An. stephensi. We present the results of the Bayesian
analysis of the genome landscapes and their association with the
nonrandom distribution of chromosomal rearrangements in malaria
mosquitoes. Our study revealed that the sex chromosome and
autosomes have different patterns of relationships between inversion
fixation and polymorphism. We also demonstrated that the rapidly
and slowly evolving chromosomal arms have very distinct genome
landscapes characterized by distinctly enriched gene subpopulations
and classes of repetitive DNA.
Results
A 1-Mb-resolution physical map for An. stephensiAvailability of the genome sequence for An. gambiae [14] and
physical maps for An. funestus [12,29] and An. stephensi (this work)
enabled a fresh perspective on the relationships between the
genome landscape and evolutionary rates. In this study, we
mapped 231 DNA markers to the An. stephensi chromosomes at a
density of 1 marker/megabase (Mb) based on the mapped An.
gambiae genome assembly [14,30]. Table S1 shows chromosomal
positions of the DNA clones mapped in this study, as well as in
previous studies [12,14,29,31,32]. We performed a test on the
uniformity of marker distribution in An. gambiae, An. stephensi, and
An. funestus using the X2 statistic. The distribution of markers was
shown to be uniform for each arm and each species (Table S2).
Comparative mapping established arm homologies among the
three species; found no evidence for inter-arm transposition events,
pericentric inversions, or partial–arm translocations (Table S1);
and confirmed that whole-arm translocations and paracentric
inversions are common rearrangements among species in the
subgenus Cellia [12,21].
Pattern and rates of inversion fixation in the subgenusCellia
We calculated the minimum number of inversions between An.
gambiae and An. stephensi using the order of mapped markers (Table
S1) and the Genome Rearrangements In Man and Mouse
(GRIMM) program without assuming directionality of the markers
[33]. GRIMM software uses the Hannenhalli and Pevzner
algorithms for computing the minimum number of rearrangement
events and for finding optimal scenarios for transforming one
genome into another. A minimum of 15 rearrangement events are
needed to transform the 24.4-Mb-long X chromosome of one
species into the other. In contrast, only 11 and 7 inversions are
required to transform the 53.2-Mb-long 3R arm and the 42-Mb-
long 3L arm, respectively (Figure 1). The 2R and 2L arms had 29
and 16 fixed inversions, respectively (Figure S1, S2). When
normalized to account for differences in chromosome length, the
X chromosome had the highest density of fixed inversions of any
chromosome (Figure S1, S2, Table 1). The highest level of
inversion fixation on the X chromosome was also found for the
analogous comparison of An. gambiae and An. funestus (Table S3).
We calculated number of breaks per Mb under the assumption
that there is no breakpoint re-use and no inversions at the very
ends of chromosomes (Table 1, Table S3). The rearrangement
scenarios provided by the GRIMM program had breakpoint
reuses and yielded lower number of breaks per Mb (Figure 1, S1,
S2). However, the actual breakpoint reuse cannot be identified at
1Mb density of markers physically mapped to chromosomes.
As another approach to inversion frequency, we also employed
an analysis of conserved syntenic blocks (CSBs), which are defined
as the regions with the same order and distance between at least
Mosquito Chromosome Evolution
PLoS ONE | www.plosone.org 2 May 2010 | Volume 5 | Issue 5 | e10592

two markers (Table S1). In order to provide better estimates of
CSBs, we further developed the Nadeau and Taylor method [34].
Using the adapted Bayesian Nadeau and Taylor analysis, we
found the posterior mean, standard error, 95% credible interval,
and Maximum A Posteriori (MAP) estimate for the mean length of
CSBs (See Methods). These lengths (X, 0.600 Mb; 2R, 1.315 Mb;
2L, 1.712 Mb; 3R, 3.756 Mb; and 3L, 2.412 Mb) (Table S4) were
also used to infer the number of fixed inversions between An.
gambiae and An. stephensi. If each inversion requires two disruption
events, then n inversions result in 2n+1 conserved segments. The
number of CSBs was calculated by dividing the total length of the
arm by the mean length of the CSB (Table 2). Nadeau and Taylor
analysis was not applied to An. gambiae and An. funestus because no
CSBs were detected on the X chromosome. However, the
GRIMM analysis inferred the level of rearrangement between
An. gambiae and An. funestus (Table S3). Given that An. gambiae and
An. funestus diverged from each other at least 36 million years ago
[22], the rate of genome rearrangement in the subgenus Cellia for
1 Mb mapping density is 0.006–0.01 disruptions per 1 Mb per
million years per lineage.
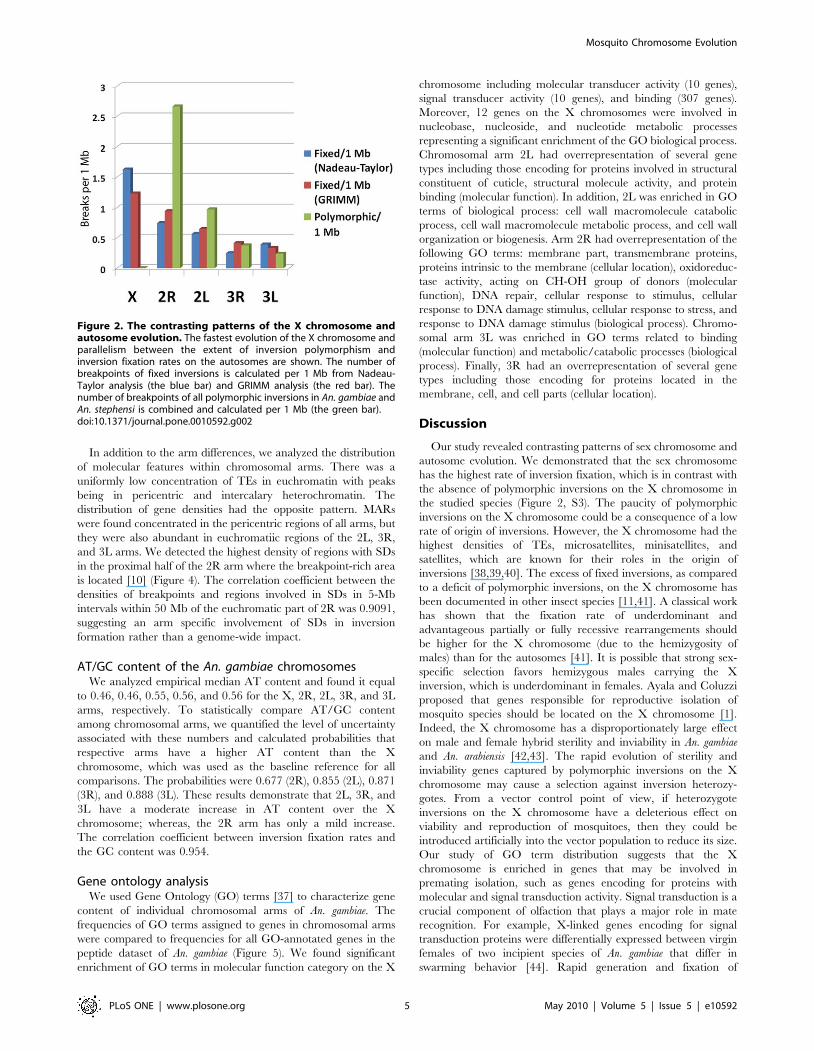
Both Nadeau-Taylor and GRIMM analyses revealed that the X
chromosome had the highest rate of inversion fixation and that the
Figure 1. The GRIMM scenario of gene order transformation between An. gambiae and A. stephensi. Relative position and orientation ofthe conserved syntenic blocks (CSBs) are shown by colored blocks. Numbers within the blocks indicate markers physically mapped to polytenechromosomes. Numbers over brackets show inversion steps. The telomere ends are on the left.doi:10.1371/journal.pone.0010592.g001
Mosquito Chromosome Evolution
PLoS ONE | www.plosone.org 3 May 2010 | Volume 5 | Issue 5 | e10592
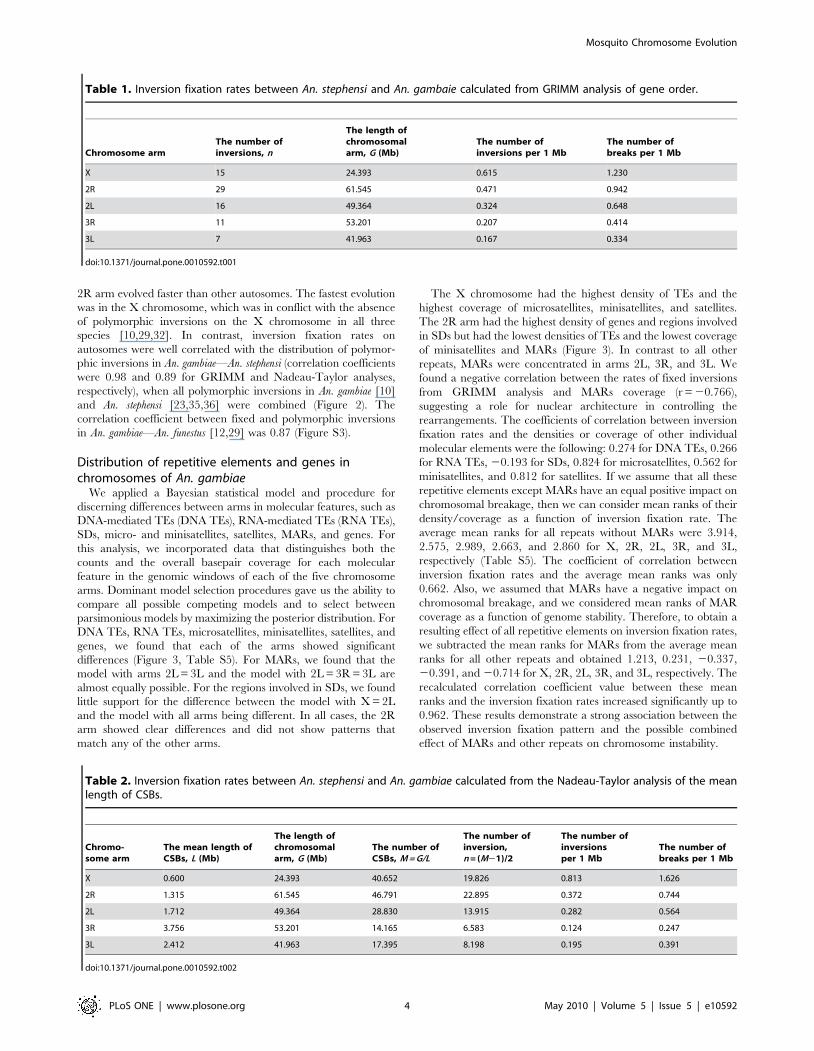
2R arm evolved faster than other autosomes. The fastest evolution
was in the X chromosome, which was in conflict with the absence
of polymorphic inversions on the X chromosome in all three
species [10,29,32]. In contrast, inversion fixation rates on
autosomes were well correlated with the distribution of polymor-
phic inversions in An. gambiae—An. stephensi (correlation coefficients
were 0.98 and 0.89 for GRIMM and Nadeau-Taylor analyses,
respectively), when all polymorphic inversions in An. gambiae [10]
and An. stephensi [23,35,36] were combined (Figure 2). The
correlation coefficient between fixed and polymorphic inversions
in An. gambiae—An. funestus [12,29] was 0.87 (Figure S3).
Distribution of repetitive elements and genes inchromosomes of An. gambiae
We applied a Bayesian statistical model and procedure for
discerning differences between arms in molecular features, such as
DNA-mediated TEs (DNA TEs), RNA-mediated TEs (RNA TEs),
SDs, micro- and minisatellites, satellites, MARs, and genes. For
this analysis, we incorporated data that distinguishes both the
counts and the overall basepair coverage for each molecular
feature in the genomic windows of each of the five chromosome
arms. Dominant model selection procedures gave us the ability to
compare all possible competing models and to select between
parsimonious models by maximizing the posterior distribution. For
DNA TEs, RNA TEs, microsatellites, minisatellites, satellites, and
genes, we found that each of the arms showed significant
differences (Figure 3, Table S5). For MARs, we found that the
model with arms 2L = 3L and the model with 2L = 3R = 3L are
almost equally possible. For the regions involved in SDs, we found
little support for the difference between the model with X = 2L
and the model with all arms being different. In all cases, the 2R
arm showed clear differences and did not show patterns that
match any of the other arms.
The X chromosome had the highest density of TEs and the
highest coverage of microsatellites, minisatellites, and satellites.
The 2R arm had the highest density of genes and regions involved
in SDs but had the lowest densities of TEs and the lowest coverage
of minisatellites and MARs (Figure 3). In contrast to all other
repeats, MARs were concentrated in arms 2L, 3R, and 3L. We
found a negative correlation between the rates of fixed inversions
from GRIMM analysis and MARs coverage (r = 20.766),
suggesting a role for nuclear architecture in controlling the
rearrangements. The coefficients of correlation between inversion
fixation rates and the densities or coverage of other individual
molecular elements were the following: 0.274 for DNA TEs, 0.266
for RNA TEs, 20.193 for SDs, 0.824 for microsatellites, 0.562 for
minisatellites, and 0.812 for satellites. If we assume that all these
repetitive elements except MARs have an equal positive impact on
chromosomal breakage, then we can consider mean ranks of their
density/coverage as a function of inversion fixation rate. The
average mean ranks for all repeats without MARs were 3.914,
2.575, 2.989, 2.663, and 2.860 for X, 2R, 2L, 3R, and 3L,
respectively (Table S5). The coefficient of correlation between
inversion fixation rates and the average mean ranks was only
0.662. Also, we assumed that MARs have a negative impact on
chromosomal breakage, and we considered mean ranks of MAR
coverage as a function of genome stability. Therefore, to obtain a
resulting effect of all repetitive elements on inversion fixation rates,
we subtracted the mean ranks for MARs from the average mean
ranks for all other repeats and obtained 1.213, 0.231, 20.337,
20.391, and 20.714 for X, 2R, 2L, 3R, and 3L, respectively. The
recalculated correlation coefficient value between these mean
ranks and the inversion fixation rates increased significantly up to
0.962. These results demonstrate a strong association between the
observed inversion fixation pattern and the possible combined
effect of MARs and other repeats on chromosome instability.
Table 1. Inversion fixation rates between An. stephensi and An. gambaie calculated from GRIMM analysis of gene order.
Chromosome armThe number ofinversions, n
The length ofchromosomalarm, G (Mb)
The number ofinversions per 1 Mb
The number ofbreaks per 1 Mb
X 15 24.393 0.615 1.230
2R 29 61.545 0.471 0.942
2L 16 49.364 0.324 0.648
3R 11 53.201 0.207 0.414
3L 7 41.963 0.167 0.334
doi:10.1371/journal.pone.0010592.t001
Table 2. Inversion fixation rates between An. stephensi and An. gambiae calculated from the Nadeau-Taylor analysis of the meanlength of CSBs.
Chromo-some arm
The mean length ofCSBs, L (Mb)
The length ofchromosomalarm, G (Mb)
The number ofCSBs, M = G/L
The number ofinversion,n = (M21)/2
The number ofinversionsper 1 Mb
The number ofbreaks per 1 Mb
X 0.600 24.393 40.652 19.826 0.813 1.626
2R 1.315 61.545 46.791 22.895 0.372 0.744
2L 1.712 49.364 28.830 13.915 0.282 0.564
3R 3.756 53.201 14.165 6.583 0.124 0.247
3L 2.412 41.963 17.395 8.198 0.195 0.391
doi:10.1371/journal.pone.0010592.t002
Mosquito Chromosome Evolution
PLoS ONE | www.plosone.org 4 May 2010 | Volume 5 | Issue 5 | e10592
In addition to the arm differences, we analyzed the distribution
of molecular features within chromosomal arms. There was a
uniformly low concentration of TEs in euchromatin with peaks
being in pericentric and intercalary heterochromatin. The
distribution of gene densities had the opposite pattern. MARs
were found concentrated in the pericentric regions of all arms, but
they were also abundant in euchromatiic regions of the 2L, 3R,
and 3L arms. We detected the highest density of regions with SDs
in the proximal half of the 2R arm where the breakpoint-rich area
is located [10] (Figure 4). The correlation coefficient between the
densities of breakpoints and regions involved in SDs in 5-Mb
intervals within 50 Mb of the euchromatic part of 2R was 0.9091,
suggesting an arm specific involvement of SDs in inversion
formation rather than a genome-wide impact.
AT/GC content of the An. gambiae chromosomesWe analyzed empirical median AT content and found it equal
to 0.46, 0.46, 0.55, 0.56, and 0.56 for the X, 2R, 2L, 3R, and 3L
arms, respectively. To statistically compare AT/GC content
among chromosomal arms, we quantified the level of uncertainty
associated with these numbers and calculated probabilities that
respective arms have a higher AT content than the X
chromosome, which was used as the baseline reference for all
comparisons. The probabilities were 0.677 (2R), 0.855 (2L), 0.871
(3R), and 0.888 (3L). These results demonstrate that 2L, 3R, and
3L have a moderate increase in AT content over the X
chromosome; whereas, the 2R arm has only a mild increase.
The correlation coefficient between inversion fixation rates and
the GC content was 0.954.
Gene ontology analysisWe used Gene Ontology (GO) terms [37] to characterize gene
content of individual chromosomal arms of An. gambiae. The
frequencies of GO terms assigned to genes in chromosomal arms
were compared to frequencies for all GO-annotated genes in the
peptide dataset of An. gambiae (Figure 5). We found significant
enrichment of GO terms in molecular function category on the X
chromosome including molecular transducer activity (10 genes),
signal transducer activity (10 genes), and binding (307 genes).
Moreover, 12 genes on the X chromosomes were involved in
nucleobase, nucleoside, and nucleotide metabolic processes
representing a significant enrichment of the GO biological process.
Chromosomal arm 2L had overrepresentation of several gene
types including those encoding for proteins involved in structural
constituent of cuticle, structural molecule activity, and protein
binding (molecular function). In addition, 2L was enriched in GO
terms of biological process: cell wall macromolecule catabolic
process, cell wall macromolecule metabolic process, and cell wall
organization or biogenesis. Arm 2R had overrepresentation of the
following GO terms: membrane part, transmembrane proteins,
proteins intrinsic to the membrane (cellular location), oxidoreduc-
tase activity, acting on CH-OH group of donors (molecular
function), DNA repair, cellular response to stimulus, cellular
response to DNA damage stimulus, cellular response to stress, and
response to DNA damage stimulus (biological process). Chromo-
somal arm 3L was enriched in GO terms related to binding
(molecular function) and metabolic/catabolic processes (biological
process). Finally, 3R had an overrepresentation of several gene
types including those encoding for proteins located in the
membrane, cell, and cell parts (cellular location).
Discussion
Our study revealed contrasting patterns of sex chromosome and
autosome evolution. We demonstrated that the sex chromosome
has the highest rate of inversion fixation, which is in contrast with
the absence of polymorphic inversions on the X chromosome in
the studied species (Figure 2, S3). The paucity of polymorphic
inversions on the X chromosome could be a consequence of a low
rate of origin of inversions. However, the X chromosome had the
highest densities of TEs, microsatellites, minisatellites, and
satellites, which are known for their roles in the origin of
inversions [38,39,40]. The excess of fixed inversions, as compared
to a deficit of polymorphic inversions, on the X chromosome has
been documented in other insect species [11,41]. A classical work
has shown that the fixation rate of underdominant and
advantageous partially or fully recessive rearrangements should
be higher for the X chromosome (due to the hemizygosity of
males) than for the autosomes [41]. It is possible that strong sex-
specific selection favors hemizygous males carrying the X
inversion, which is underdominant in females. Ayala and Coluzzi
proposed that genes responsible for reproductive isolation of
mosquito species should be located on the X chromosome [1].
Indeed, the X chromosome has a disproportionately large effect
on male and female hybrid sterility and inviability in An. gambiae
and An. arabiensis [42,43]. The rapid evolution of sterility and
inviability genes captured by polymorphic inversions on the X
chromosome may cause a selection against inversion heterozy-
gotes. From a vector control point of view, if heterozygote
inversions on the X chromosome have a deleterious effect on
viability and reproduction of mosquitoes, then they could be
introduced artificially into the vector population to reduce its size.
Our study of GO term distribution suggests that the X
chromosome is enriched in genes that may be involved in
premating isolation, such as genes encoding for proteins with
molecular and signal transduction activity. Signal transduction is a
crucial component of olfaction that plays a major role in mate
recognition. For example, X-linked genes encoding for signal
transduction proteins were differentially expressed between virgin
females of two incipient species of An. gambiae that differ in
swarming behavior [44]. Rapid generation and fixation of
Figure 2. The contrasting patterns of the X chromosome andautosome evolution. The fastest evolution of the X chromosome andparallelism between the extent of inversion polymorphism andinversion fixation rates on the autosomes are shown. The number ofbreakpoints of fixed inversions is calculated per 1 Mb from Nadeau-Taylor analysis (the blue bar) and GRIMM analysis (the red bar). Thenumber of breakpoints of all polymorphic inversions in An. gambiae andAn. stephensi is combined and calculated per 1 Mb (the green bar).doi:10.1371/journal.pone.0010592.g002
Mosquito Chromosome Evolution
PLoS ONE | www.plosone.org 5 May 2010 | Volume 5 | Issue 5 | e10592

inversions on the X chromosome may facilitate speciation in
Anopheles by differentiating alleles inside of the inverted regions as
has been shown in Drosophila [45].
Unlike the X chromosome in insects, the eutherian X
chromosome had its gene order conserved during 105 million
years of evolution, probably reflecting strong selective constraints
posed by the X inactivation system in mammals [46]. A study of
the opossum genome revealed that the evolution of the X
chromosome inactivation was associated with suppression of large-
scale rearrangements in eutherians [47]. Conversely, rapidly
evolving sex chromosomes in insects have a dosage compensation
system. Because the X chromosome in Drosophila males recruits
fewer histones and possesses an ‘‘open’’ chromatin [48], it may be
more sensitive to breakage [16] and, thus, more prone to
rearrangements.
In contrast to the X chromosome, the 2R and 2L arms of An.
gambiae and their homologous arms in An. stephensi and An. funestus
harbor polymorphic inversions associated with ecological adapta-
tions [9,23,24]. Natural selection has been implicated in fixation of
the 2Rj inversion during ecotypic speciation in An. gambiae [49].
Adaptive alleles or allelic combinations can be maintained within a
polymorphic inversion by suppressing recombination between the
loci [2,50]. It has been demonstrated that adaptive inversions are
less frequent at shorter lengths [10,27], reflecting a smaller
selective advantage when an inversion captures fewer genes [28].
Therefore, we predicted that chromosomal arms rich in
polymorphic inversions (2R, 2L) would have higher gene densities.
This prediction was met; moreover, the polymorphic inversion-
poor X chromosome had the lowest gene density (Figure 3, Table
S5). Similarly, the polymorphic inversion-rich chromosomal
Figure 3. Median values of density and coverage of molecular features in chromosomes of An. gambiae. Counts per 1 Mb are given forDNA TEs, RNA TEs, regions involved in SDs, and genes. Percentage of region length occupied per 1 Mb are indicated for microsatellites, minisatellites,satellites, and MARs.doi:10.1371/journal.pone.0010592.g003
Mosquito Chromosome Evolution
PLoS ONE | www.plosone.org 6 May 2010 | Volume 5 | Issue 5 | e10592

Figure 4. Genome landscapes of the An. gambiae chromosomal arms. Median counts per 1 Mb are given for DNA TEs, RNA TEs, regionsinvolved in SDs, and genes. Percentage of region length occupied per 1 Mb is indicated for microsatellites, minisatellites, satellites, and MARs. Medianvalues of density and coverage of molecular features are displayed as 5 Mb intervals in euchromatin and ,1 Mb intervals in heterochromatin. Thecoordinates and orientation of each arm are the following: X: 0 Mb—telomere, 24.3 Mb—centromere; 2R: 0 Mb—telomere, 61.5 Mb—centromere;2L: 0—centromere, 50 Mb—telomere; 3R: 0 Mb—telomere, 53.2 Mb—centromere; 3L: 0 Mb—centromere, 41.9 Mb—telomere.doi:10.1371/journal.pone.0010592.g004
Mosquito Chromosome Evolution
PLoS ONE | www.plosone.org 7 May 2010 | Volume 5 | Issue 5 | e10592

elements C and E have higher gene densities than the rest of the
genome in Drosophila [5]. These observations highlight the
fundamental differences between the evolutionary dynamics of
the sex chromosome and autosomes. The high rate of sex
chromosome evolution is being achieved by the rapid generation
and fixation of inversions without maintenance of a stable
inversion polymorphism. In contrast, the high rate of the
autosomal evolution results from the high level of inversion
polymorphism maintained by selection acting on gene-rich
chromosomal arms. The increase of gene density in rearrange-
ment-rich regions of autosomes was also found in vertebrates
[15,51,52] suggesting the general applicability of the principle
‘‘from polymorphism to fixation’’ to autosomal evolution.
The polymorphic inversions 2Rb, 2Rbc, 2Rcu, 2Ru, 2Rd, and
2La of An. gambiae are associated with adaptation of mosquitoes to
the dry environment [9]. Cuticle seems to play a major role in
desiccation resistance of embryo and adult mosquitoes [26,53].
These observations suggest an exciting possibility that genes
involved in the cuticle development may be disproportionally
clustered on the 2R and 2L arms. Our study of GO terms provides
evidence that 2L is indeed enriched with genes involved in the
structural integrity of a cuticle while the 2R arm has overrepre-
sentation of genes involved in cellular response to stress (e.g.,
temperature, humidity) and in building membrane parts (Figure 5).
These data support the role of natural selection in maintaining
polymorphic inversions associated with ecological adaptations.
If nonrandom origin of inversions can be attributed to unequal
density of repetitive DNA among chromosome arms, we would
predict higher densities of break-causing elements on faster
evolving arms. Indeed, the X chromosome had the highest
densities of DNA and RNA TEs (Figure 3), which can potentially
generate inversions [38,39]. In addition, the X chromosome had
the highest microsatellite, minisatellite, and satellite DNA content.
Simple repeats have been shown to play a role in the formation of
hairpin and cruciform structures, which can cause double-strand
DNA breaks and rearrangements [40]. In Drosophila, the fastest
evolving X chromosome has the highest densities of microsatellites
and TEs [5,54]. Although, the role of TEs in the origin of
individual inversions was demonstrated earlier [38,39,55,56,57],
the more recent sequencing of breakpoints discovered alternative
mechanisms of inversion generation [6,7,8,58]. SDs have been
implicated in inversion generation in mosquitoes and mammals
[59,60] and are considered as a marker of genome fragility [61].
Our study showed that the most rapidly evolving autosomal arm
2R had the lowest density of TEs but the highest density of regions
with SDs (Figure 3). Importantly, the regions involved in SDs were
clustered in the proximal half of the 2R arm (Figure 4) where the
majority of inversion breakpoints are found [10]. We also
demonstrated that the 2R arm has the lowest coverage of MARs,
which can potentially mediate interactions of specific chromosome
sites with the nuclear envelope [19,20]. Three-dimensional
organization of chromosomes in the nuclear space can affect
rearrangement rates by facilitating or hindering interchromosomal
interactions [17,18]. In agreement with this statement, MARs
were found accumulated in the slowly evolving 2L, 3R, and 3R
arms (Figure 3). We propose that multiple attachments of 2L, 3R,
Figure 5. Overrepresented GO terms enriched on each chromosomal arm of the An. gambiae genome assembly. The percentages of arm-enriched (red) genes containing the listed GO biological process (pink shading), cellular location (blue shading), and molecular function (green shading)terms are compared to the percent of genes in the whole genome matching that term. Numbers in parentheses refer to the actual number of arm-enrichedgenes annotated with the listed GO domain. P-value significance scores, as determined by GO-Term-Finder, are shown to the right (grey shading).doi:10.1371/journal.pone.0010592.g005
Mosquito Chromosome Evolution
PLoS ONE | www.plosone.org 8 May 2010 | Volume 5 | Issue 5 | e10592
and 3L to the nuclear envelope make rejoining different breaks
and forming inversions more difficult despite the abundance of
TEs and simple repeats in these arms (Figure S4). Finally, we
demonstrated that the An. gambiae X chromosome and 2R arm
have the highest G+C content. GC-rich regions have been
implemented in forming hotspots for chromosome rearrangements
[15,16] because of their propensity to form Z-DNA, hairpin loops,
and other unstable structures that are capable of generating
double-strand breaks [62]. Interestingly, our GO term analysis
demonstrated that the X chromosome is enriched with nucleo-
base, nucleoside, and nucleotide metabolic processes and that the
2R arm has overrepresented gene clusters involved in DNA
damage repair. It is possible that these GO term enrichments have
evolved in response to high rates of DNA breakage on the X and
2R chromosomes.
Our study has shown that because of the paucity of pericentric
inversions and partial-arm translocations in mosquito evolution, the
genome landscapes and evolutionary histories of individual arms are
different. The results demonstrated a strong association between the
genome landscape characteristics and the rates of chromosomal
evolution. We conclude that a unique combination of various classes
of genes and repetitive DNA in each arm, rather than a single type of
repetitive element, is likely responsible for arm-specific rates of
rearrangements. These findings call for a reevaluation of the genomic
analyses, which must be performed on an arm-by-arm basis using
sequences physically mapped to the chromosomes.
Methods
Mosquito strain and physical mappingFor the physical map development, we used the Indian wild-
type strain of An. stephensi. Chromosomal preparations from ovaries
of half-gravid females and fluorescent in situ hybridization
experiments were performed as described previously [12]. An.
stephensi, An. gambiae, and An. funestus cDNA and BAC clones were
hybridized to polytene chromosomes of An. stephensi (Table S1).
Localization of a signal was done using a standard cytogenetic
map for An. stephensi [32]. The BLASTN and BLASTX algorithms
were used to identify homologous sequences in the An. gambiae
genome, which is available at VectorBase [63].
Test of uniformity of marker distributionIn order to determine if the marker distribution, along each
chromosome arm, is distributed uniformly, we considered the x2
statistic:
X 2~
PNi~1 Oi{Eið Þ
Ei
,
where N denotes a number of equally spaced bins. Under the null
hypothesis (in this case, the distribution is uniform), Ei is the
expected number of observations and Oi is the the observed
number. Under large sample sizes, with each bin observed count
having a sufficiently high count, X 2~x2
N{1. Large values of this
statistic correspond to large deviations from the null. Analyses of
distributional fit are often based on p-values, where the hypothesis
is rejected when the p-value is under some predetermined
threshold. However, these p-values (based on x2 asymptotics) are
only reliable under large sample sizes. Some of the chromosomes
exhibit low marker counts (specifically the X chromosome), hence
simulated p-values, based on bootstrap replications (100,000) are
also provided. Under large sample sizes, bootstrap and asymptotic
p-values will coincide.
Bin counts N were determined so that the each expected bin
count was at least 5.
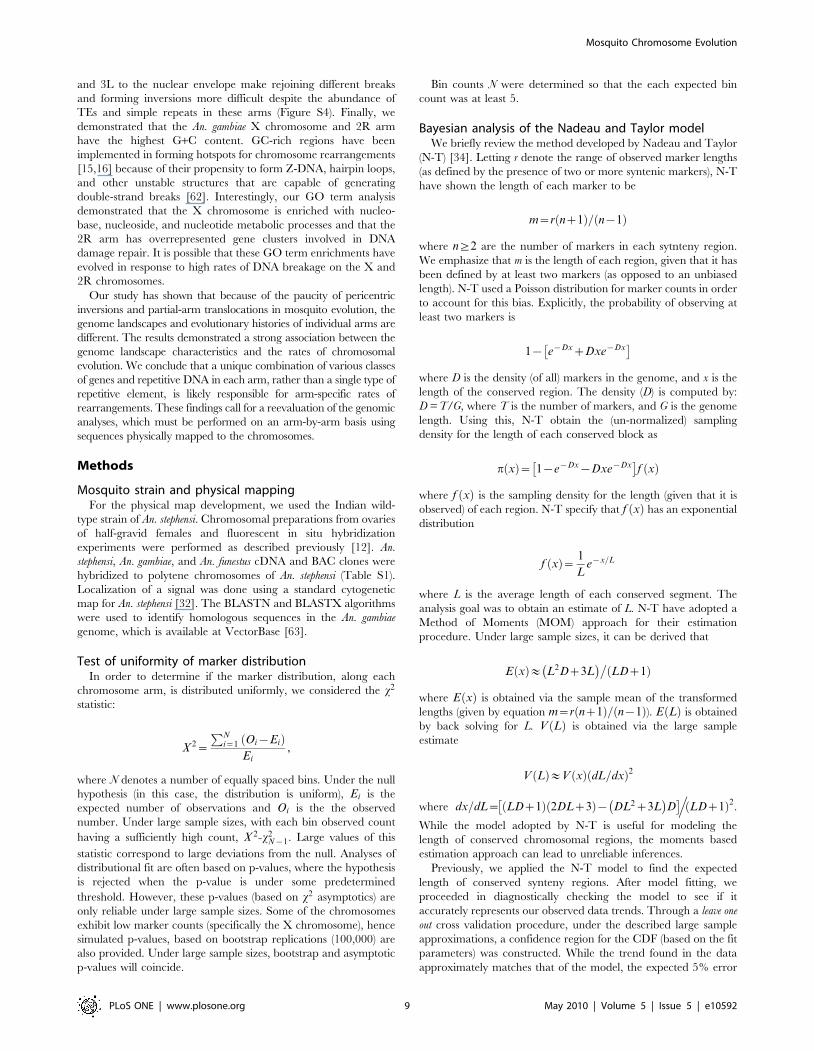
Bayesian analysis of the Nadeau and Taylor modelWe briefly review the method developed by Nadeau and Taylor
(N-T) [34]. Letting r denote the range of observed marker lengths
(as defined by the presence of two or more syntenic markers), N-T
have shown the length of each marker to be
m~r nz1ð Þ= n{1ð Þ
where n§2 are the number of markers in each sytnteny region.
We emphasize that m is the length of each region, given that it has
been defined by at least two markers (as opposed to an unbiased
length). N-T used a Poisson distribution for marker counts in order
to account for this bias. Explicitly, the probability of observing at
least two markers is
1{ e{DxzDxe{Dx� �
where D is the density (of all) markers in the genome, and x is the
length of the conserved region. The density (D) is computed by:
D = T/G, where T is the number of markers, and G is the genome
length. Using this, N-T obtain the (un-normalized) sampling
density for the length of each conserved block as
p xð Þ~ 1{e{Dx{Dxe{Dx� �
f xð Þ
where f xð Þ is the sampling density for the length (given that it is
observed) of each region. N-T specify that f xð Þ has an exponential
distribution
f xð Þ~ 1
Le{x=L
where L is the average length of each conserved segment. The
analysis goal was to obtain an estimate of L. N-T have adopted a
Method of Moments (MOM) approach for their estimation
procedure. Under large sample sizes, it can be derived that
E xð Þ& L2Dz3L� ��
LDz1ð Þ
where E xð Þ is obtained via the sample mean of the transformed
lengths (given by equation m~r nz1ð Þ= n{1ð Þ). E Lð Þ is obtained
by back solving for L. V Lð Þ is obtained via the large sample
estimate
V Lð Þ&V xð Þ dL=dxð Þ2
where dx=dL~ LDz1ð Þ 2DLz3ð Þ{ DL2z3L� �
D� �.
LDz1ð Þ2.
While the model adopted by N-T is useful for modeling the
length of conserved chromosomal regions, the moments based
estimation approach can lead to unreliable inferences.
Previously, we applied the N-T model to find the expected
length of conserved synteny regions. After model fitting, we
proceeded in diagnostically checking the model to see if it
accurately represents our observed data trends. Through a leave one
out cross validation procedure, under the described large sample
approximations, a confidence region for the CDF (based on the fit
parameters) was constructed. While the trend found in the data
approximately matches that of the model, the expected 5% error
Mosquito Chromosome Evolution
PLoS ONE | www.plosone.org 9 May 2010 | Volume 5 | Issue 5 | e10592
rate was dramatically exceeded (29.6%). This excessive error rate
could have occurred for either of two reasons. 1) The model is
inappropriate for out data, or 2) the asymptotic approximations to
the mean and variance are performing badly. In our case, we
believe the variance estimates are simply underestimated. It should
be noted that if we did have a larger data set, the problem incurred
in (2) would diminish. In general, since sample sizes are fixed (for a
given experiment), we will adopt a Bayesian inferential framework
for overcoming the asymptotic deficiencies observed in the
moments based approach. For notation, let us denote the model
by
p xDLð Þ~1{e{Dx{Dxe{Dx½ �f xð Þ 1
Le{x=L
1{1= L DzL{1ð Þð Þ{D.
L DzL{1ð Þ2� � :
Formally, in a Bayesian analysis, one constructs a distribution on
the parameter space L, given the data set D~ x1, . . . ,xNf g. This
distribution is referred to as a posterior distribution, and explicitly
follows as
p LDDð Þ~p DLð Þp Lð Þ=p()
! PN
i~1p xi DLð Þp Lð Þ:
The distribution p(L) is called the prior distribution and is used to
model beliefs about L, before observing the data. For our purposes,
we used p Lð Þ!1, which represents (in this case) neutral beliefs
about L, and doesn’t favor any particular values L. While the
choice of prior is quite flexible, the choice presented here makes
the posterior have the same form as the likelihood. From this, we
will obtain a full distribution for L, which will not rely on
asymptotic approximations (The original framework simply
provides an estimated mean and variance, which are valid under
large sample sizes). Through Markov chain Monte Carlo, we
obtain the posterior distribution for L. From this, we find the
posterior mean, standard error, 95% credible interval, and
Maximum A Posteriori (MAP) estimate for L, which are tabulated
in Table S4. We assess the appropriateness of our estimated
parameter (L) through the posterior predictive distribution:
p ~xxDDð Þ~ð
p ~xxDLð Þp LDDð ÞdL
Under the Bayesian model fit, 2/54<4% of the data falls out of
the 95% region. While the nominal error rate is 5%, the actual
error rate <4% is well within reasonable limits. While the
modeling falls under the N-T framework, we’ve adopted a
Bayesian methodology, which provided us with more robust
estimates that do not depend on the large sample assumptions in
the original paper.
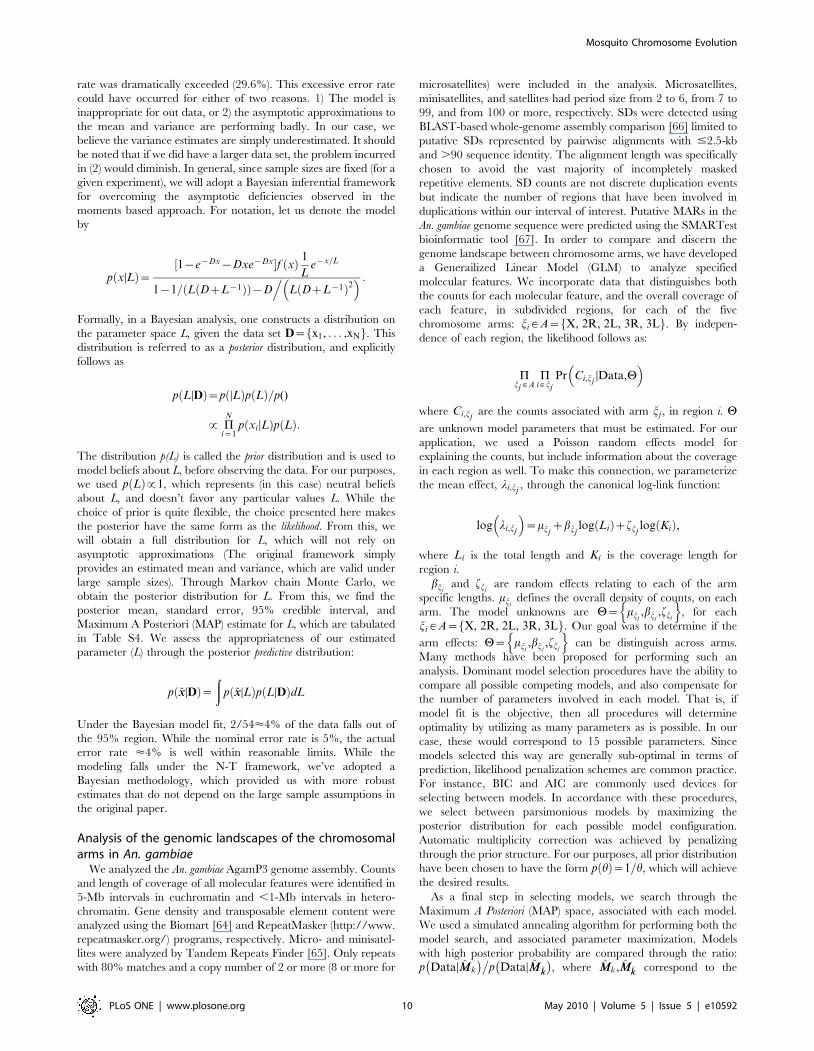
Analysis of the genomic landscapes of the chromosomalarms in An. gambiae
We analyzed the An. gambiae AgamP3 genome assembly. Counts
and length of coverage of all molecular features were identified in
5-Mb intervals in euchromatin and ,1-Mb intervals in hetero-
chromatin. Gene density and transposable element content were
analyzed using the Biomart [64] and RepeatMasker (http://www.
repeatmasker.org/) programs, respectively. Micro- and minisatel-
lites were analyzed by Tandem Repeats Finder [65]. Only repeats
with 80% matches and a copy number of 2 or more (8 or more for
microsatellites) were included in the analysis. Microsatellites,
minisatellites, and satellites had period size from 2 to 6, from 7 to
99, and from 100 or more, respectively. SDs were detected using
BLAST-based whole-genome assembly comparison [66] limited to
putative SDs represented by pairwise alignments with #2.5-kb
and .90 sequence identity. The alignment length was specifically
chosen to avoid the vast majority of incompletely masked
repetitive elements. SD counts are not discrete duplication events
but indicate the number of regions that have been involved in
duplications within our interval of interest. Putative MARs in the
An. gambiae genome sequence were predicted using the SMARTest
bioinformatic tool [67]. In order to compare and discern the
genome landscape between chromosome arms, we have developed
a Generailized Linear Model (GLM) to analyze specified
molecular features. We incorporate data that distinguishes both
the counts for each molecular feature, and the overall coverage of
each feature, in subdivided regions, for each of the five
chromosome arms: ji [A~ X, 2R, 2L, 3R, 3Lf g. By indepen-
dence of each region, the likelihood follows as:
Pjj [A
Pi [ jj
Pr Ci,jjDData,H
� �
where Ci,jjare the counts associated with arm jj , in region i. H
are unknown model parameters that must be estimated. For our
application, we used a Poisson random effects model for
explaining the counts, but include information about the coverage
in each region as well. To make this connection, we parameterize
the mean effect, li,jj, through the canonical log-link function:
log li,jj
� �~mjj
zbjjlog Lið Þzfjj
log Kið Þ,
where Li is the total length and Ki is the coverage length for
region i.
bjjand fjj
are random effects relating to each of the arm
specific lengths. mjjdefines the overall density of counts, on each
arm. The model unknowns are H~ mjj,bjj
,fjj
n o, for each
ji [A~ X, 2R, 2L, 3R, 3Lf g. Our goal was to determine if the
arm effects: H~ mjj,bjj
,fjj
n ocan be distinguish across arms.
Many methods have been proposed for performing such an
analysis. Dominant model selection procedures have the ability to
compare all possible competing models, and also compensate for
the number of parameters involved in each model. That is, if
model fit is the objective, then all procedures will determine
optimality by utilizing as many parameters as is possible. In our
case, these would correspond to 15 possible parameters. Since
models selected this way are generally sub-optimal in terms of
prediction, likelihood penalization schemes are common practice.
For instance, BIC and AIC are commonly used devices for
selecting between models. In accordance with these procedures,
we select between parsimonious models by maximizing the
posterior distribution for each possible model configuration.
Automatic multiplicity correction was achieved by penalizing
through the prior structure. For our purposes, all prior distribution
have been chosen to have the form p hð Þ~1=h, which will achieve
the desired results.
As a final step in selecting models, we search through the
Maximum A Posteriori (MAP) space, associated with each model.
We used a simulated annealing algorithm for performing both the
model search, and associated parameter maximization. Models
with high posterior probability are compared through the ratio:
p DataDM̂Mk
� ��p DataDM̂M~kk
� �, where M̂Mk,M̂M~kk correspond to the
Mosquito Chromosome Evolution
PLoS ONE | www.plosone.org 10 May 2010 | Volume 5 | Issue 5 | e10592

MAP models found by the optimization procedure. Table S5
shows mean and median densities and length of coverage as well as
mean ranks for all molecular elements in chromosomal arms of An.
gambiae.
Analysis of AT/GC contentAT/GC content was calculated using 100-kb nonoverlapping
windows with the help of the program ATcontent (Tu 2001). The
analysis of AT content was based on a Poisson regression model,
since the data arises as discrete counts. Under such a model, the
probability of observing the feature count Ci,j , for the ith region on
chromosome j [ X, 2R, 2L, 3R, 3Lf g, is
Pr Ci,j
� �~e{li,j
lCi,ji,j
Ci,j !:
The unknown parameter, li,j denotes the mean count for
observation i, on chromosome j. This mean form is generalizable
to account for different sources of variability found in the data; and
in our case, we must account for the variability specific to each
chromosome arm j [ X, 2R, 2L, 3R, 3Lf g, and the length of each
region (Li,j ). We used the canonical log-link for representing the
mean response li,j as:
log li,j
� �~jjzlog Li,j
� �,
where jj is a chromosome specific random effect for the data.
Since log li,j
� �models the logged expectation of counts for each
molecular feature, we interpret the estimated parameters by noting
the relationship
log li,j
�Li,j
� �~jj ,
From this, we see that jj models the AT percent content on
chromosome j.
While a simple descriptive statistic can be formed for comparing
the AT content, across chromosomal arms, such a model based
formulation accurately describes the level of variability across the
individual arms.
GO annotation of chromosomal armsWe analyzed the An. gambiae AgamP4 annotated peptide set using
a locally installed copy of Interproscan 4.4.1 [68]. A GO [37]
annotation file was generated using Interproscan-assigned GO
terms and custom Perl scripts. We used Go-Term-Finder [69]
version 0.86 to search for significantly overrepresented (i.e.
p,0.05) GO terms assigned to genes in chromosomal arms
relative to frequencies for all GO-annotated genes in the peptide
dataset. Bar graphs were generated with Microsoft Excel and
labeled using Adobe Illustrator CS4.
Supporting Information
Figure S1 The GRIMM scenario of gene order transformation
between the An. gambiae 2R arm and the An. stephensi 2R arm.
Relative position and orientation of the conserved syntenic blocks
(CSBs) and markers physically mapped to polytene chromosomes
are indicated by colored blocks. Numbers over brackets indicate
inversion steps. The telomere ends are on the left.
Found at: doi:10.1371/journal.pone.0010592.s001 (8.33 MB TIF)
Figure S2 The GRIMM scenario of gene order transformation
between the An. gambiae 2L arm and the An. stephensi 3L arm.
Relative position and orientation of the CSBs and markers
physically mapped to polytene chromosomes are indicated by
colored blocks. Numbers over brackets indicate inversion steps.
The telomere ends are on the right.
Found at: doi:10.1371/journal.pone.0010592.s002 (10.24 MB
TIF)
Figure S3 The contrasting patterns of the X chromosome and
autosome evolution. The fastest evolution of the X chromosome
and parallelism between the extent of inversion polymorphism and
inversion fixation rates on the autosomes are shown. The number
of fixed inversions (Y axis) is calculated per 1 Mb from GRIMM
analysis (the blue bar). The number of all polymorphic inversions
in An. gambiae and An. funestus is combined and calculated per
3 Mb (the green bar).
Found at: doi:10.1371/journal.pone.0010592.s003 (4.03 MB TIF)
Figure S4 A model of interaction of the 2R and 3L arms with
the nuclear envelope. The higher coverage of MARs on 3L
generates multiple attachments of this arm to the nuclear
envelope. These attachments make more difficult rejoining
different breaks and forming inversions despite the abundance of
TEs and simple repeats on 3L. In contrast, the lower coverage of
MARs on 2R makes fewer nuclear envelope-chromosome contacts
and allows more interaction between loci.
Found at: doi:10.1371/journal.pone.0010592.s004 (4.36 MB TIF)
Table S1 Physically and in silico mapped DNA markers in the
An. gambiae, An. funestus, and An. stephensi genomes.
Found at: doi:10.1371/journal.pone.0010592.s005 (0.47 MB
DOC)
Table S2 Measures of uniformity of marker distribution for An.
gambiae, An. stephensi, and An. funestus.
Found at: doi:10.1371/journal.pone.0010592.s006 (0.06 MB
DOC)
Table S3 Inversion fixation rates between An. funestus and An.
gambaie calculated by GRIMM from the gene order.
Found at: doi:10.1371/journal.pone.0010592.s007 (0.05 MB
DOC)
Table S4 Posterior estimates for the mean length of each
conserved segment (L, Mb) for each of the chromosome arms and
the whole genome.
Found at: doi:10.1371/journal.pone.0010592.s008 (0.05 MB
DOC)
Table S5 Density and coverage of molecular elements in
chromosomal arms of An. gambiae.
Found at: doi:10.1371/journal.pone.0010592.s009 (0.08 MB
DOC)
Acknowledgments
We thank Diego Ayala and Mark Kirkpatrick for helpful comments on the
manuscript as well as Nora J. Besansky, Frank H. Collins, Abraham
Eappen, Marcelo Jacobs-Lorena, Yogesh S. Shouche, Maria F. Unger, and
the Malaria Research and Reference Reagent Resource Center (MR4) for
providing DNA clones for physical mapping. We thank Melissa Wade and
Janet Webster, Ph.D., for editing the text. We thank Mike Wong and the
SFSU Center for Computing for Life Sciences for technical assistance with
software installation and hardware maintenance.
Author Contributions
Conceived and designed the experiments: IVS. Performed the experi-
ments: AX MVS SCL ZT JAB CS IVS. Analyzed the data: AX MVS SCL
CS IVS. Contributed reagents/materials/analysis tools: SCL ZT JAB.
Wrote the paper: SCL IVS.
Mosquito Chromosome Evolution
PLoS ONE | www.plosone.org 11 May 2010 | Volume 5 | Issue 5 | e10592

References
1. Ayala FJ, Coluzzi M (2005) Chromosome speciation: humans, Drosophila, and
mosquitoes. Proc Natl Acad Sci U S A 102 Suppl 1: 6535–6542.
2. Hoffmann AA, Rieseberg L (2008) Revisiting the Impact of Inversions in
Evolution: From Population Genetic Markers to Drivers of Adaptive Shifts and
Speciation? Annual Review of Ecology, Evolution, and Systematics 39: 21–42.
3. Coghlan A, Eichler EE, Oliver SG, Paterson AH, Stein L (2005) Chromosome
evolution in eukaryotes: a multi-kingdom perspective. Trends Genet 21:
673–682.
4. Eichler EE, Sankoff D (2003) Structural dynamics of eukaryotic chromosome
evolution. Science 301: 793–797.
5. Gonzalez J, Ranz JM, Ruiz A (2002) Chromosomal elements evolve at different
rates in the Drosophila genome. Genetics 161: 1137–1154.
6. Ranz JM, Maurin D, Chan YS, von Grotthuss M, Hillier LW, et al. (2007)
Principles of Genome Evolution in the Drosophila melanogaster Species Group.
PLoS Biol 5: e152.
7. Bhutkar A, Schaeffer SW, Russo SM, Xu M, Smith TF, et al. (2008)
Chromosomal rearrangement inferred from comparisons of 12 Drosophila
genomes. Genetics 179: 1657–1680.
8. Richards S, Liu Y, Bettencourt BR, Hradecky P, Letovsky S, et al. (2005)
Comparative genome sequencing of Drosophila pseudoobscura: chromosomal,
gene, and cis-element evolution. Genome Res 15: 1–18.
9. Coluzzi M, Sabatini A, della Torre A, Di Deco MA, Petrarca V (2002) A
polytene chromosome analysis of the Anopheles gambiae species complex.
Science 298: 1415–1418.
10. Pombi M, Caputo B, Simard F, Di Deco MA, Coluzzi M, et al. (2008)
Chromosomal plasticity and evolutionary potential in the malaria vector
Anopheles gambiae sensu stricto: insights from three decades of rare paracentric
inversions. BMC Evol Biol 8: 309.
11. Kitzmiller JB (1977) Chromosomal Differences Among Species of Anopheles
Mosquitoes. Mosquito Systematics 9: 112–122.
12. Sharakhov IV, Serazin AC, Grushko OG, Dana A, Lobo N, et al. (2002)
Inversions and gene order shuffling in Anopheles gambiae and A. funestus.
Science 298: 182–185.
13. Cornel AJ, Collins FH (2000) Maintenance of chromosome arm integrity
between two Anopheles mosquito subgenera. J Hered 91: 364–370.
14. Holt RA, Subramanian GM, Halpern A, Sutton GG, Charlab R, et al. (2002)
The genome sequence of the malaria mosquito Anopheles gambiae. Science
298: 129–149.
15. Gordon L, Yang S, Tran-Gyamfi M, Baggott D, Christensen M, et al. (2007)
Comparative analysis of chicken chromosome 28 provides new clues to the
evolutionary fragility of gene-rich vertebrate regions. Genome Res 17:
1603–1613.
16. Fisher AM, Strike P, Scott C, Moorman AV (2005) Breakpoints of variant 9;22
translocations in chronic myeloid leukemia locate preferentially in the CG-
richest regions of the genome. Genes Chromosomes Cancer 43: 383–389.
17. Marshall WF (2002) Order and disorder in the nucleus. Curr Biol 12:
R185–192.
18. Folle GA (2008) Nuclear architecture, chromosome domains and genetic
damage. Mutat Res 658: 172–183.
19. Baricheva EA, Berrios M, Bogachev SS, Borisevich IV, Lapik ER, et al. (1996)
DNA from Drosophila melanogaster beta-heterochromatin binds specifically to
nuclear lamins in vitro and the nuclear envelope in situ. Gene 171: 171–176.
20. Dechat T, Pfleghaar K, Sengupta K, Shimi T, Shumaker DK, et al. (2008)
Nuclear lamins: major factors in the structural organization and function of the
nucleus and chromatin. Genes Dev 22: 832–853.
21. Green C, Hunt R (1980) Interpretation of variation in ovarian polytene
chromosomes of Anopheles funestus Giles, A. parensis Gillies, and A. aruni? .
Genetica 51: 187–195.
22. Krzywinski J, Grushko OG, Besansky NJ (2006) Analysis of the complete
mitochondrial DNA from Anopheles funestus: an improved dipteran mitochon-
drial genome annotation and a temporal dimension of mosquito evolution. Mol
Phylogenet Evol 39: 417–423.
23. Mahmood F, Sakai RK (1984) Inversion polymorphisms in natural populations
of Anopheles stephensi. Can J Genet Cytol 26: 538–546.
24. Costantini C, Sagnon N, Ilboudo-Sanogo E, Coluzzi M, Boccolini D (1999)
Chromosomal and bionomic heterogeneities suggest incipient speciation in
Anopheles funestus from Burkina Faso. Parassitologia 41: 595–611.
25. Coluzzi M, Di Deco M, Cancrini G (1973) Chromosomal inversions in
Anopheles stephensi. Parassitologia 15: 129–136.
26. Gray EM, Rocca KA, Costantini C, Besansky NJ (2009) Inversion 2La is
associated with enhanced desiccation resistance in Anopheles gambiae. Malar J
8: 215.
27. Caceres M, Barbadilla A, Ruiz A (1997) Inversion length and breakpoint
distribution in the Drosophila buzzatii species complex: is inversion length a
selected trait? Evolution 51: 1149–1155.
28. Krimbas CB, Powell JR (1992) Introduction. In: Drosophila Inversion
Polymorphism, CRC Press. pp 1–52.
29. Sharakhov I, Braginets O, Grushko O, Cohuet A, Guelbeogo WM, et al. (2004)
A microsatellite map of the African human malaria vector Anopheles funestus.
J Hered 95: 29–34.
30. Sharakhova MV, Hammond MP, Lobo NF, Krzywinski J, Unger MF, et al.(2007) Update of the Anopheles gambiae PEST genome assembly. Genome Biol
8: R5.
31. Wondji CS, Morgan J, Coetzee M, Hunt RH, Steen K, et al. (2007) Mapping a
quantitative trait locus (QTL) conferring pyrethroid resistance in the African
malaria vector Anopheles funestus. BMC Genomics 8: 34.
32. Sharakhova MV, Xia A, McAlister SI, Sharakhov IV (2006) A standard
cytogenetic photomap for the mosquito Anopheles stephensi (Diptera:
Culicidae): application for physical mapping. J Med Entomol 43: 861–866.
33. Tesler G (2002) GRIMM: genome rearrangements web server. Bioinformatics
18: 492–493.
34. Nadeau JH, Taylor BA (1984) Lengths of chromosomal segments conserved
since divergence of man and mouse. Proc Natl Acad Sci U S A 81: 814–818.
35. Subbarao s (1996) Genetics of malaria vectors. Proc Nat Acad Sci India 66:
51–76.
36. Gayathri Devi K, Shetty J (1992) Chromosomal inversions in Anopheles
stephensi Liston–a malaria mosquito. J Cytol Genet 27: 153–161.
37. Ashburner M, Ball CA, Blake JA, Botstein D, Butler H, et al. (2000) Gene
ontology: tool for the unification of biology. The Gene Ontology Consortium.
Nat Genet 25: 25–29.
38. Caceres M, Ranz JM, Barbadilla A, Long M, Ruiz A (1999) Generation of a
widespread Drosophila inversion by a transposable element. Science 285:
415–418.
39. Mathiopoulos KD, della Torre A, Predazzi V, Petrarca V, Coluzzi M (1998)
Cloning of inversion breakpoints in the Anopheles gambiae complex traces a
transposable element at the inversion junction. Proc Natl Acad Sci U S A 95:
12444–12449.
40. Lobachev KS, Rattray A, Narayanan V (2007) Hairpin- and cruciform-
mediated chromosome breakage: causes and consequences in eukaryotic cells.
Front Biosci 12: 4208–4220.
41. Charlesworth B, Coyne JA, Barton NH (1987) The relative rates of evolution ofsex chromosomes and autosomes. The American Naturalist 130: 113–146.
42. Slotman M, Della Torre A, Powell JR (2005) Female sterility in hybrids between
Anopheles gambiae and A. arabiensis, and the causes of Haldane’s rule.
Evolution Int J Org Evolution 59: 1016–1026.
43. Slotman M, Della Torre A, Powell JR (2004) The genetics of inviability andmale sterility in hybrids between Anopheles gambiae and An. arabiensis.
Genetics 167: 275–287.
44. Cassone BJ, Mouline K, Hahn MW, White BJ, Pombi M, et al. (2008)
Differential gene expression in incipient species of Anopheles gambiae. Mol Ecol
17: 2491–2504.
45. Machado CA, Haselkorn TS, Noor MA (2007) Evaluation of the genomic extent
of effects of fixed inversion differences on intraspecific variation and interspecific
gene flow in Drosophila pseudoobscura and D. persimilis. Genetics 175:
1289–1306.
46. Rodriguez Delgado CL, Waters PD, Gilbert C, Robinson TJ, Graves JA (2009)
Physical mapping of the elephant X chromosome: conservation of gene order
over 105 million years. Chromosome Res.
47. Mikkelsen TS, Wakefield MJ, Aken B, Amemiya CT, Chang JL, et al. (2007)
Genome of the marsupial Monodelphis domestica reveals innovation in non-
coding sequences. Nature 447: 167–177.
48. Corona DF, Siriaco G, Armstrong JA, Snarskaya N, McClymont SA, et al.
(2007) ISWI regulates higher-order chromatin structure and histone H1assembly in vivo. PLoS Biol 5: e232.
49. Manoukis NC, Powell JR, Toure MB, Sacko A, Edillo FE, et al. (2008) A test of
the chromosomal theory of ecotypic speciation in Anopheles gambiae. Proc Natl
Acad Sci U S A 105: 2940–2945.
50. Kirkpatrick M, Barton N (2006) Chromosome inversions, local adaptation and
speciation. Genetics 173: 419–434.
51. Larkin DM, Pape G, Donthu R, Auvil L, Welge M, et al. (2009) Breakpoint
regions and homologous synteny blocks in chromosomes have different
evolutionary histories. Genome Res 19: 770–777.
52. Murphy WJ, Larkin DM, Everts-van der Wind A, Bourque G, Tesler G, et al.
(2005) Dynamics of mammalian chromosome evolution inferred from
multispecies comparative maps. Science 309: 613–617.
53. Goltsev Y, Rezende GL, Vranizan K, Lanzaro G, Valle D, et al. (2009)
Developmental and evolutionary basis for drought tolerance of the Anopheles
gambiae embryo. Dev Biol 330: 462–470.
54. Fontanillas P, Hartl DL, Reuter M (2007) Genome organization and gene
expression shape the transposable element distribution in the Drosophila
melanogaster euchromatin. PLoS Genet 3: e210.
55. Mathiopoulos KD, della Torre A, Santolamazza F, Predazzi V, Petrarca V, et
al. (1999) Are chromosomal inversions induced by transposable elements? A
paradigm from the malaria mosquito Anopheles gambiae. Parassitologia 41:119–123.
56. Aulard S, Vaudin P, Ladeveze V, Chaminade N, Periquet G, et al. (2004)
Maintenance of a large pericentric inversion generated by the hobo transposable
element in a transgenic line of Drosophila melanogaster. Heredity 92: 151–155.
57. Lyttle TW, Haymer DS (1992) The role of the transposable element hobo in theorigin of endemic inversions in wild populations of Drosophila melanogaster.
Genetica 86: 113–126.
Mosquito Chromosome Evolution
PLoS ONE | www.plosone.org 12 May 2010 | Volume 5 | Issue 5 | e10592

58. Sharakhov IV, White BJ, Sharakhova MV, Kayondo J, Lobo NF, et al. (2006)
Breakpoint structure reveals the unique origin of an interspecific chromosomalinversion (2La) in the Anopheles gambiae complex. Proc Natl Acad Sci U S A
103: 6258–6262.
59. Goidts V, Szamalek JM, Hameister H, Kehrer-Sawatzki H (2004) Segmentalduplication associated with the human-specific inversion of chromosome 18: a
further example of the impact of segmental duplications on karyotype andgenome evolution in primates. Hum Genet 115: 116–122.
60. Coulibaly MB, Lobo NF, Fitzpatrick MC, Kern M, Grushko O, et al. (2007)
Segmental duplication implicated in the genesis of inversion 2Rj of Anophelesgambiae. PLoS ONE 2: e849.
61. Bailey JA, Baertsch R, Kent WJ, Haussler D, Eichler EE (2004) Hotspots ofmammalian chromosomal evolution. Genome Biol 5: R23.
62. Wang G, Christensen LA, Vasquez KM (2006) Z-DNA-forming sequencesgenerate large-scale deletions in mammalian cells. Proc Natl Acad Sci U S A
103: 2677–2682.
63. Lawson D, Arensburger P, Atkinson P, Besansky NJ, Bruggner RV, et al. (2009)VectorBase: a data resource for invertebrate vector genomics. Nucleic Acids Res
37: D583–587.
64. Haider S, Ballester B, Smedley D, Zhang J, Rice P, et al. (2009) BioMart Central
Portal–unified access to biological data. Nucleic Acids Res 37: W23–27.
65. Benson G (1999) Tandem repeats finder: a program to analyze DNA sequences.
Nucleic Acids Res 27: 573–580.
66. Bailey JA, Yavor AM, Massa HF, Trask BJ, Eichler EE (2001) Segmental
duplications: organization and impact within the current human genome project
assembly. Genome Res 11: 1005–1017.
67. Frisch M, Frech K, Klingenhoff A, Cartharius K, Liebich I, et al. (2002) In silico
prediction of scaffold/matrix attachment regions in large genomic sequences.
Genome Res 12: 349–354.
68. Zdobnov EM, Apweiler R (2001) InterProScan–an integration platform for the
signature-recognition methods in InterPro. Bioinformatics 17: 847–848.
69. Boyle EI, Weng S, Gollub J, Jin H, Botstein D, et al. (2004) GO::TermFinder–
open source software for accessing Gene Ontology information and finding
significantly enriched Gene Ontology terms associated with a list of genes.
Bioinformatics 20: 3710–3715.
Mosquito Chromosome Evolution
PLoS ONE | www.plosone.org 13 May 2010 | Volume 5 | Issue 5 | e10592
Related Documents