Genetically Engineered Crops and Pesticide Use in the United States: The First Nine Years Charles M. Benbrook BioTech InfoNet Technical Paper Number 7 October 2004

Welcome message from author
This document is posted to help you gain knowledge. Please leave a comment to let me know what you think about it! Share it to your friends and learn new things together.
Transcript

Genetically Engineered Crops and Pesticide Use in the United States: The First Nine Years Charles M. Benbrook BioTech InfoNet Technical Paper Number 7 October 2004

TABLE OF CONTENTS
EXECUTIVE SUMMARY................................................................................................ 1
PESTICIDE REDUCTION CLAIMS ARE UNFOUNDED ............................................................... 2
INTRODUCTION ............................................................................................................ 5
HERBICIDE-TOLERANT CROPS ............................................................................................ 6 BT TRANSGENIC TECHNOLOGY ........................................................................................... 8
ACREAGE PLANTED TO GENETICALLY MODIFIED VARIETIES AND PESTICIDE USE, 1996 THROUGH 2004................................................................ 9
ACREAGE PLANTED TO GENETICALLY MODIFIED VARIETIES............................................... 11
AVERAGE PESTICIDE USE ON GE AND CONVENTIONAL CROP ACRES .. 14
ESTIMATING AVERAGE APPLICATION RATES BY GE TECHNOLOGY ..................................... 15 HERBICIDE-TOLERANT CORN............................................................................................ 17 HERBICIDE-TOLERANT SOYBEANS..................................................................................... 21 SPECIAL TABULATION IN 1998 PROVIDES SOLID DATA POINT ......................................... 23 HERBICIDE-TOLERANT COTTON........................................................................................ 25 BT TRANSGENIC CORN .................................................................................................... 26 BT TRANSGENIC COTTON ................................................................................................ 30
IMPACTS OF GE CROP TECHNOLOGY ON PESTICIDE USE, 1996-2004 . 32
SIGNIFICANT FINDINGS ACROSS THREE MAJOR CROPS..................................................... 33 CONCLUSIONS AND FUTURE PROSPECTS ........................................................................... 36
Charts, Figures and Tables
FIGURE 1. GLYCINE (G9) RESISTANT WEEDS........................................................... 6 TABLE 1. CORN, SOYBEAN AND COTTON ACREAGE PLANTED, AVERAGE PESTICIDE USE PER
ACRE, AND TOTAL POUNDS APPLIED; 1996-2004 (SUMMARY)............................... 9 TABLE 2. SHIFT TO LOW-DOSE CORN HERBICIDES FROM 1996 AND 2003: NUMBER OF TOP
TEN NATIONALLY APPLIED ACTIVE INGREDIENTS BY RATE OF APPLICATION .............. 10 TABLE 3. PERCENT OF NATIONAL ACRES PLANTED TO ALL HERBICIDE-TOLERANT (HT) AND BT
TRANSGENIC CROP VARIETIES, 1996-2004.................................................... 11 CHART 1. TRENDS IN THE PERCENT OF NATIONAL CROP ACREAGE PLANTED TO HERBICIDE-
TOLERANT AND BT TRANSGENIC CROPS, 1996-2004 ........................................ 12 TABLE 4. HERBICIDE POUNDS APPLIED PER ACRE TO CONVENTIONAL AND HERBICIDE-
TOLERANT (HT) CORN, 1996-2004 ............................................................ 18 TABLE 5. DIFFERENCE IN Average HERBICIDE APPLICATION RATES PER ACRE ON HERBICIDE-
TOLERANT (HT) VERSUS CONVENTIONAL SOYBEANS, 1998................................. 24 CHART 2. TRENDS IN INSECTICIDE APPLICATIONS TO MANAGE THE EUROPEAN CORN BORER
AND SOUTHWESTERN CORN BORER AND THE REDUCTION IN INSECTICIDE USE ON BT CORN ACRES .......................................................................................... 29
TABLE 6. SHIFT TO LOW-DOSE COTTON INSECTICIDES FROM 1996 AND 2003: NUMBER OF TOP TWELVE NATIONALLY APPLIED ACTIVE INGREDIENTS BY RATE OF APPLICATION ... 31
CHART 3. SHARES OF HT AND BT ACRES PLANTED TO THREE MAJOR CROPS ................. 32 CHART 4. CHANGES IN PESTICIDE USE IN THE FIRST THREE YEARS OF COMMERCIALIZATION
COMPARED TO THE LAST SIX YEARS, 1996-2004............................................. 33 TABLE 7. AVERAGE PESTICIDE POUNDS APPLIED PER ACRE PLANTED TO CONVENTIONAL,
HERBICIDE-TOLERANT (HT) AND BT TRANSGENIC VARIETIES AND ESTIMATED DIFFERENCES PER ACRE, 1996-2004 ........................................................... 34
CHART 5. ANNUAL PERCENT CHANGE IN PESTICIDE USE BROUGHT ABOUT BY HERBICIDE- TOLERANT AND BT TRANSGENIC CORN, SOYBEANS AND COTTON ........................... 36
APPENDIX TABLES 1-11 ................................................................................... 39

Acknowledgements The analysis in this report relies heavily on the good work of the USDA’s National Agricultural Statistics Service (NASS). While NASS pesticide use data are neitherperfect nor complete, the annual NASS survey on pesticide use in major field crops is the best and only source of publicly accessible, national data on pesticide use. NASS data are consistent over time and across production regions, key attributesfor an assessment over several years such as the one reported herein.
Thanks to Karen Lutz Benbrook for compiling NASS pesticide use data into a database that allows more in-depth analyses. She also did an excellent job in pro-ducing the report’s final format and layout. Several pest management specialists working at land grant universities pro- vided guidance regarding recent developments in the field and the appropriate in- terpretation of USDA data. The entomologists and weed science specialists at sev- eral universities, in particular Iowa State University, the University of Illinois, PurdueUniversity, University of Arizona, and the University of Wisconsin are conducting andreporting independent analyses of the impacts, performance, costs and benefits oftoday’s genetically engineered crops. Thank you to them for their important and on- going work. Also thanks to the Union of Concerned Scientists for providing the fundingthat made it possible for this analytical work to be carried out. This report was pre- pared by Benbrook Consulting Services and is being provided free of charge via Ag BioTech InfoNet as a public service.
EXECUTIVE SUMMARY
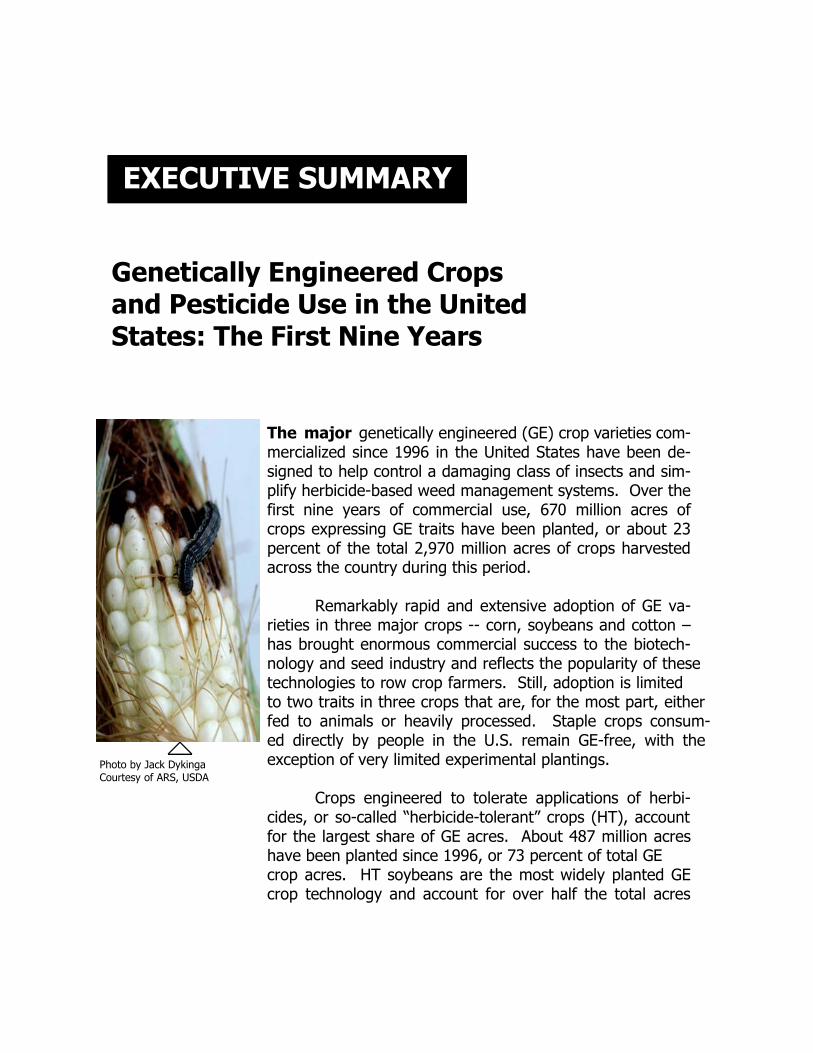
The major genetically engineered (GE) crop varieties com-mercialized since 1996 in the United States have been de-signed to help control a damaging class of insects and sim-plify herbicide-based weed management systems. Over the first nine years of commercial use, 670 million acres of crops expressing GE traits have been planted, or about 23 percent of the total 2,970 million acres of crops harvested across the country during this period.
Remarkably rapid and extensive adoption of GE va-
rieties in three major crops -- corn, soybeans and cotton – has brought enormous commercial success to the biotech-nology and seed industry and reflects the popularity of thesetechnologies to row crop farmers. Still, adoption is limitedto two traits in three crops that are, for the most part, either fed to animals or heavily processed. Staple crops consum-ed directly by people in the U.S. remain GE-free, with theexception of very limited experimental plantings.
Crops engineered to tolerate applications of herbi-
cides, or so-called “herbicide-tolerant” crops (HT), account for the largest share of GE acres. About 487 million acres have been planted since 1996, or 73 percent of total GE crop acres. HT soybeans are the most widely planted GE crop technology and account for over half the total acres
Genetically Engineered Crops and Pesticide Use in the United States: The First Nine Years
Photo by Jack Dykinga Courtesy of ARS, USDA
planted to GE varieties since 1996. The vast majority of HT crops are engineered to tolerate glyphosate (trade name “Roundup”), a herbicide introduced to the market in 1972, by Monsanto. Crops engineered to tolerate glyphosate are also called “Roundup Ready.”
Corn and cotton have been genetically engineered to express the bacterial
toxin Bacillus thuringiensis, or Bt. This transgenic trait allows plants to manufac-ture within their cells a crystalline protein that is toxic to most Lepidopteran in-sects. Some 183 million acres of Bt transgenic corn and cotton have been planted since 1996, representing 27 percent of total GE crop acreage.
2. The First Nine Years - Executive Summary
Pesticide Reduction Claims are Unfounded
The debate over the costs, risks, and benefits of agricultural biotechnology has been underway for about a decade, with no end in sight. Throughout this period, biotech proponents have claimed repeatedly that today’s GE crop technologies are re-ducing pesticide use. A comprehensive accounting of the im-pacts of HT and Bt transgenic varieties on total pesticide use demonstrates unequivocally that in the first three years of commercial use, this claim was justified. But since 1999 it has not been.
GE corn, soybeans and cotton have led to a 122 million
pound increase in pesticide use since 1996. While Bt crops have reduced insecticide use by about 15.6 million pounds over this period, HT crops have increased herbicide use 138 million pounds. Bt crops have reduced insecticide use on corn and cotton about 5 percent, while HT technology has increased herbicide use about 5 percent across the three major crops. But since so much more herbicide is used on corn, soybeans, and cotton, compared to the volume of insecticide applied to corn and cotton, overall pesticide use has risen about 4.1 per-cent on acres planted to GE varieties.
The increase in herbicide use on HT crop acres should
come as no surprise. Weed scientists have warned for about a
“Since 1990, suggested gly-phosate rates have increased by 50% to 200% on certain weeds includ-ing ryegrass, horseweed, fox-tail, barnyardgrass and water-hemp.”
Farm Journal Spring 2004
decade that heavy reliance on HT crops would trigger changes in weed communities and resistance, in turn forcing farmers to apply additional herbicides and/or increase herbi-cide rates of application. The ecological adaptations predi-cated by scientists have been occurring in the case of Roundup Ready crops for three or four years and appear to be accelerating. Farmers across the American Midwest look back fondly on the initial efficacy and simplicity of the Roundup Ready system and many miss the “good old days.”
Reliance on a single herbicide, glyphosate, as the pri-
mary method for managing weeds on millions of acres planted to HT varieties remains the primary factor that has led to the need to apply more herbicides per acre to achieve the same level of weed control.
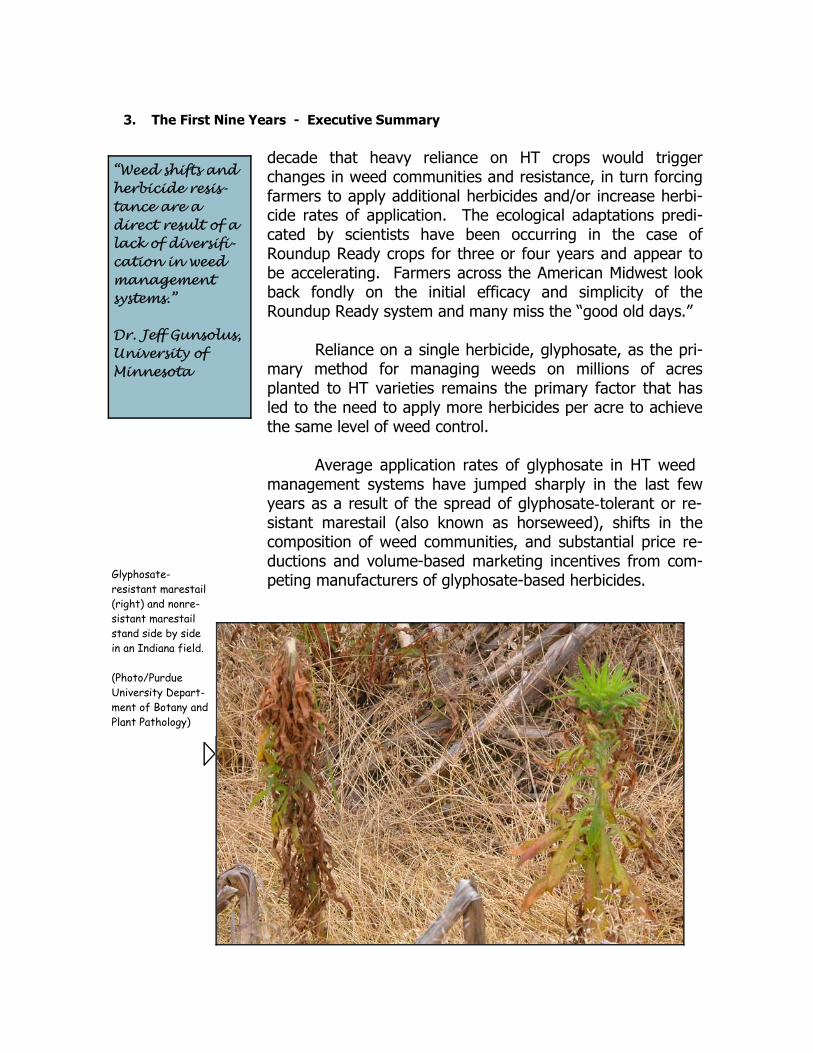
Average application rates of glyphosate in HT weed
management systems have jumped sharply in the last few years as a result of the spread of glyphosate-tolerant or re-sistant marestail (also known as horseweed), shifts in the composition of weed communities, and substantial price re-ductions and volume-based marketing incentives from com-peting manufacturers of glyphosate-based herbicides.
3. The First Nine Years - Executive Summary
“Weed shifts and herbicide resis-tance are a direct result of a lack of diversifi-cation in weed management systems.” Dr. Jeff Gunsolus, University of Minnesota
Glyphosate-resistant marestail (right) and nonre-sistant marestail stand side by side in an Indiana field. (Photo/Purdue University Depart-ment of Botany and Plant Pathology)

While ecological changes are pushing herbicide use upward on HT crop
acres, regulatory forces and industry innovation are edging average application rates downward on land planted to conventional varieties. S-metolachlor herbi-cide was registered in time for the 1997 crop season. It is a new and more bio-logically active version of metolachlor, an older, high-rate herbicide. S-metolachlor is applied at 65 percent of the rate of original metolachlor and has reduced herbicide use by 10 to 12 million pounds per year since 1998. The Envi-ronmental Protection Agency also placed new restrictions on the most widely used corn herbicide, atrazine, triggering substantial drops in per acre application rates in 2000 and again in 2002.
As a result, the difference in the total pounds of herbicides applied per
acre planted to HT crops compared to non-HT conventional varieties has in-creased steadily since 2000. Three factors – the emergence and spread of weeds resistant or less sensitive to glyphosate, limited supplies of conventional crop seeds in a number of popular maturity groups, and aggressive herbicide price cut-ting by companies seeking a larger share of the market -- are working together to create the “perfect storm” that now threatens to undermine the efficacy of HT technology.
For the foreseeable future, HT crops will increase pesticide use
more than Bt transgenic crops reduce it. Unlike the worrisome erosion in the ef-ficacy of HT technology, Bt transgenic corn targeting the European corn borer, and Bt cotton continue to perform well. Resistance management plans appear to be working.
For all current and future pest management related GE technologies, when
and how GE varieties are utilized will determine their cost, benefits and longevity. The unraveling of HT technology is just the latest reminder that too much of a good thing is the kiss of death in the world of pest management
4. The First Nine Years - Executive Summary

INTRODUCTION Today’s genetically engineered (GE) crops are designed to simplify and expand the use of pesticide-based strategies for the management of common weed and Lepidopteran in-sect pests. Proponents of biotechnology claim that today’s GE varieties substantially reduce pesticide use, a claim not substantiated by U. S. Department of Agriculture (USDA) data and reports. Here, USDA data on the acreage planted to GE crops and pesticide use are relied on in calculating the overall impact of GE crops on the volume of pesticides ap-plied in the production of corn, soybeans, and cotton during the period 1996-2004. All USDA studies done to date on the impacts of GE crop technology on pesticide use have focused on the first three years of adoption, 1996-1998, and are accessible via the Economic Research Service’s “Key Topics” page on bio-technology (http://www.ers.usda.gov/Topics/view.asp?T=101000). Analyses by Leonard Gianessi sponsored by the biotechnology industry have projected positive impacts on pesticide use, most recently in crop year 2001, and can be accessed on the website of the National Center for Food and A g r i c u l t u r a l P o l i c y ( h t t p : / /w w w . n c f a p . o r g /whatwedo/40casestudies.php). No study by USDA or pri-vate analysts has estimated nor reported the impacts in re-cent years. This is the first comprehensive estimate of the impacts of GE crops on pesticide use over the nine years of commercial use, since 1996.
This report draws on official USDA statistics on the acreage planted to GE varieties from 1996 through 2004, coupled with USDA data on the volume of pesticides applied to corn, soybeans, and cotton. These three crops account for nearly all acres planted to GE crops in the United States. The analysis addresses the impacts of the two major types of GE traits –
• Herbicide-tolerant (HT) corn, soybeans and cotton; • Bacillus thuringiensis (Bt) transgenic corn and cotton.
Photo by Scott Bauer Courtesy of ARS, USDA

6. The First Nine Years - Introduction
Herbicide-Tolerant Crops
Herbicide-tolerant (HT) crops allow farmers to spray broad-spectrum herbicides over the top of growing plants, controlling most weeds while leaving crops largely un-harmed. HT weed management systems are simple, flexible, and forgiving, and in most years and regions, they have been very effective, at least until recent years. Good performance coupled with ease of use explains why farmers have so enthusiastically embraced HT crops.
The economic impacts of HT crops have been com-
plex and dynamic. In the first three years of adoption, most farmers attained adequate control of weeds with a single application of glyphosate herbicide. As Roundup Ready (RR) crops gained market share at the expense of other herbicides, the companies losing market share cut herbicide prices aggressively. By 2000, the average cost of soybean herbicides had been cut about 40 percent, saving farmers hundreds of millions per year. These sav-ings, however, have nothing to do with the inherent effi-ciency of HT technology; competitive forces in a hotly contested marketplace were the cause.
In 2000 patent protection for glyphosate herbicide
came to an end, allowing generic competitors to enter the market. Since 2001, the price of glyphosate as fallen steadily to about one-half to one-third the level in 1996 when HT crops were first introduced. In September 2004, Monsanto announced further price reductions for Roundup brand herbicides for crop year 2005, coupled with substantial enhancements in their incentive pro-grams for farmers agreeing to buy Monsanto seed and apply only Monsanto-brand herbicides. This sort of bun-dling of inputs is an increasingly common tactic used in fiercely contested agricultural input markets and has at-tracted the attention of the antitrust division of the De-partment of Justice.
Current Inventory of Glyphosate-Resistant
Weeds
Conyza bonariensis Hairy Fleabane
South Africa—2001 Spain—2004
Conyza canadensis Horseweed
USA— 2000-2004
Eleusine indica Goosegrass
Malaysia —1997
Lolium multiflorum Italian Ryegrass
Chile– 2001-2002 Brazil-2003
Lolium rigidum Rigid Ryegrass
Australia– 1996—1997, 2000
USA– 1998 South Africa-2001
Plantago lanceolata Buckhorn Plantain
South Africa-2003
Figure 1. Glycine (G/9) Resistant Weeds by Species and Country. Weedscience.org (International Survey of Herbicide Resistant Weeds)

7. The First Nine Years - Introduction
While glyphosate prices have fallen, use rates have risen, as has the need for farmers to apply additional herbicides to deal with tough-to-control grass weeds and weed species that have attained either tolerance or resistance to gly-phosate. So despite dramatic, across-the-board decreases in the price of herbi-cides in 2002-2004, farmers are spending about the same amount on weed con-trol because they have to spray two to three different herbicides, have to spray more times, and they are still paying a significant premium for HT seed.
Until the widespread adoption of RR crops, weed scientists had confirmed
only two cases of glyphosate-resistant weeds – rigid ryegrass in Australia, South Africa, and the U.S., and goosegrass in Malaysia. Six different weeds are now re-sistance in multiple countries and states, and there is a long list of weeds that have developed a degree of tolerance sufficient to require applications of other herbicides. The Weed Science Society of America maintains an up to date global registry of resistance weeds. (See the sidebar, p. 6 for the current list of gly-phosate-resistant weeds)
Glyphosate-resistant ryegrass in (NSW) Australia. Photo by Andrew Storrie ([email protected])

8. The First Nine Years - Introduction
Bt Transgenic Technology
The other major category of GE crops has been engineered to produce one or more of several crystalline forms of the natural bacterial toxin Bacillus thuringiensis (Bt). Unlike chemical insecticides that are sprayed typically in a liquid form one to three times a season to control Lepidopteran insects, Bt toxins are manufactured continuously inside and throughout the plant, exposing both target and nontarget organisms feeding on the plant, or on plant roots, to Bt toxins. The technology is inherently prophylactic, since the plant manufactures the Bt toxins whether or not insect populations exceed economic thresholds (the level of pest infestation at which crop losses exceed the cost of control interventions).
When an acre is planted to a Bt transgenic variety, several changes often occur in the range of pest and beneficial species residing in the field. Sometimes the absence of insecticide applications targeting Lepidopteran insects creates an ecological window allowing other secondary insects to increase to potentially dam-aging levels. In other cases, lessened use of the generally broad-spectrum chemis-try used to control Lepidoptera insects allows a range of beneficial arthropods to flourish in crop fields, reducing other insect problems. Sometimes both phenom-ena occur simultaneously, with secondary pest problems typically emerging rather quickly, followed by a gradual reduction in insect pest pressure as beneficial insect populations are established and thrive.
As a result, it is complicated to carry out a full accounting of the net impact
of Bt varieties on insect populations and insecticide uses. There is another impor-tant factor that should be taken into account in estimating the net impact of Bt transgenic technology on insecticide use. The Bt toxin that is produced continu-ously in Bt-transgenic plant tissues is an insecticide that is nearly identical to the Bt toxins that are the active ingredients in liquid Bt insecticide sprays. The volume of Bt toxin produced over a full season in a field of Bt transgenic plants should be cal-culated and then counted in estimating the impacts of Bt technology on insecticide use. Doing so is difficult and beyond the scope of this report, and indeed no such estimate has been disclosed or published. Accordingly, this report’s estimates of the impact of Bt crops on average insecticide use per acre overstate the actual im-pact by an amount equal to the quantity of Bt toxin produced by the plants on an average acre planted to a Bt transgenic variety.
ACREAGE PLANTED TO GENETICALLY MODIFIED VARIETIES AND PESTICIDE USE, 1996-2004
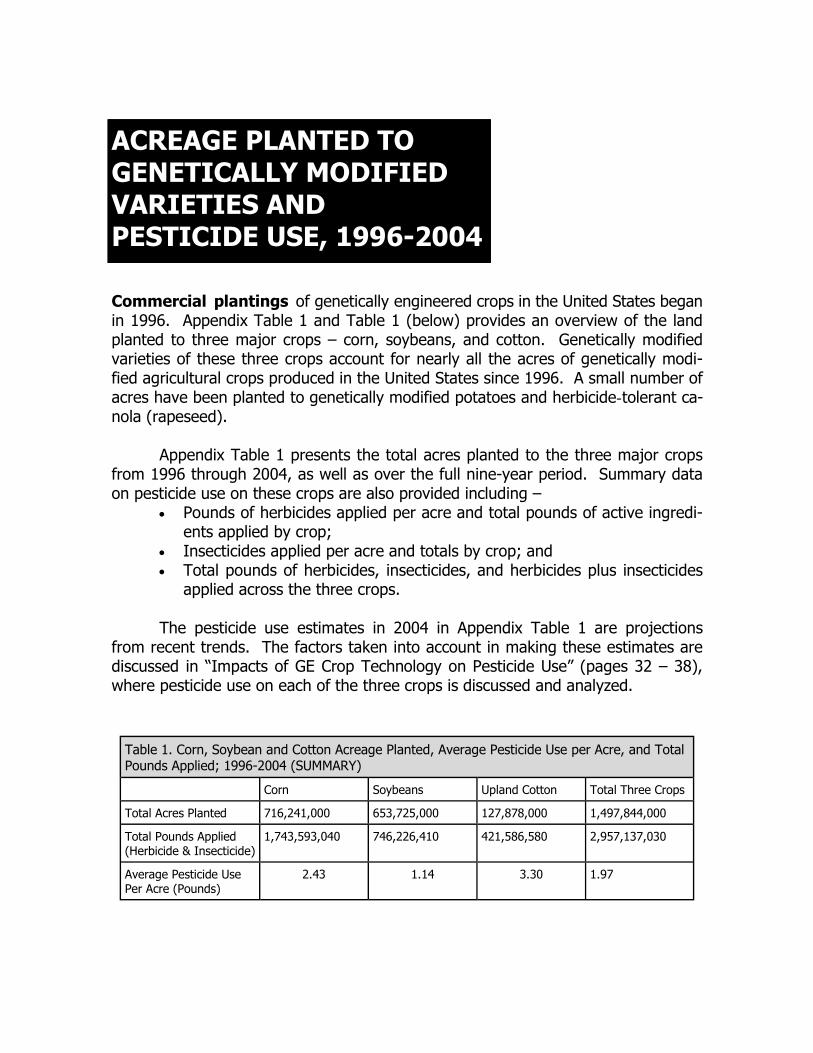
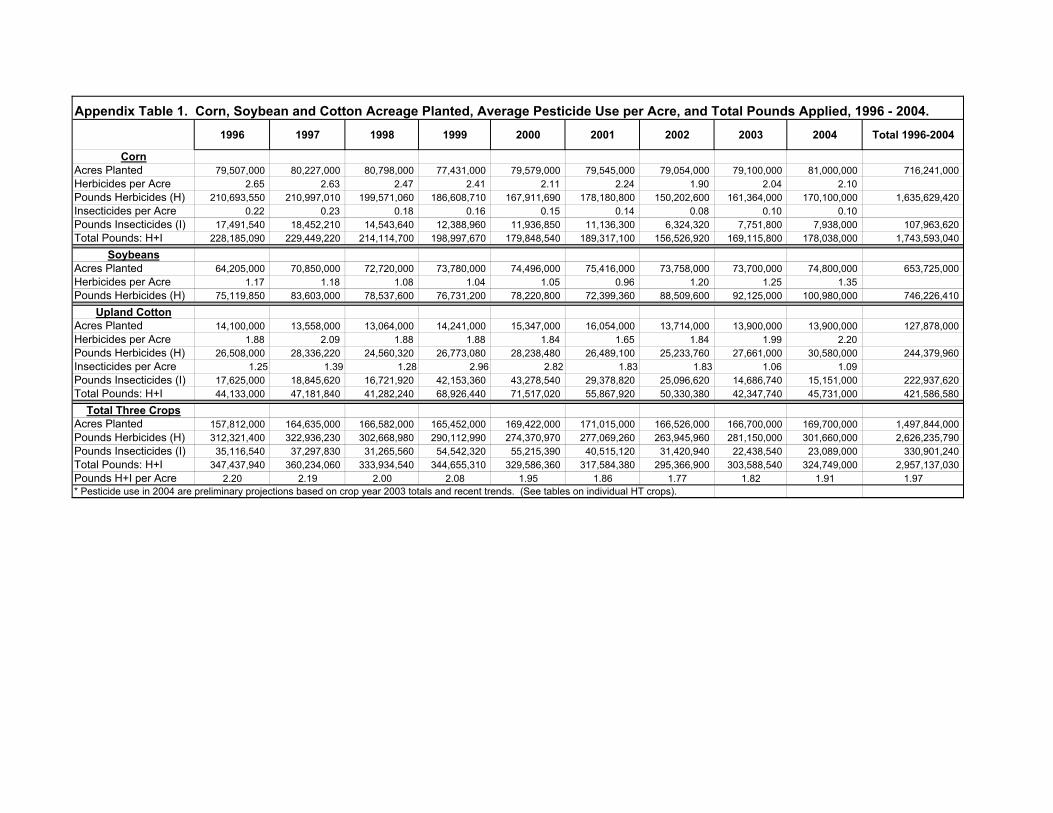
Commercial plantings of genetically engineered crops in the United States began in 1996. Appendix Table 1 and Table 1 (below) provides an overview of the land planted to three major crops – corn, soybeans, and cotton. Genetically modified varieties of these three crops account for nearly all the acres of genetically modi-fied agricultural crops produced in the United States since 1996. A small number of acres have been planted to genetically modified potatoes and herbicide-tolerant ca-nola (rapeseed).
Appendix Table 1 presents the total acres planted to the three major crops
from 1996 through 2004, as well as over the full nine-year period. Summary data on pesticide use on these crops are also provided including –
• Pounds of herbicides applied per acre and total pounds of active ingredi-ents applied by crop;
• Insecticides applied per acre and totals by crop; and • Total pounds of herbicides, insecticides, and herbicides plus insecticides
applied across the three crops. The pesticide use estimates in 2004 in Appendix Table 1 are projections
from recent trends. The factors taken into account in making these estimates are discussed in “Impacts of GE Crop Technology on Pesticide Use” (pages 32 – 38), where pesticide use on each of the three crops is discussed and analyzed.
Corn Soybeans Upland Cotton Total Three Crops
716,241,000 653,725,000 127,878,000 1,497,844,000
1,743,593,040 746,226,410 421,586,580 2,957,137,030
Table 1. Corn, Soybean and Cotton Acreage Planted, Average Pesticide Use per Acre, and Total Pounds Applied; 1996-2004 (SUMMARY)
Total Acres Planted
Total Pounds Applied (Herbicide & Insecticide)
Average Pesticide Use Per Acre (Pounds)
2.43 1.14 3.30 1.97

10. The First Nine Years - Acreage Planted to GE Varieties and Pesticide Use
In the nine years since the introduction of geneti-cally modified varieties of corn, soybeans, and cotton, the intensity of herbicide and insecticide use per acre has declined modestly on average from 2.2 pounds of active ingredients per acre to about 1.9 pounds, or by about 14 percent. Most of the reduction has been brought about by the registration and adoption of pesti-cides applied at markedly lower rates per acre than the older products they have displaced. Herbicide use in these crops was still dominated in 1996 by products ap-plied at rates of 1.0 pound to over 2.0 pounds per acre. Likewise, insecticides applied at relatively high rates, sometimes up to 1.0 pound per acre, still accounted for a significant share of the corn and cotton acres treated with insecticides.
Today, low-dose chem-istry accounts for the lion’s share of acres treated with both her-bicides and insecti-cides. Several products are applied at rates less than 0.1 pound per acre, and some at rates below 0.01 pound per acre.
Today, low-dose chemistry accounts for the lion’s share of acres treated with both herbicides and insecticides. Several products are applied at rates less than 0.1 pound per acre, and some are sprayed at rates below 0.01 pound per acre. For example, the most widely used corn insecticide in 1996 was permethrin, an in-secticide then applied at an average rate of 0.12 pound per acre. The dominant in-secticide applied in 2003 was cyfluthrin, a product effective at just 0.006 pound per acre. In soybean production, 27 percent of national acres in 1996 were treated with the herbicide pendimethalin at an average rate of 0.97 pounds per acre, and trifluralin was applied on 20 percent of national acres at a rate of 0.88 pounds. From 1996 to 2002, the combined percent of soybean acres treated with these two high-dose herbicides dropped from 49 percent to 16 percent. In 2002, sixteen her-bicides were applied at average rates below 0.1 pound per acre on conventional soybeans. The shift to lower-dose herbicides in corn production is summarized in Appendix Table 2.
Table 2. Shift to Low-Dose Corn Herbicides from 1996 and 2003: Number of Top Ten Nationally Applied Active Ingredients by Rate of Application
Rate of Application (pound of AI per Acre) 1996 2003
>2.0 1 0
1.5—1.99 3 1
1.0—1.49 2 2
0.5—0.99 0 2
0.1—0.49 3 2
<0.1 1 3
Source: U.S.D.A. National Agricultural Statistic Service (NASS), Agricultural Chemical Usage, Field Crop Summary, 1996 and 2003.

11. The First Nine Years - Acreage Planted to GE Varieties and Pesticide Use
Accurate data is available from the U.S. Department of Agri-culture’s Economic Research Service (ERS) on the percent of crop acres planted to GE varieties by State and nationally. ERS acreage estimates are based on farm-level survey data col-lected by USDA’s National Agricultural Statistics Service (NASS). Table 3 summarizes recently released ERS data on the percent of total national crop acres planted to herbicide- tolerant (HT) and Bt transgenic varieties of corn, soybeans, and cotton. All estimates of the acres planted to GE varieties in this report are derived from these USDA estimates of per-cent acres planted to GE technology, coupled with the total acres planted to each of the three major crops in Table 1. Three appendix tables (Appendix Tables 2, 3, and 4) present more detailed information by crop and by State on the percent of acres planted to GE varieties. Chart 1 shows the trends over time in the percent of acres planted to HT and Bt trans-genic varieties.
Acreage Planted to Genetically Modified Varieties
Table 3. Percent of National Acres Planted to All Herbicide-Tolerant (HT) and Bt Transgenic Crop Va-rieties, 1996—2004 [Combines percent acres planted to HT only and Bt only varieties with percent planted to stacked varieties]
1996 1997 1998 1999 2000 2001 2002 2003 2004*
———————All Herbicide-Tolerant Varieties————————–
Corn 3% 4.3% 18.4% 9% 7% 8% 11% 15% 18%
Soybeans 7.4% 17% 44.2% 57% 54% 68% 75% 81% 85%
Cotton 15% 15% 16.8% 34% 46% 56% 58% 59% 60%
———————All Bt Transgenic Varieties————————–
Corn 1.4% 7.6% 19.1% 25.6% 24.5% 19% 24% 29% 32%
Soybeans 0% 0% 0% 0% 0% 0% 0% 0% 0%
Cotton 12.7% 15.3% 19% 29% 28.7% 37% 35% 41% 46%
*Acres planted in 2004 are preliminary USDA projections

12. The First Nine Years - Acreage Planted to GE Varieties and Pesticide Use
Herbicide-tolerant soybeans were planted on 85 per-cent of national crop acreage in 2004, up 4 percent from 2003. The rate of adoption of herbicide-tolerant corn is clearly increasing at a much slower pace than in the case of soybeans. Some 18 percent of national corn acres were planted to HT varieties in 2004, reflecting an average annual growth rate of under 2 percent of national corn acres per year since commercial introduction in 1996. In contrast, the rate of growth in adoption of HT soybeans has been about four-times greater.
Chart 1. Trends in the Percent of National Crop Acreage Planted to Herbicide-Tolerant and Bt Transgenic Crops, 1996-2004
0102030405060708090
1996 1997 1998 1999 2000 2001 2002 2003 2004
Years
Perc
ent N
atio
nal A
cres
Pl
ante
d
Bt cottonBt cornHT cottonHT soyHT corn
Bt transgenic corn varieties were planted on an esti-mated 32 percent of total crop acres in 2004, up modestly from 2003. Since 1998, the percentage of corn acres planted to Bt corn has varied from 19 percent to 32 percent. Adoption went down in two years since 1998 and has risen in four years. Bt cotton was adopted on 12.7 percent of national acres in its first year of introduction and now is planted on about 46 per-cent of total acres.
Appendix Table 5 presents the national acres of corn, soybeans and cotton planted to herbicide-tolerant varieties for 1996-2004 and totals for the nine-year period. In 1996, the first year of commercial introduction, HT technology was used on 5.8 percent of the acres planted to the three major crops. The share planted to HT crops almost doubled in 1997, and then almost tripled in 1998. Growth has slowed since,
reaching 51 percent of the acreage planted to the three crops in 2004.
The dominance of herbicide-tolerant soybeans as a
share of total acres planted to HT varieties since 1996 is evi-dent in Appendix Table 5. Over the first nine years of com-mercial planting of HT varieties, HT soybeans have accounted for three-quarters of the total HT acres planted, and 54 per-cent of total GE plantings, including both HT and Bt transgenic acres. This is why the impact of HT soybeans on herbicide use plays such a major role in determining the overall impact of GE crop technology on total pesticides use since 1996.
National acres planted by crop to Bt transgenic varieties
of corn and cotton is presented in Appendix Table 6 for the pe-riod 1996-2004. A total of 182.6 million acres have been planted since 1996, with corn accounting for about 80 percent
13. The First Nine Years - Acreage Planted to GE Varieties and Pesticide Use
Over the first nine years of commercial use , HT soy-beans have ac-counted for three-quarters of the total HT-acres planted, and 54 percent of total GE plantings (HT plus Bt trans-genic acres).
and cotton, 20 percent. Corn acres planted to Bt varieties actually fell in 2000 and 2001, and cotton acres planted declined from 2001 to 2002. But over the full nine-year period, the percent of total national corn plus cotton acres planted to Bt varie-ties increased from 3.1 percent to 34.1 percent.
As in the case with HT varieties, the rapid growth in adoption of Bt trans-genic varieties occurred in the first four years of commercial use. In crop year 2004, the first corn varieties engineered to express the Cry 3Bb Bt toxin for control of corn rootworms were introduced. Appendix Table 6 does not include the esti-mated two to four million acres planted to these new varieties.
AVERAGE PESTICIDE USE ON GE AND CONVENTIONAL CROP ACRES
Despite longstanding public debate over the im-pact of GE crop technology on pesticide use, the USDA does not routinely collect nor report data com-paring the average pounds of pesticides applied per acre on cropland planted to GE varieties compared to conventional varieties. Accordingly, indirect meth-ods must be used to estimate pesticide use on GE versus conventional crop acres.
Calculations in this report of the impacts of GE
varieties on average per acre pesticide use are based on publicly accessible National Agricultural Statistics Service (NASS) pesticide use data specific to a given crop, year, and pesticide. A three-step methodology is used.
First, the number of acres producing HT and
Bt transgenic crops each year is calculated using USDA data on the total acres planted to corn, soy-beans, and cotton by year, and the percent of acres
planted to various GE crops, as shown in Appendix Tables 1 through 6. Appendix Tables 2 through 4 present more detailed adoption data by State. There is wide-spread agreement on these estimates, although a survey carried out by the Ameri-can Corn Growers Association in the early summer, 2004, suggests that the USDA estimate of adoption of Bt corn in 2004 may be marginally inflated.
Second, the average pounds of pesticides applied per acre on conventional (non-GE) acres are calculated for each year and GE technology, along with the av-erage rate of application on acres planted to each GE trait. The rate applied to the GE portion of the crop is then compared to the rate applied to conventional acres, producing an estimate of the average difference in pesticide use between conven-tional and GE-planted acres. The differential is measured in pounds of herbicide or insecticide active ingredient per acre. This approach rests on the assumption that an acre not planted to the GE trait would receive the same volume of pesticide ap-plications as acres planted to non-GE varieties.
15. The First Nine Years - Average Pesticide Use
In the third and last step, the difference in pesticide pounds applied per acre for each GE technology for a given year is multiplied by the acres planted to the GE crop that year, producing an estimate of the increase or decrease in pesti-cide use. These differences are then added across the nine-year period, produc-ing estimates of the total impact of HT and Bt transgenic varieties on herbicide and insecticide use, both by crop and by trait.
Estimating Average Application Rates by GE Technology
Annual USDA-NASS pesticide use surveys are the only publicly accessible, consistent time-series data on the volume of pesticides applied on corn, soybeans, and cotton. Even for these three major field crops, USDA does not collect pesticide use data every year. No cotton data was collected in 2002 and remarkably, given the intense public debate over herbi-cide use in HT soybeans, no soybean pesticide use data was collected in 2003. In both cases, pesticide use estimates in this report for the missing years were based on extrapolation of trends in recent years.
By state and at the national level for a variety of crops, NASS surveys record and report the percent of acres treated with a given pesticide, the average rate of application (for each distinct application), the average number of applications, the rate per crop year (average one-time rate multiplied by the number of applica-tions), and the total pounds applied. Electronic copies of annual NASS survey re-sults covering 1991 through 2003 are accessible at:
http://usda.mannlib.cornell.edu/reports/nassr/other/pcu-bb/#field
In the case of herbicide-tolerant crops, the pounds of herbicides applied per HT crop acre in a given year were estimated by adding together the glyphosate rate of application in that year as reported by NASS, and an estimate of the aver-age pounds of other herbicides applied. The basis for the estimates of other herbi-cide use on HT acres for each crop is discussed in the following sections.
16. The First Nine Years - Average Pesticide Use
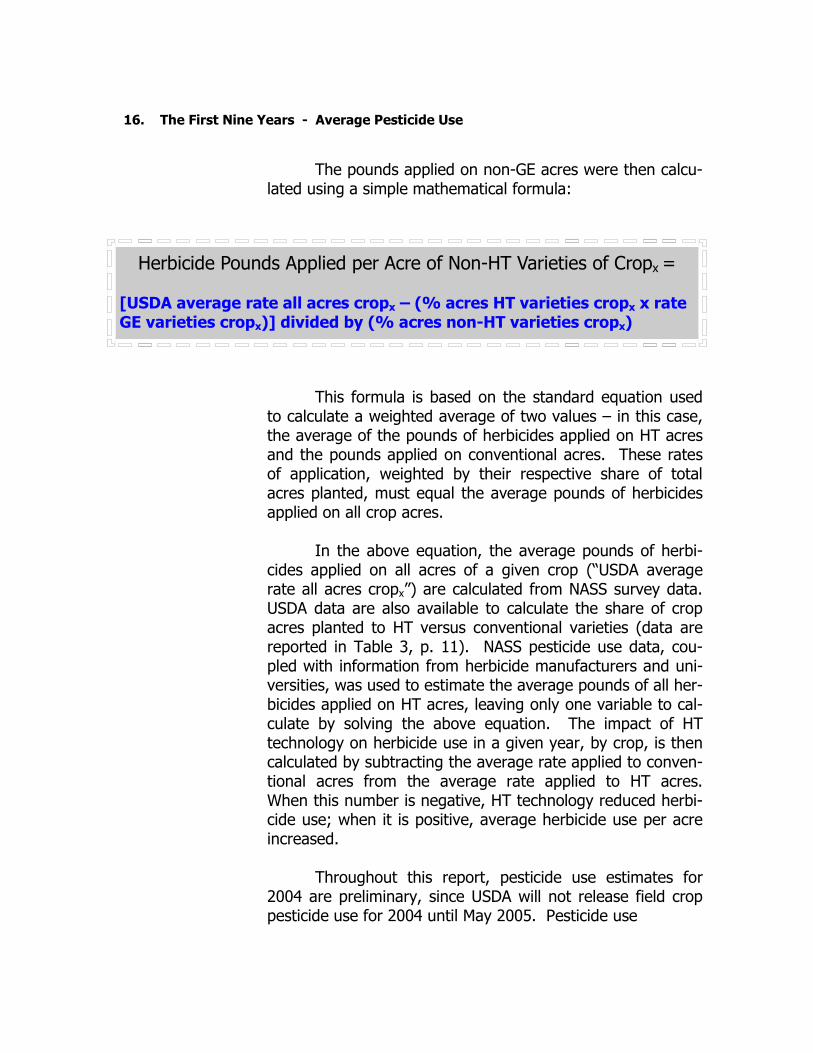
The pounds applied on non-GE acres were then calcu-lated using a simple mathematical formula:
Herbicide Pounds Applied per Acre of Non-HT Varieties of Cropx =
[USDA average rate all acres cropx – (% acres HT varieties cropx x rate GE varieties cropx)] divided by (% acres non-HT varieties cropx)
This formula is based on the standard equation used to calculate a weighted average of two values – in this case, the average of the pounds of herbicides applied on HT acres and the pounds applied on conventional acres. These rates of application, weighted by their respective share of total acres planted, must equal the average pounds of herbicides applied on all crop acres.
In the above equation, the average pounds of herbi-
cides applied on all acres of a given crop (“USDA average rate all acres cropx”) are calculated from NASS survey data. USDA data are also available to calculate the share of crop acres planted to HT versus conventional varieties (data are reported in Table 3, p. 11). NASS pesticide use data, cou-pled with information from herbicide manufacturers and uni-versities, was used to estimate the average pounds of all her-bicides applied on HT acres, leaving only one variable to cal-culate by solving the above equation. The impact of HT technology on herbicide use in a given year, by crop, is then calculated by subtracting the average rate applied to conven-tional acres from the average rate applied to HT acres. When this number is negative, HT technology reduced herbi-cide use; when it is positive, average herbicide use per acre increased.
Throughout this report, pesticide use estimates for 2004 are preliminary, since USDA will not release field crop pesticide use for 2004 until May 2005. Pesticide use

17. The First Nine Years - Average Pesticide Use
estimates for 2004 are based on levels in 2003 and trends in recent years. For corn and cotton, the esti-mates for 2004 are conservative, in that they reflect a smaller percentage increase from 2003 to 2004 than the increase evident in USDA data from 2002 to 2003. The estimated increase in herbicide use on HT soybeans between 2003 and 2004 is also conservative. Three ma-jor factors drove up HT soybean herbicide use per acre in 2004 –
· Soybean producers had to contend with several
tolerant and resistant weeds, some of which in-fested substantial acreage for the first time in 2004;
· Aggressive marketing by all major herbicide manufacturers of new combination products spe-cifically formulated to augment weed control in RR soybeans. These new products contained two, and sometimes three, active ingredients; and
· Falling prices of herbicides containing glyphosate, and indeed most herbicides registered for use on soybeans, allowed farmers to increase applications
without raising costs.
“There are increasing concerns that gly-phosate-resistant common lambsquar-ter may occur in Wisconsin.” Glyphosate Stewardship Program University of Wisconsin Extension
Herbicide-Tolerant Corn
Farmer adoption of herbicide-tolerant corn has progressed much more slowly than HT soybeans and cotton, in large part because growers have several other, comparably effective herbicide-based weed management alternatives. Farmers and university experts agree that managing weeds in corn in the mid-1990s was much simpler and more reliable – and less costly – than weed management in soybeans or cotton.
As shown in Table 4, the average rate of herbicide application on HT corn
acres was calculated as a weighted average between the rates in the two major HT corn weed management programs – the “Roundup Reliant” program and the “Residual Herbicide Applied” program. These are the two basic program options discussed in the Monsanto Roundup Ready corn technical guide, and “Roundup Ready” HT technology accounts for virtually all HT corn acres.

18. The First Nine Years - Average Pesticide Use
Table 4. Herbicide Pounds Applied per Acre to Conventional and Herbicide-Tolerant (HT) Corn, 1996-2004 (see notes)
1996 1997 1998 1999 2000 2001 2002 2003 2004 *
NASS Ave Glyphosate Rate per Crop Year
0.68 0.52 0.64 0.71 0.65 0.73 0.70 0.83 0.90
NASS Ave Glyphosate Rate per Application
0.68 0.52 0.64 0.59 0.59 0.66 0.64 0.69 0.69
Percent Acres HT Crop Planted
3% 4.3% 18.4% 9% 7% 8% 11% 15% 18%
ROUNDUP RELIANT ROGRAM (30% HT ACREAGE)
Glyphosate per RR Acre (Ave 2.0 applica-tions)
1.36 1.04 1.28 1.18 1.18 1.32 1.28 1.38 1.38
Other Herbicide Ap-plied on RR Acre
0.5 0.75 0.85 0.85 0.75 0.85 0.9 1.0 1.1
Total Herbicide Ap-plied per RR Acre
1.86 1.79 2.13 2.03 1.93 2.17 2.18 2.38 2.48
RESIDUAL HERBICIDE APPLIED (70% HT ACREAGE)
Glyphosate per RR Acre
0.68 0.52 0.64 0.59 0.59 0.66 0.64 0.69 0.69
Other Herbicide Ap-plied
1.2 1.2 1.4 1.4 1.2 1.4 1.5 1.6 1.7
Total Herbicide Ap-plied per RR Acre
1.88 1.72 2.04 1.99 1.79 2.06 2.14 2.29 2.39
WEIGHTED AVERAGE HERBICIDE USE PER RR CORN ACRE
1.87 1.74 2.07 2.0 1.83 2.09 2.15 2.32 2.42
NASS Average Rate 2.65 2.63 2.47 2.41 2.11 2.24 1.9 2.04 2.1
Conventional Acres Rate
2.67 2.67 2.56 2.45 2.13 2.25 1.87 1.99 2.03
Difference in Rate Be-tween H and Conven-tional Varieties
-0.80 -0.93 -0.49 -0.45 -0.30 -0.16 0.28 0.33 0.39
Notes: Weighted average rate per acre planted to RR varieties assumes 30% of acres under “Roundup Reliant” program and 70% under “Residual Herbicide Applied” program.
* Herbicide applications rates in 2004 are estimates based on continuation of recent trends

19. The First Nine Years - Average Pesticide Use
These program options are also discussed in the
weed management field guides, bulletins, and reports is-sued by all Midwestern land grant university weed man-agement departments.
The rates of glyphosate applied in these programs
are based on the average NASS rates per acre reported for each year. Weed management experts were con-sulted in determining that about 30 percent of corn HT areas are planted using the “Roundup Reliant” program and about 70 percent adhere to the “Residual Applied” program.
The “Roundup Reliant” program utilizes an average
of two applications of glyphosate, while the “Residual Herbicide Applied” program depends on a single applica-tion. For both programs, the one-time rate of application of glyphosate reported by NASS was used in calculating the pounds of glyphosate applied.
Differences in average herbicide use on HT and
conventional corn acres are calculated in Table 4. The first line of data in the table reports the NASS average rate for glyphosate per crop year. These rates take into account both the average rate per single application and the average number of applications per acre. The second line shows the average one-time application rate of gly-phosate.
Note the substantial jump in the glyphosate rate
per crop year from 2002 to 2003, and from 2003 to 2004. NASS reported that the average rate increased from 0.7 to 0.83 pounds per acre from 2002 to 2003, an increase of 18.6 percent. Average glyphosate use per crop year in 2004 was estimated at 0.9 pounds per acre, a 7.8 percent increase over 2003 use rates. This increase is less than half the jump reported by NASS between 2002 and 2003, and as previously noted, is likely conservative. The up-ward trend in per acre herbicide use on HT corn acres is

driven by the same dominant factors noted above that are also increasing HT soy-bean herbicide use.
The difference in herbicide use on HT versus conventional corn acres shifted
from a reduction of 0.8 pounds per acre in 1996 to an increase of 0.39 pounds in 2004. This shift from a significant reduction to a moderate increase in herbicide use is caused by a combination of two factors –
• Increased average herbicide use on HT acres; and • Reductions in the pounds of herbicides applied on conventional corn acres,
as a result of regulatory restrictions on high-dose herbicides including atrazine, the replacement of metolachlor with the lower-rate herbicide S-metolachlor, and the registration of a growing number of low- and very-low-dose corn herbicides.
The big change between 2001 and 2002 was brought about by the drop in
the average pounds applied to non-HT acres from 2.25 pounds per acre to 1.87 pounds per acre. This came about because of the combination of regulatory re-strictions on high-rate herbicides and the shift to low-dose herbicides. NASS re-ported that the rate of the most widely used corn herbicide, atrazine, fell from 1.18 pound per acre in 2001 to 1.04 in 2002. The registration of S-metolachlor in 1997 allowed farmers to cut the rate of application of a widely used, staple corn herbi-cide about 0.6 pounds per acre, without any sacrifice of weed control. This re-duced-rate herbicide has decreased corn herbicide use on conventional corn acres by 10 to 12 million pounds annually since 1999.
Note that the big drop in average pounds applied per acre in 2000 is re-
flected in the reduction in the glyphosate rates that year, as well as the pounds of other herbicides applied on HT acreage.
Herbicide use on Roundup Ready (RR) corn acres is almost certainly going
to increase further. Monsanto has recently reported another aggressive round of price cuts, coupled with enhanced promotional programs for farmers buying Mon-santo seed and Monsanto brand herbicides. Throughout the late summer and fall 2004, most major farm magazines have been running a Monsanto advertising cam-paign that promotes the RR corn system, featuring its compatibility with common tillage and planting systems and capacity to reduce costs. The “Roundup Ready Corn 2” program is composed of three steps –
20. The First Nine Years - Average Pesticide Use
21. The First Nine Years - Average Pesticide Use
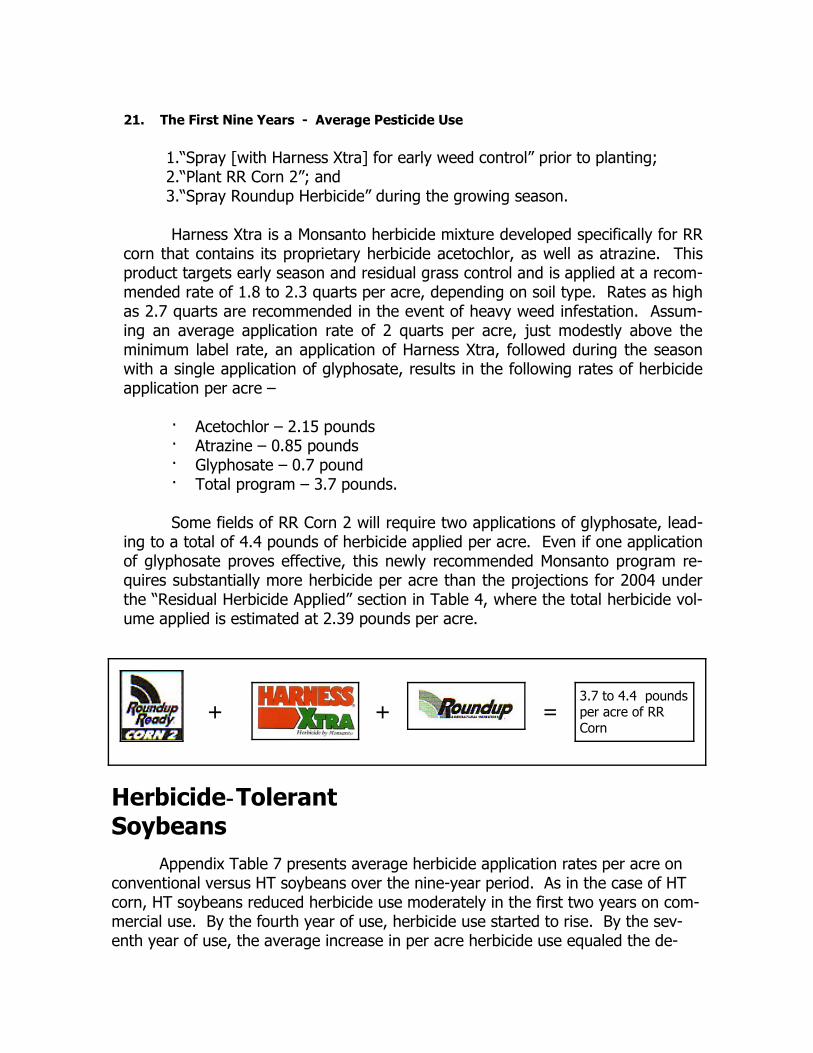
1.“Spray [with Harness Xtra] for early weed control” prior to planting; 2.“Plant RR Corn 2”; and 3.“Spray Roundup Herbicide” during the growing season.
Harness Xtra is a Monsanto herbicide mixture developed specifically for RR
corn that contains its proprietary herbicide acetochlor, as well as atrazine. This product targets early season and residual grass control and is applied at a recom-mended rate of 1.8 to 2.3 quarts per acre, depending on soil type. Rates as high as 2.7 quarts are recommended in the event of heavy weed infestation. Assum-ing an average application rate of 2 quarts per acre, just modestly above the minimum label rate, an application of Harness Xtra, followed during the season with a single application of glyphosate, results in the following rates of herbicide application per acre –
· Acetochlor – 2.15 pounds · Atrazine – 0.85 pounds · Glyphosate – 0.7 pound · Total program – 3.7 pounds. Some fields of RR Corn 2 will require two applications of glyphosate, lead-
ing to a total of 4.4 pounds of herbicide applied per acre. Even if one application of glyphosate proves effective, this newly recommended Monsanto program re-quires substantially more herbicide per acre than the projections for 2004 under the “Residual Herbicide Applied” section in Table 4, where the total herbicide vol-ume applied is estimated at 2.39 pounds per acre.
Appendix Table 7 presents average herbicide application rates per acre on conventional versus HT soybeans over the nine-year period. As in the case of HT corn, HT soybeans reduced herbicide use moderately in the first two years on com-mercial use. By the fourth year of use, herbicide use started to rise. By the sev-enth year of use, the average increase in per acre herbicide use equaled the de-
3.7 to 4.4 pounds per acre of RR Corn
Herbicide-Tolerant Soybeans
+ + =
crease in applications in the first year of use. The biggest jump occurred between 2000 and 2001, the year glyphosate went off patent and herbicide prices were dra-matically cut in a struggle among the leading herbicide manufacturers to increase or hold market share.
USDA data shows a clear upward trend in glyphosate and HT herbicide rates
per acre since 2001. The 22 percent jump in glyphosate pounds applied per acre from 2001 to 2002 was caused by price reductions, the need to control more diffi-cult sets of weeds, and the emergence of resistance and/or lessened sensitivity in many weed species that were once fully controlled by a single glyphosate applica-tion.
The pounds of all herbicides applied per acre of HT soybeans by year were
estimated in Table 6 by adding to the USDA reported rate of application of gly-phosate –
• An average of 0.15 pounds of other herbicides in 1996 and 1997; • 0.22 pounds of other herbicides in 1998-2001; • 0.25 pounds in 2002-2003; and • 0.3 pounds in 2004.
22. The First Nine Years - Average Pesticide Use
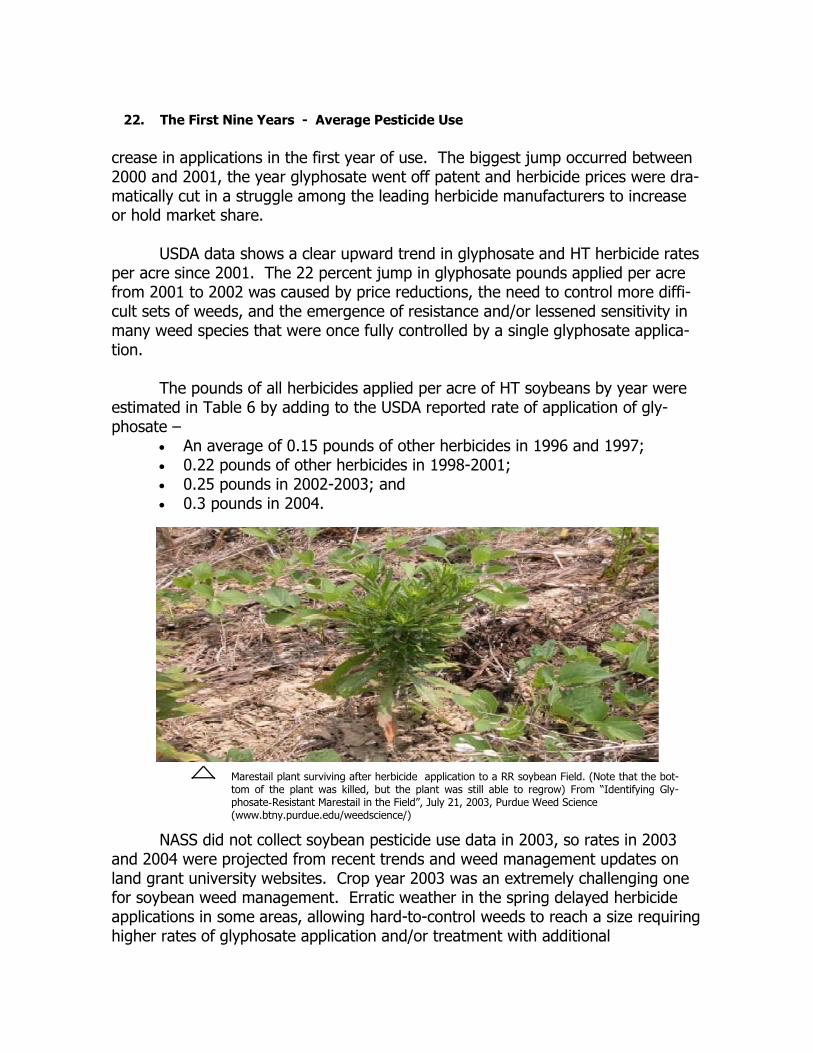
Marestail plant surviving after herbicide application to a RR soybean Field. (Note that the bot-tom of the plant was killed, but the plant was still able to regrow) From “Identifying Gly-phosate-Resistant Marestail in the Field”, July 21, 2003, Purdue Weed Science (www.btny.purdue.edu/weedscience/)
NASS did not collect soybean pesticide use data in 2003, so rates in 2003 and 2004 were projected from recent trends and weed management updates on land grant university websites. Crop year 2003 was an extremely challenging one for soybean weed management. Erratic weather in the spring delayed herbicide applications in some areas, allowing hard-to-control weeds to reach a size requiring higher rates of glyphosate application and/or treatment with additional

23. The First Nine Years - Average Pesticide Use
Special Tabulation in 1998 Provides Solid Data Point
A series of special tabulations of herbicide use data on HT and conventional acres were carried out by the ERS at the request of Benbrook Consulting Services. The ERS divided the sample points in the 1998 Agricultural Resources Management Sur-vey (ARMS) into four categories of soybean acres:
• Conventional varieties, no glyphosate applied; • Conventional varieties, glyphosate applied (mostly on no-till acreage); • Roundup Ready varieties; and • Other HT varieties.
For 1998 ERS reported both the percent of total soybean acreage by cate-
gory, as well as the average number of herbicides and pounds of herbicides applied in each category. This information was used to calculate total herbicide use per acre on conventional and HT soybeans in 1998, using a simple weighted average formula. The rates and percents of acres planted to conventional varieties treated and not treated with glyphosate were used to calculate the overall conventional-acres rate of 1.13 pounds per acre. (Conventional acres treated with glyphosate were planted using either no-tillage or conservation tillage systems in which the glyphosate is applied before soybean seeds germinate).
The same information was used to calculate the average rate of all herbi-
cides applied on HT acres, which was 1.2 pounds per acre. These results are re-ported in Table 5 and show that the average acre of HT soybeans in 1998 was treated with 0.07 pounds more herbicide than conventional acres. This is the most accurate estimate of this difference that can be made drawing on available USDA data on actual herbicide use. The difference reflects total herbicide use per acre reported by farmers on fields planted to HT versus conventional varieties. This solid estimate of the difference was used to calibrate the estimates in Appendix
herbicides. Untimely spring rains washed some applications of gly-phosate off weeds before uptake, requiring re-treatment. Glyphosate- resistant marestail emerged as a serious problem in more than a dozen states. In 2004, the extent and severity of weed control failures linked to resistant or tolerant weeds required a significant increase in herbi-cide use in many regions and accounted for most of the increase in per acre herbicide use projected between 2003 and 2004.
24. The First Nine Years - Average Pesticide Use
Table 7, which also reports a difference of 0.07 pounds per acre in 1998 between the pounds of herbicides applied on HT versus conventional acres.
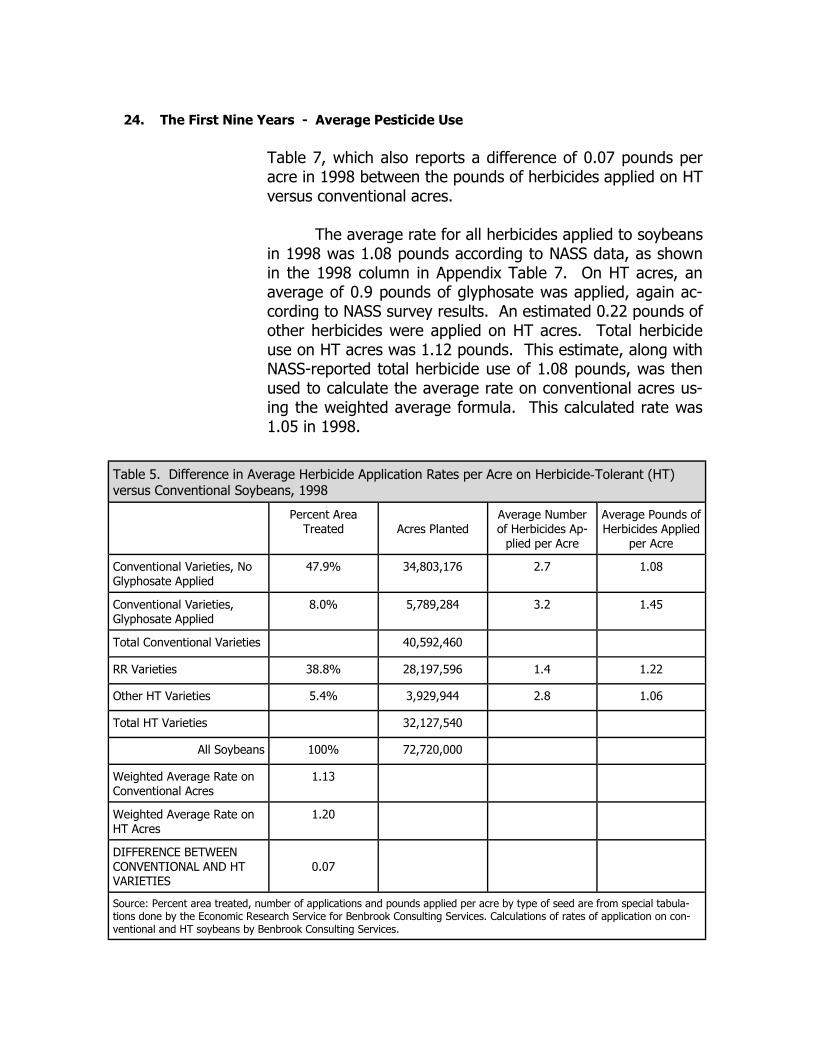
The average rate for all herbicides applied to soybeans
in 1998 was 1.08 pounds according to NASS data, as shown in the 1998 column in Appendix Table 7. On HT acres, an average of 0.9 pounds of glyphosate was applied, again ac-cording to NASS survey results. An estimated 0.22 pounds of other herbicides were applied on HT acres. Total herbicide use on HT acres was 1.12 pounds. This estimate, along with NASS-reported total herbicide use of 1.08 pounds, was then used to calculate the average rate on conventional acres us-ing the weighted average formula. This calculated rate was 1.05 in 1998.
Table 5. Difference in Average Herbicide Application Rates per Acre on Herbicide-Tolerant (HT) versus Conventional Soybeans, 1998
Percent Area Treated
Acres Planted
Average Number of Herbicides Ap-
plied per Acre
Average Pounds of Herbicides Applied
per Acre
Conventional Varieties, No Glyphosate Applied
47.9% 34,803,176 2.7 1.08
Conventional Varieties,Glyphosate Applied
8.0% 5,789,284 3.2 1.45
Total Conventional Varieties 40,592,460
RR Varieties 38.8% 28,197,596 1.4 1.22
Other HT Varieties 5.4% 3,929,944 2.8 1.06
Total HT Varieties 32,127,540
All Soybeans 100% 72,720,000
Weighted Average Rate on Conventional Acres
1.13
Weighted Average Rate on HT Acres
1.20
DIFFERENCE BETWEEN CONVENTIONAL AND HT VARIETIES
0.07
Source: Percent area treated, number of applications and pounds applied per acre by type of seed are from special tabula-tions done by the Economic Research Service for Benbrook Consulting Services. Calculations of rates of application on con-ventional and HT soybeans by Benbrook Consulting Services.

25. The First Nine Years - Average Pesticide Use
The estimate of 1.05 pounds of all herbicides applied on non-HT acres and 1.12 on HT acres in Appendix Table 7 corre-sponds to the correct differential of 0.07 pounds per acre, as re-ported in the special ERS tabulation of actual use data in Table 5.
Herbicide-Tolerant Cotton
Weed management in cotton has always required more herbi-cide per acre than soybeans. This is because cotton fields are planted in somewhat wider rows and do not form as dense of a closed canopy of foliage as soybeans. More weeds germinate and grow in cotton fields compared to soybeans because more sunlight reaches the ground. In addition, the growing season for a cotton crop is longer, which gives weeds more time to get established and requires active management of weeds over a longer period of time. In the first few years of commercial use, many HT soybean farmers got through a season with very clean fields following just one application of glyphosate; cotton farm-ers planting HT varieties were never able to replicate this level of performance and always needed to apply additional herbicides, or multiple applications of glyphosate or bromoxynil, the other herbicide used in conjunction with HT cotton varieties.
Photo by William Molin Courtesy of ARS, USDA

The difference in herbicide application rates on HT cotton and conventional
varieties shifted incrementally over time much like in the case of HT corn and soybeans, as shown in Appendix Table 8. In the first two years of commercial use, each acre planted to HT cotton reduced herbicide use by about one-third pound. Efficacy slipped in years three and four such that there was essentially no difference in total herbicide use on HT and conventional acres.
By year five, weed shifts, tolerance, and resistance had pushed total herbi-
cide use on HT acres to a level 0.23 pounds above total herbicide use on conven-tional acres. The upward trend has continued, reaching a differential of 1.01 pounds in 2003, a very difficult year for weed management in cotton country. Substantial weed control failures in 2003 in parts of the cotton belt, coupled with the rapid spread of glyphosate-resistant marestail, made weed management even more difficult in 2004, triggering an estimated 10 percent increase in the average pounds of herbicides applied her acre.
NASS reported a large jump in glyphosate use per acre of cotton between
2001 and 2003 – 1.12 pounds to 1.38 pounds per acre. (Recall that NASS did not collect cotton pesticide use data in 2002). Appendix Table 8 assumes that the to-tal increase of 0.26 pounds was evenly divided between the two subsequent pro-duction seasons. The average acre of HT cotton was treated with 0.8 to 1.1 pounds of herbicides other than glyphosate from 1996 through 2004, with levels tracking general trends in total herbicide use.
The reduction in average pounds applied on conventional acres acceler-
ated between 1999 and 2000, reflected the registration and wider use of low-dose herbicides. Heavier weed pressure accounts for much of the increase in pounds applied in 2004.
26. The First Nine Years - Average Pesticide Use
Bt Transgenic Corn
Calculating the impact of Bt corn on insecticide use is compli-cated by several factors. For decades, about 8 to 12 percent of the corn acres planted nationally have been treated for control of European corn borers (ECB) and/or Southwestern corn borers (SWCB) -- the insects targeted by Bt corn. In its third year of commercial use in 1998, Bt corn was planted on 19.1 percent of national corn acres – about twice the acreage ever sprayed to control the ECB or SWCB. Clearly, a significant portion of the

acres planted to Bt corn varieties in 1998, and since, would not have been sprayed if the farmers had continued to plant conventional varieties. Accordingly, esti-mates have to be made of the portion of the acreage planted to Bt corn each year that would have likely been sprayed with insecticides for management of ECBs and/or SWCBs.
The third line of data from the bottom of Appendix Table 9 is labeled “Percent Acres Planted to Bt Previously Treated with Insecticide.” It presents an-nual estimates of the share of Bt corn acres that would have been sprayed and starts out very high – an estimated 90 percent of the 1.1 million acres of Bt corn in 1996 would likely have been sprayed. As the acres planted to Bt corn increases, the percentage that was likely sprayed with insecticides declines. Over the period 1997 through 2004, the percent of Bt corn acres planted that would have been sprayed is estimated to vary between 26 and 33 percent. In 2004 about one-third of national corn acres were planted to Bt corn. An estimated 27 percent of these acres had previously been treated with insecticides for ECB and/or SWCB manage-ment. Accordingly, Bt corn reduced insecticide use on about 7 million acres.
The introduction of Bt corn varieties in the mid-1990s heightened research
and grower focus on the damage caused by ECBs and SWCBs. As a result of better documentation of the losses caused by these insects, farmers have managed them more aggressively than prior to 1996. This is evident in Appendix Table 9, which reports that the combined number of acres planted to Bt corn, plus acres producing conventional corn that were sprayed with insecticides for ECB/SWCB control, rose appreciably above historical levels. In 2003, for example, 7 million acres were planted to Bt corn and 8.8 million acres were sprayed with insecticides for ECBs and SWCBs, for a total acreage under insect pest management of 15.8 million acres. This estimate of the acres treated for ECBs/SWCBs reflects about a 50 per-cent increase over historical levels. Some land grant entomologists are urging farmers to rethink their decision to automatically plant Bt corn for ECB/SWCB in those parts of the Corn belt where population levels have been low in recent years. Strong evidence suggests that corn growers are now over treating for ECBs/SWCBs in some major growing areas, resulting in unnecessary expenditures, needless im-pacts on nontarget species like Monarch butterflies, and increasing the risk of resis-tance.
The method used to estimate the average pounds of insecticides applied on corn acres for management of EBC/SWCB is straightforward. USDA data and uni-versity pest management specialists indicate that eight insecticides are applied for the management of the ECB/SWCB. Of these, three are generally applied largely
27. The First Nine Years - Average Pesticide Use
or solely for control of the ECB/SWCB:
• Lambda-cyhalothrin; • Cyfluthrin; and • Permethrin.
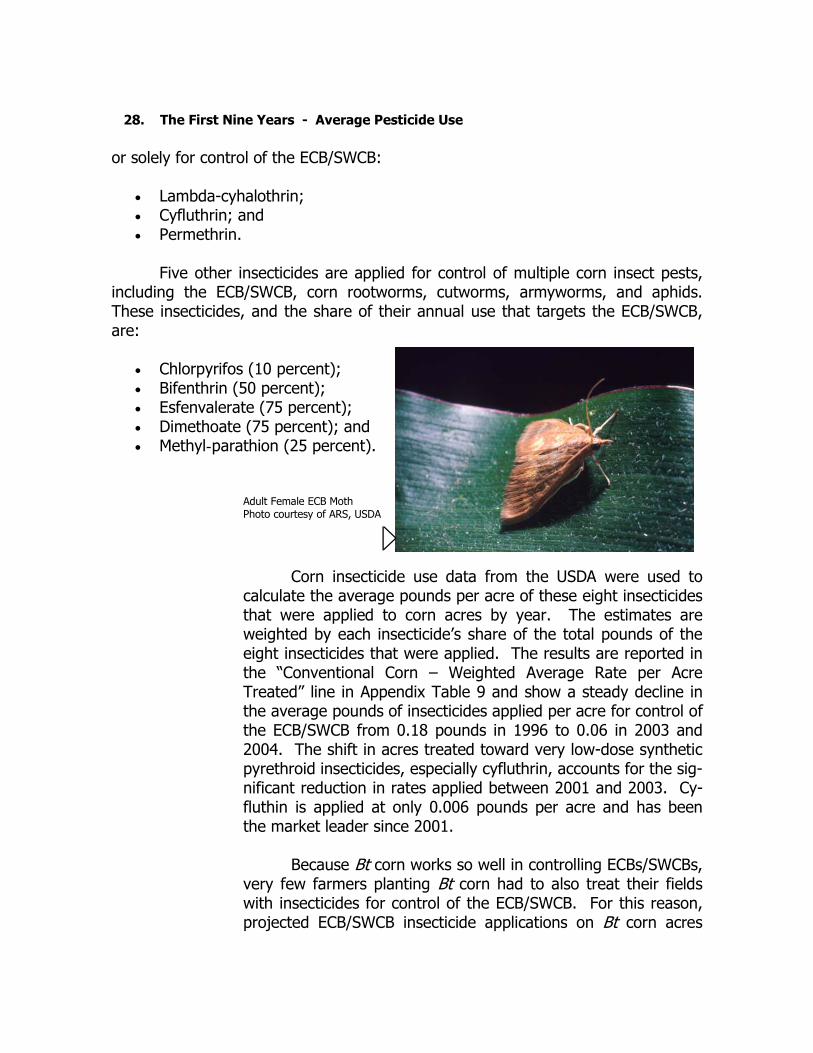
Five other insecticides are applied for control of multiple corn insect pests,
including the ECB/SWCB, corn rootworms, cutworms, armyworms, and aphids. These insecticides, and the share of their annual use that targets the ECB/SWCB, are:
• Chlorpyrifos (10 percent); • Bifenthrin (50 percent); • Esfenvalerate (75 percent); • Dimethoate (75 percent); and • Methyl-parathion (25 percent).
28. The First Nine Years - Average Pesticide Use
Adult Female ECB Moth Photo courtesy of ARS, USDA
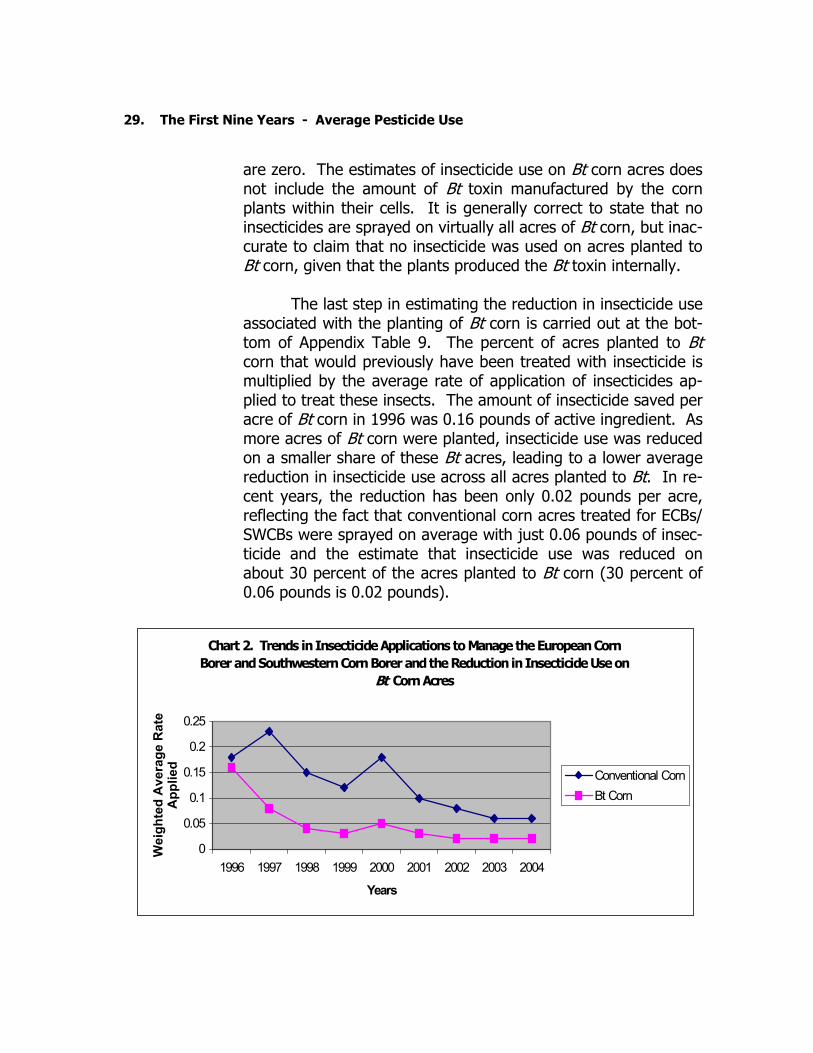
Corn insecticide use data from the USDA were used to calculate the average pounds per acre of these eight insecticides that were applied to corn acres by year. The estimates are weighted by each insecticide’s share of the total pounds of the eight insecticides that were applied. The results are reported in the “Conventional Corn – Weighted Average Rate per Acre Treated” line in Appendix Table 9 and show a steady decline in the average pounds of insecticides applied per acre for control of the ECB/SWCB from 0.18 pounds in 1996 to 0.06 in 2003 and 2004. The shift in acres treated toward very low-dose synthetic pyrethroid insecticides, especially cyfluthrin, accounts for the sig-nificant reduction in rates applied between 2001 and 2003. Cy-fluthin is applied at only 0.006 pounds per acre and has been the market leader since 2001.
Because Bt corn works so well in controlling ECBs/SWCBs,
very few farmers planting Bt corn had to also treat their fields with insecticides for control of the ECB/SWCB. For this reason, projected ECB/SWCB insecticide applications on Bt corn acres
are zero. The estimates of insecticide use on Bt corn acres does not include the amount of Bt toxin manufactured by the corn plants within their cells. It is generally correct to state that no insecticides are sprayed on virtually all acres of Bt corn, but inac-curate to claim that no insecticide was used on acres planted to Bt corn, given that the plants produced the Bt toxin internally.
The last step in estimating the reduction in insecticide use
associated with the planting of Bt corn is carried out at the bot-tom of Appendix Table 9. The percent of acres planted to Bt corn that would previously have been treated with insecticide is multiplied by the average rate of application of insecticides ap-plied to treat these insects. The amount of insecticide saved per acre of Bt corn in 1996 was 0.16 pounds of active ingredient. As more acres of Bt corn were planted, insecticide use was reduced on a smaller share of these Bt acres, leading to a lower average reduction in insecticide use across all acres planted to Bt. In re-cent years, the reduction has been only 0.02 pounds per acre, reflecting the fact that conventional corn acres treated for ECBs/SWCBs were sprayed on average with just 0.06 pounds of insec-ticide and the estimate that insecticide use was reduced on about 30 percent of the acres planted to Bt corn (30 percent of 0.06 pounds is 0.02 pounds).
29. The First Nine Years - Average Pesticide Use
Chart 2. Trends in Insecticide Applications to Manage the European Corn Borer and Southwestern Corn Borer and the Reduction in Insecticide Use on
Bt Corn Acres
0
0.05
0.1
0.15
0.2
0.25
1996 1997 1998 1999 2000 2001 2002 2003 2004
Years
Wei
ghte
d A
vera
ge R
ate
App
lied
Conventional CornBt Corn
30. The First Nine Years - Average Pesticide Use
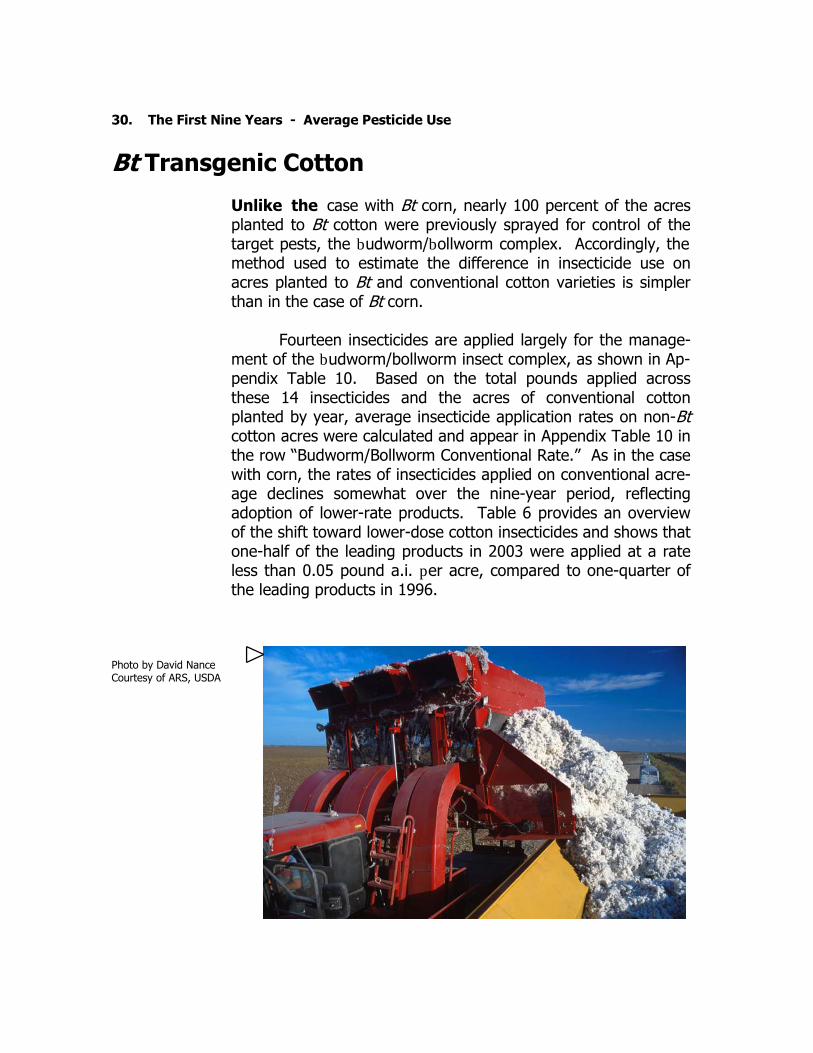
Bt Transgenic Cotton
Unlike the case with Bt corn, nearly 100 percent of the acres planted to Bt cotton were previously sprayed for control of the target pests, the budworm/bollworm complex. Accordingly, the method used to estimate the difference in insecticide use on acres planted to Bt and conventional cotton varieties is simpler than in the case of Bt corn.
Fourteen insecticides are applied largely for the manage-
ment of the budworm/bollworm insect complex, as shown in Ap-pendix Table 10. Based on the total pounds applied across these 14 insecticides and the acres of conventional cotton planted by year, average insecticide application rates on non-Bt cotton acres were calculated and appear in Appendix Table 10 in the row “Budworm/Bollworm Conventional Rate.” As in the case with corn, the rates of insecticides applied on conventional acre-age declines somewhat over the nine-year period, reflecting adoption of lower-rate products. Table 6 provides an overview of the shift toward lower-dose cotton insecticides and shows that one-half of the leading products in 2003 were applied at a rate less than 0.05 pound a.i. per acre, compared to one-quarter of the leading products in 1996.
Photo by David Nance Courtesy of ARS, USDA

Table 6. Shift to Low-Dose Cotton Insecticides from 1996 and 2003: Number of Top Twelve Na-tionally Applied Active Ingredients by Rate of Application
Rate of Application (pound of AI per Acre) 1996 2003
<0.01 0 1
0.05—0.099 1 1
0.1—0.24 2 0
0.25—0.49 3 2
0.50—0.74 1 2
0.75—1 1 1
Source: U.S.D.A. National Agricultural Statistic Service (NASS), Agricultural Chemical Usage, Field Crop Summary, 1996 and 2003.
0.01—0.049 4 5
31. The First Nine Years - Average Pesticide Use
While Bt cotton is highly effective in many areas, it does not eliminate insecticide applications targeting the bud-worm/bollworm complex. Accordingly, it was assumed that the average acre of Bt cotton was treated with 0.1 pound of insecticides. The estimated average 0.1 pound of insecti-cides applied per acre planted to Bt cotton also takes into ac-count the pounds of Bt endotoxin produced within the cells of Bt cotton plants. Accordingly, the reduction in insecticide pounds applied per acre planted to Bt cotton ranges from 0.46 pounds in 1996 to 0.16 pounds in 2001.
IMPACTS OF GE CROP TECHNOLOGY ON PESTICIDE USE, 1996-2004
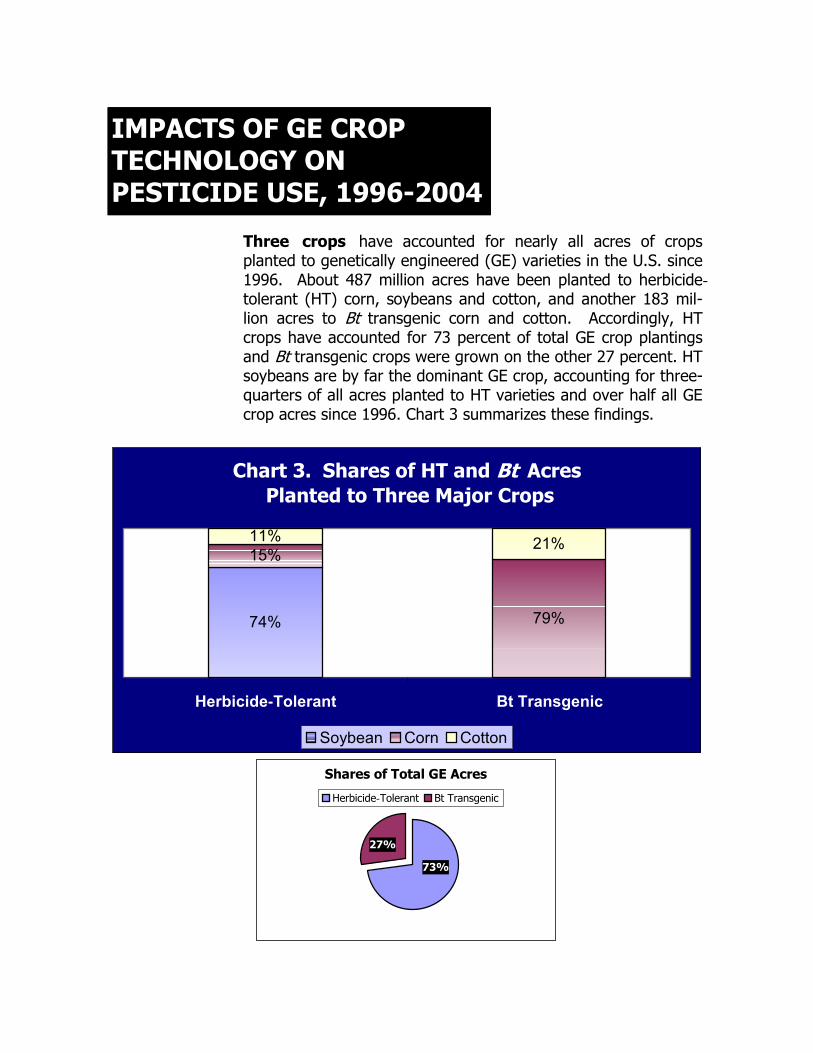
Three crops have accounted for nearly all acres of crops planted to genetically engineered (GE) varieties in the U.S. since 1996. About 487 million acres have been planted to herbicide- tolerant (HT) corn, soybeans and cotton, and another 183 mil-lion acres to Bt transgenic corn and cotton. Accordingly, HT crops have accounted for 73 percent of total GE crop plantings and Bt transgenic crops were grown on the other 27 percent. HT soybeans are by far the dominant GE crop, accounting for three-quarters of all acres planted to HT varieties and over half all GE crop acres since 1996. Chart 3 summarizes these findings.
Chart 3. Shares of HT and Bt Acres Planted to Three Major Crops
74%
15%
79%
11% 21%
Herbicide-Tolerant Bt Transgenic
Soybean Corn Cotton
Shares of Total GE Acres
27%
73%
Herbicide-Tolerant Bt Transgenic

33. The First Nine Years - Impacts of GE Crop Technology on Pesticide Use
Major Findings Across Three Significant Crops
Table 7 integrates all the estimates of average pesticide use rates per acre on GE-planted acres in contrast to acres planted to conventional varieties. For each crop and GE trait, the rates of pesticide use and the average differences per acre in pounds applied between GE and conventional acres are shown for 1996-2004. The impact of GE crops on total pounds of pesticides ap-plied across the three crops and for both HT and Bt traits are re-ported in Appendix Table 11. The numbers in Appendix Table 11 are calculated by multiplying the average difference in pesti-cide use per acre of crop planted to a GE trait by the acres planted to that GE trait each year. The last four rows of the ta-ble add together the impacts of GE technology on total herbicide, insecticide, and herbicide plus insecticide use across the three crops.
Chart 4. Changes in Pesticide Use in the First Three Years of Commercialization Compared to the Last Six Years
-50 0 50 100 150 200Change in Pounds of Pesticides Applied (Million)
1996-2004
1999-2004
1996-1998

34. The First Nine Years - Impacts of GE Crop Technology on Pesticide Use
Table 7. Average Pesticide Pounds Applied per Acre Planted to Conventional, Herbicide-Tolerant (HT) and Bt Transgenic Varieties* and Estimated Differences per Acre, 1996—2004 [Includes acres planted to stacked varieties]
1996 1997 1998 1999 2000 2001 2002 2003 2004**
Conventional Corn
Herbicides 2.67 2.67 2.56 2.45 2.13 2.25 1.87 1.99 2.03
Insecticides 0.18 0.23 0.15 0.12 0.18 0.10 0.08 0.06 0.06
GE Corn
Herbicide-Tolerant 1.87 1.74 2.07 2.00 1.83 2.09 2.15 2.32 2.42
Bt Transgenic 0.16 0.08 0.04 0.03 0.05 0.03 0.02 0.02 0.02
Average Difference GE to Conventional
Herbicide (0.80) (0.93) (0.49) (0.45) (0.30) (0.16) 0.28 0.33 0.39
Insecticide (0.16) (0.08) (0.04) (0.03) (0.05) (0.03) (0.02) (0.02) (0.02)
Conventional Soybeans
Herbicide 1.20 1.23 1.05 0.93 0.99 0.73 0.93 0.87 0.78
GE Soybeans
Herbicide-Tolerant 0.84 0.94 1.12 1.12 1.10 1.07 1.29 1.34 1.45
Average Difference GE to Conventional
Herbicide (0.36) (0.29) 0.07 0.19 0.11 0.34 0.36 0.47 0.67
Conventional Cotton
Herbicide 1.93 2.16 1.96 2.03 1.86 1.35 1.46 1.42 1.67
Insecticide 0.56 0.53 0.47 0.52 0.41 0.26 0.27 0.35 0.42
GE Cotton
Herbicide-Tolerant 1.58 1.84 1.97 1.99 2.09 1.92 2.15 2.43 2.60
Bt Transgenic 0.10 0.10 0.10 0.10 0.10 0.10 0.10 0.10 0.10
Herbicide (0.35) (0.32) 0.01 (0.04) 0.23 0.57 0.69 1.01 0.94
Insecticide (0.46) (0.43) (0.37) (0.42) (0.31) (0.16) (0.17) (0.25) (0.32)
*Differences in pounds of insecticides applied do not take into account the pounds of Bt produced within the cells of transgenic corn and cotton plants (see text for discussion).
**Pesticide use rates in 2004 are preliminary projections based on 2001-2003 data and recent trends.
Average Difference GE to Conventional

35. The First Nine Years - Impacts of GE Crop Technology on Pesticide Use
Across all traits, GE crops reduced pesticide use 20.6 million pounds from 1996 through 1998, but from 1999 through 2004, pesticide use rose 143 million pounds, for a net increase of 122 million pounds over the full nine-year period. Chart 4 contrasts the change in pesticide use in the 1996-1998 compared to 1999-2004.
Herbicide-tolerant corn reduced the total pounds of herbicides applied from
1996 through 2001, but has led to increases each year since. Moreover, HT corn is requiring more and more herbicide each year compared to acres planted to conventional varieties, a negative trend driven by shifts in weed communities, re-sistance, and the sizable drop in the price of glyphosate herbicides. Over the nine-year period, HT corn reduced total herbicide use an estimated 6.3 million pounds, but in 2004, 5.6 million more pounds of herbicides were applied because of the planting of HT corn.
Bt corn reduced insecticide use each year, but only marginally given the
very low rate of insecticides applied on conventional corn acres for control of the ECB/SWCB. Over the nine-year period Bt corn reduced insecticide use by about 4.5 million pounds. GE traits in corn have therefore reduced pesticide use by about 10.8 million pounds over the last nine years, less than a 1 percent reduc-tion in total corn herbicide plus insecticide pounds applied.
Herbicide-tolerant soybeans reduced the total pounds of herbicides applied
for the first two years of commercial use, but have triggered the need for in-creased use since. Over the nine-year period, 117 million pounds more herbicide has been applied because of the planting of HT soybeans. This large increase re-flects the slipping efficacy of the Roundup Ready system, the emergence of toler-ant and resistance weeds, and the falling price of soybean herbicides, and the progressively lower-rate herbicides used on conventional acres.
HT cotton reduced herbicide use in three of the first four years of commer-cial use but thereafter required steadily more herbicides to keep up with weed shifts and resistant/tolerant weeds. Over the nine-year period, HT cotton re-quired 26.8 million pounds more herbicides than if HT acres had been planted to conventional varieties. Bt cotton, on the other hand, substantially reduced insec-ticide use over its nine years of commercial use, resulting in a decrease of 11 mil-lion pounds of insecticides. GE traits in cotton led to an increase of 15.7 million pounds in combined herbicide plus insecticide use from 1996-2004.

36. The First Nine Years - Impacts of GE Crop Technology on Pesticide Use
Across the three crops, HT varieties increased herbicide use by 138 million pounds over the nine-year period, or by about 5 percent. The two Bt transgenic crops reduced insecticide use by 15.6 million pounds, or by about 4.7 percent. All GE crops planted since 1996 have increased corn, soybean, and cotton pesticide use by 122.4 million pounds, or about 4 percent. Chart 5 places these findings into per-spective. It shows by year the percentage change in total pesticide use on corn, soybeans, and cotton brought about by the adoption of HT and Bt crops.
-5.0% 0.0% 5.0% 10.0% 15.0% 20.0%
Chart 5. Annual Percent Change in Pesticide Use Brought About by Herbicide-Tolerant and Bt Transgenic Corn,
Soybeans and Cotton
1996
2004
Conclusions and Future Prospects
While the discovery and adoption of GE crop technology has changed American agriculture in many ways, reducing overall pesticide use is not among them. Bt transgenic crops have reduced overall insecticide use, but HT crops have increased it by a far greater margin.
Moreover, the performance of HT crops appears to be slipping. The average acre planted to glyphosate-tolerant crops is requiring more and more help from other herbicides, a trend with serious environ-mental and economic implications.

Resistance to glyphosate has emerged as a serious con-cern across most of the intensively farmed regions of the U.S. The number of resistant weeds and their rate of spread is not surprising given the degree of selection pressure imposed on weed populations by farmers applying glyphosate herbicides multiple times per year, and sometimes year in and year out on the same field.
Resistant weeds typically emerge first on just a few iso-lated fields, but their pollen, genes, and seeds can travel widely and spread quickly, especially if glyphosate continues to be re-lied on as heavily has it has been in recent years. This is why both universities and some herbicide manufacturers are calling for more aggressive, prevention-oriented management of resis-tance to glyphosate. In the case of the weed marestail, the re-cent focus on resistance management has come too late.
No substantial change in the intensity of glyphosate use
in the U.S. is expected in the foreseeable future, given the con-tinued popularity of HT crops dependent on glyphosate, the lim-ited supply of non-HT seed in some popular varieties, and the increasingly aggressive promotions offered to farmers relying ex-clusively on Roundup Ready technology. As a result, marestail will almost certainly be the first of several glyphosate-resistant weeds that emerge and spread, triggering the need for addi-tional herbicide applications and eroding the cost advantage and popularity of HT technology.
The future of Bt transgenic crops is brighter, especially in
the case of Bt cotton. Several university and USDA researchers are closely monitoring efficacy in Bt cotton, which appears to have changed little over the last nine years. The attention fo-cused on resistance management, and the issuance of manda-tory resistance management plans, has proven effective thus far in delaying the emergence of resistance. Indeed, some experts now think that the emphasis on resistance management in Bt cotton can be relaxed. History suggests that lessened diligence in cotton insect resistance management efforts would be prema-ture, given that it has taken 10-15 years for cotton insects to de-
37. The First Nine Years - Impacts of GE Crop Technology on Pesticide Use

velop resistance to each new type of insecticide applied to control them. This cycle began with the organochlorines in the 1960s and 1970s, and then repeated itself with the carbamates in the 1970s and 1980s and the synthetic pyrethroids in the 1980s and 1990s. Prudence dictates waiting until about 2010 before determining whether contemporary resistance management plans are indeed working and might possibly be simplified.
Bt corn for control of ECBs and SWCBs remains highly effective but is also
almost certainly overused. Many farmers are planting these varieties as an insur-ance policy against potentially damaging insect populations. In 2004, Monsanto in-troduced its new Cry 3Bb Bt corn for rootworm management and by 2005, several corn varieties will express both the Bt toxin targeted toward the ECB/SWCB and the new toxin designed to manage corn rootworms.
There has been virtually no field research or regulatory review of the eco-
logical and food safety implications when widely planted Bt corn varieties are simul-taneously expressing dual Bt genes. Current USDA and EPA approvals are based on the assumption that the two Bt transgenes in corn plants will operate exactly as they do in varieties engineered to express a single Bt gene, and that the impacts of the dual transgenes will not in any way be additive or decrease the stability of gene expression. These are significant and questionable assumptions that if incorrect, could lead to major, unintended consequences. For this reason, these assumptions should be subjected to empirical study before widespread planting of dual-Bt varie-ties is authorized.
38. The First Nine Years - Impacts of GE Crop Technology on Pesticide Use
1996 1997 1998 1999 2000 2001 2002 2003 2004 Total 1996-2004
CornAcres Planted 79,507,000 80,227,000 80,798,000 77,431,000 79,579,000 79,545,000 79,054,000 79,100,000 81,000,000 716,241,000 Herbicides per Acre 2.65 2.63 2.47 2.41 2.11 2.24 1.90 2.04 2.10 Pounds Herbicides (H) 210,693,550 210,997,010 199,571,060 186,608,710 167,911,690 178,180,800 150,202,600 161,364,000 170,100,000 1,635,629,420 Insecticides per Acre 0.22 0.23 0.18 0.16 0.15 0.14 0.08 0.10 0.10 Pounds Insecticides (I) 17,491,540 18,452,210 14,543,640 12,388,960 11,936,850 11,136,300 6,324,320 7,751,800 7,938,000 107,963,620 Total Pounds: H+I 228,185,090 229,449,220 214,114,700 198,997,670 179,848,540 189,317,100 156,526,920 169,115,800 178,038,000 1,743,593,040
SoybeansAcres Planted 64,205,000 70,850,000 72,720,000 73,780,000 74,496,000 75,416,000 73,758,000 73,700,000 74,800,000 653,725,000 Herbicides per Acre 1.17 1.18 1.08 1.04 1.05 0.96 1.20 1.25 1.35 Pounds Herbicides (H) 75,119,850 83,603,000 78,537,600 76,731,200 78,220,800 72,399,360 88,509,600 92,125,000 100,980,000 746,226,410
Upland CottonAcres Planted 14,100,000 13,558,000 13,064,000 14,241,000 15,347,000 16,054,000 13,714,000 13,900,000 13,900,000 127,878,000 Herbicides per Acre 1.88 2.09 1.88 1.88 1.84 1.65 1.84 1.99 2.20 Pounds Herbicides (H) 26,508,000 28,336,220 24,560,320 26,773,080 28,238,480 26,489,100 25,233,760 27,661,000 30,580,000 244,379,960 Insecticides per Acre 1.25 1.39 1.28 2.96 2.82 1.83 1.83 1.06 1.09 Pounds Insecticides (I) 17,625,000 18,845,620 16,721,920 42,153,360 43,278,540 29,378,820 25,096,620 14,686,740 15,151,000 222,937,620 Total Pounds: H+I 44,133,000 47,181,840 41,282,240 68,926,440 71,517,020 55,867,920 50,330,380 42,347,740 45,731,000 421,586,580
Total Three CropsAcres Planted 157,812,000 164,635,000 166,582,000 165,452,000 169,422,000 171,015,000 166,526,000 166,700,000 169,700,000 1,497,844,000 Pounds Herbicides (H) 312,321,400 322,936,230 302,668,980 290,112,990 274,370,970 277,069,260 263,945,960 281,150,000 301,660,000 2,626,235,790 Pounds Insecticides (I) 35,116,540 37,297,830 31,265,560 54,542,320 55,215,390 40,515,120 31,420,940 22,438,540 23,089,000 330,901,240 Total Pounds: H+I 347,437,940 360,234,060 333,934,540 344,655,310 329,586,360 317,584,380 295,366,900 303,588,540 324,749,000 2,957,137,030 Pounds H+I per Acre 2.20 2.19 2.00 2.08 1.95 1.86 1.77 1.82 1.91 1.97* Pesticide use in 2004 are preliminary projections based on crop year 2003 totals and recent trends. (See tables on individual HT crops).
Appendix Table 1. Corn, Soybean and Cotton Acreage Planted, Average Pesticide Use per Acre, and Total Pounds Applied, 1996 - 2004.

2000 2001 2002 2003 2004 2000 2001 2002 2003 2004State
Illinois 13 12 18 23 26 3 3 3 4 5Indiana 7 6 7 8 11 4 6 6 7 8Iowa 23 25 31 33 36 5 6 7 8 10Kansas 25 26 25 25 25 7 11 15 17 24Michigan 8 8 12 18 15 4 7 8 14 14Minnesota 28 25 29 31 35 7 7 11 15 17Missouri 20 23 27 32 32 6 8 6 9 13Nebraska 24 24 34 36 41 8 8 9 11 13Ohio 6 7 6 6 8 3 4 3 3 4South Dakota 35 30 33 34 28 11 14 23 24 30Wisconsin 13 11 15 21 22 4 6 9 9 14Other States1/ 10 11 14 17 19 6 8 12 17 21U.S. 18 18 22 25 27 6 7 9 11 13
2000 2001 2002 2003 2004 2000 2001 2002 2003 2004State
Illinois 1 1 1 1 2 17 16 22 28 33Indiana * * * 1 2 11 12 13 16 21Iowa 2 1 3 4 8 30 32 41 45 54Kansas 1 1 2 5 5 33 38 43 47 54Michigan * 2 2 3 4 12 17 22 35 33Minnesota 2 4 4 7 11 37 36 44 53 63Missouri 2 1 2 1 4 28 32 34 42 47Nebraska 2 2 4 5 6 34 34 46 52 60Ohio * * * * 1 9 11 9 9 13South Dakota 2 3 10 17 21 48 47 66 75 79Wisconsin 1 1 2 2 2 18 18 26 32 38Other States1/ 1 2 2 6 17 20 27 36 46U.S. 1 1 2 4 5 25 26 34 40 45
Data Source: NASS 'Acreage' Report, released June 2001, 2002, 2003, 2004 - http://usda.mannlib.cornell.edu/reports/nassr/field/pcp-bba/acrg0604.pdf
* Less than 1 percent.1/ Includes all other States in which USDA collected corn data.
Stacked gene varieties All GE varieties
…………………………Percent of all corn planted…………………….
Insect-resistant (Bt ) Only Herbicide-Tolerant Only
Appendix Table 2. Genetically engineered (GE) Corn Varieties by State and United States, 2000-2004
…………………………Percent of all corn planted…………………….
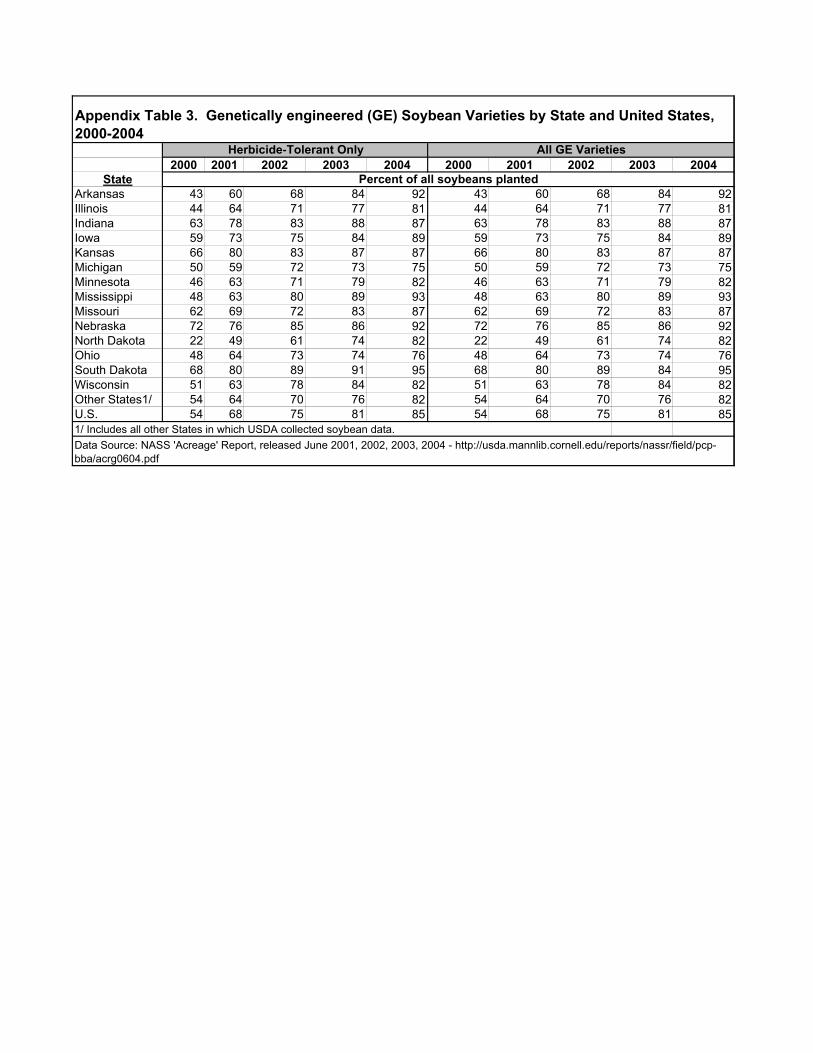
2000 2001 2002 2003 2004 2000 2001 2002 2003 2004State
Arkansas 43 60 68 84 92 43 60 68 84 92Illinois 44 64 71 77 81 44 64 71 77 81Indiana 63 78 83 88 87 63 78 83 88 87Iowa 59 73 75 84 89 59 73 75 84 89Kansas 66 80 83 87 87 66 80 83 87 87Michigan 50 59 72 73 75 50 59 72 73 75Minnesota 46 63 71 79 82 46 63 71 79 82Mississippi 48 63 80 89 93 48 63 80 89 93Missouri 62 69 72 83 87 62 69 72 83 87Nebraska 72 76 85 86 92 72 76 85 86 92North Dakota 22 49 61 74 82 22 49 61 74 82Ohio 48 64 73 74 76 48 64 73 74 76South Dakota 68 80 89 91 95 68 80 89 84 95Wisconsin 51 63 78 84 82 51 63 78 84 82Other States1/ 54 64 70 76 82 54 64 70 76 82U.S. 54 68 75 81 85 54 68 75 81 85
Appendix Table 3. Genetically engineered (GE) Soybean Varieties by State and United States, 2000-2004
Percent of all soybeans planted
Data Source: NASS 'Acreage' Report, released June 2001, 2002, 2003, 2004 - http://usda.mannlib.cornell.edu/reports/nassr/field/pcp-bba/acrg0604.pdf
1/ Includes all other States in which USDA collected soybean data.
All GE VarietiesHerbicide-Tolerant Only

2000 2001 2002 2003 2004 2000 2001 2002 2003 2004State
Arkansas 33 21 27 24 34 23 29 37 25 15California 3 11 6 9 6 17 27 26 27 39Georgia 18 13 8 14 13 32 43 55 32 23Louisiana 37 30 27 30 26 13 14 9 15 7Mississippi 29 10 19 15 16 13 15 22 16 23North Carolina 11 9 14 16 18 29 37 27 29 27Texas 7 8 7 8 10 33 35 40 39 40Other States1/ 17 18 19 18 22 21 33 35 32 24U.S. 15 13 13 14 16 26 32 36 32 30
2000 2001 2002 2003 2004 2000 2001 2002 2003 2004State
Arkansas 14 28 26 46 45 70 78 90 95 94California 4 2 1 3 7 24 40 33 39 52Georgia 32 29 30 47 58 82 85 93 93 94Louisiana 30 47 49 46 60 80 91 85 91 93Mississippi 36 61 47 61 58 78 86 88 92 97North Carolina 36 38 45 48 46 76 84 86 93 91Texas 6 6 4 6 8 46 49 51 53 58Other States1/ 36 33 32 38 45 74 84 86 88 91U.S. 20 24 22 27 30 61 69 71 73 76
Data Source: NASS 'Acreage' Report, released June 2001, 2002, 2003, 2004 - http://usda.mannlib.cornell.edu/reports/nassr/field/pcp-bba/acrg0604.pdf
Percent of all upland cotton planted
All GE VarietiesStacked Gene Varieties
Appendix Table 4. Genetically engineered (GE) Upland Cotton Varieties by State and United States, 2000-2004
pcotton data.
Herbicide-Tolerant OnlyInsect-resistant (Bt ) Only
Percent of all upland cotton planted
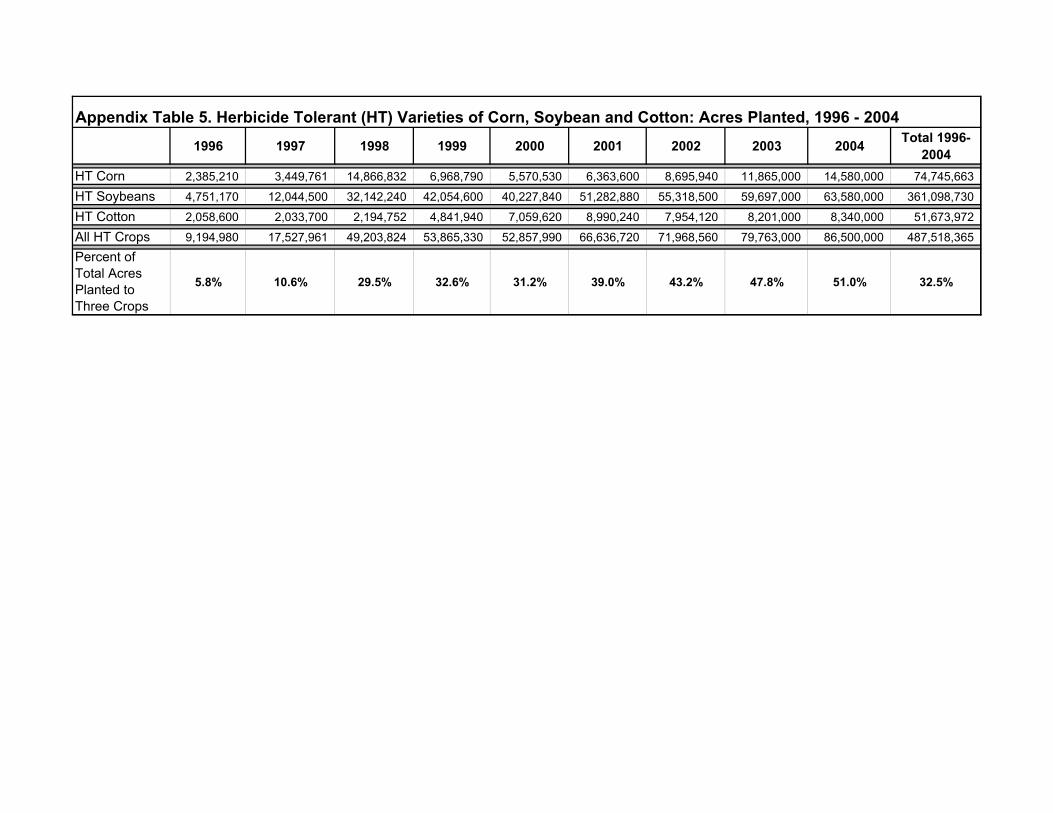
1996 1997 1998 1999 2000 2001 2002 2003 2004 Total 1996-2004
HT Corn 2,385,210 3,449,761 14,866,832 6,968,790 5,570,530 6,363,600 8,695,940 11,865,000 14,580,000 74,745,663
HT Soybeans 4,751,170 12,044,500 32,142,240 42,054,600 40,227,840 51,282,880 55,318,500 59,697,000 63,580,000 361,098,730
HT Cotton 2,058,600 2,033,700 2,194,752 4,841,940 7,059,620 8,990,240 7,954,120 8,201,000 8,340,000 51,673,972
All HT Crops 9,194,980 17,527,961 49,203,824 53,865,330 52,857,990 66,636,720 71,968,560 79,763,000 86,500,000 487,518,365
Percent of Total Acres Planted to Three Crops
5.8% 10.6% 29.5% 32.6% 31.2% 39.0% 43.2% 47.8% 51.0% 32.5%
Appendix Table 5. Herbicide Tolerant (HT) Varieties of Corn, Soybean and Cotton: Acres Planted, 1996 - 2004

1996 1997 1998 1999 2000 2001 2002 2003 2004 Total 1996-2004
Bt Corn 1,113,098 6,097,252 15,432,418 19,800,000 19,500,000 15,113,550 18,972,960 22,939,000 25,920,000 144,888,278 Bt Cotton 1,796,390 2,078,890 2,486,493 4,123,252 4,409,348 5,939,980 4,799,900 5,699,000 6,394,000 37,727,253 Total 2,909,488 8,176,142 17,918,911 23,923,252 23,909,348 21,053,530 23,772,860 28,638,000 32,314,000 182,615,531 Percent of Total Acres Planted to Two Crops
3.1% 8.7% 19.1% 26.1% 25.2% 22.0% 25.6% 30.8% 34.1% 21.6%
Appendix Table 6. Bt Transgenic Varieties of Corn and Cotton: Acres Planted, 1996 - 2004

1996 1997 1998 1999 2000 2001 2002 2003 2004*Acres Planted 64,205,000 70,850,000 72,720,000 73,780,000 74,496,000 75,416,000 73,758,000 73,700,000 74,800,000 HT Acres Planted 4,751,170 12,044,500 32,142,240 42,054,600 40,227,840 51,282,880 55,318,500 59,697,000 63,580,000
Percent Acres TreatedHT Varieties 7.4% 17.0% 44.2% 57.0% 54.0% 68.0% 75.0% 81.0% 85.0%RR Varieties 7.4% 14.5% 38.8% 51.6% 49.0% 63.0% 70.5% 76.5% 81.0%Non-RR HT varieties - 2.5% 5.4% 5.4% 5.0% 5.0% 4.5% 4.5% 4.0%Glyphosate, all soybeans 25.0% 28.0% 46.0% 62.0% 62.0% 73.0% 78.0% 84.0% 88.0%Glyphosate Notill, Non RR 17.6% 11.0% 1.8% 5.0% 8.0% 5.0% 3.0% 3.0% 3.0%
Rates per AcreNASS Average All Herbicides 1.17 1.18 1.08 1.04 1.05 0.96 1.20 1.25 1.35 Glyphosate on RR Acres 0.69 0.79 0.90 0.90 0.88 0.85 1.04 1.09 1.15 Other Herbicides on RR Acres 0.15 0.15 0.22 0.22 0.22 0.22 0.25 0.25 0.30 All Herbicides on RR Acres 0.84 0.94 1.12 1.12 1.10 1.07 1.29 1.34 1.45 Conventional Varieties 1.20 1.23 1.05 0.93 0.99 0.73 0.93 0.87 0.78
Difference in Pounds per Acre Between RR and Conventional Varieties -0.36 -0.29 0.07 0.19 0.11 0.34 0.36 0.47 0.67* Herbicide use rates in 2004 are preliminary projections based on 2002 data and recent trends.
Appendix Table 7. Herbicide Use in Conventional and Roundup Ready Herbicide Tolerant (HT) Soybeans, 1996 - 2004

1996 1997 1998 1999 2000 2001 2002* 2003 2004*Acres Planted 14,100,000 13,558,000 13,064,000 14,241,000 15,347,000 16,054,000 13,714,000 13,900,000 13,900,000 HT Acres Planted 2,058,600 2,033,700 2,194,752 4,841,940 7,059,620 8,990,240 7,954,120 8,201,000 8,340,000 Percent Acres PlantedHT Varieties 14.6% 15.0% 16.8% 34.0% 46.0% 56.0% 58.0% 59.0% 60.0%Glyphosate/RR 14.6% 14.0% 12.8% 27.0% 40.0% 55.0% 57.0% 58.0% 59.0%Bromoxynil NA 1% 4% 7% 6% 1% 1% 1% 1%Rates per AcreNASS Average All Herbicides 1.88 2.09 1.88 1.88 1.84 1.65 1.84 1.99 2.20 Glyphosate on RR Acres 0.63 0.79 1.02 1.04 1.14 1.12 1.25 1.38 1.50 Other Herbicide on RR Acres 0.95 1.05 0.95 0.95 0.95 0.80 0.90 1.05 1.10 Total RR Acres 1.58 1.84 1.97 1.99 2.09 1.92 2.15 2.43 2.60 Conventional Varieties 1.93 2.16 1.96 2.03 1.86 1.35 1.46 1.42 1.67 Difference in Pounds per Acre Between HT Transgenic and Conventional Varieties -0.35 -0.32 0.01 -0.04 0.23 0.57 0.69 1.01 0.94
Appendix Table 8. Herbicide Use in Conventional and Roundup Ready HerbicideTolerant (HT) Upland Cotton Varieties, 1996 - 2004
* Herbicide rates in 2004 are preliminary estimates based on recent trends. There was no cotton pesticide use data collected by USDA in 2002.

1996 1997 1998 1999 2000 2001 2002 2003 2004*Acres Planted 79,507,000 80,227,000 80,798,000 77,431,000 79,579,000 79,545,000 79,054,000 79,100,000 81,000,000
Bt Corn Acres Planted 1,113,098 6,097,252 15,432,418 19,800,000 19,500,000 15,113,550 18,972,960 22,929,140 25,920,000 % Bt Corn Acres Planted 1.4% 7.6% 19.1% 25.6% 24.5% 19.0% 24.0% 29.0% 32.0%
Percent Acres Treated for ECB/SWCBlambda-cyhalotrin 2.0% 1.0% 2.0% 3.0% 2.0% 2.0% 2.0% 1.0% 1.0%permethrin 4.0% 5.0% 2.0% 3.0% 3.0% 3.0% 2.0% 1.0% 1.0%cyfluthrin 1.0% 1.0% 3.0% 2.0% 2.0% 4.0% 4.0% 7.0% 7.0%chlorpyrifos (10% of total) 0.8% 0.7% 0.6% 0.5% 0.6% 0.4% 0.3% 0.4% 0.4%bifenthrin (50% of total) 0.5% 0% 1.0% 1.0% 1.0% 1.0% 1.0% 1.5% 1.5%esfenvalerate (75% of total) 0.8% 0.0% 0.0% 0.4% 0.5% 0.0% 0.0% 0.0% 0.0%dimethoate (75% of total) 0.3% 0.0% 0.8% 0.4% 0.2% 0.2% 0.5% 0.2% 0.2%methyl parathion (25% of total) 0.5% 1.0% 0.3% 0.3% 1.8% 0.3% 0.1% 0.1% 0.1%
Total Percent Acres Treated 9.9% 8.7% 9.6% 10.5% 11.0% 10.9% 9.9% 11.2% 11.2%Percent Not Treated 90.2% 91.3% 90.4% 89.5% 89.0% 89.1% 90.2% 88.8% 88.8%
Acres Treatedlambda-cyhalotrin 1,590,140 802,270 1,615,960 2,322,930 1,591,580 1,590,900 1,581,080 791,000 810,000permethrin 3,180,280 4,011,350 1,615,960 2,322,930 2,387,370 2,386,350 1,581,080 791,000 810,000cyfluthrin 795,070 802,270 2,423,940 1,548,620 1,591,580 3,181,800 3,162,160 5,537,000 5,670,000chlorpyrifos 636,056 561,589 484,788 387,155 477,474 318,180 237,162 316,400 324,000bifenthrin 397,535 0 807,980 774,310 795,790 795,450 790,540 1,186,500 1,215,000esfenvalerate 596,303 0 0 290,366 358,106 0 0 0 0dimethoate 238,521 0 605,985 290,366 179,053 178,976 355,743 177,975 182,250methyl parathion 397,535 802,270 201,995 193,578 1,392,633 198,863 79,054 39,550 40,500
Total Acres Treated 7,831,440 6,979,749 7,756,608 8,130,255 8,773,585 8,650,519 7,786,819 8,839,425 9,051,750
lambda-cyhalotrin 0.20 0.11 0.21 0.29 0.18 0.18 0.20 0.09 0.09permethrin 0.41 0.57 0.21 0.29 0.27 0.28 0.20 0.09 0.09cyfluthrin 0.10 0.11 0.31 0.19 0.18 0.37 0.41 0.63 0.63chlorpyrifos 0.08 0.08 0.06 0.05 0.05 0.04 0.03 0.04 0.04bifenthrin 0.05 0.00 0.10 0.10 0.09 0.09 0.10 0.13 0.13esfenvalerate 0.08 0.00 0.00 0.04 0.04 0.00 0.00 0.00 0.00dimethoate 0.03 0.00 0.08 0.04 0.02 0.02 0.05 0.02 0.02methyl parathion 0.05 0.11 0.03 0.02 0.16 0.02 0.01 0.00 0.00
Rates per Acrelambda-cyhalotrin 0.02 0.02 0.02 0.02 0.02 0.02 0.02 0.02 0.02permethrin 0.12 0.10 0.10 0.09 0.09 0.10 0.10 0.10 0.10cyfluthrin*** 0.006 0.006 0.006 0.006 0.006 0.006 0.006 0.006 0.006chlorpyrifos 1.04 1.23 1.01 1.08 1.05 1.14 0.94 0.94 0.94bifenthrin 0.05 0.00 0.07 0.07 0.07 0.05 0.06 0.06 0.06esfenvalerate 0.03 0.00 0.00 0.05 0.13 0.02 0.00 0.00 0.00dimethoate 0.46 0.00 0.52 0.46 0.48 0.51 0.42 0.42 0.42methyl parathion 0.52 0.66 0.41 0.51 0.45 0.52 0.53 0.53 0.53
Conventional CornWeighted Average Rate per Acre Treated 0.18 0.23 0.15 0.12 0.18 0.10 0.08 0.06 0.06
Bt Corn AcresEstimated Acres Planted to Bt Previously Treated with Insecticide 1,000,000 2,000,000 4,400,000 5,000,000 5,000,000 4,000,000 5,500,000 7,000,000 7,100,000 Percent Acres Planted to Bt Previously Treated with Insecticide 90% 33% 29% 25% 26% 26% 29% 31% 27%Weighted Average Rate Applied on Acres Planted to Bt Varieties 0.16 0.08 0.04 0.03 0.05 0.03 0.02 0.02 0.02
Reduction in Insecticide Use per Acre of Bt Corn -0.16 -0.08 -0.04 -0.03 -0.05 -0.03 -0.02 -0.02 -0.02
*** NASS reported the rate of application of cyfluthrin at 0.01 pounds per acre for 1996-2002, and 0.006 in 2003. The higher rate in the earlier years reflects a rounding up of the rate, which has been set at 0.006 for the whole period.
* Pesticide use estimates for 2004 are preliminary projections based on 2003 data and recent trends.
Appendix Table 9. Insecticide Use to Control the European Corn Borer (ECB) and Southwestern Corn Borer (SWCB) on Conventional and Bt Transgenic Varieties of Corn, 2996 - 2004 [See Notes]
Weighted Share of Treated Acres
** Differences in pounds of insecticides applied do not take into account the pounds of Bt produced within the cells of transgenic corn plants (see text for discussion).
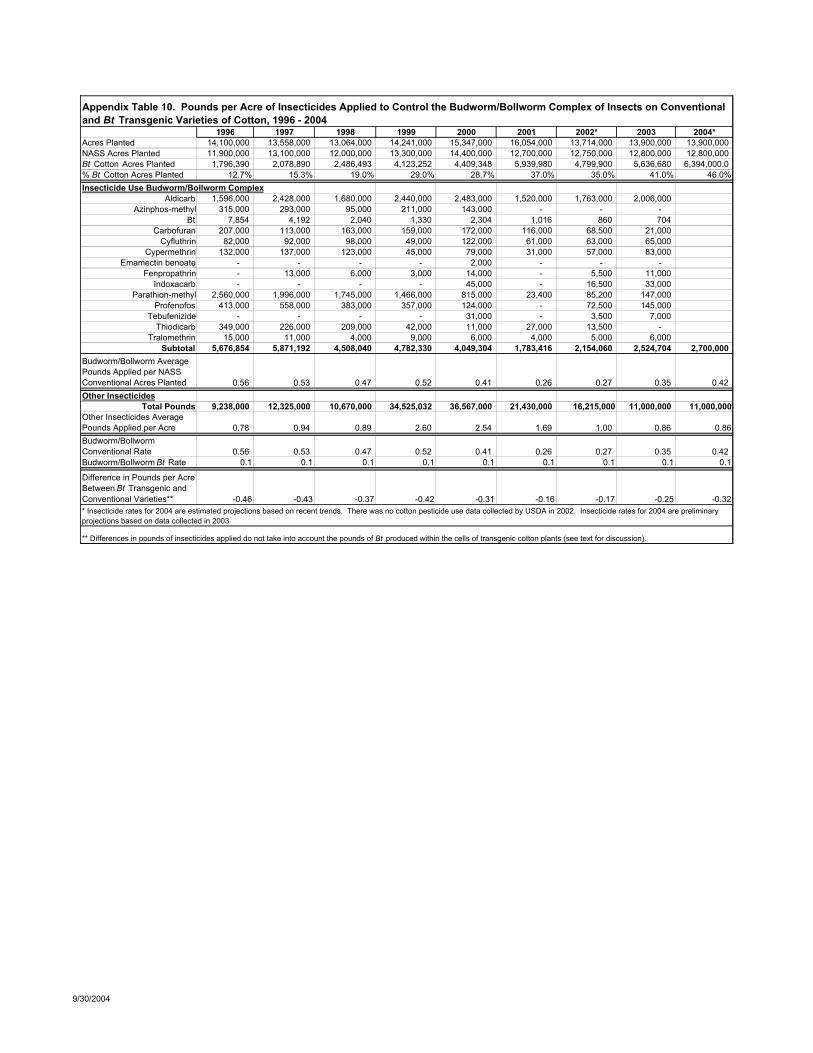
1996 1997 1998 1999 2000 2001 2002* 2003 2004*Acres Planted 14,100,000 13,558,000 13,064,000 14,241,000 15,347,000 16,054,000 13,714,000 13,900,000 13,900,000 NASS Acres Planted 11,900,000 13,100,000 12,000,000 13,300,000 14,400,000 12,700,000 12,750,000 12,800,000 12,800,000 Bt Cotton Acres Planted 1,796,390 2,078,890 2,486,493 4,123,252 4,409,348 5,939,980 4,799,900 5,636,680 6,394,000.0 % Bt Cotton Acres Planted 12.7% 15.3% 19.0% 29.0% 28.7% 37.0% 35.0% 41.0% 46.0%Insecticide Use Budworm/Bollworm Complex
Aldicarb 1,596,000 2,428,000 1,680,000 2,440,000 2,483,000 1,520,000 1,763,000 2,006,000 Azinphos-methyl 315,000 293,000 95,000 211,000 143,000 - - -
Bt 7,854 4,192 2,040 1,330 2,304 1,016 860 704 Carbofuran 207,000 113,000 163,000 159,000 172,000 116,000 68,500 21,000
Cyfluthrin 82,000 92,000 98,000 49,000 122,000 61,000 63,000 65,000 Cypermethrin 132,000 137,000 123,000 45,000 79,000 31,000 57,000 83,000
Emamectin benoate - - - - 2,000 - - - Fenpropathrin - 13,000 6,000 3,000 14,000 - 5,500 11,000
Indoxacarb - - - - 45,000 - 16,500 33,000 Parathion-methyl 2,560,000 1,996,000 1,745,000 1,466,000 815,000 23,400 85,200 147,000
Profenofos 413,000 558,000 383,000 357,000 124,000 - 72,500 145,000 Tebufenizide - - - - 31,000 - 3,500 7,000
Thiodicarb 349,000 226,000 209,000 42,000 11,000 27,000 13,500 - Tralomethrin 15,000 11,000 4,000 9,000 6,000 4,000 5,000 6,000
Subtotal 5,676,854 5,871,192 4,508,040 4,782,330 4,049,304 1,783,416 2,154,060 2,524,704 2,700,000 Budworm/Bollworm Average Pounds Applied per NASS Conventional Acres Planted 0.56 0.53 0.47 0.52 0.41 0.26 0.27 0.35 0.42 Other Insecticides
Total Pounds 9,238,000 12,325,000 10,670,000 34,525,032 36,567,000 21,430,000 16,215,000 11,000,000 11,000,000Other Insecticides Average Pounds Applied per Acre 0.78 0.94 0.89 2.60 2.54 1.69 1.00 0.86 0.86Budworm/Bollworm Conventional Rate 0.56 0.53 0.47 0.52 0.41 0.26 0.27 0.35 0.42 Budworm/Bollworm Bt Rate 0.1 0.1 0.1 0.1 0.1 0.1 0.1 0.1 0.1
Difference in Pounds per Acre Between Bt Transgenic and Conventional Varieties** -0.46 -0.43 -0.37 -0.42 -0.31 -0.16 -0.17 -0.25 -0.32
Appendix Table 10. Pounds per Acre of Insecticides Applied to Control the Budworm/Bollworm Complex of Insects on Conventional and Bt Transgenic Varieties of Cotton, 1996 - 2004
* Insecticide rates for 2004 are estimated projections based on recent trends. There was no cotton pesticide use data collected by USDA in 2002. Insecticide rates for 2004 are preliminary projections based on data collected in 2003
** Differences in pounds of insecticides applied do not take into account the pounds of Bt produced within the cells of transgenic cotton plants (see text for discussion).
9/30/2004
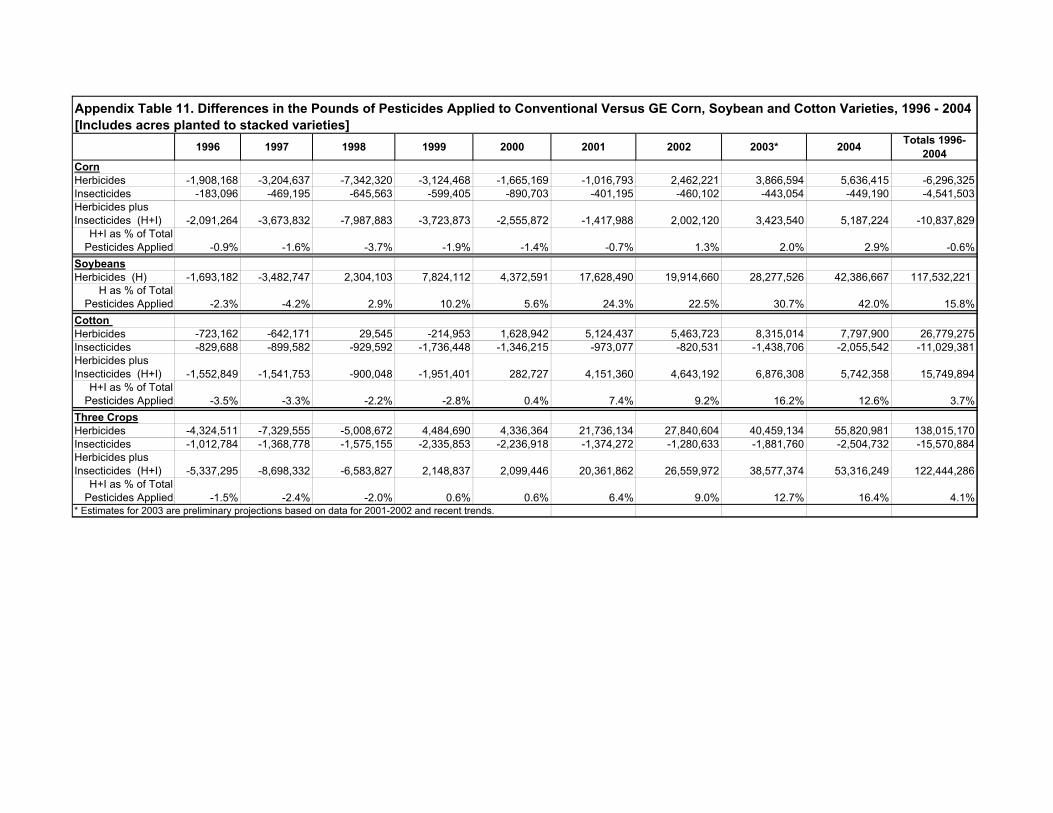
1996 1997 1998 1999 2000 2001 2002 2003* 2004 Totals 1996-2004
CornHerbicides -1,908,168 -3,204,637 -7,342,320 -3,124,468 -1,665,169 -1,016,793 2,462,221 3,866,594 5,636,415 -6,296,325Insecticides -183,096 -469,195 -645,563 -599,405 -890,703 -401,195 -460,102 -443,054 -449,190 -4,541,503Herbicides plus Insecticides (H+I) -2,091,264 -3,673,832 -7,987,883 -3,723,873 -2,555,872 -1,417,988 2,002,120 3,423,540 5,187,224 -10,837,829
H+I as % of Total Pesticides Applied -0.9% -1.6% -3.7% -1.9% -1.4% -0.7% 1.3% 2.0% 2.9% -0.6%
SoybeansHerbicides (H) -1,693,182 -3,482,747 2,304,103 7,824,112 4,372,591 17,628,490 19,914,660 28,277,526 42,386,667 117,532,221
H as % of Total Pesticides Applied -2.3% -4.2% 2.9% 10.2% 5.6% 24.3% 22.5% 30.7% 42.0% 15.8%
Cotton Herbicides -723,162 -642,171 29,545 -214,953 1,628,942 5,124,437 5,463,723 8,315,014 7,797,900 26,779,275Insecticides -829,688 -899,582 -929,592 -1,736,448 -1,346,215 -973,077 -820,531 -1,438,706 -2,055,542 -11,029,381Herbicides plus Insecticides (H+I) -1,552,849 -1,541,753 -900,048 -1,951,401 282,727 4,151,360 4,643,192 6,876,308 5,742,358 15,749,894
H+I as % of Total Pesticides Applied -3.5% -3.3% -2.2% -2.8% 0.4% 7.4% 9.2% 16.2% 12.6% 3.7%
Three CropsHerbicides -4,324,511 -7,329,555 -5,008,672 4,484,690 4,336,364 21,736,134 27,840,604 40,459,134 55,820,981 138,015,170Insecticides -1,012,784 -1,368,778 -1,575,155 -2,335,853 -2,236,918 -1,374,272 -1,280,633 -1,881,760 -2,504,732 -15,570,884Herbicides plus Insecticides (H+I) -5,337,295 -8,698,332 -6,583,827 2,148,837 2,099,446 20,361,862 26,559,972 38,577,374 53,316,249 122,444,286
H+I as % of Total Pesticides Applied -1.5% -2.4% -2.0% 0.6% 0.6% 6.4% 9.0% 12.7% 16.4% 4.1%
* Estimates for 2003 are preliminary projections based on data for 2001-2002 and recent trends.
Appendix Table 11. Differences in the Pounds of Pesticides Applied to Conventional Versus GE Corn, Soybean and Cotton Varieties, 1996 - 2004 [Includes acres planted to stacked varieties]
Related Documents


