EPIDEMIOLOGY Genetic variation in genes of the fatty acid synthesis pathway and breast cancer risk Daniele Campa James McKay Olga Sinilnikova Anika Hu ¨sing Ulla Vogel Rikke Dalgaard Hansen Kim Overvad Petra Mariann Witt Franc ¸oise Clavel-Chapelon Marie-Christine Boutron-Ruault Veronique Chajes Sabine Rohrmann Jenny Chang-Claude Heiner Boeing Eva Fisher Antonia Trichopoulou Dimitrios Trichopoulos Domenico Palli Anna Villarini Carlotta Sacerdote Amalia Mattiello Rosario Tumino Petra H. M. Peeters Carla H. van Gils H. Bas Bueno-de-Mesquita Eiliv Lund Marı ´a Dolores Chirlaque Nu ´ria Sala Laudina Rodriguez Suarez Aurelio Barricarte Miren Dorronsoro Maria-Jose ´ Sa ´nchez Per Lenner Go ¨ran Hallmans Kostas Tsilidis Sheila Bingham Kay-Tee Khaw Valentina Gallo Teresa Norat Elio Riboli Sabina Rinaldi Gilbert Lenoir Sean V. Tavtigian Federico Canzian Rudolf Kaaks Received: 9 February 2009 / Accepted: 11 February 2009 / Published online: 28 February 2009 Ó Springer Science+Business Media, LLC. 2009 Abstract Fatty acid synthase (FAS) is the major enzyme of lipogenesis. It catalyzes the NADPH-dependent con- densation of acetyl-CoA and malonyl-CoA to produce palmitic acid. Transcription of the FAS gene is controlled synergistically by the transcription factors ChREBP (car- bohydrate response element-binding protein), which is induced by glucose, and SREBP-1 (sterol response ele- ment-binding protein-1), which is stimulated by insulin through the PI3K/Akt signal transduction pathway. We investigated whether the genetic variability of the genes encoding for ChREBP, SREBP and FAS (respectively, MLXIPL, SREBF1 and FASN) is related to breast cancer risk and body-mass index (BMI) by studying 1,294 breast cancer cases and 2,452 controls from the European Pro- spective Investigation on Cancer (EPIC). We resequenced the FAS gene and combined information of SNPs found by D. Campa A. Hu ¨sing S. Rohrmann J. Chang-Claude F. Canzian R. Kaaks (&) Department of Cancer Epidemiology, German Cancer Research Center (DKFZ), Im Neuenheimer Feld 280, 69120 Heidelberg, Germany e-mail: [email protected] D. Campa University of Pisa, Pisa, Italy J. McKay V. Chajes S. Rinaldi S. V. Tavtigian International Agency for Research on Cancer, Lyon, France O. Sinilnikova Hospices Civils de Lyon/Centre Le ´on Be ´rard, CNRS-Universite ´ Claude Bernard UMR5201, Lyon, France U. Vogel National Food Institute, Technical University of Denmark, Copenhagen, Denmark R. D. Hansen Danish Cancer Society, Copenhagen, Denmark K. Overvad P. M. Witt Aarhus University Hospital, Aalborg, Denmark F. Clavel-Chapelon M.-C. Boutron-Ruault V. Chajes G. Lenoir Insitut Gustave Roussy, Villejuif, France H. Boeing E. Fisher German Institute of Human Nutrition, Potsdam-Rehbruecke, Germany A. Trichopoulou Department of Hygiene and Epidemiology, Medical School, University of Athens, Athens, Greece D. Trichopoulos Department of Epidemiology, Havard School of Public Health, Boston, MA, USA D. Palli Cancer Research and Prevention Institute (ISPO), Florence, Italy 123 Breast Cancer Res Treat (2009) 118:565–574 DOI 10.1007/s10549-009-0347-8

Welcome message from author
This document is posted to help you gain knowledge. Please leave a comment to let me know what you think about it! Share it to your friends and learn new things together.
Transcript
EPIDEMIOLOGY
Genetic variation in genes of the fatty acid synthesis pathwayand breast cancer risk
Daniele Campa Æ James McKay Æ Olga Sinilnikova Æ Anika Husing Æ Ulla Vogel Æ Rikke Dalgaard Hansen ÆKim Overvad Æ Petra Mariann Witt Æ Francoise Clavel-Chapelon Æ Marie-Christine Boutron-Ruault ÆVeronique Chajes Æ Sabine Rohrmann Æ Jenny Chang-Claude Æ Heiner Boeing Æ Eva Fisher ÆAntonia Trichopoulou Æ Dimitrios Trichopoulos Æ Domenico Palli Æ Anna Villarini ÆCarlotta Sacerdote Æ Amalia Mattiello Æ Rosario Tumino Æ Petra H. M. Peeters Æ Carla H. van Gils ÆH. Bas Bueno-de-Mesquita Æ Eiliv Lund Æ Marıa Dolores Chirlaque Æ Nuria Sala Æ Laudina Rodriguez Suarez ÆAurelio Barricarte Æ Miren Dorronsoro Æ Maria-Jose Sanchez Æ Per Lenner Æ Goran Hallmans ÆKostas Tsilidis Æ Sheila Bingham Æ Kay-Tee Khaw Æ Valentina Gallo Æ Teresa Norat ÆElio Riboli Æ Sabina Rinaldi Æ Gilbert Lenoir Æ Sean V. Tavtigian Æ Federico Canzian ÆRudolf Kaaks
Received: 9 February 2009 / Accepted: 11 February 2009 / Published online: 28 February 2009
� Springer Science+Business Media, LLC. 2009
Abstract Fatty acid synthase (FAS) is the major enzyme
of lipogenesis. It catalyzes the NADPH-dependent con-
densation of acetyl-CoA and malonyl-CoA to produce
palmitic acid. Transcription of the FAS gene is controlled
synergistically by the transcription factors ChREBP (car-
bohydrate response element-binding protein), which is
induced by glucose, and SREBP-1 (sterol response ele-
ment-binding protein-1), which is stimulated by insulin
through the PI3K/Akt signal transduction pathway. We
investigated whether the genetic variability of the genes
encoding for ChREBP, SREBP and FAS (respectively,
MLXIPL, SREBF1 and FASN) is related to breast cancer
risk and body-mass index (BMI) by studying 1,294 breast
cancer cases and 2,452 controls from the European Pro-
spective Investigation on Cancer (EPIC). We resequenced
the FAS gene and combined information of SNPs found by
D. Campa � A. Husing � S. Rohrmann � J. Chang-Claude �F. Canzian � R. Kaaks (&)
Department of Cancer Epidemiology, German Cancer Research
Center (DKFZ), Im Neuenheimer Feld 280, 69120 Heidelberg,
Germany
e-mail: [email protected]
D. Campa
University of Pisa, Pisa, Italy
J. McKay � V. Chajes � S. Rinaldi � S. V. Tavtigian
International Agency for Research on Cancer, Lyon, France
O. Sinilnikova
Hospices Civils de Lyon/Centre Leon Berard, CNRS-Universite
Claude Bernard UMR5201, Lyon, France
U. Vogel
National Food Institute, Technical University of Denmark,
Copenhagen, Denmark
R. D. Hansen
Danish Cancer Society, Copenhagen, Denmark
K. Overvad � P. M. Witt
Aarhus University Hospital, Aalborg, Denmark
F. Clavel-Chapelon � M.-C. Boutron-Ruault � V. Chajes �G. Lenoir
Insitut Gustave Roussy, Villejuif, France
H. Boeing � E. Fisher
German Institute of Human Nutrition, Potsdam-Rehbruecke,
Germany
A. Trichopoulou
Department of Hygiene and Epidemiology, Medical School,
University of Athens, Athens, Greece
D. Trichopoulos
Department of Epidemiology, Havard School of Public Health,
Boston, MA, USA
D. Palli
Cancer Research and Prevention Institute (ISPO), Florence, Italy
123
Breast Cancer Res Treat (2009) 118:565–574
DOI 10.1007/s10549-009-0347-8
resequencing and SNPs from public databases. Using a
tagging approach and selecting 20 SNPs, we covered all the
common genetic variation of these genes. In this study we
were not able to find any statistically significant association
between the SNPs in the FAS, ChREBP and SREPB-1
genes and an increased risk of breast cancer overall and by
subgroups of age, menopausal status, hormone replacement
therapy (HRT) use or BMI. On the other hand, we found
that two SNPs in FASN were associated with BMI.
Keywords Fatty acid synthase �Carbohydrate response element-binding protein �Sterol response element-binding protein-1 � Breast cancer �Susceptibility to cancer � Body-mass index
Introduction
International comparison suggests that one of the key
factors underlying the high incidence of breast cancer (BC)
in industrially developed countries is a Western lifestyle,
characterized by low rates of energy expenditure and a
high-energy diet, rich in saturated fats, refined carbohy-
drates and animal protein. However, the physiologic
mechanisms of this relationship are poorly understood.
Various hormonal and metabolic factors have been postu-
lated to mediate the effects of a Western nutritional
lifestyle on BC risk [1–7]. Breast cancer risk appears to be
increased among women who have elevated plasma levels
of insulin-like growth factor-I (IGF-I) [1, 2, 4, 5, 7–10].
Excess energy intake and obesity also cause insulin resis-
tance, which is associated with elevated blood levels of
glucose and insulin [1, 3–6, 8, 11–13]. In turn, elevated
plasma levels of glucose [12] and insulin [3, 14] have been
implicated as possible risk factors for both pre- and post-
menopausal BC.
Fatty acid synthase (FAS) is the major enzyme of lipo-
genesis. It catalyzes the NADPH-dependent condensation of
acetyl-CoA and malonyl-CoA to produce predominantly the
16-carbon saturated free palmitic acid [15]. Transcription of
the FAS gene is controlled synergistically by the transcrip-
tion factors ChREBP (carbohydrate response element-
binding protein) and SREBP-1 (sterol response element-
binding protein-1). ChREBP binds directly to the endoge-
nous promoter of the FAS gene in a glucose-dependent but
insulin-independent manner and is absolutely required for its
induction by glucose [16]. Sterol-responsive element bind-
ing protein-1 (SREBP-1) is an important transcription factor
responsible for lipid accumulation in pancreatic islets in
response to high glucose and insulin, through stimulation of
acetyl-CoA carboxylase-1 and FAS [17, 18]. It is stimulated
by insulin through the PI3K/Akt signal transduction pathway
[19, 20]. Moreover, SREBP-1 inhibition also abolishes the
induction of FAS promoter.
A. Villarini
Istituto Nazionale dei Tumori (IRCCS), Milan, Italy
C. Sacerdote
CPO Piemonte, Torino, Italy
A. Mattiello
Federico II University, Naples, Italy
R. Tumino
Azienda Ospedaliera ‘‘Civile M.P. Arezzo’’, Ragusa, Italy
P. H. M. Peeters � C. H. van Gils
Julius Center, University Medical Center, Utrecht, The
Netherlands
H. Bas Bueno-de-Mesquita
National Institute for Public Health and the Environment,
Bilthoven, The Netherlands
E. Lund
Institute of Community Medicine University of Tromsø,
Tromsø, Norway
M. D. Chirlaque
Murcia Health Council, Murcia, Spain
N. Sala
Catalan Institute of Oncology, Barcelona, Spain
L. R. Suarez
Consejerıa de Salud y Servicios Sanitarios Principado de
Asturias, Oviedo, Spain
A. Barricarte
Public Health Institute of Navarra, Pamplona, Spain
M. Dorronsoro
Public Health Department of Gipuzkoa and CIBER de
Epidemiologıa y Salud Publica (CIBERESP), San Sebastian,
Spain
M.-J. Sanchez
Andalusian School of Public Health and CIBERESP, Granada,
Spain
P. Lenner � G. Hallmans
Umea University, Umea, Sweden
K. Tsilidis
University of Oxford, Oxford, UK
S. Bingham � K.-T. Khaw
University of Cambridge, Cambridge, UK
V. Gallo � T. Norat � E. Riboli
Imperial College, London, UK
566 Breast Cancer Res Treat (2009) 118:565–574
123

The FAS gene is highly up-regulated in tumor cells of
the breast, as well as colon, prostate, ovary and endome-
trium [21–25], although this gene is expressed at minimum
or undetectable level in most normal tissues. Therefore,
FAS overexpression is considered to be one of the most
common molecular changes in cancer cells [22, 24, 26–28].
Importantly, treatment of tumor cells with pharmacologic
inhibitors of FAS leads to cell cycle arrest, followed by
apoptosis of the tumor cells [29]. Moreover, FAS inhibitors
have been shown to delay progression of breast and ovarian
tumor xenografts, and to induce apoptosis of breast carci-
noma cells [15, 23, 30–33]. Thus, the early activation of
FAS in malignant and pre-malignant cells could represent a
necessary survival strategy, which occurs to compensate
for an insufficiency of both oxygen and dietary fatty acids
due, for example, to lack of angiogenesis [34]. Thereafter,
high levels of FAS are maintained in coordination with
increased demand for fatty acid metabolism and/or
membrane synthesis in response to cancer-related overex-
pression of growth factors and/or growth factor receptors
[34]. Moreover, FAS hyperactivity and overexpression
preferentially occur in the aggressive varieties of cancer
and serve as an independent prognostic indicator of adverse
clinical outcome [34].
The above observations led us to hypothesize that
ChREBP, SREBP, and FAS, the key molecules involved in
cellular fatty acid synthesis, may be centrally implicated in
mammary gland carcinogenesis, and that polymorphic
alleles of their encoding genes that modify their expression
or activity confer altered BC susceptibility. In this report
we investigated the genetic variability of the genes
encoding for ChREBP, SREBP and FAS. We tested asso-
ciation of tagging SNPs in the three candidate genes with
BC risk in a study of 1,294 invasive BC cases and 2,452
controls nested within the European Prospective Investi-
gation into Cancer and Nutrition (EPIC). Since weight gain
and obesity are well-known risk factors for postmenopausal
BC [35], we have tested association of tagging SNPs in our
three candidate genes with body-mass index (BMI) as well.
To our knowledge this is the first report on polymorphisms
of these genes and BC risk.
Materials and methods
The EPIC cohort
A fully detailed description of the EPIC cohort has been
published elsewhere [36]. Briefly, EPIC consists of about
370,000 women and 150,000 men, aged 35–69, recruited
between 1992 and 2005 in 10 Western European countries.
The vast majority ([97%) of subjects recruited in the
EPIC cohort are of European (‘Caucasian’) origin. All
EPIC study subjects provided anthropometric measure-
ments (height, weight, and waist and hip circumferences)
and extensive, standardized questionnaire information
about medical history, diet, physical activity, smoking, and
other lifestyle factors. Women also answered questions
about menstrual and reproductive history, hysterectomy,
ovariectomy, and use of exogenous hormones for contra-
ception or treatment of menopausal symptoms. About
260,000 women and 140,000 men provided a blood
sample.
Cases of cancer occurring after recruitment into the
cohort and blood donation are identified through local and
national cancer registries in 7 of the 10 countries, and in
France, Germany, and Greece by a combination of contacts
with national health insurances and/or active follow-up
through the study subjects or their next of kin. Follow-up
on vital status is achieved through record linkage with
mortality registries.
Selection of case and control subjects
Case subjects were selected among women who developed
BC after blood collection. Control subjects (1–2 controls
per case) were selected randomly by incidence density
sampling, matching the cases for centre of recruitment, age
at blood donation, duration of follow-up, menopausal status
at the time of blood donation and use of exogenous hor-
mones. This study did not include women who were using
hormone replacement therapy (HRT) at the time of blood
donation. A total of 1,294 invasive BC cases and 2,452
controls were included in the present study. Each control
should have been free of cancer up to the duration of fol-
low-up of the index case. The study was approved by the
ethical review boards of the International Agency for
Research on Cancer, and of the collaborating institutions
responsible for subject recruitment in each of the EPIC
recruitment centres.
Resequencing analysis
The coding exons flanked by approximately 30 bp of
proximal intronic sequence, 50 UTR, and proximal pro-
moters of FASN were resequenced on 46 samples of BC
cases of Caucasian origin not carriers of germline BRCA1/
BRCA2 mutations, using previously established procedures
[37]. The genomic sequences of each locus of interest were
downloaded from the UC Santa Cruz genome browser
(http://genome.ucsc.edu/) (Sequences of the mutation
screening primers and experimental conditions are avail-
able upon request). Sequencing reaction products were
electrophoresed on a Spectrumedix capillary sequencer.
The resulting chromatograms were analyzed using the
program Java SnpScreen (S. V. Tavtigian, unpublished).
Breast Cancer Res Treat (2009) 118:565–574 567
123
The program aligns all of the chromatograms to the
canonical text sequence of each amplicon, normalizes the
signal strength from all of the chromatograms, and then
displays them as aligned forward–reverse chromatogram
pairs. Potentially heterozygous positions are spotted, based
on the joint data from the target sequence and each forward
and reverse chromatogram pair.
Selection of tagging SNPs
We aimed at surveying the entire set of common genetic
variants in the FASN, MLXIPL and SREBF1 genes. We
followed a tagging approach [38]. Gene regions were
defined as the sequence between the beginning of the first
known exon and the end of the last known exon. When an
LD block covering a part of the gene extended outside the
gene we also considered any additional sequence to include
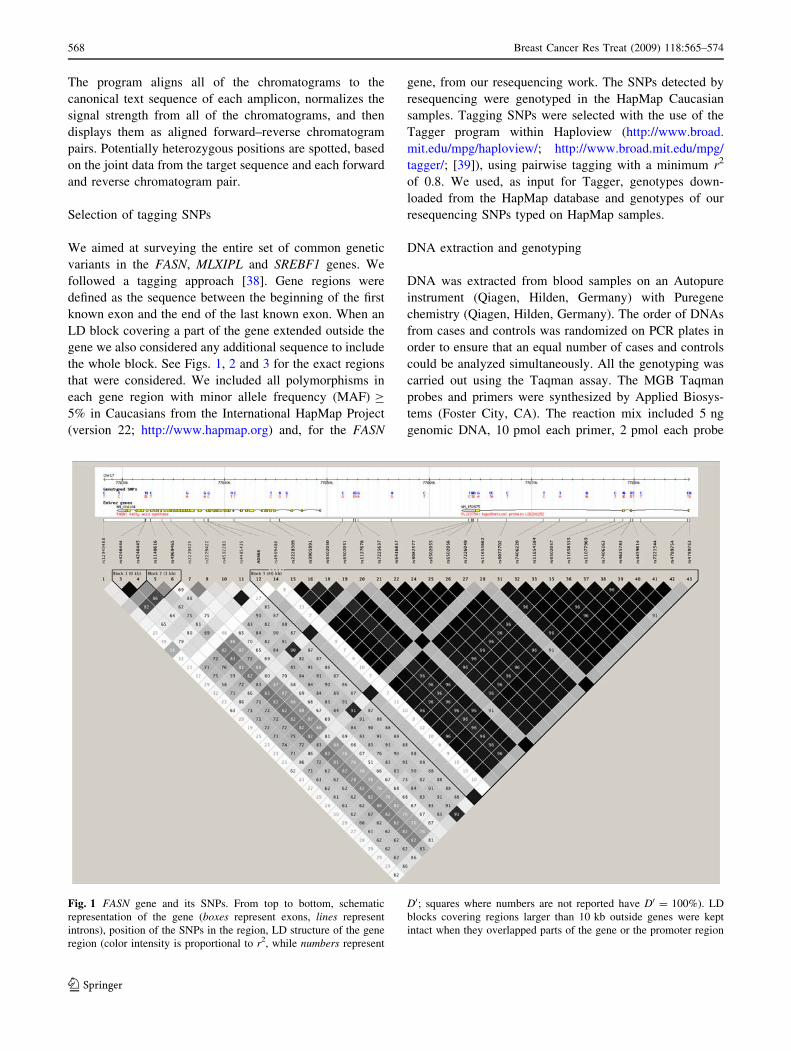
the whole block. See Figs. 1, 2 and 3 for the exact regions
that were considered. We included all polymorphisms in
each gene region with minor allele frequency (MAF) C
5% in Caucasians from the International HapMap Project
(version 22; http://www.hapmap.org) and, for the FASN
gene, from our resequencing work. The SNPs detected by
resequencing were genotyped in the HapMap Caucasian
samples. Tagging SNPs were selected with the use of the
Tagger program within Haploview (http://www.broad.
mit.edu/mpg/haploview/; http://www.broad.mit.edu/mpg/
tagger/; [39]), using pairwise tagging with a minimum r2
of 0.8. We used, as input for Tagger, genotypes down-
loaded from the HapMap database and genotypes of our
resequencing SNPs typed on HapMap samples.
DNA extraction and genotyping
DNA was extracted from blood samples on an Autopure
instrument (Qiagen, Hilden, Germany) with Puregene
chemistry (Qiagen, Hilden, Germany). The order of DNAs
from cases and controls was randomized on PCR plates in
order to ensure that an equal number of cases and controls
could be analyzed simultaneously. All the genotyping was
carried out using the Taqman assay. The MGB Taqman
probes and primers were synthesized by Applied Biosys-
tems (Foster City, CA). The reaction mix included 5 ng
genomic DNA, 10 pmol each primer, 2 pmol each probe
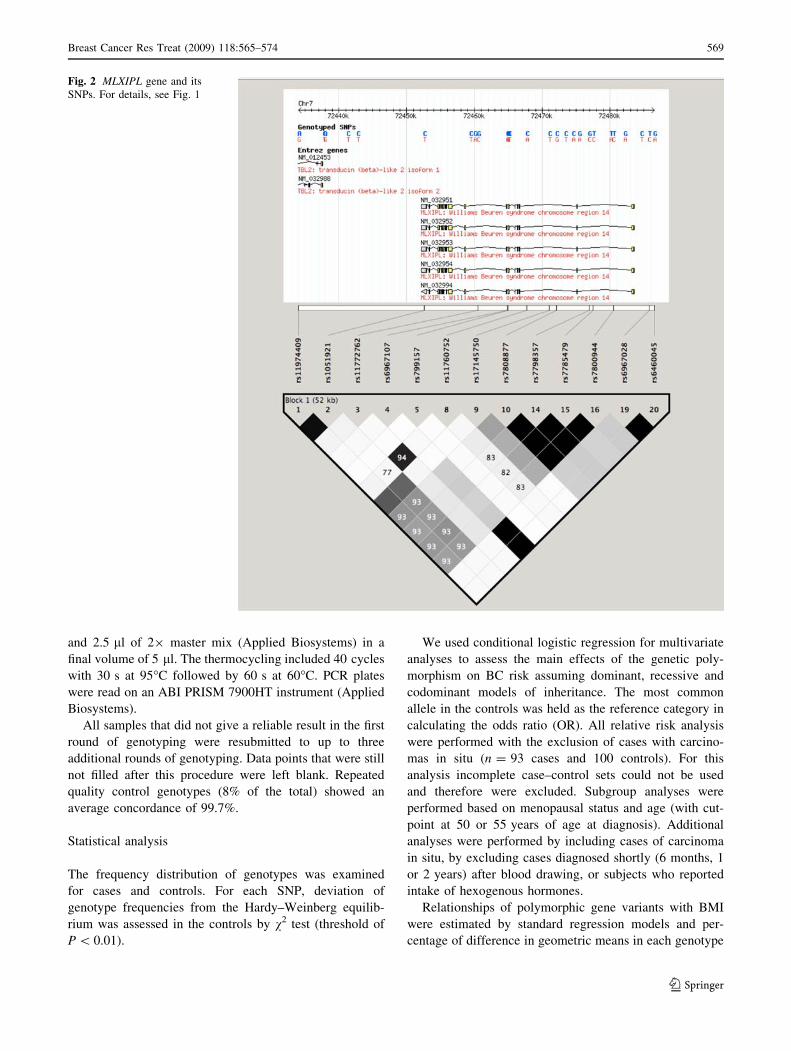
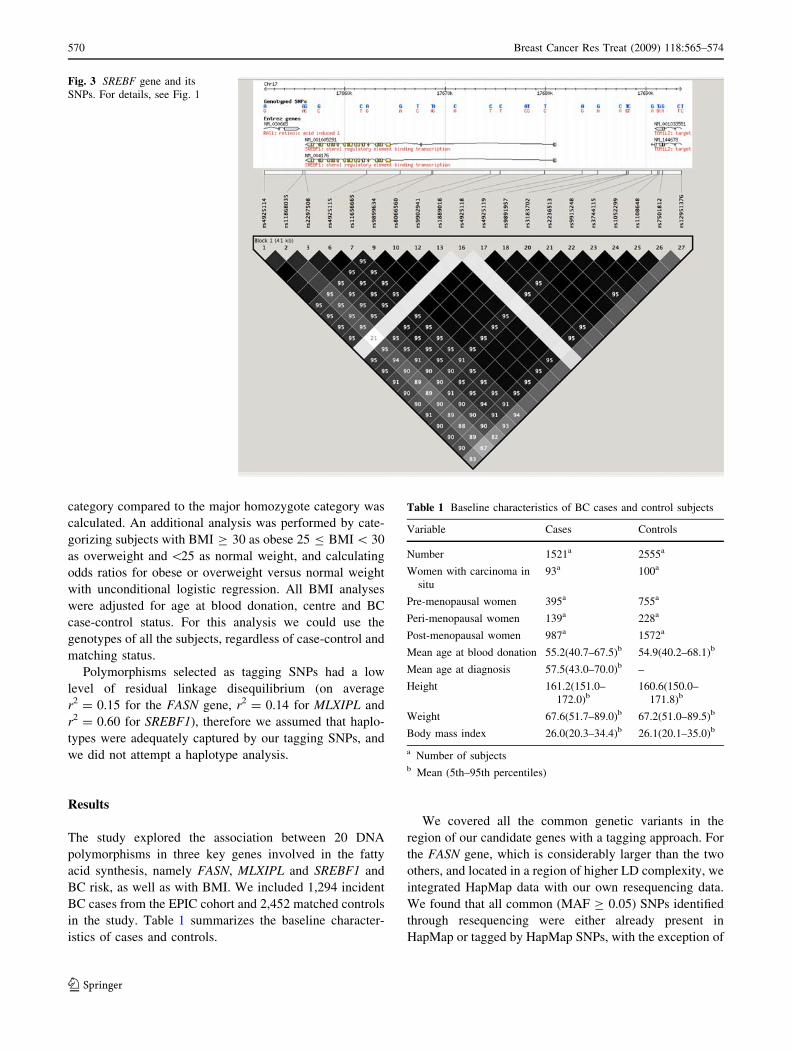
Fig. 1 FASN gene and its SNPs. From top to bottom, schematic
representation of the gene (boxes represent exons, lines represent
introns), position of the SNPs in the region, LD structure of the gene
region (color intensity is proportional to r2, while numbers represent
D0; squares where numbers are not reported have D0 = 100%). LD
blocks covering regions larger than 10 kb outside genes were kept
intact when they overlapped parts of the gene or the promoter region
568 Breast Cancer Res Treat (2009) 118:565–574
123
and 2.5 ll of 29 master mix (Applied Biosystems) in a
final volume of 5 ll. The thermocycling included 40 cycles
with 30 s at 95�C followed by 60 s at 60�C. PCR plates
were read on an ABI PRISM 7900HT instrument (Applied
Biosystems).
All samples that did not give a reliable result in the first
round of genotyping were resubmitted to up to three
additional rounds of genotyping. Data points that were still
not filled after this procedure were left blank. Repeated
quality control genotypes (8% of the total) showed an
average concordance of 99.7%.
Statistical analysis
The frequency distribution of genotypes was examined
for cases and controls. For each SNP, deviation of
genotype frequencies from the Hardy–Weinberg equilib-
rium was assessed in the controls by v2 test (threshold of
P \ 0.01).
We used conditional logistic regression for multivariate
analyses to assess the main effects of the genetic poly-
morphism on BC risk assuming dominant, recessive and
codominant models of inheritance. The most common
allele in the controls was held as the reference category in
calculating the odds ratio (OR). All relative risk analysis
were performed with the exclusion of cases with carcino-
mas in situ (n = 93 cases and 100 controls). For this
analysis incomplete case–control sets could not be used
and therefore were excluded. Subgroup analyses were
performed based on menopausal status and age (with cut-
point at 50 or 55 years of age at diagnosis). Additional
analyses were performed by including cases of carcinoma
in situ, by excluding cases diagnosed shortly (6 months, 1
or 2 years) after blood drawing, or subjects who reported
intake of hexogenous hormones.
Relationships of polymorphic gene variants with BMI
were estimated by standard regression models and per-
centage of difference in geometric means in each genotype
Fig. 2 MLXIPL gene and its
SNPs. For details, see Fig. 1
Breast Cancer Res Treat (2009) 118:565–574 569
123
category compared to the major homozygote category was
calculated. An additional analysis was performed by cate-
gorizing subjects with BMI C 30 as obese 25 B BMI \ 30
as overweight and \25 as normal weight, and calculating
odds ratios for obese or overweight versus normal weight
with unconditional logistic regression. All BMI analyses
were adjusted for age at blood donation, centre and BC
case-control status. For this analysis we could use the
genotypes of all the subjects, regardless of case-control and
matching status.
Polymorphisms selected as tagging SNPs had a low
level of residual linkage disequilibrium (on average
r2 = 0.15 for the FASN gene, r2 = 0.14 for MLXIPL and
r2 = 0.60 for SREBF1), therefore we assumed that haplo-
types were adequately captured by our tagging SNPs, and
we did not attempt a haplotype analysis.
Results
The study explored the association between 20 DNA
polymorphisms in three key genes involved in the fatty
acid synthesis, namely FASN, MLXIPL and SREBF1 and
BC risk, as well as with BMI. We included 1,294 incident
BC cases from the EPIC cohort and 2,452 matched controls
in the study. Table 1 summarizes the baseline character-
istics of cases and controls.
We covered all the common genetic variants in the
region of our candidate genes with a tagging approach. For
the FASN gene, which is considerably larger than the two
others, and located in a region of higher LD complexity, we
integrated HapMap data with our own resequencing data.
We found that all common (MAF C 0.05) SNPs identified
through resequencing were either already present in
HapMap or tagged by HapMap SNPs, with the exception of
Fig. 3 SREBF gene and its
SNPs. For details, see Fig. 1
Table 1 Baseline characteristics of BC cases and control subjects
Variable Cases Controls
Number 1521a 2555a
Women with carcinoma in
situ
93a 100a
Pre-menopausal women 395a 755a
Peri-menopausal women 139a 228a
Post-menopausal women 987a 1572a
Mean age at blood donation 55.2(40.7–67.5)b 54.9(40.2–68.1)b
Mean age at diagnosis 57.5(43.0–70.0)b –
Height 161.2(151.0–
172.0)b160.6(150.0–
171.8)b
Weight 67.6(51.7–89.0)b 67.2(51.0–89.5)b
Body mass index 26.0(20.3–34.4)b 26.1(20.1–35.0)b
a Number of subjectsb Mean (5th–95th percentiles)
570 Breast Cancer Res Treat (2009) 118:565–574
123
one (FASN_A0866), which was genotyped on the complete
series of cases and controls.
The genotype distributions at all SNPs typed in the EPIC
samples were in Hardy–Weinberg equilibrium in controls,
with non-significant v2 values (data not shown).
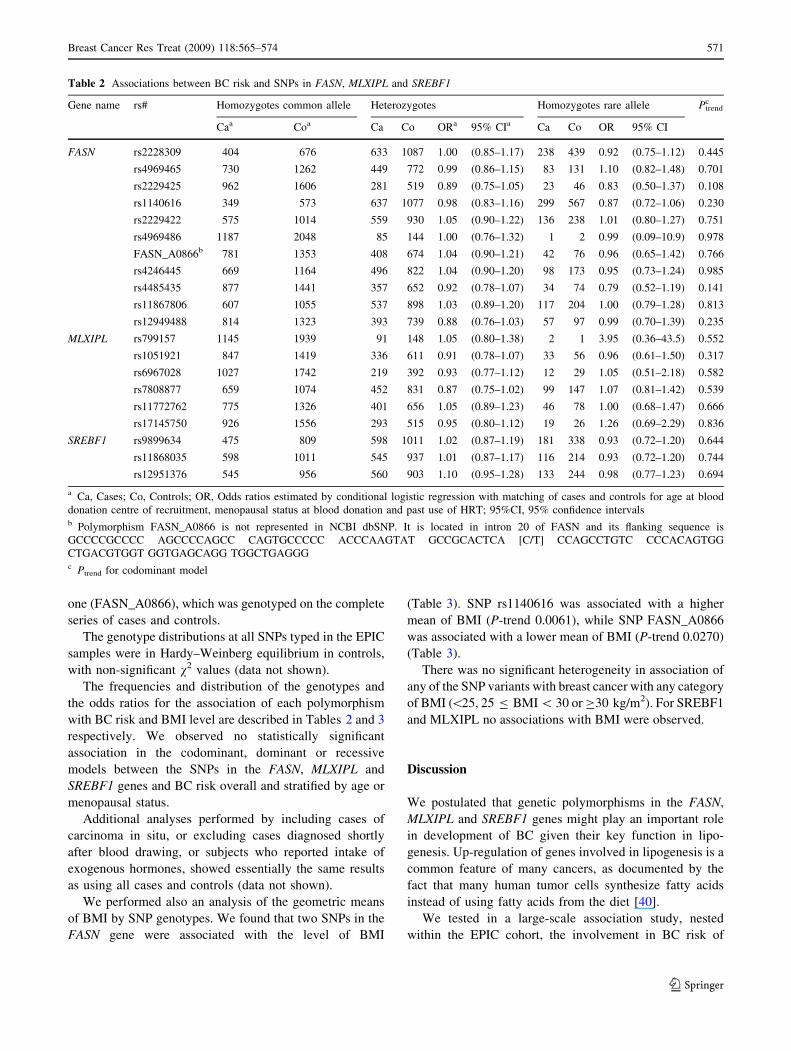
The frequencies and distribution of the genotypes and
the odds ratios for the association of each polymorphism
with BC risk and BMI level are described in Tables 2 and 3
respectively. We observed no statistically significant
association in the codominant, dominant or recessive
models between the SNPs in the FASN, MLXIPL and
SREBF1 genes and BC risk overall and stratified by age or
menopausal status.
Additional analyses performed by including cases of
carcinoma in situ, or excluding cases diagnosed shortly
after blood drawing, or subjects who reported intake of
exogenous hormones, showed essentially the same results
as using all cases and controls (data not shown).
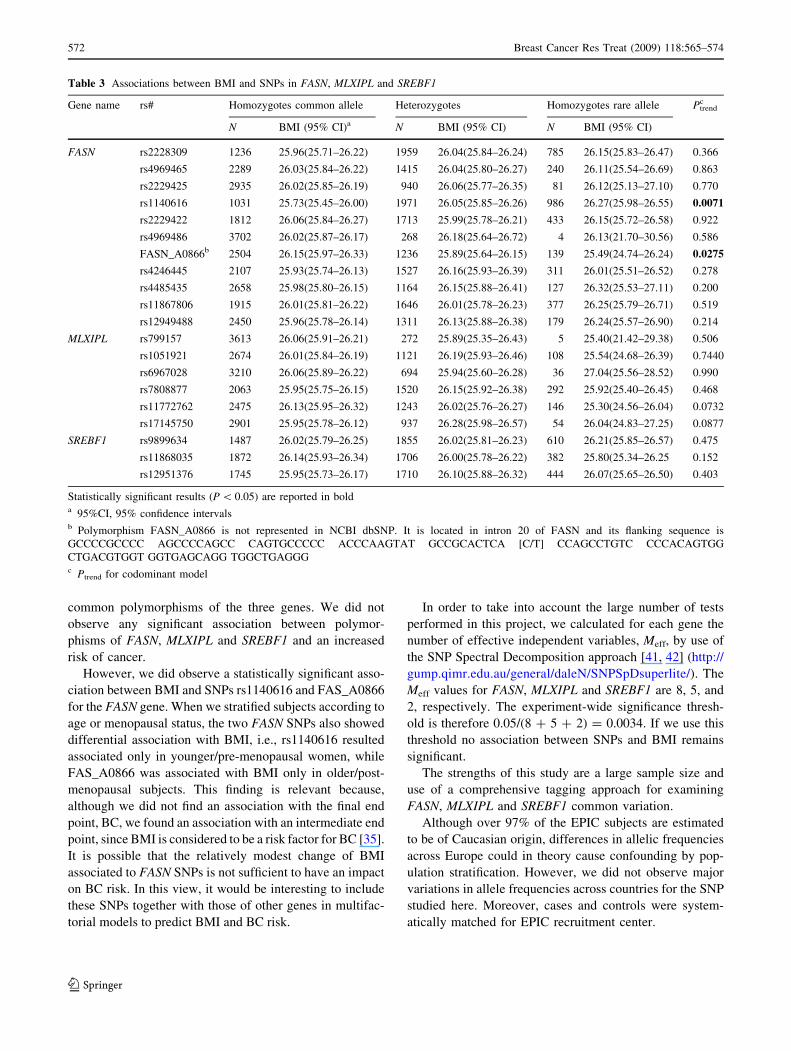
We performed also an analysis of the geometric means
of BMI by SNP genotypes. We found that two SNPs in the
FASN gene were associated with the level of BMI
(Table 3). SNP rs1140616 was associated with a higher
mean of BMI (P-trend 0.0061), while SNP FASN_A0866
was associated with a lower mean of BMI (P-trend 0.0270)
(Table 3).
There was no significant heterogeneity in association of
any of the SNP variants with breast cancer with any category
of BMI (\25, 25 B BMI \ 30 or C30 kg/m2). For SREBF1
and MLXIPL no associations with BMI were observed.
Discussion
We postulated that genetic polymorphisms in the FASN,
MLXIPL and SREBF1 genes might play an important role
in development of BC given their key function in lipo-
genesis. Up-regulation of genes involved in lipogenesis is a
common feature of many cancers, as documented by the
fact that many human tumor cells synthesize fatty acids
instead of using fatty acids from the diet [40].
We tested in a large-scale association study, nested
within the EPIC cohort, the involvement in BC risk of
Table 2 Associations between BC risk and SNPs in FASN, MLXIPL and SREBF1
Gene name rs# Homozygotes common allele Heterozygotes Homozygotes rare allele Ptrendc
Caa Coa Ca Co ORa 95% CIa Ca Co OR 95% CI
FASN rs2228309 404 676 633 1087 1.00 (0.85–1.17) 238 439 0.92 (0.75–1.12) 0.445
rs4969465 730 1262 449 772 0.99 (0.86–1.15) 83 131 1.10 (0.82–1.48) 0.701
rs2229425 962 1606 281 519 0.89 (0.75–1.05) 23 46 0.83 (0.50–1.37) 0.108
rs1140616 349 573 637 1077 0.98 (0.83–1.16) 299 567 0.87 (0.72–1.06) 0.230
rs2229422 575 1014 559 930 1.05 (0.90–1.22) 136 238 1.01 (0.80–1.27) 0.751
rs4969486 1187 2048 85 144 1.00 (0.76–1.32) 1 2 0.99 (0.09–10.9) 0.978
FASN_A0866b 781 1353 408 674 1.04 (0.90–1.21) 42 76 0.96 (0.65–1.42) 0.766
rs4246445 669 1164 496 822 1.04 (0.90–1.20) 98 173 0.95 (0.73–1.24) 0.985
rs4485435 877 1441 357 652 0.92 (0.78–1.07) 34 74 0.79 (0.52–1.19) 0.141
rs11867806 607 1055 537 898 1.03 (0.89–1.20) 117 204 1.00 (0.79–1.28) 0.813
rs12949488 814 1323 393 739 0.88 (0.76–1.03) 57 97 0.99 (0.70–1.39) 0.235
MLXIPL rs799157 1145 1939 91 148 1.05 (0.80–1.38) 2 1 3.95 (0.36–43.5) 0.552
rs1051921 847 1419 336 611 0.91 (0.78–1.07) 33 56 0.96 (0.61–1.50) 0.317
rs6967028 1027 1742 219 392 0.93 (0.77–1.12) 12 29 1.05 (0.51–2.18) 0.582
rs7808877 659 1074 452 831 0.87 (0.75–1.02) 99 147 1.07 (0.81–1.42) 0.539
rs11772762 775 1326 401 656 1.05 (0.89–1.23) 46 78 1.00 (0.68–1.47) 0.666
rs17145750 926 1556 293 515 0.95 (0.80–1.12) 19 26 1.26 (0.69–2.29) 0.836
SREBF1 rs9899634 475 809 598 1011 1.02 (0.87–1.19) 181 338 0.93 (0.72–1.20) 0.644
rs11868035 598 1011 545 937 1.01 (0.87–1.17) 116 214 0.93 (0.72–1.20) 0.744
rs12951376 545 956 560 903 1.10 (0.95–1.28) 133 244 0.98 (0.77–1.23) 0.694
a Ca, Cases; Co, Controls; OR, Odds ratios estimated by conditional logistic regression with matching of cases and controls for age at blood
donation centre of recruitment, menopausal status at blood donation and past use of HRT; 95%CI, 95% confidence intervalsb Polymorphism FASN_A0866 is not represented in NCBI dbSNP. It is located in intron 20 of FASN and its flanking sequence is
GCCCCGCCCC AGCCCCAGCC CAGTGCCCCC ACCCAAGTAT GCCGCACTCA [C/T] CCAGCCTGTC CCCACAGTGG
CTGACGTGGT GGTGAGCAGG TGGCTGAGGGc Ptrend for codominant model
Breast Cancer Res Treat (2009) 118:565–574 571
123
common polymorphisms of the three genes. We did not
observe any significant association between polymor-
phisms of FASN, MLXIPL and SREBF1 and an increased
risk of cancer.
However, we did observe a statistically significant asso-
ciation between BMI and SNPs rs1140616 and FAS_A0866
for the FASN gene. When we stratified subjects according to
age or menopausal status, the two FASN SNPs also showed
differential association with BMI, i.e., rs1140616 resulted
associated only in younger/pre-menopausal women, while
FAS_A0866 was associated with BMI only in older/post-
menopausal subjects. This finding is relevant because,
although we did not find an association with the final end
point, BC, we found an association with an intermediate end
point, since BMI is considered to be a risk factor for BC [35].
It is possible that the relatively modest change of BMI
associated to FASN SNPs is not sufficient to have an impact
on BC risk. In this view, it would be interesting to include
these SNPs together with those of other genes in multifac-
torial models to predict BMI and BC risk.
In order to take into account the large number of tests
performed in this project, we calculated for each gene the
number of effective independent variables, Meff, by use of
the SNP Spectral Decomposition approach [41, 42] (http://
gump.qimr.edu.au/general/daleN/SNPSpDsuperlite/). The
Meff values for FASN, MLXIPL and SREBF1 are 8, 5, and
2, respectively. The experiment-wide significance thresh-
old is therefore 0.05/(8 ? 5 ? 2) = 0.0034. If we use this
threshold no association between SNPs and BMI remains
significant.
The strengths of this study are a large sample size and
use of a comprehensive tagging approach for examining
FASN, MLXIPL and SREBF1 common variation.
Although over 97% of the EPIC subjects are estimated
to be of Caucasian origin, differences in allelic frequencies
across Europe could in theory cause confounding by pop-
ulation stratification. However, we did not observe major
variations in allele frequencies across countries for the SNP
studied here. Moreover, cases and controls were system-
atically matched for EPIC recruitment center.
Table 3 Associations between BMI and SNPs in FASN, MLXIPL and SREBF1
Gene name rs# Homozygotes common allele Heterozygotes Homozygotes rare allele Ptrendc
N BMI (95% CI)a N BMI (95% CI) N BMI (95% CI)
FASN rs2228309 1236 25.96(25.71–26.22) 1959 26.04(25.84–26.24) 785 26.15(25.83–26.47) 0.366
rs4969465 2289 26.03(25.84–26.22) 1415 26.04(25.80–26.27) 240 26.11(25.54–26.69) 0.863
rs2229425 2935 26.02(25.85–26.19) 940 26.06(25.77–26.35) 81 26.12(25.13–27.10) 0.770
rs1140616 1031 25.73(25.45–26.00) 1971 26.05(25.85–26.26) 986 26.27(25.98–26.55) 0.0071
rs2229422 1812 26.06(25.84–26.27) 1713 25.99(25.78–26.21) 433 26.15(25.72–26.58) 0.922
rs4969486 3702 26.02(25.87–26.17) 268 26.18(25.64–26.72) 4 26.13(21.70–30.56) 0.586
FASN_A0866b 2504 26.15(25.97–26.33) 1236 25.89(25.64–26.15) 139 25.49(24.74–26.24) 0.0275
rs4246445 2107 25.93(25.74–26.13) 1527 26.16(25.93–26.39) 311 26.01(25.51–26.52) 0.278
rs4485435 2658 25.98(25.80–26.15) 1164 26.15(25.88–26.41) 127 26.32(25.53–27.11) 0.200
rs11867806 1915 26.01(25.81–26.22) 1646 26.01(25.78–26.23) 377 26.25(25.79–26.71) 0.519
rs12949488 2450 25.96(25.78–26.14) 1311 26.13(25.88–26.38) 179 26.24(25.57–26.90) 0.214
MLXIPL rs799157 3613 26.06(25.91–26.21) 272 25.89(25.35–26.43) 5 25.40(21.42–29.38) 0.506
rs1051921 2674 26.01(25.84–26.19) 1121 26.19(25.93–26.46) 108 25.54(24.68–26.39) 0.7440
rs6967028 3210 26.06(25.89–26.22) 694 25.94(25.60–26.28) 36 27.04(25.56–28.52) 0.990
rs7808877 2063 25.95(25.75–26.15) 1520 26.15(25.92–26.38) 292 25.92(25.40–26.45) 0.468
rs11772762 2475 26.13(25.95–26.32) 1243 26.02(25.76–26.27) 146 25.30(24.56–26.04) 0.0732
rs17145750 2901 25.95(25.78–26.12) 937 26.28(25.98–26.57) 54 26.04(24.83–27.25) 0.0877
SREBF1 rs9899634 1487 26.02(25.79–26.25) 1855 26.02(25.81–26.23) 610 26.21(25.85–26.57) 0.475
rs11868035 1872 26.14(25.93–26.34) 1706 26.00(25.78–26.22) 382 25.80(25.34–26.25 0.152
rs12951376 1745 25.95(25.73–26.17) 1710 26.10(25.88–26.32) 444 26.07(25.65–26.50) 0.403
Statistically significant results (P \ 0.05) are reported in bolda 95%CI, 95% confidence intervalsb Polymorphism FASN_A0866 is not represented in NCBI dbSNP. It is located in intron 20 of FASN and its flanking sequence is
GCCCCGCCCC AGCCCCAGCC CAGTGCCCCC ACCCAAGTAT GCCGCACTCA [C/T] CCAGCCTGTC CCCACAGTGG
CTGACGTGGT GGTGAGCAGG TGGCTGAGGGc Ptrend for codominant model
572 Breast Cancer Res Treat (2009) 118:565–574
123
In conclusion, we have studied association of poly-
morphisms of three key genes in the lipogenesis pathway
with BC risk and BMI within the EPIC study. We can
confidently exclude a major role of these polymorphisms in
BC risk, although two SNPs in FASN show an association
with BMI that should be further evaluated in more com-
prehensive studies of polymorphisms and obesity.
Acknowledgments This study was supported by grant W81XWH-
04-1-0271 by the US Army Medical Research and Materiel Command.
The EPIC study was funded by ‘‘Europe Against Cancer’’ Programme
of the European Commission (SANCO); Ligue contre le Cancer
(France); Societe 3M (France); Mutuelle Generale de l’Education
Nationale; Institut National de la Sante et de la Recherche Medicale
(INSERM); German Cancer Aid; German Cancer Research Center;
German Federal Ministry of Education and Research; Danish Cancer
Society; Health Research Fund (FIS) of the Spanish Ministry of Health;
the participating regional governments and institutions of Spain;
Cancer Research UK; Medical Research Council, UK; the Stroke
Association, UK; British Heart Foundation; Department of Health, UK;
Food Standards Agency, UK; the Wellcome Trust, UK; Greek Ministry
of Health; Greek Ministry of Education; Italian Association for
Research on Cancer; Italian National Research Council; Dutch Min-
istry of Public Health, Welfare and Sports; Dutch Ministry of Health;
Dutch Prevention Funds; LK Research Funds; Dutch ZON (Zorg
Onderzoek Nederland); World Cancer Research Fund (WCRF);
Swedish Cancer Society; Swedish Scientific Council; Regional Gov-
ernment of Skane, Sweden; Norwegian Cancer Society. The authors
wish to thank Dr Alun Thomas (Department of Biomedical Informat-
ics, University of Utah School of Medicine, Salt Lake City, Utah) for
providing assistance with the Java SnpScreen software.
References
1. Augustin LS, Dal Maso L, La Vecchia C et al (2001) Dietary
glycemic index and glycemic load, and breast cancer risk: a case–
control study. Ann Oncol 12:1533–1538. doi:10.1023/A:101317
6129380
2. Hankinson SE, Willett WC, Colditz GA et al (1998) Circulating
concentrations of insulin-like growth factor-I and risk of breast
cancer. Lancet 351:1393–1396. doi:10.1016/S0140-6736(97)
10384-1
3. Kaaks R (1996) Nutrition, hormones, and breast cancer: is insulin
the missing link? Cancer Causes Control 7:605–625. doi:
10.1007/BF00051703
4. Kaaks R, Lukanova A (2001) Energy balance and cancer: the role
of insulin and insulin-like growth factor-I. Proc Nutr Soc 60:91–
106. doi:10.1079/PNS200070
5. Kaaks R, Lukanova A (2002) Effects of weight control and
physical activity in cancer prevention: role of endogenous hor-
mone metabolism. Ann N Y Acad Sci 963:268–281
6. Muti P, Quattrin T, Grant BJ et al (2002) Fasting glucose is a risk
factor for breast cancer: a prospective study. Cancer Epidemiol
Biomarkers Prev 11:1361–1368
7. Toniolo P, Bruning PF, Akhmedkhanov A et al (2000) Serum
insulin-like growth factor-I and breast cancer. Int J Cancer 88:
828–832. doi:10.1002/1097-0215(20001201)88:5\828::AID-IJC
22[3.0.CO;2-8
8. Kaaks R, Lundin E, Rinaldi S et al (2002) Prospective study of
IGF-I, IGF-binding proteins, and breast cancer risk, in northern
and southern Sweden. Cancer Causes Control 13:307–316. doi:
10.1023/A:1015270324325
9. Krajcik RA, Borofsky ND, Massardo S et al (2002) Insulin-like
growth factor I (IGF-I), IGF-binding proteins, and breast cancer.
Cancer Epidemiol Biomarkers Prev 11:1566–1573
10. Li BD, Khosravi MJ, Berkel HJ et al (2001) Free insulin-like growth
factor-I and breast cancer risk. Int J Cancer 91:736–739. doi:
10.1002/1097-0215(200002)9999:9999\::AID-IJC1111[3.0.CO;2-#
11. Bianchini F, Kaaks R, Vainio H (2002) Overweight, obesity, and
cancer risk. Lancet Oncol 3:565–574. doi:10.1016/S1470-
2045(02)00849-5
12. Key T, Appleby P, Barnes I et al (2002) Endogenous sex hor-
mones and breast cancer in postmenopausal women: reanalysis of
nine prospective studies. J Natl Cancer Inst 94:606–616
13. Lahmann PH, Schulz M, Hoffmann K et al (2005) Long-term
weight change and breast cancer risk: the European prospective
investigation into cancer and nutrition (EPIC). Br J Cancer
93:582–589. doi:10.1038/sj.bjc.6602763
14. Weiderpass E, Gridley G, Persson I et al (1997) Risk of endo-
metrial and breast cancer in patients with diabetes mellitus. Int J
Cancer 71:360–363. doi:10.1002/(SICI)1097-0215(19970502)71:
3\360::AID-IJC9[3.0.CO;2-W
15. Kuhajda FP, Jenner K, Wood FD et al (1994) Fatty acid syn-
thesis: a potential selective target for antineoplastic therapy. Proc
Natl Acad Sci USA 91:6379–6383. doi:10.1073/pnas.91.14.6379
16. da Silva Xavier G, Rutter GA, Diraison F et al (2006) ChREBP
binding to fatty acid synthase and L-type pyruvate kinase genes is
stimulated by glucose in pancreatic beta-cells. J Lipid Res
47:2482–2491. doi:10.1194/jlr.M600289-JLR200
17. Andreolas C, da Silva Xavier G, Diraison F et al (2002) Stimu-
lation of acetyl-CoA carboxylase gene expression by glucose
requires insulin release and sterol regulatory element binding
protein 1c in pancreatic MIN6 beta-cells. Diabetes 51:2536–
2545. doi:10.2337/diabetes.51.8.2536
18. Diraison F, Parton L, Ferre P et al (2004) Over-expression of
sterol-regulatory-element-binding protein-1c (SREBP1c) in rat
pancreatic islets induces lipogenesis and decreases glucose-
stimulated insulin release: modulation by 5-aminoimidazole-4-
carboxamide ribonucleoside (AICAR). Biochem J 378:769–778.
doi:10.1042/BJ20031277
19. Rufo C, Teran-Garcia M, Nakamura MT et al (2001) Involvement
of a unique carbohydrate-responsive factor in the glucose regu-
lation of rat liver fatty-acid synthase gene transcription. J Biol
Chem 276:21969–21975. doi:10.1074/jbc.M100461200
20. Yang YA, Morin PJ, Han WF et al (2003) Regulation of fatty
acid synthase expression in breast cancer by sterol regulatory
element binding protein-1c. Exp Cell Res 282:132–137. doi:
10.1016/S0014-4827(02)00023-X
21. Alo PL, Visca P, Trombetta G et al (1999) Fatty acid synthase
(FAS) predictive strength in poorly differentiated early breast
carcinomas. Tumori 85:35–40. doi:10.1159/000015275
22. Milgraum LZ, Witters LA, Pasternack GR et al (1997) Enzymes
of the fatty acid synthesis pathway are highly expressed in in situ
breast carcinoma. Clin Cancer Res 3:2115–2120
23. Pizer ES, Wood FD, Heine HS et al (1996) Inhibition of fatty acid
synthesis delays disease progression in a xenograft model of
ovarian cancer. Cancer Res 56:1189–1193
24. Rashid A, Pizer ES, Moga M et al (1997) Elevated expression of
fatty acid synthase and fatty acid synthetic activity in colorectal
neoplasia. Am J Pathol 150:201–208
25. Shurbaji MS, Kalbfleisch JH, Thurmond TS (1996) Immunohis-
tochemical detection of a fatty acid synthase (OA-519) as a
predictor of progression of prostate cancer. Hum Pathol 27:917–
921. doi:10.1016/S0046-8177(96)90218-X
26. Alo PL, Visca P, Marci A et al (1996) Expression of fatty acid
synthase (FAS) as a predictor of recurrence in stage I breast
carcinoma patients. Cancer 77:474–482. doi:10.1002/(SICI)1097-
0142(19960201)77:3\474::AID-CNCR8[3.0.CO;2-K
Breast Cancer Res Treat (2009) 118:565–574 573
123
27. Menendez JA, Lupu R (2007) Fatty acid synthase and the lipo-
genic phenotype in cancer pathogenesis. Nat Rev Cancer 7:763–
777. doi:10.1038/nrc2222
28. Swinnen JV, Roskams T, Joniau S et al (2002) Overexpression of
fatty acid synthase is an early and common event in the devel-
opment of prostate cancer. Int J Cancer 98:19–22. doi:10.1002/
ijc.10127
29. Kuhajda FP (2000) Fatty-acid synthase and human cancer: new
perspectives on its role in tumor biology. Nutrition 16:202–208.
doi:10.1016/S0899-9007(99)00266-X
30. Kuhajda FP, Pizer ES, Li JN et al (2000) Synthesis and antitumor
activity of an inhibitor of fatty acid synthase. Proc Natl Acad Sci
USA 97:3450–3454. doi:10.1073/pnas.050582897
31. Pizer ES, Jackisch C, Wood FD et al (1996) Inhibition of fatty
acid synthesis induces programmed cell death in human breast
cancer cells. Cancer Res 56:2745–2747
32. Pizer ES, Thupari J, Han WF et al (2000) Malonyl-coenzyme-A
is a potential mediator of cytotoxicity induced by fatty-acid
synthase inhibition in human breast cancer cells and xenografts.
Cancer Res 60:213–218
33. Thupari JN, Pinn ML, Kuhajda FP (2001) Fatty acid synthase
inhibition in human breast cancer cells leads to malonyl-CoA-
induced inhibition of fatty acid oxidation and cytotoxicity. Bio-
chem Biophys Res Commun 285:217–223. doi:10.1006/bbrc.
2001.5146
34. Menendez JA, Colomer R, Lupu R (2005) Why does tumor-
associated fatty acid synthase (oncogenic antigen-519) ignore
dietary fatty acids? Med Hypotheses 64:342–349. doi:10.1016/j.
mehy.2004.07.022
35. Key TJ, Verkasalo PK, Banks E (2001) Epidemiology of breast
cancer. Lancet Oncol 2:133–140. doi:10.1016/S1470-2045(00)
00254-0
36. Riboli E, Hunt KJ, Slimani N et al (2002) European Prospective
Investigation into Cancer and Nutrition (EPIC): study populations
and data collection. Public Health Nutr 5:1113–1124. doi:
10.1079/PHN2002394
37. Shattuck-Eidens D, Oliphant A, McClure M et al (1997) BRCA1
sequence analysis in women at high risk for susceptibility
mutations. Risk factor analysis and implications for genetic
testing. JAMA 278:1242–1250. doi:10.1001/jama.278.15.1242
38. Carlson CS, Eberle MA, Rieder MJ et al (2004) Selecting a
maximally informative set of single-nucleotide polymorphisms
for association analyses using linkage disequilibrium. Am J Hum
Genet 74:106–120. doi:10.1086/381000
39. de Bakker PI, Yelensky R, Pe’er I et al (2005) Efficiency and
power in genetic association studies. Nat Genet 37:1217–1223.
doi:10.1038/ng1669
40. Medes G, Thomas A, Weinhouse S (1953) Metabolism of neo-
plastic tissue. IV. A study of lipid synthesis in neoplastic tissue
slices in vitro. Cancer Res 13:27–29
41. Li J, Ji L (2005) Adjusting multiple testing in multilocus analyses
using the eigenvalues of a correlation matrix. Heredity 95:221–
227. doi:10.1038/sj.hdy.6800717
42. Nyholt DR (2004) A simple correction for multiple testing for
single-nucleotide polymorphisms in linkage disequilibrium with
each other. Am J Hum Genet 74:765–769. doi:10.1086/383251
574 Breast Cancer Res Treat (2009) 118:565–574
123
Related Documents