Genetic Variability of Hepatitis C Virus before and after Combined Therapy of Interferon plus Ribavirin Jose ´ Manuel Cuevas 1,2. , Manuela Torres-Puente 1. , Nuria Jime ´ nez-Herna ´ ndez 1,2 , Marı´a Alma Bracho 1,2 , Inmaculada Garcı´a-Robles 1 , Boris Wrobel 1 , Fernando Carnicer 3 , Juan del Olmo 4 , Enrique Ortega 5 , Andre ´ s Moya 1,2 , Fernando Gonza ´ lez-Candelas 1,2 * 1 Instituto Cavanilles de Biodiversidad y Biologı ´a Evolutiva and Departamento de Gene ´tica, Universidad de Valencia, Valencia, Spain, 2 CIBER en Epidemiologı ´a y Salud Pu ´ blica (CIBERESP), Barcelona, Spain, 3 Unidad de Hepatologı ´a, Hospital General de Alicante, Alicante, Spain, 4 Servicio de Hepatologı ´a. Hospital Clı ´nico de Valencia, Valencia, Spain, 5 Unidad de Enfermedades Infecciosas, Hospital General de Valencia, Valencia, Spain Abstract We present an analysis of the selective forces acting on two hepatitis C virus genome regions previously postulated to be involved in the viral response to combined antiviral therapy. One includes the three hypervariable regions in the envelope E2 glycoprotein, and the other encompasses the PKR binding domain and the V3 domain in the NS5A region. We used a cohort of 22 non-responder patients to combined therapy (interferon alpha-2a plus ribavirin) for which samples were obtained before initiation of therapy and after 6 or/and 12 months of treatment. A range of 25–100 clones per patient, genome region and time sample were sequenced. These were used to detect general patterns of adaptation, to identify particular adaptation mechanisms and to analyze the patterns of evolutionary change in both genome regions. These analyses failed to detect a common adaptive mechanism for the lack of response to antiviral treatment in these patients. On the contrary, a wide range of situations were observed, from patients showing no positively selected sites to others with many, and with completely different topologies in the reconstructed phylogenetic trees. Altogether, these results suggest that viral strategies to evade selection pressure from the immune system and antiviral therapies do not result from a single mechanism and they are likely based on a range of different alternatives, in which several different changes, or their combination, along the HCV genome confer viruses the ability to overcome strong selective pressures. Citation: Cuevas JM, Torres-Puente M, Jime ´ nez-Herna ´ndez N, Bracho MA, Garcı ´a-Robles I, et al. (2008) Genetic Variability of Hepatitis C Virus before and after Combined Therapy of Interferon plus Ribavirin. PLoS ONE 3(8): e3058. doi:10.1371/journal.pone.0003058 Editor: Oliver G. Pybus, University of Oxford, United Kingdom Received October 6, 2007; Accepted August 6, 2008; Published August 26, 2008 Copyright: ß 2008 Cuevas et al. This is an open-access article distributed under the terms of the Creative Commons Attribution License, which permits unrestricted use, distribution, and reproduction in any medium, provided the original author and source are credited. Funding: This work was supported by the Conselleria de Sanitat i Consum, Generalitat Valenciana (Spain) and project BFU2005-00503 from Ministerio de Educacio ´ n y Ciencia, Spain. The funders had no role in study design, data collection and analysis, decision to publish, or preparation of the manuscript. Competing Interests: The authors have declared that no competing interests exist. * E-mail: [email protected] . These authors contributed equally to this work. Introduction The hepatitis C virus (HCV) infects approximately 170 million people worldwide and it establishes persistent infection in more than two-thirds of those who contract it [1,2]. The current standard treatment for patients infected with HCV consists of a combined therapy of interferon plus ribavirin, which is successful in approximately 40% of the patients [3,4]. Recently, randomised controlled clinical trials have shown that pegylated interferon and ribavirin yield a higher rate of sustained virological response [5,6]. Moreover, response to anti-HCV therapy varies depending on the viral genotype. Patients infected with HCV genotypes 1 or 4 show significantly lower sustained response rates than those infected with genotypes 2 or 3 [6–9]. Studies trying to find differential patterns in the HCV genome in response to pressure from the immune system or resistance to antiviral treatment have mainly focused on those regions seemingly involved in evasion mechanisms and, in consequence, supposed to be subjected to strong selective pressures. The highest levels of sequence variation, i.e. the highest genetic plasticity, are concentrated in the four hypervariable regions of HCV, three of which are located in the envelope E2 glycoprotein. Hypervariable region 1 (HVR1) consists of a 27 amino acid sequence located at the N-terminus of the protein [10,11] and seems to be involved in target-cell recognition and virus attachment [12]. Hypervariable region 2 (HVR2) consists of 9 amino acids located downstream of HVR1 [11] and it has been hypothesized to be involved in cell surface receptor binding [13]. Recently, a third hypervariable region, denoted HVR3 [14,15], has been described in the E2 protein, and it is located between the two others. This region could play a role in the process of binding to host cell receptors and virus entry into host cells [14]. Finally, a fourth highly variable domain (V3), spanning 24 amino acids, is located at the C-terminus of the NS5A protein and appears to be involved in responsiveness to interferon [16,17]. Close to this domain there is another important region in the NS5A protein, the protein kinase-R binding domain (PKR-BD), which consists of 66 amino acids and includes a 40 amino acid domain, the putative interferon sensitivity determining region (ISDR). These domains interact with PKR, which is involved in the cellular antiviral response induced by interferon, thus blocking its antiviral activity [18,19]. HCV infections show two main features: high persistence and low susceptibility to antiviral treatments. The high levels of genetic variability of HCV are seemingly involved in viral escape from the PLoS ONE | www.plosone.org 1 August 2008 | Volume 3 | Issue 8 | e3058

Welcome message from author
This document is posted to help you gain knowledge. Please leave a comment to let me know what you think about it! Share it to your friends and learn new things together.
Transcript
Genetic Variability of Hepatitis C Virus before and afterCombined Therapy of Interferon plus RibavirinJose Manuel Cuevas1,2., Manuela Torres-Puente1., Nuria Jimenez-Hernandez1,2, Marıa Alma Bracho1,2,
Inmaculada Garcıa-Robles1, Boris Wrobel1, Fernando Carnicer3, Juan del Olmo4, Enrique Ortega5,
Andres Moya1,2, Fernando Gonzalez-Candelas1,2*
1 Instituto Cavanilles de Biodiversidad y Biologıa Evolutiva and Departamento de Genetica, Universidad de Valencia, Valencia, Spain, 2 CIBER en Epidemiologıa y Salud
Publica (CIBERESP), Barcelona, Spain, 3 Unidad de Hepatologıa, Hospital General de Alicante, Alicante, Spain, 4 Servicio de Hepatologıa. Hospital Clınico de Valencia,
Valencia, Spain, 5 Unidad de Enfermedades Infecciosas, Hospital General de Valencia, Valencia, Spain
Abstract
We present an analysis of the selective forces acting on two hepatitis C virus genome regions previously postulated to beinvolved in the viral response to combined antiviral therapy. One includes the three hypervariable regions in the envelopeE2 glycoprotein, and the other encompasses the PKR binding domain and the V3 domain in the NS5A region. We used acohort of 22 non-responder patients to combined therapy (interferon alpha-2a plus ribavirin) for which samples wereobtained before initiation of therapy and after 6 or/and 12 months of treatment. A range of 25–100 clones per patient,genome region and time sample were sequenced. These were used to detect general patterns of adaptation, to identifyparticular adaptation mechanisms and to analyze the patterns of evolutionary change in both genome regions. Theseanalyses failed to detect a common adaptive mechanism for the lack of response to antiviral treatment in these patients. Onthe contrary, a wide range of situations were observed, from patients showing no positively selected sites to others withmany, and with completely different topologies in the reconstructed phylogenetic trees. Altogether, these results suggestthat viral strategies to evade selection pressure from the immune system and antiviral therapies do not result from a singlemechanism and they are likely based on a range of different alternatives, in which several different changes, or theircombination, along the HCV genome confer viruses the ability to overcome strong selective pressures.
Citation: Cuevas JM, Torres-Puente M, Jimenez-Hernandez N, Bracho MA, Garcıa-Robles I, et al. (2008) Genetic Variability of Hepatitis C Virus before and afterCombined Therapy of Interferon plus Ribavirin. PLoS ONE 3(8): e3058. doi:10.1371/journal.pone.0003058
Editor: Oliver G. Pybus, University of Oxford, United Kingdom
Received October 6, 2007; Accepted August 6, 2008; Published August 26, 2008
Copyright: � 2008 Cuevas et al. This is an open-access article distributed under the terms of the Creative Commons Attribution License, which permitsunrestricted use, distribution, and reproduction in any medium, provided the original author and source are credited.
Funding: This work was supported by the Conselleria de Sanitat i Consum, Generalitat Valenciana (Spain) and project BFU2005-00503 from Ministerio deEducacion y Ciencia, Spain. The funders had no role in study design, data collection and analysis, decision to publish, or preparation of the manuscript.
Competing Interests: The authors have declared that no competing interests exist.
* E-mail: [email protected]
. These authors contributed equally to this work.
Introduction
The hepatitis C virus (HCV) infects approximately 170 million
people worldwide and it establishes persistent infection in more
than two-thirds of those who contract it [1,2]. The current
standard treatment for patients infected with HCV consists of a
combined therapy of interferon plus ribavirin, which is successful
in approximately 40% of the patients [3,4]. Recently, randomised
controlled clinical trials have shown that pegylated interferon and
ribavirin yield a higher rate of sustained virological response [5,6].
Moreover, response to anti-HCV therapy varies depending on the
viral genotype. Patients infected with HCV genotypes 1 or 4 show
significantly lower sustained response rates than those infected
with genotypes 2 or 3 [6–9].
Studies trying to find differential patterns in the HCV genome
in response to pressure from the immune system or resistance to
antiviral treatment have mainly focused on those regions
seemingly involved in evasion mechanisms and, in consequence,
supposed to be subjected to strong selective pressures. The highest
levels of sequence variation, i.e. the highest genetic plasticity, are
concentrated in the four hypervariable regions of HCV, three of
which are located in the envelope E2 glycoprotein. Hypervariable
region 1 (HVR1) consists of a 27 amino acid sequence located at
the N-terminus of the protein [10,11] and seems to be involved in
target-cell recognition and virus attachment [12]. Hypervariable
region 2 (HVR2) consists of 9 amino acids located downstream of
HVR1 [11] and it has been hypothesized to be involved in cell
surface receptor binding [13]. Recently, a third hypervariable
region, denoted HVR3 [14,15], has been described in the E2
protein, and it is located between the two others. This region could
play a role in the process of binding to host cell receptors and virus
entry into host cells [14]. Finally, a fourth highly variable domain
(V3), spanning 24 amino acids, is located at the C-terminus of the
NS5A protein and appears to be involved in responsiveness to
interferon [16,17]. Close to this domain there is another important
region in the NS5A protein, the protein kinase-R binding domain
(PKR-BD), which consists of 66 amino acids and includes a 40
amino acid domain, the putative interferon sensitivity determining
region (ISDR). These domains interact with PKR, which is
involved in the cellular antiviral response induced by interferon,
thus blocking its antiviral activity [18,19].
HCV infections show two main features: high persistence and
low susceptibility to antiviral treatments. The high levels of genetic
variability of HCV are seemingly involved in viral escape from the
PLoS ONE | www.plosone.org 1 August 2008 | Volume 3 | Issue 8 | e3058
host immune response, usually leading to chronic disease [20,21].
The selective pressures exerted by the immune system [22,23]
correlate with the degree of genetic variability in the target regions
[24]. This is the case for HVR1, which has been studied
extensively [21,25–28]. Moreover, the genetic variability of other
regions such as the ISDR [29,30] or the V3 domains [16,17] has
also been studied. However, no conclusive results have been
attained in any case, probably due to the establishment of complex
interactions between the genetic diversity of the virus and the host
immune response [31–34].
In this study we have employed several analytical procedures to
find differential selection patterns in a cohort of non-responder
patients during their treatment with interferon alpha-2a plus
ribavirin. For this, we employed 22 patients infected with HCV
genotype 1 (7 with subtype 1a and 15 with subtype 1b), for which a
sample immediately previous to initiation of antiviral treatment
was available (T0), and additional samples after 6 or/and 12
months of treatment (T1 and T2, respectively), when their lack of
response was established, were also available. Two viral genome
regions were analyzed. About 100 clone sequences per patient
were obtained from the E1-E2 region (4690 sequences in total),
which included all hypervariable regions; additionally, between 25
and 96 sequences were obtained for the NS5A (2486 sequences in
total), including the ISDR and V3 domains.
Results
Changes in nucleotide diversity during treatmentNucleotide diversity was very high in the E1-E2 region (details
of individual samples and different genetic variability estimates can
be found in Table S1), although we found a few highly
homogeneous samples (Table 1). A small positive correlation
between nucleotide diversity estimates at the two time points
(r = 0.218, P,0.01) was observed and the average values were
almost identical (p= 0.025560.0031 for T0 samples and
p= 0.023860.0033 for T1/T2 samples, Table 1). Differences in
nucleotide diversity between T1/T2 and T0 samples were
computed to analyze the change in diversity during treatment
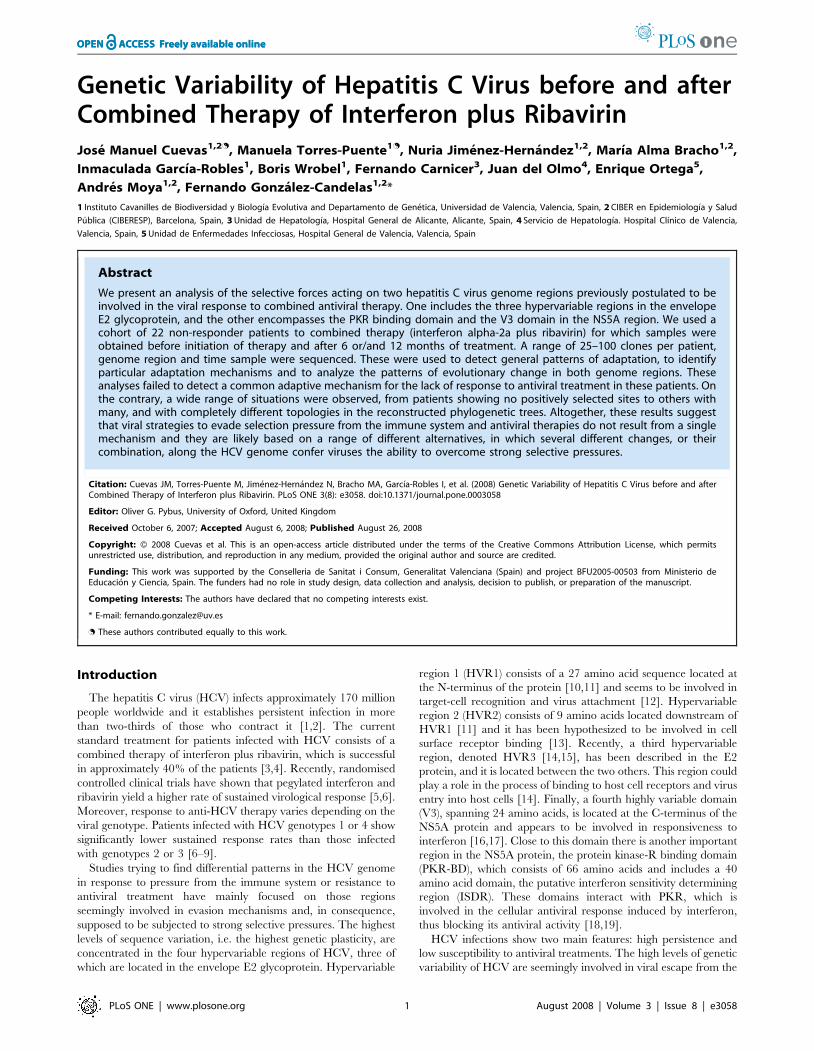
(Figure 1). Significant differences were detected in most cases (20/
24) using t-tests. A significant increase in nucleotide diversity was
detected in 13 cases, a significant decrease in 9 cases and no
significant differences were found in 4 cases. Consequently, a slight
tendency for nucleotide diversity to increase during treatment was
detected for the E1-E2 region.
In most patients we detected a significant divergence between
sequences sampled before and after treatment. The corresponding
nucleotide divergence statistics (Da), using Jukes-Cantor correc-
tion, are shown in Table 1. The range of Da values spanned from
0.0737 to 0.0002, with an average value of 0.0211 (0.0171 and
0.0231 for subtypes 1a and 1b, respectively). This is an indication
that there are very different patterns of differentiation between
sequences sampled at different times from the same patient, with a
slightly larger effect for patients infected with HCV subtype 1b
than subtype 1a (see below and supplementary Figures S1 and S2).
As expected, genetic variability was lower for the NS5A region
than for the E1-E2 region (Table 1). A marginally significant
correlation was found for nucleotide diversity between T0 and
T1/T2 samples from each patient (r = 0.396, P = 0.056). Again,
the average nucleotide diversities for the two sets of samples were
almost identical (p = 0.012860.0089 for T0 samples and
p = 0.012760.0098 for T1/T2 samples, Table 1). Variation in
nucleotide diversity during treatment was evaluated by computing
the difference between T1/T2 and T0 samples (Figure 1) for each
patient and using t-tests. Significant increases in nucleotide
diversity were detected in 8 cases, significant decreases in other
8 cases, and no significant differences in the remaining 8 cases.
Therefore, the NS5A region did not present any trend in
nucleotide diversity variation during treatment.
Similarly to the E1-E2 region, we detected a significant
divergence between sequences sampled before and after treatment
in most patients (Table 1, Figure 1). The range of Da values spanned
from 0.0356 to 0.0001, with an average value of 0.0081 (0.0039 and
0.0103 for subtypes 1a and 1b, respectively). As for the E1-E2
region, these estimates indicate that there are very different patterns
of differentiation between sequences sampled at different times from
the same patient, with a wider range of variation for patients
infected with HCV subtype 1b than for those infected with subtype
1a (see below and supplementary Figures S1 and S2).
For T0 samples, a significant correlation was detected between
the nucleotide diversity levels of E1-E2 and NS5A regions
(r = 0.604, P,0.002). However, no significant correlation was
observed for T1/T2 samples (r = 0.092, P = 0.668). These results
indicate that the levels of genetic variability between both regions
were closely related before initiation of treatment, but the
correlation had disappeared after it was discontinued.
Table 1. Evolution of genetic variation within each patientduring time for the E1-E2 and NS5A regions.
Patient E1-E2 Region NS5A Region
p (T0) p (T1/T2) Da (JC) p (T0) p (T1/T2) Da (JC)
A09 0.0123 0.0274 0.0622 0.0123 0.0212 0.0070
A20 0.0240 0.0315 0.0014 0.0097 0.0028 0.0009
A21 0.0386 0.0644 0.0128 0.0029 0.0024 0.0009
A34 0.0292 0.0284 0.0001 0.0133 0.0184 0.0005
A35 0.0117 0.0189 0.0019 0.0061 0.0121 0.0001
C05 0.0468 0.0252 0.0212 0.0102 0.0240 0.0110
C08 0.0460 0.0037 0.0444 0.0187 0.0010 0.0127
C12 0.0248 0.0321 0.0304 0.0147 0.0138 0.0221
C16 0.0251 0.0482 0.0290 0.0116 0.0252 0.0083
C17 0.0079 0.0029 0.0185 0.0007 0.0000 0.0027
C22/T1 0.0431 0.0134 0.0226 0.0186 0.0067 0.0074
C22/T2 0.0431 0.0204 0.0197 0.0186 0.0093 0.0067
C29 0.0328 0.0043 0.0634 0.0297 0.0040 0.0356
C37 0.0084 0.0128 0.0008 0.0084 0.0122 0.0012
G06 0.0286 0.0230 0.0010 0.0262 0.0271 0.0011
G07 0.0398 0.0077 0.0369 0.0362 0.0386 0.0020
G14 0.0255 0.0226 0.0038 0.0108 0.0135 0.0008
G16 0.0000 0.0313 0.0737 0.0000 0.0230 0.0209
G17 0.0507 0.0532 0.0013 0.0154 0.0051 0.0087
G18 0.0314 0.0101 0.0318 0.0152 0.0102 0.0123
G19 0.0276 0.0425 0.0082 0.0106 0.0092 0.0050
G22 0.0146 0.0287 0.0086 0.0124 0.0159 0.0027
G26/T1 0.0003 0.0005 0.0085 0.0001 0.0005 0.0149
G26/T2 0.0003 0.0177 0.0032
The nucleotide diversities (p) at the initial and final sampling times and the netnucleotide differentiation (Da, with Jukes-Cantor correction) are reported. Fortwo patients, C22 and G26, the values of an intermediate sample (at T1) are alsoreported. (SD: standard deviation). Values from three different time samples arereported for two patients (C22 and G26) at the E1-E2 region and for one patient(C22) at the NS5A region.doi:10.1371/journal.pone.0003058.t001
Therapy and Variation in HCV
PLoS ONE | www.plosone.org 2 August 2008 | Volume 3 | Issue 8 | e3058
We observed a significant correlation (r = 0.521, P,0.01)
between the differences in nucleotide diversity at T0 and T1/T2
in the two genome regions analyzed in each patient. Only two
patients (A20 and A35) presented significant changes of opposite
sign in the two estimates, with diversity increasing during
treatment in one region and decreasing in the other (Figure 1).
Hence, there is evidence for nucleotide diversity being affected
similarly by antiviral treatment in both genome regions, with only
a few cases in which the two regions changed differently, at least in
levels of nucleotide diversity, to treatment.
Patterns and rates of evolution in the E1-E2 and NS5Aregions before and after antiviral treatment
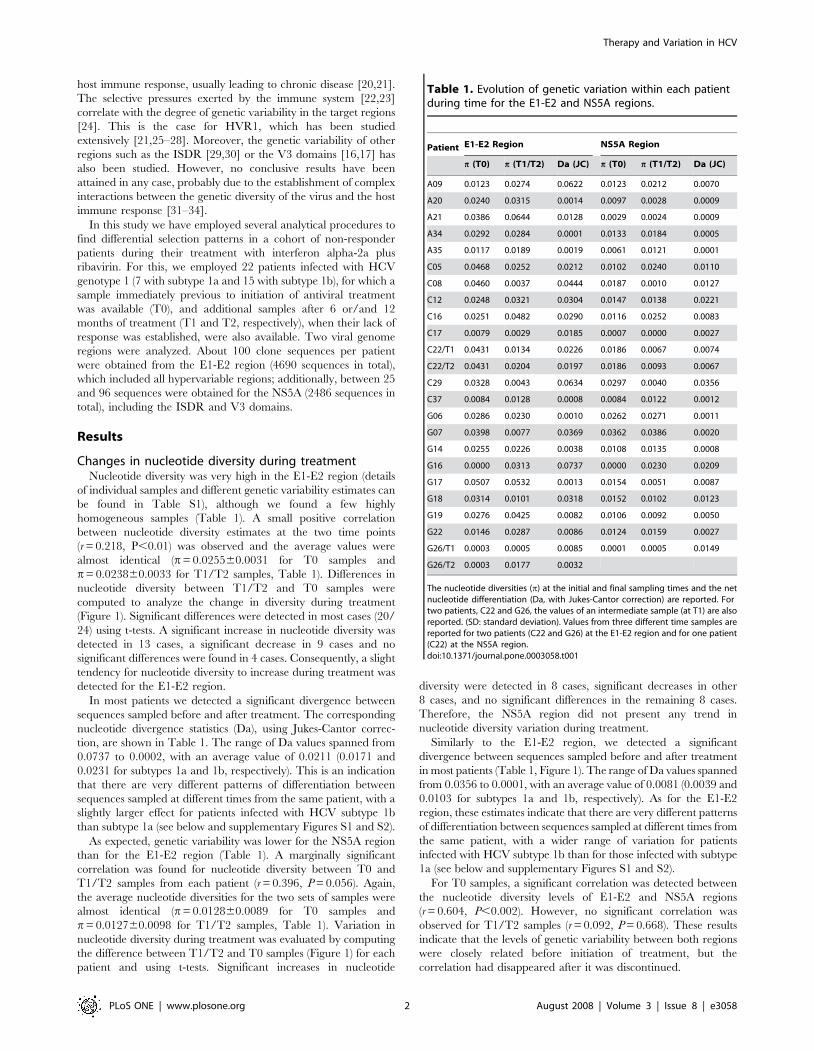
We obtained maximum likelihood phylogenetic trees for all the
sequence clones of each genome region from each patient using a
common outgroup sequence, HCV-H77 (accession number
NC_004102) for sequences of subtype 1a and HCV-J (accession
D10749) for those of subtype 1b. The most remarkable feature from
the analysis of these 44 trees was the absence of a common pattern
for the relationship between clones derived before and after antiviral
treatment (all trees for E1-E2 and NS5A regions are shown in the
supplementary material, Figures S1 and S2). In the E1-E2 region,
for instance, T0 and T2 samples from patient G07 were grouped in
separate clusters, with all T2 samples clustering in a monophyletic
group derived from one unidentified variant already present at time
T0 (Figure 2a). On the contrary, for this same region clones from
the two time samples from patient A34 were completely mixed, with
no differentiation between T0 and T1 sequences (Figure 2b).
Intermediate patterns were present in other patients for this region
(Figure S1). The same observation applied to the NS5A region
where, for instance, patient C12 showed a perfect separation in
different clusters of sequences obtained at each time sample whereas
patient G06 presented a very heterogeneous structure (Figure 2c, d).
Again, a range of intermediate and similarly extreme patterns were
found in other patients (Figure S2).
Inspection of the phylogenetic trees from both genome regions
confirmed the previous results of nucleotide diversity analyses.
Despite being characterized by a common phenotype, lack of
response to interferon plus ribavirin treatment, hepatitis C virus
from these patients presented a wide range of evolutionary
patterns and levels of genetic diversity, before and after antiviral
treatment. For instance, some patients showed low levels of genetic
variability at the T0 sample and higher levels at T1/T2 samples,
and vice versa (Figures S1 and S2). Globally, these results suggest
that HCV populations use different strategies to adapt to and
overcome the antiviral effects of interferon and ribavirin used in
the treatment of these different patients.
To further characterize in a more quantitative manner the
different adaptive strategies to antiviral treatment used by hepatitis
C virus, we analyzed the amount of viral evolution within each
infected patient in the two genome regions considered. For this, we
analyzed the ML trees described above using common, epidemi-
ologically unrelated outgroup sequences, H77 for subtype 1a
sequences and HCV-J for subtype 1b.
As a proxy for the amount of evolution before and after antiviral
treatment we computed the average length from the common
Figure 1. Graphic representation of the differences in nucleotide diversity between final versus initial time samples for the E1-E2and NS5A regions (denoted as black and white dots, respectively). Three time samples were obtained for patients C22 (for E1-E2 and NS5Aregions) and G26 (for E1-E2 region) and, consequently, differences between these three time samples are represented. Non-significant differences areindicated with an asterisk.doi:10.1371/journal.pone.0003058.g001
Therapy and Variation in HCV
PLoS ONE | www.plosone.org 3 August 2008 | Volume 3 | Issue 8 | e3058
ancestor to each tip for the different clones of each patient at both
genome regions. In line with previous analyses, an enormous
heterogeneity was observed for the cohort of patients in both
regions (Figure 3). For the E1-E2 region, 17 out of 22 patients
presented an increase of the genetic distance to the common
ancestor during treatment, whereas the same happened for 14 out
of 22 patients for the NS5A region. Despite this trend of increasing
genetic distance from the origin after treatment, only 10 of the 22
patients showed a simultaneous increase in both regions, whereas
the evolutionary distance decreased in both regions for only one
patient. Contrary to the previous observation of lack of correlation
between divergence before and after infection of each patient, we
Figure 2. Examples of phylogenetic trees from the E1-E2 and NS5A regions. Trees from patients G07 (a) and A34 (b) are shown for the E1-E2region, whereas trees from patients C12 and G06 are presented for the NS5A region. Red, green, and blue dots denote sequences from T0, T1, and T2,respectively.doi:10.1371/journal.pone.0003058.g002
Therapy and Variation in HCV
PLoS ONE | www.plosone.org 4 August 2008 | Volume 3 | Issue 8 | e3058
observed significant correlations between genetic distances from
the common origin before and after antiviral treatment within
each patient (r = 0.487, P = 0.011 for the E1-E2 region; r = 0.754,
P,0.001 for the NS5A region). However, the relationship between
genetic distance from origin before treatment and its relative
change after it was the opposite one. Correlations between genetic
distances at T0 and (T1/T22T0) were negative and marginally
significant for both genome regions (r = 20.407, P = 0.030, for E1-
E2, and r = 20.303, P = 0.087 for NS5A). Finally, relative changes
in both regions within patients were not correlated to each other
(r = 0.080, P = 0.639) nor to the number of sites detected to evolve
under positive selection (r = 0.328, P.0.10, for E1E2; r = 0.117,
P.0.10, for NS5A).
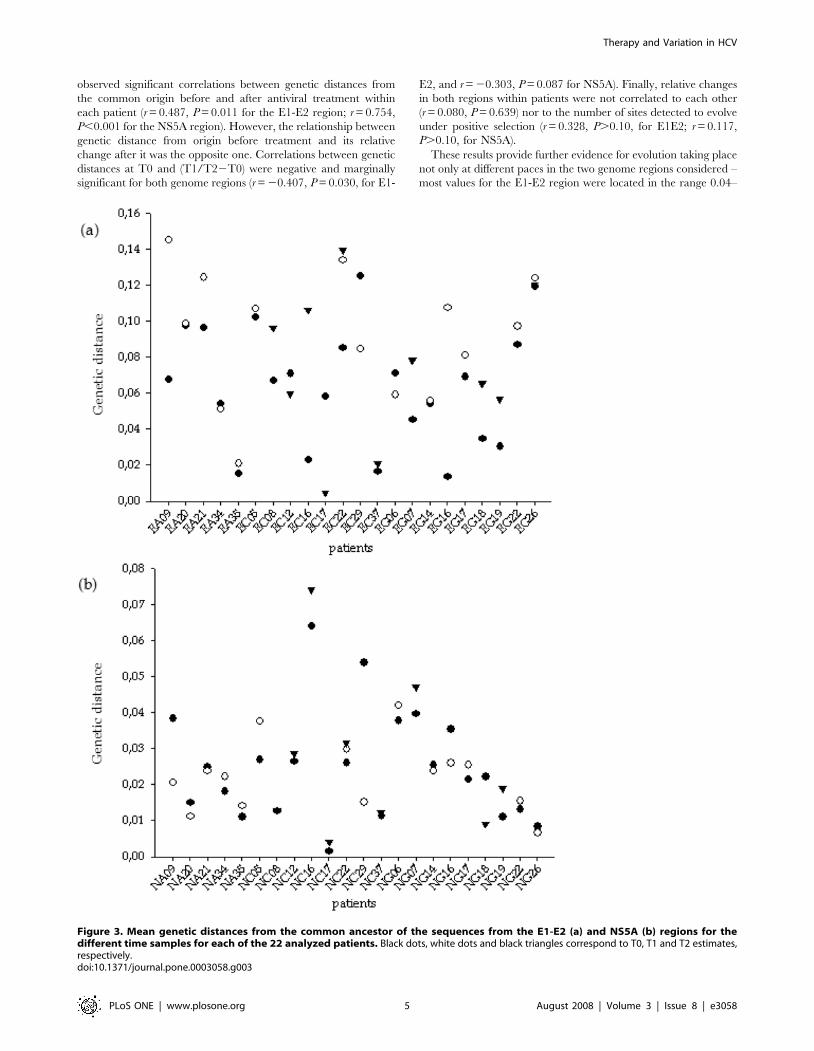
These results provide further evidence for evolution taking place
not only at different paces in the two genome regions considered –
most values for the E1-E2 region were located in the range 0.04–
Figure 3. Mean genetic distances from the common ancestor of the sequences from the E1-E2 (a) and NS5A (b) regions for thedifferent time samples for each of the 22 analyzed patients. Black dots, white dots and black triangles correspond to T0, T1 and T2 estimates,respectively.doi:10.1371/journal.pone.0003058.g003
Therapy and Variation in HCV
PLoS ONE | www.plosone.org 5 August 2008 | Volume 3 | Issue 8 | e3058
0.10, whereas for the NS5A region most values were contained in
the range 0.01–0.04 – but also more or less independently in each
of them.
Evolutionary changes during antiviral treatment in theE1-E2 region
The nature of the differences at the nucleotide level between
viral populations sampled at different times during antiviral
treatment within each patient was further investigated at the
amino acid level. Firstly, we analyzed the differences in amino acid
composition in each position between different samples for each
patient. A summary of the significant differences found is shown in
Supplementary Table S3. Almost half (71/154) of the positions
were detected to vary significantly in composition in at least one
patient. The tallying of positions with significant changes per
patient also revealed a very uneven distribution, with a maximum
of 29 positions (in patient G16) to a minimum of none found in
two subtype 1a (A20 and A34) and two subtype 1b-infected
patients (C37 and G17). There were no significant differences in
the number of such positions detected between the two viral
subtypes (average numbers were 12.5 for subtype 1a, 13.5 for 1b
and 13.2 for the whole data set).
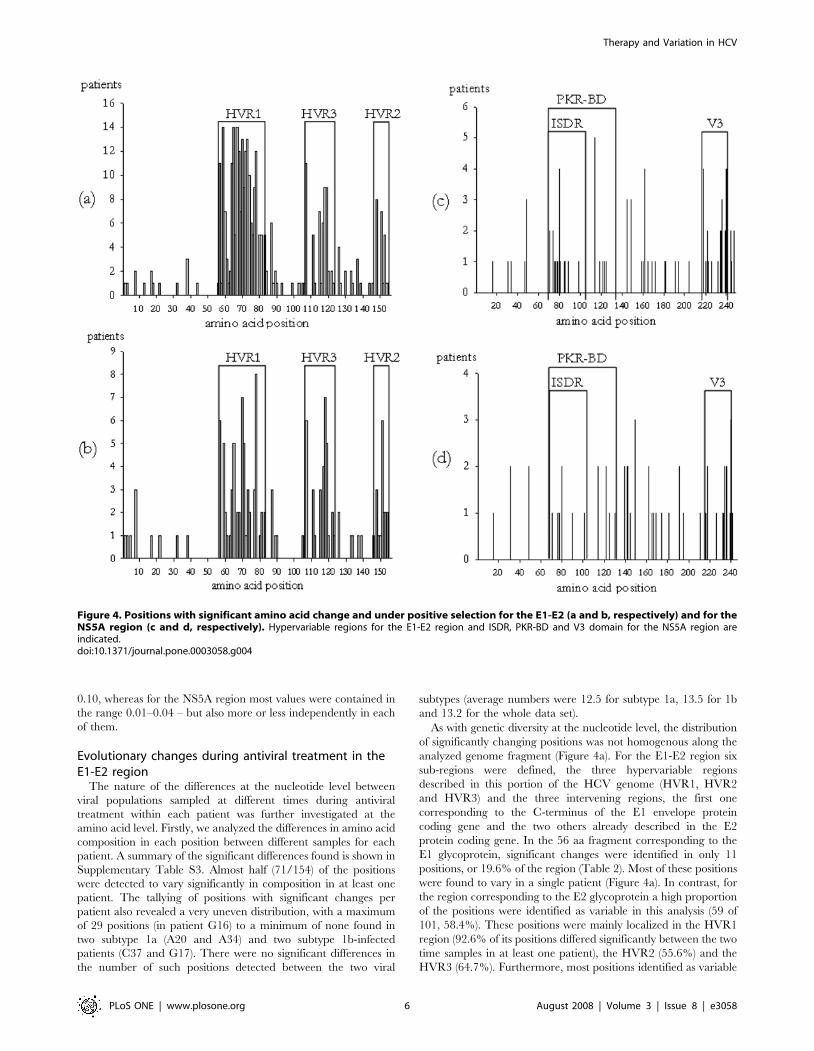
As with genetic diversity at the nucleotide level, the distribution
of significantly changing positions was not homogenous along the
analyzed genome fragment (Figure 4a). For the E1-E2 region six
sub-regions were defined, the three hypervariable regions
described in this portion of the HCV genome (HVR1, HVR2
and HVR3) and the three intervening regions, the first one
corresponding to the C-terminus of the E1 envelope protein
coding gene and the two others already described in the E2
protein coding gene. In the 56 aa fragment corresponding to the
E1 glycoprotein, significant changes were identified in only 11
positions, or 19.6% of the region (Table 2). Most of these positions
were found to vary in a single patient (Figure 4a). In contrast, for
the region corresponding to the E2 glycoprotein a high proportion
of the positions were identified as variable in this analysis (59 of
101, 58.4%). These positions were mainly localized in the HVR1
region (92.6% of its positions differed significantly between the two
time samples in at least one patient), the HVR2 (55.6%) and the
HVR3 (64.7%). Furthermore, most positions identified as variable
Figure 4. Positions with significant amino acid change and under positive selection for the E1-E2 (a and b, respectively) and for theNS5A region (c and d, respectively). Hypervariable regions for the E1-E2 region and ISDR, PKR-BD and V3 domain for the NS5A region areindicated.doi:10.1371/journal.pone.0003058.g004
Therapy and Variation in HCV
PLoS ONE | www.plosone.org 6 August 2008 | Volume 3 | Issue 8 | e3058
in these three regions were found in several patients simulta-
neously (Figure 4a).
We next analyzed whether these changes in amino acid
composition resulted from positive selection acting at the codon level
or whether they could be explained by other factors. In 20 of the 22
patients the most likely evolutionary model for sequences sampled at
two different time points (before and at the end of the viral treatment)
incorporated a class of sites for which v= Ka/Ks.1 and, in
consequence, it was possible to apply the Bayes Empirical Bayes
(BEB) procedure to identify those amino acid positions most likely
under positive selection. The two exceptions corresponded to subtype
1b-infected patients, C29 and G22. Interestingly, whereas patient
C29 showed significant change in 25 positions in the composition
analysis, the four patients in which no such positions were found
(patients A20, A34, C37 and G17) were all identified to evolve under
the model incorporating positive selection.
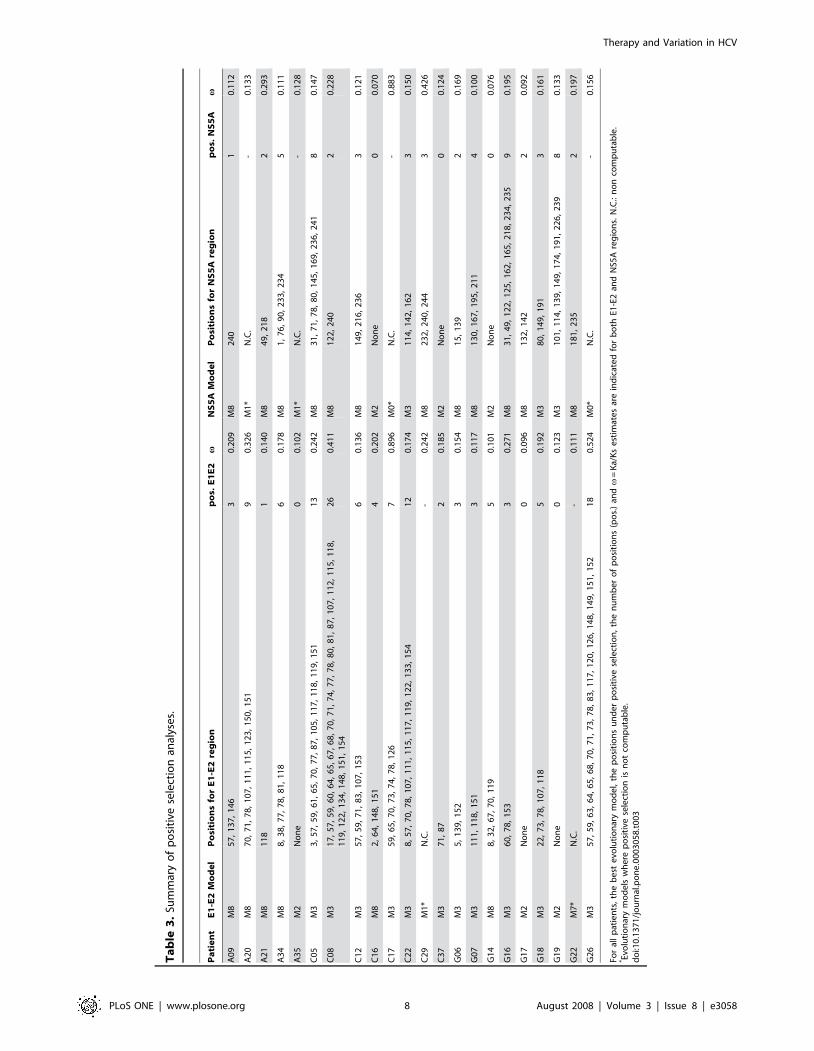
Among the 20 patients for which the virus was estimated to
evolve under a model incorporating positive selection, the BEB
procedure identified 17 patients in which at least one codon had
evolved under positive selection with a posterior probability .0.95.
The number of such positions ranged between 1 (patient A21) and
26 (C08) (Table 3). Most positions evolving under positive selection
in at least one patient were concentrated in a few quite well
delimited regions (Tables 2 and 3 and Figure 4b). Many positively
selected sites were identified as such in one single patient (22 sites),
and only a few sites evolved under positive selection in 5 (4 sites), 6 (2
sites), 7 (1 site) and 8 (1 site) patients. Only three sites identified in
more than one patient (positions 8 and 87, 3 patients; position 126, 2
patients) fell outside the three regions described above.
Most, but not all, positions identified as evolving under positive
selection in at least one patient corresponded to sites whose amino
acid composition was found to be significantly different between
the two different sample points in each patient (Table 3 and Table
S3). The general distribution of these two kinds of sites was very
similar (Figures 4a and 4b), with a lower number of sites identified
to evolve under positive selection than changing in amino acid
composition during the antiviral treatment.
For each of the six regions considered, levels of synonymous (Ks)
and non-synonymous (Ka) substitutions were estimated for each
patient (data shown in Table S4). A wide range of Ks values, from 0 to
0.32 substitutions/site, was observed. Moreover, there were no clear
differences among the different regions considered. On the contrary,
Ka values also presented a wide distribution, ranging between 0 and
0.27 subst./site, but in this case clear differences were observed
among the six regions analyzed. Three different groups could be
distinguished: firstly, the HVR1 region (with values ranging between
0 and 0.26 subst./site) showed the highest values for Ka; secondly,
regions HVR2 and HVR3, with Ka values ranging from 0 to 0.1
subst./site, were characterized by similar and intermediate values of
Ka; and finally, a third group, comprising the three intervening
regions and with Ka values ranging from 0 to 0.05 subst./site, showed
the lowest values of Ka, very close to 0 in most cases.
The analysis of the changes in synonymous and non-synonymous
substitutions between different samples from the same patient in the
six sub-regions considered in the E1-E2 region allowed a better
appreciation of the evolutionary processes involved in the virus
response during treatment (Table S5). Globally, a general increase in
the amount of synonymous substitutions was observed for the six sub-
regions considered, ranging from 8% to 117%. This might be
attributed to the mutagenic effect of ribavirin [59]. A more detailed
examination of these results and those of changes in the Ka/Ks ratios
revealed substantial variability in this response. Some patients showed
increased levels of Ks after antiviral treatment in all, or most, sub-
regions considered, but in others the pattern was the opposite one,
with fewer synonymous mutations after treatment than before it
(Table S5). Furthermore, in all but one case (patient G26) in which a
significant number of positively selected sites were detected (Table 3)
the pattern of change in Ks and Ka/Ks corresponded to a reduction
in both parameters. The corresponding phylogenetic trees revealed
highly monomorphic viral populations after treatment while those
before this was initiated were very variable (see trees corresponding to
patients A20, C08 and C17 in Supplementary Figure S1).
Interestingly, a general trend towards negative correlations was
found between DKs and the number of positively selected sites for
each sub-region, but there were too few data points to test its
significance reliably. This trend became marginally significant for
some sub-regions when considering the total number of codons
positively selected at the E1-E2 region (data not shown).
Evolutionary changes during antiviral treatment in theNS5A region
We applied the same analyses previously described for the E1-
E2 region to the NS5A region, although considering its specific
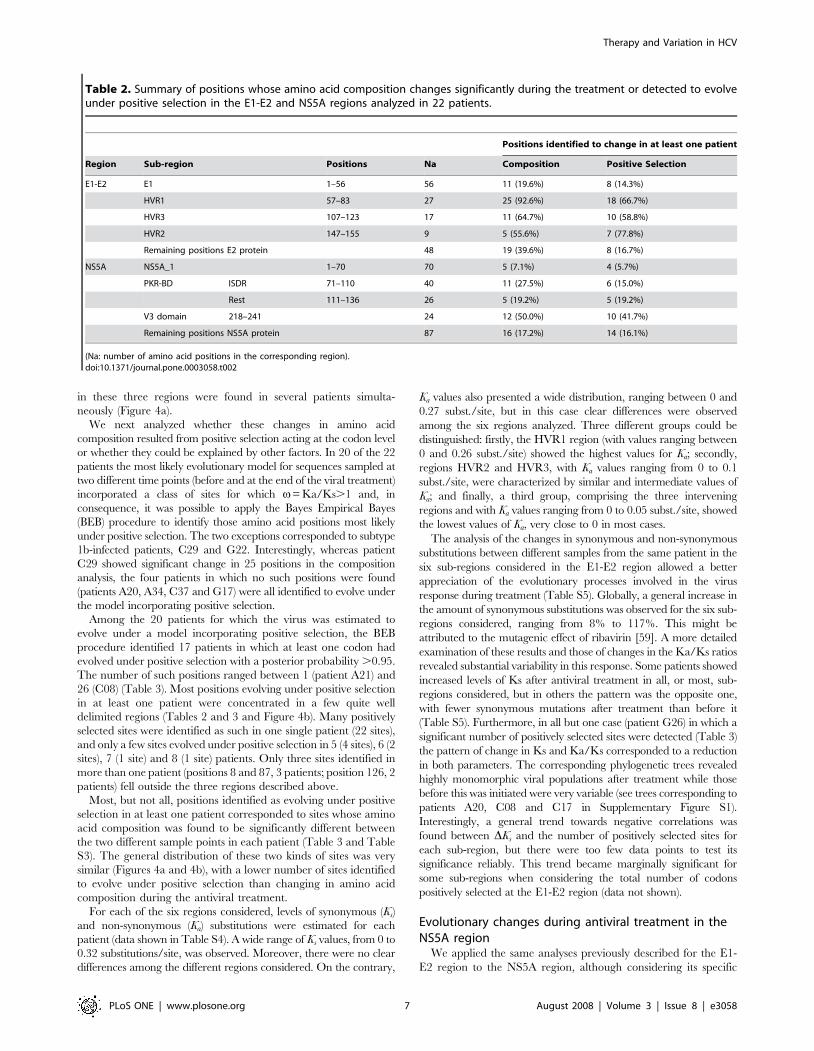
Table 2. Summary of positions whose amino acid composition changes significantly during the treatment or detected to evolveunder positive selection in the E1-E2 and NS5A regions analyzed in 22 patients.
Positions identified to change in at least one patient
Region Sub-region Positions Na Composition Positive Selection
E1-E2 E1 1–56 56 11 (19.6%) 8 (14.3%)
HVR1 57–83 27 25 (92.6%) 18 (66.7%)
HVR3 107–123 17 11 (64.7%) 10 (58.8%)
HVR2 147–155 9 5 (55.6%) 7 (77.8%)
Remaining positions E2 protein 48 19 (39.6%) 8 (16.7%)
NS5A NS5A_1 1–70 70 5 (7.1%) 4 (5.7%)
PKR-BD ISDR 71–110 40 11 (27.5%) 6 (15.0%)
Rest 111–136 26 5 (19.2%) 5 (19.2%)
V3 domain 218–241 24 12 (50.0%) 10 (41.7%)
Remaining positions NS5A protein 87 16 (17.2%) 14 (16.1%)
(Na: number of amino acid positions in the corresponding region).doi:10.1371/journal.pone.0003058.t002
Therapy and Variation in HCV
PLoS ONE | www.plosone.org 7 August 2008 | Volume 3 | Issue 8 | e3058
Ta
ble
3.
Sum
mar
yo
fp
osi
tive
sele
ctio
nan
alys
es.
Pa
tie
nt
E1
-E2
Mo
de
lP
osi
tio
ns
for
E1
-E2
reg
ion
po
s.E
1E
2v
NS
5A
Mo
de
lP
osi
tio
ns
for
NS
5A
reg
ion
po
s.N
S5
Av
A0
9M
85
7,
13
7,
14
63
0.2
09
M8
24
01
0.1
12
A2
0M
87
0,
71
,7
8,
10
7,
11
1,
11
5,
12
3,
15
0,
15
19
0.3
26
M1
*N
.C.
-0
.13
3
A2
1M
81
18
10
.14
0M
84
9,
21
82
0.2
93
A3
4M
88
,3
8,
77
,7
8,
81
,1
18
60
.17
8M
81
,7
6,
90
,2
33
,2
34
50
.11
1
A3
5M
2N
on
e0
0.1
02
M1
*N
.C.
-0
.12
8
C0
5M
33
,5
7,
59
,6
1,
65
,7
0,
77
,8
7,
10
5,
11
7,
11
8,
11
9,
15
11
30
.24
2M
83
1,
71
,7
8,
80
,1
45
,1
69
,2
36
,2
41
80
.14
7
C0
8M
31
7,
57
,5
9,
60
,6
4,
65
,6
7,
68
,7
0,
71
,7
4,
77
,7
8,
80
,8
1,
87
,1
07
,1
12
,1
15
,1
18
,1
19
,1
22
,1
34
,1
48
,1
51
,1
54
26
0.4
11
M8
12
2,
24
02
0.2
28
C1
2M
35
7,
59
,7
1,
83
,1
07
,1
53
60
.13
6M
81
49
,2
16
,2
36
30
.12
1
C1
6M
82
,6
4,
14
8,
15
14
0.2
02
M2
No
ne
00
.07
0
C1
7M
35
9,
65
,7
0,
73
,7
4,
78
,1
26
70
.89
6M
0*
N.C
.-
0.8
83
C2
2M
38
,5
7,
70
,7
8,
10
7,
11
1,
11
5,
11
7,
11
9,
12
2,
13
3,
15
41
20
.17
4M
31
14
,1
42
,1
62
30
.15
0
C2
9M
1*
N.C
.-
0.2
42
M8
23
2,
24
0,
24
43
0.4
26
C3
7M
37
1,
87
20
.18
5M
2N
on
e0
0.1
24
G0
6M
35
,1
39
,1
52
30
.15
4M
81
5,
13
92
0.1
69
G0
7M
31
11
,1
18
,1
51
30
.11
7M
81
30
,1
67
,1
95
,2
11
40
.10
0
G1
4M
88
,3
2,
67
,7
0,
11
95
0.1
01
M2
No
ne
00
.07
6
G1
6M
36
0,
78
,1
53
30
.27
1M
83
1,
49
,1
22
,1
25
,1
62
,1
65
,2
18
,2
34
,2
35
90
.19
5
G1
7M
2N
on
e0
0.0
96
M8
13
2,
14
22
0.0
92
G1
8M
32
2,
73
,7
8,
10
7,
11
85
0.1
92
M3
80
,1
49
,1
91
30
.16
1
G1
9M
2N
on
e0
0.1
23
M3
10
1,
11
4,
13
9,
14
9,
17
4,
19
1,
22
6,
23
98
0.1
33
G2
2M
7*
N.C
.-
0.1
11
M8
18
1,
23
52
0.1
97
G2
6M
35
7,
59
,6
3,
64
,6
5,
68
,7
0,
71
,7
3,
78
,8
3,
11
7,
12
0,
12
6,
14
8,
14
9,
15
1,
15
21
80
.52
4M
0*
N.C
.-
0.1
56
For
all
pat
ien
ts,
the
be
ste
volu
tio
nar
ym
od
el,
the
po
siti
on
su
nd
er
po
siti
vese
lect
ion
,th
en
um
be
ro
fp
osi
tio
ns
(po
s.)
andv
=K
a/K
se
stim
ate
sar
ein
dic
ate
dfo
rb
oth
E1-E
2an
dN
S5A
reg
ion
s.N
.C.:
no
nco
mp
uta
ble
.* Ev
olu
tio
nar
ym
od
els
wh
ere
po
siti
vese
lect
ion
isn
ot
com
pu
tab
le.
do
i:10
.13
71
/jo
urn
al.p
on
e.0
00
30
58
.t0
03
Therapy and Variation in HCV
PLoS ONE | www.plosone.org 8 August 2008 | Volume 3 | Issue 8 | e3058
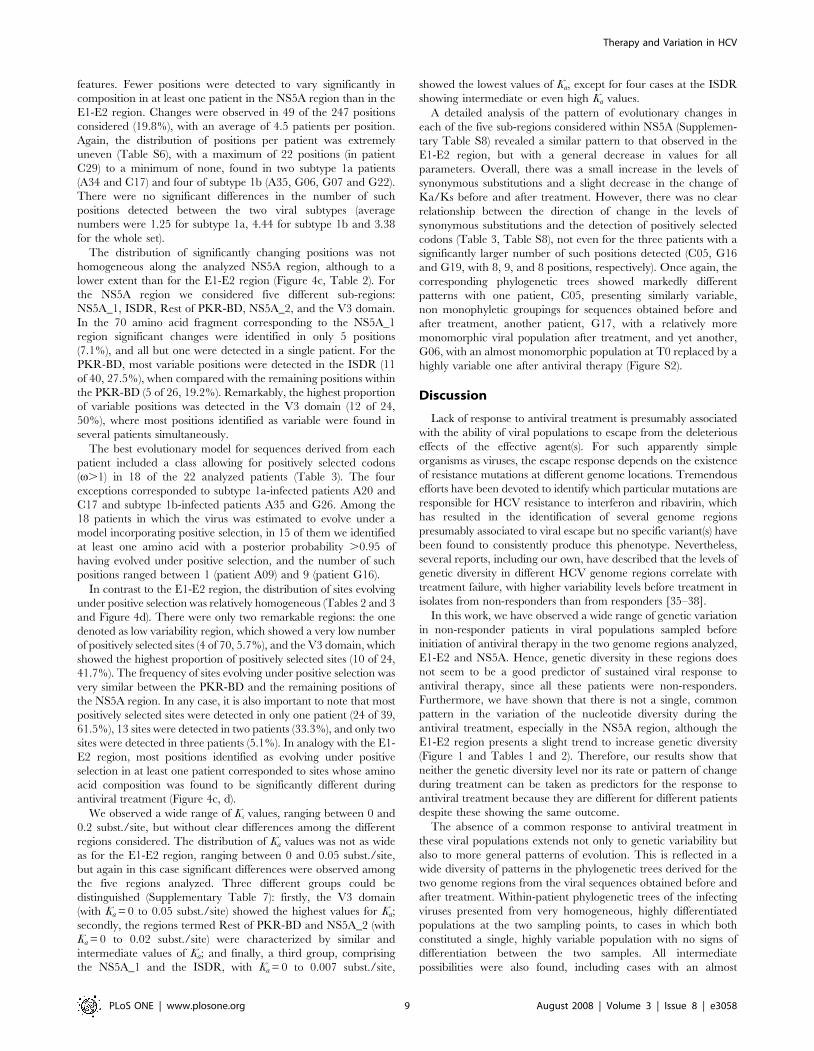
features. Fewer positions were detected to vary significantly in
composition in at least one patient in the NS5A region than in the
E1-E2 region. Changes were observed in 49 of the 247 positions
considered (19.8%), with an average of 4.5 patients per position.
Again, the distribution of positions per patient was extremely
uneven (Table S6), with a maximum of 22 positions (in patient
C29) to a minimum of none, found in two subtype 1a patients
(A34 and C17) and four of subtype 1b (A35, G06, G07 and G22).
There were no significant differences in the number of such
positions detected between the two viral subtypes (average
numbers were 1.25 for subtype 1a, 4.44 for subtype 1b and 3.38
for the whole set).
The distribution of significantly changing positions was not
homogeneous along the analyzed NS5A region, although to a
lower extent than for the E1-E2 region (Figure 4c, Table 2). For
the NS5A region we considered five different sub-regions:
NS5A_1, ISDR, Rest of PKR-BD, NS5A_2, and the V3 domain.
In the 70 amino acid fragment corresponding to the NS5A_1
region significant changes were identified in only 5 positions
(7.1%), and all but one were detected in a single patient. For the
PKR-BD, most variable positions were detected in the ISDR (11
of 40, 27.5%), when compared with the remaining positions within
the PKR-BD (5 of 26, 19.2%). Remarkably, the highest proportion
of variable positions was detected in the V3 domain (12 of 24,
50%), where most positions identified as variable were found in
several patients simultaneously.
The best evolutionary model for sequences derived from each
patient included a class allowing for positively selected codons
(v.1) in 18 of the 22 analyzed patients (Table 3). The four
exceptions corresponded to subtype 1a-infected patients A20 and
C17 and subtype 1b-infected patients A35 and G26. Among the
18 patients in which the virus was estimated to evolve under a
model incorporating positive selection, in 15 of them we identified
at least one amino acid with a posterior probability .0.95 of
having evolved under positive selection, and the number of such
positions ranged between 1 (patient A09) and 9 (patient G16).
In contrast to the E1-E2 region, the distribution of sites evolving
under positive selection was relatively homogeneous (Tables 2 and 3
and Figure 4d). There were only two remarkable regions: the one
denoted as low variability region, which showed a very low number
of positively selected sites (4 of 70, 5.7%), and the V3 domain, which
showed the highest proportion of positively selected sites (10 of 24,
41.7%). The frequency of sites evolving under positive selection was
very similar between the PKR-BD and the remaining positions of
the NS5A region. In any case, it is also important to note that most
positively selected sites were detected in only one patient (24 of 39,
61.5%), 13 sites were detected in two patients (33.3%), and only two
sites were detected in three patients (5.1%). In analogy with the E1-
E2 region, most positions identified as evolving under positive
selection in at least one patient corresponded to sites whose amino
acid composition was found to be significantly different during
antiviral treatment (Figure 4c, d).
We observed a wide range of Ks values, ranging between 0 and
0.2 subst./site, but without clear differences among the different
regions considered. The distribution of Ka values was not as wide
as for the E1-E2 region, ranging between 0 and 0.05 subst./site,
but again in this case significant differences were observed among
the five regions analyzed. Three different groups could be
distinguished (Supplementary Table 7): firstly, the V3 domain
(with Ka = 0 to 0.05 subst./site) showed the highest values for Ka;
secondly, the regions termed Rest of PKR-BD and NS5A_2 (with
Ka = 0 to 0.02 subst./site) were characterized by similar and
intermediate values of Ka; and finally, a third group, comprising
the NS5A_1 and the ISDR, with Ka = 0 to 0.007 subst./site,
showed the lowest values of Ka, except for four cases at the ISDR
showing intermediate or even high Ka values.
A detailed analysis of the pattern of evolutionary changes in
each of the five sub-regions considered within NS5A (Supplemen-
tary Table S8) revealed a similar pattern to that observed in the
E1-E2 region, but with a general decrease in values for all
parameters. Overall, there was a small increase in the levels of
synonymous substitutions and a slight decrease in the change of
Ka/Ks before and after treatment. However, there was no clear
relationship between the direction of change in the levels of
synonymous substitutions and the detection of positively selected
codons (Table 3, Table S8), not even for the three patients with a
significantly larger number of such positions detected (C05, G16
and G19, with 8, 9, and 8 positions, respectively). Once again, the
corresponding phylogenetic trees showed markedly different
patterns with one patient, C05, presenting similarly variable,
non monophyletic groupings for sequences obtained before and
after treatment, another patient, G17, with a relatively more
monomorphic viral population after treatment, and yet another,
G06, with an almost monomorphic population at T0 replaced by a
highly variable one after antiviral therapy (Figure S2).
Discussion
Lack of response to antiviral treatment is presumably associated
with the ability of viral populations to escape from the deleterious
effects of the effective agent(s). For such apparently simple
organisms as viruses, the escape response depends on the existence
of resistance mutations at different genome locations. Tremendous
efforts have been devoted to identify which particular mutations are
responsible for HCV resistance to interferon and ribavirin, which
has resulted in the identification of several genome regions
presumably associated to viral escape but no specific variant(s) have
been found to consistently produce this phenotype. Nevertheless,
several reports, including our own, have described that the levels of
genetic diversity in different HCV genome regions correlate with
treatment failure, with higher variability levels before treatment in
isolates from non-responders than from responders [35–38].
In this work, we have observed a wide range of genetic variation
in non-responder patients in viral populations sampled before
initiation of antiviral therapy in the two genome regions analyzed,
E1-E2 and NS5A. Hence, genetic diversity in these regions does
not seem to be a good predictor of sustained viral response to
antiviral therapy, since all these patients were non-responders.
Furthermore, we have shown that there is not a single, common
pattern in the variation of the nucleotide diversity during the
antiviral treatment, especially in the NS5A region, although the
E1-E2 region presents a slight trend to increase genetic diversity
(Figure 1 and Tables 1 and 2). Therefore, our results show that
neither the genetic diversity level nor its rate or pattern of change
during treatment can be taken as predictors for the response to
antiviral treatment because they are different for different patients
despite these showing the same outcome.
The absence of a common response to antiviral treatment in
these viral populations extends not only to genetic variability but
also to more general patterns of evolution. This is reflected in a
wide diversity of patterns in the phylogenetic trees derived for the
two genome regions from the viral sequences obtained before and
after treatment. Within-patient phylogenetic trees of the infecting
viruses presented from very homogeneous, highly differentiated
populations at the two sampling points, to cases in which both
constituted a single, highly variable population with no signs of
differentiation between the two samples. All intermediate
possibilities were also found, including cases with an almost
Therapy and Variation in HCV
PLoS ONE | www.plosone.org 9 August 2008 | Volume 3 | Issue 8 | e3058
monomorphic initial population which was transformed into a
highly variable one, to the reverse case.
This lack of a common pattern is also revealed by the detection
of positive selection in these two regions. Although most patients
presented positively selected sites at one or the other genome
region, no such sites were detected in patient A35. On average, the
number of such sites was higher in the E1-E2 than in the NS5A
region, but there was no correlation within patients (r = 20.0567,
P.0.10, Table 3). Patients with a large number of positively
selected sites in the E1-E2 region showed none (A20, G26) or few
(C08) such sites in the NS5A but patient C05, third in the ranking
of sites in E1-E2, was second in NS5A. The reverse is also true for
patients with most selected sites in the NS5A region.
These differences are likely reflecting the different role of the
two fragments analyzed. If we consider the distribution of changes
along the E1-E2 region, it is remarkable the high degree of
conservation of the first 56 amino acids, which correspond to the
C-terminus of the envelope 1 protein (Table 3 and Figure 4). This
fragment presents a hydrophobic region apparently involved in
multiple functions, such as the maintenance of E1 and E2 proteins
in the endoplasmic reticulum or the formation of heterodimers
between E1 and E2 proteins [39–41], suggesting its involvement in
the viral replication cycle and accounting for the high degree of
conservation detected therein. In contrast, the sequenced portion
of this region that encodes the E2 protein presents a higher level of
variability, mainly concentrated in the three hypervariable regions.
The highest number of changes has been found in the HVR1,
where most HCV antigenic sites have been reported [42,43].
Hypervariable regions HVR2 and HVR3, in which several
antigenic sites have been reported [13,44] also show high levels
of variability, although to a lower extent than HVR1. The recently
described HVR3 [14,15] shows a slightly lower variability than
HVR1 and HVR2, which correlates with a lower exposition of its
antigenic sites as inferred from structural models [13]. This pattern
is also reflected in the analysis of genetic divergences, which
showed the highest Ka for HVR1, intermediate levels for HVR2
and HVR3, and very low levels for the remaining sub-regions
included in this E1-E2 fragment (Table S4).
Levels of genetic variability in the NS5A region were lower than
in the E1-E2 fragment analyzed. The first 70 amino acids of the
NS5A region showed a high degree of conservation, whereas the
highest variability was found in the V3 domain, which has been
postulated to be involved in responsiveness to interferon [16,17,45]
and where a certain degree of variability has been described [46].
The remaining sub-regions in this fragment showed an intermediate
degree of variability. The analyses of genetic divergences further
corroborated these observations, showing the highest Ka for the V3
domain, the lowest values for the first 70 amino acids of the
fragment and the ISDR (with some exceptions), and intermediate Ka
values for the rest of the fragment (Table S7). On the whole, these
and other similar results [47] indicate that the NS5A protein is
subject to strong evolutionary restrictions, probably because of its
role in replication mechanisms [48,49]. Moreover, the low levels of
variability present in the PKR-BD, and more specifically in the
ISDR, are probably due to the existence of a specific sequence
involved in response to interferon [18,29,50,51].
A correlation in the number of amino acid changes between
both regions was observed for composition analysis but not for
positive selection analysis. This could reflect the presence of
different selective pressures acting on each region, and conse-
quently of hitchhiking phenomena. The absence of recombination
in HCV along with the enhanced selective pressures during
antiviral treatments would facilitate the presence of hitchhiking
selection [52,53], in which the regions under the strongest selective
pressures would drive the course of evolution in the rest of the
genome. In this situation, the level of linkage between regions
would depend on the time elapsed between the hitchhiking events
and the subsequent readjustment phenomena in the affected
regions. Although the high mutation rates in the HCV genome
will certainly complicate these analyses, the role of hitchhiking
selection in the evolution of HCV deserves a closer scrutiny.
Genetic variability, amino acid composition and positive selection
analyses reflect the enormous heterogeneity of adaptive solutions
shown by viral populations infecting each patient. These results are
further corroborated by the phylogenetic analyses, where the
diversity of tree structures in the pool of patients for both analyzed
regions is remarkable, thus precluding to discern general patterns of
viral adaptation. Additionally, the analysis of divergence is
consistent with the previous results, providing evidence for the
particular adaptation routes exhibited by each patient.
In agreement with our results, it has been previously shown that
the adaptive solutions adopted by RNA virus populations are
convergent to a certain extent [54]. However, although positions
detected to evolve under positive selection are mainly concentrated
in the hypervariable regions, there are too many of these so to
establish clear patterns of adaptation to the strong selective
pressures exerted by the immune system and antiviral drugs. At
this point, it is important to remark the difficulty in distinguishing
between changes due to selective pressures imposed by the
immune system from those specific to antiviral therapy.
The addition of ribavirin is likely to mask adaptive events even
further. The precise mechanism of action of ribavirin is not
completely understood [55] and different mechanisms have been
recently shown. It has been suggested that the anti-HCV effect of
ribavirin is partly mediated via the up-regulation of PKR activity
[56]. Alternatively, it has been proposed that ribavirin acts as an
RNA mutagen [57], in which case a possible mechanism for
resistance could depend on increasing replication fidelity by means
of the accumulation of mutations in the polymerase [58]. In fact, the
mutagenic effect of ribavirin has been confirmed very recently [59],
although this is still a controversial issue [60]. We have detected a
global increase in the levels of synonymous substitutions after failed
treatment, which could be due to the mutagenic effect of ribavirin.
However, as indicated above, there are cases in which the change is
in the opposite direction. But we have also found that the detection
of large numbers of positively selected sites in the E1-E2 region is
usually associated to a reduction in the level of synonymous
substitutions and to a less polymorphic viral population after
treatment. The most plausible interpretation for this is that the
stronger the selective pressures on viral population (imposed by
antiviral treatment and host immune response), the higher the initial
reduction in genetic variability. Alternatively, for those populations
with more positively selected sites, an increased fidelity of the
corresponding HCV polymerase could also account for the
observed reduction in the levels of synonymous substitutions. In
this respect, mutations in the NS5B protein, which is the RNA-
dependent RNA polymerase in HCV, could be under strong
selective pressure and, consequently, variation in other genome
regions, such as the hypervariable regions, could eventually become
a surrogate marker of these selection events. From this perspective,
future studies should also focus on the genetic analysis of the NS5B
protein and its potential correlation to sensitivity to ribavirin [61].
Materials and Methods
Patients and samplesSerum samples were obtained from 22 patients infected with
HCV genotype 1, seven of which were infected with subtype 1a
Therapy and Variation in HCV
PLoS ONE | www.plosone.org 10 August 2008 | Volume 3 | Issue 8 | e3058
and 15 with subtype 1b. These patients were included in a
prospective study in which serum samples (T0 samples) were taken
immediately before they were subjected to a combined treatment
of pegylated interferon-2a plus ribavirin. After 6 or 12 months,
treatment was discontinued since viral load did not decrease more
than 2 logs and a second serum sample was obtained for analysis
(T1 and T2 samples for 6 and 12 months, respectively). In a few
cases, samples were available for both 6- and 12-months time
points. Samples were obtained in different hospitals from the
Comunidad Valenciana, Spain (Table 4). All patients provided
written consent to be included in the study which was approved by
the corresponding ethics committees of the institutions involved
(Hospital General de Valencia, Hospital Clınico Universitario de
Valencia and Hospital General de Alicante).
Two HCV genome regions were studied: one corresponded to a
472 nt fragment encompassing genes encoding proteins E1 and E2
(from nucleotide 1322 to 1793 in the HCV-J reference genome
sequence, accession number AF009606 [62], including the three
hypervariable regions HVR1, HVR2 and HVR3), and referred to
as E1-E2 region, and the other corresponding to a 743 nt
fragment from gene NS5A (nucleotides 6742 to 7484), including
the interferon sensitivity determining region (ISDR) and the V3
domain and referred to as NS5A region.
Experimental proceduresRNA extraction, reverse transcription, amplification, cloning
and sequencing, are described in detail in [63]. Briefly, after
viral RNA extraction (High Pure Viral RNA Kit; Roche),
reverse transcription reactions were performed with random
hexadeoxynucleotides in order to prevent any bias during
reactions due to unspecific oligonucleotides. Primers used for
subsequent PCR are detailed in [64]. Amplified DNA products
for each region were purified with High Pure PCR product
Purification Kit (Roche) and directly cloned into EcoRV-
digested pBluescript II SK (+) phagemid (Stratagene). Plasmid
DNA was purified with High Pure Plasmid Isolation Kit
(Roche). Cloned products for E1-E2 and NS5A regions were
sequenced using vector-based primers KS and SK (Stratagene).
For the E1-E2 region, we obtained about 100 clones from each
patient, yielding a total of 4690 sequences, 2232 from T0
samples, 1447 from T1 samples and 1011 from T2 samples. For
the NS5A region, we obtained between 25 and 96 clones per
sample and 2486 sequences in total were determined (see Table
S1 in Supplementary data). HCV sequences obtained in this
study have been deposited in GenBank with accession numbers
given in Tables S1 and S2.
Genetic variability analysisSequence alignments were obtained using CLUSTALX v1.81
[65]. DnaSP 3.51 [66] was used to estimate, for both E1-E2 and
NS5A regions, the following measures of genetic variability in the
viral samples of each patient: number of polymorphic sites (S),
total number of mutations (g), number of haplotypes (nHap) and
nucleotide diversity (p).
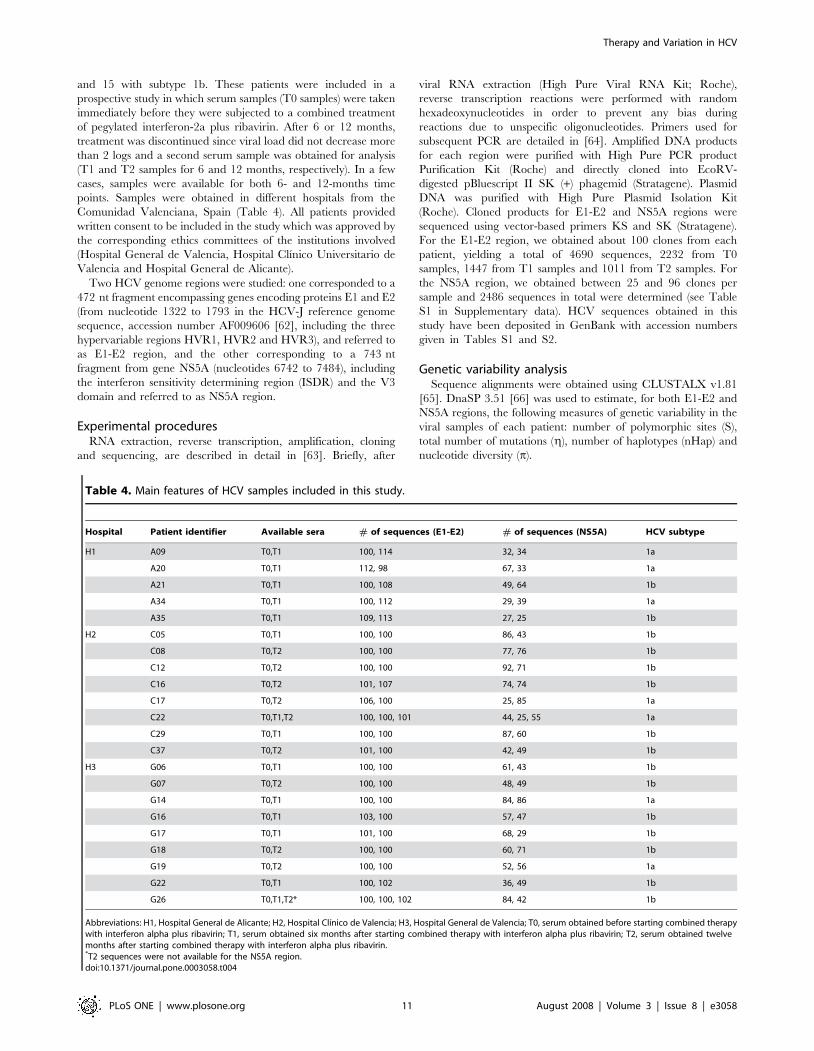
Table 4. Main features of HCV samples included in this study.
Hospital Patient identifier Available sera # of sequences (E1-E2) # of sequences (NS5A) HCV subtype
H1 A09 T0,T1 100, 114 32, 34 1a
A20 T0,T1 112, 98 67, 33 1a
A21 T0,T1 100, 108 49, 64 1b
A34 T0,T1 100, 112 29, 39 1a
A35 T0,T1 109, 113 27, 25 1b
H2 C05 T0,T1 100, 100 86, 43 1b
C08 T0,T2 100, 100 77, 76 1b
C12 T0,T2 100, 100 92, 71 1b
C16 T0,T2 101, 107 74, 74 1b
C17 T0,T2 106, 100 25, 85 1a
C22 T0,T1,T2 100, 100, 101 44, 25, 55 1a
C29 T0,T1 100, 100 87, 60 1b
C37 T0,T2 101, 100 42, 49 1b
H3 G06 T0,T1 100, 100 61, 43 1b
G07 T0,T2 100, 100 48, 49 1b
G14 T0,T1 100, 100 84, 86 1a
G16 T0,T1 103, 100 57, 47 1b
G17 T0,T1 101, 100 68, 29 1b
G18 T0,T2 100, 100 60, 71 1b
G19 T0,T2 100, 100 52, 56 1a
G22 T0,T1 100, 102 36, 49 1b
G26 T0,T1,T2* 100, 100, 102 84, 42 1b
Abbreviations: H1, Hospital General de Alicante; H2, Hospital Clınico de Valencia; H3, Hospital General de Valencia; T0, serum obtained before starting combined therapywith interferon alpha plus ribavirin; T1, serum obtained six months after starting combined therapy with interferon alpha plus ribavirin; T2, serum obtained twelvemonths after starting combined therapy with interferon alpha plus ribavirin.*T2 sequences were not available for the NS5A region.doi:10.1371/journal.pone.0003058.t004
Therapy and Variation in HCV
PLoS ONE | www.plosone.org 11 August 2008 | Volume 3 | Issue 8 | e3058
Synonymous (Ks) and nonsynonymous (Ka) substitutionsSynonymous (Ks) and nonsynonymous (Ka) substitution per
synonymous and nonsynonymous site, respectively, were estimated
for each patient from data derived from the corresponding T0
sample using the Nei-Gojobori method implemented in the
program MEGA [67]. Standard errors of Ks and Ka were obtained
by bootstrap resampling with 500 pseudoreplicates. According to
structural and functional properties, the 472-nt fragment of the
E1-E2 region was divided into six different sub-regions for Ks and
Ka estimation: the E1 sub-region, corresponding to E1 protein
(nucleotide positions 2 to 169, amino acid positions 1 to 56
[positions 328–383 in the HCV-J reference sequence]); the HVR1
(nucleotide positions 170 to 250, amino acid positions 57 to 83
[384–410]), the E2_1 sub-region, comprising nucleotide positions
251 to 319 (amino acid positions 84 to 106 [411–433]); the HVR3,
defined between nucleotide positions 320 to 370 (amino acid
positions 107 to 123 [434–450]); the E2_2 sub-region, comprising
nucleotide positions 371 to 439 (amino acid positions 124 to 146
[451–473]); and the HVR2 (positions 440 to 466 nt, 147 to 155
aa, [474–482]). Similarly, the NS5A region was subdivided into
five different sub-regions for Ks and Ka estimation: the NS5A_1
sub-region (nucleotide positions 3 to 212, amino acid positions 1 to
70 [2139–2208]); the ISDR (nucleotide positions 213 to 332,
amino acid positions 71 to 110 [2209–2248]); the rest of the PKR-
BD (nucleotide positions 333 to 410, amino acid positions 111 to
136 [2249–2274]); the NS5A_2 sub-region (nucleotide positions
411 to 653, amino acid positions 137 to 217 [2275–2355]); and the
V3 domain (nucleotide positions 654 to 725, amino acid positions
218 to 241 [2356–2379]). For both regions, Ks and Ka estimates
were obtained for each of the delimited sub-regions.
Changes in amino acid composition during treatmentFor both regions, amino acid composition was determined for
each sample and the different sets of sequences corresponding to
each patient (T0 sample versus T1 or T2 sample) were compared
with program VESPA [68]. Tests for differences in the
composition at each amino acid position between the two time-
points were carried out by means of a G-test. Significance levels for
multiple comparisons were corrected by Bonferroni’s method.
Positively selected amino acid positions during thetreatment
For each patient, a maximum likelihood approach [69]
implemented in the PAML package 3.15 [70] was used to
investigate the presence of positively selected codons in the E1-E2
and NS5A regions. Two criteria were employed to assign the best
evolutionary model to each patient (independently for each
region): a likelihood ratio test (LRT), which compares the fit of
two nested models to the data [69]; and the Akaike information
criterion (AIC), which allows to perform comparisons between non
nested models [71]. For all patients and genome regions, six
models were compared with the PAML package: M0, M1, M2,
M3, M7 and M8. For models M2, M3 and M8, the existence of
positively selected codons is allowed as they incorporate a class of
codons for which v= Ka/Ks (ratio of non-synonymous and
synonymous substitution rates) can be .1. Therefore, whenever
one of these models explained the observed data significantly
better than the other corresponding alternative in which such a
class is not allowed, then the existence of positively selected codons
was inferred. Next, a Bayes empirical Bayes (BEB) procedure [72]
was applied to detect codons with a posterior probability of
belonging to the v.1 class larger than 0.95.
Phylogenetic trees and rates of molecular evolutionMaximum likelihood trees were constructed with PHYML [73]
using a common evolutionary model (GTR+I+G) and common
outgroup sequences, H77 (accession number NC_004102) for
subtype 1a sequences and HCV-J (accession number D90208) for
subtype 1b. These two outgroup isolates represent epidemiolog-
ically unrelated strains to those included in our study. HCV-H77
was isolated from an American patient in 1979 [74] and HCV-J
was derived from a Japanese patient in the late 1980’s [75]. Rates
of evolution for the different time samples of each patient were
estimated by removing the outgroup from each phylogenetic tree
and then computing the average length of the arms for all the
sequences from each time sample.
Supporting Information
Figure S1 Phylogenetic trees for the E1-E2 region from all 22
analyzed patients. Different symbols are used to denote sequences
sampled at T0 (red dots), T1 (green dots) and T2 (blue dots).
Found at: doi:10.1371/journal.pone.0003058.s001 (0.36 MB PPT)
Figure S2 Phylogenetic trees for the NS5A region Phylogenetic
trees for the NS5A region from all 22 analyzed patients. Different
symbols are used to denote sequences sampled at T0 (red dots), T1
(green dots) and T2 (blue dots).
Found at: doi:10.1371/journal.pone.0003058.s002 (0.37 MB PPT)
Table S1 Genetic variability measures in the E1-E2 region of
the HCV genome.
Found at: doi:10.1371/journal.pone.0003058.s003 (0.09 MB
DOC)
Table S2 Genetic variability measures in the NS5A region of the
HCV genome.
Found at: doi:10.1371/journal.pone.0003058.s004 (0.09 MB
DOC)
Table S3 Positions detected to change significantly in amino
acid composition between samples at T0 and T1/T2 for each
patient included in the study for the E1-E2 region.
Found at: doi:10.1371/journal.pone.0003058.s005 (0.26 MB
DOC)
Table S4 Synonymous and non-synonymous substitutions levels
in the six sub-regions of the E1-E2 region.
Found at: doi:10.1371/journal.pone.0003058.s006 (0.09 MB
DOC)
Table S5 Relative change in the levels of synonymous and non-
synonymous to synonymous substitutions in the six sub-regions of
the E1-E2 region.
Found at: doi:10.1371/journal.pone.0003058.s007 (0.09 MB
DOC)
Table S6 Positions detected to change significantly in amino
acid composition between samples at T0 and T1/T2 for each
patient included in the study for the NS5A region.
Found at: doi:10.1371/journal.pone.0003058.s008 (0.18 MB
DOC)
Table S7 Synonymous and non-synonymous substitutions levels
in the five sub-regions of the NS5A region.
Found at: doi:10.1371/journal.pone.0003058.s009 (0.08 MB
DOC)
Table S8 Relative change in the levels of synonymous and non-
synonymous to synonymous substitutions in the six sub-regions of
the E1-E2 region.
Therapy and Variation in HCV
PLoS ONE | www.plosone.org 12 August 2008 | Volume 3 | Issue 8 | e3058
Found at: doi:10.1371/journal.pone.0003058.s010 (0.08 MB
DOC)
Acknowledgments
We thank the Editor and two anonymous reviewers for their comments
and suggestions to improve the manuscript.
Author Contributions
Conceived and designed the experiments: JMC MAB AM FGC.
Performed the experiments: MTP NJH MAB IGR. Analyzed the data:
JMC MTP FGC. Contributed reagents/materials/analysis tools: BW FC
JdO EO AM FGC. Wrote the paper: JMC FGC.
References
1. Alter HJ, Seeff LB (2000) Recovery, persistence, and sequelae in hepatitis C virusinfection: a perspective on long-term outcome. Semin Liver Dis 20: 17–35.
2. Pawlotsky JM (2006) Therapy of hepatitis C: From empiricism to eradication.Hepatology 43: S207–S220.
3. Niederau C, Lange S, Heintges T, Erhardt A, Buschkamp M, et al. (1998)Prognosis of chronic hepatitis C: results of a large, prospective cohort study.
Hepatology 28: 1687–1695.
4. Poynard T, Marcellin P, Lee SS, Niederau C, Minuk GS, et al. (1998)
Randomised trial of interferon alpha2b plus ribavirin for 48 weeks or for 24weeks versus interferon alpha2b plus placebo for 48 weeks for treatment of
chronic infection with hepatitis C virus. International Hepatitis InterventionalTherapy Group (IHIT). Lancet 352: 1426–1432.
5. Lindsay KL, Trepo C, Heintges T, Shiffman ML, Gordon SC, et al. (2001) Arandomized, double-blind trial comparing pegylated interferon alfa-2b to
interferon alfa-2b as initial treatment for chronic hepatitis C. Hepatology 34:395–403.
6. Manns MP, McHutchison JG, Gordon SC, Rustgi VK, Shiffman M, et al.(2001) Peginterferon alfa-2b plus ribavirin compared with interferon alfa-2b plus
ribavirin for initial treatment of chronic hepatitis C: a randomised trial. Lancet358: 958–965.
7. Fried MW, Shiffman ML, Reddy KR, Smith C, Marinos G, et al. (2002)Peginterferon a-2a plus ribavirin for chronic hepatitis C virus infection.
N Engl J Med 347: 975–982.
8. Hadziyannis SJ, Sette H Jr, Morgan TR, Balan V, Diago M, et al. (2004)
Peginterferon-alpha2a and ribavirin combination therapy in chronic hepatitis C:a randomized study of treatment duration and ribavirin dose. Ann Intern Med
140: 346–355.
9. Zeuzem S, Hulcrantz R, Bourliere M, Goeser T, Marcellin P, et al. (2004)
Peginterferon alfa-2b plus ribavirin for treatment of chronic hepatitis C inpreviously untreated patients infected with HCV genotypes 2 or 3. J Hepatol 40:
993–999.
10. Weiner AJ, Brauer MJ, Rosenblatt J, Richman KH, Tung J, et al. (1991)
Variable and hypervariable domains are found in the regions of HCVcorresponding to the Flavivirus envelope and NS1 proteins and the Pestivirus
envelope glycoproteins. Virology 180: 842–848.
11. Kato N, Ootsuyama Y, Tanaka T, Nakagawa M, Nakazawa T, et al. (1992)
Marked sequence diversity in the putative envelope proteins of hepatitis Cviruses. Virus Res 22: 107–123.
12. Penin F, Combet C, Germanidis G, Frainais PO, Deleage G, et al. (2001)
Conservation of the conformation and positive charges of hepatitis C virus E2
envelope glycoprotein hypervariable region 1 points to a role in cell attachment.J Virol 75: 5703–5710.
13. Yagnik AT, Lahm A, Meola A, Roccasecca RM, Ercole BB, et al. (2000) A
model for the hepatitis C virus envelope glycoprotein E2. Proteins 40: 355–366.
14. Troesch M, Meunier I, Lapierre P, Lapointe N, Alvarez F, et al. (2006) Study of
a novel hypervariable region in hepatitis C virus (HCV) E2 envelopeglycoprotein. Virology 352: 357–367.
15. Torres-Puente M, Cuevas JM, Jimenez N, Bracho MA, Garcıa-Robles I, et al.(2008) Using evolutionary tools to refine the new hypervariable region 3 within
the envelope 2 protein of hepatitis C virus. Infect Genet Evol 8: 74–82.
16. Duverlie G, Khorsi H, Castelain S, Jaillon O, Izopet J, et al. (1998) Sequence
analysis of the NS5A protein of European hepatitis C virus 1b isolates andrelation to interferon sensitivity. J Gen Virol 79: 1373–1381.
17. Durante ME, Forton DM, Ruggiero G, Karayiannis P (2003) Hepatitis C virusE2 and NS5A region variability during sequential treatment with two interferon-
alpha preparations. J Med Virol 70: 62–73.
18. Gale MJ, Korth MJ, Tang NM, Tan SL, Hopkins DA, et al. (1997) Evidence
that hepatitis C virus resistance to interferon is mediated through repression ofthe PKR protein kinase by the nonstructural 5A protein. Virology 230: 217–227.
19. Gale MJ Jr, Korth MJ, Katze MG (1998) Repression of the PKR protein kinase
by the hepatitis C virus NS5A protein: a potential mechanism of interferon
resistance. Clin Diagn Virol 10: 157–162.
20. Manzin A, Solforosi L, Petrelli E, Macarri G, Tosone G, et al. (1998) Evolutionof hypervariable region 1 of hepatitis C virus in primary infection. J Virol 72:
6271–6276.
21. Ray SC, Wang YM, Laeyendecker O, Ticehurst JR, Villano SA, Thomas DL
(1999) Acute hepatitis C virus structural gene sequences as predictors ofpersistent viremia: hypervariable region 1 as a decoy. J Virol 73: 2938–2946.
22. Chang KM, Rehermann B, McHutchison JG, Pasquinelli C, Southwood S, et al.(1997) Immunological significance of cytotoxic T lymphocyte epitope variants in
patients chronically infected by the hepatitis C virus. J Clin Invest 100:2376–2385.
23. Mondelli MU, Cerino A, Segagni L, Meola A, Cividini A, et al. (2001)
Hypervariable region 1 of hepatitis C virus: immunological decoy or biologically
relevant domain? Antiviral Res 52: 153–159.
24. Reed KE, Rice CM (2000) Overview of hepatitis C virus genome structure,
polyprotein processing, and protein properties. Curr Top Microbiol Immunol
242: 55–84.
25. Okamoto H, Kurai K, Okada SI, Yamamoto K, Iizuka H, et al. (1992)
Fulllength sequence of hepatitis C virus genome having poor homology to
reported isolates: Comparative studiy of four distinct genotypes. J Gen Virol 188:
331–341.
26. Farci P, Shimoda A, Coiana A, Diaz G, Peddis G, et al. (2000) The outcome of
acute hepatitis C predicted by the evolution of the viral quasispecies. Science
288: 339–344.
27. Curran R, Jameson CL, Craggs JK, Grabowska AM, Thomson BJ, et al. (2002)
Evolutionary trends of the first hypervariable region of the hepatitis C virus E2
protein in individuals with differing liver disease severity. J Gen Virol 83: 11–23.
28. Farci P, Strazzera R, Alter HJ, Farci S, Degioannis D, et al. (2002) Early changes
in hepatitis C viral quasispecies during interferon therapy predict the therapeutic
outcome. Proc Natl Acad Sci U S A 99: 3081–3086.
29. Enomoto N, Sakuma I, Asahina Y, Kurosaki M, Murakami T, et al. (1996)
Mutations in the nonstructural protein 5A gene and response to interferon in
patients with chronic hepatitis C virus 1b infection. New Engl J Med 334: 77–81.
30. Chayama K, Tsubota A, Kobayashi M, Okamoto K, Hashimoto M, et al. (1997)
Pretreatment virus load and multiple amino acid substitutions in the interferon
sensitivity-determining region predict the outcome of interferon treatment in
patients with chronic genotype 1b hepatitis C virus infection. Hepatology 25:
745–749.
31. Weiner AJ, Geysen HM, Christopherson C, Hall JE, Mason TJ, Saracco G, et
al. (1992) Evidence for immune selection of hepatitis C virus (HCV) putative
envelope glycoprotein variants: potential role in chronic HCV infections. Proc
Natl Acad Sci U S A 89: 3468–3472.
32. Kato N, Sekiya H, Ootsuyama Y, Nakazawa T, Hijikata M, et al. (1993)
Humoral immune response to hypervariable region 1 of the putative envelope
glycoprotein (gp70) of hepatitis C virus. J Virol 67: 3923–3930.
33. Taniguchi S, Okamoto H, Sakamoto M, Kojima M, Tsuda F, et al. (1993) A
structurally flexible and antigenically variable N-terminal domain of the hepatitis
C virus E2/NS1 protein: implication for an escape from antibody. Virology 195:
297–301.
34. Farci P, Purcell RH (2000) Clinical significance of hepatitis C virus genotypes
and quasispecies. Semin Liver Dis 20: 103–126.
35. Puig-Basagoiti F, Forns X, Furcic I, Ampurdanes S, Gimenez-Barcons M, et al.
(2005) Dynamics of hepatitis C virus NS5A quasispecies during interferon and
ribavirin therapy in responder and non-responder patients with genotype 1b
chronic hepatitis C. J Gen Virol 86: 1067–1075.
36. Chambers TJ, Fan X, Droll DA, Hembrador E, Slater T, et al. (2005)
Quasispecies heterogeneity within the E1/E2 region as a pretreatment variable
during pegylated interferon therapy of chronic hepatitis C virus infection. J Virol
79: 3071–3083.
37. Torres-Puente M, Cuevas JM, Jimenez N, Bracho MA, Garcıa-Robles I, et al.
(2008) Genetic variability in hepatitis C virus and its role in antiviral treatment
response. J Vir Hepat 15: 188–199.
38. Cuevas JM, Torres-Puente M, Jimenez-Hernandez N, Bracho MaA, Garcia-
Robles I, et al. (2008) Refined analysis of genetic variability parameters in
hepatitis C virus and the ability to predict antiviral treatment response. J Vir
Hepat 15: 578–590.
39. Ciccaglione AR, Marcantonio C, Equestre M, Jones IM, Rapicetta M (1998)
Secretion and purification of HCV E1 protein forms as glutathione-S-transferase
fusion in the baculovirus insect cell system. Virus Res 55: 157–165.
40. Cocquerel L, Duvet S, Meunier JC, Pillez A, Cacan R, et al. (1999) The
transmembrane domain of hepatitis C virus glycoprotein E1 is a signal for static
retention in the endoplasmic reticulum. J Virol 73: 2641–2649.
41. Dubuisson J (2000) Folding, assembly and subcellular localization of hepatitis C
virus glycoproteins. Curr Top Microbiol Immunol 242: 135–148.
42. Flint M, Maidens C, Loomis-Price LD, Shotton C, Dubuisson J, et al. (1999)
Characterization of hepatitis C virus E2 glycoprotein interaction with a putative
cellular receptor, CD81. J Virol 73: 6235–6244.
43. Lee JW, Kim K, Jung SH, Lee KJ, Choi EC, et al. (1999) Identification of a
domain containing B-cell epitopes in hepatitis C virus E2 glycoprotein by using
mouse monoclonal antibodies. J Virol 73: 11–18.
44. Pileri P, Uematsu Y, Campagnoli S, Galli G, Falugi F, et al. (1998) Binding of
hepatitis C virus to CD81. Science 282: 938–941.
Therapy and Variation in HCV
PLoS ONE | www.plosone.org 13 August 2008 | Volume 3 | Issue 8 | e3058
45. Layden-Almer JE, Kuiken C, Ribeiro RM, Kunstman KJ, Perelson AS, et al.
(2005) Hepatitis C virus genotype 1a NS5A pretreatment sequence variation and
viral kinetics in African American and white patients. J Infect Dis 192:
1078–1087.
46. Inchauspe G, Zebedee S, Lee DH, Sugitani M, Nasoff M, Prince AM (1991)
Genomic structure of the human prototype strain H of hepatitis C virus:
comparison with American and Japanese isolates. Proc Natl Acad Sci U S A 88:
10292–10296.
47. Nousbaum JB, Polyak SJ, Ray SC, Sullivan DG, Larson AM, et al. (2000)
Prospective characterization of full-length hepatitis C virus NS5A quasispecies
during induction and combination antiviral therapy. J Virol 74: 9028–9038.
48. Herion D, Hoofnagle JH (1997) The interferon sensitivity determining region: all
hepatitis C virus isolates are not the same. Hepatology 25: 769–771.
49. Lusida MI, Nagano-Fujii M, Nidom CA, Soetjipto, Handajani R, et al. (2001)
Correlation between mutations in the interferon sensitivity-determining region
of NS5A protein and viral load of hepatitis C virus subtypes 1b, 1c, and 2a. J Clin
Microbiol 39: 3858–3864.
50. Pascu M, Martus P, Hohne M, Wiedenmann B, Hopf U, et al. (2004) Sustained
virological response in hepatitis C virus type 1b infected patients is predicted by
the number of mutations within the NS5A-ISDR: a meta-analysis focused on
geographical differences. Gut 53: 1345–1351.
51. Torres-Puente M, Cuevas JM, Jimenez-Hernandez N, Bracho MA, Garcia-
Robles I, et al. (2008) Hepatitis C virus and the controversial role of the
interferon sensitivity determining region in the response to interferon treatment.
J Med Virol 80: 247–253.
52. Maynard-Smith JM, Haigh J (1974) The hitch-hiking effect of a favourable gene.
Genet Res 23: 23–35.
53. Charlesworth B, Morgan MT, Charlesworth D (1993) The effect of deleterious
mutations on neutral molecular variation. Genetics 134: 1289–1303.
54. Cuevas JM, Elena SF, Moya A (2002) Molecular basis of adaptive convergence
in experimental populations of RNA viruses. Genetics 162: 533–542.
55. Lau JYN, Tam RC, Liang TJ, Hong Z (2002) Mechanism of action of ribavirin
in the combination treatment of chronic HCV infection. Hepatology 35:
1002–1009.
56. Liu WL, Su WC, Cheng CW, Hwang LH, Wang CC, et al. (2007) Ribavirin up-
regulates the activity of double-stranded RNA-activated protein kinase and
enhances the action of interferon-a against hepatitis C virus. J Infect Dis 196:
425–434.
57. Crotty S, Cameron CE, Andino R (2001) RNA virus error catastrophe: direct
molecular test by using ribavirin. Proc Natl Acad Sci U S A 98: 6895–6900.
58. Pfeiffer JK, Kirkegaard K (2003) A single mutation in poliovirus RNA-
dependent RNA polymerase confers resistance to mutagenic nucleotide analogs
via increased fidelity. Proc Natl Acad Sci U S A 100: 7289–7294.
59. Hofmann WP, Polta A, Herrmann E, Mihm U, Kronenberger B, et al. (2007)
Mutagenic effect of ribavirin on hepatitis C nonstructural 5B quasispecies invitro and during antiviral therapy. Gastroenterol 132: 921–930.
60. Chevaliez S, Brillet R, Lazaro E, Hezode C, Pawlotsky JM (2007) Analysis of
ribavirin mutagenicity in human hepatitis C virus infection. J Virol 81:7732–7741.
61. Young KC, Lindsay KL, Lee KJ, Liu WC, He JW, et al. (2003) Identification ofa ribavirin-resistant NS5B mutation of hepatitis C virus during ribavirin
monotherapy. Hepatology 38: 869–878.
62. Kuiken C, Combet C, Bukh J, Shin-i T, Deleage G, et al. (2006) Acomprehensive system for consistent numbering of HCV sequences, proteins
and epitopes. Hepatology 44: 1355–1361.63. Jimenez-Hernandez N, Torres-Puente M, Bracho MA, Garcia-Robles I,
Ortega E, et al. (2007) Epidemic dynamics of two coexisting hepatitis C virussubtypes. J Gen Virol 88: 123–133.
64. Bracho MA, Garcıa-Robles I, Jimenez N, Torres-Puente M, Moya A, Gonzalez-
Candelas F (2004) Effect of oligonucleotide primers in determining viralvariability within hosts. Virol J 1: 13.
65. Thompson JD, Gibson TJ, Plewniak F, Jeanmougin F, Higgins DG (1997) TheCLUSTAL_X windows interface: flexible strategies for multiple sequence
alignment aided by quality analysis tools. Nucl Acids Res 25: 4876–4882.
66. Rozas J, Sanchez-DelBarrio JC, Messeguer X, Rozas R (2003) DnaSP, DNApolymorphism analyses by the coalescent and other methods. Bioinformatics 19:
2496–2497.67. Kumar S, Tamura K, Nei M (2004) MEGA3: Integrated Software for Molecular
Evolutionary Genetics Analysis and Sequence Alignment. Brief Bioinform 5:150–163.
68. Korber B, Myers G (1992) Signature pattern analysis: a method for assessing
viral sequence relatedness. AIDS Res Hum Retrovir 8: 1549–1560.69. Yang Z, Nielsen R, Goldman N, Pedersen AMK (2000) Codon-substitution
models for heterogeneous selection pressure at amino acid sites. Genetics 155:431–449.
70. Yang Z (1997) PAML: a program package for phylogenetic analysis by
maximum likelihood. CABIOS 13: 555–556.71. Akaike H (1974) A new look at the statistical model identification. IEEE Trans
Autom Control 19: 716–723.72. Yang Z, Wong WSW, Nielsen R (2005) Bayes empirical Bayes inference of
amino acid sites under positive selection. Mol Biol Evol 22: 1107–1118.73. Guindon S, Gascuel O (2003) A simple, fast, and accurate algorithm to estimate
large phylogenies by maximum likelihood. Syst Biol 52: 696–704.
74. Feinstone SM, Alter HJ, Dienes HP, Shimizu Y, Popper H, et al. (1981) Non-A,non-B hepatitis in chimpanzees and marmosets. J Infect Dis 144: 588–598.
75. Kato N, Hijikata M, Ootsuyama Y, Nakagawa M, Ohkoshi S, et al. (1990)Molecular cloning of the human hepatitis C virus genome from Japanese
patients with non-A, non-B hepatitis. Proc Natl Acad Sci U S A 87: 9524–9528.
Therapy and Variation in HCV
PLoS ONE | www.plosone.org 14 August 2008 | Volume 3 | Issue 8 | e3058
Related Documents


![2b versus pegylated interferon [alpha]-2a, both plus ribavirin ...](https://static.cupdf.com/doc/110x72/633c7961589e29510007d2fe/2b-versus-pegylated-interferon-alpha-2a-both-plus-ribavirin-.jpg)

