Genetic structure and genetic relatedness of a hatchery stock of Senegal sole (Solea senegalensis ) inferred by microsatellites Javier Porta a , J. Maria Porta a , Gonzalo Martı ´nez-Rodrı ´guez b , M. Carmen Alvarez a, * a University of Ma ´laga, Faculty of Sciences, Dept. of Genetics, Campus de Teatinos, 29071 Ma ´laga, Spain b Institute of Marine Sciences of Andalucia, C.S.I.C. Avda. Republica Saharaui, 2. 11510 Puerto Real, Ca ´diz, Spain Received 26 November 2004; received in revised form 13 May 2005; accepted 22 May 2005 Abstract Solea senegalensis is a fish species in an early stage of domestication. A commercial hatchery in southern Spain experienced a dramatic failure in spawning and embryo survival, after incorporation into the broodstock of fish reared in their hatchery. To assess the impact of management on the stock quality, a population genetics study was made of adult broodstock present at this hatchery in 2000. The broodstock was composed of a group of fish of wild origin and two more groups from F 1 progeny. A set of eight microsatellite loci was used to compare genetic variability among the three groups and to establish the relationships between pairs of individuals within each group. Individuals from F 1 origin showed a substantial reduction in genetic variability when compared to those from the wild. There was a greater than 50% decrease in the number of alleles per locus corrected by sample size and 16% and 26% reductions in H e values in the two F 1 groups, respectively. The degree of genetic relationship between individuals, evaluated by the relatedness estimator, rxy, and by graphical approaches, revealed a high proportion, almost 75%, of full-sibs and half-sibs in both F 1 groups, which might account for the reduction in overall variability. The high proportion of siblings also suggests a reproductive pattern in this stock in which few individuals breed successfully. This mating behaviour, along with factors inherent to selection and management systems, might be responsible for the negative effects on the reproductive capacity of the stock. D 2005 Elsevier B.V. All rights reserved. Keywords: Solea senegalensis ; Microsatellites; Genetic variability; Relatedness 1. Introduction The sole, Solea senegalensis , is a promising spe- cies for European fish farming, owing to its high economic value, fast growth and need for market diversification. Advances in hatchery and rearing 0044-8486/$ - see front matter D 2005 Elsevier B.V. All rights reserved. doi:10.1016/j.aquaculture.2005.05.019 * Corresponding author. Tel.: +34 952 131967; fax: +34 952 131955. E-mail address: [email protected] (M.C. Alvarez). Aquaculture 251 (2006) 46 – 55 www.elsevier.com/locate/aqua-online

Welcome message from author
This document is posted to help you gain knowledge. Please leave a comment to let me know what you think about it! Share it to your friends and learn new things together.
Transcript
www.elsevier.com/locate/aqua-online
Aquaculture 251
Genetic structure and genetic relatedness of a hatchery stock
of Senegal sole (Solea senegalensis) inferred by microsatellites
Javier Portaa, J. Maria Portaa, Gonzalo Martınez-Rodrıguezb, M. Carmen Alvareza,*
aUniversity of Malaga, Faculty of Sciences, Dept. of Genetics, Campus de Teatinos, 29071 Malaga, SpainbInstitute of Marine Sciences of Andalucia, C.S.I.C. Avda. Republica Saharaui, 2. 11510 Puerto Real, Cadiz, Spain
Received 26 November 2004; received in revised form 13 May 2005; accepted 22 May 2005
Abstract
Solea senegalensis is a fish species in an early stage of domestication. A commercial hatchery in southern Spain experienced
a dramatic failure in spawning and embryo survival, after incorporation into the broodstock of fish reared in their hatchery. To
assess the impact of management on the stock quality, a population genetics study was made of adult broodstock present at this
hatchery in 2000. The broodstock was composed of a group of fish of wild origin and two more groups from F1 progeny. A set
of eight microsatellite loci was used to compare genetic variability among the three groups and to establish the relationships
between pairs of individuals within each group.
Individuals from F1 origin showed a substantial reduction in genetic variability when compared to those from the wild.
There was a greater than 50% decrease in the number of alleles per locus corrected by sample size and 16% and 26% reductions
in He values in the two F1 groups, respectively. The degree of genetic relationship between individuals, evaluated by the
relatedness estimator, rxy, and by graphical approaches, revealed a high proportion, almost 75%, of full-sibs and half-sibs in
both F1 groups, which might account for the reduction in overall variability. The high proportion of siblings also suggests a
reproductive pattern in this stock in which few individuals breed successfully. This mating behaviour, along with factors
inherent to selection and management systems, might be responsible for the negative effects on the reproductive capacity of the
stock.
D 2005 Elsevier B.V. All rights reserved.
Keywords: Solea senegalensis; Microsatellites; Genetic variability; Relatedness
0044-8486/$ - see front matter D 2005 Elsevier B.V. All rights reserved.
doi:10.1016/j.aquaculture.2005.05.019
* Corresponding author. Tel.: +34 952 131967; fax: +34 952
131955.
E-mail address: [email protected] (M.C. Alvarez).
1. Introduction
The sole, Solea senegalensis, is a promising spe-
cies for European fish farming, owing to its high
economic value, fast growth and need for market
diversification. Advances in hatchery and rearing
(2006) 46–55
J. Porta et al. / Aquaculture 251 (2006) 46–55 47
techniques have been achieved for this species, al-
though many problems must be solved before repro-
ducible husbandry conditions can be established (Dinis
et al., 1999). At this early stage, guidelines based on
population genetics criteria are essential for founding
and maintaining cultivated stocks and to avoid genetic
erosion.
A domestication program for this species is under-
way in a commercial fish farm in southern Spain. The
broodstock was founded in 1990 with 250 fish (50%
males, 50% females approximately) from a wild popu-
lation captured in a reservoir close to the hatchery
facilities. Since then, the stock has been periodically
supplemented with fish from the same natural source,
except for the incorporation of fish from F1 hatchery
progeny in the late 1990s. The performance in repro-
duction was very successful in the initial period with
spawning rates of more than 15 million of eggs, but a
progressive failure in the number and the quality of
eggs occurred up to the point of null viability, being
more noticeable in recent years. These changes in
performance happened in the absence of any zootech-
nical modifications. According to records from the
company, the broodstock was composed by three
groups, one from wild origin and two others
corresponding to selected F1 progeny, incorporated
in 1998 and 1999, respectively. To assess the possible
impact of management in the deteriorated performance
of S. senegalensis in this hatchery, a population gene-
tics study was planned on the 2000-year broodstock,
consisting of an evaluation of genetic variability and
genetic relationships between individuals.
A frequent difficulty when assessing relationships
in cultured fish populations is the unavailability of
complete pedigree records, or the disappearance of a
large number of parents. However, appropriated esti-
mators of parenthood in the absence of pedigree in-
formation have been developed. These estimators
represent a measure of how many identical alleles
are shared by one pair of individuals. Among them,
the most common are from Li and Horvitz (1953),
Queller and Goodnight (1989), Mathieu et al. (1990)
and Lynch and Ritland (1999). The accuracy of these
estimators depends on the number of unlinked loci
used, the number of alleles per locus, the allele fre-
quencies distributions (Lynch and Ritland, 1999) and
the population composition (Van de Casteele et al.,
2001).
Among the molecular markers available in popu-
lation genetics, microsatellites emerged as those with
finest resolution for labelling of individuals and
populations, due to their high variability, abundance,
neutrality, codominance and unambiguously scoring
of alleles (Tautz, 1989; Weber and May, 1989).
Microsatellite genotyping has proved to be an effi-
cient tool for examining genetic structure (Wright
and Bentzen, 1995) and pedigree tracing of hatchery
populations, from various aquatic organisms (Gold-
stein and Schlotterer, 1999). Recently, 15 microsa-
tellites from Senegal sole were isolated (Porta and
Alvarez, 2004), and 8 of them were selected for this
study. These markers were used to compare genetic
variability among the three component groups; one
from wild origin and two others corresponding to
selected F1 progeny, in order to establish genetic
relatedness within each group in the absence of
pedigree information.
2. Materials and methods
2.1. Fish samples and DNA extraction
The population screened represented the year 2000
broodstock (S00) of Senegal sole (S. senegalensis),
belonging to a commercial fish farm in the southwest
coast of Spain. The broodstock consisted on 250
tagged adults and was made up by three groups: (a)
63 individuals from the wild (W) captured from the
same reservoir than founders, and located near the
company. Every year sexually mature individuals
(around 2 years of age) were captured from the res-
ervoir and used as breeders; and (b) two sets of
descendants produced in the own hatchery (F1), one
represented by 152 mature individuals born in 1996
and incorporated in 1998 (F198), and the other one by
35 mature individuals born in 1997 and incorporated
in 1999 (F199). Given that in hatchery conditions, the
mean life span of the breeders is 5 years, it is possible
that the parents of the F1 individuals were also present
in the S00 stock.
DNA was extracted from blood samples using
the saline precipitation method of Martınez et al.
(1988). Genomic DNA was resuspended in 1� TE
buffer and was kept at �20 8C prior to being
processed.
J. Porta et al. / Aquaculture 251 (2006) 46–5548
2.2. Genotyping
The genotype of each individual was obtained after
the amplification of 8 microsatellite markers, 7 of them
selected from a set of 15 developed for Senegal sole:
Sol5D, Sol9A, Sol13D, Sol19A, SolCA13, SolMII,
SolA (Porta and Alvarez, 2004) and one microsatellite
F13I8/4/7, adapted from Solea solea (Iyengar et al.,
2000). GenBank accession numbers are AF441388,
AF441389, AF441385, AF441387, AF441390,
AY426693, AY426692 and AF173849, respectively.
Polymerase chain reactions were performed in a 10
Al volume. The PCR reaction contained 100 ng (ap-
proximately) of genomic DNA, 1� reaction buffer, 0.2
mM dNTPs, 0.5 AM of each primer, 0.2 U of Taq DNA
polymerase and MgCl2 at different concentrations
according to each locus. All PCR reactions were con-
ducted in an Applied Biosystems 7200 thermal cycler.
The conditions for amplification were: 5 min at 94 8C,followed by 30 cycles of 30 s at 94 8C, 30 s at the an-
nealing temperature, variable according to each locus
(Porta and Alvarez, 2004), and 45 s at 72 8C, with a
final extension of 7 min at 72 8C. Denaturing buffer
(95% deionized formamide, 10 mM NaOH, 0.05%
xylene cyanol and 0.05% bromophenol blue) was
added to each reaction in proportion 1:1. The mixture
was heated for 10min at 95 8C andwas loaded in a 12%
polyacrylamide–8 M urea gel. Samples were run on
SE2001 manual sequencer for 2 h at 2000 V. The
resulting gel was analyzed by the Silver staining
method from Echt et al. (1996). Allele sizes were de-
termined using the original clone, a 100 bp molecular
weight marker and Poly-dA sonicated that produces a 1
bp ladder. The imageswere digitized using a scanner and
the genotypes were determined by visual inspection.
2.3. Data analysis
Hardy–Weinberg (H–W) equilibrium and linkage
disequilibrium were tested using of GENEPOP Ver.
3.3 (Raymond and Rousst, 1995). The exact P values
were determined by a Markov Chain method when the
allele number was higher than 4 (Guo and Thompson,
1992). Bonferroni adjustment of the P-values was
used to correct multiple tests (Rice, 1989). Parameters
used to obtain S.E.z0.01 were: dememorization num-
ber—1000, number of batches—400 and number of
iterations per batch—2000. A complete enumeration
method was performed when the number of alleles was
4 or less. The same software was also used to calculate
FIS values (Weir and Cockerham, 1984).
Levels of genetic variation per group and for the
whole stock were evaluated by the number of alleles
per locus (A), as well as by observed (Ho) and
expected (He) heterozygosities using FSTAT, Ver.
2.9.3 (Goudet, 2001; update from Goudet, 1995). As
the (A) value is highly dependent on sample size,
allelic richness (An), which is a measure of the num-
ber of alleles adjusted to the smallest common sample
size, was also calculated. FSTAT software applies the
rarefaction index from Hurlbert adapted to population
genetics by Mousadik and Petit (1996).
Variability comparisons between the three samples
(W, F198 and F199) were performed using different
tests: (a) ANOVA for differences in the mean number
of alleles per locus and allelic richness. (b) Kruskal–
Wallis analysis of variance on ranks to analyze the
differences in the mean values of observed and
expected heterozygosities. For all these tests the Sig-
maStat Ver. 2.03 software was used.
The amount of genetic divergence among the three
groups (W, F198 and F199) was calculated by the
genetic variance statistic FST (Wright, 1965). The
mean FST value for all loci was obtained in each
group using the above version of GENEPOP.
The degree of genetic relationship between indivi-
duals (represented by unrelated, half-sibs and full-sibs
assignments) was calculated by the rxy coefficient
(Queller and Goodnight, 1989), using the Kinship pro-
gram, Ver. 1.3.1 (Goodnight and Queller, 1999). This
test implicitly weights loci according to their contribu-
tion to the estimator. It has been extensively applied to
differentiate unrelated, half-sibs and full-sibs in several
fish (McDonald et al., 2004; Sekino et al., 2004) and
mammalian (Blouin et al., 1996) species.
To evaluate the bias of rxy values for unrelated,
half-sibs and full-sibs categories, the observed allele
frequencies of the W group were used to randomly
simulate 2500 pairs of individuals in each relatedness
category (Kinship, Ver. 1.3.1), assuming that the W
population complies with both Hardy–Weinberg and
linkage equilibrium. The mean rxy values from each
distribution were compared by the Student’s t-statis-
tics with those expected from rxy values of 0, 0.25
and 0.5, which correspond to unrelated, half-sibs and
full-sibs, respectively. Among these distributions the
J. Porta et al. / Aquaculture 251 (2006) 46–55 49
cutoff value for classification was determined as the
midpoint between the means of the two contiguous
distributions (Blouin et al., 1996). In this way, the
probability that a dyad from one category could be
misclassified as belonging to another category was
determined.
To verify that this estimator could be applied to a
real situation, a second set of rxy pairwise distribu-
tions based on the genotypes from W individuals was
obtained. For that, progeny genotypes were generated
from all possible matings between W parents, using
PROBMAXG version 1.2 (Danzmann, 1997). These
genotypes were classified according to their related-
ness and then used to generate distributions for each
category. The obtained rxy distributions were com-
pared with those obtained from allelic frequencies by
the Mann–Whitney U statistical test.
Once the suitability of these markers was tested,
the relationship between individuals was estimated.
To calculate the relatedness coefficient (rxy) between
all dyads from the three groups, the allelic frequencies
from the W group were adopted as representative of
those in the base population, and so were used to
weight the loci. This assumption is based on the fact
that at the time the F198 and F199 were born, the
broodstock was exclusively formed by fish from the
wild and supposedly from the same natural popula-
tion. Also, to test whether any individuals in W could
be parents of individuals in the F1 groups, exclusion
methods were used by means of the PROBMAX
software.
To discriminate further the family patterning within
the three groups, two graphical methods were chosen.
The UPGMA clustering was applied by using the
Populations software, Ver. 1.2.28 (Olivier Langella,
CNRS UPR9034). In this case, the distances matrix
used corresponded to 1� rxy for all pairwise compar-
isons. As a complementary approach, the factorial
correspondence analysis (AFC) was applied, using
Genetix Ver. 4.04 (Belkhir et al., 2003).
3. Results
3.1. Genetic variability and genetic structure
The S00 stock showed 121 alleles for the 8 loci,
ranging from 7 to 31 alleles per locus, with a mean
value of 15 and a mean allelic richness, An, of 9. The
mean observed and expected heterozygosity values
were 0.704 and 0.801, respectively. All loci showed
departures from H–W equilibrium proportions of gen-
otypes, and the FIS values revealed deficits of hetero-
zygosity for the Sol5D locus and an excess of
heterozygosity for the F13I8/4/7 locus.
Genetic variability data from the three sets of the
S00 stock (W, F198, and F199) are presented in Table
1. The W sample displayed the same number and
identical range of alleles than S00, but its An mean
value of 13 was significantly higher. The mean ob-
served and expected heterozygosity values were 0.80
and 0.84, respectively. From the eight microsatellites,
only SolA displayed significant departures from H–W
proportions (P b0.01) after Bonferroni adjustment. In
spite of that, this locus was not discarded for subse-
quent analysis, since the H–W estimation was not so
reliable due to the small size of the sample. Regarding
FIS values, only Sol5D and SolA showed deficit of
heterozygotes, but no evidence of null alleles was
observed after redesigning of the primers. No signi-
ficant linkage disequilibrium was detected among all
pairs of loci (P b0.01). The results obtained from the
W sample indicated that this set of microsatellites was
suitable for subsequent analysis of relatedness.
The situation in the genetic structure of the F1groups was quite different, showing mean An values
of 6 for both of them, which was half of that obtained
for W. The mean He values were of 0.7 for F198 and
0.62 for F199. Regarding the H–W equilibrium and
the FIS values, the F198 and F199 groups showed
significant deviations, with several loci showing defi-
ciency or excess of heterozygosity (Table 1).
Concerning linkage equilibrium, all loci-pairs in
F198 and 12 out of the total of 28 in F199 showed
significant disequilibrium values.
The statistics tests revealed significant differences
in the An and He values between W and both F1groups (P b0.01), whereas differences were not sig-
nificant between the two F1 groups (P N0.01).
Concerning Ho values, no significant differences
were revealed between the three groups.
The FST statistics was used to estimate genetic
variance between groups. In this way, the highest
FST value of 0.15 was obtained from F198 and F199
comparisons. Values of 0.086 and 0.07 were obtained
after comparing W with F198 and F199, respectively.
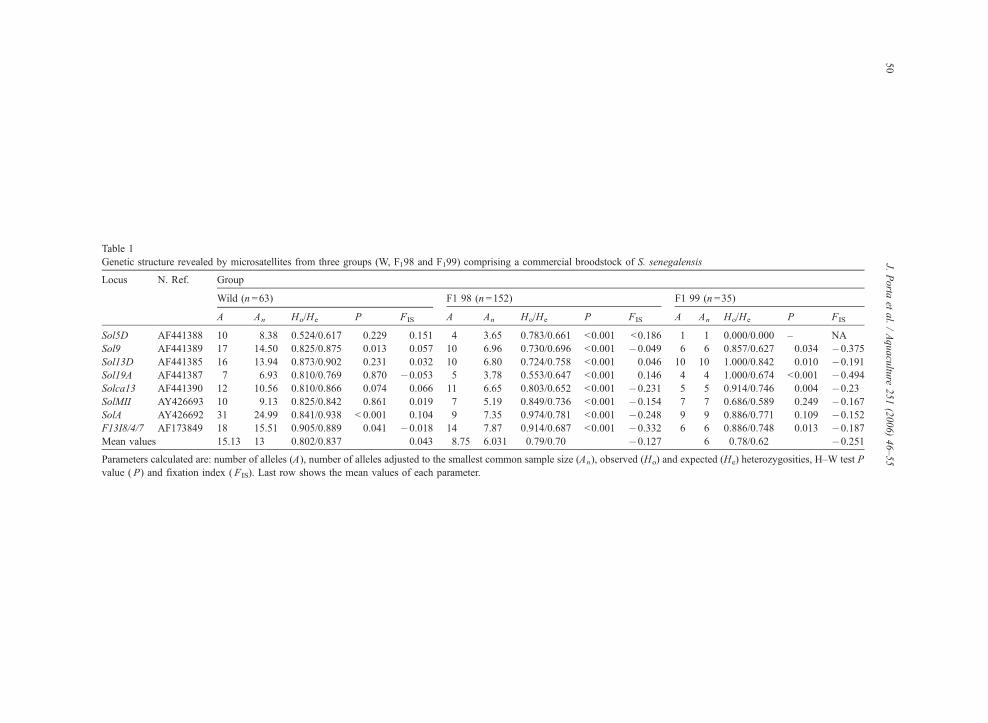
Table 1
Genetic structure revealed by microsatellites from three groups (W, F198 and F199) comprising a commercial broodstock of S. senegalensis
Locus N. Ref. Group
Wild (n =63) F1 98 (n =152) F1 99 (n =35)
A An Ho/He P FIS A An Ho/He P FIS A An Ho/He P FIS
Sol5D AF441388 10 8.38 0.524/0.617 0.229 0.151 4 3.65 0.783/0.661 b0.001 b0.186 1 1 0.000/0.000 – NA
Sol9 AF441389 17 14.50 0.825/0.875 0.013 0.057 10 6.96 0.730/0.696 b0.001 �0.049 6 6 0.857/0.627 0.034 �0.375
Sol13D AF441385 16 13.94 0.873/0.902 0.231 0.032 10 6.80 0.724/0.758 b0.001 0.046 10 10 1.000/0.842 0.010 �0.191
Sol19A AF441387 7 6.93 0.810/0.769 0.870 �0.053 5 3.78 0.553/0.647 b0.001 0.146 4 4 1.000/0.674 b0.001 �0.494
Solca13 AF441390 12 10.56 0.810/0.866 0.074 0.066 11 6.65 0.803/0.652 b0.001 �0.231 5 5 0.914/0.746 0.004 �0.23
SolMII AY426693 10 9.13 0.825/0.842 0.861 0.019 7 5.19 0.849/0.736 b0.001 �0.154 7 7 0.686/0.589 0.249 �0.167
SolA AY426692 31 24.99 0.841/0.938 b 0.001 0.104 9 7.35 0.974/0.781 b0.001 �0.248 9 9 0.886/0.771 0.109 �0.152
F13I8/4/7 AF173849 18 15.51 0.905/0.889 0.041 �0.018 14 7.87 0.914/0.687 b0.001 �0.332 6 6 0.886/0.748 0.013 �0.187
Mean values 15.13 13 0.802/0.837 0.043 8.75 6.031 0.79/0.70 �0.127 6 0.78/0.62 �0.251
Parameters calculated are: number of alleles (A), number of alleles adjusted to the smallest common sample size (An), observed (Ho) and expected (He) heterozygosities, H–W test P
value ( P) and fixation index ( FIS). Last row shows the mean values of each parameter.
J.Porta
etal./Aquacultu
re251(2006)46–55
50
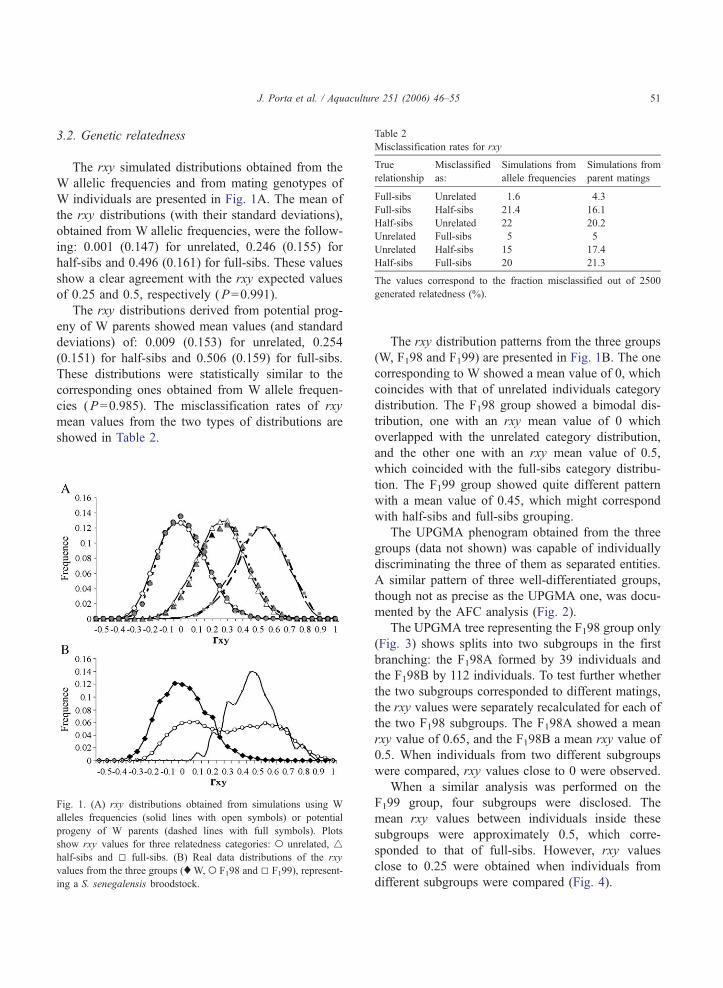
Table 2
Misclassification rates for rxy
True
relationship
Misclassified
as:
Simulations from
allele frequencies
Simulations from
parent matings
Full-sibs Unrelated 1.6 4.3
Full-sibs Half-sibs 21.4 16.1
Half-sibs Unrelated 22 20.2
Unrelated Full-sibs 5 5
Unrelated Half-sibs 15 17.4
Half-sibs Full-sibs 20 21.3
The values correspond to the fraction misclassified out of 2500
generated relatedness (%).
J. Porta et al. / Aquaculture 251 (2006) 46–55 51
3.2. Genetic relatedness
The rxy simulated distributions obtained from the
W allelic frequencies and from mating genotypes of
W individuals are presented in Fig. 1A. The mean of
the rxy distributions (with their standard deviations),
obtained from W allelic frequencies, were the follow-
ing: 0.001 (0.147) for unrelated, 0.246 (0.155) for
half-sibs and 0.496 (0.161) for full-sibs. These values
show a clear agreement with the rxy expected values
of 0.25 and 0.5, respectively (P=0.991).
The rxy distributions derived from potential prog-
eny of W parents showed mean values (and standard
deviations) of: 0.009 (0.153) for unrelated, 0.254
(0.151) for half-sibs and 0.506 (0.159) for full-sibs.
These distributions were statistically similar to the
corresponding ones obtained from W allele frequen-
cies (P=0.985). The misclassification rates of rxy
mean values from the two types of distributions are
showed in Table 2.
Fig. 1. (A) rxy distributions obtained from simulations using W
alleles frequencies (solid lines with open symbols) or potential
progeny of W parents (dashed lines with full symbols). Plots
show rxy values for three relatedness categories: o unrelated, 4half-sibs and 5 full-sibs. (B) Real data distributions of the rxy
values from the three groups (x W, o F198 and 5 F199), represent-
ing a S. senegalensis broodstock.
The rxy distribution patterns from the three groups
(W, F198 and F199) are presented in Fig. 1B. The one
corresponding to W showed a mean value of 0, which
coincides with that of unrelated individuals category
distribution. The F198 group showed a bimodal dis-
tribution, one with an rxy mean value of 0 which
overlapped with the unrelated category distribution,
and the other one with an rxy mean value of 0.5,
which coincided with the full-sibs category distribu-
tion. The F199 group showed quite different pattern
with a mean value of 0.45, which might correspond
with half-sibs and full-sibs grouping.
The UPGMA phenogram obtained from the three
groups (data not shown) was capable of individually
discriminating the three of them as separated entities.
A similar pattern of three well-differentiated groups,
though not as precise as the UPGMA one, was docu-
mented by the AFC analysis (Fig. 2).
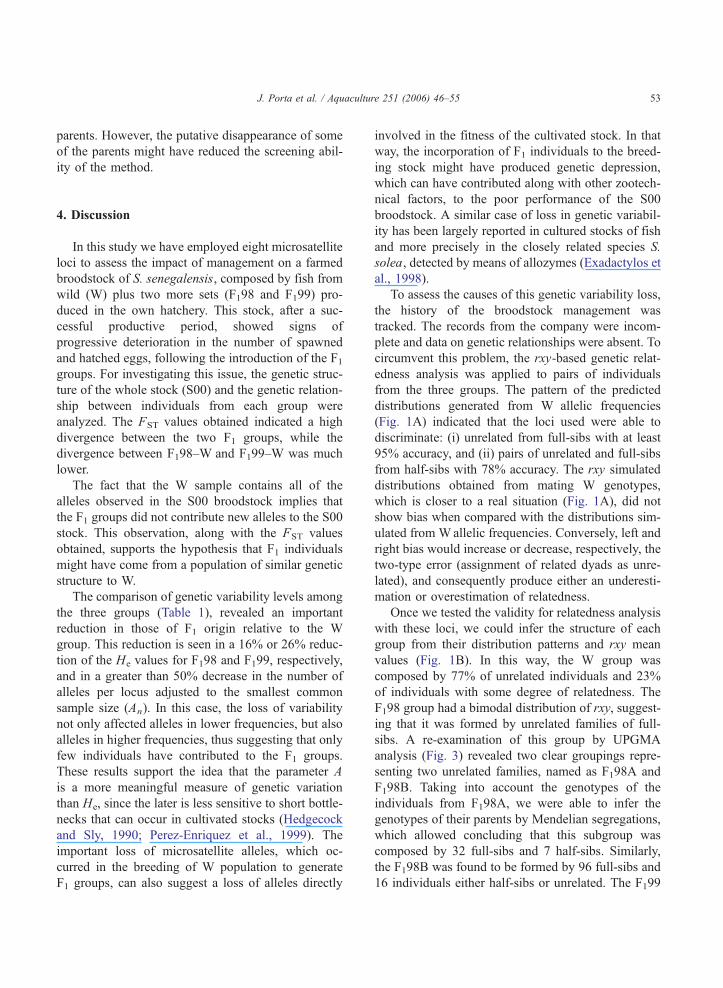
The UPGMA tree representing the F198 group only
(Fig. 3) shows splits into two subgroups in the first
branching: the F198A formed by 39 individuals and
the F198B by 112 individuals. To test further whether
the two subgroups corresponded to different matings,
the rxy values were separately recalculated for each of
the two F198 subgroups. The F198A showed a mean
rxy value of 0.65, and the F198B a mean rxy value of
0.5. When individuals from two different subgroups
were compared, rxy values close to 0 were observed.
When a similar analysis was performed on the
F199 group, four subgroups were disclosed. The
mean rxy values between individuals inside these
subgroups were approximately 0.5, which corre-
sponded to that of full-sibs. However, rxy values
close to 0.25 were obtained when individuals from
different subgroups were compared (Fig. 4).
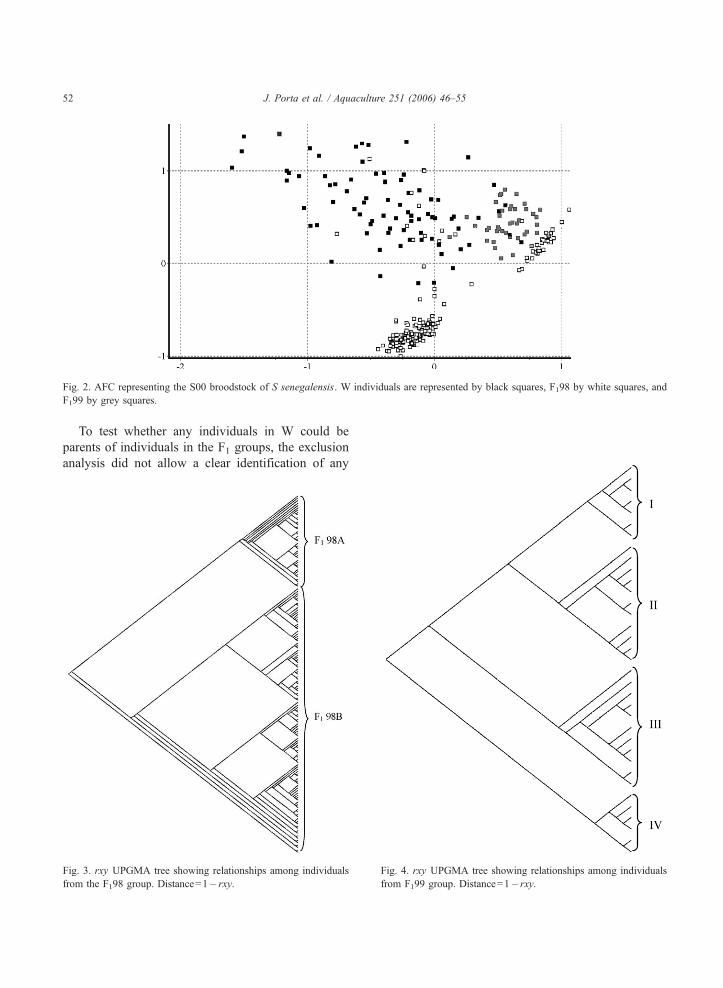
Fig. 2. AFC representing the S00 broodstock of S senegalensis. W individuals are represented by black squares, F198 by white squares, and
F199 by grey squares.
J. Porta et al. / Aquaculture 251 (2006) 46–5552
To test whether any individuals in W could be
parents of individuals in the F1 groups, the exclusion
analysis did not allow a clear identification of any
Fig. 3. rxy UPGMA tree showing relationships among individuals
from the F198 group. Distance=1� rxy.
Fig. 4. rxy UPGMA tree showing relationships among individuals
from F199 group. Distance=1� rxy.
J. Porta et al. / Aquaculture 251 (2006) 46–55 53
parents. However, the putative disappearance of some
of the parents might have reduced the screening abil-
ity of the method.
4. Discussion
In this study we have employed eight microsatellite
loci to assess the impact of management on a farmed
broodstock of S. senegalensis, composed by fish from
wild (W) plus two more sets (F198 and F199) pro-
duced in the own hatchery. This stock, after a suc-
cessful productive period, showed signs of
progressive deterioration in the number of spawned
and hatched eggs, following the introduction of the F1groups. For investigating this issue, the genetic struc-
ture of the whole stock (S00) and the genetic relation-
ship between individuals from each group were
analyzed. The FST values obtained indicated a high
divergence between the two F1 groups, while the
divergence between F198–W and F199–W was much
lower.
The fact that the W sample contains all of the
alleles observed in the S00 broodstock implies that
the F1 groups did not contribute new alleles to the S00
stock. This observation, along with the FST values
obtained, supports the hypothesis that F1 individuals
might have come from a population of similar genetic
structure to W.
The comparison of genetic variability levels among
the three groups (Table 1), revealed an important
reduction in those of F1 origin relative to the W
group. This reduction is seen in a 16% or 26% reduc-
tion of the He values for F198 and F199, respectively,
and in a greater than 50% decrease in the number of
alleles per locus adjusted to the smallest common
sample size (An). In this case, the loss of variability
not only affected alleles in lower frequencies, but also
alleles in higher frequencies, thus suggesting that only
few individuals have contributed to the F1 groups.
These results support the idea that the parameter A
is a more meaningful measure of genetic variation
than He, since the later is less sensitive to short bottle-
necks that can occur in cultivated stocks (Hedgecock
and Sly, 1990; Perez-Enriquez et al., 1999). The
important loss of microsatellite alleles, which oc-
curred in the breeding of W population to generate
F1 groups, can also suggest a loss of alleles directly
involved in the fitness of the cultivated stock. In that
way, the incorporation of F1 individuals to the breed-
ing stock might have produced genetic depression,
which can have contributed along with other zootech-
nical factors, to the poor performance of the S00
broodstock. A similar case of loss in genetic variabil-
ity has been largely reported in cultured stocks of fish
and more precisely in the closely related species S.
solea, detected by means of allozymes (Exadactylos et
al., 1998).
To assess the causes of this genetic variability loss,
the history of the broodstock management was
tracked. The records from the company were incom-
plete and data on genetic relationships were absent. To
circumvent this problem, the rxy-based genetic relat-
edness analysis was applied to pairs of individuals
from the three groups. The pattern of the predicted
distributions generated from W allelic frequencies
(Fig. 1A) indicated that the loci used were able to
discriminate: (i) unrelated from full-sibs with at least
95% accuracy, and (ii) pairs of unrelated and full-sibs
from half-sibs with 78% accuracy. The rxy simulated
distributions obtained from mating W genotypes,
which is closer to a real situation (Fig. 1A), did not
show bias when compared with the distributions sim-
ulated from Wallelic frequencies. Conversely, left and
right bias would increase or decrease, respectively, the
two-type error (assignment of related dyads as unre-
lated), and consequently produce either an underesti-
mation or overestimation of relatedness.
Once we tested the validity for relatedness analysis
with these loci, we could infer the structure of each
group from their distribution patterns and rxy mean
values (Fig. 1B). In this way, the W group was
composed by 77% of unrelated individuals and 23%
of individuals with some degree of relatedness. The
F198 group had a bimodal distribution of rxy, suggest-
ing that it was formed by unrelated families of full-
sibs. A re-examination of this group by UPGMA
analysis (Fig. 3) revealed two clear groupings repre-
senting two unrelated families, named as F198A and
F198B. Taking into account the genotypes of the
individuals from F198A, we were able to infer the
genotypes of their parents by Mendelian segregations,
which allowed concluding that this subgroup was
composed by 32 full-sibs and 7 half-sibs. Similarly,
the F198B was found to be formed by 96 full-sibs and
16 individuals either half-sibs or unrelated. The F199
J. Porta et al. / Aquaculture 251 (2006) 46–5554
group revealed a strong family structure, formed by
full-sibs and half-sibs, that was resolved into four
family groups with the UPGMA approach (Fig. 4),
but contrary to the F198 group, no more precise
relationships could be established.
The above data revealed that the S00 was com-
posed by around 75% of siblings, which could partly
account to the decrease in genetic variability in the
whole stock, and consequently might have contributed
along with other management factors to the poor
performance shown after the incorporation of F1 indi-
viduals. The fact that a high proportion of individuals
from F1 origin was closely related allowed speculating
that in the breeding pattern in captivity of S. senegal-
esis, an unbalanced contribution of each parent had
occurred. Actually, the participation of few parents
might explain the loss in one generation, not only of
rare, but also of more frequent alleles. This reproduc-
tive behaviour added to other factors, such as high
fecundity (more than a million eggs per female in one
season), differential selection pressure among fami-
lies, management effects and the selection of breeders
from the progeny, can represent a set of circumstances
responsible for the drastic reduction in the genetic
variability of the two studied F1 groups in just one
generation.
In hatchery strains, it is generally recommended
that unrelated fish from wild should be used as brood-
stock, though this might be difficult due to econom-
ical constraints. Instead a subset of hatchery-based
fish is normally used to complete the broodstock
size, with the advantage of being already adapted to
domestication conditions. However, this practice
might threaten the genetic variability of the brood-
stock when the mating behaviour of the species is
unknown (Norris et al., 1999), and therefore is not
possible to predict the pedigree structure of next
generation. In those cases maximal retention of gene-
tic variability from captive populations can be
achieved through monitoring pedigree structure of
descendants and suitably selecting reproducers
among unrelated descendants (Norris et al., 2000).
For knowledge of genetic structure and relatedness,
microsatellites have proved in some cases to be ex-
cellent tools, as exemplified in this study.
The data generated in this study provide useful
information on the population structure, on the effects
of the management system used in this hatchery and
on the reproductive pattern of this stock. This infor-
mation can be applied to design suitable management
guidelines for this stock or others from the same or
related species.
Acknowledgements
This project was funded by the national project
FD97-2239-CO2-01. We thank Dr. M.A. Toro and
Dr. J. Fernandez for comments on the manuscript.
References
Blouin, M.S., Parsons, M., Lacaille, V., Lotz, S., 1996. Use of
microsatellite loci to classify individuals by relatedness. Molec-
ular Ecology 5, 393–401.
Belkhir, K., Borsa, P., Chikhi, L., Raufaste, N., Bonhomme, F.,
2003. GENETIX 4.04, logiciel sous Windows TM pour la
genetique des populations. Laboratoire Genome, Populations,
Interactions, CNRS UMR 5000, Universite de Montpellier II,
Montpellier, France (in French).
Danzmann, R.G., 1997. Probmax: a computer program for assign-
ing unknown parentage in pedigree analysis from known geno-
typic pools of parents and progeny. Journal of Heredity 88, 33.
Dinis, M.T., Ribeiro, L., Soares, F., Sarasquete, C., 1999. A review
on the cultivation potential of Solea senegalensis in Spain and
in Portugal. Aquaculture 176, 27–38.
Echt, C.S., May-Marquardt, P., Hseih, M., Zahorchak, R., 1996.
Characterization of microsatellite markers in eastern white pine.
Genome 39, 1102–1108.
Exadactylos, A., Geffen, A.J., Thorpe, J.P., 1998. Population struc-
ture of the Dover sole, Solea solea L. in a background of high
gene flow. Journal of Sea Research 40, 117–129.
Goldstein, D.B., Schlotterer, C., 1999. Microsatellites: Evolution
and Application. Oxford Univ. Press, New York.
Goodnight, K.F., Queller, D.C., 1999. Computer software for
performing likelihood tests of pedigree relationship using ge-
netic markers. Molecular Ecology 8, 1231–1234.
Goudet, J., 1995. FSTAT (vers. 1.2): a computer program to calcu-
late F-statistics. Journal of Heredity 86, 485–486.
Goudet, J., 2001. FSTAT, a program to estimate and test gene
diversities and fixation indices (Version 2.9.3). http://www.
unil.ch/izea/softwares/fstat.html.
Guo, S.W., Thompson, E.A., 1992. Performing exact test of
Hardy–Weinberg proportion for multiple alleles. Biometrics
48, 361–372.
Hedgecock, D., Sly, F., 1990. Genetic drift and effective population
sizes of hatchery-propagated stocks of the Pacific oyster, Cras-
sostrea gigas. Aquaculture 88, 21–38.
Iyengar, A., Piyapattanakorn, S., Stone, D.M., Heipel, D.A.,
Howell, B.R., Baynes, S.M., Maclean, N., 2000. Identification
of microsatellite repeats in Turbot (Scophthalmus maximus) and
J. Porta et al. / Aquaculture 251 (2006) 46–55 55
Dover sole (Solea solea) using RAPD based technique; charac-
terization of microsatellite markers in Dover sole. Marine Bio-
technology 2, 49–56.
Li, C.C., Horvitz, D.G., 1953. Some methods of estimating the
inbreeding coefficient. American Journal of Human Genetics
5, 107–117.
Lynch, M., Ritland, K., 1999. Estimation of the pairwise relatedness
with molecular markers. Genetics 152, 1753–1766.
Martınez, G., Shaw, E.M., Carrillo, M., Zanuy, S., 1988. A protein
salting-out method applied in genomic DNA isolation from fish
whole blood. BioTechniques 24, 238–239.
Mathieu, E., Autem, M., Roux, M., Bonhomme, F., 1990. Epreuve
de validation dans l’analyse de structures genetiques mulitvar-
iees: comment tester l’equilibre panmictique? Revue de Statis-
tique Appliquee 38, 47–66 (in French).
McDonald, G.J., Danzmann, R.G., Ferguson, M.M., 2004. Relat-
edness determination in the absence of pedigree information in
three cultured strains of rainbow trout (Oncorhynchus mykiss).
Aquaculture 233, 65–78.
Mousadik, A., Petit, R.J., 1996. High level of genetic differentiation
for allelic richness among populations of the argan tree [Argania
spinosa (L.) Skeels] endemic to Morocco. Theoretical and
Applied Genetics 92, 832–839.
Norris, A.T., Bradley, D.G., Cunnigham, E.P., 1999. Microsa-
tellite genetic variation between and within farmed and wild
Atlantic salmon (Salmo salar) populations. Aquaculture 180,
247–264.
Norris, A.T., Bradley, D.G., Cunnigham, E.P., 2000. Parentage and
relatedness determination in farmed Atlantic salmon (Salmo
salar) using microsatellite markers. Aquaculture 182, 73–83.
Perez-Enriquez, R., Takagi, M., Taniguchi, N., 1999. Genetic var-
iability and pedigree tracing of a hatchery-reared stock of red
sea bream (Pagrus major) used for stock enhancement, based
on microsatellite DNA markers. Aquaculture 173, 413–423.
Porta, J., Alvarez, M.C., 2004. Development and characterization of
microsatellite from Senegal sole (Solea senegalensis). Molecu-
lar Ecology Notes 4, 277–279.
Queller, D.C., Goodnight, K.F., 1989. Estimating relatedness using
genetics markers. Evolution 43, 258–275.
Raymond, M., Rousst, F., 1995. GENEPOP (version 1.2): popula-
tion genetic software for exact test and ecumenicism. Journal of
Heredity 86, 248–249.
Rice, W.R., 1989. Analyzing tables of statistical tests. Evolution 43,
223–225.
Sekino, M., Sugaya, T., Hara, M., Taniguchi, N., 2004. Microsa-
tellite relatedness estimator used for minimal kinship selection
Paralichthys olivaceus. Aquaculture 233, 163–172.
Tautz, D., 1989. Hypervariability of simple sequences as a general
source for polymorphic DNA markers. Nucleic Acids Research
17, 6463–6471.
Van de Casteele, C.T., Galbusera, P., Matthysen, E., 2001. A
comparison of microsatellite-based pairwise relatedness estima-
tors. Molecular Ecology 10, 1539–1549.
Weber, J.L., May, P.E., 1989. Abundant class of human DNA
polymorphism which can be typed using the polymerase chain
reaction. American Journal of Human Genetics 44, 388–396.
Weir, B.S., Cockerham, C.C., 1984. Estimating F-statistics for the
analysis of population structure. Evolution 38, 1358–1370.
Wright, S., 1965. The interpretation of population structure by F-
statistics with special regards to systems of mating. Evolution
19, 395–420.
Wright, J.M., Bentzen, P., 1995. Microsatellites: genetic markers for
the future. In: Carvalho, G.R., Pitcher, T.J. (Eds.), Molecular
Genetics in Fisheries. Chapman & Hall, London, pp. 117–121.
Related Documents