Garris et al. Page 1 Genetic structure and diversity in Oryza sativa L. Amanda J. Garris *1 , Thomas H. Tai †2 , Jason Coburn * , Steve Kresovich * , and Susan McCouch * * Plant Breeding Dept, Cornell University, Ithaca, NY 14853-1901 † USDA-ARS Dale Bumpers National Rice Research Center, Stuttgart, AR 72160 1 Present address: USDA-ARS Plant Genetic Resources Unit, Geneva, NY 14456 2 Present address: USDA-ARS Crops Pathology and Genetics Research, Agronomy and Range Science, University of California, Davis, CA 95616 Genetics: Published Articles Ahead of Print, published on January 16, 2005 as 10.1534/genetics.104.035642

Welcome message from author
This document is posted to help you gain knowledge. Please leave a comment to let me know what you think about it! Share it to your friends and learn new things together.
Transcript
Garris et al. Page 1
Genetic structure and diversity in Oryza sativa L.
Amanda J. Garris*1, Thomas H. Tai†2 , Jason Coburn*, Steve Kresovich*, and Susan McCouch*
*Plant Breeding Dept, Cornell University, Ithaca, NY 14853-1901
†USDA-ARS Dale Bumpers National Rice Research Center, Stuttgart, AR 72160
1 Present address: USDA-ARS Plant Genetic Resources Unit, Geneva, NY 14456
2 Present address: USDA-ARS Crops Pathology and Genetics Research, Agronomy and Range
Science, University of California, Davis, CA 95616
Genetics: Published Articles Ahead of Print, published on January 16, 2005 as 10.1534/genetics.104.035642
Garris et al. Page 2
Running head: Genetic structure and diversity
Keywords: rice, population genetics, diversity
Corresponding author: Susan McCouch 162 Emerson Hall Cornell University, Ithaca, NY 14853 Email: [email protected] Phone: 1(607) 255-0420 Fax: 1(607) 255-6683
Garris et al. Page 3
ABSTRACT
The population structure of domesticated species is influenced by the natural history of the
populations of pre-domesticated ancestors, as well as by the breeding system and complexity of
the breeding practices exercised by humans. Within Oryza sativa, there is an ancient and well-
established divergence between the two major sub-species, indica and japonica, but finer levels
of genetic structure are suggested by the breeding history. In this study, a sample of 234
accessions of rice was genotyped at 169 nuclear SSRs and two chloroplast loci. The data were
analyzed to resolve the genetic structure and to interpret the evolutionary relationships between
groups. Five distinct groups were detected, corresponding to indica, aus, aromatic, temperate
japonica and tropical japonica rices. Nuclear and chloroplast data support a closer evolutionary
relationship between the indica and aus, and between the tropical japonica, temperate japonica
and aromatic groups. Group differences can be explained through contrasting demographic
histories. With the availability of rice genome sequence, coupled with a large collection of
publicly available genetic resources, it is of interest to develop a population-based framework for
the molecular analysis of diversity in O. sativa.

Garris et al. Page 4
INTRODUCTION
Asian cultivated rice (Oryza sativa L.) holds a unique position among domesticated crop species
in that it is both a critical food staple and the first fully sequenced crop genome. Rice is
consumed as a grain almost exclusively by humans, supplying 20% of daily calories for the
world population (World Rice Statistics, http://www.irri.org; FAOSTAT, http://apps.fao.org). As
a model organism with a fully sequenced genome, rice affords unique opportunities to use
genomic approaches to study its domestication, adaptive diversity, and the history of crop
improvement.
Archeological evidence supports a similar time of domestication for rice, wheat (Triticum
aestivum) and maize (Zea mays ssp mays), 5 - 10,000 years ago, but the evolutionary histories of
these cereals differ in several significant ways (PIPERNO and FLANNERY 2001; SHARMA and
MANDA 1980; SOLHEIM 1972; ZOHARY and HOPF 2000). Recent studies tracing the molecular
evolution of maize offer several points of comparison that help illuminate the genetic history of
rice. Unlike maize, rice is predominantly autogamous and hence, gene flow is restricted. As a
result, geographically or ecologically distinct groups of rice are expected to show greater genetic
differentiation than would be the case in an outcrossing species. Because of fewer opportunities
for cross-pollination, the structure of landraces in rice and maize is also predicted to be
fundamentally different. A greater proportion of diversity is expected to reside in differences
between homozygous lines within a heterogenous landrace in rice (OLUFOWOTE et al. 1997)
compared to the distribution of diversity among heterozygous individuals within a landrace of
maize (LABATE et al. 2003). In addition, evidence suggests that the two primary sub-species of
rice, indica and japonica, are the products of separate domestication events from the ancestral
Garris et al. Page 5
species, Oryza rufipogon, a hypothesis initially based on studies of biochemical traits (SECOND
1982) and hybrid sterility (KATO et al. 1928), and subsequently supported by molecular analyses
(CHENG et al. 2003; DOI et al. 2002). This is in contrast to the single domestication event that led
to the evolution of modern maize (MATSUOKA et al. 2002).
At all levels of analysis, the differences between the indica and japonica sub-species are very
apparent. Differences between non-sticky (indica) and sticky (japonica) rices are documented in
Chinese literature as early as 100 AD (MATSUO 1997). In eco-geographical terms, indica are
primarily known as lowland rices that are grown throughout tropical Asia, while japonica are
typically found in temperate East Asia, upland areas of Southeast Asia and high elevations in
South Asia. The traits that have been used to classify indica and japonica have included grain
shape, phenol reaction, sensitivity to potassium chlorate, leaf color and apiculus hair length,
though the spectra of variation for any of these individual traits overlap in the two subspecies
(OKA 1988).
Using RFLPs, the indica-japonica division was very clear (NAKANO et al. 1992; WANG and
TANKSLEY 1989; ZHANG et al. 1992) but additional population structure consisting of the six
varietal groups indica, japonica, aus, aromatic, rayada, and ashina was discerned using 15
isozyme loci (GLASZMANN 1987). The aus, rayada, and ashina are minor groups that have
generally been considered to be ssp. indica ecotypes, and all have a comparatively small
geographic distribution along the Himalayan foothills. The drought-tolerant, early maturing aus
rices are grown in Bangladesh during the summer season from March to June. Rayada and
ashina are floating rices of Bangladesh and India, respectively. Aromatic rices such as basmati

Garris et al. Page 6
from Pakistan, Nepal, and India and sadri from Iran have a distinctive popcorn-like aroma and
are highly prized for their quality. Because there has been no reliable way to distinguish ecotypes
based on phenotypic evaluation, and because information about the varietal groupings is rarely
available from genetic resource collections, a genetically-based identification of groups is
required to fully utilize these resources.
The purpose of this study is 1) to establish a population genetics framework for the evaluation of
rice by characterizing the intraspecific divergence within a set of 234 rice accessions using
simple sequence repeats (SSR) and chloroplast sequence, and 2) to address the evolutionary
relationships among groups within the species. Intraspecific classification of rice has been of
importance to rice geneticists and breeders, but with the advent of population genetics
approaches, it is now feasible to examine the genetic basis of domestication, adaptation, plant
development and agricultural performance. Simple sequence repeat (SSR) loci are particularly
useful for the study of population structure and demographic history of domesticated species
because their high level of allelic diversity facilitates the detection of the fine structure of
diversity more efficiently than an equal number of RFLP, AFLP or SNP loci. The specific goals
of this study are to characterize population structure within Oryza sativa, to examine the
differences between, and relationships among, genetically-defined groups and to analyze aspects
of demographic history that may explain them. The resulting framework will be used to pose
questions about the origin and diversity of genepools that exist within cultivated Asian rice and
to lay the foundation for characterizing the genes that distinguish them.

Garris et al. Page 7
MATERIALS AND METHODS
Plant material
We sampled 234 rice accessions representing the geographic range of Oryza sativa. The sample
included accessions collected in Asia (187), the Americas (27), Africa (14), Europe (3), and
Oceania (2). Information about the accessions used (accession name, accession number, seed
source, country of origin, membership in one of the five model-based populations, accession
number cited in Supplemental Figure S1, and choloroplast haplotype) is listed in supplemental
Table S1 at http://www.genetics.org/supplemental/. Aroma of rice leaves was evaluated using the
protocol of PINSON (1994), modified to include warming the samples in a 67ºC water bath for 10
minutes prior to analysis.
Genomic DNA extraction and SSR genotyping
DNA was extracted using a modified potassium acetate-SDS protocol (DELLAPORTA et al. 1983).
The 169 nuclear SSRs employed to analyze population structure is published in supplemental
Table S2 as supporting information on http://www.genetics.org/supplemental/ (CHEN et al. 1997;
COBURN et al. 2002; TEMNYKH et al. 2001; TEMNYKH et al. 2000). PCR was performed as in
Coburn et al. (2002) except that mixtures contained 20 ng template DNA, 4 pmols of forward
and reverse primers, and 1 unit of Taq polymerase. Pooled PCR products, diluted to equalize
signal strength, were size separated by capillary electrophoresis using an ABI Prism 3700 DNA
Analyzer (Applied Biosystems, Foster City, CA). SSRs were analyzed with GenScan 3.1.2
software (Applied Biosystems) and scored with Genotyper 2.5 software (Applied Biosystems).
Genotype data for all accessions is available at
http://ricelab.plbr.cornell.edu/publications/2004/garris/Genotype_Data/.
Garris et al. Page 8
Chloroplast sequencing
The plastid subtype-identity (PS-ID) sequence, which captures linker sequences between plastid
genes rp116 and rp114, was amplified as reported by (NAKAMURA et al. 1998). A second
fragment, ORF100, is known to harbor length variation in rice, and was amplified as in
Nakamura (1998), except that a new forward primer was designed to amplify a smaller fragment
(5’CAACCCACCCCATAAAATTG 3’). 10 µl of quantified PCR product was treated with 10
units Exonuclease I and two units shrimp alkaline phosphatase and incubated at 37ºC for 15
minutes followed by 80ºC for 15 minutes. Single pass sequencing was performed by automated
sequencing using an ABI Prism 3700 DNA Analyzer (Applied Biosystems, Foster City, CA) at
the Cornell BioResource Center (Ithaca, NY). Direct sequencing of PCR products resulted in a
homozygous sequence. Sequences were aligned using Sequencher 4.0.5 (Gene Codes, Inc., Ann
Arbor, MI) for base calling and CLUSTAL W (THOMPSON et al. 1994) with manual quality
control for insertion/deletions. The ends of fragments were trimmed to remove low quality
sequence.
Statistical Analysis
Genetic distance was calculated using the C.S. Chord distance (CAVALLI-SFORZA and EDWARDS
1967) because it has been shown by analysis of simulations to generate correct tree topologies
regardless of the microsatellite mutation model (TAKEZAKI and NEI 1996). Phylogenetic
reconstruction was based on the neighbor-joining method implemented in PowerMarker version
2.7 (LIU and MUSE 2004; http://www.powermarker.net) In addition, the model-based program
STRUCTURE (FALUSH et al. 2003; PRITCHARD et al. 2000) was used to infer population
Garris et al. Page 9
structure using a burn-in of 10,000, run length of 100,000, and a model allowing for admixture
and correlated allele frequencies. Five independent runs yielded consistent results. Inferred
ancestry for each accession and the key for identifying the accessions shown in the Neighbor-
Joining tree is available as supporting information on the Genetics website as supporting Table
S1 and supporting Figure S1. The graphical display of the STRUCTURE results was generated
using Distruct software (ROSENBERG 2002, http://www.cmb.usc.edu/~noahr/distruct.html).
PowerMarker was used to calculate the average number of alleles, gene diversity, and
Polymorphism Information Content (PIC) values. FST, the correlation of alleles within
subpopulations, was calculated using an AMOVA approach in Arlequin V2.000 (SCHNEIDER and
EXCOFFIER 1999; WEIR 1996). In order to utilize analysis approaches which are based on the
Stepwise Mutation Model (SMM), a set of 60 SSR loci that behaved in a stepwise manner (fewer
than 10% of alleles were at non-stepwise intervals) was identified (as indicated in the list of
SSRs published supplemental Table S2 which is published as supporting information on the
Genetics web site). This set of loci was used for analysis of directional evolution and population
bottlenecks. Average standardized allele sizes for analysis of directional evolution were
calculated as in VIGOUROUX et al. (2003). Ascertainment bias was assessed by comparing the
difference in allele lengths between ssp. indica and japonica when the markers were originally
derived from cv. IR36 (indica, 67 markers), or cv. Nipponbare (japonica, 100 markers).
Ascertainment bias was non-significant (t = 0.24, p-value = 0.83).
The program BOTTLENECK (CORNUET and LUIKART 1996) was used to test each group for
deviation from mutation-drift equilibrium under the Stepwise Mutation Model (SMM). This
program conducts test for recent (within the past 2Ne to 4Ne generations) population bottlenecks
Garris et al. Page 10
that severely reduce effective population size (Ne) and produce an excess in heterozygosity.
Significance was determined by the sign, standardized differences and Wilcoxon tests.
RESULTS
Genetic structure in rice
Analysis of genetic distance and population structure provided evidence for significant
population structure in rice. Analysis of these data, using STRUCTURE, produced the highest
log likelihood scores when the number of populations was set at five, which was consistent with
clustering based on genetic distance. Most accessions were classified into one of the five groups,
which corresponded to indica (79), aus (20), aromatic (19), temperate japonica (45), and
tropical japonica (44) (Figure 1). In addition to the accessions that were clearly assigned to a
single population, where greater than 80% of their inferred ancestry derived from one of the
model-based populations, 24 accessions (10%) in the sample were categorized as having
admixed ancestry (Figure 2). While the majority of these were identified as admixture between
temperate and tropical japonica groups, other admixture combinations were present as well
(Figure 2; Supplemental Table S1).
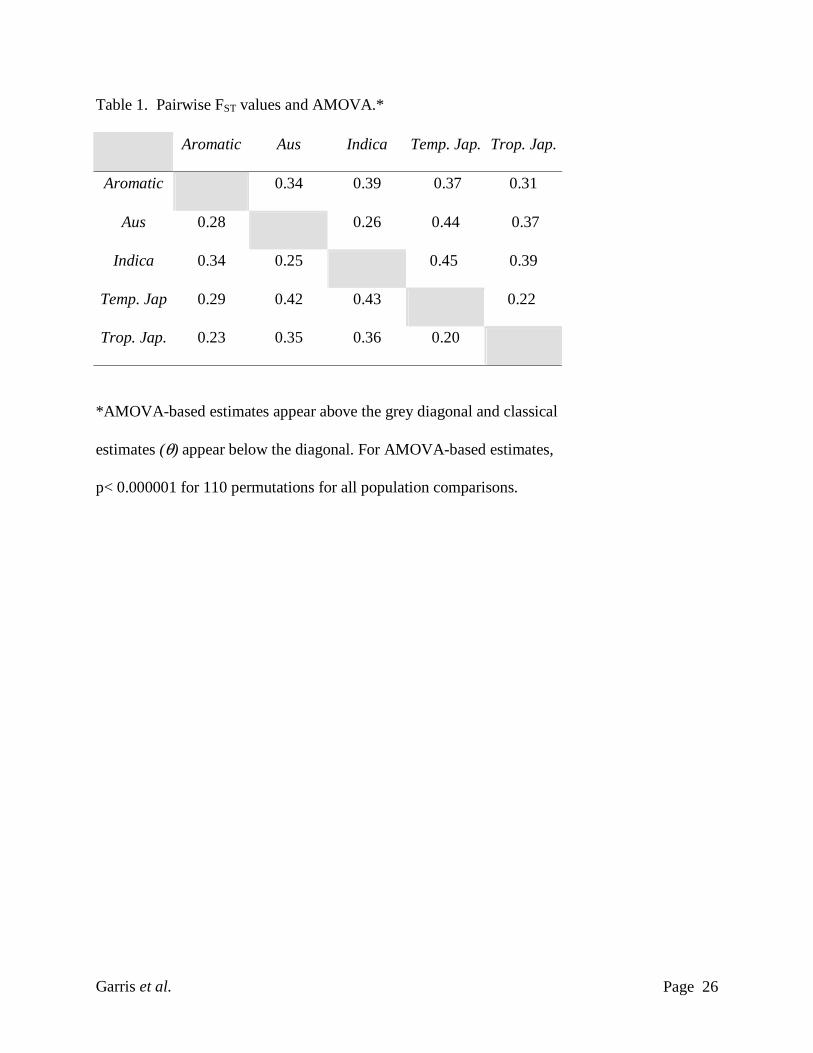
The overall AMOVA indicates that 37.5% of the variation was due to differences among groups
with the remaining 62.5% due to differences within groups. Pairwise estimates of FST using the
AMOVA approach indicated a high degree of differentiation between the five model-based
groups with values ranging from 0.20 to 0.42 (Table 1). Lower levels of differentiation were
observed in pairwise comparisons of temperate with tropical japonica (0.20) and aus with indica
(0.25).

Garris et al. Page 11
Chloroplast diversity
As an alternative method to assess the relationships among populations, two plastid loci were
examined. Overall, there were eight chloroplast haplotypes based on five polymorphic sites (two
indels, one SNP, and a polyC/polyA region) in the PSID and ORF100 fragments (Supplemental
Table S1 and Figure 1). The indica subpopulation contained the most chloroplast diversity,
harboring seven of the eight haplotypes and encompassing all the chloroplast diversity found in
the temperate and tropical japonica groups. Four of the eight haplotypes were observed in aus
chloroplasts, and these represented the most frequent indica haplotype as well as one found in
higher frequency in the japonicas. Only two haplotypes were found in the japonica sub-
populations and both were shared between the temperate and tropical groups. The aromatic rices
share a more recent maternal ancestor with the japonica, consistent with their position based on
nuclear SSRs, but 15% of aromatic rices also contained a 4 bp deletion in the ORF100 fragment
that was unique to this group.
Nuclear diversity
The amount and organization of genetic diversity differed among the model-based populations
(Table 2). The indica and tropical japonica groups contained a high percentage of polymorphic
loci (99%), and an average of 7.26 and 6.09 alleles per locus, respectively. Even with a much
smaller sample size, the aus group had very high diversity with 98% of loci polymorphic and an
average of 5.1 alleles per locus. These three groups also had the highest heterozygosity values
(0.55 for indica, 0.54 for aus, 0.47 for tropical japonica). The temperate japonica and aromatic
groups had lower diversity with 91% and 88% polymorphic loci and 4.9 and 3.4 alleles per

Garris et al. Page 12
locus, respectively, and lower HE values, (0.39 for both temperate japonica and aromatic). The
temperate japonica and aromatic populations also had the highest incidence of monomorphism,
with 15 and 21 monomorphic loci, respectively. Interestingly, the alleles at all 15 monomorphic
loci in the temperate japonica group were identical in size to the most frequent allele among the
tropical japonica. This observation is consistent with the hypothesis that temperate japonica
rices were derived from tropical japonica. For 15 of the 21 monomorphic loci in the aromatic
sample, the allele was identical in size to the most frequent allele in the tropical japonica, and
this was often the most frequent or only allele in the temperate japonica.
Directional evolution in allele length
It has been proposed that there is an upwards bias in the number of repeats responsible for the
hypervariability of SSRs which would lead to larger average allele sizes in “derived” groups
(RUBINSZTEIN et al. 1995). This has been shown to be true in the comparison of humans and
non-human primates (RUBINSZTEIN et al. 1995) and in non-ancestral populations of maize
(VIGOUROUX et al. 2003). Using the framework established by the population structure analysis,
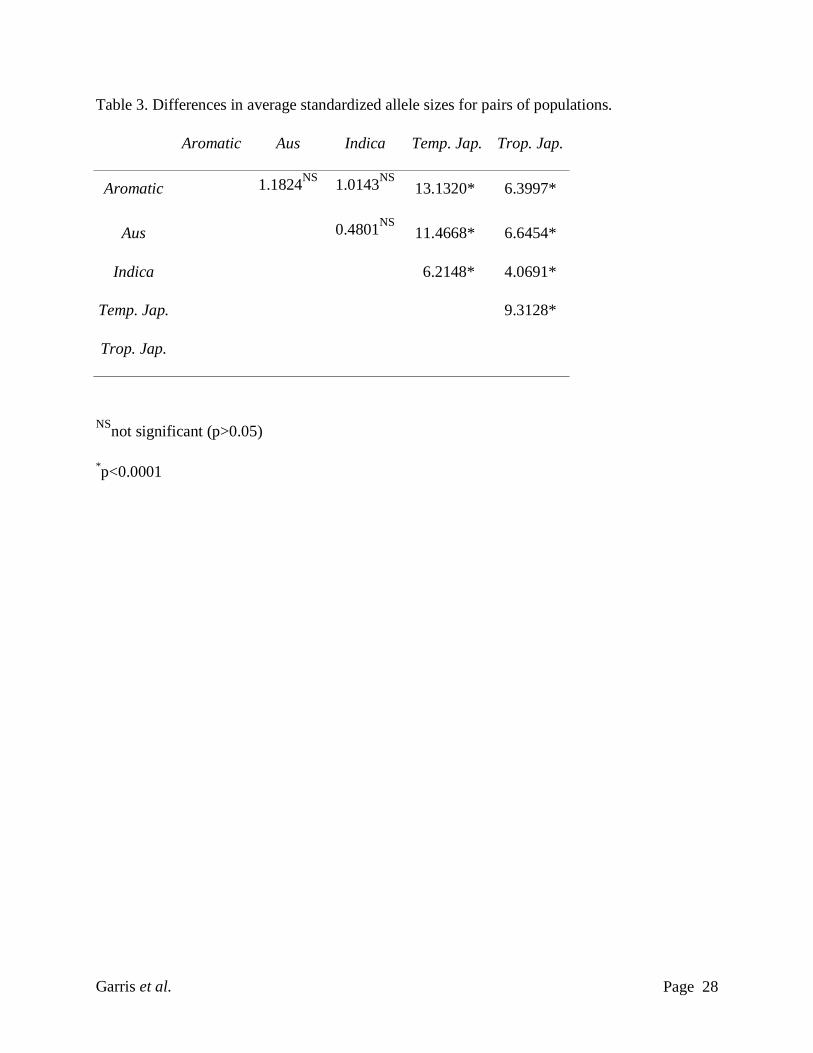
comparisons of allele lengths between groups using the subset of 60 SSR loci that have evolved
in a stepwise fashion resulted in statistically significant differences among some populations of
rice (Table 3). The average standardized allele lengths in the indica, aus and aromatic groups
were significantly smaller than those in the temperate and tropical japonica groups though the
allele lengths in the indica, aus, and aromatic groups were not statistically different from each
other. Furthermore, in the comparison between temperate and tropical japonica, the average
standardized allele size is greater in the former (t = 9.31, p < 0.0001), supporting the hypothesis
that the temperate japonica group is derived from the tropical japonica group.

Garris et al. Page 13
Population bottlenecks
The observed differences in diversity among the rice populations suggest differences in
demographic history that have shaped these patterns. In order to assess the effect of historical
population sizes in the distribution of diversity, we examined the five model-based populations
for evidence of recent bottlenecks. A likely cause of differences in the effective population sizes
of the rice groups is the proximity, duration, and severity of population bottlenecks. Deviation of
allelic diversity and heterozygosity from mutation-drift equilibrium under the Stepwise Mutation
Model (SMM) was assessed to determine whether any of the genetic populations had recently
experienced a bottleneck. Analysis of a set of 60 di-nucleotide SSR markers that exhibited
stepwise mutation patterns revealed strong evidence of bottlenecks for the aus, aromatic,
temperate japonica and tropical japonica populations. These data did not support a recent
bottleneck in the indica population. There is currently no available estimate for the mutation rate
of SSRs in rice, which would assist in the estimation of the time since the divergence of these
groups.
DISCUSSION
Genetic structure has been previously documented in rice (GLASZMANN 1987; NI et al. 2002;
PARSONS et al. 1999), but this analysis combines a large number of accessions (234) with a large
number of loci (169). The O. sativa rice accessions sampled show significant differentiation into
five groups: aromatic, aus, indica, temperate japonica, and tropical japonica. This deep genetic
structure is, in part, a legacy of structure in ancestral rice populations. Analysis of sequence
divergence between cv. GLA4, an indica cultivar and cv. Nipponbare, a temperate japonica,

Garris et al. Page 14
suggests that these two groups diverged approximately 440, 000 years ago, supporting the
hypothesis that indicas and japonicas are derived from independent domestication events from
an ancestral rice which had already differentiated into (at least) two gene pools (CAI and
MORISHIMA 2002; MA and BENNETZEN 2004; YAMANAKA et al. 2004). Sequence divergence
between the chloroplast genomes of cv. 93-11, an indica, and cv. PA64S, an indica-like variety
with a japonica chloroplast, yielded a divergence time of 86,000-200,000 years ago (TANG et al.
2004). These results suggest that the divergence between indica and japonica in our sample is in
part due to differentiation of ancestral O. rufipogon populations in different locations and at
different times. Rice presents a contrast to the history of domestication of maize, which involved
a single domestication event with a clear geographic center and expansion to the north and south
(MATSUOKA et al. 2002). As sequence comparisons in rice are enlarged to include
representatives of each subpopulation, the relationships among the groups can be clarified and
the times of divergence estimated.
The deep genetic structure in rice may also be an effect of the autogamous breeding system. In
self-pollinated species, one would predict a greater partitioning of diversity among rather than
within populations in the absence of human mediated gene flow between populations by
breeding. Indeed, the large amount of variation attributable to differences between groups in rice
(37.5% in this study) can be compared to results of a comparable sample of maize inbred lines,
in which only 8.3% of the variation was due to differences between groups (LIU et al. 2003).
While both breeding system and domestication history have had large effects on the structuring
of diversity in rice, the independent population histories of the groups have also shaped the
Garris et al. Page 15
genepools. For example, the indica is a diverse group relative to the others with no evidence of a
genetic bottleneck. The source of this variation could include mitigation of the domestication
bottleneck by gene flow with sympatric wild relatives or a historically larger effective population
size due to overland dispersal routes.
The aus had high diversity values relative to its sample size and, like the indica, contained
several chloroplast haplotypes. Aus rices were traditionally grown in a short summer season in
Bangladesh under rainfed conditions (PARSONS et al. 1999). Adaptation to flowering under long
days required evolution of day length neutrality, fostering temporal reproductive isolation and
divergence. Although the aus types have a historically smaller geographical distribution and
receive less attention than indica and japonica rices in breeding programs, their drought
tolerance and early maturity are adaptive traits that could be usefully targeted in breeding
applications.
The temperate and tropical japonica have a very close genetic relationship and have overall
lower genetic diversity than the indica (GLASZMANN 1987; NI et al. 2002; ZHANG et al. 1992) as
well as larger standardized allele lengths. In contrast to indica, which was able to utilize land
routes for migration, many of the tropical japonicas in our sample were collected from the
islands of Indonesia and the Philippines where migration via islands could have acted to decrease
diversity by a chain of bottlenecks. In addition, the two japonica groups represent an adaptive
spectrum of an ancient sub-population from tropical origins to temperate latitudes, with the
necessary adaptations to environmental signals such as day length and temperature. As the only
pair-wise comparison that embodies such obvious adaptation to a new environment, the

Garris et al. Page 16
temperate and tropical japonica groups offer a valuable tool for studying the genetic basis of
adaptation. The statistical significance of the larger allele size in the temperate relative to the
tropical japonica group supports the hypothesis that temperate japonica were derived from the
tropical japonica group. One explanation for the differences in average allele lengths is a higher
mutation rate in the temperate population. Previous observations of enhanced transposable
element activity in temperate compared to tropical japonica groups (JIANG et al. 2002) suggest
that this hypothesis may be worthy of further investigation.
Previously described as intermediate between indica and japonica rice (AHUJA et al. 1995),
aromatic rice forms a distinct sub-group in this and other studies (JAIN 2004). Both the nuclear
and chloroplast data demonstrate a close relationship to the japonicas. The aromatic group had a
high proportion of monomorphic loci suggestive of a severe or recent bottleneck (NAGARAJU et
al. (2002), and this study). The genetics of aroma may contribute to the apparent genetic
bottleneck in this group (GARLAND et al. 2000; LORIEUX et al. 1996) but this question awaits
further research.
In addition to the groups identified by this analysis, ten percent of individuals show evidence of
mixed population ancestry. In some cases these admixed individuals are likely to be the result of
modern breeding, in other cases they may be landraces belonging to groups that were
underrepresented in our sample. For example, Ashina and rayada rices (isozyme-based varietal
groups III and IV) comprised only 1% of all 1688 varieties sampled by Glaszmann (1987), and
their adaptation to deep water conditions makes them less amenable to ex situ conservation. The
identities of some admixed individuals could perhaps be better resolved through deliberate
Garris et al. Page 17
addition of deepwater rices to the dataset. The public availability of the genotypic data presented
here should facilitate further characterization of rice population structure and diversity and
highlights the need for research complementary research on the regional and national levels.
Using this framework of genetically defined populations, it may be possible to exploit the rice
gene pools more effectively with population genetics-based approaches using the extensive
collections of rice genetic resources. In particular, different subpopulations are likely to provide
differing levels of resolution for association mapping studies (GARRIS et al, 2003) as well as
different allele frequencies associated with desirable traits for plant improvement. In an
evolutionary context, many of the most intriguing questions remain to be answered, such as to
what extent allelic distribution in O. sativa is shaped by these populations, whether a pre-
domestication divergence between indica and japonica can be detected in O. rufipogon and O.
nivara ancestral groups, and whether comparisons among populations will help identify loci
showing footprints of selection. Studies designed to address these and other questions will lead
to a better understanding of the processes of domestication and adaptation in this cultivated,
inbreeding species.
ACKNOWLEDGEMENTS
We wish to thank D. Mackill of the International Rice Research Institute in the Philippines, H.
Bockelman of the National Small Grains Collection in Aberdeen, Idaho, R. Dilday and J.N.
Rutger of the Dale Bumpers National Rice Research Center and K. Moldenhauer of the Rice
Research and Extension Center in Stuttgart, Arkansas for seeds, E. Septiningsih for developing
the RM623 primer pair, S. Harrington for editing spellings and checking accession numbers in

Garris et al. Page 18
Supplemental Table 1 and L. Swales for formatting. We also thank J. Edwards and E. Buckler
for critical reading of the manuscript prior to submission. This research was supported by USDA
NRICGP No. 00-35300-9216 (T.H.T. and S.R.M.) and CRIS Project 6225-21000-006 (T.H.T.).
A.J.G. was supported by USDA/CSRS Competitive Grant 97-35300-5101, representing Food
and Agricultural Sciences National Needs Graduate Fellowship in Plant Biotechnology.
Garris et al. Page 19
LITERATURE CITED
AHUJA, S. C., D. V. S. PANWAR, U. AHUJA and K. R. GUPTA, 1995 Basmati Rice: The Scented
Pearl. Directorate of Publications, C.C.S. Haryana Agricultural University, Hisar,
Haryana, India.
CAI, H. W., and H. MORISHIMA, 2002 QTL clusters reflect character associations in wild and
cultivated rice. Theor. Appl. Genet. 104: 1217-1228.
CAVALLI-SFORZA, L. L. and A. W. F. EDWARDS, 1967 Phylogenetic Analysis: Models and
Estimation Procedures. Am. J. Human Genet. 19: 233-257.
CHEN, X., S. TEMNYKH, Y. XU, Y. G. CHO and S. R. MCCOUCH, 1997 Development of a
microsatellite framework map providing genome-wide coverage in rice (Oryza sativa L.).
Theor. Appl. Genet. 95: 553-567.
CHENG, C. Y., R. MOTOHASHI, S. TSUCHIMOTO, Y. FUKUTA, H. OHTSUBO et al., 2003
Polyphyletic origin of cultivated rice: Based on the interspersion pattern of SINEs. Mol.
Biol. and Evol. 20: 67-75.
COBURN, J. R., S. V. TEMNYKH, E. M. PAUL and S. R. MCCOUCH, 2002 Design and application
of microsatellite marker panels for semiautomated genotyping of rice (Oryza sativa L.).
Crop Sci. 42: 2092-2099.
CORNUET, J. M., and G. LUIKART, 1996 Description and power analysis of two tests for detecting
recent population bottlenecks from allele frequency data. Genetics 144: 2001-2014.
DELLAPORTA, S. L., H. WOOD and J. B. HICKS, 1983 A plant DNA minipreparation. Pl. Mol.
Biol. Reporter 1: 19-21.

Garris et al. Page 20
DOI, K., K. SOBRIZAL, K. IKEDA, P. L. SANCHEZ, T. KURAKAZU et al., 2002 Developing and
evaluating rice chromosome segment substitution lines., pp. 275-287 in IRRI conference
Sept. 16-19, 2002, edited by IRRI. IRRI, Beijing, China.
FALUSH, D., M. STEPHENS and J. K. PRITCHARD, 2003 Inference of population structure using
multilocus genotype data: Linked loci and correlated allele frequencies. Genetics 164:
1567-1587.
FISHER, R. A., 1935 The logic of inductive inference. J. Royal Stat. Soc. Series 13: 2242-2251.
GARLAND, S., L. LEWIN, A. BLAKENEY, R. REINKE and R. HENRY, 2000 PCR-based molecular
markers for the fragrance gene in rice (Oryza sativa L.). Theor. Appl. Genet. 101: 364-
371.
GARRIS, A., S. MCCOUCH, S. KRESOVICH, 2003 Population structure and its effect on haplotype
diversity and linkage disequilibrium surrounding the xa5 locus of rice (Oryza sativa L.).
Genetics 165: 759-769.
GLASZMANN, J. C., 1987 Isozymes and Classification of Asian Rice Varieties. Theor. Appl.
Genet. 74: 21-30.
JAIN, S., R. JAIN, S. MCCOUCH, 2004 Genetic analysis of Indian aromatic and quality rice (Oryza
sativa L.) germplasm using panels of fluorescently-labeled microsatellite markers. Theor.
Appl. Genet. 109: 965-977.
JIANG, N., Z. BAO, S. TEMNYKH, Z. CHENG, J. JIANG et al., 2002 Dasheng: A recently amplified
nonautonomous long terminal repeat element that is a major component of
pericentromeric regions in rice. Genetics 161: 1293-1305.

Garris et al. Page 21
KATO, S., H. KOSAKA and S. HARA, 1928 On the affinity of rice varieties as shown by the
fertility of rice plants. Central Agricultural Institute of Kyushu Imperial University 2:
241-276.
LABATE, J. A., K. R. LAMKEY, S. E. MITCHELL, S. KRESOVICH, H. SULLIVAN et al., 2003
Molecular and historical aspects of corn belt dent diversity. Crop Sci. 43: 80-91.
LIU, K. J., M. GOODMAN, S. MUSE, J. S. SMITH, E. BUCKLER et al., 2003 Genetic structure and
diversity among maize inbred lines as inferred from DNA microsatellites. Genetics 165:
2117-2128.
LIU K., and S. MUSE, 2004 PowerMarker: new genetic data analysis software. Version 2.7;
http://www.powermarker.net.
LORIEUX, M., M. PETROV, N. HUANG, E. GUIDERDONI and A. GHESQUIERE, 1996 Aroma in rice:
Genetic analysis of a quantitative trait. Theor. Appl. Genet. 93: 1145-1151.
MA, J., and J. L. BENNETZEN, 2004 Rapid recent growth and divergence of rice nuclear genomes.
Proc. Nat'l. Acad. Sci. USA 101: 12404-12410.
MATSUO, T., FUTSUHARA, Y., KIKUCHI, F., YAMAGUCHI, H., 1997 Science of the Rice Plant.
Food and Agriculture Policy Research Center, Tokyo.
MATSUOKA, Y., Y. VIGOUROUX, M. M. GOODMAN, G. J. SANCHEZ, E. BUCKLER et al., 2002 A
single domestication for maize shown by multilocus microsatellite genotyping. Proc.
Nat'l. Acad. Sci. USA 99: 6080-6084.
NAGARAJU, J., M. KATHIRVEL, R. R. KUMAR, E. A. SIDDIQ and S. E. HASNAIN, 2002 Genetic
analysis of traditional and evolved Basmati and non-Basmati rice varieties by using
fluorescence-based ISSR-PCR and SSR markers. Proc. Nat'l. Acad. Sci. USA 99: 5836-
5841.
Garris et al. Page 22
NAKAMURA, I., H. URAIRONG, N. KAMEYA, Y. FUKUTA, S. CHITRAKON et al., 1998 Six different
plastid subtypes were found in O. sativa-O. rufipogon complex. Rice Genet. Newsl. 15:
80-81.
NAKANO, M., A. YOSHIMURA and N. IWATA, 1992 Phylogenetic study of cultivated rice and its
wild relatives by RFLP. Rice Genet. Newsletter 9: 132-134.
NI, J., P. M. COLOWIT and D. J. MACKILL, 2002 Evaluation of genetic diversity in rice
subspecies using microsatellite markers. Crop Sci. 42: 601-607.
OKA, H. I., 1988 Origin of Cultivated Rice. Elsevier, Tokyo.
OLSEN, K. M., and M. D. PURUGGANAN, 2002 Molecular evidence on the origin and evolution of
glutinous rice. Genetics 162: 941-950.
OLUFOWOTE, J. O., Y. B. XU, X. L. CHEN, W. D. PARK, H. M. BEACHELL et al., 1997
Comparative evaluation of within-cultivar variation of rice (Oryza sativa L.) using
microsatellite and RFLP markers. Genome 40: 370-378.
PARSONS, B. J., H. J. NEWBURY, M. T. JACKSON and B. V. FORD-LLOYD, 1999 The genetic
structure and conservation of aus, aman and boro rices from Bangladesh. Genet. Res. and
Crop Evol. 46: 587-598.
PINSON, S. R. M., 1994 Inheritance of Aroma in 6 Rice Cultivars. Crop Sci. 34: 1151-1157.
PIPERNO, D. R., and K. V. FLANNERY, 2001 The earliest archaeological maize (Zea mays L.)
from highland Mexico: New accelerator mass spectrometry dates and their implications.
Proc. Nat'l. Acad. Sci. USA 98: 2101-2103.
PRITCHARD, J. K., M. STEPHENS and P. DONNELLY, 2000 Inference of population structure using
multilocus genotype data. Genetics 155: 945-959.

Garris et al. Page 23
ROSENBERG, N.A. 2002 Distruct: a program for the graphical display of structure results.
http://www.cmb.usc.edu/~noahr/distruct.html
RUBINSZTEIN, D. C., W. AMOS, J. LEGGO, S. GOODBURN, S. JAIN et al., 1995 Microsatellites Are
Generally Longer in Humans Compared to Their Homologs in Nonhuman-Primates -
Evidence for Directional Evolution at Microsatellite Loci. Am. J. Human Genet. 57: 214-
214.
SCHNEIDER, S., and L. EXCOFFIER, 1999 Estimation of past demographic parameters from the
distribution of pairwise differences when the mutation rates very among sites:
Application to human mitochondrial DNA. Genetics 152: 1079-1089.
SECOND, G., 1982 Origin of the genic diversity of cultivated rice (Oryza spp.): Study of the
polymorphism scored at 40 isozyme loci. Jap. J. Genet. 57: 25-57.
SHARMA, G. R., and D. MANDA, 1980 Excavations at Mahagara 1977-1978. A Neolithic
settlement in Belan Valley. Dept. of Ancient History, Culture, and Archeology,
Allahabad, India.
SOLHEIM, W. G., 1972 An earlier agricultural revolution. Sci. Am. 266: 34-41.
TAKEZAKI, N., and M. NEI, 1996 Genetic distances and reconstruction of phylogenetic trees from
microsatellite DNA. Genetics 144: 389-399.
TANG, J. B., H. A. XIA, M. L. CAO, X. Q. ZHANG, W. Y. ZENG et al., 2004 A comparison of rice
chloroplast genomes. Pl. Phys. 135: 412-420.
TEMNYKH, S., G. DECLERCK, A. LUKASHOVA, L. LIPOVICH, S. CARTINHOUR et al., 2001
Computational and experimental analysis of microsatellites in rice (Oryza sativa L.):
Frequency, length variation, transposon associations, and genetic marker potential.
Genome Res. 11: 1441-1452.

Garris et al. Page 24
TEMNYKH, S., W. D. PARK, N. AYRES, S. CARTINHOUR, N. HAUCK et al., 2000 Mapping and
genome organization of microsatellite sequences in rice (Oryza sativa L.). Theor. Appl.
Genet. 100: 697-712.
THOMPSON, J. D., D. G. HIGGINS and T. J. GIBSON, 1994 Clustal-W - Improving the Sensitivity
of Progressive Multiple Sequence Alignment through Sequence Weighting, Position-
Specific Gap Penalties and Weight Matrix Choice. Nucl. Acids Res. 22: 4673-4680.
TSUNODA, S., 1997 Ecological characteristics of upland rice, pp. 141-143 in The Science of the
Rice Plant, edited by T. MATSUO, Y. FUTSUHARA, F. KIKUCHI and H. YAMAGUCHI. Food
and Agriculture Policy Research Center, Tokyo.
VIGOUROUX, Y., Y. MATSUOKA and J. DOEBLEY, 2003 Directional evolution for microsatellite
size in maize. Mol. Biol. and Evol. 20: 1480-1483.
WANG, Z. Y., and S. D. TANKSLEY, 1989 Restriction Fragment Length Polymorphism in Oryza
sativa L. Genome 32: 1113-1118.
WEIR, B. S., 1996 Genetic Data Analysis II: Materials for discrete population genetic data.
Sinaur Assoc., Sunderland, MA.
YAMANAKA, S., I. NAKAMURA, K. N. WATANABE and Y. I. SATO, 2004 Identification of SNPs in
the waxy gene among glutinous rice cultivars and their evolutionary significance during
the domestication process of rice. Theor. Appl. Genet. 108: 1200-1204.
ZHANG, Q. F., M. A. S. MAROOF, T. Y. LU and B. Z. SHEN, 1992 Genetic Diversity and
Differentiation of Indica and Japonica Rice Detected by Rflp Analysis. Theor. Appl.
Genet. 83: 495-499.
ZOHARY, D., and M. HOPF, 2000 Domestication of plants in the old world. Oxford University
Press, Oxford, U.K.

Garris et al. Page 25
Figure Legends
Figure 1. Unrooted Neighbor-joining (NJ) tree based on C.S. Chord (Cavalli-Sforza and
Edwards, 1967) based on 169 nuclear SSRs. The key to the left relates the color of the line to the
chloroplast haplotype based on ORF100 and PS-ID sequences. Admixed individuals are
identified with an asterisk (*). Bootstrap values (out of 100) for indica, aromatic, and aus are
indicated at the branch points.
Figure 2. Model-based ancestry for each accession. Color codes are as follows: aromatic
(purple), aus (orange), indica (yellow), temperate japonica (dark blue), and tropical japonica
(light blue).
Supplemental Figure S1. Unrooted Neighbor-joining (NJ) tree based on C.S. Chord (Cavalli-
Sforza and Edwards, 1967) based on 169 nuclear SSRs. The key to the left relates the color of
the line to the chloroplast haplotype based on ORF100 and PS-ID sequences. Admixed
individuals are identified with an asterisk (*). Supplemental Table S1, published as supporting
information on the Genetics web site, provides a key to accession identities.
Garris et al. Page 26
Table 1. Pairwise FST values and AMOVA.*
Aromatic Aus Indica Temp. Jap. Trop. Jap.
Aromatic 0.34 0.39 0.37 0.31
Aus 0.28 0.26 0.44 0.37
Indica 0.34 0.25 0.45 0.39
Temp. Jap 0.29 0.42 0.43 0.22
Trop. Jap. 0.23 0.35 0.36 0.20
*AMOVA-based estimates appear above the grey diagonal and classical
estimates (θ) appear below the diagonal. For AMOVA-based estimates,
p< 0.000001 for 110 permutations for all population comparisons.

Garris et al. Page 27
Table 2. Summary of polymorphism for total dataset and by population.
Standard deviations are indicated in parentheses.
All Aus Indica Aromatic Temp. Jap. Trop. Jap.
Sample size 234* (7.35) 21 (0.990) 79 (2.92) 19 (1.85) 41 (2.24) 48 (1.73)
Avg. no. of
alleles/locus 11.8 (7.35) 5.1 (2.73) 7.3 (4.44) 3.4 (2.00) 4.9 (3.68) 6.1 (3.90)
Avg. gene diversity 0.7 (0.16) 0.54 (0.23) 0.55 (0.24) 0.39 (0.26) 0.39 (0.28) 0.47 (0.27)
Avg. PIC value 0.67 (0.18) 0.52 (0.22) 0.52 (0.24) 0.38 (0.24) 0.37 (0.27) 0.46 (0.26)
*Includes admixed
Garris et al. Page 28
Table 3. Differences in average standardized allele sizes for pairs of populations.
Aromatic Aus Indica Temp. Jap. Trop. Jap.
Aromatic 1.1824NS 1.0143NS 13.1320* 6.3997*
Aus 0.4801NS 11.4668* 6.6454*
Indica 6.2148* 4.0691*
Temp. Jap. 9.3128*
Trop. Jap.
NSnot significant (p>0.05)
*p<0.0001


Related Documents