GENETIC RESISTANCE TO BEAN STEM MAGGOT (O.SPENCERELLA) IN UGANDAN BEAN GENOTYPES CHELANGAT MURENJU DOREEN B.SC. HORTICULTURE (HONS.) (MAK) REG NO: 2012/HD02/210U STUDENT NO: 20800917 A THESIS SUBMITTED IN PARTIAL FULFILMENT OF THE REQUIREMENT FOR THE AWARD OF MASTER OF SCIENCE DEGREE IN PLANT BREEDING AND SEED SYSTEMS OF MAKERERE UNIVERSITY OCTOBER 2015

Welcome message from author
This document is posted to help you gain knowledge. Please leave a comment to let me know what you think about it! Share it to your friends and learn new things together.
Transcript
0
GENETIC RESISTANCE TO BEAN STEM MAGGOT (O.SPENCERELLA) IN
UGANDAN BEAN GENOTYPES
CHELANGAT MURENJU DOREEN
B.SC. HORTICULTURE (HONS.) (MAK)
REG NO: 2012/HD02/210U
STUDENT NO: 20800917
A THESIS SUBMITTED IN PARTIAL FULFILMENT OF THE REQUIREMENT FOR
THE AWARD OF MASTER OF SCIENCE DEGREE IN PLANT BREEDING AND
SEED SYSTEMS OF MAKERERE UNIVERSITY
OCTOBER 2015
i
DECLARATION
I declare that my thesis is an original dissertation which has not been submitted to any
institution.
Signed………………………. Date…………………………………..
Chelangat Murenju Doreen
B.Sc. (Horticulture.) (MAK)
This thesis has been submitted to Makerere University with the approval of my supervisors
Signed……………………………………. Date…………………………………
Professor Emeritus. Patrick Rubaihayo
College of Agricultural and Environmental Science,
Signed…………………………………… Date…………………………………….
Dr. Stanely Nkalubo
Bsc. Agric (Mak); MSC soil science (Mak); Ph D Plant Breeding (UKZN)
National Crops Resources Research Institurte (NaCCRI), Uganda

ii
DEDICATION
To my parents Mr and Mrs. Murenju for their love, guidance and provision throughout the
years. To my sisters and brothers for the untiring support and encouragement. Lastly, to my
husband Odutu Alfred for the love and encouragement without which I would not have
come this far.

iii
ACKNOWLEDGEMENTS
I give thanks and praise to the Almighty God for His miraculous works in my academics and
life as a whole.
I extend my gratitude to the Alliance for a Green Revolution (AGRA) donors who funded
my studies. Special gratitude to the co-odinator of the PASS project Dr. Richard Edema for
the guidance and support provided during my study period.
Special thanks to my supervisors, Prof Patrick Rubaihayo and Dr. Stanley Nkalubo for their
dedication and guidance throughout my research and thesis write up. Dr. Stanley, I also
thank you for providing the parental material used in my study.
With great love, I thank Prof. Paul Gibson and Madam Pauline for their untiring help they
offered us as a class and for the excellent academic knowledge Prof. Gibson imparted in us.
I also extend my gratitude to the NaCRRI administration and the legumes program for
allowing me to carry out my research at the institute. I also thank Mr. Bwire, with whose
help I accomplished my field activities successfully. May the Almighty God richly bless
you.
To my family members, I’m forever indebted to you for the love, prayers and support. I also
appreciate the love, support and friendship from all my classmates. Thank you very much
and may God’s flood gates be opened to you all.
v
ABSTRACT
Common bean (Phaseolus vulgaris.L) production has been greatly affected by the bean stem
maggot (BSM), an insect pest which exists in 3 species namely O.spencerella, O.phaseoli and
O.centrocematis. Among the 3 species, O.spencerella and O.phaseoli are of major economic
importance and cause up to 100% yield loss. In Uganda, the breeding program seeks to avert this
problem by developing resistant varieties for the Ugandan farmers. To achieve this, the breeders
require information to guide breeding decisions. The objectives of this study were to determine
the level of resistance to the bean stem maggot (O.spencerella) in the exotic and local Ugandan
bean genotypes, determine the nature of inheritance of BSM (O.spencerella) and heritability of
resistance to BSM (O.spencerella). Genetic variability for resistance to the BSM was determined
under natural infestation where the 32 genotypes which included 4 Ugandan varieties and 28
introductions from Malawi that were reported to be resistant to the pest were evaluated for
percent plant mortality, number of ovipunctures, number of pupae and stem damage scored on a
scale of 1-9. Significant effects were obtained for number of ovipunctures (P≤ 0.05), stem
damage (P≤ 0.01) and number of pupae in the stem (P≤ 0.001) suggesting that the genotypes had
varying levels of resistance to the BSM under Uganda environments. Several of the screened
parents were resistant and moderately resistant with very few being susceptible. Some of the
resistant sources that can be utilized include Line 19, 51, 12, 136, 6 and G 21212.
Based on the results of the screening study, 16 Malawi genotypes were crossed to NABE 4,
NABE 15, NABE 16 and NABE 17 using a NCD II without reciprocals to generate information
about the inheritance of resistance to BSM. The F1 seed were advanced to F2 and the resultant
progeny used for the inheritance evaluation. The analysis of variance showed that the general
combining ability (GCA) for the male and female parents was not significant for all resistance
parameters. Similarly, the specific combining ability (SCA) was also not significant. Both the
narrow sense and broad sense coefficient of genetic determination values were low for all
resistance parameters which included percent mortality, number of ovipunctures, number of
pupae in stem and stem damage. The NS-CGD was in the range of 0.00 to 0.11 and BS-CGD in
the range of 0.00 to 0.42. Such estimates suggest that non-additive gene action is more important
vi
compared to the additive gene action in transmitting the genes that confer resistance to the BSM
(O. spencerella).
The results of the general predictability ratio (Bakers ratio) for the resistance parameters showed
that the SCA effects were much higher compared to the GCA effects in conferring resistance to
the F2 progeny as the ratio was in the range of 0.00 to 0.37. The NS-CGD and BS-CGD for yield
were 0.475 and 0.577 respectively which indicated moderate heritability with GCA effect
estimates being higher than the SCA estimates as shown from the general predictability ratio of
83% supporting the predominance of additive gene action in conditioning yield potential.
The evaluation of heritability was also conducted under natural bean fly infestation. The F2 seed
derived from the hybridization of the local and Malawi genotypes were advanced to F3 and used
for BSM resistance evaluation. The heritability estimates for resistance to BSM were obtained
using mid- parent offspring regression. Both the F2 and F3 progeny data which were regressed to
the mid parent scores revealed that the F2 and F3 had heritability estimates in the range of 1% -
97% and 4% -37% for the different resistance parameters. This suggests that for some
parameters with high heritability estimates, selection should be done early unlike those with low
heritability where selection is recommended in later generations.

vii
TABLE OF CONTENTS
DECLARATION ............................................................................................................... i
DEDICATION ................................................................................................................. ii
ACKNOWLEDGEMENTS ............................................................................................ iii
ABSTRACT ....................................................................................................................... v
TABLE OF CONTENTS ................................................................................................. vii
LIST OF TABLES ............................................................................................................ ix
CHAPTER ONE ................................................................................................................ 1
INTRODUCTION ............................................................................................................. 1
1.0 Background ................................................................................................................ 1
1.1 Origin and Evolution ......................................................................................... 1
1.2 Importance of common beans ........................................................................... 2
1.3 Bean production and constraints ....................................................................... 2
1.4 Problem statement ............................................................................................. 5
1.5 Justification ....................................................................................................... 6
1.6 General Objective .............................................................................................. 6
1.7 Specific objectives ............................................................................................. 7
1.8 Hypothesis ......................................................................................................... 7
CHAPTER TWO ............................................................................................................... 8
LITERATURE REVIEW ................................................................................................. 8
2.0 Resistance to the bean stem maggot .................................................................. 8
2.1 Inheritance of resistance to the bean stem maggot .......................................... 10
CHAPTER THREE ......................................................................................................... 12
3.0 Genetic plant material .............................................................................................. 12
3.1 Description of the study area .................................................................................... 14
3.2 Experiment l: Screening for resistance to the bean stem maggot in the Malawi and local
genotypes 14
3.2.1 Experimental design .............................................................................................. 14
3.2.1 Data collection ............................................................................................... 14
viii
3.2.2 Data analysis .................................................................................................. 15
3.3 Experiment II: Determining the nature of inheritance of BSM resistance ...... 16
3.3.1 F1 Population development ........................................................................... 16
3.3.2 Experiment for combining ability estimation ................................................ 18
3.3.3 Data collection ............................................................................................... 18
3.3.4 Data analysis .................................................................................................. 18
3.4 Experiment III: Determination of the heritability of resistance to BSM ......... 19
3.4.1 F3 Population development ........................................................................... 21
3.4.2 Experimental design....................................................................................... 21
3.4.3 Data collection ............................................................................................... 21
3.4.4 Data analysis .................................................................................................. 21
CHAPTER FOUR ............................................................................................................ 23
RESULTS AND DISCUSSIONS .................................................................................. 23
4.0 Response of genotypes to the field infestation of the BSM ............................ 23
4.1 Combining ability effects for parents .............................................................. 32
4.2 Specific combining ability estimation ............................................................. 34
4.3 Parent-offspring regression analysis ............................................................... 38
CHAPTER FIVE ............................................................................................................. 41
5.0 Conclusion ................................................................................................................ 41
5.1 Recommendations ........................................................................................... 41
Literature Cited ................................................................................................................ 43

ix
LIST OF TABLES
Table 1: Ugandan bean production trend (2004-2013) ...................................................... 3
Table 2: Genetic materials used in the study ................................................................... 12
Table 3: Parental lines and derived F1 from NCDII mating design ................................ 17
Table 4: Parental lines and F 3 progenies evaluated for bean stem maggot resistance under field
conditions. ........................................................................................................................ 20
Table 5: Mean squares for parental genotypes to field infestation of BSM ................... 23
Table 6: Mean reaction scores of the parental genotype under field infestation ............. 24
Table 7: Correlation analysis for the resistance parameters to the bean stem maggot .... 27
Table 8: NCD II Analysis of variance for BSM resistance for the male and female parental
groups in the F2 generation.............................................................................................. 29
Table 9: Estimates of general combining ability of female and male parents ................. 32
Table 10: Estimates of specific combining ability for the crosses................................... 35
Table 11: Analysis of variance for regression of F2 means on the mid parent means .... 39
1
CHAPTER ONE
INTRODUCTION
1.0 Background
1.1 Origin and Evolution
Common bean (Phaseolus vulgaris.L) originated from the Americas, where it evolved from a
wild growing vine in Middle America and Andes (Gepts & Debouck, 1993) as supported by
molecular, morphological and archeological analysis (Singh et al., 1991) and later was
domesticated in South America (Chaco'n S et al., 2005) .
The interspecific dispersal of the wild bean populations resulted in the formation of the two
broad categories of the Andean and Mesoamerican gene pools (Knüpffer & Ochsmann, 2001).
These gene pools were then selected for crop improvement resulting in the different agronomic
groups, races and the use differences of the common bean (Knüpffer & Ochsmann, 2001). The
gene pools are divided into 6 races; 3 of Middle American origin (Jalisco, Durango,
Mesoamerica) and 3 of Andean South American origin (Peru, Nueva Granada, Chile) (Knüpffer
& Ochsmann, 2001). The Jalisco climbing bean is from the moist central Mexican highlands
while the Durango medium size seeded bean is from the dry highland of Mexico, On the other
hand, Mesoamerica small seeded bean is from the low lands of Central America and Mexico
(Singh et al., 1991) . The races in the Andean gene pool differ by virtue of their growth habit
(Singh et al., 1991).
In Africa where both gene pools are cultivated (Singh et al., 1991), beans of both gene pools
were introduced by the Portuguese in the coastal areas (Purseglove, 1976) and have since then
spread inland and become a food crop with varying levels of importance and acquired different
cultivars with local names (Leakey, 1970).
2
1.2 Importance of common beans
Worldwide, common bean is the most important grain legume for direct consumption
(Broughton et al., 2003). It is the second most important source of calories after maize in most
parts of Sub Saharan Africa (SSA) (IBP, 2014) where they account for 4% of the calories
(Akibode & Maredia, 2011). The high consumption of the crop is attributed to its nutritional
attributes of protein, vitamins, micronutrients (Fe, Zn), minerals (Broughton et al., 2003) and
fiber (Dursun, 2007). In Uganda where the bean is consumed both as a vegetable and grain
(Hillocks et al., 2006), its calorific contribution is close to 6% (Haggblade & Dewina, 2010)
which is slighly higher than that reported for the SSA region. Uganda ranks 3rd in the countries
where pulses provide 10% of per capita protein intake (Akibode & Maredia, 2011) with an
estimate of over 15 million people who regularly consume beans (Anon., 2003) .
As a grain, it is an important cash crop which is marketed in rural and urban areas (Broughton et
al., 2003). Uganda consumes nearly 80% of its bean production and the rest is exported to South
Sudan, Kenya, Congo, Sudan and Rwanda through informal border trade routes or for relief
supply by the world Food Program 9 (WFP) (Anon., 2005). In 2011, Uganda earned
approximately USD 20 million from export of 35920 MTs of beans (MAAIF, 2012).
In addition to the roles beans play in nutrition and income generation, they serve a purpose of
improving soil fertility through nitrogen fixation (Broughton et al., 2003). For this reason,
common beans like other pulses are included in most cropping systems.
1.3 Bean production and constraints
The great lakes countries of Africa, Uganda, Burundi, Rwanda and Congo (Eastern) have high
bean production that is mainly based in rural communities (Wortmann & Allen, 1994). These
rural communities utilize limited inputs for bean cultivation (Broughton et al., 2003) as a
monocrop, in rotations or in associations where it is usually intercropped with cereals, bananas
and root crops (Broughton et al., 2003) . According to a report by UBOS (2010), 35.3% of the
plots under bean cultivation are of pure stands and mixed stands comprise the other 64.7%.
3
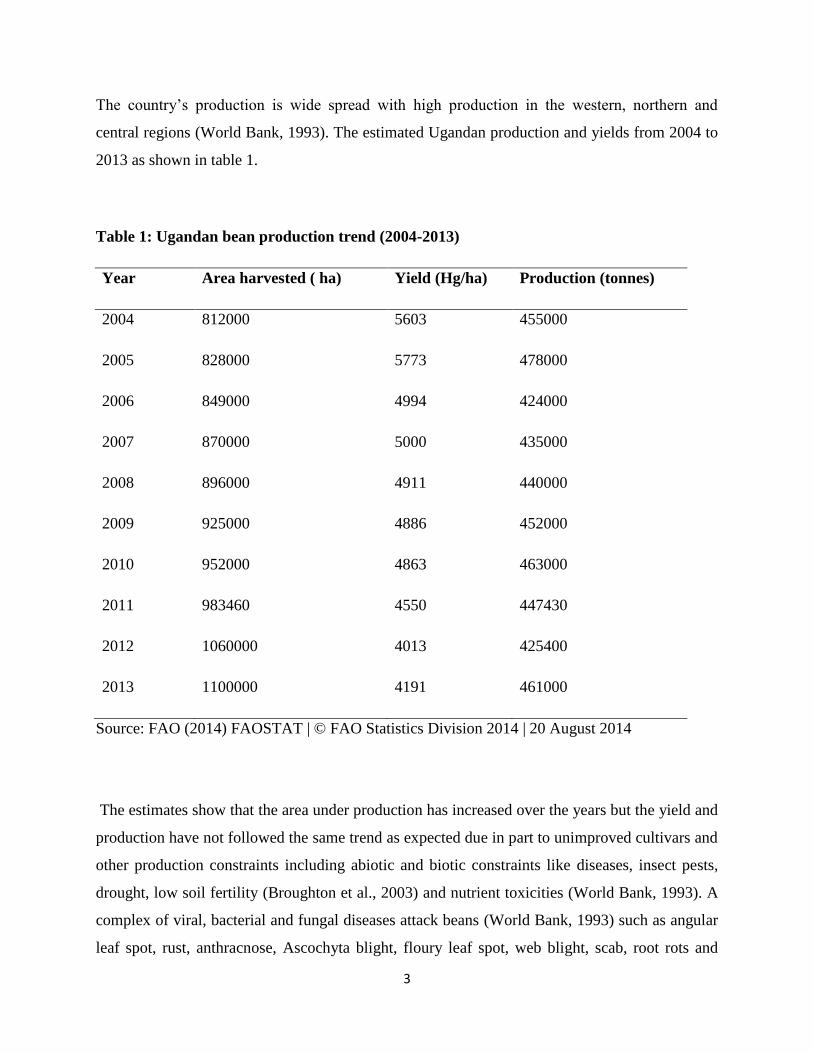
The country’s production is wide spread with high production in the western, northern and
central regions (World Bank, 1993). The estimated Ugandan production and yields from 2004 to
2013 as shown in table 1.
Table 1: Ugandan bean production trend (2004-2013)
Year Area harvested ( ha) Yield (Hg/ha) Production (tonnes)
2004 812000 5603 455000
2005 828000 5773 478000
2006 849000 4994 424000
2007 870000 5000 435000
2008 896000 4911 440000
2009 925000 4886 452000
2010 952000 4863 463000
2011 983460 4550 447430
2012 1060000 4013 425400
2013 1100000 4191 461000
Source: FAO (2014) FAOSTAT | © FAO Statistics Division 2014 | 20 August 2014
The estimates show that the area under production has increased over the years but the yield and
production have not followed the same trend as expected due in part to unimproved cultivars and
other production constraints including abiotic and biotic constraints like diseases, insect pests,
drought, low soil fertility (Broughton et al., 2003) and nutrient toxicities (World Bank, 1993). A
complex of viral, bacterial and fungal diseases attack beans (World Bank, 1993) such as angular
leaf spot, rust, anthracnose, Ascochyta blight, floury leaf spot, web blight, scab, root rots and
4
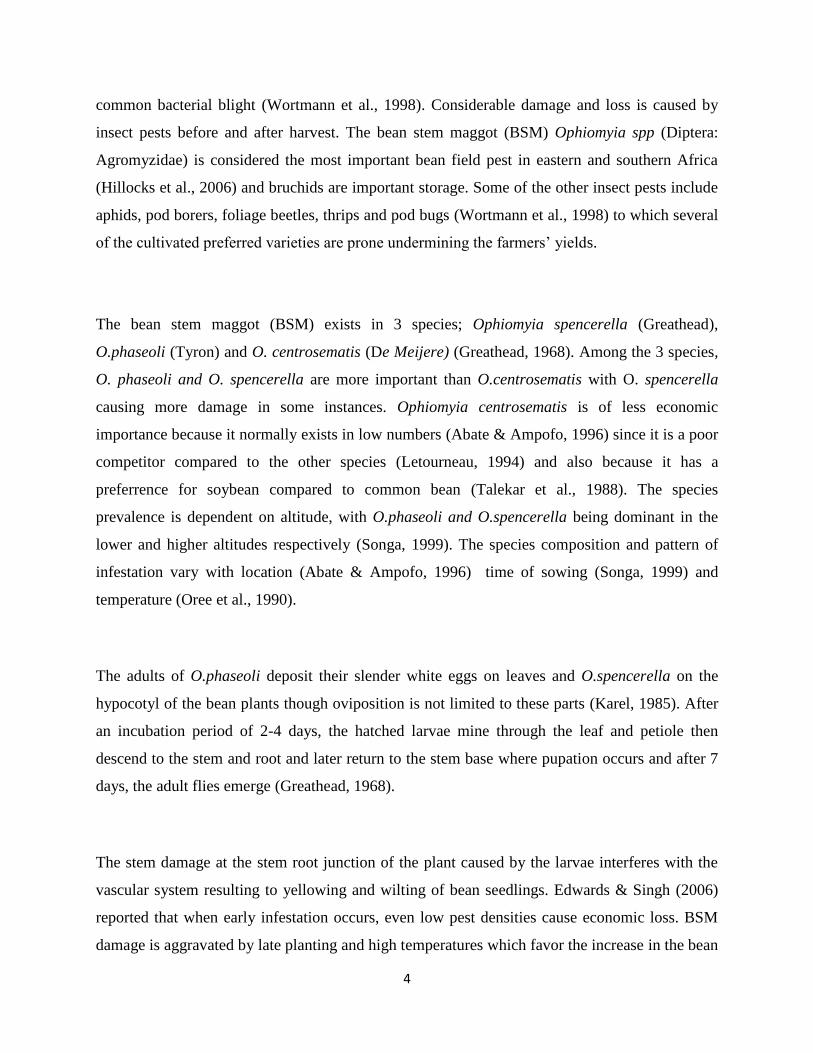
common bacterial blight (Wortmann et al., 1998). Considerable damage and loss is caused by
insect pests before and after harvest. The bean stem maggot (BSM) Ophiomyia spp (Diptera:
Agromyzidae) is considered the most important bean field pest in eastern and southern Africa
(Hillocks et al., 2006) and bruchids are important storage. Some of the other insect pests include
aphids, pod borers, foliage beetles, thrips and pod bugs (Wortmann et al., 1998) to which several
of the cultivated preferred varieties are prone undermining the farmers’ yields.
The bean stem maggot (BSM) exists in 3 species; Ophiomyia spencerella (Greathead),
O.phaseoli (Tyron) and O. centrosematis (De Meijere) (Greathead, 1968). Among the 3 species,
O. phaseoli and O. spencerella are more important than O.centrosematis with O. spencerella
causing more damage in some instances. Ophiomyia centrosematis is of less economic
importance because it normally exists in low numbers (Abate & Ampofo, 1996) since it is a poor
competitor compared to the other species (Letourneau, 1994) and also because it has a
preferrence for soybean compared to common bean (Talekar et al., 1988). The species
prevalence is dependent on altitude, with O.phaseoli and O.spencerella being dominant in the
lower and higher altitudes respectively (Songa, 1999). The species composition and pattern of
infestation vary with location (Abate & Ampofo, 1996) time of sowing (Songa, 1999) and
temperature (Oree et al., 1990).
The adults of O.phaseoli deposit their slender white eggs on leaves and O.spencerella on the
hypocotyl of the bean plants though oviposition is not limited to these parts (Karel, 1985). After
an incubation period of 2-4 days, the hatched larvae mine through the leaf and petiole then
descend to the stem and root and later return to the stem base where pupation occurs and after 7
days, the adult flies emerge (Greathead, 1968).
The stem damage at the stem root junction of the plant caused by the larvae interferes with the
vascular system resulting to yellowing and wilting of bean seedlings. Edwards & Singh (2006)
reported that when early infestation occurs, even low pest densities cause economic loss. BSM
damage is aggravated by late planting and high temperatures which favor the increase in the bean

5
fly population (Songa, 1999) . Poor soil fertility and drought conditions also increase plant
damage by the bean fly (Greathead, 1968).
Several approaches have been recommended for management of BSM which include use of
resistant varieties (Miklas et al., 2006), intercropping, insecticide application (Kyamanywa,
1997), use of deep straw mulching (Letourneau, 1994) and seed dressing (Byabagambi &
Kyamanywa, 1997). Natural enemies to the BSM like the parasitoid wasp, Opius phaseoli
(Hymenoptera; Braconidae) can control the pest levels especially of O. phaseoli as compared to
O. Spencerella (Letourneau, 1994).
1.4 Problem statement
In Uganda, the bean stem maggot (BSM) is the main field insect pest which causes losses of up
to 100% (Abate & Ampofo, 1996) especially if early infestation occurs (Nderitu, 1993). The
control of the BSM in Africa has mainly dwelt on traditional pest management practices and
rarely on the use of pesticides (Abate et al., 2000). The use of chemicals to control the pest poses
health risks and kills natural enemies (Clement et al., 1998) since the available chemicals are
persistent in the environment (Abate, 1991). The use of natural enemies like the parasitoid Opius
phaseoli can be opted for to keep the pest population in check, however, they do not reduce the
pest population to levels that minimize economic loss (Letourneau, 1994). Intercropping as a
method of controlling bean damage by the BSM requires that beans should have a lower
population than the other crop in the field. For example for the intercrop control method to be
effective, Peter et al (2009) reported that when intercropped with maize, beans should comprise
one third of the crop in the field which does not favour the bean farmer. In spite of the extent of
bean production devastation due to BSM, no resistant lines have been identified in Uganda. Also
literature that exists about the genetic mode of inheritance of resistance has mainly dwelt on
O.phaseoli Tyron yet the most prevalent species in central Uganda is O.Spencerella (Mulumbaa
et al., 2012).
6
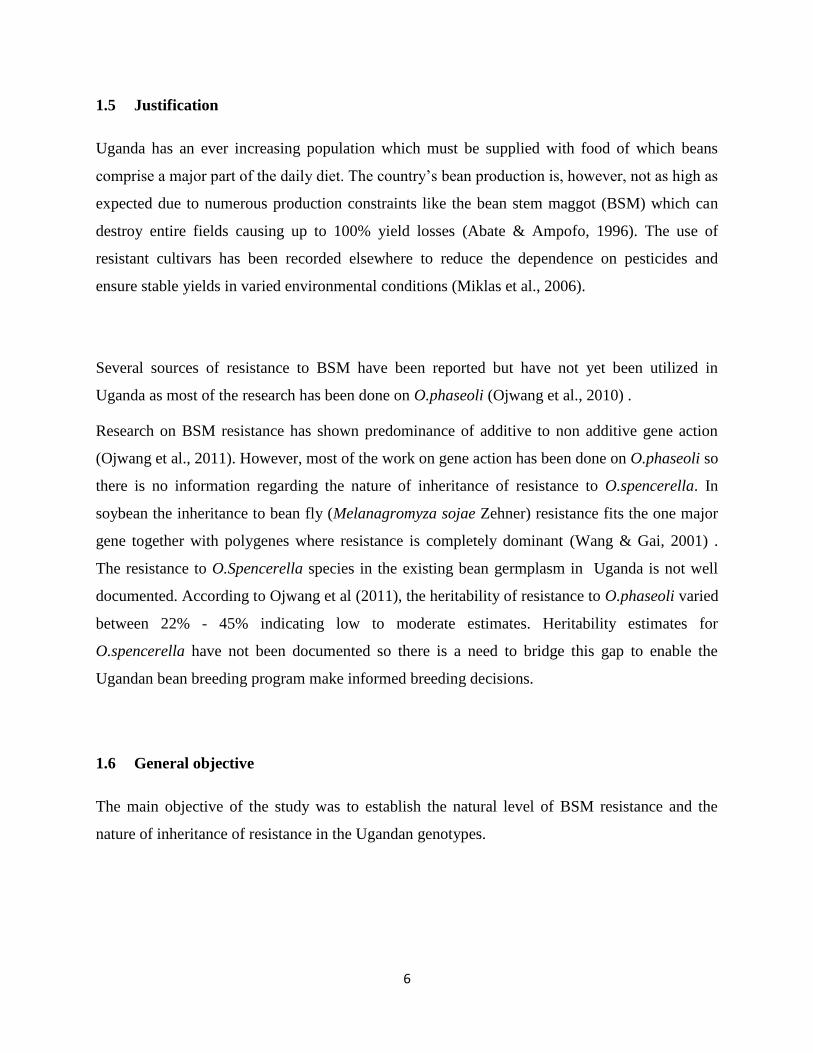
1.5 Justification
Uganda has an ever increasing population which must be supplied with food of which beans
comprise a major part of the daily diet. The country’s bean production is, however, not as high as
expected due to numerous production constraints like the bean stem maggot (BSM) which can
destroy entire fields causing up to 100% yield losses (Abate & Ampofo, 1996). The use of
resistant cultivars has been recorded elsewhere to reduce the dependence on pesticides and
ensure stable yields in varied environmental conditions (Miklas et al., 2006).
Several sources of resistance to BSM have been reported but have not yet been utilized in
Uganda as most of the research has been done on O.phaseoli (Ojwang et al., 2010) .
Research on BSM resistance has shown predominance of additive to non additive gene action
(Ojwang et al., 2011). However, most of the work on gene action has been done on O.phaseoli so
there is no information regarding the nature of inheritance of resistance to O.spencerella. In
soybean the inheritance to bean fly (Melanagromyza sojae Zehner) resistance fits the one major
gene together with polygenes where resistance is completely dominant (Wang & Gai, 2001) .
The resistance to O.Spencerella species in the existing bean germplasm in Uganda is not well
documented. According to Ojwang et al (2011), the heritability of resistance to O.phaseoli varied
between 22% - 45% indicating low to moderate estimates. Heritability estimates for
O.spencerella have not been documented so there is a need to bridge this gap to enable the
Ugandan bean breeding program make informed breeding decisions.
1.6 General objective
The main objective of the study was to establish the natural level of BSM resistance and the
nature of inheritance of resistance in the Ugandan genotypes.
7
1.7 Specific objectives
1. To determine the level of resistance to the bean stem maggot (O.spencerella) in the
Malawi and local bean genotypes.
2. To determine the nature of inheritance of BSM resistance in the bean genotypes.
3. To determine the heritability of resistance to BSM.
1.8 Hypothesis
1. Malawi and local bean genotypes have different levels of resistance to BSM.
2. The inheritance of resistance to BSM is predominantly additive in nature.
3. The heritability estimates for resistance in Malawi and local bean genotypes to BSM is
low.

8
CHAPTER TWO
LITERATURE REVIEW
2.0 Resistance to the bean stem maggot
The ultimate degree of damage done by the BSM is determined by the resistance posed by the
host plant exhibited through resistance mechanisms (Rogers, 1979). This resistance is governed
by three basic components or mechanisms which include non-preference, antibiosis and
tolerance (Maxwell et al., 1972). The non-preference may be for oviposition, shelter or food,
primarily due to the presence or absence of some chemical or physical factors (Maxwell et al.,
1972) .
The resistance to BSM achieved through tolerance has been reported to be available in bean
cultivars with tannin like substances in the epidermis and with thickened hypocotyls (Greathead,
1968). Also, high leaf pubescence, thin stems and long internodes have been associated with
tolerance of beans to O.phaseoli species (Maerere & Karel, 1984). Some local land races in
Uganda and Tanzania were found to be resistant to the BSM and this was attributed to their
ability to develop adventitious roots and thickened hypocotyles (Greathead, 1968). In the case of
O. spencerella, Narayan & Wen Jin (1993) reported pigmentation and degree of lignification as
the factors that were attributed to plant tolerance. Similar studies have been done for other
legumes like soybean and cowpea. For soybean plants, small pubescent unifoliate leaves, small
cotyledons and hypocotyls have been associated with resistance (Narayan & Wedanimbi, 1993).
Dharmasena & Fernando (1988) reported that in cowpea the resistance to the bean fly was
associated to morphological features and the susceptible varieties had high stem moisture, large
leaf area and large stem thickness.
Resistance or tolerance levels evaluated during screening experiments rely on several damage
and incidence parameters. However, some authors have recommended the use of some
parameters at specific stages of plant growth as they provide accurate resistance scores and are
consistent. Nderitu (1993) reported that accurate identification of resistant varieties to BSM

9
should be done early in the crop cycle when the ovipositing female population is high due to
their behavioral adaptation to ensure survival of the offspring to maturity by feeding on the most
nutritive crop. Scoring for seedling mortality and damage as compared to the bean fly counts and
infestation has been recommended by Abate (1990). Maerere & Karel (1984) reported that
larval-pupae counts, ovipuncture counts and stem damage recorded at 14 - 42 DAP at 1 week
intervals could be used as the criteria for BSM resistance evaluation. The number of larval mines
can be used as an indicator for number of oviposition sites since the O.phaseoli mine in the leaf
lamina remains unbranched for at least 1mm (Rogers, 1979).
In soybean, number of insects in stem and number of insects in the petiole are both indicators of
resistance to the bean fly but number of insects in stem is a better parameter as compared to
number of insects in the petiole (Wang & Gai, 2001).
Based on these parameters, several sources of resistance have been reported in common bean
(Ojwang et al., 2010), haricot bean (Abate, 1990) and soybean (Narayan & Wedanimbi, 1993).
For most of the crops, varying levels of resistance have been obtained among the screened
germplasm since cultivars can differ significantly in their level of non-preference or egg
antibiosis status (Rogers, 1979) .
In the screening for resistance to O.phaseoli, Ojwang et al., (2010) used geometric mean (GM)
selection index and genotype X environment (GE) component analysis to identify resistant
genotypes. Genotypes GBK 047821, GBK 047858, CC 888 (G15430) and Macho (G22501)
were found to be resistant to bean fly (O.phaseoli) basing on their low to moderate values for the
resistance parameters (Ojwang et al., 2011).
Sariah & Makundib (2007) reported the Tanzanian bean variety ZPV 292 as tolerant to BSM
infestation based on the number of pupae in the bean stems and number of cracked stems. CIAT
–Tanzania screened for BSM resistance under natural infestation and found Mlama 49, Mlama
127, G222501 to be resistant to the bean fly (Hillocks et al., 2006).
10
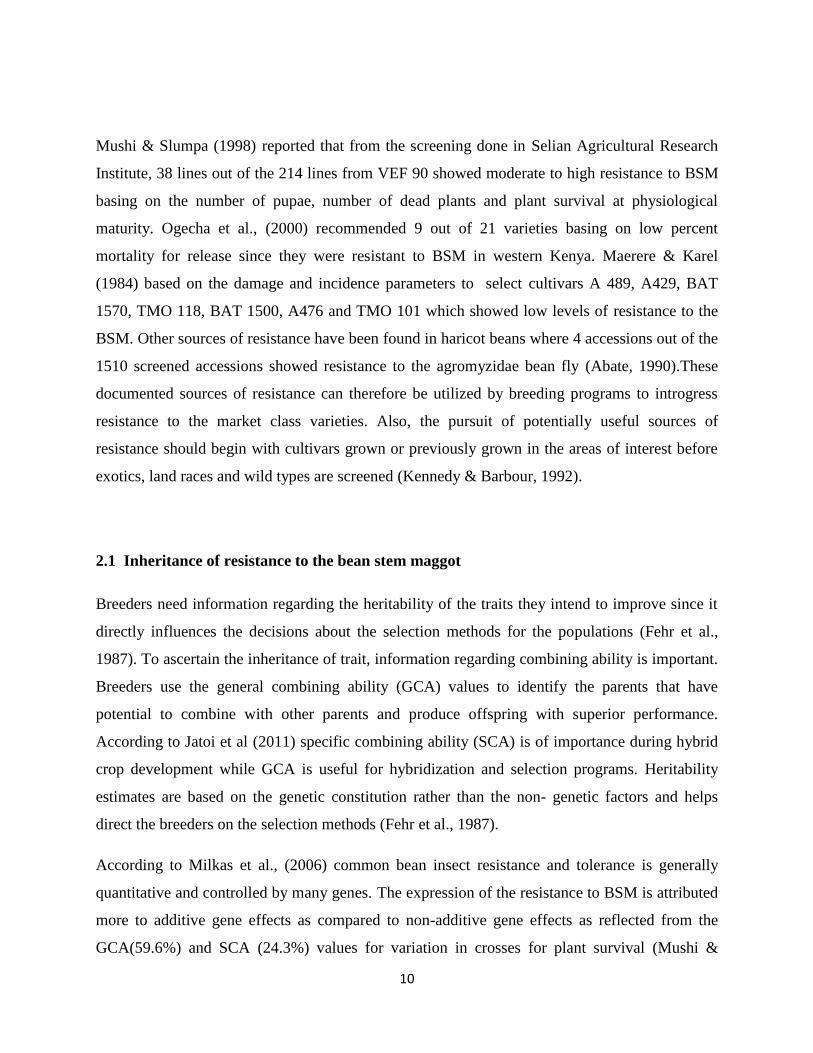
Mushi & Slumpa (1998) reported that from the screening done in Selian Agricultural Research
Institute, 38 lines out of the 214 lines from VEF 90 showed moderate to high resistance to BSM
basing on the number of pupae, number of dead plants and plant survival at physiological
maturity. Ogecha et al., (2000) recommended 9 out of 21 varieties basing on low percent
mortality for release since they were resistant to BSM in western Kenya. Maerere & Karel
(1984) based on the damage and incidence parameters to select cultivars A 489, A429, BAT
1570, TMO 118, BAT 1500, A476 and TMO 101 which showed low levels of resistance to the
BSM. Other sources of resistance have been found in haricot beans where 4 accessions out of the
1510 screened accessions showed resistance to the agromyzidae bean fly (Abate, 1990).These
documented sources of resistance can therefore be utilized by breeding programs to introgress
resistance to the market class varieties. Also, the pursuit of potentially useful sources of
resistance should begin with cultivars grown or previously grown in the areas of interest before
exotics, land races and wild types are screened (Kennedy & Barbour, 1992).
2.1 Inheritance of resistance to the bean stem maggot
Breeders need information regarding the heritability of the traits they intend to improve since it
directly influences the decisions about the selection methods for the populations (Fehr et al.,
1987). To ascertain the inheritance of trait, information regarding combining ability is important.
Breeders use the general combining ability (GCA) values to identify the parents that have
potential to combine with other parents and produce offspring with superior performance.
According to Jatoi et al (2011) specific combining ability (SCA) is of importance during hybrid
crop development while GCA is useful for hybridization and selection programs. Heritability
estimates are based on the genetic constitution rather than the non- genetic factors and helps
direct the breeders on the selection methods (Fehr et al., 1987).
According to Milkas et al., (2006) common bean insect resistance and tolerance is generally
quantitative and controlled by many genes. The expression of the resistance to BSM is attributed
more to additive gene effects as compared to non-additive gene effects as reflected from the
GCA(59.6%) and SCA (24.3%) values for variation in crosses for plant survival (Mushi &

11
Slumpa, 1998). Some crosses in the same study indicated that non-additive gene effects were of
more importance. The results indicated that BSM resistance was controlled by multiple genes
thus the recommendation to use pedigree combined with single pod descent and recurrent
methods as the breeding methods..
Ojwang et al (2011) reported general predictability ratios ranging from 0.63-0.9 indicating the
predominance of additive gene effects to non-additive gene effects in controlling BSM based on
the stem damage, plant mortality and pupae in stem. Dominance is also an important component
in the inheritance of resistance to the BSM, however, additive gene effects are greater (Ojwang
et al., 2011). The narrow sense heritability values for stem damage of 0.22 - 0.45 indicated low
to moderate heritability of the resistance trait which makes it difficult to predict the performance
of progeny since some of the resistance is not heritable (Ojwang et al., 2011). Similar findings in
relation to the predominance of additive to non additive gene effects in the inheritance of
resistance to the BSM were reported by Mushi & Slumpa (1998) but they also noted that for
some parental combinations, non-additive gene effects were more important than the additive
gene effects.
Distabanjong & Srinives (1985) reported that in mung bean the resistance to bean fly was
polygenic and predominantly additive as evidenced from the 6 generations tested i.e. P1,P2, F1,
F2, Back cross 1(BC1) and B2. In some trials, non-additive gene effects and dominance were
important with dominance towards the resistant parents. Epistatic gene effects were sufficient to
be considered as one of the factors affecting the gene action of resistance to BSM.
In soybean, the inheritance of resistance to BSM fitted the one major gene together with
polygene model with greater major gene effects than the additive and dominance gene effects of
the polygenes. The resistance to BSM was completely dominant and the heritability for the major
gene was higher than that of the polygenes (Wang & Gai, 2001).
12
CHAPTER THREE
MATERIALS AND METHODS
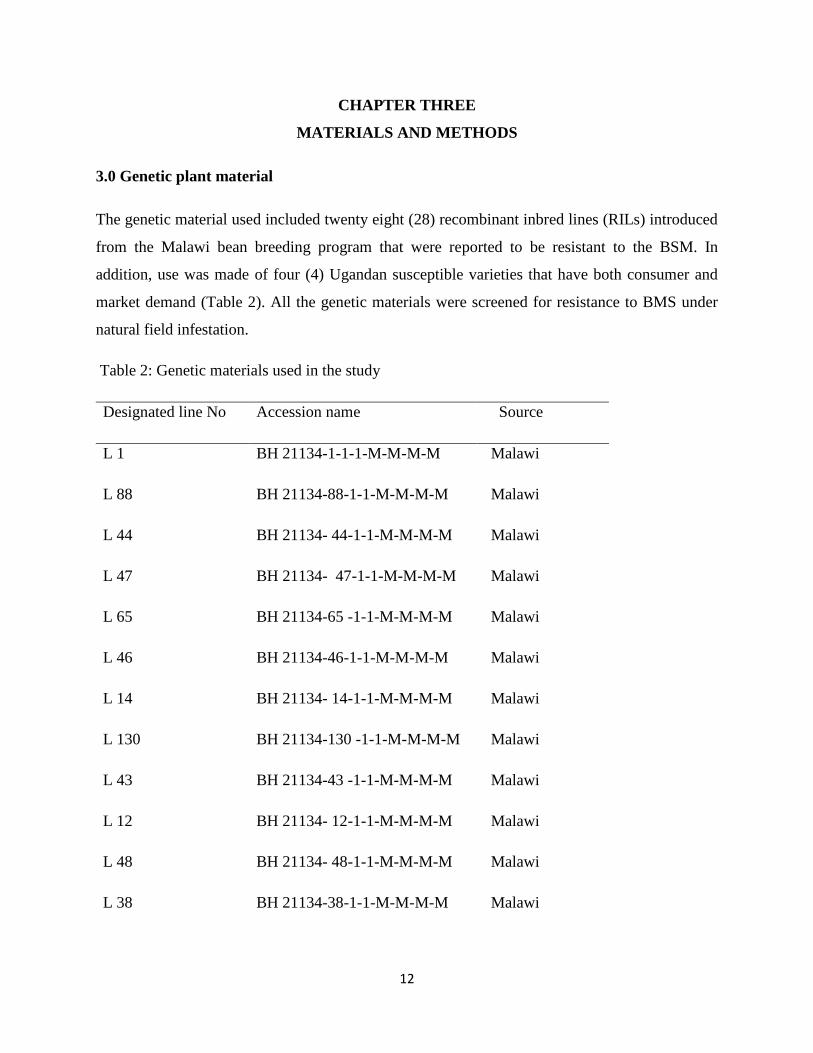
3.0 Genetic plant material
The genetic material used included twenty eight (28) recombinant inbred lines (RILs) introduced
from the Malawi bean breeding program that were reported to be resistant to the BSM. In
addition, use was made of four (4) Ugandan susceptible varieties that have both consumer and
market demand (Table 2). All the genetic materials were screened for resistance to BMS under
natural field infestation.
Table 2: Genetic materials used in the study
Designated line No Accession name Source
L 1 BH 21134-1-1-1-M-M-M-M Malawi
L 88 BH 21134-88-1-1-M-M-M-M Malawi
L 44 BH 21134- 44-1-1-M-M-M-M Malawi
L 47 BH 21134- 47-1-1-M-M-M-M Malawi
L 65 BH 21134-65 -1-1-M-M-M-M Malawi
L 46 BH 21134-46-1-1-M-M-M-M Malawi
L 14 BH 21134- 14-1-1-M-M-M-M Malawi
L 130 BH 21134-130 -1-1-M-M-M-M Malawi
L 43 BH 21134-43 -1-1-M-M-M-M Malawi
L 12 BH 21134- 12-1-1-M-M-M-M Malawi
L 48 BH 21134- 48-1-1-M-M-M-M Malawi
L 38 BH 21134-38-1-1-M-M-M-M Malawi

13
L 42 BH 21134- 42-1-1-M-M-M-M Malawi
L 80 BH 21134-80-1-1-M-M-M-M Malawi
G21212 G 21212 Malawi
L 6 BH 21134- 6-1-1-M-M-M-M Malawi
L 37 BH 21134-37-1-1-M-M-M-M Malawi
L 136 BH 21134-136-1-1-M-M-M-M Malawi
L 30 BH 21134-30-1-1-M-M-M-M Malawi
L 32 BH 21134- 32-1-1-M-M-M-M Malawi
L 3 BH 21134- 3-1-1-M-M-M-M Malawi
L 19 BH 21134- 19-1-1-M-M-M-M Malawi
L 149 BH 21134-149-1-1-M-M-M-M Malawi
L 139 BH 21134-139-1-1-M-M-M-M Malawi
L 40 BH 21134- 40-1-1-M-M-M-M Malawi
L 51 BH 21134-51-1-1-M-M-M-M Malawi
L 9 BH 21134-9-1-1-M-M-M-M Malawi
144 BH 21134- 144-1-1-M-M-M-M Malawi
N 16 NABE 16 Uganda
N 15 NABE 15 Uganda
N 4 NABE 4 Uganda
N 17 NABE 17 Uganda

14
3.1 Description of the study area
The study was conducted at the National Crops Resources Research Institute (NaCRRI) located
in the central region of Uganda. NaCRRI is positioned at 00 32’N / 32037’E, at an altitude of
1160 msl. The annual bimodal rain fall received is 994 mm/year with minimum and maximum
temperatures of 16.10 C and 29.10 C respectively. The screening experiment was carried out in
the field under the natural infestation of the bean flies since O.Spencerella is the most prevalent
species in central Uganda and Namulonge in particular (Mulumbaa et al., 2012).
3.2 Experiment l: Screening for resistance to the bean stem maggot in the Malawi and local
genotypes
3.2.1 Experimental design
The experiment was established close to a field where a susceptible bean variety (NABE 4) had
been planted 3 weeks earlier to increase the bean fly infestation pressure to enable effective
screening of the genetic materials. The field experiment was laid out in an alpha lattice design.
The 32 genetic materials were planted in 4 lattice blocks with each block containing 8 genotypes
and the experiment was replicated twice. The genotypes were planted in 2m rows at a spacing of
50 x 10 cm between and within rows respectively. Each of the 2m row plots had 20 plants from
which data was collected.
3.2.1 Data collection
Number of ovipunctures: At 2 weeks after planting, an ovipuncture count on the two primary
leaves was obtained from 5 randomly selected plants in accordance with Songa’s (1999) method.
To ensure that the correct ovipuncture count was obtained, the data collection was done in a
knelling position on a bright day, as this eased the visibility of the oviposition sites. For each
plant, the ovipunctures of each primary leaf were recorded separately and the average number
obtained from the 5 plants calculated.

15
Percent plant mortality: The number of dead plants due to BSM per genotype was recorded
from the first to the fourth week and in each week data was collected once. This was done by
uprooting the dead plants and critically examining for the cause of stem damage. Confirmation
for BSM cause of death was stem damage, presence of larvae or pupae within the dead plant’s
stem.
Stem damage and number of pupae in the stem: At 5 weeks after emergence (WAE) 5 plants
from each genotype were randomly selected and carefully uprooted by loosening the soil around
the roots with a knife to obtain the entire root system without damage. The plants were then
placed in paper bags with the roots properly protected and transported to the laboratory for
critical examination of the root surface. This was done by cleaning the root free of soil with the
use of a tooth pick. After which the stem damage for each plant was properly scored.
Visual assessment was then done and damage scored on a scale of 1-9 where 1- represented no
damage and 9- extreme damage in accordance with Kornegay & Cardona (1998) damage rating
scale .The number of pupae were counted after carefully using a tooth pick to remove the sheath
and expose the pupae as described by Ojwang et al (2011).
3.2.2 Data analysis
The average for the data collected for number of ovipunctures, percent plant mortality, stem
damage and number of pupae in stem were compiled in the excel sheet then imported to Genstat
14th edition and subjected to Residual maximum Likelihood (REML) analysis to obtain the
variance components. The lattice linear model was used for analysis:

16
Equation 1
Lattice linear model Yijk = Y… + Rj +Gi + B/R jk + eijk
Where Yijk : Individual observation
Y… : Grand mean
Rj : Replication effect
Gi : Genotype effect
B/R jk: Blocks within replication
eijk : Error
3.3 Experiment II: Determining the nature of inheritance of BSM resistance
3.3.1 F1 Population development
In the Namulonge screen house, 16 genotypes that showed high to moderate resistance based on
the results of the screening experiment were planted in large buckets measuring (36 x 31 x 14)
cm which provided enough space for growing 4 plants per bucket. Staggered planting was done
to ensure synchronized flowering between the male and female parents. At the flowering period,
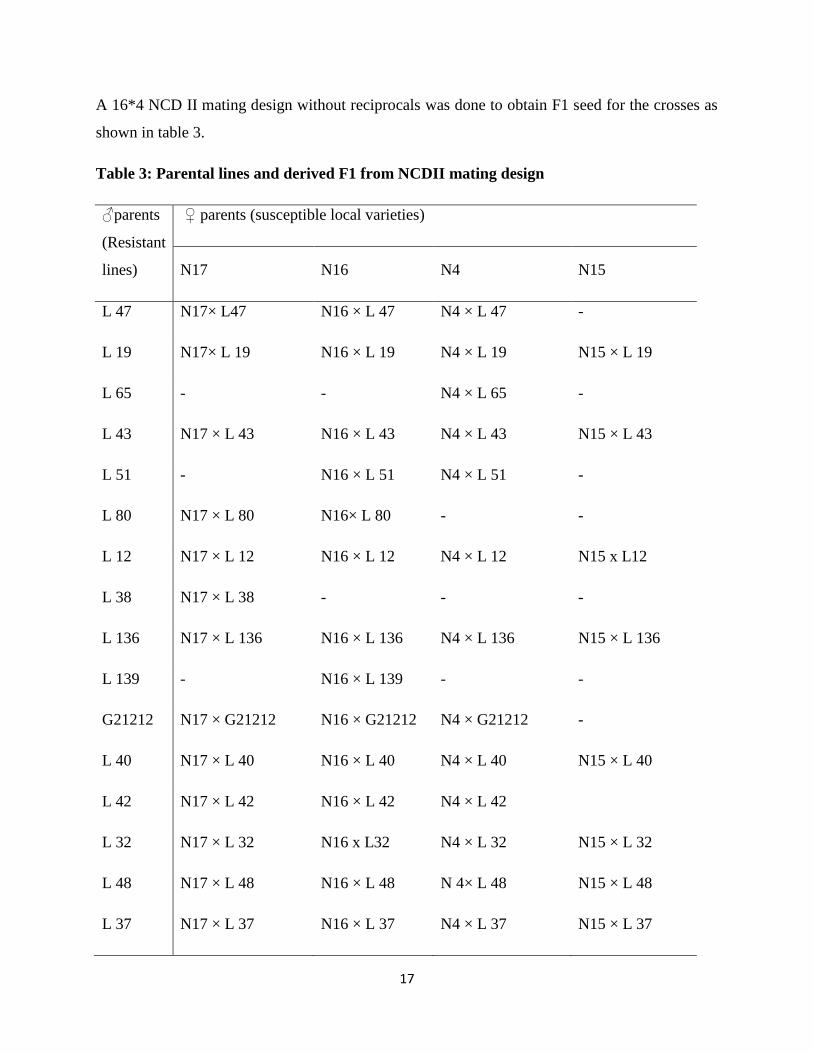
the North Carolina II (NCD II) mating design without reciprocals was used to cross the two
groups of bean plants i.e. the Ugandan and Malawi genotypes. The Uganda varieties were used
as the female parents and the Malawi genotypes used as the male parents since the Uganda
preferred market varieties were to be improved.
17
A 16*4 NCD II mating design without reciprocals was done to obtain F1 seed for the crosses as
shown in table 3.
Table 3: Parental lines and derived F1 from NCDII mating design
♂parents
(Resistant
lines)
♀ parents (susceptible local varieties)
N17 N16 N4 N15
L 47 N17× L47 N16 × L 47 N4 × L 47 -
L 19 N17× L 19 N16 × L 19 N4 × L 19 N15 × L 19
L 65 - - N4 × L 65 -
L 43 N17 × L 43 N16 × L 43 N4 × L 43 N15 × L 43
L 51 - N16 × L 51 N4 × L 51 -
L 80 N17 × L 80 N16× L 80 - -
L 12 N17 × L 12 N16 × L 12 N4 × L 12 N15 x L12
L 38 N17 × L 38 - - -
L 136 N17 × L 136 N16 × L 136 N4 × L 136 N15 × L 136
L 139 - N16 × L 139 - -
G21212 N17 × G21212 N16 × G21212 N4 × G21212 -
L 40 N17 × L 40 N16 × L 40 N4 × L 40 N15 × L 40
L 42 N17 × L 42 N16 × L 42 N4 × L 42
L 32 N17 × L 32 N16 x L32 N4 × L 32 N15 × L 32
L 48 N17 × L 48 N16 × L 48 N 4× L 48 N15 × L 48
L 37 N17 × L 37 N16 × L 37 N4 × L 37 N15 × L 37
18
Six F1 seeds obtained from each successful cross were then advanced to F2 as a way of
generating more seed to be used for evaluating the inheritance of BSM resistance.
3.3.2 Experiment for combining ability estimation
Parental genotypes and the derived F2 progeny were used for the evaluation of combining ability
estimates. The experiment was laid out in an already established bean field to ensure a high and
fairly uniform pest pressure. In the field, a 10× 7 Alpha lattice design with 2 replications was
used for BSM evaluation of the parents and F2 progenies. Each of the 10 blocks had 7 genotypes
planted in 2m rows that contained 20 plants. The plants were planted at a spacing of 50 × 10 cm
between rows and within rows respectively.
3.3.3 Data collection
Data on number of ovipunctures, percent plant mortality, number of pupae in stem, stem damage
was collected as described in 3.3.2. In addition, at maturity, plants were harvested from a 0.5m2
area, threshed and seeds cleaned. Using a digital weighing scale, the weight of these seeds was
obtained and then used to compute the yield per hectare.
3.3.4 Data analysis
The data collected was analyzed using Lattice analysis and GenStat 14th edition. F2 progeny and
parental data were used to estimate error variance, (Dobholkar, 1999). North Carolina Design II
(NCD II) was used to estimate the general combining ability (GCA) and specific combining
ability (SCA) for the F2 progenies using the model suggested by Singh & Chaudhary (1997).
The general predictability ratio (Bakers ratio) was calculated based on Baker’s (Baker, 1978)
method.
19
The analysis of NCD II was based on the linear model suggested by (Lynch & Walsh, 1998)
Zijk= μ + si + dj +Iij + eijk
Where μ: mean phenotype of the population
si and dj: Additive effects of the ith and jth parents
Iij : Non additive gene effects due to i and j parents
eijk: Deviation of the observed phenotype of the kth offspring of I and j parents
The significance for both the GCA and SCA were determined using the student t-test. Variance
components were calculated using error variance at an entry mean basis. Since the crosses were
derived from parents considered as fixed, the heritability estimates were determined by broad
and narrow sense coefficient of genetic determination (BS-CGD& NS-CGD) which were
computed from variance components for the GCA, SCA and error estimates. The Baker’s ratio
was also computed from the same variance components
3.4 Experiment III: Determination of the heritability of resistance to BSM
Parental genotypes together with the F3 progenies (Table 4) were evaluated for resistance under
field conditions.

20
Table 4: Parental lines and F 3 progenies evaluated for bean stem maggot resistance under
field conditions.
♀
♂ parents
parents N17 N16 N4 N15
L 47 N17*L 47
F3 progeny
-
-
N15*L 47
L 19 N17* L 19 - - N15* L 19
L 43 N17* L 43 - - N15* L43
L 51 N17* L 51 N16* L 51 N4* L 51 -
L 80 N17* L 80 N16* L 80 - -
L 12 N17* L 12 N16* L 12 N4* L 12 -
L 136 N17* L 136 - N4* L136 N15* L 136
L 139 N17* L 139 - - -
G21212 N17* G21212 N16* G21212 N4* G21212 -
L 40 N17* L 40 N16* L 40 - N15* L 40
L 42 - N16* L 42 N4* L 42 -
L 32 N17* L 32 N16* L 32 - -
L 48 - - - N15* L 48
L 37 N17* L 37 N16* L 37 - -
21
3.4.1 F3 Population development
After the F2 evaluation of resistance, the remnant F2 seed was advanced to F3 in the screen
house. These were planted in plastic troughs measuring 36 x 32 x 14cm and management was
provided to ensure proper growth of the F2 plants.
3.4.2 Experimental design
Prior to the establishment of the trail experiment, Nabe17 was planted in an open field to ensure
BSM pressure and after 3 weeks the evaluation materials were planted. The F3 progenies
together with the parental genotypes were planted in a completely randomized block design
(CRBD) with 2 replications. Each of the replications had 31 entries with each having 10 plants at
a spacing of 10 by 50 cm between plants and rows respectively.
3.4.3 Data collection
The parameters measured, timing and data collected were the same as indicated in section 3.3.2.
3.4.4 Data analysis
The F3 progeny data was analyzed using Genstat 14th edition to obtain a mid-parent-offspring
regression and estimate heritability. The mean scores of the F3 progeny were regressed to the
calculated mid-parent value (Falconer & Mackay, 1996). The slope of the fitted regression line
was used to directly estimate the narrow sense heritability (h2) (Falconer, 1989).The heritability
analysis followed the assumptions stated by Fehr (1993):
i. The character of interest has diploid Mendelian inheritance
ii. The population is randomly-mated
iii. The population is either in a linkage equilibrium or has no linkage among loci controlling
the trait
iv. Parents used are non-inbreds
22
v. There is no environmental correlation between the performance of the parents and the
offspring.
The analysis was also based on the standard linear regression model by Fernandez & Miller
(1985) ;
Yi= β0 + β1X1+ e1 Where;
Yi: Mean of the progenies of the i th family
β0: Intercept
β1: Linear regression coefficient
X1: mean of the Mid-parent of the i th family and e1: Random error
23
CHAPTER FOUR
RESULTS AND DISCUSSIONS
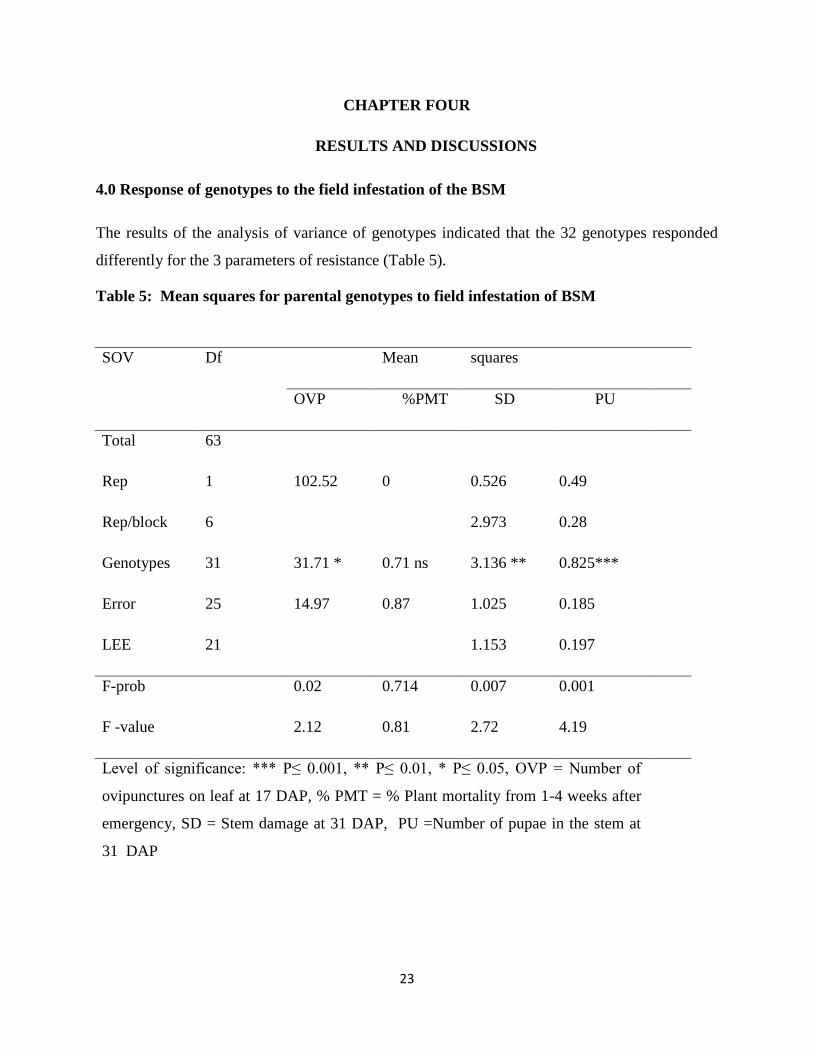
4.0 Response of genotypes to the field infestation of the BSM
The results of the analysis of variance of genotypes indicated that the 32 genotypes responded
differently for the 3 parameters of resistance (Table 5).
Table 5: Mean squares for parental genotypes to field infestation of BSM
SOV Df Mean squares
OVP %PMT SD PU
Total 63
Rep 1 102.52 0 0.526 0.49
Rep/block 6
2.973 0.28
Genotypes 31 31.71 * 0.71 ns 3.136 ** 0.825***
Error 25 14.97 0.87 1.025 0.185
LEE 21
1.153 0.197
F-prob
0.02 0.714 0.007 0.001
F -value 2.12 0.81 2.72 4.19
Level of significance: *** P≤ 0.001, ** P≤ 0.01, * P≤ 0.05, OVP = Number of
ovipunctures on leaf at 17 DAP, % PMT = % Plant mortality from 1-4 weeks after
emergency, SD = Stem damage at 31 DAP, PU =Number of pupae in the stem at
31 DAP
24
Significant effects were obtained for number of ovipunctures (P≤ 0.05), stem damage (P≤ 0.01)
and number of pupae in the stem (P≤ 0.001) suggesting that the genotypes had varying levels of
resistance to the bean stem maggot which would allow for selection of resistant genotypes
among the different genotypes. The genotypes that showed resistance if acceptable to the farmers
and the market could either be used directly by farmers in their field or utilized by breeders to
introgress BSM resistance genes into the Ugandan market class varieties.
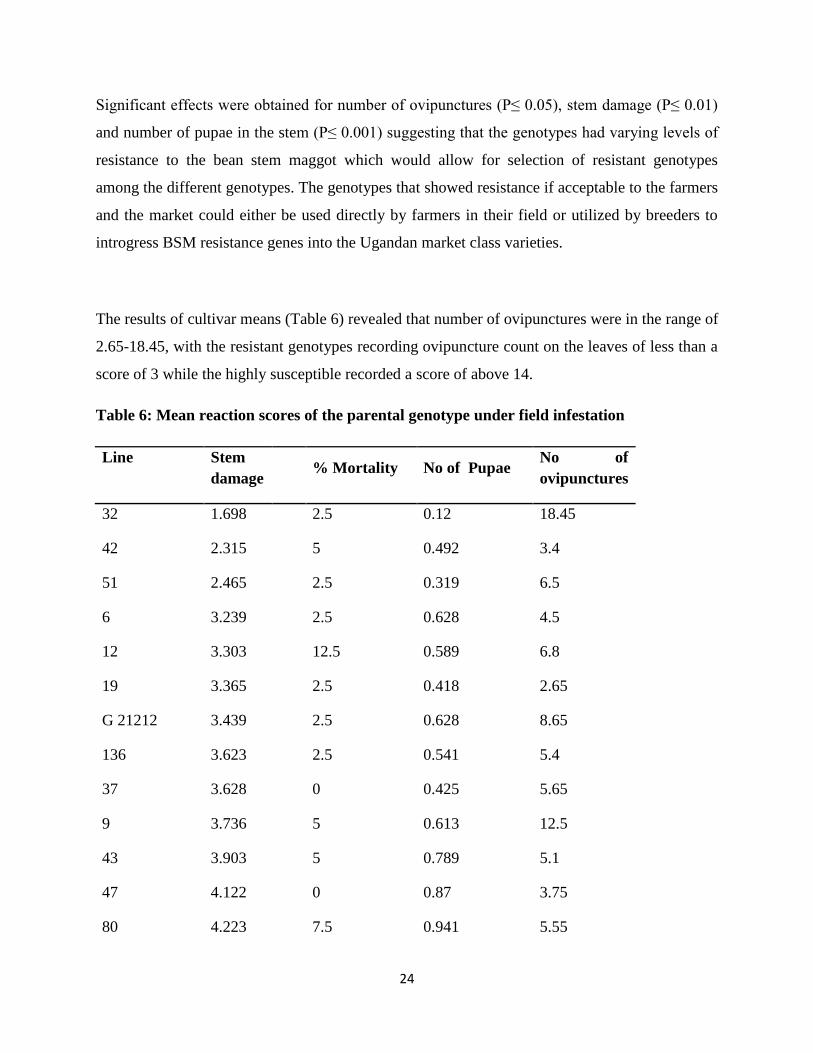
The results of cultivar means (Table 6) revealed that number of ovipunctures were in the range of
2.65-18.45, with the resistant genotypes recording ovipuncture count on the leaves of less than a
score of 3 while the highly susceptible recorded a score of above 14.
Table 6: Mean reaction scores of the parental genotype under field infestation
Line Stem
damage
% Mortality No of Pupae
No of
ovipunctures
32 1.698 2.5 0.12 18.45
42 2.315 5 0.492 3.4
51 2.465 2.5 0.319 6.5
6 3.239 2.5 0.628 4.5
12 3.303 12.5 0.589 6.8
19 3.365 2.5 0.418 2.65
G 21212 3.439 2.5 0.628 8.65
136 3.623 2.5 0.541 5.4
37 3.628 0 0.425 5.65
9 3.736 5 0.613 12.5
43 3.903 5 0.789 5.1
47 4.122 0 0.87 3.75
80 4.223 7.5 0.941 5.55
25
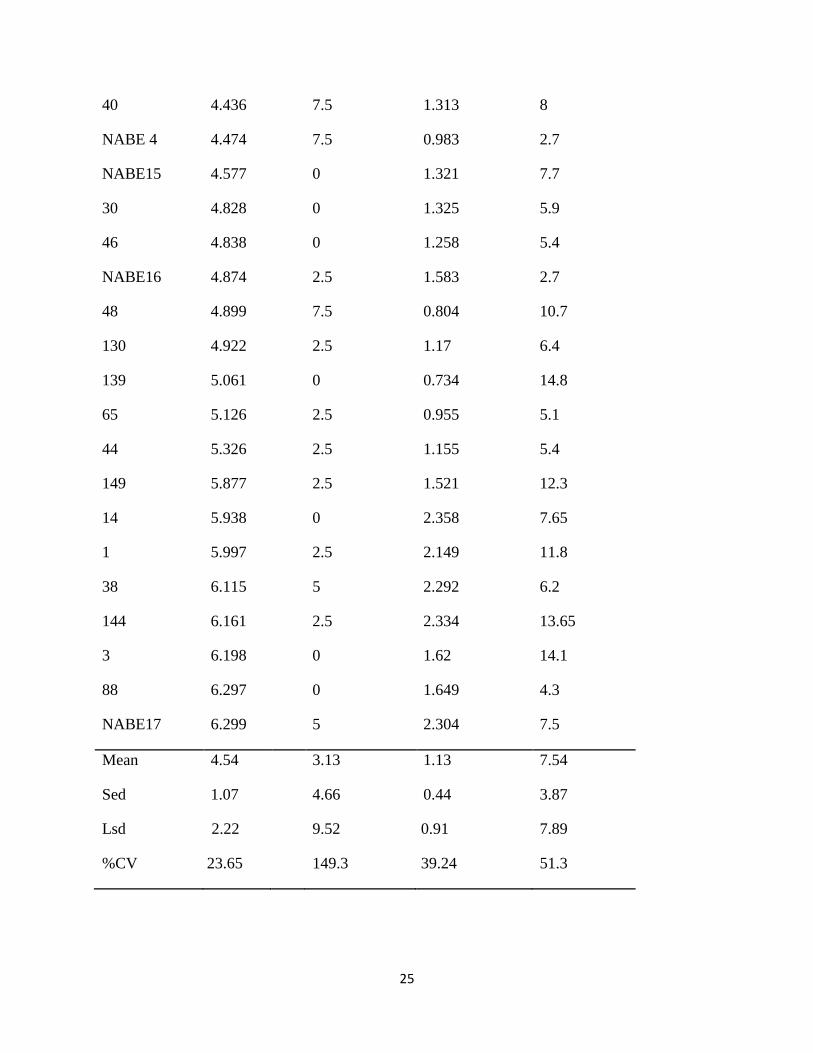
40 4.436 7.5 1.313 8
NABE 4 4.474 7.5 0.983 2.7
NABE15 4.577 0 1.321 7.7
30 4.828 0 1.325 5.9
46 4.838 0 1.258 5.4
NABE16 4.874 2.5 1.583 2.7
48 4.899 7.5 0.804 10.7
130 4.922 2.5 1.17 6.4
139 5.061 0 0.734 14.8
65 5.126 2.5 0.955 5.1
44 5.326 2.5 1.155 5.4
149 5.877 2.5 1.521 12.3
14 5.938 0 2.358 7.65
1 5.997 2.5 2.149 11.8
38 6.115 5 2.292 6.2
144 6.161 2.5 2.334 13.65
3 6.198 0 1.62 14.1
88 6.297 0 1.649 4.3
NABE17 6.299 5 2.304 7.5
Mean 4.54 3.13 1.13 7.54
Sed 1.07 4.66 0.44 3.87
Lsd 2.22 9.52 0.91 7.89
%CV 23.65 149.3 39.24 51.3
26
The least ovipuncture count was recorded on bean genotypes line 19 (2.65), NABE 16 (2.7) and
NABE 4 (2.7) while the highest were recorded on line 32 (18.45), 139 (14.8) and 3 (14.1). The
low ovipuncture numbers on the leaves of line 19, NABE 16 and NABE 4 suggested that these
genotypes possessed resistance characteristics like high pubescence that limited leaf puncture
and oviposition. Mushebezy and Karel (1985) reported that high pubescence density in bean
plants is associated with low BSM ovipuncture counts.
The mean performance of most of the genotypes for number of ovipuncture, pupae in stem and
stem damage followed a fairly similar trend. This trend was as expected, with genotypes having
large number of ovipuncture having more pupae in stem and higher stem damage. The results,
however, showed that this was not the case for Line 32 which had the highest number of
ovipunctures (18.45) and the least stem damage (1.698) and numbers of pupae in stem (0.12)
suggesting that this line had antibiosis resistance which prevented the growth of the mining
larvae in the vascular system of the stem. Li et al., (2004) explained this antibiosis mechanism as
resistance which was exhibited through reducing the fecundity, longevity and increasing the
mortality of the pest such that it does not reach the pupae stage.
Similarly Line 139 had high number of ovipunctures (14.8) and low pupae number (0.734), line
48 had 10.7 ovipuncture count, 0.804 number of pupae and line 9 had 12.5 and 0.613 number of
ovipuncture and pupae respectively.
The genotypic means for stem damage were in the range of 1.7 - 6.3 which showed that most of
the genotypes had resistance genes with a few that showed moderate susceptibility for stem
damage based on the scale of Kornegay & Cardona (1998). The least stem damage was shown
by Line 32 (1.698), line 42 (2.315) and line 51 (2.465) which had means in the range of 1-2.5
suggesting that they were resistant while line 88 (6.297) and NABE 17(6.299) had the highest
means therefore had more stem damage and were rendered susceptible (Kornegay & Cardona,
1998).

27
The results also showed that among the Ugandan preferred market class varieties NABE 4,
NABE 15 and NABE 16 which had low scores for the stem damage, number of pupae in stem
and number of ovipunctures were more resistant to the bean stem maggot than NABE 17. NABE
17 had a stem damage rating of 6.299 and 2.304 number of pupae therefore was considered
susceptible to the pest (Kornegay & Cardona, 1998). Abate (1990) recommended the use of
stem damage as the best indicator for BSM resistance.
This study focused on the O.spencerella species and genotype G21212 was found to be resistant
owing to its low means for stem damage (3.439), number of pupae (0.628) and number of
ovipunctures (8.65). In earlier screening work for resistance to O.phaseoli under natural
infestation, same genotype was found to be resistant to the species (Ojwang et al., 2010).
The correlation analysis (Table 7) of all the parameters revealed that number of pupae in the
stem was strongly and positively correlated to stem damage (p≤0.001) which indicated that stem
damage could be effectively used to predict the number of pupae in stem score and facilitate
indirect selection for resistant genotypes (Hallauer et al., 1988).
Table 7: Correlation analysis for the resistance parameters to the bean stem maggot
% Mortality No ovipunctures No Pupae Stem damage
% Mortality 1
No_of_ovipunctures -0.094 1
Pupae -0.155 0.096 1
Stem_damage -0.222 0.116 0.883*** 1
Level of significance: *** P ≤ 0.001
28
On the other hand, number of ovipunctures had a weak positive correlation to number of pupae
in stem and stem damage. Due to this weak correlation, number of ovipunctures cannot be used
reliably to indicate the level of resistance of the genotypes. Greathead (1968) and Songa (1999)
reported that not all leaf punctures have eggs deposited in them and, therefore, number of
ovipunctures is just an indication of the level of adult bean fly infestation on the bean plant but
not resistance of a genotype.
Results from the North Carolina Design (NCD II) analysis of variance for percent plant
mortality, number of ovipunctures, stem damage, number of pupae in stem and yield are
presented in Table 8.
29
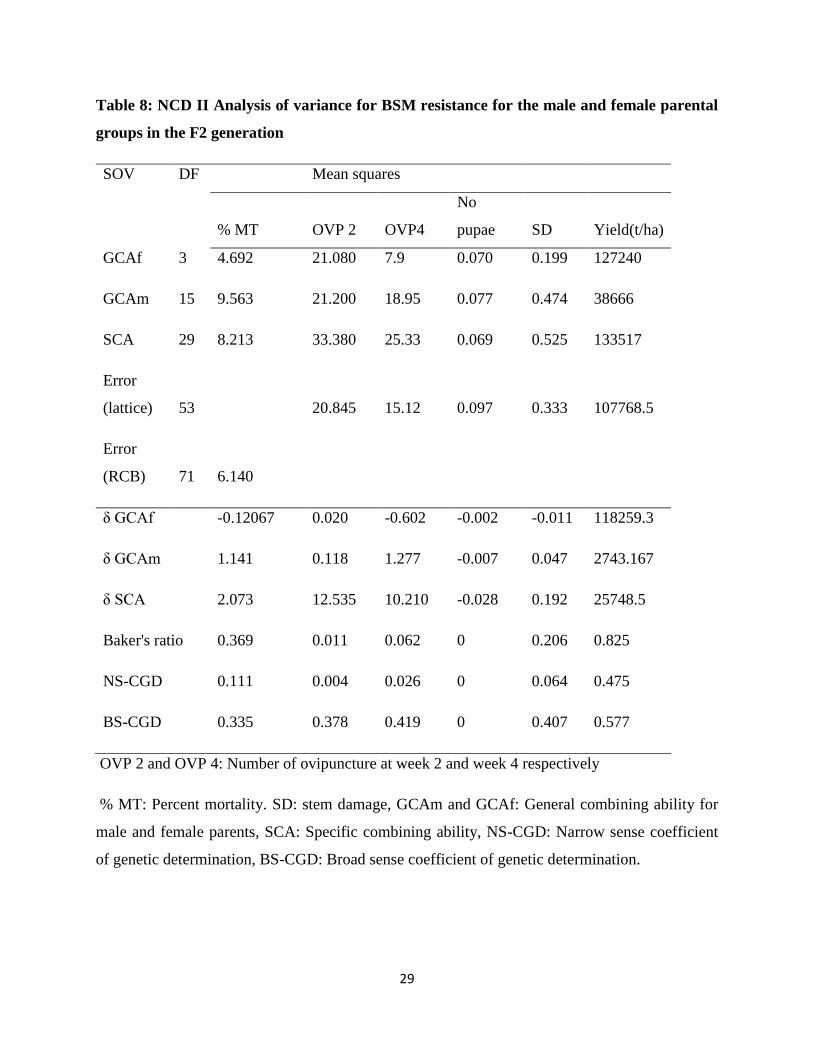
Table 8: NCD II Analysis of variance for BSM resistance for the male and female parental
groups in the F2 generation
SOV DF Mean squares
% MT OVP 2 OVP4
No
pupae SD Yield(t/ha)
GCAf 3 4.692 21.080 7.9 0.070 0.199 127240
GCAm 15 9.563 21.200 18.95 0.077 0.474 38666
SCA 29 8.213 33.380 25.33 0.069 0.525 133517
Error
(lattice) 53
20.845 15.12 0.097 0.333 107768.5
Error
(RCB) 71 6.140
δ GCAf
-0.12067 0.020 -0.602 -0.002 -0.011 118259.3
δ GCAm
1.141 0.118 1.277 -0.007 0.047 2743.167
δ SCA
2.073 12.535 10.210 -0.028 0.192 25748.5
Baker's ratio 0.369 0.011 0.062 0 0.206 0.825
NS-CGD
0.111 0.004 0.026 0 0.064 0.475
BS-CGD 0.335 0.378 0.419 0 0.407 0.577
OVP 2 and OVP 4: Number of ovipuncture at week 2 and week 4 respectively
% MT: Percent mortality. SD: stem damage, GCAm and GCAf: General combining ability for
male and female parents, SCA: Specific combining ability, NS-CGD: Narrow sense coefficient
of genetic determination, BS-CGD: Broad sense coefficient of genetic determination.

30
The general combining ability for male (GCAm) and female (GCAf) parents were not significant
for any of the parameters thus indicating that both the selected male and female parents did not
contribute significantly to the bean genotype resistance for the bean stem maggot. Similarly, the
specific combining ability was not significant for all parameters in the generalized NCD II
ANOVA suggesting that the individual parental combinations were similar in terms of their
difference from the predicted performance based on the means and the GCA values.
Both the narrow sense and broad sense coefficient of genetic determination values were low for
all resistance parameters with the Narrow sense coefficient of genetic determination (NS-CGD)
lying in the range of 0.00 to 0.11 and Broad sense coefficient of genetic determination (BS-
CGD) in the range of 0.00 to 0.42. Low NS-CGD estimates especially for the pupae in stem
(0.00) suggested the importance of non-additive gene action in the inheritance of resistance to
the bean stem maggot. The performance of the progeny cannot, therefore, be predicted from the
parental performance since inherited portion is very small. These results are in contrast to the
reports of Ojwang et al (2011) who used a different set of genotypes and reported low to
moderate narrow sense heritability estimates in the range of 0.22 to 0.45 and the predominance
of additive to non-additive gene action in the study of O. phaseoli resistance. The low estimates
of the narrow sense coefficient of genetic determination suggested that high selection pressure
needs to be used during the breeding process (Gonzales et al., 2004).
The results of the general predictability ratio (Bakers ratio) for the resistance parameters showed
that the SCA effects were much higher compared to the GCA effects in conferring resistance to
the F2 progeny as the ratio was in the range of 0.00 to 0.37 (Table 8) implying that dominance
and other forms of epistasis are important in controlling the resistance to BSM. Ojwang et al.
(2011) reported general predictability ratios ranging from 0.63-0.9 indicating predominance of
additive gene effects to non-additive gene effects but, Wang & Gai (2001) repoted that in
soybean, the inheritance of resistance to the bean fly (Melanagromyza sojae Zehntner) was
completely dominant with the heritability for the major gene being higher than that of polygenes.
Distabanjong and Srinives (1985) and Mushi and Slumpa (1998) reported the importance of
31
additive gene action but acknowledged that non-additive gene effects were also important and
could not be ignored as was the case in the current study.
The NS-CGD and BS-CGD for yield were 0.475 and 0.577 respectively which indicated
moderate heritability with GCA effect estimates being higher than the SCA estimates as shown
from the general predictability ratio of 83%. Such a high percentage suggested the important role
of additive gene action in conditioning yield potential. The predominance of additive gene
effects suggested that yield could reliably be selected for in early generations using simple
selection procedures like pure line selection and pedigree (Singh & Oswalt, 1991). Similar
results of the predominance of additive gene action for yield inheritance were reported by
Ojwang et al (2011).
32
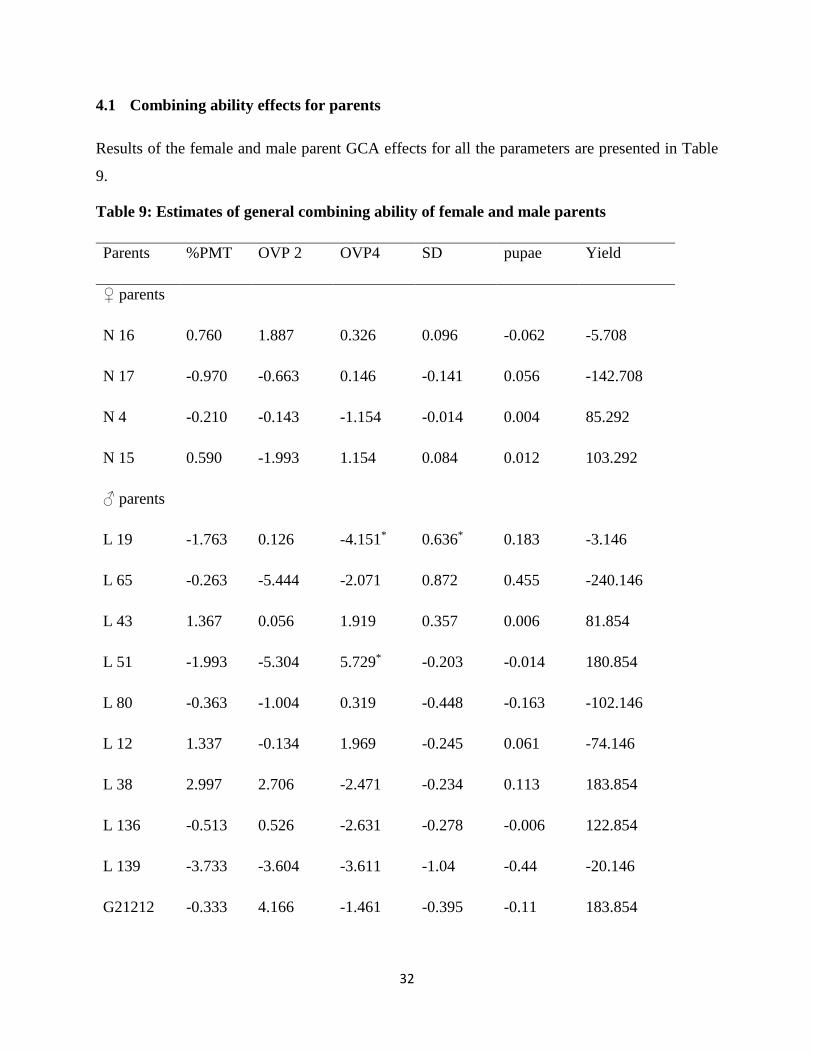
4.1 Combining ability effects for parents
Results of the female and male parent GCA effects for all the parameters are presented in Table
9.
Table 9: Estimates of general combining ability of female and male parents
Parents %PMT OVP 2 OVP4 SD pupae Yield
♀ parents
N 16 0.760 1.887 0.326 0.096 -0.062 -5.708
N 17 -0.970 -0.663 0.146 -0.141 0.056 -142.708
N 4 -0.210 -0.143 -1.154 -0.014 0.004 85.292
N 15 0.590 -1.993 1.154 0.084 0.012 103.292
♂ parents
L 19 -1.763 0.126 -4.151* 0.636* 0.183 -3.146
L 65 -0.263 -5.444 -2.071 0.872 0.455 -240.146
L 43 1.367 0.056 1.919 0.357 0.006 81.854
L 51 -1.993 -5.304 5.729* -0.203 -0.014 180.854
L 80 -0.363 -1.004 0.319 -0.448 -0.163 -102.146
L 12 1.337 -0.134 1.969 -0.245 0.061 -74.146
L 38 2.997 2.706 -2.471 -0.234 0.113 183.854
L 136 -0.513 0.526 -2.631 -0.278 -0.006 122.854
L 139 -3.733 -3.604 -3.611 -1.04 -0.44 -20.146
G21212 -0.333 4.166 -1.461 -0.395 -0.11 183.854

33
L 40 0.117 -3.944 0.069 -0.388 -0.242 39.854
L 42 -1.163 -0.384 -1.711 0.462 0.258 52.854
L 32 3.867** 2.446 3.759 -0.145 -0.041 -88.146
L 48 1.367 -1.954 0.239 0.028 0.023 -73.146
L 37 -1.133 3.866 0.169 -0.019 0.099 -177.146
L 47 -1.763 0.876 0.549 0.374 -0.123 -45.146
% PMT= percent plant mortality, SE= standard error, OVP 2=number of ovipunctures at week 2,
OVP4= Number of ovipunctures at week 4, SD= Stem damage, N=NABE variety, L=Line
number, ***, **, * = Significant levels at P≤ 0.001, 0.01, 0.05 respectively
The female parents had non -significant GCA effects for all the resistance parameters and yield.
For resistance of a genotype to a pest, significant negative GCA values are desired (Ajala et al.,
2008) since such estimates are possessed by genotypes which confer resistance to the pest.
Among the female parents, NABE 4 had negative GCA values for percent mortality (-0.210),
stem damage (-0.014), number of ovipunctures at 2 weeks (-0.143) and at 4 weeks (-1.154). This
indicates that this particular variety was the best general combiner as compared to the other
female parents and can be utilized effectively in the breeding program. NABE 17 which had
negative GCA values for percent mortality (-0.970), number of ovipunctures at week 2 (-0.663)
and stem damage (-0.141) could also be utilized for hybridization.

34
For yield, positive GCA estimates are desired (Nsabiyera et al., 2013) and were obtained for
NABE 4 (85.292) and NABE 15 (103.292). Among the female parents, NABE 17
(-142.708) and NABE 16 (-5.708) were the poor general combiners for yield since they had
negative GCA values and therefore are not suitable for inclusion in the hybridization program.
Among the male parents, Line 139 was the best general combiner for resistance to the BSM
since it had negative GCA effects (Ajala et al., 2008) for percent plant mortality (-3.733),
number of ovipunctures at week 2 (-3.604) and week 4 (-3.611), stem damage (-1.04) and
number of pupae in stem (-0.44) . The results are evidence that line 139 strongly introgressed its
resistance genes for BSM to the progeny. The same genotype was however a poor combiner for
yield as shown by the negative GCA estimate
(-20.146). Line 51, Line 80, Line 136 and G21212 also had negative GCA values for most of the
parameters indicating that they are good general combiners for resistance to the bean stem
maggot. L 19 had a significant negative (p≤ 0.05) GCA value estimate for number of
ovipuncture at week 4 suggesting that it contributed to BSM resistance. Results further indicated
that some of these genotypes like Line 51(180.854), Line 136 (122.854) and G21212 (183.854)
are good general combiners for yield, so they can be utilized in breeding for both yield and bean
stem maggot resistance. L 43, however, contributed negatively to resistance since it had all
positive GCA effects for all parameters and was, therefore, the worst combiner among the male
parent. Significant positive GCA effects were shown by Line 19 (P≤0.05) for stem damage and
Line 32 (P≤0.01) for percent mortality indicating that they significantly contributed to
susceptibility of the F2 progeny to the bean fly.
Line 38 (183.854) and G21212 (183.854) were the best general combiners for yield while Line
65 (-240.146) and Line 37 (-177.146) were the worst combiners for the character.
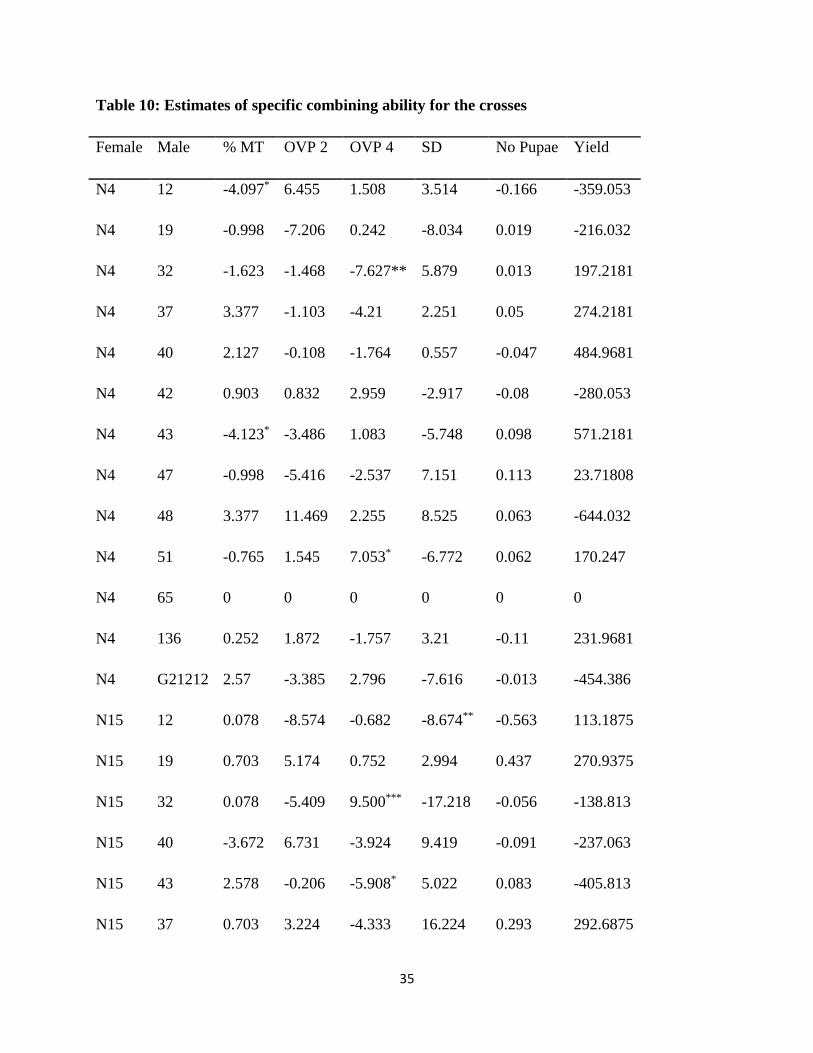
4.2 Specific combining ability estimation
The results of the estimates for specific combining ability effect are presented in Table 10
35
Table 10: Estimates of specific combining ability for the crosses
Female Male % MT OVP 2 OVP 4 SD No Pupae Yield
N4 12 -4.097* 6.455 1.508 3.514 -0.166 -359.053
N4 19 -0.998 -7.206 0.242 -8.034 0.019 -216.032
N4 32 -1.623 -1.468 -7.627** 5.879 0.013 197.2181
N4 37 3.377 -1.103 -4.21 2.251 0.05 274.2181
N4 40 2.127 -0.108 -1.764 0.557 -0.047 484.9681
N4 42 0.903 0.832 2.959 -2.917 -0.08 -280.053
N4 43 -4.123* -3.486 1.083 -5.748 0.098 571.2181
N4 47 -0.998 -5.416 -2.537 7.151 0.113 23.71808
N4 48 3.377 11.469 2.255 8.525 0.063 -644.032
N4 51 -0.765 1.545 7.053* -6.772 0.062 170.247
N4 65 0 0 0 0 0 0
N4 136 0.252 1.872 -1.757 3.21 -0.11 231.9681
N4 G21212 2.57 -3.385 2.796 -7.616 -0.013 -454.386
N15 12 0.078 -8.574 -0.682 -8.674** -0.563 113.1875
N15 19 0.703 5.174 0.752 2.994 0.437 270.9375
N15 32 0.078 -5.409 9.500*** -17.218 -0.056 -138.813
N15 40 -3.672 6.731 -3.924 9.419 -0.091 -237.063
N15 43 2.578 -0.206 -5.908* 5.022 0.083 -405.813
N15 37 0.703 3.224 -4.333 16.224 0.293 292.6875

36
N15 48 -2.422 -0.991 1.792 -4.774 -0.207 218.9375
N15 136 1.953 0.051 2.803 -2.993 0.105 -114.063
N16 12 -0.067 -4.576 1.916 -4.34 0.468 -217.547
N16 19 -1.968 6.553 -0.959 9.569** -0.384 -75.5258
N16 32 2.407 6.631 1.817 8.319 0.031 42.72417
N16 37 -2.593 3.446 -4.661 10.88 0.385 8.724167
N16 40 -1.343 -6.699 7.219** -10.854 0.117 87.47417
N16 42 -0.067 0.581 -3.378 6.589 -0.112 -276.547
N16 43 4.907** 5.383 6.323* 1.729 -0.05 133.7242
N16 47
-1.968 5.373 -1.334 -
21.989** 0.025
-313.776
N16 48 2.407 -7.822 -1.122 -3.283* -0.238 395.4742
N16 51 0.765 -1.545 -7.053* 6.772 -0.062 -170.247
N16 80 1.635 0.322 1.939 0.079* -0.255 -164.073
N16 136 -3.218 -1.809 0.964 -0.965 0.032 153.4742
N16 139 0 0 0 0 0 0
N16 G21212 -0.9 -5.836 -1.671 -2.505 0.044 396.12
N17 12 -0.862 6.232 9.553*** -4.457** 0.129 -396.13
N17 19 2.263 -4.521 -0.035 -4.529 -0.072 20.62025
N17 32 -0.862 0.247 -3.69 3.02 0.012 -101.13
N17 37 4.164* -1.88 -3.424 0.827 -0.302 576.5994
37
N17 38 0 0 0 0 0 0
N17 40 2.888 0.077 -1.531 0.878 0.022 -335.38
N17 42 -0.836 -1.413 0.419 -3.672 0.192 556.5994
N17 43 -3.362 -1.691 -1.498 -1.003 -0.13 -299.13
N17 47 2.263 -3.181 8.205** -1.386** -0.431 -2.62975
N17 48 -3.362 -2.656 -2.925 -0.468 0.383 29.62025
N17 80 -1.635 -0.322 -1.939 -0.079* 0.255 164.073
N17 136 1.013 -0.113 -2.009 0.748 -0.026 -271.38
N17 G21212 -1.67 9.22 -1.125 10.122 -0.031 58.26609
SE
1.752 0.649 2.750 0.408 0.22
232.130
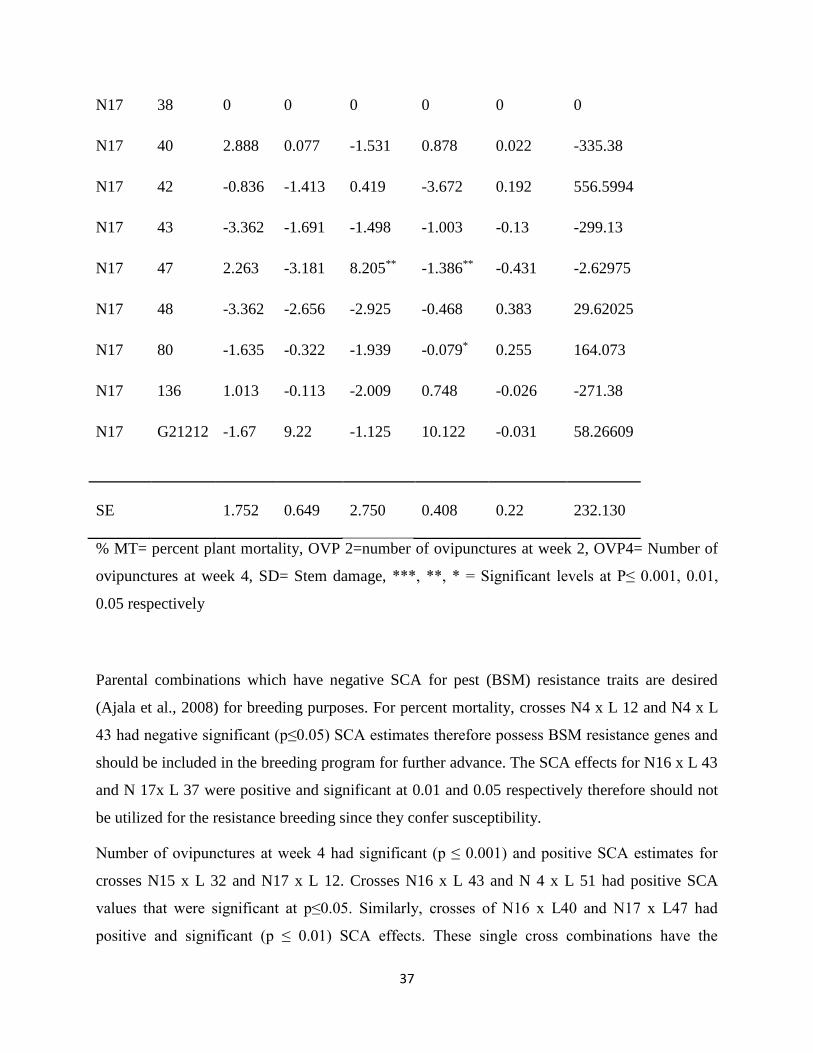
% MT= percent plant mortality, OVP 2=number of ovipunctures at week 2, OVP4= Number of
ovipunctures at week 4, SD= Stem damage, ***, **, * = Significant levels at P≤ 0.001, 0.01,
0.05 respectively
Parental combinations which have negative SCA for pest (BSM) resistance traits are desired
(Ajala et al., 2008) for breeding purposes. For percent mortality, crosses N4 x L 12 and N4 x L
43 had negative significant (p≤0.05) SCA estimates therefore possess BSM resistance genes and
should be included in the breeding program for further advance. The SCA effects for N16 x L 43
and N 17x L 37 were positive and significant at 0.01 and 0.05 respectively therefore should not
be utilized for the resistance breeding since they confer susceptibility.
Number of ovipunctures at week 4 had significant (p ≤ 0.001) and positive SCA estimates for
crosses N15 x L 32 and N17 x L 12. Crosses N16 x L 43 and N 4 x L 51 had positive SCA
values that were significant at p≤0.05. Similarly, crosses of N16 x L40 and N17 x L47 had
positive and significant (p ≤ 0.01) SCA effects. These single cross combinations have the
38
undesired susceptible genes therefore cannot be included for further hybridization. On the
contrary, crosses N15 x L 43 and N16 x L 51 which had negative and significant (p≤0.05) SCA
estimates for number of ovipunctures can be included for further hybridization since they have
BSM resistance genes.
For stem damage, crosses of N15 x L12, N 16 x L47, N17 x L 12 and N17 x L47 had significant
(p≤0.01) and negative SCA values. The SCA effects for stem damage for crosses N16 x L 48,
N17 x L80 were negative and significant at p≤0.05. For the same trait, cross N16 x L80 had a
significant negative SCA value at p≤0.05. This implies that the parents of these crosses
introgressed their resistance genes to the progeny and these specific combinations can be used in
the breeding program in the development of BSM resistant bean varieties. On the other hand,
cross of N16 x L19 had a significant positive SCA value at p≤0.01 therefore should not be
included for advance in the breeding program.
The crosses that had NABE 17 as the female parent performed better for resistance as evidenced
from the negative SCA values for most parameters per cross which was expected owing to the
fact that it was a good general combiner (Table 10) for resistance to the bean stem maggot.
Crosses for NABE 4 with line 40 and 43 gave high SCA estimates for yield and also had
negative SCA effects for resistance traits suggesting that progenies from these crosses could give
better yields a breeding program and also confer resistance to the pest. Number of pupae in stem,
number of ovipunctures and yield did not have any significant positive or negative SCA effects
implying that the resistance performance of the specific combinations from the hybridization did
not differ.
4.3 Parent-offspring regression analysis
The results of the parent-offspring regression analysis of F2 and F3 progeny data for the
resistance parameters are presented in table 11.

39
Table 11: Analysis of variance for regression of F2 and F3 means on the mid parent means
Mean squares
F2 F3
Source Df % PMt OVP2 OVP4 PU SD % PMt OVP2 OVP4
SD
Regression 1 0.695 0.26 10.06 0.237 0.771 0.65 83.25 0.52
5.389**
Residual 29 6.914 26 20.78 0.07 0.461 13.29 23.43 24.34
0.483
Total 30 6.707 25.14 20.42 0.075 0.472 12.87 25.42 23.51
0.472
b
0.01 0.02 0.16 0.49 0.97 0.109 0.37 0.04
0.366
R2 0.0035 0.0003 0.0164 0.105 0.2778 0.002 0.109 0.0007
0.055
Df= degrees of freedom, % PMT= percent plant mortality, OVP 2=number of ovipunctures at
week 2, OVP4= Number of ovipunctures at week 4, PU= Number of pupae, SD= Stem damage,
b = regression coefficient, R2 = coefficient of determination, **, * = Significant levels at P≤ 0.01,
0.05 respectively.
The analysis of F2 progeny data showed that the variance for all parameters were not significant
suggesting that the response of genotypes did not vary for resistance to the bean stem maggot
and therefore could not allow for selection.
The regression coefficient “b” which is a direct estimate of narrow sense heritability (h2)
(Poehlman & Sleper, 1995) was in the range of 0.01 - 0.97 (Table 11). Resistance parameters
like percent plant mortality (1%), number of ovipunctures at week 2 (2%) and week 4 (16%) had
low estimates of heritability which implies that these traits are conditioned by non-additive gene
effect and, therefore, selection for resistance based on these parameters should be done in later
generations (Poehlman & Sleper, 1995). A high heritability estimate was obtained for stem
damage (97%) and a moderate heritability for pupae in stem (49%) indicating the predominance
of additive gene action in conditioning the resistance of the bean plants to the BSM based on
40
these traits. The selection method used by the breeding program for these traits should be those
implemented in early generations which will save the resources and obtain quick genetic advance
(Poehlman & Sleper, 1995).The regression coefficient of determination showed that only about
27% (R2) variation of the F2 progeny means can be explained by their parental means, therefore
phenotypic selection of progeny based on their parental means cannot be reliably used by the
breeding program.
The F3 parent offspring regression analysis of results showed significance of the variance for
stem damage at p ≤ 0.01 respectively. Results showed non-significance for percent plant
mortality, number of ovipunctures at week 2 and week 4. The regression coefficient ( b) which
gives an indication of the narrow sense coefficient of genetic determination for percent plant
mortality (10.9%), number of ovipunctures at week 2 (37%) and week 4 (4%), stem damage
(36.6) were low. Low estimates for the narrow sense heritability implied that the inheritance of
these traits is predominantly controlled by non-additive gene action, therefore, the selection
based on these characters should be done in later generations (Singh & Oswalt, 1991) and high
selection pressure should be used (Gonzales et al., 2004). The F3 progeny mean scores could
only be explained by their parental values up to a percentage of 10% based on the coefficient of
determination (R2 ) values making prediction of progeny performance based on parental scores
difficult and unreliable.
41
CHAPTER FIVE
CONCLUSION AND RECOMMENDATIONS
5.0 Conclusion
The study revealed that there was genetic variability among the Malawi and local bean genotypes
utilized in the study. Several of the screened parents were resistant or moderately resistant with
very few being susceptible. Sources of resistance identified included Line 19, 51, 12, 136, 6 and
G 21212. The Ugandan varieties whose resistance levels were earlier unknown were found to
possess considerable amount of resistance.
The inheritance study revealed that non-additive gene action was more important compared to
the additive gene action in transmitting the genes that confer resistance to the BSM (O.
spencerella). The results also showed that it was not possible to predict the performance of the
progeny based on the parental performance. The yield predictability ratios, however, indicated
the predominance of additive gene action for yield.
The heritability study based on mid- parent offspring regression revealed that both non-additive
and additive gene action is responsible for conditioning resistance to O.spencerella. The
heritability estimates for other resistance parameters were low but some parameters like pupae in
stem and stem damage had high narrow sense heritability estimates.
5.1 Recommendations
The following have been recommended:
The genotypes Line 19, 51, 12, 136, 6, G 21212 and Line 139 should be used for
introgression as they showed considerable resistance to O. spencerella. For yield, line 38
and G21212 were the best general combiners and so should be utilized for hybridization.
42
An in-depth study should be conducted to ascertain the morphological and chemical
characteristics possessed by the resistant genotypes. This will ease the selection of
resistant genotypes to be used in the breeding program.
43
Literature Cited
Abate, T., 1990. Studies on genetic, cultural and inscticidal controls against the bean fly,
Ophyiomyia phaseoli (Tyron) (Diptera: Agromyzidea) in Ethiopia. Simon Fraser
University.
Abate, T., 1991. Seed dressing insecticides for bean fly [Ophiomyia phaseoli (Tryon) (Diptera:
Agromyzidae)] control in Ethiopia. Tropical Pest Management, 37(4), pp.334-37.
Abate, T., 1991. The bean fly, Ophiomyia phaseoli (Tryon) (Dipt., Agromyzidae), and its
parasitoids in Ethiopia. Journal of Applied Entomology, 111(1-5), p.278–285.
Abate, T. & Ampofo, O.J.K., 1996. Insect pests of beans in Africa: their ecology and
management. Annu. Rev. Entomol., 41, p.45–51.
Abate, T., Ampofo, O.J.K. & Huis, V.A., 2000. Pest management strategies in traditional
agriculture. Annu. Rev. Entomol., 45, p.631–659.
Ajala, S.O., Odiyi, A.C., The, C. & Olaoye, G., 2008. Population cross dialleleof maize
genotypes with varying levels of resistance to the pink stalk borer (Sesamia calamistis:
Hampson) and the sugarcane borer (Eldana sacharina: Walker). 53, pp.79-86.
Akibode, & Maredia, , 2011. Global and Regional Trends in Production, Trade and
Consumption of Food Legume Crops. Michigan State University.
Anon., 2003. Eastern and Central Africa Bean Research Network on Priority-Setting Workshop.
Final report. Kenya: ASARECA.
Anon., 2005. Dry Beans: Product Profile No. 12. Uganda Export Promotion Board.
Baker, R.J., 1978. Issues in diallel analysis. Crop science, 18(4), pp.533-36.
Bhullar, G.S., Gill, K.S. & Khehra, A.S., 1979. Combining ability analysis over F1-F5
generations in diallele crosses of bread wheat. Theor.Appl.Genet, 55, pp.77-80.
44
Broughton, J.W. et al., 2003. Bean (Phaseolous spp) model legumes. plant and soil, 252, pp.55-
128.
Byabagambi, S. & Kyamanywa, S., 1997. Effects of some agronomic practices on bean
infestation and damage by bean stem maggot. In African Crop Science Cnference
Proceedings., 1997.
Chaco'n S, M.I., Pickersgill, B. & Debouck, D.J., 2005. Domestication patterns in common bean
(Phaseolus vulgaris L.) and the origin of the Mesoamerican and Andean cultivated races.
Theoretical and Applied Genetics, pp.432-44.
Clement, S.L., Cristofaro, M., Cowgill, S.E. & Weigand, S., 1998. Germplasm resources, Insect
resistance and Grain Legume improvement. In S. Clement & Quisenberry, eds. Global
Plant Genetic Resources for Insect-Resistant Crops. pp.131-40.
Dharmasena, C.M.D. & Fernando, M.H.J.P., 1988. Resistance of cowpea varieties to beanfly-
Ophiomyia phaseoli (tryon) Dip: Agromyzidae. Tropical Agriculture Rist., 144, pp.155-
61.
Distabanjong, K. & Srinives, P., 1985. Inheritance of Beanfly Resistance in Mungbean( Vigna
radiata(L) Wilczek). Kasetsart J. (Nat.Sci.), 19, pp.75-84.
Dobholkar, A.R., 1999. Elements of biometrical genetics. 2nd ed. New Delhi, India: Ashok
Kumae Mittal concept publishing company.
Dursun, A., 2007. Variability, Heritability and Correlation Studies in beans (Phaseolus vulgaris
L.) Genotypes. World Journal of Agricultural Sciences, 3(1), pp.12-16.
Edwards, O. & Singh, B.K., 2006. Resistance to insect pest: what do legumes have to offer?
Euphytica, 147, pp.273-85.
Falconer, D.S., 1989. Introduction to quantitative genetics. 3rd ed. New York: Longman.
45
Falconer, D.S. & Mackay, T.F.C., 1996. Introduction to quatitative genetics. 4th ed. Essex:
Longman.
FAO, 2014. FAOSTAT. [Online] Available at:
http://faostat.fao.org/site/567/DesktopDefault.aspx?PageID=567#ancor [Accessed
Wedesday August 2014].
Fehr, W.R., 1993. Principles of cultivar development. Theory and techniquesWalter. 1st ed. Iowa
state University.
Fehr, W.R., Fehr, E.L. & Jessen, H.J., 1987. Principles of caltivar development. 1st ed. New
York: Macmillan Publishing Company.
Fernandez, G.C.J. & Miller, J.C., 1985. Estimation of heritability by parent offspring regression.
Theoretical and applied genetics, 70, pp.650-54.
Gepts, P. & Debouck, D., 1993. Common Beans: Research for crop improvement. C. A. B
International and CIAT.
Gonzales, J.W. et al., 2004. Heritability of resistance to potato leaf hopper in dry beans.
HortScience, 39(7), pp.1578-80.
Greathead, D.J., 1968. A study in East Africa of the bean flies (Dipt.:Agromyzidae) affecting
Phaseolus vulgaris and of their naturalenemies, with a description of a new species
Melanagromyza Hend. Bulletin of Entomological Research, 59(3), pp.541- 561.
Haggblade, & Dewina, , 2010. Staple food prices in Uganda. Maputo, Mozambique.
Hallauer, , Carena, & Filho, J.B.M., eds., 2010. Quantitative genetics in maize breeding. 3rd ed.
NewYork: Springer.
Hallauer, A.R., Carena, M.J. & Filho, J.B.M., 1988. Quantitative genetics in maize breeding. 2nd
ed. New York: Springer.

46
Hillocks, R.J. et al., 2006. Phaseolus bean improvement in Tanzania, 1959-2005. Euphytica, 150,
pp.215-31.
IBP, 2014. Bean facts & figures/ Intergrated breedig platform. [Online] Available at:
https://www.integratedbreeding.net/bean-facts-figures [Accessed 3 April 2014].
Jatoi, W., Baloch, , Veesar, & Panhwar, , 2011. Combining abilityestimates from LineX Tester
analysis for yield and yield components in uplandcotton genotypes. J. Agric. Res., 49(2),
pp.165-72.
Karel, K.A., 1985. A Bibliography of the bean flies Ophiomyia phaseoli (Tryon), and O.
centrosematis (de Meij) and Melanagromyza Spencerella (Greathead),(Diptera:
Agromyzidae). Bean/Cowpea CRSP, 200 Center for International Programs, Michigan
State Univ.
Kennedy, G.G. & Barbour, J.B., 1992. Analysis and inheritance of resistance variation. In R.S.
Fritz & E.L. Simms, eds. Plant Resistance to Herbivores and Pathogens: Ecology,
Evolution, and Genetics. London: Chicago press. pp.13-41.
Anon., 2001. Rudolf Mansfeld and Plant Genetic Resources. In Knüpffer , H. & Ochsmann, J.,
eds. Proceedings of a symposium dedicated to the 100th birthday of Rudolf Mansfeld.
Gatersleben, Germany, 2001.
Kornegay, J. & Cardona, C., 1998. Breedng for insect resistance in beans. In V.O. A, ed.
Common Beans: Research for crop improvement. Schoonhoven. pp.619-48.
Kyamanywa, S., 1997. The incidence of the bean fly Ophiomyia sp. and its hymenopteran
parasitoids in the major bean growing areas of Uganda. In African Crop Science
Conference Proceedings., 1997.
Leakey, C.L.A., 1970. The improvement of beans (Phaseolus vulgaris) in East Africa. In Leakey,
C.L.A., ed. Crop improvement in East Africa, The commonwealth Agricultural Bureaux.
London, 1970.

47
Letourneau, D.K., 1994. Bean fly, management practices, and biological control in Malawian
subsistence agriculture. Agriculture, Ecosystems and Environment, 50, pp.103-11.
Li, Y., Hill, & Hartman, G., 2004. Effect of Three Resistant Soybean Genotypes on the
Fecundity, Mortality, and Maturation of Soybean Aphid (Homoptera: Aphididae).
Journal of Economic Entomology, 97(3), pp.1106-11.
Lynch, M. & Walsh, B., 1998. Genetics and analysis of quantitative traits. Sunderland,
Massachusetts: Sinauer associates, Inc.
MAAIF, 2012. Proposed plan to operationalisethe NON-ATAAS component of theagriculture
sector development strategy and investment plan. Kampala: Ministry of agriculture,
animal industry and fisheries Ministry of agriculture, animal industry and fisheries.
Maerere, A.P. & Karel, K.A., 1984. Evaluation of common Bean cultivars for resistanceto Bean
fly (Ophiomyia phaseoli tyron). Morogoro, Tanzania: Sokoine University of Agriculture,
Department of Crop Science.
Maxwell, F.G., Jenkins, J.N. & Parrot, W.L., 1972. Resistance of plants to insects. Advances in
agronomy, Elsevier, 24, pp.187-265.
Miklas, P.N., Kelly, J.D., Beebe, S.E. & Blair, M.W., 2006. Common bean breeding for
resistance against biotic and abiotic stresses: From classical to MAS breeding. Euphytica,
47, pp.105-06.
Mulumbaa, J.W. et al., 2012. A risk-minimizing argument for traditional crop varietal diversity
use to reduce pest and disease damage in agricultural ecosystems of Uganda. Agriculture,
Ecosystems and Environment, 157, pp.70-86.
Mushebezy, D.M.K. & Karel, A.K., 1985. Resistance to bean fly (Ophiomyia phaseoli Tyron)
common bean. In Minjas, A.N. & Salema, M.P., eds. Proceedings of the fourth workshop
on bean research. Morogoro, 1985.

48
Mushi , C.S. & Slumpa, S., 1998. Diallel analysis of bean crosses for resistance to bean stem
maggot (Ophiomyia spp). Arusha Tanzania.: Bean improvement cooperative Selian
Agricultural Research Station.
Narayan S, T. & Wen Jin, H., 1993. Morphological characters in Vigna glabrescens resistant to
Agromyzids (Diptera: Agromyzidae). Journal of economic entomology, 86(4), pp.1287-
90.
Narayan, T.S. & Wedanimbi, T., 1993. Mechanism of Resistance to Bean Fly (Diptera:
Agromyzidae) in Soybean. Journal of Economic Entomology, 86(3), pp.981-985(5).
Nderitu, J.H., 1993. Evaluation of bean cultivars at different stages of growth for resistance to
bean flies. E.Afr.agric.For.J, 58(3), pp.133-34.
Nsabiyera, V. et al., 2013. Combining ability for field resistance to disease, fruit yield and yield
factors among hot pepper (Capsicum annuum L.) genotypes in Uganda. International
journal of Plant breeding, 7(1), pp.12-21.
Ogecha, J., Ampofo, J.K.O. & Owuori, J., 2000. Development of an integrated pest management
strategy for controlling bean stem maggot in South Western Kenya. Participatory
technology develoment fur soil mangement by small holders in Kenya. In Proceedings of
the 2nd conference of soil mangement and legumeresearch network projects. Mombasa,
Kenya, 2000. Kenya Agricultural Research institute.
Ojwang, P.P., Melis, , Githiri, & Songa, , 2011. Breeding options for improving common bean
for resistance against bean fly (Ophiomyia spp.): a review of research in eastern and
southern Africa. Euphytica, p.363–371.
Ojwang, P.P.O., Melis, R., Githiri, M.S. & Songa, J.M., 2011. Genetic analysis for resistance to
bean fly (Ophiomyia phaseoli) and seed yield among common bean gentypes in a semi-
arid environment. Field Crops Research, 120 , p. 223–229.
49
Ojwang, P.O., 2010. Genetic Studies on Host-Plant Resistance to Bean Fly (Ophiomyia spp.)
and Seed Yield in Common Bean (Phaseolus vulgaris) under Semi-Arid Conditions.
Pietermaritzburg.
Ojwang, P.P.O., Melis, R., Songa, J.M. & Githiri, M., 2010. Genotypic response of common
bean to natural field populations of bean fly (Ophiomyia phaseoli) under diverse
environmental conditions. Elsevier, 117, pp.139-45.
Oree, A., Slumpa, S. & Ampofo, O.J.K., 1990. Effect of environment and location on the species
composition and populations of beanfly (Ophiomyia spp: Diptera, Agromyzidae) in
Tanzania. In B, J., ed. Second Regional Workshop on Bean Research in Eastern Africa.,
1990. African Workshop Series No. 7.
Peter, K.H., Swella, G.B. & Mushobozy, D.M.K., 2009. Effect of Plant Populations on the
Incidence of Bean Stem Maggot (Ophiomyia spp.) in Common Bean Intercropped with
Maize. Plant Protect Sci, 45(4), pp.148-55.
Poehlman, J.M. & Sleper, D.A., 1995. Breeding field crops. fouth ed. Iowa: Iowa state university
press.
Purseglove, J.W., 1976. The origins and migrations of crops in tropical Africa. In Harlan, ed.
Origins of African Plant Domestication. Chicago: Aldine. pp.291-309.
Rogers, D.J., 1979. Host plant resistance to Ophyiomyia Phaseoli (Tyron) (Diptera:
Agromyzidae) in phaseolus vulgaris. J. Aust. ent. Soc, 18, pp.245-50.
Sariah, J.B. & Makundib, R.H., 2007. Effect of sowing time on infestation of beans (Phaseolus
vulgaris L.) by two species of the Bean Stem Maggot, Ophiomyia spencerella and
Ophiomyia phaseoli (Diptera: Agromyzidae). Archives Of Phytopathology And Plant
Protection, 40(1), pp.45-51.
Singh, F. & Oswalt, D.L., 1991. Genetics and breeding of groundnut. Skill development series.
India: ICRISAT ICRISAT.

50
Singh, R.K. & Chaudhary, B.H., 1997. Biometrical methods in quantitative genetics analysis.
New Delhi, India.
Singh, S.P., Gepts, P. & Debouck, D.G., 1991. Races of common bean (Phaseolus vulgaris,
fabaceae). Economic Botany, 45(3), pp.379-96.
Smith, J.D. & Kinman, M.L., 1965. The use of parent-offspring regression as an estimator of
heritability. Crop science, 5(6), pp.595-96.
Songa, J.M., 1999. Ecology of the bean stem maggot attacking drybean (Phaseolus vulgaris L.)
in the semiarid areas of eastern Kenya. International Journal of Pest Management, 45(1),
pp.35-40.
Talekar, N.S., Yang, H.C. & Lee, Y.H., 1988. Morphological and physiological traits associated
withagromyzid (Diptera: Agromyzidae) resistance in mungbean. Journal of economic
entomology, 81(5), pp.1352-58.
UBOS, 2010. Uganda Census of Agriculture 2008/2009. Crop area and production report.
Kampala: Uganda Bureau of statistics.
Wang, & Gai, , 2001. Mixed inheritance model for resistance to agromyzid beanfly
(Melanagromyza sojae Zehntner) in soybean. Eupytica, 122, pp.9-18.
World Bank, 1993. Uganda: Growing out of poverty. Washington DC: The World Bank.
Wortmann, C., R Kirkby, , Eledu, C. & Allen, , 1998. Atlas of common bean (Phaseolus vulgaris
L.) production in Africa. 297th ed. Cali, Columbia: CIAT.
Wortmann, C.S. & Allen, J., 1994. African Bean Production and environments: their definition,
characteristics and constraints. CIAT Network on Bean Research in Africa.
Wortmann, S., Kirkby, R.A., Aledu, C.A. & Allen, D.J., 1998. Atlas of common bean (phaseolus
vulgaris L.) production in Uganda. Kampala, Uganda: CIAT.
Related Documents