Genetic relationships among Mediterranean Pistacia species evaluated by RAPD and AFLP markers A. Golan-Goldhirsh* 1 , O. Barazani 1 , Z. S. Wang 1 , D. K. Khadka 1 , J. A. Saunders 3 , V. Kostiukovsky 1 , and L. J. Rowland 2 1 Desert Plant Biotechnology Laboratory, Albert Katz Department of Dryland Biotechnologies, The Jacob Blaustein Institute for Desert Research, Ben-Gurion University of the Negev, Sede Boqer Campus, Israel 2 Fruit Laboratory, and 3 Climate Stress Laboratory, Beltsville Agricultural Research Center, Agricultural Research Service, Beltsville, MD, USA Received April 14, 2003; accepted January 24, 2004 Published online: April 6, 2004 ȑ Springer-Verlag 2004 Abstract. Polymorphisms among Mediterranean basin Pistacia species and accessions within species were assessed by random amplified polymorphic DNA (RAPD) and amplified fragment length polymorphism (AFLP) analyses. Twenty-eight Pistacia accessions representing six species from geographically diverse locations in the Mediterra- nean area were analyzed. With RAPD, a total of 259 DNA fragments were amplified by 27 pre- selected primers, 254 were polymorphic fragments. AFLP analysis with 15 primer sets, produced 954 (93%) polymorphic bands out of a total of 1026. A Mantel test revealed an extremely high correlation (r ¼ 0.99) between similarity matrices generated from RAPD and AFLP data sets, indicating that similar results were obtained by the two techniques. Dendrograms constructed from the similarity matrices showed that Pistacia species could be clustered into two groups, one group containing all the P. lentiscus and the second group containing all other accessions. The latter group was divided into two subgroups, one consisting of P. palaestina and P. terebinthus; the other consisting of P. atlantica, P. khinjuk and P. vera. P. vera and P. khinjuk were highly similar, as were P. palaestina and P. terebin- thus. Key words: AFLP, genetic relationship, germplasm, molecular marker, Pistacia spp., polymorphism, RAPD. Introduction Pistacia is a genus of the Anacardiaceae. Zohary (1952) recognized 11 Pistacia species based on morphology, and placed them in four sections: Lentiscella Zoh. contains P. mexicana Kunth and P. texana Swingle; Eu-Lentiscus Zoh. contains P. lentiscus L., and P. weinmannifolia Poisson and P. saportae Burnat; Butmela Zoh. contains P. atlantica Desf.; and Eu-Terebinthus contains P. vera L., P. khinjuk Stocks, P. terebinthus L., P. palaestina Bois., and P. chinensis Bunge P. saportae was later recog- nized as an inter-specific hybrid (Zohary 1972). Pistacia trees are characteristic for the Mediterranean basin flora. Five species of the genus grow naturally in the Mediterranean basin and Middle East: P. lentiscus, P. atlan- tica, P. palaestina, P. terebinthus and P. khinjuk. Pistacia vera originated in central Plant Syst. Evol. 246: 9–18 (2004) DOI 10.1007/s00606-004-0132-4

Welcome message from author
This document is posted to help you gain knowledge. Please leave a comment to let me know what you think about it! Share it to your friends and learn new things together.
Transcript
Genetic relationships among Mediterranean Pistacia species
evaluated by RAPD and AFLP markers
A. Golan-Goldhirsh*1, O. Barazani
1, Z. S. Wang
1, D. K. Khadka
1, J. A. Saunders
3,
V. Kostiukovsky1, and L. J. Rowland2
1Desert Plant Biotechnology Laboratory, Albert Katz Department of Dryland Biotechnologies,The Jacob Blaustein Institute for Desert Research, Ben-Gurion University of the Negev,Sede Boqer Campus, Israel2Fruit Laboratory, and 3Climate Stress Laboratory, Beltsville Agricultural Research Center,Agricultural Research Service, Beltsville, MD, USA
Received April 14, 2003; accepted January 24, 2004Published online: April 6, 2004� Springer-Verlag 2004
Abstract. Polymorphisms among Mediterraneanbasin Pistacia species and accessions within specieswere assessed by random amplified polymorphicDNA (RAPD) and amplified fragment lengthpolymorphism (AFLP) analyses. Twenty-eightPistacia accessions representing six species fromgeographically diverse locations in the Mediterra-nean area were analyzed. With RAPD, a total of259 DNA fragments were amplified by 27 pre-selected primers, 254 were polymorphic fragments.AFLP analysis with 15 primer sets, produced 954(93%) polymorphic bands out of a total of 1026. AMantel test revealed an extremely high correlation(r¼ 0.99) between similarity matrices generatedfrom RAPD and AFLP data sets, indicating thatsimilar results were obtained by the two techniques.Dendrograms constructed from the similaritymatrices showed that Pistacia species could beclustered into two groups, one group containing allthe P. lentiscus and the second group containing allother accessions. The latter group was divided intotwo subgroups, one consisting of P. palaestina andP. terebinthus; the other consisting of P. atlantica,P. khinjuk and P. vera. P. vera and P. khinjuk werehighly similar, as were P. palaestina and P. terebin-thus.
Key words: AFLP, genetic relationship, germplasm,molecular marker, Pistacia spp., polymorphism,RAPD.
Introduction
Pistacia is a genusof theAnacardiaceae.Zohary(1952) recognized 11 Pistacia species based onmorphology, and placed them in four sections:Lentiscella Zoh. contains P. mexicana Kunthand P. texana Swingle; Eu-Lentiscus Zoh.contains P. lentiscus L., and P. weinmannifoliaPoisson and P. saportae Burnat; Butmela Zoh.contains P. atlantica Desf.; and Eu-Terebinthuscontains P. vera L., P. khinjuk Stocks,P. terebinthus L., P. palaestina Bois., andP. chinensis Bunge P. saportae was later recog-nized as an inter-specific hybrid (Zohary 1972).
Pistacia trees are characteristic for theMediterranean basin flora. Five species of thegenus grow naturally in the Mediterraneanbasin and Middle East: P. lentiscus, P. atlan-tica, P. palaestina, P. terebinthus andP. khinjuk. Pistacia vera originated in central
Plant Syst. Evol. 246: 9–18 (2004)DOI 10.1007/s00606-004-0132-4
Asia and is cultivated throughout the Medi-terranean region. Research efforts have mainlyfocused on P. vera because of its economicimportance, while the other species have beenoverlooked to a large extent. Some of the otherspecies, e.g. P. atlantica, P. terebinthus andP. khinjuk, are used as rootstocks for P. vera.The adaptation of Pistacia trees to harshdesert conditions and their longevity makethem ideal candidates for reforestation inarid zones. A better understanding of thegenetic relationships among the species wouldbe an advantage for breeding programs in thisgenus.
There is almost no cytogenetic informationavailable on the various Pistacia species.Loukas and Pontikis (1979), Barone et al.(1993, 1996), and Dollo (1993) conductedisozyme studies with the aim of distinguishingbetween varieties of P. vera, but insufficientisozyme polymorphism among closely relatedcultivars has limited the usefulness of isozymesfor analyses of genetic diversity and related-ness. The problem of insufficient polymor-phism can be mitigated by using DNA-basedmarkers such as restriction fragment lengthpolymorphisms (RFLPs) (Tanksley et al. 1989)or random amplified polymorphic DNA(RAPD) markers (Williams et al. 1990). Thelevel of speciation and relationships within thegenus Pistacia were investigated recently at themolecular level by Hormaza et al. (1994a,b),Dollo et al. (1995) and Parfitt and Badenes(1997, 1998). Hormaza et al. (1994b, 1998)examined genetic diversity and patterns ofrelatedness among fifteen P. vera cultivarsusing RAPD markers. The phylogenetic rela-tionships of Pistacia species were studiedrecently by restriction analysis and RFLP ofchloroplast DNA ( Parfitt and Badenes 1997,1998) and by the RAPD technique (Kafkasand Perl-Treves 2002).
The availability of an extensive germplasmcollection of Pistacia from various geograph-ical regions around the Mediterranean (Golan-Goldhirsh and Kostiukovsky 1998) has madeit possible to evaluate their genetic relation-ships and the evolution of the genus.
In the research reported here, the geneticdiversity and phylogenetic relationshipsamong Mediterranean Pistacia were analyzedusing RAPD and AFLP markers.
Materials and methods
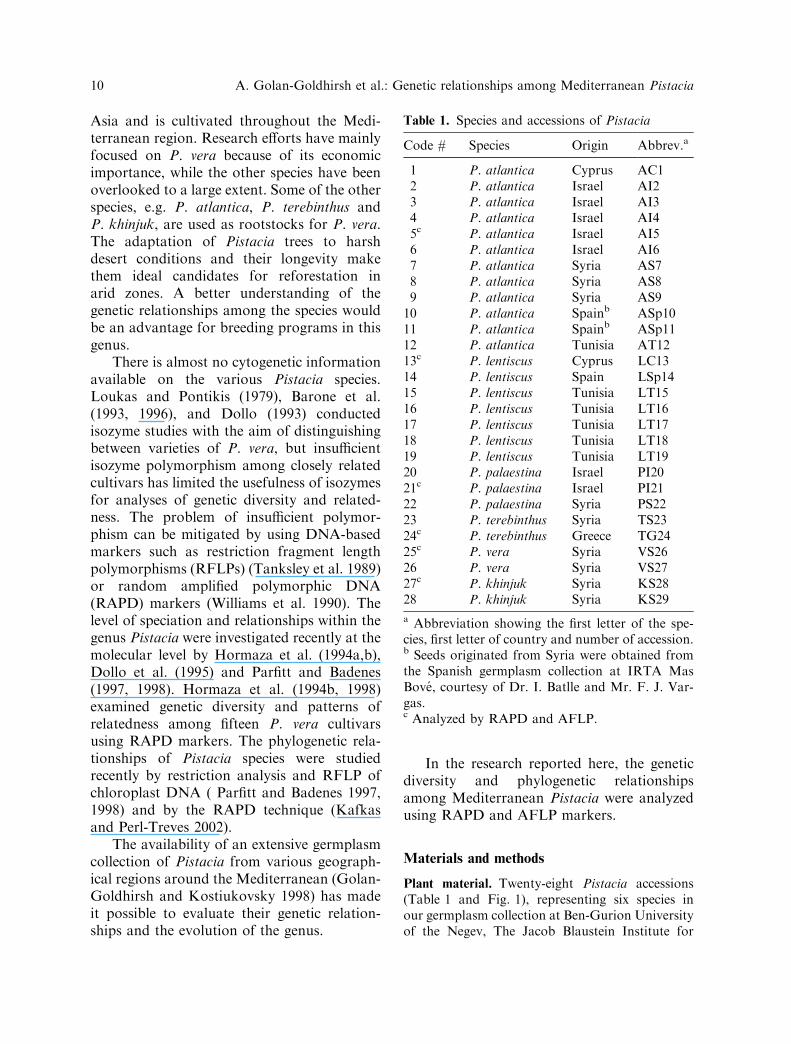
Plant material. Twenty-eight Pistacia accessions(Table 1 and Fig. 1), representing six species inour germplasm collection at Ben-Gurion Universityof the Negev, The Jacob Blaustein Institute for
Table 1. Species and accessions of Pistacia
Code # Species Origin Abbrev.a
1 P. atlantica Cyprus AC12 P. atlantica Israel AI23 P. atlantica Israel AI34 P. atlantica Israel AI45c P. atlantica Israel AI56 P. atlantica Israel AI67 P. atlantica Syria AS78 P. atlantica Syria AS89 P. atlantica Syria AS9
10 P. atlantica Spainb ASp1011 P. atlantica Spainb ASp1112 P. atlantica Tunisia AT1213c P. lentiscus Cyprus LC1314 P. lentiscus Spain LSp1415 P. lentiscus Tunisia LT1516 P. lentiscus Tunisia LT1617 P. lentiscus Tunisia LT1718 P. lentiscus Tunisia LT1819 P. lentiscus Tunisia LT1920 P. palaestina Israel PI2021c P. palaestina Israel PI2122 P. palaestina Syria PS2223 P. terebinthus Syria TS2324c P. terebinthus Greece TG2425c P. vera Syria VS2626 P. vera Syria VS2727c P. khinjuk Syria KS2828 P. khinjuk Syria KS29
a Abbreviation showing the first letter of the spe-cies, first letter of country and number of accession.b Seeds originated from Syria were obtained fromthe Spanish germplasm collection at IRTA MasBove, courtesy of Dr. I. Batlle and Mr. F. J. Var-gas.c Analyzed by RAPD and AFLP.
10 A. Golan-Goldhirsh et al.: Genetic relationships among Mediterranean Pistacia
Desert Research (Golan-Goldhirsh and Kostiukov-sky 1998) were evaluated in this study (P. atlantica,P. lentiscus, P. vera, P. terebinthus, P. palaestina,and P. khinjuk).
DNA isolation. Total DNA was extractedfrom approximately 5 g leaf tissue, according tothe method of Hormaza et al. (1994a) based onDoyle and Doyle (1987), with minor modificationsof the CTAB buffer (100 mM Tris-HCl, 1.4MNaCl, 20 mM EDTA, 2% CTAB, 1% PVP, 0.2%b-mercaptoethanol).
PCR amplification and electrophoretic analysis
of RAPD products. A preselection of suitabledecamer oligonucleotide primers (Operon Technol-ogies, Inc.) was done using 120 primers (Operonkits A, B, C, D, E and F) and three Pistaciaaccessions, one of each of P. atlantica, P. vera andP. khinjuk. Of the 120 primers tested, 95 (79%)gave amplification products, while only 39 (32.5%)revealed polymorphisms and easily scorable ampli-fication products. From the latter, 27 primers(Table 2) were selected for further RAPD analysiswith all 28 accessions (Table 1). The protocolreported by Hormaza et al. (1994b) was followedwith some modifications. Total PCR volume was25 ll and contained 10 mM Tris-HCl (pH 8.0),20 ng of total genomic DNA, 100 lM of eachdNTP, 50 mM KCl, 2 mM MgCl2, 100 mg/mlgelatin, and 1 unit of Taq DNA polymerase(Advanced Biotechnologies Ltd., U.K.). Two dropsof light mineral oil were added to prevent evapo-
ration. The amplification reactions were carried outin a MJ-Research Inc. (Watertown, MA) Program-mable Thermal Cycler under the following condi-tions: 94 �C for 2 min, 1 cycle; 94 �C for 45seconds, 36 �C for 1 min, 72 �C for 2 min, 45cycles; 72 �C for 5 min, 1 cycle, followed by storageat 4 �C. Amplification products were analyzed byelectrophoresis in a 1.5% TBE agarose gel, fol-lowed by staining with ethidium bromide 0.5 lg/mland viewing under UV radiation. All PCR reac-tions were repeated at least two times and onlyreproducible bands observed on two separateelectrophoresis runs were scored for statisticalanalysis.
AFLP analysis. AFLP analyses were done onDNA from one individual of each of the sixdifferent Pistacia spp. (Table 2). AFLP markerswere generated using the AFLP analysis system I(GibcoBRL, supplied by Life Technologies, Beth-esda, MD USA, Cat. No. 10482-016), following theinstructions provided with the kit. In the first step,64 combinations of the following selective primerswere tested: EcoR1 primers, E-ACC, E-ACT,E-ACA, E-AGG, E-AGC, E-ACG, E-AAG,E-AAC, and Mse1 primers M-CAA, M-CAC,M-CAG, M-CAT, M-CTA, M-CTC, M-CTG,M-CTT. The PCR products were analyzed on 5%sequencing gels, and stained using the DNA silverstaining system of Promega (Madison, WI, USA,Cat. No. DQ7050). Combinations that amplifiedpolymorphic fragments (Table 3) were used for the
7-925-2822-23
2-4
20-216
5
1, 13
24
10-1114
1215-19
Fig. 1. Map of the Mediterranean basin and Middle East showing the origin of the accessions used in thisstudy. The numbers on the map correspond to the code # in Table 1
A. Golan-Goldhirsh et al.: Genetic relationships among Mediterranean Pistacia 11
second phase of AFLP amplification and fragmentsranging in size between 300–700 bp were scoredfrom the autoradiograms.
Data analysis. The amplified bands werescored as 1 (present) and 0 (absent) and used forcluster analysis. Several similarity matrices wereconstructed based on the Simple Matching coeffi-cient, Hamann’s coefficient, Dice coefficient andJaccard coefficient using the Numerical Taxonomyand Multivariate Analysis System program pack-age for PC (NTSYS-pc, version 2.0) (Rohlf 1998).Dendrograms of the accessions were constructed byapplying the unweighted pair-group method, arith-metic average (UPGMA) and the neighbor-joining(NJ) methods (Saitou and Nei 1987) for estimatingphylogenetic trees, also using the NTSYS-pc. Since
the dendrograms obtained by both UPGMA andNJ methods based on either one of the similaritycoefficients yielded highly similar clustering pat-terns, the similarity matrix based on Jaccardcoefficient and the UPGMA tree were presented.For statistical evaluation of the groupings, boot-strap analysis was performed using the PAUP4.0b10 program (Swofford 1993).
Mantel test was used to test for correlationbetween the AFLP and RAPD matrices, usingNTSYS-pc.
Results
RAPD and AFLP polymorphism of Mediterra-
nean Pistacia. A total of 259 DNA fragmentswere amplified by the 27 preselected RAPDdecamer oligonucleotide primers. For eachprimer used, 6 to 23 DNA bands wereamplified from a given sample of genomicDNA with an average of 7.8 fragments peraccession. The fragment size ranged from300 bp to 2000 bp. Of the 259 DNA frag-ments, 254 were polymorphic among the 28Pistacia accessions.
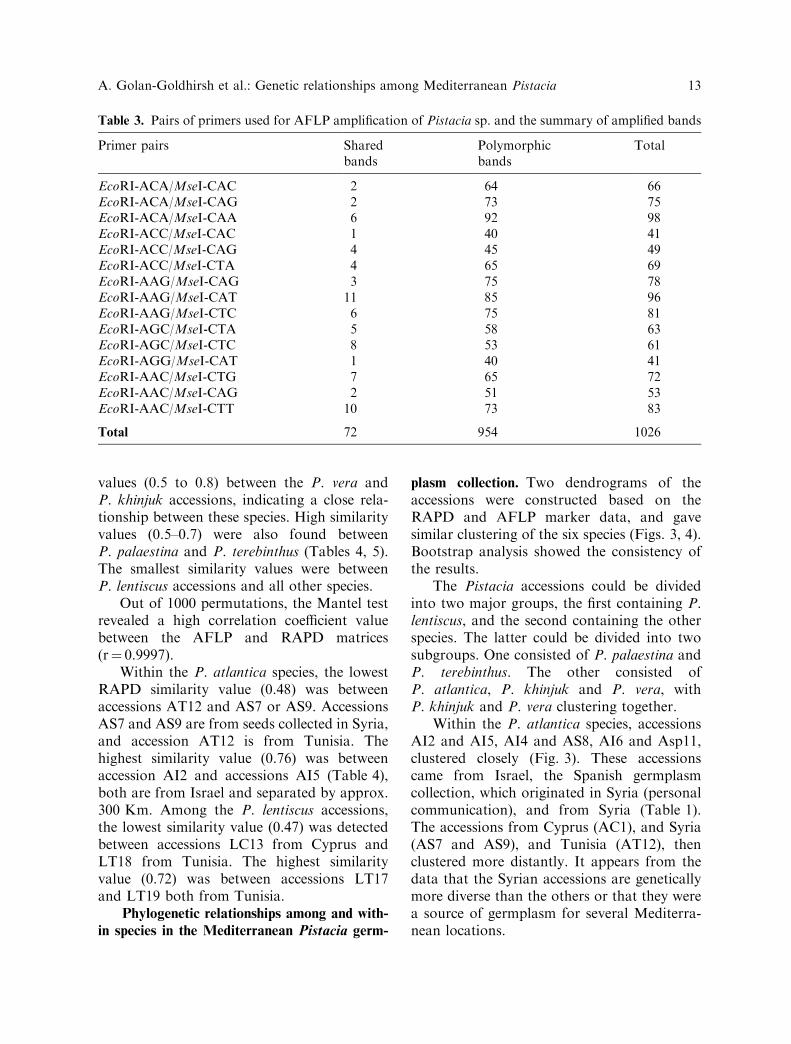
AFLP amplification of DNA of the sixPistacia species with fifteen pairs of selectiveprimers produced a total of 1026 bands,ranging in size from 300–1000 bp (Table 3).Among them, 954 were polymorphic bands(93%), and 72 bands (7.4%), were common toall 6 species (Table 3).
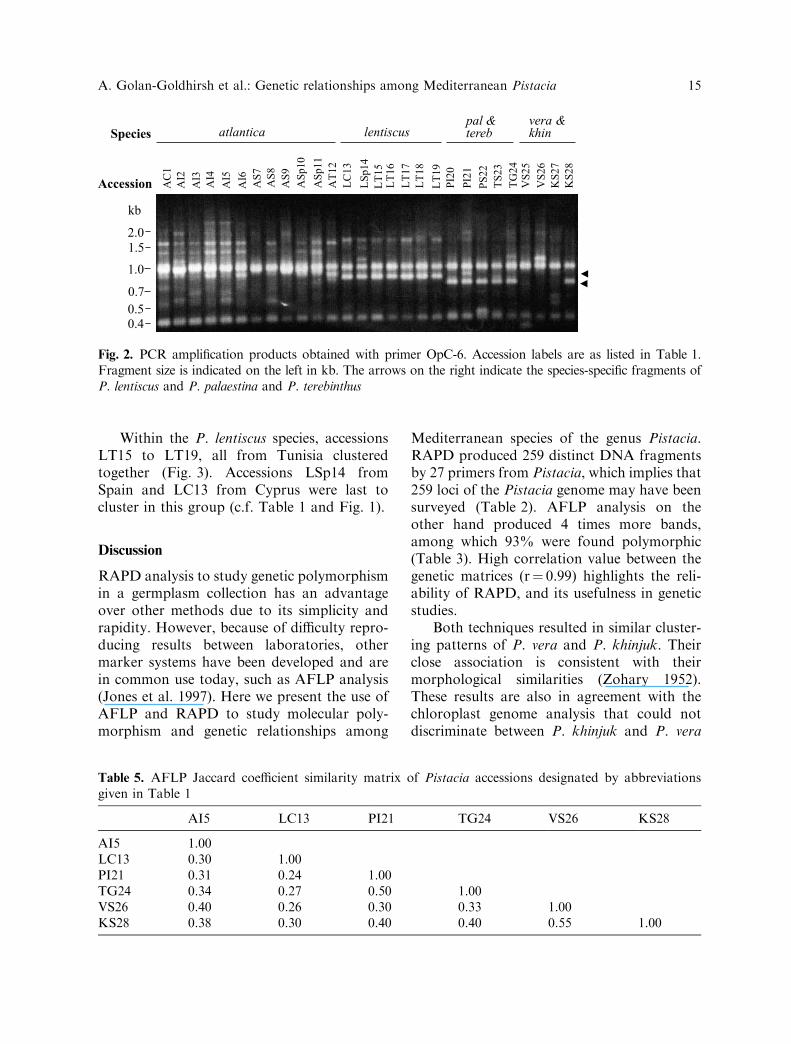
From the 12 P. atlantica accessions ana-lyzed by RAPD, 135 DNA fragments wereamplified, and 102 of them were polymorphic.From seven P. lentiscus accessions analyzed,125 DNA fragments were amplified and 90 ofthem were polymorphic. Pistacia atlanticaspecies-specific and P. lentiscus species-specificRAPD markers were also found. An exampleof amplification products with primer OpC-6,which generated P. lentiscus species-specificRAPD marker and a specific marker for P.palaestina:P. terebinthus group is shown inFig. 2.
Genetic similarity among Pistacia acces-
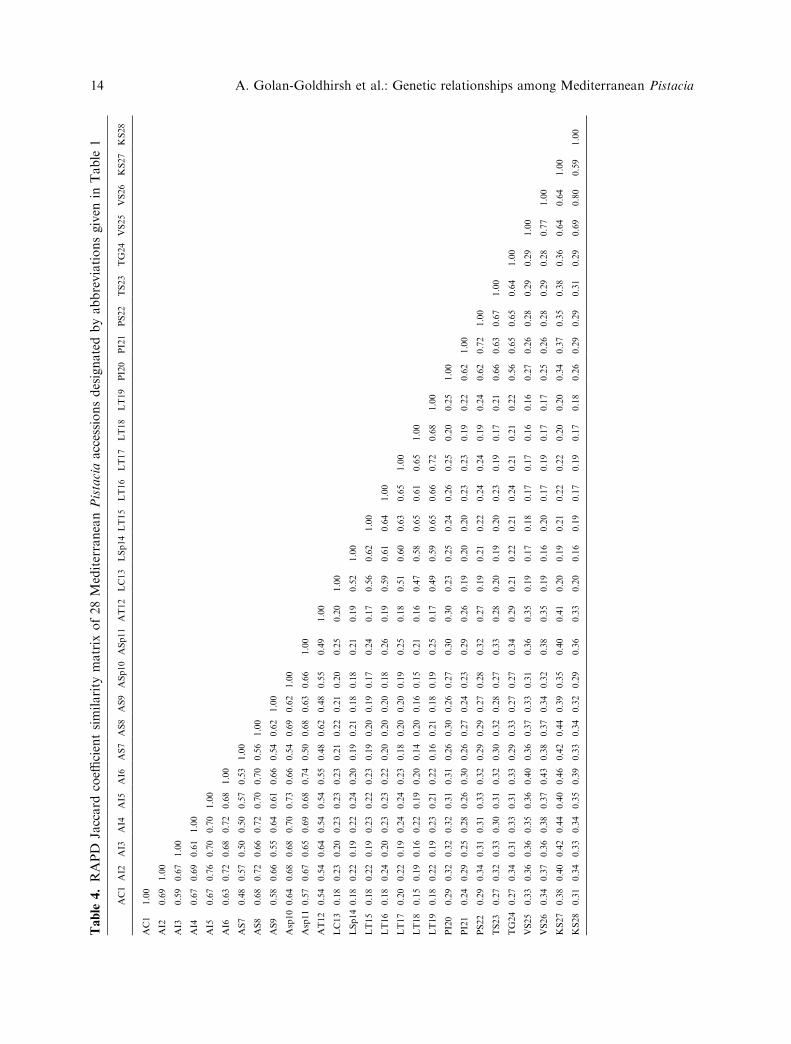
sions analyzed. The similarity matrices of theRAPD and AFLP data are presented in Tables4 and 5. Both matrices showed high similarity
Table 2. Primers used for the RAPD analysis
Primer 5¢-3¢ sequence Number ofmarkersdetected
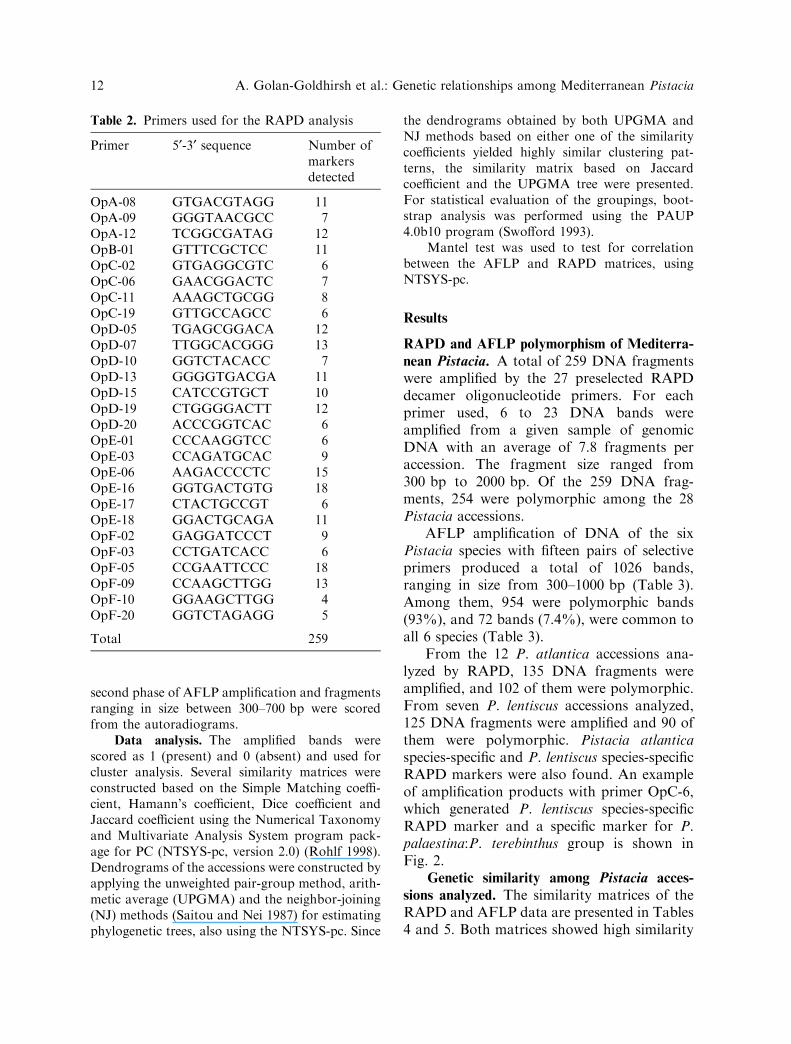
OpA-08 GTGACGTAGG 11OpA-09 GGGTAACGCC 7OpA-12 TCGGCGATAG 12OpB-01 GTTTCGCTCC 11OpC-02 GTGAGGCGTC 6OpC-06 GAACGGACTC 7OpC-11 AAAGCTGCGG 8OpC-19 GTTGCCAGCC 6OpD-05 TGAGCGGACA 12OpD-07 TTGGCACGGG 13OpD-10 GGTCTACACC 7OpD-13 GGGGTGACGA 11OpD-15 CATCCGTGCT 10OpD-19 CTGGGGACTT 12OpD-20 ACCCGGTCAC 6OpE-01 CCCAAGGTCC 6OpE-03 CCAGATGCAC 9OpE-06 AAGACCCCTC 15OpE-16 GGTGACTGTG 18OpE-17 CTACTGCCGT 6OpE-18 GGACTGCAGA 11OpF-02 GAGGATCCCT 9OpF-03 CCTGATCACC 6OpF-05 CCGAATTCCC 18OpF-09 CCAAGCTTGG 13OpF-10 GGAAGCTTGG 4OpF-20 GGTCTAGAGG 5
Total 259
12 A. Golan-Goldhirsh et al.: Genetic relationships among Mediterranean Pistacia
values (0.5 to 0.8) between the P. vera andP. khinjuk accessions, indicating a close rela-tionship between these species. High similarityvalues (0.5–0.7) were also found betweenP. palaestina and P. terebinthus (Tables 4, 5).The smallest similarity values were betweenP. lentiscus accessions and all other species.
Out of 1000 permutations, the Mantel testrevealed a high correlation coefficient valuebetween the AFLP and RAPD matrices(r¼ 0.9997).
Within the P. atlantica species, the lowestRAPD similarity value (0.48) was betweenaccessions AT12 and AS7 or AS9. AccessionsAS7 and AS9 are from seeds collected in Syria,and accession AT12 is from Tunisia. Thehighest similarity value (0.76) was betweenaccession AI2 and accessions AI5 (Table 4),both are from Israel and separated by approx.300 Km. Among the P. lentiscus accessions,the lowest similarity value (0.47) was detectedbetween accessions LC13 from Cyprus andLT18 from Tunisia. The highest similarityvalue (0.72) was between accessions LT17and LT19 both from Tunisia.
Phylogenetic relationships among and with-
in species in the Mediterranean Pistacia germ-
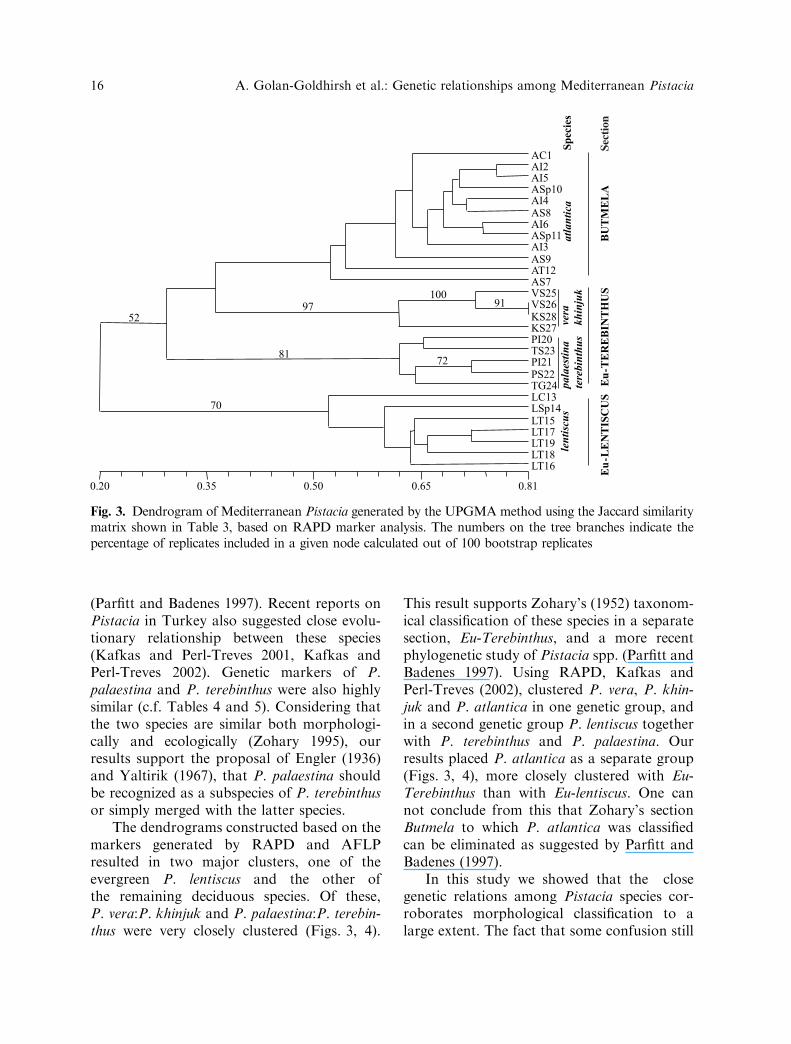
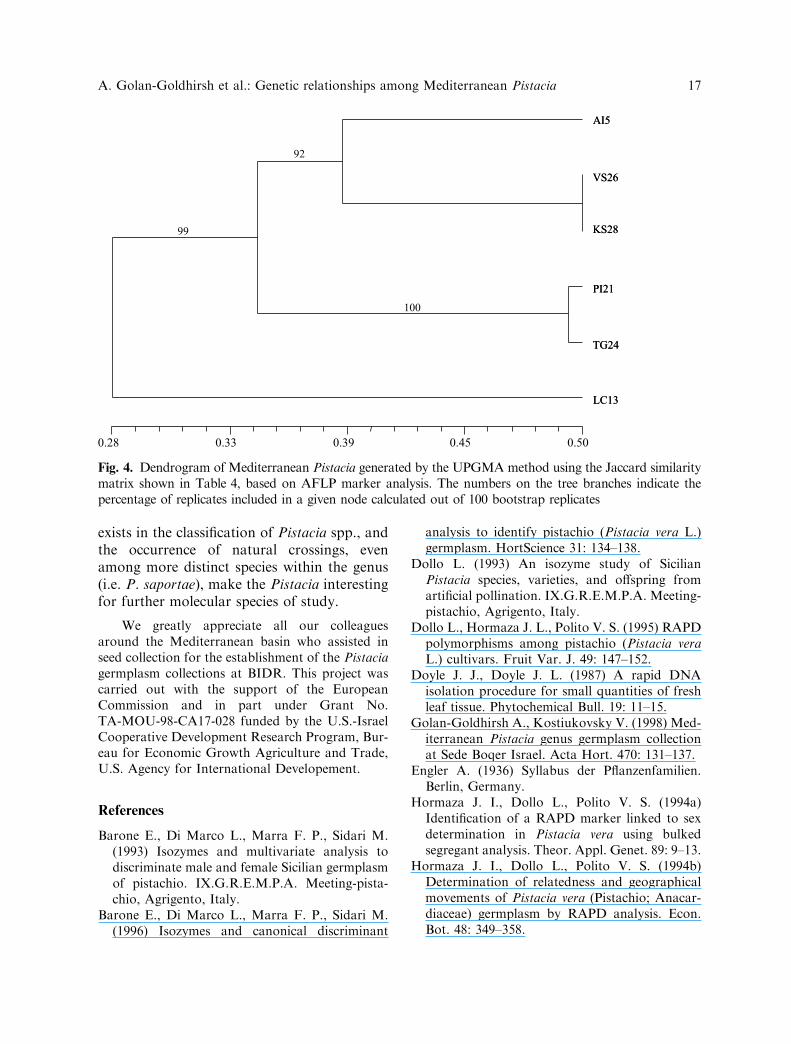
plasm collection. Two dendrograms of theaccessions were constructed based on theRAPD and AFLP marker data, and gavesimilar clustering of the six species (Figs. 3, 4).Bootstrap analysis showed the consistency ofthe results.
The Pistacia accessions could be dividedinto two major groups, the first containing P.lentiscus, and the second containing the otherspecies. The latter could be divided into twosubgroups. One consisted of P. palaestina andP. terebinthus. The other consisted ofP. atlantica, P. khinjuk and P. vera, withP. khinjuk and P. vera clustering together.
Within the P. atlantica species, accessionsAI2 and AI5, AI4 and AS8, AI6 and Asp11,clustered closely (Fig. 3). These accessionscame from Israel, the Spanish germplasmcollection, which originated in Syria (personalcommunication), and from Syria (Table 1).The accessions from Cyprus (AC1), and Syria(AS7 and AS9), and Tunisia (AT12), thenclustered more distantly. It appears from thedata that the Syrian accessions are geneticallymore diverse than the others or that they werea source of germplasm for several Mediterra-nean locations.
Table 3. Pairs of primers used for AFLP amplification of Pistacia sp. and the summary of amplified bands
Primer pairs Sharedbands
Polymorphicbands
Total
EcoRI-ACA/MseI-CAC 2 64 66EcoRI-ACA/MseI-CAG 2 73 75EcoRI-ACA/MseI-CAA 6 92 98EcoRI-ACC/MseI-CAC 1 40 41EcoRI-ACC/MseI-CAG 4 45 49EcoRI-ACC/MseI-CTA 4 65 69EcoRI-AAG/MseI-CAG 3 75 78EcoRI-AAG/MseI-CAT 11 85 96EcoRI-AAG/MseI-CTC 6 75 81EcoRI-AGC/MseI-CTA 5 58 63EcoRI-AGC/MseI-CTC 8 53 61EcoRI-AGG/MseI-CAT 1 40 41EcoRI-AAC/MseI-CTG 7 65 72EcoRI-AAC/MseI-CAG 2 51 53EcoRI-AAC/MseI-CTT 10 73 83
Total 72 954 1026
A. Golan-Goldhirsh et al.: Genetic relationships among Mediterranean Pistacia 13
Table
4.RAPD
Jaccard
coeffi
cientsimilarity
matrix
of28MediterraneanPistaciaaccessionsdesignatedbyabbreviationsgiven
inTable
1
AC1
AI2
AI3
AI4
AI5
AI6
AS7
AS8
AS9
ASp10
ASp11
AT12
LC13
LSp14LT15
LT16
LT17
LT18
LT19
PI20
PI21
PS22
TS23
TG24
VS25
VS26
KS27
KS28
AC1
1.00
AI2
0.69
1.00
AI3
0.59
0.67
1.00
AI4
0.67
0.69
0.61
1.00
AI5
0.67
0.76
0.70
0.70
1.00
AI6
0.63
0.72
0.68
0.72
0.68
1.00
AS7
0.48
0.57
0.50
0.50
0.57
0.53
1.00
AS8
0.68
0.72
0.66
0.72
0.70
0.70
0.56
1.00
AS9
0.58
0.66
0.55
0.64
0.61
0.66
0.54
0.62
1.00
Asp10
0.64
0.68
0.68
0.70
0.73
0.66
0.54
0.69
0.62
1.00
Asp11
0.57
0.67
0.65
0.69
0.68
0.74
0.50
0.68
0.63
0.66
1.00
AT12
0.54
0.54
0.64
0.54
0.54
0.55
0.48
0.62
0.48
0.55
0.49
1.00
LC13
0.18
0.23
0.20
0.23
0.23
0.23
0.21
0.22
0.21
0.20
0.25
0.20
1.00
LSp140.18
0.22
0.19
0.22
0.24
0.20
0.19
0.21
0.18
0.18
0.21
0.19
0.52
1.00
LT15
0.18
0.22
0.19
0.23
0.22
0.23
0.19
0.20
0.19
0.17
0.24
0.17
0.56
0.62
1.00
LT16
0.18
0.24
0.20
0.23
0.23
0.22
0.20
0.20
0.20
0.18
0.26
0.19
0.59
0.61
0.64
1.00
LT17
0.20
0.22
0.19
0.24
0.24
0.23
0.18
0.20
0.20
0.19
0.25
0.18
0.51
0.60
0.63
0.65
1.00
LT18
0.15
0.19
0.16
0.22
0.19
0.20
0.14
0.20
0.16
0.15
0.21
0.16
0.47
0.58
0.65
0.61
0.65
1.00
LT19
0.18
0.22
0.19
0.23
0.21
0.22
0.16
0.21
0.18
0.19
0.25
0.17
0.49
0.59
0.65
0.66
0.72
0.68
1.00
PI20
0.29
0.32
0.32
0.32
0.31
0.31
0.26
0.30
0.26
0.27
0.30
0.30
0.23
0.25
0.24
0.26
0.25
0.20
0.25
1.00
PI21
0.24
0.29
0.25
0.28
0.26
0.30
0.26
0.27
0.24
0.23
0.29
0.26
0.19
0.20
0.20
0.23
0.23
0.19
0.22
0.62
1.00
PS22
0.29
0.34
0.31
0.31
0.33
0.32
0.29
0.29
0.27
0.28
0.32
0.27
0.19
0.21
0.22
0.24
0.24
0.19
0.24
0.62
0.72
1.00
TS23
0.27
0.32
0.33
0.30
0.31
0.32
0.30
0.32
0.28
0.27
0.33
0.28
0.20
0.19
0.20
0.23
0.19
0.17
0.21
0.66
0.63
0.67
1.00
TG24
0.27
0.34
0.31
0.33
0.31
0.33
0.29
0.33
0.27
0.27
0.34
0.29
0.21
0.22
0.21
0.24
0.21
0.21
0.22
0.56
0.65
0.65
0.64
1.00
VS25
0.33
0.36
0.36
0.35
0.36
0.40
0.36
0.37
0.33
0.31
0.36
0.35
0.19
0.17
0.18
0.17
0.17
0.16
0.16
0.27
0.26
0.28
0.29
0.29
1.00
VS26
0.34
0.37
0.36
0.38
0.37
0.43
0.38
0.37
0.34
0.32
0.38
0.35
0.19
0.16
0.20
0.17
0.19
0.17
0.17
0.25
0.26
0.28
0.29
0.28
0.77
1.00
KS27
0.38
0.40
0.42
0.44
0.40
0.46
0.42
0.44
0.39
0.35
0.40
0.41
0.20
0.19
0.21
0.22
0.22
0.20
0.20
0.34
0.37
0.35
0.38
0.36
0.64
0.64
1.00
KS28
0.31
0.34
0.33
0.34
0.35
0.39
0.33
0.34
0.32
0.29
0.36
0.33
0.20
0.16
0.19
0.17
0.19
0.17
0.18
0.26
0.29
0.29
0.31
0.29
0.69
0.80
0.59
1.00
14 A. Golan-Goldhirsh et al.: Genetic relationships among Mediterranean Pistacia
Within the P. lentiscus species, accessionsLT15 to LT19, all from Tunisia clusteredtogether (Fig. 3). Accessions LSp14 fromSpain and LC13 from Cyprus were last tocluster in this group (c.f. Table 1 and Fig. 1).
Discussion
RAPD analysis to study genetic polymorphismin a germplasm collection has an advantageover other methods due to its simplicity andrapidity. However, because of difficulty repro-ducing results between laboratories, othermarker systems have been developed and arein common use today, such as AFLP analysis(Jones et al. 1997). Here we present the use ofAFLP and RAPD to study molecular poly-morphism and genetic relationships among
Mediterranean species of the genus Pistacia.RAPD produced 259 distinct DNA fragmentsby 27 primers from Pistacia, which implies that259 loci of the Pistacia genome may have beensurveyed (Table 2). AFLP analysis on theother hand produced 4 times more bands,among which 93% were found polymorphic(Table 3). High correlation value between thegenetic matrices (r¼ 0.99) highlights the reli-ability of RAPD, and its usefulness in geneticstudies.
Both techniques resulted in similar cluster-ing patterns of P. vera and P. khinjuk. Theirclose association is consistent with theirmorphological similarities (Zohary 1952).These results are also in agreement with thechloroplast genome analysis that could notdiscriminate between P. khinjuk and P. vera
Fig. 2. PCR amplification products obtained with primer OpC-6. Accession labels are as listed in Table 1.Fragment size is indicated on the left in kb. The arrows on the right indicate the species-specific fragments ofP. lentiscus and P. palaestina and P. terebinthus
Table 5. AFLP Jaccard coefficient similarity matrix of Pistacia accessions designated by abbreviationsgiven in Table 1
AI5 LC13 PI21 TG24 VS26 KS28
AI5 1.00LC13 0.30 1.00PI21 0.31 0.24 1.00TG24 0.34 0.27 0.50 1.00VS26 0.40 0.26 0.30 0.33 1.00KS28 0.38 0.30 0.40 0.40 0.55 1.00
A. Golan-Goldhirsh et al.: Genetic relationships among Mediterranean Pistacia 15
(Parfitt and Badenes 1997). Recent reports onPistacia in Turkey also suggested close evolu-tionary relationship between these species(Kafkas and Perl-Treves 2001, Kafkas andPerl-Treves 2002). Genetic markers of P.palaestina and P. terebinthus were also highlysimilar (c.f. Tables 4 and 5). Considering thatthe two species are similar both morphologi-cally and ecologically (Zohary 1995), ourresults support the proposal of Engler (1936)and Yaltirik (1967), that P. palaestina shouldbe recognized as a subspecies of P. terebinthusor simply merged with the latter species.
The dendrograms constructed based on themarkers generated by RAPD and AFLPresulted in two major clusters, one of theevergreen P. lentiscus and the other ofthe remaining deciduous species. Of these,P. vera:P. khinjuk and P. palaestina:P. terebin-thus were very closely clustered (Figs. 3, 4).
This result supports Zohary’s (1952) taxonom-ical classification of these species in a separatesection, Eu-Terebinthus, and a more recentphylogenetic study of Pistacia spp. (Parfitt andBadenes 1997). Using RAPD, Kafkas andPerl-Treves (2002), clustered P. vera, P. khin-juk and P. atlantica in one genetic group, andin a second genetic group P. lentiscus togetherwith P. terebinthus and P. palaestina. Ourresults placed P. atlantica as a separate group(Figs. 3, 4), more closely clustered with Eu-Terebinthus than with Eu-lentiscus. One cannot conclude from this that Zohary’s sectionButmela to which P. atlantica was classifiedcan be eliminated as suggested by Parfitt andBadenes (1997).
In this study we showed that the closegenetic relations among Pistacia species cor-roborates morphological classification to alarge extent. The fact that some confusion still
Fig. 3. Dendrogram of Mediterranean Pistacia generated by the UPGMA method using the Jaccard similaritymatrix shown in Table 3, based on RAPD marker analysis. The numbers on the tree branches indicate thepercentage of replicates included in a given node calculated out of 100 bootstrap replicates
16 A. Golan-Goldhirsh et al.: Genetic relationships among Mediterranean Pistacia
exists in the classification of Pistacia spp., andthe occurrence of natural crossings, evenamong more distinct species within the genus(i.e. P. saportae), make the Pistacia interestingfor further molecular species of study.
We greatly appreciate all our colleaguesaround the Mediterranean basin who assisted inseed collection for the establishment of the Pistaciagermplasm collections at BIDR. This project wascarried out with the support of the EuropeanCommission and in part under Grant No.TA-MOU-98-CA17-028 funded by the U.S.-IsraelCooperative Development Research Program, Bur-eau for Economic Growth Agriculture and Trade,U.S. Agency for International Developement.
References
Barone E., Di Marco L., Marra F. P., Sidari M.(1993) Isozymes and multivariate analysis todiscriminate male and female Sicilian germplasmof pistachio. IX.G.R.E.M.P.A. Meeting-pista-chio, Agrigento, Italy.
Barone E., Di Marco L., Marra F. P., Sidari M.(1996) Isozymes and canonical discriminant
analysis to identify pistachio (Pistacia vera L.)germplasm. HortScience 31: 134–138.
Dollo L. (1993) An isozyme study of SicilianPistacia species, varieties, and offspring fromartificial pollination. IX.G.R.E.M.P.A. Meeting-pistachio, Agrigento, Italy.
Dollo L., Hormaza J. L., Polito V. S. (1995) RAPDpolymorphisms among pistachio (Pistacia veraL.) cultivars. Fruit Var. J. 49: 147–152.
Doyle J. J., Doyle J. L. (1987) A rapid DNAisolation procedure for small quantities of freshleaf tissue. Phytochemical Bull. 19: 11–15.
Golan-Goldhirsh A., Kostiukovsky V. (1998) Med-iterranean Pistacia genus germplasm collectionat Sede Boqer Israel. Acta Hort. 470: 131–137.
Engler A. (1936) Syllabus der Pflanzenfamilien.Berlin, Germany.
Hormaza J. I., Dollo L., Polito V. S. (1994a)Identification of a RAPD marker linked to sexdetermination in Pistacia vera using bulkedsegregant analysis. Theor. Appl. Genet. 89: 9–13.
Hormaza J. I., Dollo L., Polito V. S. (1994b)Determination of relatedness and geographicalmovements of Pistacia vera (Pistachio; Anacar-diaceae) germplasm by RAPD analysis. Econ.Bot. 48: 349–358.
Fig. 4. Dendrogram of Mediterranean Pistacia generated by the UPGMA method using the Jaccard similaritymatrix shown in Table 4, based on AFLP marker analysis. The numbers on the tree branches indicate thepercentage of replicates included in a given node calculated out of 100 bootstrap replicates
A. Golan-Goldhirsh et al.: Genetic relationships among Mediterranean Pistacia 17
Hormaza J. I., Pinney K., Polito V. S. (1998)Genetic diversity of pistachio germplasm basedon RAPD markers. Econ. Bot. 52: 78–87.
Jones N., Ougham H., Thomas H. (1997) Markersand mapping: we are all genetics now. NewPhytol. 137: 165–177.
Kafkas S., Perl-Treves R. (2001) Morphologicaland molecular phylogeny of Pistacia species inTurkey. Theor. Appl. Genet. 102: 908–915.
Kafkas S., Perl-Treves R. (2002) Interspecificrelationships in Pistacia based on RAPD finger-printing. HortScience 37: 168–171.
Loukas M., Pontikis C. A. (1979) Pollen isozymepolymorphism in types of Pistacia vera andrelated species as aid in taxonomy. J. Hort. Sci.54: 95–102.
Parfitt D. E., Badenes M. L. (1997) Phylogeny ofthe genus Pistacia as determined from analysis ofthe chloroplast genome. Proc. Natl. Acad. Sci.USA 94: 7987–7992.
Parfitt D. E., Badenes M. L. (1998) Molecularphylogenetic analysis of the genus Pistacia. ActaHort. 470: 143–151.
Rohlf F. J. (1998) NTSYS-pc numerical taxonomyand multivariate analysis system, version 2.0.Exeter Publishing, Ltd., Setauket, New York.
Saitou N., Nei M. (1987) Neighbor-joining meth-od: a new method for reconstructing phyloge-netic trees. Mol. Biol. Evol. 4: 406–425.
Swofford D. L. (1993) PAUP: phylogenetic analysisusing parsimony, version 3.1, computer programdistributed by the Illinois natural history survey,Campaign, III.
Tanksley S. D., Young N. D., Paterson A. H.,Bonierbale M. W. (1989) RFLP in plant breed-ing: new tools for an old science. Bio/technology7: 257–264.
Williams J. G. K., Kubelik A. R., Livak K. J.,Rafalski J. A., Tingey S. V. (1990) DNApolymorphisms amplified by arbitrary primersare useful as genetic markers. Nucleic Acids Res.18: 6531–6535.
Yaltirik F. (1967) Anacardiaceae. In: Davis P. H.(ed.) Flora of Turkey. Edinburgh UniversityPress, UK, Vol. 2, pp. 544–548.
Zohary M. (1952) A monographical study of thegenus Pistacia. Palestine J. Bot. (JerusalemSeries) 5: 187–228.
Zohary M. (1987) Pistacia L. In: Flora Palaestina.Publications of the Israel Academy of Scienceand Humanities, Jerusalem, Vol. 2, pp. 296–300.
Zohary D. (1995) The genus Pistacia L. In:Padulosi S., Caruso T., Barone E. (eds.) Taxon-omy, distribution, conservation and uses ofPistacia genetic resources. IPGRI, Italy, pp.1–11.
Addresses of the authors: Avi Golan-Goldhirsh(e-mail: [email protected]), Oz Barazani,Zhen S. Wang, Deepak K. Khadka, VladimirKostiukovsky, Desert Plant Biotechnology Labo-ratory, Albert Katz Department of Dryland Bio-technologies, The Jacob Blaustein Institute forDesert Research, Ben-Gurion University of theNegev, Sede Boqer Campus 84990, Israel. Lisa J.Rowland, Fruit Laboratory, Beltsville AgriculturalResearch Center, Agricultural Research Service,Beltsville, MD 20705, USA. James A. Saunders,Climate Stress Laboratory, Beltsville AgriculturalResearch Center, Agricultural Research Service,Beltsville, MD 20705, USA.
18 A. Golan-Goldhirsh et al.: Genetic relationships among Mediterranean Pistacia
Related Documents