Genetic parameters for test day milk yields of first lactation Holstein cows by random regression models C. M. R. de Melo 1† , I. U. Packer 2 , C. N. Costa 3 and P. F. Machado 2 1 Aqu ¨ iculture Department – AQI/UFSC, 88040-900 Floriano ´ polis/SC, Brazil; 2 Animal Science Departament – USP/ESALQ, 13418-900 Piracicaba/SP, Brazil 3 Embrapa Gado de Leite, 36038-330 Juiz de Fora/MG, Brazil (Received 6 June 2006; Accepted 15 December 2006) Covariance components for test day milk yield using 263 390 first lactation records of 32 448 Holstein cows were estimated using random regression animal models by restricted maximum likelihood. Three functions were used to adjust the lactation curve: the five-parameter logarithmic Ali and Schaeffer function (AS), the three-parameter exponential Wilmink function in its standard form (W) and in a modified form (W*), by reducing the range of covariate, and the combination of Legendre polynomial and W (LEG þ W). Heterogeneous residual variance (RV) for different classes (4 and 29) of days in milk was considered in adjusting the functions. Estimates of RV were quite similar, rating from 4.15 to 5.29 kg 2 . Heritability estimates for AS (0.29 to 0.42), LEG þ W (0.28 to 0.42) and W* (0.33 to 0.40) were similar, but heritability estimates used W (0.25 to 0.65) were highest than those estimated by the other functions, particularly at the end of lactation. Genetic correlations between milk yield on consecutive test days were close to unity, but decreased as the interval between test days increased. The AS function with homogeneous RV model had the best fit among those evaluated. Keywords: genetic parameters, milk yield, random regression model, test day model, variance components Introduction Test day models (TDM) have been receiving considerable attention from research studies on the genetic improve- ment of dairy cattle (Gengler et al., 1999; Kettunen et al., 2000; Schaeffer et al., 2000; Swalve, 2000; Misztal et al., 2000; Jensen, 2002; Lopez-Romero and Caraban ˜ o, 2003; Mrode and Swanson, 2004; Fischer et al., 2004; Schaeffer, 2004; Albuquerque and Meyer, 2005). The use of TDM allows a more accurate definition of contemporary groups (CG) and associated environmental effects, thus offering a more specific definition of the effects of the lactation stage and reproduction of dairy cows. Further characteristics associated with TDM include the use of additional infor- mation on a single animal during genetic evaluations, a better adjustment for lactation of different durations and the possibility of adjusting for individual differences in the shape of a lactation curve, which permits the assessment of lactation persistence (Jakobsen et al., 2002). Perhaps the most important use of TDM is that it makes possible the assessment of animals with lactations in progress, allowing for more frequent assessments and, thus, a reduction in the generation interval (Swalve, 1998 and 2000; Jensen, 2002). Different models have been described for the adjustment of TDM (Misztal et al., 2000; Swalve, 2000; Jensen, 2002). Random regression models (RRM) allow the modeling of the covariance structure among test day yields. They avoid the simplicity associated to repeatability models, which assume a correlation equal to unity and variance homo- geneous among the yields, as well as the computational complexity associated to multiple character models, due to the great number of parameters that need to be estimated (Meyer, 1998b, Misztal et al., 2000: Swalve, 2000). The potential advantages associated with TDM have led researchers from various countries to investigate the implementation of these procedures in national genetic evaluation systems (Swalve, 2000; Pool et al., 2000; Jamrozik et al., 2001; Lidauer et al., 2000 and 2003; Samore ´ et al., 2002). In such a context, Jamrozik and Schaeffer (1997) reported very high heritability estimates using TDM, but negative genetic correlations among test days in early and late lactation when using Ali and Schaeffer (1987) curve to adjust the additive genetic effect, assuming the non-hereditary animal effect constant. Later, Jamrozik et al. (1997a and b), using the Wilmink (1987) curve reported † E-mail: [email protected] Animal (2007), 1: Pages 325–334 Q The Animal Consortium 2007 doi: 10.1017/S1751731107685036 animal 325

Welcome message from author
This document is posted to help you gain knowledge. Please leave a comment to let me know what you think about it! Share it to your friends and learn new things together.
Transcript
Genetic parameters for test day milk yields of first lactationHolstein cows by random regression models
C. M. R. de Melo1†, I. U. Packer2, C. N. Costa3 and P. F. Machado2
1Aquiculture Department – AQI/UFSC, 88040-900 Florianopolis/SC, Brazil; 2Animal Science Departament – USP/ESALQ, 13418-900 Piracicaba/SP, Brazil3Embrapa Gado de Leite, 36038-330 Juiz de Fora/MG, Brazil
(Received 6 June 2006; Accepted 15 December 2006)
Covariance components for test day milk yield using 263 390 first lactation records of 32 448 Holstein cows were estimated usingrandom regression animal models by restricted maximum likelihood. Three functions were used to adjust the lactation curve: thefive-parameter logarithmic Ali and Schaeffer function (AS), the three-parameter exponential Wilmink function in its standard form(W) and in a modified form (W*), by reducing the range of covariate, and the combination of Legendre polynomial and W(LEG þ W). Heterogeneous residual variance (RV) for different classes (4 and 29) of days in milk was considered in adjusting thefunctions. Estimates of RV were quite similar, rating from 4.15 to 5.29 kg2. Heritability estimates for AS (0.29 to 0.42), LEG þ W(0.28 to 0.42) and W* (0.33 to 0.40) were similar, but heritability estimates used W (0.25 to 0.65) were highest than thoseestimated by the other functions, particularly at the end of lactation. Genetic correlations between milk yield on consecutive testdays were close to unity, but decreased as the interval between test days increased. The AS function with homogeneous RVmodel had the best fit among those evaluated.
Keywords: genetic parameters, milk yield, random regression model, test day model, variance components
Introduction
Test day models (TDM) have been receiving considerableattention from research studies on the genetic improve-ment of dairy cattle (Gengler et al., 1999; Kettunen et al.,2000; Schaeffer et al., 2000; Swalve, 2000; Misztal et al.,2000; Jensen, 2002; Lopez-Romero and Carabano, 2003;Mrode and Swanson, 2004; Fischer et al., 2004; Schaeffer,2004; Albuquerque and Meyer, 2005). The use of TDMallows a more accurate definition of contemporary groups(CG) and associated environmental effects, thus offering amore specific definition of the effects of the lactation stageand reproduction of dairy cows. Further characteristicsassociated with TDM include the use of additional infor-mation on a single animal during genetic evaluations, abetter adjustment for lactation of different durations andthe possibility of adjusting for individual differences in theshape of a lactation curve, which permits the assessmentof lactation persistence (Jakobsen et al., 2002). Perhapsthe most important use of TDM is that it makes possiblethe assessment of animals with lactations in progress,allowing for more frequent assessments and, thus, a
reduction in the generation interval (Swalve, 1998 and2000; Jensen, 2002).
Different models have been described for the adjustmentof TDM (Misztal et al., 2000; Swalve, 2000; Jensen, 2002).Random regression models (RRM) allow the modeling ofthe covariance structure among test day yields. They avoidthe simplicity associated to repeatability models, whichassume a correlation equal to unity and variance homo-geneous among the yields, as well as the computationalcomplexity associated to multiple character models, due tothe great number of parameters that need to be estimated(Meyer, 1998b, Misztal et al., 2000: Swalve, 2000).
The potential advantages associated with TDM have ledresearchers from various countries to investigate theimplementation of these procedures in national geneticevaluation systems (Swalve, 2000; Pool et al., 2000; Jamroziket al., 2001; Lidauer et al., 2000 and 2003; Samoreet al., 2002). In such a context, Jamrozik and Schaeffer(1997) reported very high heritability estimates using TDM,but negative genetic correlations among test days in earlyand late lactation when using Ali and Schaeffer (1987)curve to adjust the additive genetic effect, assuming thenon-hereditary animal effect constant. Later, Jamrozik et al.(1997a and b), using the Wilmink (1987) curve reported† E-mail: [email protected]
Animal (2007), 1: Pages 325–334 Q The Animal Consortium 2007doi: 10.1017/S1751731107685036
animal
325
more realistic heritability estimates at the beginning andend of lactation, indicating the importance of adequatemodeling of the non-hereditary animal effect in randomregression models. Brotherstone et al. (2000) reported thatthe parametric curves of Ali and Schaeffer (1987) andWilmink (1987) were more adequate in adjusting the milkyields first lactation Holstein cows when compared withLegendre orthogonal polynomials.
The parametric functions of Ali and Schaeffer (1987) andWilmink (1987) have been used in the adjustment of RRM,as they allow the modeling of the lactation curve and sim-ultaneously characterise the covariance structure amongthe test day yields (Jamrozik and Schaeffer, 1997; Brother-stone et al., 2000). The implementation of RRM for geneticevaluations of dairy cattle depends on the estimates of thecovariance components and genetic parameters for thetraits included in the breeding program. The objective ofthis study is to evaluate and to compare the parametriclogarithmic function proposed by Ali and Schaeffer (1987)and the exponential function proposed by Wilmink (1987)and a combination of the Legendre polynomial of secondorder and Wilmink function to adjust test day milk yieldsof first lactation Holstein cows using RRM.
Material and methods
DataMilk yield records were obtained from the milk recordingservices of the Brazilian Holstein and their state affiliatesfrom 1991 to 2001. Records originated from 39 048 lacta-tions from 531 herds located in the states of Sao Paulo,Minas Gerais, Rio Grande do Sul, Santa Catarina and Espır-ito Santo.
Test day records were edited for cows aged 18 to 48months and 5 to 305 days after calving. It was required aminimum of three test day records per cow. Moreover, itwas determined that each CG, defined as test herd-year-month of calving, included at least four records. Afterthese edits 32 448 first lactations (263 390 test dayrecords) were used in the statistical analyses. Table 1 dis-plays number of records, animals and data structure, aswell as average and standard deviations of milk yield inthe test days. There was an average of eight test days percow; and 80.85% of the cows had eight or more test days.
Just 9.39% of the cows presented less than five availabletest days.
The pedigree data included 3737 bulls and 32 449 cowswith records. Non-informative animals were eliminated anda total of 49 394 animals were included in the A matrix.
ModelsThe lactation curve and covariance structure among testdays were modeled by three functions.
(a) Ali and Schaeffer (1987) logarithmic function (AS):
a0 þ a1cþa2c2 þ a3ðln 1=cÞ þ a4ðln 1=cÞ2 ð1Þ
where c ¼ DIM/305 and DIM ¼ days in milk.(b) Wilmink exponential (1987) function (W):
a0 þ a1tþa2expð2a3tÞ ð2Þ
where t ¼ DIM.(c) An alternative form of the Wilmink exponential func-
tion (W*):
a0 þ a1t=100 þ a2expð2a3tÞ ð3Þ
in which the second term is divided by 100 to reducethe amplitude of the covariate, expecting to improvethe numeric properties of the model (Jakobsen et al.,2002).
(d) and a combination of parametric and non-parametricfunction (LEG þ W):
0:7071a0 þ 1:2247xa1 þ ð2:3717x2 2 0:7906Þa2
þ expð2a3xÞ ð4Þ
where x ¼ 21 þ 2(DIM 2 5)/(305 2 5) and thecoefficients a0–a2 are coefficients of the secondorder Legendre polynomial at DIM.
In the Wilmink curve, the fourth parameter (a3) is gener-ally considered as a constant. In the present study it wasassumed equal to 20.05.
In its general expression, the RRM may be representedby:
yit¼FitþXf21
m¼0
bmPmðtÞþXk21
m¼0
aimPmðtÞþXk21
m¼0
gimPmðtÞþeit:
where yit is the milk yield of cow i on day t; bm are the coef-ficients of fixed regression for an average population curve;aim and gim are, respectively, the additive genetic and thenon–hereditary random regression coefficients for cow i; eit
is the measurement error associated to classes of time t; Fit
represent fixed effects of the model: test herd–year–month, season of calving, and age of the cow at calving asa co–variable with linear and quadratic terms; Pm(t) is themth term of the adjusted function; f and k is the number ofcoefficients of the fixed and random effects of the adjustedfunction. Thus, for the AS curve in [1]: P0(t) ¼ 1, P1(t) ¼ c,P2(t) ¼ c 2, P3(t) ¼ ln 1/c, P4(t) ¼ (ln 1/c)2 and f ¼ k ¼ 5.
Table 1 Structure of the data, average (kg) and standard deviations(kg) of test day milk yields
No. of records 263 930 No. of animals in analysis† 49 394No. of animals
with records32 449 No. of sires‡ 1955
Average 20.57 No. of dams§ 9739s.d. 5.99 No. of contemporary groups 14 537
† Including parents without records and dummy identities for unknown dams.‡ With progeny in the data.§ With progeny in the data, including dummy assigned for animals with miss-ing dam identities.
De Melo, Packer, Costa and Machado
326
The model above can be written in matrix form as:
y ¼ Xbþ Zaþ ZDgþ e:
where y is the test day yields vector; b is the vector offixed effects; a and g are the vectors of random regressioncoefficients for the additive genetic and non–hereditaryanimal effects, respectively; e is the vector of residual ran-dom effect; and X, Z and ZD are the matrices that associatethe observations to the fixed effects, random animal effectsand non–hereditary animal effects, respectively. Assume
a
g
e
2664
3775~ Nð0;VÞ; V ¼
GA^A 0 0
0 PD^I 0
0 0 R
2664
3775;
in which GA and PD are, respectively, the additive geneticand non–hereditary random regression coefficients covari-ance matrix effect; A is the relationship matrix; I is anidentity; ^ is Kronecker product between matrices; andR ¼ diags2
en; in which n represents number of the classesof days in milk (DIM) for adjustment of heterogeneousresidual variance. Thus, for the AS curve in [1],n ¼ 1,. . .,29 for DIM: 5–20, 21–30,. . .,295–305;n ¼ 1,. . .,4 for DIM: 5–45, 46–115, 116–265 and 266–305, and n ¼ 1 residual variance (RV) was assumed hom-ogenous or constant throughout lactation. The adjustedmodels using the AS curve were identified as AS, followedby ME (measurement error) and the number of classes ofRV (29, 4 or 1). Thus, ASME29 identifies the AS curveadjusted with 29 classes of measurement error.
The covariance components for the random effects wereestimated using ‘DxMRR’ Meyer (1998a) with (AI)REMLaverage information algorithm (Meyer, 1997). The conver-gence criterion was defined by the difference between thevalue of the likelihood function of consecutive iterationsless than 1024. Each analysis was repeated with estimatedvalues from the previous analysis until the values of thelikelihood function were equal for two consecutiveanalyses.
The evaluation of the adjusted models was accom-plished by comparing the covariance components and theparameters estimated by a repeatability single charactermodel (Melo et al., 2005). Also the following statistical cri-teria were used: logarithm of the maximum likelihood func-tion (log ‘); the Akaike information criteria(AIC ¼ 22 log‘ þ 2p); and the Schwarz information cri-teria (BIC ¼ 22 log ‘ þ p log(N 2 r(x))), in which p is thenumber of estimated parameters, N is the sample size andr(x) is the rank of the matrix of fixed effect coefficients inthe model.
Results
The log ‘ and AIC values indicate that the adjustment ofthe ASME29 model is superior to the other models studied,whereas for BIC, ASME1 proved to be superior to the other
models (Table 2). Values obtained for log ‘ and AIC tendto favour models with a greater number of parameters,whereas BIC, which is more likely to penalise a greaternumber of parameters, tends to select more parsimoniousmodels. The W model exhibited a convergence difficulty.This was probably due to the numeric problems thatoccurred in function of the amplitude of the co-variables,which was not observed using the W* model. TheLEG þ W model showed better results than models W eW*, but inferior than the AS models.
The number of records, average and standard deviations,and the residual variance estimates for milk yields in therespective measurement error classes of DIM for theadjusted models are shown in Table 3. Only results forhomogeneous residual variances are given for LEG þ W, We W* models, since differences among the residual var-iance estimates assuming 29 and four measurement errorclasses were rather small and similar to those observed forthe AS model. The RV values found were 5.29, 5.56 and5.63 kg2 for the LEG þ W, W and W* models respectively;which were larger than 4.56 kg2 obtained for the ASME1model (Table 3).
The RV estimates obtained for the DIM through theadjustment of the ASME29 model were similar, varyingfrom 4.15 kg2 for ME28 to 5.11 kg2 for ME26. The averageRV obtained from the 29 measurement error groups was4.55 kg2, with a standard deviation of 0.26 kg. RV esti-mates obtained through the adjustment of the ASME4model varied from 4.78 kg2 for ME1 to 4.50 kg2 for ME2.The average RV obtained from this model was 4.59 kg2,with a standard deviation of 0.13 kg. The RV value esti-mated by fitting the ASME1 model was 4.56 kg2. Overall, itwas observed similar average and small variation for RVestimates among models with different measurement errorindicating there is no need to fit for heterogeneity of RV.
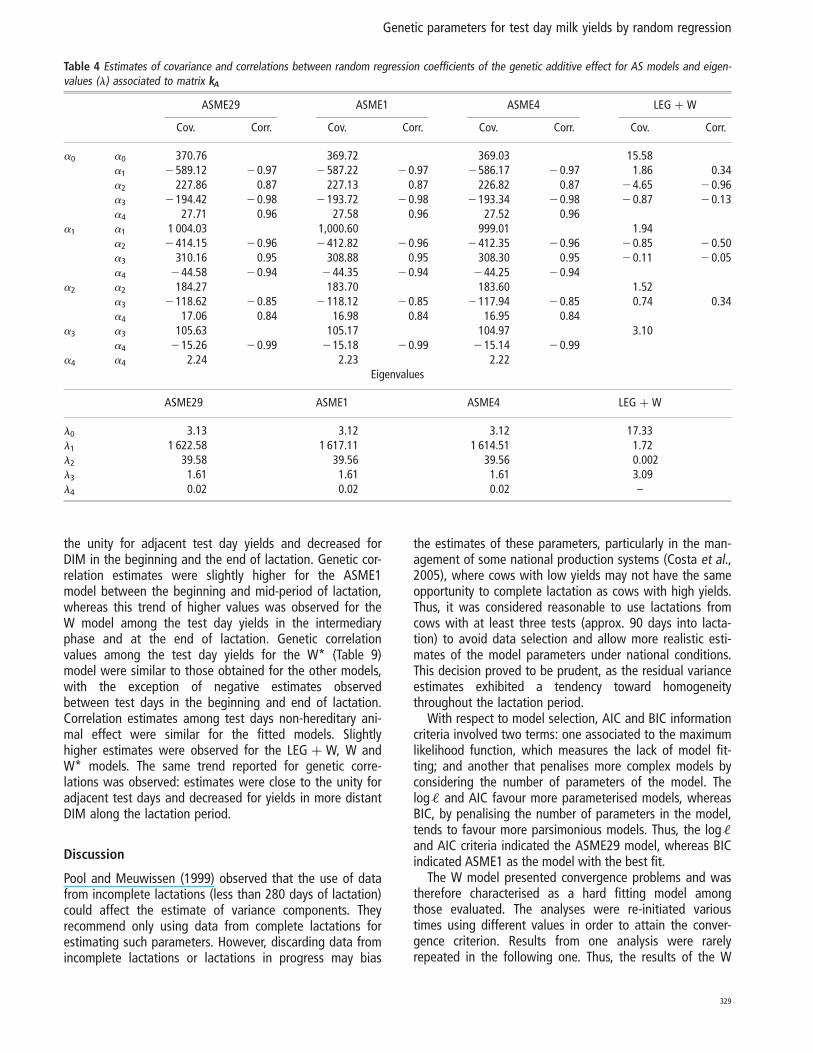
Covariance estimates and correlations among the ran-dom regression coefficients for the additive genetic andnon-hereditary animal effects of the AS curve, as well asthe associated eigenvalues are displayed in Tables 4 and 5.The estimates of the random regression coefficients for theadditive genetic effect were very similar regardless of the
Table 2 Rank of the matrix of random regression coefficients forgenetic additive effect (kA), number of parameters (p), the log likeli-hood (log ‘), criteria of information of AIC and BIC for each randomregression model
Model Rank of kA p log‘ AIC† BIC†
ASME29 5 59 2 424 543.99 849 205.99 849 824.39ASME4 5 34 2424 601.44 849 270.89 849 627.25LEG þ W 4 21 2429 283.53 858 609.07 858 829.17ASME1 5 31 2424 611.27 849 284.54 849 609.47W 3 13 2445 036.06 890 098.12 890 234.38W* 3 13 2430 912.37 861 850.73 861 986.99
† AIC ¼ 22 log ‘ þ 2p. BIC ¼ 22 log ‘ þ p log (N 2 r(x)), in which p is thenumber of estimated parameters, N is the sample size, r(x) is the matrix rankof the fixed effect coefficients in the analysis model.
Genetic parameters for test day milk yields by random regression
327
RV modeling for the AS curve. The same trend wasobserved for the estimates of coefficients of the non-her-editary animal effect.
Covariance estimates and correlations among the randomregression coefficients in the W and W* curves for the addi-tive genetic and non-hereditary animal effects are shown inTable 6. The variance estimates were similar for coefficientsa0 and a2 but higher for a1 with the W* curve. Some differ-ences were observed between functions regarding the magni-tude and meaning of the correlations among the coefficients.This was certainly due to the scale effect related to theco-variable (t/100) associated to coefficient a1.
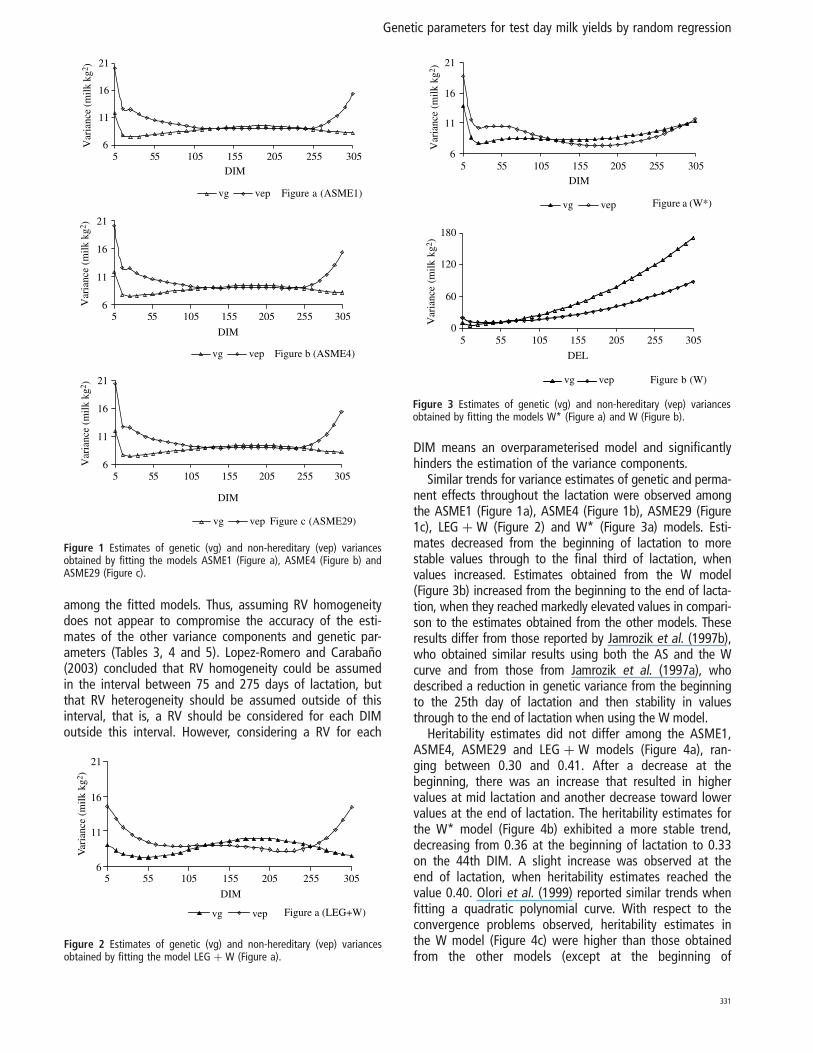
The genetic variance estimates obtained from the ASME1(Figure 1a), ASME4 (Figure 1b), ASME29 (Figure 1c),LEG þ W (Figure 2) and W* (Figure 3a) models were similarthroughout the lactation period. In the ASME1 model, thegenetic variance (7.59 to 11.88 kg2) presented an average of8.77 kg2, with a standard deviation of 0.63 kg (Figure 1a).However, genetic variance estimates for the W model exhib-ited a different trend, increasing from 9.47 kg2 on the fifthDIM to 171.27 kg2 at the end of lactation (Figure 3b).
Variance estimates of the non-hereditary animal effectpresented a trend similar to that observed for the geneticvariance estimates in the ASME1 (Figure 1a), ASME4
(Figure 1b), ASME29 (Figure 1c) and W* (Figure 3a)models, with the exception of an increase occurring fromthe 240th DIM through to the end of lactation. Withrespect to the W model, variance estimates for the non-hereditary animal effect accompanied the same trend asthe estimates for the additive genetic effect, increasingfrom the beginning to the end of lactation (Figure 3b).
Heritability estimates did not differ among the ASME29,ASME4, ASME1 and LEG þ W models (Figure 4a). The esti-mates decreased from 0.35 at the beginning of lactation to0.30 on the 25th DIM and afterwards increased to 0.41 onthe 234th DIM; and again decreased through to the end oflactation. Heritability estimates for the W* model (Figure4b) exhibited a more stable trend, decreasing from 0.36 atthe beginning of lactation to 0.33 on the 44th DIM andsmall increase at the end of lactation with a value of 0.40.Heritability estimates in the W model (Figure 4c) beganwith a value of 0.27 and was larger than the estimatesobtained from the other models, particularly at the end oflactation (0.65). The estimates for the W model reflectedthe trend of increasing genetic variance along lactation.
Genetic correlation estimates among test day yieldswere similar between ASME1 (Table 7), W* (Table 8) andthe LEG þ W models (Table 10). Estimates were close to
Table 3 Days in milk (DIM), number of records (N), mean and standard deviation (s.d.) and residual variance estimates (RV) for milk yield forclasses of error measurements from fitted RR models
ASME29
DIM N Mean s.d. RV DIM N Mean s.d. RV
5–20 13 273 19.61 5.36 4.81 161–170 9027 20.95 6.01 4.4721–30 9807 21.39 5.43 4.73 171–180 8896 20.67 5.87 4.2531–40 9913 22.07 5.57 4.75 181–190 8832 20.28 5.93 4.2041–50 9762 22.61 5.59 4.72 191–200 8876 20.15 5.91 4.4751–60 9746 22.54 5.62 4.51 201–210 8526 19.89 5.81 4.5861–70 9787 22.65 5.68 4.81 211–220 8540 19.56 5.85 4.8171–80 10 048 22.62 5.75 4.53 221–230 8386 19.32 5.94 4.9681–90 9751 22.36 5.72 4.51 231–240 8145 19.09 5.77 4.6291–100 9784 22.32 5.78 4.27 241–250 7994 18.62 5.76 4.48101–110 9758 22.11 5.83 4.24 251–260 7858 18.33 5.72 4.46111–120 9528 21.93 5.81 4.27 261–270 7480 18.06 5.76 5.11121–130 9597 21.80 5.86 4.37 271–280 7105 17.68 5.65 4.60131–140 9396 21.67 6.01 4.76 281–290 6697 17.46 5.68 4.15141–150 9148 21.29 5.91 4.62 291–305 8508 17.18 5.58 4.29151–160 9222 21.14 5.90 4.49
ASME4 W
5–45 38 162 21.10 5.66 4.78 5–305 263 930 20.57 5.99 5.5646–115 68 263 22.42 5.98 4.50116–265 130 967 20.26 5.73 4.55266–305 259 98 17.48 5.59 4.53
ASME1 W*
5–305 263 930 20.57 5.99 4.56 5–305 263 930 20.57 5.99 5.63
LEG þ W
5–305 263 930 20.57 5.99 5.29
De Melo, Packer, Costa and Machado
328
the unity for adjacent test day yields and decreased forDIM in the beginning and the end of lactation. Genetic cor-relation estimates were slightly higher for the ASME1model between the beginning and mid-period of lactation,whereas this trend of higher values was observed for theW model among the test day yields in the intermediaryphase and at the end of lactation. Genetic correlationvalues among the test day yields for the W* (Table 9)model were similar to those obtained for the other models,with the exception of negative estimates observedbetween test days in the beginning and end of lactation.Correlation estimates among test days non-hereditary ani-mal effect were similar for the fitted models. Slightlyhigher estimates were observed for the LEG þ W, W andW* models. The same trend reported for genetic corre-lations was observed: estimates were close to the unity foradjacent test days and decreased for yields in more distantDIM along the lactation period.
Discussion
Pool and Meuwissen (1999) observed that the use of datafrom incomplete lactations (less than 280 days of lactation)could affect the estimate of variance components. Theyrecommend only using data from complete lactations forestimating such parameters. However, discarding data fromincomplete lactations or lactations in progress may bias
the estimates of these parameters, particularly in the man-agement of some national production systems (Costa et al.,2005), where cows with low yields may not have the sameopportunity to complete lactation as cows with high yields.Thus, it was considered reasonable to use lactations fromcows with at least three tests (approx. 90 days into lacta-tion) to avoid data selection and allow more realistic esti-mates of the model parameters under national conditions.This decision proved to be prudent, as the residual varianceestimates exhibited a tendency toward homogeneitythroughout the lactation period.
With respect to model selection, AIC and BIC informationcriteria involved two terms: one associated to the maximumlikelihood function, which measures the lack of model fit-ting; and another that penalises more complex models byconsidering the number of parameters of the model. Thelog‘ and AIC favour more parameterised models, whereasBIC, by penalising the number of parameters in the model,tends to favour more parsimonious models. Thus, the log‘
and AIC criteria indicated the ASME29 model, whereas BICindicated ASME1 as the model with the best fit.
The W model presented convergence problems and wastherefore characterised as a hard fitting model amongthose evaluated. The analyses were re-initiated varioustimes using different values in order to attain the conver-gence criterion. Results from one analysis were rarelyrepeated in the following one. Thus, the results of the W
Table 4 Estimates of covariance and correlations between random regression coefficients of the genetic additive effect for AS models and eigen-values (l) associated to matrix kA
ASME29 ASME1 ASME4 LEG þ W
Cov. Corr. Cov. Corr. Cov. Corr. Cov. Corr.
a0 a0 370.76 369.72 369.03 15.58a1 2589.12 20.97 2587.22 20.97 2586.17 20.97 1.86 0.34a2 227.86 0.87 227.13 0.87 226.82 0.87 24.65 20.96a3 2194.42 20.98 2193.72 20.98 2193.34 20.98 20.87 20.13a4 27.71 0.96 27.58 0.96 27.52 0.96
a1 a1 1 004.03 1,000.60 999.01 1.94a2 2414.15 20.96 2412.82 20.96 2412.35 20.96 20.85 20.50a3 310.16 0.95 308.88 0.95 308.30 0.95 20.11 20.05a4 244.58 20.94 244.35 20.94 244.25 20.94
a2 a2 184.27 183.70 183.60 1.52a3 2118.62 20.85 2118.12 20.85 2117.94 20.85 0.74 0.34a4 17.06 0.84 16.98 0.84 16.95 0.84
a3 a3 105.63 105.17 104.97 3.10a4 215.26 20.99 215.18 20.99 215.14 20.99
a4 a4 2.24 2.23 2.22Eigenvalues
ASME29 ASME1 ASME4 LEG þ W
l0 3.13 3.12 3.12 17.33l1 1 622.58 1 617.11 1 614.51 1.72l2 39.58 39.56 39.56 0.002l3 1.61 1.61 1.61 3.09l4 0.02 0.02 0.02 –
Genetic parameters for test day milk yields by random regression
329
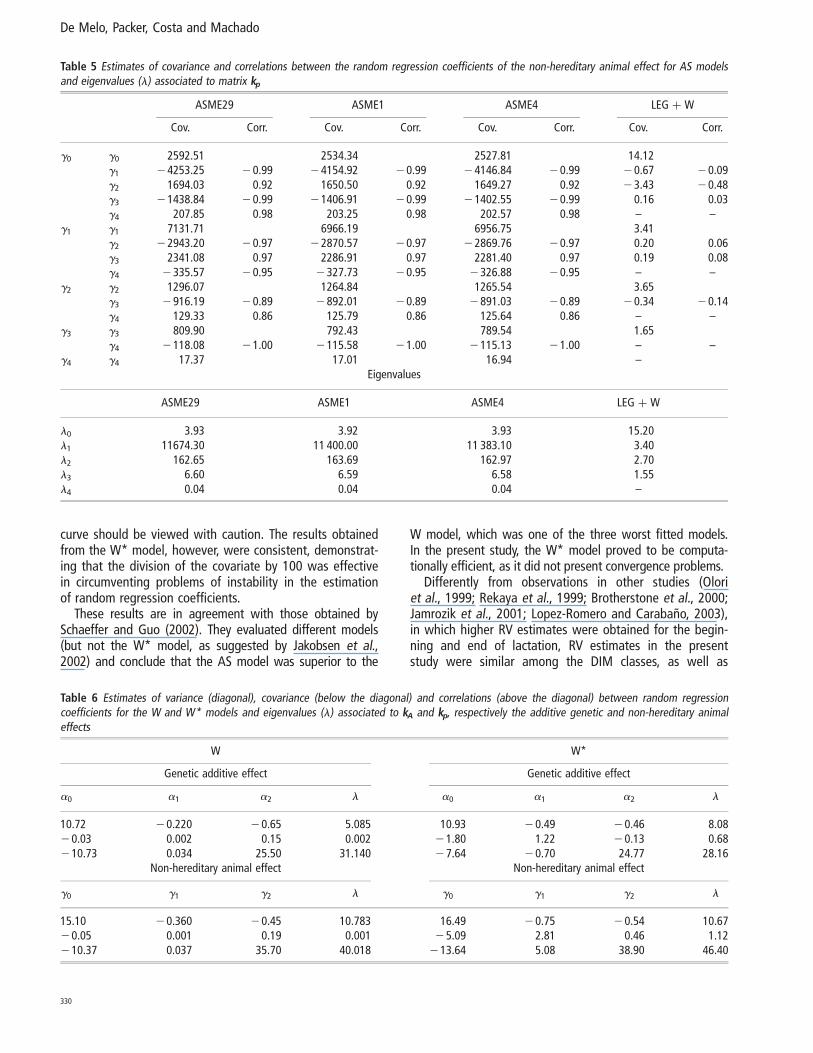
curve should be viewed with caution. The results obtainedfrom the W* model, however, were consistent, demonstrat-ing that the division of the covariate by 100 was effectivein circumventing problems of instability in the estimationof random regression coefficients.
These results are in agreement with those obtained bySchaeffer and Guo (2002). They evaluated different models(but not the W* model, as suggested by Jakobsen et al.,2002) and conclude that the AS model was superior to the
W model, which was one of the three worst fitted models.In the present study, the W* model proved to be computa-tionally efficient, as it did not present convergence problems.
Differently from observations in other studies (Oloriet al., 1999; Rekaya et al., 1999; Brotherstone et al., 2000;Jamrozik et al., 2001; Lopez-Romero and Carabano, 2003),in which higher RV estimates were obtained for the begin-ning and end of lactation, RV estimates in the presentstudy were similar among the DIM classes, as well as
Table 5 Estimates of covariance and correlations between the random regression coefficients of the non-hereditary animal effect for AS modelsand eigenvalues (l) associated to matrix kp
ASME29 ASME1 ASME4 LEG þ W
Cov. Corr. Cov. Corr. Cov. Corr. Cov. Corr.
g0 g0 2592.51 2534.34 2527.81 14.12g1 24253.25 20.99 24154.92 20.99 24146.84 20.99 20.67 20.09g2 1694.03 0.92 1650.50 0.92 1649.27 0.92 23.43 20.48g3 21438.84 20.99 21406.91 20.99 21402.55 20.99 0.16 0.03g4 207.85 0.98 203.25 0.98 202.57 0.98 – –
g1 g1 7131.71 6966.19 6956.75 3.41g2 22943.20 20.97 22870.57 20.97 22869.76 20.97 0.20 0.06g3 2341.08 0.97 2286.91 0.97 2281.40 0.97 0.19 0.08g4 2335.57 20.95 2327.73 20.95 2326.88 20.95 – –
g2 g2 1296.07 1264.84 1265.54 3.65g3 2916.19 20.89 2892.01 20.89 2891.03 20.89 20.34 20.14g4 129.33 0.86 125.79 0.86 125.64 0.86 – –
g3 g3 809.90 792.43 789.54 1.65g4 2118.08 21.00 2115.58 21.00 2115.13 21.00 – –
g4 g4 17.37 17.01 16.94 –Eigenvalues
ASME29 ASME1 ASME4 LEG þ W
l0 3.93 3.92 3.93 15.20l1 11674.30 11 400.00 11 383.10 3.40l2 162.65 163.69 162.97 2.70l3 6.60 6.59 6.58 1.55l4 0.04 0.04 0.04 –
Table 6 Estimates of variance (diagonal), covariance (below the diagonal) and correlations (above the diagonal) between random regressioncoefficients for the W and W* models and eigenvalues (l) associated to kA and kp, respectively the additive genetic and non-hereditary animaleffects
W W*
Genetic additive effect Genetic additive effect
a0 a1 a2 l a0 a1 a2 l
10.72 20.220 20.65 5.085 10.93 20.49 20.46 8.0820.03 0.002 0.15 0.002 21.80 1.22 20.13 0.68210.73 0.034 25.50 31.140 27.64 20.70 24.77 28.16
Non-hereditary animal effect Non-hereditary animal effect
g0 g1 g2 l g0 g1 g2 l
15.10 20.360 20.45 10.783 16.49 20.75 20.54 10.6720.05 0.001 0.19 0.001 25.09 2.81 0.46 1.12210.37 0.037 35.70 40.018 213.64 5.08 38.90 46.40
De Melo, Packer, Costa and Machado
330
among the fitted models. Thus, assuming RV homogeneitydoes not appear to compromise the accuracy of the esti-mates of the other variance components and genetic par-ameters (Tables 3, 4 and 5). Lopez-Romero and Carabano(2003) concluded that RV homogeneity could be assumedin the interval between 75 and 275 days of lactation, butthat RV heterogeneity should be assumed outside of thisinterval, that is, a RV should be considered for each DIMoutside this interval. However, considering a RV for each
DIM means an overparameterised model and significantlyhinders the estimation of the variance components.
Similar trends for variance estimates of genetic and perma-nent effects throughout the lactation were observed amongthe ASME1 (Figure 1a), ASME4 (Figure 1b), ASME29 (Figure1c), LEG þ W (Figure 2) and W* (Figure 3a) models. Esti-mates decreased from the beginning of lactation to morestable values through to the final third of lactation, whenvalues increased. Estimates obtained from the W model(Figure 3b) increased from the beginning to the end of lacta-tion, when they reached markedly elevated values in compari-son to the estimates obtained from the other models. Theseresults differ from those reported by Jamrozik et al. (1997b),who obtained similar results using both the AS and the Wcurve and from those from Jamrozik et al. (1997a), whodescribed a reduction in genetic variance from the beginningto the 25th day of lactation and then stability in valuesthrough to the end of lactation when using the W model.
Heritability estimates did not differ among the ASME1,ASME4, ASME29 and LEG þ W models (Figure 4a), ran-ging between 0.30 and 0.41. After a decrease at thebeginning, there was an increase that resulted in highervalues at mid lactation and another decrease toward lowervalues at the end of lactation. The heritability estimates forthe W* model (Figure 4b) exhibited a more stable trend,decreasing from 0.36 at the beginning of lactation to 0.33on the 44th DIM. A slight increase was observed at theend of lactation, when heritability estimates reached thevalue 0.40. Olori et al. (1999) reported similar trends whenfitting a quadratic polynomial curve. With respect to theconvergence problems observed, heritability estimates inthe W model (Figure 4c) were higher than those obtainedfrom the other models (except at the beginning of
Figure 1 Estimates of genetic (vg) and non-hereditary (vep) variancesobtained by fitting the models ASME1 (Figure a), ASME4 (Figure b) andASME29 (Figure c).
Figure 2 Estimates of genetic (vg) and non-hereditary (vep) variancesobtained by fitting the model LEG þ W (Figure a).
Figure 3 Estimates of genetic (vg) and non-hereditary (vep) variancesobtained by fitting the models W* (Figure a) and W (Figure b).
Genetic parameters for test day milk yields by random regression
331
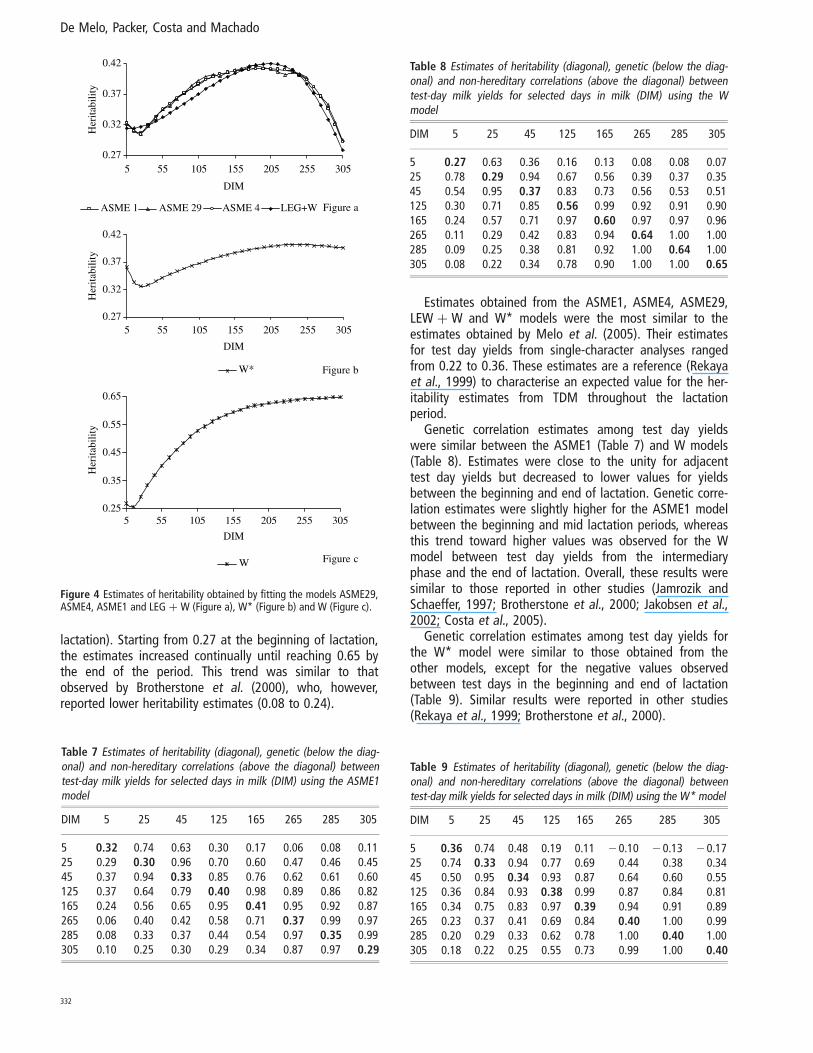
lactation). Starting from 0.27 at the beginning of lactation,the estimates increased continually until reaching 0.65 bythe end of the period. This trend was similar to thatobserved by Brotherstone et al. (2000), who, however,reported lower heritability estimates (0.08 to 0.24).
Estimates obtained from the ASME1, ASME4, ASME29,LEW þ W and W* models were the most similar to theestimates obtained by Melo et al. (2005). Their estimatesfor test day yields from single-character analyses rangedfrom 0.22 to 0.36. These estimates are a reference (Rekayaet al., 1999) to characterise an expected value for the her-itability estimates from TDM throughout the lactationperiod.
Genetic correlation estimates among test day yieldswere similar between the ASME1 (Table 7) and W models(Table 8). Estimates were close to the unity for adjacenttest day yields but decreased to lower values for yieldsbetween the beginning and end of lactation. Genetic corre-lation estimates were slightly higher for the ASME1 modelbetween the beginning and mid lactation periods, whereasthis trend toward higher values was observed for the Wmodel between test day yields from the intermediaryphase and the end of lactation. Overall, these results weresimilar to those reported in other studies (Jamrozik andSchaeffer, 1997; Brotherstone et al., 2000; Jakobsen et al.,2002; Costa et al., 2005).
Genetic correlation estimates among test day yields forthe W* model were similar to those obtained from theother models, except for the negative values observedbetween test days in the beginning and end of lactation(Table 9). Similar results were reported in other studies(Rekaya et al., 1999; Brotherstone et al., 2000).
Figure 4 Estimates of heritability obtained by fitting the models ASME29,ASME4, ASME1 and LEG þ W (Figure a), W* (Figure b) and W (Figure c).
Table 7 Estimates of heritability (diagonal), genetic (below the diag-onal) and non-hereditary correlations (above the diagonal) betweentest-day milk yields for selected days in milk (DIM) using the ASME1model
DIM 5 25 45 125 165 265 285 305
5 0.32 0.74 0.63 0.30 0.17 0.06 0.08 0.1125 0.29 0.30 0.96 0.70 0.60 0.47 0.46 0.4545 0.37 0.94 0.33 0.85 0.76 0.62 0.61 0.60125 0.37 0.64 0.79 0.40 0.98 0.89 0.86 0.82165 0.24 0.56 0.65 0.95 0.41 0.95 0.92 0.87265 0.06 0.40 0.42 0.58 0.71 0.37 0.99 0.97285 0.08 0.33 0.37 0.44 0.54 0.97 0.35 0.99305 0.10 0.25 0.30 0.29 0.34 0.87 0.97 0.29
Table 8 Estimates of heritability (diagonal), genetic (below the diag-onal) and non-hereditary correlations (above the diagonal) betweentest-day milk yields for selected days in milk (DIM) using the Wmodel
DIM 5 25 45 125 165 265 285 305
5 0.27 0.63 0.36 0.16 0.13 0.08 0.08 0.0725 0.78 0.29 0.94 0.67 0.56 0.39 0.37 0.3545 0.54 0.95 0.37 0.83 0.73 0.56 0.53 0.51125 0.30 0.71 0.85 0.56 0.99 0.92 0.91 0.90165 0.24 0.57 0.71 0.97 0.60 0.97 0.97 0.96265 0.11 0.29 0.42 0.83 0.94 0.64 1.00 1.00285 0.09 0.25 0.38 0.81 0.92 1.00 0.64 1.00305 0.08 0.22 0.34 0.78 0.90 1.00 1.00 0.65
Table 9 Estimates of heritability (diagonal), genetic (below the diag-onal) and non-hereditary correlations (above the diagonal) betweentest-day milk yields for selected days in milk (DIM) using the W* model
DIM 5 25 45 125 165 265 285 305
5 0.36 0.74 0.48 0.19 0.11 20.10 20.13 20.1725 0.74 0.33 0.94 0.77 0.69 0.44 0.38 0.3445 0.50 0.95 0.34 0.93 0.87 0.64 0.60 0.55125 0.36 0.84 0.93 0.38 0.99 0.87 0.84 0.81165 0.34 0.75 0.83 0.97 0.39 0.94 0.91 0.89265 0.23 0.37 0.41 0.69 0.84 0.40 1.00 0.99285 0.20 0.29 0.33 0.62 0.78 1.00 0.40 1.00305 0.18 0.22 0.25 0.55 0.73 0.99 1.00 0.40
De Melo, Packer, Costa and Machado
332
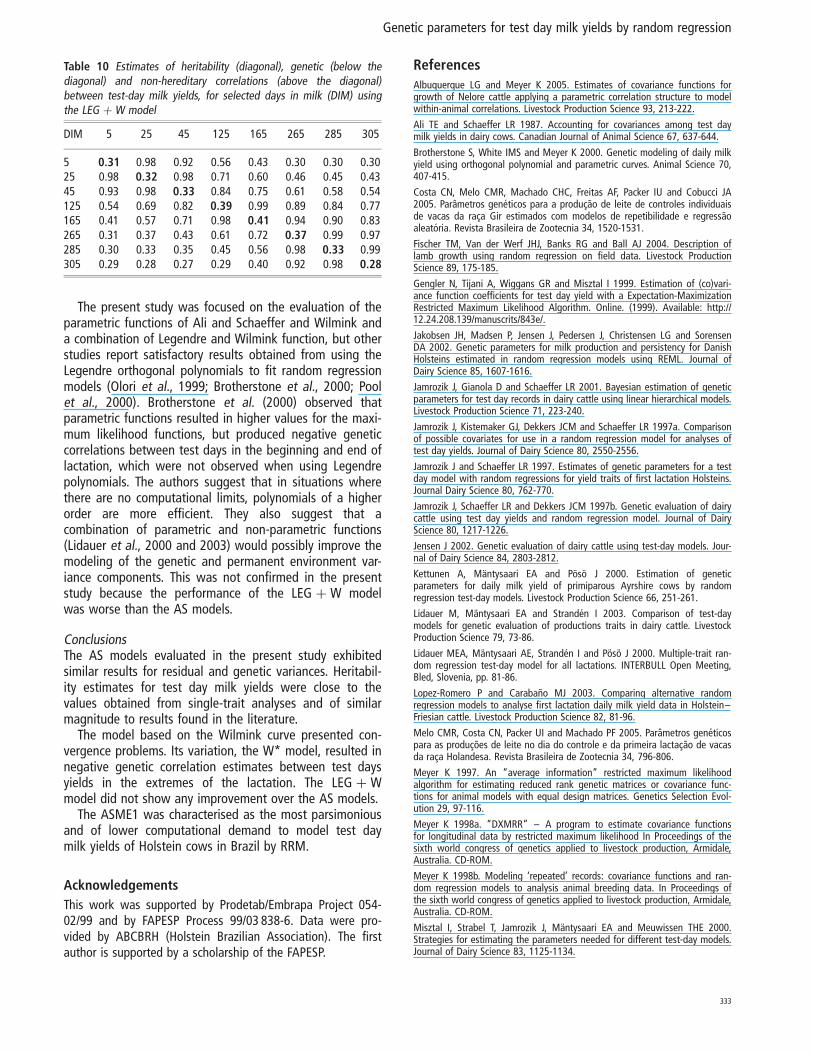
The present study was focused on the evaluation of theparametric functions of Ali and Schaeffer and Wilmink anda combination of Legendre and Wilmink function, but otherstudies report satisfactory results obtained from using theLegendre orthogonal polynomials to fit random regressionmodels (Olori et al., 1999; Brotherstone et al., 2000; Poolet al., 2000). Brotherstone et al. (2000) observed thatparametric functions resulted in higher values for the maxi-mum likelihood functions, but produced negative geneticcorrelations between test days in the beginning and end oflactation, which were not observed when using Legendrepolynomials. The authors suggest that in situations wherethere are no computational limits, polynomials of a higherorder are more efficient. They also suggest that acombination of parametric and non-parametric functions(Lidauer et al., 2000 and 2003) would possibly improve themodeling of the genetic and permanent environment var-iance components. This was not confirmed in the presentstudy because the performance of the LEG þ W modelwas worse than the AS models.
ConclusionsThe AS models evaluated in the present study exhibitedsimilar results for residual and genetic variances. Heritabil-ity estimates for test day milk yields were close to thevalues obtained from single-trait analyses and of similarmagnitude to results found in the literature.
The model based on the Wilmink curve presented con-vergence problems. Its variation, the W* model, resulted innegative genetic correlation estimates between test daysyields in the extremes of the lactation. The LEG þ Wmodel did not show any improvement over the AS models.
The ASME1 was characterised as the most parsimoniousand of lower computational demand to model test daymilk yields of Holstein cows in Brazil by RRM.
Acknowledgements
This work was supported by Prodetab/Embrapa Project 054-02/99 and by FAPESP Process 99/03 838-6. Data were pro-vided by ABCBRH (Holstein Brazilian Association). The firstauthor is supported by a scholarship of the FAPESP.
References
Albuquerque LG and Meyer K 2005. Estimates of covariance functions forgrowth of Nelore cattle applying a parametric correlation structure to modelwithin-animal correlations. Livestock Production Science 93, 213-222.
Ali TE and Schaeffer LR 1987. Accounting for covariances among test daymilk yields in dairy cows. Canadian Journal of Animal Science 67, 637-644.
Brotherstone S, White IMS and Meyer K 2000. Genetic modeling of daily milkyield using orthogonal polynomial and parametric curves. Animal Science 70,407-415.
Costa CN, Melo CMR, Machado CHC, Freitas AF, Packer IU and Cobucci JA2005. Parametros geneticos para a producao de leite de controles individuaisde vacas da raca Gir estimados com modelos de repetibilidade e regressaoaleatoria. Revista Brasileira de Zootecnia 34, 1520-1531.
Fischer TM, Van der Werf JHJ, Banks RG and Ball AJ 2004. Description oflamb growth using random regression on field data. Livestock ProductionScience 89, 175-185.
Gengler N, Tijani A, Wiggans GR and Misztal I 1999. Estimation of (co)vari-ance function coefficients for test day yield with a Expectation-MaximizationRestricted Maximum Likelihood Algorithm. Online. (1999). Available: http://12.24.208.139/manuscrits/843e/.
Jakobsen JH, Madsen P, Jensen J, Pedersen J, Christensen LG and SorensenDA 2002. Genetic parameters for milk production and persistency for DanishHolsteins estimated in random regression models using REML. Journal ofDairy Science 85, 1607-1616.
Jamrozik J, Gianola D and Schaeffer LR 2001. Bayesian estimation of geneticparameters for test day records in dairy cattle using linear hierarchical models.Livestock Production Science 71, 223-240.
Jamrozik J, Kistemaker GJ, Dekkers JCM and Schaeffer LR 1997a. Comparisonof possible covariates for use in a random regression model for analyses oftest day yields. Journal of Dairy Science 80, 2550-2556.
Jamrozik J and Schaeffer LR 1997. Estimates of genetic parameters for a testday model with random regressions for yield traits of first lactation Holsteins.Journal Dairy Science 80, 762-770.
Jamrozik J, Schaeffer LR and Dekkers JCM 1997b. Genetic evaluation of dairycattle using test day yields and random regression model. Journal of DairyScience 80, 1217-1226.
Jensen J 2002. Genetic evaluation of dairy cattle using test-day models. Jour-nal of Dairy Science 84, 2803-2812.
Kettunen A, Mantysaari EA and Poso J 2000. Estimation of geneticparameters for daily milk yield of primiparous Ayrshire cows by randomregression test-day models. Livestock Production Science 66, 251-261.
Lidauer M, Mantysaari EA and Stranden I 2003. Comparison of test-daymodels for genetic evaluation of productions traits in dairy cattle. LivestockProduction Science 79, 73-86.
Lidauer MEA, Mantysaari AE, Stranden I and Poso J 2000. Multiple-trait ran-dom regression test-day model for all lactations. INTERBULL Open Meeting,Bled, Slovenia, pp. 81-86.
Lopez-Romero P and Carabano MJ 2003. Comparing alternative randomregression models to analyse first lactation daily milk yield data in Holstein–Friesian cattle. Livestock Production Science 82, 81-96.
Melo CMR, Costa CN, Packer UI and Machado PF 2005. Parametros geneticospara as producoes de leite no dia do controle e da primeira lactacao de vacasda raca Holandesa. Revista Brasileira de Zootecnia 34, 796-806.
Meyer K 1997. An “average information” restricted maximum likelihoodalgorithm for estimating reduced rank genetic matrices or covariance func-tions for animal models with equal design matrices. Genetics Selection Evol-ution 29, 97-116.
Meyer K 1998a. “DXMRR” – A program to estimate covariance functionsfor longitudinal data by restricted maximum likelihood In Proceedings of thesixth world congress of genetics applied to livestock production, Armidale,Australia. CD-ROM.
Meyer K 1998b. Modeling ‘repeated’ records: covariance functions and ran-dom regression models to analysis animal breeding data. In Proceedings ofthe sixth world congress of genetics applied to livestock production, Armidale,Australia. CD-ROM.
Misztal I, Strabel T, Jamrozik J, Mantysaari EA and Meuwissen THE 2000.Strategies for estimating the parameters needed for different test-day models.Journal of Dairy Science 83, 1125-1134.
Table 10 Estimates of heritability (diagonal), genetic (below thediagonal) and non-hereditary correlations (above the diagonal)between test-day milk yields, for selected days in milk (DIM) usingthe LEG þ W model
DIM 5 25 45 125 165 265 285 305
5 0.31 0.98 0.92 0.56 0.43 0.30 0.30 0.3025 0.98 0.32 0.98 0.71 0.60 0.46 0.45 0.4345 0.93 0.98 0.33 0.84 0.75 0.61 0.58 0.54125 0.54 0.69 0.82 0.39 0.99 0.89 0.84 0.77165 0.41 0.57 0.71 0.98 0.41 0.94 0.90 0.83265 0.31 0.37 0.43 0.61 0.72 0.37 0.99 0.97285 0.30 0.33 0.35 0.45 0.56 0.98 0.33 0.99305 0.29 0.28 0.27 0.29 0.40 0.92 0.98 0.28
Genetic parameters for test day milk yields by random regression
333
Mrode RA and Swanson GJT 2004. Calculating cow and daughter yield devi-ations and partitioning of genetic evaluations under a random regressionmodel. Livestock Production Science 86, 253-260.
Olori VE, Hill WG, McGuirk BJ and Brotherstone S 1999. Estimatingvariance e components for test day milk records by restricted maximum likelihoodwith a random regression animal model. Livestock Production Science 61, 53-63.
Pool MH, Janss LLG and Meuwissen THE 2000. Genetic parameters ofLegendre polynomials for first parity lactation curves. Journal of Dairy Science83, 2640-2649.
Pool MH and Meuwissen THE 1999. Prediction of daily milk yields from a lim-ited number of test days using test day models. Journal of Dairy Science 82,1555-1564.
Rekaya R, Carabano MJ and Toro MA 1999. Use de test day yields for thegenetic evaluation of production traits in Holstein-Friesian cattle. LivestockProduction Science 57, 203-217.
Samore AB, Boettcher P, Jamrozik J, Bagnato A. and Groen AF 2002. Geneticparameters for production traits and somatic cell scores estimated with a mul-tiple trait random regression model in Italian Holsteins. In Proceedings of the
seventh world congress of genetics applied to livestock production, Montpel-lier, France. CD-ROM.
Schaeffer LR 2004. Application of random regression models in animal breed-ing. Livestock Production Science 86, 35-45.
Schaeffer LR and Guo Z 2002. Random regression submodel comparison. InProceedings of the seventh world congress of genetics applied to livestockproduction, Montpellier, France. CD-ROM.
Schaeffer LR, Jamrozik J, Kistemaker GJ and Van Doormaal BJ 2000. Experi-ence with a test-day model. Journal of Dairy Science 83, 1135-1144.
Swalve HH 2000. Theoretical basis and computational for differenttest-day genetic evaluation methods. Journal of Dairy Science 83,1115-1124.
Swalve HH 1998. Use of test day records for genetic evaluation. In Proceed-ings of the sixth world congress of genetics applied to livestock production,Armidale, Australia. CD-ROM.
Wilmink JBM 1987. Efficiency of selection for different cumulative milk,fat, and protein yields in first lactation. Livestock Production Science 17,211-224.
De Melo, Packer, Costa and Machado
334
Related Documents