Genetic isolation within the malaria mosquito Anopheles melas KEVIN C. DEITZ,* GIRI ATHREY,* MICHAEL R. REDDY, † HANS J. OVERGAARD, ‡ ABRAHAN MATIAS, § MUSA JAWARA, ¶ ALESSANDRA DELLA TORRE,** VINCENZO PETRARCA,** JOA ˜ O PINTO, †† ANTHONY E. KISZEWSKI, ‡‡ PIERRE KENGNE, §§¶¶ CARLO COSTANTINI, §§¶¶ ADALGISA CACCONE*** and MICHEL A. SLOTMAN* *Department of Entomology, Texas A&M University, 2475 TAMU, College Station, TX, USA, †Department of Epidemiology and Public Health, Yale University School of Medicine, 60 College Street, New Haven, CT, USA, ‡Department of Mathematical Sciences and Technology, PO Box 5003, Norwegian University of Life Sciences, A ˚ s, Norway, §Medical Care Development International, 8401 Colesville Rd, Silver Spring, MD, USA, ¶Medical Research Council Laboratories, PO Box 273, Fajara, The Gambia, **Istituto Pasteur-Fondazione Cenci-Bolognetti, Dipartimento di Sanita ` Pubblica e Malattie Infettive, Universita ` di Roma ‘‘Sapienza’’, Piazzala Aldo Moro 5, Rome, Italy, ††UEI Parasitologia Me ´dica, Centro de Mala ´ria e outras Doenc ¸as Tropicais, Instituto de Higiene e Medicina, Universidade Nova de Lisboa, Rua da Junqueira 100, Lisbon, Portugal, ‡‡Department of Natural and Applied Sciences, Bentley University, 175 Forest Street, Waltham, MA, USA, §§Institut de Recherche pour le De ´veloppement (IRD), UMR MIVEGEC (UM1, UM2, CNRS 5290, IRD 224), 911 Avenue Agropolis, Montpellier, France, ¶¶Laboratoire de Recherche sur le Paludisme, OCEAC, PO Box 288, Yaounde ´, Cameroon, ***Department of Ecology & Evolutionary Biology, Yale University, 21 Sachem Street, New Haven, CT, USA Abstract Anopheles melas is a brackish water–breeding member of the Anopheles gambiae com- plex that is distributed along the coast of West Africa and is a major malaria vector within its range. Because little is known about the population structure of this species, we analysed 15 microsatellite markers and 1161 bp of mtDNA in 11 A. melas popula- tions collected throughout its range. Compared with its sibling species A. gambiae, A. melas populations have a high level of genetic differentiation between them, repre- senting its patchy distribution due to its fragmented larval habitat that is associated with mangroves and salt marsh grass. Populations clustered into three distinct groups representing Western Africa, Southern Africa and Bioko Island populations that appear to be mostly isolated. Fixed differences in the mtDNA are present between all three clusters, and a Bayesian clustering analysis of the microsatellite data found no evidence for migration from mainland to Bioko Island populations, and little migra- tion was evident between the Southern to the Western cluster. Surprisingly, mtDNA divergence between the three A. melas clusters is on par with levels of divergence between other species of the A. gambiae complex, and no support for monophyly was observed in a maximum-likelihood phylogenetic analysis. Finally, an approximate Bayesian analysis of microsatellite data indicates that Bioko Island A. melas popula- tions were connected to the mainland populations in the past, but became isolated, presumably when sea levels rose after the last glaciation period ( 10 000–11 000 BP). This study has exposed species-level genetic divergence within A. melas and also has implications for control of this malaria vector. Keywords: Anopheles gambiae, Anopheles melas, malaria, microsatellites, migration, population structure Received 22 March 2012; revision received 5 June 2012; accepted 8 June 2012 Correspondence: Michel A. Slotman, Fax: (979) 845 6305; E-mail: [email protected] © 2012 Blackwell Publishing Ltd Molecular Ecology (2012) doi: 10.1111/j.1365-294X.2012.05724.x

Welcome message from author
This document is posted to help you gain knowledge. Please leave a comment to let me know what you think about it! Share it to your friends and learn new things together.
Transcript

Genetic isolation within the malaria mosquito Anophelesmelas
KEVIN C. DEITZ,* GIRI ATHREY,* MICHAEL R. REDDY,† HANS J . OVERGAARD,‡ ABRAHAN
MATIAS,§ MUSA JAWARA,¶ ALESSANDRA DELLA TORRE,** VINCENZO PETRARCA,** JOAO
PINTO,†† ANTHONY E. KISZEWSKI ,‡‡ PIERRE KENGNE,§§¶¶ CARLO COSTANTINI ,§§¶¶ADALGISA CACCONE*** and MICHEL A. SLOTMAN*
*Department of Entomology, Texas A&M University, 2475 TAMU, College Station, TX, USA, †Department of Epidemiology
and Public Health, Yale University School of Medicine, 60 College Street, New Haven, CT, USA, ‡Department of Mathematical
Sciences and Technology, PO Box 5003, Norwegian University of Life Sciences, As, Norway, §Medical Care Development
International, 8401 Colesville Rd, Silver Spring, MD, USA, ¶Medical Research Council Laboratories, PO Box 273, Fajara, The
Gambia, **Istituto Pasteur-Fondazione Cenci-Bolognetti, Dipartimento di Sanita Pubblica e Malattie Infettive, Universita di
Roma ‘‘Sapienza’’, Piazzala Aldo Moro 5, Rome, Italy, ††UEI Parasitologia Medica, Centro de Malaria e outras Doencas
Tropicais, Instituto de Higiene e Medicina, Universidade Nova de Lisboa, Rua da Junqueira 100, Lisbon, Portugal,
‡‡Department of Natural and Applied Sciences, Bentley University, 175 Forest Street, Waltham, MA, USA, §§Institut deRecherche pour le Developpement (IRD), UMR MIVEGEC (UM1, UM2, CNRS 5290, IRD 224), 911 Avenue Agropolis,
Montpellier, France, ¶¶Laboratoire de Recherche sur le Paludisme, OCEAC, PO Box 288, Yaounde, Cameroon, ***Department of
Ecology & Evolutionary Biology, Yale University, 21 Sachem Street, New Haven, CT, USA
Abstract
Anopheles melas is a brackish water–breeding member of the Anopheles gambiae com-
plex that is distributed along the coast of West Africa and is a major malaria vector
within its range. Because little is known about the population structure of this species,
we analysed 15 microsatellite markers and 1161 bp of mtDNA in 11 A. melas popula-
tions collected throughout its range. Compared with its sibling species A. gambiae,A. melas populations have a high level of genetic differentiation between them, repre-
senting its patchy distribution due to its fragmented larval habitat that is associated
with mangroves and salt marsh grass. Populations clustered into three distinct groups
representing Western Africa, Southern Africa and Bioko Island populations that
appear to be mostly isolated. Fixed differences in the mtDNA are present between all
three clusters, and a Bayesian clustering analysis of the microsatellite data found no
evidence for migration from mainland to Bioko Island populations, and little migra-
tion was evident between the Southern to the Western cluster. Surprisingly, mtDNA
divergence between the three A. melas clusters is on par with levels of divergence
between other species of the A. gambiae complex, and no support for monophyly was
observed in a maximum-likelihood phylogenetic analysis. Finally, an approximate
Bayesian analysis of microsatellite data indicates that Bioko Island A. melas popula-
tions were connected to the mainland populations in the past, but became isolated,
presumably when sea levels rose after the last glaciation period (� 10 000–11 000 BP).
This study has exposed species-level genetic divergence within A. melas and also has
implications for control of this malaria vector.
Keywords: Anopheles gambiae, Anopheles melas, malaria, microsatellites, migration, population
structure
Received 22 March 2012; revision received 5 June 2012; accepted 8 June 2012
Correspondence: Michel A. Slotman, Fax: (979) 845 6305;
E-mail: [email protected]
© 2012 Blackwell Publishing Ltd
Molecular Ecology (2012) doi: 10.1111/j.1365-294X.2012.05724.x

Introduction
Anopheles melas is a brackish water–breeding member of
the Anopheles gambiae complex, which is comprised of at
least seven largely morphologically indistinguishable
species. This complex was thought to be a single species
until crossing experiments between various ‘strains’
revealed the presence of male hybrid sterility (Davidson
1962; White 1974; Hunt et al. 1998). All members of this
complex are competent vectors of human malaria para-
sites, although they differ in host specificity ranging
from highly anthropophillic (A. gambiae s.s.) to almost
entirely zoophilic (A. quadriannulatus A), as well as in
the extent of their distribution. For example, the two
brackish water–breeding species, A. melas and A. merus
are confined to the west and east coast of Africa,
respectively. Hence, the species in the complex vary
considerably in their contribution to malaria transmis-
sion (Garrett-Jones et al. 1980; White et al. 1980; Hunt
et al. 1998), with only A. gambiae and A. arabiensis being
considered primary malaria vectors.
Not surprisingly, research efforts have mainly
focused on A. gambiae, Africa’s dominant malaria vec-
tor, which has turned out to have a remarkably com-
plex population structure. Early on, the nonrandom
distribution of polymorphic chromosomal inversions
led to the description of the five so-called chromosomal
forms (Toure et al. 1983; Coluzzi et al. 1985; Petrarca
et al. 1987). These chromosomal forms are now thought
to be local adaptations to various ecological conditions,
but subsequent investigations of genetic differentiation
among them revealed the presence of two molecular
forms that are characterized by fixed differences in the
ribosomal DNA (Favia et al. 1997). These have become
known as the M and S molecular forms and are now
widely considered incipient species (della Torre et al.
2001; Della Torre et al. 2005). Fixed differences between
these sympatric forms are primarily restricted to a few
centromeric regions (Turner et al. 2005; White et al.
2010). The low recombination rate associated with these
regions has been proposed as mechanism for the accu-
mulation of genetic differentiation in the face of gene
flow (Stump et al. 2005; Slotman et al. 2006).
An additional level of genetic complexity was identi-
fied within the M form. The M form in Mali, corre-
sponding to a ‘Mopti’ chromosomal form, shows a
relatively high level of genetic differentiation from the
‘Forest’ M form (Slotman et al. 2007). This suggests that
the ecotypic adaptation associated with inversions has
led to genetic differentiation within the M form, pre-
sumably due to geographic separation. In contrast, the
S molecular form grades from a ‘Savanna’ form in Mali,
into a ‘Forest’ S form in Cameroon, and with the excep-
tion of populations separated by the Rift Valley appears
to have little genetic structure (Lehman et al. 2003).
Such low levels of genetic differentiation across large
distances also seem to be characteristic of the other
major malaria vector in the complex, A. arabiensis
(Besansky et al. 1997; Donnelly & Townson 2000).
This focus on the two primary vectors in the complex
has resulted in a dearth of information about the
genetic diversity and population structure of the other
sibling species. Although generally considered a less
anthropophilic mosquito than A. gambiae, A. melas will
readily enter houses and feed on humans (Reddy et al.
2011). In The Gambia, up to 80.0% of A. melas sampled
along The Gambia river had fed on humans (Caputo
et al. 2008). Although data about malaria transmission
by this species is limited, studies in Ghana (Tuno et al.
2010) and The Gambia (Bryan 1983; Bryan et al. 1987;
Bøgh et al. 2007; Caputo et al. 2008) showed that this
species is a dominant vector in locations close to its
breeding habitat. For example, Bryan et al. (1987) found
that populations of A. melas in The Gambia can com-
prise up to 100% of sampled A. gambiae complex mos-
quitoes, with a mean P. falciparum sporozoite infection
rate of 1.5%. When found in sympatry with A. gambiae,
the latter usually has a higher sporozoite rate (Akogbeto
& Romano 1999), presumably because of a stronger
preference for human hosts.
The small amount of available genetic data for
A. melas comes from studies on paracentric inversion
polymorphisms (Bafort & Petrarca 1983; Petrarca et al.
1983; Bryan et al. 1987; Akogbeto & Di Deco 1995; Calz-
etta et al. 2008) that are mainly aimed at investigating
the distribution and the adaptive role of inversions. The
range of this species is confined to the coast of West
Africa, where it breeds primarily in mangrove swamps
and tidal marshes (Sinka et al. 2010), and its population
sizes fluctuate greatly with seasonal tides and rainfall.
Because A. melas is confined to permanent saline water
bodies (Bryan et al. 1987), it has a patchy distribution
that may be reflected in its population genetic structure.
On Bioko Island, Equatorial Guinea, A. melas is also
an important, and in some locations, dominant malaria
vector (Sharp et al. 2007; Overgaard et al. 2012). Bioko
Island is currently the focus of the Bioko Island Malaria
Project (BIMCP), which implements indoor residual
spraying (IRS) using carbamate insecticide, in
conjunction with malaria screening and treatment.
These interventions reduced mortality in children under
the age of five by 64% in the first 4 years of the
programme (Kleinschmidt et al. 2009). Bioko Island is a
potential candidate for a future malaria elimination
campaign, and understanding the level of migration
between mainland and Bioko Island vector populations
is important for predicting the potential for the reintro-
duction of the malaria parasite and/or vector in the
© 2012 Blackwell Publishing Ltd
2 K. C. DEITZ ET AL.

event of a successful elimination. The population
genetic structure of A. gambiae has been examined in
Equatorial Guinea using microsatellite markers (Moreno
et al. 2007). This study indicated very high levels of
migration of this species between the mainland and the
island, both in the M and S molecular form. However,
no information is available on A. melas, the other main
vector on the island.
Considering the complex evolutionary history of the
species complex, with varying levels of genetic isolation
among and within species and forms, a basic knowl-
edge of the genetic structure of other A. gambiae
complex member species is vital for understanding their
biology and the epidemiology of malaria. Understand-
ing the degree of genetic homogeneity throughout the
range of A. melas would allow us to predict whether
insights into the biology of this species, for example,
indoor vs. outdoor feeding behaviour (Reddy et al.
2011) or larval ecology (Walker & Lynch 2007), in one
population may be applicable to other locations. In
addition, information on the level and directionality of
gene flow across the range of this species is important,
as it can help us to predict the spread of insecticide
resistance and inform better control of this malaria
vector.
Using 15 species-specific microsatellite markers and a
fragment of the mitochondrial genes ND4 and ND5, we
examined the patterns of genetic variation and differen-
tiation between 11 A. melas populations from The Gam-
bia to Angola, including three populations on Bioko
Island, Equatorial Guinea. Our aims were to assess the
patterns of population structure across the range of the
species and to determine the degree of genetic isolation
between the mainland and island populations of Bioko.
Methods
Mosquito collections
Adult female mosquitoes were collected using CDC
light traps, human landing catches or through the aspi-
ration of resting females. Female A. melas from Equato-
rial Guinea were collected in Cacahual (Bioko Island)
and Bome (mainland) in October 2008 and Riaba and
Arena Blanca (Bioko Island) in April 2009. Female mos-
quitoes were collected from Ipono, Cameroon in
December 2005, from Tiko Cameroon in October 2010,
from Ballingho, The Gambia in February 2010, from
Ponta Abanaca, Guinea Bissau in December 2009, from
Mateba, Angola in 2002 (Calzetta et al. 2008) and from
Port Gentil, Gabon in 1999. Larval mosquitoes were col-
lected in July 2010 in Ada Foah, Ghana from a roadside
lagoon. Collections in Ghana and Tiko, Cameroon
resulted in only 6 and 16 A. melas specimens collected,
respectively. Adult female A. gambiae s.s. (M form) mos-
quitoes were collected from Ukomba, a neighbourhood
of the city of Bata, Equatorial Guinea in March 2007
and from Mongola, Bioko Island in 2009.
Molecular methods
Microsatellite DNA. Mosquito DNA was extracted from
mosquito abdomens or whole mosquitoes using a Qia-
gen Biosprint 96 DNA extraction (Qiagen Inc., Valencia,
CA, USA). Species diagnostics were performed follow-
ing Fanello et al. (2002). A polymerase chain reaction
(PCR) was used to amplify 15 Anopheles melas-specific
polymorphic microsatellite loci (Deitz et al. 2012) in
6–96 individuals from each of the 11 A. melas popula-
tions, the average sample size being 56 (Table 1). Each
Table 1 Anopheles melas and Anopheles gambiae population collection location information. Microsatellite N defines the number of
individuals genotyped for each of 15 microsatellite loci from each population. mtDNA N defines the number of individuals that was
sequenced for the ND4-ND5 mtDNA locus
Species Geographical origin Population abbreviation Microsatellite N mtDNA N
Anopheles melas Arena Blanca, Equatorial Guinea (Bioko) ARB 96 61
Anopheles melas Riaba, Equatorial Guinea (Bioko) RIA 94 16
Anopheles melas Cacahual, Equatorial Guinea (Bioko) CAC 35 13
Anopheles melas Tiko, Cameroon TIK 16 13
Anopheles melas Ada Foah, Ghana GHA 6 6
Anopheles melas Ballingho, The Gambia GAM 94 19
Anopheles melas Ponta Anabaca, Guinea Bissau GUI 62 52
Anopheles melas Ipono, Cameroon IPO 69 19
Anopheles melas Bome, Equatorial Guinea BOM 69 11
Anopheles melas Port Gentil, Gabon GAB 46 27
Anopheles melas Mateba, Angola ANG 30 10
Anopheles gambiae (M Form) Mongola, Equatorial Guinea (Bioko) AGMG � 71
Anopheles gambiae (M form) Ukomba, Equatorial Guinea AGUK � 83
© 2012 Blackwell Publishing Ltd
GENETIC ISOLATION WITHIN ANOPHELES MELAS 3

microsatellite locus was amplified using a fluorescently
labelled forward primer. PCRs contained 10-20 ng DNA
template, with 1X PCR buffer (10 mM Tris–HCl pH 8.5,
50 mM KCl), 2.5 mM MgCl2, 200 lM of each dNTP,
2.0 lM of each forward (F) and reverse (R) primer,
0.03 U of Promega GoTaq DNA Polymerase (Promega
Co., Madison, WI, USA) and ddH2O to the final 20 lLreaction volume. PCRs were performed with an initial
denaturing time of 2 min at 94 °C followed by five
cycles of 30 s at 94 °C, 30 s at 50 °C, 35 s at 72 °C, 30cycles of 30 s at 94 °C, 30 s at 52 °C, 35 s at 72 °C, fol-lowed by a 15-min extension step at 72 °C. PCR prod-
ucts were analysed on a 3730xl DNA Genetic Analyzer
(Life Technologies Corporation, Carlsbad, CA, USA).
Fragment lengths were determined using GeneMarker
ver. 1.85 (SoftGenetics LLC., State College, PA, USA).
Mitochondrial DNA. Primers were designed to amplify a
1578-bp region spanning part of the ND4 and ND5
genes of the mitochondrial genome based on the Anoph-
eles gambiae mitochondrial DNA (mtDNA) sequence
(Beard et al. 1993) (FOR GGAGGATACGGTTTATTAC-
GAA; REV CCTAATTGTCTTAAAGTTGATAAAGCA).
PCR amplification was performed at a volume of 20 lLat the following reagent concentrations: 1X PCR buffer
(10 mM Tris–HCl pH 8.5, 50 mM KCl), 2.5 mM MgCl2,
200 lM of each dNTP, 2.0 lM of each primer and 0.03 U
of Promega GoTaq DNA Polymerase (Promega Co.).
PCRs were run with an initial 10-min 94 °C denatur-
ation, followed by 35 cycles of 1 min at 94 °C, 2 min at
53 °C, 3 min at 72 °C and then a 15-min extension at
72 °C and a hold step at 4 °C. PCR products were puri-
fied using the PEG purification method (Lis 1980) and
directly sequenced in both the forward and reverse
directions using BigDye Terminator 3.1 Cycle Sequenc-
ing kit (Life Technologies Corporation).
Analytical methods
Microsatellite DNA diversity and divergence. Micro-
Checker 2.2.3 (Van Oosterhout et al. 2004) was used to
test the microsatellite data set for the presence of null
alleles using 10 000 permutations and a 99% confidence
interval. Observed heterozygosity (HO), expected het-
erozygosity (HE) and other population genetic, and
diversity parameters were calculated in Arlequin ver.
3.5.1.2 (Excoffier & Lischer 2010). Tests for deviation
from Hardy–Weinberg Equilibrium (HWE) were run
using 100 000 steps in the Markov chain, and linkage
disequilibrium (LD) was calculated using 10 000permutations. The program ADZE (Szpiech et al. 2008) wasused to compute allelic richness (AR) using N = 16 as thesample size. Both null allele corrected and uncorrected geno-type frequencies were used to calculate population pairwise
FST and G“ST statistics (Meirmans & Hedrick 2011) in theprogram GenoDive (Meirmans & van Tienderen 2004). Popu-lation pairwise FST values were calculated using 10 000 per-mutations. Pairwise G“ST values were used to calculate anunrooted neighbour-joining tree in the program QuickTree(Howe et al. 2002). The tree was visualized in the programFigTree ver. 1.3.1 (Rambaut 2009).A Bayesian assignment test was implemented in the
program STRUCTURE ver. 2.3.3 (Pritchard et al. 2000)
to determine the most likely number of populations
(K) in our data set and to identify potential hybrids/
migrants between populations. Simulations were repli-
cated 20 times for each K, 1 through 10. Each Monte
Carlo Markov Chain (MCMC, one per simulation) was
run for 500 000 steps after a 10 000 step burn-in,
under a population admixture model assuming inde-
pendent allele frequencies, without using prior popula-
tion information. Structure Harvester ver. 0.6.8 (Earl
2011) was used to examine the most likely number of
populations (K). The individuals of each predicted
cluster (K) were grouped in an analysis of molecular
variance (AMOVA) (Excoffier et al. 1992), which was per-
formed using Arlequin ver. 3.5.1.2 (Excoffier & Lischer
2010;).
Mitochondrial DNA diversity and divergence. ND4-ND5
sequences were aligned manually in Sequencher ver. 4.9
(GeneCodes, Ann Arbor, MI, USA) based on the trans-
lated Anopheles gambiae amino acid sequence (Beard et al.
1993), and consensus sequences were trimmed to
1161 bp. Chromatograms were visually inspected, and
only sequences with unambiguous base calls were
included in the analyses. Additional mtDNA sequences
published by Besansky et al. (1994) (GenBank accession
nos. U10123–U10133) were included for comparative
evolutionary analysis between A. melas and other
members of the A. gambiae complex. These included
sequences spanning a portion of the ND4 and ND5
genes of two A. melas, three A. gambiae, two A. arabiensis
and two A. merus laboratory strains.
Estimates of within group, mean evolutionary dis-
tances were calculated for each sampled A. melas and
A. gambiae population, each A. melas population cluster
and within each species in the program MEGA ver. 5.05
(Tamura et al. 2011) using the method of Nei & Kumar
(2000) under a Kimura 2-parameter substitution model
(Kimura 1980) with a gamma distribution. Fixed nucleo-
tide differences were calculated in the program DnaSP
ver. 5.10.01 (Librado & Rozas 2009). Relationships
between mtDNA haplotypes were visualized by com-
puting minimum spanning trees (Kruskal 1956; Prim
1957) in the program Arlequin ver. 3.5.1.2 (Excoffier &
Lischer 2010), which were visualized and manipulated
in the program HapStar (Teacher & Griffiths 2011). Dxy
© 2012 Blackwell Publishing Ltd
4 K. C. DEITZ ET AL.

values between major clusters, A. gambiae and A. arabi-
ensis, were calculated based on all available mtDNA
sequences using DnaSP Ver. 5.10.01 (Librado & Rozas
2009).
A maximum-likelihood approach was used to investi-
gate evolutionary relationships between the mtDNA of
members of the A. gambiae complex using the program
RAxML ver. 7.0.0 (Stamatakis 2006), implemented in
raxmlGUI (Silvestro & Michalak 2011). The program
ModelTest ver. 0.1.1 (Guindon & Gascuel 2003; Posada
2008) was used to determine the most appropriate
model of nucleotide evolution (GTR + Gamma + Invari-
ant Sites) based on the Akaike Information Criterion
(Posada & Buckley 2004). This mutation model was
implemented in the maximum-likelihood analysis in
RAxML, which utilized the thorough bootstrap
approach with 1000 bootstrap replicates. The resulting
tree with the highest bootstrap support values was
visualized using FigTree ver. 1.3.1 (Rambaut 2009).
Next, we used a Bayesian analysis implemented in
the program BEAST ver. 1.6.1 (Drummond & Rambaut
2007) to estimate divergence times between lineages of
A. melas and between A. melas, A. gambiae and A. arabi-
ensis. An initial starting tree was created in RAxML,
which included the most sampled haplotypes from each
of the A. melas population clusters, the Tiko haplotype
most similar to Bioko Island haplotypes and the most
sampled haplotypes from the two A. gambiae popula-
tions. Additionally, ND4-ND5 sequences from A. gam-
biae, A. arabiensis and A. melas laboratory strains
published in Besansky et al. (1994) were included
(Table S1). We performed a likelihood ratio test in
MEGA 5 to examine whether our nucleotide sequences
evolved in a clock-like fashion based upon the topology
of our starting tree. This hypothesis could not be
rejected based upon a 95% confidence interval, and
therefore we used a strict molecular clock approach
with a 2.3% My�1 insect mtDNA nucleotide substitution
rate (Gaunt & Miles 2002) to estimate divergence dates.
Nodes exceeding 50% bootstrap support in the starting
tree were restricted to monophyly during the run, and
the time to most recent common ancestor (tmrca) was
estimated for each of these nodes. Four independent
runs were performed in BEAST, each with a different
random seed, and 500 million steps in the Monte Carlo
Markov Chain. ND4-ND5 sequences were treated as a
single partition, and a GTR+ Gamma+ Invariant Sites
mutation model was used. Log files of each run were
analysed in Tracer ver. 1.4 (Rambaut & Drummond
2007a) to assess convergence. LogCombiner ver. 1.4
(Rambaut & Drummond 2007b) was used to combine
the log and tree file outputs of each run and to remove
the first 50 million (10%) of each as a burn-in. A maxi-
mum clade credibility tree was created in the program
TreeAnnotator ver. 1.4 (Rambaut & Drummond 2007c)
by excluding trees that did not have a posterior proba-
bility above the mean value. The maximum clade credi-
bility tree was visualized in FigTree ver. 1.3.1 (Rambaut
2009).
Approximate bayesian computation. The microsatellite data
set was used to test hypotheses regarding the origins of
observed population clusters using approximate Bayes-
ian computation (ABC) using 24 demographic scenarios
(Tables S2 and S3) (Beaumont et al. 2002). Our hypothe-
ses regarding the history of Anopheles melas populations
addressed three questions: 1) Did isolation between two
mainland population clusters arise through a vicariance
(scenarios 1, 5–7, 11–13, 17–19, 23, 24) or founder event
(scenarios 2–4, 8–10, 14–16, 20–22) ? 2) Did the Bioko
population originate through vicariance (disappearing
land bridge) (scenarios 1, 2, 7, 8, 13, 14, 19, 20) or a
founder event (scenarios 3–6, 9–12, 15–18, 21–24) ? 3)
Which mainland cluster was the source of the Bioko
island populations (scenarios 1–12 vs. 13–24) ? The data
were analysed as three populations: Bioko Island,
Western and Southern. The 24 scenarios represented
variations and reciprocal scenarios of the main hypothe-
sis in the program DIYABC (Cornuet et al. 2008, 2010).
Data were simulated by drawing values from a uniform
prior distribution defined for each parameter – effective
size (Ne) and time of divergence events (t generations
before present (gbp)). As ABC is a coalescent modelling
approach, simulations are encoded proceeding back-
wards in time from the most recent sample. Parameter
estimates for both past and present effective population
sizes (Ne) for each sampled population were estimated
using a range of predefined priors. The timing of past
events (such as divergence, bottlenecks) is estimated as
having taken place ‘t’ generations before present, also
defined by a prior range of values. In our simulations,
prior distributions are necessarily informed by the exist-
ing estimates, but were also wide enough to encompass
a wide range of potential values. As ABC utilizes sum-
mary statistics from sampled data, it is considered less
vulnerable to assumption violations that are sometimes
problematic in single-statistic estimation approaches.
Initially, 50 000 data sets were simulated for each sce-
nario, and 13 scenarios with posterior probabilities
equal to zero were discarded. The remaining pool of 11
scenarios was rerun for 50 000 simulations each, and
another five scenarios with invariant zero posterior
probabilities were excluded from further consideration.
Subsequently, the remaining six scenarios were run for
100 000 simulations each, resulting in the exclusion of a
further three scenarios with zero posterior probabilities.
For each of the final three scenarios, one million data
sets were simulated. After computing the Euclidean
© 2012 Blackwell Publishing Ltd
GENETIC ISOLATION WITHIN ANOPHELES MELAS 5
distances between observed and simulated data sets,
1% of the closest data sets were retained for calculating
the posterior probabilities. The scenario with the highest
posterior probability was used to estimate population
genetic parameters.
Results
Microsatellite DNA diversity and divergence
A total of 617 Anopheles melas wild-caught specimens
from 11 populations (Table 1, Fig. 1) were genotyped at
15 microsatellite loci. The mean observed heterozygosity
value (HO) ranged from 18 to 72%. HO deviated signifi-
cantly (P < 0.05) from the expected heterozygosity (HE)
in 19 of 165 tests before Bonferroni correction
(Table S4). Homozygote excess was the cause of this
deviation in 18 of 19 instances, five of which occurred
in Bioko Island, E.G. populations. However, HO devi-
ated significantly from HE in only two of 165 tests after
Bonferroni correction (P < 0.0003). Homozygote excess
was the explanation for this deviation in both tests, and
in one of these cases, null alleles were also detected
using Micro-checker (Van Oosterhout et al. 2004).
Micro-checker detected the presence of a small number
of null alleles in four other instances, which were
not associated with significant deviation from HWE
after Bonferroni correction. These results are similar to
other studies in the A. gambiae complex where some
heterozygote deficiencies were observed (e.g. Donnelly
& Townson 2000; Lehman et al. 2003). Perhaps not
unexpectedly, the average HO (across all 15 loci) on Bio-
ko Island is considerably less (38%), compared with
mainland populations (66%). Overall, rarefied allelic
richness for individual loci ranged from 1.0 to 11.2.
Mean rarefied allelic richness (across all 15 loci) was
also much lower in Bioko Island populations than on
the mainland (2.6 vs. 5.3).
Population pairwise FST and G“ST statistics are
reported in Table 2. Significant genetic differentiation
(FST, P < 0.05) was observed in all but one population
pairwise comparison. Given the patchy distribution of
this species this is not surprising. The one comparison
for which no significant differentiation was observed
between two populations only approximately 40 km
apart, Ipono, Cameroon and Bome, Equatorial Guinea
(FST = 0.001). To visualize the pattern of genetic differ-
entiation between A. melas populations, a neighbour-
joining tree was constructed using G“ST values (Fig. 2).
EQUATORIAL GUINEA
CAMEROON BIOKO
ISLAND
CAMEROON
EQUATORIAL GUINEA
ANGOLA
GHANA
GUINEA BISSAU THE GAMBIA
Ballingho
Ponta Anabaca
Ada Foah
Port Gentil
Mateba
Ipono
Tiko
Cacahual Riaba
Arena Blanca
Bome
GABON
Fig. 1 Anopheles melas sample locations throughout West Afri-
ca, including Bioko Island, Equatorial Guinea and neighbour-
ing Cameroon and mainland Equatorial Guinea (inset).
Table 2 Pairwise estimates of genetic divergence (G“ST and FST) values between 11 Anopheles melas populations calculated using data
from 15 microsatellite loci. Top diagonal: pairwise G“ST values. Bottom diagonal: pairwise FST values (significant values
(P-value < 0.05) in bold). FST significance values were computed using 10 000 permutations. Population abbreviations correspond
with those defined in Table 1
ARB RIA CAC TIK GHA GAM GUI IPO BOM GAB ANG
ARB � 0.2620 0.2145 0.5546 0.6335 0.6143 0.6167 0.7513 0.7651 0.7497 0.8495
RIA 0.1548 � 0.1251 0.5097 0.5988 0.5891 0.5742 0.7173 0.7291 0.7125 0.8222
CAC 0.1285 0.0740 � 0.5053 0.5914 0.6014 0.5759 0.7385 0.7502 0.7304 0.8384
TIK 0.2803 0.2548 0.2408 � 0.1295 0.1628 0.1791 0.3859 0.4165 0.4332 0.5782
GHA 0.3468 0.3243 0.3260 0.0318 � 0.1512 0.1455 0.4155 0.4372 0.4227 0.5991
GAM 0.2722 0.2580 0.2475 0.0450 0.0457 � 0.0248 0.4787 0.5142 0.5147 0.6279
GUI 0.2885 0.2654 0.2490 0.0500 0.0449 0.0073 � 0.4883 0.5184 0.5229 0.6424
IPO 0.3476 0.3283 0.3205 0.1081 0.1252 0.1428 0.1480 � 0.0032 0.0713 0.2607
BOM 0.3589 0.3385 0.3309 0.1184 0.1336 0.1552 0.1592 0.0010 � 0.0487 0.2463
GAB 0.3696 0.3476 0.3408 0.1279 0.1361 0.1596 0.1654 0.0227 0.0157 � 0.2342
ANG 0.4635 0.4446 0.4519 0.2055 0.2390 0.2203 0.2325 0.0938 0.0897 0.0899 �
© 2012 Blackwell Publishing Ltd
6 K. C. DEITZ ET AL.

Anopheles melas populations are clearly subdivided
into three major clusters with a very high level of
genetic differentiation between them. Perhaps not sur-
prisingly, the Bioko Island populations constitute a sin-
gle cluster. However, A. melas populations on the
mainland have also diverged into two highly differenti-
ated clusters. These clusters are allopatric and are here-
inafter referred to as the Western and Southern cluster.
The division between these two mainland clusters falls
between two Cameroonian populations, which are only
about 190 km apart along the coastline; Tiko and Ipono.
Nonetheless, these populations are highly differentiated
(FST = 0.108, G“ST = 0.386). This is 3.7 times higher
(G“ST) than that between Tiko and the most distant
population within its cluster, The Gambia. It seems that
the Tiko, Cameroon population lies at the centre of
divergence within A. melas, as it is also the closest
mainland population to Bioko Island, both geographi-
cally and genetically.
The results of a global analysis of molecular variance
(AMOVA), with populations assigned to the Bioko Island,
Western and Southern clusters, also indicate the high
level of divergence within A. melas, because 22.3% of
the genetic variation is explained by differences
between the three clusters (Table 3). Differences
between populations within these three groups account
for only 4.3% of the observed genetic variation, with
differences between individuals within populations
explaining the remaining 73.4%.
The Bayesian assignment test implemented in
STRUCTURE strongly supports the presence of three
populations, corresponding to the Bioko Island, Western
and Southern population clusters (Fig. 3). LnP(K)
clearly flattened out at K = 3 (Fig. S1). This is indicative
of the true K, as LnP(K) typically stops increasing once
the real K is reached and then plateaus at larger values
(Pritchard & Wen 2003). Evanno et al. (2005) devised a
method for detecting the break in this slope. Based on
their simulation results, they reported that their method
often provides a clear mode of their statistic DK at a
single true value of K. This was not the case in our
analyses. DK showed high values at both K = 2 and
K = 3 (Fig. S2). This is due to the larger increase in LnP
(K) between K = 1 and K = 2 vs. between K = 2 and
K = 3.
Individuals with mixed genotypes from different
clusters could possess immigrant ancestry or could be
evidence of remnant genetic similarity between recently
diverged populations. The likelihood bar plot for K = 3
(Fig. 3, see Fig. S3 for K = 2) shows that Bioko Island
represents a highly genetically distinct population, with
no evidence of migrants from the mainland. The
Western cluster has the highest proportion of migrants
(Fig. 3), which are found primarily in the two popula-
tions closest to the Southern cluster, Tiko and Ada
Foah. In Tiko, several individuals show evidence of
recent immigration from Bioko Island. These results
indicate that migration between Bioko Island and the
mainland has been from Bioko Island to the Western
cluster, and migration between mainland populations is
from Southern populations to Tiko and Ada Foah.
Mitochondrial DNA diversity and divergence
We obtained 1161 bp of the ND4 and ND5 genes for a
total of 247 Anopheles melas specimens from all 11 popu-
lations and from 154 A. gambiae specimens from Mon-
gola, Bioko Island and Ukomba, mainland E.G.
(Table 1). Patterns of mtDNA ND4-ND5 genetic diver-
sity within and between A. melas populations show a
Table 3 Results of a global analysis of molecular variance (AM-
OVA), as a weighted average over 15 Anopheles melas microsatel-
lite loci. Groups were defined as Western, Southern and Bioko
Island population clusters
Source of
variation
Degrees
of
freedom
Sum of
squares
Variance
components
Percentage
of
variation
Among
groups
2 1092.189 1.23965 Va 22.29
Among
populations
Within
groups
8 223.697 0.23889 Vb 4.30
Within
populations
1233 4992.281 4.08200 Vc 73.41
Total 1233 6308.167 5.56053
Riaba, E.G.
Bom
e, E
.G.
Mateba, Angola
Ponta Anabaca, Guinea Bissau
Ada Foah, G
hana
0.3096
0.07
Bioko
West
South
Fig. 2 Dendrogram of populations of Anopheles melas based
upon pairwise G“ST values constructed using a neighbour-join-
ing cluster analysis. Branch lengths (average genetic distances)
are indicated between clusters.
© 2012 Blackwell Publishing Ltd
GENETIC ISOLATION WITHIN ANOPHELES MELAS 7
very similar pattern as that based on the microsatellite
DNA. Bioko Island populations have extremely low lev-
els of mtDNA diversity, with only four haplotypes
observed in 90 samples (Table 4). Within-population
genetic divergence on Bioko Island is between 2.5 and
26.8 times lower than genetic divergence in mainland
populations. The three population clusters are evident
in the mtDNA data as well (Fig. 4). Haplotypes from
each of the groups form distinct, highly differentiated
clusters. The exception to this pattern is the Tiko popu-
lation, which is intermediate between the Western and
Bioko Island cluster. Three base-pair substitutions dif-
ferentiate Bioko Island from the most closely related
Tiko haplotype. No mtDNA haplotypes are shared
between any of the three major clusters identified using
microsatellite markers. The Western and Southern clus-
ters have two fixed differences between them, but their
haplotypes differ by a minimum of 10 base-pair substi-
tutions. Interestingly, Tiko does not share any haplo-
types with the Western cluster, and Tiko haplotypes are
divergent from other Western populations by a mini-
mum of 10 base-pair substitutions. There are also two
fixed nucleotide differences between the Western and
Bioko Island groups, and no less than 14 between the
Southern and Bioko Island clusters.
This high level of mtDNA divergence between
A. melas Bioko Island and mainland populations con-
trasts strongly with that between A. gambiae (M form)
populations located on Bioko Island (Mongola) and
mainland Equatorial Guinea (Ukomba). These popula-
tions share the same haplotypes, and unique haplotypes
do not cluster by location (Fig. S4). Although both of
these have levels of within-population genetic diver-
gence on par with those from mainland A. melas popu-
lations (Table 4), no geographic structure was detected
between mainland and Bioko Island A. gambiae popula-
tions. Both populations shared the two most sampled
haplotypes, and haplotypes did not cluster by popula-
tion (Fig. S4).
A minimum spanning tree including mtDNA
haplotypes from A. melas, A. gambiae, as well as A. ara-
biensis demonstrates that the most commonly sampled
haplotypes from the Southern, Western (excluding Tiko)
and Bioko Island population clusters are as divergent
from each other (Dxy = 0.8–1.5%) as any of these
A. melas clusters is from A. gambiae or A. arabiensis
(Dxy = 0.5–1.6%) (Fig. S5). This exemplifies the very
high level of divergence observed within A. melas. The
same patterns are observed in an unrooted maximum-
ARB RIA TIKGHA GAM ANGGUI IPO BOM GABCAC
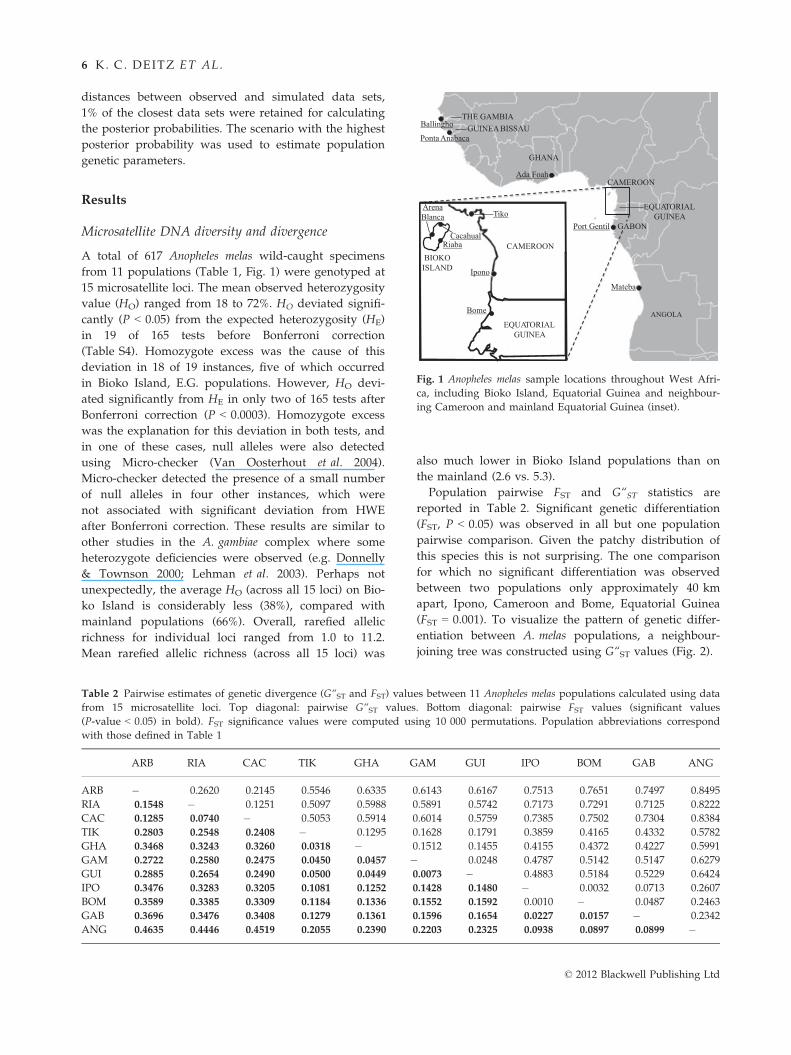
1.000.800.600.400.200.00
Fig. 3 Results of the Bayesian assignment test for three putative populations (K = 3) based upon microsatellite DNA data imple-
mented in the program Structure (Pritchard et al. 2000). Each vertical bar corresponds to a single individual, and colours represent
the proportion of the genome that is assigned to a particular cluster based upon the admixture model. Sample populations are anno-
tated according to population abbreviations defined in Table 1. Bioko Island populations are represented in blue, mainland West
populations are represented in green and mainland South populations are represented in red.
Table 4 Estimates of mean mtDNA sequence divergence
within sampled Anopheles melas populations and clusters, and
Anopheles gambiae populations. The rate variation among sites
was modelled with a gamma distribution (shape parame-
ter = 6). Codon positions included were 1st + 2nd + 3rd + non-
coding. There were a total of 1161 bp positions in the final
data set
Species/population
Distance
estimate
Standard
error
Anopheles melas
Arena Blanca, Equatorial
Guinea (Bioko)
0.00021 0.00014
Riaba, Equatorial
Guinea (Bioko)
0.00031 0.00021
Cacaual, Equatorial
Guinea (Bioko)
0.00027 0.00019
Tiko, Cameroon 0.00706 0.00143
Ada Foah, Ghana 0.00509 0.00122
Ballingho, The Gambia 0.00579 0.00115
Ponta Abanaca, Guinea Bissau 0.00576 0.00101
Ipono, Cameroon 0.00317 0.00073
Bome, Equatorial Guinea 0.00261 0.00085
Port Gentil, Gabon 0.00259 0.00059
Mateba, Angola 0.00065 0.00039
Western Cluster 0.00786 0.00112
Western Cluster (without
Tiko, Cameroon)
0.00588 0.00100
Southern Cluster 0.00255 0.00055
Bioko Island Cluster 0.00024 0.00014
Within all Anopheles melas 0.01045 0.00173
Anopheles gambiae
Mongola, Equatorial
Guinea (Bioko)
0.00312 0.00096
Ukomba, Equatorial Guinea 0.00366 0.00180
Within all Anopheles gambiae 0.00389 0.00108
© 2012 Blackwell Publishing Ltd
8 K. C. DEITZ ET AL.
likelihood tree (Fig. S6) that includes all unique haplo-
types from A. melas and A. gambiae populations, as well
as haplotypes from A. arabiensis, A. quadriannulatus and
A. merus (Besansky et al. 1994) (Table S1). The internal
nodes of this maximum-likelihood tree are not resolved
as they have low bootstrap support. As expected,
A. melas haplotypes once again form the previously
identified monophyletic clusters, with Tiko, Cameroon
haplotypes grouping with the Bioko Island haplotypes.
A single exception was found in a specimen (GUIP905)
from Guinea Bissau (Western cluster) that fell out more
similar to the A. gambiae and A. arabiensis cluster.
Importantly however, we did not find any support for
A. melas being monophyletic within the A. gambiae com-
plex (Fig. S6). This suggests that the A. melas clusters
diverged from each other soon after the ancestral
A. melas split from the other species of the complex. An
alternative scenario of an independent origin of these
clusters is less likely because of the similarity in larval
ecology, shared fixed inversions (Coluzzi et al. 2002)
and a diagnostic substitution in the rDNA.
Using a Bayesian approach implemented in BEAST,
we estimated divergence times between A. melas
population clusters, as well as between A. gambiae,
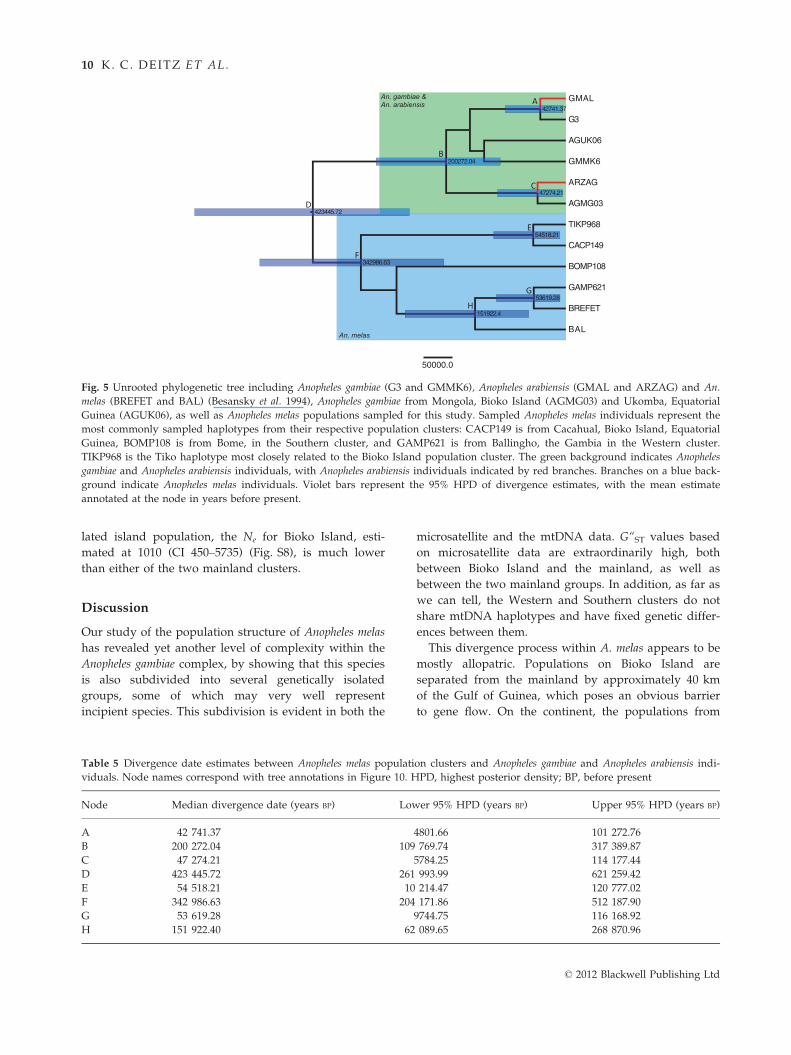
A. arabiensis and A. melas (Fig. 5 and Table 5). Bootstrap
support in the starting tree was not sufficient between
Western and Southern samples to calculate a divergence
date between them. Median divergence estimates and
95% highest posterior density (HPD) statistics are
reported in Table 5. This analysis dates the split of
A. gambiae and A. melas lineages to 423 455 years before
present (ybp) (95% HPD: 261 993–621 259) and the split
between Bioko Island populations and Tiko, Cameroon
to 54 518 ybp (95% HPD: 10 214–120 777).
Approximate bayesian computation
Among the 24 competing scenarios (Table S2), scenar-
ios 1, 2 and 7 were retained in the final pool of three
scenarios for which 1 million simulations were con-
ducted. This analysis resulted in scenario 1 having the
highest posterior probability (0.66). This scenario
describes a vicariance event (as opposed to a founder
event) between the Southern and Western cluster.
Additionally, this scenario also described a vicariance
event between the Bioko population and the Western
cluster. This is consistent with the isolation of the Bio-
ko Island population being the result of the disappear-
ance of a land bridge, rather than a founder event
creating a population on an isolated island. Scenario 7
also had a relatively high posterior probability (0.317).
This scenario describes an identical topography as sce-
nario 1, except that in scenario 1 the Southern cluster
is ancestral to the Western cluster, and in scenario 7,
this situation is reversed. This merely indicates that
the ancestry between the Western and Southern is
actually not well resolved. This is to be expected, as
the issue of ancestry is largely irrelevant in a vicari-
ance event.
Parameter estimates from the data sets simulated
under scenario 1, indicate that the divergence of Bioko
from the Western cluster is likely to have occurred
around 1 798 484 gbp (credibility interval (CI) 507 478–
6 387 175) (Fig. S7). Assuming 20 generations per year,
this equates to approximately 90 000 years before pres-
ent (ybp). The estimate of the divergence between the
Western and Southern populations is less precise, as a
wide range of values is almost equally likely (Fig. S7),
but the mode of the posterior density plot indicates that
the most likely divergence time between the two clus-
ters was approximately 7 215 619 gbp (CI, 1 723 555–
7 221 969). Again assuming 20 generation per year, this
would equate to approximately 360 000 ybp. The Wes-
tern and Southern populations have a very similar con-
temporary effective population size (Ne). The Ne of the
Western cluster is estimated at 20 229 (CI, 8891–30 908),
and that of the Southern cluster is estimated at 19 473
(CI, 9011–30 782) (Fig. S8). Not surprisingly for an iso-
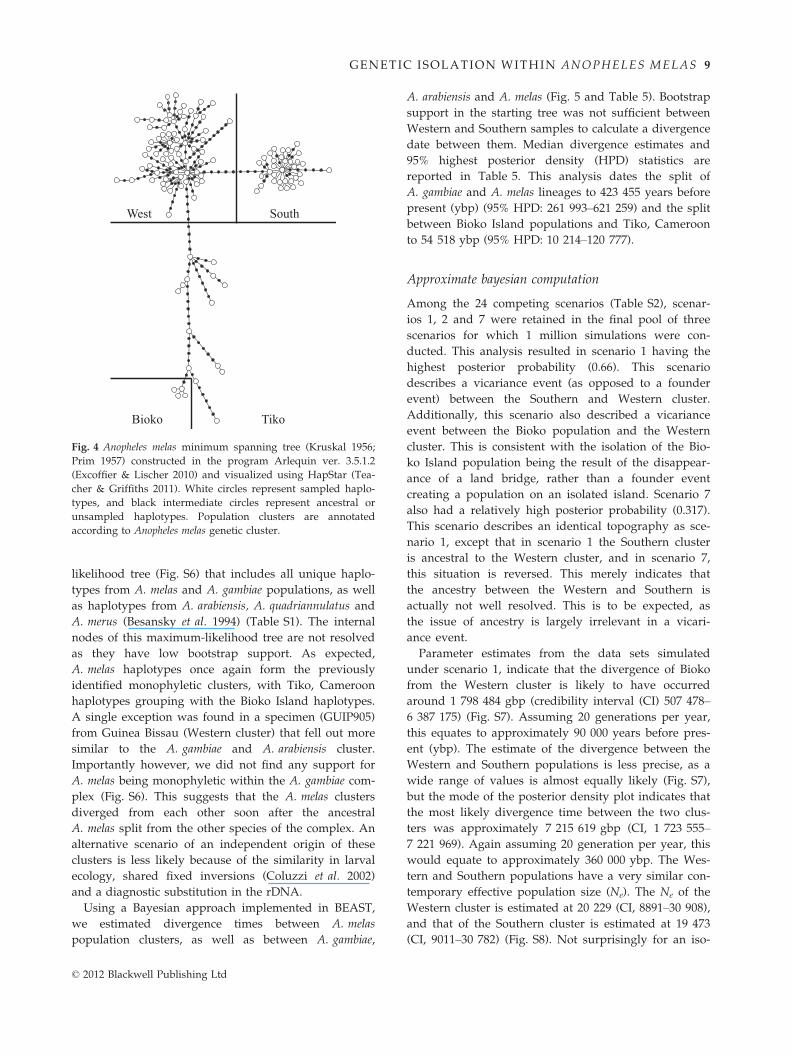
South West
Bioko Tiko
Fig. 4 Anopheles melas minimum spanning tree (Kruskal 1956;
Prim 1957) constructed in the program Arlequin ver. 3.5.1.2
(Excoffier & Lischer 2010) and visualized using HapStar (Tea-
cher & Griffiths 2011). White circles represent sampled haplo-
types, and black intermediate circles represent ancestral or
unsampled haplotypes. Population clusters are annotated
according to Anopheles melas genetic cluster.
© 2012 Blackwell Publishing Ltd
GENETIC ISOLATION WITHIN ANOPHELES MELAS 9
lated island population, the Ne for Bioko Island, esti-
mated at 1010 (CI 450–5735) (Fig. S8), is much lower
than either of the two mainland clusters.
Discussion
Our study of the population structure of Anopheles melas
has revealed yet another level of complexity within the
Anopheles gambiae complex, by showing that this species
is also subdivided into several genetically isolated
groups, some of which may very well represent
incipient species. This subdivision is evident in both the
microsatellite and the mtDNA data. G“ST values based
on microsatellite data are extraordinarily high, both
between Bioko Island and the mainland, as well as
between the two mainland groups. In addition, as far as
we can tell, the Western and Southern clusters do not
share mtDNA haplotypes and have fixed genetic differ-
ences between them.
This divergence process within A. melas appears to be
mostly allopatric. Populations on Bioko Island are
separated from the mainland by approximately 40 km
of the Gulf of Guinea, which poses an obvious barrier
to gene flow. On the continent, the populations from
Table 5 Divergence date estimates between Anopheles melas population clusters and Anopheles gambiae and Anopheles arabiensis indi-
viduals. Node names correspond with tree annotations in Figure 10. HPD, highest posterior density; BP, before present
Node Median divergence date (years BP) Lower 95% HPD (years BP) Upper 95% HPD (years BP)
A 42 741.37 4801.66 101 272.76
B 200 272.04 109 769.74 317 389.87
C 47 274.21 5784.25 114 177.44
D 423 445.72 261 993.99 621 259.42
E 54 518.21 10 214.47 120 777.02
F 342 986.63 204 171.86 512 187.90
G 53 619.28 9744.75 116 168.92
H 151 922.40 62 089.65 268 870.96
50000.0
CACP149
BOMP108
AGUK06
GMAL
BREFET
ARZAG
AGMG03
GMMK6
BAL
GAMP621
G3
TIKP968
342986.63
151922.4
53619.28
423445.72
200272.04
47274.21
54518.21
42741.37
An. gambiae & An. arabiensis
An. melas
A
B
C
D
E
F
G
H
Fig. 5 Unrooted phylogenetic tree including Anopheles gambiae (G3 and GMMK6), Anopheles arabiensis (GMAL and ARZAG) and An.
melas (BREFET and BAL) (Besansky et al. 1994), Anopheles gambiae from Mongola, Bioko Island (AGMG03) and Ukomba, Equatorial
Guinea (AGUK06), as well as Anopheles melas populations sampled for this study. Sampled Anopheles melas individuals represent the
most commonly sampled haplotypes from their respective population clusters: CACP149 is from Cacahual, Bioko Island, Equatorial
Guinea, BOMP108 is from Bome, in the Southern cluster, and GAMP621 is from Ballingho, the Gambia in the Western cluster.
TIKP968 is the Tiko haplotype most closely related to the Bioko Island population cluster. The green background indicates Anopheles
gambiae and Anopheles arabiensis individuals, with Anopheles arabiensis individuals indicated by red branches. Branches on a blue back-
ground indicate Anopheles melas individuals. Violet bars represent the 95% HPD of divergence estimates, with the mean estimate
annotated at the node in years before present.
© 2012 Blackwell Publishing Ltd
10 K. C. DEITZ ET AL.
the Western and Southern group that are closest (Tiko
and Ipono, respectively) are approximately 190 km
apart along the coastline. Although the Structure analy-
ses indicated a small amount of introgression from the
Southern into the Western group (primarily to Tiko),
the high level of genetic isolation between the two clus-
ters suggests that either little direct contact exists or
pre- and/or postmating isolation mechanisms are in
place that largely prevent the exchange of genes.
The results from our ABC analyses indicate that the
two mainland clusters arose through a vicariance event,
rather than a founder event. This indicates that a single
ancestral A. melas population was divided into two by
a geographic barrier. This barrier to gene flow arose
approximately 360 000 ybp, separating this widespread
species into the two current mainland clusters. Interest-
ingly, the break between the Western and Southern
clusters corresponds closely to the location of the Cam-
eroon line, a chain of volcanoes that gave rise to Mount
Cameroon and several islands in the Gulf of Guinea,
including Bioko Island. Even though the Cameroon line
is much older (>30 million years (Burke 2001)) than the
vicariance event between the two mainland clusters, it
is tempting to speculate that it played a role in separat-
ing the two clusters. Mount Cameroon is located on
the coast, and in concert with a more recent rise in sea
level could potentially have resulted in a geographic
barrier, splitting the distribution of the ancestral
A. melas into two and preventing/limiting migration.
Such a scenario should include the more recent separa-
tion of the Tiko population, which is located to the east
of Mount Cameroon, from the Western cluster through
a similar process. That Mount Cameroon may pose a
barrier to gene flow between Tiko and the other Wes-
tern populations, is supported by the mtDNA diver-
gence between them.
Compared to a microsatellite study of A. gambiae pop-
ulations across 1700 km (Slotman et al. 2007), genetic
differentiation (FST) between Western and Southern An.
melas populations is remarkably high. It is between 1.5
and 10-fold the level of differentiation found between
sympatric M and S forms of A. gambiae, which are
widely considered incipient species (della Torre et al.
2001; Turner et al. 2005). It is also on par with levels of
microsatellite differentiation found between A. gambiae
and A. arabiensis. FST values between Bioko Island and
Southern A. melas populations are actually about 1.5-
fold higher than those observed between sympatric
A. gambiae and A. arabiensis populations (Slotman et al.
2007).
The high level of divergence within A. melas is also
evident from the fact that the mtDNA haplotypes did
not form a monophyletic group in relation to the other
species in the A. gambiae complex. This suggests that
the A. melas clusters diverged soon after A. melas split
from the other species in the complex, and our results
raise the question whether these clusters represent
incipient species within A. melas or perhaps even previ-
ously unrecognized species. Although fixed genetic dif-
ferences are a good indicator that these clusters may be
independently evolving lineages (de Queiroz 2007), the
presence of hybrid sterility would put the issue beyond
discussion (Davidson 1962; Hunt et al. 1998).
The patchy distribution of A. melas throughout its
range is clearly represented in its population structure.
Even within the three major clusters, A. melas popula-
tions are far from panmictic. With a single exception,
every population was highly significantly differentiated
from all other populations in its cluster. In addition,
pairwise FST values within clusters are high compared
with its sister species A. gambiae, with microsatellite-
based FST values being as much as 8.6-fold higher than
found between S form populations of A. gambiae more
than 1700 miles apart (Slotman et al. 2007). Further-
more, FST values similar to those observed within the
Western cluster were the basis for concluding that M
forms in Mali vs Cameroon are highly differentiated,
indicating geographic isolation (Slotman et al. 2007).
These comparisons indicate that the patchy distribution
of A. melas due to its association with brackish-water
mangrove coastal areas has resulted in a deep popula-
tion structure even on a smaller geographic scale, with
limited current gene flow.
Coluzzi et al. (2002 and supporting online material)
showed that allopatric populations of A. melas from The
Gambia/Guinea Bissau, Benin/Togo and Congo/
Angola were characterized by different inversion poly-
morphisms, leading authors to state ‘the nonrandom
distribution of inversions … supports additional taxo-
nomic splitting within … A. melas …’. The differences
between the A. melas populations of Angola and the
other populations have been recently confirmed (Calzet-
ta et al. 2008 and Petrarca, personal communication).
However, when inversions are used as genetic markers,
they can suggest population isolation where none exists,
because the frequency of some chromosomal inversions
in the gambiae complex is correlated with ecological con-
ditions such as aridity (Coluzzi et al. 1979), indicating
they are subject to selection. Whatever the case may be,
the A. melas inversion distribution described by Coluzzi
et al. (2002) appears to parallel the Western and South-
ern cluster.
Regardless of whether the two mainland clusters are
in fact different species, the genetic distinctness of the
three A. melas clusters has major implications for our
understanding of the biology of this malaria vector.
Very few studies of the biology of this species are avail-
able, but they do provide important information for
© 2012 Blackwell Publishing Ltd
GENETIC ISOLATION WITHIN ANOPHELES MELAS 11
malaria control. For example, Reddy et al. (2011)
recently examined the host-feeding behaviour of
A. melas on Bioko Island and found that it readily feeds
both indoors and outdoors. Such information is impor-
tant for designing effective control strategies, as a par-
tially outdoor feeding population would only be
affected to some extent by the widely used indoor
residual spraying (IRS) and insecticide treated nets
(ITN). The high level of genetic differentiation within
A. melas makes clear however that it cannot be assumed
that information on the biology/ecology of the species
gained from one location will be applicable throughout
its range.
During this study, particular attention was paid to
Bioko Island, where A. melas is a main malaria vector.
Bioko Island lies on the continental shelf in the Gulf of
Guinea. It is hypothesized that Bioko was connected to
mainland Cameroon during the last glaciation and
became isolated as sea levels rose. Therefore, the fauna
of Bioko Island is species rich and is closely associated
with that of coastal Cameroon. Furthermore, endemism
is low due to the island’s recent isolation (Jones 1994),
which occurred approximately 10 000–11 000 BP (Eisen-
traut 1965; Moreau 1966).
On the basis of our estimates of divergence times of
the mtDNA, Bioko A. melas populations have been iso-
lated from the mainland because between 10 214 and
120 777 ybp. This is a rather wide estimate, but it does
indicate that A. melas on Bioko Island has been isolated
from the mainland at least since the last glaciation.
While molecular clock approaches are widely utilized
to estimate the times of divergence, they have also been
criticized. Concerns include the incorrect estimation of
calibration points (fossil dates) upon which mutation
rates are calculated (Warnock et al. 2012), varied rates
of molecular evolution between lineages and variation
in estimates among mutation models (Lanfear et al.
2010). As such, the results of this analysis should be
interpreted with caution. Nonetheless, the approximate
Bayesian computation (ABC) analysis of the microsatel-
lite data is consistent with this result, as it estimated
the divergence time between Bioko and the Western
cluster at approximately 90,000 ybp. The ABC analysis
also showed that the A. melas populations on Bioko
Island separated from the mainland through a vicari-
ance event. Therefore, these populations were once con-
nected, perhaps just prior to the last glaciation, but
possibly earlier than that.
The alternative hypothesis of A. melas populations on
Bioko Island originating from a founder event was not
supported by the ABC analysis. Interestingly, genetic
diversity is much lower on Bioko Island relative to the
mainland, which is usually a typical result of a founder
event. We know that recent malaria control activities
under the BIMCP have drastically reduced the effective
population size of this species on the island (Athrey
et al., in review), which could also have resulted in a
loss of genetic variation. However, this is unlikely to be
the whole explanation as the three populations on the
island are now nearly fixed for the same mtDNA haplo-
type, a situation that is unlikely to have resulted from
recent vector control unless little haplotype diversity
was present before the initiation of the control. There-
fore, a small long-term Ne is likely to be at least par-
tially responsible for the low level of genetic variation
observed in A. melas populations on Bioko Island.
Surprisingly, the migration pattern of A. melas
between Bioko Island and the mainland contrasts
starkly with that of its sister species A. gambiae s.s, the
other malaria vector on the island. MtDNA data of this
latter species show little or no evidence of genetic dif-
ferentiation between the mainland and island popula-
tions, indicating recent/ongoing migration. Haplotypes
are shared between the island and the mainland and do
not cluster by location. Additionally, previous work
using microsatellites by Moreno et al. (2007) also found
no substructure between A. gambiae Bioko Island and
Equatorial Guinea mainland populations. Although we
do not know the reason for the contrast in migration
pattern between the two sibling species, perhaps this
means that mosquito migration to the island is human
mediated. It is conceivable that A. gambiae, which is
more closely associated with humans, would have
greater opportunities for human-mediated migration.
Being an island with highly endemic malaria, Bioko
Island is a potential candidate for a future malaria elim-
ination campaign. Therefore, it is important to under-
stand the probability of the reintroduction of eliminated
vectors or malaria parasites through infected mosquito
migrants. On the basis of the present data, the probabil-
ity of the reintroduction of A. melas is very low. A. gam-
biae s.s on the other hand would have a high
probability of being reintroduced into Bioko Island
based on both this and other work (Moreno et al. 2007).
Any elimination campaign would have to take mea-
sures to reduce this possibility. Malaria endemic islands
are also of interest as potential sites for experimental
releases of transgenic mosquitoes. If a high level of con-
tainment is desired for such an experiment, Bioko
Island may not be an appropriate candidate.
Our study has unveiled an additional layer of
complexity within the A. gambiae complex by identify-
ing three highly isolated clusters within A. melas. On
the basis of the observed level of divergence, these clus-
ters may represent incipient species. Moreover, the pat-
chy distribution of A. melas is reflected in the high
levels of genetic differentiation between populations
within each of the clusters. In addition to enhancing
© 2012 Blackwell Publishing Ltd
12 K. C. DEITZ ET AL.
our understanding of the evolution of the A. gambiae
complex, this work also has implications for malaria
control programmes in particular on Bioko Island, as
well as other locations where this species is a dominant
vector.
Acknowledgements
This work was supported by an operational research grant
to MAS by the Bioko Island Malaria Control Project. The
BIMCP is funded by a consortium led by Marathon Oil Cor-
poration (Houston, TX) and the Government of Equatorial
Guinea. Our thanks go to Dr. Chris Schwabe, Dr. Luis Segu-
ra and Ed Aldrich from Medical Care Development Interna-
tional, Dr. Gloria Nseng and Simon Abaga from the
National Malaria Control Program and Jaime Kuklinski from
One World Development Group for operations support in
Equatorial Guinea. Vamsi Reddy and Vani Kulkarni pro-
vided technical support at Texas A&M University. We are
thankful to Dr. Gregory Lanzaro for providing A. melas sam-
ples from Guinea Bissau and to Mr. Gian Carlo Carrara and
representatives of the Angolan Ministry of Health for help-
ing in the Angolan collections. Finally, we are also thankful
to Dr Spencer Johnston, Dr. Raul Medina, Dr. Kostya V Kru-
tovsky and Dr. Chris Schwabe for providing advise and/or
comments on the manuscript.
References
Akogbeto M, Di Deco MA (1995) Repartition des membres du
complexe Anopheles gambiae et de leurs variants chromosomi-
ques au Benin et au Togo, Afrique occidentale. Journal of
African Zoology, 109, 443–454.Akogbeto M, Romano R (1999) Infectivite d’Anopheles melas vis-
a-vis du Plasmodium falciparum dans le milieu cotier lagu-
naire du Benin. Bulletin de la Societe de Pathologie Exotique, 92,
3–5.Bafort JM, Petrarca V (1983) Contribution to the knowledge of
Anopheles melas and A. gambiae in West Africa. Annales de la
Societe Belge de Medecine Tropicale, 63, 167–170.
Beard CB, Hamm DM, Collins FH (1993) The mitochondrial
genome of the mosquito Anopheles gambiae: DNA sequence,
genome organization, and comparisons with mitochondrial
sequences of other insects. Insect Molecular Biology, 2, 103–
124.
Beaumont MA, Zhang WY, Balding DJ (2002) Approximate
Bayesian computation in population genetics. Genetics, 162,
2025–2035.
Besansky NJ, Powell JR, Caccone A, Hamm DM, Scott JA, Col-
lins FH (1994) Molecular phylogeny of the Anopheles gambiae
complex suggests genetic introgression between principal
malaria vectors. Proceedings of the National Academy of Sciences
USA, 91, 6885–6888.Besansky NJ, Lehman T, Fahey GT et al. (1997) Patterns of
mitochondrial variation within and between African malaria
vectors, Anopheles gambiae and A. arabiensis, suggest extensive
gene flow. Genetics, 147, 1817–1828.Bøgh C, Lindsay SW, Clarke SE et al. (2007) High spatial reso-
lution mapping of malaria transmission risk in The Gambia,
West Africa, using landsat TM satellite imagery. American
Journal of Tropical Medicine and Hygiene, 76, 875–881.Bryan JH (1983) Anopheles gambiae and A. melas at Brefet, The
Gambia, and their role in malaria transmission. Annals of
Tropical Medicine and Parasitology, 77, 1–12.
Bryan JH, Petrarca V, Di Deco MA, Coluzzi M (1987) Adult
behavior of members of the Anopheles gambiae complex in the
Gambia with special reference to A. melas and its chromo-
somal variants. Parassitologia, 29, 221–249.
Burke K (2001) Origin of the Cameroon Line of volcano-capped
swells. The Journal of Geology, 109, 349–362.
Calzetta M, Santolamazza F, Carrara GC et al. (2008) Distribu-
tion and chromosomal characterization of the Anopheles gam-
biae complex in Angola. American Journal of Tropical Medicine
and Hygiene, 78, 169–175.
Caputo B, Nwakanma D, Jawara M et al. (2008) Anopheles gam-
biae complex along The Gambia river, with particular refer-
ence to the molecular forms of A. gambiae s.s. Malaria Journal,
7, 182.
Coluzzi M, Sabatini A, Petrarca V, Di Deco MA (1979)
Chromosomal differentiation and adaptation to human
environments in the Anopheles gambiae complex. Transactions
of the Royal Society of Tropical Medicine and Hygiene, 73, 483–
497.
Coluzzi M, Petrarca V, Di Deco MA (1985) Chromosomal
inversion intergradation and incipient speciation in Anopheles
gambiae. Bollenttino Di Zoologia, 52, 45–63.
Coluzzi M, Sabatini A, della Torre A, Di Deco MA, Petrarca V
(2002) A polytene chromosome analysis of the Anopheles gam-
biae species complex. Science, 298, 1415–1418.
Cornuet JM, Santos F, Beaumont MA et al. (2008) Inferring
population history with DIY ABC: a user-friendly approach
to approximate Bayesian computation. Bioinformatics, 24,
2713–2719.
Cornuet JM, Ravigne V, Estoup A (2010) Inference on popula-
tion history and model checking using DNA sequence and
microsatellite data with the software DIYABC (v1.0). BMC
Bioinformatics, 11, 401.
Davidson G (1962) The Anopheles gambiae complex. Nature, 196,
907.
Deitz KC, Reddy VP, Reddy MR et al. (2012) Limited useful-
ness of microsatellite markers from the malaria vector Anoph-
eles gambiae when applied to the closely related species
A. melas. Journal of Heredity, 103, 585–593.
Della Torre A, Tu Z, Petrarca V (2005) On the distribution
and genetic differentiation of Anopheles gambiae s.s. molecu-
lar forms. Insect Biochemistry and Molecular Biology, 35, 755–769.
Donnelly MJ, Townson H (2000) Evidence for extensive genetic
differentiation among populations of the malaria vector
Anopheles arabiensis in eastern Africa. Insect Molecular Biology,
9, 357–367.
Drummond AJ, Rambaut A (2007) BEAST: Bayesian evolution-
ary analysis by sampling trees. BMC Evolutionary Biology, 7,
214.
Earl DA (2011) Structure Harvester ver 0.6.8. Available
from http://users.soe.ucsc.edu/~dearl/software/structure-
Harvester/
Eisentraut M (1965) Rassenbildung bei Saugetieren und Vogeln
auf der Insel Fernando Poo. Zoologischer Anzeiger, 174, 37–53.
© 2012 Blackwell Publishing Ltd
GENETIC ISOLATION WITHIN ANOPHELES MELAS 13
Evanno G, Regnaut G, Goudet J (2005) Detecting the number
of clusters of individuals using the software STRUCTURE: a
simulation study. Molecular Ecology, 14, 2611–2620.
Excoffier L, Lischer HEL (2010) Arlequin suite ver 3.5: a new
series of programs to perform population genetics analyses
under Linux and Windows. Molecular Ecology Resources, 10,
564–567.
Excoffier L, Smouse PE, Quattro JM (1992) Analysis of molecu-
lar variance inferred from metric distances among DNA
haplotypes: application to human mitochondrial DNA
restriction data. Genetics, 131, 479–491.
Fanello C, Santolamazza F, della Torre A (2002) Simultaneous
identification of species and molecular forms of the Anopheles
gambiae complex by PCR-RFLP. Medical and Veterinary Ento-
mology, 16, 461–464.
Favia G, della Torre A, Bagayoko M et al. (1997) Molecular
identification of sympatric chromosomal forms of Anopheles
gambiae and further evidence of their reproductive isolation.
Insect Molecular Biology, 6, 377–383.
Garrett-Jones C, Borehamn PFL, Plant CP (1980) Feeding habits
of Anophelines (Diptera:Culicidae) in 1971–1978, with refer-
ence to the human blood index: a review. Bulletin of Entomo-
logical Research, 70, 165–185.
Gaunt MW, Miles MA (2002) An insect molecular clock dates
to the origin of the insects and accords with palaeontological
and biogeographic landmarks. Molecular Biology and Evolu-
tion, 19, 748–761.
Guindon S, Gascuel O (2003) A simple, fast and accurate
method to estimate large phylogenies by maximum-likeli-
hood. Systematic Biology, 52, 696–704.
Howe K, Bateman A, Durbin R (2002) QuickTree: building
huge neighbour-joining trees of protein sequences. Bioinfor-
matics, 18, 1546–1547.Hunt RH, Coetzee M, Fettene M (1998) The Anopheles gambiae
complex: a new species from Ethiopia. Transactions of The
Royal Society of Tropical Medicine and Hygiene, 92, 231–235.
Jones PJ (1994) Biodiversity in the Gulf of Guinea: an overview.
Biodiversity and Conservation, 3, 772–784.
Kimura M (1980) A simple method for estimating evolutionary
rates of base substitutions through comparative studies of
nucleotide sequences. Journal of Molecular Evolution, 16, 111–120.
Kleinschmidt I, Schwabe C, Benavente L et al. (2009) Marked
increase in child survival after 4 years of intensive malaria
control. American Journal of Tropical Medicine and Hygiene, 80,
882–888.
Kruskal JB (1956) On the shortest spanning subtree of a graph
and the travelling salesman problem. Proceedings of the Amer-
ican Mathematical Society, 7, 48–50.Lanfear R, Welch JJ, Bromham L (2010) Watching the clock:
Studying variation in rates of molecular evolution between
species. Trends in Ecology and Evolution, 25, 495–503.
Lehman T, Licht M, Elissa N et al. (2003) Population structure of
Anopheles gambiae in Africa. Journal of Heredity, 94, 133–147.
Librado P, Rozas J (2009) DnaSP v5: a software for comprehen-
sive analysis of DNA polymorphism data. Bioinformatics, 25,
1451–1452.Lis JT (1980) Fractionation of DNA fragments by polyethylene
glycol induced precipitation. Methods in Enzymology, 65, 347–353.
Meirmans PG, Hedrick PW (2011) Assessing population struc-
ture: FST and related measures. Molecular Ecology Resources,
11, 5–18.
Meirmans PG, van Tienderen PH (2004) GENOTYPE and
GENODIVE: two programs for the analysis of genetic diver-
sity of asexual organisms. Molecular Ecology Resources, 4, 792–794.
Moreau RE (1966) The Bird Faunas of Africa and its Islands.
Academic Press, London.
Moreno M, Salgueiro P, Vicente JL et al. (2007) Genetic popula-
tion structure of Anopheles gambiae in Equatorial Guinea.
Malaria Journal, 6, 137.
Nei M, Kumar S (2000) Molecular Evolution and Phylogenetics.
Oxford University Press, New York.
Overgaard HJ, Sæbø S, Reddy MR et al. (2012) Light traps fail
to estimate reliable malaria mosquito biting rates on Bioko
Island, Equatorial Guinea. Malaria Journal, 11, 56.
Petrarca V, Carrara GC, Di Deco MA, Petrangeli G (1983) Il
complesso Anopheles gambiae in Guinea Bissau. Parassitologia,
25, 29–39.Petrarca V, Vercruysse J, Coluzzi M (1987) Observations on the
Anopheles gambiae complex in the Senegal River Basin, West
Africa. Medical and Veterinary Entomology, 1, 303–312.
Posada D (2008) jModelTest: phylogenetic model averaging.
Molecular Biology and Evolution, 25, 1253–1256.
Posada D, Buckley TR (2004) Model selection and model aver-
aging in phylogenetics: advantages of Akaike information
criterion and Bayesian approaches over likelihood ratio tests.
Systematic Biology, 53, 793–808.Prim RC (1957) Shortest connection networks and some gener-
alizations. Bell System Technical Journal, 36, 1389–1401.Pritchard JK, Wen W (2003) Documentation for structure soft-
ware: Version 2. Available from http://pritch.bsd.uchicago.
edu.
Pritchard JK, Stephens M, Donnelly P (2000) Inference of popu-
lation structure using multilocus genotype data. Genetics,
155, 945–959.de Queiroz K (2007) Species concepts and species delimitation.
Systematic Biology, 56, 879–886.Rambaut A (2009) FigTree: Tree figure drawing tool, ver
1.3.1. Available from http://tree.bio.ed.ac.uk/software/fig-
tree/. Institute of Evolutionary Biology, University of Edin-
burgh.
Rambaut A, Drummond AJ (2007a) Tracer ver 1.4. Institute of
Evolutionary Biology, University of Edinburgh. Available
from http://beast.bio.ed.ac.uk/Tracer/.
Rambaut A, Drummond AJ (2007b) LogCombiner ver 1.4. Insti-
tute of Evolutionary Biology, University of Edinburgh. Avail-
able from http://beast.bio.ed.ac.uk/LogCombiner/.
Rambaut A, Drummond AJ (2007c) TreeAnnotator ver 1. Insti-
tute of Evolutionary Biology, University of Edinburgh. Avail-
able from http://beast.bio.ed.ac.uk/TreeAnnotator/.
Reddy MR, Overgaard HJ, Abaga S et al. (2011) Outdoor host-
seeking behavior of Anopheles gambiae mosquitoes following
initiation of malaria vector control on Bioko Island, Equato-
rial Guinea. Malaria Journal, 10, 184.
Sharp BL, Ridl FC, Govender D, Kuklinski J, Kleinschmidt I
(2007) Malaria vector control by indoor residual insecticide
spraying on the tropical island of Bioko, Equatorial Guinea.
Malaria Journal, 6, 52.
© 2012 Blackwell Publishing Ltd
14 K. C. DEITZ ET AL.
Silvestro D, Michalak I (2011) raxmlGUI: a graphical front-end
for RAxML. Organisms Diversity and Evolution, DOI: 10.1007/
s13127-011-0056-0.
Sinka ME, Bangs MJ, Manguin S et al. (2010) The dominant
Anopheles vectors of human malaria in Africa, Europe, and
the Middle East: occurrence data, distribution maps, and bio-
nomic precis. Parasites and Vectors, 3, 117.
Slotman MA, Reimer L, Thiemann T, Dolo G, Fondjo E, Lanz-
aro GC (2006) Reduced recombination rate and genetic dif-
ferentiation between the M and S forms of Anopheles gambiae.
Genetics, 174, 2081–2093.
Slotman MA, Tripet F, Cornel AJ et al. (2007) Evidence for sub-
division within the M molecular form of Anopheles gambiae.
Molecular Ecology, 16, 639–649.Stamatakis A (2006) RAxML-VI-HPC: maximum likelihood-
based phylogenetic analyses with thousands of taxa and
mixed models. Bioinformatics, 22, 2688–2690.
Stump AD, Fitzpatrick MC, Lobo NF et al. (2005) Centromere-
proximal differentiation and speciation in Anopheles gambiae.
Proceedings of the National Academy of Sciences of the United
States of America, 102, 15930–15935.
Szpiech ZA, Jakobsson M, Rosenberg NA (2008) ADZE: a rare-
faction approach for counting alleles private to combinations
of populations. Bioinformatics, 24, 2498–2504.Tamura K, Peterson D, Peterson N, Stecher G, Nei M, Kumar S
(2011) MEGA5: molecular evolutionary genetics analysis
using maximum likelihood, evolutionary distance, and maxi-
mum parsimony methods. Molecular Biology and Evolution,
28, 2731–2739.Teacher AGF, Griffiths DJ (2011) HapStar: automated haplo-
type network layout and visualization. Molecular Ecology
Notes, 11, 151–153.
della Torre A, Fanello C, Akogbeto M et al. (2001) Molecular
evidence of incipient speciation within Anopheles gambiae s.s.
in West Africa. Insect Molecular Biology, 20, 9–18.Toure YT, Petrarca V, Coluzzi M (1983) Nuove entita del
complesso Anopheles gambiae in Mali. Parassitologia, 25, 367–370.
Tuno N, Kjaerandsen J, Badu K, Kruppa T (2010) Blood-feed-
ing behavior of Anopheles gambiae and Anopheles melas in
Ghana, western Africa. Journal of Medical Entomology, 47, 28
–31.
Turner TL, Hahn MW, Nuzhdin SV (2005) Genomic islands of
speciation in Anopheles gambiae. PLoS Biology, 3, e285.
Van Oosterhout C, Hutchinson WF, Wills DPM, Shipley P
(2004) Micro-Checker: software for identifying and correcting
genotyping error is microsatellite data. Molecular Ecology
Notes, 4, 535–538.
Walker K, Lynch M (2007) Contributions of Anopheles larval
control to malaria suppression in tropical Africa: review of
achievements and potentials. Medical and Veterinary Entomol-
ogy, 21, 2–21.
Warnock RCM, Yang Z, Donoghue PCJ (2012) Exploring uncer-
tainty in the calibration of the molecular clock. Biology letters,
8, 156–159.White GB (1974) The Anopheles gambiae complex and disease
transmission in Africa. Transactions of the Royal Society of
Tropical Medicine and Hygiene, 68, 278–298.
White GB, Tessafaye F, Boreham PFL, Lemma G (1980) Malaria
vector capacity of Anopheles arabiensis and A. quadriannulatus
in Ethiopia: chromosomal interpretation after 6 years storage
of field preparations. Transactions of the Royal Society of Tropi-
cal Medicine and Hygiene, 74, 683–684.White BJ, Cheng C, Simard F, Costantini C, Besansky NJ (2010)
Genetic association of physically unlinked islands of geno-
mic divergence in incipient species of Anopheles gambiae.
Molecular Ecology, 19, 925–939.
K.C.D., G.A., A.d.T., V.P., J.P., P.K., C.C., A.C. and M.A.S. have
a shared interest in population genetics and speciation in
malaria vectors. M.R.R. is interested in malaria disease ecology
and mosquito vector population dynamics. H.J.O. and A.M.
have an interest in medical entomology and vector control.
M.J. investigates malaria mosquito ecology and trapping
methods. A.E.K. is a public health entomologist specializing in
sustainable interventions against malaria and other vector-
borne diseases in the developing world.
Data accessibility
Sequence data have been deposited in Genbank under
accession nos. JX117425-JX117825. The microsatellite data
have been deposited in Dryad doi:10.5061/dryad.d15d4.
Supporting information
Additional Supporting Information may be found in the online ver-
sion of this article.
Fig. S1 Results of structure harvester (Earl 2011), indicating
likelihood [LnP(K)] scores of K populations (1–10).
Fig. S2 Results of structure harvester (Earl 2011), indicating
DeltaK values for K populations (1–9).
Fig. S3 Results of the Bayesian assignment test for two puta-
tive populations (K = 2) based upon microsatellite DNA data
implemented in the program structure (Pritchard et al. 2000).
Fig. S4 Anopheles gambiae minimum spanning tree (Kruskal
1956; Prim 1957) constructed in the program Arlequin ver.
3.5.1.2 (Excoffier & Lischer 2010), and visualized using HapStar
(Teacher & Griffiths 2011).
Fig. S5 Anopheles gambiae complex minimum spanning tree
(Kruskal 1956; Prim 1957) constructed in the program Arlequin
ver. 3.5.1.2 (Excoffier & Lischer 2010), and visualized using
HapStar (Teacher & Griffiths 2011).
Fig. S6 Unrooted maximum likelihood tree of Anopheles gam-
biae complex member species including Central, West, and
Bioko Island A. melas populations.
Fig. S7 Posterior density plots for the timing of divergence events
(generations before present) of a) Bioko Island from the western
cluster and b) of the split between the western and southern clus-
ters, as estimated by approximated Bayesian computation.
Fig. S8 Posterior density plots of effective population size (Ne)
estimates for the three main populations considered in ABC
© 2012 Blackwell Publishing Ltd
GENETIC ISOLATION WITHIN ANOPHELES MELAS 15
analysis – the Western and Southern population clusters and
Bioko Island.
Table S1 Anopheles gambiae Complex ND4-ND5 mtDNA
sequences that represent five different species from the A. gam-
biae complex and were originally published by Besansky et al.
(1994).
Table S2 Description of individual scenarios: (Note: although
coalescent simulations go backwards 47 in time and were
coded as such, to simplify interpretation, they are described as
if occurring forwards in time, as in reality).
Table S3 Notations of parameters listed in Table S2 and prior
ranges 60 and parameterization conditions used in simulations.
Please note: Wiley-Blackwell are not responsible for the con-
tent or functionality of any supporting materials supplied by
the authors. Any queries (other than missing material) should
be directed to the corresponding author for the article.
© 2012 Blackwell Publishing Ltd
16 K. C. DEITZ ET AL.
Related Documents