Genetic improvement of tilapias in China: Genetic parameters and selection responses in growth of Nile tilapia (Oreochromis niloticus) after six generations of multi-trait selection for growth and fillet yield Jørn Thodesen (Da-Yong Ma) a, ⁎, Morten Rye a , Yu-Xiang Wang b , Kong-Song Yang b , Hans B. Bentsen c , Trygve Gjedrem a, c a Akvaforsk Genetics Center (AFGC), N-6600 Sunndalsøra, Norway b Hainan Progift Aqua-Tech Co. Ltd, Dingan, Hainan Province, China c Nofima Marin, P.O. Box 5010, N-1432 Ås, Norway abstract article info Article history: Received 14 August 2011 Received in revised form 6 October 2011 Accepted 9 October 2011 Available online 15 October 2011 Keywords: Nile tilapia Breeding program Growth Genetic parameters Selection responses China Genetic parameters and selection responses were obtained for growth of Progift Nile tilapia (Oreochromis niloticus) in China after six generations of multi-trait selection. About 64,000 tagged fingerlings representing 787 full-sib families in seven generations of Nile tilapia originating from the GIFT breed were tested in freshwater earthen ponds, floating cages in reservoirs and a brackish water earthen pond in Guangdong and Hainan Provinces of China. Individual body weight was recorded on 25,000 of these at the expected time of sexual maturation and 50,000 at harvest to estimate genetic parameters for growth rate. Heritability (h 2 ) estimates for body weight showed large variation in magnitude (0.00–0.52) when analyzing data from each test environment and generation separately. Estimates obtained in floating cages and a brackish water pond was comparable or lower in magnitude than those obtained in freshwater earthen ponds. The h 2 estimates for body weight at harvest became more stable (range 0.13–0.20) when data from previous generations were included in the analysis. Including all data, the effect common to full-sibs (c 2 ) accounted for 10% of the total phenotypic variance for body weight at harvest. Genetic correlation between growth recorded at expected time of sexual maturation and at harvest was 0.8, but seemed to decrease in later generations. The genetic correlations between growth in freshwater earthen ponds and other test environments were of similar magnitude. Breeding candidates in the base population (G 0 ) were ranked according to their individual breeding values for growth (recorded as body weight at harvest), while those in later generations (G 1 –G 5 ) were ranked according to a selection index including individual breeding values for growth and family breeding values for fillet yield. The selection response for growth was, on average, 11.4% per generation of selection (range 7.4–18.7%) when estimated based on control groups representing the parental generations. A genetic trend analysis based on all data (h 2 =0.20, c 2 =0.10) predicted an accumulated selection response of more than 200 g and an average selection response of 8.0% per generation of selection when using the LS mean of the G 0 as a base line for the comparison. The average inbreeding coefficient (F) was estimated to be 5.0% after six generations of selection. The results are discussed in a practical context of developing selective breeding pro- grams for tilapias and it is concluded that the ongoing selective breeding of Nile tilapia in China has resulted in con- siderable genetic improvement of growth (60–90% larger body weight at harvest) after six generations of multi- trait selection. © 2011 Elsevier B.V. All rights reserved. 1. Introduction Tilapias have the potential of becoming the most important aquacul- ture species in the world. In 2010, the world production of farmed tila- pias reached 3.2 million metric tons of which about 35% was produced in China (Fitzsimmons et al., 2011). The Chinese tilapia production in- creased very rapidly during a 20-year period until 2005 when the annual production reached about one million metric tons (Li et al., 2006; Zhao, 2011). In recent years, however, the tilapia production has stagnated in China due to problems related to unstable climatic conditions (i.e. cold winter temperatures, drought etc.) and disease outbreaks. In the past, most of the farmed tilapias in China (60–70%) were hybrids produced by crossing Nile tilapia (Oreochromis niloticus) fe- males and Blue tilapia (O. aureus) males (Li et al., 2006). These hy- brids were preferred due to a high male percentage (Lovshin, 1982) and better survival at low water temperatures (Chervinski, 1982). In recent years, China has received several imports of genetically im- proved Nile tilapia (all originating from the GIFT project in the Aquaculture 322-323 (2011) 51–64 ⁎ Corresponding author. Tel.: + 47 7169 5300; fax: + 47 7169 5301. E-mail address: [email protected] (J. Thodesen (Da-Yong Ma)). 0044-8486/$ – see front matter © 2011 Elsevier B.V. All rights reserved. doi:10.1016/j.aquaculture.2011.10.010 Contents lists available at SciVerse ScienceDirect Aquaculture journal homepage: www.elsevier.com/locate/aqua-online

Welcome message from author
This document is posted to help you gain knowledge. Please leave a comment to let me know what you think about it! Share it to your friends and learn new things together.
Transcript
Aquaculture 322-323 (2011) 51–64
Contents lists available at SciVerse ScienceDirect
Aquaculture
j ourna l homepage: www.e lsev ie r .com/ locate /aqua-on l ine
Genetic improvement of tilapias in China: Genetic parameters and selectionresponses in growth of Nile tilapia (Oreochromis niloticus) after six generations ofmulti-trait selection for growth and fillet yield
Jørn Thodesen (Da-Yong Ma) a,⁎, Morten Rye a, Yu-Xiang Wang b, Kong-Song Yang b,Hans B. Bentsen c, Trygve Gjedrem a,c
a Akvaforsk Genetics Center (AFGC), N-6600 Sunndalsøra, Norwayb Hainan Progift Aqua-Tech Co. Ltd, Dingan, Hainan Province, Chinac Nofima Marin, P.O. Box 5010, N-1432 Ås, Norway
⁎ Corresponding author. Tel.: +47 7169 5300; fax: +E-mail address: [email protected] (J. Thodesen
0044-8486/$ – see front matter © 2011 Elsevier B.V. Alldoi:10.1016/j.aquaculture.2011.10.010
a b s t r a c t
a r t i c l e i n f oArticle history:Received 14 August 2011Received in revised form 6 October 2011Accepted 9 October 2011Available online 15 October 2011
Keywords:Nile tilapiaBreeding programGrowthGenetic parametersSelection responsesChina
Genetic parameters and selection responseswere obtained for growth of Progift Nile tilapia (Oreochromis niloticus)in China after six generations of multi-trait selection. About 64,000 tagged fingerlings representing 787 full-sibfamilies in seven generations of Nile tilapia originating from the GIFT breed were tested in freshwater earthenponds, floating cages in reservoirs and a brackish water earthen pond in Guangdong and Hainan Provinces ofChina. Individual body weight was recorded on 25,000 of these at the expected time of sexual maturation and50,000 at harvest to estimate genetic parameters for growth rate. Heritability (h2) estimates for body weightshowed large variation inmagnitude (0.00–0.52)when analyzing data fromeach test environment and generationseparately. Estimates obtained in floating cages and a brackishwater pondwas comparable or lower inmagnitudethan those obtained in freshwater earthen ponds. The h2 estimates for bodyweight at harvest becamemore stable(range 0.13–0.20)whendata fromprevious generationswere included in the analysis. Including all data, the effectcommon to full-sibs (c2) accounted for 10% of the total phenotypic variance for body weight at harvest. Geneticcorrelation between growth recorded at expected time of sexual maturation and at harvest was 0.8, but seemedto decrease in later generations. The genetic correlations between growth in freshwater earthen ponds andother test environments were of similar magnitude. Breeding candidates in the base population (G0) were rankedaccording to their individual breeding values for growth (recorded as bodyweight at harvest), while those in latergenerations (G1–G5) were ranked according to a selection index including individual breeding values for growthand family breeding values for fillet yield. The selection response for growthwas, on average, 11.4% per generationof selection (range 7.4–18.7%) when estimated based on control groups representing the parental generations. Agenetic trend analysis based on all data (h2=0.20, c2=0.10) predicted an accumulated selection response ofmore than 200 g and an average selection response of 8.0% per generation of selection when using the LS meanof the G0 as a base line for the comparison. The average inbreeding coefficient (F) was estimated to be 5.0% aftersix generations of selection. The results are discussed in a practical context of developing selective breeding pro-grams for tilapias and it is concluded that the ongoing selective breeding of Nile tilapia in China has resulted in con-siderable genetic improvement of growth (60–90% larger body weight at harvest) after six generations of multi-trait selection.
© 2011 Elsevier B.V. All rights reserved.
1. Introduction
Tilapias have the potential of becoming the most important aquacul-ture species in the world. In 2010, the world production of farmed tila-pias reached 3.2 million metric tons of which about 35% was producedin China (Fitzsimmons et al., 2011). The Chinese tilapia production in-creased very rapidly during a 20-year period until 2005when the annual
47 7169 5301.(Da-Yong Ma)).
rights reserved.
production reached about one million metric tons (Li et al., 2006; Zhao,2011). In recent years, however, the tilapia production has stagnated inChina due to problems related to unstable climatic conditions (i.e. coldwinter temperatures, drought etc.) and disease outbreaks.
In the past, most of the farmed tilapias in China (60–70%) werehybrids produced by crossing Nile tilapia (Oreochromis niloticus) fe-males and Blue tilapia (O. aureus) males (Li et al., 2006). These hy-brids were preferred due to a high male percentage (Lovshin, 1982)and better survival at low water temperatures (Chervinski, 1982). Inrecent years, China has received several imports of genetically im-proved Nile tilapia (all originating from the GIFT project in the

52 J. Thodesen (Da-Yong Ma) et al. / Aquaculture 322-323 (2011) 51–64
Philippines, Eknath and Acosta, 1998) of which some materials havebeen further adapted to the Chinese production systems by mass-selection (Li et al., 2006) or combined family and within-family selec-tion (as reported in the present paper). As a result, an increasingnumber of Chinese farmers are currently producing genetically im-proved Nile tilapia due to their faster growth.
Most of the Chinese tilapia production is concentrated in fourprovinces (Guangdong, 47%; Hainan, 20%; Guangxi, 15% and Fujian,8%) in South China (Zhao, 2011), where tilapias are mainly farmedin semi-intensive or intensive all-male, mono-culture systems dueto increasing costs of labor and land (Miao and Yuan, 2007). Althoughfreshwater earthen ponds are the most common production environ-ment, floating cages located in reservoirs and brackish water ponds(former shrimp ponds) are also used to produce tilapia. About 40%of the Chinese tilapia production in 2010 was exported mainly as fro-zen fillets to markets in the USA (Fitzsimmons et al., 2011) while therest was consumed in local markets.
A sustainable development of Chinese tilapia farming will, in addi-tion to improving the production systems, require genetically im-proved breeds that are adapted and perform well under differentproduction conditions in China. Development of new breeds of tila-pias should focus on increasing their growth performances to reduceproduction time, and thus improve feed utilization (Thodesen et al.,1999) and allow more fish to be produced without increasing thestocking density. Furthermore, it is important to improve their coldand salinity tolerances to make more production areas in China suit-able for tilapia farming. The resistance against major disease agents(e.g. Streptococcus agalactiae) should be genetically improved to re-duce the use of pharmaceuticals. Finally, fillet yield and other qualitytraits (i.e. skin color) should be systematically improved to increasethe product value of Chinese tilapia.
Although Nile tilapia show genetic variation for most of the traitsmentioned above (Ponzoni et al., 2003), a better strategy than includ-ing all important traits in the breeding objective of Nile tilapia to meetfuture requirements of tilapia seed would be to initiate selectivebreeding of several tilapia species that already have some desirablecharacteristics. Nile tilapia is the first choice for production in fresh-water in tropical and sub-tropical climates, while Blue tilapia, or thehybrid between Nile tilapia and Blue tilapia, is preferred in temperateclimates where the water temperature periodically is low. Red tilapia(Oreochromis spp.), and especially those with a large proportion ofgenes from Mozambique tilapia (O. mosambicus), is preferred inbrackish water environments both due to their higher salinity toler-ance and their resemblance to popular seawater species (i.e. redsnapper and red sea bream).
Selective breeding programs with several tilapia species – i.e. Niletilapia, Blue tilapia and red tilapia – have been established during therecent years to develop genetically improved seed for different pro-duction systems in China. All species are selected to improve theirgrowth performances in different freshwater environments. Nile tila-pia has also been selected to improve its fillet yield, while Blue tilapiaand red tilapia are being selected to improve their tolerance to coldwater and high salinity water, respectively. Red tilapia is also beingselected to improve several color traits. This paper reports genetic pa-rameters and selection responses in growth of Nile tilapia after sixgenerations of multi-trait selection.
2. Materials and methods
2.1. Location of breeding program
The breeding program, operated by Hainan Progift Aqua-Tech Co.Ltd. and technically designed and supervised by Akvaforsk GeneticsCenter (Norway), was first located at a tilapia hatchery in TaishanCounty, Guangdong Province. The climate in this part of China is sub-tropical. Although the summer season can be sweltering hot, cold
northern winds during the winter season can suddenly reduce thewater temperature below critical levels for feeding and even survivalof tilapia. After two generations of selection, the breeding operationwas therefore moved to Dingan County, Hainan Province. The climatein Hainan is monsoon tropical. The air temperature may drop to 16–21 °C during the coldest months (January and February) and reachabove 35 °C during the hottest months (July and August). Hainanhas also a rainy season (May to October), during which several ty-phoons may cause major flooding on the island. The heavy rain alsocauses daily fluctuations of water temperature.
2.2. Origin of base population
The base population (i.e. 100 full-sib families) was imported fromthe Research Institute of Aquaculture No. 1 (RIA-1), Vietnam, in 2004.These families represented the G5-generation in the National breed-ing program for Nile tilapia in Vietnam and had been selected for fas-ter growth in freshwater earthen ponds in the northern regions of thecountry and better cold-water tolerance (last three generations)based on controlled challenge testing (Luan et al., 2010). RIA-1 hadin 1997 imported more than 100 full-sib families representing theG5-generation of the GIFT (Genetically Improved Farmed Tilapia)breed of Nile tilapia from the GIFT Foundation, Philippines. In 1999,offspring of these GIFT-tilapia families were used together with local-ly available Nile tilapia (i.e. Viet tilapia and a mixed population of ear-lier imported GIFT-tilapia) to establish a selective breeding programfor Nile tilapia in Vietnam (Luan, 2010). The GIFT breed of Nile tilapiawas developed from a broad genetic base of strains collected from dif-ferent countries in Africa and Asia (Bentsen et al., 1998; Eknath et al.,1993, 2007). In the GIFT program, selection for faster growthwas basedon performances in a variety of common freshwater grow-out environ-ments in the Philippines (Bentsen et al., submitted for publication;Eknath and Acosta, 1998; Eknath et al., 2007). Therefore, the full-sibfamilies in the imported base population to China represented alreadyten generations of selection for improved growth (i.e. five generationsin the Philippines and another five generations in Vietnam) before ini-tiating the reported selective breeding at Hainan Progift Aqua-TechCo. Ltd.
2.3. Transportation and quarantine
In September 2004, about 5000 Nile tilapia (representing 100 full-sib families to be used as base population) were transported fromVietnam to China by air. All fish had been tagged using uniquelycoded Passive Integrated Transponder (PIT) tags at RIA-1. Therefore,fish from different full-sib families could be mixed and kept in 25plastic bags during the transportation. After arrival in GuangzhouCity, the plastic bags containing the imported fish were transportedby truck to the tilapia hatchery in Taishan County where they werestocked into five hapa cages (3.0 m×5.0 m×1.0 m) in a commonfreshwater earthen pond for quarantine and observation. Theimported fish were inspected by the Chinese authorities (i.e. theAgency of Custom, Immigration and Quarantine) and it was conclud-ed that their health condition was very good and that few fish haddied during the transportation.
2.4. Production of families
The methodology used to produce full-sib families of Nile tilapia inthe present breeding program is generally described in the ‘GIFTTechnology Manual’ by WorldFish Center (2004) and Eknath et al.(2007). Since family production is a highly critical operation for suc-cessful selective breeding of tilapia, much effort has been made to im-prove the family production. Special focus has been to adjust themethodology to much larger breeders (Table 1), synchronize thebreeding, produce full-sib families under standardized conditions
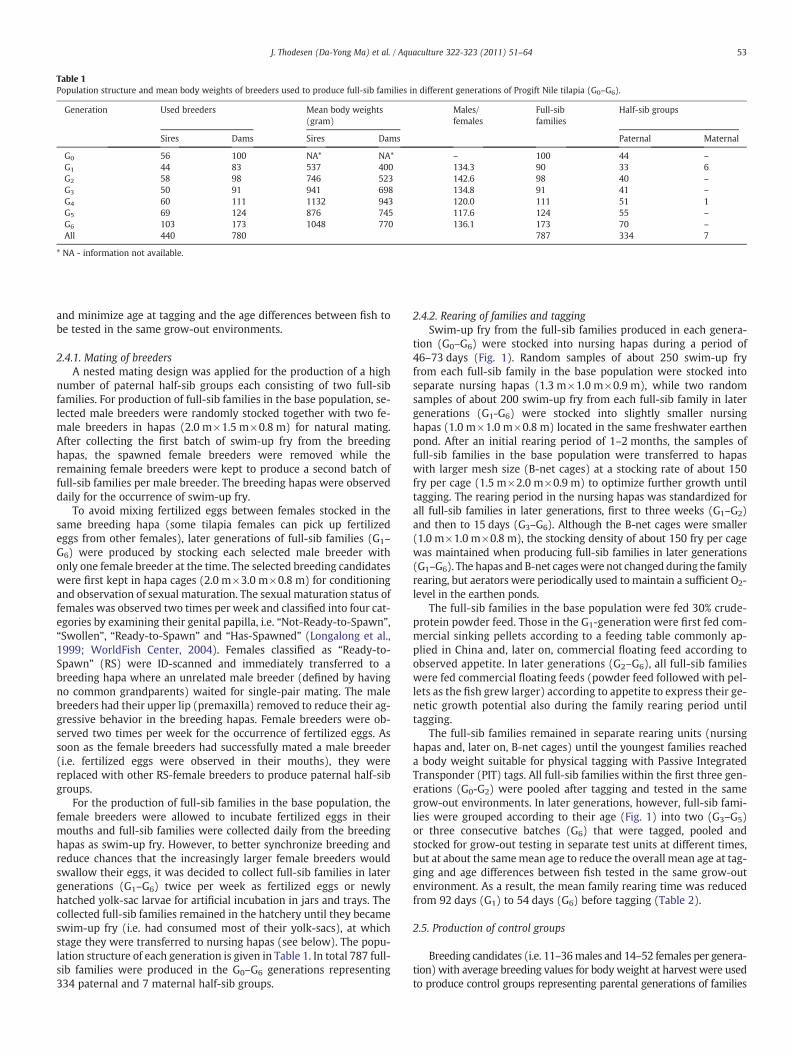
Table 1Population structure and mean body weights of breeders used to produce full-sib families in different generations of Progift Nile tilapia (G0–G6).
Generation Used breeders Mean body weights(gram)
Males/females
Full-sibfamilies
Half-sib groups
Sires Dams Sires Dams Paternal Maternal
G0 56 100 NA* NA* – 100 44 –
G1 44 83 537 400 134.3 90 33 6G2 58 98 746 523 142.6 98 40 –
G3 50 91 941 698 134.8 91 41 –
G4 60 111 1132 943 120.0 111 51 1G5 69 124 876 745 117.6 124 55 –
G6 103 173 1048 770 136.1 173 70 –
All 440 780 787 334 7
* NA - information not available.
53J. Thodesen (Da-Yong Ma) et al. / Aquaculture 322-323 (2011) 51–64
and minimize age at tagging and the age differences between fish tobe tested in the same grow-out environments.
2.4.1. Mating of breedersA nested mating design was applied for the production of a high
number of paternal half-sib groups each consisting of two full-sibfamilies. For production of full-sib families in the base population, se-lected male breeders were randomly stocked together with two fe-male breeders in hapas (2.0 m×1.5 m×0.8 m) for natural mating.After collecting the first batch of swim-up fry from the breedinghapas, the spawned female breeders were removed while theremaining female breeders were kept to produce a second batch offull-sib families per male breeder. The breeding hapas were observeddaily for the occurrence of swim-up fry.
To avoid mixing fertilized eggs between females stocked in thesame breeding hapa (some tilapia females can pick up fertilizedeggs from other females), later generations of full-sib families (G1–
G6) were produced by stocking each selected male breeder withonly one female breeder at the time. The selected breeding candidateswere first kept in hapa cages (2.0 m×3.0 m×0.8 m) for conditioningand observation of sexual maturation. The sexual maturation status offemales was observed two times per week and classified into four cat-egories by examining their genital papilla, i.e. “Not-Ready-to-Spawn”,“Swollen”, “Ready-to-Spawn” and “Has-Spawned” (Longalong et al.,1999; WorldFish Center, 2004). Females classified as “Ready-to-Spawn” (RS) were ID-scanned and immediately transferred to abreeding hapa where an unrelated male breeder (defined by havingno common grandparents) waited for single-pair mating. The malebreeders had their upper lip (premaxilla) removed to reduce their ag-gressive behavior in the breeding hapas. Female breeders were ob-served two times per week for the occurrence of fertilized eggs. Assoon as the female breeders had successfully mated a male breeder(i.e. fertilized eggs were observed in their mouths), they werereplaced with other RS-female breeders to produce paternal half-sibgroups.
For the production of full-sib families in the base population, thefemale breeders were allowed to incubate fertilized eggs in theirmouths and full-sib families were collected daily from the breedinghapas as swim-up fry. However, to better synchronize breeding andreduce chances that the increasingly larger female breeders wouldswallow their eggs, it was decided to collect full-sib families in latergenerations (G1–G6) twice per week as fertilized eggs or newlyhatched yolk-sac larvae for artificial incubation in jars and trays. Thecollected full-sib families remained in the hatchery until they becameswim-up fry (i.e. had consumed most of their yolk-sacs), at whichstage they were transferred to nursing hapas (see below). The popu-lation structure of each generation is given in Table 1. In total 787 full-sib families were produced in the G0–G6 generations representing334 paternal and 7 maternal half-sib groups.
2.4.2. Rearing of families and taggingSwim-up fry from the full-sib families produced in each genera-
tion (G0–G6) were stocked into nursing hapas during a period of46–73 days (Fig. 1). Random samples of about 250 swim-up fryfrom each full-sib family in the base population were stocked intoseparate nursing hapas (1.3 m×1.0 m×0.9 m), while two randomsamples of about 200 swim-up fry from each full-sib family in latergenerations (G1-G6) were stocked into slightly smaller nursinghapas (1.0 m×1.0 m×0.8 m) located in the same freshwater earthenpond. After an initial rearing period of 1–2 months, the samples offull-sib families in the base population were transferred to hapaswith larger mesh size (B-net cages) at a stocking rate of about 150fry per cage (1.5 m×2.0 m×0.9 m) to optimize further growth untiltagging. The rearing period in the nursing hapas was standardized forall full-sib families in later generations, first to three weeks (G1–G2)and then to 15 days (G3–G6). Although the B-net cages were smaller(1.0 m×1.0 m×0.8 m), the stocking density of about 150 fry per cagewas maintained when producing full-sib families in later generations(G1–G6). The hapas and B-net cageswere not changed during the familyrearing, but aerators were periodically used to maintain a sufficient O2-level in the earthen ponds.
The full-sib families in the base population were fed 30% crude-protein powder feed. Those in the G1-generation were first fed com-mercial sinking pellets according to a feeding table commonly ap-plied in China and, later on, commercial floating feed according toobserved appetite. In later generations (G2–G6), all full-sib familieswere fed commercial floating feeds (powder feed followed with pel-lets as the fish grew larger) according to appetite to express their ge-netic growth potential also during the family rearing period untiltagging.
The full-sib families remained in separate rearing units (nursinghapas and, later on, B-net cages) until the youngest families reacheda body weight suitable for physical tagging with Passive IntegratedTransponder (PIT) tags. All full-sib families within the first three gen-erations (G0-G2) were pooled after tagging and tested in the samegrow-out environments. In later generations, however, full-sib fami-lies were grouped according to their age (Fig. 1) into two (G3–G5)or three consecutive batches (G6) that were tagged, pooled andstocked for grow-out testing in separate test units at different times,but at about the samemean age to reduce the overall mean age at tag-ging and age differences between fish tested in the same grow-outenvironment. As a result, the mean family rearing time was reducedfrom 92 days (G1) to 54 days (G6) before tagging (Table 2).
2.5. Production of control groups
Breeding candidates (i.e. 11–36males and 14–52 females per genera-tion) with average breeding values for body weight at harvest were usedto produce control groups representing parental generations of families
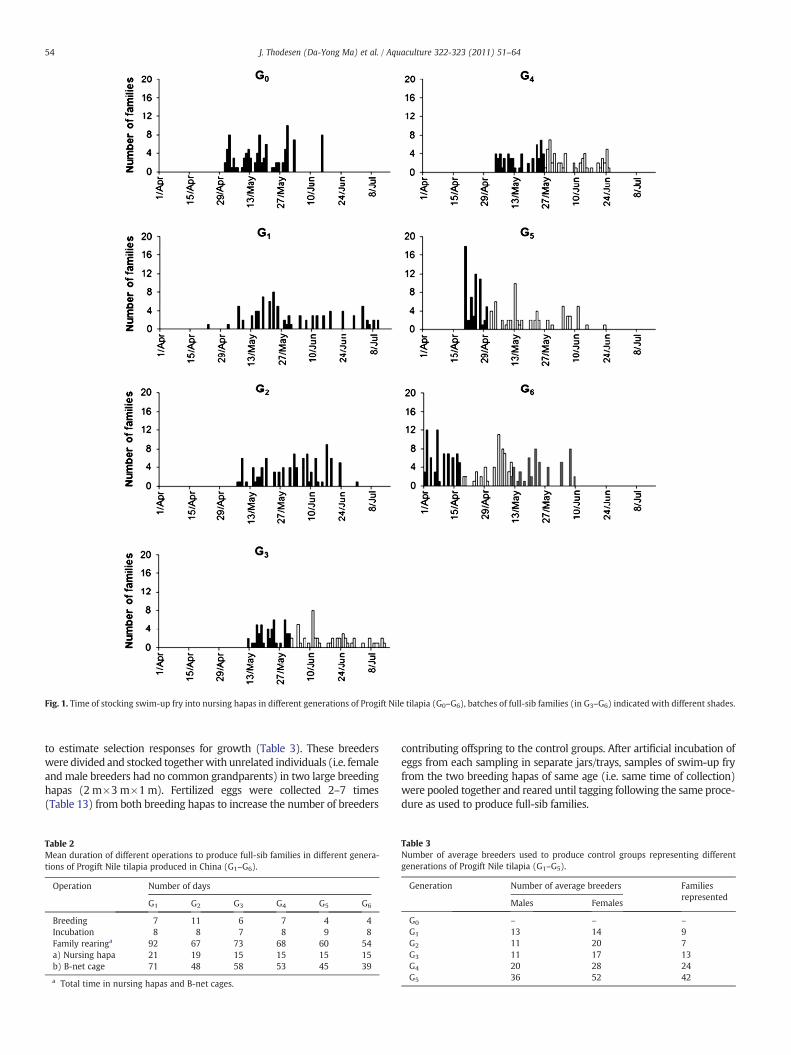
Fig. 1. Time of stocking swim-up fry into nursing hapas in different generations of Progift Nile tilapia (G0–G6), batches of full-sib families (in G3–G6) indicated with different shades.
54 J. Thodesen (Da-Yong Ma) et al. / Aquaculture 322-323 (2011) 51–64
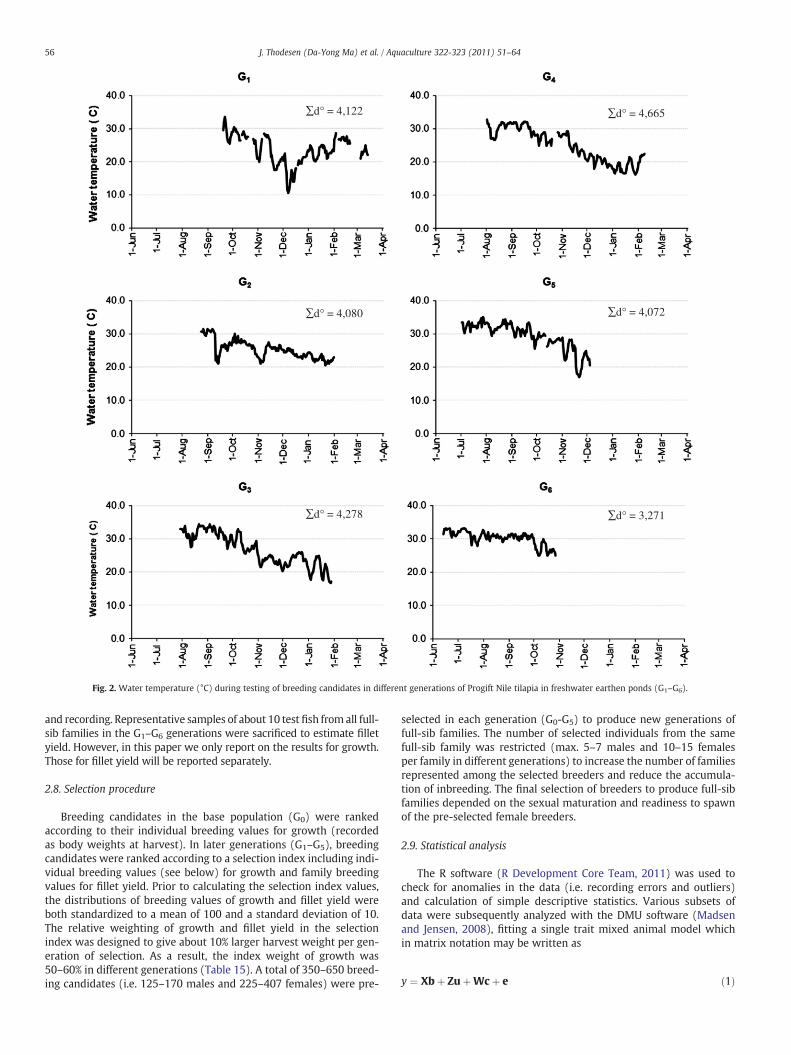
to estimate selection responses for growth (Table 3). These breederswere divided and stocked togetherwith unrelated individuals (i.e. femaleand male breeders had no common grandparents) in two large breedinghapas (2 m×3m×1m). Fertilized eggs were collected 2–7 times(Table 13) from both breeding hapas to increase the number of breeders
Table 2Mean duration of different operations to produce full-sib families in different genera-tions of Progift Nile tilapia produced in China (G1–G6).
Operation Number of days
G1 G2 G3 G4 G5 G6
Breeding 7 11 6 7 4 4Incubation 8 8 7 8 9 8Family rearinga 92 67 73 68 60 54a) Nursing hapa 21 19 15 15 15 15b) B-net cage 71 48 58 53 45 39
a Total time in nursing hapas and B-net cages.
contributing offspring to the control groups. After artificial incubation ofeggs from each sampling in separate jars/trays, samples of swim-up fryfrom the two breeding hapas of same age (i.e. same time of collection)were pooled together and reared until tagging following the same proce-dure as used to produce full-sib families.
Table 3Number of average breeders used to produce control groups representing differentgenerations of Progift Nile tilapia (G1–G5).
Generation Number of average breeders Familiesrepresented
Males Females
G0 – – –
G1 13 14 9G2 11 20 7G3 11 17 13G4 20 28 24G5 36 52 42

55J. Thodesen (Da-Yong Ma) et al. / Aquaculture 322-323 (2011) 51–64
2.6. Grow-out testing
About 64,000 tagged fingerlings representing 787 full-sib familiesproduced in the seven generations were tested in three tilapia pro-duction systems common in China (i.e. freshwater earthen ponds,floating cages in reservoirs and brackish water earthen pond) at sixlocations in Guangdong and Hainan Provinces (Table 4). Fish testedin freshwater earthen ponds were candidates to produce the nextgeneration of families (i.e. breeding candidates) while those testedin other grow-out environments (i.e. test fish) were used to collectadditional sib information for ranking of the breeding candidates.
2.6.1. Freshwater pondsThe imported Nile tilapia in the base population (G0) were first
reared in large hapa cages until they were large enough (>25 g) tobe visually sexed. Males and females were then (at the beginning ofOctober 2004) stocked into separate 2000 m2 enclosures located inthe same fertilized freshwater earthen pond (P1). The breeding can-didates representing the G1-generation were reared in a commonlarge hapa cage (3.5 m×35 m×0.5 m) for about one month and sub-sequently (in September 2005) they were visually sexed and each sexstocked into separate 2000 m2 pond enclosures (P1). The breedingcandidates in the G2-generation were tested in three pond enclosureslocated in the same fertilized freshwater earthen pond (P1). After tag-ging (end of August 2006), about half of the breeding candidates(both males and females) were stocked into a 2000 m2 enclosure.The other breeding candidates were first reared in a common largehapa cage (3.5 m×35 m×0.5 m) for about ten days when (beginningof September 2006) they were manually sexed and each sex stockedinto separate 1000 m2 pond enclosures. The fish in these first threegenerations (G0–G2) were fed commercial sinking feed twice dailyaccording to a feeding table as is commonly practiced in China. Agreen house (a bamboo frame with plastic cover) was installed overthe test pond each year (in November/December) to increase thewater temperature during the cold winter months. The two batchesof breeding candidates in the G3-generation were also sexed (end ofJuly and beginning of September 2007, respectively) before stockingmales and females into separate pond enclosures (800–950 m2) intwo freshwater earthen ponds, one pond (two enclosures) per batchof full-sib families (P2). The breeding candidates in the last three gen-erations (G4–G6) were tested in 1300–1600 m2 freshwater earthenponds (P3). Batches of breeding candidates in the G4 and G5 genera-tions were first stocked (the G4-generation in August 2008 and theG5-generation in July 2009) and tested in separate earthen pondsuntil expected time of sexual maturation. After recording, males andfemales were sorted and tested in separate earthen ponds until finalharvest to avoid uncontrolled breeding and over-crowding in theearthen ponds. Batches of breeding candidates in the G6-generation
Table 4Description of test environments.
Code Location Environment Water
P1 Taishan County,Guangdong
Earthen pond (4000 m2), 2–3 enclosures,green house installed in Nov/Dec
Freshwachemica
P2 Wenbifeng, DinganCounty, Hainan
Earthen ponds (1600 and 1900 m2), twoenclosures/pond
Freshwachemica
P3 Nanlihu, Dingan County,Hainan
Earthen ponds (1300–1600 m2) Freshwachemica
P4 Nanlihu, Dingan County,Hainan
Earthen ponds (500–600 m2) Freshwaof water
C1 Danzhou County,Hainan
Floating cage (4×4×2.5 m3) Freshwa
C2 Maniao County,Hainan
Floating cages (3×3×3 m3) Freshwa
B1 Maoming County,Guangdong
Earthen pond (2800 m2) Brackish
(stocked in June and July 2010) were tested in mixed populationsduring the entire testing period. The breeding candidates in the lastfour generations (G3–G6) were fed commercial floating pellets twicedaily according to observed appetite in a “feeding station” (a floatingframe) located at the center of each pond or pond enclosure (G3–G5)or by automatic feeders (G6). Test fish of the G6-generation were alsotested in poorly managed freshwater earthen ponds with no waterexchange and reduced feeding (P4).
2.6.2. Floating cages in reservoirTest fish representing full-sib families in the G1-generation were
stocked (beginning of September 2005) into a floating cage(4 m×4 m×2.5 m) located together with similar cages in a large res-ervoir (C1), while the two or three batches of test fish representingfull-sib families in the two last generations (G5 and G6) were stocked(same time as the breeding candidates in earthen ponds) and testedseparately in slightly smaller floating cages (3 m×3 m×3 m) locatedin a deep-water pond (C2). Males and females were stocked togetherin the same cage since breeding, if successfully conducted, wouldhave no effect on the stocking density (65–70 fish/m3) inside thecages. Test fish in both generations were fed commercial floating pel-lets twice daily according to observed appetite.
2.6.3. Brackish water pondTest fish representing full-sib families in the G1-generation were
also stocked (beginning of October 2005) and tested in a 2800-m2
earthen brackish water pond (B1). The water salinity, which was10 ppt at stocking, was gradually increased to about 18 ppt (by add-ing seawater) during the following week. Males and females werestocked and tested together in the same pond since it was notexpected that Nile tilapia would breed successfully in brackishwater (Watanabe and Kuo, 1985). The test fish in the brackishwater pond were fed commercial sinking feed twice daily accordingto a feeding table.
2.7. Recordings
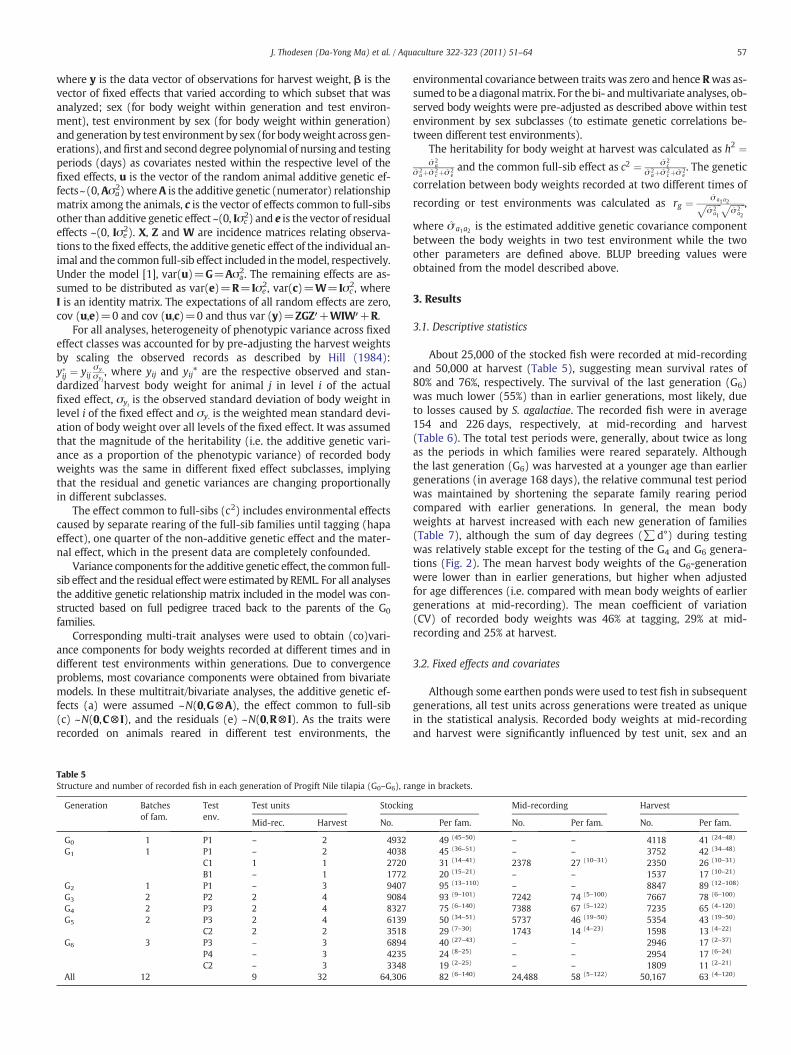
Water temperature was recorded daily (Fig. 2). Breeding candidatesand test fish representing the first three generations (G0–G2, except G1
in a floating cage) and the last generation (G6) were only recorded atstocking and harvest, while those representing the other generations(G3–G5, and G1 tested in a floating cage) were recorded at stocking,expected time of sexual maturation (mid-recording) and harvest.After harvesting, the breeding candidates were transferred to hapacages (3 m×5 m×1 m), about 300 fish/cage, for conditioning withoutfeeding at least one day before individual IDs, body weights and sexwere recorded. Test fish in the floating cages and brackish water pondwere also conditioned without feeding at least one day before harvest
Feeding
ter, fertilized withl fertilizers
Commercial feed, table feedingtwice daily
ter, Fertilized withl fertilizers
Commercial floating feed, appetite feedingtwice daily
ter, fertilized withl fertilizers
Commercial floating feed, appetite feeding twice daily
ter, fertilized, no exchange Commercial floating feed, no feeding when observingdead fish
ter, lake Commercial floating feed, appetite feedingtwice daily
ter, reservoir Commercial floating feed, appetite feedingtwice daily
water, (~18 ppt) Commercial feed, table feedingtwice daily
∑d° = 4,122 ∑d° = 4,665
∑d° = 4,080 ∑d° = 4,072
∑d° = 4,278 ∑d° = 3,271
Fig. 2. Water temperature (°C) during testing of breeding candidates in different generations of Progift Nile tilapia in freshwater earthen ponds (G1–G6).
56 J. Thodesen (Da-Yong Ma) et al. / Aquaculture 322-323 (2011) 51–64
and recording. Representative samples of about 10 test fish from all full-sib families in the G1–G6 generations were sacrificed to estimate filletyield. However, in this paper we only report on the results for growth.Those for fillet yield will be reported separately.
2.8. Selection procedure
Breeding candidates in the base population (G0) were rankedaccording to their individual breeding values for growth (recordedas body weights at harvest). In later generations (G1–G5), breedingcandidates were ranked according to a selection index including indi-vidual breeding values (see below) for growth and family breedingvalues for fillet yield. Prior to calculating the selection index values,the distributions of breeding values of growth and fillet yield wereboth standardized to a mean of 100 and a standard deviation of 10.The relative weighting of growth and fillet yield in the selectionindex was designed to give about 10% larger harvest weight per gen-eration of selection. As a result, the index weight of growth was50–60% in different generations (Table 15). A total of 350–650 breed-ing candidates (i.e. 125–170 males and 225–407 females) were pre-
selected in each generation (G0-G5) to produce new generations offull-sib families. The number of selected individuals from the samefull-sib family was restricted (max. 5–7 males and 10–15 femalesper family in different generations) to increase the number of familiesrepresented among the selected breeders and reduce the accumula-tion of inbreeding. The final selection of breeders to produce full-sibfamilies depended on the sexual maturation and readiness to spawnof the pre-selected female breeders.
2.9. Statistical analysis
The R software (R Development Core Team, 2011) was used tocheck for anomalies in the data (i.e. recording errors and outliers)and calculation of simple descriptive statistics. Various subsets ofdata were subsequently analyzed with the DMU software (Madsenand Jensen, 2008), fitting a single trait mixed animal model whichin matrix notation may be written as
y ¼ Xbþ ZuþWcþ e ð1Þ
57J. Thodesen (Da-Yong Ma) et al. / Aquaculture 322-323 (2011) 51–64
where y is the data vector of observations for harvest weight, β is thevector of fixed effects that varied according to which subset that wasanalyzed; sex (for body weight within generation and test environ-ment), test environment by sex (for body weight within generation)and generation by test environment by sex (for bodyweight across gen-erations), and first and second degree polynomial of nursing and testingperiods (days) as covariates nested within the respective level of thefixed effects, u is the vector of the random animal additive genetic ef-fects~(0,Aσa
2) whereA is the additive genetic (numerator) relationshipmatrix among the animals, c is the vector of effects common to full-sibsother than additive genetic effect ~(0, Iσc
2) and e is the vector of residualeffects ~(0, Iσe
2). X, Z and W are incidence matrices relating observa-tions to the fixed effects, the additive genetic effect of the individual an-imal and the common full-sib effect included in themodel, respectively.Under the model [1], var(u)=G=Aσa
2. The remaining effects are as-sumed to be distributed as var(e)=R=Iσe
2, var(c)=W= Iσc2, where
I is an identity matrix. The expectations of all random effects are zero,cov (u,e)=0 and cov (u,c)=0 and thus var (y)=ZGZ′+WIW′+R.
For all analyses, heterogeneity of phenotypic variance across fixedeffect classes was accounted for by pre-adjusting the harvest weightsby scaling the observed records as described by Hill (1984):y�ij ¼ yij
σy:
σyi, where yij and yij* are the respective observed and stan-
dardized harvest body weight for animal j in level i of the actualfixed effect, σyi is the observed standard deviation of body weight inlevel i of the fixed effect and σy. is the weighted mean standard devi-ation of body weight over all levels of the fixed effect. It was assumedthat the magnitude of the heritability (i.e. the additive genetic vari-ance as a proportion of the phenotypic variance) of recorded bodyweights was the same in different fixed effect subclasses, implyingthat the residual and genetic variances are changing proportionallyin different subclasses.
The effect common to full-sibs (c2) includes environmental effectscaused by separate rearing of the full-sib families until tagging (hapaeffect), one quarter of the non-additive genetic effect and the mater-nal effect, which in the present data are completely confounded.
Variance components for the additive genetic effect, the common full-sib effect and the residual effect were estimated by REML. For all analysesthe additive genetic relationship matrix included in the model was con-structed based on full pedigree traced back to the parents of the G0
families.Corresponding multi-trait analyses were used to obtain (co)vari-
ance components for body weights recorded at different times and indifferent test environments within generations. Due to convergenceproblems, most covariance components were obtained from bivariatemodels. In these multitrait/bivariate analyses, the additive genetic ef-fects (a) were assumed ~N(0,G⊗A), the effect common to full-sib(c) ~N(0,C⊗ I), and the residuals (e) ~N(0,R⊗ I). As the traits wererecorded on animals reared in different test environments, the
Table 5Structure and number of recorded fish in each generation of Progift Nile tilapia (G0–G6), ra
Generation Batchesof fam.
Testenv.
Test units Stocking
Mid-rec. Harvest No.
G0 1 P1 – 2 4932G1 1 P1 – 2 4038
C1 1 1 2720B1 – 1 1772
G2 1 P1 – 3 9407G3 2 P2 2 4 9084G4 2 P3 2 4 8327G5 2 P3 2 4 6139
C2 2 2 3518G6 3 P3 – 3 6894
P4 – 3 4235C2 – 3 3348
All 12 9 32 64,306
environmental covariance between traits was zero and hence Rwas as-sumed to be a diagonalmatrix. For the bi- andmultivariate analyses, ob-served body weights were pre-adjusted as described above within testenvironment by sex subclasses (to estimate genetic correlations be-tween different test environments).
The heritability for body weight at harvest was calculated as h2 ¼σ̂ 2
aσ̂ 2
aþσ̂ 2cþσ̂ 2
eand the common full-sib effect as c2 ¼ σ̂ 2
cσ̂ 2
aþσ̂ 2cþσ̂ 2
e. The genetic
correlation between body weights recorded at two different times of
recording or test environments was calculated as rg ¼ σ̂ a1a2ffiffiffiffiffiffiffiσ̂ 2
a1
p ffiffiffiffiffiffiffiσ̂ 2
a2
p ,
where σ̂ a1a2 is the estimated additive genetic covariance componentbetween the body weights in two test environment while the twoother parameters are defined above. BLUP breeding values wereobtained from the model described above.
3. Results
3.1. Descriptive statistics
About 25,000 of the stocked fish were recorded at mid-recordingand 50,000 at harvest (Table 5), suggesting mean survival rates of80% and 76%, respectively. The survival of the last generation (G6)was much lower (55%) than in earlier generations, most likely, dueto losses caused by S. agalactiae. The recorded fish were in average154 and 226 days, respectively, at mid-recording and harvest(Table 6). The total test periods were, generally, about twice as longas the periods in which families were reared separately. Althoughthe last generation (G6) was harvested at a younger age than earliergenerations (in average 168 days), the relative communal test periodwas maintained by shortening the separate family rearing periodcompared with earlier generations. In general, the mean bodyweights at harvest increased with each new generation of families(Table 7), although the sum of day degrees (∑d°) during testingwas relatively stable except for the testing of the G4 and G6 genera-tions (Fig. 2). The mean harvest body weights of the G6-generationwere lower than in earlier generations, but higher when adjustedfor age differences (i.e. compared with mean body weights of earliergenerations at mid-recording). The mean coefficient of variation(CV) of recorded body weights was 46% at tagging, 29% at mid-recording and 25% at harvest.
3.2. Fixed effects and covariates
Although some earthen ponds were used to test fish in subsequentgenerations, all test units across generations were treated as uniquein the statistical analysis. Recorded body weights at mid-recordingand harvest were significantly influenced by test unit, sex and an
nge in brackets.
Mid-recording Harvest
Per fam. No. Per fam. No. Per fam.
49 (45–50) – – 4118 41 (24–48)
45 (36–51) – – 3752 42 (34–48)
31 (14–41) 2378 27 (10–31) 2350 26 (10–31)
20 (15–21) – – 1537 17 (10–21)
95 (13–110) – – 8847 89 (12–108)
93 (9–101) 7242 74 (5–100) 7667 78 (6–100)
75 (6–140) 7388 67 (5–122) 7235 65 (4–120)
50 (34–51) 5737 46 (19–50) 5354 43 (19–50)
29 (7–30) 1743 14 (4–23) 1598 13 (4–22)
40 (27–43) – – 2946 17 (2–37)
24 (8–25) – – 2954 17 (6–24)
19 (2–25) – – 1809 11 (2–21)
82 (6–140) 24,488 58 (5–122) 50,167 63 (4–120)
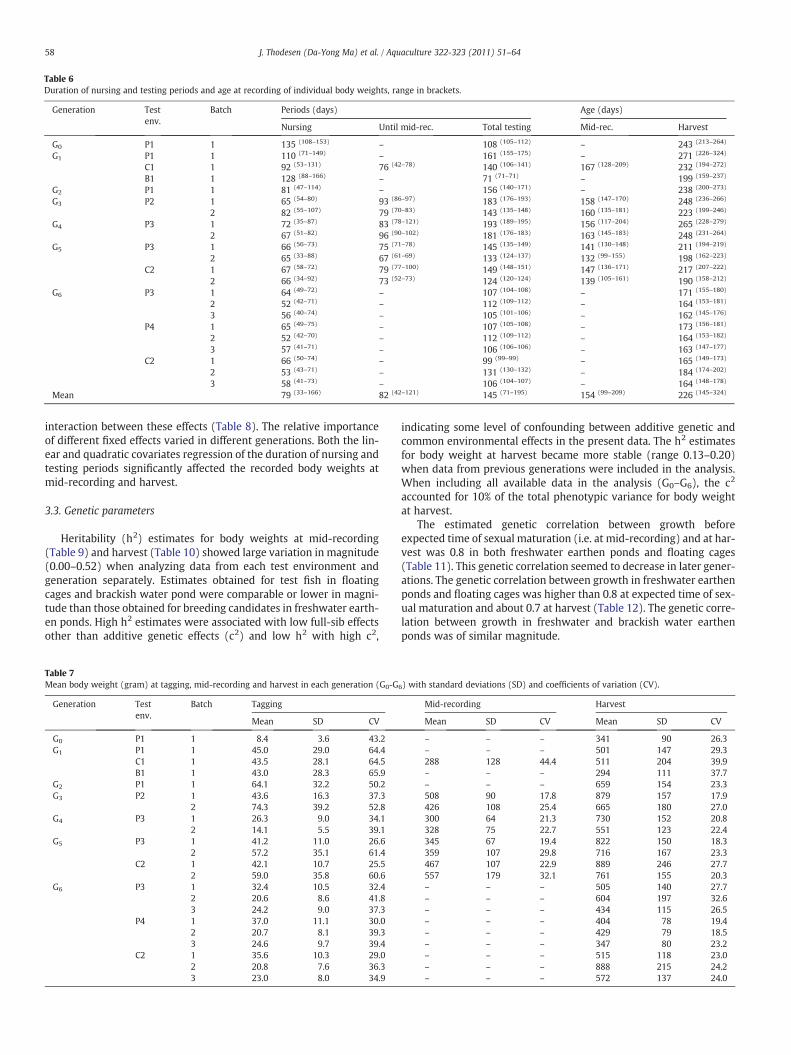
Table 6Duration of nursing and testing periods and age at recording of individual body weights, range in brackets.
Generation Testenv.
Batch Periods (days) Age (days)
Nursing Until mid-rec. Total testing Mid-rec. Harvest
G0 P1 1 135 (108–153) – 108 (105–112) – 243 (213–264)
G1 P1 1 110 (71–149) – 161 (155–175) – 271 (226–324)
C1 1 92 (53–131) 76 (42–78) 140 (106–141) 167 (128–209) 232 (194–272)
B1 1 128 (88–166) – 71 (71–71) – 199 (159–237)
G2 P1 1 81 (47–114) – 156 (140–171) – 238 (200–273)
G3 P2 1 65 (54–80) 93 (86–97) 183 (176–193) 158 (147–170) 248 (236–266)
2 82 (55–107) 79 (70–83) 143 (135–148) 160 (135–181) 223 (199–246)
G4 P3 1 72 (35–87) 83 (78–121) 193 (189–195) 156 (117–204) 265 (228–279)
2 67 (51–82) 96 (90–102) 181 (176–183) 163 (145–183) 248 (231–264)
G5 P3 1 66 (56–73) 75 (71–78) 145 (135–149) 141 (130–148) 211 (194–219)
2 65 (33–88) 67 (61–69) 133 (124–137) 132 (99–155) 198 (162–223)
C2 1 67 (58–72) 79 (77–100) 149 (148–151) 147 (136–171) 217 (207–222)
2 66 (34–92) 73 (52–73) 124 (120–124) 139 (105–161) 190 (158–212)
G6 P3 1 64 (49–72) – 107 (104–108) – 171 (155–180)
2 52 (42–71) – 112 (109–112) – 164 (153–181)
3 56 (40–74) – 105 (101–106) – 162 (145–176)
P4 1 65 (49–75) – 107 (105–108) – 173 (156–181)
2 52 (42–70) – 112 (109–112) – 164 (153–182)
3 57 (41–71) – 106 (106–106) – 163 (147–177)
C2 1 66 (50–74) – 99 (99–99) – 165 (149–173)
2 53 (43–71) – 131 (130–132) – 184 (174–202)
3 58 (41–73) – 106 (104–107) – 164 (148–178)
Mean 79 (33–166) 82 (42–121) 145 (71–195) 154 (99–209) 226 (145–324)
58 J. Thodesen (Da-Yong Ma) et al. / Aquaculture 322-323 (2011) 51–64
interaction between these effects (Table 8). The relative importanceof different fixed effects varied in different generations. Both the lin-ear and quadratic covariates regression of the duration of nursing andtesting periods significantly affected the recorded body weights atmid-recording and harvest.
3.3. Genetic parameters
Heritability (h2) estimates for body weights at mid-recording(Table 9) and harvest (Table 10) showed large variation in magnitude(0.00–0.52) when analyzing data from each test environment andgeneration separately. Estimates obtained for test fish in floatingcages and brackish water pond were comparable or lower in magni-tude than those obtained for breeding candidates in freshwater earth-en ponds. High h2 estimates were associated with low full-sib effectsother than additive genetic effects (c2) and low h2 with high c2,
Table 7Mean body weight (gram) at tagging, mid-recording and harvest in each generation (G0-G6) with standard deviations (SD) and coefficients of variation (CV).
Generation Testenv.
Batch Tagging Mid-recording Harvest
Mean SD CV Mean SD CV Mean SD CV
G0 P1 1 8.4 3.6 43.2 – – – 341 90 26.3G1 P1 1 45.0 29.0 64.4 – – – 501 147 29.3
C1 1 43.5 28.1 64.5 288 128 44.4 511 204 39.9B1 1 43.0 28.3 65.9 – – – 294 111 37.7
G2 P1 1 64.1 32.2 50.2 – – – 659 154 23.3G3 P2 1 43.6 16.3 37.3 508 90 17.8 879 157 17.9
2 74.3 39.2 52.8 426 108 25.4 665 180 27.0G4 P3 1 26.3 9.0 34.1 300 64 21.3 730 152 20.8
2 14.1 5.5 39.1 328 75 22.7 551 123 22.4G5 P3 1 41.2 11.0 26.6 345 67 19.4 822 150 18.3
2 57.2 35.1 61.4 359 107 29.8 716 167 23.3C2 1 42.1 10.7 25.5 467 107 22.9 889 246 27.7
2 59.0 35.8 60.6 557 179 32.1 761 155 20.3G6 P3 1 32.4 10.5 32.4 – – – 505 140 27.7
2 20.6 8.6 41.8 – – – 604 197 32.63 24.2 9.0 37.3 – – – 434 115 26.5
P4 1 37.0 11.1 30.0 – – – 404 78 19.42 20.7 8.1 39.3 – – – 429 79 18.53 24.6 9.7 39.4 – – – 347 80 23.2
C2 1 35.6 10.3 29.0 – – – 515 118 23.02 20.8 7.6 36.3 – – – 888 215 24.23 23.0 8.0 34.9 – – – 572 137 24.0
indicating some level of confounding between additive genetic andcommon environmental effects in the present data. The h2 estimatesfor body weight at harvest became more stable (range 0.13–0.20)when data from previous generations were included in the analysis.When including all available data in the analysis (G0–G6), the c2
accounted for 10% of the total phenotypic variance for body weightat harvest.
The estimated genetic correlation between growth beforeexpected time of sexual maturation (i.e. at mid-recording) and at har-vest was 0.8 in both freshwater earthen ponds and floating cages(Table 11). This genetic correlation seemed to decrease in later gener-ations. The genetic correlation between growth in freshwater earthenponds and floating cages was higher than 0.8 at expected time of sex-ual maturation and about 0.7 at harvest (Table 12). The genetic corre-lation between growth in freshwater and brackish water earthenponds was of similar magnitude.
Table 8Analysis of variance of recorded body weights at mid-recording and harvest in different generations of Progift Nile tilapia (G0–G6).
Effect F-values
G0 G1 G2 G3 G4 G5 G6 All
Mid-recordingTest unit (U) – 47.27*** – 3973.99*** 346.61*** 2427.79*** – 3031.82***Sex (S) – 110.70*** – 336.93*** 6.73** 14.19*** – 278.01***U*S – – – 15.44*** 18.82** 2.01NS – 19.63***Nursing period (U*S) – 1951.07*** – 487.78*** 488.74*** 371.00*** – 514.24***Nursing period (U*S)2 – 0.25NS – 21.00*** 59.74*** 29.41*** – 30.90***Testing period (U*S) – 2.91NS – 42.49*** 17.43*** 22.16*** – 26.83***Testing period (U*S)2 – 0.19NS – 5.20*** 4.43** 4.49*** – 4.42***Residual variance – 3040 – 4955 6045 5380 – 5214
HarvestTest unit (U) 85.60*** 2724.03*** 283.18*** 5122.82*** 828.05*** 3148.12*** 738.68*** 2360.46***Sex (S) 122.91*** 388.13*** 450.71*** 216.32*** 36.61*** 0.06NS 392.07*** 1404.91***U*S 21.22*** 186.09*** 186.83*** 7.90*** 95.96*** 63.36*** 47.94*** 69.52***Nursing period (U*S) 12.80*** 1021.86*** 193.30*** 386.64*** 161.51*** 198.79*** 56.76*** 214.06***Nursing period (U*S)2 0.50NS 31.94*** 54.39*** 19.95*** 17.11*** 18.81*** 5.23*** 17.88***Testing period (U*S) 45.11*** 29.64*** 17.11*** 14.25*** 10.41*** 3.71*** 1.88* 12.48***Testing period (U*S)2 0.69NS 1.01NS 9.84*** 19.96*** 8.49*** 2.97*** 5.24*** 7.49***Residual variance 16,687 9438 14,842 12,065 14,465 13,332 15,278 13,552
* pb0.05, ** pb0.01, *** pb0.001, NS p>0.05.
59J. Thodesen (Da-Yong Ma) et al. / Aquaculture 322-323 (2011) 51–64
3.4. Genetic changes
The selection response was, on average, 11.4% per generation ofselection (range 7.4–18.7%) when estimated based on the LS meanperformances of each generation and control groups representingthe parental generations (Table 13). A genetic trend analysis basedon all data and parameter estimates h2=0.20 and c2=0.10 predictsan accumulated selection response of more than 200 g (Fig. 3) andan average selection response of 8.0% per generation of selectionwhen using the LS mean of the base population (G0) as a base linefor the comparison (Table 14). The trend analysis suggested a dropin the realized selection response for growth when fillet yield was in-cluded in the selection index (G2) and further decrease when thenumber of nucleus families was gradually increased in the last threegenerations (G4–G6). The reduction of realized selection responsesof growth in later generations was associated with reduced selectionintensities, especially for female breeders (Table 15). The mean in-breeding coefficient (F) was estimated to 5.0% after six generationsof selection (Table 16).
4. Discussion
4.1. General
Most reported selective breeding programs for tilapia have focusedon developing genetically improved breeds for low-input to semi-intensive production systems (Eknath and Acosta, 1998; Hussain et al.,2011; Luan, 2010; Ponzoni et al., 2005; Rezk et al., 2009). Chinese
Table 9Heritability (h2) and environmental effects common to full-sibs (c2) estimates for growth r
Gen. All test environments
Accumulated Within generations
h2 c2 h2 c2
G0 – – – –
G1 0.22 (0.10) 0.03 (0.11) 0.22 (0.10) 0.03 (0.11)
G2 – – – –
G3 0.27 (0.08) 0.09 (0.09) 0.52 (0.18) 0.10 (0.20)
G4 0.02 (0.04) 0.26 (0.04) 0.00 (0.13) 0.35 (0.13)
G5 0.07 (0.03) 0.19 (0.03) 0.21 (0.08) 0.08 (0.08)
G6 – – – –
All 0.07 (0.03) 0.19 (0.03)
aquaculture, however, requires genetically improved breeds that per-form well in semi-intensive to intensive production systems (Miao andYuan, 2007) to meet the demand for 500 g fish in local markets andeven larger fish for export. Nile tilapia in the present breeding programin China, which originate from the GIFT project in the Philippines(Eknath and Acosta, 1998), have been selected based on growth perfor-mances and fillet yield in earthen ponds and floating cages with feedingrations set mainly according to observed appetite. Interestingly, themean harvest weights increased from 50 to 160 g in the five first gener-ations tested in the Philippines (Bentsen et al., submitted for publication)to 170–230 g in the five generations tested in Vietnam (Luan, 2010) and340–800 g in the seven generations tested in China. This increase in har-vest weight is the result of both genetic improvement of growth perfor-mance (after a total of 16 generations of selection), slightly higher age atharvest and testing in more intensified production systems.
4.2. Selection strategies
Several selection strategies have been applied to genetically im-prove the growth performance of tilapias. Mass-selection has inmost cases not showed significant selection responses in growth(Behrends et al., 1988; Huang and Liao, 1990; Hulata et al., 1986;Tave and Smitherman, 1980; Teichert-Coddington and Smitherman,1988) due to age-dependent variation of body weights caused byasynchronous spawning and confounded ranking of breeding candi-dates. Furthermore, mass-selection in combination with mass-spawning may result in highly unbalanced family sizes among the
ecorded as body weights at mid-recording, standard errors in brackets.
Within test environments
FW-pond FW-cage
h2 c2 h2 c2
– – – –
– – 0.22 (0.10) 0.03 (0.11)
– – – –
0.52 (0.18) 0.10 (0.20) – –
0.00 (0.13) 0.35 (0.13) – –
0.20 (0.09) 0.11 (0.09) 0.12 (0.08) 0.10 (0.08)
– – – –
0.08 (0.04) 0.24 (0.04) 0.12 (0.08) 0.10 (0.08)

Table 10Heritability (h2) and environmental effects common to full-sibs (c2) estimates for growth recorded as body weights at harvest, standard errors in brackets.
Gen. All test environments Within test environments
Accumulated Within generations FW-pond FW-cage BW-pond
h2 c2 h2 c2 h2 c2 h2 c2 h2 c2
G0 0.00 (0.12) 0.18 (0.12) 0.00 (0.13) 0.18 (0.12) 0.00 (0.13) 0.18 (0.12) – – – –
G1 0.14 (0.06) 0.11 (0.06) 0.14 (0.08) 0.06 (0.08) 0.20 (0.11) 0.09 (0.11) 0.16 (0.12) 0.08 (0.12) 0.05 (0.08) 0.14 (0.08)
G2 0.17 (0.05) 0.14 (0.05) 0.07 (0.17) 0.37 (0.16) 0.07 (0.17) 0.37 (0.16) – – – –
G3 0.20 (0.04) 0.13 (0.05) 0.38 (0.12) 0.07 (0.14) 0.38 (0.12) 0.07 (0.14) – – – –
G4 0.13 (0.04) 0.16 (0.04) 0.00 (0.08) 0.23 (0.07) 0.00 (0.08) 0.23 (0.07) – – – –
G5 0.17 (0.03) 0.13 (0.03) 0.38 (0.06) 0.01 (0.07) 0.51 (0.08) 0.00 (0.10) 0.12 (0.07) 0.05 (0.07) – –
G6 0.20 (0.03) 0.10 (0.03) 0.16 (0.05) 0.05 (0.05) 0.15 (0.05) 0.06 (0.05) 0.19 (0.08) 0.01 (0.08) – –
All 0.20 (0.03) 0.10 (0.03) 0.21 (0.03) 0.11 (0.03) 0.19 (0.05) 0.05 (0.05) 0.05 (0.08) 0.14 (0.08)
60 J. Thodesen (Da-Yong Ma) et al. / Aquaculture 322-323 (2011) 51–64
progeny fish and cause rapid accumulation of inbreeding that cancounteract response to selection (Bentsen and Olesen, 2002). Howev-er, Li et al. (2006) reported considerable selection responses ingrowth and caudal stripe pattern of Nile tilapia using mass-selection. Within-family selection has been successfully applied to re-strict inbreeding while improving the growth of Nile tilapia in tanks(Bolivar and Newkirk, 2002). The highly successful GIFT project inthe Philippines (Eknath and Acosta, 1998) demonstrated the poten-tial of using a combined family and within-family selection strategyto improve growth performance of Nile tilapia in several commongrow-out environments, as earlier done for salmonids (Gjedrem,2010). The ‘GIFT technology’ (WorldFish Center, 2004), which impliessingle-pair mating, separate early rearing of full-sib families and indi-vidual tagging, is now the standard for tilapia breeding programsworldwide. The technology makes it possible to account for systemat-ic non-genetic effects (i.e. test environments, sex and age differ-ences), to include traits recorded on sacrificed animals (i.e. filletyield), to maintain complete pedigree records for estimation of genet-ic parameters and breeding values, and to restrict the accumulation ofinbreeding. However, the technology should be modified according tolocal conditions (i.e. research facilities, breeding objective etc.) andgenetic changes in the fish caused by the selection (i.e. shorten familyrearing and test periods as a result of faster growth, increase numberof full-sib families to allow intensive multi-trait selection whilerestricting inbreeding etc.). Gall and Bakar (2002) concluded thatmixed-model techniques (i.e. estimation of genetic parameters andbreeding values) increases selection responses of growth in tilapiaby 20–30% compared with mass-selection.
4.3. Heritability of growth
Selection based on mixed-model estimated breeding values is su-perior to phenotypic selection, especially for traits with a low to mod-erate heritability (Belonsky and Kennedy, 1988) as has typically beenreported for growth of Nile tilapia (Bentsen et al., submitted for pub-lication; Charo-Karisa et al., 2006; Eknath et al., 2007; Gall and Bakar,2002; Khaw et al., 2009; Luan, 2010; Ponzoni et al., 2005; Rezk et al.,
Table 11Genetic correlation between body weights recorded at mid-recording (i.e. expectedtime of sexual maturation) and at harvest in different generations and test environ-ments, standard errors in brackets.
Generation FW-pond FW-cage
G1 – 1.00 (0.04)
G3 0.97 (0.04) –
G4 0.79 (0.47) –
G5 0.72 (0.09) 0.69 (0.22)
All 0.83 (0.13) 0.82 (0.09)
Table 12Genetic correlations between growth in FW-ponds and other test environments (i.eFW-cages and BW-pond) recorded as body weights at mid-recording and harvest, standard errors in brackets.
Generation Mid-recording Harvest
FW-cage FW-cage BW-pond
G1 – 0.49 (0.33) 0.81 (0.37)
G5 0.84 (0.16) 0.71 (0.15) –
G6 – 0.86 (0.12) –
All 0.85 (0.23) 0.73 (0.08) 0.86 (0.25)
2009; Rutten et al., 2005). Heritability estimates in the present breed-ing program in China were also low to moderate in magnitude andhighly variable within test environments and generations(0.00–0.52) partly because of confounding with other full-sib effects(Bentsen et al., submitted for publication). The heritability estimatesbecame more stable when data from earlier generations were includ-ed in the statistical analysis (0.13–0.20). These heritability estimatesacross generations were comparable with those cited in literature(Bentsen et al., submitted for publication; Bolivar and Newkirk,2002; Gall and Bakar, 2002; Khaw et al., 2009). Although families inthe present breeding program were collected as fertilized eggs andartificially incubated before transfer to nursing hapas, the full-sib ef-fects other than additive genetic effects (c2=0.10–0.18) were of sim-ilar magnitude as reported in the literature cited above. Simulationstudies on optimization of genetic gain with constrained inbreedingsuggest that it is necessary to select more intensively within familieswhen the c2 is of such magnitudes (Villanueva andWoolliams, 1997).Since more intense selection within families will reduce the relativeselection intensity between families, larger breeding schemes (i.e.larger numbers of families and individuals within families) are re-quired in multi-trait selection of growth and traits recorded on rela-tives of the breeding candidates (e.g. fillet yield) to allow efficientselection of all traits. Efforts should, therefore, be made to minimizec2 by standardizing the rearing environment of families and synchro-nizing the breeding to reduce differences in family rearing time be-fore communal testing.
4.4. Genotype×environment (GxE) interactions
Genetic correlations between growth recorded in different testenvironments is a measure of the genotype by environment (GxE) in-teractions, i.e. the degree of genetic agreement when a trait isrecorded in different test environments (Bentsen et al., submittedfor publication). Genetic correlations in the present breeding pro-gram between growth in freshwater earthen ponds and floatingcages were of higher magnitude (0.7–0.8) than those (0.1–0.4)reported from the GIFT project (Bentsen et al., submitted for
.-
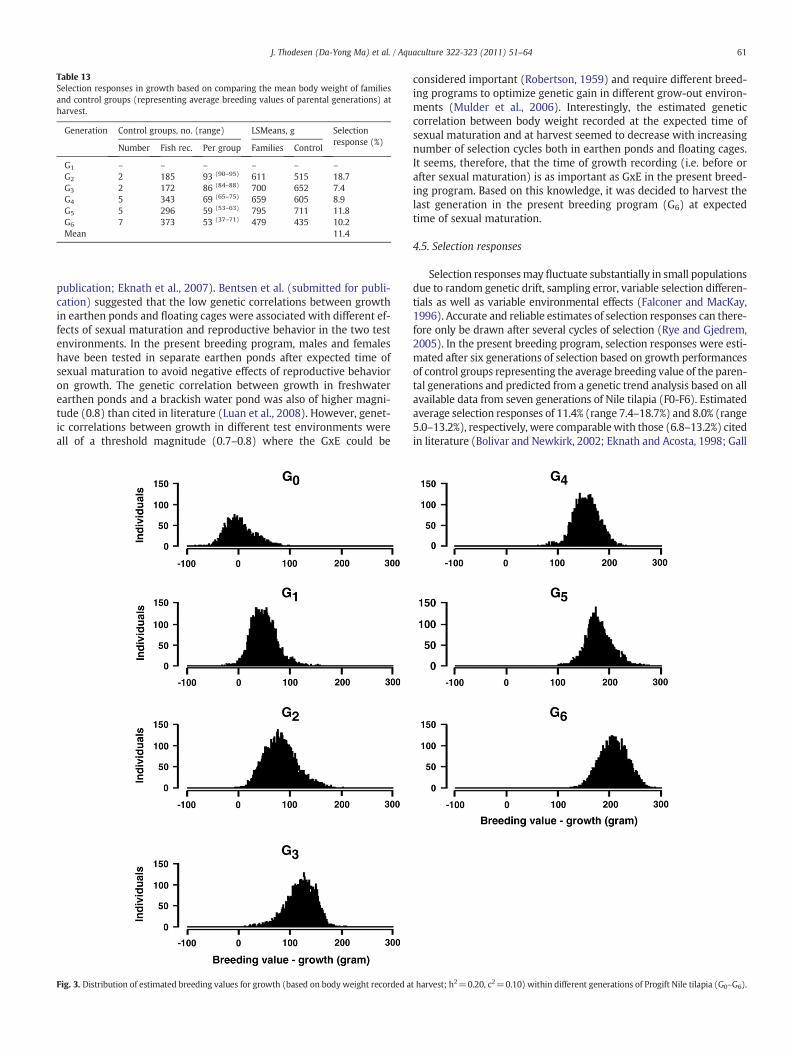
Table 13Selection responses in growth based on comparing the mean body weight of familiesand control groups (representing average breeding values of parental generations) atharvest.
Generation Control groups, no. (range) LSMeans, g Selectionresponse (%)
Number Fish rec. Per group Families Control
G1 – – – – – –
G2 2 185 93 (90–95) 611 515 18.7G3 2 172 86 (84–88) 700 652 7.4G4 5 343 69 (65–75) 659 605 8.9G5 5 296 59 (53–63) 795 711 11.8G6 7 373 53 (37–71) 479 435 10.2Mean 11.4
61J. Thodesen (Da-Yong Ma) et al. / Aquaculture 322-323 (2011) 51–64
publication; Eknath et al., 2007). Bentsen et al. (submitted for publi-cation) suggested that the low genetic correlations between growthin earthen ponds and floating cages were associated with different ef-fects of sexual maturation and reproductive behavior in the two testenvironments. In the present breeding program, males and femaleshave been tested in separate earthen ponds after expected time ofsexual maturation to avoid negative effects of reproductive behavioron growth. The genetic correlation between growth in freshwaterearthen ponds and a brackish water pond was also of higher magni-tude (0.8) than cited in literature (Luan et al., 2008). However, genet-ic correlations between growth in different test environments wereall of a threshold magnitude (0.7–0.8) where the GxE could be
Fig. 3. Distribution of estimated breeding values for growth (based on body weight recorded a
considered important (Robertson, 1959) and require different breed-ing programs to optimize genetic gain in different grow-out environ-ments (Mulder et al., 2006). Interestingly, the estimated geneticcorrelation between body weight recorded at the expected time ofsexual maturation and at harvest seemed to decrease with increasingnumber of selection cycles both in earthen ponds and floating cages.It seems, therefore, that the time of growth recording (i.e. before orafter sexual maturation) is as important as GxE in the present breed-ing program. Based on this knowledge, it was decided to harvest thelast generation in the present breeding program (G6) at expectedtime of sexual maturation.
4.5. Selection responses
Selection responsesmay fluctuate substantially in small populationsdue to random genetic drift, sampling error, variable selection differen-tials as well as variable environmental effects (Falconer and MacKay,1996). Accurate and reliable estimates of selection responses can there-fore only be drawn after several cycles of selection (Rye and Gjedrem,2005). In the present breeding program, selection responses were esti-mated after six generations of selection based on growth performancesof control groups representing the average breeding value of the paren-tal generations and predicted from a genetic trend analysis based on allavailable data from seven generations of Nile tilapia (F0-F6). Estimatedaverage selection responses of 11.4% (range 7.4–18.7%) and 8.0% (range5.0–13.2%), respectively, were comparablewith those (6.8–13.2%) citedin literature (Bolivar and Newkirk, 2002; Eknath and Acosta, 1998; Gall
t harvest; h2=0.20, c2=0.10) within different generations of Progift Nile tilapia (G0–G6).
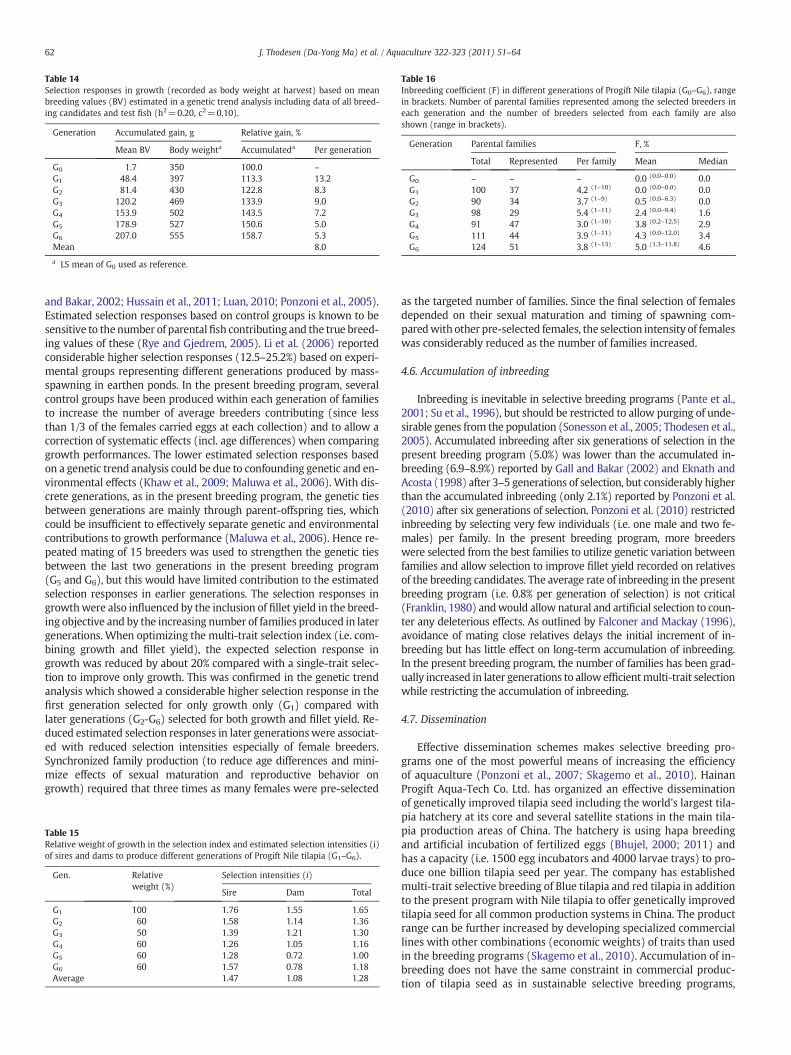
Table 16Inbreeding coefficient (F) in different generations of Progift Nile tilapia (G0–G6), rangein brackets. Number of parental families represented among the selected breeders ineach generation and the number of breeders selected from each family are alsoshown (range in brackets).
Generation Parental families F, %
Total Represented Per family Mean Median
G0 – – – 0.0 (0.0–0.0) 0.0G1 100 37 4.2 (1–10) 0.0 (0.0–0.0) 0.0G2 90 34 3.7 (1–9) 0.5 (0.0–6.3) 0.0G3 98 29 5.4 (1–11) 2.4 (0.0–9.4) 1.6G4 91 47 3.0 (1–10) 3.8 (0.2–12.5) 2.9G5 111 44 3.9 (1–11) 4.3 (0.0–12.0) 3.4G6 124 51 3.8 (1–13) 5.0 (1.3–11.8) 4.6
Table 14Selection responses in growth (recorded as body weight at harvest) based on meanbreeding values (BV) estimated in a genetic trend analysis including data of all breed-ing candidates and test fish (h2=0.20, c2=0.10).
Generation Accumulated gain, g Relative gain, %
Mean BV Body weighta Accumulateda Per generation
G0 1.7 350 100.0 –
G1 48.4 397 113.3 13.2G2 81.4 430 122.8 8.3G3 120.2 469 133.9 9.0G4 153.9 502 143.5 7.2G5 178.9 527 150.6 5.0G6 207.0 555 158.7 5.3Mean 8.0
a LS mean of G0 used as reference.
62 J. Thodesen (Da-Yong Ma) et al. / Aquaculture 322-323 (2011) 51–64
and Bakar, 2002; Hussain et al., 2011; Luan, 2010; Ponzoni et al., 2005).Estimated selection responses based on control groups is known to besensitive to thenumber of parentalfish contributing and the true breed-ing values of these (Rye and Gjedrem, 2005). Li et al. (2006) reportedconsiderable higher selection responses (12.5–25.2%) based on experi-mental groups representing different generations produced by mass-spawning in earthen ponds. In the present breeding program, severalcontrol groups have been produced within each generation of familiesto increase the number of average breeders contributing (since lessthan 1/3 of the females carried eggs at each collection) and to allow acorrection of systematic effects (incl. age differences) when comparinggrowth performances. The lower estimated selection responses basedon a genetic trend analysis could be due to confounding genetic and en-vironmental effects (Khaw et al., 2009; Maluwa et al., 2006). With dis-crete generations, as in the present breeding program, the genetic tiesbetween generations are mainly through parent-offspring ties, whichcould be insufficient to effectively separate genetic and environmentalcontributions to growth performance (Maluwa et al., 2006). Hence re-peated mating of 15 breeders was used to strengthen the genetic tiesbetween the last two generations in the present breeding program(G5 and G6), but this would have limited contribution to the estimatedselection responses in earlier generations. The selection responses ingrowthwere also influenced by the inclusion of fillet yield in the breed-ing objective and by the increasing number of families produced in latergenerations. When optimizing the multi-trait selection index (i.e. com-bining growth and fillet yield), the expected selection response ingrowth was reduced by about 20% compared with a single-trait selec-tion to improve only growth. This was confirmed in the genetic trendanalysis which showed a considerable higher selection response in thefirst generation selected for only growth only (G1) compared withlater generations (G2-G6) selected for both growth and fillet yield. Re-duced estimated selection responses in later generationswere associat-ed with reduced selection intensities especially of female breeders.Synchronized family production (to reduce age differences and mini-mize effects of sexual maturation and reproductive behavior ongrowth) required that three times as many females were pre-selected
Table 15Relative weight of growth in the selection index and estimated selection intensities (i)of sires and dams to produce different generations of Progift Nile tilapia (G1–G6).
Gen. Relativeweight (%)
Selection intensities (i)
Sire Dam Total
G1 100 1.76 1.55 1.65G2 60 1.58 1.14 1.36G3 50 1.39 1.21 1.30G4 60 1.26 1.05 1.16G5 60 1.28 0.72 1.00G6 60 1.57 0.78 1.18Average 1.47 1.08 1.28
as the targeted number of families. Since the final selection of femalesdepended on their sexual maturation and timing of spawning com-paredwith other pre-selected females, the selection intensity of femaleswas considerably reduced as the number of families increased.
4.6. Accumulation of inbreeding
Inbreeding is inevitable in selective breeding programs (Pante et al.,2001; Su et al., 1996), but should be restricted to allow purging of unde-sirable genes from the population (Sonesson et al., 2005; Thodesen et al.,2005). Accumulated inbreeding after six generations of selection in thepresent breeding program (5.0%) was lower than the accumulated in-breeding (6.9–8.9%) reported by Gall and Bakar (2002) and Eknath andAcosta (1998) after 3–5 generations of selection, but considerably higherthan the accumulated inbreeding (only 2.1%) reported by Ponzoni et al.(2010) after six generations of selection. Ponzoni et al. (2010) restrictedinbreeding by selecting very few individuals (i.e. one male and two fe-males) per family. In the present breeding program, more breederswere selected from the best families to utilize genetic variation betweenfamilies and allow selection to improve fillet yield recorded on relativesof the breeding candidates. The average rate of inbreeding in the presentbreeding program (i.e. 0.8% per generation of selection) is not critical(Franklin, 1980) andwould allow natural and artificial selection to coun-ter any deleterious effects. As outlined by Falconer and Mackay (1996),avoidance of mating close relatives delays the initial increment of in-breeding but has little effect on long-term accumulation of inbreeding.In the present breeding program, the number of families has been grad-ually increased in later generations to allow efficientmulti-trait selectionwhile restricting the accumulation of inbreeding.
4.7. Dissemination
Effective dissemination schemes makes selective breeding pro-grams one of the most powerful means of increasing the efficiencyof aquaculture (Ponzoni et al., 2007; Skagemo et al., 2010). HainanProgift Aqua-Tech Co. Ltd. has organized an effective disseminationof genetically improved tilapia seed including the world's largest tila-pia hatchery at its core and several satellite stations in the main tila-pia production areas of China. The hatchery is using hapa breedingand artificial incubation of fertilized eggs (Bhujel, 2000; 2011) andhas a capacity (i.e. 1500 egg incubators and 4000 larvae trays) to pro-duce one billion tilapia seed per year. The company has establishedmulti-trait selective breeding of Blue tilapia and red tilapia in additionto the present program with Nile tilapia to offer genetically improvedtilapia seed for all common production systems in China. The productrange can be further increased by developing specialized commerciallines with other combinations (economic weights) of traits than usedin the breeding programs (Skagemo et al., 2010). Accumulation of in-breeding does not have the same constraint in commercial produc-tion of tilapia seed as in sustainable selective breeding programs,

63J. Thodesen (Da-Yong Ma) et al. / Aquaculture 322-323 (2011) 51–64
since commercial breeders should not be used to produce new gener-ations of breeders.
5. Conclusions
It is concluded that the ongoing selective breeding of Nile tilapia inChina has resulted in considerable genetic improvement of growthafter six generations of multi-trait selection. Although the selectionresponse in growth seemed to be negatively affected by including fil-let yield in the breeding goal, the reported realized selection re-sponses suggest an accumulated genetic improvement of 60–90%larger body weight at harvest compared with the base populationimported from Vietnam. Stronger genetic ties between generationsare required to facilitate more accurate separation of additive geneticeffects and environmental effects common to full-sibs (c2), and bettersynchronized breeding and standardized family production is re-quired to reduce the latter. The increased number of full-sib familiesin later generations has restricted the accumulation of inbreedingand the breeding nucleus of Nile tilapia should have considerable ge-netic variation to allow further improvement of growth and othertraits. An effective dissemination scheme will ensure that the Chinesefarmers can utilize the genetically improved Nile tilapia as developedin the present breeding program.
Acknowledgements
Weare grateful to Azen Yuen and Simon Yuen, the owners of HainanProgift Aqua-Tech Co. Ltd., who have financed the reported breedingprogram for Nile tilapia and allowed collected data to be internationallypublished. Thanks also to Shi-Jia Li, Zhi-YongWang and the other skilledmembers of the breeding teamwhodiligently participated in improvingthe different work operations of the breeding program as required.
References
Behrends, L.L., Kingsley, J.B., Price, A.H., 1988. Bidirectional-backcross selection for bodyweight in a red tilapia. In: Pullin, R.S.V., Bhukaswan, T., Tonguthai, K., Maclean, J.L.(Eds.), The Second International Symposium on Tilapia in Aquaculture: ICLARMConf. Proc., 15, pp. 125–133. 623 pp.
Belonsky, G.M., Kennedy, B.W., 1988. Selection on individual phenotype and best linear un-biased predictor of breeding value in a closed swine herd. J. Anim. Sci. 66, 1124–1131.
Bentsen, H.B., Olesen, I., 2002. Designing aquaculture mass selection programs to avoidhigh inbreeding rates. Aquaculture 204, 349–359.
Bentsen, H.B., Eknath, A.E., Palada-de Vera, M.S., Danting, J.C., Bolivar, H.L., Reyes, R.A.,Dionisio, E.E., Longalong, F.M., Circa, A.V., Tayamen, M.M., Gjerde, B., 1998. Geneticimprovement of farmed tilapias: growth performance in a complete diallel experi-ment with eight strains of Oreochromis niloticus. Aquaculture 160, 145–173.
Bentsen, H.B., Gjerde, B., Nguyen, N.H., Rye, M., Ponzoni, R.W., Palada de Vera, M.S., Bolivar,H.L., Velasco, R.R., Danting, J.C., Dionisio, E.E., Longalong, F.M., Reyes, R.A., Abella, T.A.,Tayamen, M.M., Eknath, A.E., submitted for publication. Genetic improvement offarmed tilapias: genetic parameters for body weight at harvest in Oreochromis niloticusduring five generations of testing in multiple environments. Aquaculture.
Bhujel, R.C., 2000. A review of strategies for the management of Nile tilapia (Oreochromisniloticus) broodfish in seedproduction systems, especially hapa-based systems. Aqua-culture 181, 37–59.
Bhujel, R.C., 2011. How to produce billions of high quality tilapia fry. In: Liu, L.P., Fitzsimmons,K. (Eds.), Proceedings of the 9th International Symposium on Tilapia in Aquaculture.Shanghai, pp. 123–131. 409 pp.
Bolivar, R.B., Newkirk, G.F., 2002. Response to within family selection for body weight inNile tilapia (Oreochromis niloticus) using a single-trait animal model. Aquaculture204, 371–381.
Charo-Karisa, H., Komen, H., Rezk, M.A., Ponzoni, R.W., van Arendonk, J.A.M., Bovenhuis,H., 2006. Heritability estimates and response to selection for growth of Nile tilapia(Oreochromis niloticus) in low-input earthen ponds. Aquaculture 261, 479–486.
Chervinski, J., 1982. Environmental physiology of tilapias. In: Pullin, R.S.V., Lowe-McConnell,R.H. (Eds.), The Biology and Culture of Tilapias: ICLARM Conference Proceedings,7, pp. 119–128. 432 p.
Eknath, A.E., Acosta, B.O., 1998. Genetic Improvement of Farmed Tilapias (GIFT) Project:Final Report, March 1988 to December 1997. International Center for Living AquaticResources Management, Makati City, Philippines.
Eknath, A.E., Tayamen, M.M., Palada-de Vera, M.S., Danting, J.C., Reyes, R.A., Dionisio, E.E.,Capili, J.B., Bolivar, H.L., Abella, T.A., Circa, A.V., Bentsen, H.B., Gjerde, B., Gjedrem, T.,Pullin, R.S.V., 1993. Genetic improvement of farmed tilapias: the growth performanceof eight strains of Oreochromis niloticus tested in different farm environments. Aqua-culture 111, 171–188.
Eknath, A.E., Bentsen, H.B., Ponzoni, R.W., Rye, M., Nguyen, N.H., Thodesen, J., Gjerde, B.,2007. Genetic improvement of farmed tilapias: composition and genetic parame-ters of a synthetic base population of Oreochromis niloticus for selective breeding.Aquaculture 273, 1–14.
Falconer, D.S., Mackay, T.F.C., 1996. Introduction to Quantitative Genetics, Fourth edition.Longman Group Limited, Harlow, Essex, U.K.. 464 pp.
Fitzsimmons, K., Martinez-Garcia, R., Gonzalez-Alanis, P., 2011. Why tilapia is becom-ing the most important food fish on the planet. In: Liu, L.P., Fitzsimmons, K.(Eds.), Proceedings of the 9th International Symposium on Tilapia in Aquaculture.Shanghai, pp. 1–8. 409 pp.
Franklin, I.R., 1980. Chapter 8 Evolutionary change in small populations. In: Soule, M.E.,Wilcox, B.A. (Eds.), Conservation Biology. Sinauer Associates Inc, Sunderland, Massa-chusets, USA, pp. 135–149. 390 pp.
Gall, G.A.E., Bakar, Y., 2002. Application of mixed-model techniques to fish breed im-provement: analysis of breeding-value selection to increase 98-day body weightin tilapia. Aquaculture 212, 93–113.
Gjedrem, T., 2010. The first family-based breeding program in aquaculture. Reviews inAquaculture 2, 2–15.
Hill, W.G., 1984. On selection among groups with heterogeneous variance. Anim. Prod.39, 473–477.
Huang, C.M., Liao, I.C., 1990. Response to mass selection for growth rate in O. niloticus.Aquaculture 85, 199–205.
Hulata, G., Wohlfarth, G.W., Halevy, A., 1986. Mass selection for growth rate in the Niletilapia (Oreochromis niloticus). Aquaculture 57, 177–184.
Hussain, M.G., Kohinoor, A.H.M., Nguyen, N.H., Ponzoni, R.W., 2011. Genetic stock improve-ment of the GIFT strain in Bangladesh. In: Liu, L.P., Fitzsimmons, K. (Eds.), Proceedingsof the 9th International Symposium on Tilapia in Aquaculture. Shanghai, pp. 236–242.409 pp.
Khaw, H.L., Bovenhuis, H., Ponzoni, R.W., Rezk, M.A., Charo-Karisa, H., Komen, H., 2009.Genetic analysis of Nile tilapia (Oreochromis niloticus) selection line reared in twoinput environments. Aquaculture 294, 37–42.
Li, S.F., He, X.J., Hu, G.C., Cai, W.Q., Deng, X.W., Zhou, P.Y., 2006. Improving growth per-formance and caudal fin stripe pattern in selected F6–F8 generations of GIFT Niletilapia (Oreochromis niloticus L.) using mass selection. Aquacult. Res. 2006, 1–7.
Longalong, F.M., Eknath, A.E., Bentsen, H.B., 1999. Response to bi-directional selectionfor frequency of early maturing females in Nile tilapia (Oreochromis niloticus).Aquaculture 178, 13–25.
Lovshin, L.L., 1982. Tilapia hybridization. In: Pullin, R.S.V., Lowe-McConnell, R.H.(Eds.), The Biology and Culture of Tilapias: ICLARM Conference Proceedings, 7,pp. 279–308. 432 p.
Luan, T.D., 2010. Genetic studies of Nile tilapia (Oreochromis niloticus) for farming inNorthern Vietnam: Growth, survival and cold tolerance in different farm environ-ments. Philosophiae Doctor (PhD) Thesis 2010:04, Norwegian University of LifeSciences, 141 pp.
Luan, T.D., Olesen, I., Ødegård, J., Kolstad, K., Dan, N.C., 2008. Genotype by environment in-teraction for harvest body weight and survival of Nile tilapia (Oreochromis niloticus)in brackish and fresh water ponds. In: Elghobashy, H., Fitzsimmons, K., Diab, A.S.(Eds.), Proceedings from the 8th International Symposium on Tilapia Aquaculture.Egypt, pp. 231–240. Proceedings from the 8th International Symposium on TilapiaAquaculture. Egypt. pp1,447.
Luan, T.D., Olesen, I., Kolstad, K., 2010. Genetic parameters and genotype by environ-ment interaction for growth of Nile tilapia in low and optimal temperature. Pro-ceedings of the 9th World Congress on Genetics Applied to Livestock Production.Leipzig, Germany.
Madsen, P., Jensen, J., 2008. A user's guide to DMU. Version 6, release 4.7 Danish Instituteof Agricultural Science. Dept. of Animal Breeding andGenetics, Research Centre. 33pp.
Maluwa, A.O., Gjerde, B., Ponzoni, R.W., 2006. Genetic parameters andgenotype by environ-ment interaction for body weight of Oreochromis shiranus. Aquaculture 259, 47–55.
Miao,W.M., Yuan, X.H., 2007. Chapter 25. The carp farming industry in China– an overview.In: Leung, P.S., Lee, C.S., O'Bryen, P.J. (Eds.), Species and System Selection for SustainableAquaculture. Wiley-Blackwell, pp. 373–387. pp528.
Mulder, H.A., Veerkamp, R.F., Ducro, B.J., van Arendonk, J.A.M., Bijma, P., 2006. Optimizationof dairy cattle breeding programs for different environments with genotype by envi-ronment interaction. J. Dairy Sci. 89, 1740–1752.
Pante, M.J.R., Gjerde, B., McMillan, I., 2001. Effect of inbreeding on body weight at harvestin rainbow trout, Oncorhynchus mykiss. Aquaculture 192, 201–211.
Ponzoni, R.W., Hamzah, A.B., Saadiah, S.T., Kamaruzzaman, N., 2003. Phenotypic andgeneticparameters for live weight in two environemts in a selected line of Nile tilapia inMalaysia. International Association for Genetics in Aquaculture, Genetics inAquaculture VIII, pp. 9–15. November 2003:83, Puerto Varas, Chile.
Ponzoni, R.W., Hamzah, A.B., Saadiah, T., Norhidayat, K., 2005. Genetic parameters andresponse to selection for live weight in the GIFT strain of Nile Tilapia (Oreochromisniloticus). Aquaculture 247, 203–210.
Ponzoni, R.W., Nguyen, N.H., Khaw, H.L., 2007. Investment appraisal of genetic improvementprograms in Nile Tilapia (Oreochromis niloticus). Aquaculture 269, 187–199.
Ponzoni, R.W., Khaw, H.L., Nguyen, H.N., Hamzah, A., 2010. Inbreeding and effective popula-tion size in theMalaysian nucleus of theGIFT strain of Nile tilapia (Oreochromis niloticus).Aquaculture 302, 42–48.
RDevelopment Core Team, 2011. R: A Language andEnvironment for Statistical Computing.R Foundation for Statistical Computing, Vienna, Austria. 3-900051-07-0, URL http://www.R-project.org.
Rezk,M.A., Ponzoni, R.W., Khaw,H.L., Kamel, E., Dawood, T., John, J., 2009. Selectivebreedingfor increased body weight in a synthetic breed of Egyptian Nile tilapia, Oreochromisniloticus: response to selection and genetic parameters. Aquaculture 293, 187–194.
Robertson, A., 1959. The sampling variance of the genetic correlation coefficient. Biometrics15, 469–485.

64 J. Thodesen (Da-Yong Ma) et al. / Aquaculture 322-323 (2011) 51–64
Rutten,M.J.M., Komen, H., Bovenhuis, H., 2005. Longitudinal genetic analysis of Nile tilapia(Oreochromis niloticus L.) bodyweight using a random regressionmodel. Aquaculture246, 101–113.
Rye, M., Gjedrem, T., 2005. Chapter 15 Measuring genetic change. In: Gjedrem, T. (Ed.),Selection and Breeding Programs in Aquaculture. Springer, The Netherlands,pp. 243–250. 364 pp.
Skagemo, V., Sonesson, A.K., Meuwissen, T.H.E., Rye, M., 2010. Increased profits inaquaculture through optimized dissemination schemes. Aquaculture 300, 65–72.
Sonesson, A.K., Woolliams, J.A., Meuwissen, T.H.E., 2005. Chapter 6. Kinship, relationshipand inbreeding. In: Gjedrem, T. (Ed.), Selection and Breeding Programs in Aquaculture.Springer, The Netherlands, pp. 73–88. 364 pp.
Su, G.-S., Liljedahl, L.-E., Gall, G.A.E., 1996. Effects of inbreeding on growth and reproductivetraits in rainbow trout (Oncorhynchus mykiss). Aquaculture 142, 139–148.
Tave, D., Smitherman, R.O., 1980. Predicted response to selection for early growth in Tilapianilotica. Trans. Am. Fish. Soc. 109, 439–445.
Teichert-Coddington, D.R., Smitherman, R.O., 1988. Lack of response by T. nilotica tomass selection for rapid early growth. Trans. Am. Fish. Soc. 117, 297–300.
Thodesen, J., Grisdale-Helland, B., Helland, S., Gjerde, B., 1999. Feed intake, growth andfeed utilization of offspring from wild and selected Atlantic salmon (Salmo salar).Aquaculture 180, 237–246.
Thodesen, J. (Ma, D.Y.), Hu, H.L., Kong, J., 2005. Inbreeding and its impact on aquacul-ture. Journal of Fisheries of China 29, 849–856 (in Chinese, abstract in English).
Villanueva, B., Woolliams, J.A., 1997. Optimization of breeding programmes underindex selection and constrained inbreeding. Genet. Res. Camb. 69, 145–158.
Watanabe, W.O., Kuo, C.M., 1985. Observations on the reproductive performance of Niletilapia (Oreochromis niloticus) in laboratory aquaria at various salinities. Aquaculture49, 315–323.
WorldFish Center, 2004. GIFT Technology Manual: An Aid to Tilapia Selective Breeding.WorldFish Center, Penang, Malaysia. 56 pp.
Zhao, J.L., 2011. Tilapia germplasm in China: chance and challenge. In: Liu, L.P., Fitzsimmons,K. (Eds.), Proceedings of the 9th International Symposium on Tilapia in Aquaculture.Shanghai, pp. 217–221. 409 pp.
Related Documents