Genetic History of Southeast Asian Populations as Revealed by Ancient and Modern Human Mitochondrial DNA Analysis Patcharee Lertrit, 1 * Samerchai Poolsuwan, 2 Rachanie Thosarat, 3 Thitima Sanpachudayan, 1 Hathaichanoke Boonyarit, 1 Chatchai Chinpaisal, 4 and Bhoom Suktitipat 1 1 Department of Biochemistry, Faculty of Medicine, Mahidol University, Bangkok 10700, Thailand 2 Faculty of Sociology and Anthropology, Thammasat University, Bangkok 10200, Thailand 3 Office of Archaeology, Thai Fine Arts Department, Bangkok 10200, Thailand 4 Department of Pharmacology and Toxicology, Silpakorn University, Nakhonpathom 73000, Thailand KEY WORDS ancient mtDNA; migration history; Southeast Asian ABSTRACT The 360 base-pair fragment in HVS-1 of the mitochondrial genome were determined from ancient human remains excavated at Noen U-loke and Ban Lum- Khao, two Bronze and Iron Age archaeological sites in Northeastern Thailand, radio-carbon dated to circa 3,500– 1,500 years BP and 3,200–2,400 years BP, respectively. These two neighboring populations were parts of early ag- ricultural communities prevailing in northeastern Thailand from the fourth millennium BP onwards. The nucleotide sequences of these ancient samples were compared with the sequences of modern samples from various ethnic pop- ulations of East and Southeast Asia, encompassing four major linguistic affiliations (Altaic, Sino-Tibetan, Tai- Kadai, and Austroasiatic), to investigate the genetic rela- tionships and history among them. The two ancient sam- ples were most closely related to each other, and next most closely related to the Chao-Bon, an Austroasiatic-speaking group living near the archaeological sites, suggesting that the genetic continuum may have persisted since prehistoric times in situ among the native, perhaps Austroasiatic- speaking population. Tai-Kadai groups formed close affin- ities among themselves, with a tendency to be more closely related to other Southeast Asian populations than to popu- lations from further north. The Tai-Kadai groups were rel- atively distant from all groups that have presumably been in Southeast Asia for longer-that is, the two ancient groups and the Austroasiatic-speaking groups, with the exception of the Khmer group. This finding is compatible with the known history of the Thais: their late arrival in Southeast Asia from southern China after the 10th–11th century AD, followed by a period of subjugation under the Khmers. Am J Phys Anthropol 137:425–440, 2008. V V C 2008 Wiley-Liss, Inc. The early peopling of Southeast Asia has recently been a shared focus of archaeological, linguistic, and anthropo- logical-genetic investigations (for detailed reviews on this issue see: Jin et al., 2001; Sagart et al., 2005). Several major hypotheses have been advanced concerning the sig- nificance of this geographic area. One is that it may be an ancestral homeland of almost all present-day East Asian natives (Chu et al., 1998; Jin and Su, 2000; Su and Jin, 2001). Another is that, more recently, expanding popula- tions have moved into the area, in association with specific cultural and linguistic spreads, presumably from central or southern China (Renfrew, 1996; Bellwood, 2001, 2005; Higham, 2003; Blench, 2005; Lu, 2005). However in this area, patterns of cultural diffusion detected archaeologi- cally are not always congruent with current patterns of linguistic and genetic differentiation (Chu et al., 1998; Ding et al., 2000; Yao et al., 2002a; also see reviews in Sagart et al., 2005). This suggests that the formation of ethnic populations in the area was complicated both cul- turally and genetically. A number of causes of such dis- crepancies have been suggested, including language shifts and cultural diffusion, sometimes without population replacement or major expansion, and substantial popula- tion admixture (Ding et al., 2000; Wang, 2001; Lu, 2005). One major demographic question that naturally arises is whether contemporary ethnic populations of this geo- graphic area can be considered as direct descendants, in the genetic sense, of their ethnic and linguistic predeces- sors, thus validating the use of modern samples to repre- sent and trace the expansion of the presumed long-estab- lished ethnic populations. Without a thorough under- standing of the dynamics of genetic structures of ethnic populations since the distant past, this problem will remain unsolved. Employment of ancient human DNA analysis can partially resolve this serious problem con- cerning our understanding of recent human evolution in this geographic area. In this article, we provide an anal- ysis of ancient human mtDNA drawn from two neighbor- ing prehistoric populations in northeastern Thailand, spanning the period approximately between 3,500 and 1,500 BP, in the context of their spatial and temporal relationships with various contemporary ethnic popula- Additional Supporting Information may be found in the online version of this article. Grant sponsor: Siriraj Research and Development Fund, Faculty of Medicine Siriraj Hospital, Mahidol University; Grant number: 002(III)/48. *Correspondence to: Patcharee Lertrit, Department of Biochemis- try, Faculty of Medicine, Siriraj Hospital, Mahidol University, Bang- kok 10700, Thailand. E-mail: [email protected] and [email protected] Received 10 January 2007; accepted 28 April 2008 DOI 10.1002/ajpa.20884 Published online 9 July 2008 in Wiley InterScience (www.interscience.wiley.com). V V C 2008 WILEY-LISS, INC. AMERICAN JOURNAL OF PHYSICAL ANTHROPOLOGY 137:425–440 (2008)

Welcome message from author
This document is posted to help you gain knowledge. Please leave a comment to let me know what you think about it! Share it to your friends and learn new things together.
Transcript
Genetic History of Southeast Asian Populations asRevealed by Ancient and Modern Human MitochondrialDNA Analysis
Patcharee Lertrit,1* Samerchai Poolsuwan,2 Rachanie Thosarat,3 Thitima Sanpachudayan,1
Hathaichanoke Boonyarit,1 Chatchai Chinpaisal,4 and Bhoom Suktitipat1
1Department of Biochemistry, Faculty of Medicine, Mahidol University, Bangkok 10700, Thailand2Faculty of Sociology and Anthropology, Thammasat University, Bangkok 10200, Thailand3Office of Archaeology, Thai Fine Arts Department, Bangkok 10200, Thailand4Department of Pharmacology and Toxicology, Silpakorn University, Nakhonpathom 73000, Thailand
KEY WORDS ancient mtDNA; migration history; Southeast Asian
ABSTRACT The 360 base-pair fragment in HVS-1 ofthe mitochondrial genome were determined from ancienthuman remains excavated at Noen U-loke and Ban Lum-Khao, two Bronze and Iron Age archaeological sites inNortheastern Thailand, radio-carbon dated to circa 3,500–1,500 years BP and 3,200–2,400 years BP, respectively.These two neighboring populations were parts of early ag-ricultural communities prevailing in northeastern Thailandfrom the fourth millennium BP onwards. The nucleotidesequences of these ancient samples were compared withthe sequences of modern samples from various ethnic pop-ulations of East and Southeast Asia, encompassing fourmajor linguistic affiliations (Altaic, Sino-Tibetan, Tai-Kadai, and Austroasiatic), to investigate the genetic rela-tionships and history among them. The two ancient sam-ples were most closely related to each other, and next most
closely related to the Chao-Bon, an Austroasiatic-speakinggroup living near the archaeological sites, suggesting thatthe genetic continuum may have persisted since prehistorictimes in situ among the native, perhaps Austroasiatic-speaking population. Tai-Kadai groups formed close affin-ities among themselves, with a tendency to be more closelyrelated to other Southeast Asian populations than to popu-lations from further north. The Tai-Kadai groups were rel-atively distant from all groups that have presumably beenin Southeast Asia for longer-that is, the two ancient groupsand the Austroasiatic-speaking groups, with the exceptionof the Khmer group. This finding is compatible with theknown history of the Thais: their late arrival in SoutheastAsia from southern China after the 10th–11th century AD,followed by a period of subjugation under the Khmers. AmJ Phys Anthropol 137:425–440, 2008. VVC 2008 Wiley-Liss, Inc.
The early peopling of Southeast Asia has recently beena shared focus of archaeological, linguistic, and anthropo-logical-genetic investigations (for detailed reviews on thisissue see: Jin et al., 2001; Sagart et al., 2005). Severalmajor hypotheses have been advanced concerning the sig-nificance of this geographic area. One is that it may be anancestral homeland of almost all present-day East Asiannatives (Chu et al., 1998; Jin and Su, 2000; Su and Jin,2001). Another is that, more recently, expanding popula-tions have moved into the area, in association with specificcultural and linguistic spreads, presumably from centralor southern China (Renfrew, 1996; Bellwood, 2001, 2005;Higham, 2003; Blench, 2005; Lu, 2005). However in thisarea, patterns of cultural diffusion detected archaeologi-cally are not always congruent with current patterns oflinguistic and genetic differentiation (Chu et al., 1998;Ding et al., 2000; Yao et al., 2002a; also see reviews inSagart et al., 2005). This suggests that the formation ofethnic populations in the area was complicated both cul-turally and genetically. A number of causes of such dis-crepancies have been suggested, including language shiftsand cultural diffusion, sometimes without populationreplacement or major expansion, and substantial popula-tion admixture (Ding et al., 2000; Wang, 2001; Lu, 2005).One major demographic question that naturally arises
is whether contemporary ethnic populations of this geo-graphic area can be considered as direct descendants, inthe genetic sense, of their ethnic and linguistic predeces-sors, thus validating the use of modern samples to repre-sent and trace the expansion of the presumed long-estab-
lished ethnic populations. Without a thorough under-standing of the dynamics of genetic structures of ethnicpopulations since the distant past, this problem willremain unsolved. Employment of ancient human DNAanalysis can partially resolve this serious problem con-cerning our understanding of recent human evolution inthis geographic area. In this article, we provide an anal-ysis of ancient human mtDNA drawn from two neighbor-ing prehistoric populations in northeastern Thailand,spanning the period approximately between 3,500 and1,500 BP, in the context of their spatial and temporalrelationships with various contemporary ethnic popula-
Additional Supporting Information may be found in the onlineversion of this article.
Grant sponsor: Siriraj Research and Development Fund, Facultyof Medicine Siriraj Hospital, Mahidol University; Grant number:002(III)/48.
*Correspondence to: Patcharee Lertrit, Department of Biochemis-try, Faculty of Medicine, Siriraj Hospital, Mahidol University, Bang-kok 10700, Thailand.E-mail: [email protected] and [email protected]
Received 10 January 2007; accepted 28 April 2008
DOI 10.1002/ajpa.20884Published online 9 July 2008 in Wiley InterScience
(www.interscience.wiley.com).
VVC 2008 WILEY-LISS, INC.
AMERICAN JOURNAL OF PHYSICAL ANTHROPOLOGY 137:425–440 (2008)
tions of East and Southeast Asia. An attempt was alsomade to provide more insight into the complex demo-graphic dynamics of Southeast Asian populations, partic-ularly Austroasiatic and Thai speakers.
MATERIALS AND METHODS
Ancient samples
Two ancient populations from the Noen U-loke andBan Lum-Khao archaeological sites were selected for
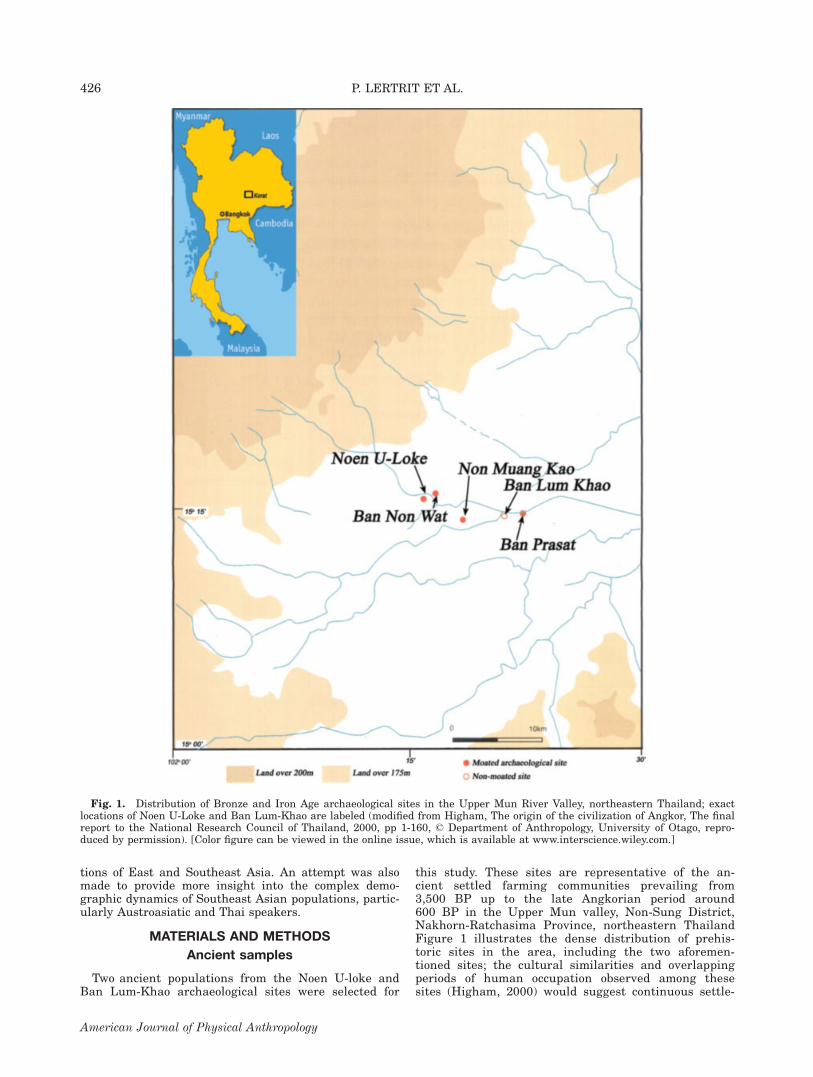
this study. These sites are representative of the an-cient settled farming communities prevailing from3,500 BP up to the late Angkorian period around600 BP in the Upper Mun valley, Non-Sung District,Nakhorn-Ratchasima Province, northeastern ThailandFigure 1 illustrates the dense distribution of prehis-toric sites in the area, including the two aforemen-tioned sites; the cultural similarities and overlappingperiods of human occupation observed among thesesites (Higham, 2000) would suggest continuous settle-
Fig. 1. Distribution of Bronze and Iron Age archaeological sites in the Upper Mun River Valley, northeastern Thailand; exactlocations of Noen U-Loke and Ban Lum-Khao are labeled (modified from Higham, The origin of the civilization of Angkor, The finalreport to the National Research Council of Thailand, 2000, pp 1-160, ' Department of Anthropology, University of Otago, repro-duced by permission). [Color figure can be viewed in the online issue, which is available at www.interscience.wiley.com.]
426 P. LERTRIT ET AL.
American Journal of Physical Anthropology
ment of probably related groups of prehistoric peoplein the area.Excavations at both sites were conducted under collab-
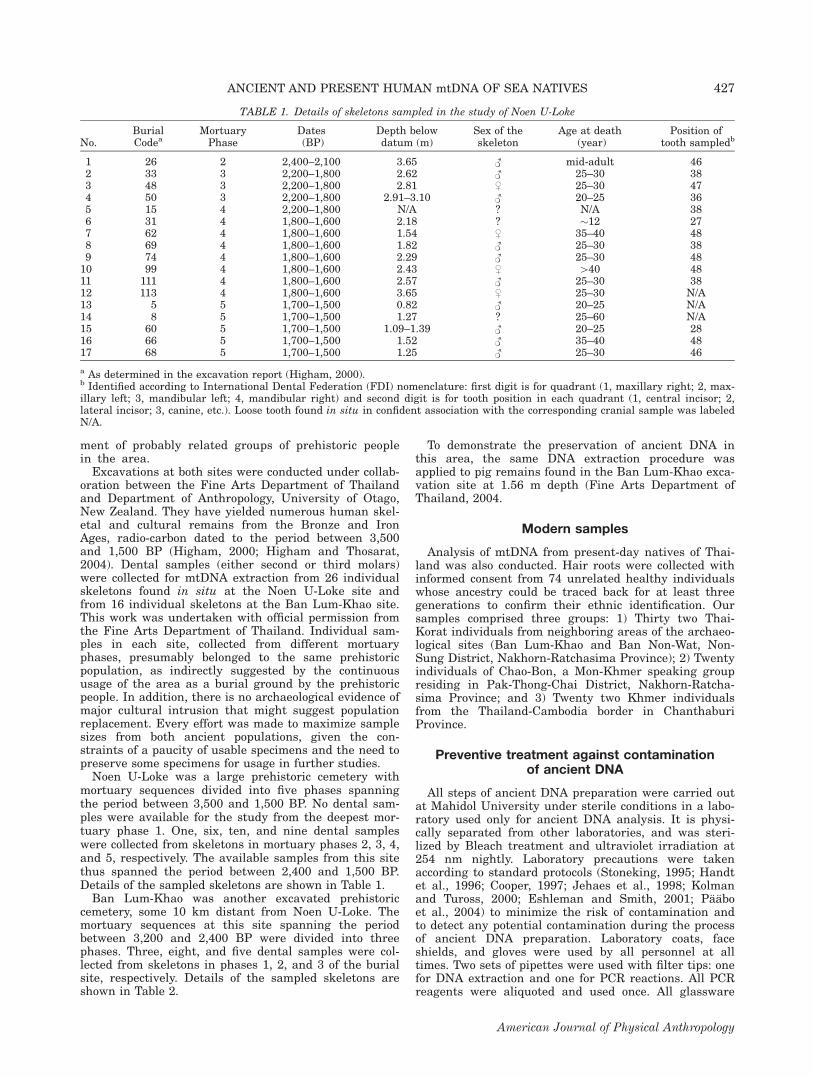
oration between the Fine Arts Department of Thailandand Department of Anthropology, University of Otago,New Zealand. They have yielded numerous human skel-etal and cultural remains from the Bronze and IronAges, radio-carbon dated to the period between 3,500and 1,500 BP (Higham, 2000; Higham and Thosarat,2004). Dental samples (either second or third molars)were collected for mtDNA extraction from 26 individualskeletons found in situ at the Noen U-Loke site andfrom 16 individual skeletons at the Ban Lum-Khao site.This work was undertaken with official permission fromthe Fine Arts Department of Thailand. Individual sam-ples in each site, collected from different mortuaryphases, presumably belonged to the same prehistoricpopulation, as indirectly suggested by the continuoususage of the area as a burial ground by the prehistoricpeople. In addition, there is no archaeological evidence ofmajor cultural intrusion that might suggest populationreplacement. Every effort was made to maximize samplesizes from both ancient populations, given the con-straints of a paucity of usable specimens and the need topreserve some specimens for usage in further studies.Noen U-Loke was a large prehistoric cemetery with
mortuary sequences divided into five phases spanningthe period between 3,500 and 1,500 BP. No dental sam-ples were available for the study from the deepest mor-tuary phase 1. One, six, ten, and nine dental sampleswere collected from skeletons in mortuary phases 2, 3, 4,and 5, respectively. The available samples from this sitethus spanned the period between 2,400 and 1,500 BP.Details of the sampled skeletons are shown in Table 1.Ban Lum-Khao was another excavated prehistoric
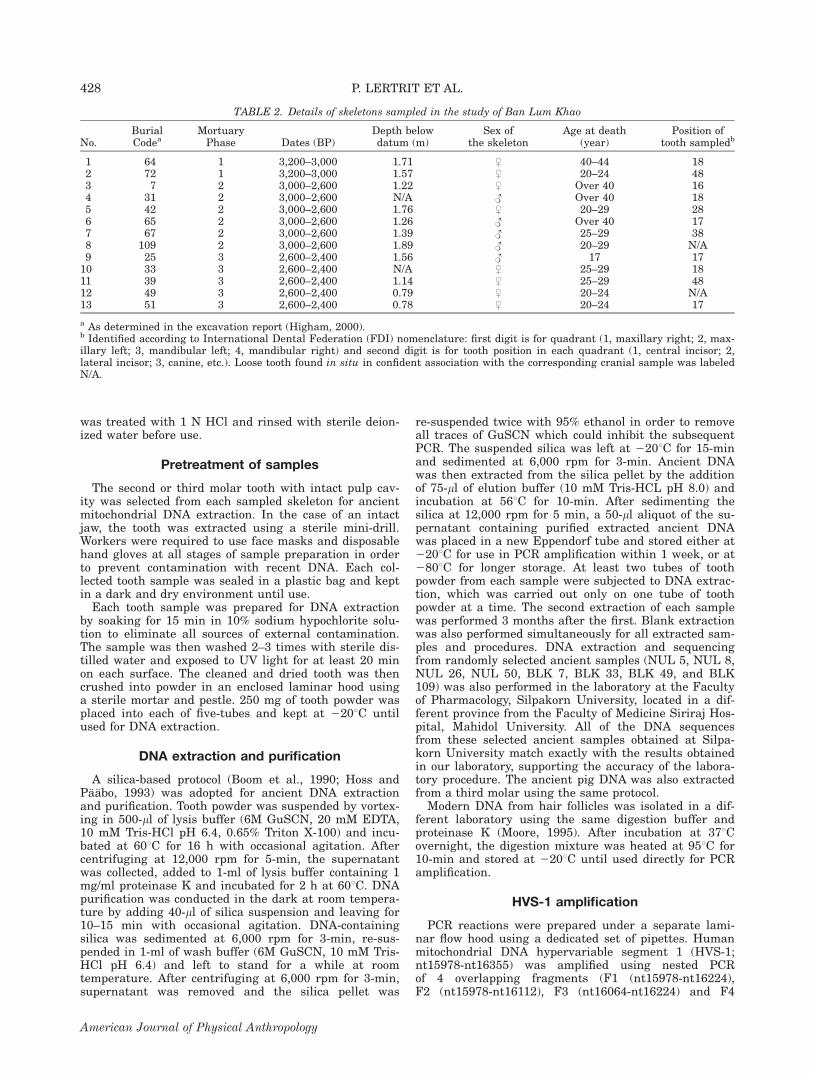
cemetery, some 10 km distant from Noen U-Loke. Themortuary sequences at this site spanning the periodbetween 3,200 and 2,400 BP were divided into threephases. Three, eight, and five dental samples were col-lected from skeletons in phases 1, 2, and 3 of the burialsite, respectively. Details of the sampled skeletons areshown in Table 2.
To demonstrate the preservation of ancient DNA inthis area, the same DNA extraction procedure wasapplied to pig remains found in the Ban Lum-Khao exca-vation site at 1.56 m depth (Fine Arts Department ofThailand, 2004.
Modern samples
Analysis of mtDNA from present-day natives of Thai-land was also conducted. Hair roots were collected withinformed consent from 74 unrelated healthy individualswhose ancestry could be traced back for at least threegenerations to confirm their ethnic identification. Oursamples comprised three groups: 1) Thirty two Thai-Korat individuals from neighboring areas of the archaeo-logical sites (Ban Lum-Khao and Ban Non-Wat, Non-Sung District, Nakhorn-Ratchasima Province); 2) Twentyindividuals of Chao-Bon, a Mon-Khmer speaking groupresiding in Pak-Thong-Chai District, Nakhorn-Ratcha-sima Province; and 3) Twenty two Khmer individualsfrom the Thailand-Cambodia border in ChanthaburiProvince.
Preventive treatment against contaminationof ancient DNA
All steps of ancient DNA preparation were carried outat Mahidol University under sterile conditions in a labo-ratory used only for ancient DNA analysis. It is physi-cally separated from other laboratories, and was steri-lized by Bleach treatment and ultraviolet irradiation at254 nm nightly. Laboratory precautions were takenaccording to standard protocols (Stoneking, 1995; Handtet al., 1996; Cooper, 1997; Jehaes et al., 1998; Kolmanand Tuross, 2000; Eshleman and Smith, 2001; Paaboet al., 2004) to minimize the risk of contamination andto detect any potential contamination during the processof ancient DNA preparation. Laboratory coats, faceshields, and gloves were used by all personnel at alltimes. Two sets of pipettes were used with filter tips: onefor DNA extraction and one for PCR reactions. All PCRreagents were aliquoted and used once. All glassware
TABLE 1. Details of skeletons sampled in the study of Noen U-Loke
No.BurialCodea
MortuaryPhase
Dates(BP)
Depth belowdatum (m)
Sex of theskeleton
Age at death(year)
Position oftooth sampledb
1 26 2 2,400–2,100 3.65 # mid-adult 462 33 3 2,200–1,800 2.62 # 25–30 383 48 3 2,200–1,800 2.81 $ 25–30 474 50 3 2,200–1,800 2.91–3.10 # 20–25 365 15 4 2,200–1,800 N/A ? N/A 386 31 4 1,800–1,600 2.18 ? �12 277 62 4 1,800–1,600 1.54 $ 35–40 488 69 4 1,800–1,600 1.82 # 25–30 389 74 4 1,800–1,600 2.29 # 25–30 4810 99 4 1,800–1,600 2.43 $ [40 4811 111 4 1,800–1,600 2.57 # 25–30 3812 113 4 1,800–1,600 3.65 $ 25–30 N/A13 5 5 1,700–1,500 0.82 # 20–25 N/A14 8 5 1,700–1,500 1.27 ? 25–60 N/A15 60 5 1,700–1,500 1.09–1.39 # 20–25 2816 66 5 1,700–1,500 1.52 # 35–40 4817 68 5 1,700–1,500 1.25 # 25–30 46
a As determined in the excavation report (Higham, 2000).b Identified according to International Dental Federation (FDI) nomenclature: first digit is for quadrant (1, maxillary right; 2, max-illary left; 3, mandibular left; 4, mandibular right) and second digit is for tooth position in each quadrant (1, central incisor; 2,lateral incisor; 3, canine, etc.). Loose tooth found in situ in confident association with the corresponding cranial sample was labeledN/A.
427ANCIENT AND PRESENT HUMAN mtDNA OF SEA NATIVES
American Journal of Physical Anthropology
was treated with 1 N HCl and rinsed with sterile deion-ized water before use.
Pretreatment of samples
The second or third molar tooth with intact pulp cav-ity was selected from each sampled skeleton for ancientmitochondrial DNA extraction. In the case of an intactjaw, the tooth was extracted using a sterile mini-drill.Workers were required to use face masks and disposablehand gloves at all stages of sample preparation in orderto prevent contamination with recent DNA. Each col-lected tooth sample was sealed in a plastic bag and keptin a dark and dry environment until use.Each tooth sample was prepared for DNA extraction
by soaking for 15 min in 10% sodium hypochlorite solu-tion to eliminate all sources of external contamination.The sample was then washed 2–3 times with sterile dis-tilled water and exposed to UV light for at least 20 minon each surface. The cleaned and dried tooth was thencrushed into powder in an enclosed laminar hood usinga sterile mortar and pestle. 250 mg of tooth powder wasplaced into each of five-tubes and kept at 2208C untilused for DNA extraction.
DNA extraction and purification
A silica-based protocol (Boom et al., 1990; Hoss andPaabo, 1993) was adopted for ancient DNA extractionand purification. Tooth powder was suspended by vortex-ing in 500-ll of lysis buffer (6M GuSCN, 20 mM EDTA,10 mM Tris-HCl pH 6.4, 0.65% Triton X-100) and incu-bated at 608C for 16 h with occasional agitation. Aftercentrifuging at 12,000 rpm for 5-min, the supernatantwas collected, added to 1-ml of lysis buffer containing 1mg/ml proteinase K and incubated for 2 h at 608C. DNApurification was conducted in the dark at room tempera-ture by adding 40-ll of silica suspension and leaving for10–15 min with occasional agitation. DNA-containingsilica was sedimented at 6,000 rpm for 3-min, re-sus-pended in 1-ml of wash buffer (6M GuSCN, 10 mM Tris-HCl pH 6.4) and left to stand for a while at roomtemperature. After centrifuging at 6,000 rpm for 3-min,supernatant was removed and the silica pellet was
re-suspended twice with 95% ethanol in order to removeall traces of GuSCN which could inhibit the subsequentPCR. The suspended silica was left at 2208C for 15-minand sedimented at 6,000 rpm for 3-min. Ancient DNAwas then extracted from the silica pellet by the additionof 75-ll of elution buffer (10 mM Tris-HCL pH 8.0) andincubation at 568C for 10-min. After sedimenting thesilica at 12,000 rpm for 5 min, a 50-ll aliquot of the su-pernatant containing purified extracted ancient DNAwas placed in a new Eppendorf tube and stored either at2208C for use in PCR amplification within 1 week, or at2808C for longer storage. At least two tubes of toothpowder from each sample were subjected to DNA extrac-tion, which was carried out only on one tube of toothpowder at a time. The second extraction of each samplewas performed 3 months after the first. Blank extractionwas also performed simultaneously for all extracted sam-ples and procedures. DNA extraction and sequencingfrom randomly selected ancient samples (NUL 5, NUL 8,NUL 26, NUL 50, BLK 7, BLK 33, BLK 49, and BLK109) was also performed in the laboratory at the Facultyof Pharmacology, Silpakorn University, located in a dif-ferent province from the Faculty of Medicine Siriraj Hos-pital, Mahidol University. All of the DNA sequencesfrom these selected ancient samples obtained at Silpa-korn University match exactly with the results obtainedin our laboratory, supporting the accuracy of the labora-tory procedure. The ancient pig DNA was also extractedfrom a third molar using the same protocol.Modern DNA from hair follicles was isolated in a dif-
ferent laboratory using the same digestion buffer andproteinase K (Moore, 1995). After incubation at 378Covernight, the digestion mixture was heated at 958C for10-min and stored at 2208C until used directly for PCRamplification.
HVS-1 amplification
PCR reactions were prepared under a separate lami-nar flow hood using a dedicated set of pipettes. Humanmitochondrial DNA hypervariable segment 1 (HVS-1;nt15978-nt16355) was amplified using nested PCRof 4 overlapping fragments (F1 (nt15978-nt16224),F2 (nt15978-nt16112), F3 (nt16064-nt16224) and F4
TABLE 2. Details of skeletons sampled in the study of Ban Lum Khao
No.BurialCodea
MortuaryPhase Dates (BP)
Depth belowdatum (m)
Sex ofthe skeleton
Age at death(year)
Position oftooth sampledb
1 64 1 3,200–3,000 1.71 $ 40–44 182 72 1 3,200–3,000 1.57 $ 20–24 483 7 2 3,000–2,600 1.22 $ Over 40 164 31 2 3,000–2,600 N/A # Over 40 185 42 2 3,000–2,600 1.76 $ 20–29 286 65 2 3,000–2,600 1.26 # Over 40 177 67 2 3,000–2,600 1.39 # 25–29 388 109 2 3,000–2,600 1.89 # 20–29 N/A9 25 3 2,600–2,400 1.56 # 17 1710 33 3 2,600–2,400 N/A $ 25–29 1811 39 3 2,600–2,400 1.14 $ 25–29 4812 49 3 2,600–2,400 0.79 $ 20–24 N/A13 51 3 2,600–2,400 0.78 $ 20–24 17
a As determined in the excavation report (Higham, 2000).b Identified according to International Dental Federation (FDI) nomenclature: first digit is for quadrant (1, maxillary right; 2, max-illary left; 3, mandibular left; 4, mandibular right) and second digit is for tooth position in each quadrant (1, central incisor; 2,lateral incisor; 3, canine, etc.). Loose tooth found in situ in confident association with the corresponding cranial sample was labeledN/A.
428 P. LERTRIT ET AL.
American Journal of Physical Anthropology
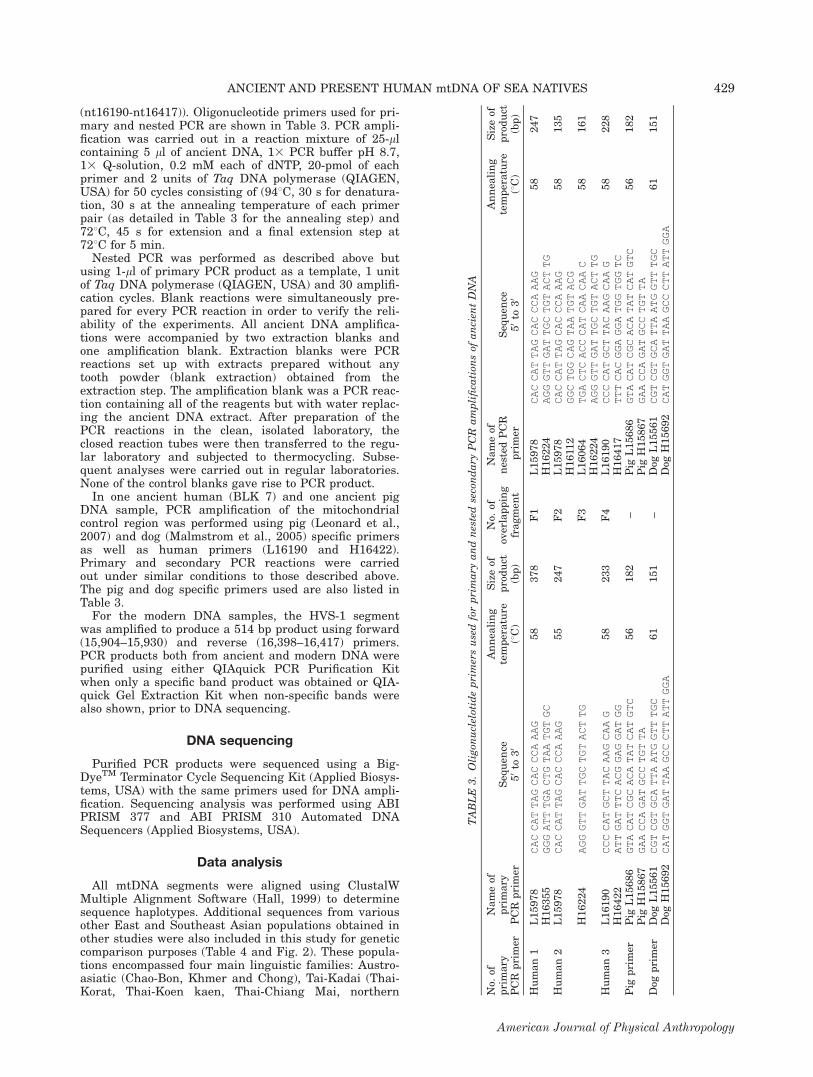
(nt16190-nt16417)). Oligonucleotide primers used for pri-mary and nested PCR are shown in Table 3. PCR ampli-fication was carried out in a reaction mixture of 25-llcontaining 5 ll of ancient DNA, 13 PCR buffer pH 8.7,13 Q-solution, 0.2 mM each of dNTP, 20-pmol of eachprimer and 2 units of Taq DNA polymerase (QIAGEN,USA) for 50 cycles consisting of (948C, 30 s for denatura-tion, 30 s at the annealing temperature of each primerpair (as detailed in Table 3 for the annealing step) and728C, 45 s for extension and a final extension step at728C for 5 min.Nested PCR was performed as described above but
using 1-ll of primary PCR product as a template, 1 unitof Taq DNA polymerase (QIAGEN, USA) and 30 amplifi-cation cycles. Blank reactions were simultaneously pre-pared for every PCR reaction in order to verify the reli-ability of the experiments. All ancient DNA amplifica-tions were accompanied by two extraction blanks andone amplification blank. Extraction blanks were PCRreactions set up with extracts prepared without anytooth powder (blank extraction) obtained from theextraction step. The amplification blank was a PCR reac-tion containing all of the reagents but with water replac-ing the ancient DNA extract. After preparation of thePCR reactions in the clean, isolated laboratory, theclosed reaction tubes were then transferred to the regu-lar laboratory and subjected to thermocycling. Subse-quent analyses were carried out in regular laboratories.None of the control blanks gave rise to PCR product.In one ancient human (BLK 7) and one ancient pig
DNA sample, PCR amplification of the mitochondrialcontrol region was performed using pig (Leonard et al.,2007) and dog (Malmstrom et al., 2005) specific primersas well as human primers (L16190 and H16422).Primary and secondary PCR reactions were carriedout under similar conditions to those described above.The pig and dog specific primers used are also listed inTable 3.For the modern DNA samples, the HVS-1 segment
was amplified to produce a 514 bp product using forward(15,904–15,930) and reverse (16,398–16,417) primers.PCR products both from ancient and modern DNA werepurified using either QIAquick PCR Purification Kitwhen only a specific band product was obtained or QIA-quick Gel Extraction Kit when non-specific bands werealso shown, prior to DNA sequencing.
DNA sequencing
Purified PCR products were sequenced using a Big-DyeTM Terminator Cycle Sequencing Kit (Applied Biosys-tems, USA) with the same primers used for DNA ampli-fication. Sequencing analysis was performed using ABIPRISM 377 and ABI PRISM 310 Automated DNASequencers (Applied Biosystems, USA).
Data analysis
All mtDNA segments were aligned using ClustalWMultiple Alignment Software (Hall, 1999) to determinesequence haplotypes. Additional sequences from variousother East and Southeast Asian populations obtained inother studies were also included in this study for geneticcomparison purposes (Table 4 and Fig. 2). These popula-tions encompassed four main linguistic families: Austro-asiatic (Chao-Bon, Khmer and Chong), Tai-Kadai (Thai-Korat, Thai-Koen kaen, Thai-Chiang Mai, northern
TABLE
3.Oligon
uclelotideprimersusedforprimary
andnestedsecondary
PCR
amplifica
tion
sof
ancien
tDNA
No.
ofprimary
PCR
primer
Nameof
primary
PCR
primer
Seq
uen
ce50 to30
Annea
ling
temperature
(8C)
Sizeof
product
(bp)
No.
ofov
erlapping
fragmen
t
Nameof
nestedPCR
primer
Seq
uen
ce50 to30
Annea
ling
temperature
(8C)
Sizeof
product
(bp)
Human1
L15978
CACCATTAGCACCCAAAG
58
378
F1
L15978
CACCATTAGCACCCAAAG
58
247
H16355
GGGATTTGACTGTAATGTGC
H16224
AGGGTTGATTGCTGTACTTG
Human2
L15978
CACCATTAGCACCCAAAG
55
247
F2
L15978
CACCATTAGCACCCAAAG
58
135
H1611
2GGCTGGCAGTAATGTACG
H16224
AGGGTTGATTGCTGTACTTG
F3
L16064
TGACTCACCCATCAACAAC
58
161
H16224
AGGGTTGATTGCTGTACTTG
Human3
L16190
CCCCATGCTTACAAGCAAG
58
233
F4
L16190
CCCCATGCTTACAAGCAAG
58
228
H16422
ATTGATTTCACGGAGGATGG
H16417
TTTCACGGAGGATGGTGGTC
Pig
primer
Pig
L15686
GTACATCGCACATATCATGTC
56
182
–Pig
L15686
GTACATCGCACATATCATGTC
56
182
Pig
H15867
GAACCAGATGCCTGTTA
Pig
H15867
GAACCAGATGCCTGTTA
Dog
primer
Dog
L15561
CGTCGTGCATTAATGGTTTGC
61
151
–Dog
L15561
CGTCGTGCATTAATGGTTTGC
61
151
Dog
H15692
CATGGTGATTAAGCCCTTATTGGA
Dog
H15692
CATGGTGATTAAGCCCTTATTGGA
429ANCIENT AND PRESENT HUMAN mtDNA OF SEA NATIVES
American Journal of Physical Anthropology
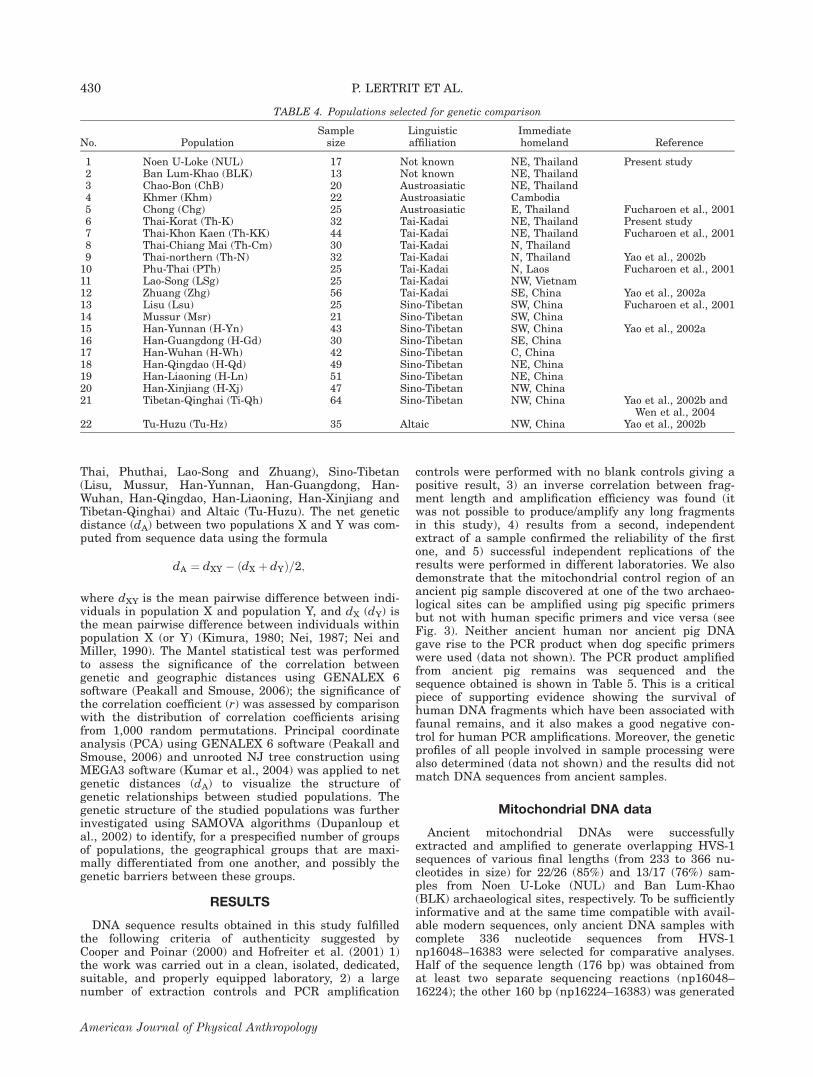
Thai, Phuthai, Lao-Song and Zhuang), Sino-Tibetan(Lisu, Mussur, Han-Yunnan, Han-Guangdong, Han-Wuhan, Han-Qingdao, Han-Liaoning, Han-Xinjiang andTibetan-Qinghai) and Altaic (Tu-Huzu). The net geneticdistance (dA) between two populations X and Y was com-puted from sequence data using the formula
dA ¼ dXY � ðdX þ dYÞ=2;
where dXY is the mean pairwise difference between indi-viduals in population X and population Y, and dX (dY) isthe mean pairwise difference between individuals withinpopulation X (or Y) (Kimura, 1980; Nei, 1987; Nei andMiller, 1990). The Mantel statistical test was performedto assess the significance of the correlation betweengenetic and geographic distances using GENALEX 6software (Peakall and Smouse, 2006); the significance ofthe correlation coefficient (r) was assessed by comparisonwith the distribution of correlation coefficients arisingfrom 1,000 random permutations. Principal coordinateanalysis (PCA) using GENALEX 6 software (Peakall andSmouse, 2006) and unrooted NJ tree construction usingMEGA3 software (Kumar et al., 2004) was applied to netgenetic distances (dA) to visualize the structure ofgenetic relationships between studied populations. Thegenetic structure of the studied populations was furtherinvestigated using SAMOVA algorithms (Dupanloup etal., 2002) to identify, for a prespecified number of groupsof populations, the geographical groups that are maxi-mally differentiated from one another, and possibly thegenetic barriers between these groups.
RESULTS
DNA sequence results obtained in this study fulfilledthe following criteria of authenticity suggested byCooper and Poinar (2000) and Hofreiter et al. (2001) 1)the work was carried out in a clean, isolated, dedicated,suitable, and properly equipped laboratory, 2) a largenumber of extraction controls and PCR amplification
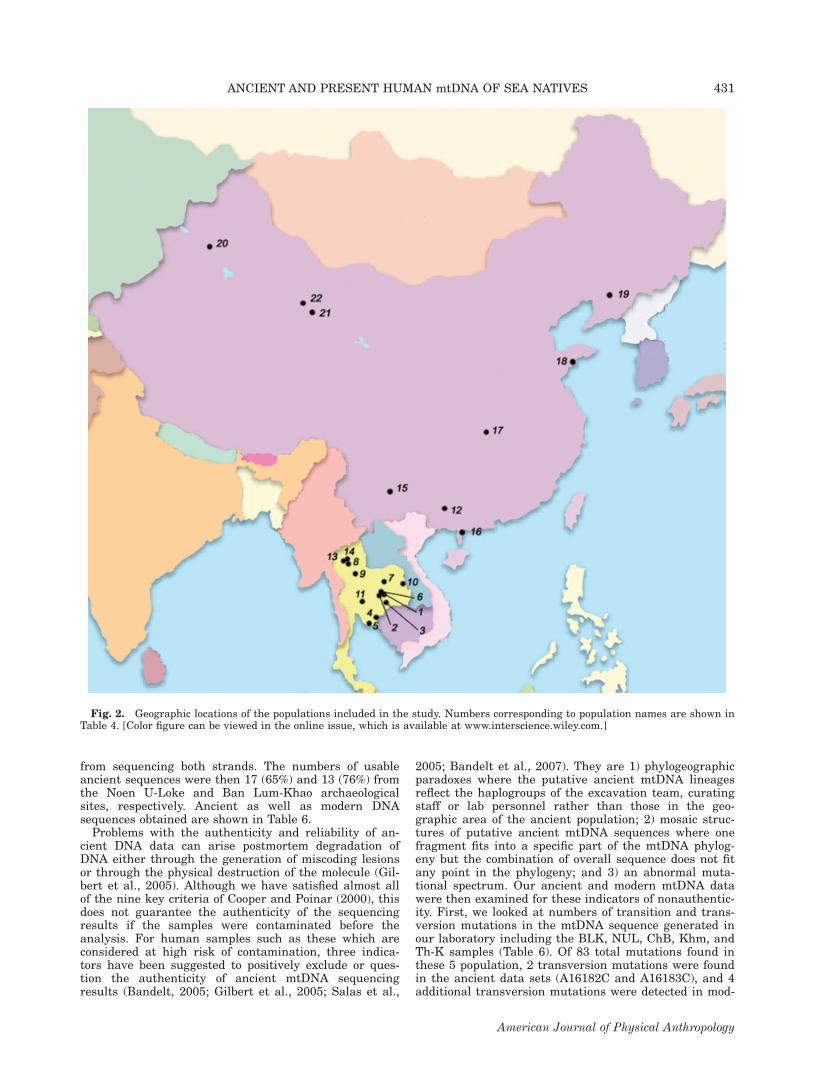
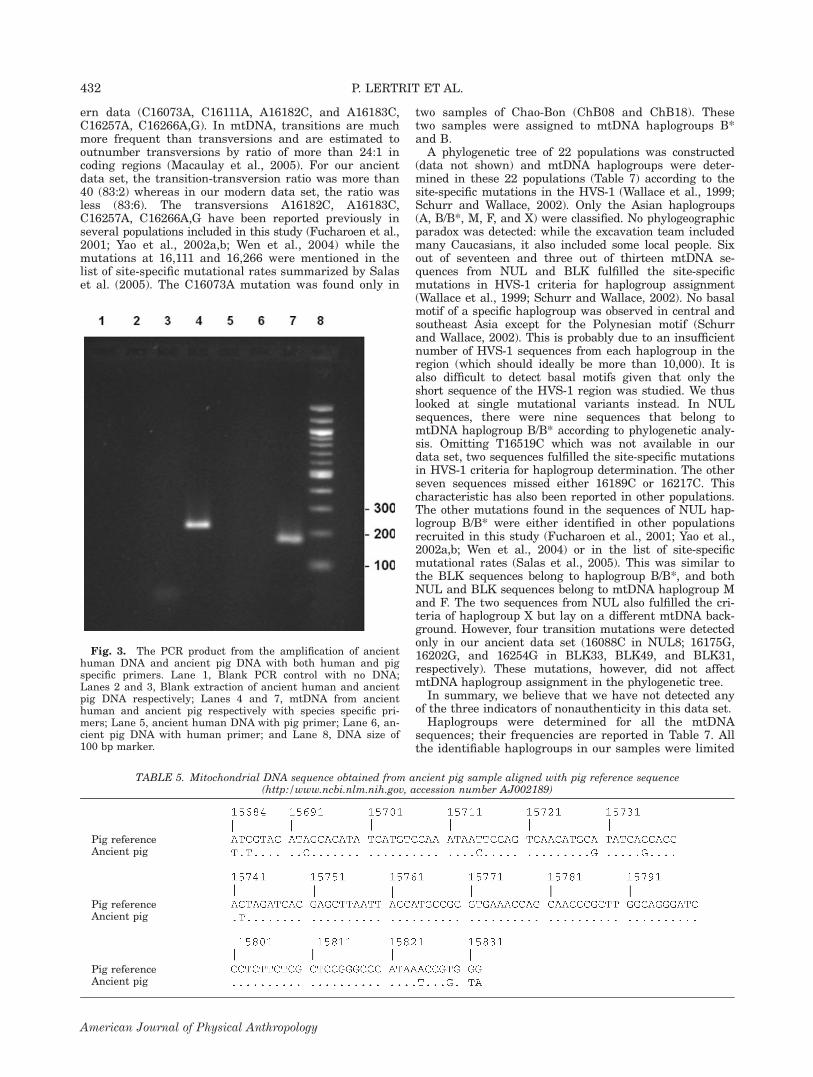
controls were performed with no blank controls giving apositive result, 3) an inverse correlation between frag-ment length and amplification efficiency was found (itwas not possible to produce/amplify any long fragmentsin this study), 4) results from a second, independentextract of a sample confirmed the reliability of the firstone, and 5) successful independent replications of theresults were performed in different laboratories. We alsodemonstrate that the mitochondrial control region of anancient pig sample discovered at one of the two archaeo-logical sites can be amplified using pig specific primersbut not with human specific primers and vice versa (seeFig. 3). Neither ancient human nor ancient pig DNAgave rise to the PCR product when dog specific primerswere used (data not shown). The PCR product amplifiedfrom ancient pig remains was sequenced and thesequence obtained is shown in Table 5. This is a criticalpiece of supporting evidence showing the survival ofhuman DNA fragments which have been associated withfaunal remains, and it also makes a good negative con-trol for human PCR amplifications. Moreover, the geneticprofiles of all people involved in sample processing werealso determined (data not shown) and the results did notmatch DNA sequences from ancient samples.
Mitochondrial DNA data
Ancient mitochondrial DNAs were successfullyextracted and amplified to generate overlapping HVS-1sequences of various final lengths (from 233 to 366 nu-cleotides in size) for 22/26 (85%) and 13/17 (76%) sam-ples from Noen U-Loke (NUL) and Ban Lum-Khao(BLK) archaeological sites, respectively. To be sufficientlyinformative and at the same time compatible with avail-able modern sequences, only ancient DNA samples withcomplete 336 nucleotide sequences from HVS-1np16048–16383 were selected for comparative analyses.Half of the sequence length (176 bp) was obtained fromat least two separate sequencing reactions (np16048–16224); the other 160 bp (np16224–16383) was generated
TABLE 4. Populations selected for genetic comparison
No. PopulationSamplesize
Linguisticaffiliation
Immediatehomeland Reference
1 Noen U-Loke (NUL) 17 Not known NE, Thailand Present study2 Ban Lum-Khao (BLK) 13 Not known NE, Thailand3 Chao-Bon (ChB) 20 Austroasiatic NE, Thailand4 Khmer (Khm) 22 Austroasiatic Cambodia5 Chong (Chg) 25 Austroasiatic E, Thailand Fucharoen et al., 20016 Thai-Korat (Th-K) 32 Tai-Kadai NE, Thailand Present study7 Thai-Khon Kaen (Th-KK) 44 Tai-Kadai NE, Thailand Fucharoen et al., 20018 Thai-Chiang Mai (Th-Cm) 30 Tai-Kadai N, Thailand9 Thai-northern (Th-N) 32 Tai-Kadai N, Thailand Yao et al., 2002b10 Phu-Thai (PTh) 25 Tai-Kadai N, Laos Fucharoen et al., 200111 Lao-Song (LSg) 25 Tai-Kadai NW, Vietnam12 Zhuang (Zhg) 56 Tai-Kadai SE, China Yao et al., 2002a13 Lisu (Lsu) 25 Sino-Tibetan SW, China Fucharoen et al., 200114 Mussur (Msr) 21 Sino-Tibetan SW, China15 Han-Yunnan (H-Yn) 43 Sino-Tibetan SW, China Yao et al., 2002a16 Han-Guangdong (H-Gd) 30 Sino-Tibetan SE, China17 Han-Wuhan (H-Wh) 42 Sino-Tibetan C, China18 Han-Qingdao (H-Qd) 49 Sino-Tibetan NE, China19 Han-Liaoning (H-Ln) 51 Sino-Tibetan NE, China20 Han-Xinjiang (H-Xj) 47 Sino-Tibetan NW, China21 Tibetan-Qinghai (Ti-Qh) 64 Sino-Tibetan NW, China Yao et al., 2002b and
Wen et al., 200422 Tu-Huzu (Tu-Hz) 35 Altaic NW, China Yao et al., 2002b
430 P. LERTRIT ET AL.
American Journal of Physical Anthropology
from sequencing both strands. The numbers of usableancient sequences were then 17 (65%) and 13 (76%) fromthe Noen U-Loke and Ban Lum-Khao archaeologicalsites, respectively. Ancient as well as modern DNAsequences obtained are shown in Table 6.Problems with the authenticity and reliability of an-
cient DNA data can arise postmortem degradation ofDNA either through the generation of miscoding lesionsor through the physical destruction of the molecule (Gil-bert et al., 2005). Although we have satisfied almost allof the nine key criteria of Cooper and Poinar (2000), thisdoes not guarantee the authenticity of the sequencingresults if the samples were contaminated before theanalysis. For human samples such as these which areconsidered at high risk of contamination, three indica-tors have been suggested to positively exclude or ques-tion the authenticity of ancient mtDNA sequencingresults (Bandelt, 2005; Gilbert et al., 2005; Salas et al.,
2005; Bandelt et al., 2007). They are 1) phylogeographicparadoxes where the putative ancient mtDNA lineagesreflect the haplogroups of the excavation team, curatingstaff or lab personnel rather than those in the geo-graphic area of the ancient population; 2) mosaic struc-tures of putative ancient mtDNA sequences where onefragment fits into a specific part of the mtDNA phylog-eny but the combination of overall sequence does not fitany point in the phylogeny; and 3) an abnormal muta-tional spectrum. Our ancient and modern mtDNA datawere then examined for these indicators of nonauthentic-ity. First, we looked at numbers of transition and trans-version mutations in the mtDNA sequence generated inour laboratory including the BLK, NUL, ChB, Khm, andTh-K samples (Table 6). Of 83 total mutations found inthese 5 population, 2 transversion mutations were foundin the ancient data sets (A16182C and A16183C), and 4additional transversion mutations were detected in mod-
Fig. 2. Geographic locations of the populations included in the study. Numbers corresponding to population names are shown inTable 4. [Color figure can be viewed in the online issue, which is available at www.interscience.wiley.com.]
431ANCIENT AND PRESENT HUMAN mtDNA OF SEA NATIVES
American Journal of Physical Anthropology
ern data (C16073A, C16111A, A16182C, and A16183C,C16257A, C16266A,G). In mtDNA, transitions are muchmore frequent than transversions and are estimated tooutnumber transversions by ratio of more than 24:1 incoding regions (Macaulay et al., 2005). For our ancientdata set, the transition-transversion ratio was more than40 (83:2) whereas in our modern data set, the ratio wasless (83:6). The transversions A16182C, A16183C,C16257A, C16266A,G have been reported previously inseveral populations included in this study (Fucharoen et al.,2001; Yao et al., 2002a,b; Wen et al., 2004) while themutations at 16,111 and 16,266 were mentioned in thelist of site-specific mutational rates summarized by Salaset al. (2005). The C16073A mutation was found only in
two samples of Chao-Bon (ChB08 and ChB18). Thesetwo samples were assigned to mtDNA haplogroups B*and B.A phylogenetic tree of 22 populations was constructed
(data not shown) and mtDNA haplogroups were deter-mined in these 22 populations (Table 7) according to thesite-specific mutations in the HVS-1 (Wallace et al., 1999;Schurr and Wallace, 2002). Only the Asian haplogroups(A, B/B*, M, F, and X) were classified. No phylogeographicparadox was detected: while the excavation team includedmany Caucasians, it also included some local people. Sixout of seventeen and three out of thirteen mtDNA se-quences from NUL and BLK fulfilled the site-specificmutations in HVS-1 criteria for haplogroup assignment(Wallace et al., 1999; Schurr and Wallace, 2002). No basalmotif of a specific haplogroup was observed in central andsoutheast Asia except for the Polynesian motif (Schurrand Wallace, 2002). This is probably due to an insufficientnumber of HVS-1 sequences from each haplogroup in theregion (which should ideally be more than 10,000). It isalso difficult to detect basal motifs given that only theshort sequence of the HVS-1 region was studied. We thuslooked at single mutational variants instead. In NULsequences, there were nine sequences that belong tomtDNA haplogroup B/B* according to phylogenetic analy-sis. Omitting T16519C which was not available in ourdata set, two sequences fulfilled the site-specific mutationsin HVS-1 criteria for haplogroup determination. The otherseven sequences missed either 16189C or 16217C. Thischaracteristic has also been reported in other populations.The other mutations found in the sequences of NUL hap-logroup B/B* were either identified in other populationsrecruited in this study (Fucharoen et al., 2001; Yao et al.,2002a,b; Wen et al., 2004) or in the list of site-specificmutational rates (Salas et al., 2005). This was similar tothe BLK sequences belong to haplogroup B/B*, and bothNUL and BLK sequences belong to mtDNA haplogroup Mand F. The two sequences from NUL also fulfilled the cri-teria of haplogroup X but lay on a different mtDNA back-ground. However, four transition mutations were detectedonly in our ancient data set (16088C in NUL8; 16175G,16202G, and 16254G in BLK33, BLK49, and BLK31,respectively). These mutations, however, did not affectmtDNA haplogroup assignment in the phylogenetic tree.In summary, we believe that we have not detected any
of the three indicators of nonauthenticity in this data set.Haplogroups were determined for all the mtDNA
sequences; their frequencies are reported in Table 7. Allthe identifiable haplogroups in our samples were limited
Fig. 3. The PCR product from the amplification of ancienthuman DNA and ancient pig DNA with both human and pigspecific primers. Lane 1, Blank PCR control with no DNA;Lanes 2 and 3, Blank extraction of ancient human and ancientpig DNA respectively; Lanes 4 and 7, mtDNA from ancienthuman and ancient pig respectively with species specific pri-mers; Lane 5, ancient human DNA with pig primer; Lane 6, an-cient pig DNA with human primer; and Lane 8, DNA size of100 bp marker.
TABLE 5. Mitochondrial DNA sequence obtained from ancient pig sample aligned with pig reference sequence(http:/www.ncbi.nlm.nih.gov, accession number AJ002189)
Pig referenceAncient pig
Pig referenceAncient pig
Pig referenceAncient pig
432 P. LERTRIT ET AL.
American Journal of Physical Anthropology
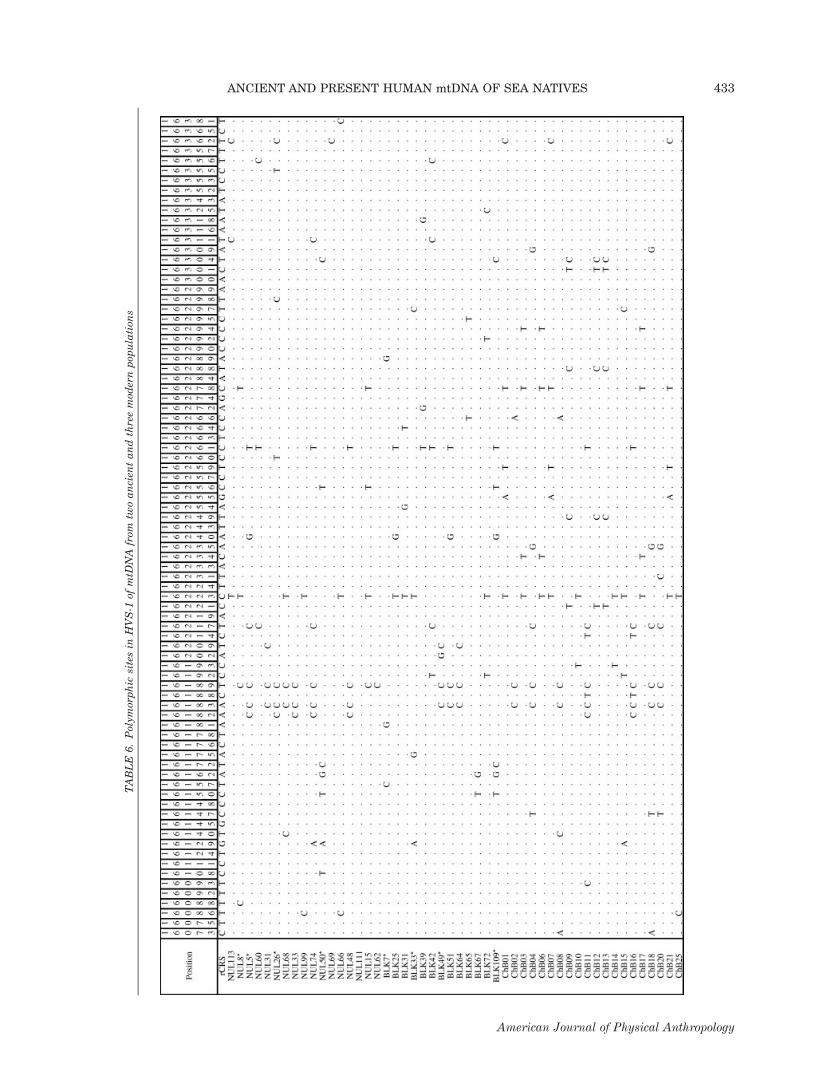
TABLE
6.Polym
orphic
sitesin
HVS-1
ofmtD
NA
from
twoancien
tandthreemod
ernpop
ulation
s
433ANCIENT AND PRESENT HUMAN mtDNA OF SEA NATIVES
American Journal of Physical Anthropology
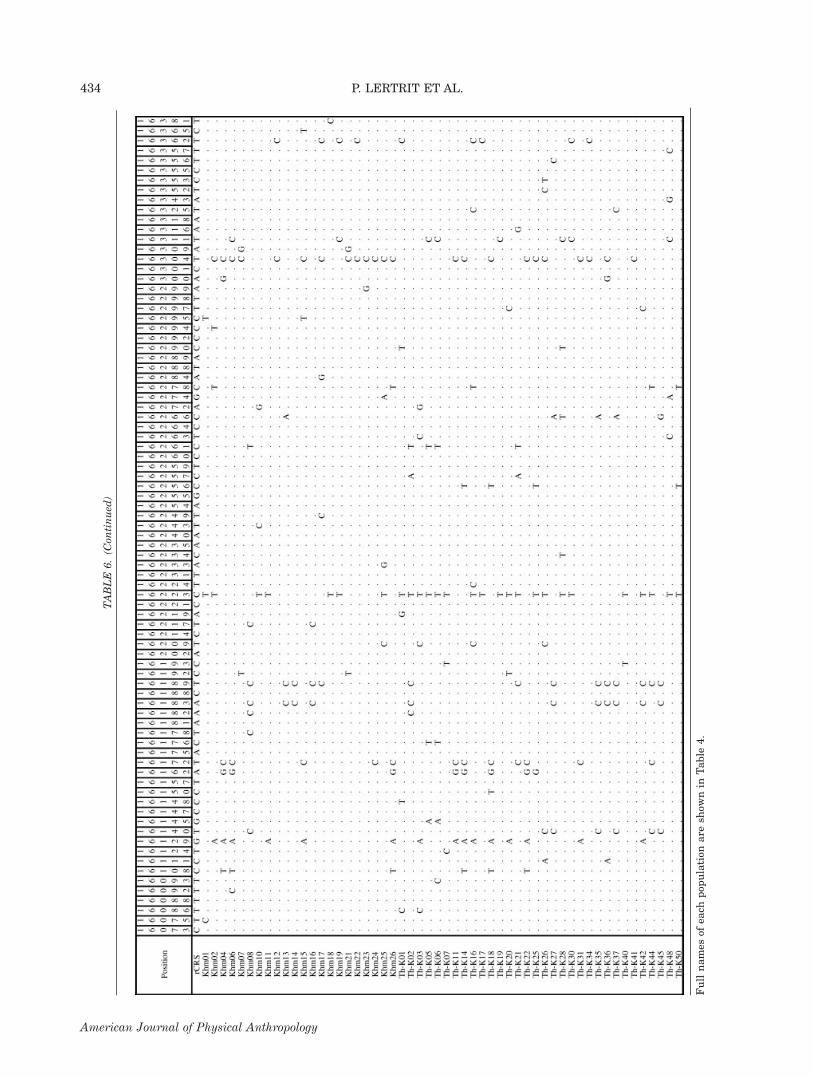
TABLE
6.(C
ontinued
)
Fullnames
ofea
chpop
ulation
are
show
nin
Table
4.
434 P. LERTRIT ET AL.
American Journal of Physical Anthropology
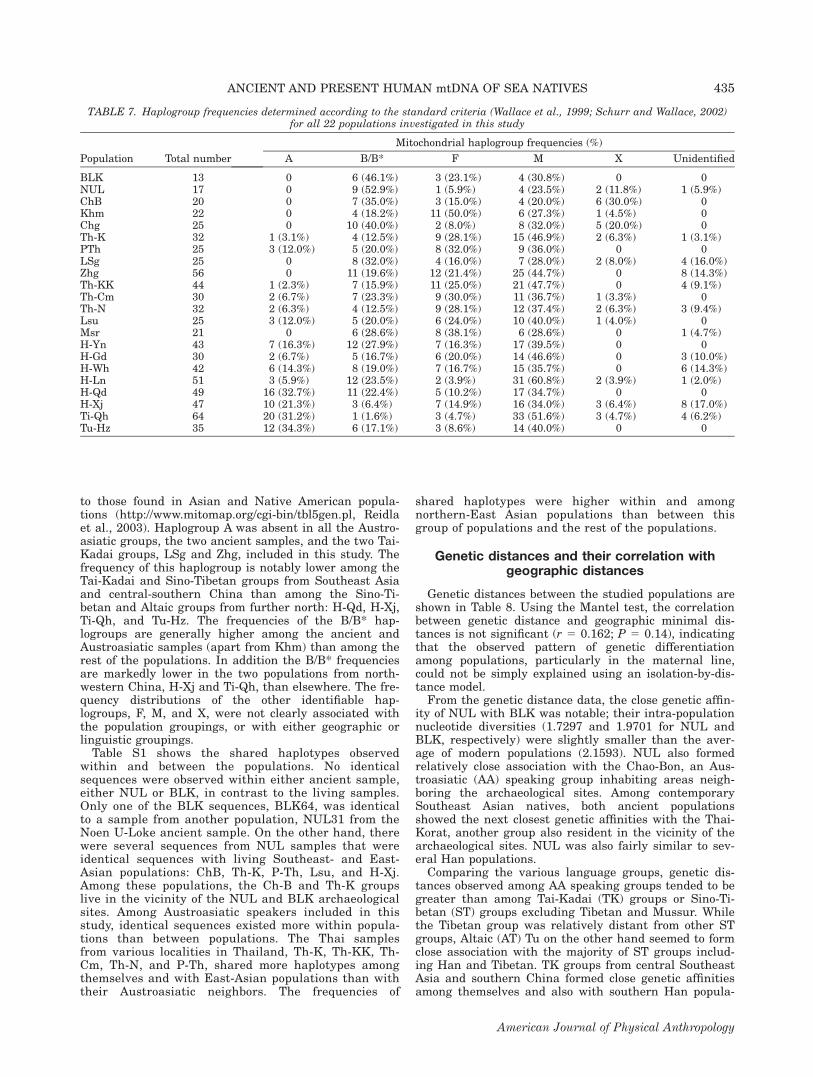
to those found in Asian and Native American popula-tions (http://www.mitomap.org/cgi-bin/tbl5gen.pl, Reidlaet al., 2003). Haplogroup A was absent in all the Austro-asiatic groups, the two ancient samples, and the two Tai-Kadai groups, LSg and Zhg, included in this study. Thefrequency of this haplogroup is notably lower among theTai-Kadai and Sino-Tibetan groups from Southeast Asiaand central-southern China than among the Sino-Ti-betan and Altaic groups from further north: H-Qd, H-Xj,Ti-Qh, and Tu-Hz. The frequencies of the B/B* hap-logroups are generally higher among the ancient andAustroasiatic samples (apart from Khm) than among therest of the populations. In addition the B/B* frequenciesare markedly lower in the two populations from north-western China, H-Xj and Ti-Qh, than elsewhere. The fre-quency distributions of the other identifiable hap-logroups, F, M, and X, were not clearly associated withthe population groupings, or with either geographic orlinguistic groupings.Table S1 shows the shared haplotypes observed
within and between the populations. No identicalsequences were observed within either ancient sample,either NUL or BLK, in contrast to the living samples.Only one of the BLK sequences, BLK64, was identicalto a sample from another population, NUL31 from theNoen U-Loke ancient sample. On the other hand, therewere several sequences from NUL samples that wereidentical sequences with living Southeast- and East-Asian populations: ChB, Th-K, P-Th, Lsu, and H-Xj.Among these populations, the Ch-B and Th-K groupslive in the vicinity of the NUL and BLK archaeologicalsites. Among Austroasiatic speakers included in thisstudy, identical sequences existed more within popula-tions than between populations. The Thai samplesfrom various localities in Thailand, Th-K, Th-KK, Th-Cm, Th-N, and P-Th, shared more haplotypes amongthemselves and with East-Asian populations than withtheir Austroasiatic neighbors. The frequencies of
shared haplotypes were higher within and amongnorthern-East Asian populations than between thisgroup of populations and the rest of the populations.
Genetic distances and their correlation withgeographic distances
Genetic distances between the studied populations areshown in Table 8. Using the Mantel test, the correlationbetween genetic distance and geographic minimal dis-tances is not significant (r 5 0.162; P 5 0.14), indicatingthat the observed pattern of genetic differentiationamong populations, particularly in the maternal line,could not be simply explained using an isolation-by-dis-tance model.From the genetic distance data, the close genetic affin-
ity of NUL with BLK was notable; their intra-populationnucleotide diversities (1.7297 and 1.9701 for NUL andBLK, respectively) were slightly smaller than the aver-age of modern populations (2.1593). NUL also formedrelatively close association with the Chao-Bon, an Aus-troasiatic (AA) speaking group inhabiting areas neigh-boring the archaeological sites. Among contemporarySoutheast Asian natives, both ancient populationsshowed the next closest genetic affinities with the Thai-Korat, another group also resident in the vicinity of thearchaeological sites. NUL was also fairly similar to sev-eral Han populations.Comparing the various language groups, genetic dis-
tances observed among AA speaking groups tended to begreater than among Tai-Kadai (TK) groups or Sino-Ti-betan (ST) groups excluding Tibetan and Mussur. Whilethe Tibetan group was relatively distant from other STgroups, Altaic (AT) Tu on the other hand seemed to formclose association with the majority of ST groups includ-ing Han and Tibetan. TK groups from central SoutheastAsia and southern China formed close genetic affinitiesamong themselves and also with southern Han popula-
TABLE 7. Haplogroup frequencies determined according to the standard criteria (Wallace et al., 1999; Schurr and Wallace, 2002)for all 22 populations investigated in this study
Population Total number
Mitochondrial haplogroup frequencies (%)
A B/B* F M X Unidentified
BLK 13 0 6 (46.1%) 3 (23.1%) 4 (30.8%) 0 0NUL 17 0 9 (52.9%) 1 (5.9%) 4 (23.5%) 2 (11.8%) 1 (5.9%)ChB 20 0 7 (35.0%) 3 (15.0%) 4 (20.0%) 6 (30.0%) 0Khm 22 0 4 (18.2%) 11 (50.0%) 6 (27.3%) 1 (4.5%) 0Chg 25 0 10 (40.0%) 2 (8.0%) 8 (32.0%) 5 (20.0%) 0Th-K 32 1 (3.1%) 4 (12.5%) 9 (28.1%) 15 (46.9%) 2 (6.3%) 1 (3.1%)PTh 25 3 (12.0%) 5 (20.0%) 8 (32.0%) 9 (36.0%) 0 0LSg 25 0 8 (32.0%) 4 (16.0%) 7 (28.0%) 2 (8.0%) 4 (16.0%)Zhg 56 0 11 (19.6%) 12 (21.4%) 25 (44.7%) 0 8 (14.3%)Th-KK 44 1 (2.3%) 7 (15.9%) 11 (25.0%) 21 (47.7%) 0 4 (9.1%)Th-Cm 30 2 (6.7%) 7 (23.3%) 9 (30.0%) 11 (36.7%) 1 (3.3%) 0Th-N 32 2 (6.3%) 4 (12.5%) 9 (28.1%) 12 (37.4%) 2 (6.3%) 3 (9.4%)Lsu 25 3 (12.0%) 5 (20.0%) 6 (24.0%) 10 (40.0%) 1 (4.0%) 0Msr 21 0 6 (28.6%) 8 (38.1%) 6 (28.6%) 0 1 (4.7%)H-Yn 43 7 (16.3%) 12 (27.9%) 7 (16.3%) 17 (39.5%) 0 0H-Gd 30 2 (6.7%) 5 (16.7%) 6 (20.0%) 14 (46.6%) 0 3 (10.0%)H-Wh 42 6 (14.3%) 8 (19.0%) 7 (16.7%) 15 (35.7%) 0 6 (14.3%)H-Ln 51 3 (5.9%) 12 (23.5%) 2 (3.9%) 31 (60.8%) 2 (3.9%) 1 (2.0%)H-Qd 49 16 (32.7%) 11 (22.4%) 5 (10.2%) 17 (34.7%) 0 0H-Xj 47 10 (21.3%) 3 (6.4%) 7 (14.9%) 16 (34.0%) 3 (6.4%) 8 (17.0%)Ti-Qh 64 20 (31.2%) 1 (1.6%) 3 (4.7%) 33 (51.6%) 3 (4.7%) 4 (6.2%)Tu-Hz 35 12 (34.3%) 6 (17.1%) 3 (8.6%) 14 (40.0%) 0 0
435ANCIENT AND PRESENT HUMAN mtDNA OF SEA NATIVES
American Journal of Physical Anthropology

tions from Yunnan and Guangdong. Interestingly theKhmer, an AA speaking group, was generally more affili-ated with TK groups than with other AA groups.
Population clustering as revealed by principalcoordinate analysis and phylogenetic analysis
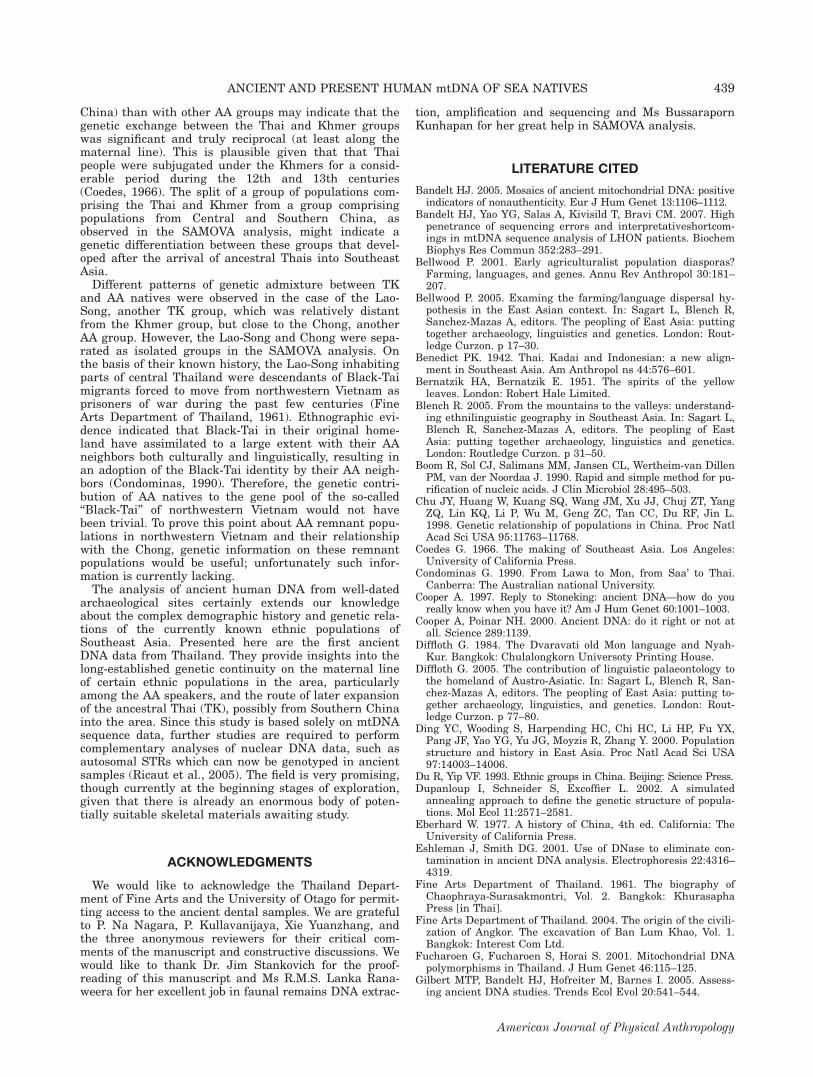
A principal coordinate (PC) map and a phylogenetictree, both derived from net genetic distance data, areshown in Figures 4 and 5, respectively. Figure 4 showsthe distribution of the studied populations according tothe first and second PC axes, which accounted for 34.67and 26.70% of the total variation, respectively. On thefirst PC axis, populations were divided roughly con-gruently with geography, with populations from South-east Asia and southern China, (AA, southern ST, TK andour two prehistoric populations) intermingling towardsone end, and northern East-Asian populations (northernST and AT) towards the opposite end. Clearer divisionsof populations according to their ethnic and linguisticaffiliations were visible on the second PC axis: the twoAA groups, Chao-Bon and Chong, were clearly separatedfrom all TK groups. Interestingly, they clustered closelyon this axis with the two prehistoric populations NULand BLK, suggesting a close genetic affiliation along thematernal line. The TK groups clustered closely togetheramong themselves, and were closer to the southern STpopulations than the northern ST populations. The TKgroups were relatively distant from the two prehistoricpopulations as well as from the majority of AA groups,particularly on the second PC axis. One major exceptionwas the Khmer group which formed a much closer affili-ation with the TK groups than with other AA groups onthe second PC axis. The closer genetic affiliation of theKhmer group with TK groups from central SoutheastAsia (i.e. Thai speaking groups) than with their north-erly linguistic relatives (i.e. Zhuang from southern Chinaand Lao-Song originally from northwestern Vietnam),might suggest significant genetic exchanges in thematernal line between the Khmers and Thais in particu-lar. The two southwestern Sino-Tibetan groups, Lisu andMussur, showed closer affiliation with Southeast Asianand southern-East Asian natives than with northern STgroups, indicating a predominantly southern origin fortheir maternal lineages. All ST-Han populations and theAT-Tu population clustered together at quite a distancefrom the ST-Tibetan population.Figure 5 illustrates an unrooted NJ-tree constructed for
maternal genetic relationships among the studied popula-tions. All Southeast Asian populations included in thisstudy, whether prehistoric or contemporary, clustered to-gether within one major branch on the NJ tree, while themajority of northerly populations clustered on the otherbranch. The southeast Asian cluster was closer to nativesof southern China, namely to Han Chinese from Yunnanand Guangdong, Zhuang, Lisu and Mussur, than to north-ern ST and AT groups. The two ancient populations,which are phylogenetically closest to each other, formed asub-branch with the two AA groups, Chao-Bon and Chong,and with one TK group, Lao-Song. Among SoutheastAsian natives, the Khmer group was closer phylogeneti-cally to the majority of Thai than to other AA groups.
SAMOVA analysis
Table 9 gives the composition of the correspondinggroups of populations inferred by the SAMOVA algo-
TABLE
8.In
tra-pop
ulation
andnet
nucleotidediversity
amon
g22selected
pop
ulation
s
NUL
BLK
ChB
Khm
Chg
Th-K
Th-K
KTh-C
mTh-N
PTh
LSg
Zhg
Lsu
Msr
H-Y
nH-G
dH-W
hH-Q
dH-Ln
H-X
jTi-Qh
Tu-H
z
NUL
1.7297
BLK
0.0357
1.9701
ChB
0.0582
0.1176
2.4295
Khm
0.1358
0.1024
0.1437
1.8473
Chg
0.183
0.2026
0.1479
0.2409
2.1857
Th-K
0.085
0.0701
0.1161
0.0284
0.1267
2.2819
Th-K
K0.1382
0.0925
0.1422
0.0373
0.1571
0.0142
2.1609
Th-C
m0.1909
0.1277
0.2006
0.0409
0.2235
0.0511
0.0134
1.94
Th-N
0.1062
0.1093
0.1001
0.0311
0.155
0.0001
0.0197
0.011
42.2503
PTh
0.1502
0.0748
0.1715
0.0007
0.2206
0.0247
0.0013
0.0135
0.0489
2.3247
LSg
0.102
0.0957
0.1326
0.1213
0.0644
0.0631
0.0577
0.0963
0.0698
0.0931
1.9238
Zhg
0.0537
0.0854
0.0994
0.056
0.1609
0.0133
0.0355
0.0461
00.052
0.075
2.2138
Lsu
0.1183
0.1132
0.1535
0.0574
0.1788
0.0397
0.0172
0.0657
0.0597
00.0688
0.0581
2.1359
Msr
0.2167
0.2505
0.2645
0.0691
0.3169
0.1062
0.0888
0.0743
0.1005
0.0256
0.1887
0.1232
0.0133
1.8819
H-Y
n0.0508
0.1014
0.1133
0.0747
0.2075
0.0271
0.047
0.0365
0.0018
0.0707
0.097
00.0742
0.1255
2.5011
H-G
d0.0339
0.1087
0.0937
0.0758
0.2037
0.0337
0.0515
0.0789
0.0426
0.0545
0.084
0.0153
0.0502
0.1002
0.001
2.3791
H-W
h0.0432
0.1227
0.117
0.1184
0.19
0.0479
0.0773
0.1275
0.0335
0.112
0.0851
0.016
0.0637
0.1855
0.0164
0.014
2.3568
H-Q
d0.111
60.1616
0.1229
0.1478
0.1982
0.0563
0.0848
0.1305
0.073
0.1035
0.126
0.0563
0.0558
0.1777
0.0482
0.01
0.0245
2.1474
H-Ln
0.0689
0.1382
0.0965
0.1524
0.1615
0.0535
0.0881
0.1552
0.0843
0.1106
0.1072
0.051
0.0474
0.1814
0.0506
0.0161
0.0162
02.366
H-X
j0.1164
0.1441
0.116
0.1122
0.1582
0.049
0.0556
0.1131
0.0584
0.0925
0.0915
0.0442
0.0171
0.1663
0.0433
0.0263
0.0228
00
2.1068
Ti-Qh
0.3177
0.3148
0.2541
0.3045
0.275
0.1827
0.1894
0.2535
0.2205
0.2125
0.2269
0.2195
0.1055
0.2773
0.211
60.1474
0.1664
0.0586
0.0666
0.0556
1.7303
Tu-H
z0.111
40.1831
0.1255
0.1786
0.1937
0.0733
0.0999
0.1558
0.0793
0.1371
0.1292
0.0656
0.0511
0.1821
0.0452
0.0151
0.0224
0.0022
00
0.0507
2.0226
436 P. LERTRIT ET AL.
American Journal of Physical Anthropology
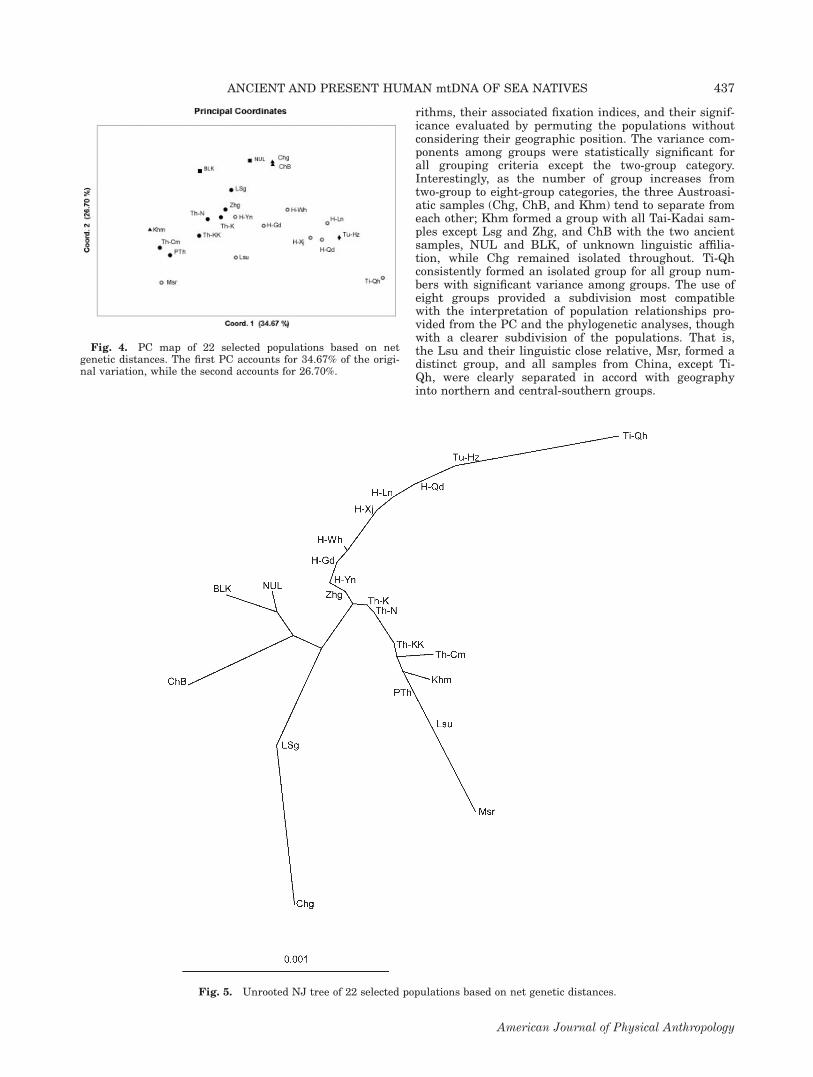
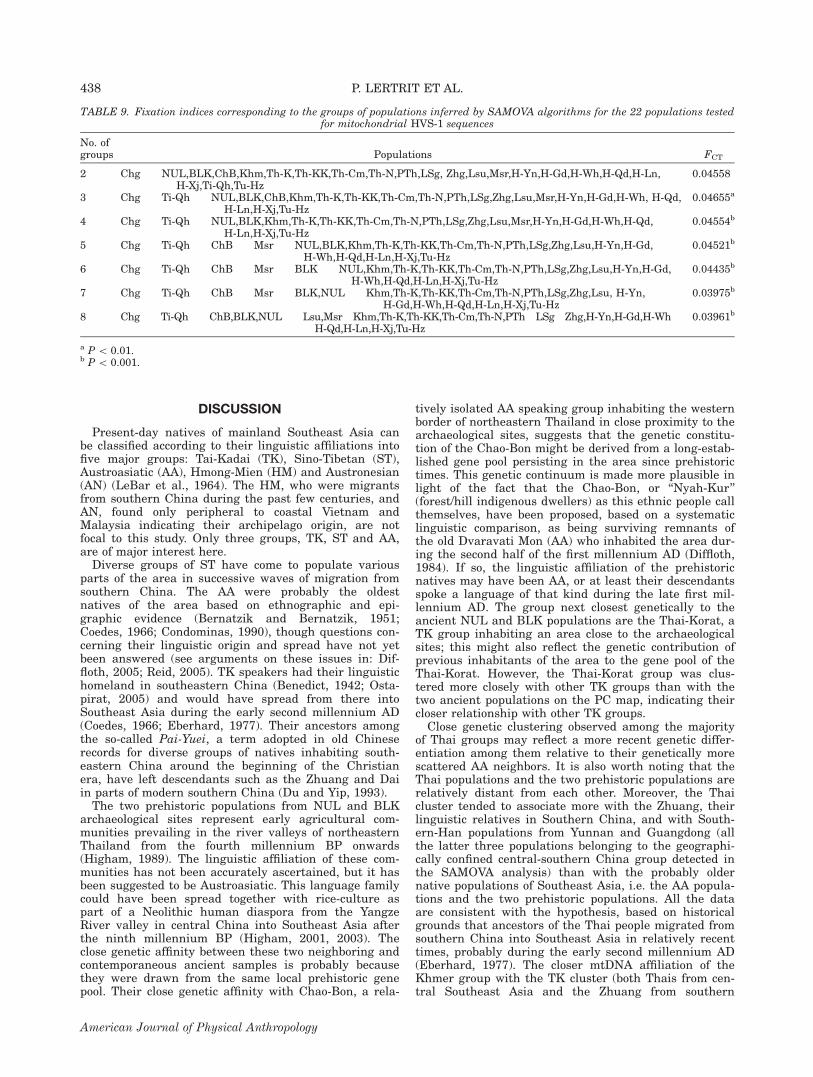
rithms, their associated fixation indices, and their signif-icance evaluated by permuting the populations withoutconsidering their geographic position. The variance com-ponents among groups were statistically significant forall grouping criteria except the two-group category.Interestingly, as the number of group increases fromtwo-group to eight-group categories, the three Austroasi-atic samples (Chg, ChB, and Khm) tend to separate fromeach other; Khm formed a group with all Tai-Kadai sam-ples except Lsg and Zhg, and ChB with the two ancientsamples, NUL and BLK, of unknown linguistic affilia-tion, while Chg remained isolated throughout. Ti-Qhconsistently formed an isolated group for all group num-bers with significant variance among groups. The use ofeight groups provided a subdivision most compatiblewith the interpretation of population relationships pro-vided from the PC and the phylogenetic analyses, thoughwith a clearer subdivision of the populations. That is,the Lsu and their linguistic close relative, Msr, formed adistinct group, and all samples from China, except Ti-Qh, were clearly separated in accord with geographyinto northern and central-southern groups.
Fig. 4. PC map of 22 selected populations based on netgenetic distances. The first PC accounts for 34.67% of the origi-nal variation, while the second accounts for 26.70%.
Fig. 5. Unrooted NJ tree of 22 selected populations based on net genetic distances.
437ANCIENT AND PRESENT HUMAN mtDNA OF SEA NATIVES
American Journal of Physical Anthropology
DISCUSSION
Present-day natives of mainland Southeast Asia canbe classified according to their linguistic affiliations intofive major groups: Tai-Kadai (TK), Sino-Tibetan (ST),Austroasiatic (AA), Hmong-Mien (HM) and Austronesian(AN) (LeBar et al., 1964). The HM, who were migrantsfrom southern China during the past few centuries, andAN, found only peripheral to coastal Vietnam andMalaysia indicating their archipelago origin, are notfocal to this study. Only three groups, TK, ST and AA,are of major interest here.Diverse groups of ST have come to populate various
parts of the area in successive waves of migration fromsouthern China. The AA were probably the oldestnatives of the area based on ethnographic and epi-graphic evidence (Bernatzik and Bernatzik, 1951;Coedes, 1966; Condominas, 1990), though questions con-cerning their linguistic origin and spread have not yetbeen answered (see arguments on these issues in: Dif-floth, 2005; Reid, 2005). TK speakers had their linguistichomeland in southeastern China (Benedict, 1942; Osta-pirat, 2005) and would have spread from there intoSoutheast Asia during the early second millennium AD(Coedes, 1966; Eberhard, 1977). Their ancestors amongthe so-called Pai-Yuei, a term adopted in old Chineserecords for diverse groups of natives inhabiting south-eastern China around the beginning of the Christianera, have left descendants such as the Zhuang and Daiin parts of modern southern China (Du and Yip, 1993).The two prehistoric populations from NUL and BLK
archaeological sites represent early agricultural com-munities prevailing in the river valleys of northeasternThailand from the fourth millennium BP onwards(Higham, 1989). The linguistic affiliation of these com-munities has not been accurately ascertained, but it hasbeen suggested to be Austroasiatic. This language familycould have been spread together with rice-culture aspart of a Neolithic human diaspora from the YangzeRiver valley in central China into Southeast Asia afterthe ninth millennium BP (Higham, 2001, 2003). Theclose genetic affinity between these two neighboring andcontemporaneous ancient samples is probably becausethey were drawn from the same local prehistoric genepool. Their close genetic affinity with Chao-Bon, a rela-
tively isolated AA speaking group inhabiting the westernborder of northeastern Thailand in close proximity to thearchaeological sites, suggests that the genetic constitu-tion of the Chao-Bon might be derived from a long-estab-lished gene pool persisting in the area since prehistorictimes. This genetic continuum is made more plausible inlight of the fact that the Chao-Bon, or ‘‘Nyah-Kur’’(forest/hill indigenous dwellers) as this ethnic people callthemselves, have been proposed, based on a systematiclinguistic comparison, as being surviving remnants ofthe old Dvaravati Mon (AA) who inhabited the area dur-ing the second half of the first millennium AD (Diffloth,1984). If so, the linguistic affiliation of the prehistoricnatives may have been AA, or at least their descendantsspoke a language of that kind during the late first mil-lennium AD. The group next closest genetically to theancient NUL and BLK populations are the Thai-Korat, aTK group inhabiting an area close to the archaeologicalsites; this might also reflect the genetic contribution ofprevious inhabitants of the area to the gene pool of theThai-Korat. However, the Thai-Korat group was clus-tered more closely with other TK groups than with thetwo ancient populations on the PC map, indicating theircloser relationship with other TK groups.Close genetic clustering observed among the majority
of Thai groups may reflect a more recent genetic differ-entiation among them relative to their genetically morescattered AA neighbors. It is also worth noting that theThai populations and the two prehistoric populations arerelatively distant from each other. Moreover, the Thaicluster tended to associate more with the Zhuang, theirlinguistic relatives in Southern China, and with South-ern-Han populations from Yunnan and Guangdong (allthe latter three populations belonging to the geographi-cally confined central-southern China group detected inthe SAMOVA analysis) than with the probably oldernative populations of Southeast Asia, i.e. the AA popula-tions and the two prehistoric populations. All the dataare consistent with the hypothesis, based on historicalgrounds that ancestors of the Thai people migrated fromsouthern China into Southeast Asia in relatively recenttimes, probably during the early second millennium AD(Eberhard, 1977). The closer mtDNA affiliation of theKhmer group with the TK cluster (both Thais from cen-tral Southeast Asia and the Zhuang from southern
TABLE 9. Fixation indices corresponding to the groups of populations inferred by SAMOVA algorithms for the 22 populations testedfor mitochondrial HVS-1 sequences
No. ofgroups Populations FCT
2 Chg NUL,BLK,ChB,Khm,Th-K,Th-KK,Th-Cm,Th-N,PTh,LSg, Zhg,Lsu,Msr,H-Yn,H-Gd,H-Wh,H-Qd,H-Ln,H-Xj,Ti-Qh,Tu-Hz
0.04558
3 Chg Ti-Qh NUL,BLK,ChB,Khm,Th-K,Th-KK,Th-Cm,Th-N,PTh,LSg,Zhg,Lsu,Msr,H-Yn,H-Gd,H-Wh, H-Qd,H-Ln,H-Xj,Tu-Hz
0.04655a
4 Chg Ti-Qh NUL,BLK,Khm,Th-K,Th-KK,Th-Cm,Th-N,PTh,LSg,Zhg,Lsu,Msr,H-Yn,H-Gd,H-Wh,H-Qd,H-Ln,H-Xj,Tu-Hz
0.04554b
5 Chg Ti-Qh ChB Msr NUL,BLK,Khm,Th-K,Th-KK,Th-Cm,Th-N,PTh,LSg,Zhg,Lsu,H-Yn,H-Gd,H-Wh,H-Qd,H-Ln,H-Xj,Tu-Hz
0.04521b
6 Chg Ti-Qh ChB Msr BLK NUL,Khm,Th-K,Th-KK,Th-Cm,Th-N,PTh,LSg,Zhg,Lsu,H-Yn,H-Gd,H-Wh,H-Qd,H-Ln,H-Xj,Tu-Hz
0.04435b
7 Chg Ti-Qh ChB Msr BLK,NUL Khm,Th-K,Th-KK,Th-Cm,Th-N,PTh,LSg,Zhg,Lsu, H-Yn,H-Gd,H-Wh,H-Qd,H-Ln,H-Xj,Tu-Hz
0.03975b
8 Chg Ti-Qh ChB,BLK,NUL Lsu,Msr Khm,Th-K,Th-KK,Th-Cm,Th-N,PTh LSg Zhg,H-Yn,H-Gd,H-WhH-Qd,H-Ln,H-Xj,Tu-Hz
0.03961b
a P\ 0.01.b P\ 0.001.
American Journal of Physical Anthropology
438 P. LERTRIT ET AL.
China) than with other AA groups may indicate that thegenetic exchange between the Thai and Khmer groupswas significant and truly reciprocal (at least along thematernal line). This is plausible given that that Thaipeople were subjugated under the Khmers for a consid-erable period during the 12th and 13th centuries(Coedes, 1966). The split of a group of populations com-prising the Thai and Khmer from a group comprisingpopulations from Central and Southern China, asobserved in the SAMOVA analysis, might indicate agenetic differentiation between these groups that devel-oped after the arrival of ancestral Thais into SoutheastAsia.Different patterns of genetic admixture between TK
and AA natives were observed in the case of the Lao-Song, another TK group, which was relatively distantfrom the Khmer group, but close to the Chong, anotherAA group. However, the Lao-Song and Chong were sepa-rated as isolated groups in the SAMOVA analysis. Onthe basis of their known history, the Lao-Song inhabitingparts of central Thailand were descendants of Black-Taimigrants forced to move from northwestern Vietnam asprisoners of war during the past few centuries (FineArts Department of Thailand, 1961). Ethnographic evi-dence indicated that Black-Tai in their original home-land have assimilated to a large extent with their AAneighbors both culturally and linguistically, resulting inan adoption of the Black-Tai identity by their AA neigh-bors (Condominas, 1990). Therefore, the genetic contri-bution of AA natives to the gene pool of the so-called‘‘Black-Tai’’ of northwestern Vietnam would not havebeen trivial. To prove this point about AA remnant popu-lations in northwestern Vietnam and their relationshipwith the Chong, genetic information on these remnantpopulations would be useful; unfortunately such infor-mation is currently lacking.The analysis of ancient human DNA from well-dated
archaeological sites certainly extends our knowledgeabout the complex demographic history and genetic rela-tions of the currently known ethnic populations ofSoutheast Asia. Presented here are the first ancientDNA data from Thailand. They provide insights into thelong-established genetic continuity on the maternal lineof certain ethnic populations in the area, particularlyamong the AA speakers, and the route of later expansionof the ancestral Thai (TK), possibly from Southern Chinainto the area. Since this study is based solely on mtDNAsequence data, further studies are required to performcomplementary analyses of nuclear DNA data, such asautosomal STRs which can now be genotyped in ancientsamples (Ricaut et al., 2005). The field is very promising,though currently at the beginning stages of exploration,given that there is already an enormous body of poten-tially suitable skeletal materials awaiting study.
ACKNOWLEDGMENTS
We would like to acknowledge the Thailand Depart-ment of Fine Arts and the University of Otago for permit-ting access to the ancient dental samples. We are gratefulto P. Na Nagara, P. Kullavanijaya, Xie Yuanzhang, andthe three anonymous reviewers for their critical com-ments of the manuscript and constructive discussions. Wewould like to thank Dr. Jim Stankovich for the proof-reading of this manuscript and Ms R.M.S. Lanka Rana-weera for her excellent job in faunal remains DNA extrac-
tion, amplification and sequencing and Ms BussarapornKunhapan for her great help in SAMOVA analysis.
LITERATURE CITED
Bandelt HJ. 2005. Mosaics of ancient mitochondrial DNA: positiveindicators of nonauthenticity. Eur J Hum Genet 13:1106–1112.
Bandelt HJ, Yao YG, Salas A, Kivisild T, Bravi CM. 2007. Highpenetrance of sequencing errors and interpretativeshortcom-ings in mtDNA sequence analysis of LHON patients. BiochemBiophys Res Commun 352:283–291.
Bellwood P. 2001. Early agriculturalist population diasporas?Farming, languages, and genes. Annu Rev Anthropol 30:181–207.
Bellwood P. 2005. Examing the farming/language dispersal hy-pothesis in the East Asian context. In: Sagart L, Blench R,Sanchez-Mazas A, editors. The peopling of East Asia: puttingtogether archaeology, linguistics and genetics. London: Rout-ledge Curzon. p 17–30.
Benedict PK. 1942. Thai. Kadai and Indonesian: a new align-ment in Southeast Asia. Am Anthropol ns 44:576–601.
Bernatzik HA, Bernatzik E. 1951. The spirits of the yellowleaves. London: Robert Hale Limited.
Blench R. 2005. From the mountains to the valleys: understand-ing ethnilinguistic geography in Southeast Asia. In: Sagart L,Blench R, Sanchez-Mazas A, editors. The peopling of EastAsia: putting together archaeology, linguistics and genetics.London: Routledge Curzon. p 31–50.
Boom R, Sol CJ, Salimans MM, Jansen CL, Wertheim-van DillenPM, van der Noordaa J. 1990. Rapid and simple method for pu-rification of nucleic acids. J Clin Microbiol 28:495–503.
Chu JY, Huang W, Kuang SQ, Wang JM, Xu JJ, Chuj ZT, YangZQ, Lin KQ, Li P, Wu M, Geng ZC, Tan CC, Du RF, Jin L.1998. Genetic relationship of populations in China. Proc NatlAcad Sci USA 95:11763–11768.
Coedes G. 1966. The making of Southeast Asia. Los Angeles:University of California Press.
Condominas G. 1990. From Lawa to Mon, from Saa’ to Thai.Canberra: The Australian national University.
Cooper A. 1997. Reply to Stoneking: ancient DNA—how do youreally know when you have it? Am J Hum Genet 60:1001–1003.
Cooper A, Poinar NH. 2000. Ancient DNA: do it right or not atall. Science 289:1139.
Diffloth G. 1984. The Dvaravati old Mon language and Nyah-Kur. Bangkok: Chulalongkorn Universoty Printing House.
Diffloth G. 2005. The contribution of linguistic palaeontology tothe homeland of Austro-Asiatic. In: Sagart L, Blench R, San-chez-Mazas A, editors. The peopling of East Asia: putting to-gether archaeology, linguistics, and genetics. London: Rout-ledge Curzon. p 77–80.
Ding YC, Wooding S, Harpending HC, Chi HC, Li HP, Fu YX,Pang JF, Yao YG, Yu JG, Moyzis R, Zhang Y. 2000. Populationstructure and history in East Asia. Proc Natl Acad Sci USA97:14003–14006.
Du R, Yip VF. 1993. Ethnic groups in China. Beijing: Science Press.Dupanloup I, Schneider S, Excoffier L. 2002. A simulated
annealing approach to define the genetic structure of popula-tions. Mol Ecol 11:2571–2581.
Eberhard W. 1977. A history of China, 4th ed. California: TheUniversity of California Press.
Eshleman J, Smith DG. 2001. Use of DNase to eliminate con-tamination in ancient DNA analysis. Electrophoresis 22:4316–4319.
Fine Arts Department of Thailand. 1961. The biography ofChaophraya-Surasakmontri, Vol. 2. Bangkok: KhurasaphaPress [in Thai].
Fine Arts Department of Thailand. 2004. The origin of the civili-zation of Angkor. The excavation of Ban Lum Khao, Vol. 1.Bangkok: Interest Com Ltd.
Fucharoen G, Fucharoen S, Horai S. 2001. Mitochondrial DNApolymorphisms in Thailand. J Hum Genet 46:115–125.
Gilbert MTP, Bandelt HJ, Hofreiter M, Barnes I. 2005. Assess-ing ancient DNA studies. Trends Ecol Evol 20:541–544.
American Journal of Physical Anthropology
439ANCIENT AND PRESENT HUMAN mtDNA OF SEA NATIVES
Hall TA. 1999. BioEdit: a user-friendly biological sequencealignment editor and analysis program for Windows 95/98/NT.Nucleic Acids Symp Ser 41:95–98.
Handt O, Krings M, Ward RH, Paabo S. 1996. The retrieval ofancient human DNA sequences. Am J Hum Genet 59:368–376.
Higham CFW. 1989. The archaeology of mainland SoutheastAsia. Cambridge: Cambridge University Press.
Higham CFW. 2000. The origin of the civilization of Angkor.The final report to the National Research Council of Thailand.New Zealand: Department of Anthropology, University ofOtago. p 1–160.
Higham CFW. 2001. Prehistory, language and human biology: isthere a consensus in East and Southeast Asia. In: Jin L,SeieIstad M, Xiao C, editors. Genetic, linguistic and archaeo-logical perspectives on human diversity in Southeast Asia.New Jersy: World Scientific. p 3–16.
Higham CFW. 2003. Languages and farming dispersals: Austro-asiatic languages and rice cultivation. In: Bellwood P, Ren-frew C, editors. Examining the farming/language dispersalhypothesis. Cambridge: McDonald Institute for ArchaeologicalResearch. p 17–28:341–56.
Higham CFW, Thosarat R. 2004. The origins of the civilizationof Angkor: The excavation of Ban Lum Khao, Vol. 1. Bangkok:Interest Company.
Hofreiter M, Serre D, Poinar HN, Kuch M, Paabo S. 2001. An-cient DNA. Nat Rev Genet 2:353–359.
Hoss M, Paabo S. 1993. DNA extraction from Pleistocene bonesby a silica-based purification method. Nucleic Acids Res21:3913–3914.
Jehaes E, Decorte R, Peneau A, Petrie JH, Boiry PA, Gilissen A,Moisan JP, Van den Berghe H, Pascal O, Cassiman JJ. 1998.Mitochondrial DNA analysis on remains of a putative son ofLouis XVI. King of France and Marie-Antoinette. Eur J HumGenet 6:383–395.
Jin L, Seielstad M, Xiao C. 2001. Genetic, linguistic, andarchaeological perspectives on human diversity in SoutheastAsia. New Jersy: World Scientific.
Jin L, Su B. 2000. Natives or immigrants: modern human originin East Asia. Nat Rev Genet 1:126–133.
Kimura M. 1980. A simple method for estimating evolutionaryrates of base substitutions through comparative studies of nu-cleotide sequences. J Mol Evol 16:111–120.
Kolman CJ, Tuross N. 2000. Ancient DNA analysis of humanpopulations. Am J Phys Anthropol 111:5–23.
Kumar S, Tamura K, Nei M. 2004. MEGA3: Integrated softwarefor molecular evolutionary genetics analysis and sequencealignment. Brief Bioinform 5:150–163.
LeBar FM, Hickey GC, Musgrave JK. 1964. Ethnic groups ofmainland Southeast Asia. New Haven: Human Relations AreaFiles Press.
Leonard JA, Shanks O, Hofreiter M, Kreuz E, Hodges L,Ream L, Wayne RK, Fleisch RC. 2007. Animal DNA in PCRreagents plagues ancient DNA research. J Archa Sci 34:1361–1366.
Lu T, L-D. 2005. The origin and dispersal of agriculture andhuman diaspora in East Asia. In: Sagart L, Blench R, San-chez-Mazas A, editors. The peopling of East Asia: putting to-gether archaeology, linguistics, and genetics. London: Rout-ledge Curzon. p 51–62.
Macaulay V, Hill C, Achilli A, Rengo C, Clarke D, Meehan W,Blackburn J, Semino O, Scozzari R, Cruciani F, Taha A,Shaari NK, Raja JM, Ismail P, Zainuddin Z, Goodwin W,Bulbeck D, Bandelt HJ, Oppenheimer S, Torroni A, RichardsM. 2005. Single rapid coastal settlement of Asia revealedby analysis of complete mitochondrial genomes. Science 308:1034–1036.
Malmstrom H, Stora J, Dalen L, Holmlund G, GotherstromA. 2005. Extensive human DNA contamination in extractsfrom ancient dog bones and teeth. Mol Biol Evol 22:2040–2047.
Moore DD. 1995. Preparation and analysis of DNA. In: AusubelFM, Brent R, Kingston RE, Moore DD, Seidman JG, SmithJA, Struhl K, editors. Short protocols in molecular biology,3rd ed. USA: John Wiley and Sons. p 2.1–2.5.
Nei M. 1987. Molecular evolutionary genetics. New York: Co-lumbia University Press.
Nei M, Miller JC. 1990. A simple method for estimating averagenumber of nucleotide substitutions within and between popu-lations from restriction data. Genetics 125:873–879.
Ostapirat W. 2005. Kra-Dai and Austronesian: notes on phono-logical correspondences and vocabulary distribution. In:Sagart L, Blench R, Sanchez-Mazas A, editors. The peoplingof East Asia: putting together archaeology, linguistics andgenetics. London: Routledge Curzonp. p 107–131.
Paabo S, Poinar H, Serre D, Jaenicke-Despres V, Hebler J, Roh-land N, Kuch M, Krause J, Vigilant L, Hofreiter M. 2004.Genetic analyses from ancient DNA. Annu Rev Genet 38:645–679.
Peakall R, Smouse PE. 2006. GENALEX 6: genetic analysis inExcel. Population genetic software for teaching and research.Mol Ecol Notes 6:288–295.
Reid LA. 2005. The current status of Austric: a review and eval-uation of the lexical and morphosyntactic evidence. In: SagartL, Blench R, Sanchez-Mazas A, editors. The peopling of EastAsia: putting together archaeology, linguistics, and genetics.London: Routledge Curzon. p 161–176.
Reidla M, Kivisild T, Metspalu E, Kaldma K, Tambets K, TolkHV, Parik J, Loogvali EL, Derenko M, Malyarchuk B, Ber-misheva M, Zhadanov S, Pennarun E, Gubina M, GolubenkoM, Damba L, Fedorova S, Gusar V, Grechanina E, Mikerezi I,Moisan JP, Chaventre’ A, Khusnutdinova E, Osipova L, Ste-panov V, Voevoda M, Achilli A, Rengo C, Rickards O, StefanoGFD, Papiha S, Beckman L, Janicijevic B, Rudan P, AnagnouN, Michalodimitrakis E, Koziel S, Usanga E, Geberhiwot T,Herrnstadt C, Howell N, Torroni A, Villems R. 2003. Originand diffusion of mtDNA haplogroup X. Am J Hum Genet 73:1178–1190.
Renfrew C. 1996. Language families and the spread of farming.In: Harris D, editor. The origins and spread of agricultureand pastoralism in Asia. London: UCL Press. p 70–92.
Ricaut FX, Keyser-Tracqui C, Crubezy E, Ludes B. 2005. STR-genotyping from human medieval tooth and bone samples.Forensic Sci Int 151:31–35.
Sagart L, Blench R, Sanchez-Mazas A. 2005. The peopling ofEast Asia: putting together archaeology, linguistics and genet-ics. London: Routledge Curzon.
Salas A, Carracedo A, Macaulay V, Richards M, Bandelt HJ.2005. A practical guide to mitochondrial DNA error preven-tion in clinical, forensic, and population genetics. BiochemBiophy Res Comm 335:891–899.
Schurr TG, Wallace DC. 2002. Mitochondrial DNA diversity inSoutheast Asian populations. Hum Biol 74:431–452.
Stoneking M. 1995. Ancient DNA: how do you know when youhave it and what can you do with it? Am J Hum Genet 57:1259–1262.
Su B, Jin L. 2001. Origins and prehistoric migrations of modernhumans in East Asia. In: Jin L, Seielstad M, Xiao C, editors.Genetic, linhuistic and archaeological perspectives on humandiversity in Southeast Asia. New Jersy: World Scientific. p107–132.
Wallace DC, Brown MD, Lott MT. 1999. Mitochondrial DNAvariation in human evolution and disease. Gene 238:211–230.
Wang W, S-Y. 2001. Human diversity and language diversity. In:Jin L, Seielstad M, Xiao C, editors. Genetic, linguistic andarchaeological perspectives on human diversity in SoutheastAsia. New Jersy: World Scientific. p 17–34.
Wen B, Xie X, Gao S, Li H, Shi H, Song X, Qian T, Xiao C, JinJ, Su B, Lu D, Chakraborty R, Jin L. 2004. Analyses ofgenetic structure of Tibeto-Burman populations reveals sex-bi-ased admixture in southern Tibeto-Burmans. Am J HumGenet 74:856–865.
Yao YG, Nie L, Harpending H, Fu YX, Yuan ZG, Zhang YP.2002a. Genetic relationship of Chinese ethnic populationsrevealed by mtDNA sequence diversity. Am J Phys Anthropol118:63–76.
Yao YG, Kong QP, Bandelt HJ, Kivisild T, Zhang YP. 2002b.Phylogeographic differentiation of mitochondrial DNA in HanChinese. Am J Hum Genet 70:635–651.
American Journal of Physical Anthropology
440 P. LERTRIT ET AL.
Related Documents


