Genetic diversity, population structure and phylogeography among belugas (Delphinapterus leucas) in Canadian waters: broad to fine-scale approaches to inform conservation and management strategies by Lianne D. Postma A Thesis submitted to the Faculty of Graduate Studies of The University of Manitoba in partial fulfilment of the requirements of the degree of DOCTOR OF PHILOSOPHY Department of Biological Sciences University of Manitoba Winnipeg Copyright © 2017 by Lianne D. Postma

Welcome message from author
This document is posted to help you gain knowledge. Please leave a comment to let me know what you think about it! Share it to your friends and learn new things together.
Transcript
Genetic diversity, population structure and phylogeography among belugas
(Delphinapterus leucas) in Canadian waters: broad to fine-scale approaches to inform
conservation and management strategies
by
Lianne D. Postma
A Thesis submitted to the Faculty of Graduate Studies of
The University of Manitoba
in partial fulfilment of the requirements of the degree of
DOCTOR OF PHILOSOPHY
Department of Biological Sciences
University of Manitoba
Winnipeg
Copyright © 2017 by Lianne D. Postma
ii
Abstract
This thesis examines the genetic diversity, population structure and phylogeography of belugas
(Delphinapterus leucas) in Canadian waters that encounter multiple stressors throughout their
seasonal distributions. Data were collected from multiple scales, including: samples covering a
temporal scale of 25 years; broad geographic comparisons to finer-scale, within-group
comparisons; and varying amounts of genetic information from partial mtDNA sequences to
whole mitogenome sequences, and multiple nuclear microsatellite loci. At least nine genetically
distinct summer aggregations, with an additional distinct winter sample collection of unknown
summer distribution, were identified. This information contributed to the identification of
Designatable Units (DUs) of belugas for future assessments by the Committee on the Status of
Endangered Wildlife in Canada (COSEWIC). Phylogenetic analyses of mtDNA sequences
revealed that the most divergent lineages are found at the east, west and southern edges of the
Canadian distribution, with the central area characteristic of a contact zone displaying an
admixture of lineages marked by incomplete lineage sorting. The geographic distribution of
these lineages suggests multiple glacial refugia as sources of ancestral beluga populations that
recolonized Canadian Arctic and sub-Arctic waters. Preliminary tests of selection detected the
presence of purifying selection on all mtDNA protein-coding genes of belugas. However, no
signals of adaptive selection were detected among genetic lineages or geographic groups. Within
nearshore summer aggregations of Beaufort Sea belugas, three distinct maternal lineages were
identified and patterns of genetic relatedness suggest clusters of related females form in the
overall area. However, these clusters of related belugas did not form fine-scale kin structure
corresponding to aggregation/harvesting locations. Thus, disturbances and subsistence harvesting

iii
in particular areas where belugas are aggregating will not be necessarily putting a discrete
genetic unit of the stock at risk. These results provide a better understanding of the diversity and
spatial differentiation among and within Canadian beluga stocks, inferences about past responses
to climate changes, approaches to investigate fine-scale structure within seasonal aggregations,
and new tools to infer adaptive potential of these whales. This information, and studies of beluga
fossils plus additional samples across global distributions, will improve conservation and
management planning for this culturally important and charismatic species.

iv
Acknowledgements
It is very difficult to capture the full scope of people who have contributed to this body of
work. It has been shaped by experiences over the course of an entire career that I have been so
fortunate to have at the Freshwater Institute (DFO) since I was a young undergraduate student.
Without the mentoring, wisdom and support of many co-workers, students and colleagues over
the last several decades, I would never have made my way to this achievement. However, to
combine a PhD program with a busy career requires a special group of people and commitment.
My supervisor, Margaret Docker, was a model of patience, encouragement and sound advice for
every step of this process. She was supported by a “dream-team” of a committee composed of
Steve Ferguson, James Hare and Micheline Manseau. I thank my external examiner Dr. David
Coltman (University of Alberta) for his thoroughness and constructive review of this thesis.
Denise Tenkula has been my partner in the lab for many years, and Susie Bajno and Vanessa
Kornelsen also supported the work in this project. Assistance as training and guidance for
Chapter 3 was generously provided by Tim Frasier of St. Mary’s University, Halifax, NS.
Helpful review and comments were also provided by Eline Lorenzen, Natural History Museum
of Denmark and University of Copenhagen.
Funding for this work was provided by Fisheries and Oceans Canada (DFO) as salary to
L. Postma, through the DFO Genomics Research and Development Initiative (GRDI), the DFO
Ecosystem Research initiative (ERI), the Nunavut Implementation Fund (NIF), and from the
Fisheries Joint Management Committee (FJMC) in the Inuvialuit Settlement Region.
However, my family and friends have been my true touchstone during this endeavour.
Their love and support kept me going when the going got tough. I cannot thank you enough.
v
Dedication
I dedicate this to my mom. She was my very first teacher and the first to inspire my love of
nature and science when she put earthworms in my small hand and explained how important they
were to the garden. While she is not here to see the end of this journey, she told me almost every
day how proud she was of me for everything I have accomplished. That has been the foundation
of all the work, and the strength in my perseverance, that has brought me, finally, to here.
vi
Table of Contents
Abstract…………………………………………………………………………………… ii
Acknowledgements ……………………………………………………………………… iv
Dedication ……………………………………………………………………………….. v
List of Tables……………………………………………………………………………… ix
List of Figures …………………………………………………………………………….. xi
Chapter 1: Introduction: Conservation goals and challenges for belugas (Delphinapterus
leucas) in the Canadian Arctic and sub-Arctic
1.1 Conservation and belugas…………………………………………………….. 1
1.2 Evolution and adaptive potential of belugas………………………………….. 6
1.3 Thesis outline…………………………………………………………………. 10
1.4 References …………………………………………………………………….. 14
Chapter 2: Mitochondrial DNA sequence diversity, population structure, and
phylogeography of belugas (Delphinapterus leucas) in Canadian waters
Abstract…………………………………………………………………………… 23
2.1 Introduction…………………………………………………………………… 24
2.2 Materials and methods
2.2.1 Data collection………………………………………………………. 31
2.2.2 Genetic variability and population structure of geographic
samples……………………………………………………………………. 34
2.2.3 Phylogenetic analyses……………………………………………….. 36
vii
2.2.4 Demographic expansions and haplogroups…………………………. 40
2.3 Results
2.3.1 mtDNA sequence diversity and population structure of
belugas in Canadian waters……………………………………………….. 42
2.3.2 Phylogeographic patterns of belugas inferred from gene
trees and haplotype network………………………………………………. 54
2.3.3 Divergence patterns and dating……………………………………... 64
2.4 Discussion
2.4.1 Population structure of belugas in Canadian waters………………… 75
2.4.2 Influence of dispersal, both historical and contemporary,
on extant beluga population genetic structure…………………………….. 83
2.4.3 Predicting changes in movement patterns and population genetic
structure among Canadian beluga populations……………………………. 94
2.5 Acknowledgements…………………………………………………………… 96
2.6 References …………………………………………………………………….. 96
Appendix 2.1. Summary of results from previous research studies of
mtDNA in beluga populations…………………………………………………….. 113
Appendix 2.2. Information for geographic sample collections used for the
analyses of haplotype diversity (Table 2.2) and geographic differentiation
(Table 2.3)………………………………………………………………………… 116
Appendix 2.3. Results of re-analysis of summer and winter beluga sample
collections using only samples collected in the period 2000-2008
(Nsamples = 718)…………………………………………………………………….. 119
viii
Appendix 2.4 Alignment of polymorphic sites in N=83 haplotypes found
in main geographic beluga sample collections (N=1377 samples)………………… 122
Chapter 3: Fine-scale genetic structure of nearshore beluga (Delphinpaterus leucas)
aggregations in the Eastern Beaufort Sea: are kin groups being impacted by harvesting?
Abstract……………………………………………………………………………. 125
3.1 Introduction……………………………………………………………………. 126
3.2 Materials and methods
3.2.1 Study area and samples……………………………………………… 133
3.2.2 DNA extraction and sex identification……………………………… 136
3.2.3 Microsatellite genotyping…………………………………………… 136
3.2.4 Validity and variability of microsatellite markers…………………... 137
3.2.5 Relatedness within geographic areas of interest…………………….. 139
3.2.6 Network clustering analyses based on pairwise
relatedness of individuals…………………………………………………. 141
3.2.7 Bayesian and multivariate clustering analyses……………………… 143
3.2.8 Mitochondrial DNA control region sequencing…………………….. 145
3.3 Results
3.3.1 Validity and variability of microsatellite markers…………………... 148
3.3.2 Relatedness and network clustering analyses……………………….. 152
3.3.3 Analyses with STRUCTURE……………………………………….. 164
3.3.4 Discriminant Analysis of Principal Components (DAPC)………….. 166
3.3.5 Mitochondrial DNA control region sequencing…………………….. 169
ix
3.4 Discussion …………………………………………………………………….. 180
3.5 Acknowledgements…………………………………………………………… 188
3.6 References …………………………………………………………………….. 189
Appendix 3.1 Multiplex amplification reaction mixtures,
amplification conditions, and pooling ratios for beluga microsatellite
genotypes in this study……………………………………………………………. 202
Chapter 4: Mitochondrial genome diversity and phylogenetic patterns among Canadian
belugas (Delphinapterus leucas), with comparisons to narwhal (Monodon monoceros)
mitogenomes
Abstract…………………………………………………………………………… 211
4.1 Introduction…………………………………………………………………… 212
4.2 Materials and Methods
4.2.1 Sample selection……………………………………………………. 217
4.2.2 Complete mitochondrial genome sequencing………………………. 222
4.2.3 Complete mitochondrial genome assembly………………………… 224
4.2.4 Mitogenome sequence variability and differentiation among
sample collections……………………………………………………….... 226
4.2.5 Phylogenetic analyses of complete mitogenome sequences………... 227
4.2.6 Mitogenome codon substitution patterns and evidence
of selection………………………………………………………………... 230
x
4.3 Results
4.3.1 Complete mitogenome sequencing workflow for beluga and
narwhal…………………………………………………………………… 233
4.3.2 Mitogenome sequence data analyses………………………………. 237
4.3.3 Phylogenetics of complete mitogenome sequences of beluga
and narwhal……………………………………………………………….. 246
4.3.4 Mitogenome codon diversity and signatures of selection…………... 256
4.4 Discussion …………………………………………………………………….. 259
4.5 Acknowledgements…………………………………………………………… 269
4.6 References …………………………………………………………………….. 269
Appendix 4.1. Haplotypes for beluga samples based on complete mitochondrial
genome sequences (16,385bp) as compared to control region mtDNA (609bp)
haplotypes…………………………………………………………………………. 280
Chapter 5: Summary, directions for further research and conclusions
5.1 Introduction…………………………………………………………………… 283
5.2 Key findings and future research directions
5.2.1 Conservation and management units for beluga whales in
Canadian waters…………………………………………………………... 284
5.2.2 Phylogeography of Canadian belugas………………………………. 286
5.2.3 Relatedness and fine-scale stock structure for nearshore
aggregations of Beaufort Sea belugas…………………………………….. 287

xi
5.2.4 Mitogenomics as a tool for investigating beluga population
genetics and molecular ecology…………………………………………... 289
5.3 Conclusion……………………………………………………………………. 291
5.4 References …………………………………………………………………….. 292
xii
List of Tables
Table 2.1. Distribution of haplotypes (N=111) from beluga samples collected in
Canadian Waters (Figure 2.1)……………………………………………………………... 45
Table 2.2. Summary of haplotype diversity found in only the summer and winter
beluga sample collections (Nsamples=1377)……………………………………………….... 48
Table 2.3. Patterns of differentiation based on genetic distance among summer and
winter beluga sample collections (Nsamples=1377)…………………………………………. 51
Table 2.4. Results of Maximum Likelihood tests for fits of different nucleotide
substitution models for 1377 haplotype sequences (609bp) from summer and
winter beluga sample collections (see Figure 2.1) as calculated in MEGA6……………... 57
Table 2.5. Pairwise divergence estimates based on nucleotide diversities for the
3 Haplogroups of beluga whale haplotypes……………………………………………….. 64
Table 2.6. Results of neutrality tests for significantly differentiated sample
collections (Table 2.3) and for all sample haplotypes combined according
to geographic haplogroup patterns (Figure 2.9)…………………………………………... 68
Table 2.7. Parameters of demographic expansion for geographic lineages
found in Canadian beluga whale samples as estimated by mismatch analysis…………… 74
Table A2.1. Summary of haplotype diversity found in only the summer
and winter beluga sample collections 2000-2008………………………………………… 119
Table A2.2. Patterns of differentiation based on genetic distance among summer
and winter beluga sample collections 2000-2008………………………………………… 120
Table 3.1. Summary of samples analyzed from each location. Note that number
of females and number of males do not always total final number as PCR
amplifications for sex determination failed in some samples…………………………… 150
Table 3.2. Measures of nuclear genetic diversity by sampling locations………………... 151
Table 3.3. Summary of mtDNA haplotype diversity found in beluga sample
collections……………………………………………………………………………….. 170
xiii
Table 3.4. Patterns of mtDNA differentiation based on genetic distance among
sample locations (Nsamples=1032)………………………………………………………… 173
Table 3.5. Patterns of differentiation based on mtDNA genetic distance
among sample collections (Nsamples=1032) divided by decades 1980s, 1990s,
and 2000s………………………………………………………………………………... 177
Table 3.6. Summary of mtDNA haplotype diversity found in beluga sample
collections grouped by decade 1980s, 1990s, and 2000s……………………………….. 180
Table 4.1. Mitogenome sequencing run summary statistics for beluga and narwhal
samples (averaged across sequencing runs/samples)……………………………………... 235
Table 4.2. Complete mitogenome genetic variability among beluga sample
collections and beluga clades (as identified in Section 4.3.3)…………………………….. 238
Table 4.3. Summary of beluga mitogenome haplotypes found in multiple samples............ 243
Table 4.4. Comparison of mtDNA control region (CR) sequence information to
complete mitochondrial genomes for beluga and narwhal………………………………... 245
Table 4.5. Intra- and interspecific diversity and divergence in mtDNA protein-coding
genes of beluga compared to narwhal…………………………………………………….. 258
Table 4.6. McDonald-Kreitman test to evaluate departures from selective neutrality
in mtDNA protein-coding genes among beluga clades…………………………………… 258
xiv
List of Figures
Figure 1.1. The global extant range of belugas…………………………………………….. 2
Figure 2.1. Locations of beluga sample sources for all mtDNA haplotypes
(N=2540) analyzed in this study………………………………………………………….. 32
Figure 2.2. Principal Coordinates Analysis (PCoA) using ΦPT genetic distance matrix
for mtDNA haplotypes from summer and winter beluga whale sample collections
(Table 2.3)………………………………………………………………………………… 52
Figure 2.3. Evolutionary relationships of summer and winter beluga whale sample
collections (Nsamples=1377) based on mtDNA haplotypes and inferred using the
Neighbour-Joining method……………………………………………………………….. 53
Figure 2.4. Evolutionary relationships of beluga whale mtDNA control region
haplotype sequences (N=83) inferred from phylogenetic analysis using
Bayesian inference………………………………………………………………………... 58
Figure 2.5. Evolutionary relationships of beluga whale mtDNA control region
haplotype sequences (N=83) inferred from phylogenetic analysis using
Maximum Parsimony……………………………………………………………………... 59
Figure 2.6. Evolutionary relationships of beluga whale mtDNA control region
haplotype sequences (N=83) inferred from phylogenetic analysis by
Maximum Likelihood…………………………………………………………………….. 60
Figure 2.7. Median-joining phylogenetic network for all beluga mtDNA haplotypes
(609bp sequences) identified in this study (Table 2.1) and found in
N>2 individuals (Nhaplotypes= 85, Nsamples= 2506)…………………………………………. 62
Figure 2.8. Distribution of haplogroups (Haplogroup 1A, Haplogroup 1B and
Haplogroup 2) among summer and winter beluga whale sample collections
(Table 2.3)………………………………………………………………………………… 63
Figure 2.9. Observed mismatch distribution (dotted line) for all Canadian beluga
summer and winter samples combined (N=1377) compared to the bell-shaped
curve (solid line) expected for the data if population expansion has occurred
in the past………………………………………………………………………………….. 69
xv
Figure 2.10. Observed mismatch distribution (dotted line) for Beaufort Sea samples,
characterized by Haplogroup 1B (N=301), compared to the bell-shaped curve
(solid line) expected for the data if population expansion has occurred in the past………. 70
Figure 2.11. Observed mismatch distribution (dotted line) for central Canadian
sample locations i.e. High Arctic, Cumberland Sound, Western Hudson Bay,
and Belcher Islands harvest, characterized by Haplogroup 1A (N=798), compared
to the bell-shaped curve (solid line) expected for the data if population expansion
has occurred in the past……………………………………………………………………. 71
Figure 2.12. Observed mismatch distribution (dotted line) for combined Belcher
Island entrapment samples and Long Island, characterized by Haplogroup 2 (N=95),
compared to the bell-shaped curve (solid line) expected for the data if population
expansion has occurred in the past………………………………………………………… 72
Figure 2.13. Observed mismatch distribution (dotted line) for (A) James Bay (N=28);
(B) Eastern Hudson Bay (N=30); and (C) St. Lawrence Estuary beluga samples
(N=125) compared to the curve (solid line) expected under a model population
growth or decline………………………………………………………………………….. 73
Figure 2.14. Distribution of haplotypes among summer and winter sample
collections that are significantly differentiated based on genetic distance (Table 2.3)…… 76
Figure A2.1 Principal Coordinates Analysis (PCoA) using ΦPT genetic distance
matrix for mtDNA haplotypes from summer and winter beluga whale sample
collections 2000-2008…………………………………………………………………….. 121
Figure 3.1. Sampling locations for Eastern Beaufort Sea stock of beluga whales
used in this study. Symbols indicate the current hunting camps (black triangle)
and main communities (white square) participating in beluga harvest monitoring………. 134
Figure 3.2. Relatedness of beluga samples from Shallow/Niaquunaq Bay harvested
by hunting camps on the same day………………………………………………………... 153
Figure 3.3. Relatedness of beluga samples from Shallow/Niaqunnaq Bay harvested
by hunting camps in the same decade…………………………………………………….. 154
xvi
Figure 3.4. Relatedness of male beluga samples (N=706) from: Shallow/Niaqunnaq
Bay (NBNB) (note that the duplication of “NB” and other location abbreviations
denotes an estimation of relatedness within the aggregation area rather than between
areas); East Mackenzie Bay (EMEM); Kugmallit Bay (KBKB); Paulatuk (PAPA);
2006 Husky Lakes (HAHA); and the St. Lawrence Estuary population (SLSL)………… 155
Figure 3.5. Relatedness of female beluga samples (N=209) from: Shallow/Niaqunnaq
Bay (NBNB) (note that the duplication of “NB” and other location abbreviations
denotes an estimation of relatedness within the aggregation area rather than
between areas); East Mackenzie Bay (EMEM); Kugmallit Bay (KBKB);
Paulatuk (PAPA); 2006 Husky Lakes (HAHA); and the St. Lawrence
Estuary population (SLSL)……………………………………………………………….. 156
Figure 3.6. Relatedness of all (male and female) beluga samples (N=964) from
Shallow/Niaqunnaq Bay (NBNB) (note that the duplication of “NB” and other
location abbreviations denotes an estimation of relatedness within the aggregation
area rather than between areas); East Mackenzie Bay (EMEM); Kugmallit Bay
(KBKB); Paulatuk (PAPA); 2006 Husky Lakes (HAHA); and the St. Lawrence
Estuary population (SLSL)………………………………………………………………... 157
Figure 3.7. Network of male and female beluga samples from all Beaufort Sea
sampling locations (Shallow/Niaqunnaq Bay, East Mackenzie Bay, Kugmallit
Bay, and Husky Lakes), and the St. Lawrence Estuary, coloured based on
group assignment: (A) to three groups found by the fast greedy method;
(B) to three groups found by the leading eigenvector method; and (C) to six
groups found by the spinglass community method……………………………………….. 160
Figure 3.8. Network of male beluga samples (N=668) from all Beaufort Sea
sampling locations (Shallow/Niaqunnaq Bay, East Mackenzie Bay, Kugmallit
Bay, and Husky Lakes), coloured based on group assignment: (A) to two
groups found by the fast greedy method; (B) to three groups found by the
leading eigenvector method; and (C) to three groups found by the spinglass
community method……………………………………………………………………….. 161
Figure 3.9. Network of female beluga samples (N=168) from all Beaufort Sea
sampling locations (Shallow/Niaqunnaq Bay, East Mackenzie Bay, Kugmallit
Bay, and Husky Lakes), coloured based on group assignment: (A) to four groups
found by the fast greedy method; (B) to three groups found by the leading
eigenvector method; and (C) to four groups found by the spinglass community
method…………………………………………………………………………………….. 162
xvii
Figure 3.10. Network of all (male and female) beluga samples (N=858) from
all Beaufort Sea sampling locations (Shallow/Niaqunnaq Bay, East Mackenzie
Bay, Kugmallit Bay, and Husky Lakes), coloured based on group assignment:
(A) to three groups found by the fast greedy method; (B) to three groups found
by the leading eigenvector method; and (C) to nine groups found by the spinglass
community method. For ease of visualization, all connections with relatedness
values < 0.35 were truncated to 0…………………………………………………………. 163
Figure 3.11. (A) Bayesian clustering assignment of individual beluga samples
(N=964) into K=2 clusters based on microsatellite data. Each vertical column
represents one individual, with the length of the coloured segments proportional
to the assignment strength of that individual to one of the clusters. Samples are
grouped by sampling locations from left to right: 1) Kugmallit Bay; 2) East
Mackenzie Bay; 3) Shallow/Niaqunnaq Bay; 4) Paulatuk; 5) 2006 Husky Lakes;
6) 1989 Husky Lakes; 7) 1996 Husky Lakes; and 8) St. Lawrence Estuary. Within
each sample location group, samples are ordered by sampling year. (B) Detection
of the number of K groups that best fit the beluga data performed with the Evanno
method and implemented in Structure Harvester…………………………………………. 161
Figure 3.12. Discriminant Analysis of Principal Components (DAPC) clustering
of male (A) and female (B) beluga samples from all Beaufort Sea
sampling locations (Shallow/Niaqunnaq Bay, East Mackenzie Bay, Kugmallit
Bay, Paulatuk and Husky Lakes), coloured based on group assignment…………………. 167
Figure 3.13. Discriminant Analysis of Principal Components (DAPC) clustering
of male and female beluga samples combined from: (A) all Beaufort Sea sampling
locations (Shallow/Niaqunnaq Bay, East Mackenzie Bay, Kugmallit Bay, Paulatuk
and Husky Lakes); and (B) all Beaufort Sea sampling locations and the
St. Lawrence Estuary, coloured based on group assignment……………………………… 168
Figure 3.14. Distribution of mtDNA haplotypes among sampling locations…………….. 172
Figure 3.15. Principal Coordinates Analysis (PCoA) using ФPT genetic distance
matrix for mtDNA sequence data for beluga sample locations…………………………… 174
Figure 3.16. Principal Coordinates Analysis (PCoA) using ФPT genetic distance
matrix for mtDNA sequence data for beluga samples grouped by location and
decade of sampling………………………………………………………………………... 176
Figure 4.1. Sampling locations and sample sizes for beluga and narwhal mitochondrial
genome sequences………………………………………………………………………… 218
xviii
Figure 4.2. Summer aggregation ranges of putative narwhal stocks in Canada………….. 221
Figure 4.3. Examples of read coverage against reference mitogenome sequence.
(A) High threshold coverage typical of most samples included in this study;
(B) Poor (below) threshold coverage for samples not included in analyses……………… 236
Figure 4.4. Sequence variation observed within the beluga (A) and narwhal
(B) mitochondrial genomes………………………………………………………………. 240
Figure 4.5. Bootstrap (1000 replicates) consensus Neighbour-Joining tree inferred
from complete narwhal mitochondrial genomes…………………………………………. 250
Figure 4.6. Bootstrap (1000 replicates) consensus Neighbour-Joining tree inferred
from complete beluga mitochondrial genomes…………………………………………… 251
Figure 4.7. Maximum Likelihood tree inferred from complete beluga mitochondrial
genomes split into two parts to highlight sample membership in clades…………………. 252
Figure 4.7, Part B. Clade A (A1 and A2) and Clade B…………………………………… 253
Figure 4.8. Median-joining phylogenetic network for Canada-wide geographic beluga
mitochondrial genome haplotypes (Table 4.1)…………………………………………… 254
Figure 4.9. Median-joining phylogenetic network for Eastern Beaufort Sea beluga
mitochondrial genome haplotypes (Table 4.1)…………………………………………… 255
Figure 4.10. Linear map of complete beluga mitochondrial genome…………………….. 257
1
Chapter 1: Introduction: Conservation goals and challenges for belugas (Delphinapterus
leucas) in the Canadian Arctic and sub-Arctic
1.1 Conservation and belugas
Conservation of wild species is a concept that spans a broad spectrum of goals and
approaches. At one end there is the motivation of how natural biodiversity provides goods,
services and economic benefits for human societies (Cardinale et al. 2012, Reyers et al. 2012,
Kareiva and Marvier 2012). At the other is the desire to conserve species for their own sake, with
an undefinable value derived from their existence (Ehrenfeld 1976, Soulé 1985, Doak et al.
2014). Deciding what, where and how to conserve a species or population is a complicated
formula involving societal values, political intent, and scientific input influenced by limited
human and financial resources (Tear et al. 2005). Priority setting then becomes a critical
exercise. Determining conservation priorities at the species level is usually done using a listing
process that assigns rankings based on levels of threat and likelihood of extinction (Coates and
Atkins 2001, ICUN 2012, COSEWIC 2015). However, actions for conservation efforts often
arise from a mixture of ecological and biological parameters, human values, and practical
management and regulatory considerations (Margules and Usher 1981).
Though Soulé (1985) described conservation biology as a crisis discipline, important
baseline information can be gathered from intact ecosystems and populations that can be used as
references for framing conservation goals and setting targets (Margules and Usher 1981, Caro et
al. 2011). The need for proactive conservation approaches is even more pertinent when dealing
with migratory species, especially if “the migration is seen as a phenomenon of abundance” and
the goal is to protect the abundance rather than preventing the animal’s extinction (Wilcove and
2
Wikelski 2008). These species and populations need to be protected while they are still able to
fulfil the ecological properties and services associated with that abundance (Wilcove and
Wikelski 2008, Rands et al. 2010).
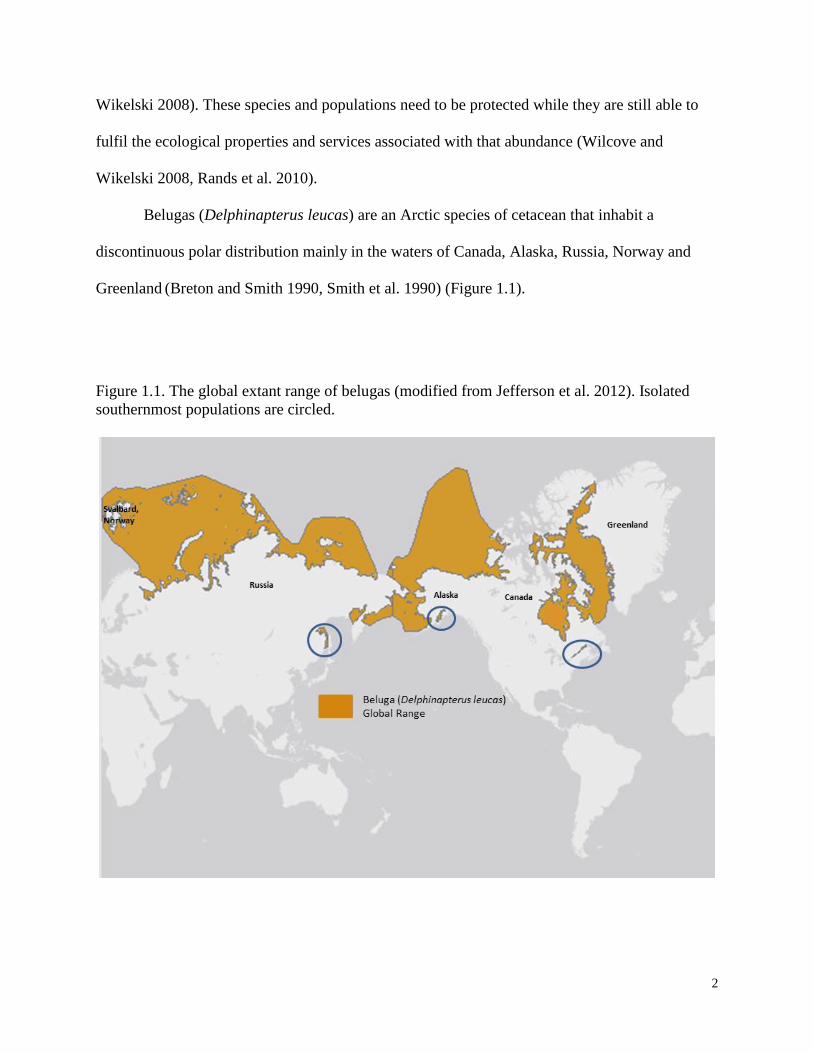
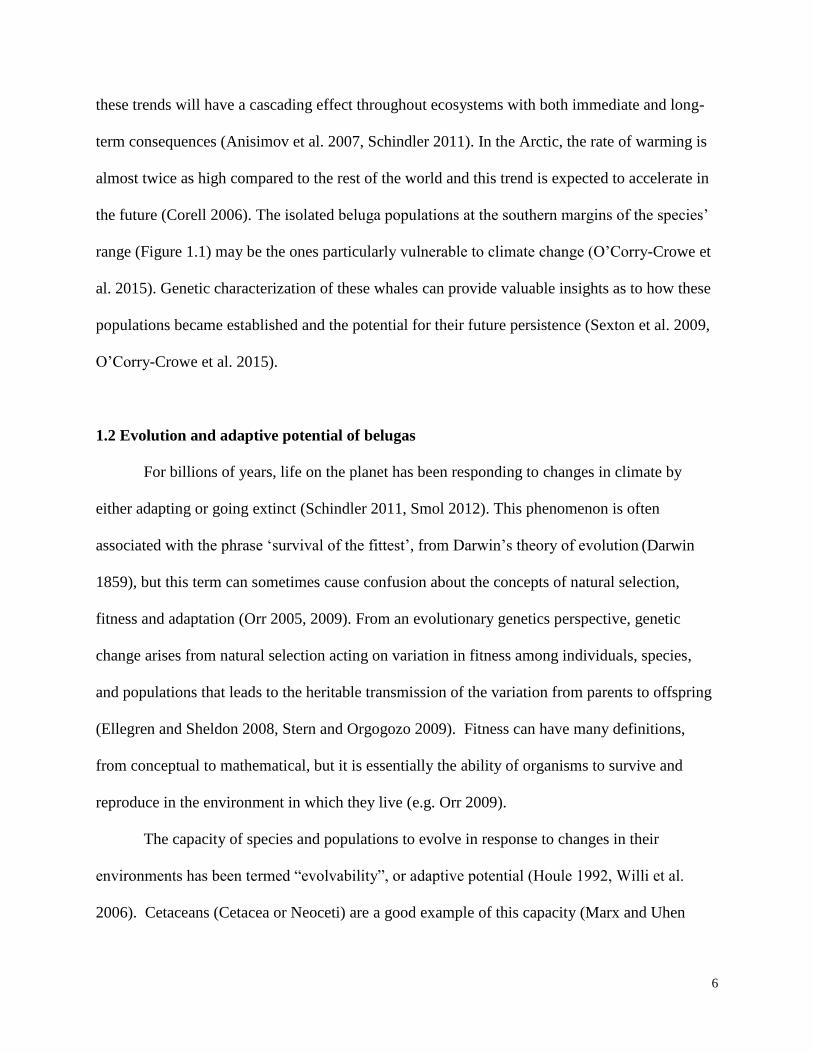
Belugas (Delphinapterus leucas) are an Arctic species of cetacean that inhabit a
discontinuous polar distribution mainly in the waters of Canada, Alaska, Russia, Norway and
Greenland (Breton and Smith 1990, Smith et al. 1990) (Figure 1.1).
Figure 1.1. The global extant range of belugas (modified from Jefferson et al. 2012). Isolated
southernmost populations are circled.
3
Because these marine mammals inhabit an environment dominated by ice for much of the
year, they follow movement patterns that often involve annual migrations covering distances of
thousands of kilometres between summering and wintering areas (Laidre et al. 2008). The global
population of belugas is estimated to be more than 150,000 individuals (Jefferson et al. 2012). In
many regions of their distribution, tens of thousands of belugas form abundant aggregations
along coastlines and in estuaries during the summer (e.g. Harwood et al. 1996, Innes et al. 2002a,
Richard 2005). These predictable seasonal movements of belugas into estuaries and their habit of
congregating close to shore creates an opportunity for the whales to become a target species for
Northern subsistence fisheries (Smith et al. 1990). Throughout their range, belugas are harvested
for consumption (Robards and Reeves 2011, Laidre et al. 2015), but beluga hunts also play an
important role for the cultural identity and social relationships among indigenous peoples (e.g.
Tyrrell 2007). In addition to being a source of food, belugas can also provide local communities
economic value from whale-watching (Orams 2000, Dressler et al. 2001) that draws the interest
of the public to “popular charismatic species” (Barua et al. 2011). In fact, the economic
importance of eco-tourism may be of greater value than harvesting in some locations (Stewart et
al. 2005, Stewart and Draper 2007). Thus, the conservation of belugas, from the species, to
populations, and to local subpopulations, becomes important not just for the inherent value of
protecting biodiversity for its own sake (Doak et al. 2014), but also to meet the food, cultural,
and economic benefits for many northern communities (e.g. Richard and Pike 1993).
The conservation risk status for belugas in Canada is assessed by the Committee on the
Status of Endangered Wildlife in Canada (COSEWIC 2015, 2016). This group provides
information and advice that forms the basis of management objectives for conservation and
management units, or stocks, of belugas. Summer aggregations of beluga in estuaries
4
traditionally have been the basis for defining stocks in the context of whaling (Reeves and
Mitchell 1989, IWC 2000). Stock boundaries, however, are not fixed – they sometimes overlap
spatially and may have a temporal dimension as well. Also, belugas often form large herds of
several hundred to more than a thousand animals, and group structure appears to be fluid, with
few stable associations (O’Corry-Crowe 2009). When possible, stock definition decisions should
be informed by as much information as possible such as TEK (Traditional Ecological
Knowledge), genetic, morphological, behavioural, telemetric, and contaminant evidence (IWC
2000, COSEWIC 2004, COSEWIC 2016). However, the interactions of people and beluga as a
resource could also be reflected in the identification of a stock. Innes et al. (2002b) define beluga
stocks based on the annual migration path (summering areas and migration routes), and the
opportunity hunters have to hunt the whales during the migration. Furthermore, Innes et al.
(2002b) argue that the migration pattern is a cultural trait of the beluga, and it is this trait, not a
biological one, that determines which individual belugas are hunted by which hunters. Stewart
(2008) reviews this, plus several other concepts of ‘stock’, and defines a stock as “a specific part
of a population impacted by human activity (including potential utilization) in a way that affects
population productivity”. Thus, the approaches that are used to refine the identification of beluga
stocks may vary, but all ultimately aim to achieve management of marine resources that
effectively combines the objectives of meeting societal needs and eliminating or mitigating
detrimental anthropogenic impacts (Waples et al. 2008).
Currently, COSEWIC (2016) recognizes eight Designatable Units (DUs) of belugas in
Canada. These DUs, which are units of the taxonomic species, are defined using a combination
of discreteness, which may involve genetic, geographic and/or eco-geographic region
discreteness; and various indicators of evolutionary significance. In this case, significance is
5
evaluated in terms of the evolutionary legacy of the species unit, and whether or not its loss
would be irreplaceable through natural means (COSEWIC 2012, 2016). Based on previous and
current COSEWIC assessments (COSEWIC 2004, 2014, 2016), belugas DUs in Canada include:
St. Lawrence Estuary (Endangered); Cumberland Sound (Threatened); Eastern Hudson Bay
(Endangered); James Bay (Not Assessed); Eastern High Arctic-Baffin Bay (Special Concern);
Ungava Bay (Endangered); Eastern Beaufort Sea (Not at Risk); and Western Hudson Bay
(Special Concern). In addition to natural mortality (e.g. predation by killer whales and polar
bears, ice entrapments, harmful algal blooms), these belugas are subject to different levels of
known or potential anthropogenic impacts (e.g. harvesting, oil and gas exploration, commercial
fisheries, hydroelectric development, shipping, habitat disturbance, and environmental pollution)
(COSEWIC 2004, Huntington 2009, Jefferson 2012). Furthermore, the effects of climate change
will likely amplify the nature and magnitude of these activities (Huntington 2009, Jefferson et al.
2012) and will impact the distribution and abundance of sea-ice critical to beluga habitat and
ecosystems (Laidre et al. 2008, O’Corry-Crowe 2008). In the winter, beluga depend on areas
where they can have access to air such as in recurring polynyas and open water formed under the
influence of bottom topography and currents (Breton and Smith 1990). Changing climate could
alter the stability of polynyas, both regarding the timing of sea ice changes and increased
competition for resources (Heide-Jørgensen et al. 2013). Changes in sea ice conditions
associated with winter habitats used by belugas may also increase the risks of ice entrapment
mortality (Laidre and Heide-Jørgensen 2005).
Increasing the concerns over climate change are the observations that warming effects are
most prominent in the polar regions and they are happening at an unprecedented rate (e.g. Corell
2006, Anisimov et al. 2007, Moline et al. 2007, Post et al. 2009, Smol 2012). The impacts of
6
these trends will have a cascading effect throughout ecosystems with both immediate and long-
term consequences (Anisimov et al. 2007, Schindler 2011). In the Arctic, the rate of warming is
almost twice as high compared to the rest of the world and this trend is expected to accelerate in
the future (Corell 2006). The isolated beluga populations at the southern margins of the species’
range (Figure 1.1) may be the ones particularly vulnerable to climate change (O’Corry-Crowe et
al. 2015). Genetic characterization of these whales can provide valuable insights as to how these
populations became established and the potential for their future persistence (Sexton et al. 2009,
O’Corry-Crowe et al. 2015).
1.2 Evolution and adaptive potential of belugas
For billions of years, life on the planet has been responding to changes in climate by
either adapting or going extinct (Schindler 2011, Smol 2012). This phenomenon is often
associated with the phrase ‘survival of the fittest’, from Darwin’s theory of evolution (Darwin
1859), but this term can sometimes cause confusion about the concepts of natural selection,
fitness and adaptation (Orr 2005, 2009). From an evolutionary genetics perspective, genetic
change arises from natural selection acting on variation in fitness among individuals, species,
and populations that leads to the heritable transmission of the variation from parents to offspring
(Ellegren and Sheldon 2008, Stern and Orgogozo 2009). Fitness can have many definitions,
from conceptual to mathematical, but it is essentially the ability of organisms to survive and
reproduce in the environment in which they live (e.g. Orr 2009).
The capacity of species and populations to evolve in response to changes in their
environments has been termed “evolvability”, or adaptive potential (Houle 1992, Willi et al.
2006). Cetaceans (Cetacea or Neoceti) are a good example of this capacity (Marx and Uhen
7
2010). Their evolution began as a transition from land to an obligate aquatic environment
(Thewissen et al. 2001). Subsequent adaptive radiation among cetaceans has been linked to
periods of ocean restructuring (Steeman et al. 2009) and to changes in oceanic currents and sea
surface temperatures that resulted in increased diatom diversity and productivity (Marx and Uhen
2010). In modern cetaceans, two whale clades are identified by adaptive strategies for feeding:
the mysticetes, or filter-feeding baleen whales, and the odontocetes, the toothed whales that
pursue larger prey using echolocation (Marx and Uhen 2010).
The only two living species of the cetacean family Monodontidae, beluga and narwhal
(Monodon monoceros), are also the only toothed-whale species found year-round in Arctic
waters. The oldest fossil evidence of an extinct Miocene monodontid lineage (Denebola
brachycephala) was found in Baja California, Mexico (Barnes 1984). The dating of these
materials suggests that monodontids originated in warm water environments at temperate
latitudes (Barnes 1984). Extinct whale lineages in fossil deposits found along the North Carolina
and Virginia coastlines of the North Atlantic Ocean were also dated to the Miocene and Pliocene
(approximately 17 to 4.5 million annum (Ma) before present (BP)) (Whitmore 1994). It is from
these same deposits that an additional early Pliocene beluga-like cetacean was identified,
Bohaskaia monodontoides (Vélez-Juarbe and Pyenson 2011). These occurrences of extinct
monodontid lineages at temperate latitudes in both the Pacific and Atlantic Ocean basins provide
some evidence that cold-climate adaptations may have evolved recently in cetacean lineages.
These lineages may have then developed into extant belugas and narwhals; therefore the
expansion of monodontids into the Arctic and sub-Arctic could be a relatively recent
phenomenon on an evolutionary scale (Vélez-Juarbe and Pyenson 2011).
8
Adaptations may occur by processes that are linked to both short-term ecological and
long-term evolutionary responses (Ungerer et al. 2008). In line with both types of processes,
belugas show adaptations that include physical, physiological, and behavioural features for
Arctic conditions that are common among polar mammals (Blix 2016). Physical adaptations
include a thick, insulating blubber layer that can comprise over 40% of body weight (Sergeant
and Brodie 1969). This barrier may also serve as an energy store during times of limited food
availability, as well as other functions specific to a cold water aquatic environment (Koopman
2007). Belugas have a small head, tail and flippers (O’Corry-Crowe 2009) that are consistent
with Allen’s rule that the lengths of limbs and other extremities tend to decrease from warmer to
colder climates as a strategy to reduce heat loss (Blix 2016, Hagen 2017). The presence of a
dorsal ridge instead of a dorsal fin in belugas is considered to be an adaptation for surfacing in an
ice-covered habitat or limiting heat loss (O’Corry-Crowe et al. 2009). However, the dorsal ridge
may not, in fact, be an adaptation specific to ice-covered waters as it is not unique to whales in
these environments (Werth et al. 2012). Instead, Werth et al. (2012) suggest that fat pads along
the abdomen are more likely to be an adaptation in monodontids for moving and foraging in ice-
covered habitats. These assist in controlling agile movements like inverted swimming, rolling
and whole body turns characteristic of belugas and narwhal. Belugas also display physiological
specializations for a sea-ice environment, such as high myoglobin content at birth that increases
rapidly to adult levels (Noren and Suydam 2016). This biochemistry facilitates breath-holding
over long periods for foraging and moving among breathing holes (Noren and Suydam 2016).
Whale evolution has also involved significant transformations of brain size and brain
morphology, to the point that brain complexity in modern cetaceans, particularly in odontocetes
(the toothed whales), is surpassed only by humans (Marino 2004). Coincident with these big
9
brain sizes, odontocetes have also evolved sophisticated social systems (Connor et al. 1998,
Marino 2004, Silk 2007a). The evolution of sociality in mammals occurs when the benefits of
living in groups (e.g. protection from predators, foraging success, mating success) outweighs the
costs that can arise from adverse effects such as competition (Silk 2007b). Thus, social behaviour
has the potential to influence individual fitness and may be important for processes leading to
adaptations (Silk 2007b, Vander Wal et al. 2015).
Social learning behaviours that are shared within subsets of a population are common
within cetacean species (Whitehead et al. 2004, Cantor and Whitehead 2013). This type of
learning is thought to promote increased ecological success by avoiding the time and energy
costs associated with individual learning (Franz and Nunn 2009). Social learning may, therefore,
be important to one of the most characteristic features of many whales, migration (e.g. Esteban et
al. 2016, Kavanaugh et al. 2017). The evolution of long-distance migration is also a strategy to
maximize fitness in seasonal environments and is facilitated by both behavioural and
physiological adaptations (Alerstam et al. 2003, Avgar et al. 2013). In belugas, the extended
period calves spend with their mothers during nursing and weaning is thought to establish social
learning behaviours related to communication, foraging and movement patterns all important for
migration strategies (Brodie 1969, Tyack 1986, Colbeck et al. 2013, Krasnova et al. 2014).
Migration patterns vary among beluga stocks and populations across Canada, with associated
costs (e.g. energy use, predation, ice-entrapments, human disturbance) and benefits (e.g. reliable
habitats and resources, energetic benefits, predator avoidance) differing as well. Migration
patterns are thought to have evolutionary flexibility through a dynamic process that can make
rapid changes to movement behaviour (Alerstam et al. 2003). Modern belugas appear to have a
high degree of fidelity to migration patterns but have been shown to shift the timing of
10
movements in response to changes in sea surface temperatures (Bailleul et al. 2012). Thus, the
potential for further behavioural adaptations for seasonal movements, at least for migration
phenology, is present in belugas.
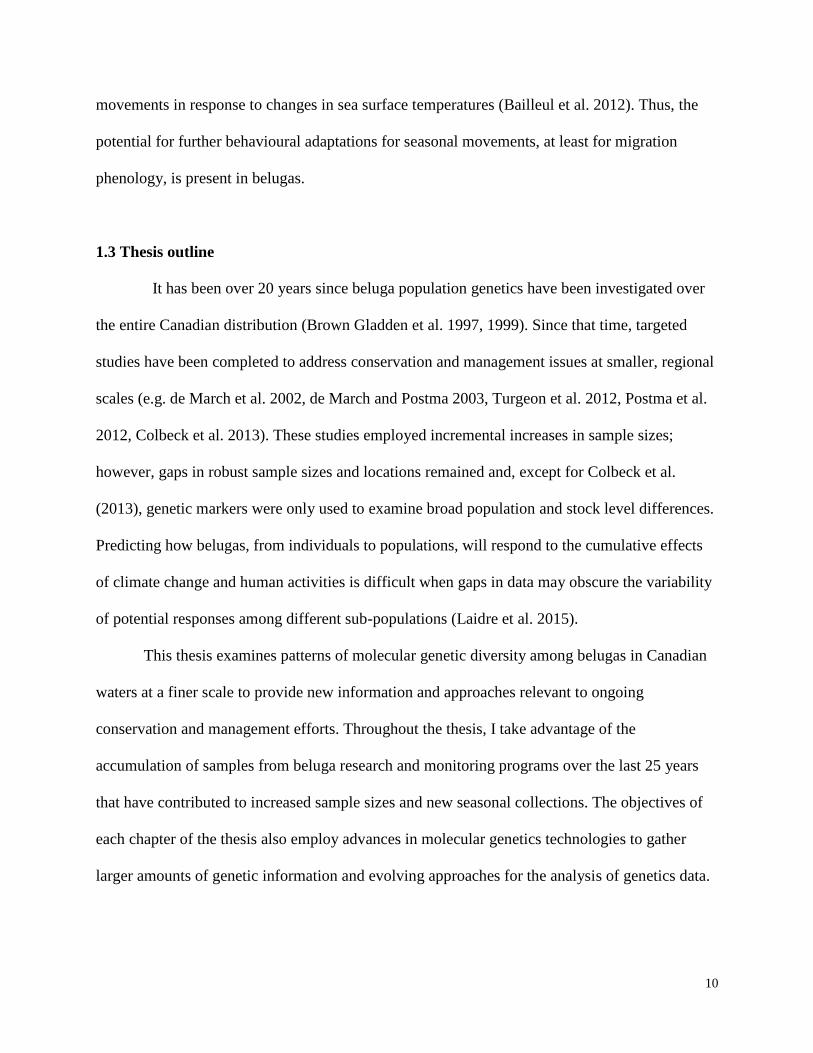
1.3 Thesis outline
It has been over 20 years since beluga population genetics have been investigated over
the entire Canadian distribution (Brown Gladden et al. 1997, 1999). Since that time, targeted
studies have been completed to address conservation and management issues at smaller, regional
scales (e.g. de March et al. 2002, de March and Postma 2003, Turgeon et al. 2012, Postma et al.
2012, Colbeck et al. 2013). These studies employed incremental increases in sample sizes;
however, gaps in robust sample sizes and locations remained and, except for Colbeck et al.
(2013), genetic markers were only used to examine broad population and stock level differences.
Predicting how belugas, from individuals to populations, will respond to the cumulative effects
of climate change and human activities is difficult when gaps in data may obscure the variability
of potential responses among different sub-populations (Laidre et al. 2015).
This thesis examines patterns of molecular genetic diversity among belugas in Canadian
waters at a finer scale to provide new information and approaches relevant to ongoing
conservation and management efforts. Throughout the thesis, I take advantage of the
accumulation of samples from beluga research and monitoring programs over the last 25 years
that have contributed to increased sample sizes and new seasonal collections. The objectives of
each chapter of the thesis also employ advances in molecular genetics technologies to gather
larger amounts of genetic information and evolving approaches for the analysis of genetics data.
11
Chapter 1 introduces the importance of belugas as a species and a resource in Canada, as
well as how conservation and management objectives in Canada are defined. Among Arctic
marine mammals, belugas have been assessed as being moderately sensitive to climate effects
(Laidre et al. 2008), but are in the top 10% of cetacean species predicted to be most affected by
climate-driven changes (Alter et al. 2010). To better understand the sensitivity of belugas to
disturbance and changes in their environment, Chapter 1 also provides some background on the
adaptations belugas display for life in an Arctic environment. Detailed knowledge of genetic
variation and patterns may help to understand this type of adaptive evolution across different
timescales and the potential for change in response to climate effects (Brodersen et al. 2014,
Mathiesen et al. 2017). Any improvement in the knowledge of the variability in movements,
habitat use, behavioural plasticity, and genetic traits that contribute to resilience will be
important elements of beluga management plans (Laidre et al. 2015).
Climate change effects are anticipated to be regionally specific, variable at different
locations, vary in time and space, and be compounded by multiple stressors, and impacts will
vary among species and populations within species (Anisimov et al. 2007, Laidre et al. 2015).
Thus, an important part of the process for defining conservation goals for belugas is the
identification of units for conservation and management at the smallest reasonable scale across
the full extent of the historical range (Reeves and Mitchell 1989, IWC 2000, Waples and Naish
2009). In Chapter 2, therefore, I re-define genetic units for belugas in Canadian waters using
increased sample sizes, greater coverage of the Canadian distribution, and a larger portion of
mitochondrial DNA (mtDNA) control region sequence. The use of a larger number of samples
and more mtDNA sequence information is predicted to identify a greater number of haplotypes
that might provide further divisions of existing stock units. These results could directly impact
12
the future definition of Designatable Units (DUs) of Canadian belugas for COSEWIC (2016),
and will contribute to further considerations of conservation definitions and fisheries
management stocks of belugas. The spatial differentiation of these stocks and degree of overlap
provide a basis for hypotheses about contemporary seasonal habitat use and migration patterns.
Chapter 2 also uses phylogeographic analyses and coalescent approaches to make inferences
about historical patterns of beluga range expansions, timing of haplotype divergence, and post-
glacial colonization routes (e.g. Provan and Bennett 2008, Hickerson et al. 2009). Insight into the
genetic resiliency of belugas during past responses to climate changes in their environment may
help to inform predictions for future impacts.
For belugas, social learning among close kin is considered to be important for the
transmission of seasonal, philopatric patterns of habitat use (Colbeck et al. 2013). As a result of
this behaviour, maternal lineages are highly structured among different areas of summer
aggregations (Brown Gladden et al. 1997, de March and Postma 2003, this thesis Chapter 2). In
Chapter 3, I explore patterns of relatedness within one of the largest beluga stocks in Canada, in
the eastern Beaufort Sea (EBS), to investigate possible fine-scale social structure. Whales present
in the summer form aggregations along nearshore areas over a fairly broad spatial distribution
(Harwood et al. 2014). Previous genetic analyses of this stock suggested microgeographic
structure among locations where whales are hunted for aboriginal subsistence purposes (Brown
Gladden et al. 1997). In Chapter 3, I use microsatellite analysis to evaluate patterns of spatial and
temporal relatedness among samples of harvested belugas, and network and clustering analysis
to test for structure. I hypothesize that fine-scale genetic structure will be detected in the large
EBS stock using comparisons at the individual level. The local geographic structure of mtDNA
haplotypes among harvest samples is also re-assessed using significantly more samples and a
13
larger portion of control region sequence. From this information, possible impacts of human
disturbance and hunting on potential genetic sub-units are assessed.
The technological power to characterize an increasing amount of genetic variation, both
neutral and adaptive, in natural populations has changed dramatically in the last five decades
(Allendorf 2017). As costs increasingly become more affordable to analyze larger numbers of
samples, genomic data are being used to address a broad range of conservation problems such as
delimiting conservation units, assessing past and present connectivity, and assessing adaptive
potential (Corlett 2017). Currently, population genomic resources for belugas have not been fully
developed. Given the utility of mitochondrial DNA for addressing some conservation and
management goals (see Chapters 2 and 3), I develop protocols to sequence complete beluga
mitogenomes using next generation sequencing for Canadian range-wide comparisons (Chapter
4). The utility of this approach to improve the identification of conservation and management
units and to refine phylogenetic patterns is examined. I hypothesize that whole mitogenome
sequences will offer more power to investigate population diversity, structure, and signals of
selection.
A summary of general results and conclusions are presented in Chapter 5, as well as
additional suggestions for further studies.
14
1.4 References
Alerstam, T., Hedenström, A. and Åkesson, S. 2003. Long‐distance migration: evolution and
determinants. Oikos 103: 247-260.
Allendorf, F.W. 2017. Genetics and the conservation of natural populations: allozymes to
genomes. Molecular Ecology 26: 420-430.
Alter, S.E., Simmonds, M.P. and Brandon, J.R. 2010. Forecasting the consequences of climate-
driven shifts in human behavior on cetaceans. Marine Policy 34: 943-954.
Anisimov, O.A., D.G. Vaughan, T.V. Callaghan, C. Furgal, H. Marchant, T.D. Prose, H.
Vilhjálmsson and J.E. Walsh. 2007. Polar regions (Arctic and Antarctic). In M.L. Parry, O.F.
Canziani, J.P. Palutikof, P.J. van der Linden and C.E. Hanson (Eds.), Climate Change 2007:
Impacts, Adaptation and Vulnerability. Contribution of Working Group II to the Fourth
Assessment Report of the Intergovernmental Panel on Climate Change, Cambridge University
Press, Cambridge, pp.653-685.
Avgar, T., Street, G. and Fryxell, J.M. 2013. On the adaptive benefits of mammal migration.
Canadian Journal of Zoology 92: 481-490.
Bailleul, F., Lesage, V., Power, M., Doidge, D.W. and Hammill, M.O. 2012. Migration
phenology of beluga whales in a changing Arctic. Climate Research 53: 169-178.
Barua, M., Root-Bernstein, M., Ladle, R.J. and Jepson, P. 2011. Defining flagship uses is critical
for flagship selection: a critique of the IUCN climate change flagship fleet. AMBIO: A Journal
of the Human Environment 40: 431-435.
Blix, A.S. 2016. Adaptations to polar life in mammals and birds. Journal of Experimental
Biology 219: 1093-1105.
Bonin, A., Nicole, F., Pompanon, F., Miaud, C. and Taberlet, P. 2007. Population adaptive
index: a new method to help measure intraspecific genetic diversity and prioritize populations for
conservation. Conservation Biology 21: 697-708.
Breton, M. and Smith, T.G. 1990. Underwater world: the beluga. Fisheries and Oceans Canada.
Brodersen, J. and Seehausen, O. 2014. Why evolutionary biologists should get seriously
involved in ecological monitoring and applied biodiversity assessment programs. Evolutionary
Applications 7: 968-983.
15
Cantor, M. and Whitehead, H. 2013. The interplay between social networks and culture:
theoretically and among whales and dolphins. Proceedings of the Royal Society of London B:
Biological Sciences 368: 20120340.
Cardinale, B.J., Duffy, J.E., Gonzalez, A., Hooper, D.U., Perrings, C., Venail, P., Narwani, A.,
Mace, G.M., Tilman, D., Wardle, D.A. and Kinzig, A.P. 2012. Biodiversity loss and its impact
on humanity. Nature 486: 59-67.
Caro, T., Darwin, J., Forrester, T., LeDoux-Bloom, C., and Wells, C. 2011. Conservation in the
Anthropocene. Conservation Biology, 26: 185-188.
Coates, D.J. and Atkins, K.A. 2001. Priority setting and the conservation of Western Australia's
diverse and highly endemic flora. Biological Conservation 97: 251-263.
Colbeck, G.J., Duchesne, P., Postma, L.D., Lesage, V., Hammill, M.O. and Turgeon, J. 2013.
Groups of related belugas (Delphinapterus leucas) travel together during their seasonal
migrations in and around Hudson Bay. Proceedings of the Royal Society of London B:
Biological Sciences 280: 20122552.
Corell, R.W. 2006. Challenges of climate change: an Arctic perspective. Ambio 35: 144-152.
Corlett, R.T. 2017. A bigger toolbox: biotechnology in biodiversity conservation. Trends in
Biotechnology 35: 55-65.
COSEWIC. 2004. COSEWIC assessment and update status report on the beluga whale
Delphinapterus leucas in Canada. Committee on the Status of Endangered Wildlife in Canada.
Ottawa. ix + 70 p.
COSEWIC. 2012. Definitions and abbreviations. [Online:
http://www.cosewic.gc.ca/eng/sct2/sct2_6_e.cfm].
COSEWIC 2014. COSEWIC assessment and update status report on the beluga whale (St
Lawrence Estuary population) Delphinapterus leucas in Canada. Committee on the Status of
Endangered Wildlife in Canada. Ottawa
COSEWIC. 2015. Committee on the Status of Endangered Wildlife in Canada
Assessment Process, Categories and Guidelines.
COSEWIC. 2016. Designatable Units for Beluga Whales (Delphinapterus leucas) in Canada.
Committee on the Status of Endangered Wildlife in Canada. Ottawa. 73 pp.
16
Darwin, C.R. 1859. The Origin of the Species. J. Murray, London.
Doak, D.F., Bakker, V.J., Goldstein, B.E. and Hale, B. 2014. What is the future of conservation?
Trends in Ecology and Evolution 29: 77-81.
Dressler, W.H., Berkes, F. and Mathias, J. 2001. Beluga hunters in a mixed economy: managing
the impacts of nature-based tourism in the Canadian western Arctic. Polar Record 37: 35-48.
Ehrenfeld, D.W. 1976. The conservation of non-resources: conservation cannot rely solely on
economic and ecological justifications. There is a more reliable criterion of the value of species
and communities. American Scientist 64: 648-656.
Ellegren, H. and B.C. Sheldon. 2008. Genetic basis of fitness differences in natural populations.
Nature 452: 169-175.
Esteban, R., Verborgh, P., Gauffier, P., Giménez, J., Martín, V., Pérez-Gil, M., Tejedor, M.,
Almunia, J., Jepson, P.D., García-Tíscar, S. and Barrett-Lennard, L.G. 2016. Using a multi-
disciplinary approach to identify a critically endangered killer whale management unit.
Ecological Indicators 66: 291-300.
Frankham, R., 2003. Genetics and conservation biology. Comptes Rendus Biologies 326: 22-29.
Franz, M. and Nunn, C.L. 2009. Rapid evolution of social learning. Journal of Evolutionary
Biology 22: 1914-1922.
Frost, K.J. and Lowry, L.F. 1990. Distribution, abundance and movements of beluga whales,
Delphinapterus leucas, in coastal waters of western Alaska. Canadian Bulletin of Fisheries and
Aquatic Sciences 224: 39-57.
Gienapp, P., C. Teplitsky, J.S. Alho, J.A. Mills and J. Merila. 2008. Climate change and
evolution: disentangling environmental and genetic responses. Molecular Ecology 17: 167-178.
Gilg, O., K.M. Kovacs, J. Aars, J. Fort, G. Gauthier, D. Grémillet, R.A. Ims, H. Meltofte, J.
Moreau, E. Post, N.M. Schmidt, G. Yannic and L. Bollache. 2012. Climate change and the
ecology and evolution of Arctic vertebrates. Annals of the N.Y. Academy of Sciences 1249: 166-
190.
Hagen, J.B. 2017. Bergmann’s Rule, adaptation, and thermoregulation in Arctic animals:
Conflicting perspectives from physiology, evolutionary biology, and physical anthropology after
World War II. Journal of the History of Biology 50: 235-265.
17
Hansen, M.M., Olivieri, I., Waller, D.M., Nielsen, E.E., and the GeM Working Group. 2012.
Monitoring adaptive genetic responses to environmental change. Molecular Ecology 21: 1311-
1329.
Harwood, L.A., Innes, S., Norton, P. and Kingsley, M.C. 1996. Distribution and abundance of
beluga whales in the Mackenzie estuary, southeast Beaufort Sea, and west Amundsen Gulf
during late July 1992. Canadian Journal of Fisheries and Aquatic Sciences 53: 2262-2273.
Heide-Jørgensen, M.P., Burt, L.M., Hansen, R.G., Nielsen, N.H., Rasmussen, M., Fossette, S.
and Stern, H. 2013. The significance of the North Water Polynya to Arctic top predators. Ambio
42: 596-610.
Hendry, A.P., Farrugia, T.J., and Kinnison, M.T. 2008. Human influences on rates of phenotypic
change in wild animal populations. Molecular Ecology 17: 20-29.
Hickerson, M.J., Carstens, B.C., Cavender-Bares, J., Crandall, K.A., Graham, C.H., Johnson,
J.B., Rissler, L., Victoriano, P.F. and Yoder, A.D. 2010. Phylogeography’s past, present, and
future: 10 years after Avise 2000. Molecular Phylogenetics and Evolution 54: 291-301.
Hobbs, R.C., Laidre, K.L., Vos, D.J., Mahoney, B.A., and Eagleton, M. 2005. Movements and
area use of belugas, Delphinapterus leucas, in a Subarctic Alaskan estuary. Arctic 58: 331-340.
Houle, D. 1992. Comparing evolvability and variability of quantitative traits. Genetics 130: 195-
204.
Huntington, H.P. 2009. A preliminary assessment of threats to arctic marine mammals and their
conservation in the coming decades. Marine Policy 33: 77-82.
Innes, S., Heide-Jørgensen, M.P., Laake, J.L., Laidre, K.L., Cleator, H.J., Richard, P. and
Stewart, R.E. 2002. Surveys of belugas and narwhals in the Canadian High Arctic in 1996.
NAMMCO Scientific Publications 4: 169-190.
Innes, S., Muir, D.C., Stewart, R.E., Heide-Jørgensen, M.P. and Dietz, R. 2002b. Stock identity
of beluga (Delphinapterus leucas) in Eastern Canada and West Greenland based on
organochlorine contaminants in their blubber. NAMMCO Scientific Publications 4: 51-68.
IUCN 2012. IUCN Red List Categories and Criteria: version 3.1. Gland, Switzerland and
Cambridge, UK: IUCN. iv + 32pp.
18
IWC. 2000. Status of Monodontid whales: white whale. J. Cetac. Res. Manage. 2 (SUPPL.),
243–250.
Jefferson, T.A., Karkzmarski, L., Laidre, K., O’Corry-Crowe, G., Reeves, R., Rojas-Bracho, L.,
Secchi, E., Slooten, E., Smith, B.D., Wang, J.Y. & Zhou, K. 2012. Delphinapterus leucas. The
IUCN Red List of Threatened Species 2012: e.T6335A17690692.
http://dx.doi.org/10.2305/IUCN.UK.2012.RLTS.T6335A17690692.en
Kareiva, P. and Marvier, M., 2012. What is conservation science? BioScience 62:962-969.
Kavanaugh, A.S, Noad, M.J., Blomberg, S.P., Goldizen, A.W., Kniest, E., Cato, D.H., and
Dunlop, R.A. 2017. Factors driving the variability in diving and movement behavior of
migrating humpback whales (Megaptera novaengliae): implications for anthropogenic
disturbance studies. Marine Mammal Science 33: 413-439.
Laidre, K.L. and Heide-Jørgensen, M.P. 2005. Arctic sea ice trends and narwhal vulnerability.
Biological Conservation 121: 509-517.
Laidre, K.L., I. Stirling, L.F. Lowry, Ø. Wiig, M.P. Heide-Jørgensen and S.F. Ferguson. 2008.
Quantifying the sensitivity of Arctic marine mammals to climate-induced habitat change.
Ecological Applications 18 (Supplement): S97-S125.
Laidre, K.L., Stern, H., Kovacs, K.M., Lowry, L., Moore, S.E., Regehr, E.V., Ferguson, S.H.,
Wiig, Ø., Boveng, P., Angliss, R.P. and Born, E.W. 2015. Arctic marine mammal population
status, sea ice habitat loss, and conservation recommendations for the 21st century. Conservation
Biology 29: 724-737.
Lande, R. 2009. Adaptation to an extraordinary environment by evolution of phenotypic
plasticity and genetic assimilation. Journal of Evolutionary Biology 22: 1435-1446.
Lesage, V. and Kingsley, M.C.S. 1998. Updated status of the St. Lawrence River population of
beluga, Delphinapterus leucas. The Canadian Field-Naturalist 11: 98-114.
MacDonald, G.M. 2010. Global warming and the Arctic: a new world beyond the reach of the
Grinnellian niche? Journal of Experimental Biology 213: 855-861.
Margules, C. and Usher, M.B. 1981. Criteria used in assessing wildlife conservation potential: a
review. Biological Conservation 21: 79-109.
19
Mathiesen, S.S., Thyrring, J., Hemmer‐Hansen, J., Berge, J., Sukhotin, A., Leopold, P., Bekaert,
M., Sejr, M.K. and Nielsen, E.E. 2017. Genetic diversity and connectivity within Mytilus spp. in
the subarctic and Arctic. Evolutionary Applications 10: 39-55.
Marx, F.G. and Uhen, M.D. 2010. Climate, critters, and cetaceans: Cenozoic drivers of the
evolution of modern whales. Science 327: 993-996.
Moline, M., Karnovsky,N.J., Brown, Z., Divoky, G.J., Frazer,T.K., Jacoby, C.A., Torres, J.J.,
and Fraser, W.R. 2008. High latitude changes in ice dynamics and their impact on polar marine
ecosystems. Annals of the NewYork Academy of Science 1134: 267-319.
Möller, L.M. 2012. Sociogenetic structure, kin associations and bonding in delphinids.
Molecular Ecology 21: 745-764.
Noren, S.R. and Suydam, R. 2016. Navigating under sea ice promotes rapid maturation of diving
physiology and performance in beluga whales. Journal of Experimental Biology 219: 2828-2836.
O’Corry-Crowe, G. 2008. Climate change and the molecular ecology of Arctic marine mammals.
Ecological Adaptations 18 (Supplement): S56-S76.
O’Corry-Crowe, G. 2009. Beluga whale, Delphinapterus leucas. In W.F. Perrin, B. Würsig and
J.G.M. Thewissen (Eds.), Encyclopedia of Marine Mammals, Elsevier Academic Press,
Burlingtom, MA, USA.
O'Corry-Crowe, G., Lucey, W., Archer, F.I. and Mahoney, B. 2015. The genetic ecology and
population origins of the beluga whales, Delphinapterus leucas, of Yakutat Bay. Marine
Fisheries Review 77: 47-58.
Orams, M.B. 2000. Tourists getting close to whales, is it what whale-watching is all about?
Tourism Management 21: 561-569.
Orr, H.A. 2005. The genetic theory of adaptation: a brief history. Nature Reviews Genetics 6:
119-127.
Orr, H. Allen. 2009. Fitness and its role in evolutionary genetics. Nature Reviews Genetics 10:
531-539.
Post, E., Forchhammer, M.C., Bret-Harte, M.S., Callaghan, T.V., Christensen, T.R., Elberling,
B., Fox, A.D., Gilg, O., Hik, D.S., Høye, T.T. and Ims, R.A. 2009. Ecological dynamics across
the Arctic associated with recent climate change. Science 325: 1355-1358.
20
Postma, L.D., Petersen, S.D., Turgeon, J., Hammill, M.O., Lesage, V., and Doniol-Valcroze, T.
2012. Belugas in James Bay: a separate entity from Eastern Hudson Bay? Canadian Science
Advisory Secretariat Research Document 2012/074.
Provan, J. and Bennett, K.D. 2008. Phylogeographic insights into cryptic glacial refugia. Trends
in Ecology and Evolution, 23: 564-571.
Rands, M.R., Adams, W.M., Bennun, L., Butchart, S.H., Clements, A., Coomes, D., Entwistle,
A., Hodge, I., Kapos, V., Scharlemann, J.P. and Sutherland, W.J. 2010. Biodiversity
conservation: challenges beyond 2010. Science 329: 1298-1303.
Reeves, R.R. and Mitchell, E. 1989. Status of white whales, Delphinapterus leucas, in Ungava
Bay and eastern Hudson Bay. Canadian Field-Naturalist 103: 220-239.
Reyers, B., Polasky, S., Tallis, H., Mooney, H.A. and Larigauderie, A. 2012. Finding common
ground for biodiversity and ecosystem services. BioScience 62:503-507.
Richard, P.R. and Pike, D.G., 1993. Small whale co-management in the eastern Canadian Arctic:
a case history and analysis. Arctic 46: 138-143.
Richard, P.R., 2005. An estimate of the Western Hudson Bay beluga population size in 2004.
Canadian Science Advisory Secretariat Research Document 2005/017.
Robards, M.D. and Reeves, R.R. 2011. The global extent and character of marine mammal
consumption by humans: 1970–2009. Biological Conservation 144: 2770-2786.
Schindler, D. 2011. The boiling point. Outdoor Canada, May 2011: 71-76.
Sexton, J.P., McIntyre, P.J., Angert, A.L. and Rice, K.J. 2009. Evolution and ecology of species
range limits. Annual Review of Ecology, Evolution, and Systematics 40: 415-436.
Silk, J.B. 2007a. Social components of fitness in primate groups. Science 317: 1347-1351.
Silk, J.B. 2007b. The adaptive value of sociality in mammalian groups. Philosophical
Transactions of the Royal Society B: Biological Sciences 362: 539-559.
Smith, T.G., St. Aubin, D.J., and Geraci, J.R. 1990. Research on beluga whales, Delphinapterus
leucas: introduction and overview. Canadian Bulletin of Fisheries and Aquatic Sciences 224: 1-
6.
21
Smol, J.P. 2012. A planet in flux: how is life on Earth reacting to climate change? Nature 483:
S12-S15.
Soulé, M.E. 1985. What is conservation biology? BioScience 35: 727-734.
Steeman, M.E., Hebsgaard, M.B., Fordyce, R.E., Ho, S.Y., Rabosky, D.L., Nielsen, R., Rahbek,
C., Glenner, H., Sørensen, M.V. and Willerslev, E. 2009. Radiation of extant cetaceans driven by
restructuring of the oceans. Systematic Biology 58: 573-585.
Stern, D.L. and Orgogozo, V. 2009. Is genetic evolution predictable? Science 323: 746-751.
Stewart, R.E. 2008. Redefining walrus stocks in Canada. Arctic 61: 292-308.
Stewart, E.J., Draper, D. and Johnston, M.E. 2005. A review of tourism research in the polar
regions. Arctic: 383-394.
Stewart, E.J. and Draper, D. 2007. A collaborative approach to understanding local stakeholder
perceptions of tourism in Churchill, Manitoba (Canada). Polar Geography 30: 7-35.
Tear, T.H., Kareiva, P., Angermeier, P.L., Comer, P., Czech, B., Kautz, R., Landon, L.,
Mehlman, D., Murphy, K., Ruckelshaus, M. and Scott, J.M. 2005. How much is enough? The
recurrent problem of setting measurable objectives in conservation. BioScience 55: 835-849.
Thewissen, J.G., Williams, E.M., Roe, L.J. and Hussain, S.T. 2001. Skeletons of terrestrial
cetaceans and the relationship of whales to artiodactyls. Nature 413: 277-281.
Tyrrell, M., 2007. Sentient beings and wildlife resources: Inuit, beluga whales and management
regimes in the Canadian Arctic. Human Ecology 35:575-586.
Ungerer, M.C., Johnson, L.C., and Herman, M.A. 2008. Ecological genomics: understanding
gene and genome function in the natural environment. Heredity 100: 178-183.
Vander Wal, E., Festa-Bianchet, M., Réale, D., Coltman, D.W. and Pelletier, F. 2015. Sex‐based
differences in the adaptive value of social behavior contrasted against morphology and
environment. Ecology 96: 631-641.
Vélez-Juarbe, J. and Pyenson, N.D. 2012. Bohaskaia monodontoides, a new monodontid
(Cetacea, Odontoceti, Delphinoidea) from the Pliocene of the western North Atlantic Ocean.
Journal of Vertebrate Paleontology 32: 476-484.
22
Waples, R.S., Punt, A.E. and Cope, J.M. 2008. Integrating genetic data into management of
marine resources: how can we do it better? Fish and Fisheries 9: 423-449.
Waples, R.S. and Naish, K.A., 2009. Genetic and evolutionary considerations in fishery
management: research needs for the future. In R.J. Beamish and B.J. Rothschild (Eds.), The
Future of Fisheries Science in North America, Springer, Netherlands, pp. 427-451.
Whitehead, H., Rendell, L., Osborne, R.W. and Würsig, B. 2004. Culture and conservation of
non-humans with reference to whales and dolphins: review and new directions. Biological
Conservation 120: 427-437.
Whitmore, F.C. 1994. Neogene climatic change and the emergence of the modern whale fauna of
the North Atlantic Ocean. Proceedings of the San Diego Society of Natural History 29: 223-227.
Wilcove, D.S. and Wikelski, M. 2008. Going, going, gone: is animal migration disappearing.
PLoS Biology 6: p.e188.
Willi, Y., Van Buskirk, J. and Hoffmann, A.A. 2006. Limits to the adaptive potential of small
populations. Annual Review of Ecology, Evolution and Systematics 37: 433-458.
23
Chapter 2: Mitochondrial DNA sequence diversity, population structure, and
phylogeography of belugas (Delphinapterus leucas) in Canadian waters
Abstract
The phylogeographic diversity among belugas (Delphinapterus leucas) with seasonal
distributions in Canadian waters can offer important evolutionary and ecological insights for
defining conservation goals for these whales. The geographic patterns of beluga migrations and
summer aggregations can be characterized with molecular genetic markers to examine
biodiversity across the Canadian range, define units for conservation and management
assessments, and provide insights about the historical use of climate refugia and recolonizations
of post-glacial habitats. In this study, I used 609bp of control region mitochondrial DNA
(mtDNA) sequence from 2500 Canadian beluga samples to examine geographic genetic diversity
and evolutionary patterns among 83 haplotypes. The fine-scale resolution of haplotypes and the
addition of new and larger sample collections resulted in the identification of at least nine
genetically distinct summer aggregations, with an additional different sample collection of
unknown summer distribution in southern Hudson Bay and/or James Bay. The patterns of
haplotypes unique to particular sample collections indicate a larger number of non-migratory
beluga populations in Canada than previously known. This result further highlights the
importance of polynyas as winter habitat around the Belcher Islands in SE Hudson Bay and
James Bay. The evolutionary relationships among the haplotypes reveal the most divergent
lineages are found at the east, west and southern edges of the Canadian distribution of belugas,
with the central area characteristic of a contact zone displaying an admixture of lineages.
Furthermore, the present geographic distribution of these lineages suggests multiple glacial
24
refugia as sources of ancestral beluga populations for recolonization of Canadian Arctic and sub-
Arctic waters. Analyses of ancient DNA from historical beluga samples and fossils would
enhance the interpretation of modern day patterns of mtDNA genetic diversity.
2.1 Introduction
Understanding the intraspecific genetic relationships of animals that are highly mobile
and distributed across large ranges is challenging. Over large areas, geographic barriers (such as
rivers, e.g. Eriksson et al. 2004; mountains and valleys, e.g. Zhou et al. 2017; and peninsulas,
e.g. Pelletier et al. 2012) can influence spatial structuring of genetic diversity by restricting gene
flow. Similarly, anthropogenic landscape barriers (such as roads, e.g. Wilson et al. 2015;
fences/barriers, e.g. Bracken et al. 2015; urbanization, e.g. Breyne et al. 2014; and agricultural
development, e.g. Stronen et al. 2012 ) can also shape population genetic substructure,
potentially within a few generations (Wilson et al. 2015).
However, in environments where there are no obvious geographic barriers to dispersal,
population genetic structuring can still occur due to a variety of other factors (Irwin 2002).
Isolation by distance (IBD) (Wright 1943, Malécot 1967, Kimura and Weiss 1964) will cause
patterns of genetic variability due to individual migration distances and mating patterns being
smaller than the species distribution as a whole (e.g. Spice et al. 2012). Thus, with IBD, both
ecological and genetic nuances can shape population structure at different scales (Ishida 2009).
For example, even though seabirds are highly mobile animals with few limitations to dispersal,
genetic differentiation of populations and colonies can be strong and is commonly linked to
selective or behavioural processes (Friesen et al. 2007). Even within the same habitat and
geographic scale, two different seabird species can have sharply contrasting levels of genetic
25
differentiation among colonies due to behavioural differences (i.e. natal and breeding philopatry)
(Levin and Parker 2012). Evaluating the elements that lead to genetic population differentiation
can be even more difficult when both geographic barriers and behavioural processes are at play.
In one study of a tropical bird species (El Oro parakeet, Pyrrhura orcesi), fine-scale genetic
structure was considered to be influenced by a combination of the loss of suitable habitat at
lower elevations due to climate change, human deforestation practices, and a complex social
breeding system that all contributed to limited dispersal (Klauke et al. 2016).
The dispersal potential for marine mammals in many ways parallels that of birds. These
highly mobile animals are often characterized by broad, continuous distributions with few
physical or geographic barriers to movements and gene flow that may facilitate genetically
homogenous populations. For example, despite extensive spatial and temporal sampling, current
genetic analyses of North East Atlantic minke whales (Balaenoptera acutorostrata
acutorostrata) fail to provide any support for geographic or cryptic population genetic structure
(Quintela et al. 2014). However, many marine mammal species do display a high level of
subpopulation differentiation that is shaped by a variety of factors and at different scales.
Worldwide patterns of genetic structure among sperm whales (Physeter macrocephalus) within
and among oceanic basins are thought to result from recent population expansions, breeding
behaviours, female social groups, and geographic philopatry (Alexander et al. 2016). Atlantic
spotted dolphins (Stenella frontalis) show higher-level genetic differences between oceanic and
shelf morphotypes, but also habitat related genetic structure within the shelf lineage that is linked
to depth and sea-surface temperature (Viricel and Rosel 2014). Coastal and pelagic bottlenose
dolphins (Tursiops truncatus) in the North East Atlantic also have a fine-scale population
structure that is maintained by habitat preference (Louis et al. 2014). In long-finned pilot whales
26
(Globicephala melas) from the North Atlantic, social structure due to sex-biased dispersal and
female philopatry, along with possible foraging specializations, are thought to contribute to
regional divergence and genetic population structure (Monteiro et al. 2015). Prey specialization
is also considered to shape genetic differentiation among populations of killer whales (Orcinus
orca), along with dispersal and mating strategies, kin associations, and maternal social structure
(e.g. Hoelzel et al. 2007, Pilot et al. 2010, Parsons et al. 2013).
Belugas (Delphinapterus leucas) are primarily an Arctic species of whale with a large,
discontinuous circumpolar distribution (Figure 1.1; Stewart and Stewart 1989) and a variety of
behavioural and ecological characteristics that could shape genetic differentiation among
populations and subpopulations. For example, over the species distribution, the whales display a
variety of movement patterns that are closely linked to sea-ice and sea-surface temperatures (e.g.
Bailleul et al. 2012, Hauser et al. 2014, Hornby et al. 2016, Hauser et al. 2016). Some beluga
populations have annual patterns of summer and winter area site fidelity resulting in migrations
that may cover thousands of kilometres for some beluga populations (Richard et al. 2001, Hauser
et al. 2014). Conversely, annual movements may only involve relatively small shifts away from
land-fast ice for other, generally isolated, populations (Hobbs et al. 2005, Lefebvre et al. 2012).
Although ice has the potential to limit movements of belugas and even cause death due to ice
entrapments (Heide-Jørgensen et al. 2002), this species, especially adult males, has been shown
to move into areas of dense (>90%) ice cover (Richard et al. 2001, Suydam et al. 2001) to pursue
foraging opportunities (Loseto et al. 2006, 2008).
Evidence from reproductive tract metrics indicates that belugas have a promiscuous
mating system (Kelley et al. 2015) and breeding is thought to occur in late winter to early spring
while whales are in or near wintering areas where several subpopulations, or stocks, may overlap
27
(O’Corry-Crowe 2009, Citta et al. 2017). This behaviour can cause gene flow among stocks and
contribute to a decrease in genetic heterogeneity. Conversely, several other behaviours exhibited
by belugas are thought to promote structuring within populations. Predictable summer
distributions of belugas are generally associated with bays and shallow estuaries (e.g. Richard et
al. 2001, Martin et al. 2001, Gosselin et al. 2002) that have warmer, brackish waters and rocky
bottom substrate thought to facilitate an annual moult (St. Aubin et al. 1990, Boily 1995).
Females with calves and juveniles stay near these shallow coastal areas during the summer,
perhaps for energetic benefits and/or protection from predators such as killer whales (Loseto et
al. 2006). However, males generally disperse offshore to forage in areas of higher productivity
(Suydam et al. 2001, Richard et al. 2001, Loseto et al. 2006). Though Arctic cod (Boreogadus
saida) are a primary prey species for belugas, diet and foraging ecology varies among
populations and stocks with respect to geographic areas and habitats, season, migration patterns
and duration, and range extent (Loseto et al. 2006 , Kelley et al. 2010, Marcoux et al. 2012,
Quakenbush et al. 2015). Similar to other odontocetes, beluga females spend an extended period
(up to 3 years) nursing their calves, with the age of weaning variable among individuals
(Matthews and Ferguson 2015). Maternal investment in nursing and weaning calves is thought to
provide the foundation of beluga social organization, based on learning behaviours related to
communication, foraging and philopatric migration patterns (Brodie 1969, Tyack 1986, Colbeck
et al. 2013, Krasnova et al. 2014).
Other challenges for understanding contemporary genetic structure in populations arise
from the need to interpret the influences of current demographic processes along with
evolutionary and historical signals. Climate fluctuations play a significant role in shaping the
genetic diversity and geographic distribution of both species and genealogical lineages by
28
influencing fragmentation, range expansions and long range colonizations (Friesen et al. 2007).
Historical patterns of glaciation forced species into refugia that, in turn, shaped genetic
signatures of post-glacial movements (Hewitt 1996, 2000, 2004). Specifically, intraspecific
genetic diversity is expected to be high within the refugial areas, followed by declining diversity
away from the refugia due to successive founder events along recolonization routes as ice
recedes (Hewitt 1996, 2000, Slatkin and Excoffier 2012). However, genetic signatures of glacial
refugia may be difficult to detect (Provan and Bennet 2008). Gavin et al. (2014) assert the need
to use a combination of fossil records, species distribution models, and molecular
phylogeographic approaches to investigate the existence of past refugia and to understand their
influence on the current and future “spatiotemporal trajectories of species and populations”.
However, ice-age marine refugia are particularly difficult to identify because of sea level
changes altering coastlines and a lack of a fossil record for many marine species (Provan and
Bennett 2008, Maggs et al. 2008). In this case, phylogeography, the spatial and temporal
distribution of genetic lineages (Avise et al. 1987, 2009), may be the best approach, especially
for within-species and among-population questions about historical migration patterns and the
link between evolutionary and demographic processes (Gavin et al. 2014).
Information about genetic structure and phylogeographic patterns are important elements
for the identification of conservation and management units for wildlife. The Committee on the
Status of Endangered Wildlife in Canada (COSEWIC) recently re-examined belugas in Canada
under the criteria to define Designatable Units (DUs) that are “discrete and evolutionary
significant units of the taxonomic species, where significant means that the unit is important to
the evolutionary legacy of the species as a whole and if lost would likely not be replaced through
natural dispersion” (COSEWIC 2012, 2016). One of the lines of evidence required to identify
29
discreteness and one for evolutionary significance both rely on genetic information from neutral,
relatively slow-evolving genetic markers (COSEWIC 2016).
Mitochondrial DNA (mtDNA) sequence has proven to be a useful tool for the study of
many aspects of beluga population structure, phylogeography, dispersal patterns, and social
structure (see references in Appendix 1). The dominant findings of these studies reveal that
migratory belugas are highly philopatric to relatively discrete summering areas, and these groups
of animals are representative of distinctive maternal genetic lineages (Brennin et al. 1997, Brown
Gladden et al. 1997, O’Corry-Crowe et al. 1997, de March and Postma 2003, Turgeon et al.
2012). Furthermore, phylogeographic relationships among the haplotypes identified patterns of
postglacial recolonizations of North American waters from an eastern or Atlantic refugium and a
western or Pacific refugium (Brennin et al. 1997, Brown-Gladden et al. 1997, de March and
Postma 2003). However, at a finer scale, some phylogenetic and population structure patterns,
especially in Canadian waters, remain unclear (de March and Postma 2003, Turgeon et al. 2012).
In all studies, a small number (N=2 or 3) of dominant haplotypes were found in the majority of
samples (>50%) (Appendix 1). This result may be due to the relatively small portion of
mitochondrial control region sequence analyzed (234 base pairs, bp). Louis et al. (2014) found
that longer (682bp vs. 324bp) mtDNA control region sequences were necessary for the resolution
of bottlenose dolphin ecotypes, and recommended that more extended sequences be used for
investigations of fine-scale genetic structure in delphinids. In addition, samples sizes, especially
in certain areas, may not be sufficient to reveal more complex patterns due to “signal:noise ratio
problems” (Waples 1998). In species with high gene flow, such as belugas, the genetic signal
used to indicate stock structure may be relatively weak, and the “noise” due to biases in the
samples may have a greater impact. One approach to mitigate this effect is to increase sample
30
size and replicate samples over time (Waples 1998). Furthermore, some potentially genetically
distinct aggregations of belugas have not been sampled at all (de March and Postma 2003,
Turgeon et al. 2012). All of these factors have been implicated as a cause for some of the
confusing or inconsistent results for geographic comparisons in these studies, and are likely
contributing to an “insufficient phylogenetic signal” (Palsböll et al. 2002) for mtDNA analyses
of Canadian beluga samples.
In this study, mitochondrial DNA haplotype diversity is assessed across the full
distribution of belugas in Canadian waters, with increased sample sizes at most locations and
samples from previously unsampled areas. The length of the control region analyzed has also
been significantly increased. With this new data, the goals of the analyses are to:
1. Refine our understanding of extant mtDNA genetic variation and population structure of
beluga whales in Canadian waters to be able to update the identification of Designatable
Units (DUs) of belugas in Canada;
2. Infer phylogeographic patterns among beluga haplotypes found in different geographic
summer aggregations and other seasonal groups that define Canadian beluga stocks and
add new information about possible historical patterns underlying present-day genetic
structure;
3. Place this information in the context of potential changes to beluga population structure
in response to changing climate and human activities.
31
2.2 Materials and Methods
2.2.1 Data collection
Sample collection
Beluga whale samples in Canada have been collected for many years through harvest
monitoring programs, research programs such as satellite tagging studies, and opportunistic
sampling of carcases and sloughed skin. Samples in this study have been accessed from archived
tissues (primarily skin and muscle) dating back to the 1980s and held at the Freshwater Institute,
Winnipeg, Manitoba (DFO Central and Arctic). A broad range of geographic sample locations
was considered (Figure 2.1) to encompass the greatest amount of the beluga distribution in
Canadian waters as possible. The sample collections could be grouped into different categories:
1) animals sampled from community harvests occurring along the migration routes of the
belugas in the spring and fall (mainly in N Hudson Bay, Hudson Strait and Ungava Bay); 2)
whales sampled from harvests of animals while they are in annual summer aggregations,
generally late June to August; 3) samples collected from summer aggregations of whales during
satellite tag attachment for tracking programs, or opportunistically from sloughed skin; 4)
belugas sampled from humane harvests of whales unable to escape from winter ice entrapments,
December to March (considered to be ‘winter samples’); and 5) samples collected from
necropsies of beachcast belugas, mainly from the St. Lawrence River Estuary. (See Appendix 2.2
for detailed information on samples for main geographic sample collection comparisons).
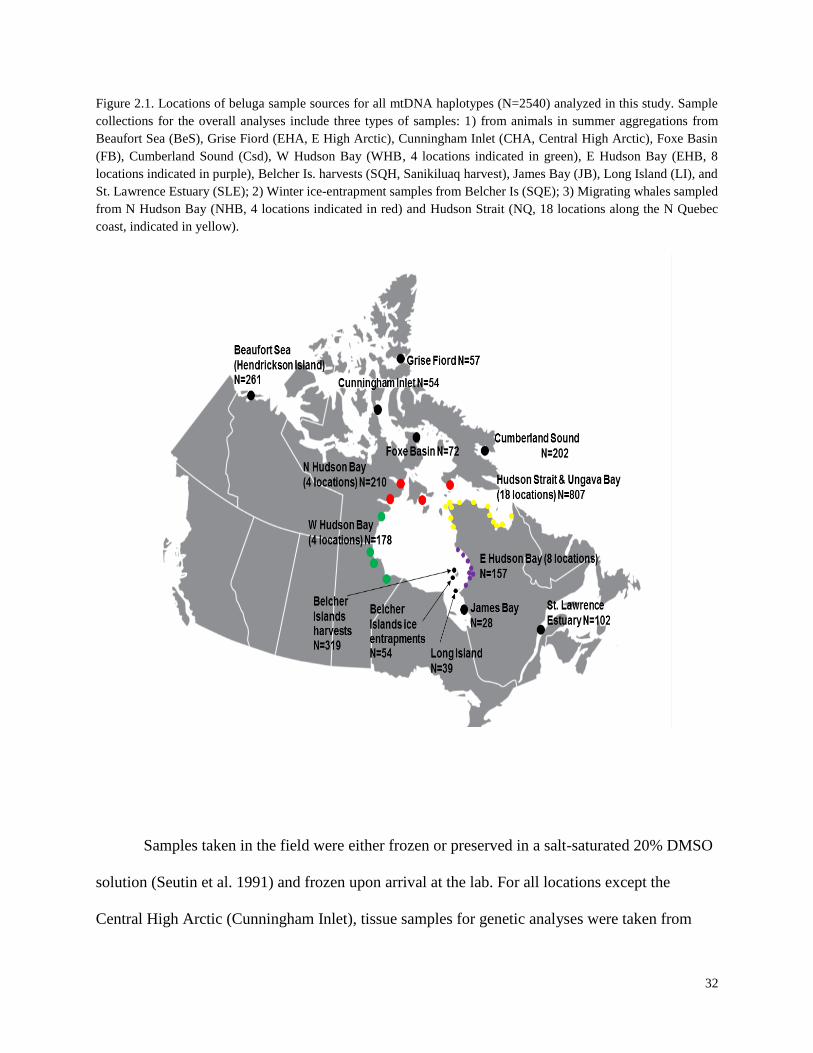
32
Figure 2.1. Locations of beluga sample sources for all mtDNA haplotypes (N=2540) analyzed in this study. Sample
collections for the overall analyses include three types of samples: 1) from animals in summer aggregations from
Beaufort Sea (BeS), Grise Fiord (EHA, E High Arctic), Cunningham Inlet (CHA, Central High Arctic), Foxe Basin
(FB), Cumberland Sound (Csd), W Hudson Bay (WHB, 4 locations indicated in green), E Hudson Bay (EHB, 8
locations indicated in purple), Belcher Is. harvests (SQH, Sanikiluaq harvest), James Bay (JB), Long Island (LI), and
St. Lawrence Estuary (SLE); 2) Winter ice-entrapment samples from Belcher Is (SQE); 3) Migrating whales sampled
from N Hudson Bay (NHB, 4 locations indicated in red) and Hudson Strait (NQ, 18 locations along the N Quebec
coast, indicated in yellow).
Samples taken in the field were either frozen or preserved in a salt-saturated 20% DMSO
solution (Seutin et al. 1991) and frozen upon arrival at the lab. For all locations except the
Central High Arctic (Cunningham Inlet), tissue samples for genetic analyses were taken from
33
dead animals, or satellite tagging programs where there was confidence that replicate sampling
of individuals did not occur. Tissue samples are a by-product during tag attachment, and all
whale handling protocols for satellite telemetry studies were approved by Fisheries and Oceans
Canada Animal Care Committee at the FWI. The Cunningham Inlet samples were collected from
sloughed beluga skin washed onto shore by high wave action. These tissues were all previously
analyzed using 15 microsatellite loci (L. Postma, unpublished data) and replicate samples of
individuals identified using GenAlEx ver. 6 (Peakall and Smouse 2006). Only skin samples from
unique individuals from this location were included in analyses for this study.
DNA extraction and sequencing
Total cellular DNA extractions were performed using proteinase K digestions followed
by a variety of separation methods including phenol:chloroform (Amos and Holzel 1992),
Qiagen spin columns (DNeasy Blood and Tissue Kits), and the Biosprint automated platform
(Qiagen Inc, Valencia, CA, USA).
Mitochondrial DNA (mtDNA) sequences (approximately 700bp) were generated using
amplification reactions designed to target a portion of the mtDNA control region. Primers Belmt-
5 (GAT AGA GTT TTT TGA GCC CG) and Belmt-6 (TCA CCA CCA ACA CCC AAA G)
were used in a polymerase chain reaction (PCR) mixture containing a 1x buffer, 25mM MgCl2,
10mM dNTP mix, 20uM of each primer, 0.5units of Taq polymerase and approximately 50-
200ng of template DNA. The PCR reactions were performed in a total volume of 50µL under the
following conditions: 95°C for10 min.; 35 cycles of 95°C for 20s, 55°C for 30s, 72°C for 45s;
extension at 72°C for 10 min. Products were visualized using agarose gel electrophoresis, and
successfully amplified samples were cleaned using QiaQuick PCR clean-up kits (Qiagen Inc.).
34
DNA sequencing was performed using BigDye ver3.5 (Applied Biosystems) with the Belmt-6
primer as the sequencing primer (2uM). The PCR sequencing temperature profile was: 96°C for
1min.; 32 cycles of 96°C for 10s, 50°C for 30s, and 60°C for 4min; and an extension at 72°C for
7min. Sequencing was performed on an Applied Biosystems 3130xl genetic analyzer (Life
Technologies).
Sequence alignment, editing and identification of haplotypes
DNA sequences were aligned and edited using a combination of approaches (largely due
to the introduction of new software resources over time), either using the Life Technologies
software SeqScape ver. 2.5 for the 3010xl genetic analyzer, or using MEGA (ver. 3 Kumar et al.
2004, ver. 4 Tamura et al. 2007, ver. 5 Tamura et al. 2011). Individual sample sequence
haplotypes, based on 609bp of unambiguous sequence, were assigned using SeqScape ver 2.5 or
using GenAlEx ver. 6 (Peakall and Smouse 2006). All sequences were also visually checked by
eye and haplotypes confirmed. The resulting ‘library’ of unique haplotypes was verified each
time a new haplotype was found using alignment and visualization in the software package DNA
Alignment (www.fluxus-engineering.com). Samples resulting in a new haplotype were also re-
analyzed to verify the sequence. Due to the use of various versions of software and alignment
approaches, after all the data in this study had been collected, N=89 randomly chosen samples
were re-extracted and re-sequenced to estimate the error in haplotype identification.
2.2.2 Genetic variability and population structure of geographic samples
Haplotype frequency distributions and geographic patterns were evaluated for the entire
dataset (all samples from all seasons) and separately for a subset of samples collected from
35
animals located in summer aggregations and winter ice-entrapments. It has been shown that
genetic structuring within beluga populations is influenced by matrilineal migrations patterns
(Brown Gladden et al. 1997, de March and Postma 2003, Turgeon et al. 2010) and that stock
identification is based on annual returns of animals to particular geographic summering areas
(IWC 2000, Richard 2010). Examination of the haplotypes for all samples will allow for the full
range of haplotype diversity in Canadian belugas to be investigated, while analysis of only
summer and winter samples will provide a basis for testing population structuring and
demographic patterns among discrete geographic groups of samples.
Genetic diversity and differentiation were estimated for the summer and winter
geographic sample collections which included Western Hudson Bay (N=118), Beaufort Sea
(N=301), Central High Arctic (N=54), Eastern High Arctic (N=57), Foxe Basin (N=72), James
Bay (N=28), Long Island (N=39), Eastern Hudson Bay (N=30), St. Lawrence Estuary (N=125),
Cumberland Sound (N=186), Belcher Islands harvest (N=311), and Belcher Islands winter ice
entrapments (N=56). The number of different haplotypes (NH), haplotype diversity (h),
nucleotide diversity (π), the number of segregating sites in each group and the average number of
nucleotide differences (k) within sample collections were determined using DnaSP ver. 5.1
(Librado and Rozas 2009). The presence of population structure was assessed using analysis of
molecular variance (AMOVA) between and within the sample collection groups and pairwise
ΦST comparisons using ARLEQUIN ver. 3.5.1.2 (Excoffier and Lischer 2010). AMOVA was
also performed in GenAlEx ver. 6.4 (Peakall and Smouse 2012) under a slightly different null
hypothesis. Instead of a hypothesis of ‘no difference in genetic variation among populations or
sub-populations’, the Ho is that subpopulations are part of a single randomly mating genetic
population. The FST analogue here, ΦPT, is also tested for significance in a slightly different way
36
using randomization of the data with the observed value being included as another permutation
(Peakall and Smouse 2010).
The matrix of ΦPT pairwise differences produced in GenAlEx (Peakall and Smouse 2012)
was then used in a Principal Coordinates Analysis (PCoA) as a way to visualize the patterns of
genetic relationships among the summer and winter sample collections based on genetic
distance. Evolutionary relationships among the collections were also inferred from a Neighbour-
Joining (NJ) tree calculated in MEGA ver. 6 (Tamura et al. 2013) using an evolutionary distance
matrix (FST) calculated using DnaSP (Librado and Rozas 2009).
2.2.3 Phylogenetic analyses
Evolutionary histories among beluga sample collections were also investigated using
gene trees based on the mtDNA haplotypes, which allows for the characterization of population
subdivision through the identification of lineages with a common ancestor (Nichols 2001). For
these phylogenetic analyses, only haplotypes that occurred at a frequency of >2 in the overall
dataset were used to exclude rare haplotypes that were possible errors during haplotype
identification (see Results for details of final numbers).
Phylogenetic trees were reconstructed using Maximum Likelihood (ML) in PhyML
(Guindon et al. 2005), Bayesian Inference (BI) in MrBayes ver. 3.2 (Ronquist et al. 2011), and
Maximum Parsimony (MP) in MEGA ver. 6 (Tamura et al. 2013). The selection of the most
appropriate substitution model for the data was determined using methods contained within
PhyML and MEGA software packages, and also using jModelTest ver, 2.1.7 (Posada 2008). In
each case, the optimal model was selected based on the lowest Akaike Information Criterion
(AIC) and Bayesian Information Criterion (BIC) scores and was considered to describe the
37
substitution pattern in the data best. This model was used for all the subsequent phylogenetic
analyses. Analyses were run without an outgroup and later rooted using an ingroup branch. This
approach was done to ensure that branching patterns within the ingroup (beluga haplotypes) were
not being obscured by the outgroup branch (Holland et al. 2003). This form of rooting the tree is
acceptable as long as the distance between the group/taxon used to root the tree is greater than
any distances within the resulting clades.
Phylogenetic analysis by Maximum Likelihood (an approach that infers an evolutionary
tree that makes the data most likely, Hall 2011) was implemented in the online version of
PhyML using a large, parallel computing platform (Guindon et al. 2010, http://www.atgc-
montpellier.fr/phyml/ ). Unique haplotype sequences for the summer and winter sample
collections (N=83) were submitted and the substitution model HKY85 (Hasegawa-Kishino-Yano
model, Hasegawa et al. 1985) was selected based on previous trial runs of the PhyML program
using the automatic model selection option, the results of MEGA analyses and the results of the
jModelTest analysis. The equilibrium frequencies and the transition/transversion ratio were both
estimated, and the proportion of invariable sites was set to 0.89 (also determined from various
model test results). The number of substitution rate categories was 4, and the gamma shape
parameter was estimated by the program. Tree searches used a BIONJ tree as a starting tree, and
the tree improvement was assessed using SPR (subtree pruning and regrafting topological
moves, Hordijk and Gascuel 2005). This method was recommended for datasets larger than 50
sequences and where a weak phylogenetic signal is expected (PhyML manual http://www.atgc-
montpellier.fr/download/papers/phyml_manual_2012.pdf). Branch support was estimated using
the approximate likelihood ratio test (“aLRT SH-like” option) (Anisimova and Gascuel 2006).
38
A Bayesian Inference approach was also used to estimate a phylogenetic tree; however,
the tree that is produced in this analysis is the one that is most likely given the data and the
substitution model selected (Hall 2011). The Bayesian analyses were conducted using MrBayes
ver. 3.2.5 (Ronquist et al. 2012) with two independent runs each consisting of four simultaneous
chains (one “heated chain” and three “cold” chains). Given that the data were from a single non-
coding mtDNA region, the data was not partitioned, and the nucleotide model was left at the
default setting of ‘4 by 4’. Based on the previous results of jModelTest (Posada 2008) and
MEGA (Tamura et al. 2013) analyses for the optimal substitution model for the data, the NST
parameter of the likelihood model was set to ‘2’ which encompasses the K2, HKY, T3P and
TN93 models (MrBayes ver. 3.2 manual (http://mrbayes.sourceforge.net/mb3.2_manual.pdf).
Similarly, the rates parameter was set to ‘invgamma’, which indicates that a proportion of the
sites are invariable and that the rate for the remaining sites should be drawn from a gamma
distribution. This distribution is approximated using four categories, and the proportion of
invariable sites was estimated from a uniform distribution. All priors for the phylogenetic model
were left at the default parameters; therefore, no molecular clock was assumed, rate
heterogeneity was modelled by the analyses, and any combination of base frequency was given
equal prior weight. The two concurrent runs of 7,000,000 generations were sampled every 1000
generations to assess for convergence using an evaluation of the standard deviation of the split
frequencies between runs and a Potential Scale Reduction Factor (PRSF) convergence diagnostic
(MrBayes ver. 3.2 manual (http://mrbayes.sourceforge.net/mb3.2_manual.pdf). The effective
sample sizes (ESS) of parameters sampled from the MCMC analysis and the overall trace data
were also evaluated using a 25% burn-in applied by Tracer ver. 1.6 (Rambaut et al. 2014). A
39
50% majority-rule consensus tree was then constructed to summarize the posterior probabilities
for each identified clade.
Maximum Parsimony (MP) analyses do not use the selection of a particular evolutionary
model during the estimation of trees but instead employ methods that search for trees constructed
from the minimum number of steps (representing the fewest evolutionary changes) that explain
the data (Hall 2011). Beluga haplotype MP trees were produced using MEGA ver. 6 (Tamura et
al. 2013) using the Tree-Bisection-Regrafting (TBR) algorithm for branch-swapping (Nei and
Kumar 2000). Branch lengths were calculated using the average pathway method (Nei and
Kumar 2000) and support for the nodes was determined using bootstrap analysis of 2000
replicates with 10 random-addition sequence replicates (Felsenstein 1985).
Consensus networks offer an alternative to inferring the evolutionary history of species
using gene trees because they are less prone to errors arising from factors such as stochastic
processes, sampling error, and complex biological processes (e.g. hybridization) (Holland et al.
2004). This situation is particularly the case for intraspecific data where phylogenetically
informative characters may have undergone recurrent mutation (Bandelt et al. 2000). Therefore,
an unrooted median-joining phylogenetic network using all beluga haplotypes that occurred at a
frequency of >2 in the overall dataset was constructed using Network ver. 4.6 (www.fluxus-
engineering.com). As the beluga data contained only substitutions that were 99% transitions,
characters were not weighted, and the setting was left at the default value of 10 (Network 4.6
User Guide http://www.fluxus-engineering.com/Network4600_user_guide.pdf). The initial
median-joining network was built using an epsilon (a weighted genetic distance measure) value
of 10 after exploring runs with epsilon = 0, 10 and 20 to determine the clearest result. The
“Greedy FHP” method for distance calculation (Foulds et al. 1979) was selected and so was the
40
MP (maximum parsimony) option that identifies and eliminates unnecessary median vectors and
links. The resulting network was drawn and modified for clarity using Network Publisher ver.
2.0 (http://www.fluxus-engineering.com/nwpub.htm).
Based on the results of phylogenetic trees and network analyses, haplogroups were
identified that grouped haplotypes based on ancestral origins indicating a common ancestor
(International Society of Genetic Genealogy http://isogg.org/wiki/Genetics_Glossary). For
mitochondrial DNA, founder events and genetic drift influence the development of haplogroups,
which are often restricted to specific geographic areas (Achilli et al. 2004). Branching patterns in
phylogenetic trees and “star-like” clusters in phylogenetic networks are indicative of such
haplogroups (Richards et al. 1998, Troy et al. 2001, Avise 2009). To visualize haplogroup
patterns in the beluga dataset, the summer and winter sample collection haplotypes were
combined into the identified haplogroups, and the frequencies of each haplogroup graphed based
on the geographic origin of the samples. Divergence estimates of total raw divergence (Dxy) and
net divergence (Da) among the haplogroups were calculated using 2000 replicates for the
permutation test in DnaSP ver. 5.1 (Librado and Rozas 2009).
2.2.4 Demographic expansions and haplogroups
Demographic analyses for indications of population expansion for both summer and
winter collection samples and haplogroups were performed using several different statistical
approaches. First, Tajima’s D statistic (Tajima, 1989) and Fu’s FS test statistic (Fu 1997) were
used for assessing departures from an evolutionary model of neutral mutation. These tests are
slightly different as Tajima’s D uses information from the mutation frequency and Fu’s FS uses
information from the haplotype distribution (Ramos-Onsins and Rozas 2002). Both statistics
41
were determined using Arlequin ver. 3.5.1.2 (Excoffier and Lischer 2010) and significance were
tested using 10,000 coalescent simulations. Significantly negative Tajima’s D tests and Fu’s FS
tests are considered to be indicative of population expansion. The R2 statistic, a third neutrality
test, was also used as it has been found to be more powerful than Tajima’s D and performs better
for small sample sizes than Fu’s FS statistic (Ramos-Onsins and Rozas 2002). This R2 test was
conducted using DnaSP ver. 5.1 (Librado and Rozas 2009) and the significance evaluated with
2000 coalescent simulations. Finally, the mismatch distribution method (Rogers and Harpending
1992) was used to test if the sample collections in the analysis belong to a population of constant
size over time. This process examines the distribution of the number of pairwise differences
between sequences within a set of samples. The pattern of the distribution will indicate either a
model of population expansion (a smooth, unimodal wave) or a model of constant population
size (a “non-wave-like” or multi-modal ragged distribution) (Rogers and Harpending 1992,
Harpending 1994, Schenekar and Weiss 2011). The distribution pattern was assessed by
quantifying a raggedness statistic, R (Harpending 1994), and by a sum of squared differences
statistic (SSD) where both use a bootstrap approach to compare the observed and expected
mismatch distribution based on simulations (Schneider and Excoffier 1999). Both of these
statistics were calculated in Arlequin ver. 3.5.1.2 (Excoffier and Lischer 2010) with 10,000
simulations to test significance. Graphs of the mismatch distribution data were produced in
DnaSP ver. 5.1 (Librado and Rozas 2009) using parameters of Ɵ0 and tau being estimated from
the data assuming a Ɵfinal of infinity, and a Ɵfinal for the graphical simulation set to 1000 (Rogers
and Harpending 1992).
Mismatch distribution can also be used to estimate, or at least compare, the timing of
demographic expansion (Rogers and Harpending 1992, Schenekar and Weiss 2011). This
42
approach uses the equation t = Ƭ/2u where t is the time since expansion, Ƭ is the mode of the
mismatch distribution and is a moment estimator of mutational time, and u is the cumulative
(across the sequence) nucleotide mutation rate. The calculation of u must take into account the
amount of sequence information in base pairs and the substitution rate for the particular segment
of the sequence used in the mismatch distribution analysis (Rogers and Harpending 1992). A
cetacean (dusky dolphin, Lagenorhynchus obscurus) mtDNA mutation rate (µ) of 7.0 x 10⁻⁸ per
base per year (Harlin et al. 2003) was used to determine an aggregate mutation rate for the
beluga haplotype sequences for u = 609µ = 4.26 x 10⁻⁵. The time of expansion based on
mismatch distribution analyses for beluga haplogroups was therefore estimated using t
=Ƭ/0.000085.
2.3 Results
2.3.1 mtDNA sequence diversity and population structure of belugas in Canadian waters
The analysis of 2540 beluga whales sampled from widely distributed locations in
Canadian waters (Figure 2.1) resulted in the identification of 111 unique haplotypes based on
609bp of mtDNA control region sequence (Table 2.1). Replicate sequencing analysis (Morin et
al. 2010) and haplotype identification of a randomly selected subgroup of samples (N=83, 6 of
the original 89 samples failed to yield good sequences) had an error rate of 8% (7 out of 83
haplotypes did not match). While this is a high incidence (typical error rate for beluga mtDNA
sequencing is <1% as in Chapter 3, Section 3.3.5), in all cases the samples that did not match
were older samples (1986-1999), and sample degradation (causing poor quality template
resulting in sequencing errors) is suspected to have contributed to the results. Also, the
misidentification was with a haplotype of similar sequence (one mutational difference), and this
43
type of error is unlikely to affect overall analyses in this study (see below). To test the influence
of older samples on analyzed results, the dataset was re-analyzed using only post-1999 samples.
The results did not change any of the patterns as compared to the full dataset (Appendix 2.3),
except for Foxe Basin where the sample size was significantly reduced (N=72 to N=9). Thus, the
full dataset analyses were retained for all interpretations.
Rare haplotypes in the overall dataset could also be an indication of sequencing errors
and error in identifying haplotypes; therefore, haplotypes that occurred in ≤2 individuals were
removed. In total, 40 individuals corresponding to 28 haplotypes were excluded. The majority of
these samples were old (or from sloughed skin) and of poorer DNA template quality. The
sequences produced from these types of samples are more vulnerable to sequencing errors and
subjective haplotype scoring by different lab technicians. After this data quality screening, a final
dataset of 2500 individuals and 83 unique haplotypes was retained. This almost doubles the
number of samples examined in previous beluga mtDNA studies and more than doubles the
number of haplotypes identified (references in Appendix 2.1).
Increasing the number of base pairs sequenced from 234bp to 609bp increased the
number of variable positions from 19 (Brown Gladden et al. 1997) to 39 in this study. This
resulted in an increased haplotype diversity (Table 2.2) for all locations, except the St. Lawrence
River, as compared to de March and Postma (2003). All of the mutations observed in the 609bp
of mtDNA sequence used to identify haplotypes were due to single nucleotide substitutions (i.e.
rather than insertions or deletions). Of the 39 variable positions, 38 displayed transitions in all
samples, except for position 220 where a transversion (C->G) was observed in three samples
from Grise Fiord.
44
Overall haplotype diversity (h) was 0.9378, nucleotide diversity (π) was 0.0083, and the
average number of nucleotide differences (k) was 5.03 (Table 2.2). The smallest haplotype
diversities were found in the St. Lawrence Estuary sample collection (0.4493) and James Bay
(0.5212), whereas all other distinct areas had diversities larger than 0.7333.
The increased number of haplotypes in this study resulted in new patterns of unique
haplotypes and new proportions of dominant haplotypes found among different locations (see
Appendix 2.4 for example alignment of polymorphic sites). In previous beluga studies, haplotype
H02 was the dominant haplotype, found in 36% (Brown Gladden et al. 1997), 52% (de March
and Postma 2003) and 38% (Turgeon et al. 2012) of all the samples analyzed. In this study,
haplotype H02 was differentiated into 21 different haplotypes (E02, E03, E04, E05, E06, E07,
E08, E34, E40, E52, E58, E65, E71, E72, E83, E101, E130, E133, E138, E141, and E176) that
collectively represented 49% of the total sample set (Table 2.1). Also, the resolution of H02 into
new haplotypes was different among various sampling collections, and this provided a finer scale
of genetic information that revealed new geographic patterns. Haplotype H02 in Western Hudson
Bay samples broke down into mostly E72 (29%), E02 (25%) and E05 (10%) haplotypes. In the
Sanikiluaq harvest samples, the proportions of haplotypes from H02 were mainly E02 (28%),
E06 (15%), E07 and E08 (together 5%). Eastern Hudson Bay samples did not have a large
number of H02 haplotypes reported in previous studies (15%, e.g. Turgeon et al. 2012), and in
contrast to other Hudson Bay samples, this remained approximately the same in this study with
12% of these samples all E02.
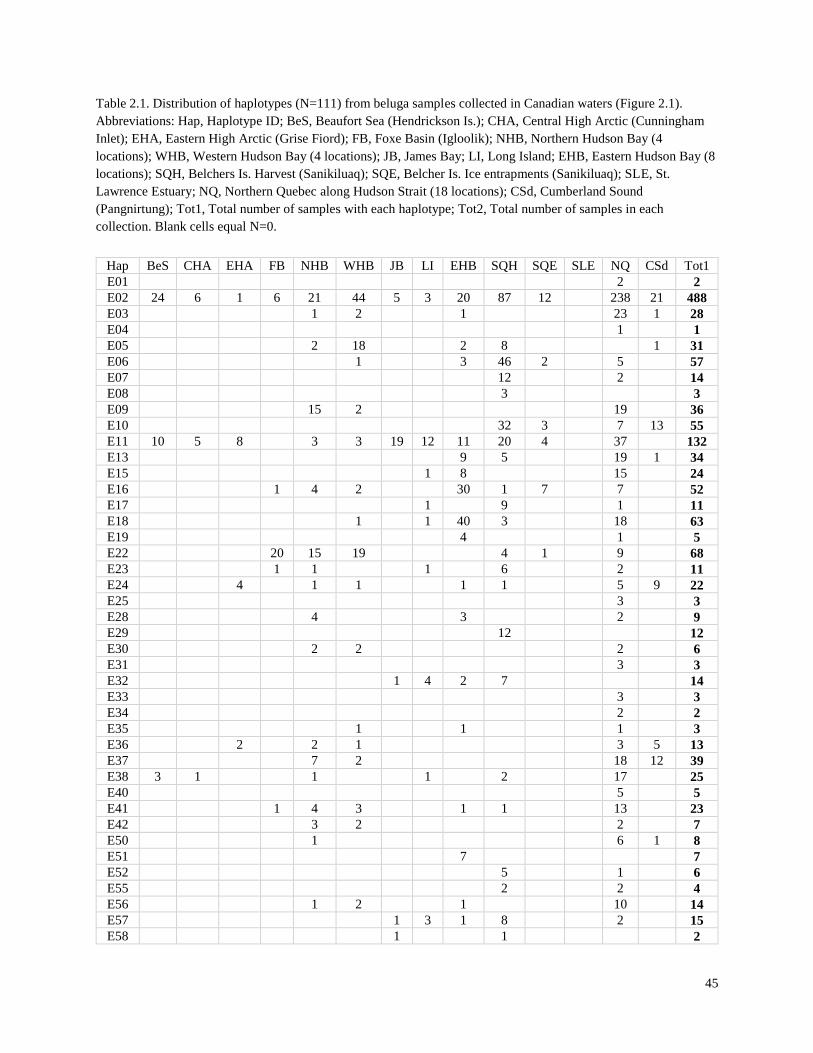
45
Table 2.1. Distribution of haplotypes (N=111) from beluga samples collected in Canadian waters (Figure 2.1).
Abbreviations: Hap, Haplotype ID; BeS, Beaufort Sea (Hendrickson Is.); CHA, Central High Arctic (Cunningham
Inlet); EHA, Eastern High Arctic (Grise Fiord); FB, Foxe Basin (Igloolik); NHB, Northern Hudson Bay (4
locations); WHB, Western Hudson Bay (4 locations); JB, James Bay; LI, Long Island; EHB, Eastern Hudson Bay (8
locations); SQH, Belchers Is. Harvest (Sanikiluaq); SQE, Belcher Is. Ice entrapments (Sanikiluaq); SLE, St.
Lawrence Estuary; NQ, Northern Quebec along Hudson Strait (18 locations); CSd, Cumberland Sound
(Pangnirtung); Tot1, Total number of samples with each haplotype; Tot2, Total number of samples in each
collection. Blank cells equal N=0.
Hap BeS CHA EHA FB NHB WHB JB LI EHB SQH SQE SLE NQ CSd Tot1
E01 2 2
E02 24 6 1 6 21 44 5 3 20 87 12 238 21 488
E03 1 2 1 23 1 28
E04 1 1
E05 2 18 2 8 1 31
E06 1 3 46 2 5 57
E07 12 2 14
E08 3 3
E09 15 2 19 36
E10 32 3 7 13 55
E11 10 5 8 3 3 19 12 11 20 4 37 132
E13 9 5 19 1 34
E15 1 8 15 24
E16 1 4 2 30 1 7 7 52
E17 1 9 1 11
E18 1 1 40 3 18 63
E19 4 1 5
E22 20 15 19 4 1 9 68
E23 1 1 1 6 2 11
E24 4 1 1 1 1 5 9 22
E25 3 3
E28 4 3 2 9
E29 12 12
E30 2 2 2 6
E31 3 3
E32 1 4 2 7 14
E33 3 3
E34 2 2
E35 1 1 1 3
E36 2 2 1 3 5 13
E37 7 2 18 12 39
E38 3 1 1 1 2 17 25
E40 5 5
E41 1 4 3 1 1 13 23
E42 3 2 2 7
E50 1 6 1 8
E51 7 7
E52 5 1 6
E55 2 2 4
E56 1 2 1 10 14
E57 1 3 1 8 2 15
E58 1 1 2
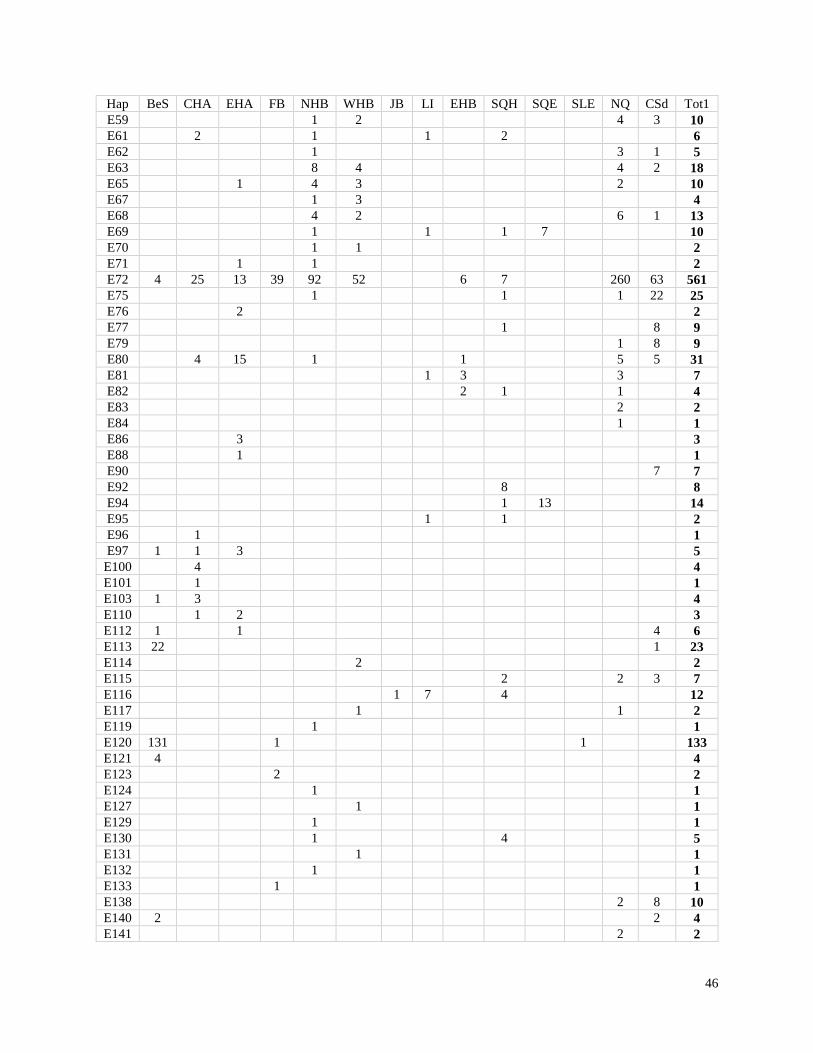
46
Hap BeS CHA EHA FB NHB WHB JB LI EHB SQH SQE SLE NQ CSd Tot1
E59 1 2 4 3 10
E61 2 1 1 2 6
E62 1 3 1 5
E63 8 4 4 2 18
E65 1 4 3 2 10
E67 1 3 4
E68 4 2 6 1 13
E69 1 1 1 7 10
E70 1 1 2
E71 1 1 2
E72 4 25 13 39 92 52 6 7 260 63 561
E75 1 1 1 22 25
E76 2 2
E77 1 8 9
E79 1 8 9
E80 4 15 1 1 5 5 31
E81 1 3 3 7
E82 2 1 1 4
E83 2 2
E84 1 1
E86 3 3
E88 1 1
E90 7 7
E92 8 8
E94 1 13 14
E95 1 1 2
E96 1 1
E97 1 1 3 5
E100 4 4
E101 1 1
E103 1 3 4
E110 1 2 3
E112 1 1 4 6
E113 22 1 23
E114 2 2
E115 2 2 3 7
E116 1 7 4 12
E117 1 1 2
E119 1 1
E120 131 1 1 133
E121 4 4
E123 2 2
E124 1 1
E127 1 1
E129 1 1
E130 1 4 5
E131 1 1
E132 1 1
E133 1 1
E138 2 8 10
E140 2 2 4
E141 2 2
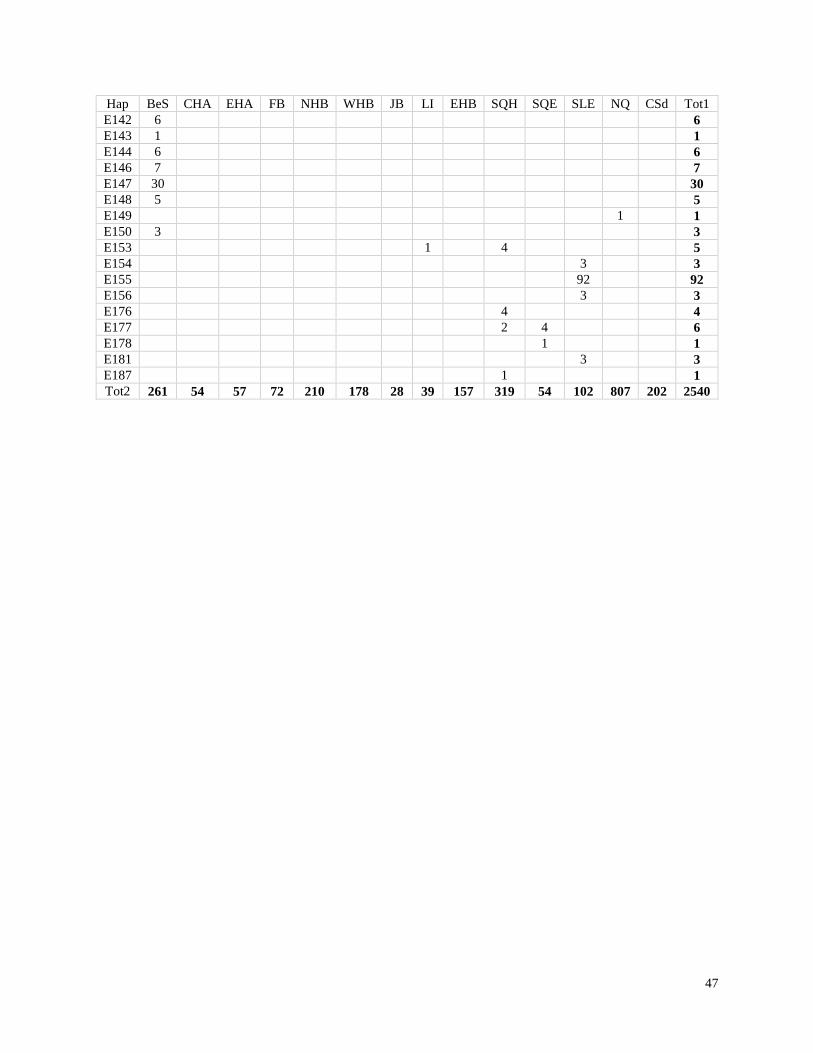
47
Hap BeS CHA EHA FB NHB WHB JB LI EHB SQH SQE SLE NQ CSd Tot1
E142 6 6
E143 1 1
E144 6 6
E146 7 7
E147 30 30
E148 5 5
E149 1 1
E150 3 3
E153 1 4 5
E154 3 3
E155 92 92
E156 3 3
E176 4 4
E177 2 4 6
E178 1 1
E181 3 3
E187 1 1
Tot2 261 54 57 72 210 178 28 39 157 319 54 102 807 202 2540
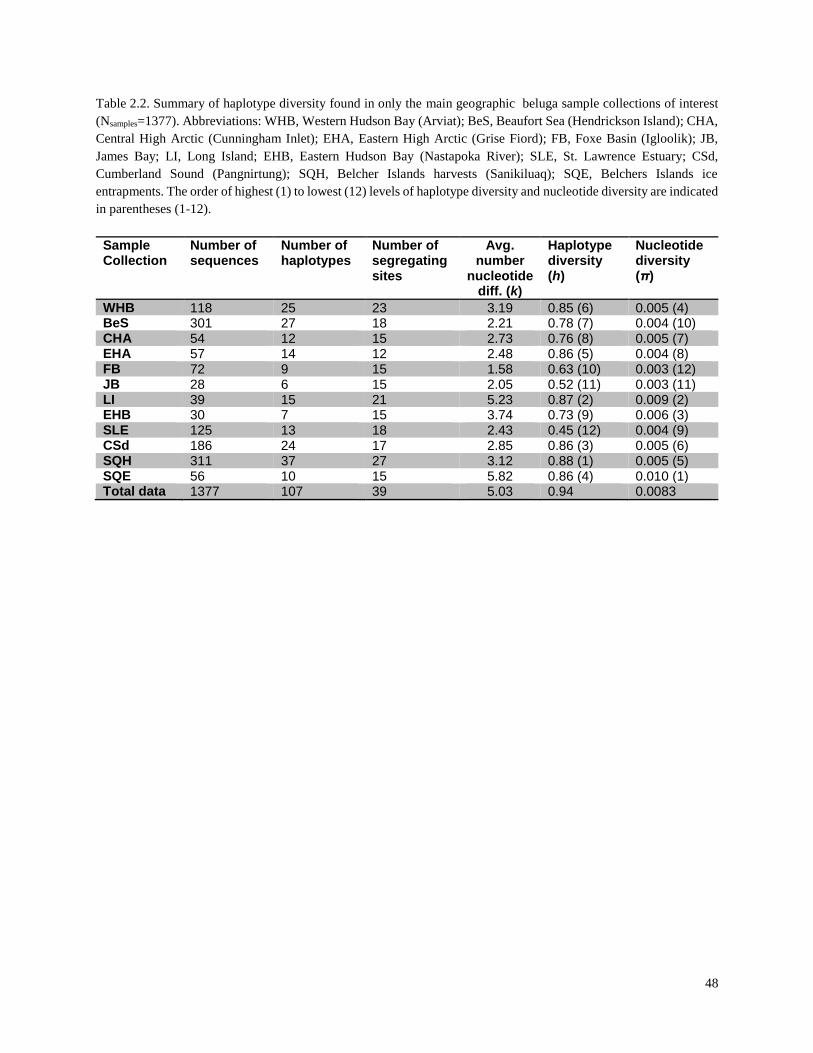
48
Table 2.2. Summary of haplotype diversity found in only the main geographic beluga sample collections of interest
(Nsamples=1377). Abbreviations: WHB, Western Hudson Bay (Arviat); BeS, Beaufort Sea (Hendrickson Island); CHA,
Central High Arctic (Cunningham Inlet); EHA, Eastern High Arctic (Grise Fiord); FB, Foxe Basin (Igloolik); JB,
James Bay; LI, Long Island; EHB, Eastern Hudson Bay (Nastapoka River); SLE, St. Lawrence Estuary; CSd,
Cumberland Sound (Pangnirtung); SQH, Belcher Islands harvests (Sanikiluaq); SQE, Belchers Islands ice
entrapments. The order of highest (1) to lowest (12) levels of haplotype diversity and nucleotide diversity are indicated
in parentheses (1-12).
Sample Collection
Number of sequences
Number of haplotypes
Number of segregating sites
Avg. number
nucleotide diff. (k)
Haplotype diversity (h)
Nucleotide diversity (π)
WHB 118 25 23 3.19 0.85 (6) 0.005 (4) BeS 301 27 18 2.21 0.78 (7) 0.004 (10) CHA 54 12 15 2.73 0.76 (8) 0.005 (7) EHA 57 14 12 2.48 0.86 (5) 0.004 (8) FB 72 9 15 1.58 0.63 (10) 0.003 (12) JB 28 6 15 2.05 0.52 (11) 0.003 (11) LI 39 15 21 5.23 0.87 (2) 0.009 (2) EHB 30 7 15 3.74 0.73 (9) 0.006 (3) SLE 125 13 18 2.43 0.45 (12) 0.004 (9) CSd 186 24 17 2.85 0.86 (3) 0.005 (6) SQH 311 37 27 3.12 0.88 (1) 0.005 (5) SQE 56 10 15 5.82 0.86 (4) 0.010 (1) Total data 1377 107 39 5.03 0.94 0.0083
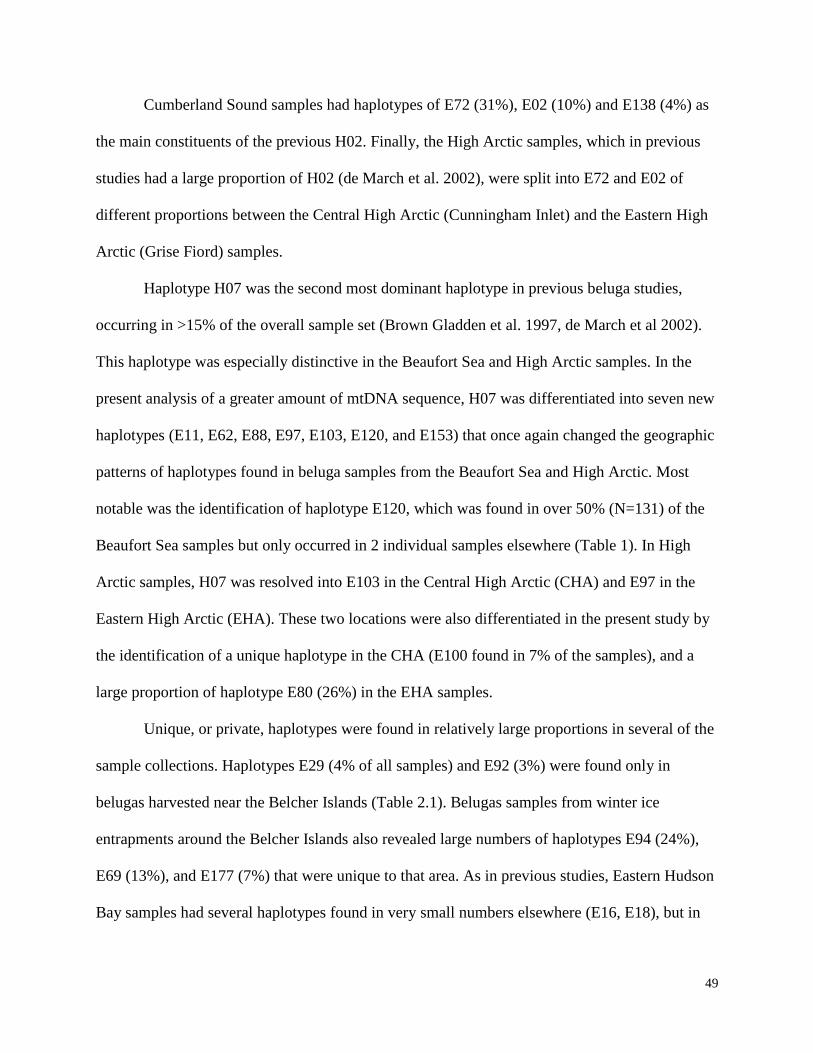
49
Cumberland Sound samples had haplotypes of E72 (31%), E02 (10%) and E138 (4%) as
the main constituents of the previous H02. Finally, the High Arctic samples, which in previous
studies had a large proportion of H02 (de March et al. 2002), were split into E72 and E02 of
different proportions between the Central High Arctic (Cunningham Inlet) and the Eastern High
Arctic (Grise Fiord) samples.
Haplotype H07 was the second most dominant haplotype in previous beluga studies,
occurring in >15% of the overall sample set (Brown Gladden et al. 1997, de March et al 2002).
This haplotype was especially distinctive in the Beaufort Sea and High Arctic samples. In the
present analysis of a greater amount of mtDNA sequence, H07 was differentiated into seven new
haplotypes (E11, E62, E88, E97, E103, E120, and E153) that once again changed the geographic
patterns of haplotypes found in beluga samples from the Beaufort Sea and High Arctic. Most
notable was the identification of haplotype E120, which was found in over 50% (N=131) of the
Beaufort Sea samples but only occurred in 2 individual samples elsewhere (Table 1). In High
Arctic samples, H07 was resolved into E103 in the Central High Arctic (CHA) and E97 in the
Eastern High Arctic (EHA). These two locations were also differentiated in the present study by
the identification of a unique haplotype in the CHA (E100 found in 7% of the samples), and a
large proportion of haplotype E80 (26%) in the EHA samples.
Unique, or private, haplotypes were found in relatively large proportions in several of the
sample collections. Haplotypes E29 (4% of all samples) and E92 (3%) were found only in
belugas harvested near the Belcher Islands (Table 2.1). Belugas samples from winter ice
entrapments around the Belcher Islands also revealed large numbers of haplotypes E94 (24%),
E69 (13%), and E177 (7%) that were unique to that area. As in previous studies, Eastern Hudson
Bay samples had several haplotypes found in very small numbers elsewhere (E16, E18), but in
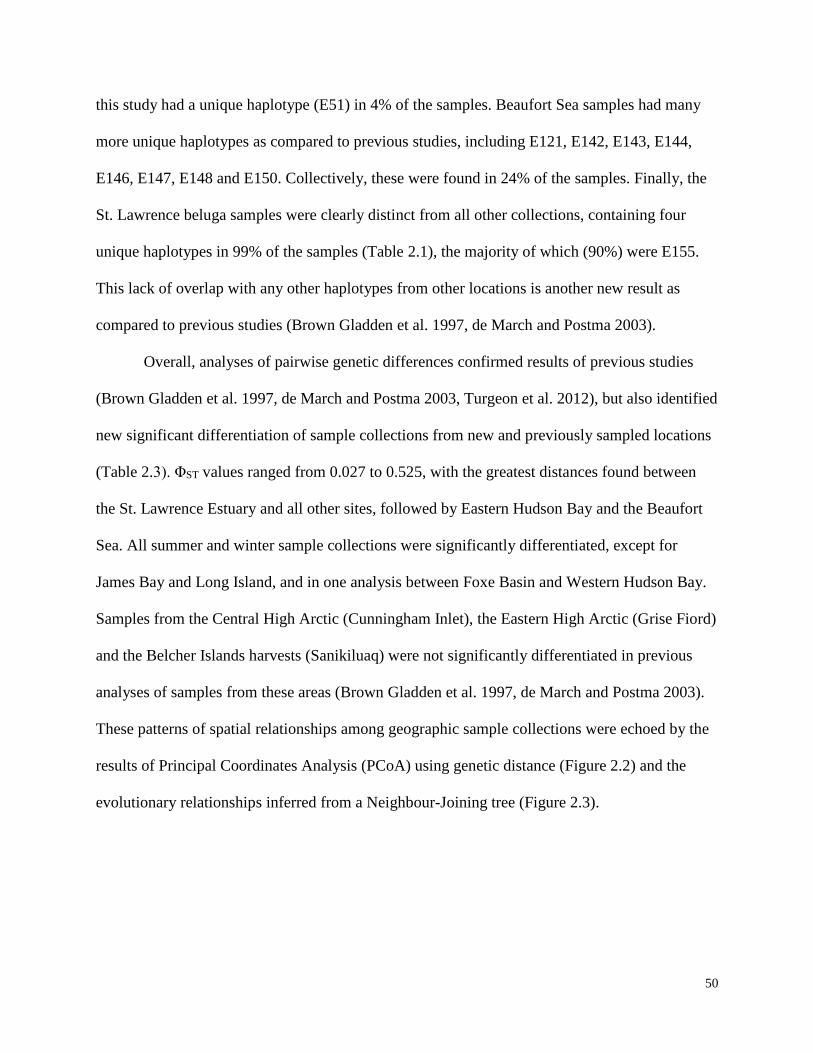
50
this study had a unique haplotype (E51) in 4% of the samples. Beaufort Sea samples had many
more unique haplotypes as compared to previous studies, including E121, E142, E143, E144,
E146, E147, E148 and E150. Collectively, these were found in 24% of the samples. Finally, the
St. Lawrence beluga samples were clearly distinct from all other collections, containing four
unique haplotypes in 99% of the samples (Table 2.1), the majority of which (90%) were E155.
This lack of overlap with any other haplotypes from other locations is another new result as
compared to previous studies (Brown Gladden et al. 1997, de March and Postma 2003).
Overall, analyses of pairwise genetic differences confirmed results of previous studies
(Brown Gladden et al. 1997, de March and Postma 2003, Turgeon et al. 2012), but also identified
new significant differentiation of sample collections from new and previously sampled locations
(Table 2.3). ΦST values ranged from 0.027 to 0.525, with the greatest distances found between
the St. Lawrence Estuary and all other sites, followed by Eastern Hudson Bay and the Beaufort
Sea. All summer and winter sample collections were significantly differentiated, except for
James Bay and Long Island, and in one analysis between Foxe Basin and Western Hudson Bay.
Samples from the Central High Arctic (Cunningham Inlet), the Eastern High Arctic (Grise Fiord)
and the Belcher Islands harvests (Sanikiluaq) were not significantly differentiated in previous
analyses of samples from these areas (Brown Gladden et al. 1997, de March and Postma 2003).
These patterns of spatial relationships among geographic sample collections were echoed by the
results of Principal Coordinates Analysis (PCoA) using genetic distance (Figure 2.2) and the
evolutionary relationships inferred from a Neighbour-Joining tree (Figure 2.3).
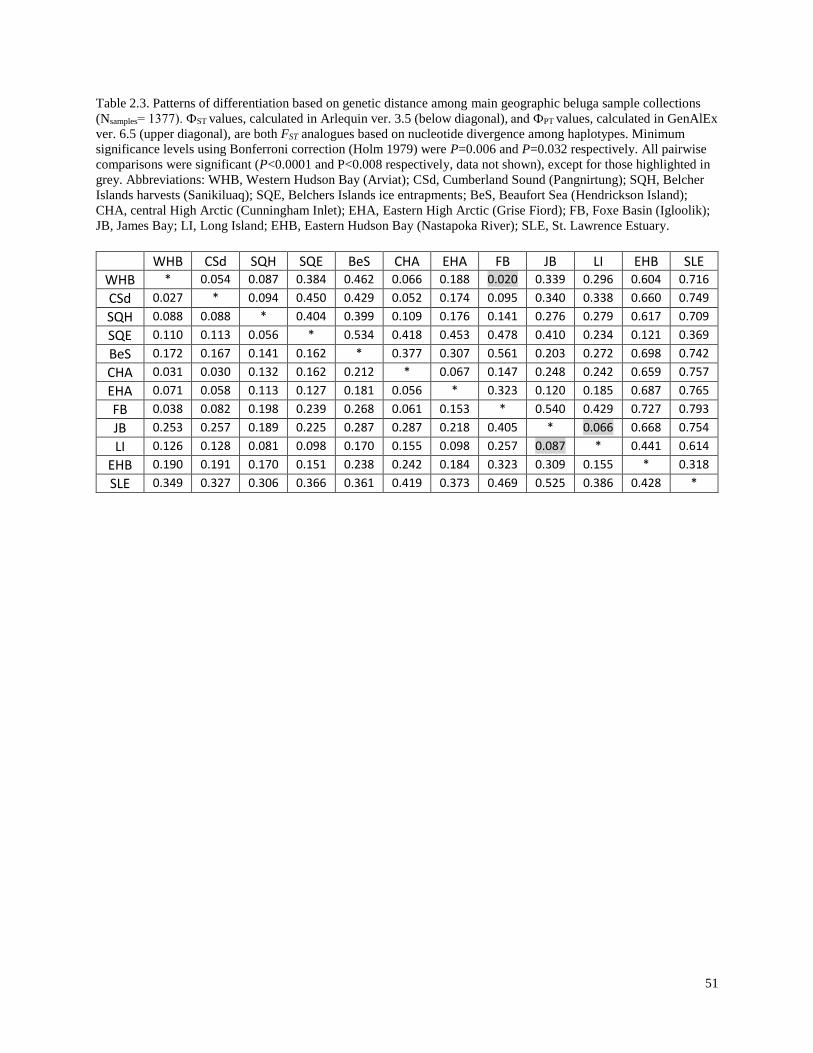
51
Table 2.3. Patterns of differentiation based on genetic distance among main geographic beluga sample collections
(Nsamples= 1377). ФST values, calculated in Arlequin ver. 3.5 (below diagonal), and ФPT values, calculated in GenAlEx
ver. 6.5 (upper diagonal), are both FST analogues based on nucleotide divergence among haplotypes. Minimum
significance levels using Bonferroni correction (Holm 1979) were P=0.006 and P=0.032 respectively. All pairwise
comparisons were significant (P<0.0001 and P<0.008 respectively, data not shown), except for those highlighted in
grey. Abbreviations: WHB, Western Hudson Bay (Arviat); CSd, Cumberland Sound (Pangnirtung); SQH, Belcher
Islands harvests (Sanikiluaq); SQE, Belchers Islands ice entrapments; BeS, Beaufort Sea (Hendrickson Island);
CHA, central High Arctic (Cunningham Inlet); EHA, Eastern High Arctic (Grise Fiord); FB, Foxe Basin (Igloolik);
JB, James Bay; LI, Long Island; EHB, Eastern Hudson Bay (Nastapoka River); SLE, St. Lawrence Estuary.
WHB CSd SQH SQE BeS CHA EHA FB JB LI EHB SLE
WHB * 0.054 0.087 0.384 0.462 0.066 0.188 0.020 0.339 0.296 0.604 0.716
CSd 0.027 * 0.094 0.450 0.429 0.052 0.174 0.095 0.340 0.338 0.660 0.749
SQH 0.088 0.088 * 0.404 0.399 0.109 0.176 0.141 0.276 0.279 0.617 0.709
SQE 0.110 0.113 0.056 * 0.534 0.418 0.453 0.478 0.410 0.234 0.121 0.369
BeS 0.172 0.167 0.141 0.162 * 0.377 0.307 0.561 0.203 0.272 0.698 0.742
CHA 0.031 0.030 0.132 0.162 0.212 * 0.067 0.147 0.248 0.242 0.659 0.757
EHA 0.071 0.058 0.113 0.127 0.181 0.056 * 0.323 0.120 0.185 0.687 0.765
FB 0.038 0.082 0.198 0.239 0.268 0.061 0.153 * 0.540 0.429 0.727 0.793
JB 0.253 0.257 0.189 0.225 0.287 0.287 0.218 0.405 * 0.066 0.668 0.754
LI 0.126 0.128 0.081 0.098 0.170 0.155 0.098 0.257 0.087 * 0.441 0.614
EHB 0.190 0.191 0.170 0.151 0.238 0.242 0.184 0.323 0.309 0.155 * 0.318
SLE 0.349 0.327 0.306 0.366 0.361 0.419 0.373 0.469 0.525 0.386 0.428 *
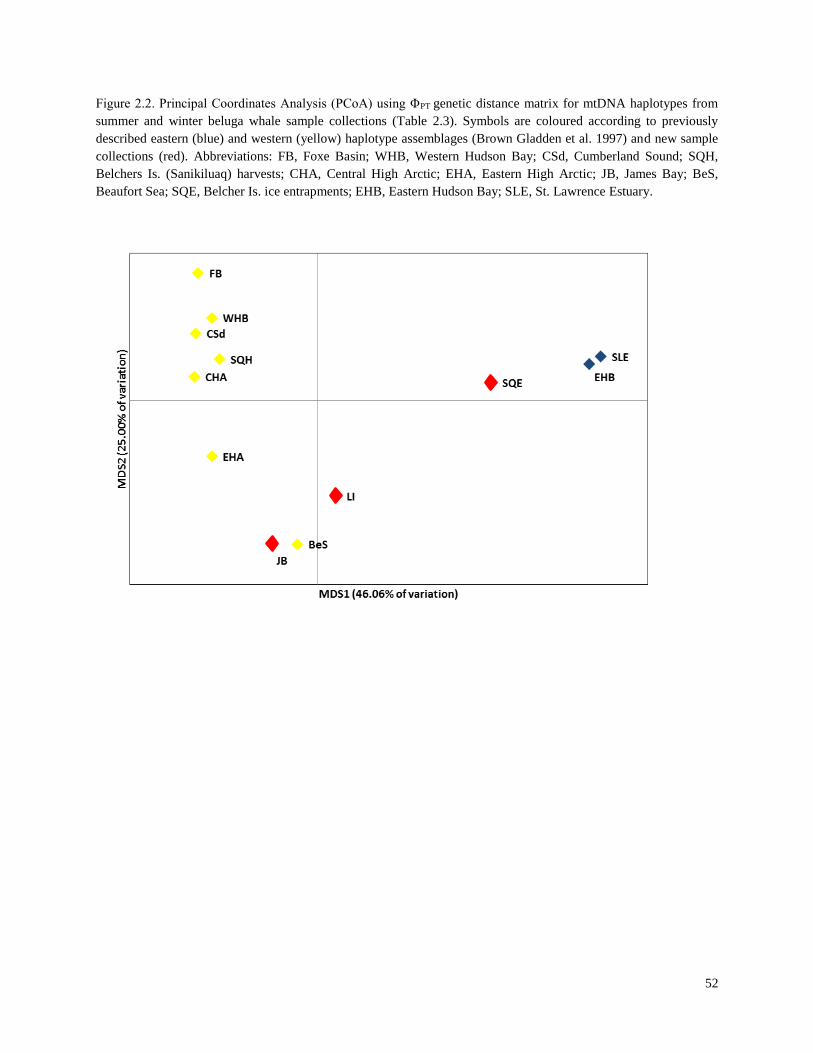
52
Figure 2.2. Principal Coordinates Analysis (PCoA) using ΦPT genetic distance matrix for mtDNA haplotypes from
summer and winter beluga whale sample collections (Table 2.3). Symbols are coloured according to previously
described eastern (blue) and western (yellow) haplotype assemblages (Brown Gladden et al. 1997) and new sample
collections (red). Abbreviations: FB, Foxe Basin; WHB, Western Hudson Bay; CSd, Cumberland Sound; SQH,
Belchers Is. (Sanikiluaq) harvests; CHA, Central High Arctic; EHA, Eastern High Arctic; JB, James Bay; BeS,
Beaufort Sea; SQE, Belcher Is. ice entrapments; EHB, Eastern Hudson Bay; SLE, St. Lawrence Estuary.
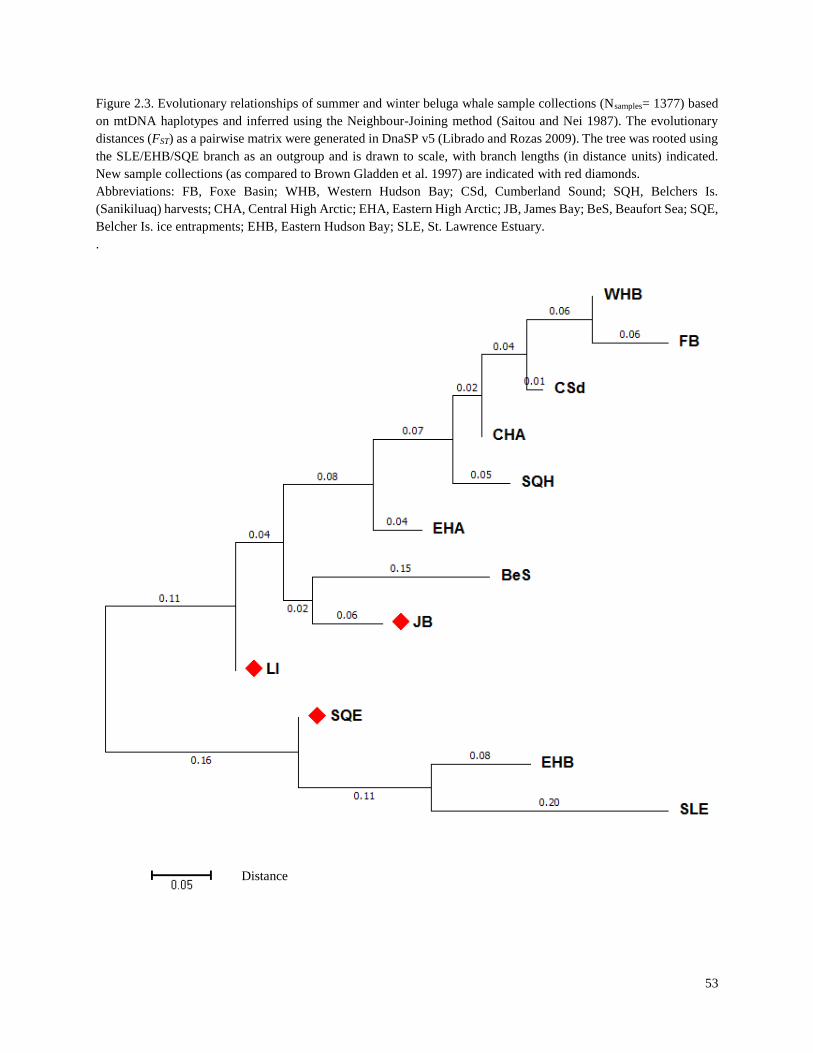
53
Figure 2.3. Evolutionary relationships of summer and winter beluga whale sample collections (Nsamples= 1377) based
on mtDNA haplotypes and inferred using the Neighbour-Joining method (Saitou and Nei 1987). The evolutionary
distances (FST) as a pairwise matrix were generated in DnaSP v5 (Librado and Rozas 2009). The tree was rooted using
the SLE/EHB/SQE branch as an outgroup and is drawn to scale, with branch lengths (in distance units) indicated.
New sample collections (as compared to Brown Gladden et al. 1997) are indicated with red diamonds.
Abbreviations: FB, Foxe Basin; WHB, Western Hudson Bay; CSd, Cumberland Sound; SQH, Belchers Is.
(Sanikiluaq) harvests; CHA, Central High Arctic; EHA, Eastern High Arctic; JB, James Bay; BeS, Beaufort Sea; SQE,
Belcher Is. ice entrapments; EHB, Eastern Hudson Bay; SLE, St. Lawrence Estuary.
.
Distance
54
2.3.2 Phylogeographic patterns of belugas inferred from gene trees and haplotype network
Phylogenetic analyses were performed to estimate gene trees for the 83 main haplotypes
identified in this study. All model tests (PhyML, MEGA and jModelTest) agreed that the best
model of sequence evolution for the beluga data was HKY+G+I (Table 2.4). All phylogenetic
approaches, Bayesian Inference (Figure 2.4), Maximum Parsimony (Figure 2.5), and Maximum
Likelihood (Figure 2.6), identified two well-supported lineages (>80% support). These lineages
correspond to the two “assemblages” of haplotypes identified in previous studies (see references
in Appendix 1) with the haplotypes highlighted in blue in Figures 2.4 - 2.6) corresponding to the
“eastern assemblage”. Branching patterns within this lineage were also consistent and reasonably
well-supported across the different phylogenetic methods. E154 and E155, the two haplotypes
found in almost all (93%) of the St. Lawrence Estuary beluga samples, consistently grouped
together and were the most distantly related haplotypes to all others. Haplotypes E17, E18, and
E19 also formed a consistent group and were found almost exclusively in a large proportion of
the Eastern Hudson Bay samples.
The other lineage (roughly corresponding to the “western assemblage”) was composed of
branching patterns that were less consistent across the different phylogenetic analyses. However,
both the Maximum Parsimony (MP) (Figure 2.5) and Maximum Likelihood (ML) (Figure 2.6)
analyses clustered the same sets of haplotypes in similar patterns and as most distant from other
haplotypes in the lineage. While the MP branch support was very weak, the ML tree had strong
aLRT support for most branches and suggested the division of the overall “western” lineage into
two subgroups. The Bayesian tree did not provide a similar resolution of the polytomy in this
lineage (Figure 2.4). Some haplotypes were grouped in several clusters, but with lower posterior
probabilities at the nodes than the level of support that was found in the ML interpretation of
55
haplotype relationships. It is unlikely that this is a failure of the BI analysis, as all diagnostics
indicated that convergence was achieved (i.e. all PSRF values = 1.000 – 1.001; all parameter
ESS (effective sample size) values greater than 900, and no obvious trend in the trace plot
suggesting that the MCMC was still converging).
The median-joining (MJ) phylogenetic network (Figure 2.7) provides more clarity for
assessing the different haplotype relationships represented by the different gene tree analyses.
This type of network, and others allows for the inclusion of ancestral nodes, multifurcations
(multiple connections as opposed to strictly bifurcating branches) and reticulations (more
complex structures in the connections) (Posada and Crandall 2001). Because of this, more
phylogenetic information from the dataset can be determined from the interconnections of the
haplotypes depicted by a network. Ancestral haplotypes will be found central to a cluster of
multiple descendant haplotypes in a network analysis, and will also “occupy a branch of zero
length at the basal node of a cluster” in a traditional bifurcating tree (Posada and Crandall 2001).
Haplotypes E120, E11, E02, E72, E13, E41, E16 and E18 all have this characteristic defining
them as ancestral haplotypes in both the ML tree and the MJ network (Figures 2.6 and 2.7). Also,
these older haplotypes will often be present in higher frequencies (Watterson and Guess 1977)
and will be “common” alleles (i.e. found over a wider geographic range) (Watterson 1985). The
network results (Figure 2.7) confirm this pattern. Using this information and further comparison
of the ML phylogenetic tree (Figure 2.6) and the MJ network (Figure 2.7), three haplogroups
(evolutionary closely related haplotypes, e.g. Klüsch et al. 2012, Lindqvist et al. 2016) for the
beluga mtDNA data in this study were identified. These haplogroups appear to have formed from
different ancestral lineages: Haplogroup 1A and Haplogroup 1B corresponding to the “western
56
assemblage” identified in previous studies (references in Appendix 1) and Haplogroup 2
corresponding to the “eastern assemblage” (Figure 2.6 and 2.7).
The grouping of individual samples into the three haplogroups and comparison of the
haplogroup frequencies among the summer and winter collection locations revealed both north-
south and east-west patterns over the Canadian beluga distribution (Figure 2.8). In the western
Canadian Arctic (Beaufort Sea), the samples were predominantly Haplogroup 1B and in the
eastern edge of the distribution (St. Lawrence Estuary) samples were almost entirely Haplogroup
2. In the middle of the Canadian beluga distribution, there was a latitudinal gradient from south
to north of decreasing frequencies for haplotypes belonging to Haplogroup 2. Conversely,
Haplogroup 1B had a general trend of decreasing frequency from north to south, with the
exception of James Bay and the southeast corner of Hudson Bay (Long Island and Belcher
Islands). Haplogroup 1A was the dominant haplogroup in the central portion of the beluga
distribution, with a slightly decreasing frequency occurring from south to north.
The belugas sampled in the St. Lawrence Estuary represent an isolated population and
have the lowest amount of haplotype diversity (Table 2.2). Though the haplotypes found in this
sample collection belong to Haplogroup 2, they were unique to this population and were
predominantly (90%) a single haplotype. Based on these results, this location was considered
separately for further analyses.
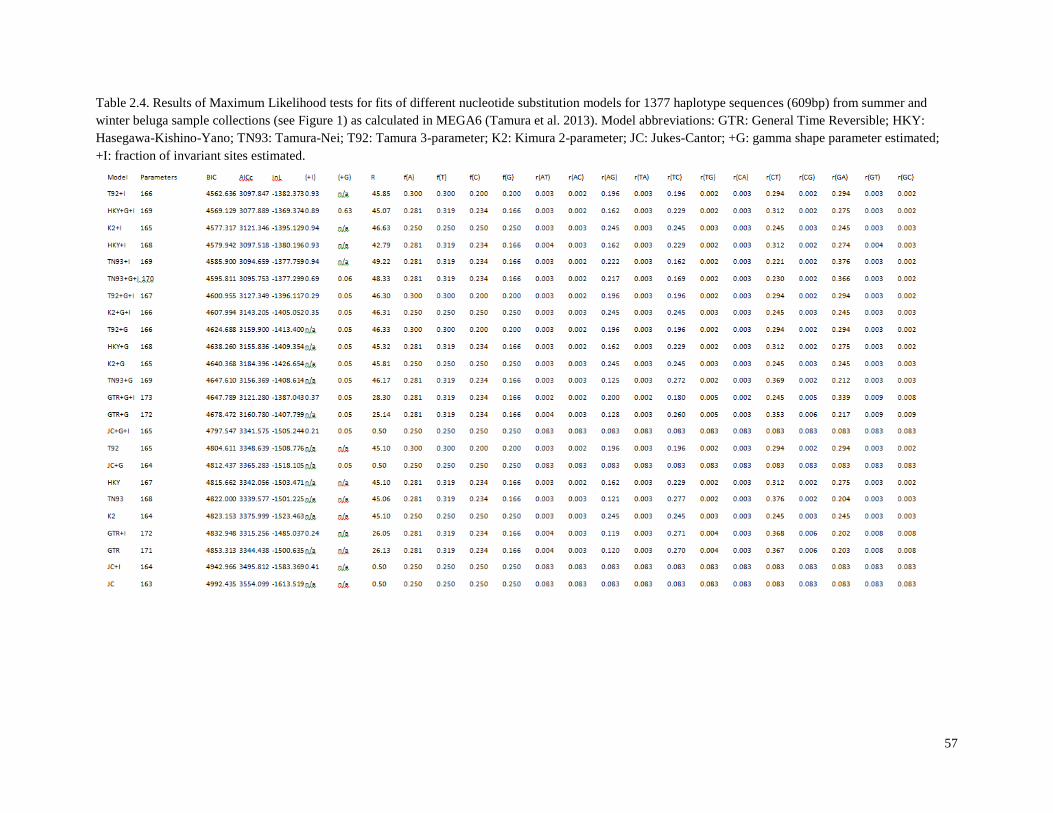
57
Table 2.4. Results of Maximum Likelihood tests for fits of different nucleotide substitution models for 1377 haplotype sequences (609bp) from summer and
winter beluga sample collections (see Figure 1) as calculated in MEGA6 (Tamura et al. 2013). Model abbreviations: GTR: General Time Reversible; HKY:
Hasegawa-Kishino-Yano; TN93: Tamura-Nei; T92: Tamura 3-parameter; K2: Kimura 2-parameter; JC: Jukes-Cantor; +G: gamma shape parameter estimated;
+I: fraction of invariant sites estimated.
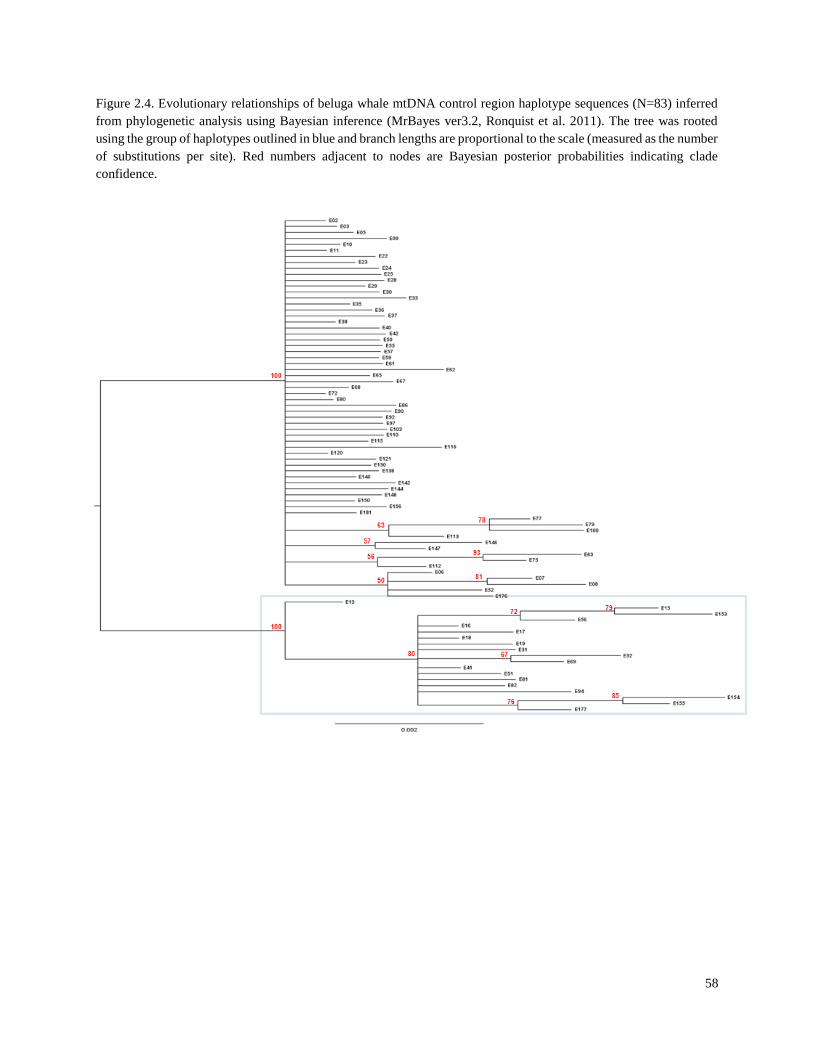
58
Figure 2.4. Evolutionary relationships of beluga whale mtDNA control region haplotype sequences (N=83) inferred
from phylogenetic analysis using Bayesian inference (MrBayes ver3.2, Ronquist et al. 2011). The tree was rooted
using the group of haplotypes outlined in blue and branch lengths are proportional to the scale (measured as the number
of substitutions per site). Red numbers adjacent to nodes are Bayesian posterior probabilities indicating clade
confidence.
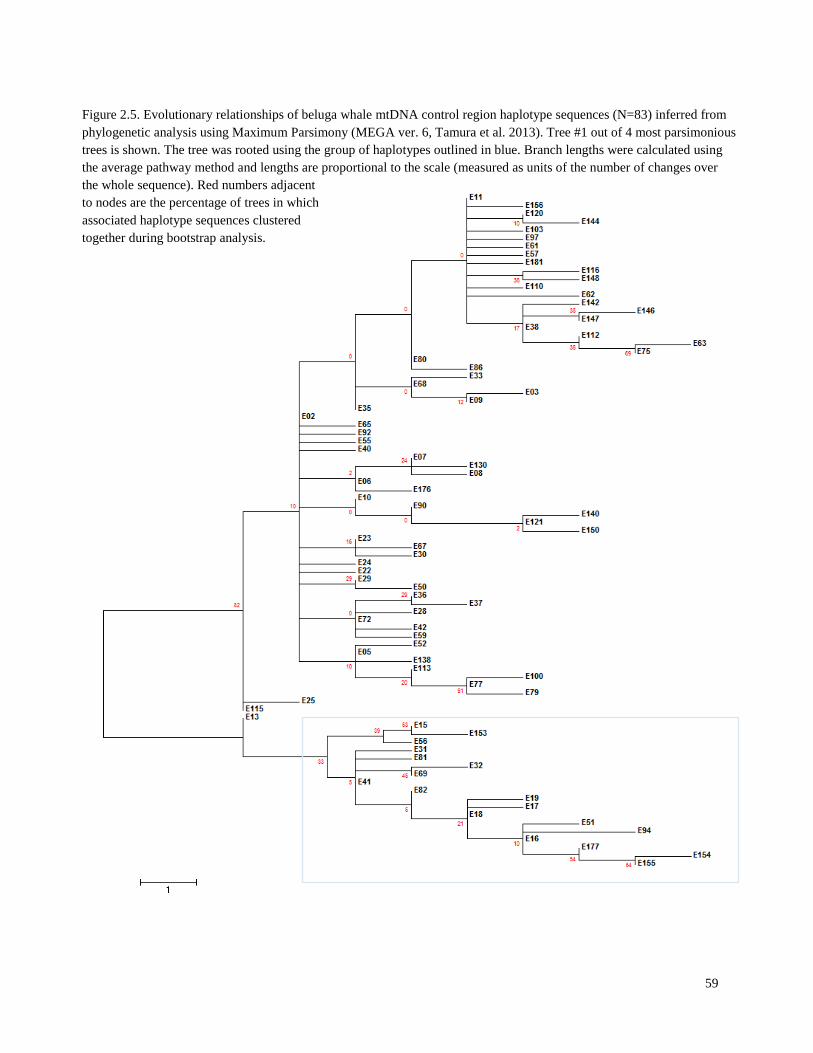
59
Figure 2.5. Evolutionary relationships of beluga whale mtDNA control region haplotype sequences (N=83) inferred from
phylogenetic analysis using Maximum Parsimony (MEGA ver. 6, Tamura et al. 2013). Tree #1 out of 4 most parsimonious
trees is shown. The tree was rooted using the group of haplotypes outlined in blue. Branch lengths were calculated using
the average pathway method and lengths are proportional to the scale (measured as units of the number of changes over
the whole sequence). Red numbers adjacent
to nodes are the percentage of trees in which
associated haplotype sequences clustered
together during bootstrap analysis.

60
Figure 2.6. Evolutionary relationships of beluga whale mtDNA control region haplotype sequences (N=83) inferred
from phylogenetic analysis by Maximum Likelihood (PhyML ver3.0, Guindon et al. 2010). The tree was rooted
using the group of haplotypes highlighted in blue, and branch lengths greater than 0.001 are shown (measured as the
number of substitutions per site). Red numbers adjacent to nodes are aLRT (approximate Likelihood Ratio Test)
measures of support for the branches. Additionally, two main haplogroups are identified that generally correspond to
the previously described eastern and western haplotype assemblages (Brown Gladden et al. 1997). However, the
“western” assemblage has been subdivided into two haplotype subgroups based on the new mtDNA control region
sequence (609bp) information included in this study. Circled haplotypes have been identified as ancestral
haplotypes.
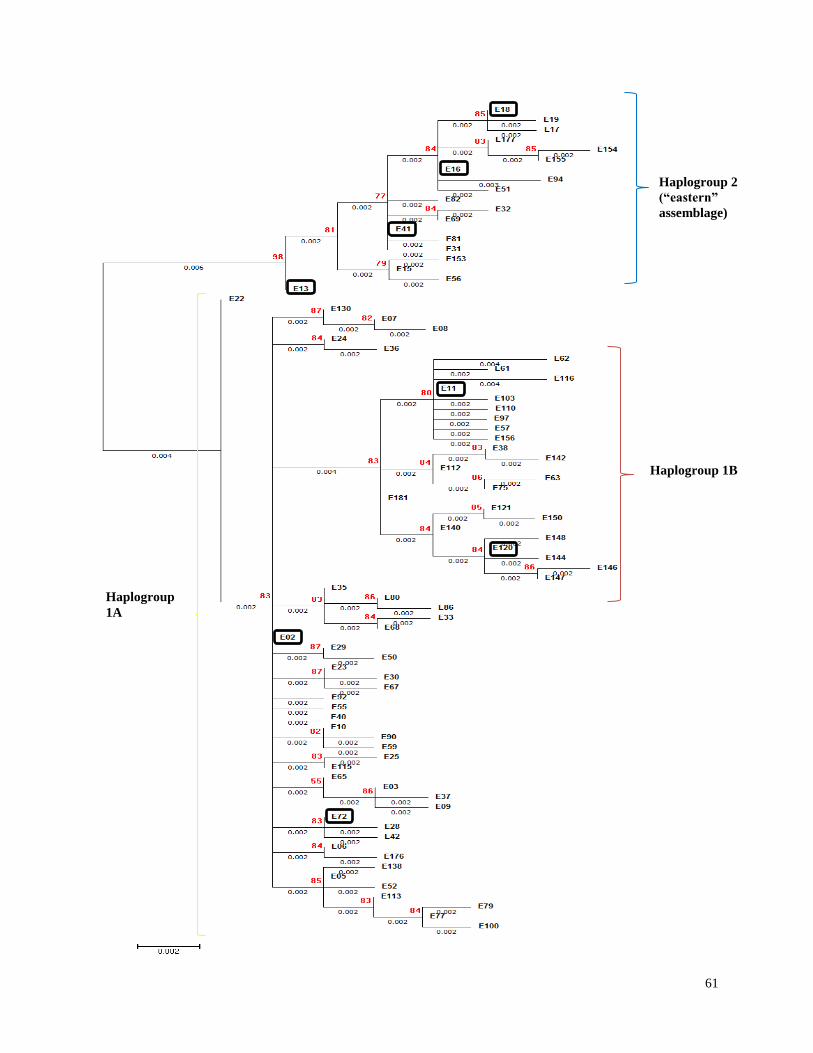
61
Haplogroup 2
(“eastern”
assemblage)
Haplogroup 1B
Haplogroup
1A
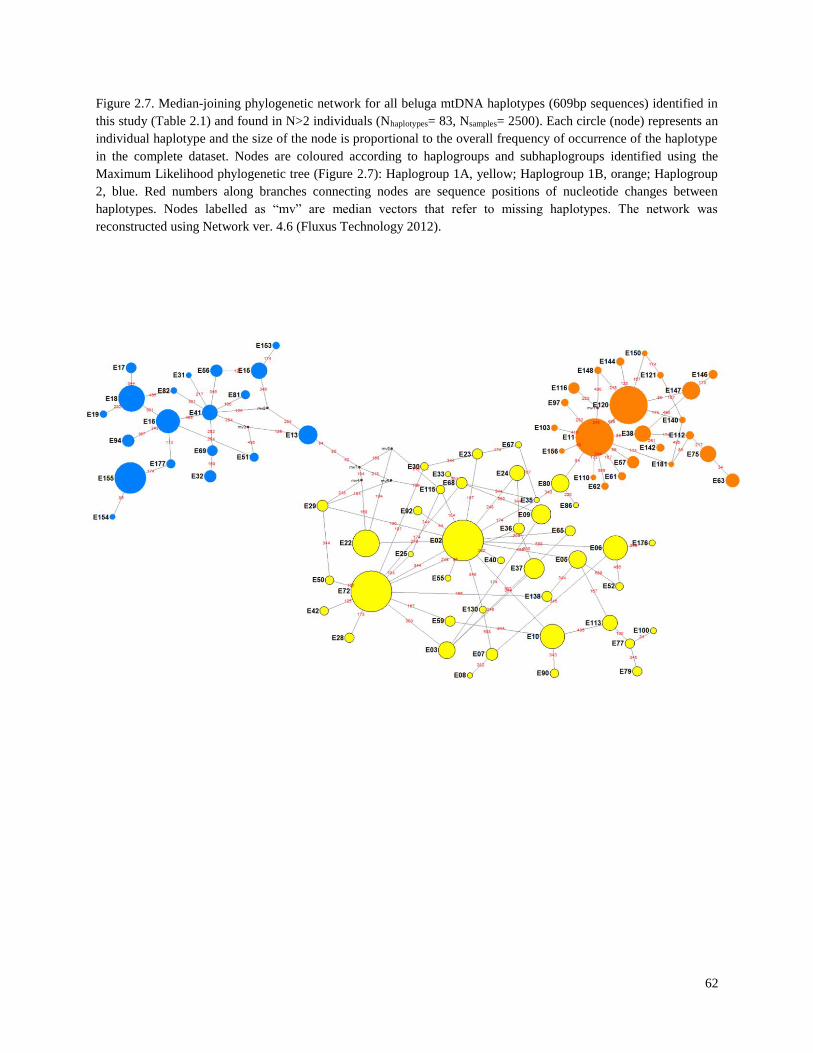
62
Figure 2.7. Median-joining phylogenetic network for all beluga mtDNA haplotypes (609bp sequences) identified in
this study (Table 2.1) and found in N>2 individuals (Nhaplotypes= 83, Nsamples= 2500). Each circle (node) represents an
individual haplotype and the size of the node is proportional to the overall frequency of occurrence of the haplotype
in the complete dataset. Nodes are coloured according to haplogroups and subhaplogroups identified using the
Maximum Likelihood phylogenetic tree (Figure 2.7): Haplogroup 1A, yellow; Haplogroup 1B, orange; Haplogroup
2, blue. Red numbers along branches connecting nodes are sequence positions of nucleotide changes between
haplotypes. Nodes labelled as “mv” are median vectors that refer to missing haplotypes. The network was
reconstructed using Network ver. 4.6 (Fluxus Technology 2012).
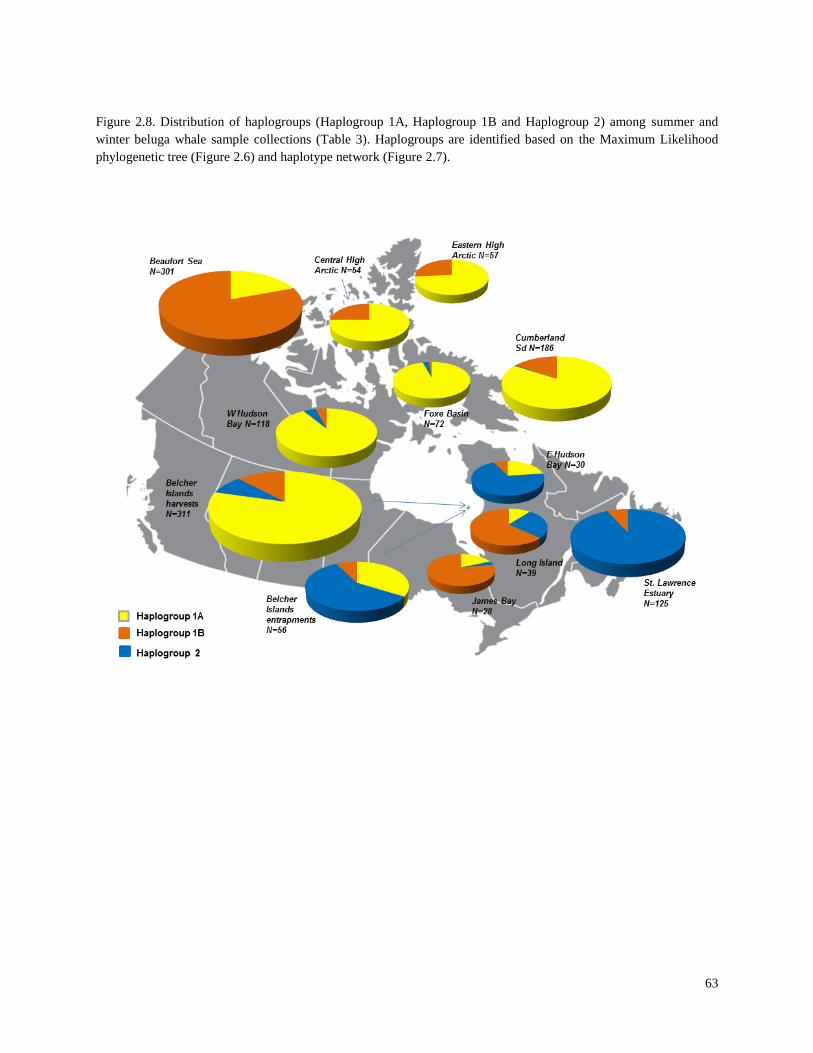
63
Figure 2.8. Distribution of haplogroups (Haplogroup 1A, Haplogroup 1B and Haplogroup 2) among summer and
winter beluga whale sample collections (Table 3). Haplogroups are identified based on the Maximum Likelihood
phylogenetic tree (Figure 2.6) and haplotype network (Figure 2.7).
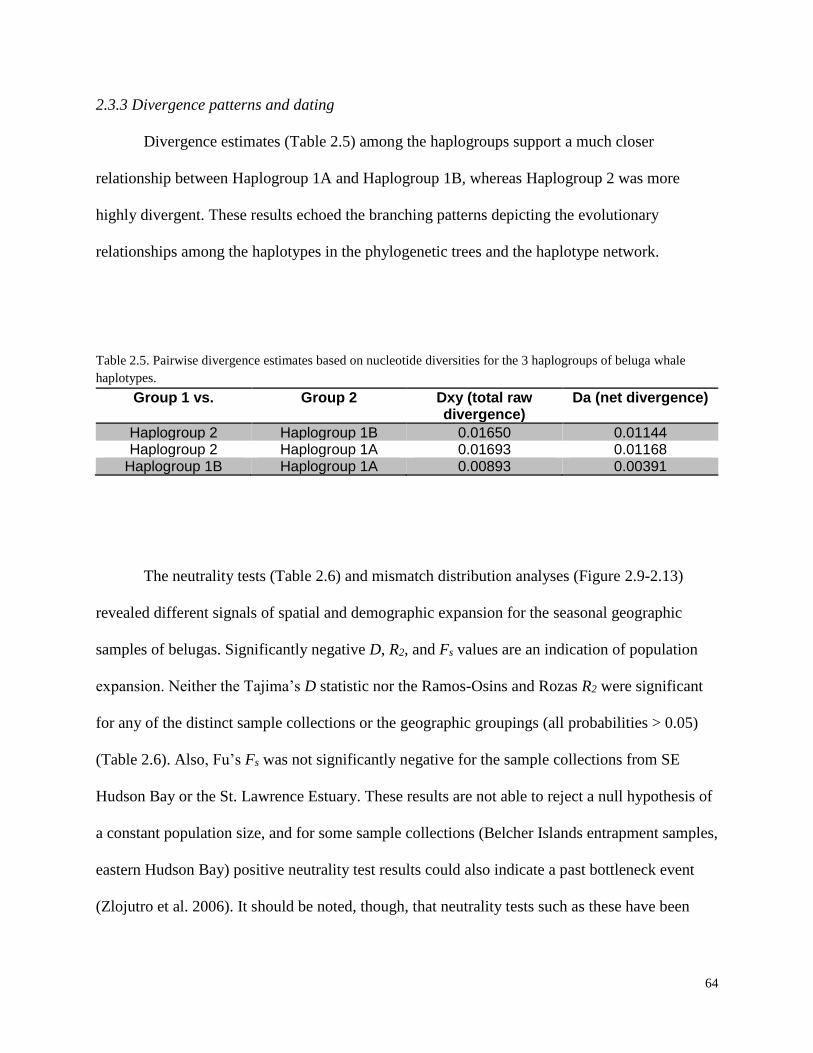
64
2.3.3 Divergence patterns and dating
Divergence estimates (Table 2.5) among the haplogroups support a much closer
relationship between Haplogroup 1A and Haplogroup 1B, whereas Haplogroup 2 was more
highly divergent. These results echoed the branching patterns depicting the evolutionary
relationships among the haplotypes in the phylogenetic trees and the haplotype network.
Table 2.5. Pairwise divergence estimates based on nucleotide diversities for the 3 haplogroups of beluga whale
haplotypes.
Group 1 vs. Group 2 Dxy (total raw divergence)
Da (net divergence)
Haplogroup 2 Haplogroup 1B 0.01650 0.01144 Haplogroup 2 Haplogroup 1A 0.01693 0.01168
Haplogroup 1B Haplogroup 1A 0.00893 0.00391
The neutrality tests (Table 2.6) and mismatch distribution analyses (Figure 2.9-2.13)
revealed different signals of spatial and demographic expansion for the seasonal geographic
samples of belugas. Significantly negative D, R2, and Fs values are an indication of population
expansion. Neither the Tajima’s D statistic nor the Ramos-Osins and Rozas R2 were significant
for any of the distinct sample collections or the geographic groupings (all probabilities > 0.05)
(Table 2.6). Also, Fu’s Fs was not significantly negative for the sample collections from SE
Hudson Bay or the St. Lawrence Estuary. These results are not able to reject a null hypothesis of
a constant population size, and for some sample collections (Belcher Islands entrapment samples,
eastern Hudson Bay) positive neutrality test results could also indicate a past bottleneck event
(Zlojutro et al. 2006). It should be noted, though, that neutrality tests such as these have been
65
shown to have weak power when sampling occurs too early (before substantial population
growth has occurred) or too late (after the population has reached a steady size) (Fu, 1997).
However, Fu’s Fs was significantly negative for five out of nine locations (the High
Arctic samples were combined), all of which had predominantly Haplogroup 1A haplotypes.
Thus, as expected, this combined set of samples representing Haplogroup 1A also had a highly
significant Fu’s Fs (-25.34, P = 0.0003). While the weight of evidence is stronger with congruent
test results, it has been shown that Tajima’s D, Ramos-Osins and Rozas R2, and Fu’s Fs are much
different in their ability to detect departures from population equilibrium (Fu 1997, Ramos-
Onsins and Rozas 2002, Ray et al. 2003). The power of Tajima’s D is greatly influenced by gene
flow and the age of the expansion event, whereas Fu’s Fs is more robust, especially for larger
sample sizes such as in this beluga dataset (Ramos-Onsins and Rozas 2002, Ray et al. 2003).
And since the R2 statistic is based on the mutation frequencies rather than the haplotype
distribution, Fs is more sensitive than R2 to the presence of rare haplotypes expected in a recently
expanded population (Fu 1997, Ramos-Onsins and Rozas 2002).
Based on geographic patterns of haplogroup distributions and the results of the neutrality
tests, pairwise sequence mismatch distributions were examined for groups of samples that
represent potential post-glacial expansions from different refugia. The mismatch distribution
graphs echoed the results of the neutrality tests. The pairwise difference distribution for the
complete summer and winter sample dataset did not have a unimodal pattern (Figure 2.9) and did
not have any significant departures from a model of neutral evolution and constant population
size with any of the neutrality tests (Table 2.6). Instead, there were two modes in the pairwise
distribution. Given the broad geographic range of this large dataset (N=1377), this multimodal
distribution could reflect population substructure (Marjoram and Donnelly 1994, Zlojutro et al.
66
2006). However, Rogers et al. (1996) asserted that pooling data from subdivided populations has
a limited effect on the results of mismatch distribution analyses. Thus, the larger mode (at ~ 11)
most likely corresponds to the number of differences between the two main beluga lineages and
the smaller mode (at ~ 4) reflects the differences among individuals within lineages (Bernatchez
2001).
For the analyses of individual haplogroups, the mismatch distributions for both the
Beaufort Sea samples (Figure 2.10) and the central Canadian locations (Figure 2.11) displayed a
unimodal distribution (at ~3 pairwise differences) that fit the mode and shape of a curve expected
for a population that had undergone expansion in the recent past. The highly significant Fs tests
for each of these sample collections support this interpretation (Table 2.6), as do the non-
significant P-values for the sum of squares deviation (SSD) and raggedness index (Table 2.7).
Based on the mismatch distribution results, the time since expansion for the Beaufort Sea
samples (Haplogroup 1B) was estimated at 51,765 years ago (ya). For Haplogroup 1A (the
central Canadian locations: High Arctic, Hudson Bay, and Cumberland Sound), the mismatch
distribution results estimate a time since expansion of 14,118 ya.
Mismatch distribution results for both the southeastern Hudson Bay samples (James Bay
and Eastern Hudson Bay) and the St. Lawrence Estuary had different patterns and did not display
a typical unimodal bell-shape curve. However, samples from each of these locations did roughly
conform to the expected mismatch distribution under a model of population expansion (Figure
2.13), though the higher raggedness index (Table 2.7) did indicate a poorer fit of the data to the
model. Still, non-significant P-values for the SSD and raggedness index do not deviate from an
expansion hypothesis (Table 2.7). Thus, based on mismatch distribution analyses, the
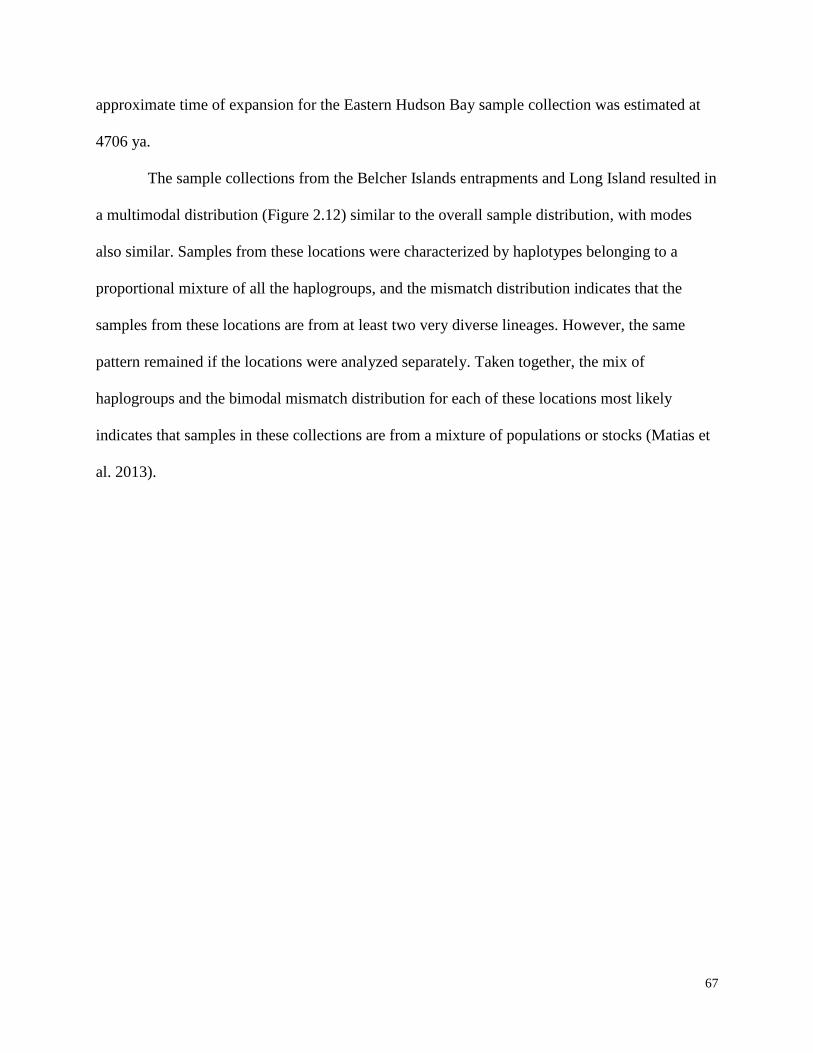
67
approximate time of expansion for the Eastern Hudson Bay sample collection was estimated at
4706 ya.
The sample collections from the Belcher Islands entrapments and Long Island resulted in
a multimodal distribution (Figure 2.12) similar to the overall sample distribution, with modes
also similar. Samples from these locations were characterized by haplotypes belonging to a
proportional mixture of all the haplogroups, and the mismatch distribution indicates that the
samples from these locations are from at least two very diverse lineages. However, the same
pattern remained if the locations were analyzed separately. Taken together, the mix of
haplogroups and the bimodal mismatch distribution for each of these locations most likely
indicates that samples in these collections are from a mixture of populations or stocks (Matias et
al. 2013).
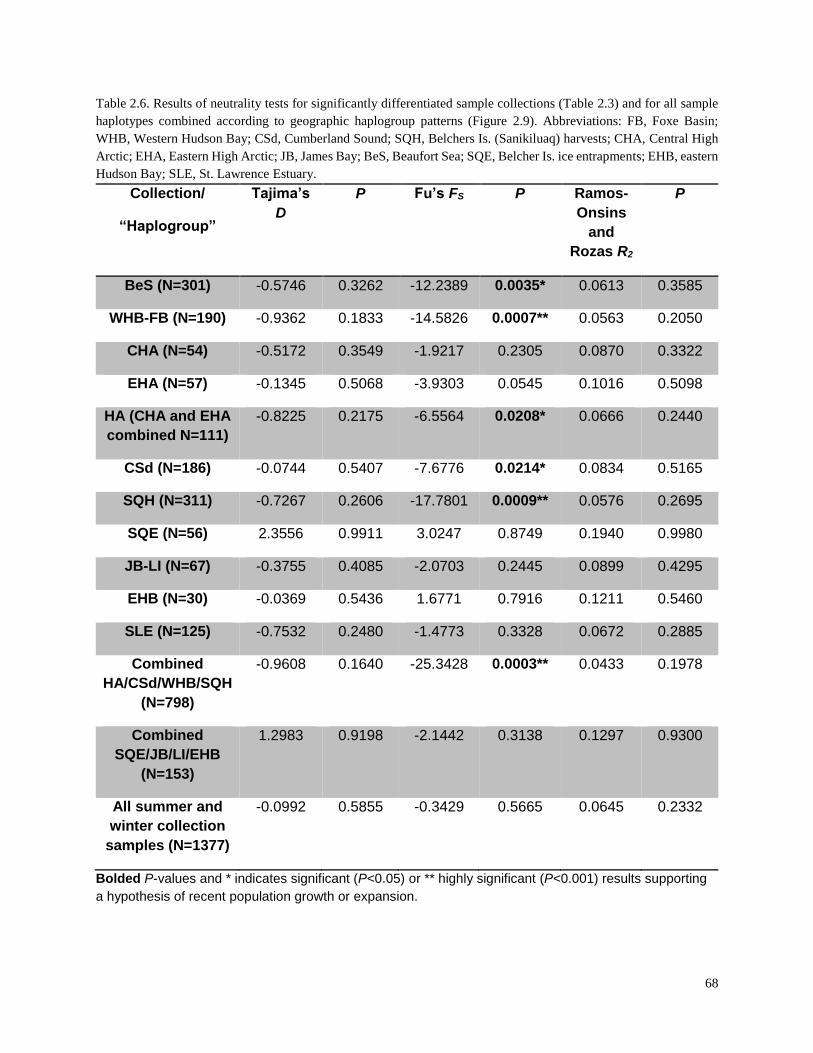
68
Table 2.6. Results of neutrality tests for significantly differentiated sample collections (Table 2.3) and for all sample
haplotypes combined according to geographic haplogroup patterns (Figure 2.9). Abbreviations: FB, Foxe Basin;
WHB, Western Hudson Bay; CSd, Cumberland Sound; SQH, Belchers Is. (Sanikiluaq) harvests; CHA, Central High
Arctic; EHA, Eastern High Arctic; JB, James Bay; BeS, Beaufort Sea; SQE, Belcher Is. ice entrapments; EHB, eastern
Hudson Bay; SLE, St. Lawrence Estuary.
Collection/
“Haplogroup”
Tajima’s
D
P Fu’s FS P Ramos-
Onsins
and
Rozas R2
P
BeS (N=301) -0.5746 0.3262 -12.2389 0.0035* 0.0613 0.3585
WHB-FB (N=190) -0.9362 0.1833 -14.5826 0.0007** 0.0563 0.2050
CHA (N=54) -0.5172 0.3549 -1.9217 0.2305 0.0870 0.3322
EHA (N=57) -0.1345 0.5068 -3.9303 0.0545 0.1016 0.5098
HA (CHA and EHA
combined N=111)
-0.8225 0.2175 -6.5564 0.0208* 0.0666 0.2440
CSd (N=186) -0.0744 0.5407 -7.6776 0.0214* 0.0834 0.5165
SQH (N=311) -0.7267 0.2606 -17.7801 0.0009** 0.0576 0.2695
SQE (N=56) 2.3556 0.9911 3.0247 0.8749 0.1940 0.9980
JB-LI (N=67) -0.3755 0.4085 -2.0703 0.2445 0.0899 0.4295
EHB (N=30) -0.0369 0.5436 1.6771 0.7916 0.1211 0.5460
SLE (N=125) -0.7532 0.2480 -1.4773 0.3328 0.0672 0.2885
Combined
HA/CSd/WHB/SQH
(N=798)
-0.9608 0.1640 -25.3428 0.0003** 0.0433 0.1978
Combined
SQE/JB/LI/EHB
(N=153)
1.2983 0.9198 -2.1442 0.3138 0.1297 0.9300
All summer and
winter collection
samples (N=1377)
-0.0992 0.5855 -0.3429 0.5665 0.0645 0.2332
Bolded P-values and * indicates significant (P<0.05) or ** highly significant (P<0.001) results supporting
a hypothesis of recent population growth or expansion.
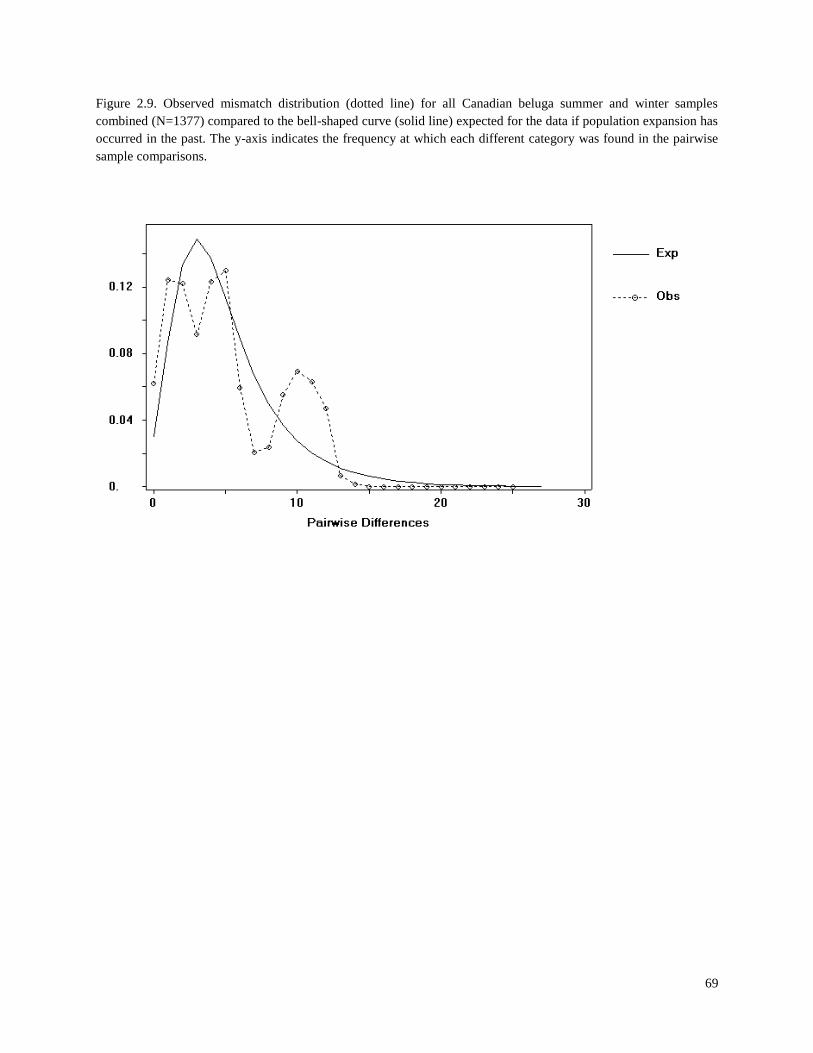
69
Figure 2.9. Observed mismatch distribution (dotted line) for all Canadian beluga summer and winter samples
combined (N=1377) compared to the bell-shaped curve (solid line) expected for the data if population expansion has
occurred in the past. The y-axis indicates the frequency at which each different category was found in the pairwise
sample comparisons.
70
Figure 2.10. Observed mismatch distribution (dotted line) for Beaufort Sea samples, characterized by Haplogroup 1B
(N=301), compared to the bell-shaped curve (solid line) expected for the data if population expansion has occurred in
the past. The y-axis indicates the frequency at which each different category was found in the pairwise sample
comparisons.
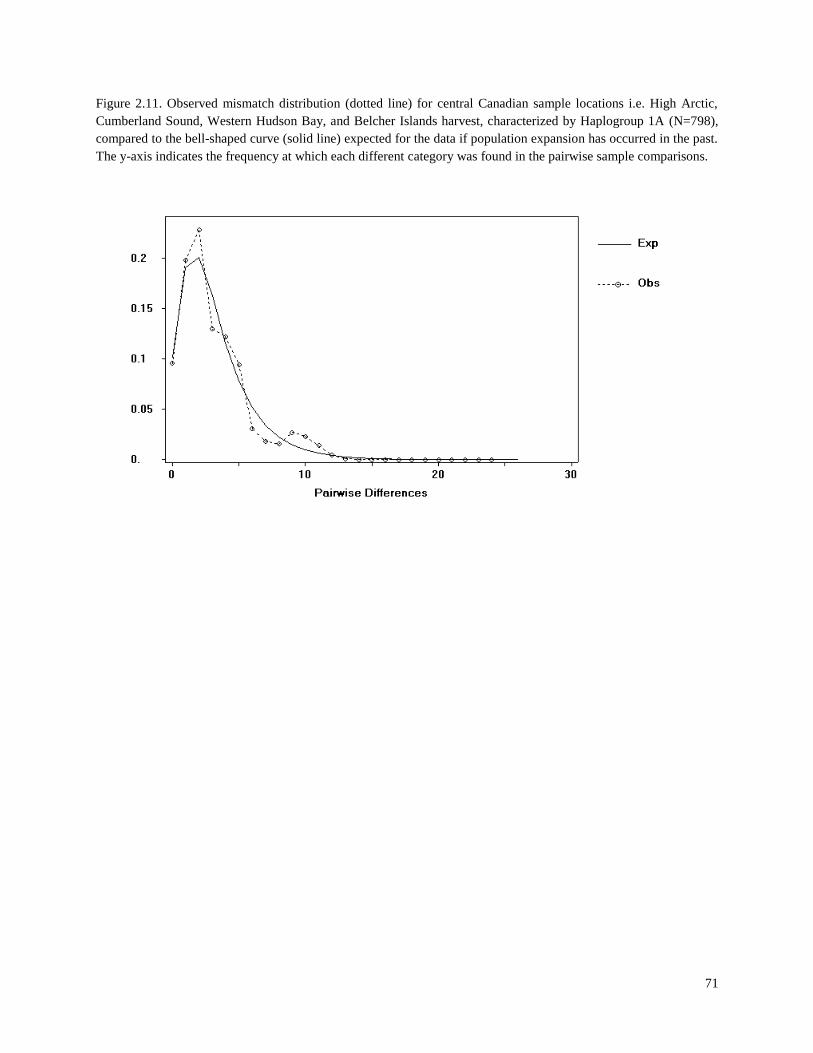
71
Figure 2.11. Observed mismatch distribution (dotted line) for central Canadian sample locations i.e. High Arctic,
Cumberland Sound, Western Hudson Bay, and Belcher Islands harvest, characterized by Haplogroup 1A (N=798),
compared to the bell-shaped curve (solid line) expected for the data if population expansion has occurred in the past.
The y-axis indicates the frequency at which each different category was found in the pairwise sample comparisons.
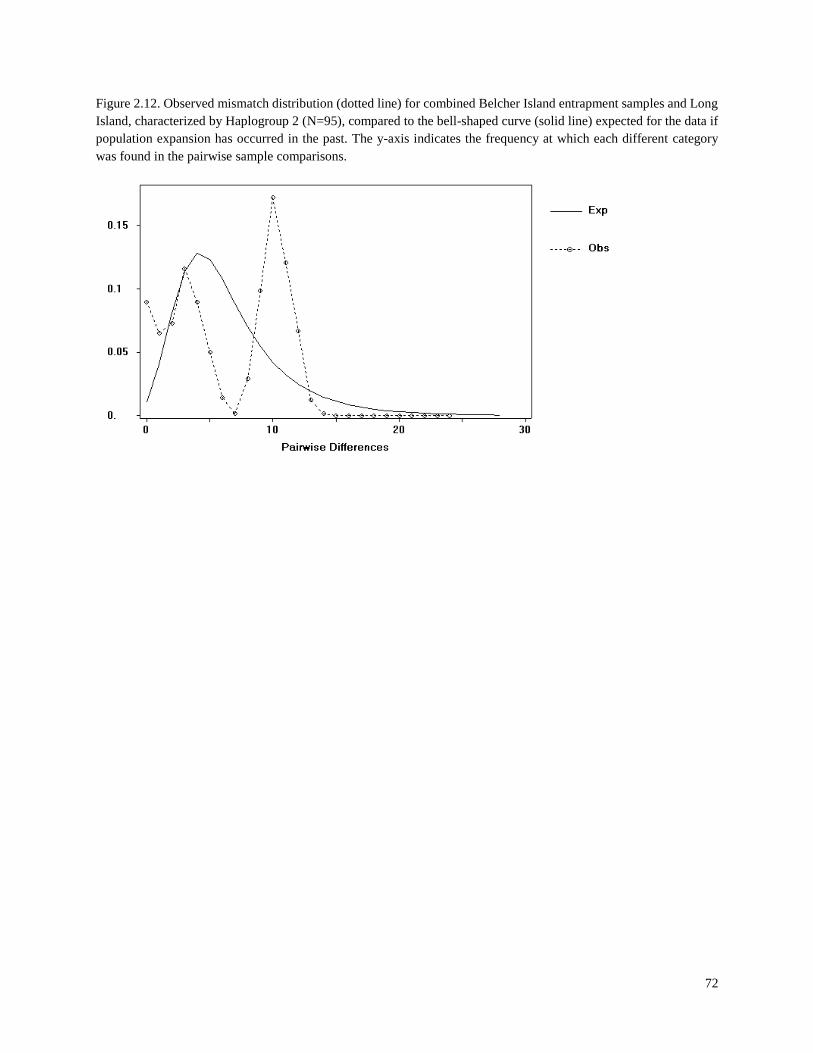
72
Figure 2.12. Observed mismatch distribution (dotted line) for combined Belcher Island entrapment samples and Long
Island, characterized by Haplogroup 2 (N=95), compared to the bell-shaped curve (solid line) expected for the data if
population expansion has occurred in the past. The y-axis indicates the frequency at which each different category
was found in the pairwise sample comparisons.
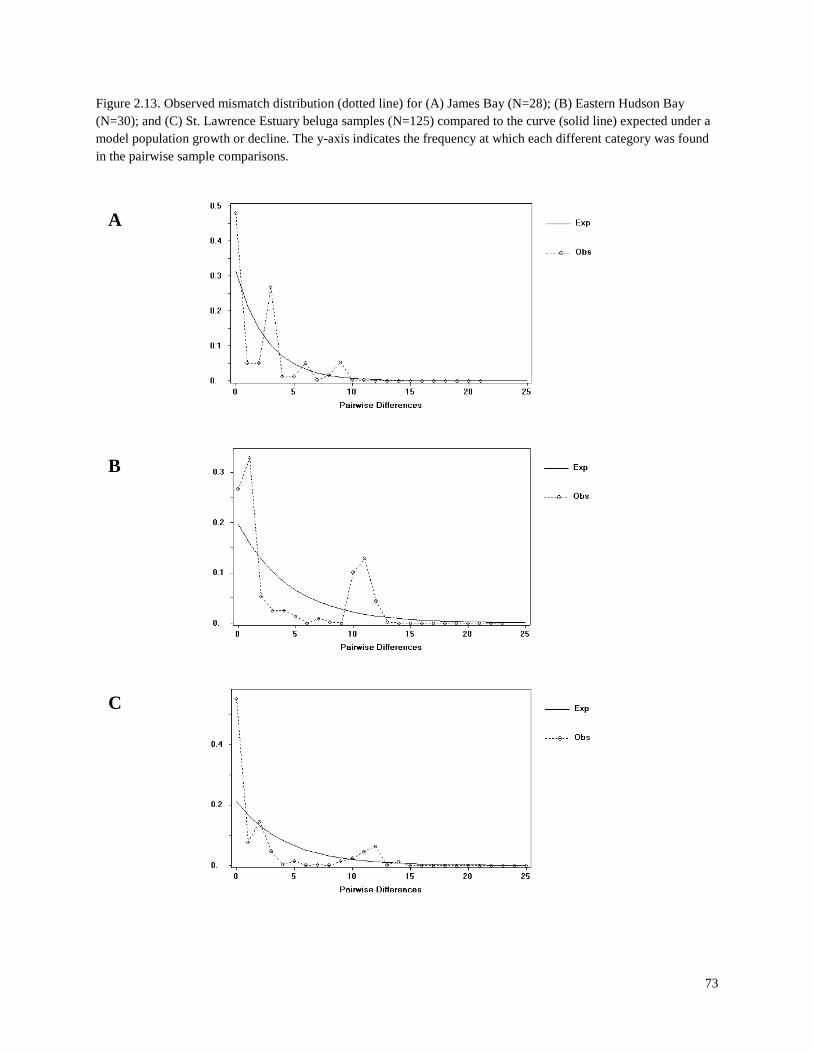
73
Figure 2.13. Observed mismatch distribution (dotted line) for (A) James Bay (N=28); (B) Eastern Hudson Bay
(N=30); and (C) St. Lawrence Estuary beluga samples (N=125) compared to the curve (solid line) expected under a
model population growth or decline. The y-axis indicates the frequency at which each different category was found
in the pairwise sample comparisons.
C
B
A
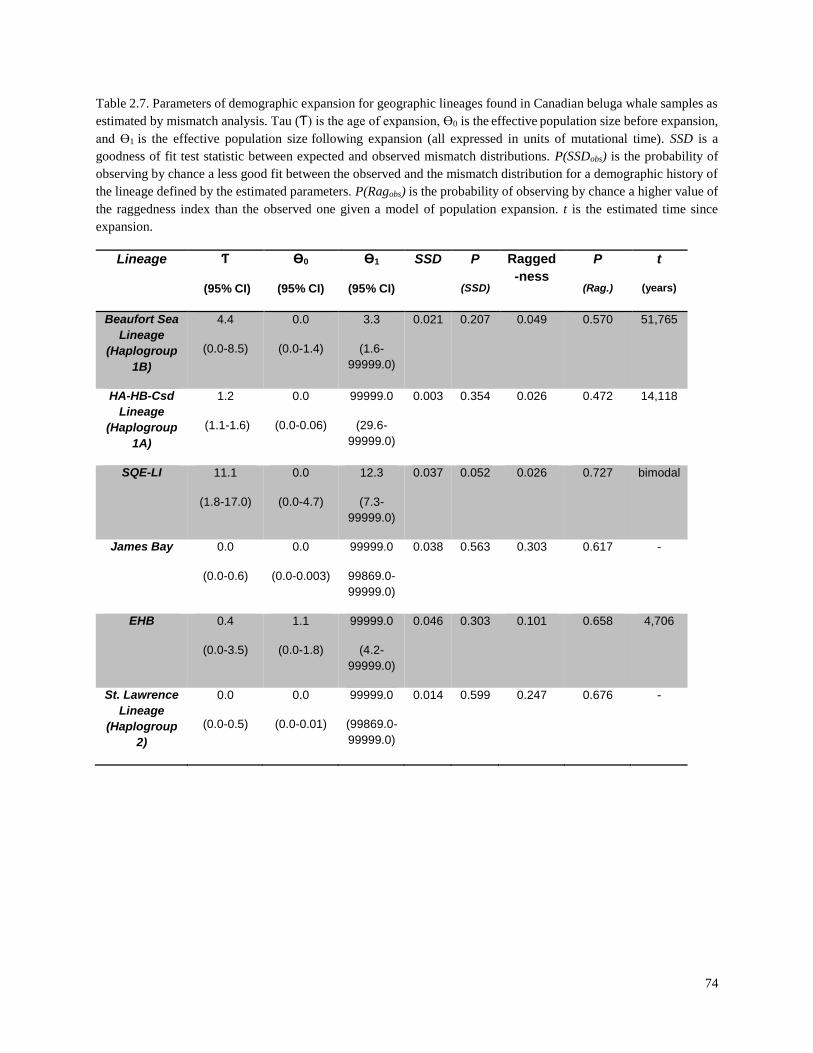
74
Table 2.7. Parameters of demographic expansion for geographic lineages found in Canadian beluga whale samples as
estimated by mismatch analysis. Tau (Ƭ) is the age of expansion, ϴ0 is the effective population size before expansion,
and ϴ1 is the effective population size following expansion (all expressed in units of mutational time). SSD is a
goodness of fit test statistic between expected and observed mismatch distributions. P(SSDobs) is the probability of
observing by chance a less good fit between the observed and the mismatch distribution for a demographic history of
the lineage defined by the estimated parameters. P(Ragobs) is the probability of observing by chance a higher value of
the raggedness index than the observed one given a model of population expansion. t is the estimated time since
expansion.
Lineage Ƭ
(95% CI)
ϴ0
(95% CI)
ϴ1
(95% CI)
SSD P
(SSD)
Ragged
-ness
P
(Rag.)
t
(years)
Beaufort Sea
Lineage
(Haplogroup
1B)
4.4
(0.0-8.5)
0.0
(0.0-1.4)
3.3
(1.6-
99999.0)
0.021 0.207 0.049 0.570 51,765
HA-HB-Csd
Lineage
(Haplogroup
1A)
1.2
(1.1-1.6)
0.0
(0.0-0.06)
99999.0
(29.6-
99999.0)
0.003 0.354 0.026 0.472 14,118
SQE-LI 11.1
(1.8-17.0)
0.0
(0.0-4.7)
12.3
(7.3-
99999.0)
0.037 0.052 0.026 0.727 bimodal
James Bay 0.0
(0.0-0.6)
0.0
(0.0-0.003)
99999.0
99869.0-
99999.0)
0.038 0.563 0.303 0.617 -
EHB 0.4
(0.0-3.5)
1.1
(0.0-1.8)
99999.0
(4.2-
99999.0)
0.046 0.303 0.101 0.658 4,706
St. Lawrence
Lineage
(Haplogroup
2)
0.0
(0.0-0.5)
0.0
(0.0-0.01)
99999.0
(99869.0-
99999.0)
0.014 0.599 0.247 0.676 -
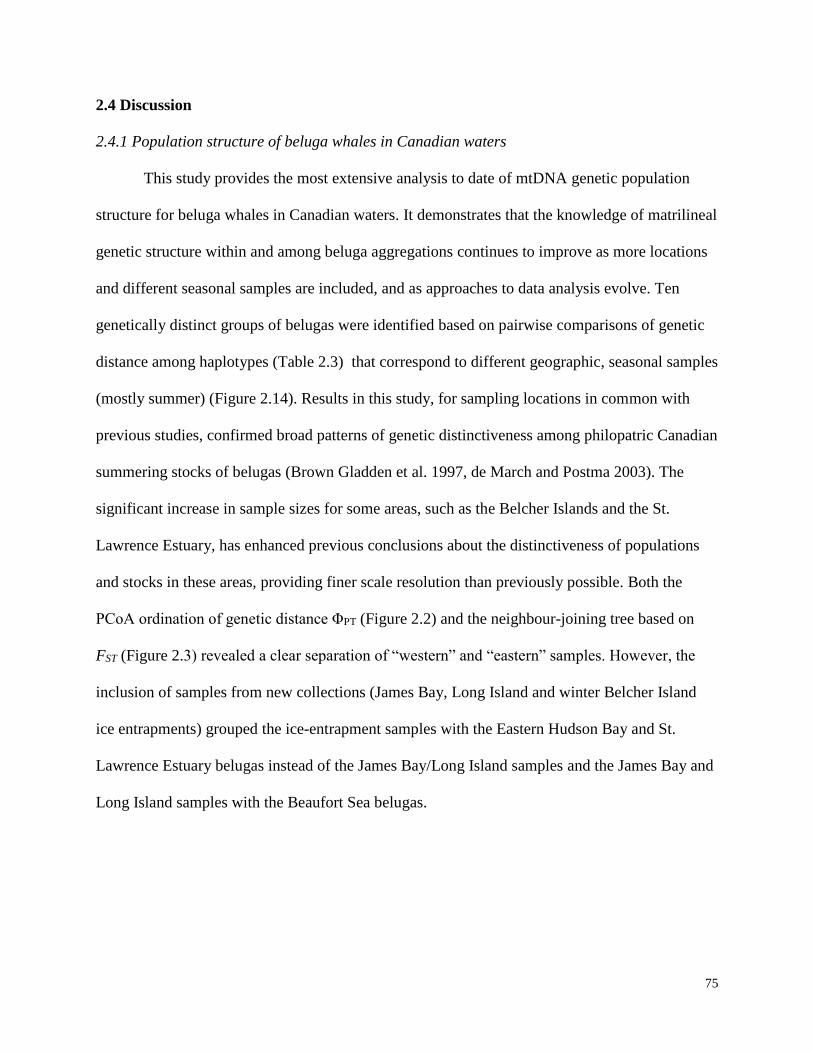
75
2.4 Discussion
2.4.1 Population structure of beluga whales in Canadian waters
This study provides the most extensive analysis to date of mtDNA genetic population
structure for beluga whales in Canadian waters. It demonstrates that the knowledge of matrilineal
genetic structure within and among beluga aggregations continues to improve as more locations
and different seasonal samples are included, and as approaches to data analysis evolve. Ten
genetically distinct groups of belugas were identified based on pairwise comparisons of genetic
distance among haplotypes (Table 2.3) that correspond to different geographic, seasonal samples
(mostly summer) (Figure 2.14). Results in this study, for sampling locations in common with
previous studies, confirmed broad patterns of genetic distinctiveness among philopatric Canadian
summering stocks of belugas (Brown Gladden et al. 1997, de March and Postma 2003). The
significant increase in sample sizes for some areas, such as the Belcher Islands and the St.
Lawrence Estuary, has enhanced previous conclusions about the distinctiveness of populations
and stocks in these areas, providing finer scale resolution than previously possible. Both the
PCoA ordination of genetic distance ΦPT (Figure 2.2) and the neighbour-joining tree based on
FST (Figure 2.3) revealed a clear separation of “western” and “eastern” samples. However, the
inclusion of samples from new collections (James Bay, Long Island and winter Belcher Island
ice entrapments) grouped the ice-entrapment samples with the Eastern Hudson Bay and St.
Lawrence Estuary belugas instead of the James Bay/Long Island samples and the James Bay and
Long Island samples with the Beaufort Sea belugas.
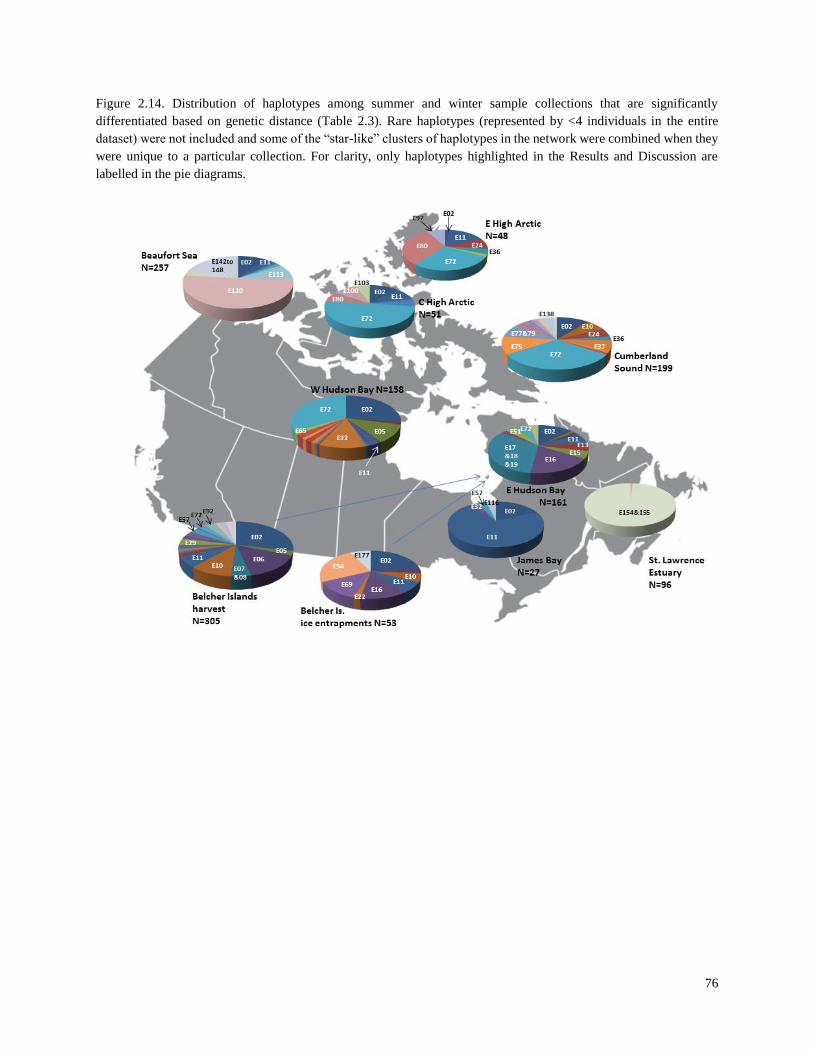
76
Figure 2.14. Distribution of haplotypes among summer and winter sample collections that are significantly
differentiated based on genetic distance (Table 2.3). Rare haplotypes (represented by <4 individuals in the entire
dataset) were not included and some of the “star-like” clusters of haplotypes in the network were combined when they
were unique to a particular collection. For clarity, only haplotypes highlighted in the Results and Discussion are
labelled in the pie diagrams.
77
Belugas summering in the Canadian Central High Arctic (Creswell Bay, Elwin Bay,
Cunningham Inlet) have been considered to be part of a single High Arctic stock, also shared
with western Greenland, based on genetic analyses of five samples from Creswell Bay (Brown
Gladden et al. 1997, 1999). However, satellite tracking studies of belugas tagged in these areas
have challenged this information and suggest the possibility of further segregation among, and
even within, summering localities in the High Arctic (Heide-Jørgensen et al. 2003). Of the
whales tracked in this study, only the belugas tagged in Creswell Bay moved to West Greenland.
This result was incongruent with the hypothesis supported by the genetic analyses at that time
which indicated that the Canadian High Arctic and West Greenland whales were mixing as a
single stock. Additional samples used in this study revealed haplotypes unique to Cunningham
Inlet (CHA) that were not found in the other High Arctic (EHA) location of Grise Fiord (Figure
2.1 and 2.14), which also had unique haplotypes revealed (Table 2.1). These haplotypes, along
with differing frequencies of shared haplotypes, resulted in significant differentiation of the two
geographic High Arctic samples (Table 2.3), providing some genetic evidence in support of the
satellite tracking hypothesis of “segregation within the beluga population in Canada” (Heide-
Jørgensen et al. 2003).
Aerial surveys of James Bay have shown that a large number of whales (approximately
15,000) are distributed throughout the Bay in August (Gosselin et al. 2013). Given the lack of
hunting in this area and failures of biopsy efforts, samples were unavailable to earlier genetic
studies of Canadian beluga populations and critical information has therefore been missing (de
March and Postma 2003, Turgeon et al. 2012). A small number of samples were collected by
hunters in 2003-2004, including Cape Jones Island in the northwest corner of James Bay near
Long Island (Figure 2.1) and Cape Hope Island in the southeastern corner of James Bay. Satellite
78
tags were deployed from Cape Hope Island from 2007 to 2009 along with the collection of tissue
samples from 14 belugas (11 females and 3 males) (Bailleul et al. 2012). All of these samples
were analyzed with the same mtDNA sequencing analyses as this study and included in
geographic comparisons. Of these accumulated samples, 86% were haplotype E11, which is
found in low proportions in other Hudson Bay summer aggregation samples (Postma et al. 2012,
Figure 2.14 this study) and also in the Beaufort Sea and High Arctic samples in low proportions
(Figure 2.14). Haplotype E11 was not found in the Foxe Basin samples, Cumberland Sound
samples, or in the St. Lawrence Estuary samples (Table 2.1).
Adding to the uniqueness of the James Bay samples was evidence from microsatellite
analyses that these samples came from a group of highly related individuals, even though they
were collected over different years (Postma et al. 2012). Also, all 14 of the whales tagged over
three years at Cape Hope Island were haplotype E11 (Postma et al. 2012). The satellite tracking
results revealed that the whales tagged did not leave the southeast portion of James Bay during
the months of August to February, suggesting that these are non-migratory whales belonging to a
distinct population that overwinters in polynyas within James Bay (Bailleul et al. 2012). Results
of all genetic analyses would further suggest that this population is small and isolated given the
similarities of high relatedness and genetic homozygosity of the samples to date with those that
have been characterized for the St. Lawrence Estuary (Table 2.2 and Figure 3.6). It is possible
that these animals belong to a family unit that has been sampled (Palsbøll et al. 2002), but again,
it would be unusual to have a family sampled together over multiple years. Even within years,
kin-groups (except for mothers and calves) are thought to disperse in summering areas (Colbeck
et al. 2012).
79
This does, however, raise questions about the large groups of belugas that have been
recorded during the summer from aerial and other observational surveys along the northwest
coastline of James Bay (Gosselin et al. 2013) and in several river estuaries along the north coast
of Ontario (Armstrong 2013). The genetic, spatial, and seasonal cohesiveness of the Cape Hope
Island belugas would indicate that they do not overlap with the northwest James Bay or north
Ontario coast groups. Thus, the Ontario coastal whales may form (one or more) additional
distinct summering groups of belugas (Gosselin et al. 2013). These whales are currently
considered to belong to the western Hudson Bay stock based on a continuous pattern of beluga
distribution in major river estuaries along the Hudson Bay coast of Manitoba and Ontario
(Armstrong 2013). Given the patterns of finer genetic subdivision of Hudson Bay belugas
revealed in our analyses, this may not be true.
Polynyas, or areas of open water surrounded by ice, have been found to recur each winter
in the same area and provide necessary habitat for migrating or overwintering species of marine
birds and mammals (Stirling 1997). At least 61 distinct, recurring polynyas have been identified
in the Northern Hemisphere, with 21 identified within or partly within Canadian waters (Barber
and Massom 2007). Some of these polynyas are very well-known (e.g. the North Water polynya
in northern Baffin Bay and southern Smith Sound) while others are too small to be mapped with
remote sensing technologies and have no published information (Barber and Massom 2007). The
non-migratory belugas tagged near Cape Hope Island in James Bay are likely utilizing this type
of small, undocumented polynya (Bailleul et al. 2012). However, around the Belcher Islands, in
southeast Hudson Bay and north of James Bay (Figure 2.1), some documented recurring
polynyas have been observed to provide important winter habitat for marine mammals and birds,
including belugas that commonly overwinter to the southwest of the Islands (Gilchrist and
80
Robertson 2000). This study has revealed new, never previously sequenced haplotypes in
samples collected from several winter ice entrapments of belugas around the Belcher Islands
(N=60). These private haplotypes were found in high proportion among the samples (E94, 26%;
E69, 12% and E177, 7%) and in each year entrapments were sampled (2004, 2011, 2013). This
suggests the presence of an unrecognized population of belugas that does not migrate out of
Hudson Bay for the winter. If migration was occurring along traditional migration routes, it is
likely that the haplotypes would have been detected in our harvest samples of migratory whales
(‘NQ’ in Table 2.1). This additional Hudson Bay population most likely includes the groups of
belugas found in the summer along the north Ontario coast and/or in the northwestern part of
James Bay. However, this is speculative, and cannot be confirmed without genetic analyses of
samples from these summering concentrations of whales.
The combination of ice-entrapment samples and extensive harvest sampling from the
Belcher Islands (by the community of Sanikiluaq) has substantially increased sample size for this
area (SQH N=311, SQE N=56) compared to previous studies using only harvest samples
(N=100, de March and Postma 2003; N=152, Turgeon et al. 2012). The Sanikiluaq harvest
samples contained four private haplotypes (E08, E29, E92, E176) that were found in 9% of the
overall sample. Six haplotypes were found almost exclusively in Sanikiluaq samples (>80%),
with the few other occurrences in areas along what could potentially be a migratory route
through Hudson Strait (NQ in Table 2.1) or in an offshore distribution range to eastern Hudson
Bay (EHB) and Long Island (LI) near the opening of James Bay (Figure 2.1). Furthermore, the
division of the dominant haplotype, H02, of previous studies (Brown Gladden et al. 1997, de
March et al. 2003, Turgeon et al. 2012) into 21 different haplotypes by sequencing a larger
segment of mtDNA provided clearer partitioning with less overlap of haplotypes among all of
81
the Hudson Bay stocks examined (Table 2.1), and has more clearly distinguished the Sanikiluaq
harvest samples from western Hudson Bay samples (Figure 2.14).
Current beluga harvest management approaches that use the genetic assignment of
samples from harvested whales taken by Sanikiluaq hunters only consider Western Hudson Bay
and Eastern Hudson Bay stocks as sources for the harvested whales (DFO 2016). This is in large
part due to a lack of knowledge on the distribution, migratory movements, and abundance of a
possible Sanikiluaq stock. Spatial and temporal overlap of this stock is known to occur with the
genetically distinctive Eastern Hudson Bay (EHB) beluga stock in the summer. Evidence of this
comes from the almost continuous distribution of animals observed during aerial surveys
(Gosselin et al. 2013) and the proportion of mtDNA haplotypes characteristic to the EHB stock
found in the Sanikiluaq summer harvest samples (de March and Postma 2003, Turgeon et al.
2012, present study). Overlap of the Sanikiluaq stock with other, as yet uncharacterized, stocks is
also possible. The Belcher Islands may be at the centre of a genetic “melting pot”, both
historically (Petit et al. 2003) and currently, for various beluga populations and stocks in Hudson
Bay and this could indicate the area is of ecological importance. Under this model, an increase in
genetic diversity (as indicated in Table 2.2, where the Belcher Islands harvest samples had the
highest gene diversity) can result from a post-glacial redistribution of the genetic diversity from
multiple source refugia (Petit et al. 2003). Despite the unknowns, genetic evidence is now quite
compelling that beluga harvests around the Belcher Islands area are composed of a more
complex genetic mixture of stocks than the simple WHB-EHB model currently used.
Furthermore, private haplotypes found consistently over time in this harvest suggest the presence
of a local summer Belcher Islands stock.
82
The analyses in this thesis have supported the identification of at least eight (8)
Designatable Units for belugas in Canada (COSEWIC 2016), including: Eastern Beaufort Sea
(EBS), Eastern High Arctic-Baffin Bay (EHA-BB), Cumberland Sound (CS), Ungava Bay (UB),
Western Hudson Bay (WHB), Eastern Hudson Bay (EHB), St. Lawrence Estuary (STL), and
James Bay (JB).The beluga DU report also recognized the evidence of another DU, not officially
assessed and requiring further sampling, in southeastern Hudson Bay as indicated by the samples
from ice-entrapped whales near the Belcher Islands (COSEWIC 2016). Again, this data and
information resulted from the preliminary results of this thesis. However, the analyses in this
thesis also indicate finer scale genetic structure in the EHA-BB and WHB DUs. The authors of
the report acknowledge that “the EHA-BB DU is under-sampled, especially in the high and
central Arctic regions” (COSEWIC 2016). Given the multiple lines of evidence employed in the
report for DU identification, it is possible that the data and analyses in this thesis do not meet the
threshold required for a separate DU around Cunningham Inlet (Central High Arctic). However,
its genetic distinctiveness should be recognized for further efforts for sampling, genetic analyses
and re-evaluation.
For the Western Hudson Bay Designatable Unit of beluga (WHB-DU), there is some
recognition that further substructure may be present due to estuary specific lineages (de March
and Postma 2003, COSEWIC 2016). The report (COSEWIC 2016) focusses on the Seal,
Churchill and Nelson Rivers as examples, but fails to mention the complex mixture of
haplotypes from whales harvested in the spring and summer around the Belcher Islands. The data
in this study represent a large number of samples (N=310) collected over almost two decades
from seasonal harvesting and results consistently indicate the presence of unique haplotypes and
haplotype mixtures not found in other Hudson Bay sampling collections. Again, perhaps the
83
multiple lines of evidence are not available to identify the evolutionary significance of this
sample collection, but the genetic distinctiveness is evident, and further research should be
focussed in this area.
2.4.2 Influence of dispersal, both historical and contemporary, on extant beluga population
genetic structure
The geographical pattern of genetic variation arises from a combination of genetic
structure and population history (Templeton et al. 1995). The finer scale resolution of mtDNA
diversity and structure among Canadian beluga stocks revealed by this study provides an
opportunity to re-visit the evolutionary relationships of haplotypes from different geographic
locations, phylogeographic hypotheses about the use of glacial refugia during the last glacial
maximum and the possible routes of post-glacial range expansions by belugas. As in previous
studies (Brown Gladden et al. 1997, de March et al. 2003), at least two divergent clades of
haplotypes were supported by all methods of phylogenetic analyses (gene trees, Figures 2.4 –
2.6, and median-joining network, Figure 2.7). However, the joint interpretation of the maximum
likelihood tree and the network (Figure 2.6 and 2.7) supports three main groups of haplotypes
that cluster together based on ancestral nodes with multiple descendant haplotypes. Furthermore,
the geographical distribution of these haplogroups (Figure 2.8) offers a different model for the
location of possible refugia and the patterns of historical expansion and recolonizations by
Canadian stocks of belugas compared to the previous hypothesis (Brown Gladden et al. 1997, de
March et al. 2003).
Glacial refugia have been defined in different ways, but essentially were areas or habitats
that allowed the survival of species during periods of adverse conditions (Bennett and Provan
2008, Keppel et al. 2012, Gavin et al. 2014). Characteristics of refugia will vary spatially and
84
temporally, but generally, species will expand away from refugia once conditions become more
favourable (Gavin et al. 2014). These range expansions can “produce genetic patterns that persist
for many hundreds or thousands of generations” (Nichols and Hewitt 1994) and therefore leave
some predictable modern day signatures. First, areas of glacial refugia will have the highest
within-population and between-population genetic diversity due to a longer demographic history
than the postglacial colonies (Taberlet et al. 1998, Provan and Bennett 2008, Maggs et al. 2008).
Second, because the leading edge of range expansions by long-distance dispersers causes a series
of founder events (Hewitt 2000), there will be a steady reduction of genetic diversity with
increasing distance from the refugial, or ancestral population (Slatkin and Excoffier 2014). And
third, contact zones will form where recolonizing populations meet (Bennett and Provan 2008).
These areas are characterized by high levels of genetic diversity but lack unique or “private”
haplotypes more typical in refugial populations that were isolated during the glacial maximum
(Petit et al. 2003, Maggs et al. 2008). Genetic patterns of expansion will also be influenced by
the effective population sizes before and after the expansion (Avise 1984, Rogers and
Harpending 1992).
Glacial refugia for North American belugas were thought have been south of the current
beluga distribution (Brown Gladden et al. 1997). Previous patterns of genetic variation suggested
that most of the summer aggregations of belugas currently distributed in Canadian waters are the
result of historical range expansion and recolonizations from a Pacific Ocean refugium (Brown
Gladden et al. 1997, de March and Postma 2003). The results of our study support a hypothesis
of a more complex series of postglacial expansions by belugas from a more diverse source of
multiple refugia.
85
Analyses of beluga samples from the Beaufort Sea in our study are consistent with an
expansion of whales from a western Arctic refugial area. Genetic studies of other Pacific Arctic
marine species have proposed the presence of refugia in the eastern Bering Sea and/or near
southeastern Alaska (e.g. Barrie and Conway 1999, O’Corry-Crowe et al. 2008, Canino et al.
2010). Signals of beluga expansion were detected in the mismatch distribution (Figure 2.10,
Table 2.7), a significant Fu’s Fs test (Table 2.6), the moderate level of genetic diversity (Table
2.2), a large number of private haplotypes in the Beaufort Sea samples (Table 2.1), and
significantly different haplotypes from all other Canadian locations (Table 2.3, Figure 2.2, Figure
2.14). The presence of a single haplotype (E120) in greater than 50% of the samples, along with
private haplotypes connected by a single mutation to E120 in a star-like pattern in the network
(Figure 2.7), suggests this is an ancestral haplotype (Posada and Crandall 2001) unique to the
Beaufort Sea area. The time of expansion for this stock, as estimated by mismatch analysis
(Table 2.7), is approximately 53 kilo anni (ka) before present (BP), which suggests beluga
expansion into the western Canadian Arctic occurred before the glacial retreat from the last
glacial maximum approximately 12 ka BP. Approximately 73 ka BP, the largest volcano
eruption of the last two million years occurred at the Toba volcano in northern Sumatra and was
considered in some studies to have contributed to climate cooling and changes in global
environments (Williams et al. 2009). Despite this major climate event, it is unclear what direct
and enduring ecological effects the eruption may have had on global climate and wild
populations (Louys 2007, Williams 2012). The late Pleistocene, in general, was characterized by
environmental fluctuations (Louys 2012), and beluga expansions in the western Canadian Arctic
may have coincided with glacial/interglacial cycles of the late Pleistocene epoch.
86
However, dominant expansion from the west (Bering Sea) into the central Canadian
Arctic is not supported by our current data. Mismatch distribution in these samples (Figure 2.11)
and significant Fu’s Fs values (Table 2.6) do support a pattern of a recent expansion into this
area. However, it would be expected that samples from locations along pathways of
recolonizations from a single western refugium would be marked by a steady reduction of
genetic diversity and evidence of founder events (Hewitt 2000, Excoffier et al. 2009, Slatkin and
Excoffier 2012). Sample collections for this area (High Arctic locations, Western Hudson Bay,
Belcher Islands, Cumberland Sound) had the highest genetic diversity of all the summering areas
(Table 2.2). Given that these areas were covered with an ice sheet complex at the last glacial
maximum (Dyke 2004), it is unlikely that any of these locations were themselves refugial areas.
The patterns of genetic diversity instead indicate that the central Canadian Arctic is a contact
zone of colonizing belugas emigrating from multiple different refugia which resulted in
admixture of ancestral haplotype lineages (Petit et al. 2003, Maggs et al. 2008).
The present geographic distribution of haplotype E11, found in all sample collections
except Cumberland Sound and the St. Lawrence Estuary, suggests it is one of these ancestral
haplotypes. This distribution, and its position in the network (Figure 2.7) and ML gene tree
(Figure 2.6) clustering with E120, would indicate that there was at least some expansion of
beluga from a western refugium (N Pacific/E Bering Sea) into the contact zone, especially in the
High Arctic locations.
With this interpretation, the presence of haplotype E11 in 100% of whales tagged over
three years at Cape Hope Island in SE James Bay is quite unusual. A small occurrence of a
“western haplotype” was noted by de March and Postma (2003) for the Belcher Islands and
eastern Hudson Bay, and was further suggested to have infiltrated the area via recolonization
87
routes from the west through Fury and Hecla Strait approximately 5 ka BP. At this time, glacial
retreat and depressed coastlines would have provided connections between the western Arctic
and Hudson Bay. This connection would have disappeared around 3 to 4 ka BP when land levels
rose due to postglacial rebound, which then contributed to a loss of continued gene flow between
these areas (de March and Postma 2003). Studies of the postglacial distribution of radiocarbon
aged bowhead whale (Balaena mysticetus) fossils (Dyke et al. 1996) and the historical and
present-day patterns of gene flow in bowhead whales (Alter et al. 2012) provide evidence in
support of this hypothesis.
Based on the samples available for our analyses, an origin for the SE James Bay beluga
genetic signature could be the result of a leptokurtic founder event at the leading edge of a west-
to-east postglacial recolonization route through Fury and Hecla Strait. Revised maps of North
American deglaciation, with updated timing of ice margin history, indicate this route was open
approximately 7 ka BP (Dyke 2004). Leptokurtic movement is a rare, long-distance dispersal
event where some individuals move far ahead of the distribution of the main population (Hewitt
1996). This type of range expansion can result in the “establishment of pocket populations….that
tend to show a high level of inbreeding within populations and of differentiation between
populations” (Ibrahim et al. 1996). Given that belugas have been shown to travel thousands of
kilometres in short time periods (one whale was shown to travel over 5000 km in just over three
months (Heide-Jørgensen et al. 2003)), this pattern for beluga dispersal is possible. Recent
research has further suggested that leptokurtic dispersal may be linked to individual variation of
behavioural traits for boldness and exploration of habitats (Fraser et al. 2001, Hawkes 2009,
Canestrelli et al. 2016) and that these behavioural polymorphisms can shape “current geographic
patterns of species distributions and genetic diversity” (Canestrelli et al. 2016). In fact,
88
individual behavioural characteristics such as this (i.e. related to movement patterns) can be
important for the evolution and establishment of novel traits, and it can occur over a relatively
fast evolutionary timescale (fewer than 100 generations) (Zuk et al. 2014). Predator avoidance,
foraging and food preference, and mating and mate preferences are other behaviours that can act
as novel selection pressures (Zuk et al. 2014), and may also have the potential to influence trait
evolution in belugas.
The High Arctic locations, western and northern Hudson Bay and Cumberland Sound all
have large proportions of an ancestral haplotype E72, which is absent or only present in small
proportions in all other sample collections (Figure 2.10). The absence of this haplotype in the
Beaufort Sea samples suggests a non-western refugial source, likely in the eastern Canadian
Arctic, contributed to the expansion of belugas into these areas after ice receded, and contributed
to the observed genetic data patterns consistent with a postglacial contact zone. The important
distinction in this study is that this refugium is not the same as the source of the “eastern
assemblage” of haplotypes hypothesized previously (Brown Gladden et al. 1997, de March and
Postma 2003). The haplotypes connected to E72 (Haplogroup 1A) are significantly differentiated
with high divergence (Table 2.5) from this eastern assemblage (included in this study with
Haplogroup 2).
Samples from Cumberland Sound have genetic signatures of high diversity (h = 0.8635,
Table 2.2), large numbers of private haplotypes (Figure 2.10) and are from an area with a small,
non-migrating population of belugas (Richard et al. 2010). It is likely that these samples have
been collected from a mixture of this resident population and migrating whales from other stocks
that temporarily move into parts of Cumberland Sound; however, the data would suggest that a
refugial population of belugas was located near the coast of Southeast Baffin Island. Coastal,
89
periglacial refugia have been proposed for the North Atlantic (Maggs et al. 2008) and several
possible offshore refugial areas indicated for marine mammals (O’Corry-Crowe et al. 2008).
Patterns of ice retreat at the end of the last glacial maximum indicate that Cumberland Sound
started to open approximately 10.25 ka BP (Dyke 2004). Thus, this may have been the first area
recolonized by expansion from a nearby refugium.
Genetic patterns of range expansion by belugas from the North Atlantic or Baffin Bay
into Hudson Bay and towards the High Arctic are also consistent with deglaciation patterns. Ice
retreat at the east end of Hudson Strait started to fluctuate around16 ka BP (Dyke 2004). By
approximately 9 ka BP, Hudson Strait was open from the east as was Lancaster Sound and the
Gulf of Boothia in the High Arctic (though movement north along the east coast of Baffin Island
to the entrance of Lancaster Sound was possible much earlier) (Dyke 2004). Movement by
belugas into the central part of Hudson Bay would have been possible around 7.8 – 7.6 ka BP
(Dyke 2004). The estimated time since expansion for this group of samples of 14 ka BP based on
mismatch distribution analyses (Haplogroup 1A, Table 2.7) supports this hypothesis.
All of these estimated times since expansion need to be interpreted in the context of the
phylogenetic analyses. Disagreement in the outcomes of different tree-building methods using
the same dataset, as observed in the analyses of the beluga data, is often due to conflicts arising
from the complex interconnections of within-species data (Morrison 2005, Huson and
Scornavacca 2010). Bifurcating trees with simple hierarchical connections are often not able to
capture the evolutionary impact of population-level processes, nor the relationship complexities
of inter-breeding populations (Posada and Crandall 2001). Furthermore, the beluga phylogenetic
trees for all methods resulted in branching patterns (i.e. short branches) typical of incomplete
lineage sorting that often occurs when there has been few generations since divergence
90
(Maddison 1997). Both large ancestral effective population sizes (Nichols 2001) and relatively
few generations since divergence (Maddison 1997) result in a higher likelihood that lineages will
fail to completely sort out at the same time as speciation events, or population sub-division
within a species (Maddison and Knowles 2006).
The most cryptic patterns for beluga haplotype distributions and diversity remain with the
“eastern mtDNA assemblage” (Brown Gladden et al. 1997, de March and Postma 2003). In our
study, the beluga haplotype lineages that cluster in Haplogroup 2 were highly divergent from all
other haplotypes (Figures 2.3 – 2.6, Table 2.5), and the number of mutations separating the two
clades (4+ in the haplotype network, Figure 2.7) indicates a long separation between the
ancestral population of this group from all other Canadian beluga stocks (Maggs et al. 2008).
However, the geographic distances between the two SE Hudson Bay sample collections and the
St. Lawrence Estuary population, and the differences in movement patterns and habitat use
among these areas suggest further evolutionary patterns. The very low genetic diversity in the St.
Lawrence samples (Table 2.2), plus the lack of any shared haplotypes with any other location
(Figure 2.14), suggests that colonization of the St. Lawrence Estuary was from a different glacial
refugium as eastern Hudson Bay and the Belcher Islands. This pattern of multiple refugia with
little or no contact has been described for other species (see Maggs et al. 2008), notably for
hermit crabs (Pagurus longicarpus) in areas of the North Atlantic around Maine (US) and Nova
Scotia (Canada) (Young et al. 2002). Beluga may have inhabited a similar refugial area to hermit
crabs. The Champlain Sea was an extension of the Atlantic Ocean that encompassed the St.
Lawrence River around 13 – 9 ka BP (Cronin et al. 2008). Approximately 80% of whale remains
found in the area of the Champlain Sea have been identified as beluga (N= 21 beluga fossils)
(Harington 2006, 2008). A nearly complete beluga skeleton has been radiocarbon dated to 10.7
91
ka BP (Harington 2006), and several other fossilized beluga remains to 10.4 ka BP (Harington
2008). The prominence of beluga fossils in the Champlain Sea and the ages of these fossils
suggest that this was suitable habitat for belugas as deglaciation of the St. Lawrence River began
and the Champlain Sea formed approximately 11.5 ka BP (Dyke 2004, Cronin et al. 2008).
Ancient DNA analyses of these beluga fossils would add additional data to further molecular
phylogeographic investigations of refugia in this area of the North Atlantic (Gavin et al. 2014).
The samples collected from the Belcher Islands ice entrapments also contained, at
relatively high frequency, haplotypes that were not found in any other collection (Table 2.1,
Figure 2.14). Similarly, the eastern Hudson Bay samples contained the highest proportion of
other haplotypes clustered in Haplogroup 2. This indicates that belugas used different post-
glacial colonization routes into southern Hudson Bay with different timing and/or refugia than
eastern Hudson Bay belugas (Maggs et al. 2008, Keppel et al. 2012). These refugia were both
likely in the Atlantic Ocean, with expansion occurring along routes through Hudson Strait. The
mismatch distribution estimated time of expansion for the eastern Hudson Bay beluga stock is
approximately 4.7 ka BP (Table 2.7). This estimate agrees very closely with radiocarbon dated
beluga fossil material from the Great Whale River, Quebec, which suggested belugas had
recolonized eastern Hudson Bay by at least 4.3 ka BP (Harington 2003). The timing of
deglaciation patterns for Hudson Strait and Hudson Bay indicate this would have been possible
from an expansion from the northeast Atlantic well before that time, approximately 7.6 – 7.2 ka
BP (Dyke 2004).
However, as the Laurentide Ice Sheet began to recede from the south, along its edge, the
Champlain Sea was joined to a series of interconnected glacial lakes approximately 11.5 ka BP
(Cronin et al. 2008), including Lake Agassiz and Lake Ojibway. These “gigantic” lakes
92
disappeared after northwards drainage into Hudson Bay approximately 7.7 ka BP (Dyke 2004).
Furthermore, ice scour patterns indicate that the initial drainage of these lakes may have been
into western Hudson Bay and that more than one northward flushing may have occurred (Dyke
2004). The presence of beluga fossils, discussed previously, provide evidence of belugas
inhabiting the Champlain Sea (Harington 2006, 2008) and gives support to the possibility of
belugas recolonizing Hudson Bay via an expansion from the south (de March and Postma 2003).
Belugas have been shown to move into warmer, brackish waters and lakes (St. Aubin et al. 1990,
Boily 1995, Kocho-Schellenberg 2010), and warmer sea surface temperatures in the North
Atlantic at the end of last glacial maximum (Hewitt et al. 2001) may have allowed persistence in
these glacial lakes.
An alternate possibility is the existence of cryptic glacial refugia within Hudson Bay
itself. The existence of these refugia, not identified in paleorecords (Keppel et al. 2012), have
been proposed in the Arctic for a diverse range of species, including white spruce (Picea glauca)
(Anderson et al 2006), polar tiger moths (Pararctia subnebulosa) (Bolotov et al. 2015), and
collared lemmings (Dicrostonyx groenlandicus) (Fedorov and Stenseth 2002). Computer
modelling of the Laurentide ice sheet(s) in North America indicates that erratics in ice formation
and ice flow were common around the Belcher Islands and Hudson-James Bay lowland (Prest
1990). Given the ability of modern belugas to navigate areas of shifting and heavy ice cover
(Richard et al. 2001, Suydam et al. 2001), perhaps suitable habitat for belugas was present and
allowed for the persistence of whales in these areas throughout the last glacial maximum.
Drawing conclusions about historical expansion patterns from phylogeographic analyses
of modern genetic diversity must consider a number of confounding influences. Marjoram and
Donnelly (1994) point out that the interpretation of non-unimodal distributions of mtDNA
93
pairwise differences need to consider not only a hypothesis of constant population size or
geographic subdivision but a variety of other population genetics models such as selection,
alternate mechanisms of mutation and unique population or migration dynamics. Certainly,
migration strategies of belugas vary among regions and within regions, such as SE Hudson Bay
and James Bay. However, present migration patterns may not entirely reflect post-glacial
colonization routes. Migration routes are shaped by numerous factors other than historic and
genetic influences, such as: barriers, mortality costs and/or predation, energy costs, and
navigational cues including search behaviours and memory (Alerstam et al. 2003, Avgar et al.
2013, Shaw and Couzin 2013, Fagan et al. 2013). Evidence of close kin associations during
migration in extant belugas has demonstrated the importance of social learning as a behavioural
driver of migration routes (Colbeck et al. 2012), which can also evolve over ecological
timescales (Zuk et al. 2014).
The impact of historic commercial harvesting and other human activities (such as
hydroelectric development, shipping and industrial pollution) are also likely to have influenced
the extant genetic patterns of Canadian beluga stocks (e.g. Allendorf et al. 2008). Starting in the
1500s, Spanish and French Basque commercial whalers hunted several species of whales nearly
to extinction along the east coast of Canada (Pope 2015). Though bowhead whales and right
whales (Eubaleana glacialis) were the primary targets of commercial whaling (McLeod et al.
2008), belugas were also taken, especially from the 1850s to the early 1900s in Cumberland
Sound, Ungava Bay, eastern Hudson Bay and the St. Lawrence Estuary (Reeves and Mitchell
1989, Reeves and Smith 2003, Lawson et al. 2006). This historical commercial whaling reduced
the numbers of belugas in these areas by approximately 75% (Cumberland Sound, Eastern
Hudson Bay) to 90% (St. Lawrence Estuary and Ungava Bay) (Lawson et al. 2006). The low
94
level of haplotype diversity in the St. Lawrence Estuary (Table 2.2) likely reflects a demographic
bottleneck as a result of the severe reduction in population size (e.g. Nyström et al. 2006).
Conversely, high levels of haplotype diversity in Cumberland Sound and eastern Hudson Bay
beluga samples could indicate that the source populations for expansion into these areas may
have been large in size and/or high in genetic diversity and were able to retain diversity despite
high levels of historic commercial exploitation. For example, a similar history of commercial
exploitation and near extinction of Atlantic walrus (Odebenus rosmarus rosmarus) in Svalbard
was assessed for genetic impacts using ancient DNA techniques (Lindqvist et al. 2016). Ancient
sample haplotypes were nested in the modern samples, and higher than expected mtDNA
sequence variation was found in the modern Svalbard samples, indicating that intense hunting
may not have resulted in an extensive loss of mtDNA genetic variation. Again, ancient DNA
analyses of pre-commercial whaling beluga specimens and fossils would enhance the
interpretation of genetic patterns of modern beluga samples.
2.4.3 Predicting changes in movement patterns and population genetic structure among
Canadian beluga populations
Genetic information is essential for the development and modification of conservation
and management plans that seek to maintain species biodiversity vulnerable to stressors such as
changing climate and anthropogenic activities (e.g. Waples et al. 2008, Sgrò et al. 2010). The
identification of Canadian beluga stocks based on body size differences, summering aggregation
areas and migration patterns has been used for decades to evaluate the impacts of human
activities such as industrial development (e.g. hydro-electric development, shipping) and hunting
on the species biodiversity, abundance, and population trajectories (Reeves and Mitchell 1989,
95
COSEWIC 2004). The concerns over the impacts of climate change, both direct and indirect, on
belugas have been increasing as the potential magnitude of threats due to cumulative stressors
are assessed (e.g. Laidre 2008, O’Corry-Crowe et al. 2008, Moore and Huntington 2008,
Huntington 2009, Laidre et al. 2015). Genetic tools can add both evolutionary insights for beluga
population histories and contemporary data for understanding current population diversity and
structure (O’Corry-Crowe et al. 2008).
Belugas are considered to be moderately sensitive to climate change and was the least
sensitive of the Arctic cetaceans because of its overall relative flexibility (Laidre et al. 2008).
The results of this study reveal a genetic diversity and suggest a phylogeographic history across
the Canadian range of belugas that further supports this idea of climate change resilience. In
contrast, narwhals (Monodon monoceros) are considered the most sensitive Arctic cetacean to
climate change as a consequence of close associations with ice and specialized feeding (Laidre et
al. 2008). Despite ecological similarities to belugas in migrations, area usage and large
population sizes, narwhals have very low levels of mtDNA genetic diversity (Palsbøll et al.
1997, de March et al. 2003) The identification of greater haplotype diversity in the Canada-wide
distribution of belugas has yielded more insight about the demographic histories of these whales
in many areas. Southeastern Hudson Bay and James Bay have a more complex mixture of
overlapping stocks than previously defined, and genetic evidence supports observations of
diverse migration and movement patterns and could indicate “uniquely adapted ecologies and
behaviours” in this area (Reeves and Mitchell 1989, O’Corry-Crowe et al. 2008). However, the
effects of a demographic bottleneck and reduction of the number of haplotypes in the St.
Lawrence Estuary appear more severe that previously indicated (Brown Gladden et al. 1997, de
March and Postma 2003) and highlight the impact that human activities can have on isolated
96
beluga populations. The inferred ability of belugas to respond to historic periods of climate
change through the use of multiple refugia, routes of range expansions and recolonizations routes
reinforce the idea of the flexibility of this species to shift its range in response to changing
climate (Huntington 2008).
2.5 Acknowledgements
Most of the samples for genetic analyses in this study were collected by hunters from
communities in the Inuvialuit Settlement Region (ISR), Nunavut, and Nunavik during harvest
monitoring programs funded by the Fisheries Joint Management Committee (FJMC), the
Nunavut Wildlife Management Board (NWMB), the Nunavik Inuit Land Claims Agreement
(NICLA), and Fisheries and Oceans Canada. Countless scientific studies would not be possible
without these partnerships. The efforts of many dedicated individuals to coordinate these sample
collections and other sampling endeavours, the shipping and sorting of sample kits, archiving
materials in an organized system and maintaining sample information databases are immensely
appreciated. Denise Tenkula (DFO Central and Arctic) provided laboratory assistance, as well as
students and others (Vanessa Kornelsen, Lucy Johnson, Susie Bajno, Sheri Friesen) who helped
out over the duration of this study.
2.6 References
Achilli, A., Rengo, C., Magri, C., Battaglia, V., Olivieri, A., Scozzari, R., Cruciani, F., Zeviani,
M., Briem, E., Carelli, V. and Moral, P. 2004. The molecular dissection of mtDNA haplogroup
H confirms that the Franco-Cantabrian glacial refuge was a major source for the European gene
pool. The American Journal of Human Genetics 75: 910-918.
Alerstam, T., Hedenström, A. and Åkesson, S. 2003. Long‐distance migration: evolution and
determinants. Oikos 103: 247-260.
97
Alexander, A., Steel, D., Hoekzema, K., Mesnick, S.L., Engelhaupt, D., Kerr, I., Payne, R. and
Baker, C.S. 2016. What influences the worldwide genetic structure of sperm whales (Physeter
macrocephalus)? Molecular Ecology 25: 2754-2772.
Amos, W. and Hoelzel, A.R. 1992. Applications of molecular genetic techniques to the
conservation of small populations. Biological Conservation 61: 133-144.
Anderson, B. G. and Borns Jr, H. W. 1997. The ice age world. An introduction to Quaternary
history and research with emphasis on North America and Europe during the last 2.5 million
years. Scandinavian University Press, Oslo, Norway.
Anderson, L.L., Hu, F.S., Nelson, D.M., Petit, R.J. and Paige, K.N. 2006. Ice-age endurance:
DNA evidence of a white spruce refugium in Alaska. Proceedings of the National Academy of
Sciences USA 103: 12447-12450.
Anisimova, M., and Gascuel, O. 2006. Approximate likelihood-ratio test for branches: a fast,
accurate, and powerful alternative. Systematic Biology 55: 539-552.
Armstrong, T. 2013. Management plan for the beluga (Delphinapterus leucas) in Ontario.
Ontario Management Plan Series. Prepared for the Ontario Ministry of Natural Resources.
Peterborough, Ontario. Vi + 58pp.
Avgar, T., Street, G. and Fryxell, J.M. 2013. On the adaptive benefits of mammal migration.
Canadian Journal of Zoology 92: 481-490.
Avise, J.C., Arnold, J., Ball, R.M., Bermingham, E., Lamb, T., Neigel, J.E., Reeb, C.A. and
Saunders, N.C. 1987. Intraspecific phylogeography: the mitochondrial DNA bridge between
population genetics and systematics. Annual Review of Ecology and Systematics 18: 489-522.
Avise, J.C., 2009. Phylogeography: retrospect and prospect. Journal of Biogeography 36: 3-15.
Bailleul, F., Lesage, V., Power, M., Doidge, D.W. and Hammill, M.O. 2012. Migration
phenology of beluga whales in a changing Arctic. Climate Research 53: 169-178.
Bandelt, H.-J., Forster, P., and Röhl, A. 1999. Median-joining networks for inferring
intraspecific phylogenies. Molecular Biology and Evolution 16: 37-48.
Bandelt, H.-J., Macauley, V., and Richards, M. 2000. Median networks: speedy construction and
greedy reduction, one simulation, and two case studies from human mtDNA. Molecular
Phylogenetics and Evolution 16: 8-28.
98
Barber, D.G. andMassom, R.A. 2007. The role of sea ice in Arctic and Antarctic polynyas. In
W.O. Smith Jr. and D.G. Barber (Eds.) Polynyas: Windows to the World. Elsevier Oceanography
Series 74, doi 10.1016/S0422-9894(06)74001-6, pp. 1-54.
Barrie, J.V. and Conway, K.W. 1999. Late Quaternary glaciation and postglacial stratigraphy of
the northern Pacific margin of Canada. Quaternary Research 51: 113-123.
Bennett, K.D. and Provan, J. 2008. What do we mean by ‘refugia’?. Quaternary Science Reviews
27: 2449-2455.
Bernatchez, L. 2001. The evolutionary history of brown trout (Salmo trutta L.) inferred from
phylogeographic, nested clade, and mismatch analyses of mitochondrial DNA variation.
Evolution 55: 351-379.
Boily, P., 1995. Theoretical heat flux in water and habitat selection of phocid seals and beluga
whales during the annual molt. Journal of Theoretical Biology 172: 235-244.
Bolotov, I.N., Tatarinov, A.G., Filippov, B.Y., Gofarov, M.Y., Kondakov, A.V., Kulakova, O.I.,
Potapov, G.S., Zubryi, N.A. and Spitsyn, V.M. 2015. The distribution and biology of Pararctia
subnebulosa (Dyar, 1899)(Lepidoptera: Erebidae: Arctiinae), the largest tiger moth species in the
High Arctic. Polar Biology 38: 905-911.
Bracken, F.S., Hoelzel, A.R., Hume, J.B. and Lucas, M.C., 2015. Contrasting population genetic
structure among freshwater‐resident and anadromous lampreys: the role of demographic history,
differential dispersal and anthropogenic barriers to movement. Molecular Ecology 24: pp.1188-
1204.
Brennin, R., Murray, B.W., Friesen, M.K., Maiers (Postma), L.D., Clayton, J.W., and White,
B.N. 1997. Population genetic structure of beluga whales (Delphinapterus leucas): mitochondrial
DNA sequence variation within and among North American populations. Canadian Journal of
Zoology 75: 795-802.
Breyne, P., Mergeay, J. and Casaer, J., 2014. Roe deer population structure in a highly
fragmented landscape. European Journal of Wildlife Research 60: 909-917.
Brodie, P.F. 1969. Duration of lactation in cetacea: an indicator of required learning? American
Midland Naturalist 82: 312-314.
99
Brown Gladden, J.G., Ferguson, M.M, and Clayton, J.W. 1997. Matriarchal genetic population
structure of North American beluga whales Delphinapterus leucas (Cetacea: Monodontidae).
Molecular Ecology 6: 1033-1046.
Canestrelli, D., Bisconti, R. and Carere, C. 2016. Bolder takes all? The behavioral dimension of
biogeography. Trends in Ecology & Vvolution 31: 35-43.
Canino, M.F., Spies, I.B., Cunningham, K.M., Hauser, L. and Grant, W.S., 2010. Multiple ice‐
age refugia in Pacific cod, Gadus macrocephalus. Molecular Ecology 19: 4339-4351.
Citta, J.J., Richard, P., Lowry, L.F., O'Corry‐Crowe, G., Marcoux, M., Suydam, R., Quakenbush,
L.T., Hobbs, R.C., Litovka, D.I., Frost, K.J. and Gray, T. 2017. Satellite telemetry reveals
population specific winter ranges of beluga whales in the Bering Sea. Marine Mammal Science
33: 236-250.
Colbeck, G.J., Duchesne, P., Postma, L.D., Lesage, V., Hammill, M.O. and Turgeon, J., 2013.
Groups of related belugas (Delphinapterus leucas) travel together during their seasonal
migrations in and around Hudson Bay. Proceedings of the Royal Society of London B:
Biological Sciences 280: 20122552.
COSEWIC 2004. COSEWIC assessment and update status report on the beluga whale
Delphinapterus leucas in Canada. Committee on the Status of Endangered Wildlife in Canada.
Ottawa. Ix + 70 pp. (www.sararegistry.gc.ca/status/status_e.cfm).
COSEWIC. 2012. Definitions and abbreviations. [Online:
http://www.cosewic.gc.ca/eng/sct2/sct2_6_e.cfm].
COSEWIC 2015. Guidelines for recognizing Designatable Units. www.cosewic.gc.ca Status
Reports. Information for Preparing Status Reports.
COSEWIC. 2016. Designatable Units for Beluga Whales (Delphinapterus leucas) in Canada.
Committee on the Status of Endangered Wildlife in Canada. Ottawa. 73 pp.
Cronin, T.M., Manley, P.L., Brachfeld, S., Manley, T.O., Willard, D.A., Guilbault, J.P.,
Rayburn, J.A., Thunell, R. and Berke, M. 2008. Impacts of post-glacial lake drainage events and
revised chronology of the Champlain Sea episode 13–9 ka. Palaeogeography, Palaeoclimatology,
Palaeoecology 262: 46-60.
100
de March, B.G.E., Maiers (Postma), L.D., and Friesen, M.K. 2002. An overview of genetic
relationships of Canadian and adjacent populations of belugas (Delphinapterus leucas) with
emphasis on Baffin Bay and Canadian eastern Arctic populations. NAMMCO Scientific
Publications 4: 17-35.
de March, B.G.E and Postma, L.D. 2003. Molecular stock discrimination of belugas
(Delphinapterus leucas) hunted in eastern Hudson Bay, northern Quebec, Hudson Strait, and
Sanikiluaq (Belcher Islands), Canada, and comparisons to adjacent populations. Arctic 56: 111-
124.
de March, B.G.E., Tenkula, D.A, and Postma, L.D. 2003. Molecular genetics of narwhal
(Monodon monoceros) from Canada and West Greenland (1982-2001). Canadian Science
Advisory Secretariat Research Document 2003/080, i + 19pp.
DFO. 2016. Updated genetic mixture analysis of Nunavik beluga (Delphinapterus leucas)
harvests. DFO Canadian Science Advisory Secretariat Science Advisory Report 2016/025.
Dyke, A.S., 2004. An outline of North American deglaciation with emphasis on central and
northern Canada. Developments in Quaternary Sciences 2: 373-424.
Dyke, A.S., Hooper, J. and Savelle, J.M., 1996. A history of sea ice in the Canadian Arctic
Archipelago based on postglacial remains of the bowhead whale (Balaena mysticetus). Arctic 49:
235-255.
Eriksson, J., Hohmann, G., Boesch, C. and Vigilant, L., 2004. Rivers influence the population
genetic structure of bonobos (Pan paniscus). Molecular Ecology 13: 3425-3435.
Fagan, W.F., Lewis, M.A., Auger‐Méthé, M., Avgar, T., Benhamou, S., Breed, G., LaDage, L.,
Schlägel, U.E., Tang, W.W., Papastamatiou, Y.P. and Forester, J. 2013. Spatial memory and
animal movement. Ecology Letters 16: 1316-1329.
Fedorov, V.B. and Stenseth, N.C. 2002. Multiple glacial refugia in the North American Arctic:
inference from phylogeography of the collared lemming (Dicrostonyx groenlandicus).
Proceedings of the Royal Society of London B: Biological Sciences 269: 2071-2077.
Felsenstein, J. 1985. Confidence limits on phylogenies: an approach using the bootstrap.
Evolution 39: 783-791.
Foulds, L.R., Hendy, M.D., and Penny, D. 1979. A graph theoretic approach to the development
of minimal phylogenetic trees. Journal of Molecular Evolution 13: 127-149.
101
Friesen, V.L., Burg, T.M. and McCoy, K.D., 2007. Mechanisms of population differentiation in
seabirds. Molecular Ecology 16: 1765-1785.
Fraser, D.F., Gilliam, J.F., Daley, M.J., Le, A.N., and Skalski, G.T. 2001. Explaining leptokurtic
movement distributions: intrapopulation variation in boldness and exploration. The American
Naturalist 158: 124-135.
Fratini, S., Ragionieri, L., and Cannicci, S. 2010. Stock structure and demographic history of the
Indo-West Pacific mud crab Scylla serrata. Estuarine, Coastal and Shelf Science 86: 51-61.
Fu, Y.-X. 1997. Statistical tests of neutrality against population growth, hitchhiking and
background selection. Genetics 147: 915-925.
Gavin, D.G., Fitzpatrick, M.C., Gugger, P.F., Heath, K.D., Rodríguez‐Sánchez, F., Dobrowski,
S.Z., Hampe, A., Hu, F.S., Ashcroft, M.B., Bartlein, P.J. and Blois, J.L. 2014. Climate refugia:
joint inference from fossil records, species distribution models and phylogeography. New
Phytologist 204: 37-54.
Gilchrist, H.G. and Robertson, G.J. 2000. Observations of marine birds and mammals wintering
at polynyas and ice edges in the Belcher Islands, Nunavut, Canada. Arctic 53: 61-68.
Gosselin, J.-F., Lésage, V., Hammill, M., and Bourdages, H. 2002. Abundance indices of
belugas in James Bay, eastern Hudson Bay and Ungava Bay in summer 2001. Canadian Science
Advisory Secretariat Research Document 2002/042, 27pp.
Guindon, S., Lethiec, F., Duroux, P., and Gascuel, O. 2005. PHYML online – a web server for
fast maximum likelihood-based phylogenetic inference. Nucleic Acids Research 33: W557-
W559.
Hall, B. 2011. Phylogenetic Trees Made Easy. Sinauer Associates Inc. Publishers,
Massachusetts, U.S.A., 282pp.
Harlin, A.D., Markowitz, T., Baker, C.S, Würsig, B., and Honeycutt, R.L. 2003. Genetic
structure, diversity and historical demography of New Zealand’s dusky dolphin
(Lagenorhynchus obscurus). Journal of Mammalogy 84: 702-717.
Harington, C.R., 2003. Quaternary vertebrates of Québec: a summary. Géographie physique et
Quaternaire 57:85-94.
102
Harington, C.R. 2006. Félix: a late Pleistocene white whale (Delphinapterus leucas) skeleton
from the Champlain Sea deposits at Saint-Félix-de-Valois, Québec. Géographie physique et
Quaternaire 60: 183-198.
Harington, C.R. 2008. The evolution of Arctic marine mammals. Ecological Applications 18
(Supplement): S23-S40.
Harpending, H.C. 1994. Signature of ancient population growth in a low-resolution
mitochondrial DNA mismatch distribution. Human Biology 66: 591-600.
Hasegawa, M., Kishino, K., and Yano, T. 1985. Dating the human-ape splitting by a molecular
clock of mitochondrial DNA. Journal of Molecular Evolution 22: 160-174.
Hauser, D.D., Laidre, K.L., Suydam, R.S. and Richard, P.R. 2014. Population-specific home
ranges and migration timing of Pacific Arctic beluga whales (Delphinapterus leucas). Polar
Biology 37: 1171-1183.
Hauser, D.D., Laidre, K.L., Stafford, K.M., Stern, H.L., Suydam, R.S. and Richard, P.R. 2016.
Decadal shifts in autumn migration timing by Pacific Arctic beluga whales are related to delayed
annual sea ice formation. Global Change Biology, doi: 10.1111/gcb.13564.
Hawkes, C., 2009. Linking movement behaviour, dispersal and population processes: is
individual variation a key? Journal of Animal Ecology 78: 894-906.
Heide-Jørgensen, M.P., Richard, P., Ramsay, M. and Akeeagok, S. 2002. Three recent ice
entrapments of Arctic cetaceans in West Greenland and the eastern Canadian High Arctic.
NAMMCO Scientific Publications 4: 143-148.
Hewitt, C.D., Broccoli, A.J., Mitchell, J.F. and Stouffer, R.J. 2001. A coupled model study of the
last glacial maximum: Was part of the North Atlantic relatively warm? Geophysical Research
Letters 28: 1571-1574.
Hewitt, G.M. 1996. Some genetic consequences of ice ages, and their role in divergence and
speciation. Biological Journal of the Linnean Society 58: 247-276.
Hewitt, G.M. 2000. The genetic legacy of the ice ages. Nature 405: 907-913.
Hewitt, G.M. 2004. Genetic consequences of climatic oscillations in the Quaternary.
Philosophical Transactions of the Royal Society of London B 359: 183-195.
103
Hoelzel, A.R., Hey, J., Dahlheim, M.E., Nicholson, C., Burkanov, V. and Black, N. 2007.
Evolution of population structure in a highly social top predator, the killer whale. Molecular
Biology and Evolution 24: 1407-1415.
Holland, B.R., Penny, D., and Hendy, M.D. 2003. Outgroup misplacement and phylogenetic
inaccuracy under a molecular clock- a simulation study. Systematic Biology 52: 229-238.
Holland, B.R., Huber, K.T., Moulton, V., and Lockhart, P.J. 2004. Using consensus networks to
visualize contradictory evidence for species phylogeny. Molecular Biology and Evolution 21:
1459-1461.
Holm, S. 1979. A simple sequential rejective method procedure. Scandinavian Journal of
Statistics 6: 65-70.
Hordijk, W., and Gascuel, O. 2005. Improving the efficiency of SPR moves in phylogenetic tree
search methods based on maximum likelihood. Bioinformatics 21: 4338-4347.
Hornby, C.A., Hoover, C., Iacozza, J., Barber, D.G. and Loseto, L.L. 2016. Spring conditions
and habitat use of beluga whales (Delphinapterus leucas) during arrival to the Mackenzie River
Estuary. Polar Biology 39: 2319-2334.
Huson, D.H. and Scornavacca, C. 2011. A survey of combinatorial methods for phylogenetic
networks. Genome Biology and Evolution 3: 23-35.
Ibrahim, K.M., Nichols, R.A., and Hewitt, G.M. 1996. Spatial patterns of genetic variation
generated by different forms of dispersal during range expansion. Heredity 77: 282-291.
Irwin, D.E., 2002. Phylogeographic breaks without geographic barriers to gene flow. Evolution
56: 2383-2394.
IWC 2000. Status of Monodontid whales: white whale. Journal of Cetacean Research and
Management, 2 (SUPPL.), 243-250.
Kelley, T.C., Loseto, L.L., Stewart, R.E.A., Yurkowski, M. and Ferguson, S.H. 2010.
Importance of eating capelin: unique dietary habits of Hudson Bay beluga. In S.H. Ferguson et
al. (Eds.) A Little Less Arctic: Top Predators in the World’s Largest Northern Inland Sea,
Hudson Bay. Springer, Netherlands, pp 53-70, doi: 10.1007/978-90-481-9121-5_3.
104
Kelley, T.C., Stewart, R.E., Yurkowski, D.J., Ryan, A. and Ferguson, S.H. 2015. Mating ecology
of beluga (Delphinapterus leucas) and narwhal (Monodon monoceros) as estimated by
reproductive tract metrics. Marine Mammal Science 31: 479-500.
Keppel, G., Van Niel, K.P., Wardell‐Johnson, G.W., Yates, C.J., Byrne, M., Mucina, L., Schut,
A.G., Hopper, S.D. and Franklin, S.E. 2012. Refugia: identifying and understanding safe havens
for biodiversity under climate change. Global Ecology and Biogeography 21: 393-404.
Klauke, N., Schaefer, H.M., Bauer, M. and Segelbacher, G., 2016. Limited dispersal and
significant fine-scale genetic structure in a tropical montane parrot species. PLoS One 11:
p.e0169165.
Klütsch, C.F., Manseau, M. and Wilson, P.J. 2012. Phylogeographical analysis of mtDNA data
indicates postglacial expansion from multiple glacial refugia in woodland caribou (Rangifer
tarandus caribou). PLoS One 7, p.e52661.
Knowles, L. L. and Maddison, W.P. 2002. Statistical phylogeography. Molecular Ecology 11:
2623-2635.
Kocho-Schellenberg, J.E. 2010. Understanding the evolution of beluga entrapment co-
management in the Inuvialuit Settlement Region using social network analysis. Master’s Thesis,
Faculty of Environment, Earth and Resources, University of Manitoba, Winnipeg, 138pp.
Krasnova, V.V., Chernetsky, A.D., Zheludkova, A.I. and Bel’kovich, V.M., 2014. Parental
behavior of the beluga whale (Delphinapterus leucas) in natural environment. Biology Bulletin,
41: 349-356.
Kumar, S., Tamura, K., and Nei, M. 2004. MEGA3: Integrated software for Molecular
Evolutionary Genetics Analysis and Sequence Alignment. Briefings in Bioinformatics 5: 150-
163.
Laidre, K.L., Stirling, I., Lowry, L.F., Wiig, Ø., Heide-Jørgensen, M.P. and Ferguson, S.H. 2008.
Quantifying the sensitivity of Arctic marine mammals to climate‐induced habitat change.
Ecological Applications 18 (Supplement): S97-S125.
Lawson, J., Hammill, M., and Stenson, G. 2006. Characteristics for recovery: beluga whale.
DFO Canadian Science Advisory Secretariat Research Document 2006/075. ii + 16pp.
105
Lefebvre, S.L., Michaud, R., Lesage, V. and Berteaux, D. 2012. Identifying high residency areas
of the threatened St. Lawrence beluga whale from fine-scale movements of individuals and
coarse-scale movements of herds. Marine Ecology Progress Series: 243-257.
Levin, I.I. and Parker, P.G., 2012. Philopatry drives genetic differentiation in an island
archipelago: comparative population genetics of Galapagos Nazca boobies (Sula granti) and
great frigatebirds (Fregata minor). Ecology and Evolution 2: 2775-2787.
Librado, P. and Rozas, J. 2009. DnaSP v5: A software for comprehensive analysis of DNA
polymorphism data. Bioinformatics 25: 1451-1452.
Lindqvist, C., Roy, T., Lydersen, C., Kovacs, K.M., Aars, J., Wiig, Ø. and Bachmann, L. 2016.
Genetic diversity of historical Atlantic walruses (Odobenus rosmarus rosmarus) from Bjørnøya
and Håøya (Tusenøyane), Svalbard, Norway. BMC Research Notes 9: 112.
Loseto, L.L., Richard, P., Stern, G.A., Orr, J. and Ferguson, S.H. 2006. Segregation of Beaufort
Sea beluga whales during the open-water season. Canadian Journal of Zoology 84: 1743-1751.
Loseto, L.L., Stern, G.A. and Ferguson, S.H. 2008. Size and biomagnification: how habitat
selection explains beluga mercury levels. Environmental Science & Technology 42: 3982-3988.
Louis, M., Viricel, A., Lucas, T., Peltier, H., Alfonsi, E., Berrow, S., Brownlow, A., Covelo, P.,
Dabin, W., Deaville, R. and Stephanis, R. 2014. Habitat‐driven population structure of bottlenose
dolphins, Tursiops truncatus, in the North‐East Atlantic. Molecular Ecology 23: 857-874.
Louys, J. 2007. Limited effect of the Quaternary's largest super-eruption (Toba) on land
mammals from Southeast Asia. Quaternary Science Reviews 26: 3108-3117.
Louys, J. 2012. Mammal community structure of Sundanese fossil assemblages from the Late
Pleistocene, and a discussion on the ecological effects of the Toba eruption. Quaternary
International 258: 80-87.
Maddison, W.P., 1997. Gene trees in species trees. Systematic Biology 46: 523-536.
Maddison, W.P. and Knowles, L.L. 2006. Inferring phylogeny despite incomplete lineage
sorting. Systematic Biology 55: 21-30.
Maggs, C.A., Castilho, R., Folta, D., Henzler, C, and Wares, J. 2008. Evaluating signatures of
glacial refugia for North Atlantic benthic marine taxa. Ecology 89 (Supplement): S108-S122.
106
Marjoram, P. and Donnelly, P. 1994. Pairwise comparisons of mitochondrial DNA sequences in
subdivided populations and implications for early human evolution. Genetics 136: 673-683.
Martin, A.R., Hall, P. and Richard, P.R. 2001. Dive behaviour of belugas (Delphinapterus
leucas) in the shallow waters of western Hudson Bay. Arctic 54: 276-283.
Matias, A.M.A., Anticamara, J.A. and Quilang, J.P., 2013. High gene flow in reef fishes and its
implications for ad-hoc no-take marine reserves. Mitochondrial DNA 24: 584-595.
McLeod, B.A., Brown, M.W., Moore, M.J., Stevens, W., Barkham, S.H., Barkham, M. and
White, B.N. 2008. Bowhead whales, and not right whales, were the primary target of 16th-to
17th-century Basque whalers in the western North Atlantic. Arctic 61:61-75.
Meschersky, I.G., Kholodova, M.V., and Zvychaynaya, E.Y. 2008. Molecular genetic study of
the beluga (Delphinapterus leucas: Cetacea, Monodontidae) summering in the southern Sea of
Okhotsk as compared to North American populations. Russian Journal of Genetics 44: 1105 –
1110.
Monteiro, S.S., Méndez-Fernandez, P., Piertney, S., Moffat, C.F., Ferreira, M., Vingada, J.V.,
López, A., Brownlow, A., Jepson, P., Mikkelsen, B. and Niemeyer, M. 2015. Long-finned pilot
whale population diversity and structure in Atlantic waters assessed through biogeochemical and
genetic markers. Marine Ecology Progress Series 536: 243-257.
Morin, P.A., Martien, K.K., Archer, F.I., Cipriano, F., Steel, D., Jackson, J. and Taylor, B.L.,
2010. Applied conservation genetics and the need for quality control and reporting of genetic
data used in fisheries and wildlife management. Journal of Heredity 101: 1-10.
Morrison, D.A. 2005. Networks in phylogenetic analysis: new tools for population biology.
International Journal for Parasitology 35: 567-582.
Nei, M. and Kumar, S. 2000. Molecular Evolution and Phylogenetics. Oxford University Press,
New York, U.S.A., 333pp.
Nichols, R. 2001. Gene trees and species trees are not the same. Trends in Ecology and
Evolution 16: 358-364.
Nichols, R.A. and Hewitt, G.M., 1994. The genetic consequences of long distance dispersal
during colonization. Heredity 72: 312-317.
107
Nyström, V., Angerbjörn, A. and Dalén, L. 2006. Genetic consequences of a demographic
bottleneck in the Scandinavian arctic fox. Oikos 114: 84-94.
O’Corry-Crowe, G.M., Suydam, R.S., Rosenberg, A., Frost, K.J., and Dizon, A.E. 1997.
Phylogeography, population structure and dispersal patterns of the beluga whale Delphinapterus
leucas in the western Nearctic revealed by mitochondrial DNA. Molecular Ecology 6: 955-970.
O’Corry-Crowe, G.M. 2008. Climate change and the molecular ecology of Arctic marine
mammals. Ecological Applications 18 (Supplement): S56-S76.
O’Corry-Crowe, G. 2009. Beluga whale, Delphinapterus leucas. In W.F. Perrin, B. Würsig and
J.G.M. Thewissen (Eds.), Encyclopedia of Marine Mammals, Elsevier Academic Press,
Burlingtom, MA, USA.
O’Corry-Crowe, G.M., Lydersen, C., Heide-Jørgensen, M.P., Hansen, L, Mukhametov, L.M.,
Dove, O., and Kovacs, K. 2010. Population genetic structure and evolutionary history of North
Atlantic beluga whales (Delphinapterus leucas) from West Greenland, Svalbard and the White
Sea. Polar Biology 33: 1179-1194.
O’Corry-Crowe, G.M., Lucey, W., Archer, F.I. and Mahoney, B. 2015. The genetic ecology and
population origins of the beluga whales, Delphinapterus leucas, of Yakutat Bay. Marine
Fisheries Review 77: 47-58.
Palsbøll, P., Heide-Jørgensen, M.P. and Dietz, R. 1997. Genetic studies of narwhals, Monodon
monoceros, from West and East Greenland. Heredity 78: 284-292.
Palsböll, P.J., Heide-Jørgensen, M.P., and Bérubé, M. 2002. Analysis of mitochondrial control
region nucleotide sequences from Baffin Bay beluga (Delphinapterus leucas): detecting pods or
sub-populations? NAMMCO Scientific Publications 4: 39-51.
Parsons, K.M., Durban, J.W., Burdin, A.M., Burkanov, V.N., Pitman, R.L., Barlow, J., Barrett-
Lennard, L.G., LeDuc, R.G., Robertson, K.M., Matkin, C.O. and Wade, P.R. 2013. Geographic
patterns of genetic differentiation among killer whales in the northern North Pacific. Journal of
Heredity 104: 737-754.
Peakall, R. and Smouse, P.E. 2006. GENALEX 6: genetic analysis in excel. Population
genetic software for teaching and research. Molecular Ecology Notes 6: 288-295.
108
Pelletier, A., Obbard, M.E., Mills, K., Howe, E.J., Burrows, F.G., White, B.N., and Kyle, C.J.
2012. Delineating genetic groupings in continuously distributed species across largely
homogeneous landscapes: a study of American black bears (Ursus americanus) in Ontario,
Canada. Canadian Journal of Zoology 90: 999-1014.
Pilot, M., Dahlheim, M.E. and Hoelzel, A.R. 2010. Social cohesion among kin, gene flow
without dispersal and the evolution of population genetic structure in the killer whale (Orcinus
orca). Journal of Evolutionary Biology 23: 20-31.
Posada, D. 2008. jModelTest: Phylogenetic model averaging. Molecular Biology and Evolution
25: 1253-1256.
Posada, D. and Crandall, K.A. 2001. Intraspecific gene genealogies: trees grafting into networks.
Trends in Ecology and Evolution 16: 37-45.
Postma, L.D., Petersen, S.D., Turgeon, J., Hammill, M.O., and Doniol-Valcroze, T. 2012. Beluga
whales in James Bay: a separate entity from eastern Hudson Bay belugas? DFO Canadian
Science Advisory Secretariat Research Document 2012/074. iii + 23pp.
Provan, J., and Bennett, K.D. 2008. Phylogeographic insights into cryptic glacial refugia. Trends
in Ecology and Evolution 23: 564-571.
Quakenbush, L.T., Suydam, R.S., Bryan, A.L., Lowry, L.F., Frost, K.J. and Mahoney, B.A.
2015. Diet of beluga whales (Delphinapterus leucas) in Alaska from stomach contents, March–
November. Marine Fisheries Review 77: 70-84.
Quintela, M., Skaug, H.J., Øien, N., Haug, T., Seliussen, B.B., Solvang, H.K., Pampoulie, C.,
Kanda, N., Pastene, L.A. and Glover, K.A. 2014. Investigating population genetic structure in a
highly mobile marine organism: the minke whale Balaenoptera acutorostrata acutorostrata in
the North East Atlantic. PLoS One 9: p.e108640.
Rambaut, A., Suchard, M.A., Xie, D., and Drummond, A.J. 2014. Tracer v1.6. Available from
http://beast.bio.ed.ac.uk/Tracer
Ramos-Onsins, S.E. and Rozas, J. 2002 Statistical properties of new neutrality tests against
population growth. Molecular Biology and Evolution 19: 2092-2100.
Ray, N., Currat, M. and Excoffier, L. 2003. Intra-demem molecular diversity in spatially
expanding populations. Molecular Biology and Evolution 20: 76-86.
109
Reeves, R.R. and Mitchell, E. 1989. Status of white whales, Delphinapterus leucas, in Ungava
Bay and eastern Hudson Bay. Canadian Field-Naturalist 103: 220-239.
Reeves, R.R. and Smith, T.D. 2006. A taxonomy of world whaling. Whales, whaling, and ocean
ecosystems (JA Estes, DP DeMaster, DF Doak, TM Williams, and RL Brownell, Jr. (eds.).
University of California Press, Berkeley, pp.82-101.
Richard, P.R., Heide-Jørgensen, M.P., Orr, J.R., Dietz, R. and Smith, T.G. 2001. Summer and
autumn movements and habitat use by belugas in the Canadian High Arctic and adjacent areas.
Arctic 54: 207-222.
Richard, P. 2010. Stock definition of belugas and narwhals in Nunavut. DFO Canadian Science
Advisory Secretariat Research Document 2010/022. iv + 14p.
Rogers, A.R. and Harpending, H. 1992. Population growth makes waves in the distribution of
pairwise genetic differences. Molecular Biology and Evolution 9: 552-569.
Rogers, A.R., Fraley, A.E., Bamshad, M.J., Watkins, W.S., and Jorde, L.B. 1996. Mitochondrial
mismatch analysis is insensitive to the mutational process. Molecular Biology and Evolution 13:
895-902.
Ronquist, F., Teslenko, M., van der Mark, P., Aures, D.L., Darling, A., Höhna, S., Larget, B.,
Liu, L., Suchard, M.A., and Huelsenbeck, J.P. 2012. MrBayes 3.2: Efficient Bayesian
phylogenetic inference and model choice across a large model space. Systematic Biology 61:
539-542.
Schenekar, T. and Weiss, S. 2011. High rate of calculation errors in mismatch distribution
analysis results in numerous false inferences of biological importance. Heredity 107: 511-512.
Seutin, G., White, B.N., and Boag, P.T. 1991. Preservation of avian blood and tissue samples
for DNA analyses. Canadian Journal of Zoology 69: 82-9.
Sgrò, C.M., Lowe, A.J. and Hoffmann, A.A. 2011. Building evolutionary resilience for
conserving biodiversity under climate change. Evolutionary Applications 4: 326-337.
Shaw, A.K. and Couzin, I.D. 2013. Migration or residency? The evolution of movement
behavior and information usage in seasonal environments. The American Naturalist 181: 114-
124.
110
Slatkin, M. and Excoffier, L. 2012. Serial founder effects during range expansion: a spatial
analog of genetic drift. Genetics 191: 171-181.
Spice, E.K., Goodman, D.H., Reid, S.B. and Docker, M.F. 2012. Neither philopatric nor
panmictic: microsatellite and mtDNA evidence suggests lack of natal homing but limits to
dispersal in Pacific lamprey. Molecular Ecology 21: 12916-2930.
St. Aubin, D.S., Smith, T.G. and Geraci, J.R. 1990. Seasonal epidermal molt in beluga whales,
Delphinapterus leucas. Canadian Journal of Zoology 68: 359-367.
Stewart, B.E., and Stewart, R.E.A. 1989. Delphinapterus leucas. Mammalian Species 336:1-8.
Stirling, I. 1997. The importance of polynyas, ice edges, and leads to marine mammals and birds.
Journal of Marine Systems: 9-21.
Stronen, A.V., Forbes, G.J., Paquet, P.C., Goulet, G., Sallows, T. and Musiani, M., 2012.
Dispersal in a plain landscape: short-distance genetic differentiation in southwestern Manitoba
wolves, Canada. Conservation Genetics 13: 359-371.
Tajima, F. 1989. Statistical-method for testing the neutral mutation hypothesis by DNA
polymorphism. Genetics 123: 585-595.
Tamura, K., Dudley, J., Nei, M., and Kumar, S. 2007. MEGA4: Molecular Evolutionary
Genetics Analysis (MEGA) software version 4.0. Molecular Biology and Evolution 24: 1596-
1599.
Tamura, K., Peterson, D., Peterson, N., Stecher, G., Nei, M, and Kumar, S. 2011. MEGA5:
Molecular Evolutionary Genetics Analysis using maximum likelihood, evolutionary distance,
and maximum parsimony methods. Molecular Biology and Evolution 28: 2731-2739.
Tamura, K. Stecher, G., Peterson, D., Filipski, A., and Kumar, S. 2013. MEGA6: Molecular
Evolutionary Genetics Analysis version 6. Molecular Biology and Evolution 30: 2725-2729.
Templeton, A.R., Routman, E. and Phillips, C.A. 1995. Separating population structure from
population history: a cladistic analysis of the geographical distribution of mitochondrial DNA
haplotypes in the tiger salamander, Ambystoma tigrinum. Genetics 140: 767-782.
111
Turgeon, J., Duchesne, P., Colbeck, G.J., Postma, L.D., and Hammill, M.O. 2012.
Spatiotemporal segregation among summer stocks of beluga (Delphinapterus leucas) despite
nuclear gene flow: implication for the endangered belugas in eastern Hudson Bay (Canada).
Conservation Genetics 13: 419-433.
Tyack, P. 1986. Population biology, social behavior and communication in whales and dolphins.
Trends in Ecology & Evolution 1: 144-150.
Vélez-Juarbe, J. and Pyenson, N.D. 2012. Bohaskaia monodontoides, a new monodontid
(Cetacea, Odontoceti, Delphinoidea) from the Pliocene of the western North Atlantic Ocean.
Journal of Vertebrate Paleontology 32: 476-484.
Viricel, A. and Rosel, P.E. 2014. Hierarchical population structure and habitat differences in a
highly mobile marine species: the Atlantic spotted dolphin. Molecular Ecology 23: 5018-5035.
Waples, R.S., 1998. Separating the wheat from the chaff: patterns of genetic differentiation in
high gene flow species. Journal of Heredity 89: 438-450.
Waples, R.S., Punt, A.E. and Cope, J.M. 2008. Integrating genetic data into management of
marine resources: how can we do it better? Fish and Fisheries 9:423-449.
Watterson, G.A., and Guess, H.A. 1977. Is the most frequent allele the oldest? Theoretical
Population Biology 11: 141-160.
Watterson, G.A. 1985. The genetic divergence of two populations. Theoretical Population
Biology 27: 298-317.
Williams, M.A., Ambrose, S.H., van der Kaars, S., Ruehlemann, C., Chattopadhyaya, U., Pal, J.
and Chauhan, P.R. 2009. Environmental impact of the 73ka Toba super-eruption in South Asia.
Palaeogeography, Palaeoclimatology, Palaeoecology 284: 295-314.
Williams, M., 2012. Did the 73 ka Toba super-eruption have an enduring effect? Insights from
genetics, prehistoric archaeology, pollen analysis, stable isotope geochemistry, geomorphology,
ice cores, and climate models. Quaternary International 269: 87-93.
Wilson, R.E., Farley, S.D., McDonough, T.J., Talbot, S.L. and Barboza, P.S., 2015. A genetic
discontinuity in moose (Alces alces). Conservation Genetics 16: 791-800.
112
Zhou, W., Jin, J., Wu, J., Chen, H., Yang, J., Murphy, R.W. and Che, J. 2017. Mountains too
high and valleys too deep drive population structuring and demographics in a Qinghai–Tibetan
Plateau frog Nanorana pleskei (Dicroglossidae). Ecology and Evolution 7: 240-252.
Zlojutro, M., Rubicz, R., Devor, E.J., Spitsyn, V.A., Makarov, S.V., Wilson, K., and Crawford,
M.H. 2006. Genetic structure of the Aleuts and Circumpolar Populations based on mitochondrial
DNA sequences: a synthesis. American Journal of Physical Anthropology 129: 446-464.
Zuk, M., Bastiaans, E., Langkilde, T. and Swanger, E. 2014. The role of behaviour in the
establishment of novel traits. Animal Behaviour 92: 333-344.
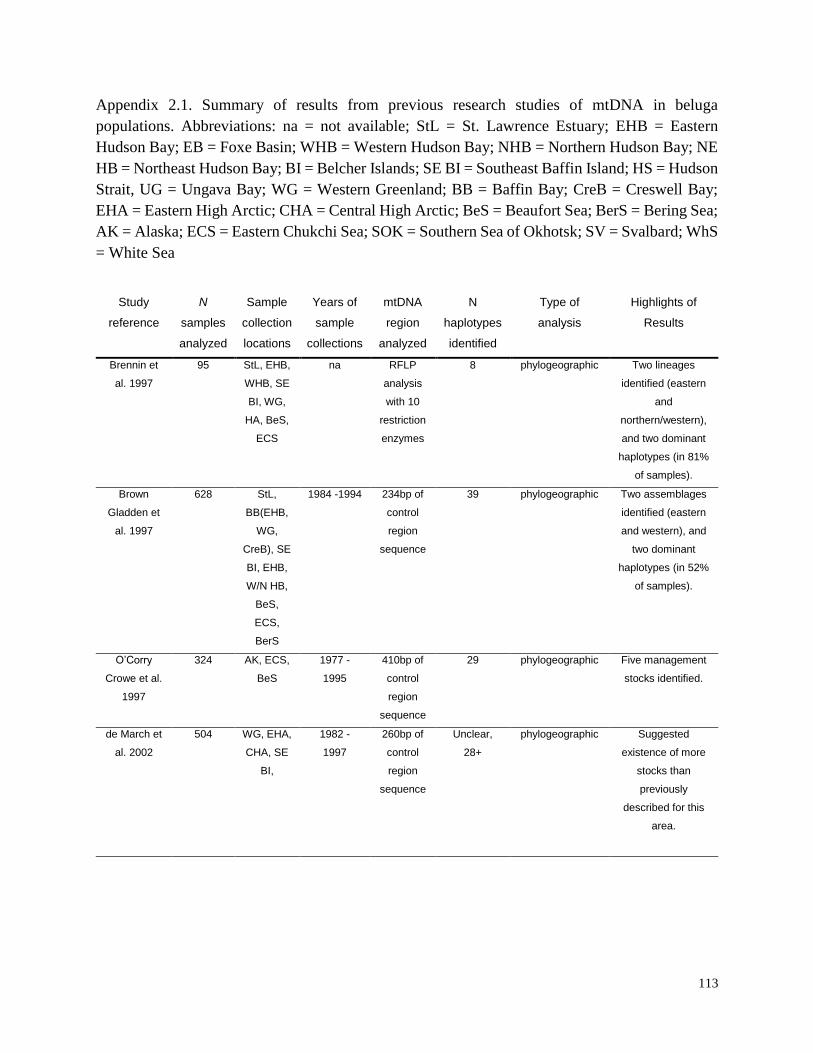
113
Appendix 2.1. Summary of results from previous research studies of mtDNA in beluga
populations. Abbreviations: na = not available; StL = St. Lawrence Estuary; EHB = Eastern
Hudson Bay; EB = Foxe Basin; WHB = Western Hudson Bay; NHB = Northern Hudson Bay; NE
HB = Northeast Hudson Bay; BI = Belcher Islands; SE BI = Southeast Baffin Island; HS = Hudson
Strait, UG = Ungava Bay; WG = Western Greenland; BB = Baffin Bay; CreB = Creswell Bay;
EHA = Eastern High Arctic; CHA = Central High Arctic; BeS = Beaufort Sea; BerS = Bering Sea;
AK = Alaska; ECS = Eastern Chukchi Sea; SOK = Southern Sea of Okhotsk; SV = Svalbard; WhS
= White Sea
Study
reference
N
samples
analyzed
Sample
collection
locations
Years of
sample
collections
mtDNA
region
analyzed
N
haplotypes
identified
Type of
analysis
Highlights of
Results
Brennin et
al. 1997
95 StL, EHB,
WHB, SE
BI, WG,
HA, BeS,
ECS
na RFLP
analysis
with 10
restriction
enzymes
8 phylogeographic Two lineages
identified (eastern
and
northern/western),
and two dominant
haplotypes (in 81%
of samples).
Brown
Gladden et
al. 1997
628 StL,
BB(EHB,
WG,
CreB), SE
BI, EHB,
W/N HB,
BeS,
ECS,
BerS
1984 -1994 234bp of
control
region
sequence
39 phylogeographic Two assemblages
identified (eastern
and western), and
two dominant
haplotypes (in 52%
of samples).
O’Corry
Crowe et al.
1997
324 AK, ECS,
BeS
1977 -
1995
410bp of
control
region
sequence
29 phylogeographic Five management
stocks identified.
de March et
al. 2002
504 WG, EHA,
CHA, SE
BI,
1982 -
1997
260bp of
control
region
sequence
Unclear,
28+
phylogeographic Suggested
existence of more
stocks than
previously
described for this
area.
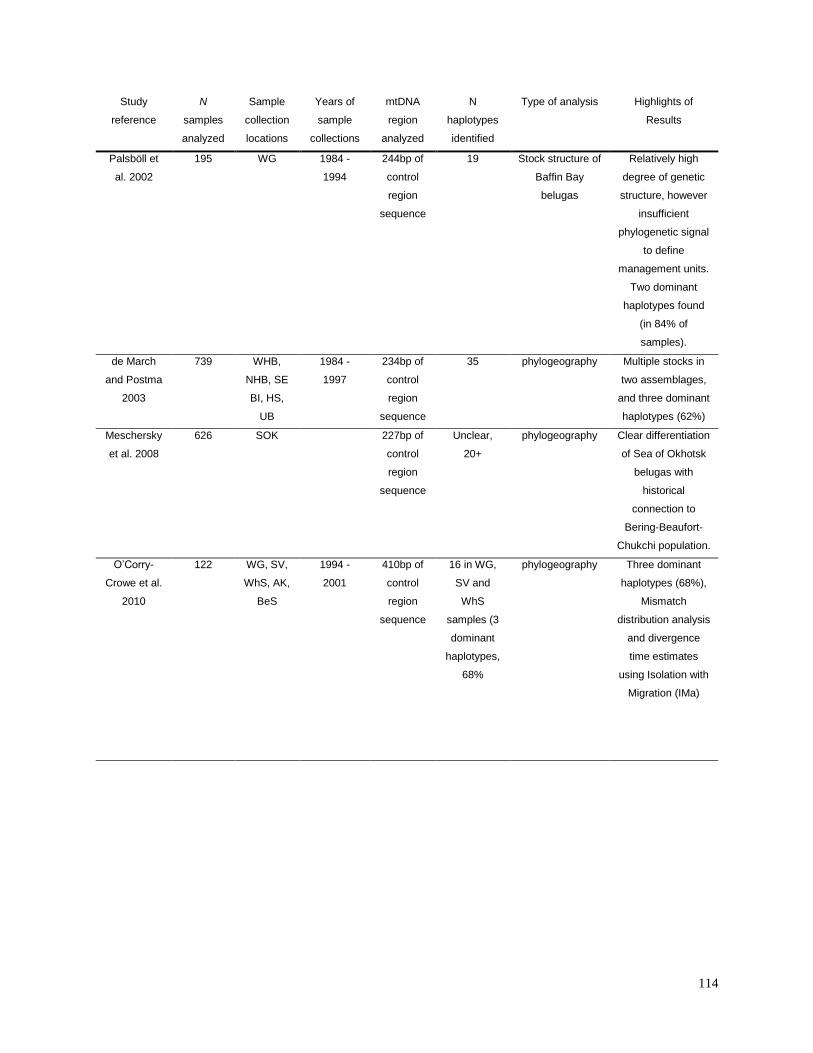
114
Study
reference
N
samples
analyzed
Sample
collection
locations
Years of
sample
collections
mtDNA
region
analyzed
N
haplotypes
identified
Type of analysis Highlights of
Results
Palsböll et
al. 2002
195 WG 1984 -
1994
244bp of
control
region
sequence
19 Stock structure of
Baffin Bay
belugas
Relatively high
degree of genetic
structure, however
insufficient
phylogenetic signal
to define
management units.
Two dominant
haplotypes found
(in 84% of
samples).
de March
and Postma
2003
739 WHB,
NHB, SE
BI, HS,
UB
1984 -
1997
234bp of
control
region
sequence
35 phylogeography Multiple stocks in
two assemblages,
and three dominant
haplotypes (62%)
Meschersky
et al. 2008
626 SOK 227bp of
control
region
sequence
Unclear,
20+
phylogeography Clear differentiation
of Sea of Okhotsk
belugas with
historical
connection to
Bering-Beaufort-
Chukchi population.
O’Corry-
Crowe et al.
2010
122 WG, SV,
WhS, AK,
BeS
1994 -
2001
410bp of
control
region
sequence
16 in WG,
SV and
WhS
samples (3
dominant
haplotypes,
68%
phylogeography Three dominant
haplotypes (68%),
Mismatch
distribution analysis
and divergence
time estimates
using Isolation with
Migration (IMa)
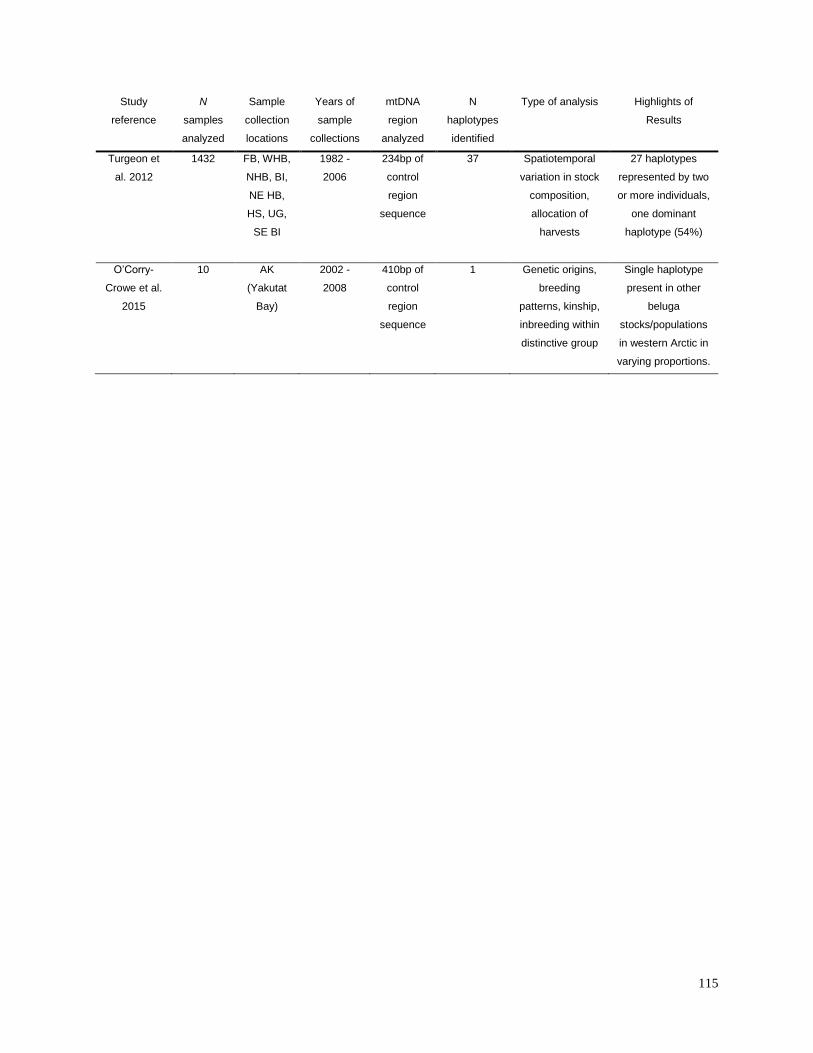
115
Study
reference
N
samples
analyzed
Sample
collection
locations
Years of
sample
collections
mtDNA
region
analyzed
N
haplotypes
identified
Type of analysis Highlights of
Results
Turgeon et
al. 2012
1432 FB, WHB,
NHB, BI,
NE HB,
HS, UG,
SE BI
1982 -
2006
234bp of
control
region
sequence
37 Spatiotemporal
variation in stock
composition,
allocation of
harvests
27 haplotypes
represented by two
or more individuals,
one dominant
haplotype (54%)
O’Corry-
Crowe et al.
2015
10 AK
(Yakutat
Bay)
2002 -
2008
410bp of
control
region
sequence
1 Genetic origins,
breeding
patterns, kinship,
inbreeding within
distinctive group
Single haplotype
present in other
beluga
stocks/populations
in western Arctic in
varying proportions.
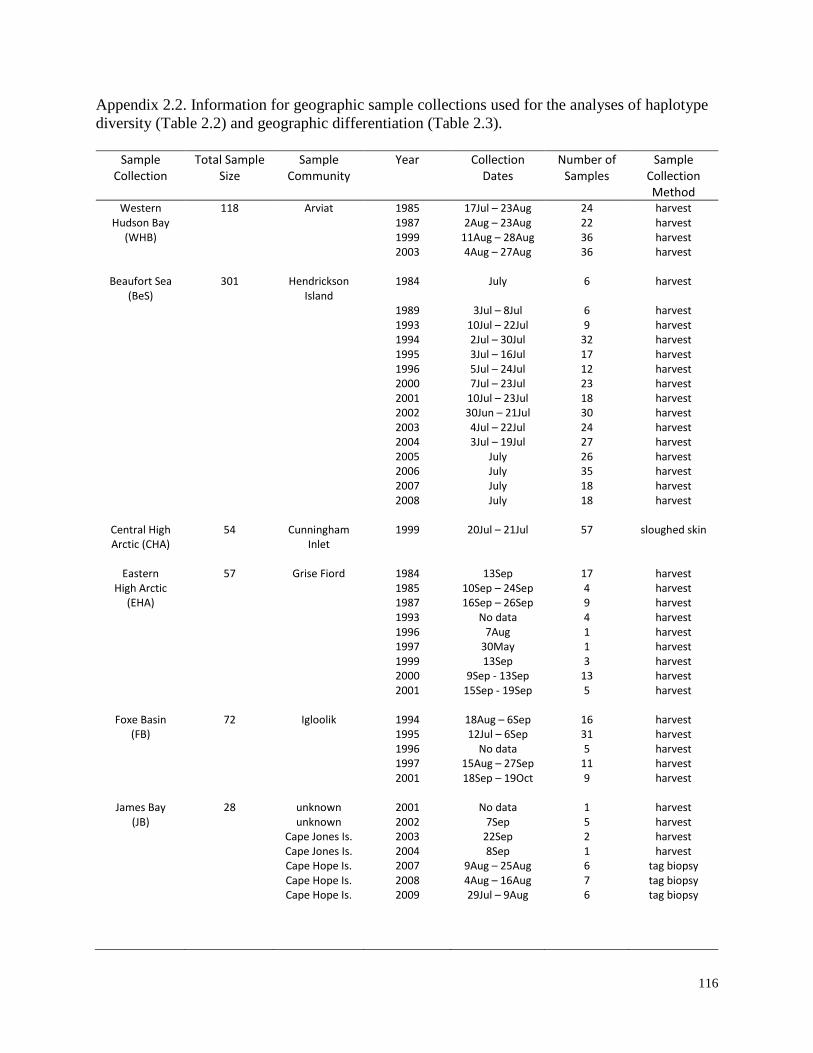
116
Appendix 2.2. Information for geographic sample collections used for the analyses of haplotype
diversity (Table 2.2) and geographic differentiation (Table 2.3).
Sample
Collection Total Sample
Size Sample
Community Year Collection
Dates Number of
Samples Sample
Collection Method
Western 118 Arviat 1985 17Jul – 23Aug 24 harvest Hudson Bay 1987 2Aug – 23Aug 22 harvest
(WHB) 1999 11Aug – 28Aug 36 harvest 2003 4Aug – 27Aug 36 harvest
Beaufort Sea (BeS)
301 Hendrickson Island
1984 July 6 harvest
1989 3Jul – 8Jul 6 harvest 1993 10Jul – 22Jul 9 harvest 1994 2Jul – 30Jul 32 harvest 1995 3Jul – 16Jul 17 harvest 1996 5Jul – 24Jul 12 harvest 2000 7Jul – 23Jul 23 harvest 2001 10Jul – 23Jul 18 harvest 2002 30Jun – 21Jul 30 harvest 2003 4Jul – 22Jul 24 harvest 2004 3Jul – 19Jul 27 harvest 2005 July 26 harvest 2006 July 35 harvest 2007 July 18 harvest 2008 July 18 harvest
Central High Arctic (CHA)
54 Cunningham Inlet
1999 20Jul – 21Jul 57 sloughed skin
Eastern 57 Grise Fiord 1984 13Sep 17 harvest
High Arctic 1985 10Sep – 24Sep 4 harvest (EHA) 1987 16Sep – 26Sep 9 harvest
1993 No data 4 harvest 1996 7Aug 1 harvest 1997 30May 1 harvest 1999 13Sep 3 harvest 2000 9Sep - 13Sep 13 harvest 2001 15Sep - 19Sep 5 harvest
Foxe Basin 72 Igloolik 1994 18Aug – 6Sep 16 harvest (FB) 1995 12Jul – 6Sep 31 harvest
1996 No data 5 harvest 1997 15Aug – 27Sep 11 harvest 2001 18Sep – 19Oct 9 harvest
James Bay 28 unknown 2001 No data 1 harvest (JB) unknown 2002 7Sep 5 harvest
Cape Jones Is. 2003 22Sep 2 harvest Cape Jones Is. 2004 8Sep 1 harvest Cape Hope Is. 2007 9Aug – 25Aug 6 tag biopsy Cape Hope Is. 2008 4Aug – 16Aug 7 tag biopsy Cape Hope Is. 2009 29Jul – 9Aug 6 tag biopsy
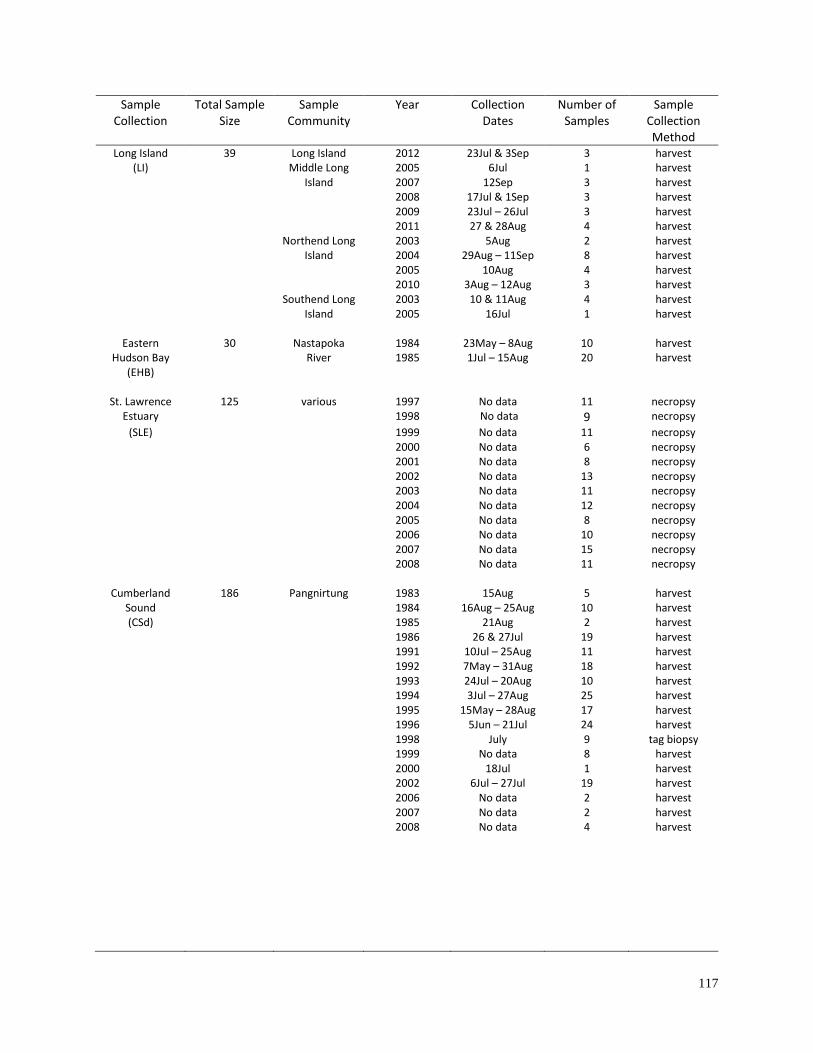
117
Sample Collection
Total Sample Size
Sample Community
Year Collection Dates
Number of Samples
Sample Collection Method
Long Island 39 Long Island 2012 23Jul & 3Sep 3 harvest (LI) Middle Long 2005 6Jul 1 harvest
Island 2007 12Sep 3 harvest 2008 17Jul & 1Sep 3 harvest 2009 23Jul – 26Jul 3 harvest 2011 27 & 28Aug 4 harvest Northend Long 2003 5Aug 2 harvest Island 2004 29Aug – 11Sep 8 harvest 2005 10Aug 4 harvest 2010 3Aug – 12Aug 3 harvest Southend Long 2003 10 & 11Aug 4 harvest Island 2005 16Jul 1 harvest
Eastern 30 Nastapoka 1984 23May – 8Aug 10 harvest Hudson Bay River 1985 1Jul – 15Aug 20 harvest
(EHB)
St. Lawrence 125 various 1997 No data 11 necropsy Estuary 1998 No data 9 necropsy
(SLE) 1999 No data 11 necropsy 2000 No data 6 necropsy 2001 No data 8 necropsy 2002 No data 13 necropsy 2003 No data 11 necropsy 2004 No data 12 necropsy 2005 No data 8 necropsy 2006 No data 10 necropsy 2007 No data 15 necropsy 2008 No data 11 necropsy
Cumberland 186 Pangnirtung 1983 15Aug 5 harvest Sound 1984 16Aug – 25Aug 10 harvest (CSd) 1985 21Aug 2 harvest
1986 26 & 27Jul 19 harvest 1991 10Jul – 25Aug 11 harvest 1992 7May – 31Aug 18 harvest 1993 24Jul – 20Aug 10 harvest 1994 3Jul – 27Aug 25 harvest 1995 15May – 28Aug 17 harvest 1996 5Jun – 21Jul 24 harvest 1998 July 9 tag biopsy 1999 No data 8 harvest 2000 18Jul 1 harvest 2002 6Jul – 27Jul 19 harvest 2006 No data 2 harvest 2007 No data 2 harvest 2008 No data 4 harvest
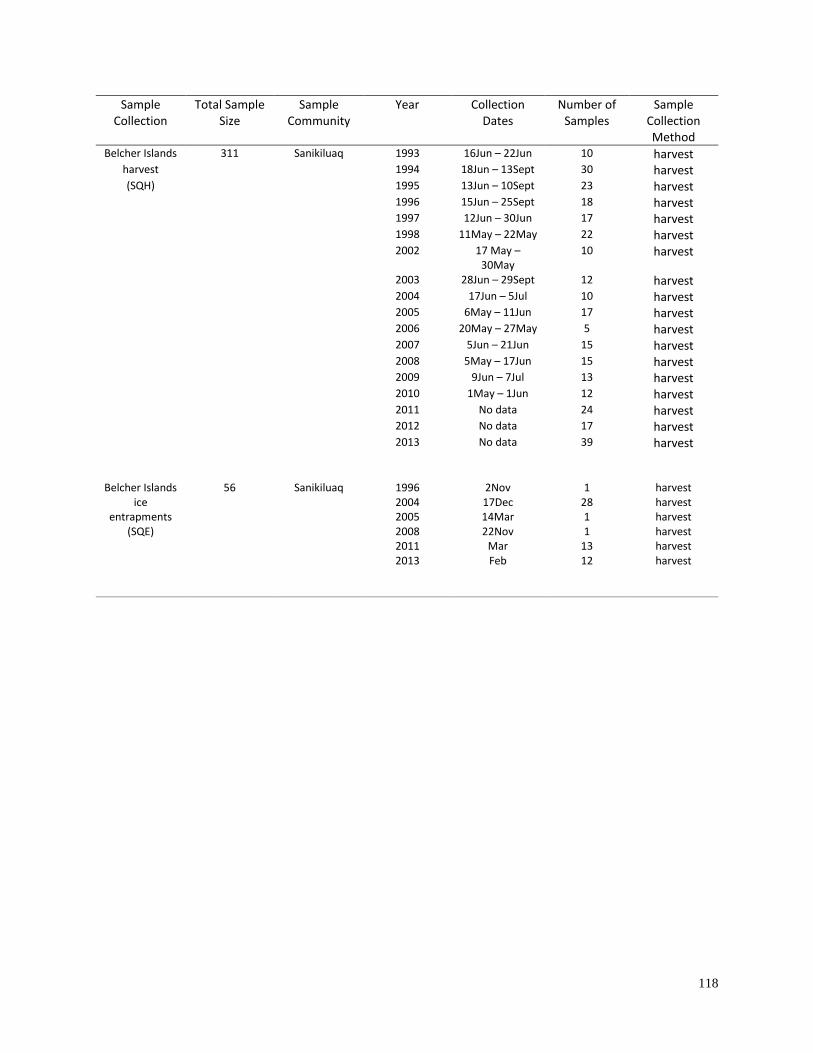
118
Sample Collection
Total Sample Size
Sample Community
Year Collection Dates
Number of Samples
Sample Collection Method
Belcher Islands 311 Sanikiluaq 1993 16Jun – 22Jun 10 harvest harvest 1994 18Jun – 13Sept 30 harvest
(SQH) 1995 13Jun – 10Sept 23 harvest
1996 15Jun – 25Sept 18 harvest 1997 12Jun – 30Jun 17 harvest
1998 11May – 22May 22 harvest
2002 17 May – 30May
10 harvest
2003 28Jun – 29Sept 12 harvest
2004 17Jun – 5Jul 10 harvest 2005 6May – 11Jun 17 harvest
2006 20May – 27May 5 harvest
2007 5Jun – 21Jun 15 harvest
2008 5May – 17Jun 15 harvest 2009 9Jun – 7Jul 13 harvest
2010 1May – 1Jun 12 harvest
2011 No data 24 harvest 2012 No data 17 harvest
2013 No data 39 harvest
Belcher Islands 56 Sanikiluaq 1996 2Nov 1 harvest ice 2004 17Dec 28 harvest
entrapments 2005 14Mar 1 harvest (SQE) 2008 22Nov 1 harvest
2011 Mar 13 harvest 2013 Feb 12 harvest
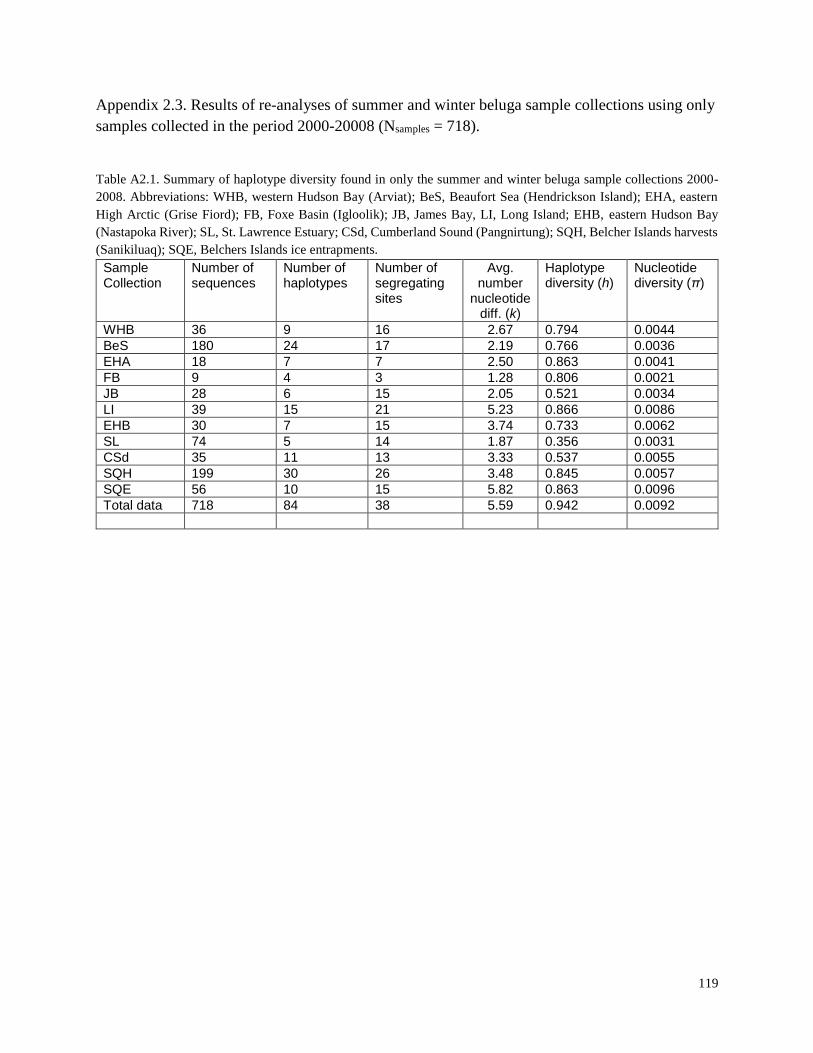
119
Appendix 2.3. Results of re-analyses of summer and winter beluga sample collections using only
samples collected in the period 2000-20008 (Nsamples = 718).
Table A2.1. Summary of haplotype diversity found in only the summer and winter beluga sample collections 2000-
2008. Abbreviations: WHB, western Hudson Bay (Arviat); BeS, Beaufort Sea (Hendrickson Island); EHA, eastern
High Arctic (Grise Fiord); FB, Foxe Basin (Igloolik); JB, James Bay, LI, Long Island; EHB, eastern Hudson Bay
(Nastapoka River); SL, St. Lawrence Estuary; CSd, Cumberland Sound (Pangnirtung); SQH, Belcher Islands harvests
(Sanikiluaq); SQE, Belchers Islands ice entrapments.
Sample Collection
Number of sequences
Number of haplotypes
Number of segregating sites
Avg. number
nucleotide diff. (k)
Haplotype diversity (h)
Nucleotide diversity (π)
WHB 36 9 16 2.67 0.794 0.0044
BeS 180 24 17 2.19 0.766 0.0036
EHA 18 7 7 2.50 0.863 0.0041
FB 9 4 3 1.28 0.806 0.0021
JB 28 6 15 2.05 0.521 0.0034
LI 39 15 21 5.23 0.866 0.0086
EHB 30 7 15 3.74 0.733 0.0062
SL 74 5 14 1.87 0.356 0.0031
CSd 35 11 13 3.33 0.537 0.0055
SQH 199 30 26 3.48 0.845 0.0057
SQE 56 10 15 5.82 0.863 0.0096
Total data 718 84 38 5.59 0.942 0.0092
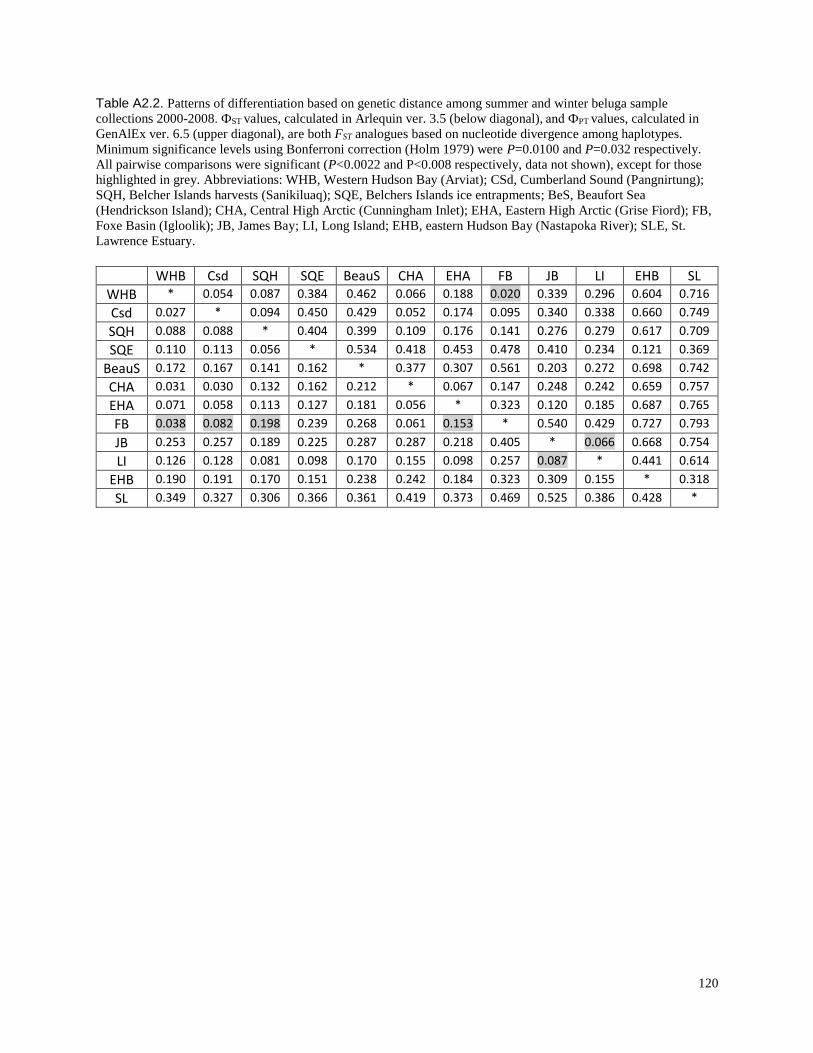
120
Table A2.2. Patterns of differentiation based on genetic distance among summer and winter beluga sample
collections 2000-2008. ФST values, calculated in Arlequin ver. 3.5 (below diagonal), and ФPT values, calculated in
GenAlEx ver. 6.5 (upper diagonal), are both FST analogues based on nucleotide divergence among haplotypes.
Minimum significance levels using Bonferroni correction (Holm 1979) were P=0.0100 and P=0.032 respectively.
All pairwise comparisons were significant (P<0.0022 and P<0.008 respectively, data not shown), except for those
highlighted in grey. Abbreviations: WHB, Western Hudson Bay (Arviat); CSd, Cumberland Sound (Pangnirtung);
SQH, Belcher Islands harvests (Sanikiluaq); SQE, Belchers Islands ice entrapments; BeS, Beaufort Sea
(Hendrickson Island); CHA, Central High Arctic (Cunningham Inlet); EHA, Eastern High Arctic (Grise Fiord); FB,
Foxe Basin (Igloolik); JB, James Bay; LI, Long Island; EHB, eastern Hudson Bay (Nastapoka River); SLE, St.
Lawrence Estuary.
WHB Csd SQH SQE BeauS CHA EHA FB JB LI EHB SL
WHB * 0.054 0.087 0.384 0.462 0.066 0.188 0.020 0.339 0.296 0.604 0.716
Csd 0.027 * 0.094 0.450 0.429 0.052 0.174 0.095 0.340 0.338 0.660 0.749
SQH 0.088 0.088 * 0.404 0.399 0.109 0.176 0.141 0.276 0.279 0.617 0.709
SQE 0.110 0.113 0.056 * 0.534 0.418 0.453 0.478 0.410 0.234 0.121 0.369
BeauS 0.172 0.167 0.141 0.162 * 0.377 0.307 0.561 0.203 0.272 0.698 0.742
CHA 0.031 0.030 0.132 0.162 0.212 * 0.067 0.147 0.248 0.242 0.659 0.757
EHA 0.071 0.058 0.113 0.127 0.181 0.056 * 0.323 0.120 0.185 0.687 0.765
FB 0.038 0.082 0.198 0.239 0.268 0.061 0.153 * 0.540 0.429 0.727 0.793
JB 0.253 0.257 0.189 0.225 0.287 0.287 0.218 0.405 * 0.066 0.668 0.754
LI 0.126 0.128 0.081 0.098 0.170 0.155 0.098 0.257 0.087 * 0.441 0.614
EHB 0.190 0.191 0.170 0.151 0.238 0.242 0.184 0.323 0.309 0.155 * 0.318
SL 0.349 0.327 0.306 0.366 0.361 0.419 0.373 0.469 0.525 0.386 0.428 *
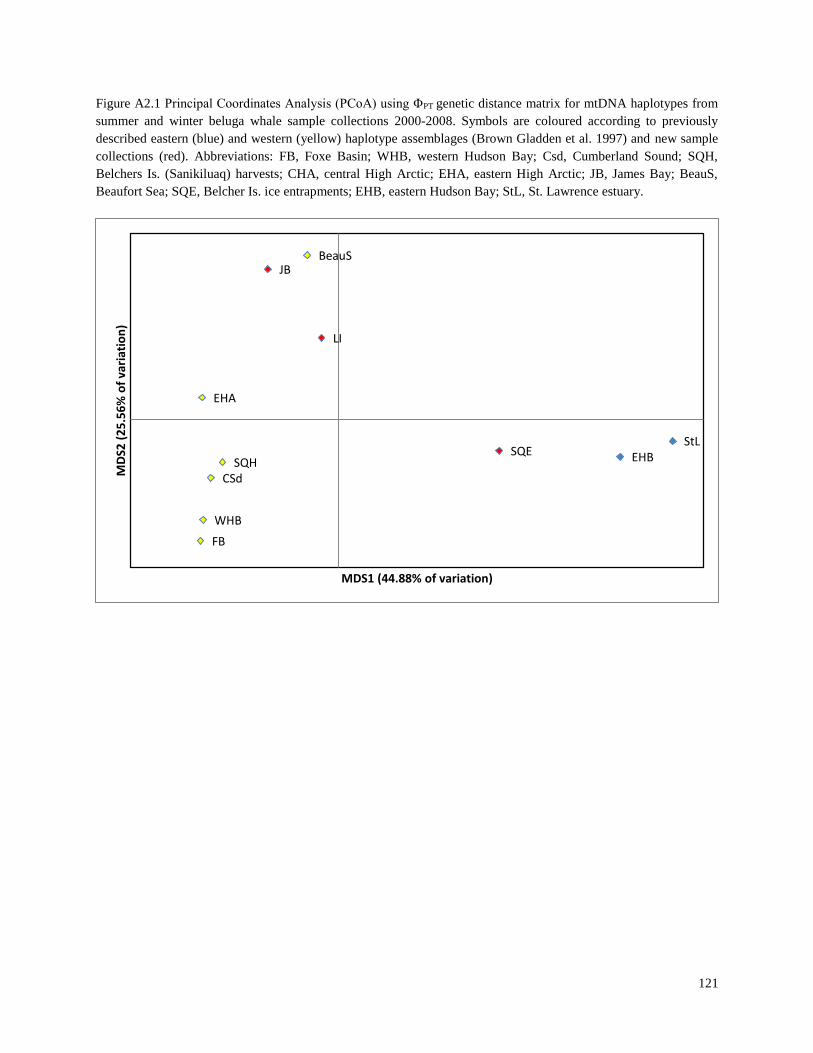
121
Figure A2.1 Principal Coordinates Analysis (PCoA) using ΦPT genetic distance matrix for mtDNA haplotypes from
summer and winter beluga whale sample collections 2000-2008. Symbols are coloured according to previously
described eastern (blue) and western (yellow) haplotype assemblages (Brown Gladden et al. 1997) and new sample
collections (red). Abbreviations: FB, Foxe Basin; WHB, western Hudson Bay; Csd, Cumberland Sound; SQH,
Belchers Is. (Sanikiluaq) harvests; CHA, central High Arctic; EHA, eastern High Arctic; JB, James Bay; BeauS,
Beaufort Sea; SQE, Belcher Is. ice entrapments; EHB, eastern Hudson Bay; StL, St. Lawrence estuary.
JB
LI
EHBSQE
WHB
BeauS
FB
EHA
CSdSQH
StL
MD
S2 (
25
.56
% o
f va
riat
ion
)
MDS1 (44.88% of variation)
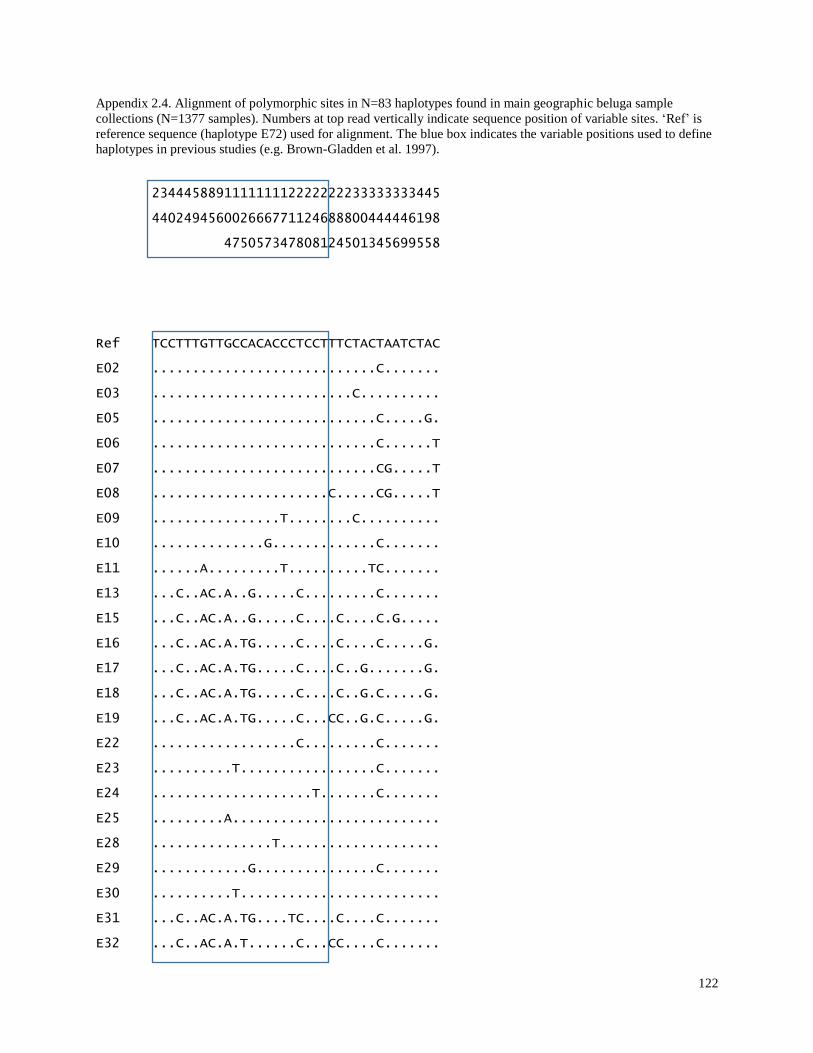
122
Appendix 2.4. Alignment of polymorphic sites in N=83 haplotypes found in main geographic beluga sample
collections (N=1377 samples). Numbers at top read vertically indicate sequence position of variable sites. ‘Ref’ is
reference sequence (haplotype E72) used for alignment. The blue box indicates the variable positions used to define
haplotypes in previous studies (e.g. Brown-Gladden et al. 1997).
234445889111111112222222233333333445
440249456002666771124688800444446198
475057347808124501345699558
Ref TCCTTTGTTGCCACACCCTCCTTTCTACTAATCTAC
E02 ............................C.......
E03 .........................C..........
E05 ............................C.....G.
E06 ............................C......T
E07 ............................CG.....T
E08 ......................C.....CG.....T
E09 ................T........C..........
E10 ..............G.............C.......
E11 ......A.........T..........TC.......
E13 ...C..AC.A..G.....C.........C.......
E15 ...C..AC.A..G.....C....C....C.G.....
E16 ...C..AC.A.TG.....C....C....C.....G.
E17 ...C..AC.A.TG.....C....C..G.......G.
E18 ...C..AC.A.TG.....C....C..G.C.....G.
E19 ...C..AC.A.TG.....C...CC..G.C.....G.
E22 ..................C.........C.......
E23 ..........T.................C.......
E24 ....................T.......C.......
E25 .........A..........................
E28 ...............T....................
E29 ............G...............C.......
E30 ..........T.........................
E31 ...C..AC.A.TG....TC....C....C.......
E32 ...C..AC.A.T......C...CC....C.......
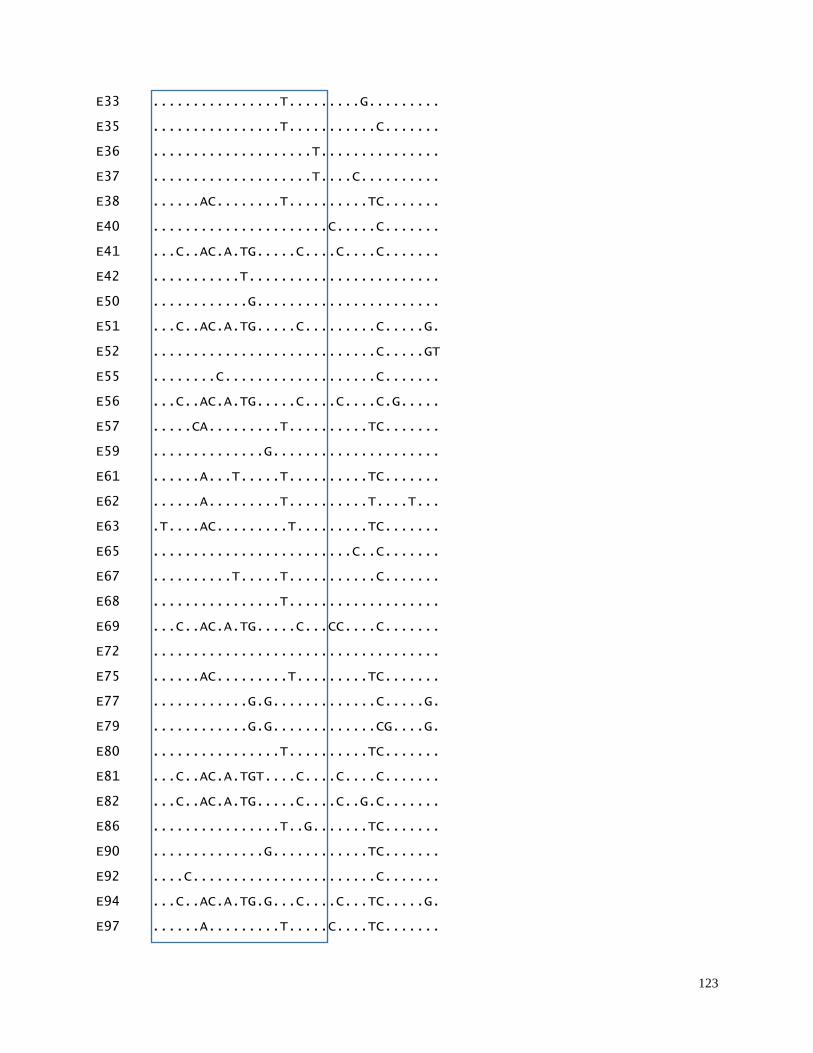
123
E33 ................T.........G.........
E35 ................T...........C.......
E36 ....................T...............
E37 ....................T....C..........
E38 ......AC........T..........TC.......
E40 ......................C.....C.......
E41 ...C..AC.A.TG.....C....C....C.......
E42 ...........T........................
E50 ............G.......................
E51 ...C..AC.A.TG.....C.........C.....G.
E52 ............................C.....GT
E55 ........C...................C.......
E56 ...C..AC.A.TG.....C....C....C.G.....
E57 .....CA.........T..........TC.......
E59 ..............G.....................
E61 ......A...T.....T..........TC.......
E62 ......A.........T..........T....T...
E63 .T....AC.........T.........TC.......
E65 .........................C..C.......
E67 ..........T.....T...........C.......
E68 ................T...................
E69 ...C..AC.A.TG.....C...CC....C.......
E72 ....................................
E75 ......AC.........T.........TC.......
E77 ............G.G.............C.....G.
E79 ............G.G.............CG....G.
E80 ................T..........TC.......
E81 ...C..AC.A.TGT....C....C....C.......
E82 ...C..AC.A.TG.....C....C..G.C.......
E86 ................T..G.......TC.......
E90 ..............G............TC.......
E92 ....C.......................C.......
E94 ...C..AC.A.TG.G...C....C...TC.....G.
E97 ......A.........T.....C....TC.......
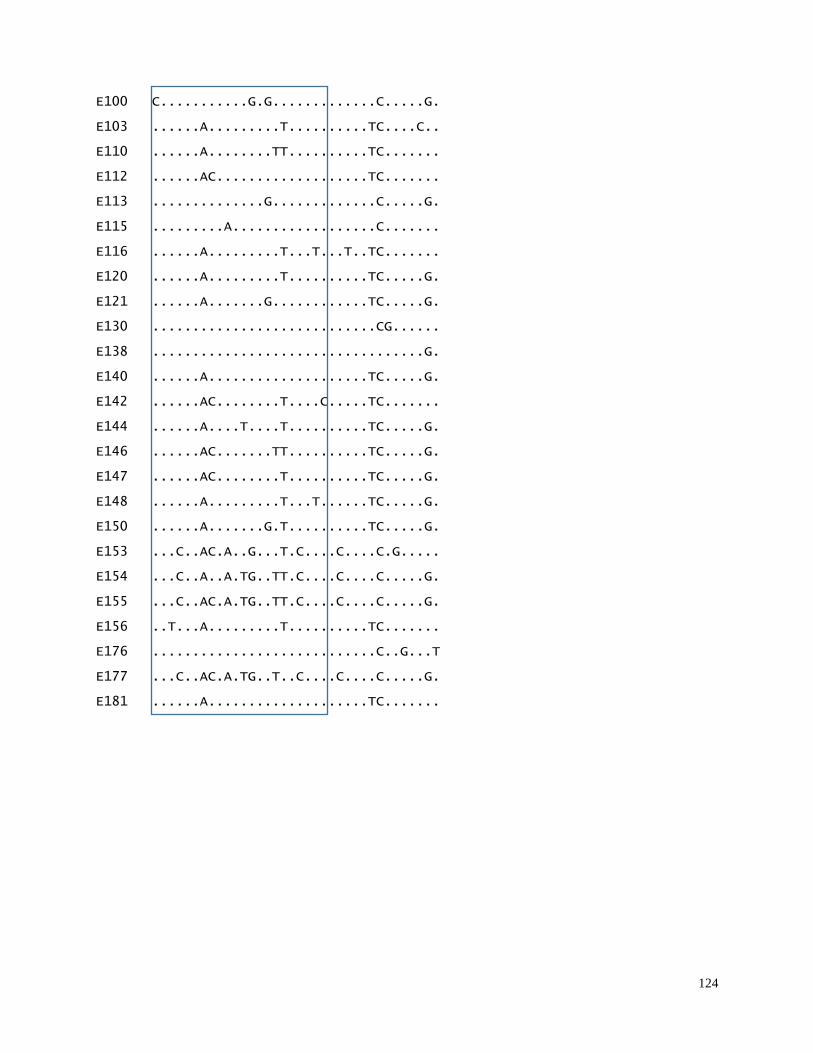
124
E100 C...........G.G.............C.....G.
E103 ......A.........T..........TC....C..
E110 ......A........TT..........TC.......
E112 ......AC...................TC.......
E113 ..............G.............C.....G.
E115 .........A..................C.......
E116 ......A.........T...T...T..TC.......
E120 ......A.........T..........TC.....G.
E121 ......A.......G............TC.....G.
E130 ............................CG......
E138 ..................................G.
E140 ......A....................TC.....G.
E142 ......AC........T....C.....TC.......
E144 ......A....T....T..........TC.....G.
E146 ......AC.......TT..........TC.....G.
E147 ......AC........T..........TC.....G.
E148 ......A.........T...T......TC.....G.
E150 ......A.......G.T..........TC.....G.
E153 ...C..AC.A..G...T.C....C....C.G.....
E154 ...C..A..A.TG..TT.C....C....C.....G.
E155 ...C..AC.A.TG..TT.C....C....C.....G.
E156 ..T...A.........T..........TC.......
E176 ............................C..G...T
E177 ...C..AC.A.TG..T..C....C....C.....G.
E181 ......A....................TC.......
125
Chapter 3: Fine-scale genetic structure of nearshore beluga (Delphinapterus leucas)
aggregations in the Eastern Beaufort Sea: are kin groups being impacted by harvesting?
Abstract
In many mammalian species, fission-fusion group formation can shape population
structure in response to the influence of ecological and behavioural variables. In the Arctic,
migratory whales such as belugas (Delphinapterus leucas) have patterns of behaviour and habitat
use that make them vulnerable to adverse effects from subsistence overharvesting, industrial
development and indirect impacts of climate change. Even in large, stable stocks, the annual use
of dedicated migratory pathways and philopatric aggregations in nearshore areas may result in
specific segments of the population being at a higher risk of overharvesting. In this study, the
impact of subsistence hunting on possible kin-groups of belugas in the Eastern Beaufort Sea
(EBS) was investigated using nearshore samples collected from harvest monitoring programs
from 1983 to 2008. Patterns of relatedness based on genotypes of 964 samples analyzed at 16
microsatellite loci and mitochondrial DNA control region sequences were compared among
different aggregation and harvesting areas and from ice entrapment events spanning the
distribution of the stock. Clustering methods (Bayesian approach, network analysis and
discriminant analysis of principal components (DAPC)) were also used to detect possible
structuring within Beaufort Sea belugas. Samples were heavily biased towards males (4:1), and
neither males nor females were more related than expected by chance using spatial and temporal
a priori divisions of the samples. Results across clustering methods were somewhat inconsistent,
with differing numbers of clusters identified and support for more than one cluster weak. The
exception was the DAPC clustering analysis of female EBS belugas, which had strong
126
assignments to non-overlapping clusters for most individuals. However, the assignments to the
clusters had no discernable pattern in space or time when interpreted using sampling locations
associated with aggregation areas. The patterns observed in this study suggest that groups of
related belugas, most strongly observed in females, use this large summering area but do not
form fine-scale kin structure related to aggregation/harvesting locations in the nearshore areas.
As a result, harvesting and other disturbances in particular bays where belugas are aggregating
will not be necessarily putting a discrete genetic unit of the stock at risk. This also appears true
for natural mortality of groups of whales due to ice entrapments observed in the last few decades.
3.1 Introduction
Population structure in mammals is shaped by many factors such as dispersal, philopatry,
local adaptation and social organization (Greenwood 1980, Storz 1999, Berdahl et al. 2015). The
tendency of animals to form groups is a dynamic activity that can shape population structure
over a continuum of highly structured social hierarchies to fluid populations with highly variable
group composition (Couzin and Laidre 2009). What constitutes a group may be peculiar to a
certain species, and even within a species, group formation and size may be dictated by
environmental and behavioural variables such as food availability, the risk of predation, and
intra-group competition (Grove 2012). As with many life history strategies, the individual
benefits of spatial and temporal associations with groups need to outweigh the costs (e.g. Van
Horn et al. 2007, Kashima et al. 2013, Lardy et al. 2016).
One type of group-living strategy is termed fission-fusion which, as the name implies,
involves groups that “merge (fusion) or split (fission) as they move through the environment”
(Couzin 2006). This process is kinetic, with groups merging, splitting and then merging again as
127
random, non-permanent units (e.g. large herbivores, Gerard et al. 2002) or as part of more stable
sub-groups (e.g. killer whale matriline units, Tavares et al. 2017). Group formation and
individual associations are most often studied in wild populations by observing (either remotely
or directly) individuals in a study area over time. Various techniques are employed, such as
group focal follows with photo-indentification of individuals (e.g. Pearson et al. 2017, Tavares et
al. 2017), observing pre-marked individuals (e.g. King et al. 2017), or GPS tracked individuals
(e.g. Krause et al. 2013, Body et al. 2015).
Characteristics of fission-fusion groups related to size, individual membership and the
degree of cohesion often vary over different spatial and temporal scales (Aureli et al. 2008). In
studies of chimpanzees (Pan troglodytes, Pan paniscus), the greatest predictor of group size and
type was the time spent moving, feeding and socializing (Lehmann et al. 2006). The larger the
group size, the longer it takes for animals to meet their physiological and social demands
effectively and this can have an impact on how animals survive in particular habitats (Dunbar et
al. 2009, Grove et al. 2012). In tree-roosting big brown bats (Eptesicus fuscus), the number and
size of groups seem to be dictated by the number and type of trees available for roosting, the
thermoregulatory benefits of roosting in larger groups, and maternal kin relationships (Metheny
et al. 2008a, b). The availability of food resources was found to be the main factor influencing
fission-fusion in spotted hyenas (Crocuta crocuta), serving to cause both group fusion (defence
of shared resources) and group fission (individual competition for food) (Smith et al. 2008).
In some species of cetaceans, particularly delphinids, fission-fusion group dynamics are
influenced by factors such as food resources, habitat and environmental preferences (e.g.
inshore/coastal vs. pelagic), avoidance of predation, sexual conflict, sociality and kin
associations (Gowans et al. 2007, Möller 2012). An understanding of how these species may be
128
using fission-fusion to adapt to changes in these influences is an important part of conservation
considerations. In Hawaiian spinner dolphins (Stenella longirostris), fission-fusion strategies
appear to be necessary to philopatric groups of animals exploiting limited resting habitats and
prey resources around the smaller islands and atolls (Karczmarski et al. 2005, Andrews et al.
2010). These behaviours may make these groups vulnerable to human disturbances such as
ecotourism activities (Andrews et al. 2010). An example of this has been shown for a small
population of Indo-Pacific humpback dolphins (Sousa chinensis), where a shift from fission-
fusion dynamics typical of larger populations (Parra et al. 2011) to stable, cohesive social
associations was found (Dungan et al. 2016). This difference in population structure was
attributed to anthropogenic stressors impacting the behavioural evolution of the population
(Dungan et al. 2016). In bottlenose dolphins (Tursiops spp.), all populations are characterized by
fission-fusion dynamics; however, variation in socially influenced groups occurs both within and
between communities (e.g. Connor et al. 2000, Lusseau et al. 2006, Moreno and Acevedo-
Gutiérrez 2016). Various stressors, both natural and human-induced, are thought to have the
potential to alter bottlenose dolphin behaviour and social structure. These include fisheries and
aquaculture (Chivers et al. 2001, Diaz Lopez and Bernal Shiral 2008, Blasi and Boitani 2014),
wind and tide turbine farms (Louis et al. 2015), and environmental disasters (Elliser et al. 2011).
These factors were found to alter group size, community membership, habitat preference and
feeding behaviours. Studies of other cetacean species may add additional perspectives on the
potential impacts of human activities on fission-fusion dynamics, social organization and
structure, and contribute further to conservation and management planning.
In most areas of their Arctic and sub-Arctic distribution, beluga whales (Delphinapterus
leucas) follow seasonal migration patterns with movements of animals that can number in the
129
tens of thousands (Harwood et al. 1996, Richard 2005). Globally partitioned into more than 20
putative stocks (or subpopulations) defined mostly by movement patterns and genetics (IWC
2000), at least six stocks of belugas spend a portion or the entirety of an annual cycle of
migration in Canadian waters (Richard 2010). These stocks are assessed for the purpose of
identifying conservation and management needs by the Committee on the Status of Endangered
Wildlife in Canada (COSEWIC) on the basis of Designatable Units (DUs) which are defined as
“discrete and evolutionary significant units of the taxonomic species, where significant means
that the unit is important to the evolutionary legacy of the species as a whole and if lost would
likely not be replaced through natural dispersion” (COSEWIC 2012, 2016). Seven of eight
beluga DUs found in Canadian waters have been assessed and span a wide spectrum of
vulnerability: from Endangered (St. Lawrence Estuary, Eastern Hudson Bay and Ungava Bay
populations, although the Ungava Bay population may, in fact, be extirpated) and Threatened
(Cumberland Sound population), to Special Concern (Western Hudson Bay and Eastern High
Arctic/Baffin Bay populations) and Not at Risk (Eastern Beaufort Sea stock) (COSEWIC 2004,
2014, 2016). The main threats to these whales come from anthropogenic activities such as
aboriginal subsistence harvests, industrial development, shipping, and pollution (COSEWIC
2004, 2014, Reeves et al. 2014). An eighth DU (James Bay) was recently identified, but its status
has not yet been assessed (COSEWIC 2016).
The Eastern Beaufort Sea (EBS) beluga stock is part of the Bering-Beaufort-Chukchi Sea
population of belugas (DFO 2000). Whales migrate annually from an overwintering area in the
Bering Sea and move into the Mackenzie Delta estuary (see Figure 1) in late June, forming peak
aggregations during the month of July (Norton and Harwood 1985, Harwood et al. 1996). These
recurring patterns of aggregations provide an opportunity for hunting, and therefore the EBS
130
belugas are of cultural and subsistence importance to Aboriginal communities in the Inuvialuit
Settlement Region of the western Canadian Arctic (Harwood and Smith 2002). The harvests are
considered sustainable and the stock to be stable or increasing (DFO 2000, Harwood et al. 2002).
However, shipping and industrial development, especially oil and gas exploration and drilling, is
predicted to increase near areas of beluga “hot spots” (Fast et al. 2001, Harwood et al. 2014,
Reeves et al. 2014). These types of activities can be detrimental, especially for migratory
mammals, due to disturbance and potential loss of habitat (Beckmann et al. 2012, Seidler et al.
2014). It has also been suggested that disruption of beluga behaviour and social systems are a
contributing factor to the lack of recovery in some beluga stocks following intense exploitation
(Wade at al. 2012).
The effects of human activities have been recognized to cause disruption to kin structure
and should be considered for conservation and management planning. For example, wild boar
(Sus scrofa) populations have been found to have differing patterns of kin structure depending on
the level of hunting pressure (Poteaux et al. 2009, Lacolina et al. 2009, Podgórski et al. 2014).
Poaching of adult female African elephants (Loxodonta africana) was also found to alter kin
structure in core elephant groups, disrupting social bonds and increasing agonistic contests
between groups (Gobush and Wasser 2009). Investigation of kin structure in racoon (Procyon
lotor) populations revealed that even a species with high dispersal capabilities might be
negatively impacted at the kin structure level by anthropogenic habitat loss and fragmentation
(Dharmarajan et al. 2014). Genetic data have been applied to numerous conservation and wildlife
management challenges, particularly those that seek to maintain genetic diversity of species, sub-
species, populations, and individuals (Allendorf et al. 2013). One essential step to achieving
these population management goals is to identify what represents distinct units to conserve (e.g.
131
Pallsbøl et al. 2006, Waples and Gaggiotti 2006) and it is common to partition wild populations
into subgroups for management purposes based on genetic structure revealed by population-
based approaches (Allendorf et al. 2013). However, individual-based analyses have recently
emerged that use the identification of genetically similar clusters of individuals to assess a
variety of ecological and conservation questions (Palsbøll et al. 2010). One such approach,
estimation of relatedness among individuals, can be used for conservation of wild populations by
helping to understand social systems (Allendorf et al. 2013) which may contribute to kin
structure or “spatial structure within populations where more related individuals are closer to
each other in space than to unrelated individuals” (e.g. Zeyl et al. 2009).
Most species of whales, including delphinids, are very social and form a variety of
kinship associations (Gowans et al. 2008, Möller 2012). The evolution of social structure is
mainly driven by mating strategies, food distribution and predation risk, with environment type
playing a significant role in motivating dispersal (Möller 2012). Differing patterns of habitat
selection have been shown to result in segregation during the summer of Eastern Beaufort Sea
belugas based on sex, age and reproductive status (Richard et al. 2001a, Loseto et al. 2006). This
segregation was linked to different resource needs of individuals and may also represent social
structure within the stock (Loseto et al. 2006). Individual-based genetic comparisons of whales
found in various areas of their distribution would add information about kin relationships related
to these habitat segregation patterns.
Eastern Beaufort Sea belugas have been previously analyzed using population-focused
approaches to distinguish the stock within a broad geographic scale (Brown Gladden et al. 1999,
O’Corry-Crowe et al. 1997) but have not been examined using an individual-based, finer-scale
analysis. In particular, microsatellite (simple sequence repeats in nuclear DNA) data can be used
132
to compare patterns of relatedness among groups of animals to determine if individuals who
overlap in their space use are more closely related than the population as a whole. This has been
demonstrated for mammalian species such as long-tailed macaques (Macaca fascicularis) (Ruiter
and Gefen 1998), ocelots (Leopardus pardalis) (Rodgers et al. 2015), roe deer (Capreolus
capreolus) (Biosa et al. 2015), and even for high fission-fusion species such as bats (Myotis
bechsteinii) (Kerth et al. 2011), giraffes (Giraffa camelopardalis) (Carter et al. 2013) and gelada
baboons (Theropithecus gelada) (Snyder-Mackler et al. 2014).
The goal of this study is to combine the use of individual-based methods of genetic
analyses with samples obtained from annual subsistence harvesting to determine if there is a
fine-scale geographic structure within the Eastern Beaufort Sea beluga due to associations among
whales that are close relatives. For species that are difficult to observe over the long term, this
type of genetic data can be useful to help understand the influence of social systems and
dispersal on population structure (Nidiffer and Cortés-Ortiz 2015). The utility of this approach
has been demonstrated for Hudson Bay belugas (Colbeck et al. 2013) and has been informative
for determining patterns of genetic relatedness in other exploited species such as managed red
deer (Cervus elaphus) populations (Pérez-González et al. 2012) and white-tailed deer
(Odocoileus virginianus) (Grear et al. 2010).
In this study, samples are partitioned from main summer aggregation areas to
correspond with beluga “hot spots” in areas of concern (Harwood et al. 2015). We also include
samples collected from several ice entrapment events that appear to be happening more
frequently in recent years (Kocho-Schellenberg 2010). Network analyses based on relatedness
and clustering methods were used to test the hypothesis that whales forming aggregations in
different nearshore areas in the Beaufort Sea and the Amundsen Gulf are more closely related
133
than those from a randomly distributed population. We hypothesize that belugas that are
aggregating in various bays across the overall nearshore range of the EBS stock comprise groups
that are more closely related to each other than the stock as a whole and that this kin-based
structure contributes to the fission-fusion dynamics of group formation in this stock. We
evaluated the sensitivity of our within EBS beluga stock analyses by using a comparison of EBS
results to a group of samples from a separate, distinct and small population of beluga thought to
have associations among close kin (St. Lawrence Estuary population in eastern Canada, T.
Frasier pers. comm.). We also evaluated if male and female belugas in the EBS stock show
differences in patterns of relatedness as might be expected in a species with matrilineal
philopatry to estuaries (Smith et al. 1994, Clutton-Brock and Lukas 2012). Finally, we assessed
if there is evidence of kin-groups present in the harvest of belugas from the EBS stock.
3.2 Materials and Methods
3.2.1 Study area and samples
A total of 1054 samples for this study were obtained from tissues collected during
research and subsistence harvest monitoring programs established in the Beaufort Sea in the
1970s (Harwood et al. 2002). During these programs, samples and information are collected
from hunters that use traditional whaling camps located along the coastline of the eastern
Beaufort Sea (Figure 3.1). The hunt coincides with the peak of beluga aggregations during July
in the three main areas of the Mackenzie River estuary: Shallow Bay/Niaqunnaq Bay, eastern
Mackenzie Bay and Kugmallit Bay (Harwood et al. 2014). Hunters select for larger and older
belugas, and there is a strong bias towards males (Harwood et al. 2015). In the 1980s, the ratio of
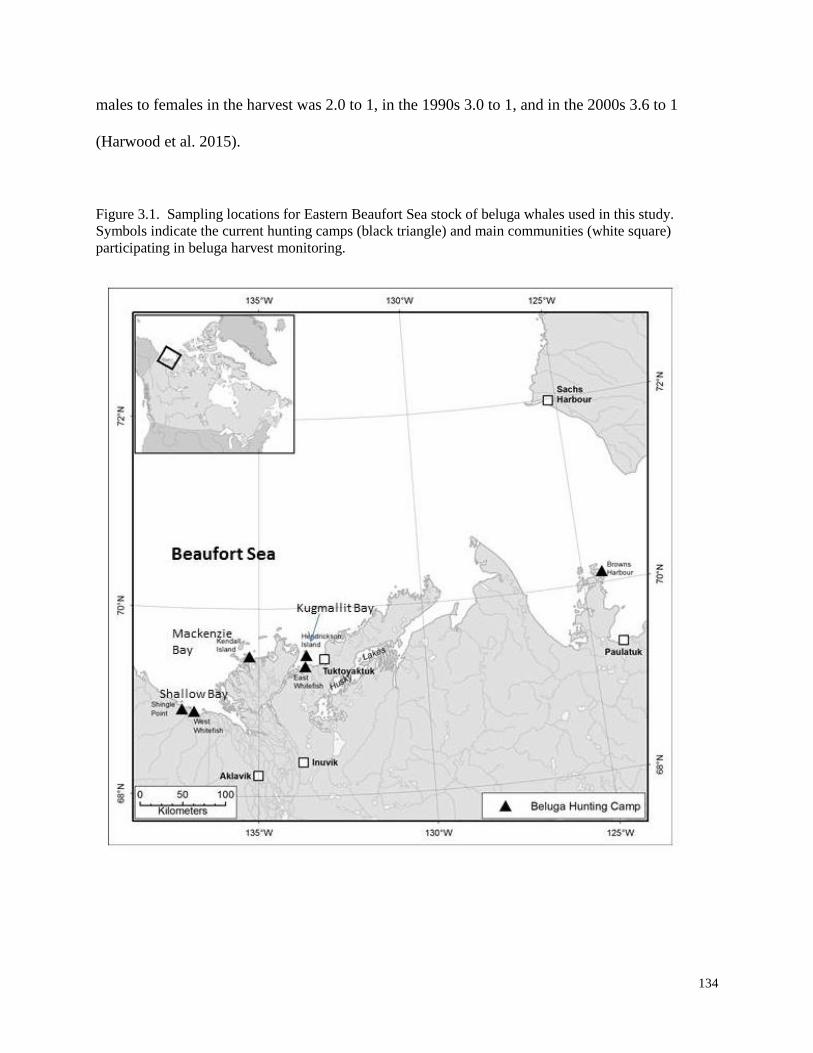
134
males to females in the harvest was 2.0 to 1, in the 1990s 3.0 to 1, and in the 2000s 3.6 to 1
(Harwood et al. 2015).
Figure 3.1. Sampling locations for Eastern Beaufort Sea stock of beluga whales used in this study.
Symbols indicate the current hunting camps (black triangle) and main communities (white square)
participating in beluga harvest monitoring.
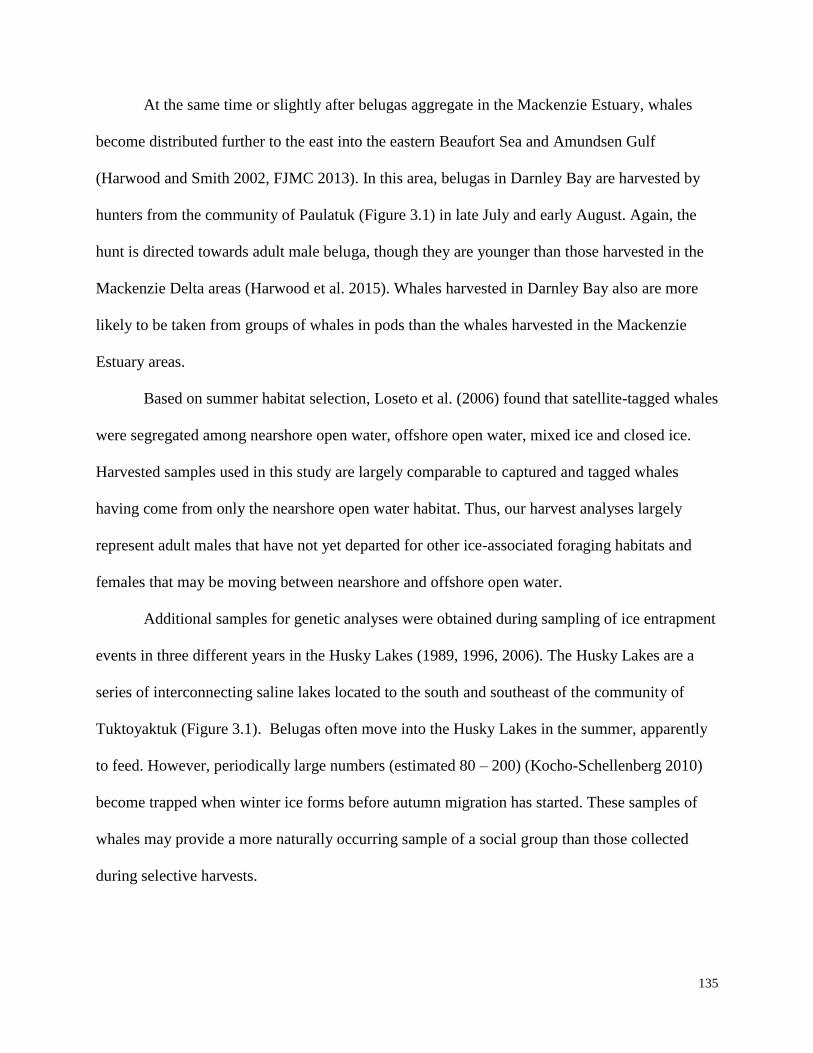
135
At the same time or slightly after belugas aggregate in the Mackenzie Estuary, whales
become distributed further to the east into the eastern Beaufort Sea and Amundsen Gulf
(Harwood and Smith 2002, FJMC 2013). In this area, belugas in Darnley Bay are harvested by
hunters from the community of Paulatuk (Figure 3.1) in late July and early August. Again, the
hunt is directed towards adult male beluga, though they are younger than those harvested in the
Mackenzie Delta areas (Harwood et al. 2015). Whales harvested in Darnley Bay also are more
likely to be taken from groups of whales in pods than the whales harvested in the Mackenzie
Estuary areas.
Based on summer habitat selection, Loseto et al. (2006) found that satellite-tagged whales
were segregated among nearshore open water, offshore open water, mixed ice and closed ice.
Harvested samples used in this study are largely comparable to captured and tagged whales
having come from only the nearshore open water habitat. Thus, our harvest analyses largely
represent adult males that have not yet departed for other ice-associated foraging habitats and
females that may be moving between nearshore and offshore open water.
Additional samples for genetic analyses were obtained during sampling of ice entrapment
events in three different years in the Husky Lakes (1989, 1996, 2006). The Husky Lakes are a
series of interconnecting saline lakes located to the south and southeast of the community of
Tuktoyaktuk (Figure 3.1). Belugas often move into the Husky Lakes in the summer, apparently
to feed. However, periodically large numbers (estimated 80 – 200) (Kocho-Schellenberg 2010)
become trapped when winter ice forms before autumn migration has started. These samples of
whales may provide a more naturally occurring sample of a social group than those collected
during selective harvests.
136
Finally, samples were obtained from a necropsy program of beach-cast belugas from the
St. Lawrence River in eastern Canada. The St. Lawrence Estuary beluga population is a small,
isolated population with limited migration at the southernmost limit of the species distribution
(DFO 2014). It is genetically distinct from all other Canadian beluga populations and has lower
levels of genetic diversity (Brown Gladden et al. 1999, COSEWIC 2014). These samples will be
used as a different population comparison and to ensure the ability of the analyses to detect
signals of relatedness among the Beaufort Sea beluga samples. For the final data analyses, a total
of 964 and 1032 beluga samples were included in the microsatellite and mitochondrial DNA
datasets, respectively (see Sections 3.3.1 and 3.3.5).
3.2.2 DNA extraction and sex identification
Samples in the field were preserved either by freezing in coolers or a salt-saturated 20%
DMSO solution (Seutin et al. 1991) and frozen upon arrival at the laboratory (Winnipeg, MB).
Total cellular DNA extractions were performed using a variety of methods including
phenol:chloroform (Amos and Holzel 1992), Qiagen spin columns (DNeasy Blood and Tissue
Kits), and the Biosprint automated platform (Qiagen Inc, Valencia, CA, USA). Molecular
determination of sex was completed using methods described in Bérubé and Palsbøll (1996) or
Shaw et al. (2005) with separation and visualization of the PCR products on a QIAxcel (Qiagen
Inc, Valencia, CA, USA) to determine sex based on length differences.
3.2.3 Microsatellite genotyping
Samples were genotyped at 16 different microsatellite loci: FCB1, FCB3, FCB4, FCB5,
FCB8, FCB10, FCB11, FCB14, FCB17 (from belugas, Buchanan et al. 1996), EV14, EV37,
137
EV94 (from humpback whales (Megaptera novaeangliae), Valsecchi and Amos 1996),
KWM2A, KWM12A (from killer whales (Orcinus orca), Hoelzel et al. 1998), SW19 (from
sperm whales (Physeter microcephalus), Richard et al. 1996), and PPH104 (from harbour
porpoise (Phocoena phocoena), Rosel et al. 1999). Loci were amplified individually or in
duplexes in reactions with a total volume of 10µL. Reaction mixtures contained 20 – 100ng of
DNA, 1X AmpliTaq gold reaction buffer without MgCl2 (Life Technologies), 1.5mM MgCl2,
0.2mM dNTP mix, 0.125 – 0.5µM of each primer (one of each pair labelled with a fluorescent
dye and the other tailed with a poly-A sequence), and 1 unit of AmpliTaq gold (Life
Technologies). One of three different thermal cycler profiles were used, and amplification
products from individual and duplex PCRs were pooled in ratios to optimize peak intensities (see
Appendix 3.1 for details). Fragments were analyzed using an Applied Biosystems 3130xl genetic
analyzer (Life Technologies) with an internal 400HD Rox size standard. Alleles were scored
according to size in base pairs using GeneMarker ver1.95 software (SoftGenetics).
Fairly large numbers of loci (30-40) are needed to have moderate confidence around a
single pairwise estimate of relatedness (Blouin 2003), but fewer loci are often used especially if
they have a relatively large number of alleles (Van de Casteele et al. 2001). The 16 loci analyzed
in our dataset satisfy this requirement in that all loci were suitably polymorphic and individuals
had high heterozygosity (Waits et al. 2001).
3.2.4 Validity and variability of microsatellite markers
Potential errors in the raw data were assessed using GenAlEx ver. 6.5 (Peakall and
Smouse 2012) for empty data cells, non-numeric data, missing data, samples with repeated
genotypes, and samples with matching names. Specimens that were missing data at more than
138
three loci (80% complete genotype (Morin et al. 2010)) were removed. The data were also
checked for scoring errors and the possible presence of null alleles using the software
Microchecker (van Oosterhout et al. 2004).
To assess genotyping error rate, 180 individuals were randomly selected for re-
amplification and scoring at all loci. Between four and six different beluga samples were also
included as replicates with every PCR amplification and analysis to act as a positive control for
reactions and to assess consistency across runs.
Tests for significant departures from Hardy-Weinberg proportions (H-W) and linkage
disequilibrium were performed using 10,000 iterations in the software GENEPOP web ver. 4.2
(Raymond and Rousset 1995, Rousset 2008). Significant values for multiple comparisons were
corrected using the sequential Bonferroni technique (Holm 1979).
Genetic variation within the sample groups was estimated by calculating the mean
number of alleles (NA), number of private alleles (PA), observed heterozygosity (Ho), and
unbiased heterozygosity expected under H-W proportions (He) using GenAlEx ver. 6.5 (Peakall
and Smouse 2012). Allelic richness (AR) as an unbiased measure of allele number adjusted by
sample size and FIS, the proportional excess of homozygotes relative to H-W proportions, were
calculated using FSTAT ver. 2.9.3 (Goudet 1995). The ability of the microsatellite data to
discriminate individuals was assessed by calculating the probability of identity (Pid) using
GenAlEx ver. 6.5 (Peakall and Smouse 2012). This is the estimate of the average probability that
two unrelated individuals will by chance have the same multilocus genotype.
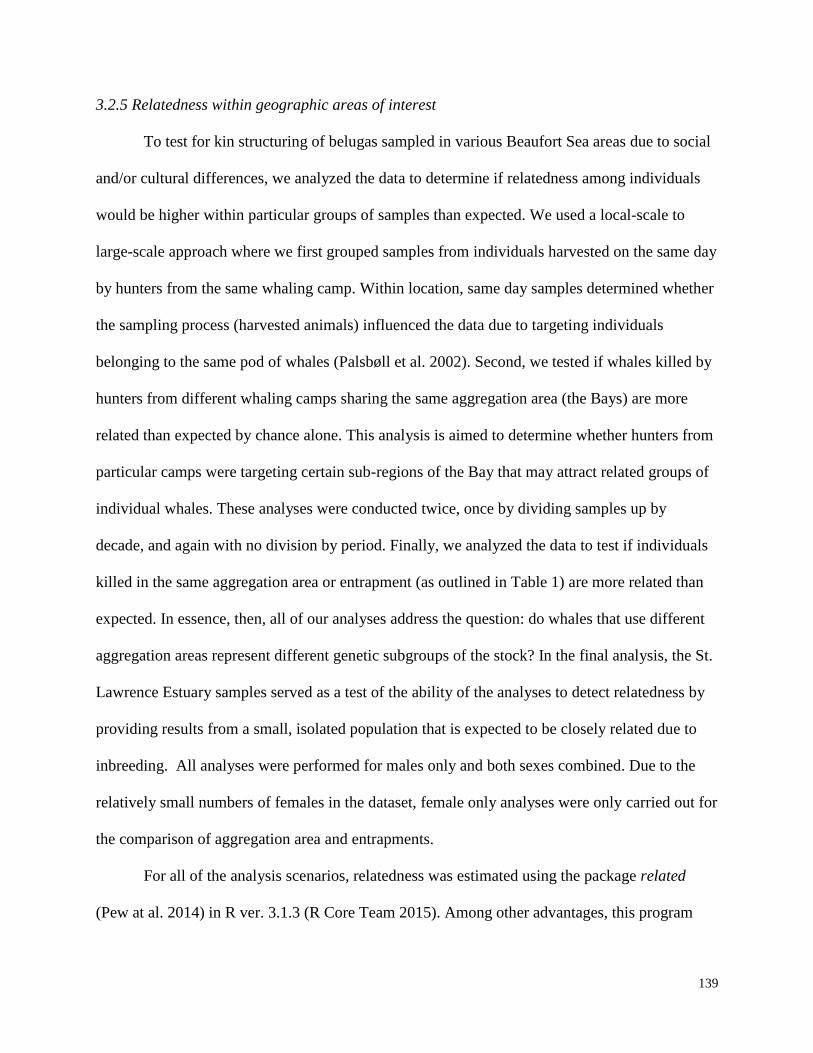
139
3.2.5 Relatedness within geographic areas of interest
To test for kin structuring of belugas sampled in various Beaufort Sea areas due to social
and/or cultural differences, we analyzed the data to determine if relatedness among individuals
would be higher within particular groups of samples than expected. We used a local-scale to
large-scale approach where we first grouped samples from individuals harvested on the same day
by hunters from the same whaling camp. Within location, same day samples determined whether
the sampling process (harvested animals) influenced the data due to targeting individuals
belonging to the same pod of whales (Palsbøll et al. 2002). Second, we tested if whales killed by
hunters from different whaling camps sharing the same aggregation area (the Bays) are more
related than expected by chance alone. This analysis is aimed to determine whether hunters from
particular camps were targeting certain sub-regions of the Bay that may attract related groups of
individual whales. These analyses were conducted twice, once by dividing samples up by
decade, and again with no division by period. Finally, we analyzed the data to test if individuals
killed in the same aggregation area or entrapment (as outlined in Table 1) are more related than
expected. In essence, then, all of our analyses address the question: do whales that use different
aggregation areas represent different genetic subgroups of the stock? In the final analysis, the St.
Lawrence Estuary samples served as a test of the ability of the analyses to detect relatedness by
providing results from a small, isolated population that is expected to be closely related due to
inbreeding. All analyses were performed for males only and both sexes combined. Due to the
relatively small numbers of females in the dataset, female only analyses were only carried out for
the comparison of aggregation area and entrapments.
For all of the analysis scenarios, relatedness was estimated using the package related
(Pew at al. 2014) in R ver. 3.1.3 (R Core Team 2015). Among other advantages, this program
140
allows for the comparison of the performance of four commonly used relatedness estimators (Li
at al. (1993), Lynch and Ritland (1999), Queller and Goodnight (1989), and Wang (2002))
employing the user’s genotype data. The program will simulate genotypes of known relatedness,
calculate relatedness values using the four moment-based estimators and then plot the data for
assessment. Using this method, the Wang estimator (2002) was selected for this study, and it was
used consistently for all analyses.
Beluga data were tested to see if individuals within groups are more related than expected
by chance or if they instead represent random groups of individuals. This was done using an
iterative randomization approach where all pairwise relatedness values were first estimated
within each group, and then an average was calculated. Then, the order of the individuals in the
genotype file was randomly shuffled while keeping the rows representing each group constant.
Thus, individuals were shuffled between groups while maintaining a constant size for each
group. Then relatedness was calculated within each group again. For all of the analysis scenarios
used in this study, the number of iterations used for analyzing group relatedness using the related
software package was 200, which determined (using trials) based on the processing limits of the
computer used for analyses.
Expected values of relatedness (based on iterative random reshuffling individuals within
the dataset) for each of the group comparisons were plotted using histograms of relatedness
values estimated under a null hypothesis that the samples represent a random group of
individuals. Therefore, the larger the sample size at each location, the larger the pool of
individuals to draw from for the reshuffling. This, in turn, resulted in a tighter distribution of
values for the null hypothesis (e.g. see Figure 3.4). An observed relatedness value falling outside
the distribution would reject the null hypothesis. P-values were also generated for each
141
comparison of observed vs. expected values, though these are not exact p-values as they are
based on simulation rather than direct calculation. Instead, they give an indication of how many
of the iterations contained average relatedness values less than or equal to the observed
relatedness value. Thus, p-values were linked to sample size at each of the location comparisons
used to generate the range of expected values of relatedness under the null hypothesis.
3.2.6 Network and clustering analyses based on pairwise relatedness of individuals
Networks based on pairwise relatedness values between individuals were analyzed for
males and females separately, for samples from the Beaufort Sea area only, and for all samples
including the St. Lawrence Estuary. The analyses were performed using the software packages
related (Pew et al. 2014) and igraph (Csardi and Nepusz 2006) in R ver. 3.1.3 (R Core Team
2015). Relatedness of individuals in the beluga dataset was again estimated using the Wang
(2002) estimator. A matrix was created with the number of rows and columns equal to the total
number of samples in the dataset. The matrix was then filled with the pairwise relatedness
estimates. However, negative values cannot be used for creating edges in a network; therefore,
all negative estimates of relatedness were truncated to zero. Finally, the matrix was labelled and
imported into igraph (Csardi and Nepusz 2006) to create and analyze the network.
A weighted (based on relatedness values) adjacency graph was created from the matrix
with the diagonal of the matrix zeroed out so as to not be included in the calculation, and only
the lower left triangle used to create a undirected graph. The column names (the sample codes
for the individual belugas) were used as the vertex (node) names in the graph.
Three different methods were used to test for clusters (or communities): the fast greedy
community method, the leading eigenvector community method, and the spinglass community
142
method. Community structure is a feature of the network where the vertices (the nodes, or
individuals in the beluga dataset) are grouped so that there is a higher density of edges (the
connections of individuals) within the groups than between them (Clauset et al. 2004).
Community structure detection is, therefore, a data-analysis technique that highlights structure
present in large-scale network datasets (Newman 2006a). Both the fast greedy and the leading
eigenvector algorithms are hierarchical approaches that try to optimize a network quality
function, modularity (Clauset et al. 2004, Newman 2006b). Modularity is a quantitative measure
that relates a statistically meaningful arrangement of edges to true community structure (Girvan
and Newman 2002, Newman 2006a). Thus, modularity indicates structure by measuring if a
community division has more edges (or links) within a community and few edges between
communities (Clauset et al. 2004). Modularity estimates for all beluga networks were obtained
for both fast greedy and leading eigenvector community algorithms, and assignments of
individuals to each of the identified clusters found under each method were compared.
The spinglass community algorithm is a non-hierarchical approach for detecting
community structure in networks that is based on a modified q-state Potts model (a spin-glass
model) (Reichardt and Bornholdt 2004). This model interprets structure by translating similarity
measures into coupling strengths based on the interactions and spin states of the vertices – in this
case, the individual belugas comprising the dataset. The model is simulated for a given number
of iterations and the spin states of the particles, in the end, define the communities. Modularity
for this type of algorithm cannot be calculated.
Another network property related to clustering is transitivity, which occurs when two
nodes in the network are both neighbours of the same third node and because of that common
connection, have a higher probability of also being neighbours with each other (Girvan and
143
Newman 2002). Transitivity is also known as the clustering coefficient, and the higher the value,
the more probable it is to observe a link between two nodes which are both connected to a third
one (Orman and Labatut 2011).
To assess the signals for structuring within the beluga relatedness networks, modularity
estimates for all networks were obtained for both the fast greedy and leading eigenvector
community algorithms. Transitivity for each network was also determined, and assignments of
individuals to each of the identified clusters found under the three clustering methods were
compared. One of the shortcomings of network analysis techniques is that we are unable to
perform traditional significance testing (Lusseau et al. 2006). However, the strength of the
observed modularity and transitivity values were assessed by comparing them to an expected
distribution of transitivity and modularity values for simulated datasets and relatedness networks
of unrelated individuals. The simulations to create the data were run with 200 iterations and used
allele frequencies from the original beluga dataset. The fast greedy community algorithm was
used to determine transitivity and modularity for each iteration of the simulation.
The networks and the clustering analysis results for each of the community algorithms
were imported and visualized in CytoScape ver 3.2.1 (Shannon et al. 2003). For all of the
network clustering analyses, the full networks were used. However, to assist in the visualization
of crowded networks, the networks were trimmed to include only weighted relatedness values
greater than 0.35 for figures (determined using trials of different values).
3.2.7 Bayesian and multivariate clustering analyses
Additional analyses were used to identify the most likely number of distinct genetic
clusters and assign individuals to these groups: a Bayesian model-based method implemented in
144
STRUCTURE (Pritchard et al. 2000), and a multivariate method, the discriminant analysis of
principal components (DAPC) using adegenet (Jombart et al 2010) in R ver. 3.1.3 (R Core Team
2015).
Methods implemented in STRUCTURE use genotype data to describe and visualize
population structure based on allele frequencies assuming that a variety of conditions are met,
specifically, Hardy-Weinberg and linkage equilibrium within groups, random mating within
populations and free recombination between loci (Pritchard et al. 2010). The model uses
simulations to estimate group membership of each individual using several user-defined
parameters. It is important that these parameters be defined with sufficient rigour to best achieve
reproducibility of STRUCTURE results (Gilbert et al. 2012).
For the analyses of the entire beluga dataset (males and females, St. Lawrence Estuary
samples included), the admixture model with correlated allele frequencies was used, without
using any a priori information on sample locations or putative population origins. The model
was run with values of K (assumed number of distinct populations) set from 1 to 10 using a burn-
in period of 500,000 iterations followed by 100,000 Markov chain Monte Carlo (MCMC)
repetitions. Twenty independent runs were conducted for each value of K to check for
convergence of results and increase the precision of the parameter estimates (Gilbert et al. 2012).
The most likely number of clusters was chosen by calculating and finding the largest value for
ΔK, based on the second order rate of change of LnP(D) (the mean log likelihood of the data)
with respect to K (Evanno et al. 2005) as implemented in the software STRUCTURE
HARVESTER (Earl and von Holdt 2012).
Discriminant analysis of principal components (DAPC) employs methods to describe
genetic clusters of related individuals by maximizing differences between groups while
145
minimizing variation within groups (Jombert et al. 2010). Again, beluga data were analyzed with
males and females separated, and both sexes combined, for the complete dataset including the St.
Lawrence Estuary as well as for only the Beaufort Sea locations.
All DAPC analyses were performed following the recommendations of Jombart (2014).
The data was first transformed using a principal components analysis and individuals then
assigned to groups using k-means clustering (max. clusters set to 10-15). During the first round
of analyses, all principal components (PCs) were retained (100-120) and the best number of
clusters to describe the data determined using the Bayesian Information Criterion (BIC). The first
DAPC was then performed on the decomposed data to assess differentiation among groups.
Individuals were assigned to clusters based on membership probabilities. However, retaining too
many PCs with respect to the number of individuals can lead to overfitting and instability of the
membership probabilities (Jombart 2014). Therefore a second round of DAPC was performed
using an optimized number of PCs for the analysis. This was determined using an a-score which
measures the trade-off between discrimination power and over-fitting. Final DAPC results were
visualized using scatter plots, and assignments of individuals to clusters were compared to
clusters assignments from all other types of analyses used for this study.
3.2.8 Mitochondrial DNA control region sequencing
Based on the results of the DAPC analyses of females, sequencing of mitochondrial DNA
was used to investigate potential structuring of maternal haplotype lineages among the main
sampling locations.
Mitochondrial DNA (mtDNA) sequences were generated using amplification reactions
designed to target a portion of the mtDNA control region. Primers Belmt-5 (5’-GAT AGA GTT
146
TTT TGA GCC CG-3’) and Belmt-6 (5’-TCA CCA CCA ACA CCC AAA G-3’) were used in a
polymerase chain reaction (PCR) mixture containing 1x buffer, 25mM MgCl2, 10mM dNTP
mix, 20uM of each primer, 0.5units of Taq polymerase and approximately 50-200ng of template
DNA. The PCR amplifications were performed in a total volume of 50µL under the following
conditions: 95°C for10 min.; 35 cycles of 95°C for 20s, 55°C for 30s, 72°C for 45s; extension at
72°C for 10 min. Products were visualized using agarose gel electrophoresis, and successfully
amplified samples were cleaned using or QiaQuick PCR clean-up kits (Qiagen Inc. (Canada),
Toronto, ON) or RapidTips (Diffinity Genomics, D-Mark BioSciences, Toronto, ON). DNA
sequencing was performed using BigDye ver. 3.5 (ThermoFisher Scientific, Mississauga, ON)
with the Belmt-6 primer as the sequencing primer (2uM). The PCR sequencing temperature
profile was: 96°C for 1min.; 32 cycles of 96°C for 10s, 50°C for 30s, and 60°C for 4min; and an
extension at 72°C for 7min. Sequencing was performed on an Applied Biosystems 3130xl
genetic analyzer (ThermoFisher Scientific, Mississauga, ON).
DNA sequences were aligned and edited using MEGA ver. 6 (Tamura et al. 2011).
Individual sample sequence haplotypes were assigned using GenAlEx ver. 6 (Peakall and
Smouse 2006). The resulting “library” of unique haplotypes was verified each time a new
haplotype was found using alignment and visualization in the software package DNA Alignment
(Fluxus Technology Ltd. 2013)). Samples resulting in a new haplotype were also resequenced to
verify the sequence. A subset of samples was re-sequenced to estimate the error in haplotype
identification and positive control samples were used for every sequencing plate analysis to
verify the reproducibility of sequencing results.
Haplotype frequency distributions and geographic patterns were evaluated for the main
aggregation areas for all samples combined and for each sampling location by decade for
147
evidence of both spatial and temporal differentiation. Genetic diversity and differentiation were
estimated for the main aggregation areas combined to have robust sample sizes. The number of
different haplotypes (NH), haplotype diversity (h), nucleotide diversity (π), the number of
segregating sites in each group and the average number of nucleotide differences (k) within
sample collections were determined using DnaSP ver. 5.1 (Librado and Rozas 2009). The
presence of fine-scale population structure was assessed using analysis of molecular variance
(AMOVA) between and within the sample collection groups and pairwise ΦST comparisons
using ARLEQUIN ver. 3.5.1.2 (Excoffier and Lischer 2010). AMOVA was also performed in
GenAlEx ver. 6.4 (Peakall and Smouse, 2012) using the FST analogue ΦPT and significance tested
using randomization of the data with the observed value being included as another permutation
(Peakall and Smouse 2010). The matrix of ΦPT pairwise differences produced in GenAlEx
(Peakall and Smouse 2012) was then used in a Principal Coordinates Analysis (PCoA) as a way
to visualize the patterns of genetic relationships among the sample collections from different
areas based on genetic distance.
Bonferroni correction (Holm 1979) is applied to pairwise tests of genetic differentiation
to decrease the risk of falsely rejecting the null hypothesis (of no difference), i.e. Type I error,
resulting from experiment-wise multiple testing (Narum 2006). Sequential Bonferroni
corrections address Type II errors (not rejecting the null hypothesis when it is false) for table-
wise multiple comparisons. These types of corrections have been accused of being misused
(Cabin and Mitchell 2000) and of being overly conservative and obscuring “potentially relevant
results” (Moran 2003, García 2004, Narum 2006). Instead, many authors advocate the use of
False Discovery Rate (FDR) procedures (Benjamini and Hochberg 1995) to provide better power
over falsely rejected hypotheses and allow for better interpretation of biologically meaningful
148
patterns of genetic differentiation (e.g. Benjamini and Yekutieli 2001, García 2004, Narum
2006). Therefore, patterns of mtDNA differentiation based on genetic distance among sample
locations were evaluated using both Bonferroni correction and a Benjamini-Hochberg FDR
correction applied using software developed by Lesack and Naugler (2011).
3.3 Results
3.3.1 Validity and variability of microsatellite markers
Initially, 1054 beluga samples were analyzed. Nineteen duplicate samples were removed
from the dataset, and samples with less than 80% complete genotype at the 16 loci were also
excluded from the final dataset. This resulted in 964 samples from nine sampling locations
(Shingle Point, West Whitefish Stations, Kendall Island, Hendrickson Island, Tuktoyaktuk, East
Whitefish Station, Paulatuk, Husky Lakes, St. Lawrence River Estuary) and spanning three
decades being included in the subsequent analyses of group differences. The samples from the
three most important aggregation areas, i.e.: Shallow Bay, East Mackenzie Bay, and Kugmallit
Bay, were grouped for further analyses, but the samples from the individual entrapment events in
the Husky Lakes were kept separate to examine questions of interest in this study (Table 3.1).
A total of 17.5% of the dataset was reprocessed to estimate genotyping error. The error
rate across most loci ranged from 0.000 to 0.005 errors/allele. Microchecker analyses of the data
indicated the possible presence of null alleles and/or allelic dropout at locus KWM12A for the
2006 Husky Lakes samples and locus EV94 in the Kugmallit Bay sample group. Further
analyses in GENEPOP found a significant departure from Hardy-Weinberg proportions at locus
FCB17 in the St. Lawrence Estuary samples and for EV94 and KWM12A in the 2006 Husky
Lakes samples. The Husky Lakes and St. Lawrence samples came from whales that were
149
emaciated (Husky Lakes) and/or from beach-cast animals that may have spent some time
decaying. Sample quality likely contributed to inconsistent DNA template quality or low
template quantity that could have affected PCR amplification at some loci (Dakin and Avise
2004). This is the likely cause here as the majority of missing data due to failed or “poor-quality”
results came from these two sample locations. Considering the effect is limited to few loci in the
overall genotypes and sample groups, all data were included in the analyses. Results of further
statistical analyses that assume Hardy-Weinberg equilibrium were carefully assessed to
determine if these data were causing any spurious results. For all sampling locations, departures
from expected Hardy-Weinberg proportions (Fis) were not significant (Table 3.2).
Tests for linkage disequilibrium (LD), estimated in GENEPOP, were significant for FCB
4/FCB17 and FCB8/FCB3 locus pairs across all populations; however, closer examination of the
results of each population revealed that this result was driven by a significant LD in Kugmallit
Bay (FCB4 and FCB17) and Paulatuk (FCB8 and FCB3). Use of these loci in other studies of
beluga datasets including different sized populations did not detect indications of linkage among
these loci (de March and Postma 2003, Turgeon et al. 2012). Therefore, the impact of this result
on the overall dataset was considered negligible.
Mean numbers of alleles varied by location and overall sample sizes (Table 3.2). Allelic
richness, adjusted by sample size, was smallest across loci for the St. Lawrence samples, as was
the observed heterozygosity. Analyses of probability of identity (P(ID)) resulted in negligible
probabilities that two individuals in the dataset would have matching genotypes due to chance
(Table 3.2) at a threshold of P(ID) < 0.0001 (Waits et al. 2001), and indicated high discriminatory
power to identify individuals with these loci.
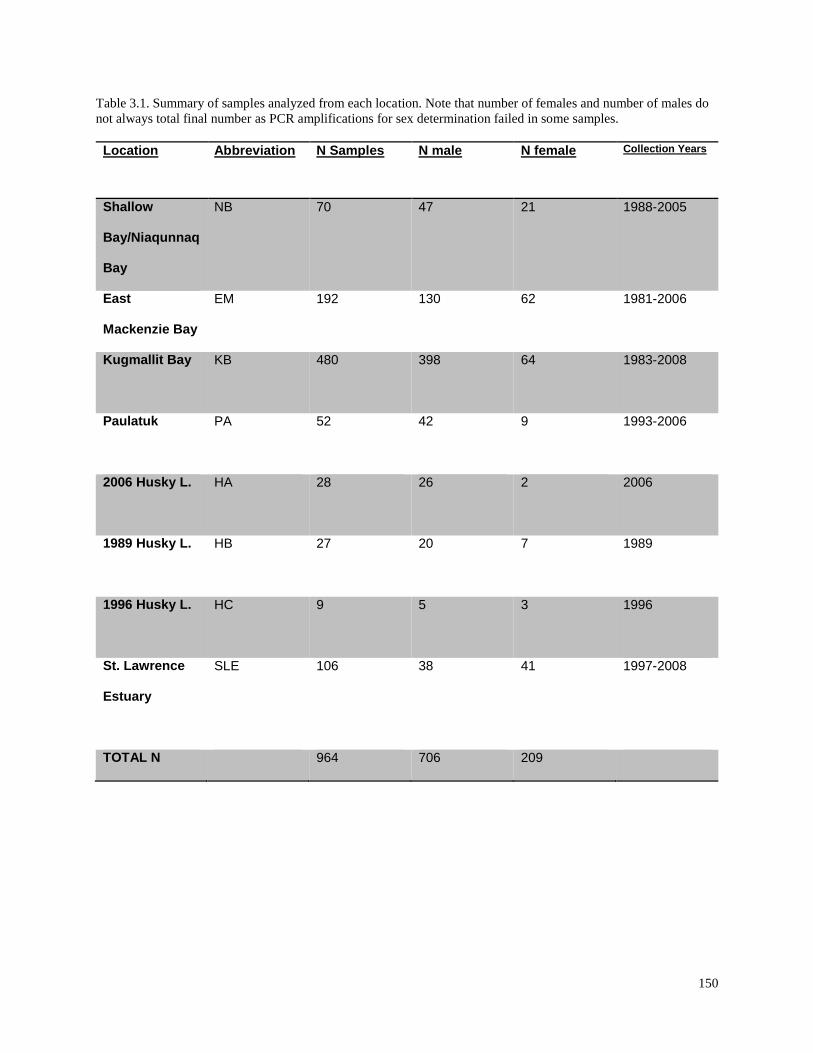
150
Table 3.1. Summary of samples analyzed from each location. Note that number of females and number of males do
not always total final number as PCR amplifications for sex determination failed in some samples.
Location Abbreviation N Samples N male N female Collection Years
Shallow
Bay/Niaqunnaq
Bay
NB 70 47 21 1988-2005
East
Mackenzie Bay
EM 192 130 62 1981-2006
Kugmallit Bay KB 480 398 64 1983-2008
Paulatuk PA 52 42 9 1993-2006
2006 Husky L. HA 28 26 2 2006
1989 Husky L. HB 27 20 7 1989
1996 Husky L. HC 9 5 3 1996
St. Lawrence
Estuary
SLE 106 38 41 1997-2008
TOTAL N 964 706 209
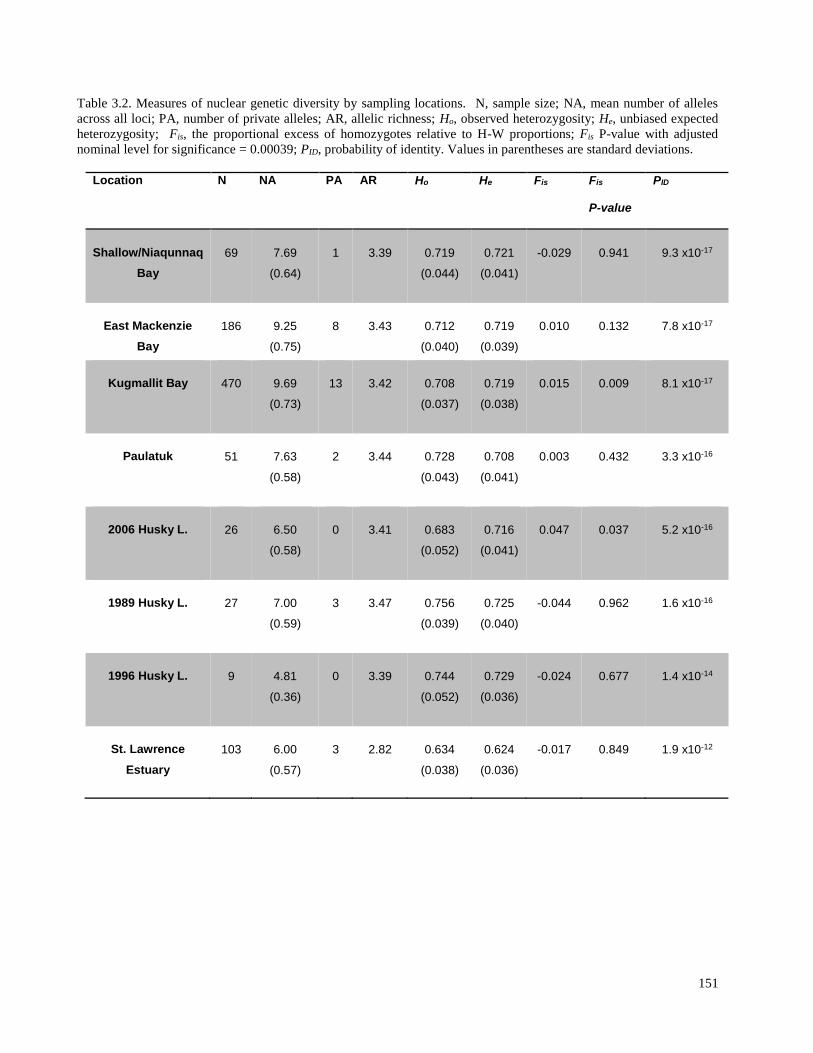
151
Table 3.2. Measures of nuclear genetic diversity by sampling locations. N, sample size; NA, mean number of alleles
across all loci; PA, number of private alleles; AR, allelic richness; Ho, observed heterozygosity; He, unbiased expected
heterozygosity; Fis, the proportional excess of homozygotes relative to H-W proportions; Fis P-value with adjusted
nominal level for significance = 0.00039; PID, probability of identity. Values in parentheses are standard deviations.
Location N NA PA AR Ho He Fis Fis
P-value
PID
Shallow/Niaqunnaq
Bay
69 7.69
(0.64)
1 3.39 0.719
(0.044)
0.721
(0.041)
-0.029 0.941 9.3 x10⁻¹⁷
East Mackenzie
Bay
186 9.25
(0.75)
8 3.43 0.712
(0.040)
0.719
(0.039)
0.010 0.132 7.8 x10⁻¹⁷
Kugmallit Bay
470 9.69
(0.73)
13 3.42 0.708
(0.037)
0.719
(0.038)
0.015 0.009 8.1 x10⁻¹⁷
Paulatuk
51 7.63
(0.58)
2 3.44 0.728
(0.043)
0.708
(0.041)
0.003 0.432 3.3 x10⁻¹⁶
2006 Husky L.
26 6.50
(0.58)
0 3.41 0.683
(0.052)
0.716
(0.041)
0.047 0.037 5.2 x10⁻¹⁶
1989 Husky L.
27 7.00
(0.59)
3 3.47 0.756
(0.039)
0.725
(0.040)
-0.044 0.962 1.6 x10⁻¹⁶
1996 Husky L.
9 4.81
(0.36)
0 3.39 0.744
(0.052)
0.729
(0.036)
-0.024 0.677 1.4 x10⁻¹⁴
St. Lawrence
Estuary
103 6.00
(0.57)
3 2.82 0.634
(0.038)
0.624
(0.036)
-0.017 0.849 1.9 x10⁻¹²
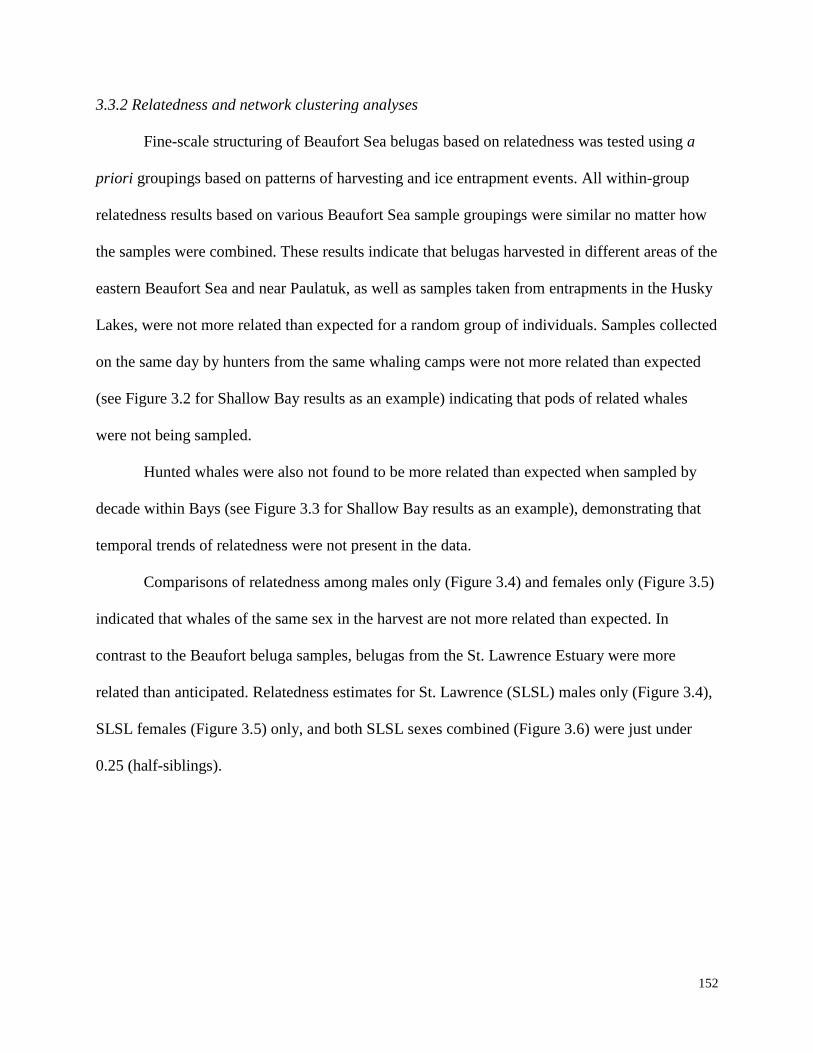
152
3.3.2 Relatedness and network clustering analyses
Fine-scale structuring of Beaufort Sea belugas based on relatedness was tested using a
priori groupings based on patterns of harvesting and ice entrapment events. All within-group
relatedness results based on various Beaufort Sea sample groupings were similar no matter how
the samples were combined. These results indicate that belugas harvested in different areas of the
eastern Beaufort Sea and near Paulatuk, as well as samples taken from entrapments in the Husky
Lakes, were not more related than expected for a random group of individuals. Samples collected
on the same day by hunters from the same whaling camps were not more related than expected
(see Figure 3.2 for Shallow Bay results as an example) indicating that pods of related whales
were not being sampled.
Hunted whales were also not found to be more related than expected when sampled by
decade within Bays (see Figure 3.3 for Shallow Bay results as an example), demonstrating that
temporal trends of relatedness were not present in the data.
Comparisons of relatedness among males only (Figure 3.4) and females only (Figure 3.5)
indicated that whales of the same sex in the harvest are not more related than expected. In
contrast to the Beaufort beluga samples, belugas from the St. Lawrence Estuary were more
related than anticipated. Relatedness estimates for St. Lawrence (SLSL) males only (Figure 3.4),
SLSL females (Figure 3.5) only, and both SLSL sexes combined (Figure 3.6) were just under
0.25 (half-siblings).
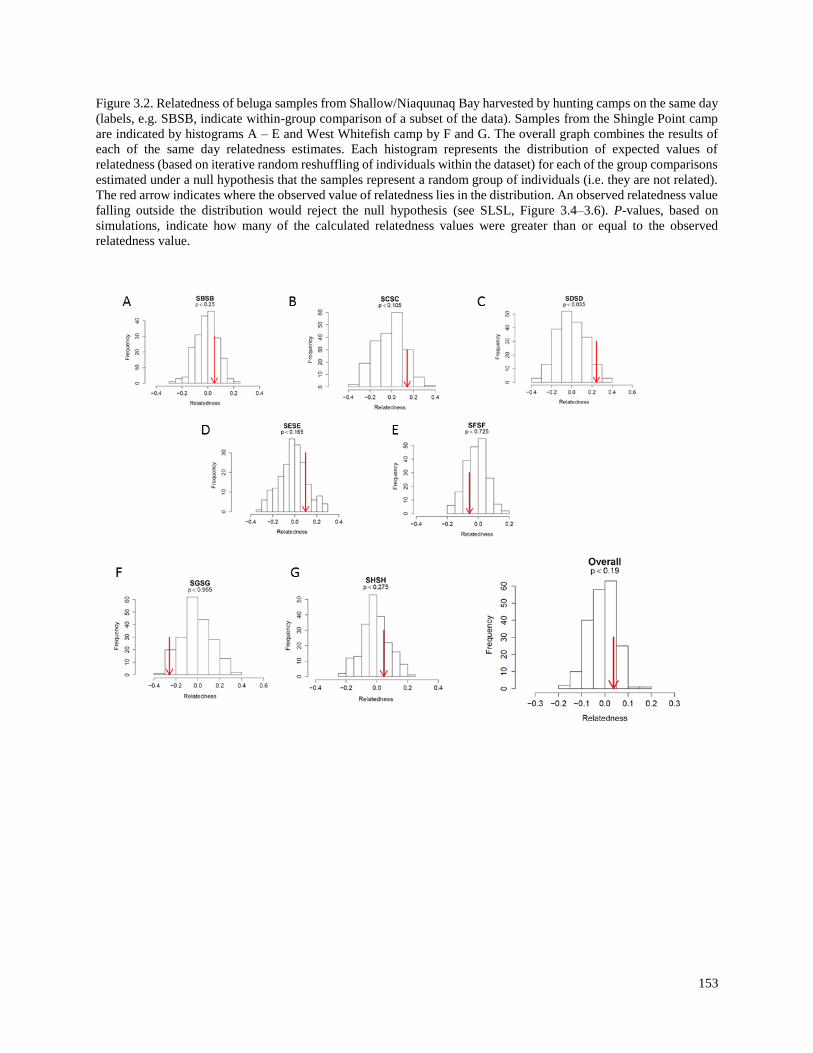
153
Figure 3.2. Relatedness of beluga samples from Shallow/Niaquunaq Bay harvested by hunting camps on the same day
(labels, e.g. SBSB, indicate within-group comparison of a subset of the data). Samples from the Shingle Point camp
are indicated by histograms A – E and West Whitefish camp by F and G. The overall graph combines the results of
each of the same day relatedness estimates. Each histogram represents the distribution of expected values of
relatedness (based on iterative random reshuffling of individuals within the dataset) for each of the group comparisons
estimated under a null hypothesis that the samples represent a random group of individuals (i.e. they are not related).
The red arrow indicates where the observed value of relatedness lies in the distribution. An observed relatedness value
falling outside the distribution would reject the null hypothesis (see SLSL, Figure 3.4–3.6). P-values, based on
simulations, indicate how many of the calculated relatedness values were greater than or equal to the observed
relatedness value.
154
Figure 3.3. Relatedness of beluga samples from Shallow/Niaqunnaq Bay harvested by hunting camps in the same
decade (labels, e.g. SBSB, indicate within-group comparison of a subset of the data). Samples from the Shingle Point
camp are indicated by histograms A (1980s), B (1990s), and C (2000s), and West Whitefish camp by D (1980s), E
(1990s), and F (2000s). The overall graph combines the results of each of the decadal relatedness estimates. Each
histogram represents the distribution of expected values of relatedness (based on iterative random reshuffling of
individuals within the dataset) for each of the group comparisons estimated under a null hypothesis that the samples
represent a random group of individuals (i.e. they are not related). The red arrow indicates where the observed value
of relatedness lies in the distribution. An observed relatedness value falling outside the distribution would reject the
null hypothesis. P-values, based on simulations, indicate how many of the calculated relatedness values were greater
than or equal to the observed relatedness value.
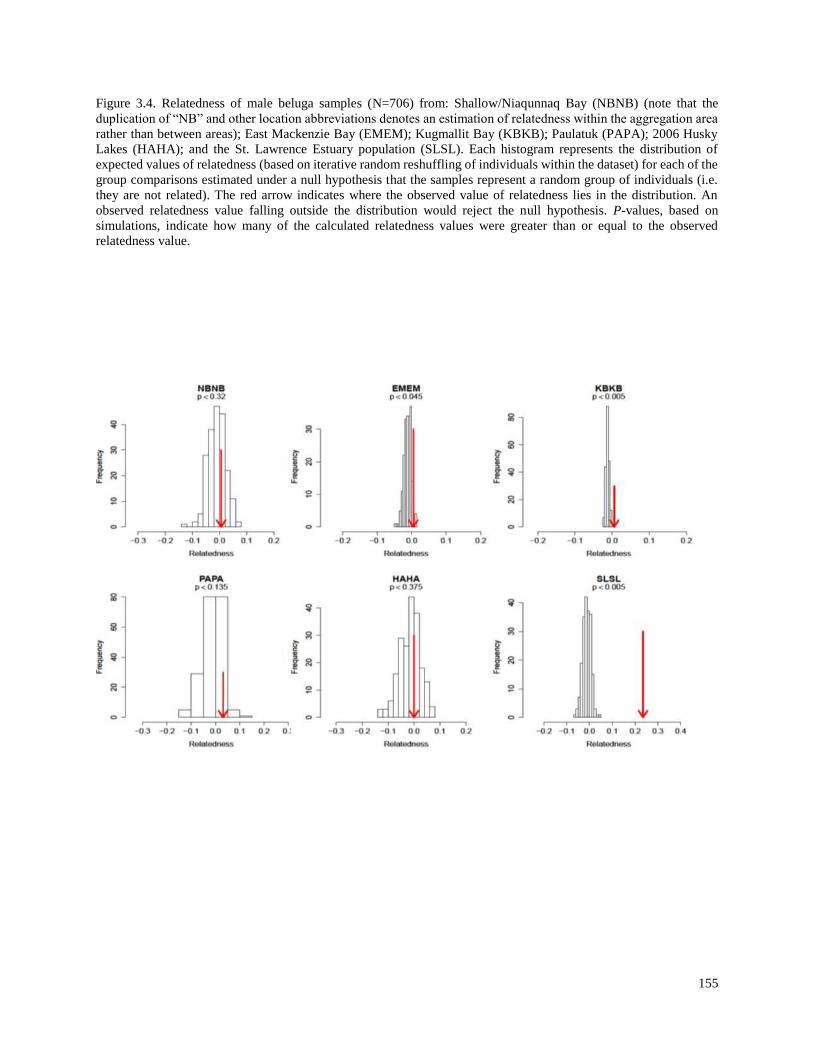
155
Figure 3.4. Relatedness of male beluga samples (N=706) from: Shallow/Niaqunnaq Bay (NBNB) (note that the
duplication of “NB” and other location abbreviations denotes an estimation of relatedness within the aggregation area
rather than between areas); East Mackenzie Bay (EMEM); Kugmallit Bay (KBKB); Paulatuk (PAPA); 2006 Husky
Lakes (HAHA); and the St. Lawrence Estuary population (SLSL). Each histogram represents the distribution of
expected values of relatedness (based on iterative random reshuffling of individuals within the dataset) for each of the
group comparisons estimated under a null hypothesis that the samples represent a random group of individuals (i.e.
they are not related). The red arrow indicates where the observed value of relatedness lies in the distribution. An
observed relatedness value falling outside the distribution would reject the null hypothesis. P-values, based on
simulations, indicate how many of the calculated relatedness values were greater than or equal to the observed
relatedness value.
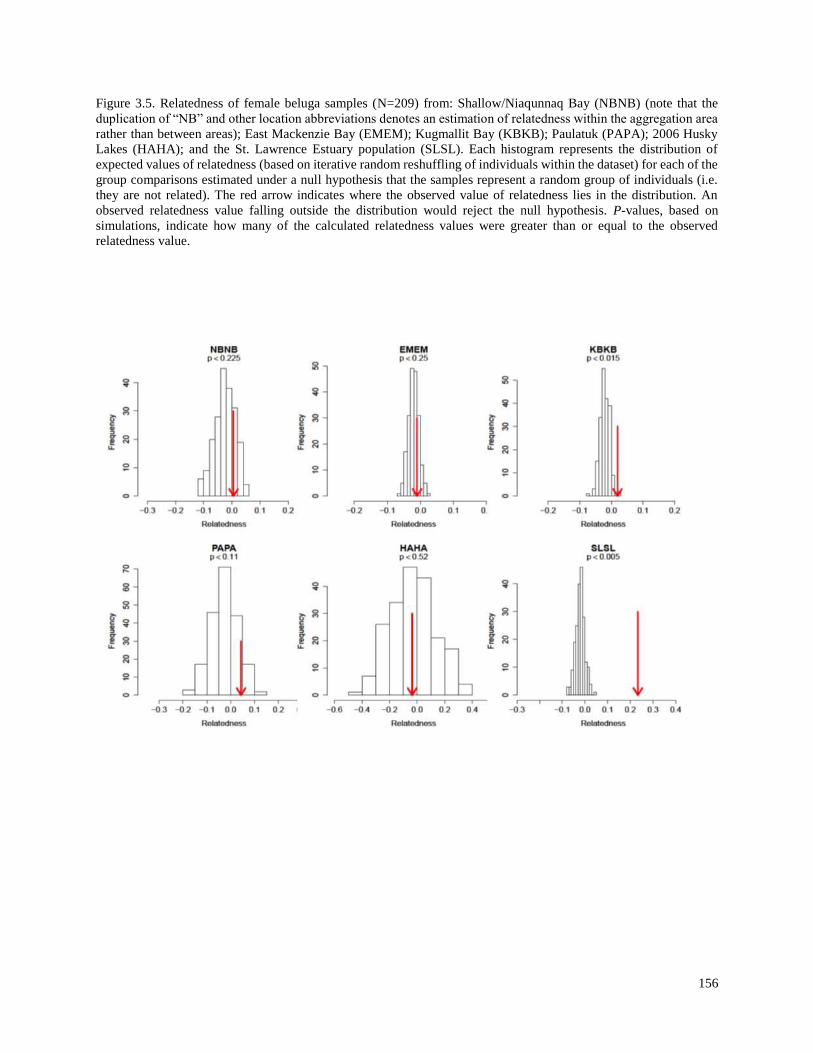
156
Figure 3.5. Relatedness of female beluga samples (N=209) from: Shallow/Niaqunnaq Bay (NBNB) (note that the
duplication of “NB” and other location abbreviations denotes an estimation of relatedness within the aggregation area
rather than between areas); East Mackenzie Bay (EMEM); Kugmallit Bay (KBKB); Paulatuk (PAPA); 2006 Husky
Lakes (HAHA); and the St. Lawrence Estuary population (SLSL). Each histogram represents the distribution of
expected values of relatedness (based on iterative random reshuffling of individuals within the dataset) for each of the
group comparisons estimated under a null hypothesis that the samples represent a random group of individuals (i.e.
they are not related). The red arrow indicates where the observed value of relatedness lies in the distribution. An
observed relatedness value falling outside the distribution would reject the null hypothesis. P-values, based on
simulations, indicate how many of the calculated relatedness values were greater than or equal to the observed
relatedness value.
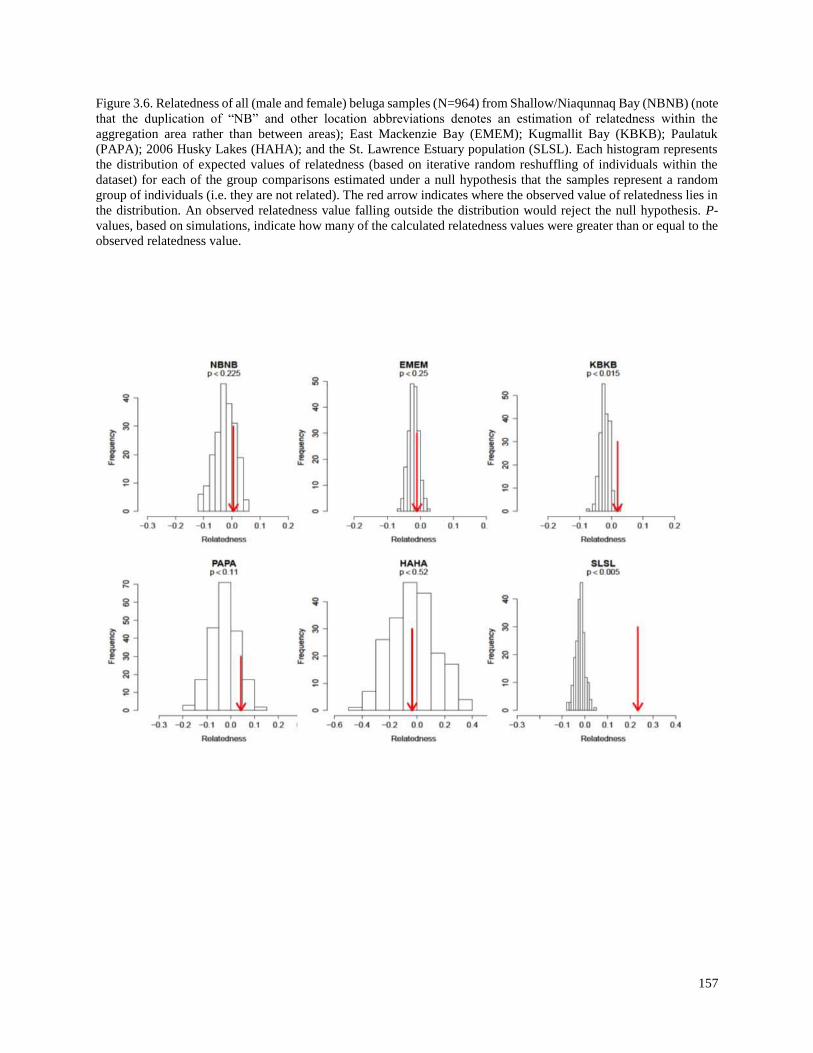
157
Figure 3.6. Relatedness of all (male and female) beluga samples (N=964) from Shallow/Niaqunnaq Bay (NBNB) (note
that the duplication of “NB” and other location abbreviations denotes an estimation of relatedness within the
aggregation area rather than between areas); East Mackenzie Bay (EMEM); Kugmallit Bay (KBKB); Paulatuk
(PAPA); 2006 Husky Lakes (HAHA); and the St. Lawrence Estuary population (SLSL). Each histogram represents
the distribution of expected values of relatedness (based on iterative random reshuffling of individuals within the
dataset) for each of the group comparisons estimated under a null hypothesis that the samples represent a random
group of individuals (i.e. they are not related). The red arrow indicates where the observed value of relatedness lies in
the distribution. An observed relatedness value falling outside the distribution would reject the null hypothesis. P-
values, based on simulations, indicate how many of the calculated relatedness values were greater than or equal to the
observed relatedness value.
158
Clustering analyses of weighted networks based on relatedness among individuals,
without any a priori groupings, echoed the results of the within-group relatedness comparisons.
The base network topologies themselves can be indicative of the population genetic structure
among the samples (Dyer and Nason 2004, Garroway et al. 2008). In our study, the
interconnected nodes (with each node being a beluga sample) represent the patterns of
relatedness among all of the individual whales with edge (the relationship between individuals)
length proportional to the level of relatedness. In most cases, the networks (even ‘trimmed’ to
minimize low relatedness connections, those at r < 0.35) were dense clouds of complex
connections without any obvious patterns. The only apparent genetic structure was found when
the St. Lawrence Estuary samples were included in the analyses, and two clusters are separated
in the network (Figure 3.7).
Clustering analyses of the network were employed to assign individual whales to discrete
clusters; however, the number of clusters varied depending on the clustering algorithm used, and
samples were not always grouped in the same clusters between methods. Analyses of male
samples from the Beaufort Sea sampling locations (Figure 3.8) resulted in two clusters using the
fast greedy method and three clusters using both the leading eigenvector and the spinglass
community methods.
Samples of females from the Beaufort Sea (Figure 3.9) formed more clusters than the
males: four clusters using the fast greedy method, three clusters using the leading eigenvector
method and four clusters with the spinglass community method. The leading eigenvector method
cluster sizes were 44:78:46, with the other two methods more evenly distributed: 55:45:21:47 for
the spinglass community method and 35:30:51:52 for the fast greedy method. As with the males,
samples did not assign to groups consistently, however, for the females, there was a more
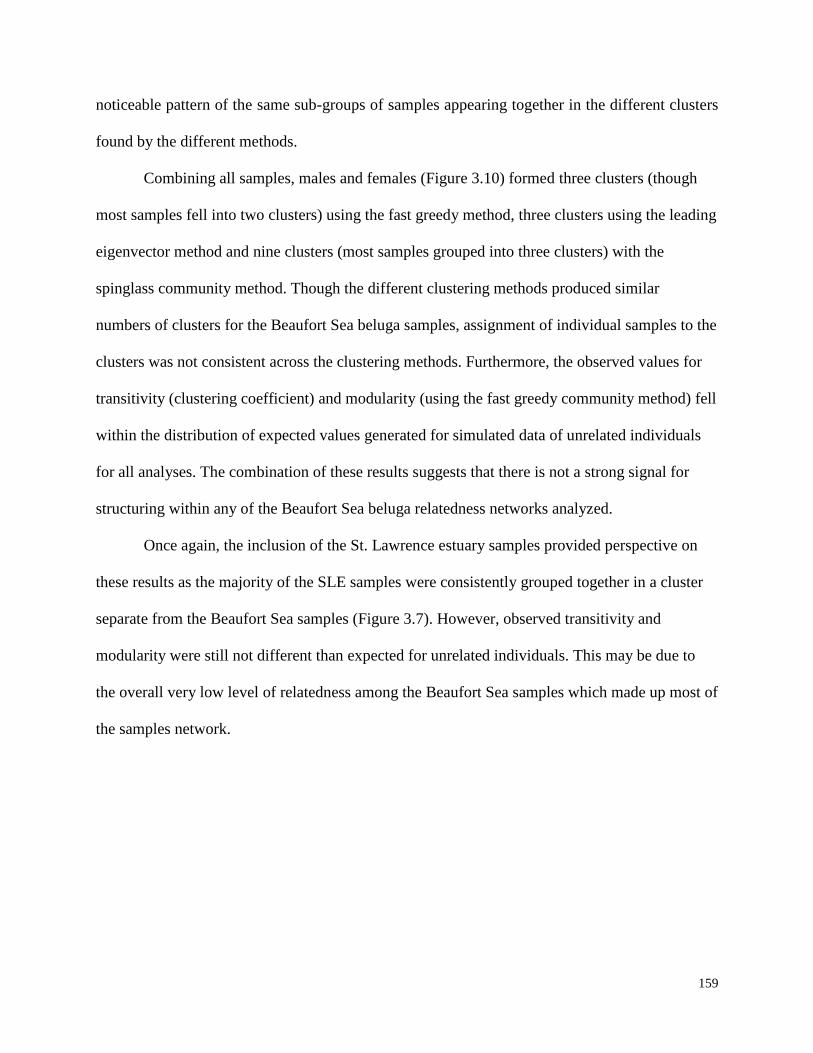
159
noticeable pattern of the same sub-groups of samples appearing together in the different clusters
found by the different methods.
Combining all samples, males and females (Figure 3.10) formed three clusters (though
most samples fell into two clusters) using the fast greedy method, three clusters using the leading
eigenvector method and nine clusters (most samples grouped into three clusters) with the
spinglass community method. Though the different clustering methods produced similar
numbers of clusters for the Beaufort Sea beluga samples, assignment of individual samples to the
clusters was not consistent across the clustering methods. Furthermore, the observed values for
transitivity (clustering coefficient) and modularity (using the fast greedy community method) fell
within the distribution of expected values generated for simulated data of unrelated individuals
for all analyses. The combination of these results suggests that there is not a strong signal for
structuring within any of the Beaufort Sea beluga relatedness networks analyzed.
Once again, the inclusion of the St. Lawrence estuary samples provided perspective on
these results as the majority of the SLE samples were consistently grouped together in a cluster
separate from the Beaufort Sea samples (Figure 3.7). However, observed transitivity and
modularity were still not different than expected for unrelated individuals. This may be due to
the overall very low level of relatedness among the Beaufort Sea samples which made up most of
the samples network.
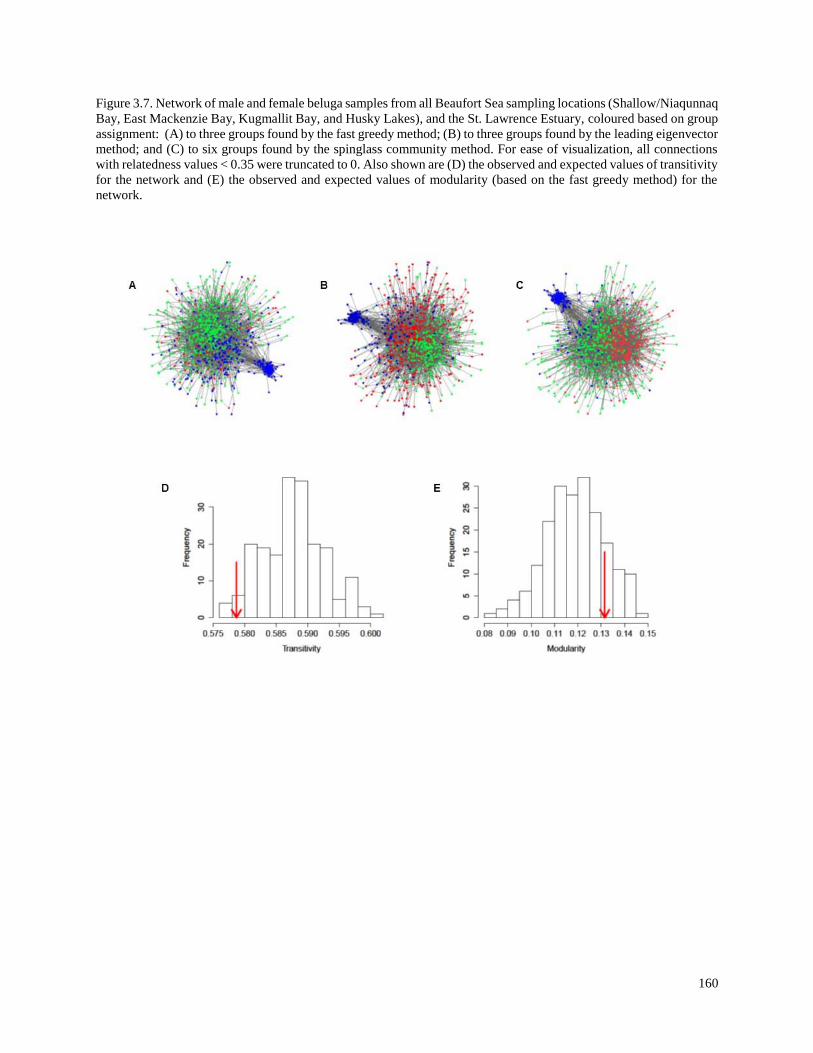
160
Figure 3.7. Network of male and female beluga samples from all Beaufort Sea sampling locations (Shallow/Niaqunnaq
Bay, East Mackenzie Bay, Kugmallit Bay, and Husky Lakes), and the St. Lawrence Estuary, coloured based on group
assignment: (A) to three groups found by the fast greedy method; (B) to three groups found by the leading eigenvector
method; and (C) to six groups found by the spinglass community method. For ease of visualization, all connections
with relatedness values < 0.35 were truncated to 0. Also shown are (D) the observed and expected values of transitivity
for the network and (E) the observed and expected values of modularity (based on the fast greedy method) for the
network.
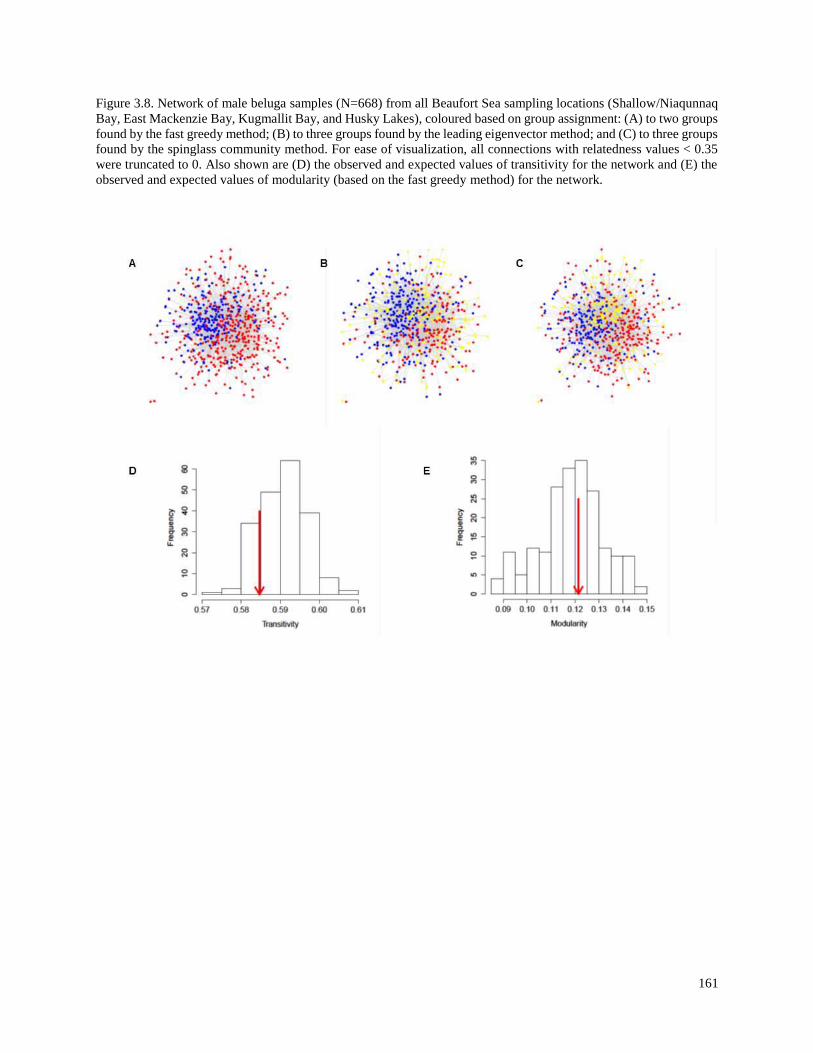
161
Figure 3.8. Network of male beluga samples (N=668) from all Beaufort Sea sampling locations (Shallow/Niaqunnaq
Bay, East Mackenzie Bay, Kugmallit Bay, and Husky Lakes), coloured based on group assignment: (A) to two groups
found by the fast greedy method; (B) to three groups found by the leading eigenvector method; and (C) to three groups
found by the spinglass community method. For ease of visualization, all connections with relatedness values < 0.35
were truncated to 0. Also shown are (D) the observed and expected values of transitivity for the network and (E) the
observed and expected values of modularity (based on the fast greedy method) for the network.
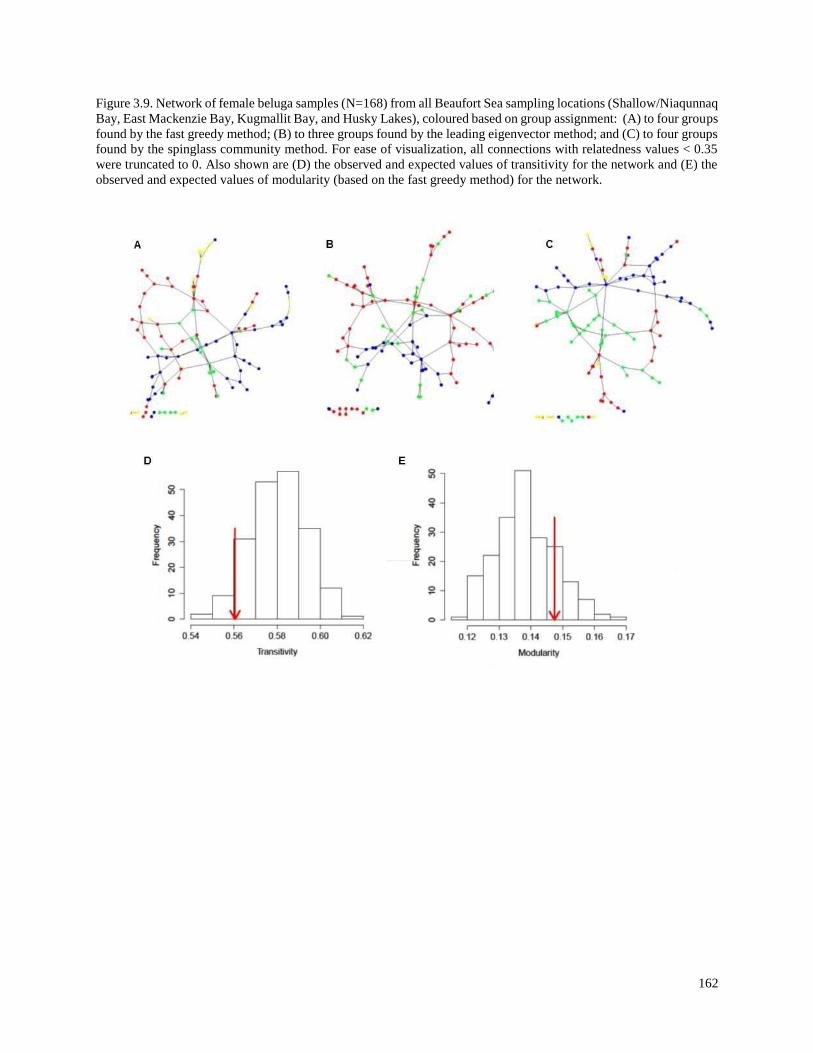
162
Figure 3.9. Network of female beluga samples (N=168) from all Beaufort Sea sampling locations (Shallow/Niaqunnaq
Bay, East Mackenzie Bay, Kugmallit Bay, and Husky Lakes), coloured based on group assignment: (A) to four groups
found by the fast greedy method; (B) to three groups found by the leading eigenvector method; and (C) to four groups
found by the spinglass community method. For ease of visualization, all connections with relatedness values < 0.35
were truncated to 0. Also shown are (D) the observed and expected values of transitivity for the network and (E) the
observed and expected values of modularity (based on the fast greedy method) for the network.
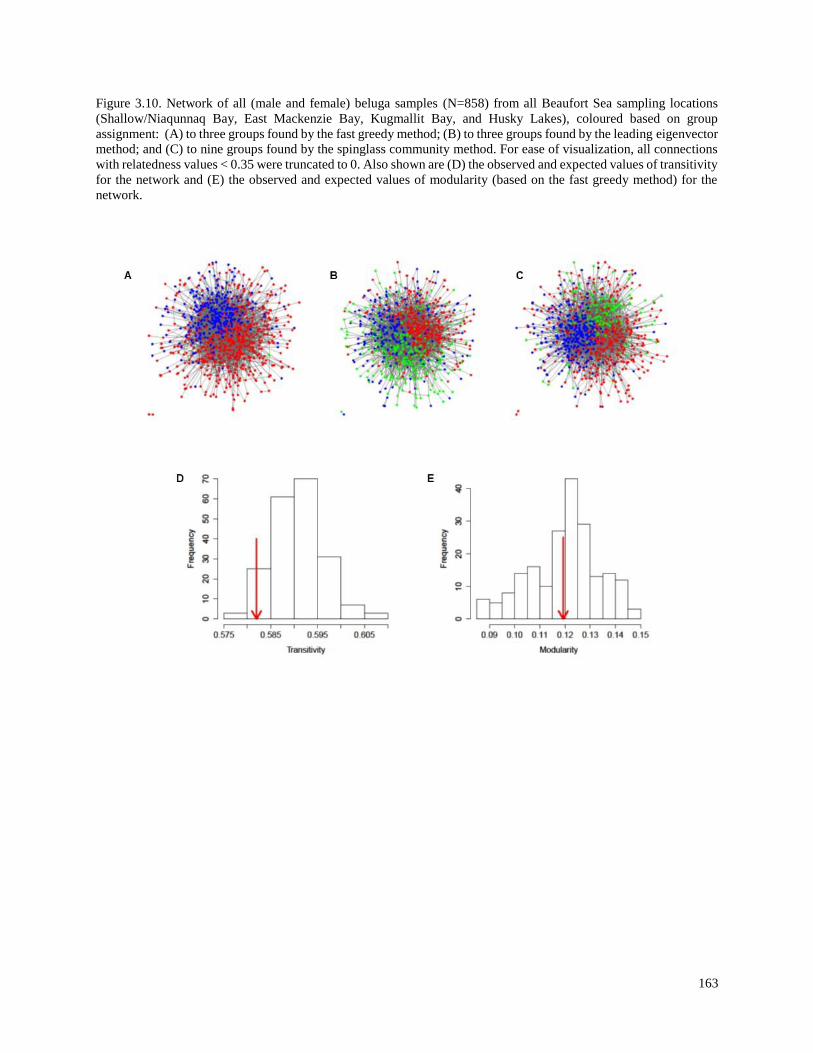
163
Figure 3.10. Network of all (male and female) beluga samples (N=858) from all Beaufort Sea sampling locations
(Shallow/Niaqunnaq Bay, East Mackenzie Bay, Kugmallit Bay, and Husky Lakes), coloured based on group
assignment: (A) to three groups found by the fast greedy method; (B) to three groups found by the leading eigenvector
method; and (C) to nine groups found by the spinglass community method. For ease of visualization, all connections
with relatedness values < 0.35 were truncated to 0. Also shown are (D) the observed and expected values of transitivity
for the network and (E) the observed and expected values of modularity (based on the fast greedy method) for the
network.
164
3.3.3 Analyses with STRUCTURE
Analysis using STRUCTURE with all samples from the Eastern Beaufort Sea (EBS) and
the St. Lawrence Estuary (SLE) identified the most likely number of clusters as two (based on
the Evanno method) (Figure 3.11). The majority of individuals (99%) were strongly assigned to
one of the clusters with assignment probability Q > 0.90. There were three samples from the SLE
population that had a strong assignment to the EBS cluster (green lines in the red area, Figure
3.11).
Further STRUCTURE analysis of Beaufort Sea samples only (as the strong
differentiation between the EBS samples and the SLE samples may overwhelm subtle structure
within EBS) did not support any number of K groups above one, with individual samples equally
assigned to all clusters. However, the model-based clustering approach used in STRUCTURE
does not perform well at low levels of genetic differentiation (Fst < 0.28) and also is not
appropriate for describing relatedness among clusters (Putman and Carbone 2014).
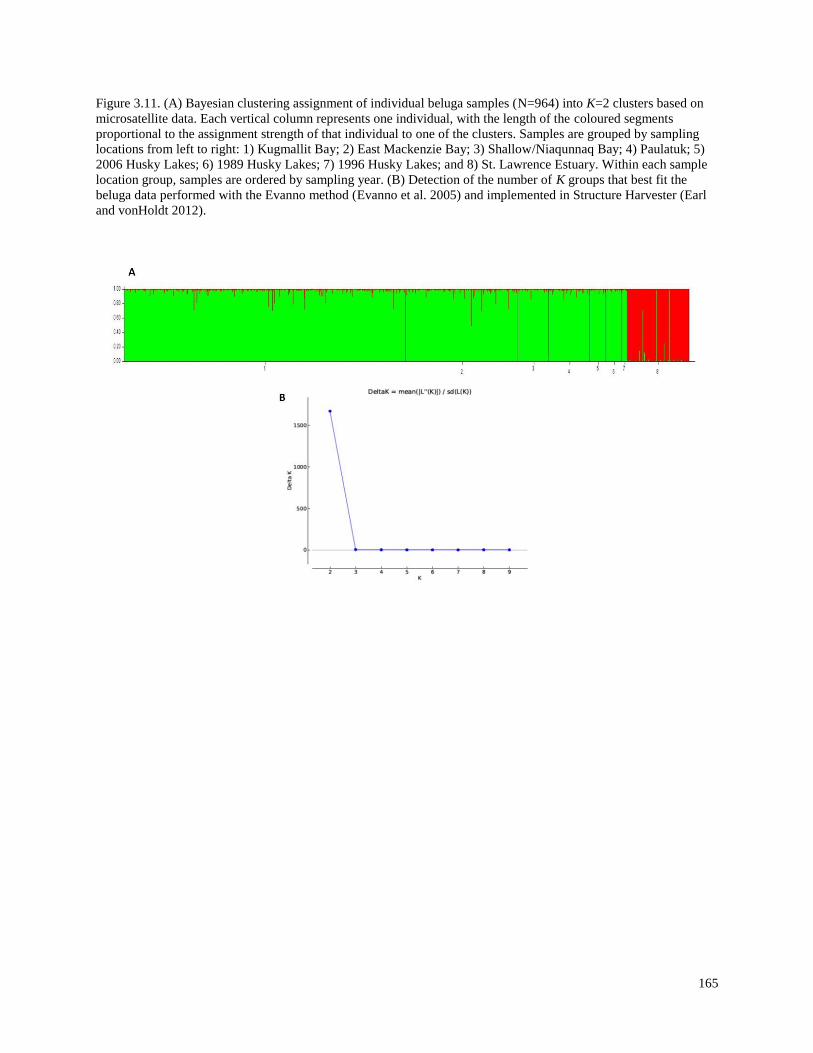
165
Figure 3.11. (A) Bayesian clustering assignment of individual beluga samples (N=964) into K=2 clusters based on
microsatellite data. Each vertical column represents one individual, with the length of the coloured segments
proportional to the assignment strength of that individual to one of the clusters. Samples are grouped by sampling
locations from left to right: 1) Kugmallit Bay; 2) East Mackenzie Bay; 3) Shallow/Niaqunnaq Bay; 4) Paulatuk; 5)
2006 Husky Lakes; 6) 1989 Husky Lakes; 7) 1996 Husky Lakes; and 8) St. Lawrence Estuary. Within each sample
location group, samples are ordered by sampling year. (B) Detection of the number of K groups that best fit the
beluga data performed with the Evanno method (Evanno et al. 2005) and implemented in Structure Harvester (Earl
and vonHoldt 2012).
166
3.3.4 Discriminant Analysis of Principal Components (DAPC)
DAPC is designed to be able to describe clusters of genetically related individuals
(Jombert et al. 2010) and may perform better than STRUCTURE for detection of population
subdivision in some cases. Using this method, nine clusters were identified for male beluga
samples from the Beaufort Sea locations and three clusters identified for the female samples
(Figure 3.12). For the male samples, there was some degree of overlap among the clusters, with
six of the nine identified clusters almost completely overlapping. However, at least one cluster
(cluster 3 in Figure 3.12A) was clearly separate from the other clusters, and two others (clusters
5 and 6 in Figure 3.12A) appeared distinct. Conversely, the DAPC analysis of female Beaufort
Sea samples resulted in clearly separated clusters (Figure 3.12B). These patterns suggest that
differences in kin relationships among males and females are present within the nearshore open-
water habitat of the EBS belugas, with females more strongly clustering in related groups.
However, for both males and females, the clusters are not formed by animals sampled from a
particular aggregation area, nor from a particular period.
DAPC analyses of males and females combined had a large degree of overlap among
clusters for the EBS samples, with and without the inclusion of the St. Lawrence Estuary
samples (Figure 3.13). The SLE samples, as expected, formed a distinct cluster separated from
the nine clusters observed for the EBS samples (Figure 3.13B). When considered on their own,
the Beaufort Sea samples formed eight overlapping clusters (Figure 3.13A) in a pattern similar to
that observed in the analyses that included the SLE samples
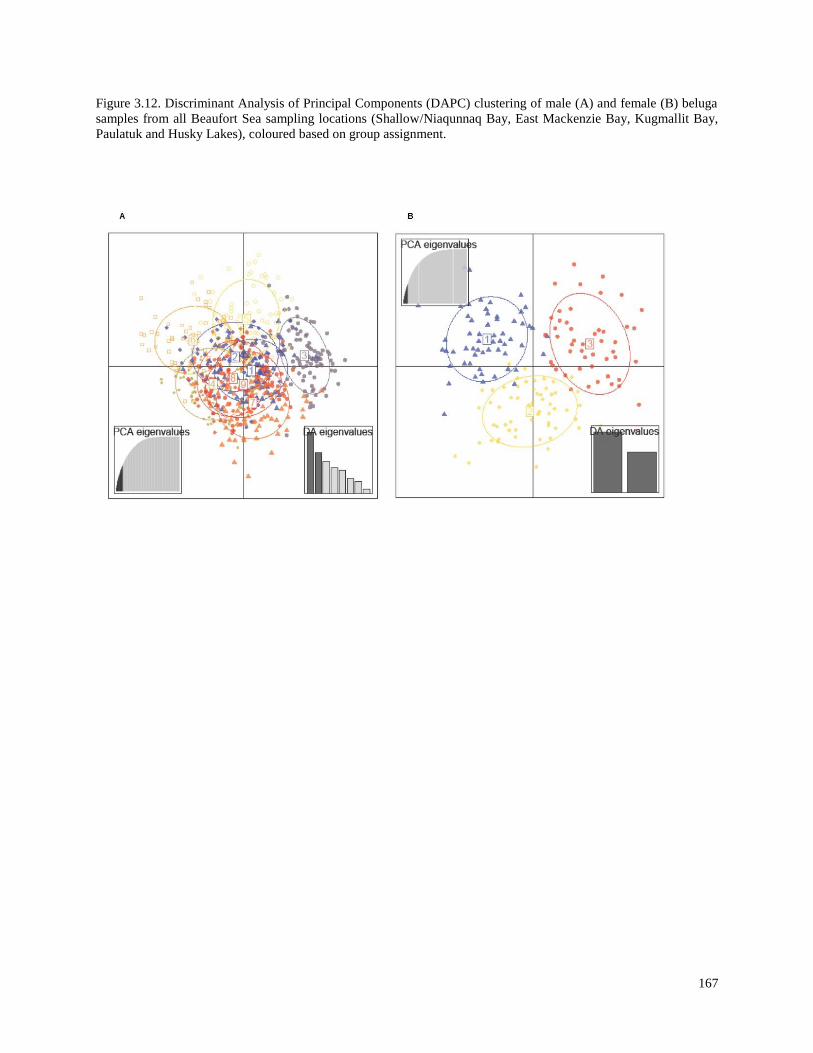
167
Figure 3.12. Discriminant Analysis of Principal Components (DAPC) clustering of male (A) and female (B) beluga
samples from all Beaufort Sea sampling locations (Shallow/Niaqunnaq Bay, East Mackenzie Bay, Kugmallit Bay,
Paulatuk and Husky Lakes), coloured based on group assignment.
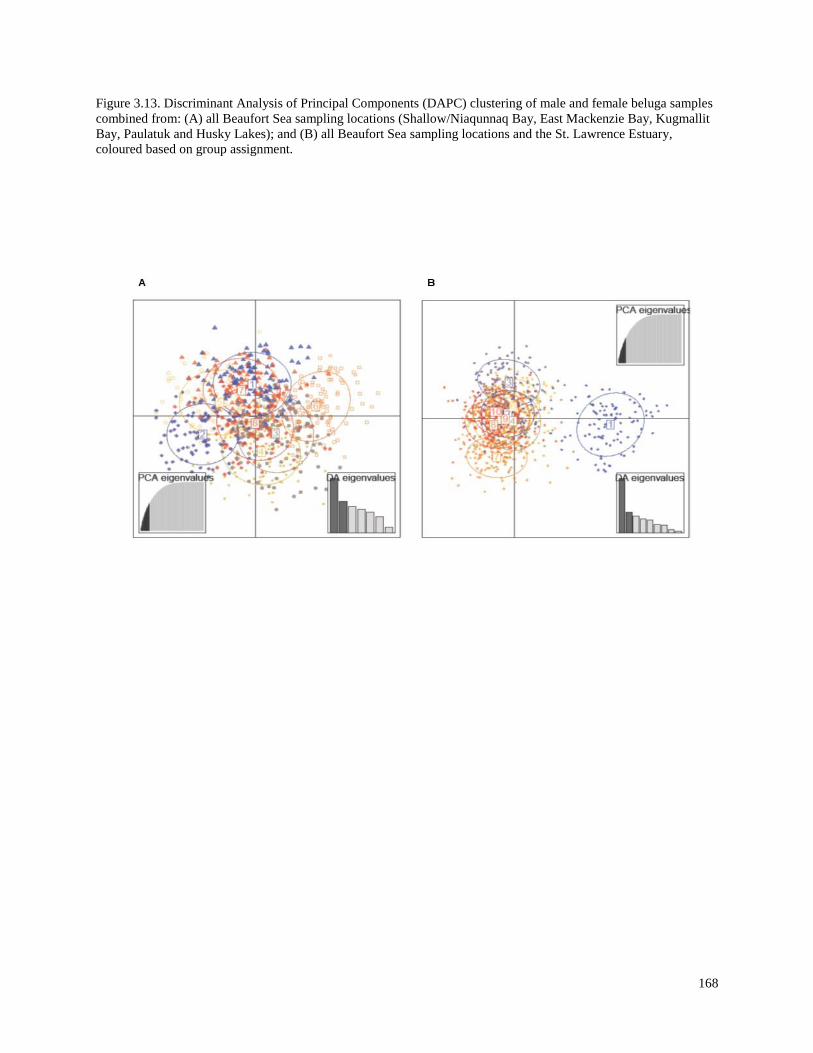
168
Figure 3.13. Discriminant Analysis of Principal Components (DAPC) clustering of male and female beluga samples
combined from: (A) all Beaufort Sea sampling locations (Shallow/Niaqunnaq Bay, East Mackenzie Bay, Kugmallit
Bay, Paulatuk and Husky Lakes); and (B) all Beaufort Sea sampling locations and the St. Lawrence Estuary,
coloured based on group assignment.
169
3.3.5 Mitochondrial DNA control region sequencing
A total of 1048 beluga samples were successfully sequenced over a 702bp portion of the
mtDNA control region. Duplicate samples were identified based on nuclear DNA genotypes, and
a total of ten samples were removed from the dataset. A further six individual samples were
removed due to poor sequence quality. Two different control samples were included during
every sequencing analysis run, resulting in each control sample having 10 replicates. Both
control samples were consistently scored as the same haplotype over all runs. A total of 122
samples were re-analyzed to estimate error rate and resulted in one sample mismatch in the
haplotype score (estimated error rate 0.8%).
The final sequence dataset included a total of 1032 individuals which revealed 37
variable positions and resulted in the identification of 55 unique haplotypes (Table 3.3). The
resolution of a larger portion of mtDNA control region sequence as compared to the data used in
Chapter 2 (702bp vs. 609bp) did not alter the number of haplotypes or diversity in the
Hendrickson Island sample set (which was the Beaufort Sea sample set used for the Canada-wide
comparisons in Table 2.2). Similarly, the larger portion of mtDNA control region sequence did
not increase the number of haplotypes observed in the St. Lawrence Estuary samples, although
the discard of a few poor quality samples slightly reduced the number of haplotypes and
haplotype diversity for this location.
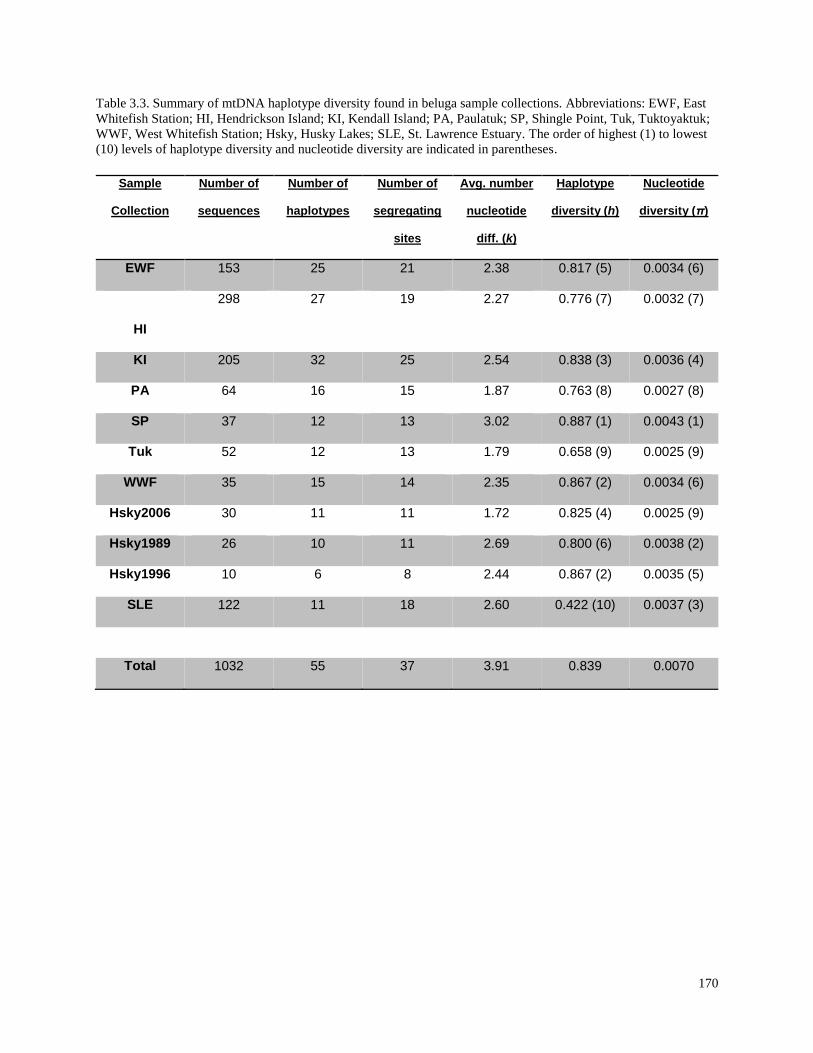
170
Table 3.3. Summary of mtDNA haplotype diversity found in beluga sample collections. Abbreviations: EWF, East
Whitefish Station; HI, Hendrickson Island; KI, Kendall Island; PA, Paulatuk; SP, Shingle Point, Tuk, Tuktoyaktuk;
WWF, West Whitefish Station; Hsky, Husky Lakes; SLE, St. Lawrence Estuary. The order of highest (1) to lowest
(10) levels of haplotype diversity and nucleotide diversity are indicated in parentheses.
Sample
Collection
Number of
sequences
Number of
haplotypes
Number of
segregating
sites
Avg. number
nucleotide
diff. (k)
Haplotype
diversity (h)
Nucleotide
diversity (π)
EWF 153 25 21 2.38 0.817 (5) 0.0034 (6)
HI
298 27 19 2.27 0.776 (7) 0.0032 (7)
KI 205 32 25 2.54 0.838 (3) 0.0036 (4)
PA 64 16 15 1.87 0.763 (8) 0.0027 (8)
SP 37 12 13 3.02 0.887 (1) 0.0043 (1)
Tuk 52 12 13 1.79 0.658 (9) 0.0025 (9)
WWF 35 15 14 2.35 0.867 (2) 0.0034 (6)
Hsky2006 30 11 11 1.72 0.825 (4) 0.0025 (9)
Hsky1989 26 10 11 2.69 0.800 (6) 0.0038 (2)
Hsky1996 10 6 8 2.44 0.867 (2) 0.0035 (5)
SLE 122 11 18 2.60 0.422 (10) 0.0037 (3)
Total 1032 55 37 3.91 0.839 0.0070
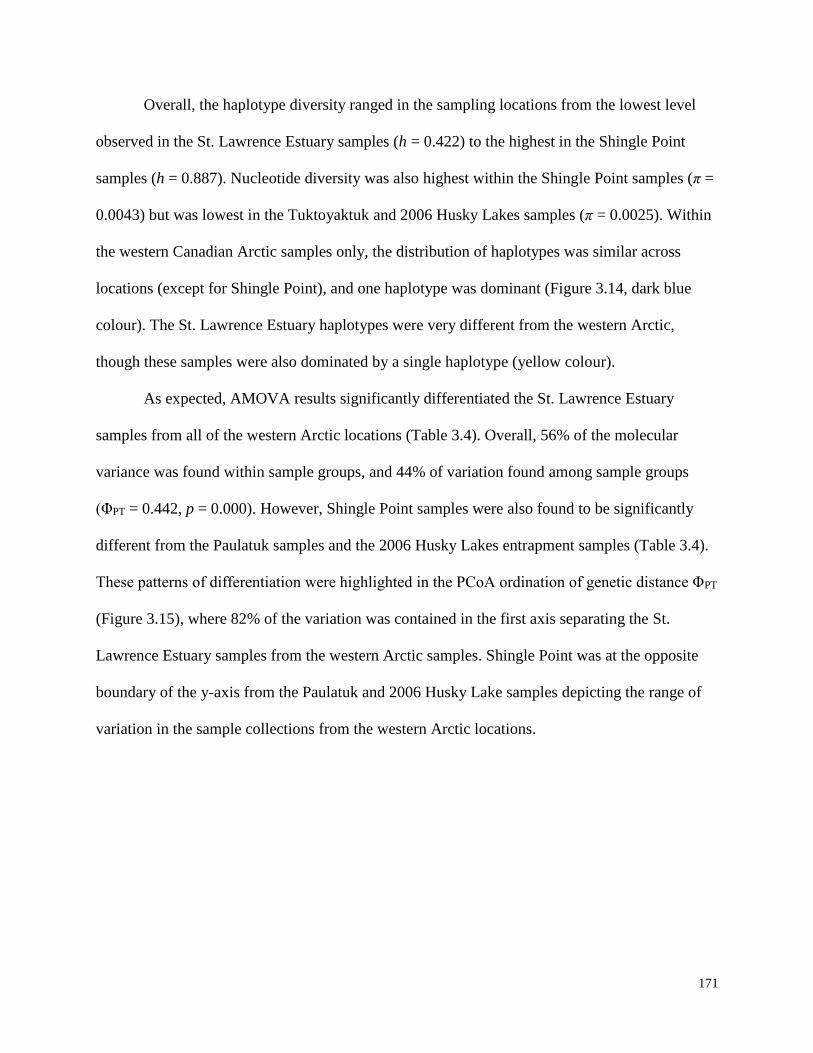
171
Overall, the haplotype diversity ranged in the sampling locations from the lowest level
observed in the St. Lawrence Estuary samples (h = 0.422) to the highest in the Shingle Point
samples (h = 0.887). Nucleotide diversity was also highest within the Shingle Point samples (π =
0.0043) but was lowest in the Tuktoyaktuk and 2006 Husky Lakes samples (π = 0.0025). Within
the western Canadian Arctic samples only, the distribution of haplotypes was similar across
locations (except for Shingle Point), and one haplotype was dominant (Figure 3.14, dark blue
colour). The St. Lawrence Estuary haplotypes were very different from the western Arctic,
though these samples were also dominated by a single haplotype (yellow colour).
As expected, AMOVA results significantly differentiated the St. Lawrence Estuary
samples from all of the western Arctic locations (Table 3.4). Overall, 56% of the molecular
variance was found within sample groups, and 44% of variation found among sample groups
(ΦPT = 0.442, p = 0.000). However, Shingle Point samples were also found to be significantly
different from the Paulatuk samples and the 2006 Husky Lakes entrapment samples (Table 3.4).
These patterns of differentiation were highlighted in the PCoA ordination of genetic distance ΦPT
(Figure 3.15), where 82% of the variation was contained in the first axis separating the St.
Lawrence Estuary samples from the western Arctic samples. Shingle Point was at the opposite
boundary of the y-axis from the Paulatuk and 2006 Husky Lake samples depicting the range of
variation in the sample collections from the western Arctic locations.
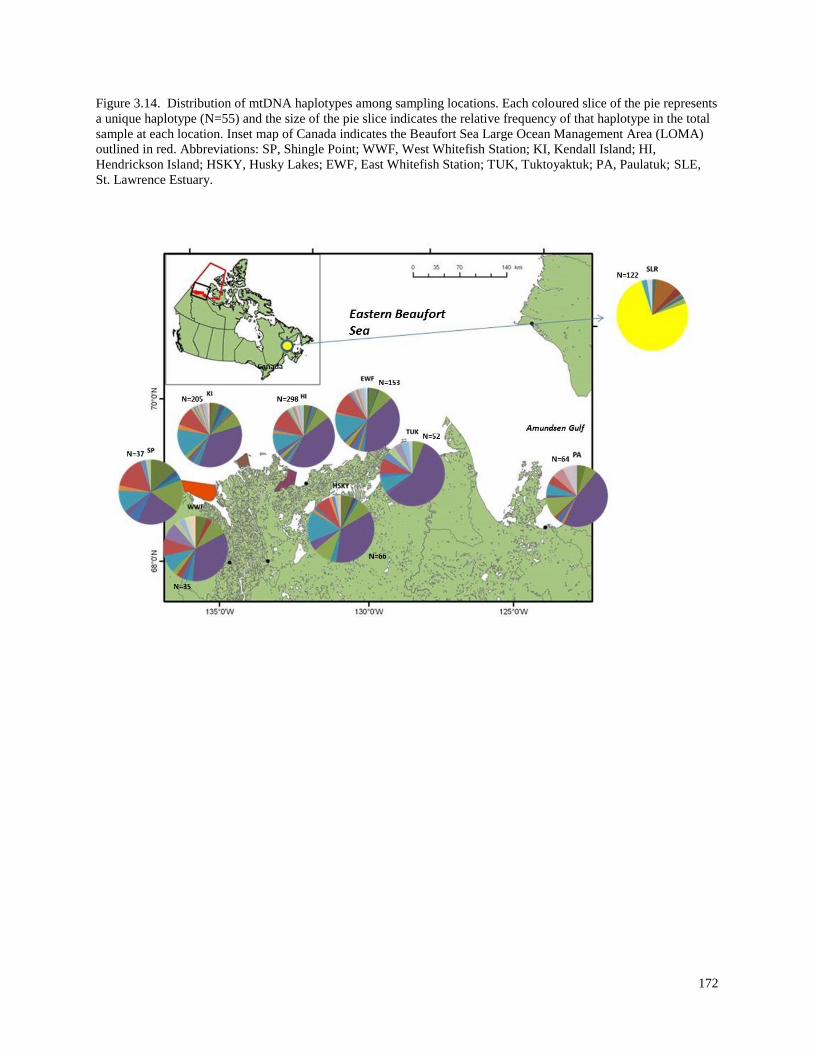
172
Figure 3.14. Distribution of mtDNA haplotypes among sampling locations. Each coloured slice of the pie represents
a unique haplotype (N=55) and the size of the pie slice indicates the relative frequency of that haplotype in the total
sample at each location. Inset map of Canada indicates the Beaufort Sea Large Ocean Management Area (LOMA)
outlined in red. Abbreviations: SP, Shingle Point; WWF, West Whitefish Station; KI, Kendall Island; HI,
Hendrickson Island; HSKY, Husky Lakes; EWF, East Whitefish Station; TUK, Tuktoyaktuk; PA, Paulatuk; SLE,
St. Lawrence Estuary.
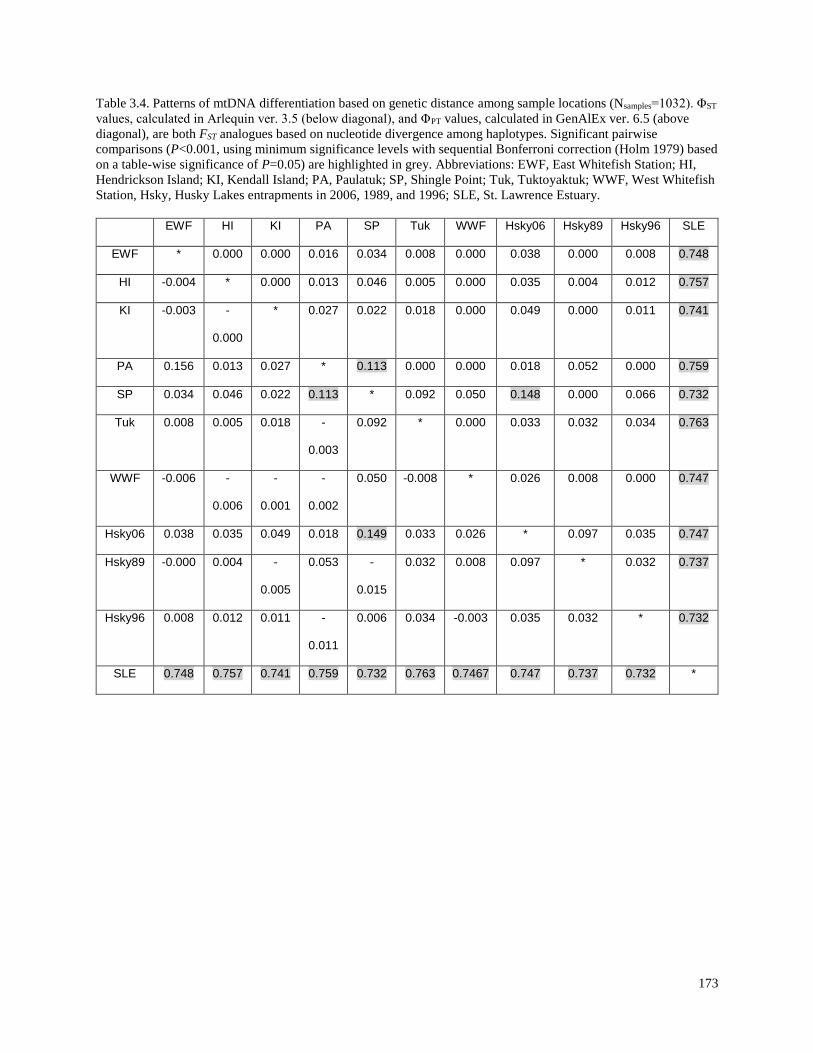
173
Table 3.4. Patterns of mtDNA differentiation based on genetic distance among sample locations (Nsamples=1032). ΦST
values, calculated in Arlequin ver. 3.5 (below diagonal), and ΦPT values, calculated in GenAlEx ver. 6.5 (above
diagonal), are both FST analogues based on nucleotide divergence among haplotypes. Significant pairwise
comparisons (P<0.001, using minimum significance levels with sequential Bonferroni correction (Holm 1979) based
on a table-wise significance of P=0.05) are highlighted in grey. Abbreviations: EWF, East Whitefish Station; HI,
Hendrickson Island; KI, Kendall Island; PA, Paulatuk; SP, Shingle Point; Tuk, Tuktoyaktuk; WWF, West Whitefish
Station, Hsky, Husky Lakes entrapments in 2006, 1989, and 1996; SLE, St. Lawrence Estuary.
EWF HI KI PA SP Tuk WWF Hsky06 Hsky89 Hsky96 SLE
EWF * 0.000 0.000 0.016 0.034 0.008 0.000 0.038 0.000 0.008 0.748
HI -0.004 * 0.000 0.013 0.046 0.005 0.000 0.035 0.004 0.012 0.757
KI -0.003 -
0.000
* 0.027 0.022 0.018 0.000 0.049 0.000 0.011 0.741
PA 0.156 0.013 0.027 * 0.113 0.000 0.000 0.018 0.052 0.000 0.759
SP 0.034 0.046 0.022 0.113 * 0.092 0.050 0.148 0.000 0.066 0.732
Tuk 0.008 0.005 0.018 -
0.003
0.092 * 0.000 0.033 0.032 0.034 0.763
WWF -0.006 -
0.006
-
0.001
-
0.002
0.050 -0.008 * 0.026 0.008 0.000 0.747
Hsky06 0.038 0.035 0.049 0.018 0.149 0.033 0.026 * 0.097 0.035 0.747
Hsky89 -0.000 0.004 -
0.005
0.053 -
0.015
0.032 0.008 0.097 * 0.032 0.737
Hsky96 0.008 0.012 0.011 -
0.011
0.006 0.034 -0.003 0.035 0.032 * 0.732
SLE 0.748 0.757 0.741 0.759 0.732 0.763 0.7467 0.747 0.737 0.732 *
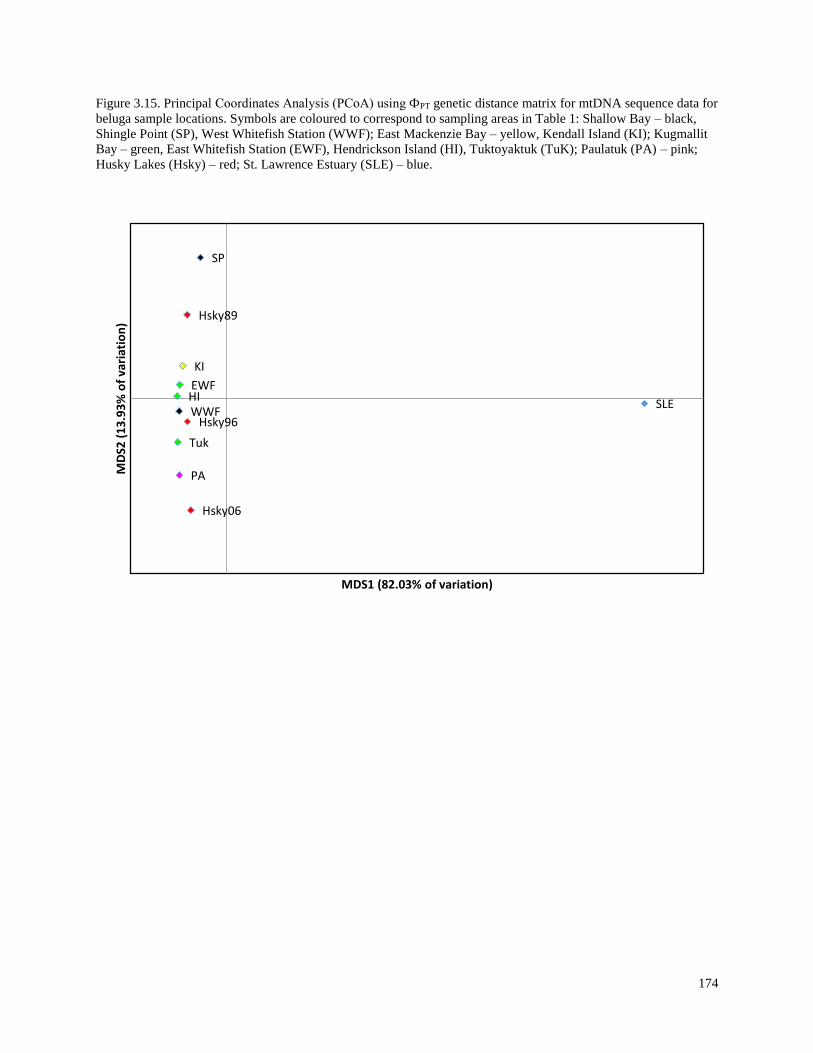
174
Figure 3.15. Principal Coordinates Analysis (PCoA) using ФPT genetic distance matrix for mtDNA sequence data for
beluga sample locations. Symbols are coloured to correspond to sampling areas in Table 1: Shallow Bay – black,
Shingle Point (SP), West Whitefish Station (WWF); East Mackenzie Bay – yellow, Kendall Island (KI); Kugmallit
Bay – green, East Whitefish Station (EWF), Hendrickson Island (HI), Tuktoyaktuk (TuK); Paulatuk (PA) – pink;
Husky Lakes (Hsky) – red; St. Lawrence Estuary (SLE) – blue.
EWFHI
KI
PA
SP
Tuk
WWF
Hsky06
Hsky89
Hsky96
SLE
MD
S2 (
13
.93
% o
f va
riat
ion
)
MDS1 (82.03% of variation)
175
Using a Benjamini-Hochberg FDR correction, Shingle Point was additionally
differentiated from Hendrickson Island and Tutoyaktuk. Kendall Island was also differentiated
from both the Paulatuk and 2006 Husky Lakes samples, and Husky Lakes 1989 was
differentiated from the 2006 Husky Lakes samples. These new results confirm the trends
revealed by the PCoA ordination of the dataFurther analysis of temporal variation within sample
locations also revealed trends in the data as illustrated by PCoA ordination of the samples
grouped by decade at each of the locations (Figure 3.16). AMOVA results based on these finer
scale groups revealed almost the same overall pattern of molecular variance as the previous
analysis (57% variation within sample groups, 43% variation among sample groups, ΦPT =
0.442, p = 0.000); however, results of individual pairwise differences also indicated a trend of
change over time from the 1980s to the 2000s (Table 3.5). The majority of the significant
differentiation occurred between the 1980s and the 2000s, especially for Husky Lakes, Kendall
Island and West Whitefish Station. However, it is important to note that the number of samples
from the 1980s that were analyzed was small compared to other decades, especially for West
Whitefish Station (N=3) (Table 3.6).
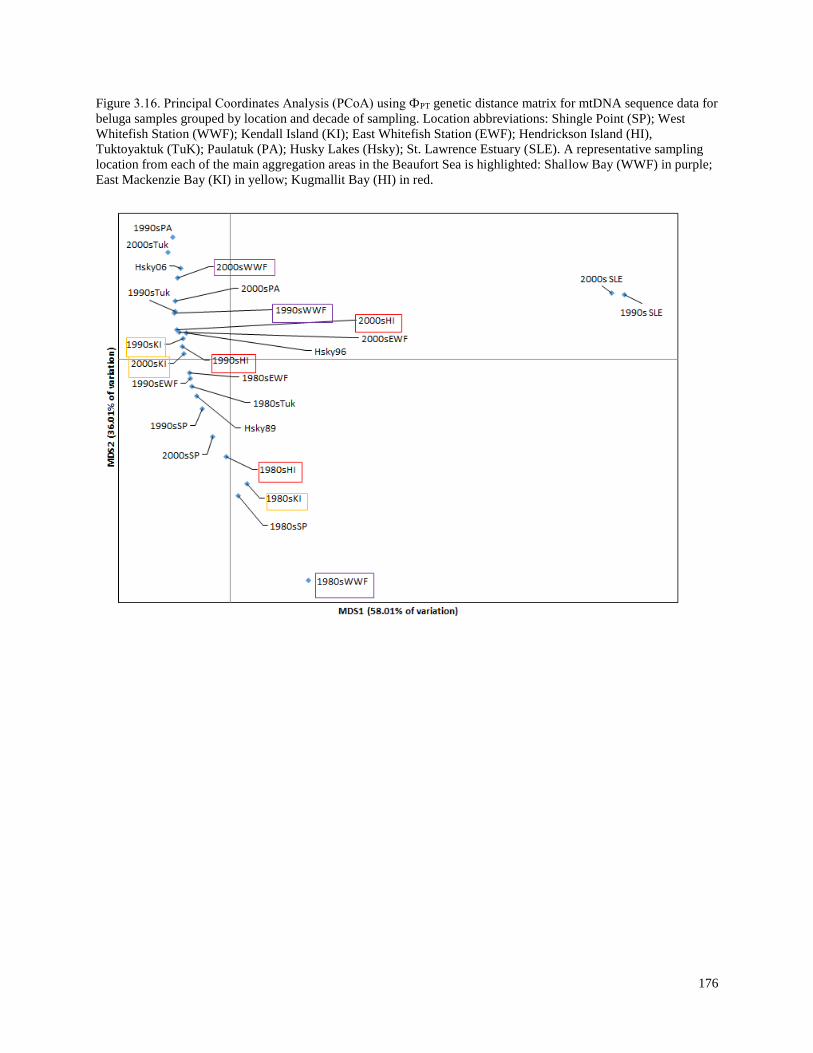
176
Figure 3.16. Principal Coordinates Analysis (PCoA) using ФPT genetic distance matrix for mtDNA sequence data for
beluga samples grouped by location and decade of sampling. Location abbreviations: Shingle Point (SP); West
Whitefish Station (WWF); Kendall Island (KI); East Whitefish Station (EWF); Hendrickson Island (HI),
Tuktoyaktuk (TuK); Paulatuk (PA); Husky Lakes (Hsky); St. Lawrence Estuary (SLE). A representative sampling
location from each of the main aggregation areas in the Beaufort Sea is highlighted: Shallow Bay (WWF) in purple;
East Mackenzie Bay (KI) in yellow; Kugmallit Bay (HI) in red.
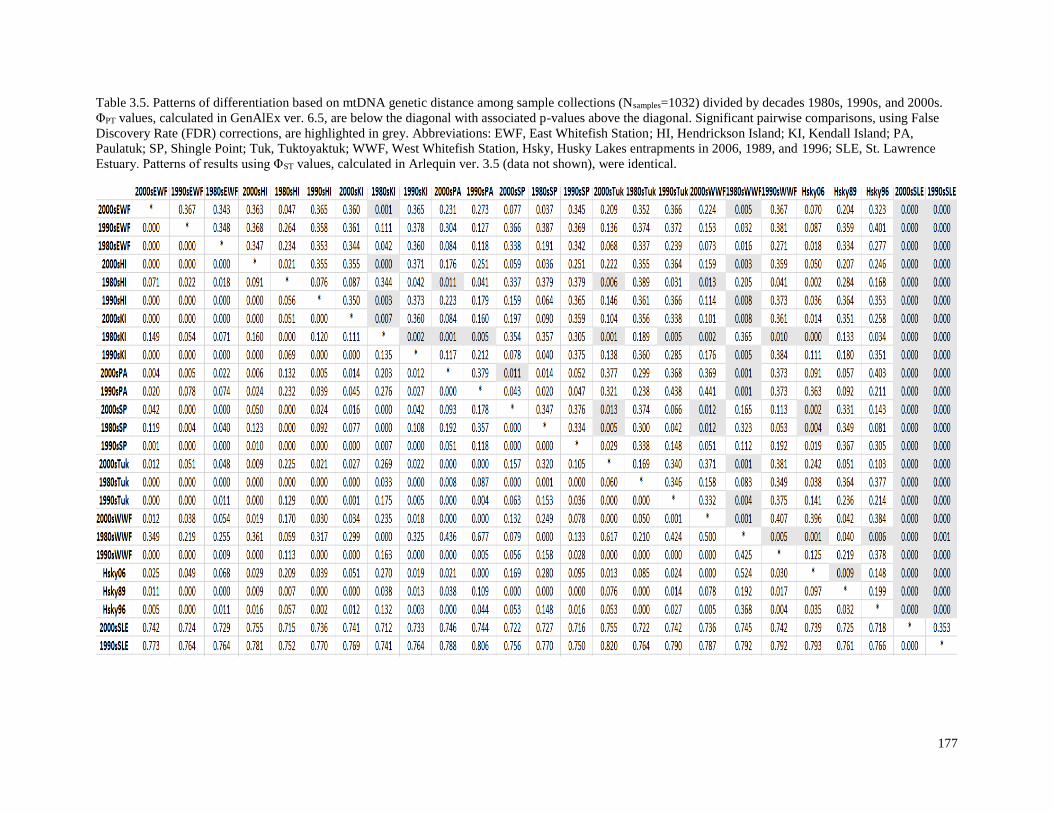
177
Table 3.5. Patterns of differentiation based on mtDNA genetic distance among sample collections (Nsamples=1032) divided by decades 1980s, 1990s, and 2000s.
ΦPT values, calculated in GenAlEx ver. 6.5, are below the diagonal with associated p-values above the diagonal. Significant pairwise comparisons, using False
Discovery Rate (FDR) corrections, are highlighted in grey. Abbreviations: EWF, East Whitefish Station; HI, Hendrickson Island; KI, Kendall Island; PA,
Paulatuk; SP, Shingle Point; Tuk, Tuktoyaktuk; WWF, West Whitefish Station, Hsky, Husky Lakes entrapments in 2006, 1989, and 1996; SLE, St. Lawrence
Estuary. Patterns of results using ΦST values, calculated in Arlequin ver. 3.5 (data not shown), were identical.
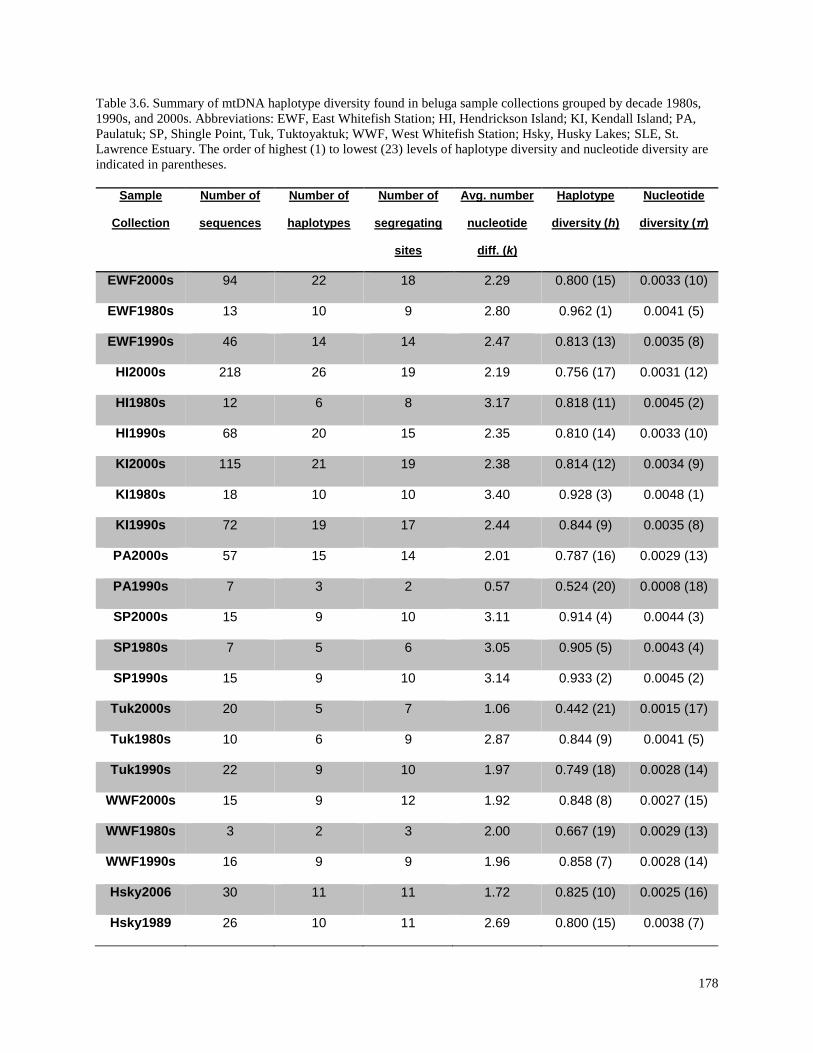
178
Table 3.6. Summary of mtDNA haplotype diversity found in beluga sample collections grouped by decade 1980s,
1990s, and 2000s. Abbreviations: EWF, East Whitefish Station; HI, Hendrickson Island; KI, Kendall Island; PA,
Paulatuk; SP, Shingle Point, Tuk, Tuktoyaktuk; WWF, West Whitefish Station; Hsky, Husky Lakes; SLE, St.
Lawrence Estuary. The order of highest (1) to lowest (23) levels of haplotype diversity and nucleotide diversity are
indicated in parentheses.
Sample
Collection
Number of
sequences
Number of
haplotypes
Number of
segregating
sites
Avg. number
nucleotide
diff. (k)
Haplotype
diversity (h)
Nucleotide
diversity (π)
EWF2000s 94 22 18 2.29 0.800 (15) 0.0033 (10)
EWF1980s 13 10 9 2.80 0.962 (1) 0.0041 (5)
EWF1990s 46 14 14 2.47 0.813 (13) 0.0035 (8)
HI2000s 218 26 19 2.19 0.756 (17) 0.0031 (12)
HI1980s 12 6 8 3.17 0.818 (11) 0.0045 (2)
HI1990s 68 20 15 2.35 0.810 (14) 0.0033 (10)
KI2000s 115 21 19 2.38 0.814 (12) 0.0034 (9)
KI1980s 18 10 10 3.40 0.928 (3) 0.0048 (1)
KI1990s 72 19 17 2.44 0.844 (9) 0.0035 (8)
PA2000s 57 15 14 2.01 0.787 (16) 0.0029 (13)
PA1990s 7 3 2 0.57 0.524 (20) 0.0008 (18)
SP2000s 15 9 10 3.11 0.914 (4) 0.0044 (3)
SP1980s 7 5 6 3.05 0.905 (5) 0.0043 (4)
SP1990s 15 9 10 3.14 0.933 (2) 0.0045 (2)
Tuk2000s 20 5 7 1.06 0.442 (21) 0.0015 (17)
Tuk1980s 10 6 9 2.87 0.844 (9) 0.0041 (5)
Tuk1990s 22 9 10 1.97 0.749 (18) 0.0028 (14)
WWF2000s 15 9 12 1.92 0.848 (8) 0.0027 (15)
WWF1980s 3 2 3 2.00 0.667 (19) 0.0029 (13)
WWF1990s 16 9 9 1.96 0.858 (7) 0.0028 (14)
Hsky2006 30 11 11 1.72 0.825 (10) 0.0025 (16)
Hsky1989 26 10 11 2.69 0.800 (15) 0.0038 (7)
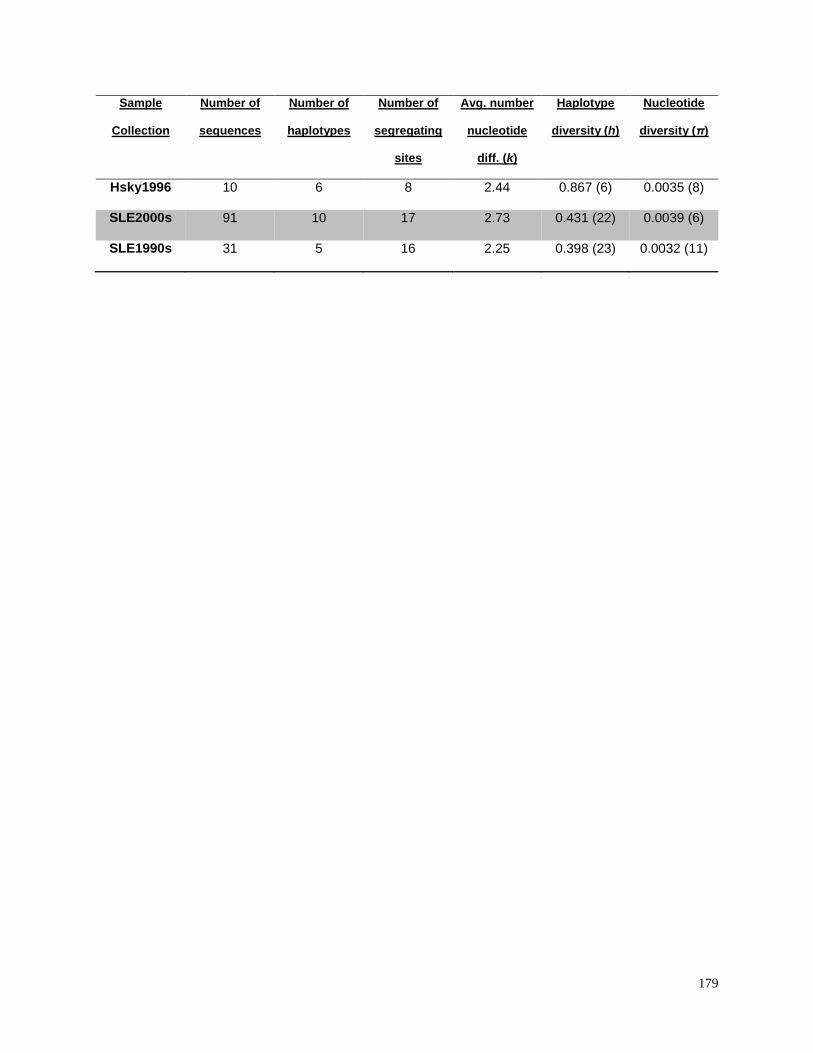
179
Sample
Collection
Number of
sequences
Number of
haplotypes
Number of
segregating
sites
Avg. number
nucleotide
diff. (k)
Haplotype
diversity (h)
Nucleotide
diversity (π)
Hsky1996 10 6 8 2.44 0.867 (6) 0.0035 (8)
SLE2000s 91 10 17 2.73 0.431 (22) 0.0039 (6)
SLE1990s 31 5 16 2.25 0.398 (23) 0.0032 (11)
180
3.4 Discussion
Testing for patterns of relatedness among whales sampled from different harvest areas
has the potential to shed light on the presence or absence of kin structure among belugas within
stocks and populations. In the present study, however, there was no evidence of fine-scale kin
structure in beluga whales in the Beaufort Sea related to nearshore aggregation or harvesting
location. Given this result, harvesting practices that have been used in the region over the last
several decades do not appear to be impacting particular kin-groups or distinct genetic units
associated with particular geographic locations.
This contrasts with belugas studied in the Hudson Bay population of eastern Canada
where close kin, including relatives other than parents and siblings, were caught in harvests of
animals travelling together during migration (Colbeck et al. 2013). These associations of related
individuals formed among belugas that aggregated in space and time during the migratory
period; however, the kin groups (other than mothers and offspring) dissociated once animals
reached the summering areas. However, it has been suggested that kin structure may vary
between populations due to differences in local animal densities and individual space-use
strategies (Zeyl et al. 2009). Indeed, social systems of delphinids have been shown to vary within
species as a result of individual responses to variation in environments and resources (Gowans et
al. 2008). The summer distribution of belugas in the Eastern Beaufort Sea and the Amundsen
Gulf covers a much larger geographic area than the summer distribution of individual stocks of
whales in Hudson Bay (Reeves et al. 2014), so alternate space use strategies and social structure
may be possible.
Within the Beaufort Sea area, samples taken from belugas harvested in aggregation
locations were not more related than expected for individuals grouped at random. There are
181
several possible reasons for this. First, the harvesting practices in the Beaufort Sea area select for
adult males and this bias is clearly reflected in the samples available for genetic analyses. Unlike
the study in Hudson Bay/Hudson Strait (Colbeck et al. 2013, see Supplementary Data), females,
and especially females with calves, are not proportionately represented in the Beaufort Sea
samples. The Beaufort Sea beluga harvest is strongly biased towards males (4:1 males:females),
as opposed to the more equal ratio of males to females in samples collected from Hudson
Strait/Hudson Bay harvests. Thus, associations between mother and calves, as found in Hudson
Bay summering areas (Colbeck et al. 2013), would be difficult to detect in the type of samples
available for this study. Second, with the exception of Paulatuk and the Husky Lake ice
entrapments, pods, or groups of whales, are not generally harvested at one time. This also limited
genetic analyses of samples of whales known to be associated in space and time. Third, despite
the large geographic distribution of whales in the Beaufort Sea and surrounding areas,
coordinated movements among kin, such as during migration (Colbeck et al. 2013), may not be
happening in this area or not represented by the samples available for analyses. However, the
objectives of this study were focussed on the kin-relationships in beluga aggregation areas where
the largest effort for harvesting of EBS belugas occurs. Investigations of kin-relationships during
EBS beluga migration and larger population questions will require further research with different
sample collection timing and strategies such as biopsy sampling of free-ranging whales.
The apparent lack of kin structure based on geographically aggregated groups most likely
reflects the beluga movement patterns revealed by data from satellite tagged whales. Male
belugas left the Mackenzie Estuary in the first half of July and travelled north to the permanent
pack ice or east towards the Amundsen Gulf (Richard et al. 2001b). Female belugas were also
shown to leave the Mackenzie Delta to make short-term trips to the Amundsen Gulf and back to
182
nearshore or offshore waters of the delta. Even though the speeds at which the whales moved
were relatively slow (less than 3 km/hr), which corresponded to potential movements of about 24
km/day (Richard et al. 2001b), our analyses indicate that belugas do not even cluster in short-
term groups of related individuals in aggregations areas. Evidence of this would have been
detected in the analysis of relatedness in whales harvested in the same area on the same day.
Thus, our results suggest that patterns of movements among adult whales in the coastal regions
are not constrained by kinship and correspond to general movements of unrelated animals. This
would indicate that sociality based on kinship among adults is not a major factor influencing
spatial structure on a fine scale for EBS belugas during the period when samples were obtained.
This has also been observed in coastal river otters (Lontra canadensis), for example, where
sociality seems to arise from cooperative group foraging on high-quality prey resources with no
kin associations within these groups (Blundell et al. 2004). Similarly, studies involving giraffes
have also shown that animals that are not close kin may associate with each other solely on the
basis of similar habitat preferences (Carter et al. 2013). Another type of sociality, alliance
formation for the protection of calves, has also been proposed for EBS belugas (Loseto et al.
2006). It has been suggested that association of close kin could facilitate the cooperative
protection of young in delphinids (Gaspari et al. 2007). Again, our results provided no evidence
that such alliances are formed among related individuals. The lack of juveniles in our sample (or
samples more representative of the population as a whole) may obscure the involvement of kin in
this type of social behaviour (Loseto et al. 2006), but our results do provide an additional
perspective to this idea.
While relatedness in EBS belugas was not found using a priori divisions of the samples,
some clusters of genetically-related individuals were detected within the full set of samples,
183
particularly for females. The lack of spatial or temporal patterns for the clusters indicates a lack
of fine-scale kin structure but may suggest that for the nearshore portion of the stock overall,
female EBS belugas form moderate bonds with other female kin and there is female philopatry to
the overall Eastern Beaufort Sea area. This would be a similar sociogenetic pattern to other
delphinids that live in fission-fusion societies (Möller 2011). The seasonal philopatry of related
groups of female belugas may have benefits such as the maintenance of detailed knowledge of
food distribution, avoidance of predation, and support from matrilineal kin for breeding success
(Clutton-Brock and Lukas 2012).
The belugas sampled from ice-entrapments in the Husky Lakes are from a different
habitat, different period and are a more natural group sample from the EBS beluga stock than the
harvest samples. Also, the timing of the entrapments would correspond to the time when animals
would be in migratory groups starting their westward fall migration back to wintering areas
(Richard et al. 2001b). In Hudson Bay belugas, groups of whales migrating together were found
to be networks of related individuals (Colbeck et al. 2013). However, our results based on
entrapment samples were not different from the July harvest samples. For each of the entrapment
years sampled, there was no evidence of relatedness nor any clusters in the network analyses that
corresponded to the individual entrapment events. These results were unexpected. It seemed
likely that the attraction of this area for belugas revolve around unique foraging opportunities in
that the Husky Lakes are rich in many fish species (e.g. lake trout, whitefish, cod) (Inuvialuit
Land Administration 2011, Kocho-Schellenberg 2010). Though the benefits of such a feeding
area are high, the risk of ice entrapment is also high. However, avoidance of ice entrapments has
been suggested to be learned from older, experienced whales (Wade et al. 2012) which might
mitigate the risk in this situation. This does not seem to be true for the belugas sampled from the
184
Husky Lakes. It is possible that the lack of complete sampling of all individuals involved in the
entrapment may have biased our analyses of group relatedness. However, the analyses of average
relatedness in mass-stranded pods of common dolphins (Delphinus delphis) also did not reveal
closer kin relationships than samples taken from a random collection of animals from different
groups (Viricel et al. 2008). This finding was extrapolated to overall common dolphin
populations, and the authors concluded that social organization in this delphinid species is not
based on kinship. The results of our Husky Lakes beluga analyses, together with the analyses of
harvested beluga samples, support a similar view of Eastern Beaufort Sea belugas. Social
structure, at least among adult whales in the stock, is most likely rooted in habitat selection and
foraging opportunities (an additional hypothesis suggested by Loseto et al. 2006) without the
added influence of kin-biased association. A similar result was found with the analyses of
narwhals (Monodon monoceros) sampled from an ice entrapment in the eastern Canadian Arctic
(Watt et al. 2015). Among the portion of samples collected, genetic relatedness and fatty acid
signatures were not correlated, suggesting that foraging and kin-based social groups are not
linked for narwhal.
This study was the first to apply measures of relatedness, network analyses, and Bayesian
methods to detect distinct genetic clusters within the EBS beluga stock. The use of beluga
samples from the St. Lawrence Estuary as a contrasting population revealed the types of patterns
that could be detected using these methods from a small, isolated beluga population.
Furthermore, the STUCTURE analysis revealed the ability to detect individual outliers in the
data (Figure 3.11). Three individual beluga samples from the SLE population appeared to have a
strong assignment to the EBS population.These are likely samples of belugas that “strayed” into
the St. Lawrence Estuary from an eastern Canadian beluga population, probably from the
185
overwintering area in Baffin Bay. Incidents of strays (usually young adults) and observations of
extralimital belugas are not uncommon (Brown Gladden et al. 1997, Brown Gladden et al. 1999,
O’Corry-Crowe et al. 2015), but no apparent strays were detected in the EBS samples.
However, the patterns of mitochondrial DNA haplotype distributions do suggest a
matrilineal driven philopatry for EBS belugas (Brown-Gladden et al. 1999), especially to the
core summer aggregation areas within the Mackenzie Delta where large numbers of animals are
seasonally predictable and are most regularly harvested (i.e. Kendall Island, Hendrickson Island,
East Whitefish Station, Tuktoyaktuk). The mtDNA haplotypes and frequencies in these areas
were not significantly different across hunting camp locations. However, in the areas near the
edges of the nearshore range of the stock (Shingle Point, Paulatuk and Husky Lakes), variability
in haplotype frequencies was observed that resulted in some significant differences in pairwise
genetic comparisons involving samples from these locations. This variability could be linked to
changes in group structure as compared to core nearshore areas around the Mackenzie Delta area
that may be consistent with fission-fusion dynamics related to the distribution and availability of
prey and beluga feeding behaviour (Lehmann et al. 2006, Dunbar et al. 2009, Grove 2011).
Studies of migrating beluga whales found that feeding behaviour in the nearshore areas was more
common during migration than in summer aggregations where behaviours other than feeding
(e.g. moulting, calving, protections from predation/disturbance) may be more important
(Quakenbush et al. 2015). This matches the observation that EBS belugas do not appear to feed
extensively in the core aggregation areas near the Mackenzie River estuary, but they are known
to feed in east Amundsen Gulf (nearer to Paulatuk) and during migration (Harwood et al. 2014),
as well as likely within the Arctic Archipelago as inferred from deep-diving males in Vicount-
Melville Sound (Richard et al. 2001b). The timing of sampling for the Husky Lakes (early winter
186
entrapments) and Shingle Point (late summer/early fall) would coincide with beluga groups that
have formed during the start of migrations out of the eastern Beaufort Sea areas towards the
wintering grounds to the west (Richard et al. 2001b).
Whether or not there is a matrilineal social structuring that is occurring as groups form to
feed and/or migrate in the EBS beluga stock is hard to determine. It is challenging to collect
detailed data about association patterns among individuals for animals that cannot be easily and
consistently observed over time (Whitehead 1997). Belugas, which spend so much time out of
sight under water and ice, move rapidly and over long distances, and gather in large groups
during times that they are accessible, definitely fall into this category. Association data, in
combination with genetic data, would be needed to clarify the role of social structure in the
fission-fusion dynamics of EBS belugas.
The results of this study do provide the first individual-based socio-genetic information
about the Eastern Beaufort Sea beluga stock and add to our knowledge about patterns of social
structure revealed by satellite tracking, habitat selection and foraging ecology (Richard et al.
2001b, Harwood et al. 2014, Loseto et al. 2006). The patterns observed here suggest that clusters
of related belugas, particularly in females, use this large summering area but do not form fine-
scale kin structure related to aggregation ‘hotspots’ in the nearshore areas. The overall results
from mtDNA sequencing in this study also refute an indication of “microgeographic variation
within the Mackenzie Delta” (Brown Gladden et al. 1997) that suggested annual fidelity to
particular sites. It is most likely the difference in samples sizes that added this clarification. This
could be considered good news for the maintenance of genetic diversity and perhaps for the
resilience of the stock to the cumulative impacts of subsistence harvesting, increased disturbance
from industrial activities and tourism, and shifts in prey species and/or distribution due to
187
changing climate (Wade et al. 2012, Reeves et al. 2014). Disturbances from these activities in
particular bays where belugas aggregate will not put a discrete genetic unit of the stock at risk.
The same is apparent for natural mortality of groups of whales due to ice entrapments, though
this inference rests on samples that may not be characteristic of entrapments in general. The
selection of large adult whales, particularly adult males, during the harvests also appears likely to
have minimal impact on the stock as it was the female belugas that were found to form discrete
clusters. It is this female group that may be at greater risk of disturbance and harm. However,
removals of any specific class of individuals with specialized roles from a population can have
negative impacts on the transmission of cultural knowledge, reproductive success, and social
cohesion (e.g. Coltman et al. 2003, Williams and Lusseau 2006, Gobush and Waser 2009). For
example, preference for large males in the trophy hunt of bighorn sheep (Ovis canadensis)
caused directional selection for greater breeding success by the smaller males (Coltman et al.
2003). This may not be true for selective subsistence harvesting. Factors other than animal size,
in particular, the level of harvesting pressure, plus elements such as population structure and the
composition of the harvest relative to age at maturity may have a greater influence on selective
evolutionary changes (Mysterud 2011).
Animals that can be flexible in the degree of fission-fusion group formation during the
exploitation of different habitats are the most likely to adapt to effects of climate change (Dunbar
et al. 2009). The last 20 years has seen trends of later sea ice advance, earlier sea ice retreat and
shorter ice season duration in the Arctic, including the Beaufort Sea (Stammerjohn et al. 2012).
Belugas whales are considered to be moderately sensitive to climate change (Laidre 2008) and
behavioural flexibility, especially in response to sea ice changes and trophic web changes that
affect prey densities and distributions, will be important. Ecosystem regime shifts in the Bering
188
Sea, where EBS belugas overwinter, did not have long-term effects on body size or survivorship
(Luque and Ferguson 2009). Their resilience may have been, in part, due to the whales’ ability to
adjust their feeding behaviour patterns (Luque and Ferguson 2009). Recently, genetic analyses of
mtDNA haplotypes in two decades of samples of belugas provided evidence to link short-term
behavioural changes in migration patterns and seasonal habitat use to changes in sea ice
conditions (O’Corry-Crowe et al. 2016). Our current results did not reveal any short- or long-
term dramatic changes in haplotypes or frequencies within sampling locations; however, sample
sizes were heavily skewed towards the last ten years. The general trend that was observed
encourages the continued use of genetic analyses to track potential changes in group structure
related to habitat use and feeding patterns among EBS belugas. Even though we were not able to
discern kin-based or mtDNA haplotype patterns for fine-scale clustering of beluga whales in the
nearshore EBS area, the genetic information from this study will support continuing conservation
efforts and harvest management of Eastern Beaufort Sea belugas.
3.5 Acknowledgements
This study would not have been possible without the many people involved in harvest
monitoring programs and beluga sampling in the Beaufort Sea and surrounding areas, especially
the hunters of the Inuvialiut Settlement Region. Tim Frasier (St. Mary’s University, Halifax)
provided invaluable training and guidance for the analysis of relatedness and testing of
clustering. We thank Veronique Lésage, DFO Quebec, for providing the St. Lawrence estuary
samples and all of the individuals involved in that beluga necropsy and sampling program.
Laboratory assistance was provided by Denise Tenkula and Susie Bajno. We are indebted to Lois
Harwood for sharing her wealth of knowledge about Beaufort Sea belugas. Funding for this
189
study was obtained from Fisheries and Oceans Canada (DFO), especially the Genomics Research
and Development (GRDI) program, the DFO Ecosystem Research Initiative (ERI), and the
Fisheries Joint Management Committee (FJMC).
3.6 References
Allendorf, F.W., Luikart, G., and Aitken, N. 2013. Conservation and the genetics of populations,
second ed. Wiley-Blackwell Publishing, Oxford, UK, xviii + 602p.
Amos, W., and Hoelzel, A.R. 1992. Applications of molecular genetic techniques to the
conservation of small populations. Biological Conservation 61:133–144.
Andrews, K.R., Karczmarski, L., Au, W.W., Rickards, S.H., Vanderlip, C.A., Bowen, B.W.,
Gordon Grau, E. and Toonen, R.J., 2010. Rolling stones and stable homes: social structure,
habitat diversity and population genetics of the Hawaiian spinner dolphin (Stenella longirostris).
Molecular Ecology 19: 732-748.
Aureli, F., Schaffner, C.M., Boesch, C., Bearder, S.K., Call, J., Chapman, C.A., Connor, R.,
Fiore, A.D., Dunbar, R.I., Henzi, S.P. and Holekamp, K. 2008. Fission-fusion dynamics: new
research frameworks. Current Anthropology 49: 627-654.
Beckmann, J.P., Murray, K., Seidler, R.G., and Berger, J. 2012. Human-mediated shifts in
animal habitat use: sequential changes in pronghorn use of a natural gas field in Greater
Yellowstone. Biological Conservation 147: 222–233.
Benjamini, Y., and Hochberg, Y. 1995. Controlling the false discovery rate: a practical and
powerful approach to multiple testing. Journal of the Royal Statistical Society Series B 57: 289–
300.
Benjamini, Y., and Yekutieli, D. 2001. The control of the false discovery rate in multiple testing
under dependency. Annals of Statistics 29: 1165–1188.
Berdahl, A., Torney, C.J., Schertzer, E. and Levin, S.A. 2015. On the evolutionary interplay
between dispersal and local adaptation in heterogeneous environments. Evolution 69: 1390-1405.
Bérubé, M., and Palsbøll, P. 1996. Identification of sex in cetaceans by multiplexing with three
ZFX and ZFY specific primers. Molecular Ecology 5: 283–287.
Biosa, D. Grignolio, S., Sica, N., Pagon, N., Scandura, M., and Apollonio, M. 2015. Do relatives
like to stay closer? Spatial organization and genetic relatedness in a mountain roe deer
population. Journal of Zoology 296: 30–37.
190
Blasi, M.F., and Boitani, L. 2014. Complex social structure of an endangered population of
bottlenose dolphins (Tursiops truncatus) in the Aeolian Archipelago (Italy). PLoS ONE 9:
e114849.
Blouin, M. S. 2003. DNA-based methods for pedigree reconstruction and kinship analysis in
natural populations. Trends in Ecology and Evolution 18: 503-511.
Blundell, G.M., Ben-David, M., Groves, P., Bowyer R.T., and Geffen, E. 2004. Kinship and
sociality in coastal river otters: are they related? Behavioral Ecology 15: 705–714.
Body, G., Weladji, R.B., Holand, Ø. and Nieminen, M. 2015. Fission-fusion group dynamics in
reindeer reveal an increase of cohesiveness at the beginning of the peak rut. Acta Ethologica 18:
101-110.
Brown Gladden, J.G., Ferguson, M.M. and Clayton, J.W., 1997. Matriarchal genetic population
structure of North American beluga whales Delphinapterus leucas (Cetacea: Monodontidae).
Molecular Ecology 6:1033-1046.
Brown Gladden, J.G., Ferguson, M.M., Friesen, M.K., and Clayton, J.W. 1999. Population
structure of North American beluga whales (Delphinapterus leucas) based on nuclear DNA
microsatellite variation and contrasted with the population structure revealed by mtDNA
variation. Molecular Ecology 8: 347–363.
Brown Gladden, J.G., Brodie, P.F. and Clayton, J.W. 1999. Mitochondrial DNA used to identify
an extralimital beluga whale (Delphinapterus leucas) from Nova Scotia as originating from the
St. Lawrence population. Marine Mammal Science 15: 556-558.
Buchanan, F.C., Friesen, M.K., Littlejohn, R.P., and Cayton, J.W. 1996. Microsatellites from
the beluga whale, Delphinapterus leucas. Molecular Ecology 5: 571–575.
Cabin, R.J., and Mitchell, R.J. 2000. To Bonferroni or not to Bonferroni: when and how are the
questions. Bulletin of the Ecological Society of America 81: 246–248.
Carter, K.D., Seddon, J.M., Frère, C.H., Carter, J.K., and Goldizen, A.W. 2013. Fission-fusion
dynamics in wild giraffes may be driven by kinship, spatial overlap and individual social
preferences. Animal Behaviour 85: 385–394.
Chivers, B.L., and Corkeron, P.J. 2001. Trawling and bottlenose dolphins’ social structure.
Proceedings of the Royal Society of London B: Biological Sciences 268: 1901-1905.
Clauset , A., Newman, M.E.J., and Moore, C. 2004. Finding community structure in very large
networks. Physical Review E 70(6), p.066111.
Clutton-Brock, T.H., and Lukas, D. 2012. The evolution of social philopatry and dispersal in
female mammals. Molecular Ecology 21: 472–492.
191
Colbeck, G.J., Duschesne, P., Postma, L.D., Lésage, V., Hammill, M.O., and Turgeon, J. 2013.
Groups of related belugas (Delphinapterus leucas) travel together during their seasonal
migrations in and around Hudson Bay. Proceedings of the Royal Society of London B:
Biological Sciences 280: 1752–1762.
Coltman, D.W., O’Donoghue, P., Jorgenson, J.T., Hogg, J.T., Strobeck, C., and Festa-Bianchet,
M. 2003. Undesireable evolutionary consequences of trophy hunting. Nature 426: 655–658.
Connor, R.C., Wells, R.S., Mann, J., and Read, A.J., 2000. The bottlenose dolphin, social
relationships in a fission-fusion society. Cetacean Societies: Field Studies of Dolphins and
Whales. Mann, J., Connor, R.C., Tyack, P.L, and Whitehead, H. (Eds.),University of Chicago
Press, USA., pp.91-125.
COSEWIC. 2004. COSEWIC assessment and update status report on the beluga whale
Delphinapterus leucas in Canada. Committee on the Status of Endangered Wildlife in Canada.
Ottawa. ix + 70 p.
COSEWIC. 2012. Definitions and abbreviations. [Online:
http://www.cosewic.gc.ca/eng/sct2/sct2_6_e.cfm].
COSEWIC 2014. COSEWIC assessment and update status report on the beluga whale (St
Lawrence Estuary population) Delphinapterus leucas in Canada. Committee on the Status of
Endangered Wildlife in Canada. Ottawa
COSEWIC. 2015. Committee on the Status of Endangered Wildlife in Canada
Assessment Process, Categories and Guidelines.
COSEWIC. 2016. Designatable Units for Beluga Whales (Delphinapterus leucas) in Canada.
Committee on the Status of Endangered Wildlife in Canada. Ottawa. 73 pp.
Couzin, I.D. and Laidre, M.E. 2009. Fission–fusion populations. Current Biology 19: R633-
R635.
Csardi, G., and Nepusz, T. 2006. The igraph software package for complex network research.
Interjournal, Complex Systems 1695.
Dakin, E.E., and Avise, J.C. 2004. Microsatellite null alleles in parentage analysis. Heredity 93:
504–509
de March, B.G.E and Postma, L.D. 2003. Molecular stock discrimination of belugas
(Delphinapterus leucas) hunted in eastern Hudson Bay, northern Quebec, Hudson Strait, and
Sanikiluaq (Belcher Islands), Canada, and comparisons to adjacent populations. Arctic 56: 111-
124.
192
Dent, E.A., and vonHoldt, B.M. 2012. STRUCTURE HARVESTER: a website and program for
visualizing STRUCTURE output and implementing the Evanno method. Conservation Genetics
Resources 4: 359–361.
DFO. 2000. Eastern Beaufort Sea beluga. DFO Stock Status Report E5–38.
DFO. 2014. Status of beluga (Delphinapterus leucas) in the St. Lawrence River estuary. DFO
Canadian Science Advisory Secretariat Science Advisory Report 2013/076.
Dharmarajan, G., Beasley, J.C, Fike, J.A., and Rodes Jr., O.E. 2014. Effects of landscape,
demographic and behavioural factors on kin structure: testing ecological predictions in a
mesopredator with high dispersal capability. Animal Conservation 17: 225–234.
Díaz López, B. and Bernal Shirai, J.A. 2008. Marine aquaculture and bottlenose dolphins’
(Tursiops truncatus) social structure. Behavioural Ecology and Sociobiology 62: 887-894.
Dunbar, R.I.M, Korstjens, A.H., and Lehmann, J. 2009. Time as an ecological constraint.
Biology Reviews 84: 413–429.
Dungan, S.Z., Wang, J.Y., Araujo, C.C, Yang, S.-C., and White, B. 2016. Social structure in a
critically endangered Indo-Pacific humpback dolphin (Sousa chinensis) population. Aquatic
Conservation in Marine and Freshwater Ecosystems 26: 517-529.
Dyer, R.J., and Nason, J.D. 2004. Population graphs: the graph theoretic shape of genetic
structure. Molecular Ecology 13: 1713–1727.
Elliser, C.R. and Herzing, D.L., 2011. Replacement dolphins? Social restructuring of a resident
pod of Atlantic bottlenose dolphins, Tursiops truncatus, after two major hurricanes. Marine
Mammal Science 27: 39-59.
Evanno, G., Regnaut, S., and Goudet, J. 2005. Detecting the number of clusters of individuals
using the software STRUCTURE: a simulation study. Molecular Ecology 14: 2611–2620.
Falush, D., Stephens, M., and Pritchard, J.K. 2003. Inference of population structure using
multilocus genotype data: linked loci and correlated allele frequencies. Genetics 164: 1567–
1587.
Fast, H., Mathias, J, and Banias, O. 2001. Directions toward marine conservation in Canada’s
western Arctic. Ocean Coastal Management 44: 183–205.
FJMC (Fisheries Joint Management Committee). 2013. Beaufort Sea Management Plan.
Amended fourth edition. 44 p.
Fluxus Technology Ltd. 2013. DNA Alignment version 1.3.3.2. www.fluxus-
engineering.com/dnaalignment
193
García, L.V. 2004. Escaping the Bonferroni iron claw in ecological studies. Oikos. 105: 657–
663.
Garroway, C.J., Bowman, J., Carr, D., and Wilson, P.J. 2008. Applications of graph theory to
landscape genetics. Evolutionary Applications 1: 620–630.
Gaspari, S., Azzellino, A., Airold, S., and Hoelzel, A.R. 2007. Social kin associat associations
and genetic structuring of striped dolphin populations (Stenella coeruleoalba) in the
Mediterranean Sea. Molecular Ecology 16: 2922–2933.
Gerard, J.F., Bideau, E., Maublanc, M.L., Loisel, P. and Marchal, C. 2002. Herd size in large
herbivores: encoded in the individual or emergent? The Biological Bulletin 202: 275-282.
Gilbert, K.J., Andrew, R.L., Bock, D.G., Franklin, M.T., Kane, N.C., Moore, J.S., Moyers, B.T.,
Renault, S., Rennison, D.J., Veen, T., and Vines, T.H. 2012. Recommendations for utilizing and
reporting population genetic analyses: the reproducibility of genetic clustering using the program
STRUCTURE. Molecular Ecology 21: 4925–4930.
Girvan, M., and Newman, M.E.J. 2002. Community structure in social and biological networks.
Proceedings of the National Acadademy of Sciences USA 99: 7821–7826.
Gobush, K.S., and Wasser, S.K. 2009. Behavioural correlates of low relatedness in African
elephant core groups of a poached population. Animal Behaviour 78: 1079–1086.
Goudet, J. 1995. FSTAT (version 1.2): a computer program to calculate F-statisitcs. Journal of
Heredity 86: 485-486.
Gowans, S., Wursig, B., and Karczmarski. 2008. The social structure and strategies of
delphinids: predictions based on an ecological framework. Advances in Marine Biology 53: 195–
294.
Grear, D.A., Samuel, M.D., Scribner, K.T., Weckworth, B.V., and Langenberg, J.A. 2010.
Influence of genetic relatedness and spatial proximity on chronic wasting disease infection
among female white-tailed deer. Journal of Applied Ecology 47: 532–540.
Greenwood, P.J., 1980. Mating systems, philopatry and dispersal in birds and mammals. Animal
Behaviour 28: 1140-1162.
Grove, M. 2012. Space, time, and group size: a model of constraints on primate social foraging.
Animal Behaviour 83:411–419.
Harwood, L.A., Innes, S., Norton, P., and Kingsley, M.C.S. 1996. Distribution and abundance of
beluga whales in the Mackenzie estuary, southeast Beaufort Sea, and west Amundsen Gulf
during late July 1992. Canadian Journal of Fisheries and Aquatic Sciences 53: 2262–2273.
194
Harwood, L.A., Norton, P., Day, B., and Hall, P.A. 2002. The harvest of beluga whales in
Canada’s western Arctic: hunter-based monitoring of the size and composition of the catch.
Arctic 55: 10–20.
Harwood, L.A., and Smith, T.G. 2002. Whales of the Inuvialuit Settlement Region in Canada’s
western Arctic: and overview and outlook. Arctic 55: 77–93.
Harwood, L.A., Iacozza, J., Auld, J.C., Norton, P., and Loseto, L. 2014. Belugas in the
Mackenzie River estuary, NT, Canada: Habitat use and hotspots in the Tarium Niryutait Marine
Protected Area. Ocean and Coastal Management 100: 128–138.
Harwood, L.A., Kingsley, M.C.S., and Pokiak, F. 2015. Monitoring beluga harvests in the
Mackenzie Delta and near Paulatuk, NT, Canada: harvest efficiency and trend, size and sex of
landed whales, and reproduction, 1970 – 2009. Canadian Manuscript Report of Fisheries and
Aquatic Sciences 3059.
Hoelzel A.R., Dahlheim, M., and Stern, S.J. 1998. Low genetic variation among killer whales
(Orcinus orca) in the eastern North Pacific and genetic differentiation between foraging
specialists. Journal of Heredity 89: 121–128.
Holm, S. 1979. A simple sequentially rejective multiple test procedure. Scandanavian Journal of
Statistics 6: 65–70.
Iacolina, L., Scandura, M., Bongi, P., and Apollonio, M. 2009. Non-kin associations in wild boar
social units. Journal of Mammalogy 90: 666–674.
Inuvialuit Land Administration. 2011. Husky Lakes Special Cultural Area.
IWC. 2000. Status of Monodontid whales: white whale. Journal of Cetacean Research and
Management 2 (SUPPL.), 243–250.
Jombart, T. 2010. Discriminant analysis of principal components: a new method for the analysis
of genetically structured populations. BMC Genetics 11: 94.
Jombart, T. 2014. A tutorial for Discriminant Analysis of Principal Components (DAPC) using
adegenet 1.4–1.
Karczmarski, L., Würsig, B., Gailey, G., Larson, K.W. and Vanderlip, C., 2005. Spinner
dolphins in a remote Hawaiian atoll: social grouping and population structure. Behavioural
Ecology 16: 675-685.
Kashima, K., Ohtsuki, H. and Satake, A. 2013. Fission-fusion bat behavior as a strategy for
balancing the conflicting needs of maximizing information accuracy and minimizing infection
risk. Journal of Theoretical Biology 318: 101-109.
195
Kerth, G., Perony, N., and Schweitzer, F. 2011. Bats are able to maintain long-term social
relationships despite the high fission-fusion dynamics of their groups. Proceedings of the Royal
Society B 278: 2761–2767.
King, W.J., Festa-Bianchet, M., Coulson, G. and Goldizen, A.W. 2017. Long-term consequences
of mother-offspring associations in eastern grey kangaroos. Behavioral Ecology and
Sociobiology 71: 77.
Kocho-Schellenberg, J.E. 2010. Understanding the evolution of beluga entrapment co-
management in the Inuvialuit Settlement Region using social network analysis. Master’s Thesis,
Faculty of Environment, Earth and Resources, University of Manitoba, Winnipeg, 138pp.
Krause, J., Krause, S., Arlinghaus, R., Psorakis, I., Roberts, S. and Rutz, C. 2013. Reality mining
of animal social systems. Trends in Ecology & Evolution 28: 541-551.
Laidre, K.L., Stirling, I., Lowry, L.F., Wiig, O., Heide-Jørgensen, M.P., and Ferguson, S.H.
2008. Quantifying the sensitivity of Arctic marine mammals to climate-induced habitat change.
Ecological Applications 18: S97–S125.
Lehmann, J., Korstjens, A.H., and Dunbar, R.I.M. 2006. Fission-fusion social systems as a
strategy for coping with ecological constraints: a primate case. Evolution and Ecology 21: 613–
634.
Lesack, K., and Naugler, C. 2011. An open-source software program for performing Bonferroni
and related corrections for multiple comparisons. Journal of Pathology Informatics 2: 52.
Li, C.C, Weeks, D.E, and Chakravarti, A. 1993. Similarity of DNA fingerprints due to chance
and relatedness. Human Heredity 43: 45-52.
Loseto, L.L., Richard, P., Stern, G.A., Orr, J., and Ferguson, S.H. 2006. Segregation of Beaufort
Sea beluga whales during the open-water season. Canadian Journal of Zoology 84: 1743-1751.
Loseto, L., Wazny, T., Cleator, H., Ayles, B., Cobb, D., Harwood, L., Michel, C., Nielsen, O.,
Paulic, J., Postma, L., Ramlal, P., Reist, J., Richard, P., Ross, P.S., Solomon, S., Walkusz, W.,
Weilgart, L., and Williams, B. 2010. Information in support of indicator selection for monitoring
the Tarium Niryutait Marine Protected Area (TNMPA). DFO Canadian Science Advisory
Secretariat Science Research Document 2010/094. vi + 47 p.
Louis, M., Gally, F.. Barbraud. C., Béesau, J., Tixier, P., Simon-Bouhet, B., Le Rest, K., and
Guinet, C. 2015. Social structure and abundance of coastal bottlenose dolphins, Tursiops
truncatus, in Normano-Breton Gulf, English Channel. Journal of Mammalogy 96: 481-493.
Luque, S.P., and Ferguson, S.H. 2009. Ecosystems regime shifts have not affected growth and
survivorship of eastern Beaufort Sea belugas. Oecologia 160: 367–378.
196
Lusseau, D., Wilson, B., Hammond, P.S., Grellier, K., Durban, J.W., Parsons, K.M., Barton,
T.R., and Thompson, P.M. 2006. Quantifying the influence of sociality on populations structure
in bottlenose dolphins. Journal of Animal Ecology 75: 14–24.
Lynch, M., and Ritland, K. 1999. Estimation of pairwise relatedness with molecular markers.
Genetics 152: 1753–1766.
Metheny, J.D., Kalcounis-Rueppell, M.C., Bondo, K.J. and Brigham, R.M. 2008a. A genetic
analysis of group movement in an isolated population of tree-roosting bats. Proceedings of the
Royal Society of London B: Biological Sciences 275: 2265-2272.
Metheny, J.D., Kalcounis-Rueppell, M.C., Willis, C.K., Kolar, K.A. and Brigham, R.M. 2008b.
Genetic relationships between roost-mates in a fission–fusion society of tree-roosting big brown
bats (Eptesicus fuscus). Behavioral Ecology and Sociobiology 62: 1043-1051.
Möller, L.M. 2012. Sociogenetic structure, kin associations and bonding in delphinids.
Molecular Ecology 21: 745–764.
Moran, M.D. 2003. Arguments for rejecting the sequential Bonferroni in ecological studies.
Oikos 100: 403–405.
Moreno, K., and Acevedo-Gutiérrez, A. 2016. The social structure of Golfo Dulce bottlenose
dolphins (Tursiops truncatus) and the influence of behavioural state. Royal Society Open
Science doi: 10.1098/rsos.160010.
Morin, P.A., Martien, K.K., Archer, F.I., Cipriano, F., Steel, D., Jackson, J. and Taylor, B.L.
2010. Applied conservation genetics and the need for quality control and reporting of genetic
data used in fisheries and wildlife management. Journal of Heredity 101: 1-10.
Mysterud, A. 2011. Selective harvesting of large mammals: how often does it results in
directional selection? Journal of Applied Ecology 48: 827-834.
Narum, S.R. 2006. Beyond Bonferroni: less conservative analyses for conservation genetics.
Conservation Genetics 7: 783–787.
Newman, M.E.J. 2006a. Modularity and community structure in networks. Proceedings of the
National Academy of Sciences USA 103: 8577–8582.
Newman, M.E.J. 2006b. Finding community structure in networks using the eigenvectors of
matrices. Physical Review E 74(3): 036104.
Nidiffer, M.D., and Cortés-Ortiz, L. 2015. Intragroup relatedness in two howler monkey species
(Alouatta pigra and A. palliate): implications for understanding social systems and dispersal.
American Journal of Primatology 77: 1333–1345.
197
O’Corry-Crowe, G., Mahoney, A.R., Quakenbush, L., Whiting, A., Lowry, L., and Harwood, L.
2016. Genetic profiling links changing sea-ice to shifting beluga whale migration patterns.
Biology Letters 12: 20160404.
O'Corry-Crowe, G., Lucey, W., Archer, F.I. and Mahoney, B. 2015. The genetic ecology and
population origins of the beluga whales, Delphinapterus leucas, of Yakutat Bay. Marine
Fisheries Review 77: 47-58.
O’Corry-Crowe, G.M., Suydam, R.S, Rosenberg, A., Frost, K.J., and Dizon, A.E. 1997.
Phylogeography, population structure and dispersal patterns of the beluga whale Delphinapterus
leucas in the western Nearctic revealed by mitochondrial DNA. Molecular Ecology 6: 955–970.
Orman, G. and Labatut, V. 2011. A comparison of community detection algorithms on artificial
networks. Discovery Science, 2009, Porto, Portugal, Springer 5808, pp.242–256.
Palsbøll P., Heide-Jørgensen, M.P., and Bérubé, M. 2002. Analysis of mitochondrial control
region nucleotide sequences from Baffin Bay beluga (Delphinapterus leucas): detecting pods or
sub-populations? NAMMCO Scientific Publications 4: 39–50.
Palsbøll, P.J., Bérubé, M., and Allendorf, F.W. 2006. Identification of management units using
population genetic data. Trends in Ecology and Evolution 22: 11–16.
Palsbøll, P.J., Peery, M.Z., and Bérubé, M. 2010. Detecting populations in the ‘ambiguous’ zone:
kinship-based estimation of population structure at low genetic divergence. Molecular Ecology
Resources 10: 797–805.
Parra, G.J., Corkeron, P.J. and Arnold, P. 2011. Grouping and fission–fusion dynamics in
Australian snubfin and Indo-Pacific humpback dolphins. Animal Behaviour 82: 1423-1433.
Peakall, R., and Smouse, P.E. 2012. GenAlEx 6.5: genetic analysis in Excel. Population genetic
software for teaching and research – an update. Bioinformatics Applications Note 28: 2537–
2539.
Pearson, H.C., Markowitz, T.M., Weir, J.S. and Würsig, B. 2017. Dusky dolphin
(Lagenorhynchus obscurus) social structure characterized by social fluidity and preferred
companions. Marine Mammal Science 33: 251-276.
Pérez-González, J., Frantz, A.C., Torres-Porras, J., Castillo, L., and Carranza, J. 2012.
Population structure, habitat features and genetic structure of managed red deer populations.
European Wildlife Research 58: 933–943.
Pew, J., Muir, P.H., Wang, J., and Frasier, T. 2014. related: and R package for analysing
pairwise relatedness from codominant molecular markers. Molecular Ecology Resources 15:
557-561.
198
Podgórski, T., Scandura, M., and Jędrzejewska, B. 2014. Next of kin next door – philopatry and
socio-genetic population structure in wild boar. Journal of Zoology 294: 190–197.
Poteaux, C., Baubet, E., Kaminski, E., Brandt, S. Dobson, F.S., and Baudoin, C. 2009. Socio-
genetic structure and mating system of a wild boar population. Journal of Zoology 278: 116–125.
Pritchard, J., Stephens, M, and Donnelly, P. 2000. Inference of population structure using
multilocus genotype data. Genetics 155: 945–959.
Putman, A.I, and Carbone I. 2014. Challenges in the analysis and interpretation of microsatellite
data for population genetic studies. Ecology and Evolution 4: 4399–4428.
Quakenbush, L.T, Suydam, R.S., Bryan, A.L., Lowry, L.F., Frost, K.J., and Mahoney, B.A.
2015. Diet of beluga whales, Delphinapterus leucas, in Alaska form stomach contents, March-
November. Marine Fisheries Review 77: 70-84.
Queller, D.C., and Goodnight, K.F. 1989. Estimating relatedness using molecular markers.
Evolution 43: 258–275.
R Core Team. 2015. R: A language and environment for statistical computing. R Foundation for
Statistical Computing, Vienna, Austria.
Raymond M., and Rousset, F. 1995. GENEPOP (version 1.2): population genetics software for
exact tests and ecumenicism. Journal of Heredity 86: 248–249.
Reichardt, J., and Bornholdt, S. 2004. Detecting fuzzy community structures in complex
networks with a Potts model. Physical Review Letters 93: 218701.
Reeves, R.R., Ewins, P.J., Agbayani, S., Heide-Jørgensen, M.P., Kovacs, K.M., Lydersen, C.,
Suydam, R., Elliott, W., Polet, G., van Dijk, Y., and Blijleven, R. 2014. Distribution of endemic
cetaceans in relation to hydrocarbon development and commercial shipping in a warming Arctic.
Marine Policy 44: 375–389.
Reichardt, J., and Bornholdt, S. 2006. Statistical mechanics of community detection. Physical
Review E 74: 016110.
Richard, K.R., Dillon, M.C., Whitehead, H., and Wright, J.M. 1996. Patterns of kinships in
groups of free-living sperm whales (Physeter macrocephalus) revealed by multiple molecular
genetic analyses. Proceedings of the National Academy of Sciences USA 93: 8792–8795.
Richard, P.R., Martin, A.R., and Orr, J.R. 2001a. Summer and autumn movements of belugas of
the Beaufort Sea Region. Arctic 54: 223–236.
Richard, P.R., Heide-Jørgensen, M.P., Orr, J., Dietz, R., and Smith, T.G. 2001b. Summer and
autumn movements and habitat use by belugas in the Canadian high Arctic and adjacent waters.
Arctic 54: 207–222.
199
Richard, P.R. 2005. An estimate of the Western Hudson Bay beluga population size in 2004.
DFO Canadian Science Advisory Secretariat Research Document 2005/017. Ii + 29 p.
Richard, P.R. 2010. Stock definition of belugas and narwhals in Nunavut. DFO Canadian
Science Advisory Secretariat Research Document 2010/022. iv + 14 p.
Ritland, K. 1996 Estimators for pairwise relatedness and inbreeding coefficients. Genetics
Resources 67: 175–186.
Rodgers, T.W., Giacalone, J., Heske, E.J., Janečka, J.E., Jansen, P.A., Phillips, C.A., and
Schooley, R.L. 2015. Socio-spatial organization and kin structure in ocelots from integration of
camera trapping and noninvasive genetics. Journal of Mammalogy 96: 120–128.
Rosel, P., France, S.C., Wang, J.Y., and Kocher, T.D. 1999. Genetic structure of harbour
porpoise Phocoena phocoena populations in the northwest Atlantic based on mitochondrial and
nuclear markers. Molecular Ecology 8 (Supplementary Issue S1): S41–S54.
Rousset, F. 2008. Genepop'007: a complete reimplementation of the Genepop software for
Windows and Linux. Molecular Ecology Resources 8: 103–106.
Seutin, G., White, B.N., and Boag, P.T. 1991. Preservation of avian blood and tissue samples for
DNA analyses. Canadian Journal of Zoology 69: 82–90.
Shaw, C.N., Wilson, P.J., and White, B.N. 2003. A reliable molecular methods for gender
determination for mammals. Journal of Mammalogy 84: 123–128.
Seutin, G., White, B.N., and Boag, P.T. 1991. Preservation of avian blood and tissue samples for
DNA analyses. Canadian Journal of Zoology 68: 82-90.
Shannon, P., Markiel, A., Ozier, O., Baliga, N.S., Wang, J.T., Ramage, D., Amin, N.,
Schwikowski, B, and Ideker, T. 2003. Cytoscape: a software environment for integrated models
of biomolecular interaction networks. Genome Research 13: 2498–2504.
Seidler, R.G., Long, R.A., Berger, J., Bergen, S., and Beckmann, J.P. 2014. Identifying
impediments to long-distance mammal migrations. Conservation Biology 29: 99–109.
Smith, T.G., Hammill, M.O., and Martin, A.R. 1994. Herd composition & behaviour of white
whales (Delphinapterus leucas) in two Canadian estuaries. Meddeleser om. Grønland,
Biosciences 39: 175–186.
Smith, J.E., Kolowski, J.M., Graham, K.E., Dawes, S.E. and Holekamp, K.E. 2008. Social and
ecological determinants of fission–fusion dynamics in the spotted hyaena. Animal Behaviour 76:
619-636.
200
Snyder-Mackler, N., Albert, S.C., and Bergman, T.J. 2014. The socio-genetics of a complex
society: female gelada relatedness patterns mirror association patterns in a multilevel society.
Molecular Ecology 23: 6179–6191.
Stammerjohn, S., Massom, R, Rind, R., and Martinson, D. 2012. Regions of rapid sea ice
change: an inter-hemispheric seasonal comparison. Geophysical Research Letters 39: L06501.
Storz, J.F. 1999. Genetic consequences of mammalian social structure. Journal of Mammalogy,
80: 553-569.
Tavares, S.B., Samarra, F.I. and Miller, P.J. 2017. A multilevel society of herring-eating killer
whales indicates adaptation to prey characteristics. Behavioral Ecology 28: 500-514.
Turgeon, J., Duchesne, P., Colbeck, G.J., Postma, L.D., and Hammill, M.O. 2012.
Spatiotemporal segregation among summer stocks of beluga (Delphinapterus leucas) despite
nuclear gene flow: implication for the endangered belugas in eastern Hudson Bay (Canada).
Conservation Genetics 13: 419-433.
Valsecchi, E., and Amos, W. 1996. Microsatellite markers for the study of cetacean populations.
Molecular Ecology 5: 151–156.
van Oosterhout, C., Hutchinson, W.F., Wills, D.P., and Shipley, P. 2004. MICRO-CHECKER:
software for identifying and correcting genotyping errors in microsatellite data. Molecular
Ecology Notes 4: 535-538.
Van de Casteele, T., Galbusera, P., and Matthysen, E. 2001. A comparison of microsatellite-
based pairwise relatedness estimators. Molecular Ecology 10: 1539–1549.
Van Horn, R.C., Buchan, J.C., Altmann, J. and Alberts, S.C. 2007. Divided destinies: group
choice by female savannah baboons during social group fission. Behavioral Ecology and
Sociobiology 6: 1823-1837.
Viricel, A., Strand, A.E., Rosel, P.E., Ridoux, V., and Garcia, P. 2008. Insights on common
dolphin (Delphinus delphis) social organization from genetic analysis of a mass stranded pod.
Behavioral Ecology and Sociobiolgy 63: 173–185.
Wade, P.R., Reeves, R., and Mesnick, S.L. 2012. Social and behavioural factors in cetacean
responses to overexploitation: are odontocetes less “resilient” than mysticetes? Journal of Marine
Biology Article ID 567276, 15 pages, doi:10.1155/2012/567276.
Waits, L.P., Luikart, G., and Taberlet, P. 2001. Estimating the probability of identity among
genotypes in natural populations: cautions and guidelines. Molecular Ecology 10: 249-256.
Wang, J. 2002. An estimator for pairwise relatedness using molecular markers. Genetics 160:
1203–1215.
201
Waples, R.S., and Gaggiotti, O. 2006. What is a population? An empirical evaluation of some
genetic methods for identifying the number of gene pools and their degree of connectivity.
Molecular Ecology 15: 1419-1439.
Watt, C.A., Petersen, S.D., and Ferguson, S.H. 2015. Genetics and fatty acids assist in
deciphering narwhal (Monodon monoceros) social groupings. Polar Biology 38:1971-1981.
Williams, R., and Lusseau, D. 2006. A killer whale social network is vulnerable to targeted
removals. Biology Letters 2: 497–500.
Zeyl, E., Aars, J., Ehrich, D., and Wiig, Ø. 2009. Families in space: relatedness in the Barents
Sea population of polar bears (Ursus maritimus). Molecular Ecology 18: 735-749.
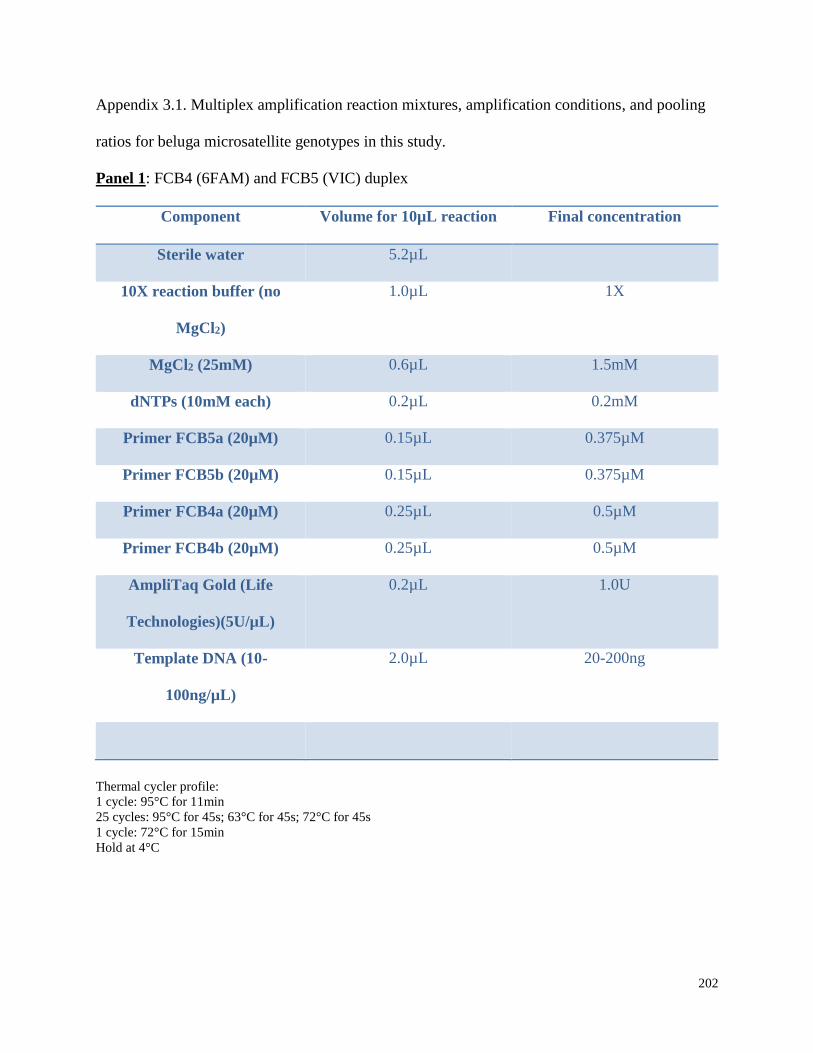
202
Appendix 3.1. Multiplex amplification reaction mixtures, amplification conditions, and pooling
ratios for beluga microsatellite genotypes in this study.
Panel 1: FCB4 (6FAM) and FCB5 (VIC) duplex
Component Volume for 10µL reaction Final concentration
Sterile water 5.2µL
10X reaction buffer (no
MgCl2)
1.0µL 1X
MgCl2 (25mM) 0.6µL 1.5mM
dNTPs (10mM each) 0.2µL 0.2mM
Primer FCB5a (20µM) 0.15µL 0.375µM
Primer FCB5b (20µM) 0.15µL 0.375µM
Primer FCB4a (20µM) 0.25µL 0.5µM
Primer FCB4b (20µM) 0.25µL 0.5µM
AmpliTaq Gold (Life
Technologies)(5U/µL)
0.2µL 1.0U
Template DNA (10-
100ng/µL)
2.0µL 20-200ng
Thermal cycler profile:
1 cycle: 95°C for 11min
25 cycles: 95°C for 45s; 63°C for 45s; 72°C for 45s
1 cycle: 72°C for 15min
Hold at 4°C
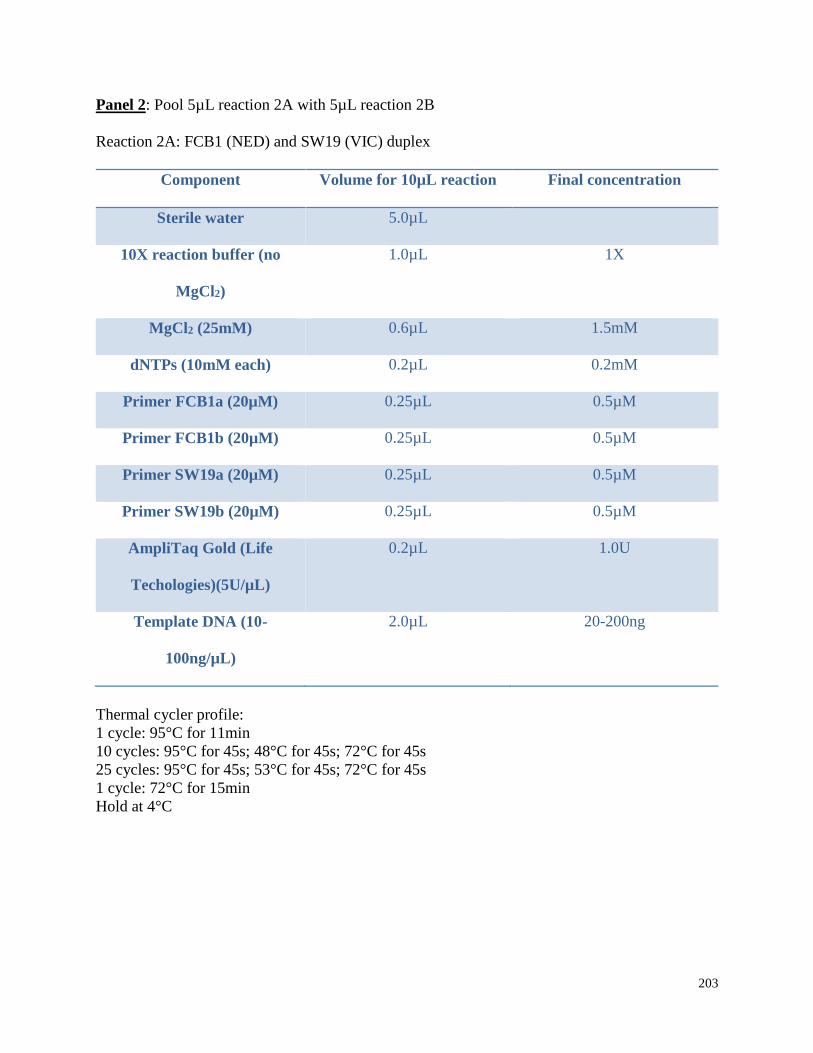
203
Panel 2: Pool 5µL reaction 2A with 5µL reaction 2B
Reaction 2A: FCB1 (NED) and SW19 (VIC) duplex
Component Volume for 10µL reaction Final concentration
Sterile water 5.0µL
10X reaction buffer (no
MgCl2)
1.0µL 1X
MgCl2 (25mM) 0.6µL 1.5mM
dNTPs (10mM each) 0.2µL 0.2mM
Primer FCB1a (20µM) 0.25µL 0.5µM
Primer FCB1b (20µM) 0.25µL 0.5µM
Primer SW19a (20µM) 0.25µL 0.5µM
Primer SW19b (20µM) 0.25µL 0.5µM
AmpliTaq Gold (Life
Techologies)(5U/µL)
0.2µL 1.0U
Template DNA (10-
100ng/µL)
2.0µL 20-200ng
Thermal cycler profile:
1 cycle: 95°C for 11min
10 cycles: 95°C for 45s; 48°C for 45s; 72°C for 45s
25 cycles: 95°C for 45s; 53°C for 45s; 72°C for 45s
1 cycle: 72°C for 15min
Hold at 4°C
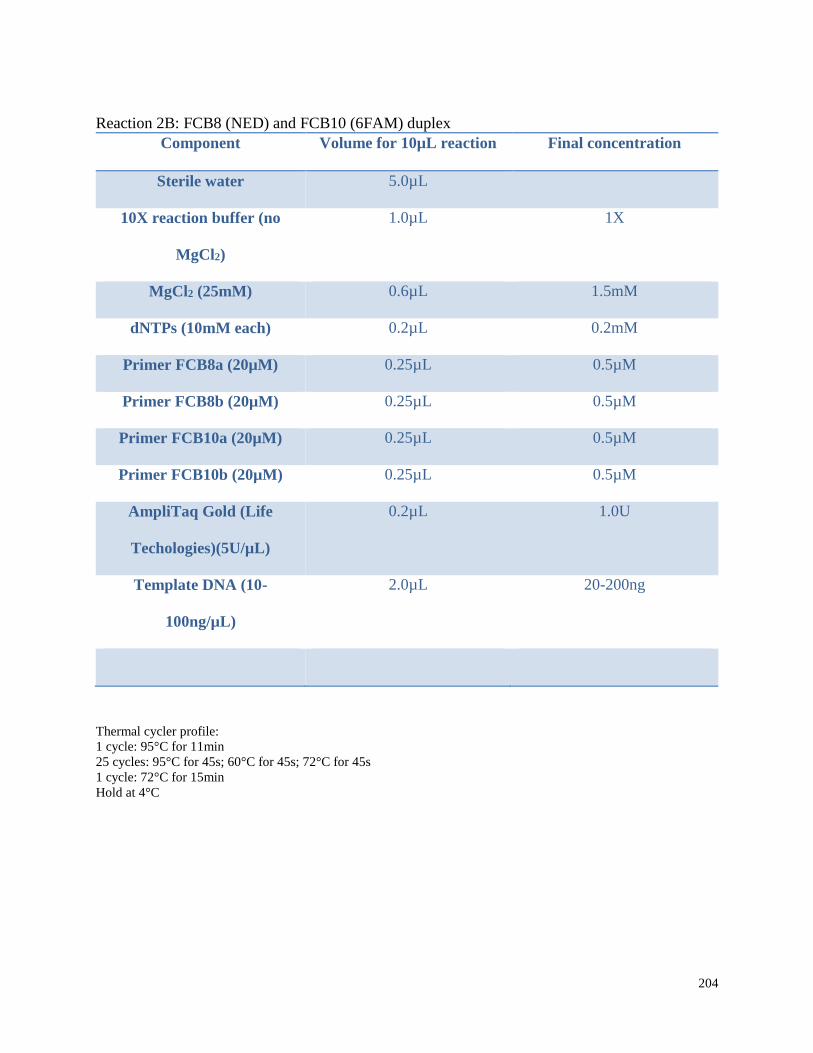
204
Reaction 2B: FCB8 (NED) and FCB10 (6FAM) duplex
Component Volume for 10µL reaction Final concentration
Sterile water 5.0µL
10X reaction buffer (no
MgCl2)
1.0µL 1X
MgCl2 (25mM) 0.6µL 1.5mM
dNTPs (10mM each) 0.2µL 0.2mM
Primer FCB8a (20µM) 0.25µL 0.5µM
Primer FCB8b (20µM) 0.25µL 0.5µM
Primer FCB10a (20µM) 0.25µL 0.5µM
Primer FCB10b (20µM) 0.25µL 0.5µM
AmpliTaq Gold (Life
Techologies)(5U/µL)
0.2µL 1.0U
Template DNA (10-
100ng/µL)
2.0µL 20-200ng
Thermal cycler profile:
1 cycle: 95°C for 11min
25 cycles: 95°C for 45s; 60°C for 45s; 72°C for 45s
1 cycle: 72°C for 15min
Hold at 4°C
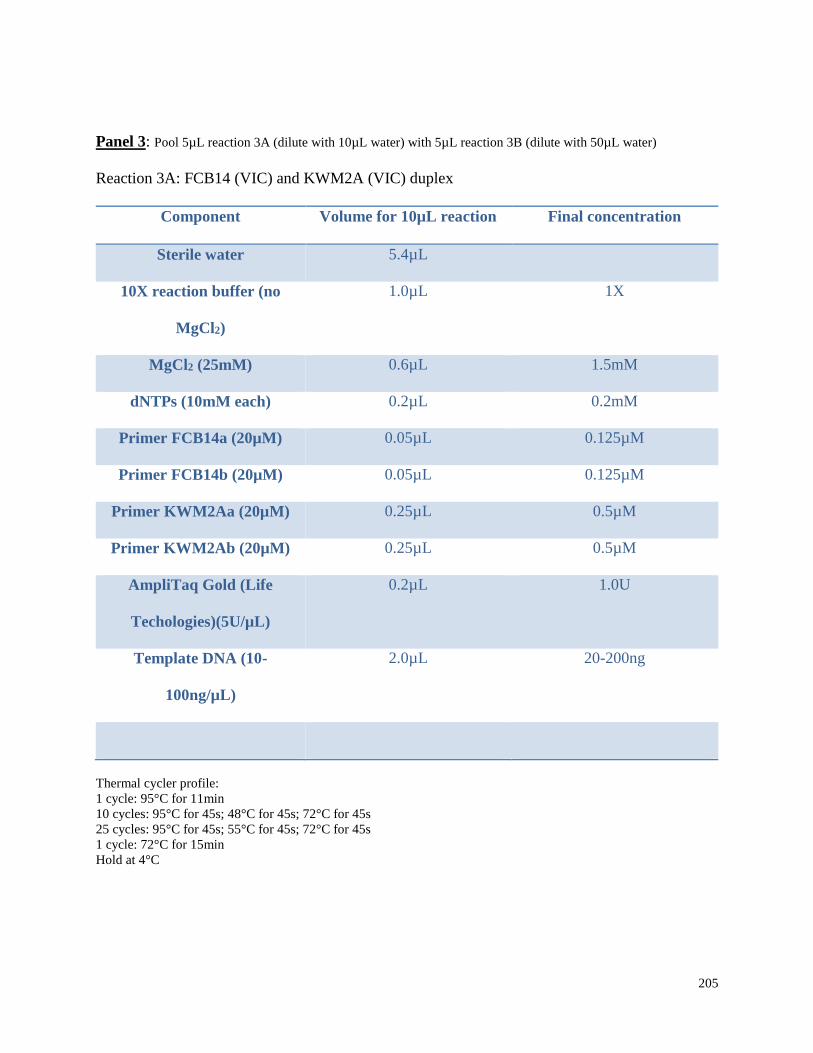
205
Panel 3: Pool 5µL reaction 3A (dilute with 10µL water) with 5µL reaction 3B (dilute with 50µL water)
Reaction 3A: FCB14 (VIC) and KWM2A (VIC) duplex
Component Volume for 10µL reaction Final concentration
Sterile water 5.4µL
10X reaction buffer (no
MgCl2)
1.0µL 1X
MgCl2 (25mM) 0.6µL 1.5mM
dNTPs (10mM each) 0.2µL 0.2mM
Primer FCB14a (20µM) 0.05µL 0.125µM
Primer FCB14b (20µM) 0.05µL 0.125µM
Primer KWM2Aa (20µM) 0.25µL 0.5µM
Primer KWM2Ab (20µM) 0.25µL 0.5µM
AmpliTaq Gold (Life
Techologies)(5U/µL)
0.2µL 1.0U
Template DNA (10-
100ng/µL)
2.0µL 20-200ng
Thermal cycler profile:
1 cycle: 95°C for 11min
10 cycles: 95°C for 45s; 48°C for 45s; 72°C for 45s
25 cycles: 95°C for 45s; 55°C for 45s; 72°C for 45s
1 cycle: 72°C for 15min
Hold at 4°C
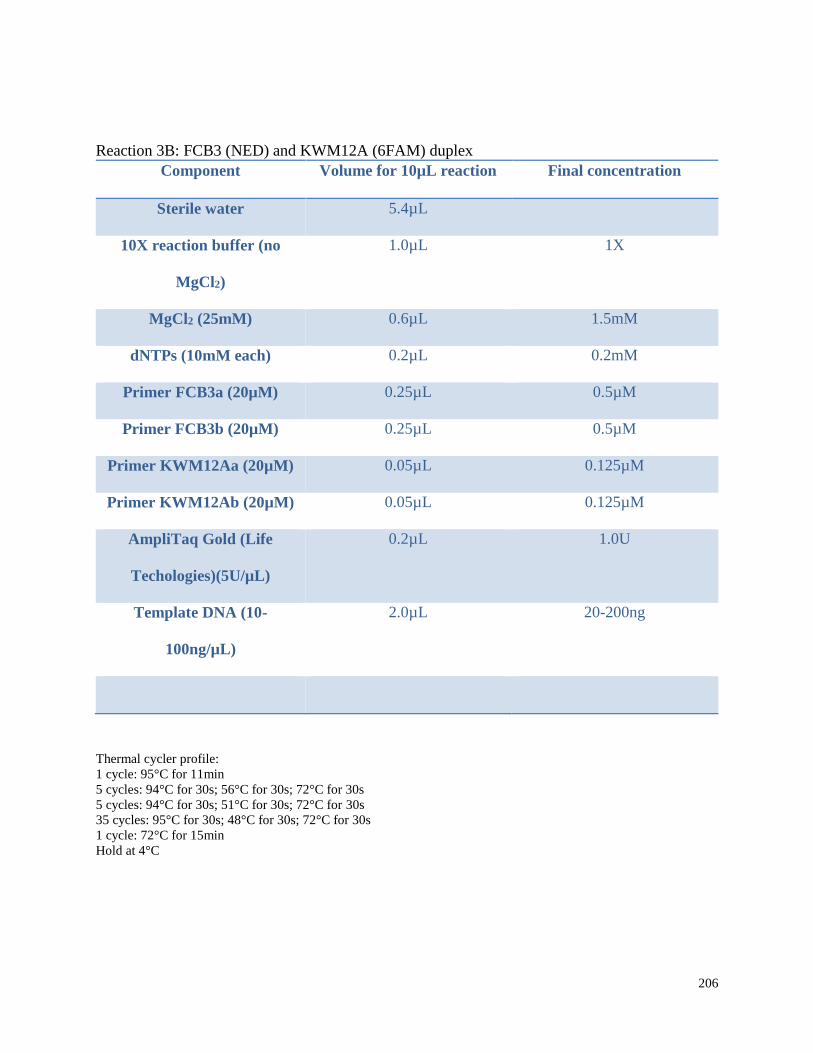
206
Reaction 3B: FCB3 (NED) and KWM12A (6FAM) duplex
Component Volume for 10µL reaction Final concentration
Sterile water 5.4µL
10X reaction buffer (no
MgCl2)
1.0µL 1X
MgCl2 (25mM) 0.6µL 1.5mM
dNTPs (10mM each) 0.2µL 0.2mM
Primer FCB3a (20µM) 0.25µL 0.5µM
Primer FCB3b (20µM) 0.25µL 0.5µM
Primer KWM12Aa (20µM) 0.05µL 0.125µM
Primer KWM12Ab (20µM) 0.05µL 0.125µM
AmpliTaq Gold (Life
Techologies)(5U/µL)
0.2µL 1.0U
Template DNA (10-
100ng/µL)
2.0µL 20-200ng
Thermal cycler profile:
1 cycle: 95°C for 11min
5 cycles: 94°C for 30s; 56°C for 30s; 72°C for 30s
5 cycles: 94°C for 30s; 51°C for 30s; 72°C for 30s
35 cycles: 95°C for 30s; 48°C for 30s; 72°C for 30s
1 cycle: 72°C for 15min
Hold at 4°C
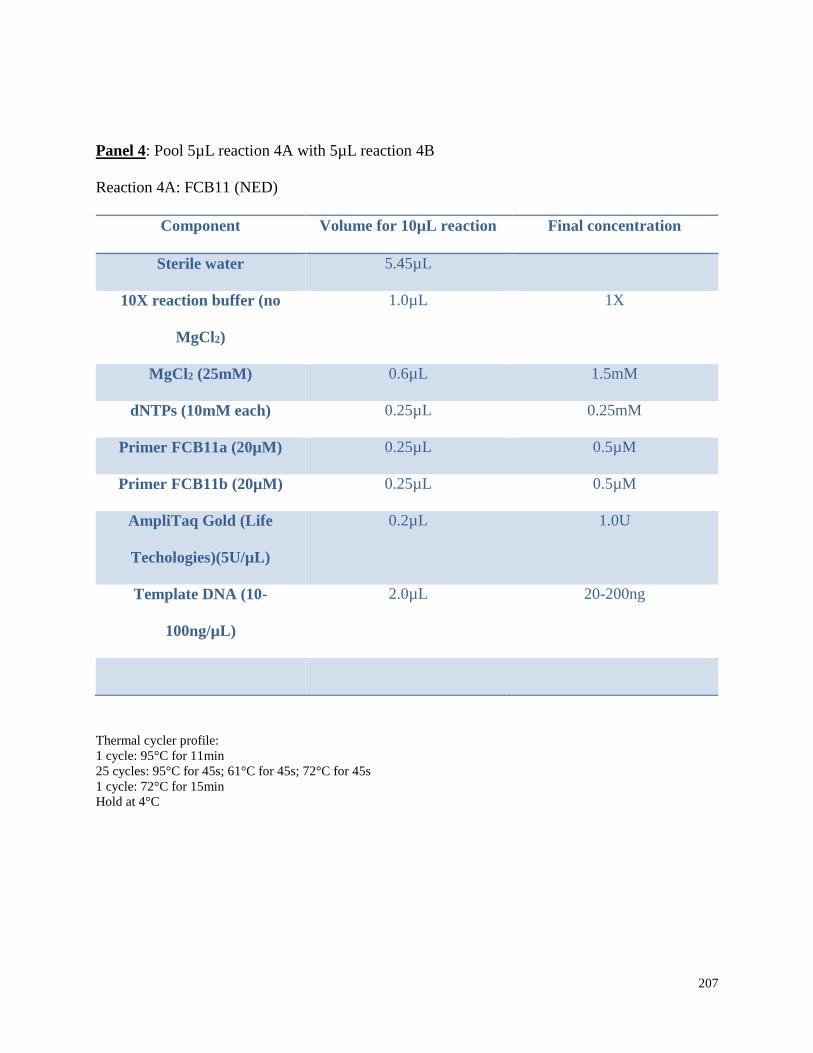
207
Panel 4: Pool 5µL reaction 4A with 5µL reaction 4B
Reaction 4A: FCB11 (NED)
Component Volume for 10µL reaction Final concentration
Sterile water 5.45µL
10X reaction buffer (no
MgCl2)
1.0µL 1X
MgCl2 (25mM) 0.6µL 1.5mM
dNTPs (10mM each) 0.25µL 0.25mM
Primer FCB11a (20µM) 0.25µL 0.5µM
Primer FCB11b (20µM) 0.25µL 0.5µM
AmpliTaq Gold (Life
Techologies)(5U/µL)
0.2µL 1.0U
Template DNA (10-
100ng/µL)
2.0µL 20-200ng
Thermal cycler profile:
1 cycle: 95°C for 11min
25 cycles: 95°C for 45s; 61°C for 45s; 72°C for 45s
1 cycle: 72°C for 15min
Hold at 4°C
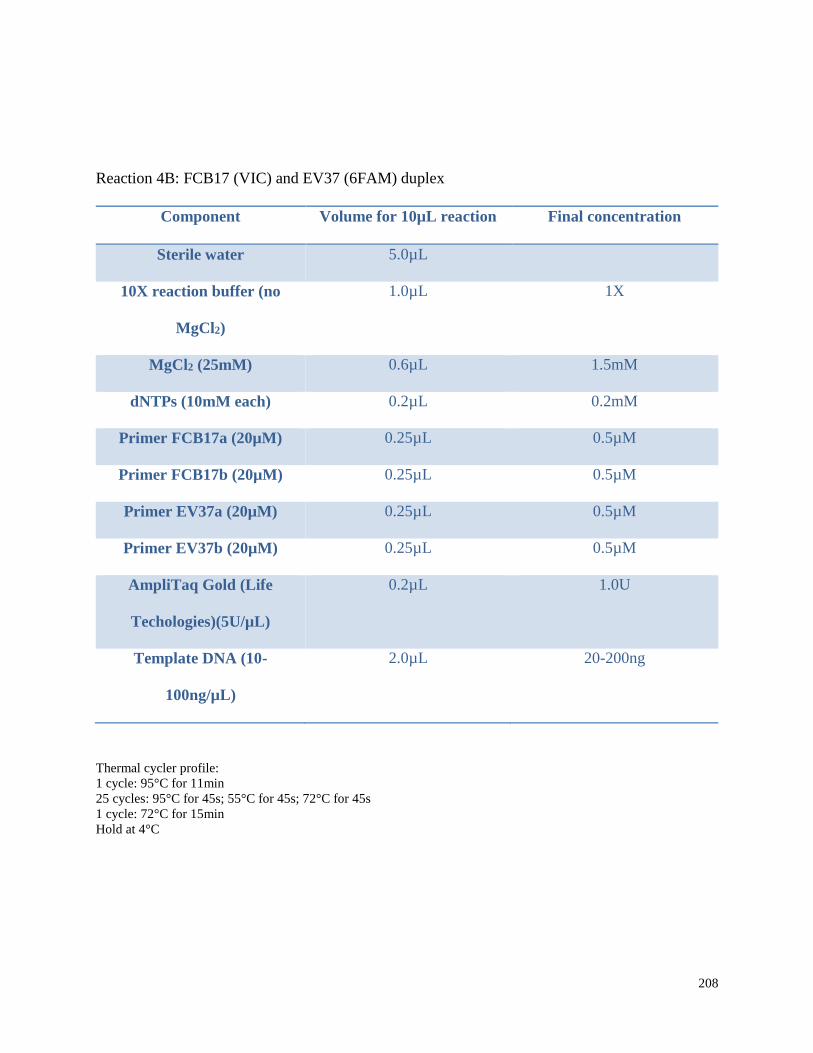
208
Reaction 4B: FCB17 (VIC) and EV37 (6FAM) duplex
Component Volume for 10µL reaction Final concentration
Sterile water 5.0µL
10X reaction buffer (no
MgCl2)
1.0µL 1X
MgCl2 (25mM) 0.6µL 1.5mM
dNTPs (10mM each) 0.2µL 0.2mM
Primer FCB17a (20µM) 0.25µL 0.5µM
Primer FCB17b (20µM) 0.25µL 0.5µM
Primer EV37a (20µM) 0.25µL 0.5µM
Primer EV37b (20µM) 0.25µL 0.5µM
AmpliTaq Gold (Life
Techologies)(5U/µL)
0.2µL 1.0U
Template DNA (10-
100ng/µL)
2.0µL 20-200ng
Thermal cycler profile:
1 cycle: 95°C for 11min
25 cycles: 95°C for 45s; 55°C for 45s; 72°C for 45s
1 cycle: 72°C for 15min
Hold at 4°C
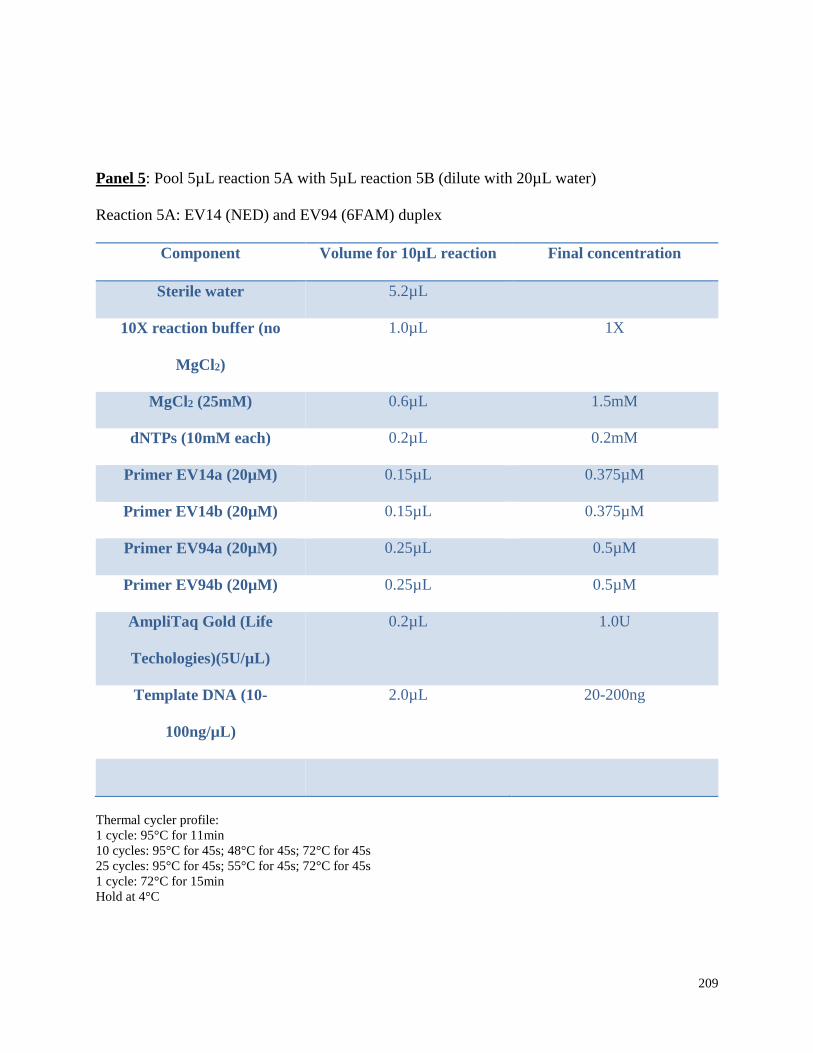
209
Panel 5: Pool 5µL reaction 5A with 5µL reaction 5B (dilute with 20µL water)
Reaction 5A: EV14 (NED) and EV94 (6FAM) duplex
Component Volume for 10µL reaction Final concentration
Sterile water 5.2µL
10X reaction buffer (no
MgCl2)
1.0µL 1X
MgCl2 (25mM) 0.6µL 1.5mM
dNTPs (10mM each) 0.2µL 0.2mM
Primer EV14a (20µM) 0.15µL 0.375µM
Primer EV14b (20µM) 0.15µL 0.375µM
Primer EV94a (20µM) 0.25µL 0.5µM
Primer EV94b (20µM) 0.25µL 0.5µM
AmpliTaq Gold (Life
Techologies)(5U/µL)
0.2µL 1.0U
Template DNA (10-
100ng/µL)
2.0µL 20-200ng
Thermal cycler profile:
1 cycle: 95°C for 11min
10 cycles: 95°C for 45s; 48°C for 45s; 72°C for 45s
25 cycles: 95°C for 45s; 55°C for 45s; 72°C for 45s
1 cycle: 72°C for 15min
Hold at 4°C
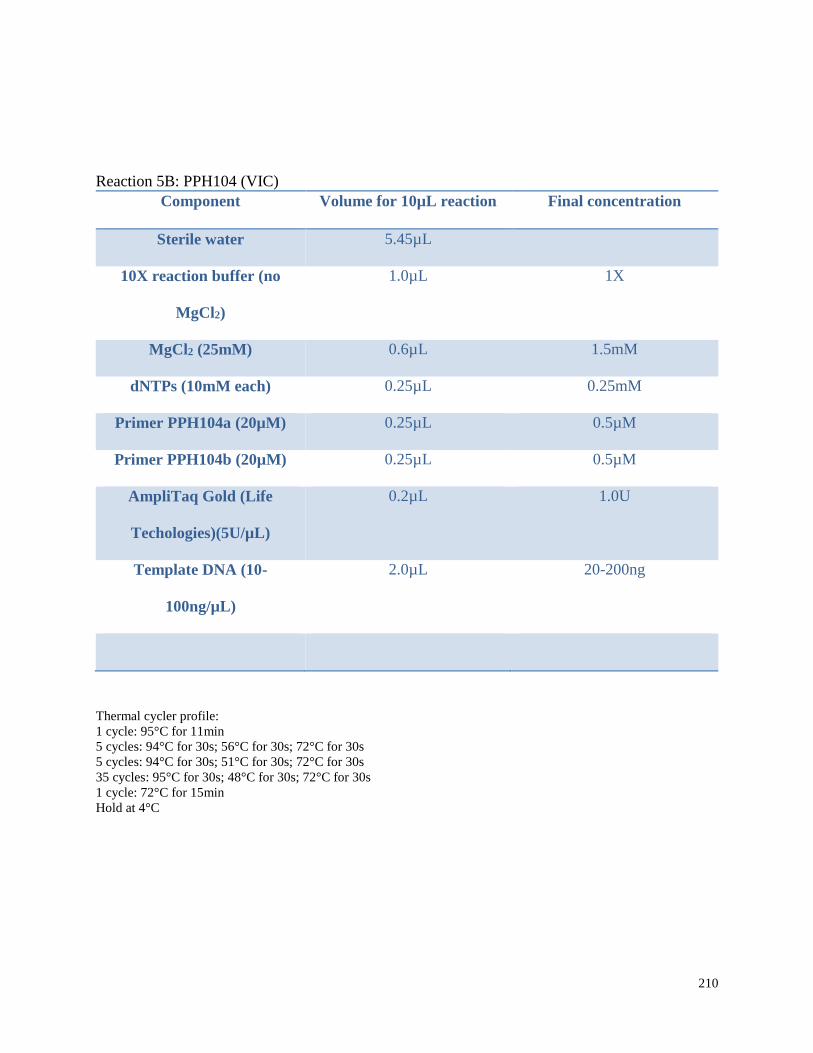
210
Reaction 5B: PPH104 (VIC)
Component Volume for 10µL reaction Final concentration
Sterile water 5.45µL
10X reaction buffer (no
MgCl2)
1.0µL 1X
MgCl2 (25mM) 0.6µL 1.5mM
dNTPs (10mM each) 0.25µL 0.25mM
Primer PPH104a (20µM) 0.25µL 0.5µM
Primer PPH104b (20µM) 0.25µL 0.5µM
AmpliTaq Gold (Life
Techologies)(5U/µL)
0.2µL 1.0U
Template DNA (10-
100ng/µL)
2.0µL 20-200ng
Thermal cycler profile:
1 cycle: 95°C for 11min
5 cycles: 94°C for 30s; 56°C for 30s; 72°C for 30s
5 cycles: 94°C for 30s; 51°C for 30s; 72°C for 30s
35 cycles: 95°C for 30s; 48°C for 30s; 72°C for 30s
1 cycle: 72°C for 15min
Hold at 4°C
211
CHAPTER 4: Mitochondrial genome diversity and phylogenetic patterns among Canadian
belugas (Delphinapterus leucas), with comparisons to narwhal (Monodon monoceros)
mitogenomes
Abstract
For many years, Sanger sequencing portions of the control region (CR) in mitochondrial
DNA (mtDNA) of belugas (Delphinapterus leucas) has provided valuable insight for
conservation and population studies for these whales. However, the advantages of increasing the
overall amount of mtDNA sequence and including mtDNA protein-coding genes for
investigating stock structure and phylogenies has been demonstrated in other species, including
other cetaceans. In this study, a next-generation workflow was developed to sequence complete
mitochondrial genomes (mitogenomes) for population studies of beluga and narwhal (Monodon
monoceros). A total of 106 belugas and 94 narwhals from across each species’ Canadian range
were sequenced, which resulted in complete mitogenomes of 16,385bp and 16,381bp,
respectively, for all samples. Genetic diversity and phylogenetic analyses of beluga mitogenomes
supported previous results found with CR sequence, but more phylogenetic clades were inferred
consistently across methods, and overall node support was much higher. Within beluga clades,
clusters of samples were found that affirm the identification of management units and the
inferred evolutionary relationships of haplotypes using previous methods. Preliminary tests of
selection detected the presence of negative, or purifying, selection on all protein-coding genes of
belugas, particularly for the ND1, CO1 and CO2 genes. However, no signals of positive selection
were detected with the analytical methods used. In contrast to belugas, narwhal mitogenomes
continued to exhibit much lower levels of genetic diversity and offered no improvements
212
compared to previous approaches for resolving phylogenetic relationships among geographic
sample collections. This could be due to insufficient numbers of samples for the analyses. For
both species, especially narwhals, mitogenomic analyses of more samples and samples from
across the species’ global range would improve the interpretation of phylogeographic
relationships, provide better resolution of clades for the estimation of divergence times, and
increase the possibility of finding signals of adaptive selection.
4.1 Introduction
The technological power to characterize an increasing amount of genetic variation, both
neutral and adaptive, in natural populations has changed dramatically in the last five decades
(Allendorf 2017). For at least the last 30 years, molecular markers have been used to investigate
a wide range of population genetic hypotheses for beluga whales (Delphinapterus leucas).
Among the earliest studies, beluga population structure and divergence were examined using
restriction enzyme digestion of mitochondrial DNA (mtDNA) and visualization with Southern
blotting (Southern 1975) to provide the first evidence of two distinct beluga stocks within
Hudson Bay (Helbig et al. 1989). An early study of nuclear variation among different groups of
belugas used immunological techniques (microcomplement fixation) and starch gel
electrophoresis of allozymes, but the approach had limited success for resolving questions of
population sub-structure (Lint et al. 1990). DNA fingerprint analyses with three minisatellite
probes compared belugas from the eastern Beaufort Sea and the St. Lawrence Estuary and
revealed a dramatically lower level of genetic variation in the St. Lawrence Estuary population,
most likely due to a genetic bottleneck from which the population has failed to recover
(Patenaude et al. 1990). Nuclear DNA markers continued to be developed, and variation among
213
beluga populations across a broad geographic range was assessed using the analyses of Major
Histocompatability Complex (MHC) locus DQβ (Murray et al. 1995). The analyses found low
levels of variation overall but did find the High Arctic belugas to be different from all other
beluga populations. Given that these whales shared high frequencies of a particular allele at this
locus with narwhal, also a High Arctic species, the study also concluded that evidence of positive
selection at this locus could be an environmental adaptation to different pathogens encountered
at higher latitudes (Murray et al. 1995).
However, by the mid-1990s, nuclear DNA microsatellites were developed for belugas
(Buchanan et al. 1996) and these became the nuclear markers of choice for genetic investigations
such as population and conservation studies, inferring demographic histories, and the
identification of individual relationships and kin groups (e.g. Maiers (Postma) et al. 1996, Brown
Gladden et al. 1999, O’Corry-Crowe et al. 2010, Turgeon et al. 2012, Colbeck et al. 2012). But
for many beluga conservation studies, analyses of mtDNA has proven more informative for
questions about sub-population structuring, phylogeography, monitoring the impacts of
harvesting on individual stocks, and the genetic origins of populations (e.g. Brennin et al. 1997,
Brown Gladden et al. 1997, de March and Postma 2003, Turgeon et al. 2012, O’Corry-Crowe et
al. 2015). These studies have all relied on the sequencing of differing lengths of control region
(CR) sequence. The hypervariable nature of this portion of mtDNA sequence made it well-suited
for detecting recent mutations inferring, in particular, matriarchal phylogeographic trees,
population sub-structure, dispersal, and historical biogeography (Avise and Ellis 1986, Avise et
al. 1987, Avise 1989, Avise et al. 1989).
As costs become increasingly more affordable to analyze large numbers of samples,
genomic data are now being used to address a wide range of conservation problems such as
214
defining conservation units, assessing the past and present connectivity among and within
species, and assessing adaptive potential (Corlett 2017). In particular, sequencing of complete
mitochondrial DNA genomes (mitogenomes) is allowing comparisons to previous studies that
used a portion or portions of the mitogenome, and subsequently refining conclusions drawn from
those studies. For example, the analyses of complete mitogenome sequences in Eurasian brown
bears (Ursus arctos) had “far greater resolving power than shorter sequences” and provided new
conclusions about population structuring, phylogeography, and demographic history (Keis et al.
2013). Mitochondrial genomes from green turtles (Chelonia mydas) were able to resolve shared
control region haplotypes and improved genetic signal for identifying cryptic population
structure among rookeries (Shamblin et al. 2012). Furthermore, mitogenome sequencing may
have the power to perform mixed stock analysis for the assignment of foraging turtles to natal
sites. Previously undocumented haplotype diversity was found with expanded mitochondrial
genome sequencing of red foxes (Vulpes vulpes), which clarified population structure and
population origins of red foxes in western North America (Volkmann et al. 2015).
Complete mitogenome sequencing offers further advantages for population and
conservation studies of wild species. Analyses of full mitogenomes can investigate diversity
within coding regions of the genome, in particular, the 13 genes associated with the oxidative
phosphorylation system (OXPHOS) that is important for the production of cellular energy
(Ballard and Pichaud 2014). As changes to this metabolic pathway due to mutations in the
protein coding genes can result in fitness and evolutionary consequences, mtDNA sequence
substitutions can play an important role in adaptive evolution within species (da Fonseca et al.
2008). Relating these mutational changes with environmental stressors such as temperature, diet,
changes in hormone levels, and chemical exposure (Ballard and Pichaud 2014) can detect signals
215
of local adaptation within species and populations. Sequence analyses of nine mitochondrial
genes involved in the OXPHOS pathway of Atlantic salmon (Salmo salar) provided evidence of
both purifying and positive selection in ND1, ND3 and ND4 genes that were correlated with a
non-random pattern over a wide latitudinal range (Consuegra et al. 2015). Since some of the
mutations were specific to Arctic populations, the selection on the mtDNA genome was
hypothesized to be related to local metabolic adaptation to cold temperatures (Consuegra et al.
2015). Changes in latitude are not the only environmental gradients over which mtDNA-linked
adaptation can occur. In Chinese snub-nosed monkeys (Rhinopithicus species), evidence of
positive selection in mtDNA ND2 and ND6 genes in one particular species (Rhinopithicus
roxellana) was found to be associated with high altitude and cold temperatures (Yu et al. 2011).
In cetacean species, whole mitogenome sequences have been used to investigate a wide
range of molecular ecology questions including population diversity (e.g. sperm whales
(Physeter macrocephalus) Alexander et al. 2013), phylogenetic relationships (e.g. Delphinidae,
Vilstrup et al. 2011; fin whales (Balaenoptera physalus) Archer et al. 2013), and evolutionary
origins (e.g. Arnason et al. 2004, killer whales (Orcinus orca) Foote et al. 2011a). Whole
mitogenome analyses of killer whales, arguably one of the most studied cetaceans, have revealed
many new insights into the natural history and ecology of this species. Phylogenetic inferences
for killer whales were greatly improved by moving from low diversity control region sequences
to whole mitogenomes (Morin et al. 2010) and strengthened the identification of geographic
ecotypes that formed distinct clades associated with resource specializations (Foote et al. 2011b,
Moura et al. 2015). Evidence of functional adaptation in killer whales, related to metabolic
performance for the cold environment of the Antarctic pack ice, has also been found from the
analyses of mitogenome coding genes (Foote et al. 2011c).
216
Currently, whole mitogenome sequencing has not been explored as a tool for beluga
population ecology and conservation research. Based on studies in other cetacean species, whole
mitogenome sequencing of beluga samples will offer more power to investigate genetic
population diversity, structure, and signals of selection. In this study, the main goal is to assess
the potential advantages of using mitogenomes for population genetic studies of belugas in
Canada. To do this, I have the following objectives:
1. To develop a next-generation sequencing workflow customized for beluga and
narwhal sample templates to generate complete mitochondrial genomes for
population studies;
2. To characterize the genetic diversity, differentiation and phylogenetic relationships of
beluga sample mitogenome haplotypes and compare these results to similar analyses
using only mtDNA control region (CR) haplotypes (as described in Chapter 2);
3. Identify nonsynonymous and synonymous mutations across mtDNA protein-coding
genes in beluga samples to detect indications of selection. This involves comparing
intraspecific polymorphism across beluga sample collections and using between-
species divergence comparisons to narwhal. Based on a previous study (Murray et al.
1995), a comparison of mitogenome protein-coding sequence from high Arctic beluga
samples (Grise Fiord) to samples collected from the most southern Canadian
population of belugas (St. Lawrence Estuary) is the most likely to detect a signal of
positive selection.
217
4.2 Materials and Methods
4.2.1 Sample selection
Beluga whale samples in Canada have been collected for many years through harvest
monitoring programs, research programs such as satellite tagging studies, and occasional
opportunistic sampling of carcases and sloughed skin. Samples in this study have been accessed
from archived tissues (primarily skin and muscle) dating back to the 1980s and held at the
Freshwater Institute, Winnipeg, Manitoba (DFO Central and Arctic). Samples taken in the field
were either frozen or preserved in a salt-saturated 20% DMSO solution (Seutin et al. 1991) and
frozen upon arrival at the lab.
Geographic samples for this study were chosen to cover the full Canadian range of
belugas and include representative samples for each genetically distinct stock identified using
CR mitochondrial DNA sequences (Figure 4.1). All samples used for mitogenome sequencing
were selected, when possible, from July or August to ensure sampling of summer aggregations.
The one exception was the inclusion of beluga samples from ice entrapments around the Belcher
Islands, which were winter samples and considered to be from whales “resident” to southern
Hudson Bay. Within the Beaufort Sea, additional samples were chosen from different
aggregation areas where local subsistence harvest or ice entrapment mortality occurs. These
samples will allow for testing of spatial hypotheses of genetic structure and phylogenetic patterns
from a broad, Canada-wide scale to a local, within-stock scale.
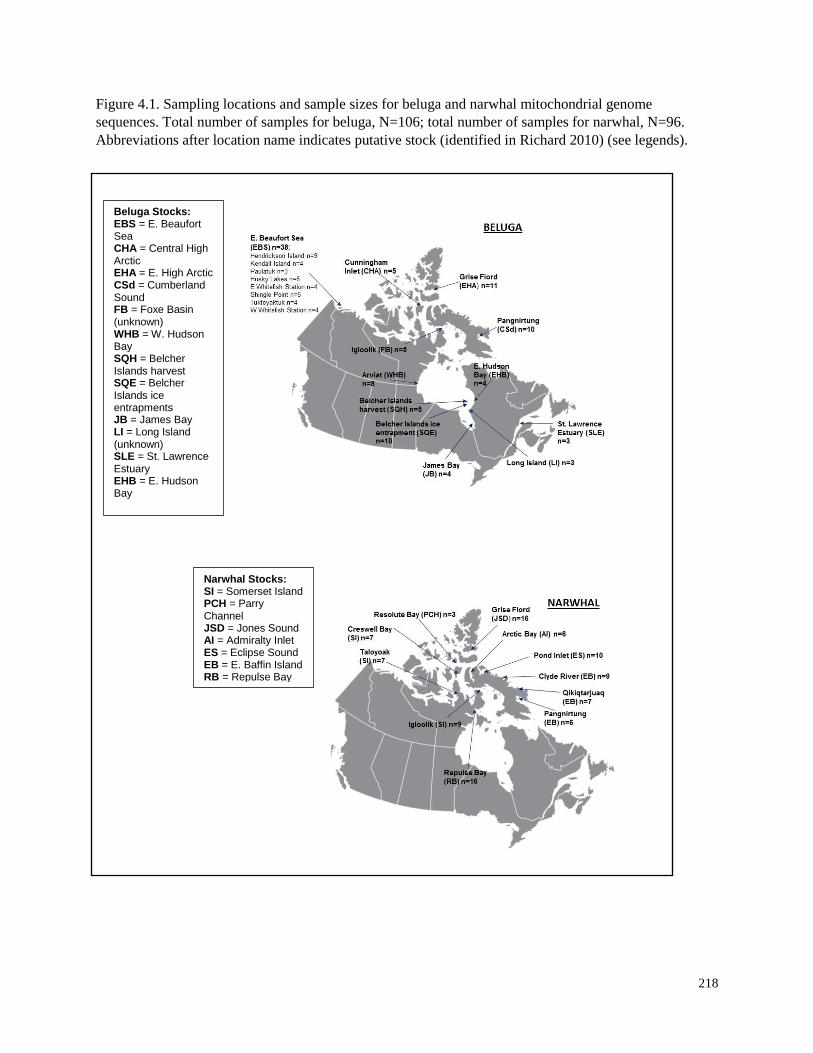
218
Figure 4.1. Sampling locations and sample sizes for beluga and narwhal mitochondrial genome
sequences. Total number of samples for beluga, N=106; total number of samples for narwhal, N=96.
Abbreviations after location name indicates putative stock (identified in Richard 2010) (see legends).
Beluga Stocks: EBS = E. Beaufort Sea CHA = Central High Arctic EHA = E. High Arctic CSd = Cumberland Sound FB = Foxe Basin (unknown) WHB = W. Hudson Bay SQH = Belcher Islands harvest SQE = Belcher Islands ice entrapments JB = James Bay LI = Long Island (unknown) SLE = St. Lawrence Estuary EHB = E. Hudson Bay
Narwhal Stocks: SI = Somerset Island PCH = Parry Channel JSD = Jones Sound AI = Admiralty Inlet ES = Eclipse Sound EB = E. Baffin Island RB = Repulse Bay
219
Specific samples for each stock were chosen on the basis of CR haplotypes identified
using 702bp of mtDNA sequence (Chapter 2), and included both haplotypes that were unique to
a particular stock (see Appendix 4.1) and haplotypes that were indicated by phylogenetic
analyses to be ancestral haplotypes (found in high overall proportions and/or sampled in almost
every stock i.e. E02, E11, E72, E120, E16, E18). This selection strategy was used to encompass
the widest possible range of mutational motifs previously found among Canadian belugas (e.g. as
in Achilli et al. 2012).
For all locations except the central High Arctic (Cunningham Inlet), beluga tissue
samples for genetic analyses were taken from dead animals or from satellite tagging programs
where there was confidence that replicate sampling of individuals did not occur. The
Cunningham Inlet samples were collected from sloughed beluga skin washed onto shore by high
wave action. These tissues were all previously analyzed using 15 microsatellite loci and replicate
samples of individuals identified using GenAlEx ver. 6 (Peakall and Smouse 2006). Only skin
samples from unique individuals from this location were included in analyses for this study.
Narwhal samples, representing seven of the eight potential summer stocks in Canada
(Higdon and Ferguson 2017, Figure 4.2), were also sequenced for inter-species comparisons with
the beluga mitogenome dataset (Figure 4.1). Narwhals and belugas are the only extant members
of the odontocete family Monodontidae and are estimated to have diverged approximately 6.28
Mya (McGowan et al. 2009). In contrast to belugas and most other cetaceans, narwhals have a
very low level of variation in CR mitochondrial DNA sequence that is thought to stem from
recent expansion from a small founding population (Palsböll et al. 1997, de March et al. 2003).
This low diversity of mtDNA is not unique to narwhal and has been observed in other species of
whales with matrilineal population structure such as pilot whales (Globicephala sp.), sperm
220
whales and killer whales (Whitehead et al. 1998). It has also frustrated past attempts to
genetically distinguish summering stocks of narwhals in Canada that are part of the Baffin Bay
narwhal population (de March et al. 2003).
Narwhal samples have also been collected in Canada over a similar timeframe as belugas,
and are also available mostly due to harvest monitoring programs and research programs
involving satellite tagging studies. Tissue samples collected for genetic analyses were also
preserved in the field either by freezing or in a salt-saturated 20% DMSO solution (Seutin et al.
1991) and frozen upon arrival at the lab.
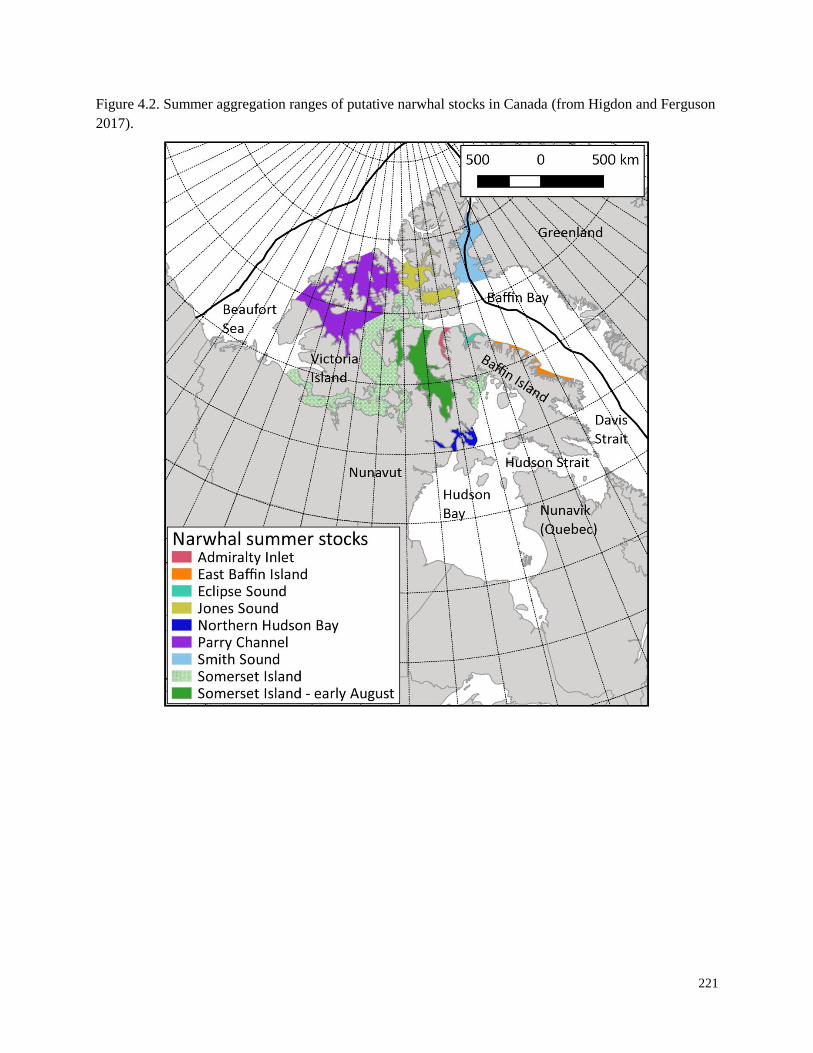
221
Figure 4.2. Summer aggregation ranges of putative narwhal stocks in Canada (from Higdon and Ferguson
2017).
222
4.2.2 Complete mitochondrial genome sequencing
For this thesis, a novel workflow was developed to generate complete beluga and narwhal
mitochondrial genome sequences using an Ion Torrent Personal Genome Machine (PGM™)
system (ThermoFisher Scientific/Life Technologies, Carlsbad, CA, USA). During the time data
were collected, a complete mitochondrial genome had not been produced or published for
belugas; however, a complete mitogenome was available in GenBank for narwhal (accession
#AJ554062).
Total cellular DNA extractions from whale skin samples were performed using DNeasy
Blood and Tissue kits (Qiagen Inc., Valencia, CA, USA) according to the manufacturer’s
protocols. Primers were developed to amplify the entire mitochondrial genome using two long-
range PCR amplifications based on the narwhal mitogenome sequence from GenBank and
designed using GenBank Primer-BLAST software. Primers were selected within the Cytb and
CO1 gene coding regions and were designated Delmtg-1 (forward primer: CAA TAC ACT ACA
CAC CAG ACA CC; reverse primer: GCT AGG ACA GGT AGT GAT AGT AGG) and
Delmtg-2 (forward primer: CTT GTCCCT TTA ATA ATC GGA GCC; reverse primer: TCT
GGT GTG TAG TGT ATT GCT AGG). These primer sets were used to amplify two long-range
PCR amplicons (target amplicon sizes 8.2kb for Delmtg-1 and 8.6kb for Delmtg-2) using the
SequalPrep™ Long PCR Kit with dNTPs (ThermoFisher Scientific/Life Technologies).
Amplification reaction mixtures were prepared in 20μL volumes containing 2μL 10X reaction
buffer, 0.4μL dimethyl sulphoxide (DMSO), 1μL 10X enhancer B, 0.36μL long polymerase
(1.8U), 14.24 μL DNase-free water, and 1 μL of primer set (500nM final concentration). The
PCR reactions were performed under the following conditions: 30 cycles of 94⁰C for 10s, 59⁰C
(for Detmtg-1 primer set) or 55⁰C (for Delmtg-2 primer set) for 30s, 68⁰C for 8min; and a final
223
extension of 72⁰C for 5min. Amplification products were visualized on 0.8% agarose gels,
compared to a 1kb DNA ladder, and assessed for quality and expected size. Successfully
amplified samples were purified using QIAquick PCR Purification kits (Qiagen Inc.) using
manufacturer protocols and eluted into 50μL of nuclease free water. After purification,
individual amplicon concentrations were determined using a NanoDrop UV-Vis
Spectrophotometer (ThermoFisher Scientific) and the Delmtg-1 and Delmtg-2 amplicons were
pooled in equimolar amounts (250ng of each amplicon for a total of 500ng template DNA) for
library construction.
Amplicon libraries were prepared using Ion Shear Plus Fragment Library kits
(ThermoFisher Scientific/Life Technologies) using the manufacturer’s recommended protocols.
Enzymatic shear times were optimized for each set of samples prepared, but in most reactions
were 7 minutes (range 5–8 minutes). Fragmented amplicons were purified using a Serapure
protocol (Faircloth and Glenn 2011) and libraries prepared using manufacturer protocols for end
repair and ligation of barcodes to identify individual samples during PGM sequencing. The
unamplified library was size selected using 2% agarose gel electrophoresis (E-Gel system,
ThermoFisher Scientific/Life Technologies) and a 50bp DNA ladder to yield library fragments of
approximately 200bp. Resulting 200bp fragment libraries were amplified in approximately 50μL
reaction volumes (47μL master mix containing 40μL Platinum PCR mix, 2μL Library
amplification primer mix, and 5μL nuclease-free water; plus 3-5μL fragmented sample) using
the following conditions: 1 cycle of 95⁰C for 5min.; 15 cycles of 95⁰C for 15s, 58⁰C for 15s,
70⁰C for 1min; and a final hold at 4⁰C. Amplification products were assessed using 2% agarose
gel electrophoresis, purified with Serapure, and size-selected again (as above) to isolate 200bp
amplified libraries. Individual sample libraries were analyzed to determine relative quality,
224
confirm fragment size profiles, and quantify concentration using a BioAnalyzer (Agilent
Technologies, Santa Clara, CA, USA) with the High Sensitivity DNA Kit (Agilent
Technologies). Each sample library was diluted to 100pM concentration and samples (generally
32 samples, range 16-37) pooled in equimolar amounts into a final 100pM barcoded library pool.
Sequencing template preparation of the diluted library pool was performed with an Ion
OneTouch 2 Instrument using the Ion PGM template OT2 200 (ThermoFisher Scientific/Life
Technologies) according to the manufacturer’s protocols with 2.5-3μL of library pool. At the end
of template preparation, 2μL of the unenriched, template-positive Ion Sphere Particles (ISPs)
were assessed for the percentage of template ISPs using an Ion Sphere Quality Control kit
(ThermoFisher Scientific/Life Technologies) and Qubit 2.0 Fluorometer (ThermoFisher
Scientific/Life Technologies) according to the recommended protocols. All PGM sequencing
reactions in this study contained 19–23% template ISPs, all within the recommended range of
10-30% ( Ion PGM Template OneTouch 2 200 kit User Guide, ThermoFisher Scientific/Life
Technologies). Sequencing of templated ISPs was conducted using an Ion PGM 200 or Ion PGM
Hi-Q Sequencing kit and an Ion 316 or 318 Chip on an Ion Torrent Personal Genome Machine
(PGM) (ThermoFisher Scientific/Life Technologies) following the manufacturer protocols.
4.2.3 Complete mitochondrial genome assembly
The raw sequencing reads from the PGM were quality filtered, and adapters and barcodes
were trimmed using post-sequencing processing with the PGM Torrent Suite Software ver.
4.2.1(ThermoFisher Scientific/Life Technologies). The extracted reads were assembled using the
SeqMan NGen, SeqMan Pro, and MegAlign Pro programs contained in the LaserGene software
package from DNAStar (Madison, WI, USA).
225
To create a reference sequence for belugas, PGM data for 16 beluga samples representing
each of the putative stocks were assembled using the de novo genome workflow in SeqMan
NGen. Based on the results, the sample with the fewest number of contigs of large size was
chosen (sample 98SLE003) to then be reassembled and aligned to the narwhal GenBank
mitogenome sequence (accession #AJ554062) using the reference-guided genome workflow in
SeqMan NGen with a minimum match percentage of 90%. The resulting reference sequence
assembly was analyzed in SeqMan Pro where mismatches and sequencing errors were manually
corrected, and a draft beluga reference sequence created. The original PGM data for the draft
reference sequence was then reassembled to the new reference so that any remaining errors could
be manually corrected. No structural variants were detected. As further confirmation that there
were no unresolved insertions, the unassembled sequence reads from the reference sample data
were de novo assembled in SeqMan NGen. The contigs that resulted from this analysis had very
thin coverage, and alignment with the beluga consensus reference using MegAlign Pro
confirmed they were not insertion elements. Reassembly of the original raw PGM reference
sample data to the new beluga consensus sequence produced an assembly with relatively few
(<50) consensus disagreements, mostly due to homopolymeric errors and misassembly of small
repeat elements. These positions were manually edited from the sequence, and it was saved as
the final beluga consensus reference sequence for reference-guided genome assembly of all
remaining beluga samples. All resulting beluga mitogenome sequences were aligned with the
beluga mitogenome reference using MegAlign Pro and edited for errors. Raw PGM data for all
narwhal samples were assembled using the NGen reference-guided assembly workflow with the
GenBank narwhal mitogenome sequence as a reference. All resulting narwhal consensus
226
sequences were aligned with the GenBank reference using MegAlign Pro to check for errors
which were subsequently corrected.
A published complete beluga mitochondrial genome (derived from a beluga originating
in Russia) was published in early March 2017 (Kim et al. 2017). This sequence was obtained
from GenBank (accession #KY444734) and included with all beluga samples in this study and
aligned using MEGA ver. 6 (Tamura et al. 2013). Based on the published beluga mitogenome,
all samples in this study were again edited to remove any errors in the sequence, especially
homopolymer errors, which are known to be a problem associated with the flow-based
chemistries used by the PGM (Loman et al. 2012). Narwhal sequences were also aligned with the
GenBank narwhal reference using MEGA ver. 6 (Tamura et al. 2013), and sequences again re-
examined for potential errors. All errors were corrected and final sequence alignments for each
species retained for data analyses.
Individual sample sequences were refined with further inspection and haplotypes were
identified using GenAlEx ver. 6.5 (Peakall and Smouse 2012). GenAlEx data review options
highlighted polymorphic sites in the sequences and ambiguous positions in individual samples
(“R”, “Y”, or spurious deletions), which were then identified and edited in the MEGA
alignments (ver. 6, Tamura et al. 2013) of all sequences. Through iterations of this process, final
alignments of complete mitogenomes for all samples were created using MEGA and haplotypes
assigned using GenAlEx.
4.2.4 Mitogenome sequence variability and differentiation among sample collections
Mitogenome haplotype frequencies and distributions were evaluated and compared to the
patterns revealed using CR region sequences. The number of polymorphic sites, parsimony
227
informative sites, different haplotypes (NH), haplotype diversity (h), nucleotide diversity (π), and
the average number of nucleotide differences (k) within sample collections were determined
using DnaSP ver. 5.1 (Librado and Rozas 2009). The genetic differentiation among all Canada-
wide geographic samples was assessed using analysis of molecular variance (AMOVA) between
and within the sample collection groups and pairwise ΦST comparisons using Arlequin ver. 3.5
(Excoffier and Lischer 2010). Tajima’s D statistic (Tajima, 1989) and Fu’s FS test statistic (Fu
1997) were used to assess departures from an evolutionary model of neutral mutation. These
tests are slightly different as Tajima’s D uses information from the mutation frequency and Fu’s
FS uses information from the haplotype distribution (Ramos-Onsins and Rozas 2002). Both
statistics were determined using Arlequin ver. 3.5 and significance was tested using 10,000
coalescent simulations. Significantly negative Tajima’s D tests and Fu’s FS tests are considered
to be indicative of population expansion.
4.2.5 Phylogenetic analyses of complete mitogenome sequences
Unrooted median-joining phylogenetic networks using complete mitogenome sequence
haplotypes representing the entire Canada-wide beluga sample collections i.e. with Hendrickson
Island samples only representing the Eastern Beaufort Sea (EBS) stock (N=77), and for the EBS
samples only (N=38), were constructed using Network ver. 5.0 (www.fluxus-engineering.com).
Different network parameters were explored using default values (no weighting), weighting of
variable positions based on transversion:transition ratios of 1:1 and 3:1, and by “down”
weighting hypervariable positions within the control region (Fluxus Engineering 2015). For both
networks, different epsilon values were set after determining the maximum unweighted pairwise
difference from a mismatch distribution analysis of the samples. For the Canada-wide network,
228
epsilon values of 10 (recommended, Fluxus Engineering 2015), 50 and 160 (maximum
unweighted pairwise difference) were used. For the EBS only samples, epsilon values of 10 and
40 (maximum unweighted pairwise difference) were used. For all networks, the “Greedy FHP”
method for distance calculation (Foulds et al. 1979) was selected and so was the MP (maximum
parsimony) option that identifies and eliminates unnecessary median vectors and links. The
resulting network was drawn and modified for clarity using Network Publisher ver. 2.0
(http://www.fluxus-engineering.com/nwpub.htm).
Evolutionary histories among beluga and narwhal samples were also investigated using
phylogenetic trees based on complete mitogenome sequences, which also allows for the
characterization of potential population subdivision through the identification of lineages with a
common ancestor (Nichols 2001). The most appropriate substitution model for the data was
determined using methods contained within MEGA ver. 6 (Tamura et al. 2013). The optimal
model was selected based on the lowest Akaike Information Criterion (AIC) and Bayesian
Information Criterion (BIC) scores and was considered to best describe the substitution pattern in
the data.
Neighbour-Joining (NJ) trees were used to infer evolutionary histories among all beluga
samples (N=106) and all narwhal samples (N=93) and included outgroup mitogenome sequences
from the Indo-Pacific finless porpoise (Neophocaena phocaenoides) and the narrow-ridged
finless porpoise (Neophocaena asiaorientalis) obtained from GenBank (accession numbers
NC_021461 and NC_026456 respectively). The evolutionary distance for both trees was
computed using the TN93 model (Tamura and Nei 1993) based on model selection results in
MEGA ver. 6 analyses. A bootstrap consensus tree inferred from 1000 replicates was retained
and major clades with bootstrap support of 80% or greater identified.
229
Phylogenetic analysis by maximum likelihood (ML) (an approach that infers an
evolutionary tree that makes the data most likely, Hall 2011) was implemented in the online
version of PhyML ver. 3.0 (Guindon et al. 2010). All beluga sample mitogenome sequences
(N=106) were submitted, and the substitution model TN93 (Tamura and Nei 1993) was selected.
The equilibrium frequencies, the transition:transversion ratio and the proportion of invariable
sites were all estimated. The number of substitution rate categories was 4, and the gamma shape
parameter was estimated by the program. Tree searches used a BIONJ tree as a starting tree, and
the tree topology improvement was assessed using SPR (subtree pruning and regrafting
topological moves, Hordijk and Gascuel 2005). This method is recommended for datasets larger
than 50 sequences and where a weak phylogenetic signal is expected (Guindon 2012). Branch
support was estimated using the approximate likelihood ratio test (“aLRT SH-like” option)
(Anisimova and Gascuel 2006) and using bootstrap resampling of 1000 random replicates.
A Bayesian inference (BI) approach was also used to estimate a phylogenetic tree;
however, the tree that is produced in this analysis is the one that is most likely given the data and
the substitution model selected (Hall, 2011). The BI analyses of beluga samples (N=106) were
conducted using MrBayes ver. 3.2.5 (Ronquist et al. 2012) executed on the CIPRES
(Cyberinfrastructure for Phylogenetic Research) Science Gateway ver. 3.1 (Miller et al. 2010).
Analyses used two parallel independent runs each consisting of four simultaneous chains (one
“heated chain” and three “cold” chains). The optimal substitution model for the data, the NST
parameter of the likelihood model, was set to ‘2’ which encompasses the K2, HKY, T3P and
TN93 models (Ronquist et al. 2011). Similarly, the rates parameter was set to ‘invgamma’,
which indicates that a proportion of the sites are invariable and that the rate for the remaining
sites should be drawn from a gamma distribution. This distribution is approximated using four
230
categories, and the proportion of invariable sites was estimated from a uniform distribution. All
priors for the phylogenetic model were left at the default parameters; therefore, no molecular
clock was assumed, rate heterogeneity was modelled by the analyses, and any combination of
base frequency was given equal prior weight. The two concurrent runs of 10,000,000 generations
were sampled every 1000 generations to assess for convergence using an evaluation of the
standard deviation of the split frequencies between runs and a Potential Scale Reduction Factor
(PRSF) convergence diagnostic (Ronquist et al. 2011). The effective sample sizes (ESS) of
parameters sampled from the MCMC analysis and the overall trace data were also evaluated
using a 25% burn-in applied by Tracer ver. 1.6 (Rambaut et al. 2014). A 50% majority-rule
consensus tree was then constructed to summarize the posterior probabilities for each identified
clade.
4.2.6 Mitogenome codon substitution patterns and evidence of selection
Sequences containing only the concatenated mtDNA protein-coding genes (PCG) were
created for both the beluga and narwhal datasets. In each case, the GenBank reference sequence
(accession #KY444734 for beluga and accession #AJ554062 for narwhal) was imported into the
SeqBuilder program contained in the LaserGene software package from DNAStar (Madison, WI,
USA). After the PCG annotations had been applied, the non-coding portions of the sequence
were edited out and the resulting concatenated sequence exported as a new PCG reference. The
beluga and narwhal samples were aligned to their respective PCG reference sequence using
MEGA ver. 6 and edited to remove the non-coding regions. All beluga samples and ten narwhal
samples representing six putative narwhal stocks were combined into a final dataset with
identical haplotypes removed so only unique haplotypes were included. Nucleotide diversity (π)
231
of the mtDNA genes in beluga and the interspecific nucleotide divergence (Dxy , the average
number of nucleotide substitutions per site between species) between beluga and narwhal
mitogenomes were calculated using pairwise comparisons made with DnaSP ver. 5.1 (Librado
and Rozas 2009).
Natural selection and its influence on the evolution of protein-coding genes (PCGs) is
commonly studied by measuring the ratio ω = dN/dS or KA/KS, or the rates of non-synonymous
(dN or Ka = the mean number of nucleotide substitutions per 100 nonsynonymous sites) to
synonymous nucleotide substitutions (dS or Ks= the mean number of nucleotide substitutions per
100 synonymous sites) (Nei and Gojobori 1986). It is assumed that ω > 1 indicates positive
selection where replacement substitutions increase fitness, ω = 1 indicates neutrality, and ω < 1
indicates negative, or purifying, selection (Nozawa et al. 2009). Using DnaSP ver. 5.1, KA/KS (ω)
estimates were determined for each of the H-strand mtDNA protein coding genes in beluga to
determine if there was evidence of selective pressure on a particular gene or set of genes.
A codon-based Z-test of selection, implemented in MEGA ver. 6 (Tamura et al. 2013),
was used to perform a distance-based sequence analysis of the beluga clades to estimate the
average number of synonymous and nonsynonymous substitutions that have occurred in the
PCGs. Estimates of dN and dS were calculated, along with the variance of the difference between
these two quantities using the bootstrap method (1000 replicates), to test the null hypothesis that
dN = dS (neutrality) (Nei and Gojobori 1986) using a Z-test (Nei and Kumar 2000). Rejection of
this null hypothesis could indicate positive selection (dN > dS) or negative selection (dN < dS).
The McDonald-Kreitman (MK) test (McDonald and Kreitman 1991), executed in the
DnaSP program, was also used to test for indications of adaptive protein evolution in the beluga
clades identified by phylogenetic analyses. In this test, the ratio of nonsynonymous (amino-acid
232
altering) to synonymous changes within species are compared to the ratio of nonsynonymous to
synonymous changes between species (Meiklejohn et al. 2007). Under a prediction of neutrality
(no selection), the ratio of replacement (nonsynonymous) to silent (synonymous) changes
observed between species should equal the ratio of replacement to silent changes between
species (McDonald and Kreitman 1991). Departures from this neutrality can be evaluated using
the Neutrality Index (NI) (Rand and Kann 1996, Meiklejohn et al. 2007), where NI = 1.0
indicates neutrality, NI < 1.0 indicates negative selection (detected as an excess of amino acid
divergence), and NI > 1.0 indicates positive selection (detected as an excess of amino acid
polymorphism) (Meiklejohn et al. 2007). Narwhal mitogenome sequences (N=10) were used for
interspecific comparisons to the beluga clades.
Many methods that use dN/dS or KA/KS ratios to assess selection pressure in particular
DNA regions may lack the statistical power to detect positive selection, as only a few sites may
be affected (Kosakovsky Pond and Frost 2005). To perform this type of analysis, methods that
specifically identify signals of positive selection were used in the software package HyPhy
(Kosakovsky Pond et al. 2005) found at the Datamonkey server (Poon et al. 2009). This analysis
has the advantage of including the evolutionary history of the sequences, in the form of a
phylogenetic tree, along with site-by-site analysis over multi-gene data sets (Kosakovsky Pond et
al. 2005) that enables the identification of both codons and lineages under selection (Poon et al.
2009).The PhyML program was used to infer a maximum-likelihood (ML) tree for the
concatenated protein-coding gene sequences of the 87 (N=86 Canadian samples + reference
sequence) unique beluga mitogenome haplotypes (same settings used for the complete
mitogenome tree and aLRT-SH branch support). These sequences and the ML tree were used as
inputs for the “Positive Selection” option in HyPhy with several approaches for estimating the
233
ratios of nonsynonymous and synonymous changes (dN/dS): the multirate fixed effects likelihood
(FEL) method that estimates dN/dS for each site; the single likelihood ancestor counting (SLAC)
method that counts the numbers of synonymous and nonsynonymous substitutions along the
phylogeny (Kosakovsky Pond and Frost 2005); and the branch site REL (BSR) method that
allows evolutionary rate variation along branches and sites simultaneously (Kosakovsky Pond et
al. 2011). These methods were chosen on the basis of computational demands for the beluga
dataset, but with enough of a range of approaches to allow for consensus-based inference of the
results and to avoid false positives (Kosakovsky Pond et al. 2007).
4.3 Results
4.3.1 Complete mitogenome sequencing workflow for beluga and narwhal
A total of 115 beluga samples and 105 narwhal samples, representing broad (and fine-
scale for belugas) geographic distribution over the Canadian range of each whale, were
processed using the next-generation sequencing workflow developed for this study. Each step of
the analysis pipeline was refined to address limitations in laboratory infrastructure while at the
same time optimizing sample throughput and quality control measures. For each sequencing run,
bases were filtered to include only those with quality scores greater than or equal to Q20. These
quality scores, or Phred scores (Ewing et al. 1998), reflect the probability of base call error
(Huse et al. 2007). A Phred quality score of 20 indicates a 0.01 probability of an incorrect base
call (or 99% base call accuracy). While these scores can give a general sense of base-calling
error rate, the information from quality scores does not describe error patterns (Li et al. 2004).
These patterns were considered in the final assembly of consensus sequences for each sample.
As a result, of the 115 beluga samples processed, raw data (reads) for 108 samples were
234
available for assembly. The number of narwhal samples was reduced from 105 samples
sequenced to a total of 96 samples for assembly.
In general, the number of reads covering the same regions of the genome (read depth),
the evenness of the read coverage along the entire genome, the length of the reads, and the read
quality are the major indicators of the quality of the assembled, reconstructed genome sequences
(e.g. Loman et al. 2012). Across all runs, the quality parameters for beluga and narwhal samples
were very good, with large numbers of reads of tightly distributed and consistent read lengths
(Table 4.1). Beluga and narwhal sample sequencing depth varied across the full mitogenome and
ranged from 200- to over 3500-fold coverage (Figure 4.3a), with the exception of a few samples
that had read depth that ranged from 1- to 120-fold and incomplete coverage across the full
mitogenome (Figure 4.3b). Samples with poor read depth or coverage were discarded (N=2
beluga; N=3 narwhal). For both beluga and narwhal sample mitogenome assemblies, insertions
and deletions of single nucleotides were the most common errors in the sequencing reads. These
homopolymer errors are known to be the dominant type of error in PGM sequencing (e.g. Loman
et al. 2012, Bragg et al. 2013, Zhang et al. 2015). All of these errors (approximately 65 in total,
or 0.4% of total nucleotides) were edited out of the final sequences as described in Section 4.2.3,
leaving only polymorphic variable sites. Overall, a total of 106 complete beluga mitogenome
sequences comprised of 16,386bp were retained for further analyses. For narwhal, the complete
mitogenomes (16,381bp) of 93 samples were retained.
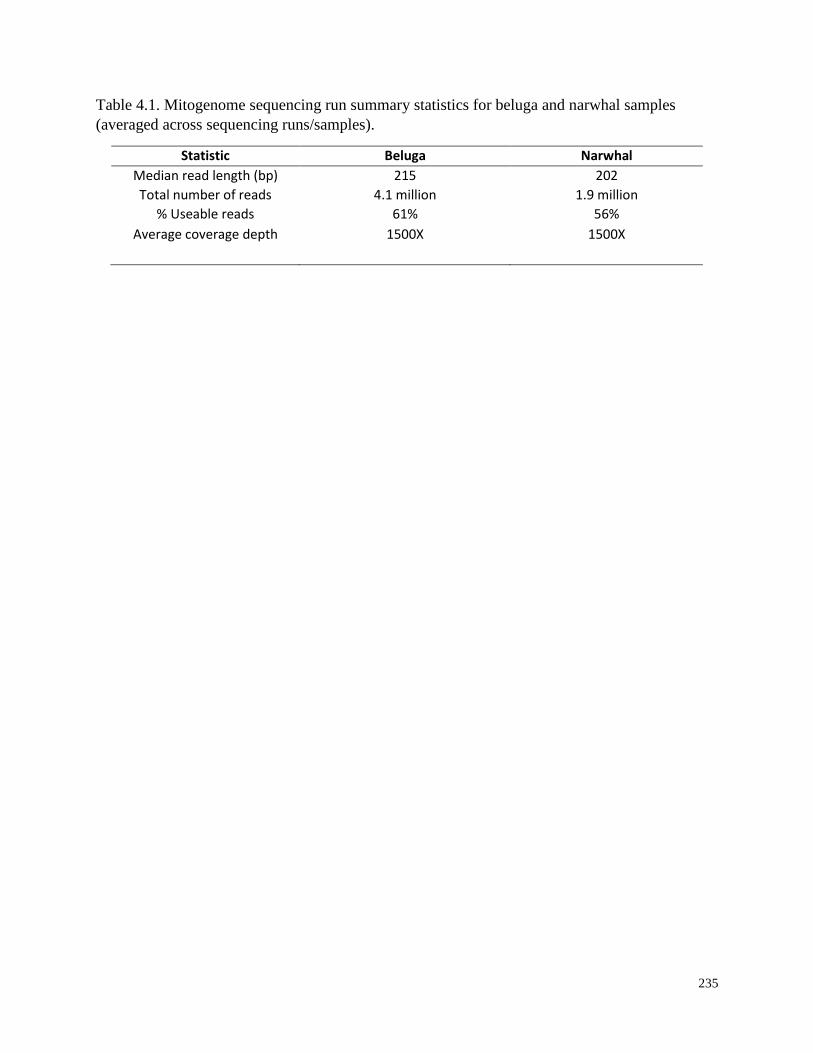
235
Table 4.1. Mitogenome sequencing run summary statistics for beluga and narwhal samples
(averaged across sequencing runs/samples).
Statistic Beluga Narwhal
Median read length (bp) 215 202
Total number of reads 4.1 million 1.9 million
% Useable reads 61% 56%
Average coverage depth 1500X 1500X
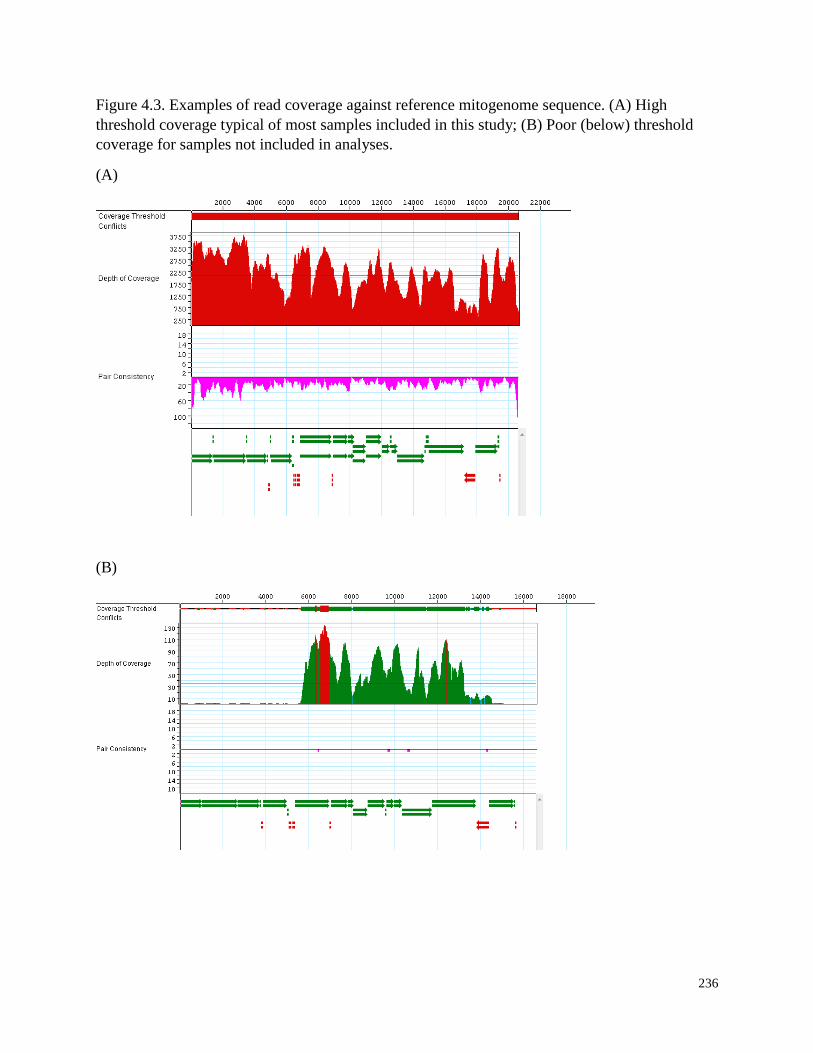
236
Figure 4.3. Examples of read coverage against reference mitogenome sequence. (A) High
threshold coverage typical of most samples included in this study; (B) Poor (below) threshold
coverage for samples not included in analyses.
(A)
(B)
237
4.3.2 Mitogenome sequence data analysis
Multiple alignments of samples for each species were created with GenBank
mitogenomes as reference sequences to assess variability. For beluga samples, one variable
position could not be resolved with confidence. This position (at 15,476), in the control region,
was deleted from both the reference and Canadian samples, resulting in a final mitogenome
sequence length for beluga of 16,385bp. The Canadian narwhal samples contained two deleted
positions compared to the GenBank reference, both again occurring in the control region
(positions 15,469 and 15,483). Each of these positions was deleted from the reference to align it
with the Canadian samples, resulting in a final narwhal mitogenome sequence of 16,381bp.
Overall, there were 305 variable mitogenome positions observed in the Canadian beluga
samples (N=106) and 151 variable positions in the narwhal sample mitogenomes (N=94) (Table
4.2). For belugas, 240 of the variable sites were found in mtDNA coding regions, resulting in
173 synonymous changes (72.1%) and 67 nonsynonymous (replacement) changes (27.9%).
Narwhal samples had 118 of the total variable positions in coding regions, with 86 sites resulting
in synonymous changes (72.9%) and 32 positions with variations leading to replacement changes
(27.1%). The patterns of variation over the complete mitogenomes for each species were
different (Figure 4.4), most notably in the control region. Beluga mitogenomes for the samples in
this study had 33 variable positions in 916bp of control region sequences (3.6% variability).
Narwhal, as found in previous studies (Palsbøll et al. 1997, de March et al. 2003), had much
lower variability than beluga in the control region, with 12 variable positions in 913bp of
sequence (1.3% variability).
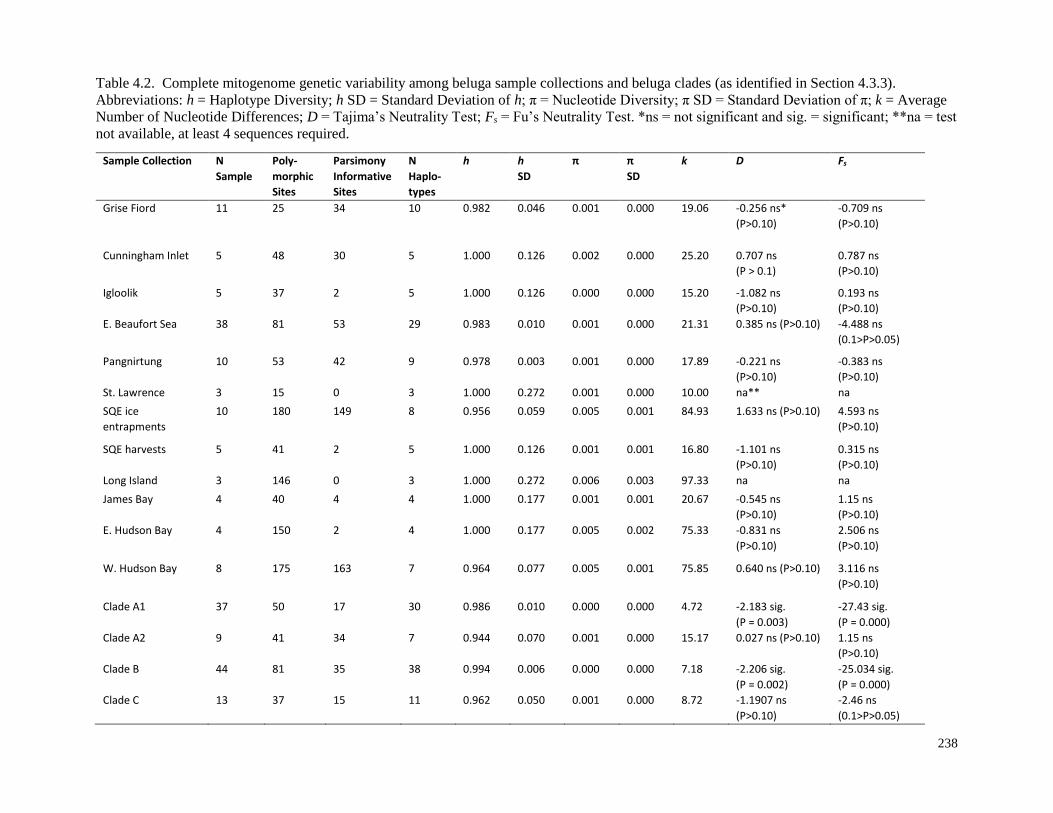
238
Table 4.2. Complete mitogenome genetic variability among beluga sample collections and beluga clades (as identified in Section 4.3.3).
Abbreviations: h = Haplotype Diversity; h SD = Standard Deviation of h; π = Nucleotide Diversity; π SD = Standard Deviation of π; k = Average
Number of Nucleotide Differences; D = Tajima’s Neutrality Test; Fs = Fu’s Neutrality Test. *ns = not significant and sig. = significant; **na = test
not available, at least 4 sequences required.
Sample Collection N
Sample
Poly-
morphic
Sites
Parsimony
Informative
Sites
N
Haplo-
types
h h
SD
π π
SD
k D Fs
Grise Fiord 11 25 34 10 0.982 0.046 0.001 0.000 19.06 -0.256 ns*
(P>0.10)
-0.709 ns
(P>0.10)
Cunningham Inlet 5 48 30 5 1.000 0.126
0.002 0.000 25.20 0.707 ns
(P > 0.1)
0.787 ns
(P>0.10)
Igloolik 5 37 2 5 1.000 0.126 0.000 0.000 15.20 -1.082 ns
(P>0.10)
0.193 ns
(P>0.10)
E. Beaufort Sea 38 81 53 29 0.983 0.010 0.001 0.000 21.31 0.385 ns (P>0.10) -4.488 ns
(0.1>P>0.05)
Pangnirtung 10 53 42 9 0.978 0.003 0.001 0.000 17.89 -0.221 ns
(P>0.10)
-0.383 ns
(P>0.10)
St. Lawrence 3 15 0 3 1.000 0.272 0.001 0.000 10.00 na** na
SQE ice
entrapments
10 180 149 8 0.956 0.059 0.005 0.001 84.93 1.633 ns (P>0.10) 4.593 ns
(P>0.10)
SQE harvests 5 41 2 5 1.000 0.126 0.001 0.001 16.80 -1.101 ns
(P>0.10)
0.315 ns
(P>0.10)
Long Island 3 146 0 3 1.000 0.272 0.006 0.003 97.33 na na
James Bay 4 40 4 4 1.000 0.177 0.001 0.001 20.67 -0.545 ns
(P>0.10)
1.15 ns
(P>0.10)
E. Hudson Bay 4 150 2 4 1.000 0.177 0.005 0.002 75.33 -0.831 ns
(P>0.10)
2.506 ns
(P>0.10)
W. Hudson Bay 8 175 163 7 0.964 0.077 0.005 0.001 75.85 0.640 ns (P>0.10) 3.116 ns
(P>0.10)
Clade A1 37 50 17 30 0.986 0.010 0.000 0.000 4.72 -2.183 sig.
(P = 0.003)
-27.43 sig.
(P = 0.000)
Clade A2 9 41 34 7 0.944 0.070 0.001 0.000 15.17 0.027 ns (P>0.10) 1.15 ns
(P>0.10)
Clade B 44 81 35 38 0.994 0.006 0.000 0.000 7.18 -2.206 sig.
(P = 0.002)
-25.034 sig.
(P = 0.000)
Clade C 13 37 15 11 0.962 0.050 0.001 0.000 8.72 -1.1907 ns
(P>0.10)
-2.46 ns
(0.1>P>0.05)
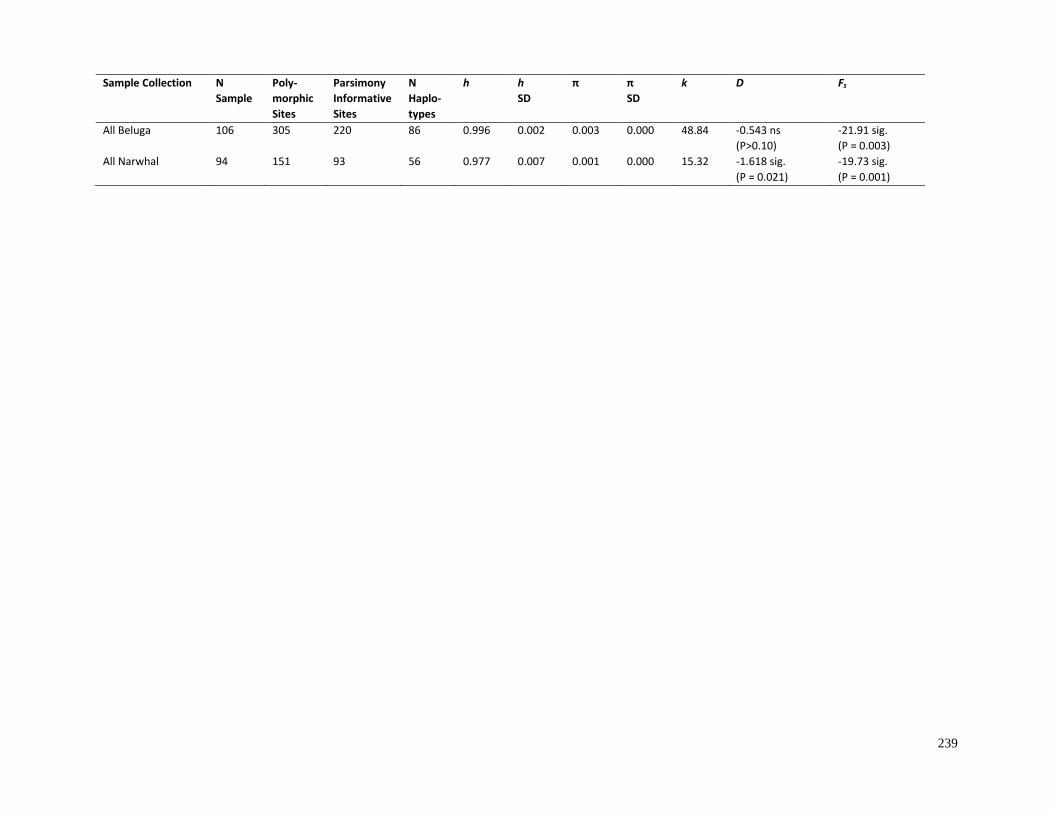
239
Sample Collection N
Sample
Poly-
morphic
Sites
Parsimony
Informative
Sites
N
Haplo-
types
h h
SD
π π
SD
k D Fs
All Beluga 106 305 220 86 0.996 0.002 0.003 0.000 48.84 -0.543 ns
(P>0.10)
-21.91 sig.
(P = 0.003)
All Narwhal 94 151 93 56 0.977 0.007 0.001 0.000 15.32 -1.618 sig.
(P = 0.021)
-19.73 sig.
(P = 0.001)
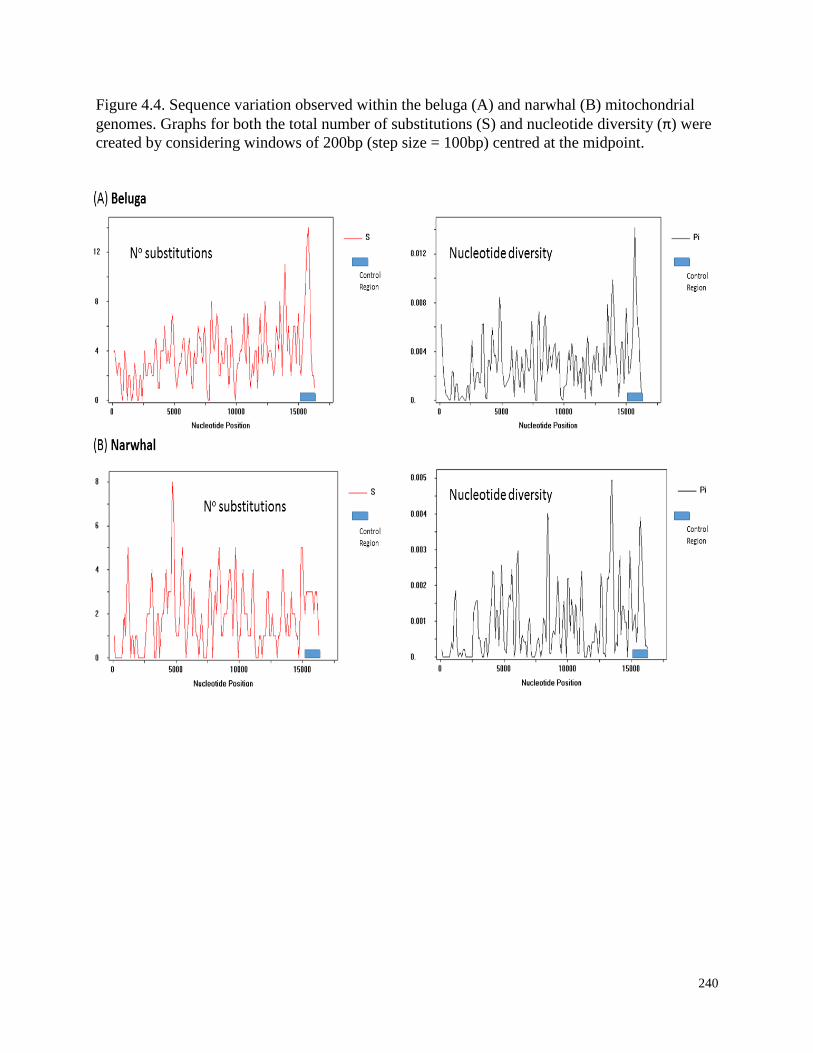
240
Figure 4.4. Sequence variation observed within the beluga (A) and narwhal (B) mitochondrial
genomes. Graphs for both the total number of substitutions (S) and nucleotide diversity (π) were
created by considering windows of 200bp (step size = 100bp) centred at the midpoint.
241
A total of 86 unique haplotypes were identified in the 106 beluga samples analyzed in
this study (Appendix 4.1). The majority of these haplotypes (69.8%) were observed in single
samples, with shared haplotypes generally found in samples from the same or closely related
stocks (Table 4.2). The greatest number of shared haplotypes (5/14) were found in samples from
the Eastern Beaufort Sea stock which had the largest number of samples analyzed from a single
stock (N=38). A further 3/14 shared haplotypes were observed in samples from the Belcher
Island ice entrapments. However, some samples with shared haplotypes were notable. Samples
from Igloolik, which were taken from migratory whales thought to be from the High Arctic
stocks, had haplotype 19 which was also found in a sample from Grise Fiord (as expected), but
also one with haplotype 16 which was also found in a sample from the Belcher Islands ice
entrapment. The most unexpected result occurred with haplotype 77 which was observed in three
samples, one from the St. Lawrence Estuary and two samples from western Hudson Bay. This
was also the only instance where samples with the same mitogenome haplotype did not share the
same control region (CR) haplotype found in previous analyses (Chapter 2, this thesis). In fact,
each of the three samples had different CR haplotypes (Appendix 4.1). This result indicates an
error, either in the CR haplotype identification or the mitogenome sequencing. It is not possible,
with the current analyses, to determine where the source of the error is.
Comparison of mitogenome sequences to CR mtDNA sequences for both species
provides a better assessment of the differences in variability between beluga and narwhal (Table
4.4). Though far fewer haplotypes have been observed in narwhals using CR sequence as
compared to beluga, the number of samples that have been sequenced is also considerably less -
approximately 1:6. However, the mitogenome analyses of a similar number of samples, both
selected from broad geographic ranges, still indicate that mtDNA diversity is much lower in
242
narwhal as compared to beluga. While the number of haplotypes observed per sample between
the two species is more equitable (1:1.68 samples in narwhal; 1:1.23 samples in beluga), the
number of polymorphic sites in the narwhal samples is half the number found in beluga samples.
Within the geographic sample collections of beluga, the number of polymorphic sites and
diversity in mitogenomes had a wide range that was similar to the patterns observed in studies
examining CR mtDNA sequence. Samples from the St. Lawrence Estuary had the fewest number
of polymorphic sites, few parsimony informative sites (i.e. a variable position that occurs in at
least two of the sample sequences), and the smallest average number of nucleotide differences
(Table 4.2). Surprisingly, it was not the sample collections with the largest sample sizes (Grise
Fiord, Eastern Beaufort Sea, and Pangnirtung) that had the greatest amount of diversity. Samples
from the Belcher Islands (SQ) ice entrapments and western Hudson Bay, with sample sizes of
N=10 and N=8 respectively, had the largest number of variable positions, parsimony informative
sites and number of haplotypes. However, the most diversity was observed in the Long Island
samples, which included only three samples but had 146 variable positions, the highest
nucleotide diversity, and the largest average number of nucleotide differences. This result
supports previous conclusions (Chapter 2) that beluga samples harvested from Long Island are
from a mixture of different beluga stocks in the south and eastern Hudson Bay area.
Significantly negative D and Fs values are an indication of demographic population
expansion. Neither the Tajima’s D statistic nor Fu’s Fs was significant for any of the beluga
sample collections (all probabilities > 0.05) (Table 4.2). These results are not able to reject a null
hypothesis of a constant population size, although neutrality tests such as these have been shown
to have weak power when sampling occurs too early (before substantial population growth has
occurred) or too late (after the population has reached a steady size) (Fu, 1997).
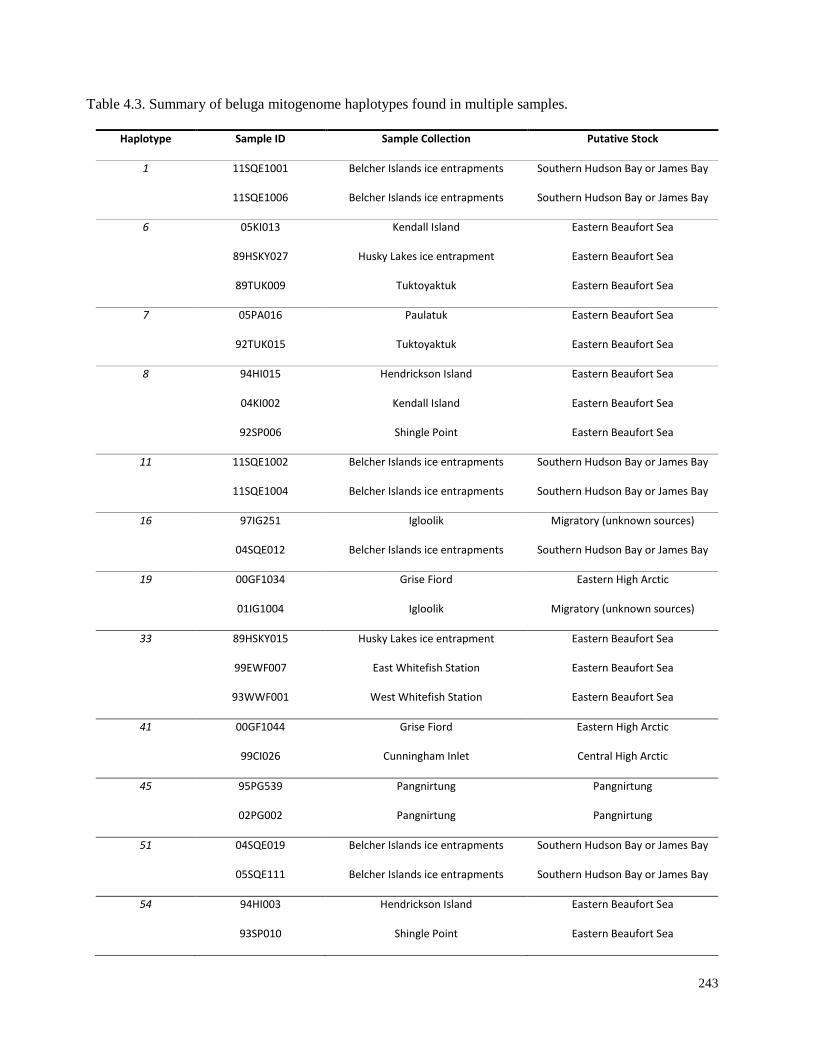
243
Table 4.3. Summary of beluga mitogenome haplotypes found in multiple samples.
Haplotype Sample ID Sample Collection Putative Stock
1 11SQE1001 Belcher Islands ice entrapments Southern Hudson Bay or James Bay
11SQE1006 Belcher Islands ice entrapments Southern Hudson Bay or James Bay
6 05KI013 Kendall Island Eastern Beaufort Sea
89HSKY027 Husky Lakes ice entrapment Eastern Beaufort Sea
89TUK009 Tuktoyaktuk Eastern Beaufort Sea
7 05PA016 Paulatuk Eastern Beaufort Sea
92TUK015 Tuktoyaktuk Eastern Beaufort Sea
8 94HI015 Hendrickson Island Eastern Beaufort Sea
04KI002 Kendall Island Eastern Beaufort Sea
92SP006 Shingle Point Eastern Beaufort Sea
11 11SQE1002 Belcher Islands ice entrapments Southern Hudson Bay or James Bay
11SQE1004 Belcher Islands ice entrapments Southern Hudson Bay or James Bay
16 97IG251 Igloolik Migratory (unknown sources)
04SQE012 Belcher Islands ice entrapments Southern Hudson Bay or James Bay
19 00GF1034 Grise Fiord Eastern High Arctic
01IG1004 Igloolik Migratory (unknown sources)
33 89HSKY015 Husky Lakes ice entrapment Eastern Beaufort Sea
99EWF007 East Whitefish Station Eastern Beaufort Sea
93WWF001 West Whitefish Station Eastern Beaufort Sea
41 00GF1044 Grise Fiord Eastern High Arctic
99CI026 Cunningham Inlet Central High Arctic
45 95PG539 Pangnirtung Pangnirtung
02PG002 Pangnirtung Pangnirtung
51 04SQE019 Belcher Islands ice entrapments Southern Hudson Bay or James Bay
05SQE111 Belcher Islands ice entrapments Southern Hudson Bay or James Bay
54 94HI003 Hendrickson Island Eastern Beaufort Sea
93SP010 Shingle Point Eastern Beaufort Sea
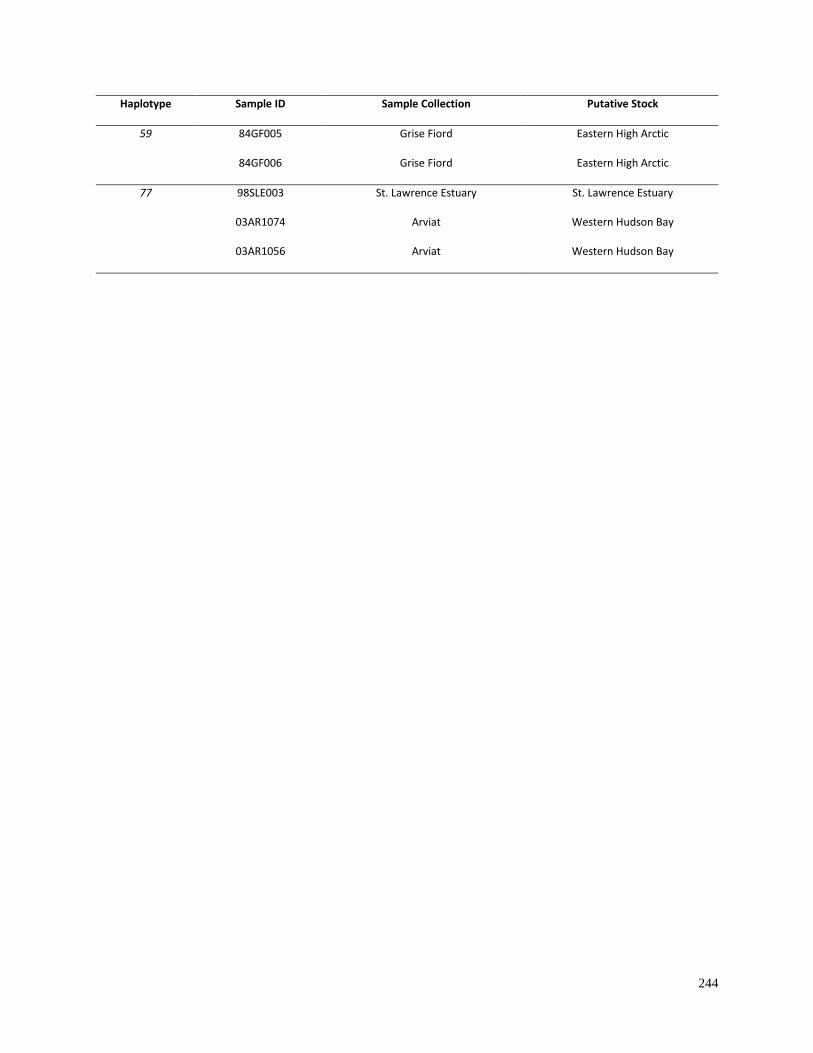
244
Haplotype Sample ID Sample Collection Putative Stock
59 84GF005 Grise Fiord Eastern High Arctic
84GF006 Grise Fiord Eastern High Arctic
77 98SLE003 St. Lawrence Estuary St. Lawrence Estuary
03AR1074 Arviat Western Hudson Bay
03AR1056 Arviat Western Hudson Bay
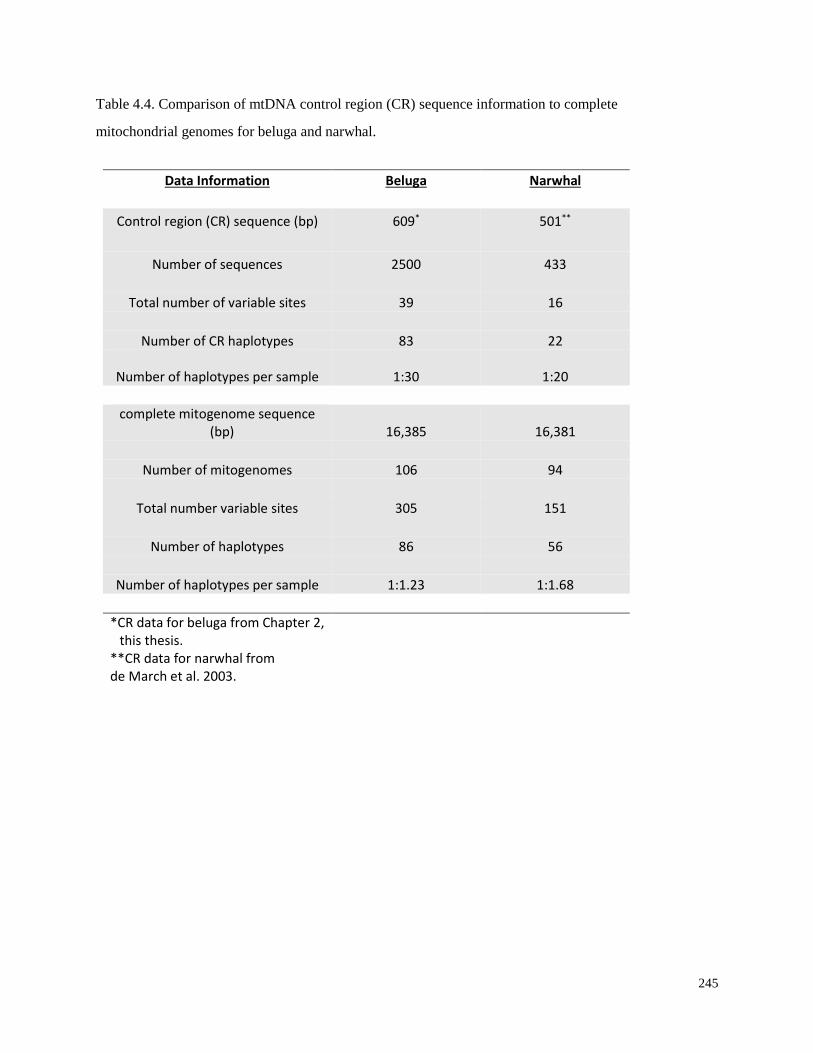
245
Table 4.4. Comparison of mtDNA control region (CR) sequence information to complete
mitochondrial genomes for beluga and narwhal.
Data Information Beluga Narwhal
Control region (CR) sequence (bp) 609* 501**
Number of sequences 2500 433
Total number of variable sites 39 16
Number of CR haplotypes 83 22
Number of haplotypes per sample 1:30 1:20
complete mitogenome sequence
(bp) 16,385 16,381
Number of mitogenomes 106 94
Total number variable sites 305 151
Number of haplotypes 86 56
Number of haplotypes per sample 1:1.23 1:1.68
*CR data for beluga from Chapter 2,
this thesis. **CR data for narwhal from de March et al. 2003.
246
4.3.3 Phylogenetics of complete mitogenome sequences of beluga and narwhal
Complete mitochondrial genomes were used to infer detailed phylogenies for beluga
samples and a general phylogeny for the narwhal samples. Neighbour-joining (NJ) trees
constructed for beluga and narwhal reflected the differences in mtDNA diversity observed in
samples from these species (Section 4.3.2). The narwhal NJ tree revealed strong bootstrap
support between the narwhal samples and outgroups of beluga and finless porpoise (Figure 4.5).
However, there was little support of clades forming among any of the narwhal geographic
sample collections, including the samples from Repulse Bay which are currently considered to be
a separate stock and population as compared to the Baffin Bay (all other locations) narwhal (de
March et al. 2003, Petersen et al. 2011).
This phylogenetic result for narwhal is contrasted by the NJ tree inferred from beluga
mitogenome sequences (Figure 4.6). Three major clades were identified with 100% bootstrap
support (A, B, and C) and within clade A, two clades are identified with bootstrap support
greater than 80% (83% support for clade A1 and 88% support for clade A2). The main clades
generally correspond to the haplogroups identified with CR mtDNA sequences (Chapter 2):
clade A overlaps with Haplogroup 1A and is dominated by Hudson Bay, High Arctic and
Cumberland samples; clade B with Haplogroup 1B, dominated by Eastern Beaufort Sea samples;
and clade C with haplogroup 2 dominated by St. Lawrence Estuary, Eastern Hudson Bay, and
Belcher Islands (SQ) entrapment samples. However, Haplogroup 1A, which was found in high
proportions across all geographic sample collections except the St. Lawrence Estuary, has been
split into two clades with the mitogenome analyses. Clade A1 is a smaller cluster of samples,
including mostly Eastern Beaufort Sea samples, the beluga reference sequence and two
Pangnirtung samples. Clade A2 continues to reflect a broad geographic collection of samples
247
similar to Haplogroup 1A. However, within clade A2, the remaining eastern Beaufort Sea
samples group into two distinct clusters with relatively high bootstrap support (90% and 69%).
Similarly, there are several groups of samples that cluster together in clade B which
correspond to geographic sample collections. Cluster B1 is composed of almost all Grise Fiord
samples, with a single Cunningham Inlet sample (also from the High Arctic) included. Cluster
B2 has a similar composition to clade A1 with a group of Eastern Beaufort Sea samples
connected to a pair of Pangnirtung samples. Eastern Beaufort Sea samples comprise almost the
entire cluster B3, with a single sample from western Hudson Bay included. Cluster B4 is the
most diverse group in this clade, with samples from a broad geographic distribution.
Phylogenetic trees inferred using a Maximum-Likelihood (ML) and Bayesian Inference
approach (BI) resulted in trees with the same patterns as the NJ tree (Figure 4.7). The major
clades A1, A2, B, and C, were supported with high support (>70% ML/ >90% BI). Furthermore,
samples from the same geographic collections formed more distinct clusters within clade B. All
of the Eastern Beaufort Sea samples and one Western Hudson Bay sample clustered together in
B2, separate from the Pangnirtung samples. Cluster B3 contained eastern Beaufort Sea, High
Arctic and Western Hudson Bay samples, and cluster B4 was composed of all Hudson Bay
samples.
Nucleotide diversity was similar for all of the major clades (Table 4.2). Both Tajima’s D
and Fu’s FS tests of neutrality were significantly negative (P<0.005) for clade A1 and clade B.
These results strengthen the significantly negative FS neutrality tests for samples from Hudson
Bay, the High Arctic and Cumberland Sound observed with CR mtDNA sequences (Table 2.6,
Chapter 2) and provided further evidence of recent demographic population expansion in these
areas. Similarly, neither CR mtDNA Haplogroup 2 nor mitogenome clade C had significantly
248
negative neutrality tests, and thus a null hypothesis of a constant population size cannot be
rejected.
Given that the mitogenome haplotypes represent mostly individuals within sample
collections in this study, exact tests of differentiation based on mitogenome haplotype
frequencies (determined in Arlequin ver. 3.5) are not particularly informative for population
structure. However, general patterns with larger groupings (i.e. narwhal compared to beluga, and
comparison of beluga clades) using pairwise FST allowed for some general comparisons to the
patterns of differentiation among sample collections with CR mtDNA (Table 2.3, Chapter 2). All
narwhal samples were strongly differentiated from all beluga groups (P = 0.000). Among the
beluga clades, all clades (A1, A2, B and C) were also significantly differentiated from each other
(P = 0.000). Clade C was most similar to the eastern Hudson Bay and St. Lawrence Estuary
sample collections, again indicating the congruence of this clade with Haplogroup 2 found using
CR mtDNA sequences. Similarly, clade A2 was most similar to the mid-Canadian Arctic sample
collections of Cunningham Inlet, Igloolik, and Pangnirtung which aligns Haplogroup 1A. Clades
A1 and B were generally different from all of the individual sample collections and may reflect a
refinement of Haplogroup 1B into two groups. Given that these two clades also were the ones
identified by neutrality tests to have undergone recent population expansion, this may add
support the patterns of post-glacial expansion from different refugial populations into contact
zones discussed in Chapter 2.
The median-joining (MJ) phylogenetic network for the broad Canada-wide geographic
beluga mitogenomes highlights a deep divergence among clades A, B and C (Figure 4.8). Clades
A and B, which are separated by 28 nucleotide changes, show a closer evolutionary relationship
than clades B and C, which are separated by 138 nucleotide differences. These are much larger
249
differences than what was observed among Haplogroups A1, A2 and B in the CR mtDNA
network of the same geographic distribution of samples (Figure 2.8, Chapter 2). In this network,
the majority of the haplotypes differed by one nucleotide change, with the largest distance being
three nucleotide differences between Haplogroup 2 (corresponding to mitogenome clade C) and
the Haplogroups 1A and 1B (mitogenome clades A and B). Thus, the CR mtDNA haplogroups
from Chapter 2 and the mitogenome clades in this study have the same patterns, but on a
different scale.
The MJ phylogenetic network for the Eastern Beaufort Sea (EBS) samples confirms the
presence of three clusters of samples revealed by the ML and BI trees (Figure 4.9). The samples
that cluster in group B2 are separated by 27 nucleotide differences from the clusters in clade A2
and A1, which are separated by six nucleotide differences. However, within these clusters, there
are no fine-scale geographic patterns related to locations where beluga samples were collected.
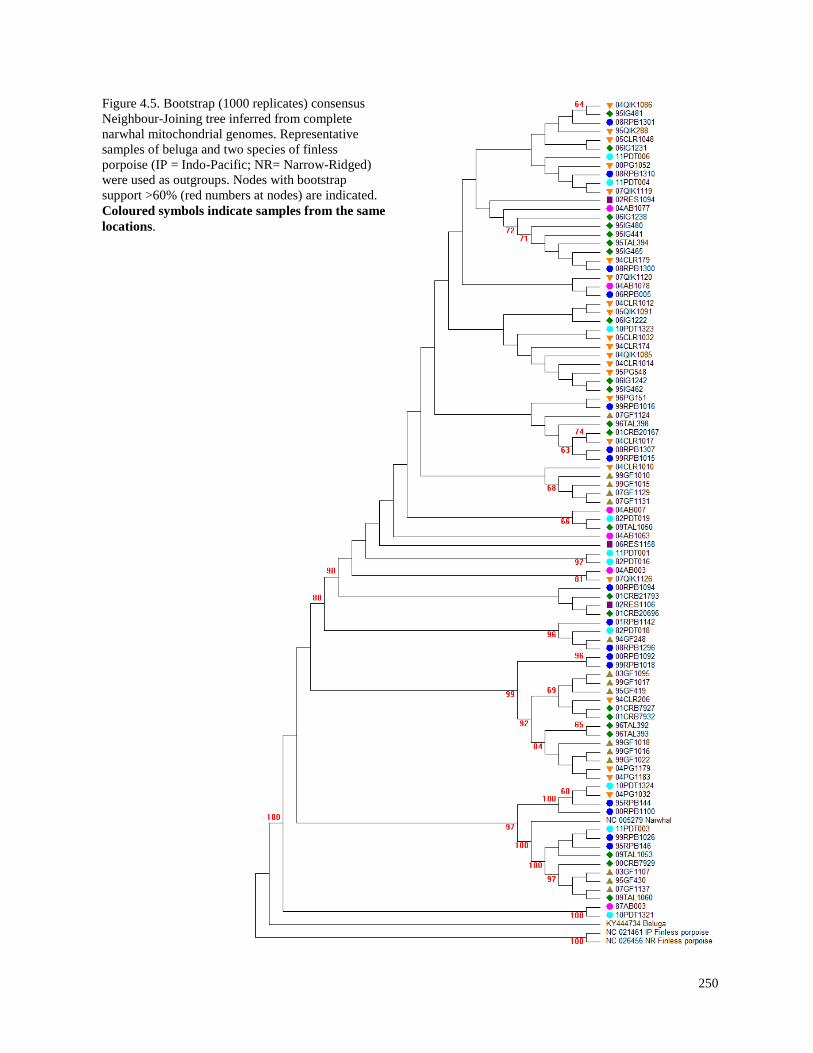
250
Figure 4.5. Bootstrap (1000 replicates) consensus
Neighbour-Joining tree inferred from complete
narwhal mitochondrial genomes. Representative
samples of beluga and two species of finless
porpoise (IP = Indo-Pacific; NR= Narrow-Ridged)
were used as outgroups. Nodes with bootstrap
support >60% (red numbers at nodes) are indicated.
Coloured symbols indicate samples from the same
locations.
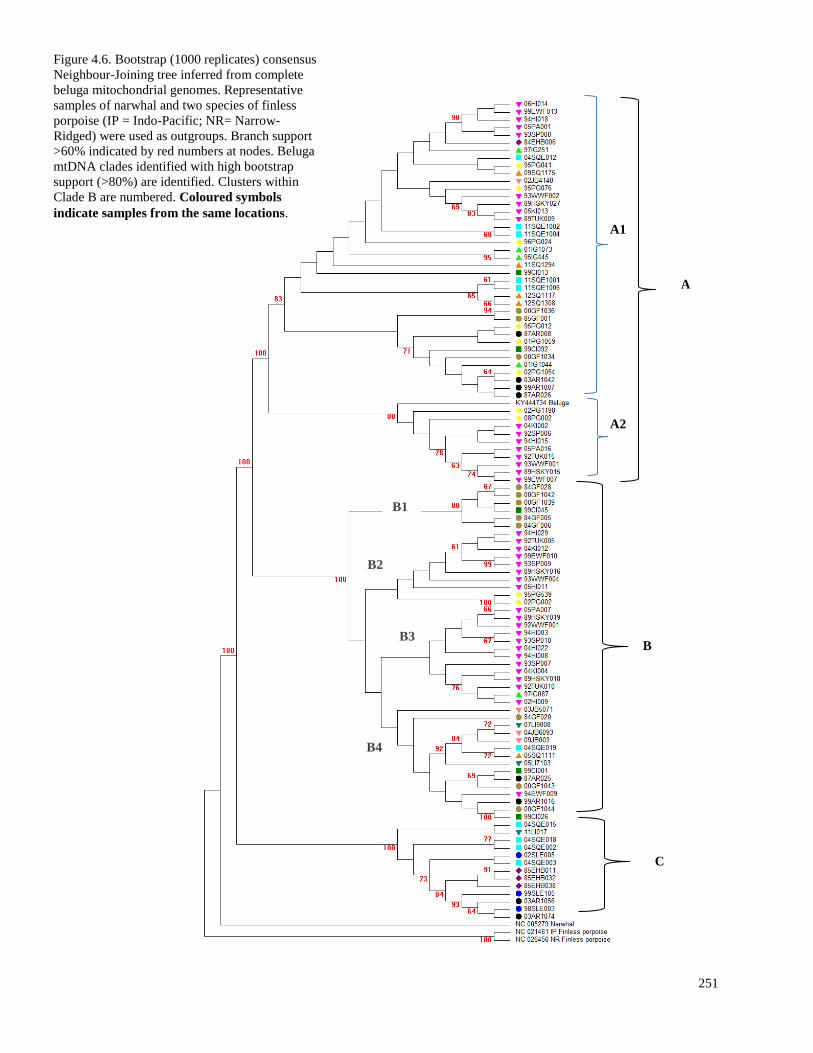
251
B1
A2
A1
A
C
B
B4
B3
B2
Figure 4.6. Bootstrap (1000 replicates) consensus
Neighbour-Joining tree inferred from complete
beluga mitochondrial genomes. Representative
samples of narwhal and two species of finless
porpoise (IP = Indo-Pacific; NR= Narrow-
Ridged) were used as outgroups. Branch support
>60% indicated by red numbers at nodes. Beluga
mtDNA clades identified with high bootstrap
support (>80%) are identified. Clusters within
Clade B are numbered. Coloured symbols
indicate samples from the same locations.
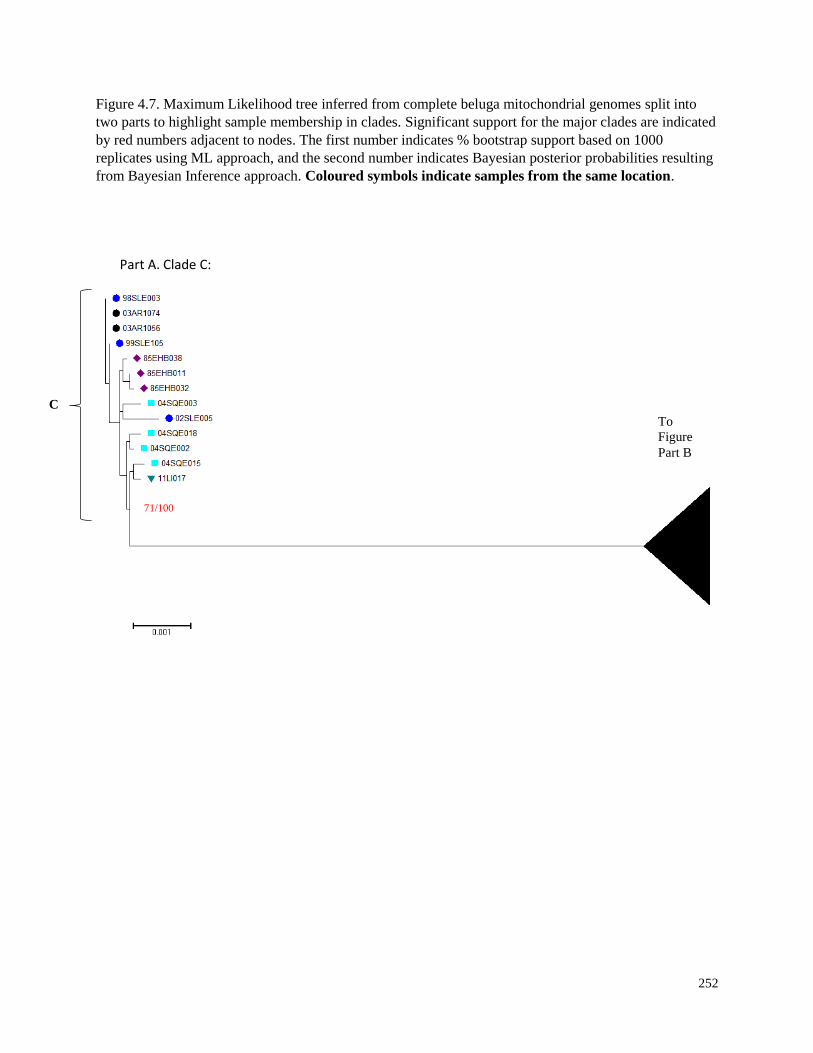
252
Figure 4.7. Maximum Likelihood tree inferred from complete beluga mitochondrial genomes split into
two parts to highlight sample membership in clades. Significant support for the major clades are indicated
by red numbers adjacent to nodes. The first number indicates % bootstrap support based on 1000
replicates using ML approach, and the second number indicates Bayesian posterior probabilities resulting
from Bayesian Inference approach. Coloured symbols indicate samples from the same location.
Part A. Clade C:
71/100
To
Figure
Part B
C
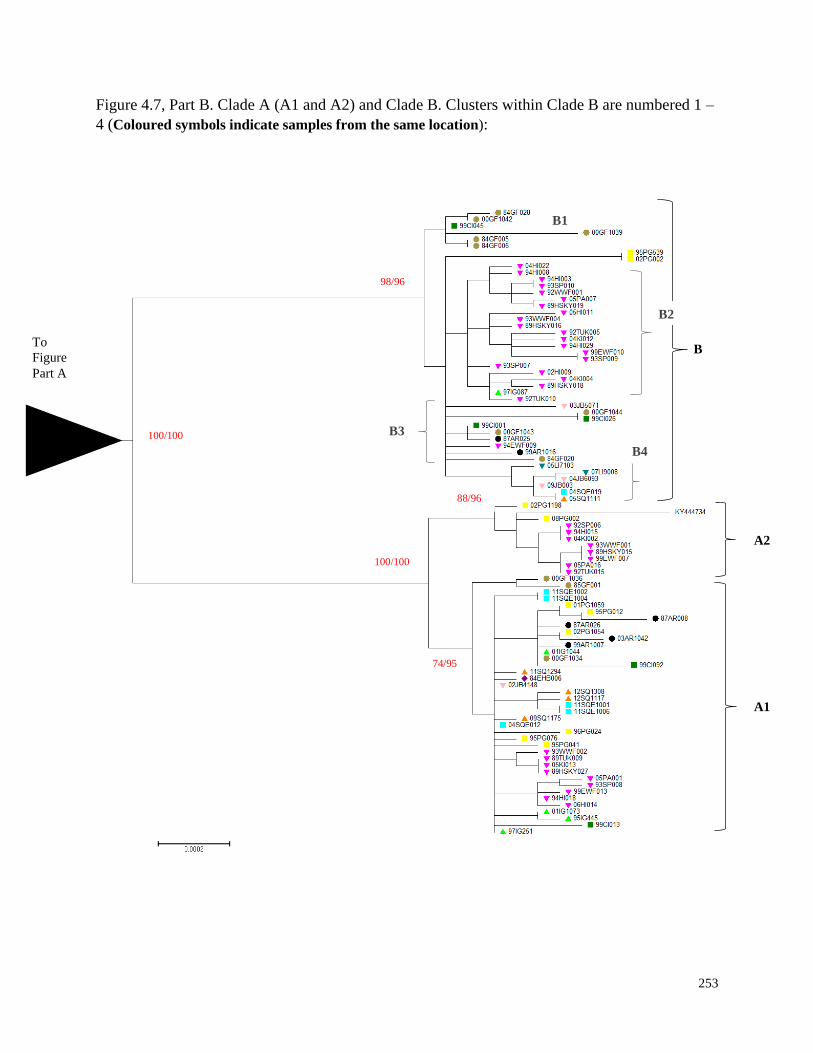
253
Figure 4.7, Part B. Clade A (A1 and A2) and Clade B. Clusters within Clade B are numbered 1 –
4 (Coloured symbols indicate samples from the same location):
B To
Figure
Part A
100/100
98/96
88/96
A2
A1
74/95
B1
B2
B3
B4
100/100
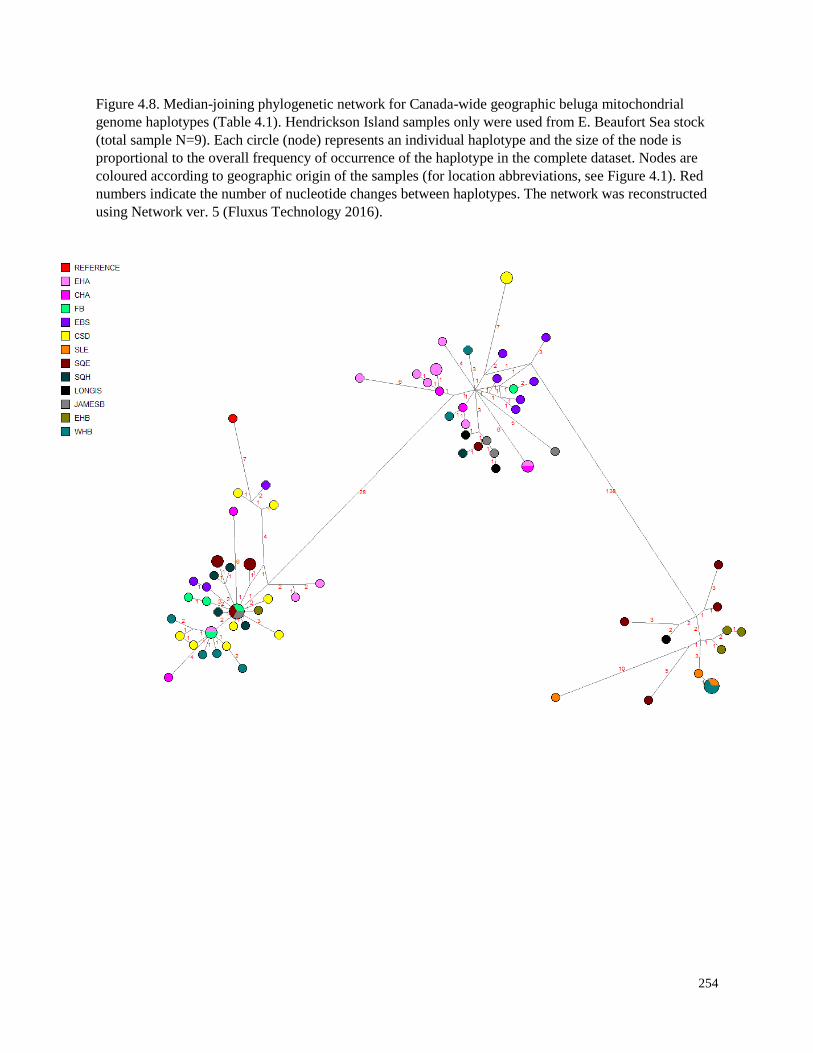
254
Figure 4.8. Median-joining phylogenetic network for Canada-wide geographic beluga mitochondrial
genome haplotypes (Table 4.1). Hendrickson Island samples only were used from E. Beaufort Sea stock
(total sample N=9). Each circle (node) represents an individual haplotype and the size of the node is
proportional to the overall frequency of occurrence of the haplotype in the complete dataset. Nodes are
coloured according to geographic origin of the samples (for location abbreviations, see Figure 4.1). Red
numbers indicate the number of nucleotide changes between haplotypes. The network was reconstructed
using Network ver. 5 (Fluxus Technology 2016).
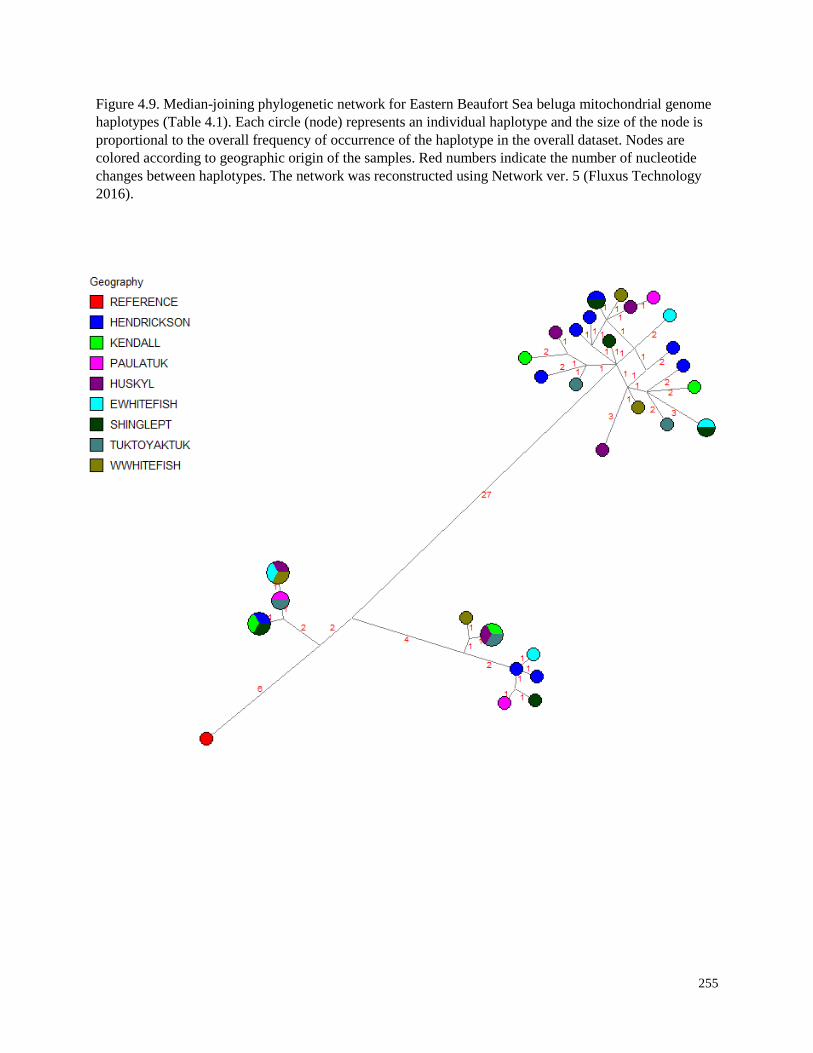
255
Figure 4.9. Median-joining phylogenetic network for Eastern Beaufort Sea beluga mitochondrial genome
haplotypes (Table 4.1). Each circle (node) represents an individual haplotype and the size of the node is
proportional to the overall frequency of occurrence of the haplotype in the overall dataset. Nodes are
colored according to geographic origin of the samples. Red numbers indicate the number of nucleotide
changes between haplotypes. The network was reconstructed using Network ver. 5 (Fluxus Technology
2016).
256
4.3.4 Mitogenome codon diversity and signatures of selection
Concatenated mitogenome sequences for beluga protein-coding genes (PCGs) on the
heavy strand resulted in 12 genes distributed in 10,823bp of sequence (Figure 4.10). The greatest
amount of nucleotide diversity in gene codons was found in the ATP8 gene, and the least amount
of diversity was in the ND4L gene (Table 4.5). Ratios of the rate of nonsynonymous
substitutions to the rate of synonymous substitutions (KA/KS estimates) for each of the 12 beluga
PCGs indicate the widespread influence of negative, or purifying selection (ω < 1) on all
mitochondrial genes. These effects were strongest in the ND1, CO1 and CO2 genes.
The McDonald-Krietman test (with the use of 10 narwhal mitogenome sequences as an
outgroup for interspecific analyses) indicated slight departures from a neutral prediction for the
ratio of amino acid replacement variation to synonymous variation within species compared to
the ratio of replacement to synonymous divergence between species (Table 4.6). The Neutrality
Index was slightly less than 1.0 for clades A1, A2 and clade B, but was slightly larger than 1.0
for clade C and the beluga samples overall. None of these departures was statistically significant
using a Fisher exact test (P>0.05) (Table 4.6).
A codon-based Z-test of selection rejected a null hypothesis of neutrality (dN = dS) for
clade A2 only, with a significantly negative value (-3.026, P=0.003) indicating that this beluga
mtDNA clade has undergone negative (purifying) selection.
The results of all tests for positive selection on beluga mtDNA sites and phylogenetic
branches of the beluga ML tree using the HyPhy software (Kosakovsky Pond et al. 2005) did not
indicate statistically significant evidence of positive selection on branches (branch REL method)
or sites (single likelihood ancestor counting method or SLAC, multirate FEL).
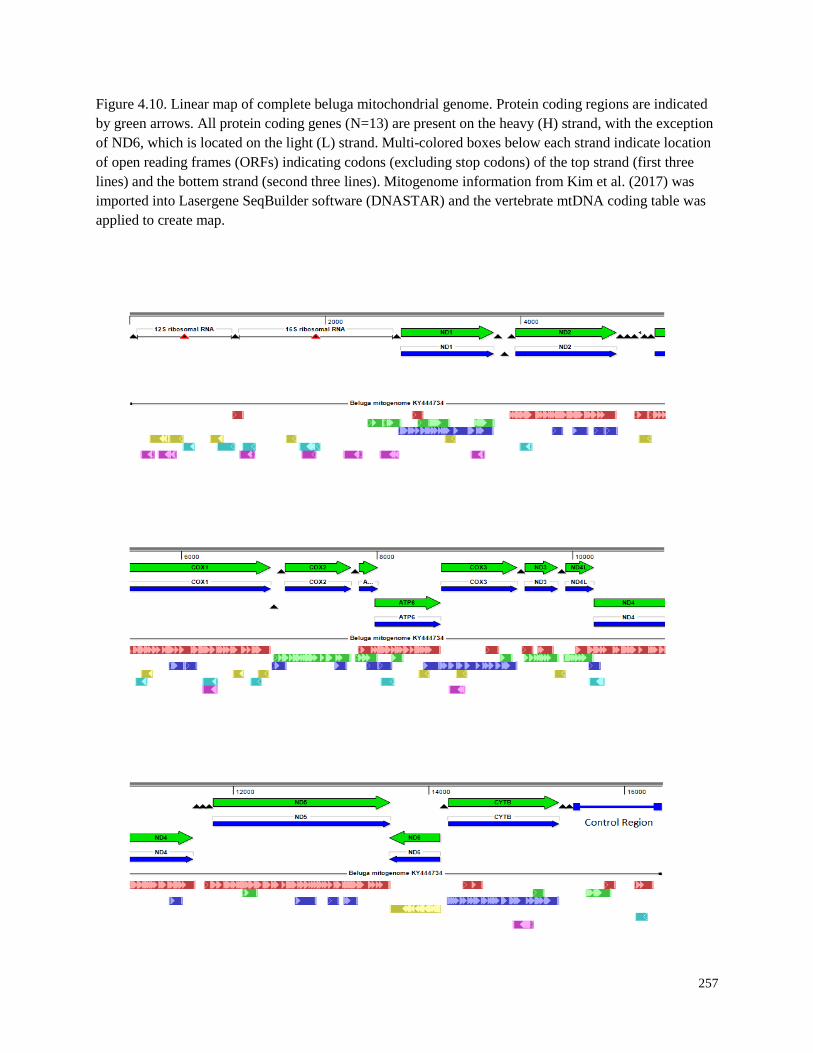
257
Figure 4.10. Linear map of complete beluga mitochondrial genome. Protein coding regions are indicated
by green arrows. All protein coding genes (N=13) are present on the heavy (H) strand, with the exception
of ND6, which is located on the light (L) strand. Multi-colored boxes below each strand indicate location
of open reading frames (ORFs) indicating codons (excluding stop codons) of the top strand (first three
lines) and the bottem strand (second three lines). Mitogenome information from Kim et al. (2017) was
imported into Lasergene SeqBuilder software (DNASTAR) and the vertebrate mtDNA coding table was
applied to create map.
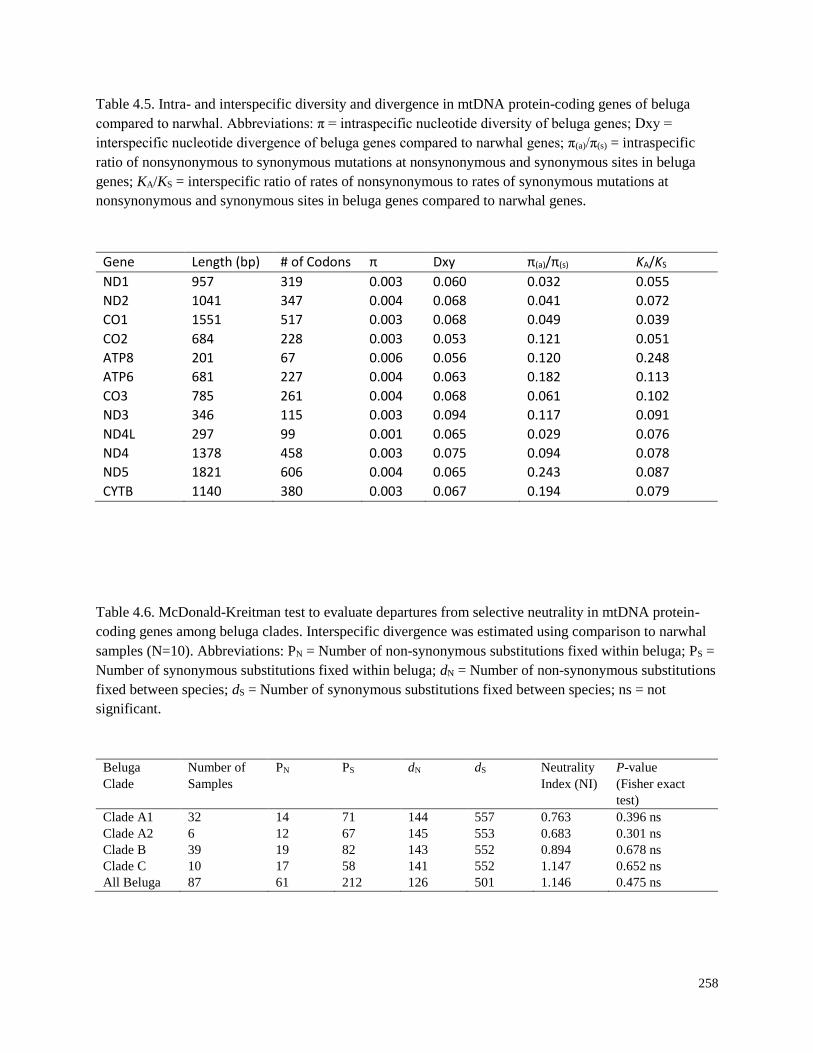
258
Table 4.5. Intra- and interspecific diversity and divergence in mtDNA protein-coding genes of beluga
compared to narwhal. Abbreviations: π = intraspecific nucleotide diversity of beluga genes; Dxy =
interspecific nucleotide divergence of beluga genes compared to narwhal genes; π(a)/π(s) = intraspecific
ratio of nonsynonymous to synonymous mutations at nonsynonymous and synonymous sites in beluga
genes; KA/KS = interspecific ratio of rates of nonsynonymous to rates of synonymous mutations at
nonsynonymous and synonymous sites in beluga genes compared to narwhal genes.
Gene Length (bp) # of Codons π Dxy π(a)/π(s) KA/KS
ND1 957 319 0.003 0.060 0.032 0.055
ND2 1041 347 0.004 0.068 0.041 0.072
CO1 1551 517 0.003 0.068 0.049 0.039
CO2 684 228 0.003 0.053 0.121 0.051
ATP8 201 67 0.006 0.056 0.120 0.248
ATP6 681 227 0.004 0.063 0.182 0.113
CO3 785 261 0.004 0.068 0.061 0.102
ND3 346 115 0.003 0.094 0.117 0.091
ND4L 297 99 0.001 0.065 0.029 0.076
ND4 1378 458 0.003 0.075 0.094 0.078
ND5 1821 606 0.004 0.065 0.243 0.087
CYTB 1140 380 0.003 0.067 0.194 0.079
Table 4.6. McDonald-Kreitman test to evaluate departures from selective neutrality in mtDNA protein-
coding genes among beluga clades. Interspecific divergence was estimated using comparison to narwhal
samples (N=10). Abbreviations: PN = Number of non-synonymous substitutions fixed within beluga; PS =
Number of synonymous substitutions fixed within beluga; dN = Number of non-synonymous substitutions
fixed between species; dS = Number of synonymous substitutions fixed between species; ns = not
significant.
Beluga
Clade
Number of
Samples
PN PS dN dS Neutrality
Index (NI)
P-value
(Fisher exact
test)
Clade A1 32 14 71 144 557 0.763 0.396 ns
Clade A2 6 12 67 145 553 0.683 0.301 ns
Clade B 39 19 82 143 552 0.894 0.678 ns
Clade C 10 17 58 141 552 1.147 0.652 ns
All Beluga 87 61 212 126 501 1.146 0.475 ns
259
4.4 Discussion
This is the first study to use complete mitochondrial genome sequences to study
populations of beluga whales and move beyond the use of low coverage markers (e.g. restriction
fragment analyses and control region mtDNA sequence) for the investigation of questions about
population structure, stock discrimination, and phylogenetics (e.g. Brennin et al. 1997, Brown
Gladden et al. 1997, de March and Postma 2003, Turgeon et al. 2012, O’Corry-Crowe et al.
2015). The laboratory protocols and workflow specific to beluga and narwhal templates
developed for this thesis provide a means to produce large amounts of mitogenome data for
significant numbers of samples using an Ion Torrent PGM next-generation sequencer (NGS) in a
relatively cost- and time-effective manner. The recent publication of an Illumina HiSeq 4000
(Illumina, San Diego, CA, USA) reference mitogenome sequence for beluga (Kim et al. 2017)
makes the assembly of whole mitogenome sequences even more reliable for use in a variety of
beluga studies to infer evolutionary relationships and patterns. However, the results of this study
do provide some cautions about using these methods for population mitogenomic analyses of
beluga samples.
As compared to other NGS sequencing platforms, Ion Torrent data is known to have
several shortcomings (Lui et al. 2012, Loman et al. 2012, Quail et al. 2012). First and foremost is
the high rate of insertion and deletion (indel) errors that occur in homopolymeric regions, which
are segments of sequence that are characterized by runs of the same base (Merriman et al. 2012,
Bragg et al. 2013). In these regions, the PGM reads have been found to have many
inconsistencies in homopolymers larger than eight bases long, and problems generating reads at
all for homopolymer regions longer than 14 bases (Quail et al. 2012). It is important to note,
though, that problems with long homopolymer regions occur with every NGS platform,
260
especially for GC-rich templates (Ross et al. 2013). The largest impact of these errors for
population genomic studies is on the identification of nucleotide variants leading to
polymorphism (Bragg et al. 2013), which is the basis for identifying haplotypes as was done in
this study for belugas and narwhals. However, higher read coverage can compensate for these
types of errors and make it easier to distinguish true variants from PGM indels (Bragg et al.
2013). For the beluga and narwhal samples sequenced for this study, read depth and coverage
were very high; thus, the identification of indel errors was quite clear. Also, as these were mostly
intraspecific analyses, insertion and deletions were not likely to be found in the alignments of
same-species mitogenomes and thus could be eliminated with confidence. True indels were more
important for the alignments including the finless porpoise (Neophocaena sp.) outgoups during
phylogenetic analyses and were examined carefully.
Since sequence editing for both beluga and narwhal samples was done with an alignment
of all samples, conservative decisions on the veracity of variable positions were made
consistently across all samples. This should have maintained the integrity of haplotype
identification, phylogenetic comparisons, and the identification of synonymous and
nonsynonymous substitutions during analyses for the objectives of this study, but the pursuit of
future population mitogenomic analyses will require more quality controls. The use of replicates
is an essential approach for the identification of high frequency indel errors that could be
mistaken for polymorphisms (Bragg et al. 2013). Indeed, the inconsistencies for the set of three
diverse geographic samples that shared the same mitogenome haplotype, but had three different
CR haplotypes (Appendix 4.1), were difficult to interpret in the absence of any knowledge of the
error rate for mitogenome sequences in the study. Most of the population mitogenomic literature
reviewed for this study did not contain explicit reporting on sequence error rates. The one
261
exception reported a sequence error rate based on full mitogenome replicate sequencing of
approximately 5% of the total number of samples (Morin et al. 2010). An examination of
complete or near-complete mitogenome sequences for domestic animals publicly available from
GenBank found a considerable error rate (14.5%) and underscores the need for rigorous error
assessment of data (Shi et al. 2014). In addition to replicates, detailed phylogenetic analysis of
raw data may also allow for the detection of mitogenome sequence errors due to incomplete
mutation patterns, poor quality template, contamination and sequencing artefacts (Duleba et al.
2015).
The main objective of this study was to assess the potential of complete mitogenome
sequences to improve the resolution of evolutionary relationships among beluga samples
throughout the species’ Canadian range. This type of genomic information may have the power
to “improve traditional conservation genetic inferences and provide qualitatively novel insights”
(Shafer et al. 2014) for belugas. Though the highest rate of sequence variability was still located
in the traditional control region (CR) sequence mtDNA marker (Figure 4.4), variation over the
complete mitogenome provided greater resolution of the beluga sample collection haplotype
diversity (Appendix 4.1, Table 4.2) and the consistent identification of clades in all the inferred
trees across different phylogenetic approaches (Figures 4.6 and 4.7). Furthermore, there was
higher statistical support for most nodes in the consensus tree. The mitogenome phylogenetic
relationships of geographic samples confirmed and, in many cases, strengthened the
identification of beluga stocks and their evolutionary connections described by CR mtDNA
sequence haplotypes (Chapter 2). Clusters of samples from the High Arctic (B1), the Eastern
Beaufort Sea (B2) and Hudson Bay (B4) were distinguished within clade B (Figure 4.7), and the
262
most likely source stock identified for migratory sample collections (e.g. Igloolik clustered with
High Arctic samples in clade A1).
The use of whole mitogenome sequencing identified three distinct clusters within the
EBS beluga samples that were in three different clades: A1, A2 and B2 (Figure 4.7). This result
indicates the presence of fine-scale structure within the stock, but the clusters did not correspond
to spatially distinct sample collections. This lack of geographic mtDNA genome structure is a
similar result to the CR mtDNA sequence analyses of EBS samples in Chapter 3 of this thesis.
However, clustering analysis based on nuclear DNA of female samples resulted in three clusters
of genetically-related individuals found in the overall nearshore area (Figure 3.12B) that support
the idea that female EBS belugas form moderate bonds with other females and that there is
female philopatry to the EBS area. The phylogenetic results based on complete mitogenome
sequences further suggest that three distinct maternal lineages may also contribute to these
philopatric patterns.
In the broad Canada-wide geographic analyses of CR mtDNA sequences (Chapter 2), two
main haplogroups were consistently identified using different phylogenetic approaches. The
larger of these two groups, containing haplogroup 1 subgroups 1A and 1B, was characterized by
polytomies in the gene trees and star-like patterns in the median-joining network, most likely
resulting from recent, low levels of sequence divergence in areas of contact zones formed from
expansions of multiple post-glacial refugial populations (Chapter 2). Given the fairly long
generation time of belugas (13 years per generation), this period of recent expansion spans
relatively few generations on an evolutionary timescale (de March and Postma 2003). This most
likely has contributed to the short branches in the phylogenetic tree for haplotypes that belong to
these haplogroups, which is also a sign of incomplete lineage sorting (Maddison 1997, Maddison
263
and Knowles 2006). It has been found that increasing the amount of mtDNA sequence can
clarify phylogenies in recently evolved species, but the amount of sequence needed to resolve an
internode depends on both the length of the internode and its depth in the phylogeny (DeFilippis
and Moore 2000). Whole mitogenome sequences generated for beluga samples in this study did
not completely resolve the polytomies, but given the short time frame for clade and lineage
divergence, some phylogenetic relationships among Canadian belugas may not be resolved with
this marker (e.g. Roos et al. 2011, Liedigk et al. 2015). However, with mitogenomic analyses,
the number of polytomies was reduced in beluga phylogenetic trees, and an increased number of
more geographically divergent clusters of samples were identified (Figure 4.7). Further
exploration of these mitogenomic patterns with increased sample sizes may continue to improve
the resolution and accuracy of phylogenetic comparisons among belugas. An increase in both the
number of loci used to estimate the phylogeny and the number of individuals sampled can yield
more accurate estimates of phylogenetic relationships despite incomplete lineage sorting
(Maddison and Knowles 2006). However, for shallower trees, sampling more individuals was
found to have the most impact (Maddison and Knowles 2006).
The median-joining (MJ) phylogenetic network of mitogenome haplotypes had
phylogeographic clustering patterns consistent with the CR mtDNA haplotype network in
Chapter 2 (Figure 2.8). However, the mitogenome network emphasized the divergence between
the three main clades, or haplogroups, of belugas (Figure 4.8). Once again, the samples from the
St. Lawrence Estuary, eastern Hudson Bay, and the Belcher Island ice entrapments (clade C, or
Haplogroup 2) were most distantly connected to the other two groups. The main improvement is
the distinction between clades A and B (CR Haplogroups 1A and 1B), which is much more
pronounced in the mitogenome network. However, mitogenome haplotype networks for belugas
264
may have the most potential for resolving phylogenetic patterns at a finer geographic scale. CR
mtDNA haplotypes for Eastern Beaufort Sea (EBS) belugas (N=1032) were dominated by three
main haplotypes (Chapter 3, Figure 3.14). Overall haplotype diversity for these samples was
0.839, and they had an overall average number of nucleotide differences (k) of 3.91 (Table 3.3).
With complete mitogenome sequences, haplotype diversity in EBS beluga samples (N=38) was
0.978 and a k = 21.31 (Table 4.4). But while CR mtDNA haplotypes revealed no apparent
structure (Chapter 3, Figure 3.15), the mitogenome network for this sample collection revealed
two highly divergent maternal lineages, with evidence of a third lineage (Figure 4.6). This
pattern was also found in all of the phylogenetic trees (Figures 4.6 and 4.7) where clusters of
EBS belugas were formed within clades A1, A2 and B2/B3. This type of improved network
resolution and identification of discrete lineages based on mitogenomes has also been observed
in bobwhites (Colinus virginianus) (Halley et al. 2015) and brown bears (Keis et al. 2012). In
bobwhites, the neutrality tests and tests of adaptive evolution for mitogenome data were not
significant, indicating that the divergent maternal lineages that were identified in the MJ network
survived from pre-expansion to post-glacial expansion (Halley et al. 2015). Such analyses of an
increased sample size of EBS samples may also prove to be informative.
In contrast to belugas, whole mitogenome analyses of narwhal samples were not very
informative for identifying geographic clusters of samples that correspond to putative stock
designations. In fact, mitogenome phylogenetic analysis did not support differentiation among
different populations represented by northern Hudson Bay narwhal samples and Baffin Bay
narwhals (de March et al. 2003, Peterson et al. 2011). Control region sequencing analyses of
samples from these populations did not reveal private haplotypes, but instead, the population
differentiation was based on statistically significant differences in the ratios of haplotypes (de
265
March et al. 2003). Given the resolution of highly shared narwhal CR haplotypes into more
diverse mitogenome haplotypes in this study, it would be worthwhile to increase the number of
samples and the geographic scale of samples for narwhals to see if patterns do emerge. Several
studies have shown that sampling protocols (sampling intensity and site design) can have a
significant influence on the results of genetic clustering analyses, especially when genetic
gradients are present (e.g. Schwartz and McKelvey 2009, Koen et al. 2013). In particular,
phylogenetic interpretations based on mtDNA may be biased “when limited sampling occurs in a
species harbouring multiple mtDNA types” (Ballard and Rand 2005). Mitogenome samples over
a broader geographic, perhaps global, distribution of narwhals would provide a better assessment
of mitogenome diversity in this species. Also, the CR sequence region could be removed from
narwhal mitogenomes to focus on the analysis of the most informative regions, which have been
shown to vary among taxa (Duchêne et al. 2011). As revealed in Figure 4.4, variation for the
narwhal samples peaked in regions spanning positions 4600-4900 (ND2 gene region) and
positions 12,500-12,800 (ND5 gene region). Analyses for indications of positive selection in
these regions would also be worthwhile. Evidence of adaptive evolution has been found in the
ND genes, particularly ND2 and ND5, in a number of mammalian species (da Fonseca et al.
2008). In sable (Martes zibellina, Malyarchuk et al. 2014) and African elephants (Loxondonta
sp., Finch et al. 2014), selection in the ND genes was suggested to be linked to metabolic
adaptations for particular environmental conditions and habitats.
Sperm whales, a more globally distributed cetacean with large populations, were found to
have overall low mitogenome diversity in samples representing the worldwide species diversity
(Alexander et al. 2012). The results were consistent with hypotheses that these whales underwent
a bottleneck or selective sweep in the recent past (72,800 to 137,400 years ago). Sperm whales
266
occupy a specialized niche, and the characteristic deep foraging dives of sperm whales may have
influenced positive selection on the mtDNA protein-coding genes as a physiological and
environmental adaptation for this dive behaviour (Alexander et al. 2012). This supports a
hypothesis of a selective sweep as opposed to a population bottleneck due to commercial
whaling, though changes in prey availability may have also affected populations at some point in
the past (Alexander et al. 2012). A similar hypothesis about the influence of a selective sweep on
mtDNA diversity may apply to narwhals. This Arctic species of whale displays a lack of
behavioural plasticity, with highly predictable and consistent movement patterns, diving
behaviour, and habitat selection (Heide-Jørgensen et al. 2015). This has created a much narrower
ecological niche for narwhals as compared to belugas. This, along with a closer association with
ice and distribution at higher latitudes (thus colder temperatures), could be influencing adaptive
selection in narwhal mtDNA as has been proposed in early studies of MHC variability in High
Arctic whales (Murray et al. 1995) and similar to Antarctic killer whales (Foote et al. 2011c).
Despite its almost ubiquitous use for studies of molecular diversity, mtDNA sequencing,
which represents the analysis of a single locus, is not without weaknesses as a marker for
population genetic studies (e.g. Galtier et al. 2009a). Several of the hallmarks that have
distinguished mtDNA as the preferred marker for phylogenetic and evolutionary studies have
been challenged. For example, the assumption that mtDNA is solely maternally inherited has
been revised (Wolff et al. 2013). Instead, the paternal contribution of mtDNA gets cumulatively
diminished by a number of mechanisms and is thus limited to leakage effects that can still lead to
distinct mtDNA lineages within a zygote (Wolff et al. 2013). Also, mtDNA was thought to be
clonally inherited; however, genetic hitchhiking on the mitochondrial genome has been linked to
genetic variability, as well as selective sweeps of advantageous mutations (Ballard and Dean
267
2001). Finally, the idea that mtDNA is effectively neutral needs to be considered in the context
of adaptive evolution which has been shown to influence within-species mtDNA diversity across
a wide range of species (Bazin et al. 2006). All of these factors need to be kept in mind when
pursuing mitogenome analyses, and armed with this revised perspective, whole mtDNA
sequence analysis for molecular ecology studies may offer new types of insights about
mitogenome evolution, adaptation, and processes associated with variation (Galtier et al. 2009a).
This study was not specifically designed to address questions about adaptive selection,
but basic approaches using the ratio of rates of nonsynonymous to rates of synonymous
substitutions were used to search for signals of selective pressure on the mitochondrial protein
coding genes (PCGs) in beluga samples. The results for each of the 12 beluga PCGs indicate the
widespread influence of negative, or purifying, selection (ω < 1) on all mitochondrial genes, with
the strongest signals in the ND1, CO1 and CO2 genes (Table 4.5). Given the importance of these
genes for the synthesis of cellular energy (in the form of ATP), purifying selection is essential to
remove deleterious mutations and maintain mitochondrial gene function (e.g. Meiklejohn et al.
2007, Castellana et al. 2011) and has much greater influence on mtDNA evolution than positive
selection (Bazin et al. 2006). Thus, it was not unexpected that given the objectives and design of
this study, no evidence of positive selection was found for the beluga clades (Table 4.6). Given
the similar migratory patterns of most of the Canadian beluga stocks, there is likely not enough
environmental variability represented by the samples analyzed to influence local physiological
adaptations in the mitogenome. Plus, as reviewed by Ballard and Melvin (2010), it may be too
early to determine “whether adaptive mutations in mtDNA are the rule or the exception to the
rule”. As with narwhal, comparisons of PCGs in mitogenomes of belugas from the global
distribution of the species, and less conservative analyses than were used in this study (such as
268
analyses of physio-chemical changes in proteins resulting from amino acid replacements,
implemented in TREESAAP (Wooley et al. 2003), would offer a greater chance of detecting
signals of positive selection (e.g. Foote et al. 2011c, Malyarchuk et al. 2014, Finch et al. 2014,
Filipi et al. 2015). In addition, more detailed analyses of mutation rates in mtDNA PCGs will
need to consider the variability in mtDNA mutation rates across lineages and at different codon
positions (Galtier et al. 2009b, Duchêne et al. 2011), though the need for partitioning may not be
required if the most informative genes only are used (Duchêne et al. 2011).
Ion Torrent costs continue to decrease, chemistries and technologies continue to improve
sequence coverage and error biases, and the workflow is evolving to become more efficient and
less time-consuming. Analyses of complete mitochondrial genomes for larger numbers of
samples should continue to be pursued for population studies of belugas and narwhals. At the
intra-population level, the increased amount of sequence, including the coding regions, offer the
potential for increased resolution of fine-scale structure and stronger inference of the
evolutionary histories among different groups (e.g. Morin et al. 2010, Keis et al. 2013). This will
allow for continued evaluation of the geographic areas used to define putative beluga and
narwhal stocks as the units for conservation and management. Shallow haplotype trees that are
geographically unstructured, such as the NJ tree inferred for the Canadian narwhal samples, can
be a result of recent population expansion and increase, recent or current gene flow, or possibly
due to purifying selection (Zink et al. 2003). Mitogenomic comparisons of populations across the
full global distribution of the species may provide better identification of ancestral haplotypes,
better resolution of lineage sorting, and the estimation of divergence times. Furthermore, a wider
geographic range of samples may also allow for comparisons of populations with a wider
269
ecological variation that may have a greater potential to detect signals of selection and
adaptation.
4.5 Acknowledgements
Most of the samples for genetic analyses in this study were collected by hunters from
communities in the Inuvialuit Settlement Region (ISR), Nunavut, and Nunavik during harvest
monitoring programs funded by the Fisheries Joint Management Committee (FJMC), the
Nunavut Wildlife Management Board (NWMB), the Nunavik Inuit Land Claims Agreement
(NICLA), and Fisheries and Oceans Canada. Countless scientific studies would not be possible
without these partnerships. The efforts of many dedicated individuals to coordinate these sample
collections and other sampling endeavours, the shipping and sorting of sample kits, archiving
materials in an organized system and maintaining sample information databases are immensely
appreciated. Denise Tenkula (DFO Central and Arctic) and Craig McFarlane provided laboratory
assistance for the development of the Ion Torrent mitogenome sequencing workflow and sample
processing. Funding was provided by Fisheries and Oceans Canada (DFO) Central and Arctic
Region, the DFO Genomics Research and Development Initiative (GRDI) and the DFO Nunavut
Implementation Fund (NIF).
4.6 References
Alexander, A., Steel, D., Slikas, B., Hoekzema, K., Carraher, C., Parks, M., Cronn, R. and Baker,
C.S. 2013. Low diversity in the mitogenome of sperm whales revealed by next-generation
sequencing. Genome Biology and Evolution 5: 113-129.
Allendorf, F.W. 2017. Genetics and the conservation of natural populations: allozymes to
genomes. Molecular Ecology 26: 420-430.
270
Anisimova, M., and Gascuel, O. 2006. Approximate likelihood-ratio test for branches: a fast,
accurate, and powerful alternative. Systematic Biology 55: 539-552.
Archer, F.I., Morin, P.A., Hancock-Hanser, B.L., Robertson, K.M., Leslie, M.S., Bérubé, M.,
Panigada, S. and Taylor, B.L. 2013. Mitogenomic phylogenetics of fin whales (Balaenoptera
physalus spp.): genetic evidence for revision of subspecies. PLoS One 8: p.e63396.
Arnason, U., Gullberg, A. and Janke, A. 2004. Mitogenomic analyses provide new insights into
cetacean origin and evolution. Gene 333: 27-34.
Avise, J.C. and Ellis, D. 1986. Mitochondrial DNA and the evolutionary genetics of higher
animals and discussion. Philosophical Transactions of the Royal Society of London B:
Biological Sciences 312: 325-342.
Avise, J.C., Arnold, J., Ball, R.M., Bermingham, E., Lamb, T., Neigel, J.E., Reeb, C.A. and
Saunders, N.C. 1987. Intraspecific phylogeography: the mitochondrial DNA bridge between
population genetics and systematics. Annual Review of Ecology and Systematics 18: 489-522.
Avise, J.C. 1989. Gene trees and organismal histories: a phylogenetic approach to population
biology. Evolution 43: 1192-1208.
Avise, J.C., Bowen, B.W. and Lamb, T. 1989. DNA fingerprints from hypervariable
mitochondrial genotypes. Molecular Biology and Evolution 6: 258-269.
Ballard, J.W.O. and Rand, D.M. 2005. The population biology of mitochondrial DNA and its
phylogenetic implications. Annual Review of Ecology, Evolution and Systematics 36: 621-642.
Ballard, J.W.O. and Melvin, R.G., 2010. Linking the mitochondrial genotype to the organismal
phenotype. Molecular Ecology 19: 1523-1539.
Ballard, J.W.O. and Pichaud, N. 2014. Mitochondrial DNA: more than an evolutionary
bystander. Functional Ecology 28: 218-231.
Bazin, E., Glémin, S. and Galtier, N. 2006. Population size does not influence mitochondrial
genetic diversity in animals. Science 312: 570-572.
Bragg, L.M., Stone, G., Butler, M.K., Hugenholtz, P. and Tyson, G.W. 2013. Shining a light on
dark sequencing: characterising errors in Ion Torrent PGM data. PLoS Computational Biology 9:
p.e1003031.
271
Brennin, R., Murray, B.W., Friesen, M.K., Maiers (Postma), L.D., Clayton, J.W., and White,
B.N. 1997. Population genetic structure of beluga whales (Delphinapterus leucas): mitochondrial
DNA sequence variation within and among North American populations. Canadian Journal of
Zoology 75: 795-802.
Brown Gladden, J.G., Ferguson, M.M, and Clayton, J.W. 1997. Matriarchal genetic population
structure of North American beluga whales Delphinapterus leucas (Cetacea: Monodontidae).
Molecular Ecology 6: 1033-1046.
Brown Gladden, J.G., Ferguson, M.M., Friesen, M.K. and Clayton, J.W. 1999. Population
structure of North American beluga whales (Delphinapterus leucas) based on nuclear DNA
microsatellite variation and contrasted with the population structure revealed by mitochondrial
DNA variation. Molecular Ecology 8: 347-363.
Castellana, S., Vicario, S. and Saccone, C. 2011. Evolutionary patterns of the mitochondrial
genome in Metazoa: exploring the role of mutation and selection in mitochondrial protein–
coding Genes. Genome Biology and Evolution 3: 1067-1079.
Colbeck, G.J., Duchesne, P., Postma, L.D., Lesage, V., Hammill, M.O. and Turgeon, J., 2013.
Groups of related belugas (Delphinapterus leucas) travel together during their seasonal
migrations in and around Hudson Bay. Proceedings of the Royal Society of London B:
Biological Sciences 280: 20122552.
Consuegra, S., John, E., Verspoor, E. and De Leaniz, C.G. 2015. Patterns of natural selection
acting on the mitochondrial genome of a locally adapted fish species. Genetics Selection
Evolution 47: 58.
Corlett, R.T. 2017. A bigger toolbox: biotechnology in biodiversity conservation. Trends in
Biotechnology 35: 55-65.
da Fonseca, R.R., Johnson, W.E., O'Brien, S.J., Ramos, M.J. and Antunes, A. 2008. The adaptive
evolution of the mammalian mitochondrial genome. BMC Genomics 9: 119.
de March, B.G.E and Postma, L.D. 2003. Molecular stock discrimination of belugas
(Delphinapterus leucas) hunted in eastern Hudson Bay, northern Quebec, Hudson Strait, and
Sanikiluaq (Belcher Islands), Canada, and comparisons to adjacent populations. Arctic 56: 111-
124.
272
de March, B.G.E., Tenkula, D.A, and Postma, L.D. 2003. Molecular genetics of narwhal
(Monodon monoceros) from Canada and West Greenland (1982-2001). Canadian Science
Advisory Secretariat Research Document 2003/080, i + 19pp.
Duchêne, S., Archer, F.I., Vilstrup, J., Caballero, S. and Morin, P.A. 2011. Mitogenome
phylogenetics: the impact of using single regions and partitioning schemes on topology,
substitution rate and divergence time estimation. PLoS One 6: p.e27138.
Duleba, A., Skonieczna, K., Bogdanowicz, W., Malyarchuk, B. and Grzybowski, T. 2015.
Complete mitochondrial genome database and standardized classification system for Canis lupus
familiaris. Forensic Science International: Genetics 19: 123-129.
Ewing, B., Hillier, L., Wendl, M.C. and Green, P. 1998. Base-calling of automated sequencer
traces using Phred. I. Accuracy assessment. Genome Research 8: 175-185.
Excoffier, L. and Lischer, H.E. 2010. Arlequin suite ver 3.5: a new series of programs to perform
population genetics analyses under Linux and Windows. Molecular Ecology Resources 10: 564-
567.
Faircloth, B., and Glenn, T. 2011. https://ethanomics.files.wordpress.com/2012/08/serapure_v2-
2.pdf
Filipi, K., Marková, S., Searle, J.B. and Kotlík, P. 2015. Mitogenomic phylogenetics of the bank
vole Clethrionomys glareolus, a model system for studying end-glacial colonization of Europe.
Molecular Phylogenetics and Evolution 82: 245-257.
Finch, T.M., Zhao, N., Korkin, D., Frederick, K.H. and Eggert, L.S. 2014. Evidence of positive
selection in mitochondrial complexes I and V of the African elephant. PLoS One 9: p.e92587.
Fluxus Engineering, 2015. Network 4.6 User Guide http://www.fluxus-
engineering.com/Network4600_user_guide.pdf
Foote, A.D., Morin, P.A., Durban, J.W., Willerslev, E., Orlando, L. and Gilbert, M.T.P. 2011a.
Out of the Pacific and back again: insights into the matrilineal history of Pacific killer whale
ecotypes. PLoS One 6: p.e24980.
Foote, A.D., Vilstrup, J.T., De Stephanis, R., Verborgh, P., Abel Neilsen, S.C., Deaville, R.,
Kleivane, L., Martin, V., Miller, P.J., Øien, N.,…., and Piertney, S.B. 2011b. Genetic
differentiation among North Atlantic killer whale populations. Molecular Ecology 20: 629-641.
273
Foote, A.D., Morin, P.A., Durban, J.W., Pitman, R.L., Wade, P., Willerslev, E., Gilbert, M.T.P.
and da Fonseca, R.R. 2011c. Positive selection on the killer whale mitogenome. Biology Letters
7: 116-118.
Foulds, L.R., Hendy, M.D., and Penny, D. 1979. A graph theoretic approach to the development
of minimal phylogenetic trees. Journal of Molecular Evolution 13: 127-149.
Fu, Y.-X. 1997. Statistical tests of neutrality against population growth, hitchhiking and
background selection. Genetics 147: 915-925.
Galtier, N., Nabholz, B., Glémin, S. and Hurst, G.D.D. 2009a. Mitochondrial DNA as a marker
of molecular diversity: a reappraisal. Molecular Ecology 18: 4541-4550.
Galtier, N., Jobson, R.W., Nabholz, B., Glémin, S. and Blier, P.U. 2009b. Mitochondrial whims:
metabolic rate, longevity and the rate of molecular evolution. Biology Letters 5: 413-416.
Guidon, S. 2012. PhyML – Manual.
http://www.atgcmontpellier.fr/download/papers/phyml_manual_2012.pdf)
Guindon, S., Dufayard, J.F., Lefort, V., Anisimova, M., Hordijk, W. and Gascuel, O. 2010. New
algorithms and methods to estimate maximum-likelihood phylogenies: assessing the
performance of PhyML 3.0. Systematic Biology 59: 307-321.
Hall, B. 2011. Phylogenetic Trees Made Easy. Sinauer Associates Inc. Publishers,
Massachusetts, U.S.A., 282pp.
Heide‐Jørgensen, M.P., Nielsen, N.H., Hansen, R.G., Schmidt, H.C., Blackwell, S.B. and
Jørgensen, O.A. 2015. The predictable narwhal: satellite tracking shows behavioural similarities
between isolated subpopulations. Journal of Zoology 297: 54-65.
Helbig, R., Boag, P.T. and White, B.N., 1989. Stock identification of beluga whales
(Delphinapterus leucas) using mitochondrial DNA markers: Preliminary results. Musk-Ox 37:
122-128.
Higdon, J.W., and Ferguson, S.H. 2017. Database of aerial surveys and abundance extimates for
beluga whales (Delphinapterus leucas) and narwhals (Monodon monceros) in the Canadian
Arctic. Canadian Technical Report of Fisheries and Aquatic Sciences 3211: v + 48p.
Hordijk, W., and Gascuel, O. 2005. Improving the efficiency of SPR moves in phylogenetic tree
search methods based on maximum likelihood. Bioinformatics 21: 4338-4347.
274
Huse, S.M., Huber, J.A., Morrison, H.G., Sogin, M.L. and Welch, D.M. 2007. Accuracy and
quality of massively parallel DNA pyrosequencing. Genome Biology 8: R143.
Keis, M., Remm, J., Ho, S.Y., Davison, J., Tammeleht, E., Tumanov, I.L., Saveljev, A.P.,
Männil, P., Kojola, I., Abramov, A.V. and Margus, T. 2013. Complete mitochondrial genomes
and a novel spatial genetic method reveal cryptic phylogeographical structure and migration
patterns among brown bears in north‐western Eurasia. Journal of Biogeography 40: 915-927.
Kim, J.H., Lee, Y.R., Koh, J.R., Jun, J.W., Giri, S.S., Kim, H.J., Chi, C., Yun, S., Kim, S.G.,
Kim, S.W. and Kim, H.K. 2017. Complete mitochondrial genome of the beluga whale
Delphinapterus leucas (Cetacea: Monodontidae). Conservation Genetics Resources: DOI
10.1007/s12686-017-0705-5.
Koen, E.L., Bowman, J., Garroway, C.J. and Wilson, P.J. 2013. The sensitivity of genetic
connectivity measures to unsampled and under-sampled sites. PLoS One 8: p.e56204.
Kosakovsky Pond, S.L.K. and Frost, S.D., 2005. Not so different after all: a comparison of
methods for detecting amino acid sites under selection. Molecular Biology and Evolution 22:
1208-1222.
Kosakovsky Pond, S.L.K., Frost, S.D.W., and Muse, S.V. 2005. HyPhy: hypothesis testing using
phylogenies. Bioinformatics 21: 676-679.
Li, M., Nordborg, M. and Li, L.M., 2004. Adjust quality scores from alignment and improve
sequencing accuracy. Nucleic Acids Research 32: 5183-5191.
Librado, P. and Rozas, J. 2009. DnaSP v5: A software for comprehensive analysis of DNA
polymorphism data. Bioinformatics 25: 1451-1452.
Lint, D.W., Clayton, J.W., Lillie, W.R. and Postma, L. 1990. Evolution and systematics of the
beluga whale, (Delphinapterus leucas) and other odontocetes: A molecular approach. In T.G.
Smith, D.G. St. Aubin, and J.R. Geraci (Eds.), Advances in Research on the Beluga Whale,
Delphinapterus leucas. Canadian Bulletin of Fisheries and Aquatic Sciences 224: 7-22.
Liu, L., Li, Y., Li, S., Hu, N., He, Y., Pong, R., Lin, D., Lu, L. and Law, M. 2012. Comparison
of next-generation sequencing systems. BioMed Research International, doi:
10.1155/2012/251364.
275
Loman, N.J., Misra, R.V., Dallman, T.J., Constantinidou, C., Gharbia, S.E., Wain, J. and Pallen,
M.J. 2012. Performance comparison of benchtop high-throughput sequencing platforms. Nature
Biotechnology 30:434-439.
Maddison, W.P., 1997. Gene trees in species trees. Systematic Biology 46: 523-536.
Maddison, W.P. and Knowles, L.L. 2006. Inferring phylogeny despite incomplete lineage
sorting. Systematic Biology 55: 21-30.
Maiers (Postma), L.D., Friesen, M.K., Wiens, A.V., and Clayton, J.W. 1996. Use of DNA
microsatellites in beluga whale (Delphinapterus leucas) population genetics. Canadian Technical
Report or Fisheries and Aquatic Sciences 2115: iv + 17p.
Malyarchuk, B., Derenko, M. and Denisova, G. 2014. A mitogenomic phylogeny and genetic
history of sable (Martes zibellina). Gene 550: pp.56-67.
McDonald, J.H. and Kreitman, M. 1991. Adaptive protein evolution at the Adh locus in
Drosophila. Nature 351: 652-654.
McGowen, M.R., Spaulding, M. and Gatesy, J. 2009. Divergence date estimation and a
comprehensive molecular tree of extant cetaceans. Molecular Phylogenetics and Evolution 53:
891-906.
Meiklejohn, C.D., Montooth, K.L. and Rand, D.M. 2007. Positive and negative selection on the
mitochondrial genome. Trends in Genetics 23: 259-263.
Merriman, B., Torrent, I., Rothberg, J.M. and R&D Team. 2012. Progress in ion torrent
semiconductor chip based sequencing. Electrophoresis 33: 3397-3417.
Miller, M.A., Pfeiffer, W. and Schwartz, T. 2010, Creating the CIPRES Science Gateway for
inference of large phylogenetic trees. In Gateway Computing Environments Workshop (GCE),
2010 (pp. 1-8).
Morin, P.A., Archer, F.I., Foote, A.D., Vilstrup, J., Allen, E.E., Wade, P., Durban, J., Parsons,
K., Pitman, R., Li, L. and Bouffard, P. 2010. Complete mitochondrial genome phylogeographic
analysis of killer whales (Orcinus orca) indicates multiple species. Genome Research 20: 908-
916.
Moura, A.E., Nielsen, S.C.A, Vilstrup, J.T., Moreno-Mayar, J.V., Gray, H., Natoli, A., Möller,
L., and Hoelzel, A.R. 2013a. Recent diversification of a marine genus (Tursiops spp.) tracks
habitat preference and environmental change. Systematic Biology 62: 865-877.
276
Moura, A.E., Nielsen, S.C.A, Vilstrup, J.T., Moreno-Mayar, J.V., Gray, H., Natoli, A., Möller,
L., and Hoelzel, A.R. 2013b. Data from: Recent diversification of a marine genus (Tursiops spp.)
tracks habitat preference and environmental change. Dryad Digital Repository.
http://dx.doi.org/10.5061/dryad.k501d
Moura, A.E., Kenny, J.G., Chaudhuri, R.R., Hughes, M.A., Reisinger, R.R., De Bruyn, P.J.N.,
Dahlheim, M.E., Hall, N. and Hoelzel, A.R. 2015. Phylogenomics of the killer whale indicates
ecotype divergence in sympatry. Heredity 114: 48-55.
Morin, P.A., Archer, F.I., Foote, A.D., Vilstrup, J., Allen, E.E., Wade, P., Durban, J., Parsons,
K., Pitman, R., Li, L. and Bouffard, P. 2010. Complete mitochondrial genome phylogeographic
analysis of killer whales (Orcinus orca) indicates multiple species. Genome Research 20: 908-
916.
Murray, B.W., Malik, S. and White, B.N., 1995. Sequence variation at the major
histocompatibility complex locus DQ beta in beluga whales (Delphinapterus leucas). Molecular
Biology and Evolution 12: 582-593.
Nei, M. and Gojobori, T. 1986. Simple methods for estimating the numbers of synonymous and
nonsynonymous nucleotide substitutions. Molecular Biology and Evolution 3: 418-426.
Nei, M. and Kumar, S. 2000. Molecular evolution and phylogenetics. Oxford University Press,
Inc., New York, USA.
Nichols, R. 2001. Gene trees and species trees are not the same. Trends in Ecology and
Evolution 16: 358-364.
Nozawa, M., Suzuki, Y. and Nei, M. 2009. Reliabilities of identifying positive selection by the
branch-site and the site-prediction methods. Proceedings of the National Academy of Sciences
USA 106: 6700-6705.
O’Corry-Crowe, G., Lydersen, C., Heide-Jørgensen, M.P., Hansen, L., Mukhametov, L.M.,
Dove, O. and Kovacs, K.M. 2010. Population genetic structure and evolutionary history of North
Atlantic beluga whales (Delphinapterus leucas) from West Greenland, Svalbard and the White
Sea. Polar Biology 33: 1179-1194.
O’Corry-Crowe, G.M., Lucey, W., Archer, F.I. and Mahoney, B. 2015. The genetic ecology and
population origins of the beluga whales, Delphinapterus leucas, of Yakutat Bay. Marine
Fisheries Review 77: 47-58.
277
Pál, C., Papp, B. and Lercher, M.J. 2006. An integrated view of protein evolution. Nature
Reviews Genetics 7: 337-348.
Palsbøll, P., Heide-Jørgensen, M.P. and Dietz, R. 1997. Genetic studies of narwhals, Monodon
monoceros, from West and East Greenland. Heredity 78: 284-292.
Patenaude, N.J., Quinn, J.S., Beland, P., Kingsley, M. and White, B.N., 1994. Genetic variation
of the St. Lawrence beluga whale population assessed by DNA fingerprinting. Molecular
Ecology 3: 375-381.
Peakall, R., and Smouse, P.E. 2012. GenAlEx 6.5: genetic analysis in Excel. Population genetic
software for teaching and research - an update. Bioinformatics 28: 2537-2539.
Petersen, S.D., Tenkula, D. and Ferguson, S.H. 2011. Population Genetic Structure of Narwhal
(Monodon monoceros). DFO Canadian Science Advisory Secretariat Research Document
2011/021. vi + 20 p.
Poon, A.F., Frost, S.D. and Pond, S.L.K. 2009. Detecting signatures of selection from DNA
sequences using Datamonkey. Bioinformatics for DNA Sequence Analysis 53:163-183.
http://www.datamonkey.org/help/tutorial
Quail, M.A., Smith, M., Coupland, P., Otto, T.D., Harris, S.R., Connor, T.R., Bertoni, A.,
Swerdlow, H.P. and Gu, Y. 2012. A tale of three next generation sequencing platforms:
comparison of Ion Torrent, Pacific Biosciences and Illumina MiSeq sequencers. BMC Genomics
13: 341.
Rambaut, A., Suchard, M.A., Xie, D., and Drummond, A.J. 2014. Tracer v1.6. Available from
http://beast.bio.ed.ac.uk/Tracer
Ramos-Onsins, S.E. and Rozas, J. 2002 Statistical properties of new neutrality tests against
population growth. Molecular Biology and Evolution 19: 2092-2100.
Richard, P. 2010. Stock definition of belugas and narwhals in Nunavut. DFO Canadian Science
Advisory Secretariat Research Document 2010/022. iv + 14p.
Ronquist, F., Huelsenbeck, J., and Teslenko. 2011. Mr. Bayes ver. 3.2 manual
(http://mrbayes.sourceforge.net/mb3.2_manual.pdf)
278
Ronquist, F., Teslenko, M., van der Mark, P., Aures, D.L., Darling, A., Höhna, S., Larget, B.,
Liu, L., Suchard, M.A., and Huelsenbeck, J.P. 2012. MrBayes 3.2: Efficient Bayesian
phylogenetic inference and model choice across a large model space. Systematic Biology 61:
539-542.
Ross, M.G., Russ, C., Costello, M., Hollinger, A., Lennon, N.J., Hegarty, R., Nusbaum, C. and
Jaffe, D.B. 2013. Characterizing and measuring bias in sequence data. Genome Biology 14:
R51.
Schwartz, M.K. and McKelvey, K.S. 2009. Why sampling scheme matters: the effect of
sampling scheme on landscape genetic results. Conservation Genetics 10: 441-452.
Shafer, A.B., Wolf, J.B., Alves, P.C., Bergström, L., Bruford, M.W., Brännström, I., Colling, G.,
Dalen, L., De Meester, L., Ekblom, R. and Fawcett, K.D. 2015. Genomics and the challenging
translation into conservation practice. Trends in Ecology and Evolution 30: 78-87.
Seutin, G., White, B.N., and Boag, P.T. 1991. Preservation of avian blood and tissue samples
for DNA analyses. Canadian Journal of Zoology 69: 82-9.
Shamblin, B.M., Bjorndal, K.A., Bolten, A.B., Hillis-Starr, Z.M., Lundgren, I., Naro-Maciel, E.,
and Nairn, C.J. 2012. Mitogenomic sequences better resolve stock structure of southern Greater
Caribbean green turtle rookeries. Molecular Ecology 21: 2330-2340.
Shi, N.N., Fan, L., Yao, Y.G., Peng, M.S. and Zhang, Y.P. 2014. Mitochondrial genomes of
domestic animals need scrutiny. Molecular Ecology 23: 5393-5397.
Southern, E.M. 1975. Detection of specific sequences among DNA fragments separated by gel
electrophoresis. Journal of Molecular Biology 98: pp.503 -508.
Tamura, K. and Nei, M., 1993. Estimation of the number of nucleotide substitutions in the
control region of mitochondrial DNA in humans and chimpanzees. Molecular Biology and
Evolution 10: 512-526.
Tajima, F. 1989. Statistical-method for testing the neutral mutation hypothesis by DNA
polymorphism. Genetics 123: 585-595.
Tamura, K., Stecher, G., Peterson, D., Filipski, A. and Kumar, S. 2013. MEGA6: molecular
evolutionary genetics analysis version 6.0. Molecular Biology and Evolution 30: 2725-2729.
279
Turgeon, J., Duchesne, P., Colbeck, G.J., Postma, L.D., and Hammill, M.O. 2012.
Spatiotemporal segregation among summer stocks of beluga (Delphinapterus leucas) despite
nuclear gene flow: implication for the endangered belugas in eastern Hudson Bay (Canada).
Conservation Genetics 13: 419-433.
Vilstrup, J.T., Ho, S.Y., Foote, A.D., Morin, P.A., Kreb, D., Krützen, M., Parra, G.J., Robertson,
K.M., de Stephanis, R., Verborgh, P. and Willerslev, E. 2011. Mitogenomic phylogenetic
analyses of the Delphinidae with an emphasis on the Globicephalinae. BMC Evolutionary
Biology 11: 65.
Volkmann, L.A., Statham, M.J., Mooers, A.Ø. and Sacks, B.N. 2015. Genetic distinctiveness of
red foxes in the Intermountain West as revealed through expanded mitochondrial sequencing.
Journal of Mammalogy 96: 297-307.
Whitehead, H. 1998. Cultural selection and genetic diversity in matrilineal whales. Science 282:
1708-1711.
Woolley, S., Johnson, J., Smith, M.J., Crandall, K.A. and McClellan, D.A. 2003. TreeSAAP:
selection on amino acid properties using phylogenetic trees. Bioinformatics 19: 671-672.
Yu, L., Wang, X., Ting, N. and Zhang, Y. 2011. Mitogenomic analysis of Chinese snub-nosed
monkeys: Evidence of positive selection in NADH dehydrogenase genes in high-altitude
adaptation. Mitochondrion 11: 497-503.
Zhang, B., Penton, C.R., Xue, C., Wang, Q., Zheng, T. and Tiedje, J.M. 2015. Evaluation of the
Ion Torrent Personal Genome Machine for gene-targeted studies using amplicons of the
nitrogenase gene nifH. Applied and Environmental Microbiology 81: 4536-4545.
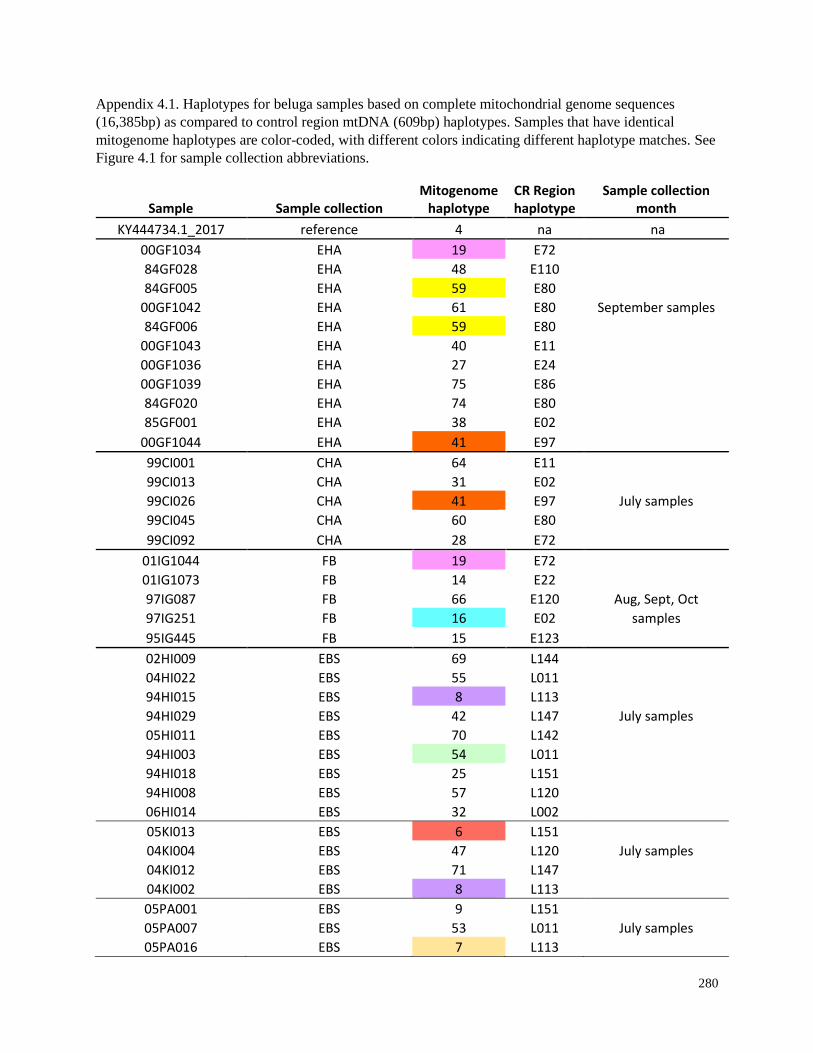
280
Appendix 4.1. Haplotypes for beluga samples based on complete mitochondrial genome sequences
(16,385bp) as compared to control region mtDNA (609bp) haplotypes. Samples that have identical
mitogenome haplotypes are color-coded, with different colors indicating different haplotype matches. See
Figure 4.1 for sample collection abbreviations.
Sample Sample collection Mitogenome
haplotype CR Region haplotype
Sample collection month
KY444734.1_2017 reference 4 na na
00GF1034 EHA 19 E72 84GF028 EHA 48 E110 84GF005 EHA 59 E80
00GF1042 EHA 61 E80 September samples
84GF006 EHA 59 E80 00GF1043 EHA 40 E11 00GF1036 EHA 27 E24 00GF1039 EHA 75 E86 84GF020 EHA 74 E80 85GF001 EHA 38 E02
00GF1044 EHA 41 E97
99CI001 CHA 64 E11 99CI013 CHA 31 E02 99CI026 CHA 41 E97 July samples
99CI045 CHA 60 E80 99CI092 CHA 28 E72
01IG1044 FB 19 E72 01IG1073 FB 14 E22 97IG087 FB 66 E120 Aug, Sept, Oct
97IG251 FB 16 E02 samples
95IG445 FB 15 E123
02HI009 EBS 69 L144 04HI022 EBS 55 L011 94HI015 EBS 8 L113 94HI029 EBS 42 L147 July samples
05HI011 EBS 70 L142 94HI003 EBS 54 L011 94HI018 EBS 25 L151 94HI008 EBS 57 L120 06HI014 EBS 32 L002
05KI013 EBS 6 L151 04KI004 EBS 47 L120 July samples
04KI012 EBS 71 L147 04KI002 EBS 8 L113
05PA001 EBS 9 L151 05PA007 EBS 53 L011 July samples
05PA016 EBS 7 L113
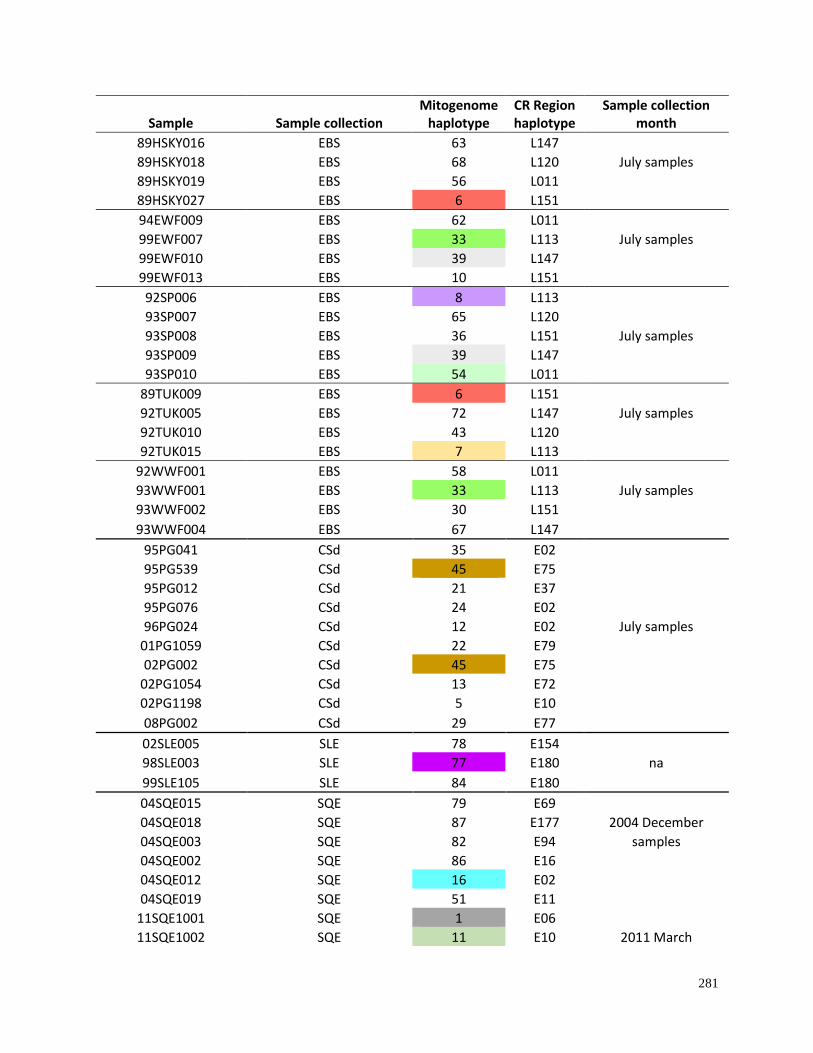
281
Sample Sample collection Mitogenome
haplotype CR Region haplotype
Sample collection month
89HSKY016 EBS 63 L147 89HSKY018 EBS 68 L120 July samples
89HSKY019 EBS 56 L011 89HSKY027 EBS 6 L151
94EWF009 EBS 62 L011 99EWF007 EBS 33 L113 July samples
99EWF010 EBS 39 L147 99EWF013 EBS 10 L151
92SP006 EBS 8 L113 93SP007 EBS 65 L120 93SP008 EBS 36 L151 July samples
93SP009 EBS 39 L147 93SP010 EBS 54 L011
89TUK009 EBS 6 L151 92TUK005 EBS 72 L147 July samples
92TUK010 EBS 43 L120 92TUK015 EBS 7 L113
92WWF001 EBS 58 L011 93WWF001 EBS 33 L113 July samples
93WWF002 EBS 30 L151 93WWF004 EBS 67 L147
95PG041 CSd 35 E02 95PG539 CSd 45 E75 95PG012 CSd 21 E37 95PG076 CSd 24 E02 96PG024 CSd 12 E02 July samples
01PG1059 CSd 22 E79 02PG002 CSd 45 E75
02PG1054 CSd 13 E72 02PG1198 CSd 5 E10 08PG002 CSd 29 E77
02SLE005 SLE 78 E154 98SLE003 SLE 77 E180 na
99SLE105 SLE 84 E180
04SQE015 SQE 79 E69 04SQE018 SQE 87 E177 2004 December
04SQE003 SQE 82 E94 samples
04SQE002 SQE 86 E16 04SQE012 SQE 16 E02 04SQE019 SQE 51 E11
11SQE1001 SQE 1 E06 11SQE1002 SQE 11 E10 2011 March
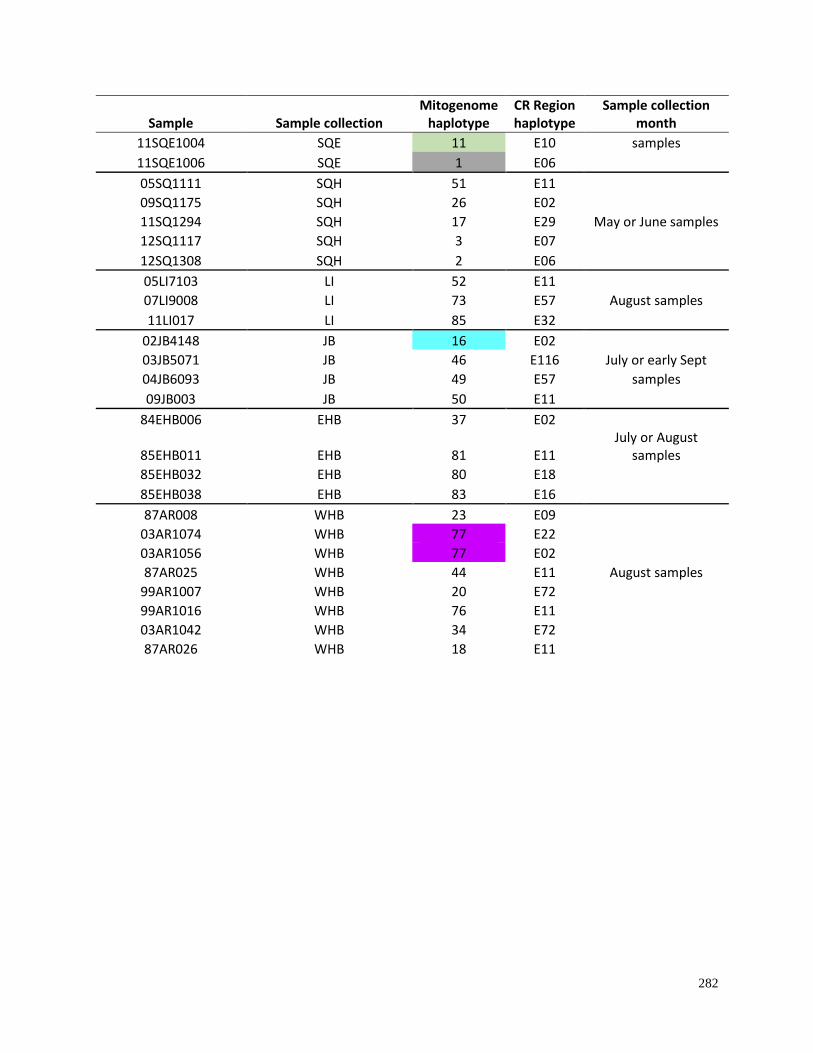
282
Sample Sample collection Mitogenome
haplotype CR Region haplotype
Sample collection month
11SQE1004 SQE 11 E10 samples
11SQE1006 SQE 1 E06
05SQ1111 SQH 51 E11 09SQ1175 SQH 26 E02 11SQ1294 SQH 17 E29 May or June samples
12SQ1117 SQH 3 E07 12SQ1308 SQH 2 E06
05LI7103 LI 52 E11 07LI9008 LI 73 E57 August samples
11LI017 LI 85 E32
02JB4148 JB 16 E02 03JB5071 JB 46 E116 July or early Sept
04JB6093 JB 49 E57 samples
09JB003 JB 50 E11
84EHB006 EHB 37 E02
85EHB011 EHB 81 E11 July or August
samples
85EHB032 EHB 80 E18 85EHB038 EHB 83 E16
87AR008 WHB 23 E09 03AR1074 WHB 77 E22 03AR1056 WHB 77 E02 87AR025 WHB 44 E11 August samples
99AR1007 WHB 20 E72 99AR1016 WHB 76 E11 03AR1042 WHB 34 E72 87AR026 WHB 18 E11
283
Chapter 5: Summary, conclusions, and directions for future research
5.1 Introduction
The role of genetics in conservation biology recognizes that “future evolutionary
adaptation depends on the existence of genetic variation” (Milligan et al. 1994). The tools
available, including empirical approaches in the lab and theoretical applications for data analysis,
to detect and interpret that variation in natural populations have changed dramatically over the
last 50 years (Allendorf 2017, Charlesworth and Charlesworth 2017). As I consider the last 25
years I have spent using genetic approaches to study belugas (Delphinpaterus leucas), the ability
of researchers to adapt to rapid changes in laboratory technology, increasingly more complex
quantitative methods and computational resources, and to integrate information from whole
ecosystems and across scientific disciplines is no less remarkable.
At their core, strategies for the conservation and management of wild populations still
include the use of molecular data to: reveal patterns of extant genetic diversity; define population
and management units; provide information about the extent of historical population isolations
and subsequent patterns of geographic expansions; collect information about species biology
important to conservation; and understand evolutionary processes (e.g. Moritz 1999, 2002,
Paetkau 1999, Frankham 2003). This thesis took advantage of evolving empirical and theoretical
genetic approaches to examine diversity among belugas from across the Canadian range of the
species and spanning more than 25 years of sampling. The overall goal was to improve the
resolution of spatial genetic differentiation among and within putative Canadian beluga stocks
(as defined in Richard 2010), refine inferences about past responses of belugas to climate
284
changes, test new approaches to detect fine-scale structure within seasonal aggregations, and
develop new tools to infer the adaptive potential of these whales.
5.2 Key findings and future research directions
5.2.1 Conservation and management units for beluga whales in Canadian waters
In the 1980’s, before the introduction of the first Perkin Elmer Cetus© thermalcycler, the
isolation and restriction enzyme digestion of high quality mtDNA enabled the first genetic
delineation of beluga stocks in Canada (Helbig et al. 1989). After the introduction of the
polymerase chain reaction (PCR) (Saiki et al. 1985, Mullis et al. 1989), this technique, along
with laborious manual Sanger sequencing (Sanger et al. 1977), allowed for the first control
region (CR) mtDNA study of belugas across Canada (Brown Gladden et a. 1997). In this present
thesis, automated, high throughput sequencing allowed for the most extensive analysis to date of
CR mtDNA genetic population structure for over 2500 beluga whales sampled in Canadian
waters.
This study resulted in the identification of ten genetically distinct groups of belugas that
correspond to different geographic seasonal sample collections (mostly summer). The results
also improved the resolution of genetic diversity among and within summering groups of belugas
in Canada as compared to previous studies (e.g. Brennin et al. 1997, Brown Gladden et al. 1997,
de March and Postma 2003, Turgeon et al. 2012).The information was incorporated into an
update of Designatable Units (DUs) for belugas in Canada (COSEWIC 2016) where eight DUs
were proposed, including: Eastern Beaufort Sea (EBS), Eastern High Arctic-Baffin Bay (EHA-
BB), Cumberland Sound (CS), Ungava Bay (UB), Western Hudson Bay (WHB), Eastern Hudson
Bay (EHB), St. Lawrence Estuary (STL), and James Bay (JB). The full analyses in this thesis
285
continued to support the identification of these Designatable Units for belugas in Canada, but
also indicate finer scale genetic structure in the EHA-BB and WHB DUs. Specifically, results
suggest the presence of additional beluga DUs in the central Canadian High Arctic (i.e.
Cunningham Inlet area) and a local, migratory DU around the Belcher Islands in Hudson Bay.
Complex mixtures of genetically distinct groups that overlap spatially and temporally in
areas such as Hudson Bay (and possibly the High Arctic and Cumberland Sound) present
challenges for ongoing efforts to define boundaries for conservation and management purposes.
As recommended in the beluga DU report (COSEWIC 2016), comprehensive analyses in these
areas, and the full Canada-wide distribution of belugas, with nuclear DNA microsatellite markers
would complement the results from mtDNA sequencing. However, the utility of new genetic
markers, such as SNPs and other genome-wide markers, should also be investigated (Davey et al.
2011). More representative population genetic information (i.e. larger number of samples,
sampling efforts to target specific locations, larger genetic surveys of genome-wide information),
along with new ways to analyze data, such as network analysis (as used in Chapter 3) and
seascape genetics that integrates other data and approaches (e.g. Amaral et al. 2012, Selkoe et al.
2016), may help provide new information required for stock assessment and management goals.
Seascape genetics, a marine equivalent to landscape genetics, is an approach that uses spatial
analyses and statistics for population genetic data to help clarify the relationship of dispersal and
gene flow of an organism to particular environments/habitats (i.e. in the case of belugas, the
seascape) (Selkoe et al. 2016). Information from genetic markers, location data (latitude and
longitude coordinates) for beluga samples used for genetic analyses, temporal information such
as date or season, aerial survey information on distributions and aggregations, physical
oceanographic information, and other habitat feature information could be linked in a GIS
286
framework to form layers that could allow for the interpretation of boundaries between
conservation and management units of belugas.
5.2.2 Phylogeography of Canadian belugas
Early DNA sequencing technologies used for previous phylogenetic studies of belugas
resulted in relatively short fragments of sequences for analyses (234 – 410bp, Chapter 2
Appendix 2.1). Phylogeographic analyses based on 609bp of sequence in this thesis supported
the identification of three main groups of haplotypes (instead of two groups, Brown Gladden et.
al 1997) that clustered together based on ancestral nodes with multiple descendant haplotypes.
Furthermore, the geographical distribution of these haplogroups offered a different model for the
location of glacial refugia and the patterns of historical expansion and recolonizations by
Canadian stocks of belugas as compared to previous studies (Brown Gladden et al. 1997, de
March et al. 2003). The most divergent lineages were found at the east, west and southern edges
of the Canadian distribution of belugas, with the central area characteristic of a contact zone
displaying an admixture of lineages. Neutrality tests and mismatch distribution analyses
indicated population expansions in the recent past for most haplogroups, with estimated
expansion times generally coinciding with patterns of glacial retreat (Dyke 2004). The results
presented in this thesis found levels of genetic diversity and suggested a phylogeographic history
across the Canadian range of belugas that may indicate a capacity among beluga lineages for
climate change resilience (e.g. Laidre et al. 2008).
Molecular genetic approaches have become well established for the investigation of
phylogeographic patterns (Hickerson et al. 2010), with Arctic marine taxa offering unique
opportunities to evaluate evolutionary processes in response to environmental changes (Weider
287
and Hobæk, 2000). Species such as belugas allow for the study of a variety of connected
ecological and evolutionary phenomena (such as dispersal, founder effects, and post-glacial
range expansions), especially over a latitudinal gradient (Weider and Hobæk, 2000). Coordinated
efforts among global beluga population genetic researchers could offer extremely valuable
ecological and evolutionary insights for the species. The next step for phylogeographic studies
and assessing responses to climate change of Canadian belugas should focus on integrating the
molecular data with information from fossil records such as those from the Champlain Sea
(Huntington 2006, 2008), including genetic analyses using ancient DNA techniques (e.g. de
Bruyn et al. 2011), and spatial modelling approaches (Gavin et al. 2014). Species distribution
modelling, which correlates species presence with environmental and ecological variables
through space and time (Jiménez-Valverde et al. 2008, Kearney and Porter 2009), merged with
genetic information for belugas could contribute to the resolution of conservation and
management units and also link to the seascape genetics approach identified in Section 5.2.1.
5.2.3 Relatedness and fine-scale stock structure for nearshore aggregations of Beaufort Sea
belugas
In highly mobile animals such as whales, population structure may be quite cryptic and
can develop from non-random associations of related kin (e.g. Pilot et al. 2010, Möller 2012).
Analyses to determine patterns of individual and kin-relationships among belugas have only
recently been employed (Colbeck et al 2013). In this thesis, genetic analyses of relatedness using
microsatellite genotypes of samples obtained from annual subsistence harvesting did not reveal
fine-scale geographic structure of kin-groups within nearshore aggregations of Eastern Beaufort
Sea (EBS) beluga. Given these results, harvesting practices that have been used in the region
288
over the last several decades do not appear to be impacting particular kin-groups or distinct
genetic units associated with particular geographic locations.
However, even though there were no spatial or temporal patterns, both control region
sequences and whole mitogenome analyses did suggest that for the nearshore portion of the
stock, female EBS belugas form moderate bonds with other female kin and there is female
philopatry to the overall Eastern Beaufort Sea area. Given these results, and the evidence for
segregation within the EBS belugas based on habitat use (Loseto et al. 2006), it would be
interesting to pursue studies of social associations with a more representative sample of the
stock. Association studies of marked individuals, combined with genetics, can provide very
powerful insights for social structure (e.g. Kerth et al. 2011, Snyder-Mackler et al. 2014,
Morinha et al. 2017). Biopsy sampling of free-ranging animals is commonly used for studies of
social structure in whales (e.g. Richard et al. 1996, Andrews et al. 2010); however, cultural
sensitivities discourage its use for belugas. New technologies may again provide alternatives to
harvest sampling for genetic investigations of the full range of the EBS beluga stock.
Recently, environmental DNA (eDNA) from seawater has been used for population
genetic analyses of whale sharks (Rhincodon typus) (Sigsgaard et al. 2016). Traditionally, eDNA
has been used as a tool to detect the presence/absence of aquatic species, including whales (Foote
et al. 2012), but some proponents foresee its application for conservation genetics and
phylogeography despite continuing concerns over false positives and other limitations (Bohmann
et al. 2014). It is possible that it will evolve even further as a molecular genetics tool. Belugas, in
particular, could be a good candidate species for further investigations of eDNA as a tool for
population genetic analyses in the marine environment. The fact that these whales form
predicable summer aggregations in large numbers in shallow river estuaries, and the unique
289
(among cetaceans) characteristic that most of these whales are undergoing an annual skin moult
in these locations (Boily 1995), provides an opportunity to test and optimize a number of
methods for eDNA investigations. First, whales are accessible and are visible, allowing for
known presence or absence detections. Second, because of the moult, there is a high expectation
for sloughed skin cell material to be present in the water. Second, sampling could be done at
increasing distances from an aggregation of whales to test the influence of dilution, current, and
water mixing on detection results. Finally, genetic resources are readily available for beluga for
the design of assays of eDNA samples to detect a variety of genetic information. Once these
types of technological issues, along with the establishment of stringent quality control protocols
for false positives and negatives, have been established, population and stock-scale questions
may be able to be addressed. For example, a survey of haplotype frequencies from eDNA
sampling of beluga aggregations, as was done for whale shark aggregations (Sigsgaard et al.
2016), among river estuaries in Hudson Bay could be compared to existing results from skin
samples obtained through harvesting to evaluate the eDNA results. Based on these results, eDNA
samples from areas where harvest or biopsy sampling is not possible (e.g. Seal River, Churchill
River, Nelson River along Western Hudson Bay; along the northern Ontario coastline and into
James Bay) may be particularly interesting for refining the identification of unique genetic
groups of belugas in Hudson Bay.
5.2.4 Mitogenomics as a tool for investigating beluga population genetics and molecular ecology
Studies evaluating the use of whole mitogenome sequences for the study of population
genetic diversity and phylogenetics in belugas and narwhals have not previously been conducted.
Though analyses of whole mitogenomes has been employed for inferring phylogenetic
290
relationships for more than 15 years, especially in mammals (Curole and Kocher 1999), more
recent advances in next-generation sequencing technologies have improved sequencing speed
and sample throughput at costs affordable for population-genetic studies (Schuster 2008). In this
thesis, the comparison of whole mitogenome sequences, generated using next-generation
sequencing protocols, for beluga and narwhal samples representing range-wide Canadian stocks
corroborated results of control region mtDNA analyses. Furthermore, finer-scale patterns of
phylogenetic relationships among beluga samples were resolved, but whole mitogenome
diversity failed to improve phylogenetic results of narwhals as compared to control region
mtDNA sequences. Future work should be done to examine possible advantages of phylogenies
from only the most informative regions of the mitogenome sequence (Duchêne et al. 2011).
Also, coalescent-based population genetic analyses (such as available in BEAST (Bayesian
Evolutionary Analysis by Sampling Trees), Bouckaert et al. 2014) for more precise estimates of
divergence times should be conducted using mitogenome phylogenies. The analysis of multiple
loci, specifically nuclear microsatellite loci, may also help to resolve the shallow phylogenies
found for beluga and narwhal samples and provide estimates of recent divergence times. The use
of multiple unlinked loci is often recommended for better estimation of phylogenetic trees for
species with recent, rapid radiation (e.g. Sánchez-Gracia and Castresana 2012).
Perhaps the greatest potential for mitogenomic studies of natural populations is for the
investigation of adaptive variation, particularly positive selection for variation related to
particular environments (Primmer 2009). In this study, preliminary analyses for indications of
selection among beluga lineages revealed widespread signals of negative, purifying selection, but
no evidence of positive, adaptive selection was found. Further research involving greater
numbers of samples that encompass a more diverse, global range of populations may have a
291
greater chance of detecting variation that may be linked to adaptation within mtDNA protein-
coding genes. This approach should not be limited to just mtDNA data. Geographic cline
analysis has recently been combined with complete genome-wide genetic variation among
ecotypes of monkeyflowers (Mimulus aurantiacus) (Stankowski et al. 2017). The results
demonstrate the value of a using a spatially explicit framework to study genome-wide patterns of
divergence within a species.
5.3 Conclusion
This thesis examined DNA diversity among Canadian beluga whales sampled across a
broad spatial and temporal scale, and at various scales of sequence analyses (i.e. partial mtDNA
control region sequence, multiple nuclear microsatellite loci, and whole mitogenome sequences).
Understanding the genetic diversity of natural populations and the evolutionary forces that shape
it, the relationship of diversity to census population sizes, and how diversity is linked to adaptive
potential of a population, are critical for effective conservation strategies (Leffler et al. 2012).
The results of this thesis provided important information for the identification of conservation
and management units of belugas, including: Designatable Units (DUs) for conservation
assessment purposes (COSEWIC 2016), evolutionarily-related groups to interpret patterns of
refugial use and post-glacial expansion in response to climate changes, and kin-groups to
determine the potential impacts of subsistence harvesting practices. The development of an Ion
Torrent workflow allowed for testing a mitogenomic approach to examine neutral and adaptive
variation among beluga samples representing ancestral and distinct control region lineages from
across the Canadian distribution of the species. This may be a first step towards adopting
conservation genomics investigations of belugas to survey mtDNA genetic diversity in more
292
detail. If this information is then linked to the ecological and life-history strategies of a
population or stock, it can provide a basis for predictions about potential responses to
environmental disturbance, population health, fitness, and other ecosystem interactions (Hughes
et al. 2008, Romiguier et al. 2014). This would be valuable for developing and updating
conservation strategies and management policies.
5.4 References
Allendorf, F.W. 2017. Genetics and the conservation of natural populations: allozymes to
genomes. Molecular Ecology 26: 420-430.
Amaral, A.R., Beheregaray, L.B., Bilgmann, K., Boutov, D., Freitas, L., Robertson, K.M.,
Sequeira, M., Stockin, K.A., Coelho, M.M. and Möller, L.M. 2012. Seascape genetics of a
globally distributed, highly mobile marine mammal: the short-beaked common dolphin (genus
Delphinus). PLoS One 7: p.e31482.
Andrews, K.R., Karczmarski, L., Au, W.W., Rickards, S.H., Vanderlip, C.A., Bowen, B.W.,
Gordon Grau, E. and Toonen, R.J., 2010. Rolling stones and stable homes: social structure,
habitat diversity and population genetics of the Hawaiian spinner dolphin (Stenella longirostris).
Molecular Ecology 19: 732-748.
Bohmann, K., Evans, A., Gilbert, M.T.P., Carvalho, G.R., Creer, S., Knapp, M., Douglas, W.Y.
and De Bruyn, M. 2014. Environmental DNA for wildlife biology and biodiversity
monitoring. Trends in Ecology Evolution 29: 358-367.
Boily, P., 1995. Theoretical heat flux in water and habitat selection of phocid seals and beluga
whales during the annual molt. Journal of Theoretical Biology 172: 235-244.
Bouckaert, R., Heled, J., Kühnert, D., Vaughan, T., Wu, C.H., Xie, D., Suchard, M.A., Rambaut,
A. and Drummond, A.J. 2014. BEAST 2: a software platform for Bayesian evolutionary
analysis. PLoS Computational Biology 10: e1003537.
Brennin, R., Murray, B.W., Friesen, M.K., Maiers (Postma), L.D., Clayton, J.W., and White,
B.N. 1997. Population genetic structure of beluga whales (Delphinapterus leucas): mitochondrial
DNA sequence variation within and among North American populations. Canadian Journal of
Zoology 75: 795-802.
293
Brown Gladden, J.G., Ferguson, M.M, and Clayton, J.W. 1997. Matriarchal genetic population
structure of North American beluga whales Delphinapterus leucas (Cetacea: Monodontidae).
Molecular Ecology 6: 1033-1046.
Charlesworth, B. and Charlesworth, D. 2017. Population genetics from 1966 to 2016. Heredity
118: 2-9.
Colbeck, G.J., Duschesne, P., Postma, L.D., Lésage, V., Hammill, M.O., and Turgeon, J. 2013.
Groups of related belugas (Delphinapterus leucas) travel together during their seasonal
migrations in and around Hudson Bay. Proceedings of the Royal Society of London B:
Biological Sciences 280: 1752–1762.
COSEWIC. 2016. Designatable Units for Beluga Whales (Delphinapterus leucas) in Canada.
Committee on the Status of Endangered Wildlife in Canada. Ottawa. 73 pp.
Curole, J.P. and Kocher, T.D. 1999. Mitogenomics: digging deeper with complete mitochondrial
genomes. Trends in Ecology and Evolution 14: 394-398.
de Bruyn, M., Hoelzel, A.R., Carvalho, G.R. and Hofreiter, M. 2011. Faunal histories from
Holocene ancient DNA. Trends in Ecology and Evolution 26: 405-413.
de March, B.G.E and Postma, L.D. 2003. Molecular stock discrimination of belugas
(Delphinapterus leucas) hunted in eastern Hudson Bay, northern Quebec, Hudson Strait, and
Sanikiluaq (Belcher Islands), Canada, and comparisons to adjacent populations. Arctic 56: 111-
124.
Dyke, A.S., 2004. An outline of North American deglaciation with emphasis on central and
northern Canada. Developments in Quaternary Sciences 2: 373-424.
Foote, A.D., Thomsen, P.F., Sveegaard, S., Wahlberg, M., Kielgast, J., Kyhn, L.A., Salling,
A.B., Galatius, A., Orlando, L. and Gilbert, M.T.P., 2012. Investigating the potential use of
environmental DNA (eDNA) for genetic monitoring of marine mammals. PLoS One 7:
p.e41781.
Frankham, R. 2003. Genetics and conservation biology. Comptes Rendus Biologies 326: 22-29.
Gavin, D.G., Fitzpatrick, M.C., Gugger, P.F., Heath, K.D., Rodríguez‐Sánchez, F., Dobrowski,
S.Z., Hampe, A., Hu, F.S., Ashcroft, M.B., Bartlein, P.J. and Blois, J.L. 2014. Climate refugia:
joint inference from fossil records, species distribution models and phylogeography. New
Phytologist 204: 37-54.
294
Harington, C.R. 2006. Félix: a late Pleistocene white whale (Delphinapterus leucas) skeleton
from the Champlain Sea deposits at Saint-Félix-de-Valois, Québec. Géographie physique et
Quaternaire 60: 183-198.
Harington, C.R. 2008. The evolution of Arctic marine mammals. Ecological Applications 18
(Supplement): S23-S40.
Helbig, R., Boag, P.T. and White, B.N., 1989. Stock identification of beluga whales
(Delphinapterus leucas) using mitochondrial DNA markers: Preliminary results. Musk-Ox 37:
122-128.
Hickerson, M.J., Carstens, B.C., Cavender-Bares, J., Crandall, K.A., Graham, C.H., Johnson,
J.B., Rissler, L., Victoriano, P.F. and Yoder, A.D. 2010. Phylogeography’s past, present, and
future: 10 years after. Molecular Phylogenetics and Evolution 54: 291-301.
Hughes, A.R., Inouye, B.D., Johnson, M.T., Underwood, N. and Vellend, M. 2008. Ecological
consequences of genetic diversity. Ecology Letters 11: 609-623.
Kearney, M. and Porter, W. 2009. Mechanistic niche modelling: combining physiological and
spatial data to predict species’ ranges. Ecology Letters 12: 334-350.
Kerth, G., Perony, N., and Schweitzer, F. 2011. Bats are able to maintain long-term social
relationships despite the high fission-fusion dynamics of their groups. Proceedings of the Royal
Society of London B: Biological Sciences 278: 2761–2767.
Laidre, K.L., Stirling, I., Lowry, L.F., Wiig, Ø., Heide-Jørgensen, M.P. and Ferguson, S.H. 2008.
Quantifying the sensitivity of Arctic marine mammals to climate‐induced habitat change.
Ecological Applications 18 (Supplement): S97-S125.
Leffler, E.M., Bullaughey, K., Matute, D.R., Meyer, W.K., Segurel, L., Venkat, A., Andolfatto,
P. and Przeworski, M. 2012. Revisiting an old riddle: what determines genetic diversity levels
within species? PLoS Biology 10: p.e1001388.
Loseto, L.L., Richard, P., Stern, G.A., Orr, J., and Ferguson, S.H. 2006. Segregation of Beaufort
Sea beluga whales during the open-water season. Canadian Journal of Zoology 84: 1743-1751.
Milligan, B.G., Leebens-Mack, J. and Strand, A.E. 1994. Conservation genetics: beyond the
maintenance of marker diversity. Molecular Ecology 3: 423-435.
Möller, L.M. 2012. Sociogenetic structure, kin associations and bonding in delphinids.
Molecular Ecology 21: 745–764.
295
Moritz, C. 1999. Conservation units and translocations: strategies for conserving evolutionary
processes. Hereditas 130: 217-228.
Moritz, C. 2002. Strategies to protect biological diversity and the evolutionary processes that
sustain it. Systematic Biology 51: 238-254.
Mullis, K., Faloona, F., Scharf, S., Saiki, R.K., Horn, G.T. and Erlich, H.1986. Specific
enzymatic amplification of DNA in vitro: the polymerase chain reaction. Cold Spring Harbor
Symposia on Quantitative Biology 51: 263-273.
Paetkau, D. 1999. Using genetics to identify intraspecific conservation units: a critique of current
methods. Conservation Biology 13: 1507-1509.
Pilot, M., Dahlheim, M.E. and Hoelzel, A.R. 2010. Social cohesion among kin, gene flow
without dispersal and the evolution of population genetic structure in the killer whale (Orcinus
orca). Journal of Evolutionary Biology 23: 20-31.
Primmer, C.R. 2009. From conservation genetics to conservation genomics. Annals of the New
York Academy of Sciences 1162: 357-368.
Richard, P. 2010. Stock definition of belugas and narwhals in Nunavut. DFO Canadian Science
Advisory Secretariat Research Document 2010/022. iv + 14p.
Romiguier, J., Gayral, P., Ballenghien, M., Bernard, A., Cahais, V., Chenuil, A., Chiari, Y.,
Dernat, R., Duret, L., Faivre, N. and Loire, E. 2014. Comparative population genomics in
animals uncovers the determinants of genetic diversity. Nature 515:261-263.
Richard, K.R., Dillon, M.C., Whitehead, H. and Wright, J.M. 1996. Patterns of kinship in groups
of free-living sperm whales (Physeter macrocephalus) revealed by multiple molecular genetic
analyses. Proceedings of the National Academy of Sciences USA 93: 8792-8795.
Saiki, R.K., Scharf, S., Faloona, F., Mullis, K.B., Horn, G.T., Erlich, H.A. and Arnheim, N.
1985. Enzymatic amplification of b-globin genomic sequences and restriction site analysis for
diagnosis of sickle cell anemia. Science 230: 1350-1354.
Sánchez-Gracia, A. and Castresana, J. 2012. Impact of deep coalescence on the reliability of
species tree inference from different types of DNA markers in mammals. PLoS One 7:
p.e30239.
296
Sanger, F., Nicklen, S. and Coulson, A.R. 1977. DNA sequencing with chain-terminating
inhibitors. Proceedings of the National Academy of Sciences USA 74: 5463-5467.
Selkoe, K.A., Aloia, C.C., Crandall, E.D., Iacchei, M., Liggins, L., Puritz, J.B., von der Heyden,
S. and Toonen, R.J. 2016. A decade of seascape genetics: contributions to basic and applied
marine connectivity. Marine Ecology Progress Series 554: 1-19.
Schuster, S.C. 2008. Next-generation sequencing transforms today's biology. Nature Methods 5:
16-18.
Sigsgaard, E.E., Nielsen, I.B., Bach, S.S., Lorenzen, E.D., Robinson, D.P., Knudsen, S.W.,
Pedersen, M.W., Al Jaidah, M., Orlando, L., Willerslev, E. and Møller, P.R. 2016. Population
characteristics of a large whale shark aggregation inferred from seawater environmental
DNA. Nature Ecology and Evolution 1: DOI: 10.1038/s41559-016-0004.
Snyder-Mackler, N., Albert, S.C., and Bergman, T.J. 2014. The socio-genetics of a complex
society: female gelada relatedness patterns mirror association patterns in a multilevel society.
Molecular Ecology 23: 6179–6191.
Turgeon, J., Duchesne, P., Colbeck, G.J., Postma, L.D., and Hammill, M.O. 2012.
Spatiotemporal segregation among summer stocks of beluga (Delphinapterus leucas) despite
nuclear gene flow: implication for the endangered belugas in eastern Hudson Bay (Canada).
Conservation Genetics 13: 419-433.
Weider, L.J. and Hobæk, A. 2000. Phylogeography and Arctic biodiversity: a review. Annales
Zoologici Fennici 34: 217-231.
Related Documents