1670 AJCS 7(11):1670-1681 (2013) ISSN:1835-2707 Genetic diversity of water use efficiency in Jerusalem artichoke (Helianthus tuberosus L.) germplasm Anon Janket 1 , Sanun Jogloy 1 *, Nimitr Vorasoot 1 , Thawan. Kesmala 1 , C. Corley Holbrook 2 and Aran Patanothai 1 1 Department of Plant Science and Agricultural Resources, Faculty of Agriculture, Khon Kaen University, Khon Kaen 40002, Thailand 2 USDA-ARS, Crop Genetics and Breeding Research Unit, Coastal Plain Experimental Station, Tifton, GA 31793, USA *Corresponding author: [email protected] Abstract Genetic diversity in crop germplasm is an important resource for crop improvement, but information on genetic diversity is rare for Jerusalem artichoke, especially for traits related to water use efficiency. The objectives of this study were to investigate genetic variations for water use and water use efficiency in Jerusalem artichoke accessions and to identify superior genotypes for these characters under different water regimes. Forty Jerusalem artichoke accessions were arranged in a strip plot design with four replications for two years. Three strip plots represented three water regimes (W1 = 100%, W2 = 75% and W3 = 45% of crop water requirement). Data were recorded for tuber dry weight, biomass, relative water content, water use and water use efficiency. The effects of water regimes and Jerusalem artichoke accessions were significant for all characters. Genotypes contributed the largest portions for water use efficiency for biomass and tubers. These results documented genetic diversity for water use efficiency in Jerusalem artichoke. The genotypes with high water use efficiency for biomass were HEL 231, HEL 65 and JA102×JA89(8). HEL 65 had high water use efficiency for tubers. These genotypes should be useful in future breeding programs for higher water use efficiency. Keywords: Diversity, Drought resistance, Sun-choke, Transpiration efficiency, Water stress. Abbreviations: WU- Water use; WUEb- Water use efficiency for biomass; WUEt- Water use efficiency for tuber. Introduction Jerusalem artichoke (Helianthus tuberosus L.) is an underutilized crop that originated in the temperate regions of North America. It has been known as “potato for the poor” and was consumed as vegetable by native Americans and the early settlers (Cosgrove et al., 1991). Jerusalem artichoke stores inulin in stems and tubers, which can be used as raw material for supplementing various value-added and health food products (Kay and Nottingham, 2008; Roberfroid, 2000). More recently, interest in Jerusalem artichoke research has increased substantially as indicated by the number of research articles in the freely-accessed sources. This is because it can be grown in a wide range of environments (Pimsean et al., 2010), while other inulin producing crops such as root chicory (Chicorium intybus var. sativum) and globe artichoke (Cynara cardunculus var. scolymus) have a rather limited production range in the temperate regions or high altitude areas (Burke, 2005; Robert et al., 2007). Jerusalem artichoke has been grown in many parts of the world and production conditions range from rainfed to fully irrigated and the crop can be grown in all seasons in a wide range of climates, although the productivity varies greatly across regions (Baldini et al., 2006; Rodrigues et al., 2007). Drought is a recurring problem for crops including Jerusalem artichoke grown in most growing conditions. When only 50% of the water requirement was available, tuber yield of Jerusalem artichoke was reduced by 20% (Conde et al., 1991) and 22.8% (Losavio et al., 1997). Among inulin containing and sugar containing crops, Jerusalem artichoke is more susceptible to water stress than sugar beet and root chicory (Schittenhelm, 1999). The previous studies indicated that the crop requires adequate soil moisture for optimum yield. The questions arising from the previous studies are “1) what is the optimal amount of water to be applied to Jerusalem artichoke with supplemental irrigation or full irrigation under rainfed conditions, and 2) is there variation in water use efficiency among Jerusalem artichoke accessions under different water gradients?” These questions are important for water management of the crop and further improvement of water use efficiency by the crop. Jerusalem artichoke varieties with high water use efficiency should be more productive under water limited conditions. The trait can be used as a selection criterion for drought resistance (Teare et al., 1982). The use of water use efficiency, which is relatively simple to assess, as an indicator trait for the more complex and difficult to access trait of drought resistance would be effective and efficient. Variation in water use efficiency among genotypes has been reported in other crops such as peanut (Arachis hypogaea L.) (Jongrungklang et al., 2008; Puangbut et al., 2009), Isabgol (Plantago ovata) and French phyllium (Plantago psyllium) (Rahimi et al., 2011) and Cotton (Gossypium herbaceum L.) (Tennakoon and Milroy, 2002). Previous investigations on water use and water use efficiency

Welcome message from author
This document is posted to help you gain knowledge. Please leave a comment to let me know what you think about it! Share it to your friends and learn new things together.
Transcript
1670
AJCS 7(11):1670-1681 (2013) ISSN:1835-2707
Genetic diversity of water use efficiency in Jerusalem artichoke (Helianthus tuberosus L.)
germplasm
Anon Janket
1, Sanun Jogloy
1*, Nimitr Vorasoot
1, Thawan. Kesmala
1, C. Corley Holbrook
2 and
Aran Patanothai1
1Department of Plant Science and Agricultural Resources, Faculty of Agriculture, Khon Kaen University, Khon
Kaen 40002, Thailand 2USDA-ARS, Crop Genetics and Breeding Research Unit, Coastal Plain Experimental Station, Tifton, GA 31793,
USA
*Corresponding author: [email protected]
Abstract
Genetic diversity in crop germplasm is an important resource for crop improvement, but information on genetic diversity is rare for
Jerusalem artichoke, especially for traits related to water use efficiency. The objectives of this study were to investigate genetic
variations for water use and water use efficiency in Jerusalem artichoke accessions and to identify superior genotypes for these
characters under different water regimes. Forty Jerusalem artichoke accessions were arranged in a strip plot design with four
replications for two years. Three strip plots represented three water regimes (W1 = 100%, W2 = 75% and W3 = 45% of crop water
requirement). Data were recorded for tuber dry weight, biomass, relative water content, water use and water use efficiency. The
effects of water regimes and Jerusalem artichoke accessions were significant for all characters. Genotypes contributed the largest
portions for water use efficiency for biomass and tubers. These results documented genetic diversity for water use efficiency in
Jerusalem artichoke. The genotypes with high water use efficiency for biomass were HEL 231, HEL 65 and JA102×JA89(8). HEL
65 had high water use efficiency for tubers. These genotypes should be useful in future breeding programs for higher water use
efficiency.
Keywords: Diversity, Drought resistance, Sun-choke, Transpiration efficiency, Water stress.
Abbreviations: WU- Water use; WUEb- Water use efficiency for biomass; WUEt- Water use efficiency for tuber.
Introduction
Jerusalem artichoke (Helianthus tuberosus L.) is an
underutilized crop that originated in the temperate regions of
North America. It has been known as “potato for the poor”
and was consumed as vegetable by native Americans and the
early settlers (Cosgrove et al., 1991). Jerusalem artichoke
stores inulin in stems and tubers, which can be used as raw
material for supplementing various value-added and health
food products (Kay and Nottingham, 2008; Roberfroid,
2000). More recently, interest in Jerusalem artichoke research
has increased substantially as indicated by the number of
research articles in the freely-accessed sources. This is
because it can be grown in a wide range of environments
(Pimsean et al., 2010), while other inulin producing crops
such as root chicory (Chicorium intybus var. sativum) and
globe artichoke (Cynara cardunculus var. scolymus) have a
rather limited production range in the temperate regions or
high altitude areas (Burke, 2005; Robert et al., 2007).
Jerusalem artichoke has been grown in many parts of the
world and production conditions range from rainfed to fully
irrigated and the crop can be grown in all seasons in a wide
range of climates, although the productivity varies greatly
across regions (Baldini et al., 2006; Rodrigues et al., 2007).
Drought is a recurring problem for crops including Jerusalem
artichoke grown in most growing conditions. When only 50%
of the water requirement was available, tuber yield of
Jerusalem artichoke was reduced by 20% (Conde et al., 1991)
and 22.8% (Losavio et al., 1997). Among inulin containing
and sugar containing crops, Jerusalem artichoke is more
susceptible to water stress than sugar beet and root chicory
(Schittenhelm, 1999). The previous studies indicated that the
crop requires adequate soil moisture for optimum yield. The
questions arising from the previous studies are “1) what is the
optimal amount of water to be applied to Jerusalem artichoke
with supplemental irrigation or full irrigation under rainfed
conditions, and 2) is there variation in water use efficiency
among Jerusalem artichoke accessions under different water
gradients?” These questions are important for water
management of the crop and further improvement of water
use efficiency by the crop. Jerusalem artichoke varieties with
high water use efficiency should be more productive under
water limited conditions. The trait can be used as a selection
criterion for drought resistance (Teare et al., 1982). The use
of water use efficiency, which is relatively simple to assess,
as an indicator trait for the more complex and difficult to
access trait of drought resistance would be effective and
efficient. Variation in water use efficiency among genotypes
has been reported in other crops such as peanut (Arachis
hypogaea L.) (Jongrungklang et al., 2008; Puangbut et al.,
2009), Isabgol (Plantago ovata) and French phyllium
(Plantago psyllium) (Rahimi et al., 2011) and Cotton
(Gossypium herbaceum L.) (Tennakoon and Milroy, 2002).
Previous investigations on water use and water use efficiency

1671
Table 1. Mean squares for water use (WU), water use efficiency for biomass (WUEb) and water use efficiency of tubers (WUEt)
of 40 Jerusalem artichoke genotypes grown under three water regimes (W1,W2 and W3) in the dry seasons 2010/11 and 2011/12.
Source of variation DF Mean square
WU WUEb WUEt
Year (Y) 1 33ns (0.0) 2.36056** (20.0) 0.63644** (10.4)
Reps within Year 6 19648 (5.8) 0.02775 (1.4) 0.02216 (2.2)
Water regimes (W) 2 894720** (88.4) 0.06598** (1.1) 0.04403** (1.4)
Y×W 2 2683ns (0.3) 0.00148ns (0.0) 0.00468ns (0.2)
Error (a) 12 2914 (1.7) 0.00419 (0.4) 0.00157 ( 0.3)
Genotypes (G) 39 792** (1.5) 0.14837** (49.0) 0.06839** (43.7)
Y ×G 39 152** (1.5) 0.03142** (10.4) 0.02557** (16.4)
Error (b) 234 73 (0.8) 0.00191 (3.8) 0.00145 (5.6)
W×G 78 59** (0.2) 0.00633** (4.2) 0.00533** (6.8)
Y×W ×G 78 39ns (0.2) 0.00616** (4.1) 0.00449** (5.7)
Error (c) 468 32 (0.7) 0.00140 (5.6) 0.00095 (7.3)
CV (%) (a) 36.36 21.51 17.63
CV (%) (b) 5.77 14.52 16.95
CV (%) (c) 3.83 12.44 13.71 ns, *, ** = non-significant and significant at P < 0.05 and P < 0.01 probability levels, respectively.
Values in parenthesis are percentages of sum squares. W1= 100%ET, W2= 75%ET and W3=45%ET.
Fig 1. Maximum air temperatures (T-max), minimum air temperatures (T-min) (OC), rainfall (mm), pan evaporation (mm) and
relative humidity(RH) (%) during the crop growth period of Jerusalem artichoke in the dry season 2010/11 (a),(b) and the dry
season 2011/12 (c),(d)
conducted so far have been limited to 6 Jerusalem artichoke
genotypes (Yang et al., 2010). Studies on a wide range of
diverse genotypes are required to fully exploit genetic
variations in these characters. The objectives of this study
were to compare water use efficiency among Jerusalem
artichoke genotypes under different water gradient conditions
and to identify Jerusalem artichoke genotypes with high
water use efficiency. The information obtained in this study
will be useful for irrigation management of Jerusalem
artichoke and breeding of Jerusalem artichoke for high water
use efficiency.
Results
Meteorological conditions, soil moisture status and
variation of plant water status
Average daily maximum (T-max) and minimum temperature
(T-min) were slightly different between years. Means of T-
max in the first year and the second year were 30.3 oC and
30.5 oC, respectively. Means of T-min in the first year and the
second year were 18.4 oC and 19.5 oC, respectively. Daily pan
evaporations ranged from 2.0 to 7.7 mm in the first year and
2.2 to 9.8 mm in the second year.
0
10
20
30
40
1 15 29 43 57 71 85
Air
tem
per
atu
re (
oC
)
Days after transplanting
Tmax Tmin
0
10
20
30
40
1 15 29 43 57 71 85
Air
tem
per
atu
re (
oC
)
Days after transplanting
Tmax Tmin
0
10
20
30
40
50
60
70
80
90
0
20
40
60
80
100
120
1 15 29 43 57 71 85
Rai
n a
nd
pan
evap
ora
tion
(m
m)
Rel
ativ
e h
um
idit
y (
%)
Days after transplanting
Rain (mm)
Relative humidity (%)
Pan evaporation (mm)
0
10
20
30
40
50
60
70
80
90
0
20
40
60
80
100
120
1 15 29 43 57 71 85
Rai
n a
nd
pan
evap
ora
tion
(m
m)
Rel
ativ
e h
um
idit
y (
%)
Days after transplanting
Rain (mm)Relative humidity (%)Pan evaporation (mm)
(a)
(b)
(c)
(d)
1672
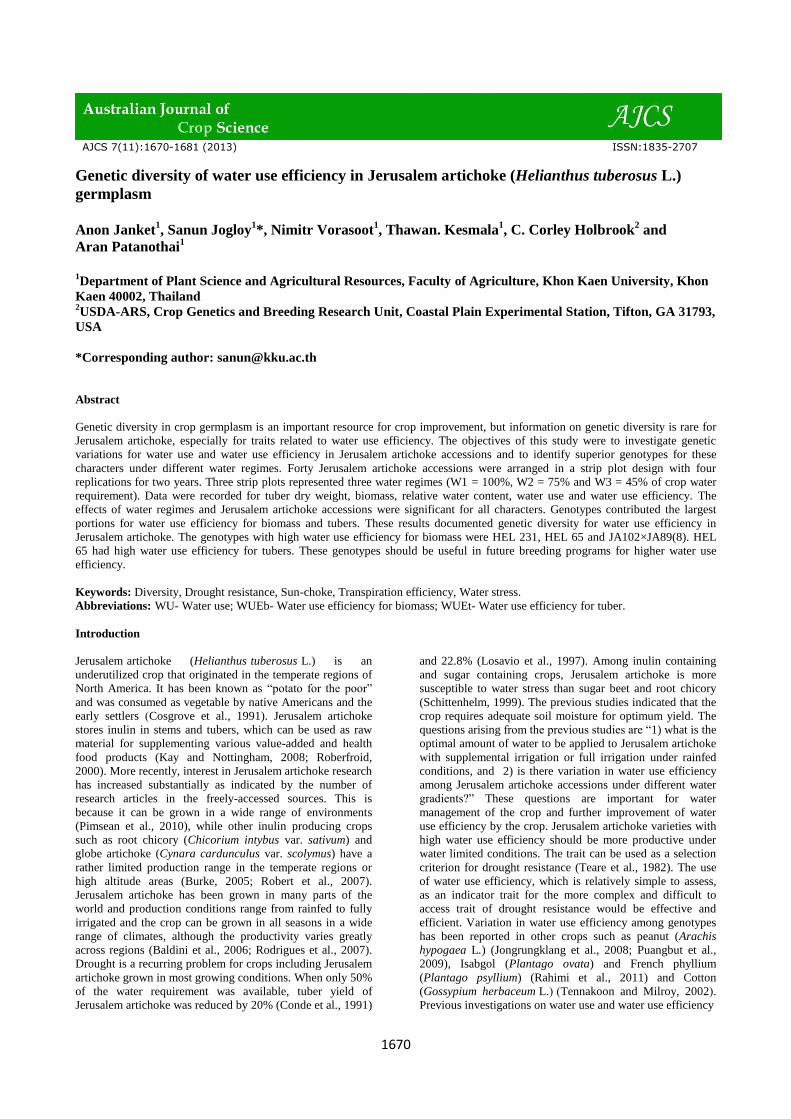
Table 2. Ten selected genotypes with the highest water use (WU), water use efficiency for biomass (WUEb) and water use efficiency for tubers (WUEt) and 10 selected genotypes with the
lowest performance for these traits and drought tolerance index (DTI) selected from 40 Jerusalem artichoke genotypes in the dry seasons 2010/11.
Group No.
Water use (WU)
(mm) DTI
Water use efficiency for biomass (WUEb)
(kg mm-1 ha-1)
DTIa Water use efficiency for tubers (WUEt)
(kg mm-1 ha-1)
DTI
Genotypes W1
W2
W3
W2 W3 Genotypes W1
W2
W3
W2 W3 Genotypes W1
W2
W3
W2 W3
High 1 HEL 62 217.5 a 161.8 a 93.3 b 0.74 0.43 HEL 53 32.7 a 36.6 a 31.4 a 1.12 0.96 HEL 53 24.8 a 27.2 a 32.0 a 1.10 1.29
2 HEL 246 211.2 ab 157.7 ab 114.7 a 0.75 0.54 HEL 253 32.0 a 28.5 b 31.9 a 0.89 1.00 HEL 335 24.3 a 18.9 ab 13.2 g-k 0.78 0.54
3 KKUAc001 210.3 abc 158.3 ab 93.1 b 0.75 0.44 HEL 335 30.7 ab 20.4 e-h 19.2 e-i 0.66 0.62 HEL 65 22.5 ab 15.9 c-f 22.8 c 0.70 1.01
4 HEL 256 209.6 a-d 158.7 ab 93.3 b 0.76 0.44 HEL 256 30.7 ab 24.0 cde 26.9 a-d 0.78 0.88 HEL 256 22.1 abc 12.9 e-i 14.5 e-j 0.58 0.66
5 JA 125 209.3 a-d 155.8 a-e 92.4 b 0.74 0.44 HEL 61 28.7 bc 22.1 bc 22.8 c-f 0.77 0.79 HEL 61 22.1 abc 15.7 c-f 17.9 def 0.71 0.81
6 HEL 257 209.0 a-d 155.4 a-f 92.6 b 0.74 0.44 HEL 65 28.3 bc 21.1 efg 28.5 ab 0.75 1.01 HEL 253 22.0 abc 16.1 cde 20.1 cd 0.73 0.91
7 JA 77 208.9 a-d 158.0 ab 92.3 b 0.76 0.44 JA102XJA89(8) 28.0 bc 21.5 ef 28.4 ab 0.77 1.01 JA 89 21.4 a-d 20.9 b 26.7 b 0.98 1.25
8 JA 67 208.9 a-d 157.1 abc 92.3 b 0.75 0.44 JA 89 25.7 cd 27.5 bc 27.7 ab 1.07 1.08 JA102XJA89(8) 20.4 a-e 16.1 cde 17.9 def 0.79 0.88
9 HEL 53 208.7 a-d 157.8 ab 93.1 b 0.76 0.45 HEL 231 25.7 cd 26.1 bcd 24.3 b-e 1.02 0.95 HEL 231 19.7 a-f 16.0 c-f 19.5 cd 0.81 0.99
10 HEL 335 208.1 a-d 158.1 ab 93.4 b 0.76 0.45 KKUAc001 24.0 d 22.7 de 27.2 abc 0.95 1.33 KKUAc001 17.3 a-g 20.5 b 19.7 cd 1.19 1.14
Low 1 HEL 253 194.7 b-f 157.9 ab 93.4 b 0.81 0.48 JA 125 10.2 m-p 13.7 j-o 13.3 jp 1.35 1.31 JA 36 8.4 g-j 5.1 pq 7.1 n 0.60 0.85
2 JA 21 194.5 b-f 146.6 i-m 86.8 b 0.75 0.45 JA 36 9.9 n-q 9.2 p-s 8.5 p 0.93 0.86 HEL 62 8.3 a-j 8.4 k-p 8.4 lmn 1.01 1.01
3 HEL 65 194.5 b-f 156.5 a-d 91.1 b 0.80 0.47 JA 60 9.4 n-r 10.7 n-r 10.1 nop 1.14 1.07 JA 125 8.3 g-j 10.1 g-n 11.3 j-n 1.22 1.36
4 HEL 324 193.7 b-f 145.6 j-m 86.5 b 0.75 0.45 JA 109 9.3 n-r 13.7 j-o 20.3 e-h 1.47 2.17 JA 60 7.8 g-j 9.1 i-o 10.7 j-n 1.17 1.37
5 JA 3 193.3 b-f 144.7 klm 86.4 b 0.75 0.45 JA 46 8.8 n-r 10.9 m-r 12.2 k-p 1.23 1.39 JA 109 6.8 g-j 9.6 h-o 17.2 d-h 1.41 2.53
6 JA 76 192.5 c-f 156.6 a-d 93.1 b 0.81 0.48 JA 97 8.6 o-r 8.7 qrs 15.5 h-n 1.01 1.80 JA 61 6.5 a-j 6.1 opq 9.5 k-n 0.93 1.45
7 JA 36 191.7 c-f 143.4 lm 85.5 b 0.75 0.45 JA 77 7.5 pqr 8.5 qrs 8.5 p 1.13 1.12 JA 77 6.3 hij 7.1 l-q 7.1 ln 1.12 1.12
8 JA 6 191.5 def 146.6 i-m 86.6 b 0.77 0.45 JA 1 6.9 qr 5.6 s 9.1 p 0.82 1.33 JA 97 6.0 ij 6.8 m-q 11.5 j-n 1.13 1.92
9 JA 16 188.9 ef 141.8 m 84.7 b 0.75 0.45 JA 70 6.8 qr 7.9 rs 10.3 m-p 1.16 1.52 JA 1 5.8 ij 4.7 q 7.9 mn 0.82 1.36
10 JA 15 181.8 f 148.6 e-m 85.2 b 0.82 0.47 JA 61 6.3 r 7.1 rs 9.4 op 1.12 1.48 JA 70 5.5 j 6.6 n-q 8.4 lmn 1.19 1.52
Mean
201.8 A 152.5 B 90.5 C 0.76 0.45
16.9 AB 15.7 B 17.7 A 0.97 1.21
13.45 A 12.15 B 14.27 A 0.94 1.14
Min
181.8
141.8
84.7
0.73 0.43
6.3
5.6
8.5
0.66 0.62
5.5
4.7
7.1
0.58 0.54
Max
217.5
161.8
114.7
0.82 0.54
32.7
36.6
31.9
1.47 2.17
24.8
27.2
32.0
1.41 2.52 Maximum, minimum and mean values were calculated from 40 genotypes, For comparison among Jerusalem artichoke genotypes and for comparison among water regimes, Means in the same column followed by the
same letter(s) are not significantly different at P < 0.05 probability levels by Duncan's multiple range test (DMRT). aDTI = Drought tolerance index was calculated by the ratio of stressed conditions / non stressed conditions.
W1= 100%ET, W2= 75%ET and W3=45%ET
1673
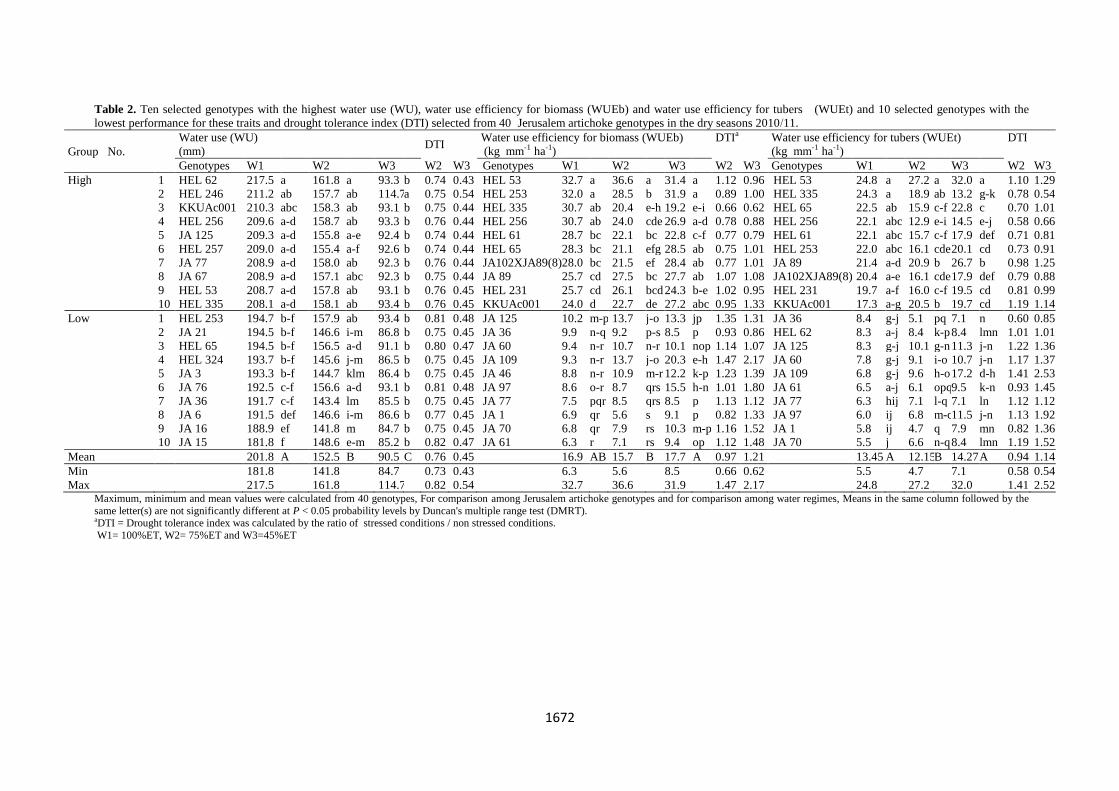
Fig 2. Soil moisture volume fractions for three soil water regimes (W1= 100%ET, W2= 75%ET and W3= 45%ET) of three soil
depths at 30 cm (a), 60 cm (b) and 90 cm (c) in the dry seasons 2010/11 and the dry season 2011/12 (d-f).
Daily maximum relative humidity ranged from 69 to 98 % in
the first year and 71 to 99% in the second year (Fig. 1a,c).
There was no rainfall during the experimental period in
2010/11 but rainfall of 174.6 mm was recorded in 2011/12 at
1–6 days after transplanting (DAT) (Fig. 1b,d). The rainfall
did not cause significant difference among water treatments
because it occurred during pre-treatment period, when all
treatments received the same amount of water. Soil moisture
contents of different water regimes (W1–W3) were clearly
different at the soil depth of 30 cm, starting from 21 DAT
when water was supplied to the crop by line- source sprinkler
irrigation system for a week (Fig. 2 a,d). Soil moisture content
for W1 was slightly lower than field capacity but higher than
W2 because deep water loss was ignored and the soil is well-
drained. The differences in soil moisture content among water
regimes were significant, but differences in soil moisture
content were reduced with the depth of the soil profile (Fig 2
b,e). There was no difference in soil moisture at 90 cm depth
(Fig. 2 c,f). Relative water contents (RWC) at 40, 60 and 70
DAT for W1 were higher than those for W2, and relative
water contents for W2 were higher than those for W3 in both
years, indicating that the control of water supply for all water
regimes was reasonably good (Fig 3).
Combined analysis of variance
Combined analysis of variance showed significant
differences between water regimes (W) and Jerusalem
artichoke genotypes (G) for WU, WUEb and WUEt (Table
1). The difference in years (Y) was significant for most
characters (P<0.01) except for WU, and the differences
among genotypes for WU were significant but accounted for
only 1.5% of total variation. Year × water interactions were
not significant for all characters, whereas the interactions
0.050
0.100
0.150
0.200
0.250
7 14 21 28 35 42 49 56 63 70 77 84
Soil
mois
ture
volu
me
frac
tion
Days after transplanting
W1 W2 W3
0.050
0.100
0.150
0.200
0.250
7 14 21 28 35 42 49 56 63 70 77
Soil
mois
ture
volu
me
frac
tion
Days after transplanting
W1 W2 W3
0.050
0.100
0.150
0.200
0.250
7 14 21 28 35 42 49 56 63 70 77 84
Soil
mois
ture
volu
me
frac
tion
Days after transplanting
W1 W2 W3
0.050
0.100
0.150
0.200
0.250
7 14 21 28 35 42 49 56 63 70 77
Soil
mois
ture
volu
me
frac
tion
Days after transpanting
W1 W2 W3
0.050
0.100
0.150
0.200
0.250
7 14 21 28 35 42 49 56 63 70 77 84
Soil
mois
ture
volu
me
frac
tion
Days after transplanting
W1 W2 W3
0.050
0.100
0.150
0.200
0.250
7 14 21 28 35 42 49 56 63 70 77
Soil
mois
ture
volu
me
frac
tion
Days after transplanting
W1 W2 W3
(d)
(c)
(a)
(f)
(b)
(d)
(e)

1674
between water and genotypes were significant for all
characters. Y × G interactions for WUEb (10.4% of SS) and
WUEt (16.4% of SS) were much larger than that for WU
(1.5% of SS), the variations among genotypes for these traits
were also higher (49.0% of SS for WUEb and 43.7% of SS
for WUEt). Year × water × genotype interactions were
significant for WUEb and WUEt (P≤0.01) but not for WU.
Water regimes accounted for small percentages of variations
in WUEb and WUEt (1.1–1.4%). The contribution of
genotype × water regime interaction was higher than that of
water regimes but it was still lower than the contribution of
genotypic differences to WUEb and WUEt.
Water use and water use efficiency
As the interactions between genotype and year were
significant for WU, data were analyzed by year (Tables 2 and
3). WU in both years depended largely on water regimes, in
which the highest WU was observed for W1 and the lowest
WU was recorded for W3. Genotypic variations for WU were
low for all water regimes in both years, and the variations
were lowest for W3. Drought tolerance indices for WU were
higher for W2 in both years, indicating that under water stress
less water used by plants. The identification of superior
genotypes for WU was difficult because of low variation for
this trait and high Y × G interaction. As the interactions for
WUEb and WUEt between genotype and year, genotype and
water regime and secondary level of interaction were high but
much lower than that for genotype main effect, the data for
two years were analyzed separately (Tables 2 and 3). The
variations in these traits were due largely to variations in
genotypes. Water regime contributed less to total variations
compared to genotype main effect, but the differences in
water regimes did not show consistent patterns between
years. Drought tolerance indices across years for WUEb and
WUEt for W3 in general were consistently higher than those
for W2. The data indicated that W3 could somewhat increase
water use efficiency. The genotypes with high or low WUEb
and WUEt could then be identified. HEL 53, JA 89,
KKUAc001, JA102×JA89(8), HEL 253, HEL 231, HEL 65
and HEL 61 had consistently high WUEb and WUEt across
water regimes in 2010/11. HEL 335 had consistently high
WUEb and WUEt under W1 and W2, whereas HEL 256 had
high WUEb across water regimes but WUEt exhibited high
water use efficiency under W1 only. JA 61, JA 70, JA 1, JA
77, JA 97, JA 46, JA 109, JA 60, JA 36 and JA 125 had low
WUEb under W1 in 2010/11, whereas JA 61, JA 70, JA 1, JA
77, JA 60 and JA 36 had consistently low WUEb across
water regimes. The genotypes with low WUEb also had low
WUEt except for HEL 62 showing low WUEt only and JA 46
showing low WUEb only. JA 70, JA 1, JA 77, JA 61 and JA
36 showed consistently low WUEb and WUEt across water
regimes. In the experiment in 2011/12, HEL 256, JA 89, JA
6, HEL 231, HEL 65, CN 52867, KKUAc001, HEL 324,
JA102×JA89(8) and JA 16 had high WUEb under W1, and,
among these genotypes, JA 6, HEL 231, HEL 65 and
JA102×JA89(8) had high water use efficiency across water
regimes. HEL 256, JA 89, JA 6, HEL 65, HEL 257, CN
52867 , JA 122, JA 16, HEL 324 and JA102×JA89(8) had
high WUEt under W1. Among these accessions, there were 3
genotypes (JA 6, HEL 65 and CN 52867) with high water use
efficiency across water regimes. The genotypes with low
WUEb under W1 were JA 1, JA 70, JA 36, JA 109, HEL 62,
JA 60, JA 46, JA 61, JA 125, JA 92, and the genotypes
showing consistently WUEb across water regimes were JA 1,
JA 92, JA 70, JA 36, JA 109, JA 60, JA 46 and HEL62. Most
genotypes showing low WUEb also had low WUEt.
However, JA 125 and JA 61 had low WUEb but their WUEt
was relatively high under W1. In contrast, JA 67 and JA 77
had low WUEt but WUEb was relatively high. JA 70, JA
109, HEL 62 and JA 36 showed consistently low WUEt
across water regimes. JA 89, KKUAc001, JA102×JA89(8),
HEL 231 and HEL 65 had high WUEb across years under
W1, whereas JA 89, JA102 × JA89(8) and HEL 65 had high
WUEt. Three genotypes (HEL 231, HEL 65 and
JA102×JA89(8)) had consistently high WUEb across water
regimes and years, and HEL 65 had high WUEt across water
regimes and years. There were 6 genotypes (JA61, JA 70, JA
1, JA 109, JA 60 and JA 36) showing consistently low WUEb
across years under W1 and 7 genotypes (JA 70, JA 1, JA 109,
HEL 62, JA 36, JA 60 and JA 77) showing consistently low
WUEt under W1. However, there were only four genotypes
(JA 70, JA 1, JA 60 and JA 36) with consistently low WUEb
across water regimes and years and three genotypes (JA 70,
HEL 62 and JA 36) with consistently low WUEt across water
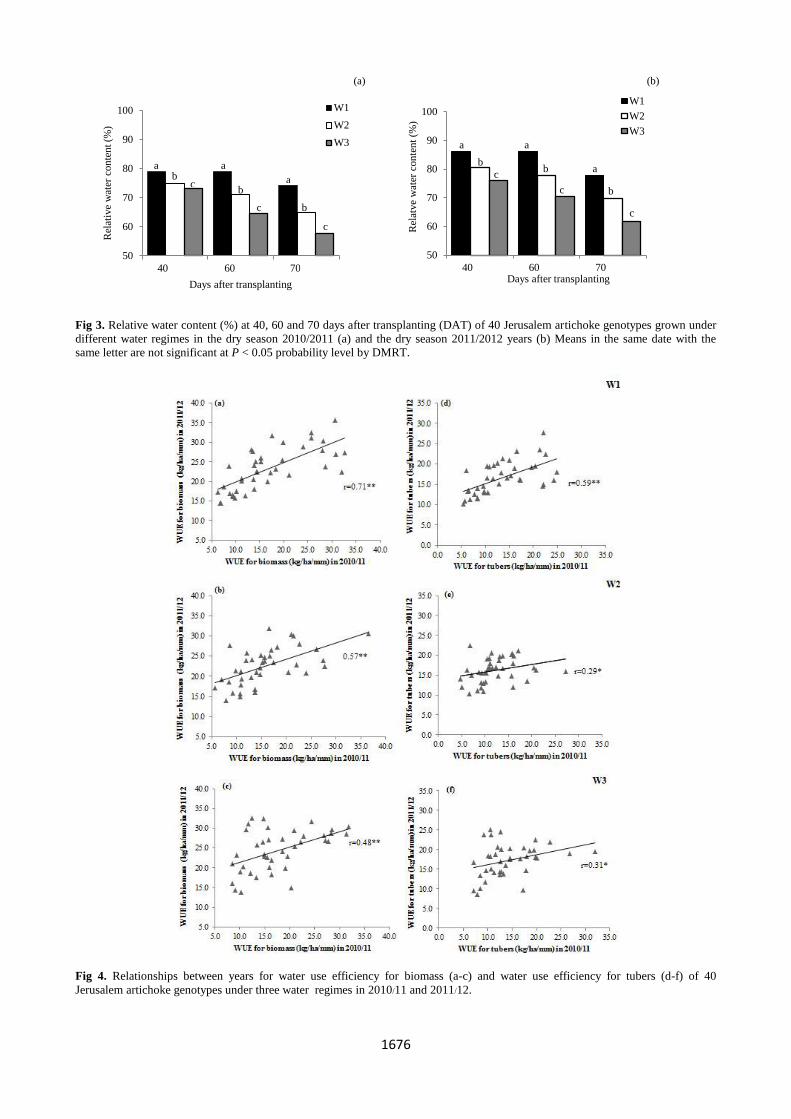
regimes and years. Correlation coefficients between the data
of two years (2010/11 and 2011/12) for water use efficiency
for biomass WUEb and water use efficiency for tuber yield
(WUEt) were calculated for three water regimes (Fig. 4).
Correlation coefficients for (WUEb) were positive and
significant for all water regimes, being 0.71**, 0.57** and
0.48** for W1, W2 and W3, respectively (Fig. 4 a,b,c).
Correlation coefficients for WUEt were lower but positive
and significant, being 0.59**, 0.29* and 0.31* for W1, W2
and W3, respectively (Fig. 4 d,e,f). Correlation coefficients
between years for WUEb and WUEt were lower in the
drought treatments of W2 and W3 (Fig. 4 b,c and e,f), and
correlation coefficients for WUEb were higher than for
WUEt for all water regimes. Drought at moderate level (W2)
caused 7.1 and 9.6% reductions in WUEb and WUEt,
respectively, but drought at severe level (W3) caused slight
increases in WUEb (4.2%) and WUEt (5.4%). The reductions
in 2010/11 were higher than in 2011/12 (data not shown). In
2010/11, the DTI ranged in all drought conditions from 0.54
to 2.52 (Table 2). The genotypes showing high DTI for
WUEb and WUEt were JA 109, JA 97, HEL 324, JA 70 and
JA 61 in W3 ranged from 1.44 to 2.52. In the experiment in
2011/12, the DTI ranged in all drought conditions from 0.54
to 1.73 (Table 3). The genotypes with high DTI for WUEb
were JA 3, JA 15, HEL 253, JA 38 and JA 61 in W3 ranged
from 1.33 to 1.57 and DTI for WUEt the genotypes with high
DTI were JA 3, JA 67, JA 38, JA 132 and JA 92 ranged from
1.30 – 1.73.
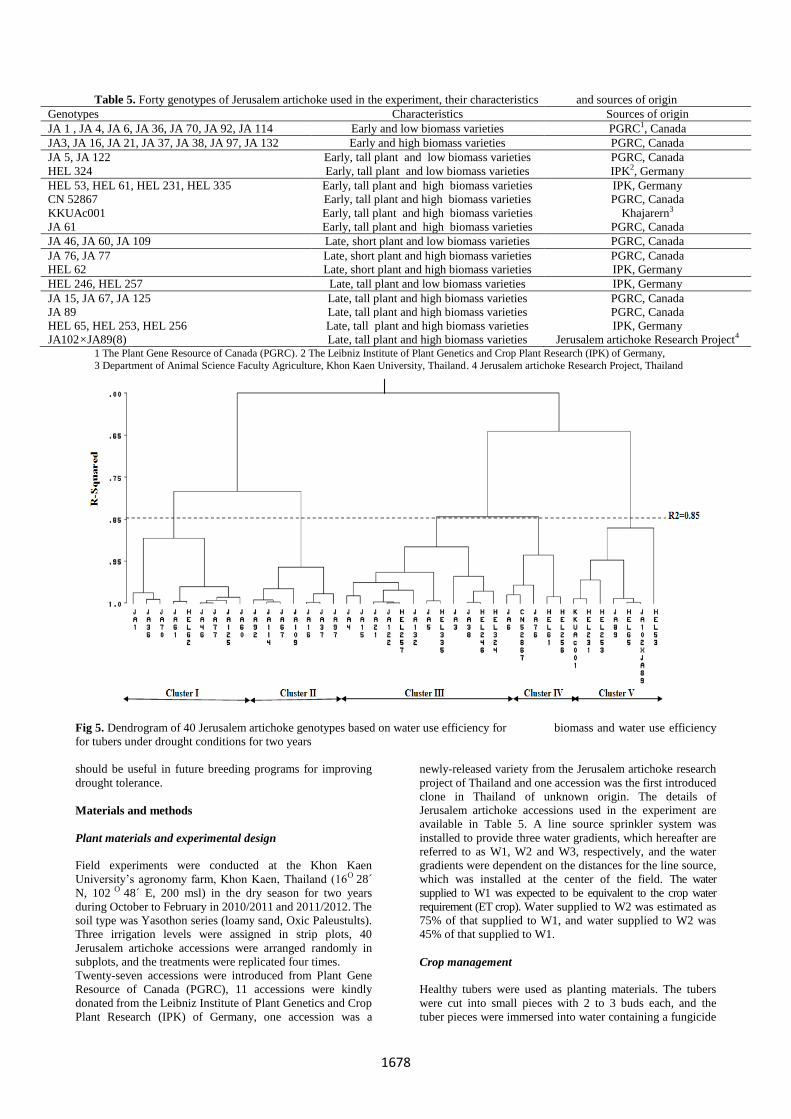
Cluster analysis
Based on combined data for WUEb and WUEt of two
drought levels for two years, a dendrogram could divide 40
Jerusalem artichoke genotypes into five clusters (R-square =
0.85) (Fig. 5). Nine Jerusalem artichoke genotypes formed
cluster 1, which was characterized by low water use
efficiency under drought conditions. Cluster 2 comprised 7
genotypes, which was characterized by relatively low water
use efficiency under drought conditions. Cluster 3 included
12 genotypes, which was characterized by intermediate to
relatively high water use efficiency under drought conditions,
but a few genotypes had relatively low water use efficiency.
Cluster 4 had 5 genotypes, which are characterized by
relatively high water use efficiency under drought conditions.
Cluster 5 had 7 genotypes, which was characterized by high
water use efficiency under drought conditions.
1675
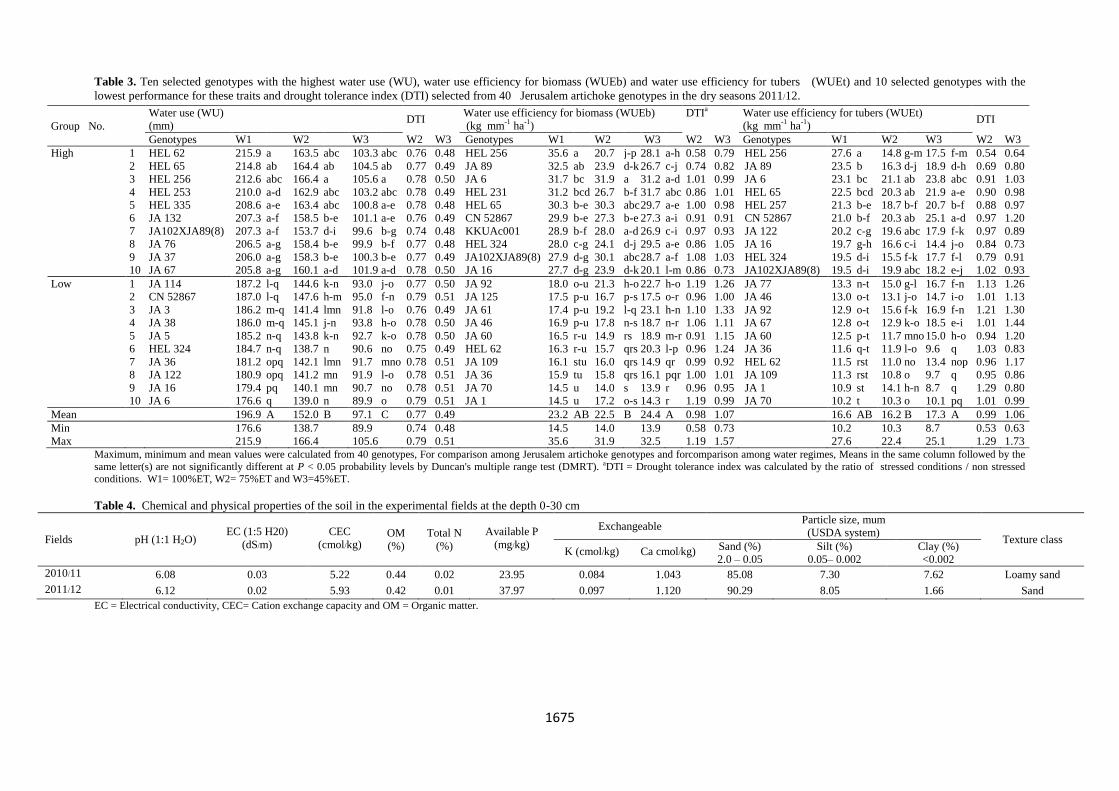
Table 3. Ten selected genotypes with the highest water use (WU), water use efficiency for biomass (WUEb) and water use efficiency for tubers (WUEt) and 10 selected genotypes with the
lowest performance for these traits and drought tolerance index (DTI) selected from 40 Jerusalem artichoke genotypes in the dry seasons 2011/12.
Group No.
Water use (WU)
(mm) DTI
Water use efficiency for biomass (WUEb)
(kg mm-1
ha-1
)
DTIa Water use efficiency for tubers (WUEt)
(kg mm-1
ha-1
) DTI
Genotypes W1
W2
W3
W2 W3 Genotypes W1
W2
W3
W2 W3 Genotypes W1
W2
W3
W2 W3
High 1 HEL 62 215.9 a 163.5 abc 103.3 abc 0.76 0.48 HEL 256 35.6 a 20.7 j-p 28.1 a-h 0.58 0.79 HEL 256 27.6 a 14.8 g-m 17.5 f-m 0.54 0.64
2 HEL 65 214.8 ab 164.4 ab 104.5 ab 0.77 0.49 JA 89 32.5 ab 23.9 d-k 26.7 c-j 0.74 0.82 JA 89 23.5 b 16.3 d-j 18.9 d-h 0.69 0.80
3 HEL 256 212.6 abc 166.4 a 105.6 a 0.78 0.50 JA 6 31.7 bc 31.9 a 31.2 a-d 1.01 0.99 JA 6 23.1 bc 21.1 ab 23.8 abc 0.91 1.03
4 HEL 253 210.0 a-d 162.9 abc 103.2 abc 0.78 0.49 HEL 231 31.2 bcd 26.7 b-f 31.7 abc 0.86 1.01 HEL 65 22.5 bcd 20.3 ab 21.9 a-e 0.90 0.98
5 HEL 335 208.6 a-e 163.4 abc 100.8 a-e 0.78 0.48 HEL 65 30.3 b-e 30.3 abc 29.7 a-e 1.00 0.98 HEL 257 21.3 b-e 18.7 b-f 20.7 b-f 0.88 0.97
6 JA 132 207.3 a-f 158.5 b-e 101.1 a-e 0.76 0.49 CN 52867 29.9 b-e 27.3 b-e 27.3 a-i 0.91 0.91 CN 52867 21.0 b-f 20.3 ab 25.1 a-d 0.97 1.20
7 JA102XJA89(8) 207.3 a-f 153.7 d-i 99.6 b-g 0.74 0.48 KKUAc001 28.9 b-f 28.0 a-d 26.9 c-i 0.97 0.93 JA 122 20.2 c-g 19.6 abc 17.9 f-k 0.97 0.89
8 JA 76 206.5 a-g 158.4 b-e 99.9 b-f 0.77 0.48 HEL 324 28.0 c-g 24.1 d-j 29.5 a-e 0.86 1.05 JA 16 19.7 g-h 16.6 c-i 14.4 j-o 0.84 0.73
9 JA 37 206.0 a-g 158.3 b-e 100.3 b-e 0.77 0.49 JA102XJA89(8) 27.9 d-g 30.1 abc 28.7 a-f 1.08 1.03 HEL 324 19.5 d-i 15.5 f-k 17.7 f-l 0.79 0.91
10 JA 67 205.8 a-g 160.1 a-d 101.9 a-d 0.78 0.50 JA 16 27.7 d-g 23.9 d-k 20.1 l-m 0.86 0.73 JA102XJA89(8) 19.5 d-i 19.9 abc 18.2 e-j 1.02 0.93
Low 1 JA 114 187.2 l-q 144.6 k-n 93.0 j-o 0.77 0.50 JA 92 18.0 o-u 21.3 h-o 22.7 h-o 1.19 1.26 JA 77 13.3 n-t 15.0 g-l 16.7 f-n 1.13 1.26
2 CN 52867 187.0 l-q 147.6 h-m 95.0 f-n 0.79 0.51 JA 125 17.5 p-u 16.7 p-s 17.5 o-r 0.96 1.00 JA 46 13.0 o-t 13.1 j-o 14.7 i-o 1.01 1.13
3 JA 3 186.2 m-q 141.4 lmn 91.8 l-o 0.76 0.49 JA 61 17.4 p-u 19.2 l-q 23.1 h-n 1.10 1.33 JA 92 12.9 o-t 15.6 f-k 16.9 f-n 1.21 1.30
4 JA 38 186.0 m-q 145.1 j-n 93.8 h-o 0.78 0.50 JA 46 16.9 p-u 17.8 n-s 18.7 n-r 1.06 1.11 JA 67 12.8 o-t 12.9 k-o 18.5 e-i 1.01 1.44
5 JA 5 185.2 n-q 143.8 k-n 92.7 k-o 0.78 0.50 JA 60 16.5 r-u 14.9 rs 18.9 m-r 0.91 1.15 JA 60 12.5 p-t 11.7 mno 15.0 h-o 0.94 1.20
6 HEL 324 184.7 n-q 138.7 n 90.6 no 0.75 0.49 HEL 62 16.3 r-u 15.7 qrs 20.3 l-p 0.96 1.24 JA 36 11.6 q-t 11.9 l-o 9.6 q 1.03 0.83
7 JA 36 181.2 opq 142.1 lmn 91.7 mno 0.78 0.51 JA 109 16.1 stu 16.0 qrs 14.9 qr 0.99 0.92 HEL 62 11.5 rst 11.0 no 13.4 nop 0.96 1.17
8 JA 122 180.9 opq 141.2 mn 91.9 l-o 0.78 0.51 JA 36 15.9 tu 15.8 qrs 16.1 pqr 1.00 1.01 JA 109 11.3 rst 10.8 o 9.7 q 0.95 0.86
9 JA 16 179.4 pq 140.1 mn 90.7 no 0.78 0.51 JA 70 14.5 u 14.0 s 13.9 r 0.96 0.95 JA 1 10.9 st 14.1 h-n 8.7 q 1.29 0.80
10 JA 6 176.6 q 139.0 n 89.9 o 0.79 0.51 JA 1 14.5 u 17.2 o-s 14.3 r 1.19 0.99 JA 70 10.2 t 10.3 o 10.1 pq 1.01 0.99
Mean
196.9 A 152.0 B 97.1 C 0.77 0.49
23.2 AB 22.5 B 24.4 A 0.98 1.07
16.6 AB 16.2 B 17.3 A 0.99 1.06
Min
176.6
138.7
89.9
0.74 0.48
14.5
14.0
13.9
0.58 0.73
10.2
10.3
8.7
0.53 0.63
Max
215.9
166.4
105.6
0.79 0.51
35.6
31.9
32.5
1.19 1.57
27.6
22.4
25.1
1.29 1.73
Maximum, minimum and mean values were calculated from 40 genotypes, For comparison among Jerusalem artichoke genotypes and forcomparison among water regimes, Means in the same column followed by the
same letter(s) are not significantly different at P < 0.05 probability levels by Duncan's multiple range test (DMRT). aDTI = Drought tolerance index was calculated by the ratio of stressed conditions / non stressed
conditions. W1= 100%ET, W2= 75%ET and W3=45%ET.
Table 4. Chemical and physical properties of the soil in the experimental fields at the depth 0-30 cm
Fields pH (1:1 H2O) EC (1:5 H20)
(dS/m)
CEC
(cmol/kg) OM
(%)
Total N
(%)
Available P
(mg/kg)
Exchangeable Particle size, mum
(USDA system) Texture class
K (cmol/kg) Ca cmol/kg) Sand (%)
2.0 – 0.05
Silt (%)
0.05– 0.002
Clay (%)
<0.002
2010/11 6.08 0.03 5.22 0.44 0.02 23.95 0.084 1.043 85.08 7.30 7.62 Loamy sand
2011/12 6.12 0.02 5.93 0.42 0.01 37.97 0.097 1.120 90.29 8.05 1.66 Sand
EC = Electrical conductivity, CEC= Cation exchange capacity and OM = Organic matter.
1676
Fig 3. Relative water content (%) at 40, 60 and 70 days after transplanting (DAT) of 40 Jerusalem artichoke genotypes grown under
different water regimes in the dry season 2010/2011 (a) and the dry season 2011/2012 years (b) Means in the same date with the
same letter are not significant at P < 0.05 probability level by DMRT.
Fig 4. Relationships between years for water use efficiency for biomass (a-c) and water use efficiency for tubers (d-f) of 40
Jerusalem artichoke genotypes under three water regimes in 2010/11 and 2011/12.
50
60
70
80
90
100
40 DAT 60 DAT 70 DAT
Rel
atve
wat
er c
on
ten
t (%
)
Days after transplanting
W1
W2
W3
50
60
70
80
90
100
40 DAT 60DAT 70DAT
Rel
ativ
e w
ater
con
ten
t (%
)
Days after transplanting
W1
W2
W3
(a) (b)
a
b
c
a
b c
a
b
c
b
b
a
c
a
b
c
a
c
1677
Discussion
The soil chemical and physical properties were slightly
different among experimental years (Table 4). The soil in the
second experiment (2011/12) was higher in pH, available
phosphorus (P), exchangeable potassium and exchangeable
calcium (Ca) than in the first experiment (2010/11). The
chemical properties indicated that soil fertility was lower than
optimum conditions for production of Jerusalem artichoke.
EC values in both years were lower than 0.03 dS/m,
indicating that the soil was not saline (Geng-mao et al.,
2008), and P values were higher than 15 mg/kg which should
be sufficient for normal growth of Jerusalem artichoke
(Lebot, 2009). Potassium values were intermediate and
nitrogen values were low. As the nutrient values fell into the
same ranges and basal dose was also applied, the difference
in nutrients among years would not cause significant
differences in water use efficiency. Differences were
found among the experiments in the ranking of the
genotypes, showing the significance of genotypes by
environmental interactions. The differences between years
were likely due to higher rain fall and air temperature in
2011/12 that enhanced performance of genotypes. In the first
year, maximum and minimum air temperatures ranged from
18.4–30.3 oC, which was lower than the second year which
ranged from 19.5–30.5 oC. Because Jerusalem artichoke in
this study was grown in the tropics, the growing temperatures
were much higher than optimum temperatures for this
species. Most Jerusalem artichoke cultivars require an
average annual temperature between 18–26 oC under
temperate conditions (Cosgrove et al., 1991). However,
Jerusalem artichoke grown under temperate conditions and
tropical conditions requires a similar number of heat units. In
tropical regions, heat units between 2245 and 4242 were
reported (Ruttanaprasert et al., 2013), while heat units
between 2106 and 4123 were reported in temperate regions
(Kocsis et al., 2007). The difference is that the crop in
temperate regions takes nine months to accumulate these heat
units but it takes only three months in the tropics. The rainfall
did not cause significant differences among water treatments
because all treatments received uniform water during the crop
establishment period, but rainfall during the early growing
season in 2011/12 promoted better establishment of the crop
and subsequent crop performance than in 2010/11.
Differences in WU were largely due to the differences in
amount of water applied to the crop, which accounted for
88.4% of total variation for water use. Genotype and
genotype by year interaction gave small contribution to total
variation for WU (1.5% for both). Improvement of WU in
this population was not expected to yield significant results as
the genetic variation for this trait was rather low. Genotypes
contributed significant proportions of the total variations in
WUEb (49.0%) and WUEt (43.7%). The contributions were
generally 1- to- 4 fold larger than those for variation by years,
water regimes and other interactions. Water use efficiency is
important for crop improvement for drought resistance. In
peanut, genotype contributed a large portion to the variations
in water use efficiency (Jongrungklang et al., 2008; Mattews
et al., 1988). Similar results were also reported in cassava
(Manickasundaram et al., 2002). Therefore, improvement of
these traits in this Jerusalem artichoke population is
promising. Other agronomic traits are also important for
improvement of Jerusalem artichoke for drought resistance.
Variations in fresh tuber yield, biomass and inulin content
have also been reported (Puttha et al., 2012), and the
genotypic variation in inulin content was consistent across
planting dates (Puangbut et al., 2011). However, water use
efficiency for inulin yield has not been investigated, and this
trait is also important for Jerusalem artichoke breeding for
drought resistance. Water regime contributed to small
portions of total variations in WUEb (1.1%) and WUEt
(1.4%). The results suggested that any water regime can be
used for evaluation of water use efficiency with similar
results. Therefore, mimicking of drought conditions may not
be necessary. In general, the cultivars with high yield
potential under optimum conditions had acceptable yield
under stressed environments, but, under a particular
environmental stress, cultivars with high potential had lower
yield than certain cultivars with lower yield potential (Blum,
2005). Therefore, high yield potential and low yield reduction
under water stressed conditions are important for sustaining
yield under drought. In some cases, drought stress reduced
water use efficiency such as in peanut (Jongrungklang et al.,
2008) and dry bean (Phaseolus vulgaris L.) (Muñoz-perea et
al., 2007). In Jerusalem artichoke, water application of 50%
of ET caused yield reductions of lower than 50% (Losavio et
al., 1997), and, therefore, drought caused higher water use
efficiency. Drought also increased water use efficiency in
peanut (Aranyanak et al., 2008), cassava (Olanrewaju et al.,
2009), common bean and green gram (Webber et al., 2006).
Differences in the results from different studies are due to
difference in crop species, times of drought imposition to the
crops and drought intensity. As mentioned earlier,
genotypic variations accounted for 49.0% for WUEb and
43.7% for WUEt. Genotypes with high water use efficiency
could be readily identified. HEL 231, HEL 65 and
JA102×JA89(8) had high WUEb across water regimes and
years, whereas HEL 65 had high WUEt. As water use
efficiency is closely related to yield, these Jerusalem
artichoke genotypes also showed high yield under and well-
irrigated and drought conditions (Data not reported).
Relationships between data for WUEb and WUEt of two
years were consistent as indicated by significant correlation
coefficients. The results indicated that selection for high
water use efficiency in these Jerusalem artichoke collections
of genotypes is possible. In previous investigation, Yang et
al. (2010) found that JA 6 had high water use efficiency for
biomass. It is interesting to note here that JA 6 was
commonly used in these studies. However, JA 6 has high
water use efficiency for biomass and tuber yield across water
regimes in 2011/12 only. JA 70, JA 1, JA 60 and JA 36 had
low WUEb, whereas JA 70 and JA 36 had low WUEt.
Genotypic variations in water use efficiency are mainly due
to genetic variation in WU. Reduction in WU should increase
water use efficiency and ultimately improve yield under
drought conditions (Blum, 2005; Hamlyn, 2004). So, water
use efficiency values depend on the WU and day to harvest in
each genotype (Lasovio et al., 1997; Matthews et al., 1988).
Cluster analysis based on WUEb and WUEt under drought
conditions could reasonably well separate groups of
Jerusalem artichoke genotypes with high or low WUEb and
WUEt. However, the classification of Jerusalem artichoke
genotypes based on the dendrogram was slightly different
from that based on the data of three water regimes. The
difference could be due to the differential response of
Jerusalem artichoke genotypes to drought conditions. The
genotypes with high DTI were relatively low-yielding
genotypes in well- watered conditions. Genotypes with high
water use efficiency were not high DTI genotypes because
high DTI genotypes were not the best for yield in drought
conditions but rather had low yield reductions under drought
conditions. The genotypes identified through this study
1678
Table 5. Forty genotypes of Jerusalem artichoke used in the experiment, their characteristics and sources of origin
Genotypes Characteristics Sources of origin
JA 1 , JA 4, JA 6, JA 36, JA 70, JA 92, JA 114 Early and low biomass varieties PGRC1, Canada
JA3, JA 16, JA 21, JA 37, JA 38, JA 97, JA 132 Early and high biomass varieties PGRC, Canada
JA 5, JA 122 Early, tall plant and low biomass varieties PGRC, Canada
HEL 324 Early, tall plant and low biomass varieties IPK2, Germany
HEL 53, HEL 61, HEL 231, HEL 335 Early, tall plant and high biomass varieties IPK, Germany
CN 52867 Early, tall plant and high biomass varieties PGRC, Canada
KKUAc001 Early, tall plant and high biomass varieties Khajarern3
JA 61 Early, tall plant and high biomass varieties PGRC, Canada
JA 46, JA 60, JA 109 Late, short plant and low biomass varieties PGRC, Canada
JA 76, JA 77 Late, short plant and high biomass varieties PGRC, Canada
HEL 62 Late, short plant and high biomass varieties IPK, Germany
HEL 246, HEL 257 Late, tall plant and low biomass varieties IPK, Germany
JA 15, JA 67, JA 125 Late, tall plant and high biomass varieties PGRC, Canada
JA 89 Late, tall plant and high biomass varieties PGRC, Canada
HEL 65, HEL 253, HEL 256 Late, tall plant and high biomass varieties IPK, Germany
JA102×JA89(8) Late, tall plant and high biomass varieties Jerusalem artichoke Research Project4 1 The Plant Gene Resource of Canada (PGRC). 2 The Leibniz Institute of Plant Genetics and Crop Plant Research (IPK) of Germany,
3 Department of Animal Science Faculty Agriculture, Khon Kaen University, Thailand. 4 Jerusalem artichoke Research Project, Thailand
Fig 5. Dendrogram of 40 Jerusalem artichoke genotypes based on water use efficiency for biomass and water use efficiency
for tubers under drought conditions for two years
should be useful in future breeding programs for improving
drought tolerance.
Materials and methods
Plant materials and experimental design
Field experiments were conducted at the Khon Kaen
University’s agronomy farm, Khon Kaen, Thailand (16O 28´
N, 102 O 48´ E, 200 msl) in the dry season for two years
during October to February in 2010/2011 and 2011/2012. The
soil type was Yasothon series (loamy sand, Oxic Paleustults).
Three irrigation levels were assigned in strip plots, 40
Jerusalem artichoke accessions were arranged randomly in
subplots, and the treatments were replicated four times.
Twenty-seven accessions were introduced from Plant Gene
Resource of Canada (PGRC), 11 accessions were kindly
donated from the Leibniz Institute of Plant Genetics and Crop
Plant Research (IPK) of Germany, one accession was a
newly-released variety from the Jerusalem artichoke research
project of Thailand and one accession was the first introduced
clone in Thailand of unknown origin. The details of
Jerusalem artichoke accessions used in the experiment are
available in Table 5. A line source sprinkler system was
installed to provide three water gradients, which hereafter are
referred to as W1, W2 and W3, respectively, and the water
gradients were dependent on the distances for the line source,
which was installed at the center of the field. The water
supplied to W1 was expected to be equivalent to the crop water
requirement (ET crop). Water supplied to W2 was estimated as
75% of that supplied to W1, and water supplied to W2 was
45% of that supplied to W1.
Crop management
Healthy tubers were used as planting materials. The tubers
were cut into small pieces with 2 to 3 buds each, and the
tuber pieces were immersed into water containing a fungicide

1679
(caboximide) at the rate of 10 g per 20 l of water for 40 min.
The tuber pieces were then incubated in burnt rice husk
mixed (1:1) with a commercial preparation of Trichoderma
(T9) in plastic boxes for 5 to 7 days to stimulate germination.
Trichoderma was incorporated into the soil to control stem
rot disease caused by Sclerotium rolfsii. After germination,
the seedlings were transferred into plug trays containing
mixed medium of soil, burnt rice husk and Trichoderma at
the ratio of 3:3:2 V/V. Water was supplied regularly to the
nursery to avoid water stress until the seedlings had 2–3
leaves, or about 7–10 days after transferring. The seedlings
were then suitable for transplanting into the field.
Conventional tillage was practiced for soil preparation. A line
source sprinkler system consisting of two modules was
installed at the centre of the experimental field, and PVC
tubes with 3 inches in diameter were used to supply water to
the system. Module 1 supplied water to replications 1 and 2,
and module 2 supplied water to replications 3 and 4. A
separate control valve was installed for each module, The
system was not operated until the crop was well established.
Prior to transplanting of Jerusalem artichoke, a subsurface
drip irrigation system (Super Typhoon®, Netafim Irrigation
Equipment & Drip System, Israel) was installed with a
spacing of 50 cm between drip lines and 20 cm between
emitters. The drip lines were installed at 10 cm below the soil
surface between the rows, and pressure values and water
meters were fitted separately for all replications to ensure
uniform supply of water. The insecticide carbofuran (2,3–
dihydro–2,2–dimethyl benzofuran–7–ylmethylcarbamate 3%
G granular) at the rate 62.5 kg ha-1 was applied along the drip
lines and then the drip lines were covered with soil. An
aluminum access tube was installed at the middle of each
water level of the plot border to measure soil moisture
content. Prior to planting, water was supplied to the soil
through drip irrigation at field capacity level. The healthy
seedlings were then transplanted to the soil and inoculum of
Trichoderma was applied to each hill before planting. Plot
size was 2 × 4 m in both years with a spacing of 50 cm
between rows and 30 cm between plants within row. Manual
weeding was done at 14 days after transplanting (DAT) and
mixed fertilizer of N – P2O5 –K 2O (15–15–15) at the rate of
156.25 kg ha-1 was applied at 30 DAT.
Water regimes
Water was supplied to the crop through drip irrigation system
at field capacity level from transplanting to 10 DAT, and then
drip irrigation system was no longer used. After 14 DAT,
water was supplied through a line source sprinkler irrigation
system until harvest. Total crop water use for W1 was crop
water requirement described by Doorenbos and Pruitt (1992),
Where, ETcrop = ETo × Kc
ETcrop = crop water requirement (mm/day)
ETo = evapotranspiration of a reference plant under
specified conditions calculated by pan evaporation method Kc = the crop water requirement coefficient for sunflower,
which varies depending on varieties and growth stages. As
crop coefficient for Jerusalem artichoke is not available in the
literature, the crop coefficient for sun flower (Monti et al.,
2005) is used because sunflower and Jerusalem artichoke are
closely related species and their morphological characters are
similar. The amounts of water that were supplied to the crop
at all moisture levels were monitored by catch can, which
were installed in all replications of water treatments (6 cans
for each water treatment for a replication).
Data collection
Meteorological conditions
Weather data for both seasons were obtained from nearby
meteorological station, Khon Kaen University, Khon Kaen,
Thailand. Evaporation (E0), rainfall, maximum and minimum
temperature and relative humidity (RH) were recorded daily
form transplanting until harvest.
Soil data and soil moisture content
The field experiment in both years was conducted in the same
field. Soil samples were collected before planting in each
replication from 8 positions per replication, and the soil
samples were air dried. After mixing and bulking, the soil
samples were analyzed to determine the physical and
chemical properties. The soil chemical and physical
properties were slightly different among experimental years.
The soil in 2010/11 was loamy sand and in 2011/12 was sand,
and clay particle in 2010/11 was slightly higher than in
2011/12 (Table 4). The differences in soil properties could be
due to tillage to break hard pan. Soil moisture content was
measured by gravimetric methods at transplanting, 14 DAT
and harvest at the depths of 30, 60 and 90 cm. Soil moisture
content was also measured with a neutron probe (Type I.H. II
SER. No NO152, Ambe Didcot Instruments Co., Ltd.,
England), and neutron probe readings were conducted at the
depths of 30, 60 and 90 cm (30 cm intervals) at 7–day
intervals throughout the course of the experiment.
Crop Data
Relative water content
To evaluate plant water status, the relative water content was
measured at 40, 60 and 70 DAT using the second or third
expanded leaves from the top of the main stem of five plants
from each plot. The leaves were cut with a disc borer 1 cm in
diameter, and leaf fresh weight was determined. The leaf
discs were placed in distilled water until the leaf was
moisture saturated. The turgid weight was determined after
keeping the leaf sample in distilled water for 8 hours. The
leaf discs were oven-dried at 80 oC for 48 hours and leaf dry
weight was determined. Water content was calculated based
on the formula suggested by Kramer (1980) as follows;
RWC =[(FW – DW)/ (TW – DW)] × 100,
Where, FW: sample field weight, TW: sample turgid weight
and DW: sample dry weight.
Biomass and tuber yield
At harvest, the plants at two ends of the rows were discarded,
all plants in an area of 2.1 m2 were harvested discarding the
border rows, cut at the soil surface and separated into shoots
and tubers. Tubers were washed in tap water to remove the
potting medium. Fresh shoot weight and tuber fresh weight
were determined in the field (Ohaus model PA 413, USA)
and then the weights were converted to fresh weights per
area. A random shoot fresh weight and tuber fresh weight
from 10% of plants in each plot was taken, oven-dried at 80
°C for 72 hours or until constant weight, and weighed.
Biomass was calculated from shoot dry weight and tuber dry
weight.
1680
Water use (WU) and water use efficiency (WUE)
calculation
Total crop water use was calculated by the sum of irrigation
applications and rains in each plot ± the difference in soil
moisture before transplanting and soil moisture at final
harvest. WUE was estimated for biomass and tuber using the
formula proposed by Teare et al. (1982):
WUE for biomass (WUEb) = total dry matter /water used in
evapotranspiration and
WUE for tubers (WUEt) = tuber dry weight/water used in
evapotranspiration.
Drought tolerance index (DTI)
Drought tolerance index was computed for water use,
biomass and tuber dry weight ratio by comparing values
under stress treatment to values for non–stress treatment as
suggested by Nautiyal et al. (2002)
DTI = Data of stress treatment/data of non–stress treatment.
Statistical analysis
Analysis of variance was performed for each character based
on a strip plot design (Gomez and Gomez, 1984) using
statistix 8 (Statistix8, 2003). Homogeneity of variance was
tested for all characters and combined analysis of variance of
two-year data was performed. When the differences of main
effects were significant (P ≤ 0.05), Duncan’s multiple range
test (DMRT) was used to compare means using MSTAT-C
package (Bricker, 1989). Cluster analysis was constructed
using means of Jerusalem artichoke genotypes for WUEb and
WUEt under two drought levels for two years. The cluster
analysis based on Ward’s method and squared Euclidian
distance was performed and the dendrogram was constructed.
All calculations were done using computer program SAS
6.12 software (SAS, 2001).
Conclusion
The results show that there were significant genetic variations
in WUEb and WUEt in this set of Jerusalem artichoke
accessions and, therefore, improvement of drought resistance
using these accessions as a germplasm source may be
possible. High WU was found in the crop with W1. HEL 231,
HEL 65 and JA 102 ×JA89 (8) performed well for WUEb at
all water regimes, whereas HEL 65 was identified as the
accessions with high WUEt.
Acknowledgements
This work was supported by the Higher Education Research
Promotion and National Research University Project of
Thailand, Office of the Higher Education Commission,
through the Food and Functional Food Research Cluster of
Khon Kaen University. The Plant Gene Resource of Canada
and the Leibniz Institute of Plant Genetics and Crop Plant
Research, Germany are acknowledged for their donation of
Jerusalem artichoke Germplasm. The research has been
supported financially by the Peanut and Jerusalem Artichoke
Improvement for Functional Food Research Group under the
KKU Research Fund and Plant Breeding Research Center for
Sustainable Agriculture, Khon Kaen University, Thailand.
Grateful acknowledgment is also made to the Thailand
Research Fund (TRF), the Commission of Higher Education
(CHE) and Khon Kaen University (KKU) for providing
financial supports to this research through the Distinguished
Research Professor Grant of Dr. Aran Patanothai. I would
like to thank Dr. Barbara Shew for her language editing and
Dr. Bhalang Suriharn for his suggestions on cluster analysis.
References
Arunyanark A, Jogloy S, Akkasaeng C, Vorasoot N, Kesmala
T, Nageswara Rao RC, Wright GC, Patanothai A (2008)
Chlorophyll stability is an indicator of drought tolerance in
peanut. J Agron Crop Sci. 194:113–125
Baldini M, Danuso F, Monti A, Amaducci T, Stevanato P,
Mastro GD (2006) Chicory and Jerusalem artichoke
productivity in different areas of Italy, in relation to water
availability and time of harvest. Ital J Agron. 2:291–307
Blum A (2005) Drought resistance, water-use efficiency, and
yield potential-are they compatible, dissonant, or mutually
exclusive? Aust J Agi Res. 56:1159–1168
Bricker AA (1989) MSTAT-C user’s guide. Michigan State
University, East Lansing
Burke D (2005) The Complete Burke's Backyard: The
Ultimate Book of Fact Sheets. Kay Scariett, Australia
Conde JR, Tenorio JL, Rodriguez-Maribona B, Ayerbe L
(1991) Tuber yield of Jerusalem artichoke (Helianthus
tuberosus L.) in relation to water stress. Biomass Bioenerg.
3:131–142
Cosgrove DR, Oelke EA, Doll JD, Doll DW, Davesd W,
Undersander DJ, Springer SE (1991) Alternative Field
Crop Manual. Jerusalem artichoke. Available at: http://hort.
purdue,edu/newcrop/afcm/jerisart.html. (accessed January
3, 2011)
Doorenbos J, Pruitt WO (1992) Calculation of crop water
requirement. In: Crop water requirement. FAO of The
United Nation. Rome, Italy
Geng-mao Z, Zhao-pu L, Ming-da C, Shi-wei G (2008) Soil
properties and yield of Jerusalem artichoke (Helianthus
tuberosus L.) with seawater irrigation in North China plain.
Pedosphere. 18:195–202
Gomez KA, Gomez AA (1984) Statistical procedures for
agricultural research. John Wiley & Sons, New York Hamlyn (2004) What is water use efficiency? In: Mark AB
(ed) Water use efficiency in plant biology. Blackwell
publishing, Florida
Jongrungklang N, Toomsan B, Vorasoot N, Jogloy S,
Kesmala T, Patanothai A (2008) Identification of peanut
genotypes with high water use efficiency under drought
stress conditions from peanut germplasm of diverse origins.
Asian J Plant Sci. 7:628–638
Kays SJ, Nottingham SF (2008) Biology and Chemistry of
Jerusalem artichoke (Helianthus tuberosus L.). CRC press,
Florida
Kramer PJ (1980) Drought, stress and the origin of
adaptation. In: Turner NC, Kramer PJ (eds) Adaptation of
plant to water and high temperature stress. John Wiley &
Sons, New York
Kocsis L, Kaul HP, Praznik W, Liebhard P (2007) Influence
of harvest date on shoot and tuber yield of different
Jerusalem artichoke (Helianthus tuberosus L.) cultivars in
the semi-arid production area of Austria. Ger J Agro. 11:
67–76 (In German, summary in English)
Lebot V (2009) Tropical root and tuber crop: cassava, sweet
potato, yams and aroids. CABI, UK
Losavio N, Lamascese N, Vonella AV (1997) Water
requirements and nitrogen fertilization in Jerusalem
artichoke (Helianthus tuberosus L.) grown under
Mediterranean conditions. Acta Hort. 449:205–209

1681
Manickasundarum P, Selvaraj PK, Krishnamoorthi VV,
Gnanamurthy P (2002) Drip irrigation and fertigation
studies in tapioca. Madras Agric J. 89:446–468
Matthews RB, Harris D, Nageswara Roa RC, Williams JH,
Wadia KDR (1988) The physiological basis for yield
differences between four genotypes of groundnut (Arachis
hypogaea L.) in response to drought. I. Dry matter
production and water use. Exp Agr. 24:191–202
Monti A, Amaducci MT, Venturi G (2005) Growth response,
leaf gas exchange and fructans accumulation of Jerusalem
artichoke (Helianthus tuberosus L.) as affected by different
water regimes. Eur J Agron. 23:136–145
Muñoz-perea CG, Allen RC, Westermann DT, Wright JL,
Singh SP (2007) Water use efficiency among dry bean
landraces and cultivars in drought-stressed and non-stressed
environments. Euphytica. 155:393–402
Nautiyal PC, Negeswara Roa RC, Jodhi YC (2002) Moisture
deficit induced changes in leaf water content, leaf carbon
exchange rate and biomass production in groundnut
cultivars differing in specific leaf area. Field Crop Res.
74:67–79
Olanrewaju OO, Olufayo AA, Oguntunde PG, Ilemobade
(2009) Water use efficiency of Manihot esculenta crantz
under drip irrigation system in south western Nigeria. Eur J
Sci Res. 27:576–587
Pimsean W, Jogloy S, Suriharn B, Kesmala T, Pensuk V,
Patanothai A (2010) Genotype by environment (G×E)
interactions for yield components of Jerusalem Artichoke
(Helianthus tuberosus L.). Asian J Plant Sci. 9:11–19
Puangbut D, Jogloy S, Srijaranai S, Vorasoot N, Kesmala T,
Patanothai A (2011) Rapid assessment of inulin content in
Helianthus tuberosus L. tubers. SABRAO J Breed Genet.
43:188–200
Puangbut D, Jogloy S, Vorasoot N, Akkasaeng C, Kesmala
T, Rachaputi Rao CN, Wright GC, Patanothai A (2009)
Association of root dry weight and transpiration efficiency
of peanut genotypes under early season drought. Agr Water
Manage. 96:1460– 1466
Puttha R, Jogloy S, Wangsomnuk P, Srijaranai S, Kesmala T,
Patanothai A (2012) Genotypic variability and genotype by
environment interactions for inulin content ofJerusalem
artichoke germplasm. Euphytica. 183:119–131
Rahimi A, Jahansoz M.R, Madah Hoseini S, Sajjadinia AR,
Roosta HR, Fateh E (2011) Water use and water-use
efficiency of Isabgol (Plantago ovata) and French psyllium
(Plantago psyllium) in different irrigation regimes. Aust J
Crop Sci. 5:71–77
Roberfroid MB (2000) Prebiotics and probiotics:are they
functional food? American Am J Clin Nutr. 71:1682–1687
Robert F, Barnes C, Jerry N, Moore KJ, Michael C (2007)
Forages: The science of grassland agriculture. Blackwell
publishing, lowa
Rodrigues MA, Sousa L, Cabanas JE, Arrobas M (2007)
Tuber yield and leaf mineral composition of Jerusalem
artichoke (Helianthus tuberosus L.) grown under different
cropping practices. Span J Agric Res. 5:545–553
Ruttanaprasert R, Jogloy S, Vorasoot N, Kesmala T, Kanwar
RS, Holbrook CC, Patanothai A (2013) Photoperiod and
growing degree days effect on dry matter partitioning in
Jerusalem artichoke. Int J Plant Prod. 7:393–416
SAS Institute (2001) SAS/STAT user’s guide, 2nd edn. SAS
Institute Inc, Cary
Schittenhelm MS (1999) Agronomic performance of root
chicory, Jerusalem artichoke and sugarbeet in stress and
non-stress environment. Crop Sci. 39:1815–1823
Statistix8 (2003) Statistix8: analytical software user’s
manual. Tallahassee, Florida
Teare ID, Sionit N, Kramer PJ (1982) Change in water status
during water stress at different stages of development in
wheat. Physiol Plantarum. 55:296–300
Tennakoon SB, Milroy SP (2002) Crop water use and water
use efficiency on irrigated cotton farms in Australia. Agr
Water Manage. 61:179–194
Webber HA, Madramootoo CA, Bourgault M, Horst MG,
Stulina G, Smith DL (2006) Water use efficiency of
common bean and green gram grown using alternate furrow
and deficit irrigation. Agr Water Manage. 86:259–268
Yang B, Zhang HJ, You-Xian L, Xue YL (2010) Effect of
different irrigation on development and water use
efficiency of Jerusalem artichoke. Irrig Drain. 29:168–175
(In Chinese, abstract in English)
Related Documents