Genet. Sel. Evol. 33 (2001) 311–332 311 © INRA, EDP Sciences, 2001 Original article Genetic diversity measures of local European beef cattle breeds for conservation purposes Javier CAÑÓN a , * , Paolo ALEXANDRINO b , Isabel BESSA b , Carlos CARLEOS c , Yolanda CARRETERO a , Susana DUNNER a , Nuno FERRAN b , David GARCIA a , Jordi JORDANA d , Denis LALOË e , Albano PEREIRA b , Armand SANCHEZ d , Katayoun MOAZAMI-GOUDARZI e a Laboratorio de Genética, Facultad de Veterinaria, Universidad Complutense de Madrid, 28040 Madrid, Spain b Faculdade Ciencias Porto, 04021 Porto, Portugal c Facultad de Ciencias, Universidad de Oviedo, 33007 Oviedo, Spain d Facultad de Veterinaria, Universidad Autónoma de Barcelona, 08193 Bellaterra, Spain e Institut national de la recherche agronomique, Département de génétique animale, 78352 Jouy-en-Josas, France (Received 4 August 2000; accepted 2 January 2001) Abstract – This study was undertaken to determine the genetic structure, evolutionary relation- ships, and the genetic diversity among 18 local cattle breeds from Spain, Portugal, and France using 16 microsatellites. Heterozygosities, estimates of Fst, genetic distances, multivariate and diversity analyses, and assignment tests were performed. Heterozygosities ranged from 0.54 in the Pirenaica breed to 0.72 in the Barrosã breed. Seven percent of the total genetic variability can be attributed to differences among breeds (mean F st = 0.07; P < 0.01). Five different genetic distances were computed and compared with no correlation found to be significantly different from 0 between distances based on the effective size of the population and those which use the size of the alleles. The Weitzman recursive approach and a multivariate analysis were used to measure the contribution of the breeds diversity. The Weitzman approach suggests that the most important breeds to be preserved are those grouped into two clusters: the cluster formed by the Mirandesa and Alistana breeds and that of the Sayaguesa and Tudanca breeds. The hypothetical extinction of one of those clusters represents a 17% loss of diversity. A correspondence analysis not only distinguished four breed groups but also confirmed results of previous studies classifying the important breeds contributing to diversity. In addition, the variation between breeds was sufficiently high so as to allow individuals to be assigned to their breed of origin with a probability of 99% for simulated samples. local beef cattle breeds / microsatellite / genetic diversity * Correspondence and reprints E-mail: [email protected]

Welcome message from author
This document is posted to help you gain knowledge. Please leave a comment to let me know what you think about it! Share it to your friends and learn new things together.
Transcript
Genet. Sel. Evol. 33 (2001) 311–332 311© INRA, EDP Sciences, 2001
Original article
Genetic diversity measures of localEuropean beef cattle breedsfor conservation purposes
Javier CAÑÓNa,∗, Paolo ALEXANDRINOb,Isabel BESSAb, Carlos CARLEOSc, Yolanda CARRETEROa,
Susana DUNNERa, Nuno FERRANb, David GARCIAa,Jordi JORDANAd, Denis LALOËe, Albano PEREIRAb,
Armand SANCHEZd, Katayoun MOAZAMI-GOUDARZIe
a Laboratorio de Genética, Facultad de Veterinaria,Universidad Complutense de Madrid, 28040 Madrid, Spain
b Faculdade Ciencias Porto, 04021 Porto, Portugalc Facultad de Ciencias, Universidad de Oviedo, 33007 Oviedo, Spain
d Facultad de Veterinaria, Universidad Autónoma de Barcelona,08193 Bellaterra, Spain
e Institut national de la recherche agronomique, Département de génétique animale,78352 Jouy-en-Josas, France
(Received 4 August 2000; accepted 2 January 2001)
Abstract – This study was undertaken to determine the genetic structure, evolutionary relation-ships, and the genetic diversity among 18 local cattle breeds from Spain, Portugal, and Franceusing 16 microsatellites. Heterozygosities, estimates of Fst, genetic distances, multivariate anddiversity analyses, and assignment tests were performed. Heterozygosities ranged from 0.54 inthe Pirenaica breed to 0.72 in the Barrosã breed. Seven percent of the total genetic variabilitycan be attributed to differences among breeds (mean Fst = 0.07; P < 0.01). Five differentgenetic distances were computed and compared with no correlation found to be significantlydifferent from 0 between distances based on the effective size of the population and those whichuse the size of the alleles. The Weitzman recursive approach and a multivariate analysis wereused to measure the contribution of the breeds diversity. The Weitzman approach suggeststhat the most important breeds to be preserved are those grouped into two clusters: the clusterformed by the Mirandesa and Alistana breeds and that of the Sayaguesa and Tudanca breeds.The hypothetical extinction of one of those clusters represents a 17% loss of diversity. Acorrespondence analysis not only distinguished four breed groups but also confirmed resultsof previous studies classifying the important breeds contributing to diversity. In addition, thevariation between breeds was sufficiently high so as to allow individuals to be assigned to theirbreed of origin with a probability of 99% for simulated samples.
local beef cattle breeds / microsatellite / genetic diversity
∗ Correspondence and reprintsE-mail: [email protected]
312 J. Cañón et al.
1. INTRODUCTION
During the last forty years, it has become clear that biochemical analysesof genetic variation can provide valuable insight into the genetic structure andevolutionary history of cattle populations. Studies have been undertaken ona broad scale to encompass populations not only from different regions ofthe globe but also at a local level among closely related populations withinparticular regions [4,18,22,30,33,38]. Manwell and Baker [31] were thefirst to present a phylogenetic tree for the ten major cattle breed-groups ofEurope, Western Asia, and Northern Africa. By reviewing the data on proteinpolymorphism, they were able to demonstrate that it was in positive agreementwith morphological and geographical divisions of the major breed-groups.They were not able, however, to study relationships between individual breeds.
More recently, molecular techniques have provided new markers for thestudy of genetic variation [6,27,37]. Among these, microsatellites (repetitiveelements containing simple sequence motifs, usually dimers or trimers) havequickly become the favourite agents for population genetic studies as they offeradvantages which are particularly appropriate in conservation projects. First,they are widely available. Second, they exhibit a high degree of polymorphism.Third, as genetic systems, they are comparatively easy to automate with thepossibility of multiplex amplification of up to five loci in a single PCR reactionand of multiple loadings of up to fifteen loci per lane in some highly optimisedgel systems. In addition, it is assumed they are neutral to selection, theobserved genetic diversity being the consequence of two forces: genetic driftand mutation.
In the last five years, different studies of genetic relationships betweencattle breeds using microsatellites have been published. MacHugh et al. [28]analysed 20 microsatellites in different cattle populations from Africa, Europe,and Asia highlighting a marked distinction between humpless (taurine) andhumped (zebu) cattle which provides strong support for the hypothesis of aseparate origin of domesticated zebu cattle. Studies aimed at characterisingrelationships within the African group [45] or within the European group ofcattle breeds have focused on breeds from Italy [10], Spain [32], Belgium [36],the British Isles [29], France [35], and Switzerland [42]. It is difficult, however,to group the data from these studies together in order to clarify the geneticrelationships among the major types of cattle because they do not use a commonset of microsatellites. For this reason, the FAO has proposed a list of thirtymicrosatellites for the analysis of genetic diversity in European cattle breeds.
The primary goal of this study is to assess the genetic variation within,and between, breeds and groups of breeds. A secondary aim is to definea diversity measure which will permit the ranking of breeds for conservationpurposes thus providing useful information concerning the relative contribution
Genetic diversity of local beef cattle breeds 313
to genetic diversity of 18 local cattle breeds from Spain, Portugal, and Franceusing 16 microsatellites (15 of which are from the FAO list).
2. MATERIALS AND METHODS
2.1. Cattle breeds
The breeds included in this study (Tab. I) are characterised by a widespreadregional distribution, small population size, and ties to traditional productionsystems.
Regarding their morphological attributes, most of the breeds show pigment-ation similar to their wild ancestor, from reddish-brown to brownish-black,with black pigmentation restricted to the extremities (Alistana, Mirandesa,Maronesa, Barrosã, Asturiana de los Valles, Asturiana de la Montaña, Aub-rac). In some breeds (Tudanca, Gasconne and Bruna) red pigmentation tendsto lighten considerably as the animals age. The most commonly observedvariants are solid black (Morucha and Avileña) and red pigmentation (Retinta,Alentejana, Pirenaica, Salers) although a colour-sided (Mertolenga) breed wasalso found in this study. Most of the breeds included in the project have neverbeen exposed to reproductive technology or other breeding tools related toartificial discriminative mating thus limiting the male and female gene flowbetween breeds with individual dispersion only at local levels. Nevertheless,the lack of organised studbooks, most of them created recently, for many of thebreeds has facilitated a certain degree of genetic introgression between them.
2.2. Sampling of populations
The sampling process is of great importance as it allows us to determine thekind of inferences which can be made. In order to reflect the current geneticcomposition, individuals can be considered to have been sampled at randomwithin-generation.
Fresh blood collected in a conservative buffer was taken from 50 individuals(25 males and 25 females).
2.3. Genetic loci studied
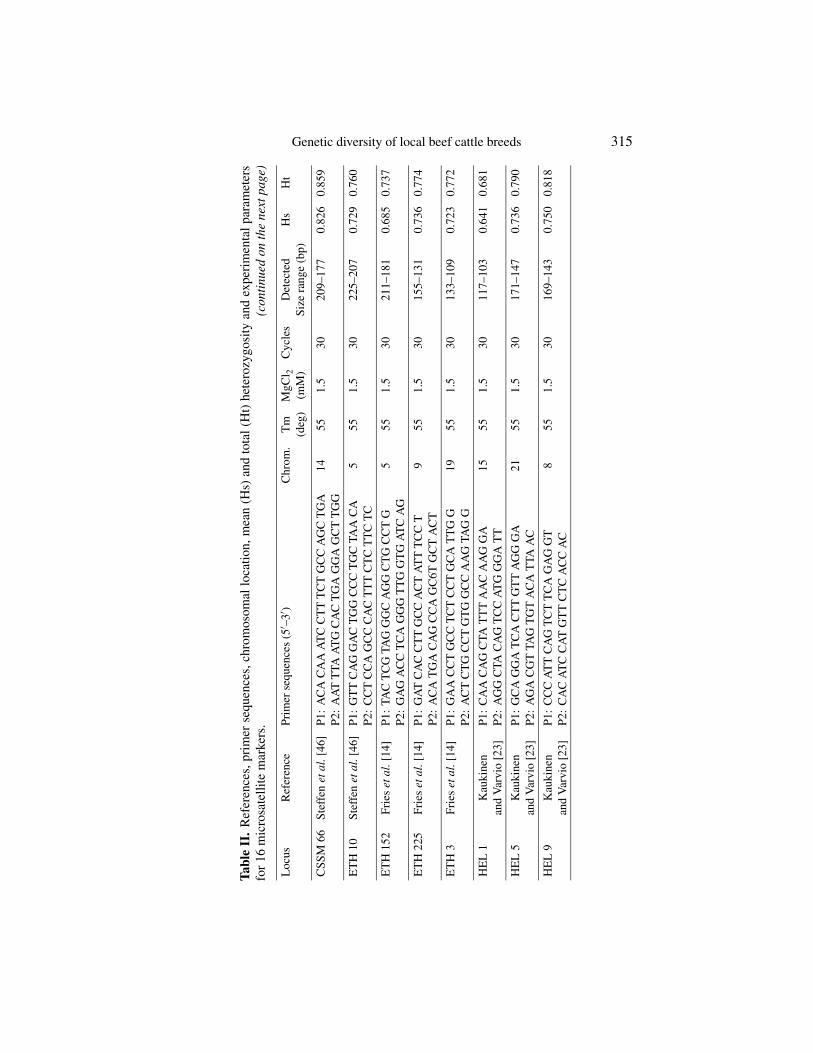
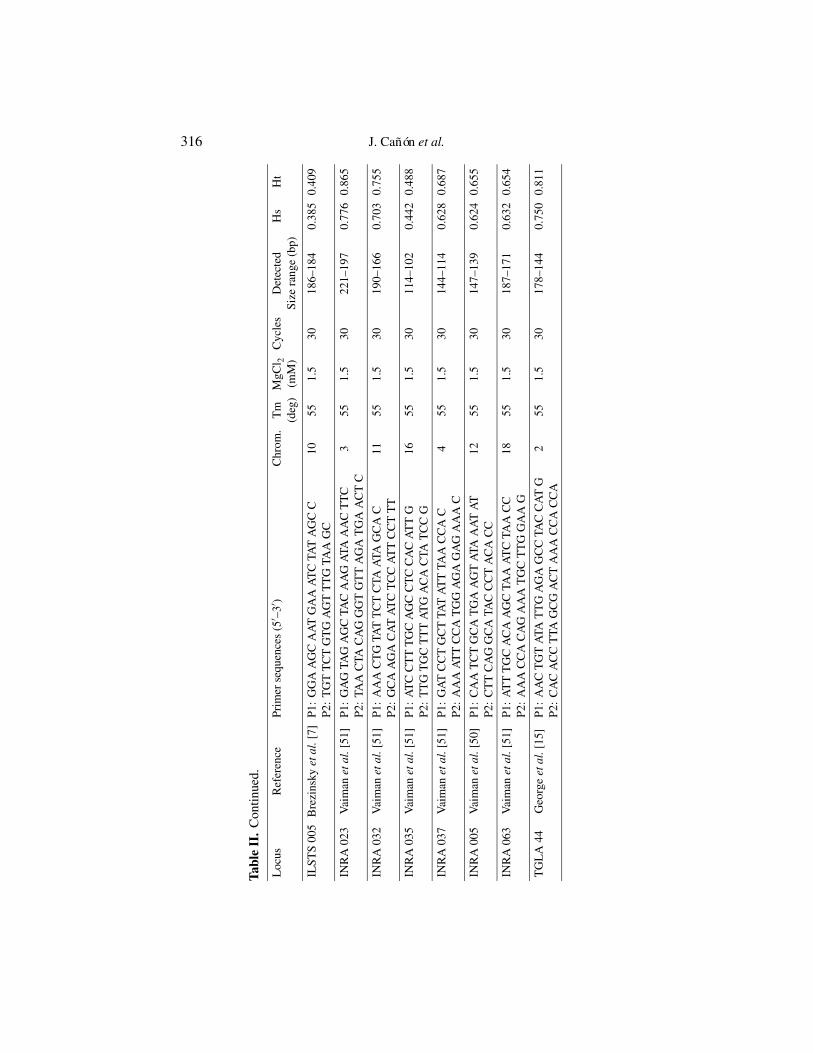
The 16 microsatellite loci studied were: CSSM 66, ETH 10, ETH 152,ETH 225, ETH 3, HEL 1, HEL 5, HEL 9, ILSTS 005, INRA 023, INRA 032,INRA 035, INRA 037, INRA 005, INRA 063, and TGLA 44. References andprimer sequences are described in Table II. TGLA 44 is the only locus notincluded in the European Concerted Action AIRE2066 list (FAO list).

314 J. Cañón et al.
Table I. Summary statistics for beef cattle breeds used in microsatellite marker analysisof population structure showing geographical location, sample size (N), observed (Ho)and expected (He) heterozygosity and average number of alleles per locus (MNA).Standard errors in parentheses.
Breed Origin N Ho He MNAof the samples
Alistana Spain 50 0.629 (0.032) 0.681 (0.027) 6.9 (0.8)Asturiana Montaña Spain 50 0.652 (0.037) 0.705 (0.034) 6.6 (0.7)Asturiana Valles Spain 50 0.656 (0.045) 0.683 (0.042) 7.0 (0.7)Sayaguesa Spain 50 0.654 (0.031) 0.707 (0.028) 6.4 (0.6)Tudanca Spain 50 0.596 (0.040) 0.651 (0.036) 6.8 (0.8)Avileña Negra-Ibérica Spain 50 0.589 (0.043) 0.692 (0.034) 6.9 (0.7)Bruna del Pirineus Spain 50 0.619 (0.033) 0.672 (0.030) 7.1 (0.7)Morucha Spain 50 0.640 (0.036) 0.709 (0.039) 6.9 (0.7)Pirenaica Spain 50 0.543 (0.052) 0.628 (0.037) 5.8 (0.4)Retinta Spain 50 0.614 (0.040) 0.693 (0.033) 6.8 (0.6)Alentejana Portugal 50 0.622 (0.054) 0.655 (0.052) 5.8 (0.5)Barrosã Portugal 50 0.716 (0.037) 0.708 (0.039) 6.7 (0.6)Maronesa Portugal 49 0.635 (0.045) 0.664 (0.041) 6.1 (0.6)Mertolenga Portugal 50 0.626 (0.039) 0.671 (0.035) 5.9 (0.5)Mirandesa Portugal 50 0.625 (0.037) 0.635 (0.026) 5.5 (0.4)Aubrac France 50 0.569 (0.043) 0.611 (0.036) 6.2 (0.6)Gasconne France 50 0.630 (0.039) 0.708 (0.023) 7.2 (0.6)Salers France 50 0.580 (0.046) 0.631 (0.036) 6.1 (0.6)
2.4. DNA extraction and PCR amplification
DNA was extracted using established procedures [20,41] that guaranteelong-term stability of DNA samples. Primers and Polymerase Chain Reaction(PCR) conditions are described in Table II. The PCR analysis of microsatelliteswas carried out by loading onto standard 7% polyacrilamide denaturing gelusing silver staining [2] or fluorescent-labelled PCR primer methods through anautomated DNA fragment analyser (Applied Biosystem 373 or 377). In order toensure the compatibility of results from different equipment and laboratories,3 types of reference DNA were used: Type 1 = reference DNAs (n = 9)from the AIRE 2006, Type 2 = reference DNA (n = 4) from this project,Type 3 = reference DNA (n = 2) from individual laboratories. Moreover, theaccurate sizing of allele fragments of these 15 reference DNAs was checkedby each of the four laboratories involved in the study. In addition, to ensurethe compatibility of results within each laboratory, Type 3 DNAs were used asstandards for each loaded gel.
Genetic diversity of local beef cattle breeds 315
Tabl
eII
.R
efer
ence
s,pr
imer
sequ
ence
s,ch
rom
osom
allo
catio
n,m
ean
(Hs)
and
tota
l(H
t)he
tero
zygo
sity
and
expe
rim
enta
lpar
amet
ers
for
16m
icro
sate
llite
mar
kers
.(c
ontin
ued
onth
ene
xtpa
ge)
Loc
usR
efer
ence
Prim
erse
quen
ces
(5′ –
3′)
Chr
om.
Tm
MgC
l 2C
ycle
sD
etec
ted
Hs
Ht
(deg
)(m
M)
Size
rang
e(b
p)
CSS
M66
Stef
fen
etal
.[46
]P1
:A
CA
CA
AA
TC
CT
TT
CT
GC
CA
GC
TG
A14
551.
530
209–
177
0.82
60.
859
P2:
AA
TT
TAA
TG
CA
CT
GA
GG
AG
CT
TG
G
ET
H10
Stef
fen
etal
.[46
]P1
:G
TT
CA
GG
AC
TG
GC
CC
TG
CTA
AC
A5
551.
530
225–
207
0.72
90.
760
P2:
CC
TC
CA
GC
CC
AC
TT
TC
TC
TT
CT
C
ET
H15
2Fr
ies
etal
.[14
]P1
:TA
CT
CG
TAG
GG
CA
GG
CT
GC
CT
G5
551.
530
211–
181
0.68
50.
737
P2:
GA
GA
CC
TC
AG
GG
TT
GG
TG
AT
CA
G
ET
H22
5Fr
ies
etal
.[14
]P1
:G
AT
CA
CC
TT
GC
CA
CT
AT
TT
CC
T9
551.
530
155–
131
0.73
60.
774
P2:
AC
AT
GA
CA
GC
CA
GC
6TG
CT
AC
T
ET
H3
Frie
set
al.[
14]
P1:
GA
AC
CT
GC
CT
CT
CC
TG
CA
TT
GG
1955
1.5
3013
3–10
90.
723
0.77
2P2
:A
CT
CT
GC
CT
GT
GG
CC
AA
GTA
GG
HE
L1
Kau
kine
nP1
:C
AA
CA
GC
TAT
TT
AA
CA
AG
GA
1555
1.5
3011
7–10
30.
641
0.68
1an
dV
arvi
o[2
3]P2
:A
GG
CTA
CA
GT
CC
AT
GG
GA
TT
HE
L5
Kau
kine
nP1
:G
CA
GG
AT
CA
CT
TG
TT
AG
GG
A21
551.
530
171–
147
0.73
60.
790
and
Var
vio
[23]
P2:
AG
AC
GT
TAG
TG
TA
CA
TTA
AC
HE
L9
Kau
kine
nP1
:C
CC
AT
TC
AG
TC
TT
CA
GA
GG
T8
551.
530
169–
143
0.75
00.
818
and
Var
vio
[23]
P2:
CA
CA
TC
CA
TG
TT
CT
CA
CC
AC
316 J. Cañón et al.
Tabl
eII
.C
ontin
ued.
Loc
usR
efer
ence
Prim
erse
quen
ces
(5′ –
3′)
Chr
om.
Tm
MgC
l 2C
ycle
sD
etec
ted
Hs
Ht
(deg
)(m
M)
Size
rang
e(b
p)
ILST
S00
5B
rezi
nsky
etal
.[7]
P1:
GG
AA
GC
AA
TG
AA
AT
CTA
TA
GC
C10
551.
530
186–
184
0.38
50.
409
P2:
TG
TT
CT
GT
GA
GT
TT
GTA
AG
C
INR
A02
3V
aim
anet
al.[
51]
P1:
GA
GTA
GA
GC
TAC
AA
GA
TAA
AC
TT
C3
551.
530
221–
197
0.77
60.
865
P2:
TAA
CTA
CA
GG
GT
GT
TA
GA
TG
AA
CT
C
INR
A03
2V
aim
anet
al.[
51]
P1:
AA
AC
TG
TAT
TC
TC
TAA
TAG
CA
C11
551.
530
190–
166
0.70
30.
755
P2:
GC
AA
GA
CA
TA
TC
TC
CA
TT
CC
TT
T
INR
A03
5V
aim
anet
al.[
51]
P1:
AT
CC
TT
TG
CA
GC
CT
CC
AC
AT
TG
1655
1.5
3011
4–10
20.
442
0.48
8P2
:T
TG
TG
CT
TT
AT
GA
CA
CTA
TC
CG
INR
A03
7V
aim
anet
al.[
51]
P1:
GA
TC
CT
GC
TTA
TA
TT
TAA
CC
AC
455
1.5
3014
4–11
40.
628
0.68
7P2
:A
AA
AT
TC
CA
TG
GA
GA
GA
GA
AA
C
INR
A00
5V
aim
anet
al.[
50]
P1:
CA
AT
CT
GC
AT
GA
AG
TA
TAA
AT
AT
1255
1.5
3014
7–13
90.
624
0.65
5P2
:C
TT
CA
GG
CA
TAC
CC
TA
CA
CC
INR
A06
3V
aim
anet
al.[
51]
P1:
AT
TT
GC
AC
AA
GC
TAA
AT
CTA
AC
C18
551.
530
187–
171
0.63
20.
654
P2:
AA
AC
CA
CA
GA
AA
TG
CT
TG
GA
AG
TG
LA
44G
eorg
eet
al.[
15]
P1:
AA
CT
GT
ATA
TT
GA
GA
GC
CTA
CC
AT
G2
551.
530
178–
144
0.75
00.
811
P2:
CA
CA
CC
TTA
GC
GA
CT
AA
AC
CA
CC
A
Genetic diversity of local beef cattle breeds 317
2.5. Statistical analysis
The BIOSYS-1 package [47] was used to compute allele frequencies bydirect counting, as well as the number of alleles, and unbiased estimates forexpected (He) and observed (Ho) heterozygosity.
Different genetic distances clustered into three groups were used: 1) geneticdistances considered appropriate under a pure drift model where genetic driftwas assumed to be the main factor in genetic differentiation among closelyrelated populations or for short-term evolution [39,48,52] – using the traditionaldifferentiation-between-population estimator FST [55] and the Reynolds geneticdistance estimator [39]; 2) genetic distances that assume a step-wise-mutationmodel, i.e., average squared distance [16] and delta-mu squared distance [17];3) a non-metric genetic distance based on the proportion of shared alleles [5].All genetic distances were estimated using MICROSAT [34] except for theReynolds distance for which the PHYLIP package [13] was used. The product-moment correlation (r) and Mantel test statistic were computed for pairwisecomparisons of distance matrices.
After defining groups of breeds by country or by trunk (a set of breeds witha hypothetical common ancestor) using a priori information, a hierarchicalanalysis of variance was carried out which permitted the partitioning of thetotal genetic variance into components due to inter-individual differences onthe one hand and inter-breed differences on the other. Variance componentswere then used to compute fixation indices [55] and their significance testedusing a non-parametric permutation approach described by Excoffier et al. [12].Computation was carried out using the AMOVA (Analysis of Molecular Vari-ance) programme implemented in the ARLEQUIN package [43].
2.5.1. Multivariate correspondence analysisPhylogenetic reconstruction and the use of genetic distances do not take
into account the effects of admixtures between branches. Alternatively, therepresentation of genetic relationships among a group of populations may beobtained using multivariate techniques which can condense the informationfrom a large number of alleles and loci into a few synthetic variables.
Correspondence Analysis [3,26] is a multivariate method analogous to thePrincipal Components analysis but which is appropriate for categorical vari-ables and leads to a simultaneous representation of breeds and loci as a cloudof points in a metric space. As with the Principal Components analysis, axes,which are ranked according to their fraction of information, span this spacewith each axis independent of the others. Inertia, or dispersion, measures thisinformation, i.e., the direction of maximum inertia is the direction in whichthe cloud of points is the most scattered. The basic concept of inertia canbe related to the well-established population parameter FST [19] as well as togenetic diversity [24].

318 J. Cañón et al.
Allele frequencies of all loci were used as variables to spatially cluster thebreeds using a correspondence analysis based on Chi-square distances to judgeproximity between them.
2.5.2. Computing diversity
Following the Weitzman approach [53,54], the Reynolds genetic distanceswere used to compute marginal losses of genetic diversity. After transformingthe genetic distance matrix into a distance matrix with ultrametric properties,a maximum likelihood tree was drawn using NTSYS [40].
2.5.3. Breed assignment
The assignment of an anonymous animal i to a set of breeds, r1, . . . rn, wasbased on the maximum likelihood discriminate rule, i.e., animal i was assignedto the population which maximises the conditional probability (P[i|r]). LetP̂r,l,a be the frequency of allele a in the l locus and r breed, then P[i|r] =∏
l h(i, l)P̂r, l, ail1P̂r, l, ail2 , where h(i, l) = 1 if ail1 = ail2 and h(i, l) = 2 if ail1 6=ail2. When one allele was missing in a specific population, we assigned a small,but positive, probability of the allele in this breed
(1/(2n+1)
)where n was the
sample size of the breed [44]. A traditional way of expressing the significanceof a particular result is by using the log of likelihood ratio (LOD). If the interestis to classify an anonymous sample in one of two possible populations, it isnecessary to determine the distribution of the appropriate statistic under the nullhypothesis (H0) by bootstrap or by simulating allele frequencies. Given thatit is not possible to directly determine the LOD distribution when many lociare used, we simulated 100 000 genotypes per breed using allele frequenciesaccording to the assumptions of Hardy-Weinberg and linkage equilibrium. Thefrequency at which each animal was correctly assigned to its breed providedthe probability of assignment, and the distribution of the LODs for pairs ofbreeds, or populations, allowed for the construction of confidence thresholds.
3. RESULTS
3.1. Variation within, and among, populations
A total of 173 distinct alleles were detected across the 16 loci analysed. Themean number of alleles (MNA) per locus per breed was 6.5 (Tab. I).
Observed and expected heterozygosities per breed ranged from 0.54(Pirenaica) to 0.72 (Barrosã), and from 0.61 (Aubrac) to 0.71 (Asturiana deMontaña, Barrosã, Morucha and Sayaguesa) respectively (Tab. I).
Genetic diversity of local beef cattle breeds 319
Levels of apparent breed differentiation were considerable with multilocusFST values indicating that around 7% of the total genetic variation correspon-ded to differences between breeds while the remaining 93% corresponded todifferences among individuals.
Table III presents FST values when breeds were considered in pairs. Geneticdifferentiation values among breeds ranged from 3% for the Aubrac-Salerspair to 15% for the Mirandesa-Tudanca pair. All values were different from 0(P < 0.01). Values above the diagonal in Table III represent the number ofindividuals between populations exchanged per generation (Nm, where N isthe total effective number of animals and m the migration rate) which balancedthe diversifying effect of the genetic drift.
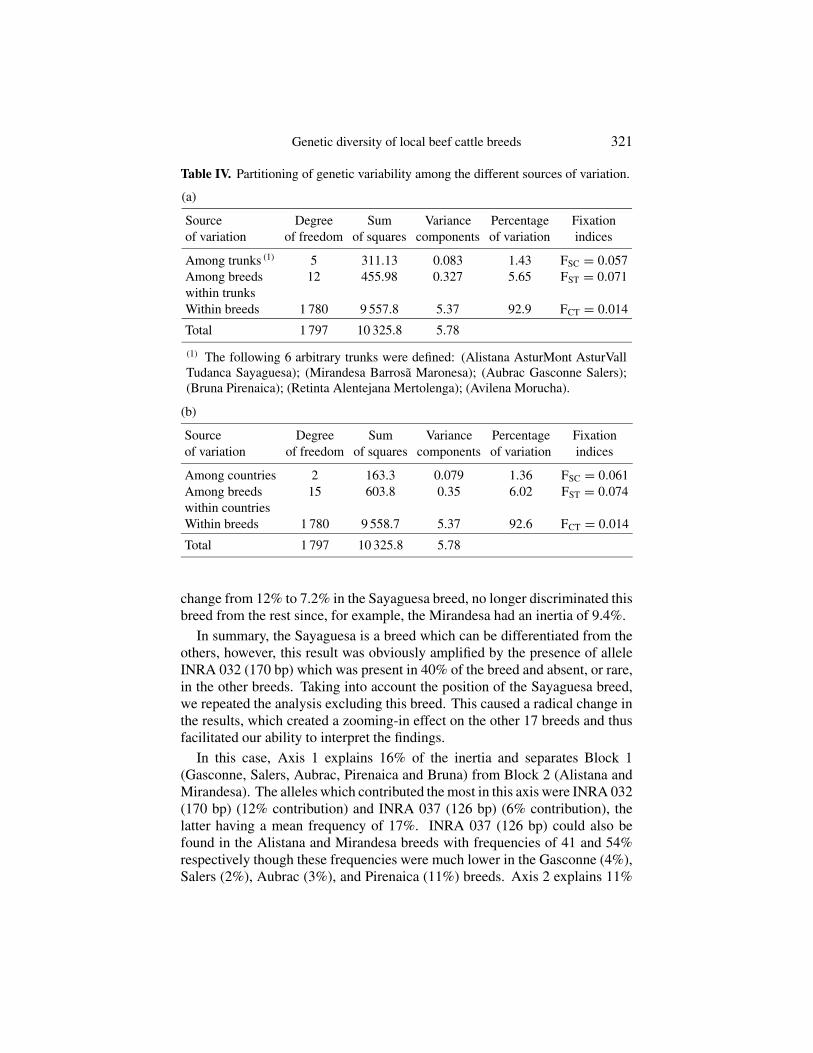
The AMOVA analysis permitted the partitioning of the genetic variabilitybetween different sources of variation – hypothetical trunks, or countries –and breeds were the main factors in the analysis carried out in this study.Results of the analysis of variance are shown in Table IV. Clearly, variability(excluding individual variability) was taken into account when looking at thebreed factor leaving a low, yet significant, genetic variability (< 1.5%) at thetrunk (Tab. IVa), or country level (Tab. IVb). Less than 1.5 per cent of the totalgenetic differences detected was due to the hypothetical trunk (1.43) or to thecountry of origin (1.36) to which the breeds were assigned.
3.2. Correspondence Analysis
The first two axes contribute 14% and 13% of the total inertia respectively(Fig. 1). The Sayaguesa breed was isolated from the others and represents12% of the total inertia respective to the other 18 breeds. Axis 1 separates theMirandesa and Alistana breeds as well but shows no special proximity betweenthe two. Axis 2 separates two blocks: block I (Gasconne, Salers, Aubrac,Bruna) and Block II (Mirandesa, Alistana, Sayaguesa).
The most important alleles are INRA 032 (170 bp) which contributes 17%in Axis 1 and 9% in Axis 2, and ETH 3 (109 bp) which contributes 8% and6% in Axis 1 and 2, respectively. Allele INRA 032 (170 bp) is a nearly uniquecharacteristic of the Sayaguesa breed with a frequency of 40% that was absentin the other breeds except the Gasconne and Salers (4% and 1%, respectively).Although this allele appeared in only 9% of the entire breed population studied,allele ETH 3 (109 bp) can be closely associated with the Alistana and Mirandesabreeds which demonstrated a 34% and 58% frequency, respectively.
Observing the importance of allele INRA 032 (170 bp), the analysis wasrepeated excluding this microsatellite, enabling us to detect a change in the axes– a 15% change in the first axis separating the Alistana and Mirandesa from theother breeds and an 11% change in the second axis separating the Sayaguesafrom the others. It became clear at this point that inertia, explained by the

320 J. Cañón et al.
Tabl
eII
I.F
STes
timat
es(b
elow
diag
onal
)as
am
easu
reof
gene
ticdi
stan
cebe
twee
nbo
vine
bree
dsan
dth
enu
mbe
rof
effe
ctiv
em
igra
nts
per
gene
ratio
n(N
m)
(abo
vedi
agon
al)
inba
lanc
ew
ithge
netic
drif
t
( F ST=
1
4Nm+
1
)(W
righ
t[55
]).
Alistana
AsturMont
AsturVall
Sayaguesa
Tudanca
Alentejana
Barrosa
Maronesa
Mertolenga
Mirandesa
Aubrac
Gasconne
Salers
Avilena
Bruna
Morucha
Pirenaica
Retinta
Alis
tana
4.7
4.3
2.6
2.9
3.5
3.6
3.1
3.5
4.3
2.4
2.9
2.6
4.1
3.8
3.4
3.1
3.7
Ast
urM
ont
0.05
027.
53.
84.
05.
16.
15.
75.
42.
63.
55.
74.
04.
54.
76.
74.
18.
6A
stur
Val
l0.
0546
0.03
213.
23.
45.
04.
13.
84.
72.
43.
24.
94.
15.
15.
76.
65.
15.
5Sa
yagu
esa
0.08
630.
0621
0.07
273.
22.
13.
53.
02.
61.
72.
32.
82.
33.
12.
63.
02.
03.
8T
udan
ca0.
0803
0.05
870.
0680
0.07
182.
53.
82.
92.
61.
42.
53.
22.
53.
23.
24.
32.
33.
5A
lent
ejan
a0.
0659
0.04
650.
0481
0.10
530.
0909
4.1
3.6
6.2
2.3
2.4
3.0
2.4
4.2
3.3
5.0
3.1
4.9
Bar
rosa
0.06
490.
0394
0.05
790.
0668
0.06
120.
0575
5.3
5.6
2.2
2.3
3.5
2.3
3.7
3.4
5.3
2.6
4.6
Mar
ones
a0.
0746
0.04
210.
0613
0.07
780.
0787
0.06
520.
0450
4.1
2.0
2.4
3.4
3.0
3.3
3.0
4.0
2.8
4.8
Mer
tole
nga
0.06
700.
0442
0.05
100.
0862
0.08
750.
0385
0.04
300.
0570
2.5
3.0
3.7
3.2
4.1
3.8
4.9
4.2
6.2
Mir
ande
sa0.
0548
0.08
630.
0959
0.13
110.
1478
0.09
760.
1035
0.11
140.
0901
1.8
2.1
1.8
2.8
1.9
2.1
1.9
2.5
Aub
rac
0.09
570.
0673
0.07
260.
0990
0.08
980.
0930
0.09
840.
0962
0.07
780.
1207
5.7
8.5
4.6
3.2
3.6
3.9
2.9
Gas
conn
e0.
0783
0.04
210.
0490
0.08
220.
0732
0.07
780.
0673
0.06
800.
0635
0.10
620.
0421
5.7
4.3
4.6
5.0
6.2
5.0
Sale
rs0.
0868
0.05
880.
0572
0.09
670.
0912
0.09
390.
0986
0.07
750.
0715
0.12
040.
0286
0.04
214.
14.
03.
94.
23.
4A
vile
na0.
0581
0.05
280.
0470
0.07
580.
0731
0.05
630.
0635
0.06
970.
0577
0.08
290.
0520
0.05
490.
0576
5.1
5.3
3.9
4.4
Bru
na0.
0621
0.05
020.
0422
0.08
890.
0719
0.07
080.
0687
0.07
810.
0615
0.11
590.
0722
0.05
150.
0587
0.04
665.
76.
04.
2M
oruc
ha0.
0694
0.03
600.
0367
0.07
590.
0550
0.04
770.
0449
0.05
940.
0490
0.10
770.
0656
0.04
760.
0608
0.04
530.
0417
3.8
5.0
Pire
naic
a0.
0741
0.05
770.
0468
0.11
000.
0991
0.07
470.
0875
0.08
280.
0564
0.11
840.
0596
0.03
860.
0558
0.06
030.
0398
0.06
164.
0R
etin
ta0.
0639
0.04
340.
0617
0.06
630.
0489
0.05
160.
0494
0.03
860.
0914
0.07
970.
0472
0.06
920.
0542
0.05
650.
0478
0.05
930.
0670
Genetic diversity of local beef cattle breeds 321
Table IV. Partitioning of genetic variability among the different sources of variation.
(a)
Source Degree Sum Variance Percentage Fixationof variation of freedom of squares components of variation indices
Among trunks (1) 5 311.13 0.083 1.43 FSC = 0.057Among breeds 12 455.98 0.327 5.65 FST = 0.071within trunksWithin breeds 1 780 9 557.8 5.37 92.9 FCT = 0.014
Total 1 797 10 325.8 5.78
(1) The following 6 arbitrary trunks were defined: (Alistana AsturMont AsturVallTudanca Sayaguesa); (Mirandesa Barrosã Maronesa); (Aubrac Gasconne Salers);(Bruna Pirenaica); (Retinta Alentejana Mertolenga); (Avilena Morucha).
(b)
Source Degree Sum Variance Percentage Fixationof variation of freedom of squares components of variation indices
Among countries 2 163.3 0.079 1.36 FSC = 0.061Among breeds 15 603.8 0.35 6.02 FST = 0.074within countriesWithin breeds 1 780 9 558.7 5.37 92.6 FCT = 0.014
Total 1 797 10 325.8 5.78
change from 12% to 7.2% in the Sayaguesa breed, no longer discriminated thisbreed from the rest since, for example, the Mirandesa had an inertia of 9.4%.
In summary, the Sayaguesa is a breed which can be differentiated from theothers, however, this result was obviously amplified by the presence of alleleINRA 032 (170 bp) which was present in 40% of the breed and absent, or rare,in the other breeds. Taking into account the position of the Sayaguesa breed,we repeated the analysis excluding this breed. This caused a radical change inthe results, which created a zooming-in effect on the other 17 breeds and thusfacilitated our ability to interpret the findings.
In this case, Axis 1 explains 16% of the inertia and separates Block 1(Gasconne, Salers, Aubrac, Pirenaica and Bruna) from Block 2 (Alistana andMirandesa). The alleles which contributed the most in this axis were INRA 032(170 bp) (12% contribution) and INRA 037 (126 bp) (6% contribution), thelatter having a mean frequency of 17%. INRA 037 (126 bp) could also befound in the Alistana and Mirandesa breeds with frequencies of 41 and 54%respectively though these frequencies were much lower in the Gasconne (4%),Salers (2%), Aubrac (3%), and Pirenaica (11%) breeds. Axis 2 explains 11%

322 J. Cañón et al.
·
·
· ·
·
·
· ·
·
·
·
·
·
·
·
·
·
·
1st factor (14%)
-0.5 0.0 0.5
-0.2
0..0
0.2
0.4
Sayaguesa
AubracGasconne
Salers
Alistana
Avileña
Pirenaica
Mertolenga
Maronesa
Morucha
AsturVallAsturMon
AlentejanaRetinta
Bruna
Tudanca
Mirandesa
Barrosã
B
3rd
fact
or
(9%
)
··
·
·
·
����� ������� � ���������-0.5 0.0 0.5
-0.6
-0.4
-0.2
0.0
0.2
0.4
Barrosã
Gasconne
BrunaSalers
AubracMorucha
Pirenaica
Tudanca
Retinta
AsturVall
AsturMon
MaronesaMertolenga Avileña
Alentejana
AlistanaMirandesa
Sayaguesa
A
2nd
fact
or
(13 %
)
Figure 1. Correspondence analysis of allele frequencies from 16 microsatellite locityped in eighteen bovine breeds: A) Projection of breeds on axes 1 and 2, B) Projectionof breeds on axes 1 and 3.
of the inertia and separates the Morucha, Tudanca, and Bruna block from theGasconne, Salers, Aubrac and Pirenaica (excluding the Bruna) group. Axis 3explains 10% of the inertia and singles out the Mertolenga, Barrosa, Maronesaand Alentejana block.
Genetic diversity of local beef cattle breeds 323
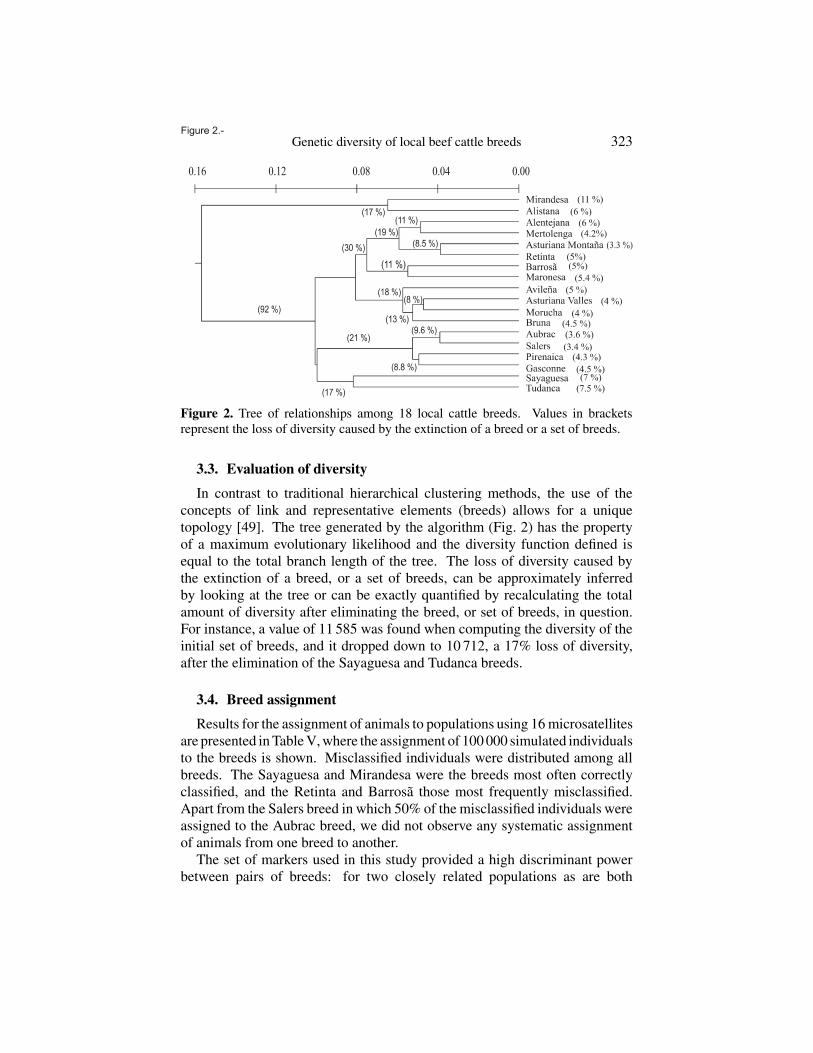
Figure 2. Tree of relationships among 18 local cattle breeds. Values in bracketsrepresent the loss of diversity caused by the extinction of a breed or a set of breeds.
3.3. Evaluation of diversity
In contrast to traditional hierarchical clustering methods, the use of theconcepts of link and representative elements (breeds) allows for a uniquetopology [49]. The tree generated by the algorithm (Fig. 2) has the propertyof a maximum evolutionary likelihood and the diversity function defined isequal to the total branch length of the tree. The loss of diversity caused bythe extinction of a breed, or a set of breeds, can be approximately inferredby looking at the tree or can be exactly quantified by recalculating the totalamount of diversity after eliminating the breed, or set of breeds, in question.For instance, a value of 11 585 was found when computing the diversity of theinitial set of breeds, and it dropped down to 10 712, a 17% loss of diversity,after the elimination of the Sayaguesa and Tudanca breeds.
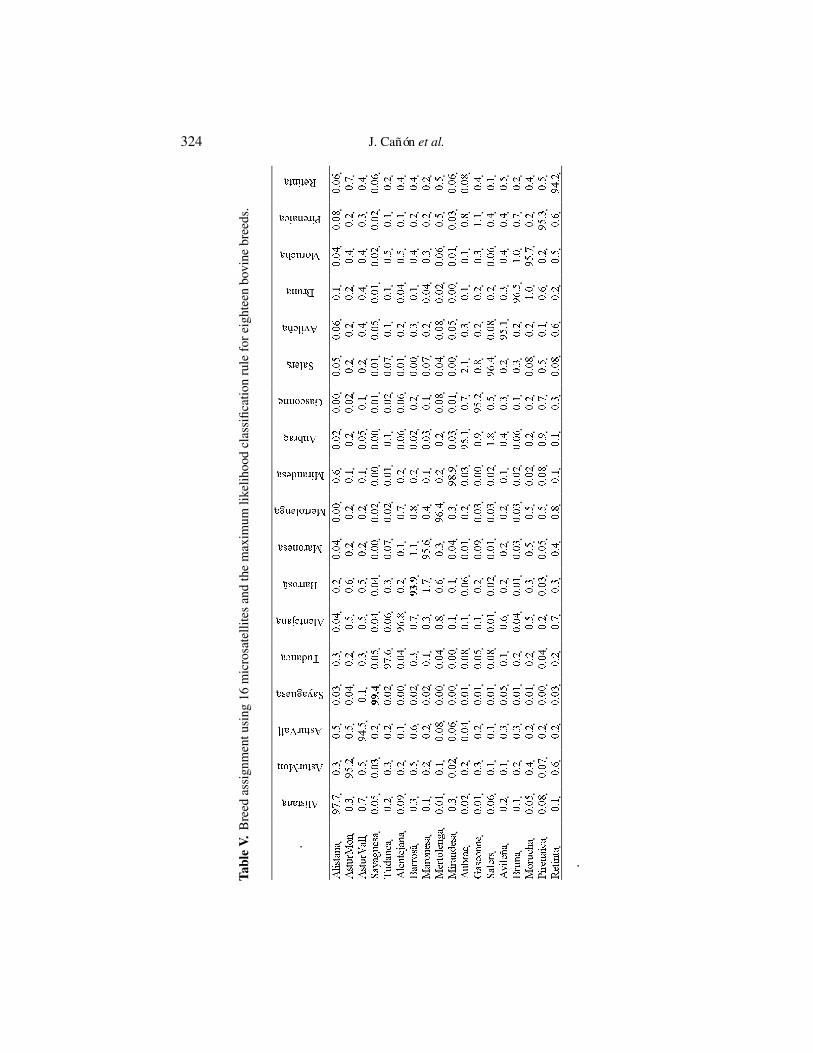
3.4. Breed assignment
Results for the assignment of animals to populations using 16 microsatellitesare presented in Table V, where the assignment of 100 000 simulated individualsto the breeds is shown. Misclassified individuals were distributed among allbreeds. The Sayaguesa and Mirandesa were the breeds most often correctlyclassified, and the Retinta and Barrosã those most frequently misclassified.Apart from the Salers breed in which 50% of the misclassified individuals wereassigned to the Aubrac breed, we did not observe any systematic assignmentof animals from one breed to another.
The set of markers used in this study provided a high discriminant powerbetween pairs of breeds: for two closely related populations as are both
324 J. Cañón et al.
Tabl
eV.
Bre
edas
sign
men
tusi
ng16
mic
rosa
telli
tes
and
the
max
imum
likel
ihoo
dcl
assi
ficat
ion
rule
for
eigh
teen
bovi
nebr
eeds
.
Genetic diversity of local beef cattle breeds 325
Asturiana breeds, only 1.2% of the individuals were misclassified. This canbe interpreted from a classical hypothesis testing point of view; if for a certainanonymous sample the test “H0: the sample is Asturiana de Valles, H1: thesample is Asturiana de Montaña” is carried out and we set a conservativesignificance level (0.01), the power of the test
(1− Pr(type II error)
)is 0.98.
4. DISCUSSION
Assuming that we are working with a neutral polymorphism, three forcesremain that can be used to explain the genetic diversity observed: mutation,genetic drift, and migration. Since mutation is important only when studyinglong periods of time, we accept that the forces to be considered in this sort ofstudy are genetic drift, the source which contributes to diversity, and migra-tion, the opposite force which tends to homogenise the breeds. Reproductiveisolation, a consequence of the local use and management of a breed, reducesthe effective population size and contributes to a genetic subdivision that canbe detected through drift-based measures based on variations observed whenusing the microsatellite loci.
The degree of genetic differentiation among the breeds studied and thehigh levels of significance for the between-population FST estimates indicatea relatively low gene flow between these breeds and, equivalently, a relativelyhigh reproductive isolation. It is also clear that most of the genetic variation isinter-individual and only less than seven percent of the total variation is due tobreed differences.
Migration values (Nm) can be interpreted in the context of the conservationand maintenance of the genetic variability of an animal as the upper limit ofthe number of migrants per generation which would allow for maintenance ofthe genetic differentiation observed between the breeds.
Although ancestral trunks are evident in studies based on morphologicaltraits, e.g. Jordana et al. [21], they are not nearly as apparent when using neutralinformation to assign breeds to clusters such as the Brown trunk (both Asturianbreeds, Alistana, Sayaguesa, Tudanca, etc.), Turdetanus trunk (Pirenaica andBruna), or Iberian trunk (Avileña and Morucha). Results of this study areconfusing since a similar magnitude of differentiation was found among breedswithin a trunk or country (5.7% and 6.1% respectively). FSC and FST aremeasures of the degree of resemblance between individuals within a breed.This resemblance can be interpreted as the differences between individuals indifferent breeds and expressed as the differences between breeds as a proportionof the total genetic variance (FST) or as a proportion of the trunk or countryvariance (FSC). Conversely, the parameter FCT is a measure of the degreeof resemblance between individuals of a trunk, or country, expressed as aproportion of the total variance. The degree of genetic differentiation among
326 J. Cañón et al.
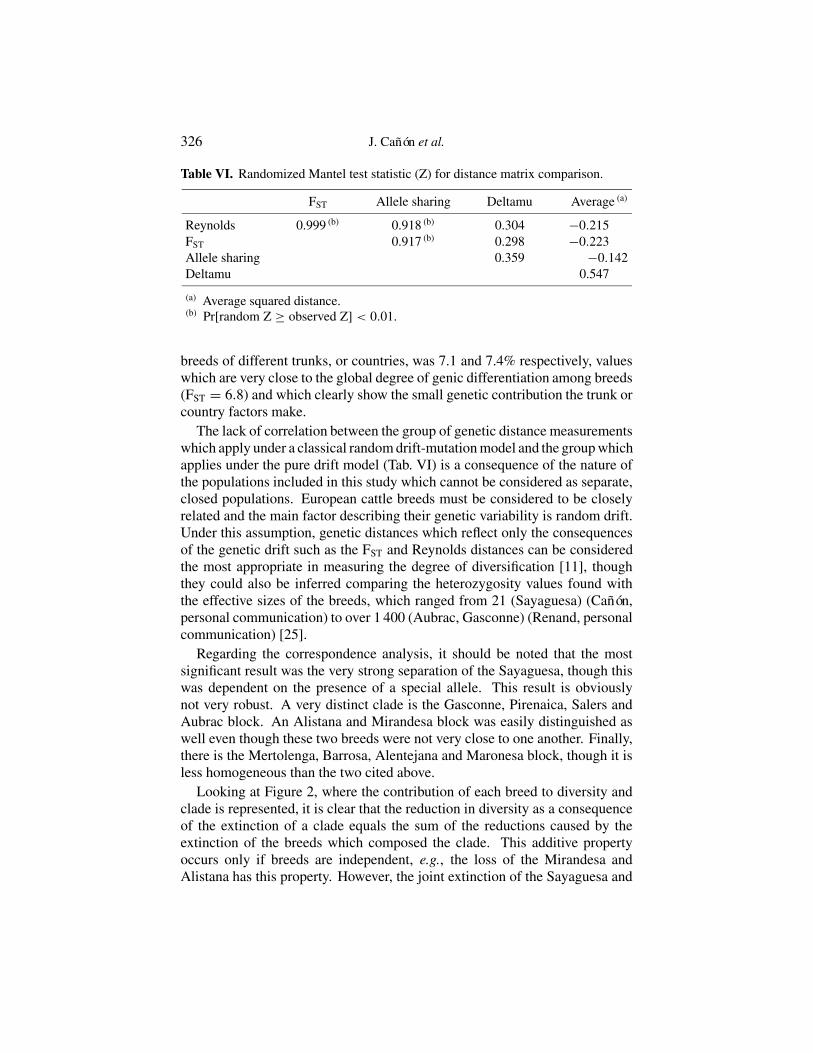
Table VI. Randomized Mantel test statistic (Z) for distance matrix comparison.
FST Allele sharing Deltamu Average (a)
Reynolds 0.999 (b) 0.918 (b) 0.304 −0.215FST 0.917 (b) 0.298 −0.223Allele sharing 0.359 −0.142Deltamu 0.547
(a) Average squared distance.(b) Pr[random Z ≥ observed Z] < 0.01.
breeds of different trunks, or countries, was 7.1 and 7.4% respectively, valueswhich are very close to the global degree of genic differentiation among breeds(FST = 6.8) and which clearly show the small genetic contribution the trunk orcountry factors make.
The lack of correlation between the group of genetic distance measurementswhich apply under a classical random drift-mutation model and the group whichapplies under the pure drift model (Tab. VI) is a consequence of the nature ofthe populations included in this study which cannot be considered as separate,closed populations. European cattle breeds must be considered to be closelyrelated and the main factor describing their genetic variability is random drift.Under this assumption, genetic distances which reflect only the consequencesof the genetic drift such as the FST and Reynolds distances can be consideredthe most appropriate in measuring the degree of diversification [11], thoughthey could also be inferred comparing the heterozygosity values found withthe effective sizes of the breeds, which ranged from 21 (Sayaguesa) (Cañón,personal communication) to over 1 400 (Aubrac, Gasconne) (Renand, personalcommunication) [25].
Regarding the correspondence analysis, it should be noted that the mostsignificant result was the very strong separation of the Sayaguesa, though thiswas dependent on the presence of a special allele. This result is obviouslynot very robust. A very distinct clade is the Gasconne, Pirenaica, Salers andAubrac block. An Alistana and Mirandesa block was easily distinguished aswell even though these two breeds were not very close to one another. Finally,there is the Mertolenga, Barrosa, Alentejana and Maronesa block, though it isless homogeneous than the two cited above.
Looking at Figure 2, where the contribution of each breed to diversity andclade is represented, it is clear that the reduction in diversity as a consequenceof the extinction of a clade equals the sum of the reductions caused by theextinction of the breeds which composed the clade. This additive propertyoccurs only if breeds are independent, e.g., the loss of the Mirandesa andAlistana has this property. However, the joint extinction of the Sayaguesa and
Genetic diversity of local beef cattle breeds 327
Tudanca breeds reduces the total diversity by a greater magnitude than the sumof the two, so they cannot be considered as independent from each other. Aninteresting question is to what extent both procedures, correspondence analysisand the Weitzman approach, give similar results. It must be emphasised thata correspondence analysis exploits within-breed variability while the Weitz-man approach does not. The correlation between the contribution of breedsto diversity, computed by the Weitzman procedure, and the correspondenceanalysis (inertia) when the complete set of 16 markers and INRA 032 wereeliminated, was 0.54 and 0.64 ( p < 0.05), respectively. Moreover, if weconsider the four breeds which contributed the most to diversity, three of them(Mirandesa, Sayaguesa and Alistana) were always present, independently ofthe analysis procedure used.
Two additional considerations with respect to the Weitzman diversity func-tion refer to the caution needed when interpreting the graphical representationas a phylogenetic tree. Indeed it is only a representation of the diversity foundat the current time and the sensitivity of the graphical representation fromthe model used to study the divergence among the breeds. The order of thebreeds appearing in the tree strongly depends on the force (random drift ormutation) considered to be the determinant of the observed diversity. WhenFST and Reynolds genetic distances were used, breeds ranked in a similar order(Spearman correlation = 1.0); however, no rank correlation was found to besignificantly different from 0 between the breed-order computed using formerdistances based on effective population size and the breed-order calculatedusing those genetic distances which are based on the size of the alleles. It shouldbe noted that, despite criticism of the Weitzman approach [49], it continuesto be a valid method of determining priorities for conservation investments,if we know the relationships of breeds to each other, the survival probabilitydistribution functions and the costs of improving breed survival.
A different argument showing that hypervariable microsatellites with a highlevel of heterozygosity and a large number of alleles, provide an efficientway of evaluating genetic diversity between the bovine breeds considered,can be demonstrated by observing their statistical power for breed-affiliationestimation. The results presented in Table V demonstrate the possibility ofassigning breedidentities to anonymous bovine samples as has been previouslyshown in equines [9], cattle [29], sheep [8] and humans [44]. These molecularmarkers provide a powerful tool for measuring the genetic differentiationbetween breeds of domestic species.
5. CONCLUSIONS
The main objective of conservation genetics is to preserve variability withinpopulations under the hypothesis of correlation between genetic variation and
328 J. Cañón et al.
population viability. Avoidance of inbreeding has often been considered assynonymous with heterozygosity maintenance. Heterozygosity is retainedthrough the maximisation of the inbreeding effective size, which primarilydepends on the parental generation size. In populations with known pedigrees,as is the case in this study, maximising effective size while ignoring the ancestryof each individual may not be the most effective strategy for maintaininggenetic diversity. Instead, a strategy that utilises all pedigree informationwould better serve to preserve genetic variation. Unfortunately, many of thelocal breeds included in this study have incomplete pedigrees and one or bothparents of some individuals are unknown. In this context, the application ofmolecular information can solve some of the uncertainties since it is useful whenidentifying pedigree relationships and the genetically most important animals inorder to maximise founder genome equivalents. Moreover, although additionalinformation on productive, morphological, and fitness-related traits should betaken into account when ranking breeds for preservation purposes, strategiesbased on neutral markers can be efficient in maximising the retention of thehighest number of neutral and non-neutral alleles in small populations [1].
This study contributes to the knowledge of the genetic diversity acrossdifferent countries and to the molecular characterisation of limited-size pop-ulations, many of which are under threat of extinction. It also shows howmicrosatellites can be used to construct an appropriate measure of diversityfunction through the genetic relationships between populations. Additionally,the present study provides reasonable statistical power for breed assignmentregardless of whether breeds are closely related or not. These issues allow forfuture management of the breeds to be based on greater knowledge of theirgenetic structuring and the relationships between their populations.
ACKNOWLEDGEMENTS
This study received the financial support of the EC DGVI FII.3 (contractFAIR1 CT95 0702). Additional support was provided by CICYT (contractAGF96–1950-CE/95). Blood samples from the Sayaguesa and Alistana breedswere provided by E. Matorra and J.E. Yanes, and from the Tudanca breedby R. Sainz. We would also like to thank ASEAVA, ASEAMO, UNIONAUBRAC, UPRA SALERS, UPRA GASCONNE and Alain Havy from theInstitut de l’Élevage for their help in blood sampling.
REFERENCES
[1] Bataillon T.M., David J.L., Schoen D.J., Neutral genetic markers and conserva-tion genetics: simulated germplasm collections, Genetics 144 (1996) 409–417.
Genetic diversity of local beef cattle breeds 329
[2] Bassam B.J., Caetano-Anolles G., Gresshoff P.M., Fast and sensitive silverstaining of DNA in polyacrylamide gels, Anal. Biochem. 196 (1991) 80–83.
[3] Benzécri J.P., Analyse des données. Tome 2: Analyse des correspondances,Dunod, Paris, 1973.
[4] Blott S.C., Williams J.L., Haley C.S., Genetic relationships among Europeancattle breeds, Anim. Genet. 29 (1998) 273–282.
[5] Bowcock A.M., Ruiz-Linares A., Tomforhde J., Minch E., Kidd J.R., Cavalli-Sforza L.L., High resolution of human evolutionary trees with polymorphicmicrosatellites, Nature 368 (1994) 455–457.
[6] Bradley D.G., Machugh D.E., Loftus R.T., Sow R.S., Hoste C.H., CunninghamE.P., Zebu-taurine variation in Y chromosomal DNA: a sensitive assay for geneticintrogression in west African trypanotolerant cattle populations, Anim. Genet.25 (1994) 7–12.
[7] Brezinsky L., Kemp S.J., Womack J., Teale A.J., A panel of bovine microsatellitegenetic markers, in: Proceedings of the XXII Conference on Animal Genetics,1992, Interlakin, Switzerland, International Society for Animal Genetics.
[8] Buchanan F.C., Adams L.J., Littlejohn R.P., Maddox J.F., Crawford A.M.,Determination of evolutionary relationships among sheep breeds usingmicrosatellites, Genomics 22 (1994) 397–403.
[9] Cañon J., Checa M.L., Carleos C., Vega-Pla J.L., Vallejo M., Dunner S., Thegenetic structure of Spanish Celtic horse breeds inferred from microsatellite data,Anim. Genet. 31 (2000) 39–48.
[10] Ciampolini R., Moazami-Goudarzi K., Vaiman D., Dillman C., Mazzanti E.,Foulley J.L., Leveziel H., Cianci D., Individual multilocus genotypes usingmicrosatellite polymorphisms to permit the analysis of the genetic variabilitywithin and between Italian beef cattle breeds, J. Anim. Sci. 73 (1995) 3259–3268.
[11] Eding J.H., Laval G., Measuring genetic uniqueness in livestock, in: J.K. Olden-broek (Ed.), Genebanks and the conservation of farm animal genetic resources,DLO Inst. Anim. Sci. and Health, Leylstad, 1999.
[12] Excoffier L., Smouse P.E., Quattro J.M., Analysis of molecular variance inferredfrom metric distances among DNA haplotypes: Application to human mitochon-drial DNA restriction data, Genetics 131 (1992) 479–491.
[13] Felsenstein J., PHYLIP (Phylogeny Inference Package) Version 3.5c. Departmentof Genetics, University of Eashington, Seattle, 1993.
[14] Fries R., Eggen A., Womack J.E., The bovine genome map, Mamm. Genome 4(1993) 405–28.
[15] Georges M., Massey J., Polymorphic DNA markers in bovidae (World IntellectualProperty Org Geneva), Wo. Publi. N◦ 92/13102, 1992.
[16] Goldstein D.B., Ruiz-Linares A., Cavalli-Sforza L.L., Feldman M.W., An eval-uation of genetic distances for use with microsatellite loci, Genetics 139 (1995)463–471.
[17] Goldstein D.B., Ruiz-Linares A., Cavalli-Sforza L.L., Feldman M.W., Geneticabsolute dating based on microsatellites and the origin of modern humans, Proc.Nat. Acad. Sci. USA. 92 (1995) 6723–6727.
[18] Grosclaude F., Aupetit R.Y., Lefebvre J., Mériaux J.C., Essai d’analyse desrelations génétiques entre les races bovines françaises à l’aide du polymorphismebiochimique, Genet. Sel. Evol. 22 (1990) 317–338.

330 J. Cañón et al.
[19] Guinand B., Use of a multivariate model using allele frequency distributions toanalyse patterns of genetic differentiation among populations, Biol. J. Linn. Soc.58 (1996) 173–195.
[20] Jeanpierre M., A rapid method for purification of DNA from blood, NucleicAcids Res. 15 (1987) 9611.
[21] Jordana J., Pelegrin M., Piedrafita J., Relaciones genéticas en bovinos españolesobtenidas a partir del estudio de caracteres morfológicos, ITEA 87 (1991) 50–64.
[22] Kantanen J., Olsaker I., Adalsteinsson S., Sandberg K., Eythorsdottir E.,Pirhonen K., Holm L.E., Temporal changes in genetic vatriation of North Europencattle breeds, Anim. Genet. 30 (1999) 16–27.
[23] Kaukinen J., Varvio S.L., Eight polymorphic bovine microsatellites, Anim.Genet. 24 (1993) 148.
[24] Laloë D., Moazami-Goudarzi K., Souvenir Zafindrajaona P., Analyse des cor-respondances et biodiversité dans les races domestiques, Société française debiométrie, 20 mai 1999, Grenoble, 5 p.
[25] Laval G., Iannuccelli A., Legault Ch., Milan D., Groenen A.M., Giuffra E.,Andersson L., Nissen P.H., Jorgensen C.B., Beeeckmann P., Geldermann H.,Foulley J.L., Chevalet C., Ollivier L., Genetic diversity of eleven European pigbreeds, Genet. Sel. Evol. 32 (2000) 187–203.
[26] Lebart L., Morineau A., Warwick K, Multivariate Descriptive Statistical Ana-lysis, J. Wiley, New York, 1984.
[27] Loftus R.T., MacHugh D.E., Ngere L.O., Balain D.S., Badi A.M., Bradley D.G.,Cunningham E.P., Mitochondrial genetic variation in European, African an Indiancattle populations, Anim. Genet. 25 (1994) 265–271.
[28] MacHugh D.E., Shriver M.D., Loftus R.T., Cunningham P., Bradley D.G.,Microsatellite DNA variation and the evolution, domestication and phylogeo-graphy of taurine and zebu cattle (Bos taurus and Bos indicus), Genetics 146(1997) 1071–86.
[29] MacHugh D.E., Loftus R.T., Cunningham P., Bradley D.G., Genetic structure ofseven European cattle breeds assessed using 20 microsatellite markers, Anim.Genet. 29 (1998) 333–40.
[30] Mahé M.F., Miranda G., Queval R., Bado A., Souvenir Zafindrajaona P.,Grosclaude F., Genetic polymorphism of milk proteins in African Bos taurusand Bos indicus populations. Characterization of variants αs1-Cn H and β-Cn J,Genet. Sel. Evol. 31 (1999) 239–253.
[31] Manwell C., Baker A.C.M., Biochemical classification of cattle. 2. Phylogenictree and specific status of the zebu, Anim. Blood. Groups. Bioechem. Genet. 11(1980) 151–162.
[32] Martin-Burriel I., Garcia-Muro E., Zaragoza P., Genetic diversity analysis ofsix Spanish native cattle breeds using microsatellites, Anim. Genet. 30 (1999)177–182.
[33] Medjudorc I., Kustermann W., Lazar P., Russ I., Pirchner F., Marker-derivedphylogeny of European cattle supports demic expansion of agriculture, Anim.Genet. 25 Suppl. 1 (1994) 19–27.
[34] Minch E., Ruiz-Linares A., Goldstein D.B., Feldman M.W., Cavalli-Sforza L.L.,MICROSAT (version 1.4): a computer program for calculating various statisticson microsatellite allele data, http://lotka.stanford.edu:microsat.html, 1995.
Genetic diversity of local beef cattle breeds 331
[35] Moazami-Goudarzi K., Laloë D., Furet J.P., Grosclaude F., Analysis of geneticrelationships between 10 cattle breeds with 17 microsatellites, Anim. Genet. 28(1997) 338–345.
[36] Mommens G., Peelman L.J., Van zeveren A., D’Ieteren G., Wissocq N.,Microsatellite variation between an African and five European taurine breedsresults in a geographical phylogenetic tree with a bison outgroup, J. Anim.Breed. Genet. 116 (1999) 325–330.
[37] Nijman I.J., Bradley D.G., Hanotte O., Otsen M., Lenstra J.A., Satellite DNApolymorphisms and AFLP correlate with Bos indicus-taurus hybridization,Anim. Genet. 30 (1999) 265–273.
[38] Queval R., Moazami-Goudarzi K., Laloë D., Mériaux J.C., Grosclaude F., Rela-tions génétiques entre populations de taurins ou zébus d’Afrique de l’Ouest ettaurins européens, Genet. Sel. Evol. 30 (1998) 367–383.
[39] Reynolds J., Weir B.S., Cockerham C.C., Estimation of the coancestry coefficient:Basis for a short-term genetic distance, Genetics 105 (1983) 767–79.
[40] Rohlf F.J., NTSYS-pc: Numercial Taxonomy and Multivariate Analysis System,Exeter Software, Heritage Lane, Setauket, New York, 1988.
[41] Sambrook J., Fritsch E.F., Maniatis T., Molecular Cloning: a Laboratory Manual,2nd ed., Cold Spring Harbor, Cold Spring Harbor Laboratory Press, NY, 1989.
[42] Schmid M., Saitbekova N., Gaillard C., Dolf G., Genetic diversity in Swiss cattlebreeds, J. Anim. Breed. Genet. 116 (1999) 1–8.
[43] Schneider S., Kueffer J.M, Roessli D., Excoffier L., Arlequin ver 1.1: A soft-ware for population genetic data analysis, Genetics and Biometry Laboratory,University of Geneva, 1997.
[44] Shriver M.D., Smith M.W., Jin L., Marcini A., Akey J.M., Deka R., Ferrell R.E.,Ethnic-Affiliation Estimation by use of population-specific DNA markers, Am.J. Hum. Genet. 60 (1997) 957–964.
[45] Souvenir Zafindrajaona P., Zeuh V., Moazami-Goudarzi K., Laloë D., BourzatD., Idriss A., Grosclaude F., Étude du statut phylogénétique du bovin Kouri dulac Tchad à l’aide de marqueurs moléculaires, Rev. Elev. Méd. Vét. Pays Trop.52 (1999) 155–162.
[46] Steffen P., Eggen A., Dietz A.B., Womack J.E., Stranzinger G., Fries R., Isolationand mapping of polymorphic microsatellites in cattle, Anim. Genet. 24 (1993)121–124.
[47] Swofford D.L., Selander R.B., BIOSYS-1. A computer program for the ana-lysis of allelic variation in population genetics and biochemical systematics(Release 1.7), University of Illinois, Urbana, Champaign, 1989.
[48] Takezaki N., Nei M., Genetic distances and reconstruction of phylogenetic treesfrom microsatellite DNA, Genetics 144 (1996) 389–399.
[49] Thaon d’Arnoldi C., Foulley J.L., Ollivier L., An overview of the Weitzmanapproach to diversity, Genet. Sel. Evol. 30 (1998) 149–161.
[50] Vaiman D., Osta R., Merci D., Grohs C., Leveziel H., Characterization of fivenew bovine dinucleotide repeats, Anim. Genet. 23 (1992) 537–541.
[51] Vaiman D., Mercier D., Moazami-Goudarzi K., Eggen A., Ciampolini R.,Lépingle A., Velmala R., Kaukinen J., Varvio S.L., Martin P., Levéziel H.,Guérin G., A set of 99 cattle microsatellites: characterization, synteny mapping,and polymorphism, Mamm. Genome 5 (1994) 288–297.
332 J. Cañón et al.
[52] Weir B.S., Genetic Data Analysis, Sinauer Associates, Sunderland, Massachu-setts, 1990.
[53] Weitzman M., On diversity, Quart. J. Econ. 107 (1992) 363–405.[54] Weitzman M., What to preserve? An application of diversity theory to crane
conservation, Quart. J. Econ. 108 (1993) 157–183.[55] Wright S., The interpretation of population structure by F-statistics with special
regard to systems of mating, Evolution 19 (1965) 395–420.
To access this journal on line:www.edpsciences.org
Related Documents