Research Article Genetic diversity in Napier grass (Pennisetum purpureum) cultivars: implications for breeding and conservation Bramwel W. Wanjala 1,2,3 * , Meshack Obonyo 2 , Francis N. Wachira 2,7 , Alice Muchugi 4 , Margaret Mulaa 5 , Jagger Harvey 3 , Robert A. Skilton 3 , Janice Proud 6 and Jean Hanson 6 1 Biotechnology and Biodiversity, Kenya Agricultural Research Institute, PO Box 14733, Nairobi 00800, Kenya 2 Biochemistry and Molecular Biology Department, Egerton University, PO Box 563, Egerton 20115, Kenya 3 Biosciences Eastern and Central Africa (BecA) at ILRI Hub, PO Box 30709, Nairobi 00100, Kenya 4 International Centre for Research in Agroforestry, World Agroforestry Centre, United Nations Avenue, Gigiri, PO Box 30677, Nairobi 00100, Kenya 5 Kenya Agricultural Research Institute, PO Box 450, Kitale 30200, Kenya 6 International Livestock Research Institute (ILRI), PO Box 5689, Addis Ababa, Ethiopia 7 Present address: Association for Strengthening Agricultural Research in Eastern and Central Africa, PO Box 765, Entebbe, Uganda Received: 30 October 2012; Accepted: 11 March 2013; Published: 27 March 2013 Citation: Wanjala BW, Obonyo M, Wachira FN, Muchugi A, Mulaa M, Harvey J, Skilton RA, Proud J, Hanson J. 2013. Genetic diversity in Napier grass (Pennisetum purpureum) cultivars: implications for breeding and conservation. AoB PLANTS 5: plt022; doi:10.1093/ aobpla/plt022 Abstract. Napier grass is an important forage crop for dairy production in the tropics; as such, its existing genetic diversity needs to be assessed for conservation. The current study assessed the genetic variation of Napier grass col- lections from selected regions in Eastern Africa and the International Livestock Research Institute Forage Germplasm- Ethiopia. The diversity of 281 cultivars was investigated using five selective amplified fragment length polymorphism (AFLP) markers and classical population genetic parameters analysed using various software. The number of bands generated was 216 with fragments per primer set ranging from 50 to 115. Mean percentage polymorphic loci was 63.40. Genetic diversity coefficients based on Nei’s genetic diversity ranged from 0.0783 to 0.2142 and Shannon’s in- formation index ranged from 0.1293 to 0.3445. The Fst value obtained was moderately significant (Fst ¼ 0.1688). Neighbour-joining analysis gave two distinct clusters which did not reflect geographical locations. Analysis of molecu- lar variance showed all variance components to be highly significant (P , 0.001), indicating more variation within (91 %) than between populations (9 %). Results suggested moderate genetic differentiation among Napier grass popu- lations sampled, which could imply a high germplasm exchange within the region. The AFLP markers used in this study efficiently discriminate among cultivars and could be useful in identification and germplasm conservation. Keywords: AFLP; conservation; cultivars; genetic diversity; germplasm; Napier grass. Introduction In East Africa, Napier grass (Pennisetum purpureum) is a perennial grass grown widely as a fodder crop and feed for the cut-and-carry zero-grazing dairy systems (Bayer 1990) and constitutes up to 80 % of forage for smallholder dairy farms (Staal et al. 1987). It is the forage of choice not only in the tropics but also worldwide (Hanna et al. 2004) due to its desirable traits such as tolerance to drought and a wide range of soil conditions, and high photosynthet- ic and water-use efficiency (Anderson et al. 2008). While much attention has been directed towards research for improving the productivity of major cereal * Corresponding author’s e-mail address: [email protected] Published by Oxford University Press on behalf of the Annals of Botany Company. This is an Open Access article distributed under the terms of the Creative Commons Attribution License (http://creativecommons.org/licenses/by/3.0/), which permits unrestricted use, distribution, and reproduction in any medium, provided the original work is properly cited. AoB PLANTS www.aobplants.oxfordjournals.org & The Authors 2013 1 by guest on May 22, 2013 http://aobpla.oxfordjournals.org/ Downloaded from

Welcome message from author
This document is posted to help you gain knowledge. Please leave a comment to let me know what you think about it! Share it to your friends and learn new things together.
Transcript
Research Article
Genetic diversity in Napier grass (Pennisetum purpureum)cultivars: implications for breeding and conservationBramwel W. Wanjala1,2,3*, Meshack Obonyo2, Francis N. Wachira2,7, Alice Muchugi4, Margaret Mulaa5,Jagger Harvey3, Robert A. Skilton3, Janice Proud6 and Jean Hanson6
1 Biotechnology and Biodiversity, Kenya Agricultural Research Institute, PO Box 14733, Nairobi 00800, Kenya2 Biochemistry and Molecular Biology Department, Egerton University, PO Box 563, Egerton 20115, Kenya3 Biosciences Eastern and Central Africa (BecA) at ILRI Hub, PO Box 30709, Nairobi 00100, Kenya4 International Centre for Research in Agroforestry, World Agroforestry Centre, United Nations Avenue, Gigiri, PO Box 30677,Nairobi 00100, Kenya5 Kenya Agricultural Research Institute, PO Box 450, Kitale 30200, Kenya6 International Livestock Research Institute (ILRI), PO Box 5689, Addis Ababa, Ethiopia7 Present address: Association for Strengthening Agricultural Research in Eastern and Central Africa, PO Box 765, Entebbe, Uganda
Received: 30 October 2012; Accepted: 11 March 2013; Published: 27 March 2013
Citation: Wanjala BW, Obonyo M, Wachira FN, Muchugi A, Mulaa M, Harvey J, Skilton RA, Proud J, Hanson J. 2013. Genetic diversity inNapier grass (Pennisetum purpureum) cultivars: implications for breeding and conservation. AoB PLANTS 5: plt022; doi:10.1093/aobpla/plt022
Abstract. Napier grass is an important forage crop for dairy production in the tropics; as such, its existing geneticdiversity needs to be assessed for conservation. The current study assessed the genetic variation of Napier grass col-lections from selected regions in Eastern Africa and the International Livestock Research Institute Forage Germplasm-Ethiopia. The diversity of 281 cultivars was investigated using five selective amplified fragment length polymorphism(AFLP) markers and classical population genetic parameters analysed using various software. The number of bandsgenerated was 216 with fragments per primer set ranging from 50 to 115. Mean percentage polymorphic loci was63.40. Genetic diversity coefficients based on Nei’s genetic diversity ranged from 0.0783 to 0.2142 and Shannon’s in-formation index ranged from 0.1293 to 0.3445. The Fst value obtained was moderately significant (Fst ¼ 0.1688).Neighbour-joining analysis gave two distinct clusters which did not reflect geographical locations. Analysis of molecu-lar variance showed all variance components to be highly significant (P , 0.001), indicating more variation within(91 %) than between populations (9 %). Results suggested moderate genetic differentiation among Napier grass popu-lations sampled, which could imply a high germplasm exchange within the region. The AFLP markers used in this studyefficiently discriminate among cultivars and could be useful in identification and germplasm conservation.
Keywords: AFLP; conservation; cultivars; genetic diversity; germplasm; Napier grass.
IntroductionIn East Africa, Napier grass (Pennisetum purpureum) is aperennial grass grown widely as a fodder crop and feedfor the cut-and-carry zero-grazing dairy systems (Bayer1990) and constitutes up to 80 % of forage for smallholderdairy farms (Staal et al. 1987). It is the forage of choice not
only in the tropics but also worldwide (Hanna et al. 2004)due to its desirable traits such as tolerance to droughtand a wide range of soil conditions, and high photosynthet-ic and water-use efficiency (Anderson et al. 2008).
While much attention has been directed towardsresearch for improving the productivity of major cereal
* Corresponding author’s e-mail address: [email protected]
Published by Oxford University Press on behalf of the Annals of Botany Company. This is an Open Access article distributed under theterms of the Creative Commons Attribution License (http://creativecommons.org/licenses/by/3.0/), which permits unrestricted use,distribution, and reproduction in any medium, provided the original work is properly cited.
AoB PLANTS www.aobplants.oxfordjournals.org & The Authors 2013 1
by guest on May 22, 2013
http://aobpla.oxfordjournals.org/D
ownloaded from
crops (Katz 2003), there has been comparatively littleeffort to improve Napier grass—an important foragecrop that has been grown over centuries and currentlyenjoys a multiplicity of uses besides conventionalanimal consumption (Jaradat 2010). This is key amongthe drivers of renewed research interest in this otherwisepreviously neglected crop. However, the productivity ofNapier grass is limited by several factors especially emer-ging diseases, mainly Napier grass stunt disease andNapier grass head smut disease, which constrains thegrowth of the smallholder dairy industry (New Agricultur-ists 2009). For this reason, it is necessary to strengthenforage breeding programmes for the development ofdisease-resistant cultivars (Boa et al. 2005).
Correct identification of Napier grass accessions is a pre-requisite because the existing germplasm information isscanty and cannot be relied upon for crop improvement,since cultivar discrimination has predominantly relied onmorphological and agronomic features and is the majorcause of inconsistency in identification. Consequently, anumber of Napier grass cultivars have been in circulation,often with more than one name (Struwig 2007).
Molecular markers have proven useful in distinguishingamong morphologically related individuals within culti-vars of the same plant species (Mohammadi andPrasanna 2003). Thus the genetic assessment of variousNapier grass accessions from the Eastern Africa regionis important for correct cultivar identification in order toexploit them fully in crop improvement strategies.
However, in genetic diversity studies, a wide range ofmarker systems require development in order to beused either singly or in combination, depending onthe researcher’s interest. Thus, most markers havesome degree of shortcomings, which include: (i) restric-tion fragment length polymorphisms (RFLPs) are timeconsuming and involve expensive radioactive materials(Mondini et al. 2009), (ii) random amplified polymorphicDNAs (RAPDs) are irreproducible (Bardakci 2001), (iii)isozyme systems are few per species, (iv) amplified frag-ment length polymorphism (AFLP) band profiles cannotbe interpreted in terms of loci, alleles and their domin-ance (Spooner et al. 2005), and (v) there is a lack ofsimple sequence repeats (SSRs) for Napier grass(Azevedo et al. 2012). Thus, due to a large number ofloci analysed, high polymorphism levels, amenability toautomation, high reproducibility without prior sequenceknowledge and genome-wide marker distribution(Powell et al. 1996), the AFLP method (Vos et al. 1995)is considered more reliable and robust for an evaluationof genetic variability.
This study assessed the genetic variation betweenand within Napier grass collections comprising 281accessions from selected regions in Eastern Africa
(Kenya, Uganda, Tanzania and International LivestockResearch Institute Forage Germplasm-Ethiopia). Impli-cations of the findings for germplasm identification,breeding and conservation are discussed.
Methods
Source of cultivars
Cultivars were collected from selected regions in Kenya,Uganda and Tanzania between 2009 and 2010. Alsoincluded was a collection from the International Live-stock Research Institute Forage Germplasm (ILRI-FG)which comprised cultivars from other parts of Africa,USA and accessions of unknown origin. The ILRI-FGwas established in 1982 and has been maintainedwithout external infusion (Table 1). Samples wereselected based on morphological differences and col-lected from different regions with a range of ecologicaland altitudinal variations. They were then evaluated fornutritive parameters and biomass forage yield comparedwith the best local clone at 8 weeks post-harvest inter-vals. From the 281 clones, 3 young leaves without necro-sis were collected and placed in a transparent polythenebag. Holes were punched to permit air flow. Samples weredried by placing them in a large plastic bag with silica. Thesilica gel was changed daily until samples were complete-ly dry. The dried samples were then packaged in largepolythene bags (without holes to prevent rehydration)and sent to the Biosciences east and central Africa(BecA)-ILRI Hub, Nairobi for analysis.
DNA extraction
Genomic DNA was extracted following the cetyltrimethyl-ammonium bromide (CTAB) method (Doyle and Doyle1987) with some modifications. Dried leaves of �200–300 mg were cut into small pieces and transferred into1.2-mL strip tubes containing two stainless steel grind-ing balls. Strip tubes were then cooled by immersing inliquid nitrogen. The frozen leaves were subsequentlyground into fine powder using GenoGrinder-2000 at aspeed of 500 strokes min21 for 10 min. Strip tubeswere centrifuged at 1000 rpm for 1 min to allow collec-tion of the ground tissue at the bottom. Warm CTABbuffer (700 mL; 65 8C) (2 % CTAB, 100 mM Tris–HCl pH8.0, 1.4 M NaCl, 20 mM EDTA, 2 % polyvinylpyrrolidone(PVP)) was added and the samples homogenized for1 min by re-grinding in a GenoGrinder. Samples wereincubated in a water bath at 65 8C for an hour with con-tinuous shaking and mixing by inversion of strip tubes(every 15 min). Tubes were then removed from thewater bath and left to cool at room temperature for10 min, followed by centrifugation at 4000 rpm for20 min. The aqueous layer was transferred into fresh
2 AoB PLANTS www.aobplants.oxfordjournals.org & The Authors 2013
Wanjala et al. — Genetic diversity in Napier grass cultivars
by guest on May 22, 2013
http://aobpla.oxfordjournals.org/D
ownloaded from
strip tubes. Chloroform : isoamyl alcohol (24 : 1; 600 mL)was added and the contents mixed by gently invertingthe tubes 10 times. Centrifugation was carried out at4000 rpm for 20 min and the aqueous (top) layer trans-ferred into a fresh strip tube. The above step wasrepeated twice and the aqueous layer transferred intofresh strip tubes. Ice-cold absolute ethanol : sodiumacetate (25 : 1; 600 mL) was added gently and mixed byinversion, and a sample incubated at 220 8C for45 min. DNA was pelleted by centrifugation at4000 rpm for 20 min. The supernatant was removed;the pellet was washed with 500 mL of 70 % ethanoland left to stand for 5 min, then washed twice. TheDNA pellet was air dried for 20 min, then dissolved in100 mL of low-salt TE buffer (10 mM Tris–HCl pH 7.5,1 mM EDTA). To free the DNA of RNA, 5 mL of ribonucle-ase A (RNase A), 10 mg/mL, were added and incubatedat 37 8C for 30 min. DNA was re-precipitated by adding200 mL of cold absolute ethanol and incubated at220 8C for 30 min. DNA was pelleted by centrifuging at4000 rpm for 20 min and washed with 70 % ethanol
twice. The pellet was air dried for 30–60 min and resus-pended in 100 mL of low-salt TE buffer.
AFLP analysis
The AFLP protocol described by Vos et al. (1995) wasemployed. Sixty-four primer pairs were initially screenedfor their potential to produce scorable fragments(Applied Biosystems, Foster City, CA, USA). From 64primer pairs, five were chosen based on their reproduci-bility and levels of fragment polymorphism (Table 2).
. . . . . . . . . . . . . . . . . . . . . . . . . . . . . . . . . . . . . . . . . . . . . . . . . . . . . . . . . . . . . . . . . . . . . . . . . . . . . . . . . .
Table 2. Selected selective AFLP primer combinations.
Primer no. EcoRI primer MseI primer Dye Colour
1 EcoRI + AAC MseI + CAT NED Yellow
2 EcoRI + ACC MseI + CAA NED Yellow
3 EcoRI + ACT MseI + CAG 6-FAM Blue
4 EcoRI + ACT MseI + CAT 6-FAM Blue
5 EcoRI + AGG MseI + CAC JOE Green
. . . . . . . . . . . . . . . . . . . . . . . . . . . . . . . . . . . . . . . . . . . . . . . . . . . . . . . . . . . . . . . . . . . . . . . . . . . . . . . . . . . . . . . . . . . . . . . . . . . . . . . . . . . . . . . . . . . . . . . . . . . . . . . . . . . . . . . . . . . . . . . . . . . . . . . . . . . . . . . . . . . . . . . . . . . .
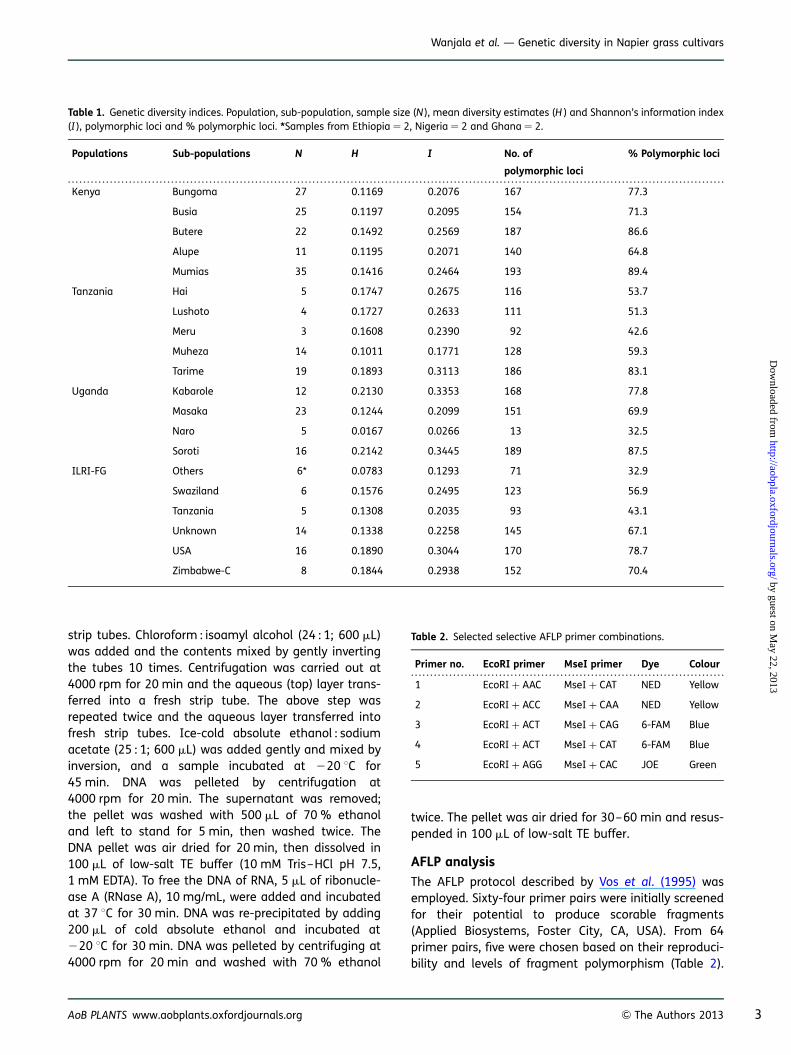
Table 1. Genetic diversity indices. Population, sub-population, sample size (N ), mean diversity estimates (H ) and Shannon’s information index(I ), polymorphic loci and % polymorphic loci. *Samples from Ethiopia ¼ 2, Nigeria ¼ 2 and Ghana ¼ 2.
Populations Sub-populations N H I No. of
polymorphic loci
% Polymorphic loci
Kenya Bungoma 27 0.1169 0.2076 167 77.3
Busia 25 0.1197 0.2095 154 71.3
Butere 22 0.1492 0.2569 187 86.6
Alupe 11 0.1195 0.2071 140 64.8
Mumias 35 0.1416 0.2464 193 89.4
Tanzania Hai 5 0.1747 0.2675 116 53.7
Lushoto 4 0.1727 0.2633 111 51.3
Meru 3 0.1608 0.2390 92 42.6
Muheza 14 0.1011 0.1771 128 59.3
Tarime 19 0.1893 0.3113 186 83.1
Uganda Kabarole 12 0.2130 0.3353 168 77.8
Masaka 23 0.1244 0.2099 151 69.9
Naro 5 0.0167 0.0266 13 32.5
Soroti 16 0.2142 0.3445 189 87.5
ILRI-FG Others 6* 0.0783 0.1293 71 32.9
Swaziland 6 0.1576 0.2495 123 56.9
Tanzania 5 0.1308 0.2035 93 43.1
Unknown 14 0.1338 0.2258 145 67.1
USA 16 0.1890 0.3044 170 78.7
Zimbabwe-C 8 0.1844 0.2938 152 70.4
AoB PLANTS www.aobplants.oxfordjournals.org & The Authors 2013 3
Wanjala et al. — Genetic diversity in Napier grass cultivars
by guest on May 22, 2013
http://aobpla.oxfordjournals.org/D
ownloaded from
Reproducibility was assessed by duplicating the samesample three times with different primer pair combina-tions to produce similar electropherograms. Polymerasechain reaction (PCR) products were prepared for separ-ation on capillary electrophoresis (Applied Biosystems).Size separation of AFLP–PCR fragments was done onan ABI 3730 xl Genetic Analyzer (Applied Biosystems).Amplified fragment length polymorphism peaks fromthe Genetic Analyzer were sized and alleles scoredwith GeneMapper version 4.1 (Applied Biosystems AFLPPlant Mapping Protocol, 2005). Scored results wereexported to an Excel matrix with values 1 (allelepresent) or 0 (allele absent).
Data analyses
Genetic diversity, ordination analysis and analysis ofmolecular variance (AMOVA)—for diversity among andwithin populations—were determined using GenAlExsoftware (Peakall and Smouse 2009). PopGen32 (Yehet al. 1997) was used for the population-based approachusing F statistics, gene diversity over loci, proportion ofpolymorphic loci, Shannon index and gene frequency(Nei 1987; McDermott and McDonald 1993). In addition,the genetic distance between any two populations(Schneider et al. 2000) was computed using Tools forPopulation Genetic Analysis (TFPGA) software (Miller1997). To show the relationships between 281 cultivars,principal co-ordinate analysis and unweighted pairgroup method with arithmetic mean (UPGMA) were gen-erated using Darwin software (Perrier and Jacquemoud-Collet 2006). About 2000 bootstrap replicates were usedto determine branch support in the consensus tree.
Results
Evaluation of genetic diversity
From the initial 64 primers screened, 22 were efficient atthe inter-population level and sufficiently polymorphic todiscriminate clones within populations. Intra-populationpolymorphism obtained with the selected primers gavealleles unique to each individual from the same popula-tion. Five primers that generated electropherogramswith high relative fluorescent units/(peaks) withoutbackground noise were further selected for genotyping.Amplified fragment length polymorphism fragmentsranged from 50 to 500 base pairs. Polymorphic bandsranged from 50 to 115 with an average of 43 bandsper primer from a total of 216 bands generated,accounting for 64.80 % of polymorphic loci observed.The percentage of polymorphic fragments within sub-populations ranged from 32.5 for the National Agricul-tural Research Organization (NARO) to 89.4 % forMumias. Following the same order, the genetic diversity
coefficients based on Nei’s genetic diversity ranged from0.0783 to 0.2142 and Shannon’s information indexranged from 0.1293 to 0.3445 (Table 1).
Phenetic analysis
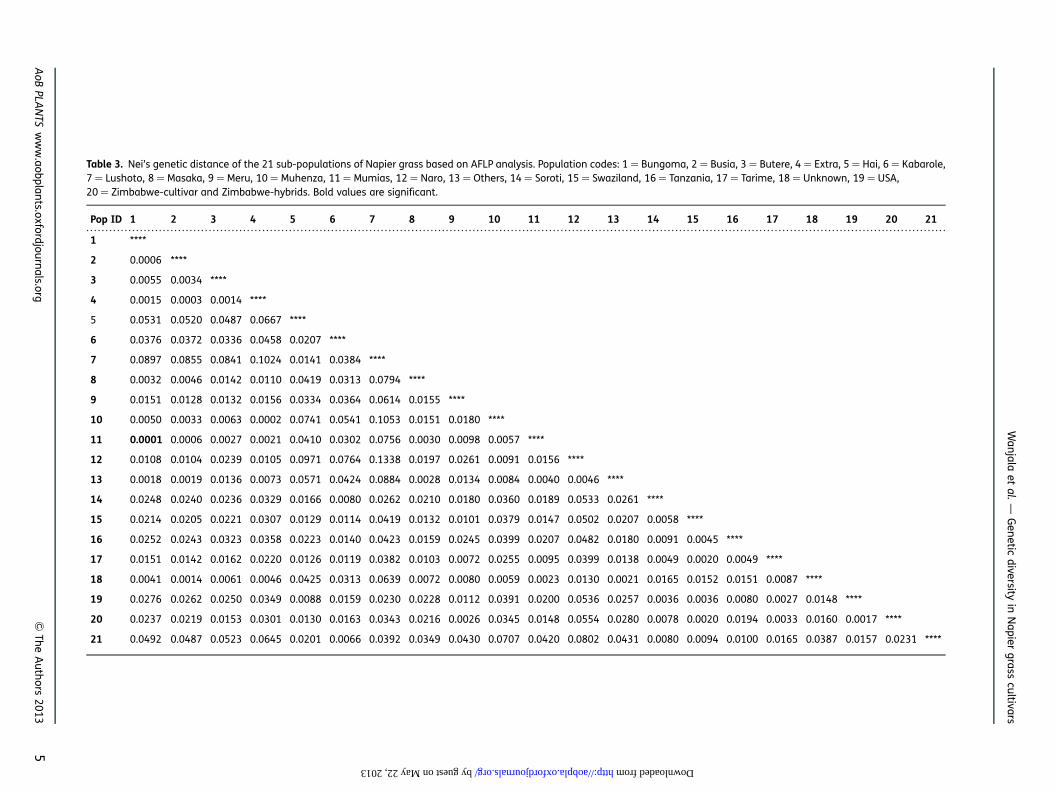
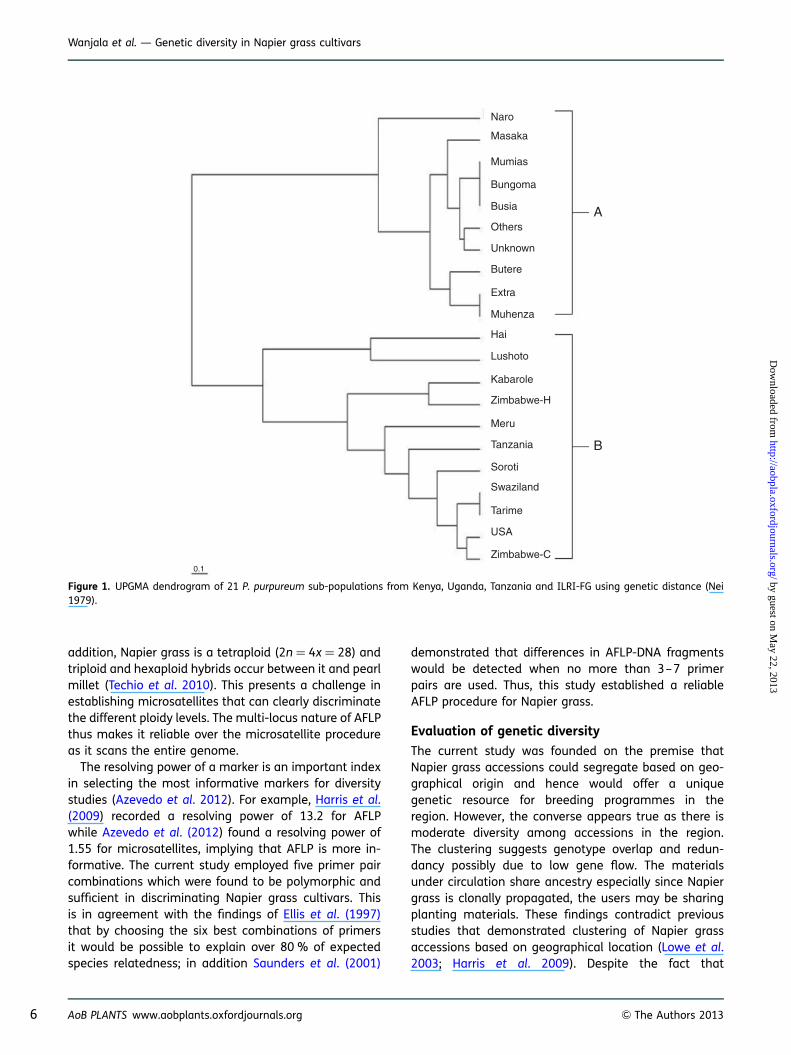
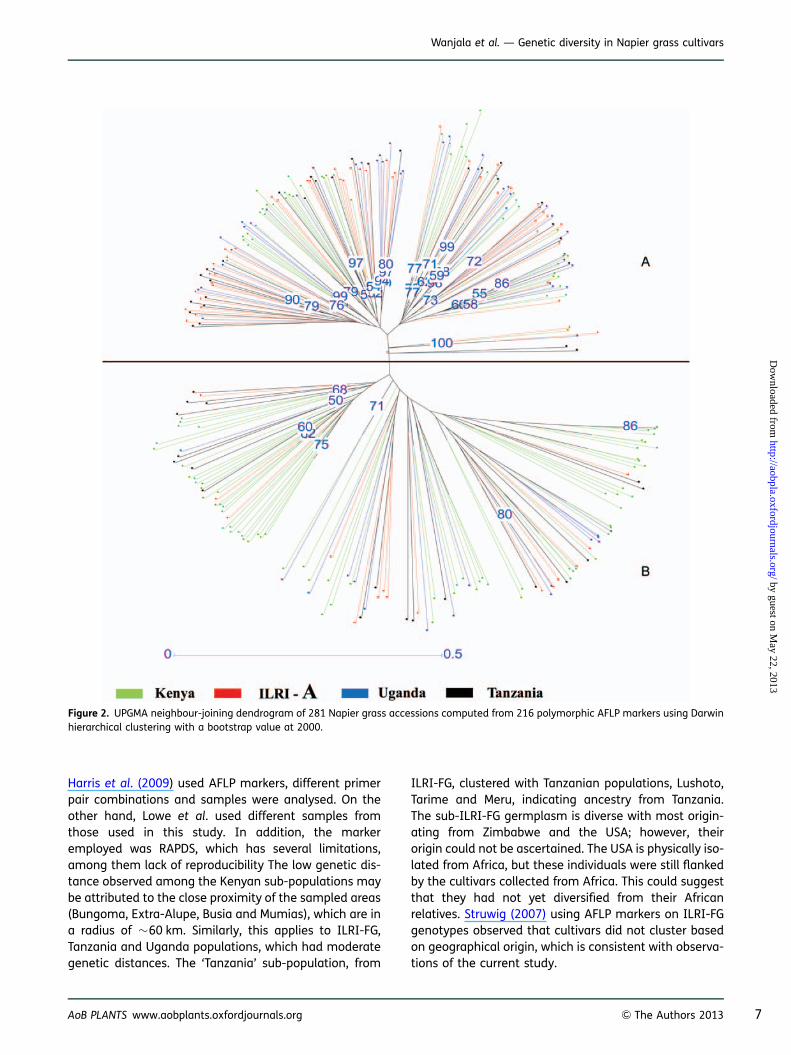
The genetic distances between/among 21 Napier grasssub-populations (regions within countries) and fourpopulations (countries: Kenya, Uganda, Tanzania andILRI-FG) were subjected to hierarchical clustering byUPGMA (Table 3). This yielded two distinct clusters(A and B) which did not reflect the geographical loca-tions of the 281 cultivars (Fig. 1). In addition, therewas an overlap among cultivars spread across differentclusters (Fig. 2). Pairwise comparison of genetic distanceand similarity of populations revealed little genetic diver-sity within the Kenyan population and the ILRI-FG popu-lation, while it was moderate within the Uganda andTanzanian populations.
Population structure among and withinpopulations
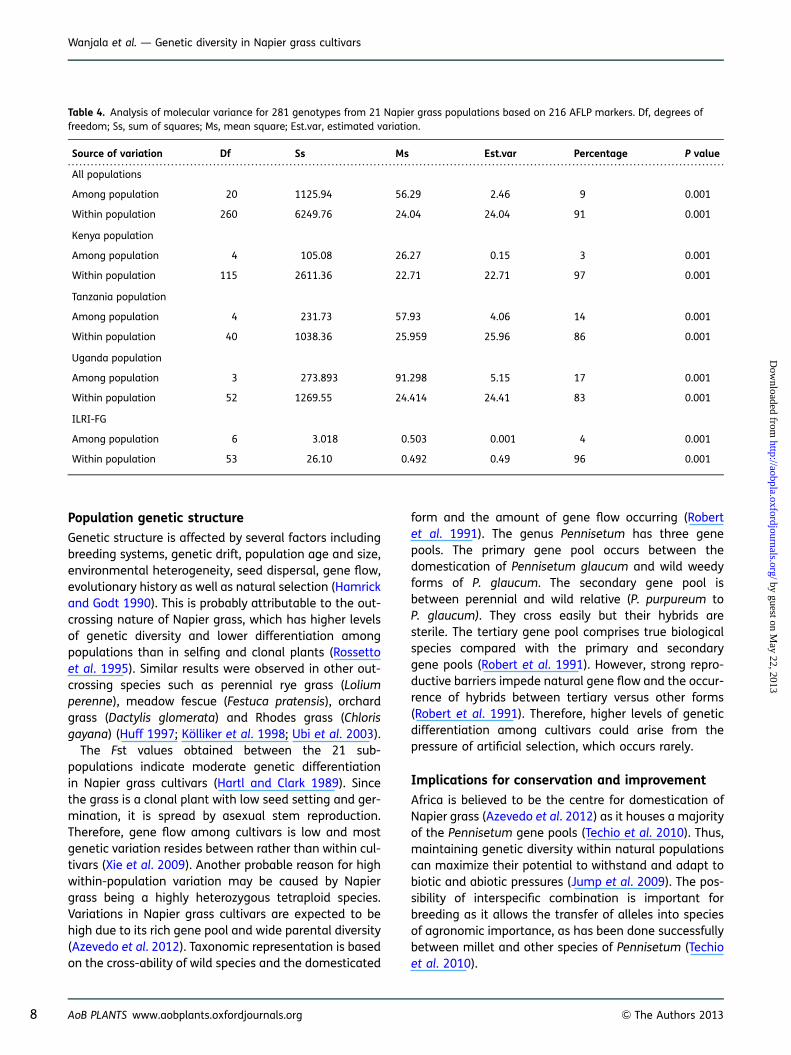
Variance components obtained by AMOVA were highlysignificant (P , 0.001) with more variation within(91 %) than between populations (9 %) (Table 4). Simi-larly, nested analysis partitioned by country, withinpopulation, Uganda 83 %, Kenya 97 %, Tanzania 86 %and ILRI-FG 96 %, was also highly significant (P ,
0.001). On the other hand, variation among populationshowed the Kenyan population as having the least vari-ation (3 %) while the most variation was among theUgandan population (17 %).
Discussion
Reliability of AFLP markers
A good molecular marker must separate individuals’inter-populations and still be sufficiently polymorphicat the intra-population level to precisely identify clones(Mueller and Wolfenbarger 1999). Amplified fragmentlength polymorphism employed in the current studygenerated numerous highly polymorphic alleles, whichcorroborates the findings of Vos et al. (1995) that alarge number of alleles are important for accurately es-timating the genetic diversity of a germplasm. Whilemicrosatellites are among the most commonly usedmarkers due to their locus specificity, co-dominantnature, high polymorphism and reproducibility, their de-velopment and application have been restricted to a fewagriculturally important crops since they first requireidentification via genome sequencing (Powell et al.1996). The genome of Napier grass has not beensequenced and the inputs involved are high and limitthe development of microsatellite for this crop. In
4 AoB PLANTS www.aobplants.oxfordjournals.org & The Authors 2013
Wanjala et al. — Genetic diversity in Napier grass cultivars
by guest on May 22, 2013
http://aobpla.oxfordjournals.org/D
ownloaded from
. . . . . . . . . . . . . . . . . . . . . . . . . . . . . . . . . . . . . . . . . . . . . . . . . . . . . . . . . . . . . . . . . . . . . . . . . . . . . . . . . . . . . . . . . . . . . . . . . . . . . . . . . . . . . . . . . . . . . . . . . . . . . . . . . . . . . . . . . . . . . . . . . . . . . . . . . . . . . . . . . . . . . . . . . . . . . . . . . . . . . . . . . . . . . . . . . . . . . . . . . . . . . . . . . . . . . . . . . . . . . . . . .
Table 3. Nei’s genetic distance of the 21 sub-populations of Napier grass based on AFLP analysis. Population codes: 1 ¼ Bungoma, 2 ¼ Busia, 3 ¼ Butere, 4 ¼ Extra, 5 ¼ Hai, 6 ¼ Kabarole,7 ¼ Lushoto, 8 ¼ Masaka, 9 ¼ Meru, 10 ¼ Muhenza, 11 ¼ Mumias, 12 ¼ Naro, 13 ¼ Others, 14 ¼ Soroti, 15 ¼ Swaziland, 16 ¼ Tanzania, 17 ¼ Tarime, 18 ¼ Unknown, 19 ¼ USA,20 ¼ Zimbabwe-cultivar and Zimbabwe-hybrids. Bold values are significant.
Pop ID 1 2 3 4 5 6 7 8 9 10 11 12 13 14 15 16 17 18 19 20 21
1 ****
2 0.0006 ****
3 0.0055 0.0034 ****
4 0.0015 0.0003 0.0014 ****
5 0.0531 0.0520 0.0487 0.0667 ****
6 0.0376 0.0372 0.0336 0.0458 0.0207 ****
7 0.0897 0.0855 0.0841 0.1024 0.0141 0.0384 ****
8 0.0032 0.0046 0.0142 0.0110 0.0419 0.0313 0.0794 ****
9 0.0151 0.0128 0.0132 0.0156 0.0334 0.0364 0.0614 0.0155 ****
10 0.0050 0.0033 0.0063 0.0002 0.0741 0.0541 0.1053 0.0151 0.0180 ****
11 0.0001 0.0006 0.0027 0.0021 0.0410 0.0302 0.0756 0.0030 0.0098 0.0057 ****
12 0.0108 0.0104 0.0239 0.0105 0.0971 0.0764 0.1338 0.0197 0.0261 0.0091 0.0156 ****
13 0.0018 0.0019 0.0136 0.0073 0.0571 0.0424 0.0884 0.0028 0.0134 0.0084 0.0040 0.0046 ****
14 0.0248 0.0240 0.0236 0.0329 0.0166 0.0080 0.0262 0.0210 0.0180 0.0360 0.0189 0.0533 0.0261 ****
15 0.0214 0.0205 0.0221 0.0307 0.0129 0.0114 0.0419 0.0132 0.0101 0.0379 0.0147 0.0502 0.0207 0.0058 ****
16 0.0252 0.0243 0.0323 0.0358 0.0223 0.0140 0.0423 0.0159 0.0245 0.0399 0.0207 0.0482 0.0180 0.0091 0.0045 ****
17 0.0151 0.0142 0.0162 0.0220 0.0126 0.0119 0.0382 0.0103 0.0072 0.0255 0.0095 0.0399 0.0138 0.0049 0.0020 0.0049 ****
18 0.0041 0.0014 0.0061 0.0046 0.0425 0.0313 0.0639 0.0072 0.0080 0.0059 0.0023 0.0130 0.0021 0.0165 0.0152 0.0151 0.0087 ****
19 0.0276 0.0262 0.0250 0.0349 0.0088 0.0159 0.0230 0.0228 0.0112 0.0391 0.0200 0.0536 0.0257 0.0036 0.0036 0.0080 0.0027 0.0148 ****
20 0.0237 0.0219 0.0153 0.0301 0.0130 0.0163 0.0343 0.0216 0.0026 0.0345 0.0148 0.0554 0.0280 0.0078 0.0020 0.0194 0.0033 0.0160 0.0017 ****
21 0.0492 0.0487 0.0523 0.0645 0.0201 0.0066 0.0392 0.0349 0.0430 0.0707 0.0420 0.0802 0.0431 0.0080 0.0094 0.0100 0.0165 0.0387 0.0157 0.0231 ****
AoB
PLAN
TSw
ww
.aobplants.oxford
journ
als.org&
The
Au
thors
20135
Wan
jalaet
al.—G
enetic
diversity
inN
apiergrass
cultivars
by guest on May 22, 2013 http://aobpla.oxfordjournals.org/ Downloaded from
addition, Napier grass is a tetraploid (2n ¼ 4x ¼ 28) andtriploid and hexaploid hybrids occur between it and pearlmillet (Techio et al. 2010). This presents a challenge inestablishing microsatellites that can clearly discriminatethe different ploidy levels. The multi-locus nature of AFLPthus makes it reliable over the microsatellite procedureas it scans the entire genome.
The resolving power of a marker is an important indexin selecting the most informative markers for diversitystudies (Azevedo et al. 2012). For example, Harris et al.(2009) recorded a resolving power of 13.2 for AFLPwhile Azevedo et al. (2012) found a resolving power of1.55 for microsatellites, implying that AFLP is more in-formative. The current study employed five primer paircombinations which were found to be polymorphic andsufficient in discriminating Napier grass cultivars. Thisis in agreement with the findings of Ellis et al. (1997)that by choosing the six best combinations of primersit would be possible to explain over 80 % of expectedspecies relatedness; in addition Saunders et al. (2001)
demonstrated that differences in AFLP-DNA fragmentswould be detected when no more than 3–7 primerpairs are used. Thus, this study established a reliableAFLP procedure for Napier grass.
Evaluation of genetic diversity
The current study was founded on the premise thatNapier grass accessions could segregate based on geo-graphical origin and hence would offer a uniquegenetic resource for breeding programmes in theregion. However, the converse appears true as there ismoderate diversity among accessions in the region.The clustering suggests genotype overlap and redun-dancy possibly due to low gene flow. The materialsunder circulation share ancestry especially since Napiergrass is clonally propagated, the users may be sharingplanting materials. These findings contradict previousstudies that demonstrated clustering of Napier grassaccessions based on geographical location (Lowe et al.2003; Harris et al. 2009). Despite the fact that
Naro
Masaka
Mumias
Bungoma
A
B
Busia
Others
Unknown
Butere
Extra
Muhenza
Hai
Lushoto
Kabarole
Zimbabwe-H
Zimbabwe-C0.1
Meru
Tanzania
Soroti
Swaziland
Tarime
USA
Figure 1. UPGMA dendrogram of 21 P. purpureum sub-populations from Kenya, Uganda, Tanzania and ILRI-FG using genetic distance (Nei1979).
6 AoB PLANTS www.aobplants.oxfordjournals.org & The Authors 2013
Wanjala et al. — Genetic diversity in Napier grass cultivars
by guest on May 22, 2013
http://aobpla.oxfordjournals.org/D
ownloaded from
Harris et al. (2009) used AFLP markers, different primerpair combinations and samples were analysed. On theother hand, Lowe et al. used different samples fromthose used in this study. In addition, the markeremployed was RAPDS, which has several limitations,among them lack of reproducibility The low genetic dis-tance observed among the Kenyan sub-populations maybe attributed to the close proximity of the sampled areas(Bungoma, Extra-Alupe, Busia and Mumias), which are ina radius of �60 km. Similarly, this applies to ILRI-FG,Tanzania and Uganda populations, which had moderategenetic distances. The ‘Tanzania’ sub-population, from
ILRI-FG, clustered with Tanzanian populations, Lushoto,Tarime and Meru, indicating ancestry from Tanzania.The sub-ILRI-FG germplasm is diverse with most origin-ating from Zimbabwe and the USA; however, theirorigin could not be ascertained. The USA is physically iso-lated from Africa, but these individuals were still flankedby the cultivars collected from Africa. This could suggestthat they had not yet diversified from their Africanrelatives. Struwig (2007) using AFLP markers on ILRI-FGgenotypes observed that cultivars did not cluster basedon geographical origin, which is consistent with observa-tions of the current study.
Figure 2. UPGMA neighbour-joining dendrogram of 281 Napier grass accessions computed from 216 polymorphic AFLP markers using Darwinhierarchical clustering with a bootstrap value at 2000.
AoB PLANTS www.aobplants.oxfordjournals.org & The Authors 2013 7
Wanjala et al. — Genetic diversity in Napier grass cultivars
by guest on May 22, 2013
http://aobpla.oxfordjournals.org/D
ownloaded from
Population genetic structure
Genetic structure is affected by several factors includingbreeding systems, genetic drift, population age and size,environmental heterogeneity, seed dispersal, gene flow,evolutionary history as well as natural selection (Hamrickand Godt 1990). This is probably attributable to the out-crossing nature of Napier grass, which has higher levelsof genetic diversity and lower differentiation amongpopulations than in selfing and clonal plants (Rossettoet al. 1995). Similar results were observed in other out-crossing species such as perennial rye grass (Loliumperenne), meadow fescue (Festuca pratensis), orchardgrass (Dactylis glomerata) and Rhodes grass (Chlorisgayana) (Huff 1997; Kolliker et al. 1998; Ubi et al. 2003).
The Fst values obtained between the 21 sub-populations indicate moderate genetic differentiationin Napier grass cultivars (Hartl and Clark 1989). Sincethe grass is a clonal plant with low seed setting and ger-mination, it is spread by asexual stem reproduction.Therefore, gene flow among cultivars is low and mostgenetic variation resides between rather than within cul-tivars (Xie et al. 2009). Another probable reason for highwithin-population variation may be caused by Napiergrass being a highly heterozygous tetraploid species.Variations in Napier grass cultivars are expected to behigh due to its rich gene pool and wide parental diversity(Azevedo et al. 2012). Taxonomic representation is basedon the cross-ability of wild species and the domesticated
form and the amount of gene flow occurring (Robertet al. 1991). The genus Pennisetum has three genepools. The primary gene pool occurs between thedomestication of Pennisetum glaucum and wild weedyforms of P. glaucum. The secondary gene pool isbetween perennial and wild relative (P. purpureum toP. glaucum). They cross easily but their hybrids aresterile. The tertiary gene pool comprises true biologicalspecies compared with the primary and secondarygene pools (Robert et al. 1991). However, strong repro-ductive barriers impede natural gene flow and the occur-rence of hybrids between tertiary versus other forms(Robert et al. 1991). Therefore, higher levels of geneticdifferentiation among cultivars could arise from thepressure of artificial selection, which occurs rarely.
Implications for conservation and improvement
Africa is believed to be the centre for domestication ofNapier grass (Azevedo et al. 2012) as it houses a majorityof the Pennisetum gene pools (Techio et al. 2010). Thus,maintaining genetic diversity within natural populationscan maximize their potential to withstand and adapt tobiotic and abiotic pressures (Jump et al. 2009). The pos-sibility of interspecific combination is important forbreeding as it allows the transfer of alleles into speciesof agronomic importance, as has been done successfullybetween millet and other species of Pennisetum (Techioet al. 2010).
. . . . . . . . . . . . . . . . . . . . . . . . . . . . . . . . . . . . . . . . . . . . . . . . . . . . . . . . . . . . . . . . . . . . . . . . . . . . . . . . . . . . . . . . . . . . . . . . . . . . . . . . . . . . . . . . . . . . . . . . . . . . . . . . . . . . . . . . . . . . . . . . . . . . . . . . . . . . . . . . . . . . . . . . . . . .
Table 4. Analysis of molecular variance for 281 genotypes from 21 Napier grass populations based on 216 AFLP markers. Df, degrees offreedom; Ss, sum of squares; Ms, mean square; Est.var, estimated variation.
Source of variation Df Ss Ms Est.var Percentage P value
All populations
Among population 20 1125.94 56.29 2.46 9 0.001
Within population 260 6249.76 24.04 24.04 91 0.001
Kenya population
Among population 4 105.08 26.27 0.15 3 0.001
Within population 115 2611.36 22.71 22.71 97 0.001
Tanzania population
Among population 4 231.73 57.93 4.06 14 0.001
Within population 40 1038.36 25.959 25.96 86 0.001
Uganda population
Among population 3 273.893 91.298 5.15 17 0.001
Within population 52 1269.55 24.414 24.41 83 0.001
ILRI-FG
Among population 6 3.018 0.503 0.001 4 0.001
Within population 53 26.10 0.492 0.49 96 0.001
8 AoB PLANTS www.aobplants.oxfordjournals.org & The Authors 2013
Wanjala et al. — Genetic diversity in Napier grass cultivars
by guest on May 22, 2013
http://aobpla.oxfordjournals.org/D
ownloaded from
Assessment of the entire Pennisetum gene pool wouldmake material available for breeding programmeswithout causing genetic erosion or loss of varieties.Thus there ought to be renewed efforts among research-ers to populate the forage germplasm (ILRI-FG) withmaterials from different agroecological zones of theworld. Potential sources of Napier grass diversity areSouth Africa, Brazil, Puerto Rico, the USA, Australia,China, Pakistan and India (Azevedo et al. 2012).
ConclusionsThe AFLP methodology developed in this study was ableto discriminate among the Napier grass accessions andcould be useful in screening cultivars.
Sources of FundingThis work was supported by a grant (Napier grasssmut and stunt resistance ASARECA project 06/RC01-FC-2-02) through the Association for Strengthen-ing Agricultural Research in Eastern and Central Africa(ASARECA).
Contributions by the AuthorsB.W.W. conducted the lab work, and drafted and revisedthe manuscript with contributions from co-authors. M.O.,F.N.W., J. Harvey and R.A.S. were primarily responsiblefor supervising the laboratory work and revising themanuscript. A.M. provided technical backstopping inthe AFLP methodology and data analysis. M.M. was re-sponsible for the field sampling of the Kenyan cultivars.J.P. coordinated all the activities of the project. J. Hansonconceived the study and obtained funding for it. Allauthors read and approved the final manuscript.
Conflicts of Interest StatementNone declared.
AcknowledgementsWe thank the Director, Kenya Agricultural Research Insti-tute, for allowing the graduate student to undertake thisstudy. The Director of Biosciences eastern and centralAfrica (BecA) at ILRI Hub is appreciated for providingan enabling environment where this piece of work wasconducted. Dr Beatrice Pallangyo TARO-Tanzania andDr Jolly Kabirizi NARO-Uganda supplied cultivars fromtheir respective countries for genotyping. Our gratitudegoes to Mercy Kitavi for the lab induction and facilitationof the graduate student at BecA Hub.
Literature CitedAnderson WF, Dien BS, Brandon SK, Peterson JD. 2008. Assessment
of Bermuda grass and bunch grasses as feed stocks for conver-sion to ethanol. Applied Biochemistry and Biotechnology 145:13–21.
Azevedo ALS, Costa PP, Machado JC, Machando MA, Pereira AV,Ledo FJS. 2012. Cross species amplification of Pennisetumglaucum microsatellite markers in Pennisetum purpureum andgenetic diversity of Napier grass accessions. Crop Science 4:1776–1785.
Bardakci F. 2001. Random amplified polymorphic DNA (RAPD)markers. Turkish Journal of Biology 25:185–196.
Bayer W. 1990. Napier grass—a promising fodder for smallholderlivestock production in the tropics. Plant Research Development31:103–111.
Boa E, Ajanga S, Mulaa M, Jones P. 2005. Going public on Napierstunting disease in Western Kenya. Egham, UK: Global PlantClinic, 14 pp.
Doyle JJ, Doyle JL. 1987. A rapid DNA isolation procedure for smallquantities of fresh leaf material. Phytochemical Bulletin 19:11–15.
Ellis RP, McNicol JW, Baird E, Booth A, Lawrence P, Thomas B,Powell W. 1997. The use of AFLP to examine genetic relatednessin barley. Molecular Breeding 3:359–369.
Hamrick JL, Godt MJ. 1990. Plant population genetics, breeding, andgenetic resources. Sunderland, MA: Sinauer, 43–63.
Hanna WW, Chaparro CJ, Mathews BW, Burns JC, Sollenberger LE,Carpenter JR. 2004. Perennial pennisetums. In: Moser LE,Burson BL, Sollenberger LE, eds. Warm-season (C4) grasses.Vol. 34. Madison, American Society of Agronomy: Monographseries, 503–535.
Harris K, Anderson W, Malik R. 2009. Genetic relationships amongNapier grass (Pennisetum purpureum) nursery accessions usingAFLP markers. Plant Genetic Resources: Characterization andUtilization 1:1–8.
Hartl DL, Clark AG. 1989. Principles of population genetics, 3rd edn.Sunderland, MA: Sinauer Associates, Inc.
Huff DR. 1997. RAPD characterization of heterogeneous perennialryegrass cultivars. Crop Science 37:557–594.
Jaradat AA. 2010. Genetic resources of energy crops: biologicalsystems to combat climate change. Australian Journal of CropScience 4:309–323.
Jump AS, Marchant R, Penuelas J. 2009. Environmental change andthe option value of genetic diversity. Trends in Plant Science 14:51–58.
Katz SH. 2003. Cereal grains and pseudo-cereals. Encyclopediaof food & culture. http://www.enotes.com/food-encyclopedia/cereal-grains-pseudo-cereals (14 July 2009).
Kolliker R, Stadelmann FJ, Reidy B, Nosberger J. 1998. Genetic vari-ability of forage grass cultivars: a comparison of Festuca praten-sis Huds. Lolium perenne L. and Dactylis glomerata L. Euphytica106:261–270.
Lowe AJ, Thorpe W, Teake A, Hanson J. 2003. Characterization ofgermplasm accession of Napier grass (Pennisetum purpureumand P. purpureum and P. glaucum hybrids) and comparisonwith farm clones using RAPD. Genetic Resources and CropEvolution 50:121–132.
AoB PLANTS www.aobplants.oxfordjournals.org & The Authors 2013 9
Wanjala et al. — Genetic diversity in Napier grass cultivars
by guest on May 22, 2013
http://aobpla.oxfordjournals.org/D
ownloaded from
McDermott JM, McDonald BA. 1993. Gene flow in plant pathosys-tems. Annual Review of Phytopathology 31:353–373.
Miller MP. 1997. Tools for Population Genetic Analyses (TFPGA).Available with the program’s installation files at: http://www.marksgeneticsoftware.net/tfpga.htm (19 June 2009).
Mohammadi SA, Prasanna BM. 2003. Analysis of genetic diversity incrop plants—salient statistical tools and considerations. CropScience 43:1235–1248.
Mondini L, Noorani A, Pagnotta MA. 2009. Assessing plant geneticdiversity by molecular tools. Diversity 1:19–35.
Mueller UG, Wolfenbarger LL. 1999. Amplified fragment length poly-morphism (AFLP) genotyping and fingerprinting. Trends inEcology and Evolution 14:389–394.
Nei M. 1987. Genetic distance between populations. American Nat-uralist 106:283–292.
Nei M, Li WH. 1979. Mathematical model for studying genetic vari-ation in terms of restriction endonucleases. Proceedings of theNational Academy of Sciences of the USA 76:5269–5273.
New Agriculturists. A healthy aversion to smut. http://www.new-ag.info/98-2/newsbr.html (1 November 2009).
Peakall R, Smouse PE. 2009. GENALEX 6: Genetic Analysis in Excel.Population genetic software for teaching and research. Molecu-lar Ecology Notes 6:288–295.
Perrier X, Jacquemoud-Collet JP 2006. DARwin software. http://darwin.cirad.fr/ (16 July 2009).
Powell W, Machray GC, Provan J. 1996. Polymorphism revealedby simple sequence repeats. Trends in Plant Science 7:215–222.
Robert T, Lespinasse R, Peerns J, Sarr A. 1991. Gametophytic com-petition as influencing gene flow between wild and cultivatedforms of pearl millet (Pennisetum typhoides). Genome 34:195–200.
Rossetto M, Weaver PK, Dixon KW. 1995. Use of RAPD analysis indevising conservation strategies for the rare and endangeredGrevillea scapigera. Molecular Ecology 4:321–329.
Saunders JA, Pedroni MJ, Penrose LDJ, Fist AJ. 2001. AFLP DNA ana-lysis of opium poppy. Crop Science 41:1596–1601.
Schneider S, Roessli D, Excoffier L. 2000. Arlequin, version 2000: soft-ware for population genetic analysis. Switzerland: Genetics andBiometry Laboratory, University of Geneva.
Spooner D, van Treuren R, de Vicente MC. 2005. Molecular markersfor gene bank management. IPGRI Technical Bulletin No. 10.Rome, Italy: International Plant Genetic Resources Institute.
Staal S, Chege L, Kenyanjui M, Kimari A, Lukuyu B, Njubi D,Owango M, Tanner J, Thorp W, Wambugu M. 1987. A cross-sectional survey of Kiambu District for the identification oftarget groups of smallholder dairy producers. KARI/ILRI collab-orative project research report. Nairobi, Kenya.
Struwig M. 2007. Fingerprinting Pennisetum purpureum varietiesand cultivars using AFLP analyses. Thesis, Masters of Environ-mental Sciences, North West University.
Techio VH, Davide LC, Cagliari A, Barbosa S, Pereira AV. 2010.Karyotipic asymmetry of both wild and cultivated species ofPennisetum. Bragantia Campinas 69:273–279.
Ubi GN, Kenworthy WJ, Costa JM, Cregan PB, Alvernaz J. 2003.Genetic diversity of soybean cultivars from China, Japan, NorthAmerica, and North American ancestral lines determined byamplified fragment length polymorphism. Crop Science 43:1858–1867.
Vos P, Hogers R, Bleeker M, Reijans M, van de Lee T, Hornes M,Frijters A, Pot J, Peleman J, Kuiper M. 1995. AFLP: a new tech-nique for DNA fingerprinting. Nucleic Acids Research 23:4407–4414.
Xie XM, Zhou F, Zhang XQ, Zhang JM. 2009. Genetic variability andrelationships between MT-1 elephant grass and closely relatedcultivars assessed by SRAP markers. Journal of Genetics 88:281–290.
Yeh FC, Yang RC, Boyle TBJ, Ye ZH, Mao JX. 1997. POPGENE, the user-friendly shareware for population genetic analysis. Canada: Mo-lecular Biology and Biotechnology Centre, University of Alberta.
10 AoB PLANTS www.aobplants.oxfordjournals.org & The Authors 2013
Wanjala et al. — Genetic diversity in Napier grass cultivars
by guest on May 22, 2013
http://aobpla.oxfordjournals.org/D
ownloaded from
Related Documents