1 Genetic distance as a tool in the conservation of rare horse breeds. E. Gus Cothran 1 and Cristina Luis 2 1 Department of Veterinary Science, University of Kentucky, Lexington, KY 40546, USA 2 Centro de Biologia Ambiental/DBA, Faculdade de Ciencias, Universidade de Lisboa, P1749-016 Lisboa, Portugal

Welcome message from author
This document is posted to help you gain knowledge. Please leave a comment to let me know what you think about it! Share it to your friends and learn new things together.
Transcript

1
Genetic distance as a tool in the conservation of rare horse breeds.
E. Gus Cothran1 and Cristina Luis2
1Department of Veterinary Science, University of Kentucky, Lexington, KY 40546, USA
2Centro de Biologia Ambiental/DBA, Faculdade de Ciencias, Universidade de
Lisboa, P1749-016 Lisboa, Portugal

2
It is increasingly clear that the diversity of domestic animal resources used in agriculture
is declining just as is the diversity of species in nature. Because the genetic diversity that is
being lost could have importance to future agricultural production, efforts are now under way,
lead by the Food and Agriculture Organization of the United Nations (FAO), to understand the
current genetic diversity of the worlds domestic animal resources (for example see Barker et al.,
1998). The horse is included in this effort. Of all the domestic animal species, the horse has
perhaps the greatest diversity of uses and has had a tremendous impact on human civilization
first as a food source then as a means of draft power, transportation and as a weapon in warfare.
Horses still perform all of their historical functions in one part of the world or another.
Genotyping of genetic marker systems now is frequently used as a tool for conservation.
Probably the most important use is in the assessment of genetic diversity (Laval et al., 2000).
Another use is the determination of resemblance or relationship between and among populations
by calculation of genetic similarity or distance (similarity is usually the inverse of distance;
Hedrick, 1975). Genetic distance also can be used to determine population structure and genetic
distinctiveness of a population or breed (MacHugh et al., 1998). Here we will report on several
aspects of the use of genetic distance as it relates to the conservation of rare breeds of the horse.
In particular we will focus on the interpretation of the results of distance analysis and we will not
go into detail on the statistical aspects of the various distance measures or clustering techniques.
The genetic distance analyses covered here were of 22 domestic horse breeds. The
analyses were limited to this relatively small number of breeds to simplify explanation of the
results. The breeds represent a wide diversity of horse types and include rare breeds. Three
different data sets were analyzed. The first was 7 blood group and 10 biochemical genetic loci
analyzed by standard techniques (Cothran et al., 1998; Sandberg and Cothran, 2000) hereafter

3
referred to as protein loci. The second data set was based upon 15 microsatellite loci also tested
by standard methods (Juras et al., 2003). Both the protein loci and the microsatellite loci are
routinely used for parentage verification. The third data set was based upon a 288 bp sequence
of the mitochondrial D-loop as described by Luis et al. (2002a).
A large number of genetic similarity and distance measures have been developed and
used to compare groups of organisms. The various measures often have different statistical
properties and are based upon different assumptions about how the variation among groups
arose. There also are measures that are designed for specific types of genetic variation such as
microsatellites or DNA sequence variation. All genetic distance and similarity measures are
used to evaluate the amount of variation shared among groups (breeds for the purposes of this
paper). The measures convert a large array of frequency or sequence data into a single value.
Although this will result in some loss of information the single value simplifies looking at
patterns among groups. Despite the different mathematical and biological assumptions the
various measures are based upon, in practice most measures are highly correlated (Hedrick,
1975).
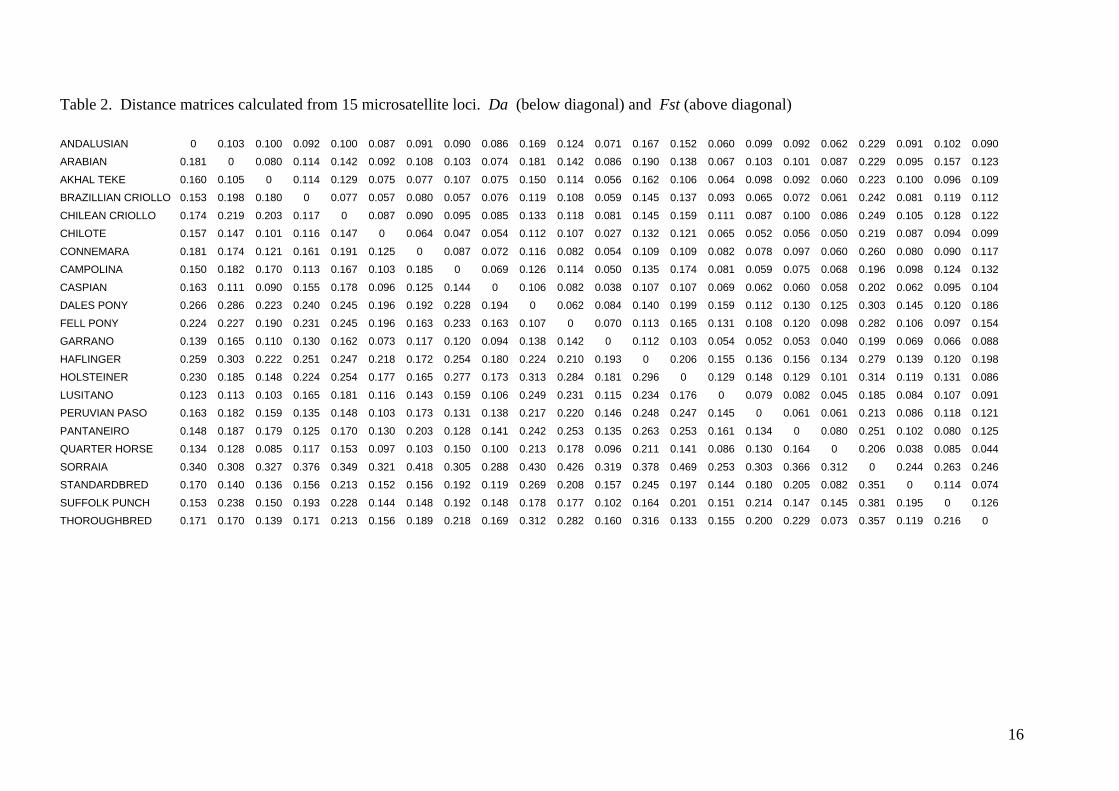
Tables 1 and 2 give distances values based upon protein and microsatellite data,
respectively, for the set of 22 horse breeds. Although it is readily apparent that the distance
values vary, it is not easy to determine how well the different measures correlated within data
types or if protein data show relationships that are the same as the microsatellite data. You can
compare the matrices statistically by use of the Mantel test (Mantel, 1967). A general discussion
of the Mantel test is given in Hubert (1987). We give two examples of matrix comparison here
(tests were performed using the NTSYS-pc package version 1.80). The first is a comparison of
Nei’s (1972) D versus the chord distance (Dc, Cavalli-Sforza and Edwards, 1967) for the protein

4
data. The matrix correlation is 0.936 (this is equal to the normalized Mantel statistic Z). The
approximate Mantel t-test value is 5.395, which is highly statistically significant. A scatter
diagram of the matrix comparison is given in Figure 1. The high correlation of the two measures
indicates that the two distance measures give essentially the same result. The comparison of
Nei’s D calculated from protein data and from microsatellite data gives a correlation of 0.665
and a t-test value of 4.133 (Figure 2). This also is a significant correlation but indicates that the
two different types of gene markers show less correlation, even though the same distance
measure is used, than do two different distance measures based upon the same data set.
Even though the distance measure is a reduction in the data from the basic gene
frequencies, it still is difficult to evaluate relationships within a distance matrix. To further
reduce the data and help to visualize the relationships among groups shown by the distance
measures, a tree diagram (dendrogram) is usually produced using some type of clustering
procedure. This reduces the data to two-dimensions. It also is possible to produce three-
dimensional diagrams by use of an ordination technique such as principle components analysis
or multidimensional scaling, but that type of analysis will not be covered here. There are almost
as many types of clustering techniques as there are distance coefficients. These include a variety
of phenetic clustering and phylogenetic reconstruction techniques. Again, the different
techniques have different mathematical and/or biological assumptions associated with them.
Different clustering procedures can give trees with different topologies from the same distance
matrix.
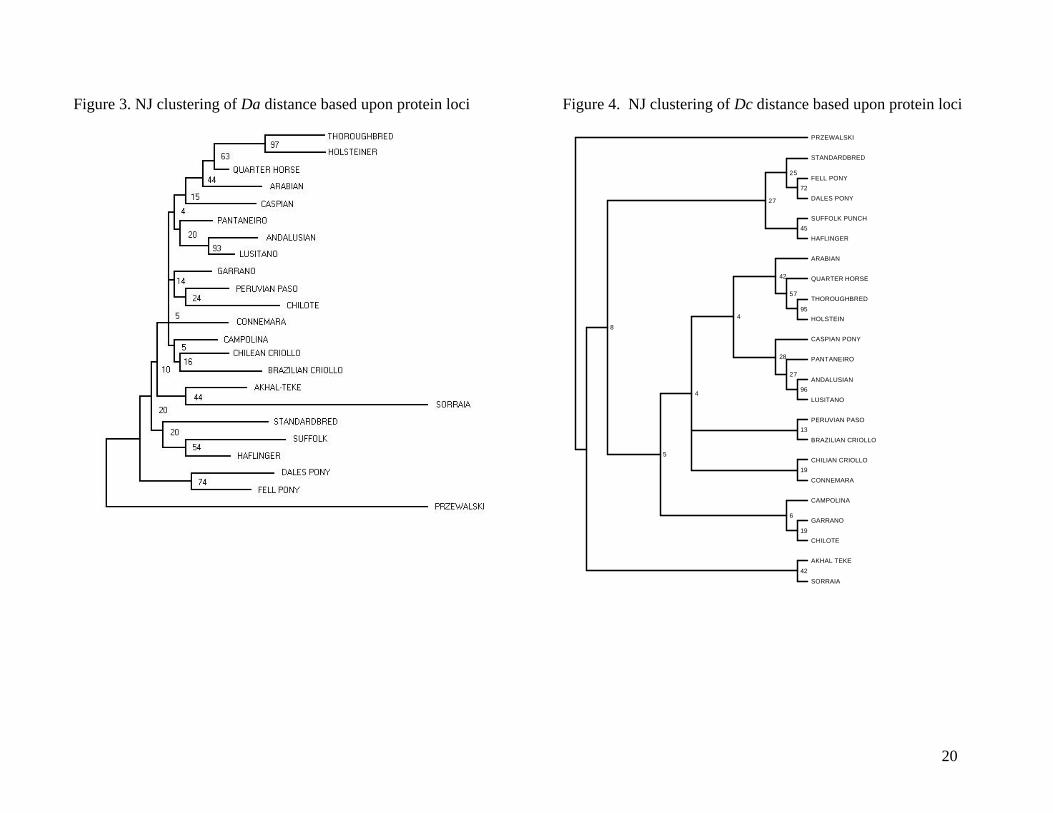
Figures 3 and 4 show Neighbor Joining (NJ; Saitou and Nei, 1987) dendrograms based
upon protein data for 22 horse breeds and the Przewalski horse (used as the outgroup). Figure 3
is based upon the Da distance (Nei et al., 1983) while Figure 4 is based upon Dc distance. The

5
data sets were bootstrapped 100 times and bootstrap values are shown at the nodes of the trees.
There are general similarities between the two trees but there are only four couplets that are the
same (Thoroughbred/Holsteiner, Akhal Teke/Sorraia, Suffolk/Haflinger, and Fell Pony/Dales
Pony) and only one cluster with more than two breeds that is the same in both trees
(Thoroughbred/Holsteiner/Quarter Horse/Arabian). These are the clusters with the highest
bootstrap values in both trees. The rank order of the bootstrap values is different for the
branches between the two trees but mainly for the more distant branches.
Bootstrapping is used to give a measure of confidence in the way the tree reflects the total
data in two dimensions. In general, the bootstrap values are low, especially at the nodes that
connect the major groups. This is primarily due to the overall high degree of relationship among
horse breeds. This causes inconsistent branching patterns at both the intermediate distances and
at the outer branches, which leads to the low bootstrap values. However, this does not mean that
the distance analysis and clustering cannot produce consistent trees that reflect true relationships.
Although it is not extremely clear from the trees shown here, the major groupings of breeds
shown do fit known relationships quite well. For example, for the most part Iberian type horses
are grouped together as are the so called “cold blood” horse breeds, the draft and true pony
breeds. If more breeds from each of the major groupings of horses were included in the analysis
the major clusters would be more distinct (see Cothran et al., 1998; Cothran et al., 2001).
Figures 5 and 6 show NJ clustering of Da and Fst (Reynolds et al., 1987), respectively,
based upon microsatellite data. For these trees, Equus asinus, the donkey, was used as the
outgroup. Again, there is general similarity of the two trees, although there were only three
couplets that were the same (Dales/Fell, Thoroughbred/Holsteiner, and Arabian/Akhal Teke).

6
Also, bootstrap values are mostly low for the same reasons as indicated before. Again, despite
the low bootstrap values, the trees do represent known relationships fairly well.
Comparison of Figures 4 and 7 shows how different clustering techniques can give
different trees from the same distance matrix. In this case, Dc from protein data is summarized
by the NJ method (Figure 4) and in Figure 7 by Restricted Maximum Likelihood (RML;
Felsenstein, 1973). Again, there is generally a high degree of concordance between the two
trees. Differences are mainly due to breeds that do not fit easily into any breed group or with
other single breeds for a variety of reasons. We will go into this in more detail below. Except
for these breeds, which include the Garrano, Connemara and Sorraia, there is fairly good
agreement between these trees and, for the most part, the trees do reflect groups that are known
to be related.
Another type of genetic marker is mitochondrial DNA (mtDNA) sequence variation. The
analysis of mtDNA variation has been tremendously useful in determining phylogenetic
relationships of species and was used to clearly determine the origins of domestication of cattle
(Loftus et al., 1994). However, as shown in Figure 9, mtDNA does not group breeds of horses
into groups that fit expectations based upon recent history, nor does it match the groups shown in
the protein and microsatellite analyses. This pattern has been interpreted to indicate a wide
diversity in the geographic origins of horses in early domestication (Lister et al., 1998; Vila et
al., 2001; Jansen et al., 2002).
The analyses shown up to this point have looked at using genotyping data to compare
populations or breeds. It also is possible to use this type of data to determine the population
membership of an individual. Bjornstad and Roed (2001) have shown that the use of simple
allele sharing statistics and maximum likelihood estimates, based upon allele frequencies, can

7
achieve high power in the allocation of an individual to a breed for Norwegian horse breeds.
However, Canon et al. (2000) had lower success in correct breed assignments likely due to less
genetic differentiation among the Spanish horse breeds they investigated. For the Norwegian
breeds a high probability of correct assignment was possible once more than twelve
microsatellite loci were typed. This methodology could have use in breed conservation by
determining which individuals, in a geographic region where breed designations are not well
defined, make up a particular breeding group that could be considered as a unit for preservation.
Also, it could be used to identify individuals that are members of a particular breed but have not
been registered in a studbook. This would have value for a breed with a very small population
size. However, this type of use of genotyping does require a good knowledge of the genetic
structure of the populations being analyzed and there is always a possibility of error in breed
assignment.
The dendrograms shown here illustrate a number of points about genetic distance and
clustering analysis that are extremely important to understand if these techniques are to be used
for rare breed conservation planning. An important aspect of this type of analysis is that most of
the clustering methods used are phylogenetic techniques that are designed to determine
ancestor/descendant relationships based upon comparison with an outgroup. The outgroup is a
sister group of the taxons being examined (in this case the horse breeds) which is used to
determine which of the characters in the data are primitive to the groups and which are derived
(Wiley, 1981). This type of analysis is not strictly appropriate to the analysis of breeds. Breeds
do not evolve in a direct ancestor/descendent branching manner the way that species do.
Because breeds are all members of a single species and are frequently formed by crossing two or
more different breeds, the relationships among breeds of a species are more like a web than a

8
tree. For this reason, a phenetic clustering method such as UPGMA, which only considers
distance rather than assumptions about the character states, is probably more appropriate.
However, in practice, a UPGMA tree of horse breed genetic distance such as shown in Figure 8
(based upon Fst distance and microsatellite data) does not give a tree that fits known
relationships as well as the NJ or RML tree. The clusters in Figure 6 fit known relationships
much better than those of Figure 8.
It is very important in the interpretation of distance analysis that you know the breeds you
are working with and the data. For example, the position of the Connemara varies among the
trees. The Connemara is an Irish breed that is originally one of the native pony breeds of the
British Isles. Thus, the expected position from that standpoint is that such as in Figures 5 or 6
where it is in the cluster with the Dales and Fell ponies and the Suffolk Punch, all British breeds.
However, in Figures 3 and 7, the Connemara is in a much more divergent position and does not
show any real breed group association. This is due to cross breeding of the Connemara to the
Thoroughbred, Arabian and other breeds (Hendricks, 1995).
Knowledge of the data used in the distance analysis also is important for interpretation of
results. Levels of genetic variability, for example, can have a major impact on genetic distance
values. Figure 10 (based upon Table 3) shows the relationship of heterozygosity with Da
distance for the breeds used in this study. There is a clear and statistically significant trend for
Da to increase as heterozygosity decreases. This association also has been observed for breeds
of chickens (Rosenberg et al., 2001). The effect of variation on distance interpretation can be
seen by the position of the Sorraia breed in the different trees. The Sorraia is a breed found in
Portugal that may represent an ancestral type of Iberian horse (Andrade, 1926). It has extremely
low variation, both in terms of allelic diversity and heterozygosity, due to a very small founder

9
population size and a very small size of the current population (Luis et al., 2002b; Oom and
Cothran, 1994). In Figures 3 and 4 the Sorraia clusters with the Akhal Teke, a breed from the
Steppes of Central Asia. In Figure 5, the Sorraia is the most divergent horse breed and is placed
between the outgroup and all other breeds. In Figure 6, the Sorraia pairs with the Lusitano,
another Portuguese breed and the one breed in this group that it is most closely related too. If
one were unaware of the low variation of the Sorraia, the true genetic relationships of the breed
could easily be misinterpreted. For example, if only Figure 5 were used the Sorraia could be
considered as a very primitive breed. This may be true, but the primitive position in the tree is
just as likely due to the low variability. Many of the oldest horse breeds do have low variability
but it is not clear if this is a primitive condition or if it is due to small population size. Only the
Arabian horse, of the oldest breeds examined to date, is not a rare or endangered breed.
The Thoroughbred also has very low variation but consistently clusters where it would be
expected in the trees shown. This is primarily due to relatively high number of alleles although
allelic diversity (as measured by effective number of alleles, Ae) and heterozygosity are very low
(Table 3). Rosenberg et al. (2001) also showed that allelic diversity was associated with genetic
distance. In the case of the Thoroughbred, although it has low variation, it has been crossed into
the Holsteiner and the Quarter Horse as well as a number of other breeds in this analysis. Thus,
the Thoroughbred consistently clusters with the appropriate breeds even though only the Sorraia
and Dales Pony have higher mean Da distance value when compared to the other breeds than
does the Thoroughbred (Table 3).
Of the 22 horse breeds used in the analyses reported here, seven could be considered as
rare or endangered. These are the Akhal Teke, Caspian, Chilote, Dales Pony, Fell Pony, Sorraia

10
and Suffolk Punch. What does the genetic distance analysis tell us about these breeds in terms of
distinctiveness and relationship to other breeds?
First, in general, the cluster analyses of the distance measures places all the rare breeds
within the major breed groups that they would be expected to be in, based upon their place of
origin or known history, with the exception of the Sorraia. The Akhal Teke groups primarily
with the Oriental type horses such as the Arab (Figures 5, 6 and 7) as would be expected based
upon their origin on the Asian Steppes. The Caspian Pony, a breed of small horses from Iran,
also fits within this group (Figures 3, 5 and 7). It should be noted that due to the small number
of breeds examined here, major groups are not well defined but they are clearly apparent with a
large number of breeds (see Cothran et al., 1998). The Suffolk, Dales and Fell group together
and with the Haflinger, which is the only other “cold blood” type horse in this analysis (Figures
3, 4, 5, 6 and 7). As noted above, the Connemara could be expected to fit within this group
based upon origins but does not consistently do so due to recent history. The Chilote is a
miniature horse breed from the island of Chiloe off the coast of Chile (Cothran et al., 1993). It
fits within the cluster of other South American and Iberian breeds. The Sorraia is an Iberian
breed as well, but as discussed above, due to the low variation it does not fit consistently into any
cluster.
The distinctiveness of these seven rare breeds is not easy to evaluate. All have mean Da
values at or above the average for all 22 breeds analyzed here (Table 3). This suggests that they
have distinctiveness at least as great as any of the other breeds. To some extent this is likely a
result of reduced genetic diversity due to small population size, which is what defines these
breeds as rare.

11
The only breeds analyzed here that are both rare and closely related (both genetically and
geographically) are the Dales and Fell Pony breeds. The Dales is native to the eastern side of the
Pennines of England while the Fell is found on the western side. The breeds probably share a
common origin from a mixture of horses in the region in Roman times, but have slightly
different histories of cross breeding in more recent times with the Dales being influenced by the
Welsh Cob and Clydesdale to a greater degree than the Fell in the eighteenth and nineteenth
centuries (Hendricks, 1995). The genetic distance analysis clearly shows the close relationship
as the two breeds cluster together in all trees and the distance values between the two are
consistently low. What the distance analysis does not show is which breed you might want to
conserve if there were only resources to preserve one of them. Other physical and historical
factors must be taken into account if such a hypothetical decision had to be made. If the decision
involved preservation of two of the three rare British breeds analyzed here, the Suffolk Punch is
clearly distinct from the Fell and Dales, both physically and genetically, so the decision would
again come down to the two pony breeds. In physical appearance the two are quite similar with
the Dales being slightly smaller. The breeds have similar histories and both have been used for
riding, packing and farm work (Hendricks, 1995). The only factor that might differentiate the
two is that the Fell is known to have a lethal, immune deficiency gene in the population (Fell
Pony Society, personal communication) that has not been reported from the Dales Pony.
However, with small population sizes, a genetic defect could occur in any rare breed. The point
is that genetic distance alone cannot be used to determine the uniqueness of a breed. All known
information must go into decisions about whether a breed is worthy of conservation. Genetic
distance analysis can be used as a tool to confirm suspected relationships or distinctiveness but it

12
is important that a full understanding of the data set analyzed and the history of the breeds be
included in the interpretation of the results.
Genetic conservation of rare breeds of horses is a complex issue. In the developed countries
horses are seldom used in agriculture and conservation of rare breeds is more a matter of
emotional and historical factors than of economic ones. In those countries where horses are still
significant agricultural animals they are usually not organized into distinct breeds. Regardless of
the current use of horses, once a breed or geographic type is gone they are lost forever. It is
important to conserve the different types of horses because preservation of the diversity of types
of horses is preservation of a part of human culture.
References Andrade R., d’. 1926. Apontamentos para um estudo sobre a origem e domesticação do cavalo
na Península Ibérica Aproximações. Centro Tipográfico Colonial, Lisboa, 30 p. Barker, J.S.F., W.G. Hill, D. Bradley, M. Nei, R. Fries, and R.K. Wayne. 1998. Measurement
of domestic animal diversity (MoDAD): original working group report. Fao. Rome. Bjornstad, G. and K.H. Roed. 2001. Breed determination and potential for breed allocation of
horses assessed by microsatellites. Animal Genetics 32:55-65. Canon, J., M.L. Checa, C. Carleos, J.L. Vega-Pla, M. Vallejo, and S. Dunner. 2000. The genetic
structure of Spanish Celtic horse breeds inferred from microsatellite data. Animal Genetics 31:39-48.
Cavalli-Sforza, L.L. and A.W.F. Edwards. 1967. Phylogenetic analysis: models and estimation
procedures. American Journal of Human Genetics 19:233-257. Cothran, E.G., R. Mancilla, J. Oltra, and M. Ortiz. 1993. Genetic analysis of the Chilote horse
from the island of Chiloe-Chile. Archivos De Medicina Veterinaria 25:137-146.
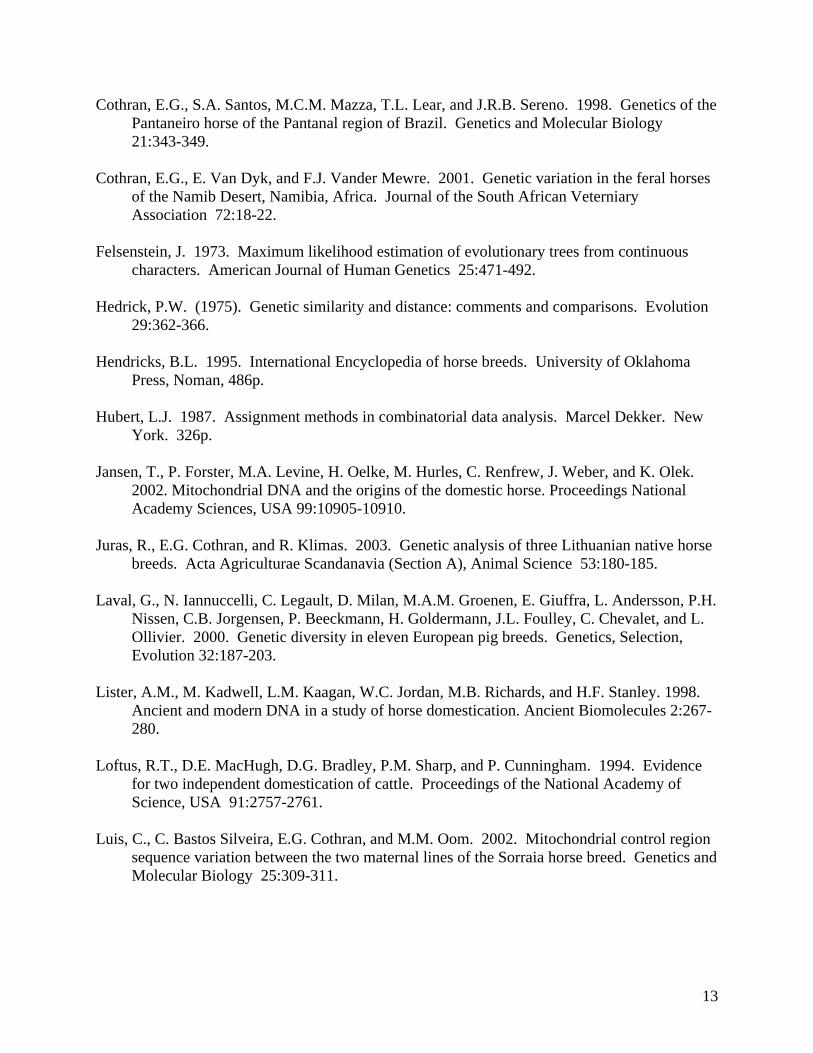
13
Cothran, E.G., S.A. Santos, M.C.M. Mazza, T.L. Lear, and J.R.B. Sereno. 1998. Genetics of the Pantaneiro horse of the Pantanal region of Brazil. Genetics and Molecular Biology 21:343-349.
Cothran, E.G., E. Van Dyk, and F.J. Vander Mewre. 2001. Genetic variation in the feral horses
of the Namib Desert, Namibia, Africa. Journal of the South African Veterniary Association 72:18-22.
Felsenstein, J. 1973. Maximum likelihood estimation of evolutionary trees from continuous
characters. American Journal of Human Genetics 25:471-492. Hedrick, P.W. (1975). Genetic similarity and distance: comments and comparisons. Evolution
29:362-366. Hendricks, B.L. 1995. International Encyclopedia of horse breeds. University of Oklahoma
Press, Noman, 486p. Hubert, L.J. 1987. Assignment methods in combinatorial data analysis. Marcel Dekker. New
York. 326p. Jansen, T., P. Forster, M.A. Levine, H. Oelke, M. Hurles, C. Renfrew, J. Weber, and K. Olek.
2002. Mitochondrial DNA and the origins of the domestic horse. Proceedings National Academy Sciences, USA 99:10905-10910.
Juras, R., E.G. Cothran, and R. Klimas. 2003. Genetic analysis of three Lithuanian native horse
breeds. Acta Agriculturae Scandanavia (Section A), Animal Science 53:180-185. Laval, G., N. Iannuccelli, C. Legault, D. Milan, M.A.M. Groenen, E. Giuffra, L. Andersson, P.H.
Nissen, C.B. Jorgensen, P. Beeckmann, H. Goldermann, J.L. Foulley, C. Chevalet, and L. Ollivier. 2000. Genetic diversity in eleven European pig breeds. Genetics, Selection, Evolution 32:187-203.
Lister, A.M., M. Kadwell, L.M. Kaagan, W.C. Jordan, M.B. Richards, and H.F. Stanley. 1998.
Ancient and modern DNA in a study of horse domestication. Ancient Biomolecules 2:267-280.
Loftus, R.T., D.E. MacHugh, D.G. Bradley, P.M. Sharp, and P. Cunningham. 1994. Evidence
for two independent domestication of cattle. Proceedings of the National Academy of Science, USA 91:2757-2761.
Luis, C., C. Bastos Silveira, E.G. Cothran, and M.M. Oom. 2002. Mitochondrial control region
sequence variation between the two maternal lines of the Sorraia horse breed. Genetics and Molecular Biology 25:309-311.

14
Luis, C., E.G. Cothran, and M.M. Oom. 2002. Microsatellites in Portuguese autochthonous horse breeds: usefulness for parentage testing. Genetics and Molecular Biology 25:131-134.
MacHugh, D.E., R.T. Loftus, P. Cunningham, and D.G. Bradley. 1998. Genetic structure of
seven European cattle breeds assessed using 20 microsatellite markers. Animal Genetics 29:333-340.
Mantel, N.A. 1967. The detection of disease clustering and a generalized regression approach.
Cancer Research 27:209-220. Nei, M. 1972. Genetic distance between populations. American Naturalist 106:283-292. Nei, M., F. Tajima, and Y. Tateno. 1983. Accuracy of estimated phylogenetic trees from
molecular data. Journal of Molecular Evolution 19:153-170. Oom, M.M. and E.G. Cothran. 1994. The genetic variation of an endangered breed: the Sorraia
horse. Animal Genetics 25 (suppl 2):15. Reynolds, J., Weir, B.S., and Cockerham, C.C. 1983. Estimation of the coancestry coefficient:
basis for a short-term genetic distance. Genetics 105:767-779. Rosenberg, N.A., T. Burke, K. Elo, M.W. Feldman, P.J. Freidlin, M.A.M. Groenen, J. Hillel, A.
Maki-Tanila, M. Tixer-Biochard, A. Vignal, K. Wimmerg, and S. Weigend. 2001. Emperical evaluation of genetic clustering methods using multilocus genotypes from 20 chicken breeds. Genetics 159:699-713.
Saitou, N. and M. Nei. 1987. The neighbour-joining method: A new method for reconstructing
phylogenetic trees. Molecular Biology and Evolution 4:406-425. Sandberg, K. and E.G. Cothran. 2000. Biochemical Genetics and Blood Groups. In. The
Genetics of the Horse, Bowling, A.T. and A. Ruvinsky, eds. CABI Publishing, Wallingford, United Kingdom. 527p.
Vila, C., J.A. Leonard, A. Gotherstrom, S. Marklund, K. Sandberg, K. Liden, R.K. Wayne, and
H. Ellegren. 2001. Widespread origins of domestic horse lineages. Science 291:474-477. Wiley, E.O. 1981. Phylogenetics. John Wiley and Sons, New York. 439p.

15
Table 1. Distance matrices calculated from 17 protein loci. Da (above diagonal) and Dc (below diagonal). ANDALUSIAN 0 0.078 0.100 0.095 0.075 0.086 0.081 0.078 0.081 0.148 0.122 0.069 0.086 0.146 0.036 0.075 0.047 0.075 0.195 0.138 0.121 0.156
ARABIAN 0.049 0 0.072 0.100 0.089 0.112 0.080 0.091 0.064 0.158 0.143 0.073 0.106 0.091 0.076 0.066 0.075 0.049 0.196 0.098 0.145 0.083
AKHAL TEKE 0.063 0.045 0 0.099 0.088 0.126 0.074 0.090 0.090 0.142 0.141 0.076 0.088 0.115 0.098 0.075 0.077 0.089 0.157 0.110 0.142 0.118
BRAZILLIAN CRIOLLO 0.060 0.063 0.062 0 0.066 0.111 0.080 0.064 0.118 0.143 0.109 0.071 0.095 0.105 0.092 0.074 0.061 0.073 0.179 0.101 0.128 0.124
CHILEAN CRIOLLO 0.048 0.056 0.056 0.041 0 0.083 0.055 0.049 0.079 0.118 0.100 0.054 0.072 0.118 0.059 0.063 0.047 0.054 0.182 0.096 0.123 0.117
CHILOTE 0.054 0.070 0.079 0.070 0.052 0 0.097 0.077 0.104 0.139 0.117 0.067 0.121 0.148 0.081 0.070 0.084 0.095 0.186 0.167 0.141 0.175
CONNEMARA 0.051 0.051 0.047 0.050 0.035 0.061 0 0.056 0.079 0.118 0.083 0.050 0.077 0.093 0.075 0.064 0.050 0.048 0.200 0.096 0.097 0.114
CAMPOLINA 0.049 0.057 0.057 0.040 0.031 0.049 0.036 0 0.079 0.114 0.090 0.045 0.068 0.111 0.070 0.060 0.037 0.054 0.168 0.098 0.099 0.119
CASPIAN 0.051 0.040 0.057 0.074 0.050 0.066 0.050 0.050 0 0.140 0.134 0.074 0.091 0.122 0.069 0.065 0.055 0.072 0.190 0.113 0.140 0.121
DALES PONY 0.093 0.100 0.089 0.090 0.074 0.088 0.074 0.072 0.088 0 0.072 0.095 0.111 0.161 0.136 0.114 0.121 0.133 0.208 0.128 0.127 0.179
FELL PONY 0.077 0.090 0.089 0.069 0.063 0.074 0.052 0.057 0.084 0.045 0 0.077 0.114 0.165 0.108 0.093 0.092 0.099 0.227 0.109 0.113 0.161
GARRANO 0.044 0.046 0.048 0.045 0.034 0.042 0.031 0.028 0.047 0.060 0.048 0 0.064 0.105 0.055 0.052 0.053 0.046 0.183 0.103 0.091 0.112
HAFLINGER 0.054 0.067 0.056 0.060 0.046 0.076 0.049 0.043 0.057 0.070 0.071 0.040 0 0.147 0.095 0.074 0.071 0.085 0.181 0.088 0.074 0.156
HOLSTEINER 0.092 0.058 0.072 0.066 0.074 0.093 0.059 0.070 0.077 0.101 0.104 0.066 0.093 0 0.121 0.110 0.105 0.068 0.231 0.120 0.167 0.059
LUSITANO 0.023 0.048 0.062 0.058 0.037 0.051 0.047 0.044 0.043 0.086 0.068 0.035 0.060 0.076 0 0.061 0.049 0.057 0.183 0.124 0.121 0.110
PERUVIAN PASO 0.048 0.041 0.047 0.046 0.040 0.044 0.040 0.038 0.041 0.072 0.059 0.033 0.046 0.069 0.038 0 0.060 0.055 0.190 0.096 0.123 0.115
PANTANEIRO 0.030 0.047 0.048 0.038 0.030 0.053 0.032 0.023 0.035 0.076 0.058 0.033 0.045 0.066 0.031 0.038 0 0.049 0.182 0.106 0.105 0.099
QUARTER HORSE 0.047 0.031 0.056 0.046 0.034 0.060 0.030 0.034 0.045 0.084 0.062 0.029 0.053 0.043 0.036 0.035 0.031 0 0.211 0.070 0.106 0.052
SORRAIA 0.123 0.123 0.099 0.113 0.114 0.117 0.126 0.106 0.120 0.131 0.143 0.115 0.114 0.146 0.115 0.119 0.115 0.133 0 0.192 0.205 0.236
STANDARDBRED 0.087 0.062 0.069 0.064 0.060 0.105 0.060 0.062 0.071 0.081 0.068 0.065 0.056 0.075 0.078 0.060 0.067 0.044 0.121 0 0.116 0.114
SUFFOLK PUNCH 0.076 0.092 0.089 0.081 0.077 0.089 0.061 0.063 0.088 0.080 0.071 0.057 0.046 0.105 0.076 0.078 0.066 0.066 0.129 0.073 0 0.176
THOROUGHBRED 0.098 0.052 0.074 0.078 0.074 0.110 0.072 0.075 0.076 0.113 0.102 0.070 0.098 0.037 0.069 0.072 0.062 0.033 0.149 0.072 0.111 0
16
Table 2. Distance matrices calculated from 15 microsatellite loci. Da (below diagonal) and Fst (above diagonal) ANDALUSIAN 0 0.103 0.100 0.092 0.100 0.087 0.091 0.090 0.086 0.169 0.124 0.071 0.167 0.152 0.060 0.099 0.092 0.062 0.229 0.091 0.102 0.090
ARABIAN 0.181 0 0.080 0.114 0.142 0.092 0.108 0.103 0.074 0.181 0.142 0.086 0.190 0.138 0.067 0.103 0.101 0.087 0.229 0.095 0.157 0.123
AKHAL TEKE 0.160 0.105 0 0.114 0.129 0.075 0.077 0.107 0.075 0.150 0.114 0.056 0.162 0.106 0.064 0.098 0.092 0.060 0.223 0.100 0.096 0.109
BRAZILLIAN CRIOLLO 0.153 0.198 0.180 0 0.077 0.057 0.080 0.057 0.076 0.119 0.108 0.059 0.145 0.137 0.093 0.065 0.072 0.061 0.242 0.081 0.119 0.112
CHILEAN CRIOLLO 0.174 0.219 0.203 0.117 0 0.087 0.090 0.095 0.085 0.133 0.118 0.081 0.145 0.159 0.111 0.087 0.100 0.086 0.249 0.105 0.128 0.122
CHILOTE 0.157 0.147 0.101 0.116 0.147 0 0.064 0.047 0.054 0.112 0.107 0.027 0.132 0.121 0.065 0.052 0.056 0.050 0.219 0.087 0.094 0.099
CONNEMARA 0.181 0.174 0.121 0.161 0.191 0.125 0 0.087 0.072 0.116 0.082 0.054 0.109 0.109 0.082 0.078 0.097 0.060 0.260 0.080 0.090 0.117
CAMPOLINA 0.150 0.182 0.170 0.113 0.167 0.103 0.185 0 0.069 0.126 0.114 0.050 0.135 0.174 0.081 0.059 0.075 0.068 0.196 0.098 0.124 0.132
CASPIAN 0.163 0.111 0.090 0.155 0.178 0.096 0.125 0.144 0 0.106 0.082 0.038 0.107 0.107 0.069 0.062 0.060 0.058 0.202 0.062 0.095 0.104
DALES PONY 0.266 0.286 0.223 0.240 0.245 0.196 0.192 0.228 0.194 0 0.062 0.084 0.140 0.199 0.159 0.112 0.130 0.125 0.303 0.145 0.120 0.186
FELL PONY 0.224 0.227 0.190 0.231 0.245 0.196 0.163 0.233 0.163 0.107 0 0.070 0.113 0.165 0.131 0.108 0.120 0.098 0.282 0.106 0.097 0.154
GARRANO 0.139 0.165 0.110 0.130 0.162 0.073 0.117 0.120 0.094 0.138 0.142 0 0.112 0.103 0.054 0.052 0.053 0.040 0.199 0.069 0.066 0.088
HAFLINGER 0.259 0.303 0.222 0.251 0.247 0.218 0.172 0.254 0.180 0.224 0.210 0.193 0 0.206 0.155 0.136 0.156 0.134 0.279 0.139 0.120 0.198
HOLSTEINER 0.230 0.185 0.148 0.224 0.254 0.177 0.165 0.277 0.173 0.313 0.284 0.181 0.296 0 0.129 0.148 0.129 0.101 0.314 0.119 0.131 0.086
LUSITANO 0.123 0.113 0.103 0.165 0.181 0.116 0.143 0.159 0.106 0.249 0.231 0.115 0.234 0.176 0 0.079 0.082 0.045 0.185 0.084 0.107 0.091
PERUVIAN PASO 0.163 0.182 0.159 0.135 0.148 0.103 0.173 0.131 0.138 0.217 0.220 0.146 0.248 0.247 0.145 0 0.061 0.061 0.213 0.086 0.118 0.121
PANTANEIRO 0.148 0.187 0.179 0.125 0.170 0.130 0.203 0.128 0.141 0.242 0.253 0.135 0.263 0.253 0.161 0.134 0 0.080 0.251 0.102 0.080 0.125
QUARTER HORSE 0.134 0.128 0.085 0.117 0.153 0.097 0.103 0.150 0.100 0.213 0.178 0.096 0.211 0.141 0.086 0.130 0.164 0 0.206 0.038 0.085 0.044
SORRAIA 0.340 0.308 0.327 0.376 0.349 0.321 0.418 0.305 0.288 0.430 0.426 0.319 0.378 0.469 0.253 0.303 0.366 0.312 0 0.244 0.263 0.246
STANDARDBRED 0.170 0.140 0.136 0.156 0.213 0.152 0.156 0.192 0.119 0.269 0.208 0.157 0.245 0.197 0.144 0.180 0.205 0.082 0.351 0 0.114 0.074
SUFFOLK PUNCH 0.153 0.238 0.150 0.193 0.228 0.144 0.148 0.192 0.148 0.178 0.177 0.102 0.164 0.201 0.151 0.214 0.147 0.145 0.381 0.195 0 0.126
THOROUGHBRED 0.171 0.170 0.139 0.171 0.213 0.156 0.189 0.218 0.169 0.312 0.282 0.160 0.316 0.133 0.155 0.200 0.229 0.073 0.357 0.119 0.216 0

17
Table 3. Hardy-Weinberg expected heterozygosity (He), effective number of alleles (Ae) and average Da distance for the 22 horse breeds, based upon protein data. Breed He Ae Da Dales Pony .382 2.026 .133 Arabian .392 2.029 .097 Caspian .404 2.066 .099 Thoroughbred .319 1.842 .128 Quarter Horse .439 2.585 .078 Holsteiner .424 2.275 .124 Standardbred .419 2.030 .113 Akhal Teke .411 2.157 .103 Andalusian .425 2.362 .099 Lusitano .410 2.352 .089 Suffolk Punch .466 2.282 .127 Haflinger .458 2.534 .098 Chilean Criollo .457 2.763 .085 Campolino .457 2.589 .082 Peruvian Paso .469 2.575 .084 Garrano .447 2.361 .077 Brazilian Criollo .463 2.569 .099 Fell Pony .416 2.224 .117 Sorraia .358 1.876 .194 Chilote .449 2.392 .114 Pantaneiro .439 2.534 .077 Connemara .490 2.770 .084

18
Figure 1. Scatter diagram of matrix correlation of Nei’s D vs chord distance Dc both based upon 17 protein loci. 0.00 0.05 0.10 0.15 0.20 0.25 0.30 0.35 |----------|---------|---------|---------|---------|---------|---------| | | | | | * | 6.00 - * * - | | | | | * | | * * | | * | | * * * | | * * * | | ** * ** | | * *2 | 2.00 - * - | * 2 | | * * * * * | | * | | * * ** * | | 2 3 * *2 | | *** * | | * * * | | * 2*3* ** 2 | | 2 3*23* * | 8.00 - *2**2 2 * ****** - | * 22 23 | | ***3*4** | | 232*3*3 | | *43*** * | | * 3**2** | | * 3 443*4** | | * *4232** | | * 2*2 2 * | | 22 3* | 4.00 - 432* * - | 3222* | | | | * * | | | | | |----------|---------|---------|---------|---------|---------|---------| 0.00 0.05 0.10 0.15 0.20 0.25 0.30 0.35

19
Figure 2. Scatter diagram of matrix correlation of Nei’s D based upon 17 protein loci vs D, based upon 15 microsatellite loci. 0.00 0.05 0.10 0.15 0.20 0.25 0.30 .35 |----------|---------|---------|---------|---------|---------|--------| | | | | | * | | | 1.00 - - | * | | | | | | | | * * | | | | | | | | | 0.75 - * - | | | ** * | | * * * * * | | * * * * | | * * 2 * * | | ** * * | | ** * * * * | | * * * * | | 2* * * | 0.50 - ** * * * - | *22** **2 ** * * | | **2 * * 2 * ** * | | 2 2** *** * | | * **33*2**2 * * * * | | * **33 22* *2 * | | *3* 22 42*22*3 2 * * | | 2*** 3* * 3* * * | | *2* **23* 2* * * * | | * *****2 * 22 * | 0.25 - * 2 2* ** 2* * * - | **22**2* * * | | ** * * | | * | | * * | | | |----------|---------|---------|---------|---------|---------|--------| 0.00 0.05 0.10 0.15 0.20 0.25 0.30 0.35
20
Figure 3. NJ clustering of Da distance based upon protein loci
Figure 4. NJ clustering of Dc distance based upon protein loci
PRZEWALSKI
STANDARDBRED
FELL PONY
DALES PONY
72
25
SUFFOLK PUNCH
HAFLINGER
45
27
ARABIAN
QUARTER HORSE
THOROUGHBRED
HOLSTEIN
95
57
42
CASPIAN PONY
PANTANEIRO
ANDALUSIAN
LUSITANO
96
27
28
4
PERUVIAN PASO
BRAZILIAN CRIOLLO
13
CHILIAN CRIOLLO
CONNEMARA
19
4
CAMPOLINA
GARRANO
CHILOTE
19
6
5
8
AKHAL TEKE
SORRAIA
42

21
Figure 5. NJ clustering of Da distance based upon microsatellites.
Figure 6. NJ clustering Fst distance based upon microsatellites.
E ASINUS
SORRAIA
LUSITANO
CASPIAN
ARABIAN
AKHAL-TEKE
36
STANDARDBRED
QUARTER HORSE
HOLSTEINER
THOROUGHBRED
74
36
21
7
5
1
ANDALUSIAN
CHILOTE
GARRANO
CONNEMARA
DALES PONY
FELL PONY
98
HAFLINGER
SUFFOLK PUNCH
43
23
16
20
10
BRAZILLIAN CRIOLLO
CHILEAN CRIOLLO
50
CAMPOLINA
PANTANEIRO
16
7
PERUVIA PASO
0
0
1
72
E ASINUS
CHILEAN CRIOLLO
CONNEMARA
SUFFOLK PUNCH
HAFLINGER
DALES PONY
FELL PONY
94
46
15
15
ANDALUSIAN
ARABIAN
AKHAL-TEKE
34
LUSITANO
SORRAIA
28
4
3
HOLSTEINER
THOROUGHBRED
77
QUARTER HORSE
STANDARDBRED
36
17
2
CASPIAN
GARRANO
BRAZILLIAN CRIOLLO
CAMPOLINA
29
PERUVIA PASO
PANTANEIRO
18
2
CHILOTE
4
1
0
3
23

22
Figure 7. RML dendrogram of Dc distance based upon protein loci.
Figure 8. UPGMA clustering of Fst distance based upon microsatellites.
PRZEWALSKI
GARRANO
CONNEMARA
PERUVIAN PASO
STANDARDBRED
QUARTER HORSE
HOLSTEIN
THOROUGHBRED
95
66
37
AKHAL TEKE
SORRAIA
43
CASPIAN PONY
ARABIAN
21
9
7
4
CHILIAN CRIOLLO
BRAZILIAN CRIOLLO
PANTANEIRO
CAMPOLINA
26
30
16
CHILOTE
ANDALUSIAN
LUSITANO
96
21
6
7
7
15
SUFFOLK PUNCH
HAFLINGER
62
23
FELL PONY
DALES PONY
78
E ASINUS
SORRAIA
HOLSTEINER
SUFFOLK PUNCH
ANDALUSIAN
LUSITANO
31
THOROUGHBRED
QUARTER HORSE
STANDARDBRED
52
42
7
CHILEAN CRIOLLO
BRAZILLIAN CRIOLLO
CONNEMARA
PANTANEIRO
CASPIAN
PERUVIA PASO
CAMPOLINA
CHILOTE
GARRANO
89
31
11
4
4
6
5
5
2
ARABIAN
AKHAL-TEKE
26
2
2
8
HAFLINGER
DALES PONY
FELL PONY
88
34
19
88
99

23
Figure 9. Reduced median network based upon 288 bp sequences of the mtDNA D-Loop region. Colors indicate different haplogroups. Circles correspond to different haplotypes and are proportional to the number of individuals with the same haplotype. AD-Andalusian; AR-Arabian; AT-Akhal-Teke; BZ-Brazilian Criollo; CC-Chilean Criollo; CI-Chilote; CO-Connemara; ; CP-Campolina; CS-Caspian; FL-Fell Pony; FR-Friesian; GR-Garrano; HF-Haflinger; HO-Holsteiner; LU-Lusitano; PN-Pantaneiro; SO-Sorraia; SU-Suffolk Punch; TB-Thoroughbred.

24
Figure 10. Plot of mean heterozygosity calculated from 17 protein loci and average Da distance for 22 horse breeds.
0.3
0.32
0.34
0.36
0.38
0.4
0.42
0.44
0.46
0.48
0.5
0.06 0.08 0.1 0.12 0.14 0.16 0.18 0.2
Da distance
Het
ero
zyg
osi
ty
Related Documents