Hereditas 127: 239-248 (1997) Genetic differences between two wild and one farmed population of Atlantic salmon (Salmo salar) revealed by three classes of genetic markers I. B. MJMLNERm], U. H. REFSETH’, E. KARLSEN2, T. BALSTAD], K. S. JAKOBSEN’ and K. HINDAR’ ‘ Division of General Genetics, Department of Biology, University of Qslo, Blindern, Oslo, Norway Norwegian Institute for Nature Research (NINA), Trondheim, Norway Mjelnerad, I. B., Refseth, U. H., Karlsen, E., Balstad, T., Jakobsen, K. S. and Hindar, K. 1997. Genetic differences between two wild and one farmed population of Atlantic salmon (Salmo salar) revealed by three classes of genetic markers. - Hereditas 127: 239-248. Lund, Sweden. ISSN 0018-0661. Received April 7, 1997. Accepted August 21, 1997 Genetic diversity within and between two wild and one farmed population of Atlantic salmon was estimated by 12 variable enzyme loci, three single locus- and one multilocus DNA minisatellite probe. The farmed salmon were fifth-generation fish from one of the principal commercial strains in Norway and the wild salmon were from the rivers Numedalslagen and Tana, Norway. All three classes of markers detected significant differentiation between the populations, with the farmed population being genetically most divergent. The farmed fish showed less genetic variability than the wild populations, as all techniques revealed a lower (14 %-45 %) number of variable bands/alleles in this group. However, only multilocus DNA fingerprinting detected a significantly lower level of heterozygosity within the farmed population. Estimates of average heterozygosity within populations were almost identical for single locus and multilocus minisatellites (0.558 and 0.548, respectively), which were more than three times higher than for polymorphic allozymes (0.162). Estimates of interpopulation genetic differentiation, however, gave highly concordant results between the allozymes and minisatellites (Fst range: 0.106-0.135). Our results show that fifth generation farmed Atlantic salmon differ significantly from wild salmon in loci others than those chosen for selection in the breeding program. The study also suggests that the choice of genetic markers for studies of Atlantic salmon depends on the aim of the study (within- versus between-population variability). Ingrid B. Mjdnerad, Directorate for Nature Management, Tungasletta 2, NO- 7005 Trondheim, Norway. E-mail: mjol- [email protected] Genetic variation of Atlantic salmon (Salmo salar) has been extensively surveyed by enzyme elec- trophoresis (ALLENDORF and UTTER 1979; STAHL 1981, 1987; RYMAN and STAHL 1981; HEGGBERGET et al. 1986; JORDAN et al. 1992; ELOet al. 1994). The amount of genetic variability detected by this tech- nique is relatively limited for Atlantic salmon, and in the most comprehensive study to date (STAHL 1987), 90% of the genetic diversity throughout the species range was accounted for by three enzyme loci. Due to low levels of variation in mitochondria1 DNA (KING et al. 1993), the development of single locus mini- satellite DNA probes (TAGGART and FERGUSON 1990) was the first real alternative to enzyme analyses for population level investigations on this species. Now, several single locus DNA probes are available for Atlantic salmon (BENTZEN et al. 1993; TAGGART et al. 1995a) and, lately, also some multilocus mini- satellite probes (REFSETH et al. 1994; HEATH et al. 1995) and microsatellite primers (SLETTAN et al. 1993; MCCONNELL et al. 1995; SANCHEZ et al. 1996) have shown to be applicable for this species. Despite the great potential of these highly variable DNA markers, relatively few studies have applied them in analyses of intra- and interpopulation genetic vari- ability in Atlantic salmon (GALVIN 1995; Mc- CONNELL et al. 1995; TAGGART et al. 1995b; SANCHEZ et al. 1996). In other species, minisatellites have predominantly been used in analyses of relatedness between indi- viduals within natural populations (BURKE and BRU- FORD 1987; WETTON et al. 1987; BURKE et al. 1991), but studies have also documented their usefulness for identifying population differentiation (FAULKES et al. 1990; GILBERT et al. 1990; REEVE et al. 1990; WAYNE et al. 1991; TRIGGS et al. 1992; DEGNAN 1993; SCRIBNER et al. 1994). However, studies com- paring the levels of interpopulation genetic differenti- ation detected by allozymes and DNA minisatellite analyses, have shown differing results. A consistent pattern between the two types of markers has been shown for brown trout (Salrno trutta) (PRODOHL et al. 1992; LAIKRE et al. 1995). For the common toad (Bufo bufo), the levels of genetic differentiation were higher for allozymes compared with DNA minisatel- lite analyses (SCRIBNER et al. 1994), while a study of Atlantic salmon sampled from various parts within a single river system, showed slightly but non-signifi- cantly higher F,, values for single locus DNA mini- satellites than for allozymes (GALVIN 1995). Clearly,

Welcome message from author
This document is posted to help you gain knowledge. Please leave a comment to let me know what you think about it! Share it to your friends and learn new things together.
Transcript

Hereditas 127: 239-248 (1997)
Genetic differences between two wild and one farmed population of Atlantic salmon (Salmo salar) revealed by three classes of genetic markers I. B. MJMLNERm], U. H. REFSETH’, E. KARLSEN2, T. BALSTAD], K. S. JAKOBSEN’ and K. HINDAR’
‘ Division of General Genetics, Department of Biology, University of Qslo, Blindern, Oslo, Norway Norwegian Institute for Nature Research (NINA), Trondheim, Norway
Mjelnerad, I. B., Refseth, U. H., Karlsen, E., Balstad, T., Jakobsen, K. S. and Hindar, K. 1997. Genetic differences between two wild and one farmed population of Atlantic salmon (Salmo salar) revealed by three classes of genetic markers. - Hereditas 127: 239-248. Lund, Sweden. ISSN 0018-0661. Received April 7, 1997. Accepted August 21, 1997
Genetic diversity within and between two wild and one farmed population of Atlantic salmon was estimated by 12 variable enzyme loci, three single locus- and one multilocus DNA minisatellite probe. The farmed salmon were fifth-generation fish from one of the principal commercial strains in Norway and the wild salmon were from the rivers Numedalslagen and Tana, Norway. All three classes of markers detected significant differentiation between the populations, with the farmed population being genetically most divergent. The farmed fish showed less genetic variability than the wild populations, as all techniques revealed a lower (14 %-45 %) number of variable bands/alleles in this group. However, only multilocus DNA fingerprinting detected a significantly lower level of heterozygosity within the farmed population. Estimates of average heterozygosity within populations were almost identical for single locus and multilocus minisatellites (0.558 and 0.548, respectively), which were more than three times higher than for polymorphic allozymes (0.162). Estimates of interpopulation genetic differentiation, however, gave highly concordant results between the allozymes and minisatellites (Fst range: 0.106-0.135). Our results show that fifth generation farmed Atlantic salmon differ significantly from wild salmon in loci others than those chosen for selection in the breeding program. The study also suggests that the choice of genetic markers for studies of Atlantic salmon depends on the aim of the study (within- versus between-population variability).
Ingrid B. Mjdnerad, Directorate for Nature Management, Tungasletta 2, NO- 7005 Trondheim, Norway. E-mail: mjol- [email protected]
Genetic variation of Atlantic salmon (Salmo salar) has been extensively surveyed by enzyme elec- trophoresis (ALLENDORF and UTTER 1979; STAHL 1981, 1987; RYMAN and STAHL 1981; HEGGBERGET et al. 1986; JORDAN et al. 1992; ELO et al. 1994). The amount of genetic variability detected by this tech- nique is relatively limited for Atlantic salmon, and in the most comprehensive study to date (STAHL 1987), 90% of the genetic diversity throughout the species range was accounted for by three enzyme loci. Due to low levels of variation in mitochondria1 DNA (KING et al. 1993), the development of single locus mini- satellite DNA probes (TAGGART and FERGUSON 1990) was the first real alternative to enzyme analyses for population level investigations on this species. Now, several single locus DNA probes are available for Atlantic salmon (BENTZEN et al. 1993; TAGGART et al. 1995a) and, lately, also some multilocus mini- satellite probes (REFSETH et al. 1994; HEATH et al. 1995) and microsatellite primers (SLETTAN et al. 1993; MCCONNELL et al. 1995; SANCHEZ et al. 1996) have shown to be applicable for this species. Despite the great potential of these highly variable DNA markers, relatively few studies have applied them in analyses of intra- and interpopulation genetic vari-
ability in Atlantic salmon (GALVIN 1995; Mc- CONNELL et al. 1995; TAGGART et al. 1995b; SANCHEZ et al. 1996).
In other species, minisatellites have predominantly been used in analyses of relatedness between indi- viduals within natural populations (BURKE and BRU- FORD 1987; WETTON et al. 1987; BURKE et al. 1991), but studies have also documented their usefulness for identifying population differentiation (FAULKES et al. 1990; GILBERT et al. 1990; REEVE et al. 1990; WAYNE et al. 1991; TRIGGS et al. 1992; DEGNAN 1993; SCRIBNER et al. 1994). However, studies com- paring the levels of interpopulation genetic differenti- ation detected by allozymes and DNA minisatellite analyses, have shown differing results. A consistent pattern between the two types of markers has been shown for brown trout (Salrno trutta) (PRODOHL et al. 1992; LAIKRE et al. 1995). For the common toad (Bufo bufo), the levels of genetic differentiation were higher for allozymes compared with DNA minisatel- lite analyses (SCRIBNER et al. 1994), while a study of Atlantic salmon sampled from various parts within a single river system, showed slightly but non-signifi- cantly higher F,, values for single locus DNA mini- satellites than for allozymes (GALVIN 1995). Clearly,

240 I. B. Mialnersd et ul. Hereditas 127 (1997)
more comparative studies are needed to explain the variable patterns of differentiation for the two types of markers.
In this study, three classes of genetic markers were employed to evaluate the genetic variability within and between Norwegian farmed and wild salmon. About 65% of the farmed Atlantic salmon in Nor- way originates from a breeding program initiated in 197 1 (Jerrn Ekrem, NLA, Kyrkszterarra, Norway, personal communication), and consists of four se- lected strains which are based on parental fish col- lected from about 40 wild populations along the coast of Norway (GJEDREM et al. 1991). Each of these four strains have gone through five to six generations of selection in a breeding program which seeks to max- imise genetic and phenotypic parameters for eco- nomic traits. One of the four strains of Norwegian farmed salmon was chosen for this study along with a northern (the River Tana) and a southern (the River Numedalsligen) Norwegian wild population that are both presumed to be unaffected by fish culture practices. In the mid 1980s, significant al- lozyme heterogeneity was found between populations of wild Atlantic salmon in Norway as well as between different populations of farmed salmon (STAHL and HINDAR 1988). However, no evidence for a loss of genetic variation in Norwegian farmed salmon rela- tive to wild salmon was found.
Our primary objectives were twofold; (1) to com- pare allozyme-, single locus- and multilocus mini- satellite analyses for estimating genetic diversity of Atlantic salmon, and (2) to provide information about the level of genetic variability within one strain of Norwegian farmed salmon and two wild populations as well as the degree of genetic differentiation between them. Using literature data, we also compare the farmed salmon with its principal founding population from the River Namsen (VUORINEN and BERG 1989).
MATERIALS AND METHODS
Fish samples
Wild juvenile salmon were sampled in 1993 by elec- trofishing in the River Jiesjokka (a tributary of the River Tana, at 69"N, 24"E) and in the River Numedalsligen (59"N, 9"E) in Norway (Fig. I). Thirty individuals from each population were analysed for allozymes, and 20 of them were DNA fingerprinted. In addition, allozyme data of 104 indi- viduals electrofished in Jiesjokka in 1988, were added to increase the dataset from the River Tana (no significant allele frequency heterogeneities were ob- served between these samples; X2-tests, P > 0.5 for all loci). The wild juveniles represented five year classes
from the River Tana, and three from the River Numedalsligen, and were sampled over an area of more than 200 meters to reduce the likelihood of capturing siblings (we found no significant allele fre- quency heterogeneities between yearclasses within each population; X2-tests, P > 0.09 for all enzyme- and single locus DNA loci). The third population was farmed salmon produced at the main breeding station for Atlantic salmon at Kyrksaetererra in Norway. This sample represents fifth generation offspring of "the 1972-population" (i.e., the breeding strain founded on fish hatched in 1972), one of the four strains from the main breeding program of farmed Norwegian salmon (GJEDREM et al. 1991). In 1992 a sample of 100 individuals were chosen at random from one- summer old parr. They were all analysed for al- lozymes, and 20 were in addition DNA fingerprinted. For DNA fingerprinting, one fin was removed after killing and preserved in 96 YO ethanol for DNA ex- traction. The rest of the fish was immediately frozen on dry ice, and tissue samples of skeletal muscle, liver and eye were later dissected and stored at -70°C until required for enzyme electrophoretic analysis.
Enzyme electrophoresis
Horizontal starch gel electrophoresis was performed as described by AEBERSOLD et al. (1987). The buffer systems used, the proteins examined, and the genetic interpretations of the electrophoretic banding pat- terns followed STAHL (1987), with additional systems being described by JORDAN et al. (1992), ELO et al. (1994), WILSON et a]. (1995) and L. BOURKE and T. CROSS (University College Cork, Ireland, personal communication). The designation of loci, alleles, and genotypes is according to SHAKLEE et al. (1990).
50"N
Fig. 1. Map of northwestern Europe showing sampling locations for wild ( 0 ) and farmed (*) Atlantic salmon in Norway.

Hereditas 127 (1 997) Genetic diversity of wild and farmed Atlantic salmon 241
Genetic variation was found at the following 12 loci (the observed variant alleles are added to the locus designation): aspartate aminotransferase A A T- 4*25, *SO, creatine phosphokinase CK-1,2*82, fruc- tose-biphosphate aldolase FBALD-3*95, N-acetyl f3-glucosaminidase /3GLUA*80, isocitrate dehydroge- nase ZDHP-3* 130, L-iditol (sorbitol) dehydrogenase ZDDH-l*20, ZDDH-2*-80, *60, L-lactate dehydroge- nase LDH-4*60, malate dehydrogenase MDH- 1 * 10, MDH-3,4*80, malic enzyme MEP-2*125, and triosephosphate isomerase TPZ-3* 105. Variation at the duplicate MDH-3,4* and CK-1,2* loci was arbi- trarily assigned to MDH-3* and CK-1*, respectively. Variation at the duplicate IDDH-1,2* could be as- signed to one locus or the other because of slight differences in mobility between the two loci; the most anodally migrating locus being ZDDH-2* (ELO et al. 1994). Allele frequencies were estimated by direct allele counts. An additional 36 loci were monomor- phic in all populations.
DNA extraction, digestion, electrophoresis and Southern blotting
DNA was extracted from about 50 mg fin tissue following the protocol described by TAGGART et al. (1992). About 10 pg DNA was digested over night with Alu I followed by heat inactivation at 65°C for 30 min. Glycerol and bromophenol blue loading buffer containing 25 ng 1 kb ladder and 25 ng digested hDNA (Hind 111, Xmn I) was added to each of the digested samples as internal markers. DNA was separated in 1.2 % agarose gels at approximately 1.4 V/cm for 48 h in 1 x TAE buffer (0.04 M Tris- acetate, 0.001 M EDTA). At the end of the run, 2 ng of OX174 was loaded into each well to indicate the application origo. The gel was allowed to run for 15 more min. The separated DNA was then transferred to a Hybond Nfp membrane (Amersham Interna- tional, U.K.) according to the manufacturer’s recom- mendation, and was finally fixed by both UV-crosslinking and baking for 2 h at 80°C.
Probe labeling and hybridization
Multilocus DNA -probe. -The construction and la- beling of the 813 bp M13 probe template followed the description by REFSETH et a]. (1 994). For the internal markers, 20 ng each of lkb ladder and digested hDNA were labeled by random priming (FEINBERG and VOGELSTEIN 1983). Both, when hybridizing with the 813 bp M13, the single locus probes and the internal markers, 20 ng of OX174 labeled by random priming, were added to the hybridization solution. Prehybridization and hybridization were carried out in 1 x SSC-equivalent buffer (GALAU et al. 1986) with no blocking DNA over night at 65°C. Post-
hybridization washing was also performed at 65°C with 1 x SSC-equivalent buffer three times for 15 min. The exposure times for autoradiography were from a few hours to several days, depending on the strength of signal.
Single locus DNA-probes. -The E4 and B5 single locus probes (THOMAZ 1995) were each cloned into a charomid vector and excised from the vector with EcoRI. The pSsa-A45/1 probe (TAGGART and FER- GUSON 1990) was subcloned into Bluescript I1 KS( -) and subsequently excised with Sau 3AI. The three single locus probes were purified from an agarose gel using Qiaex TM (Qiagen Inc., USA). The probes were labeled by random priming and prehybridized, hybridized and washed at 65°C according to Amer- sham’s protocol for single locus hybridization, with salmon sperm DNA (25 pg/mL) added to the hy- bridization solution. The exposure times for autora- diography were from a few hours to several days, depending on the strength of signal.
DNA jingerprint analyses
Four gels were run altogether, with 30 samples on each gel. Slight differences in gelrunning conditions restrict analysis of bandsharing across gels, and as a consequence each individual was run twice; i.e., on two different gels. For two of the gels, the individuals from each population were grouped 10 and 10. For the two additional gels, the individuals from the two “grouped” gels were mixed. On each gel there were 10 individuals from each population, which made it possible to calculate intra- and interpopulation simi- larity values for multilocus minisatellites for all four gels. Only clearly resolvable bands were scored visu- ally (by two persons independent of each other in the case of multilocus minisatellites, making up eight scorings), using monomorphic bands and internal markers as references.
Statistical analyses
Deviations from Hardy-Weinberg equilibrium expec- tations and linkage-disequilibrium between loci were analysed using exact tests (ROUSSET and RAYMOND 1997, and references therein) available in the com- puter program package GENEPOP 2.0 (RAYMOND and ROUSSET 1995) for both allozymes and single locus DNA fingerprinting. For these markers, unbi- ased estimators of F-statistics (the extent of interpop- ulation-, intrapopulation and global genetic diversity expressed as F,,, F, and Fit) were calculated using the method of WEIR and COCKERHAM (1984) in the computer program Fstat (GOUDET 1995). The same program was used to perform one-sided tests for allele frequency heterogeneity among populations ex-
242 I. B. M i h e r e d et ul. Hereditas 127 (1997)
pressed as the significance of F,,, using permutation procedures.
Multilocus minisatellite band sharing coefficients (similarity- or S-values) were calculated using similar- ity statistics; S,, = 2N,,/(N, + N,), where N, and N, are the number of fragments in individual x and y, respectively, and N,, is the number of common bands scored (WETTON et al. 1987). All possible pairwise comparisons between all the individuals on each gel were made, making up a large dataset. An effect of comparing all individuals, is that the data are not independent. Consequently, a MANTEL (1967) type of matrix randomization (permutation) test (MANLY 1994) was chosen to assess whether intrapopulation bandsharing values were significantly higher than in- terpopulation values (the significance of F,,), and to test for differences in intrapopulation S-values be- tween populations. Estimates of heterozygosity based on multilocus DNA fingerprinting were performed as described by STEPHENS et al. (1992), and F,, was calculated as F,, = (H, - H,)/H, according to NEI (1973) where H, is the average expected heterozygos- ity in the whole sample, and H, is the average ex- pected heterozygosity within subpopulations. A nonparametric analysis of variance (Wilcoxon-Mann- Whitney U test) was performed to test for differences in expected heterozygosity between populations, us- ing four values of expected heterozygosity (the two gels with 10 individuals grouped from each popula- tion, scored by two persons) calculated for each population. The same test was used to compare levels of heterozygosity within populations from the al- lozyme- and single locus fingerprinting data, using the expected heterozygosity of each locus as a variate.
Differences in the number of alleles (allozymes and single locus fingerprinting) and the number of vari- able bands (based on multilocus fingerprints of the two gels with 10 individuals grouped from each popu- lation, scored by two persons) between wild and farmed fish were tested using the Wilcoxon-Mann- Whitney U analysis of variance. Since the number of individuals analysed for allozymes varied among the populations, only the first 30 individuals sampled from each population were used to count the number of enzyme alleles per locus. For all statistical analy- ses, the sequential Bonferroni procedure (RICE 1989) was used to correct the significance level for multiple simultaneous tests.
RESULTS
Intrapopuhtion genetic diversity
The DNA and protein markers differed in overall genetic variability, but they all revealed a higher
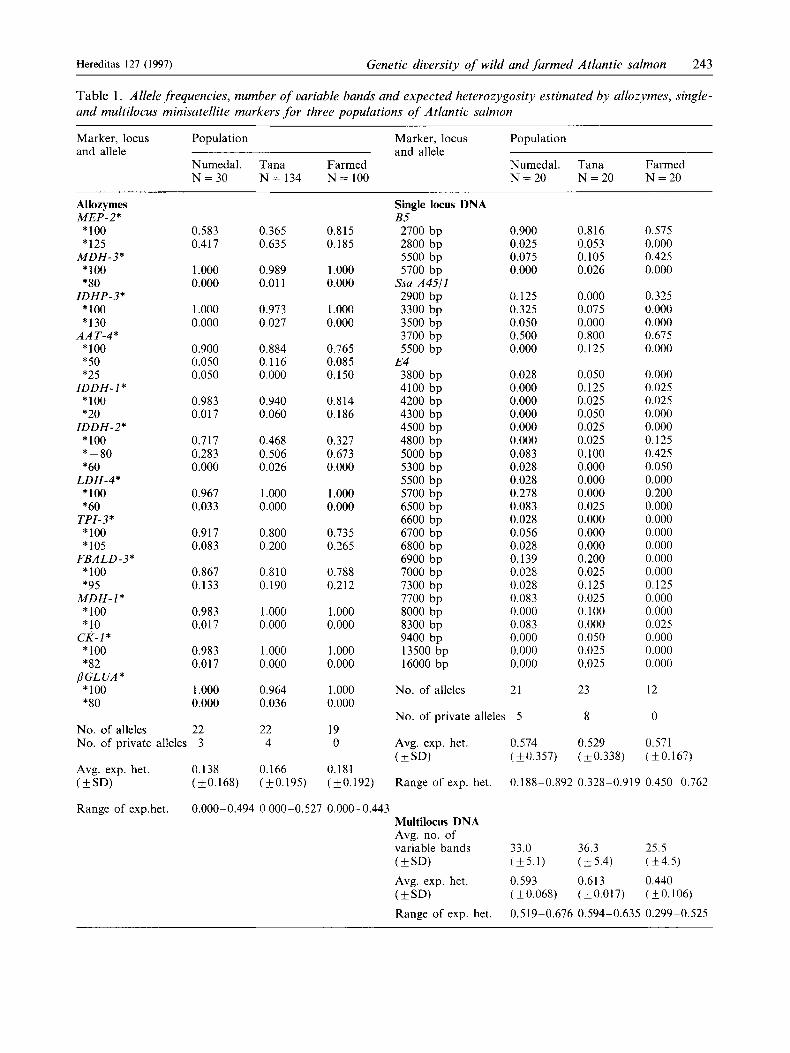
number of alleles within the wiid populations as compared with the farmed population (Table 1). The estimates of average heterozygosity within popula- tions were almost identical for single locus- and mul- tilocus minisatellites (0.558 and 0.548, respectively), being more than three times higher than the estimate based on polymorphic allozymes (0.162).
The allozyme analyses revealed totally 26 alleles distributed among 12 polymorphic loci. The number of alleles detected in the farmed population was lower than in either of the two wild populations (about 14 Yo reduction), but the difference was not statisti- cally significant (P > 0.05). In spite of the lower num- ber of alleles, the farmed population expressed the highest average expected heterozygosity of the three populations, although the variation in this parameter was not significant among populations (P > 0.05). No Statistically significant linkage disequilibria between allozyme loci were observed after sequential Bonfer- roni correction for multiple tests. No statistically significant deviations from Hardy-Weinberg equi- librium were detected in any of the populations, except for a heterozygote deficiency in the farmed population at the enzyme locus IDDH-2* (P < 0.001 after Bonferroni correction).
The single locus DNA minisatellites were highly polymorphic compared with the allozymes with 32 alleles observed at the three loci. The farmed popula- tion exhibited a 45 YO reduction in number of alleles compared with the two wild populations (Table 1). However, the difference was not statistically signifi- cant. As with the allozymes, no significant variation in average expected heterozygosity was found for the minisatellite DNA loci (P > 0.05). No statistically significant linkage disequilibrium was detected for the single locus probes, but one deviation from Hardy- Weinberg equilibrium was registered as a statistically significant heterozygote deficiency in the Tana popu- lation at the minisatellite locus E4 (P < 0.001 after Bonferroni adjustment). This deviation might be ex- plained by the possible false scoring of heterozygotes of similar allele sizes as homozygotes (O'REILLY and WRIGHT 1995).
The multilocus DNA fingerprints revealed clearly resolvable banding patterns, and independent scoring of the multilocus DNA fingerprints by two persons resulted in highly concordant bandsharing values. The mean bandsharing values are summarised in Table 2. Totally 45-52 bands were scored per gel, and 4 to 18 bands were resolved per individual. The multilocus minisatellite probe revealed a statistically significant lower number of variable bands for farmed fish than for wild (26 % lower, P < 0.05). In addition, subsequent pairwise comparisons of the MI 3 fingerprint pattern showed that the average
Hereditas 127 ( 1 997) Genetic diversity of wild and farmed Atlantic salmon 243
Table 1. Allele frequencies, number of variable bands and expected heterozygosity estimated by ullozymes, single- and multilocus minisatellite markers for three populations of Atlantic salmon
Marker, locus Population Marker, locus Population and allele and allele
Numedal. Tana Farmed Numedal. T a m Farmed N = 3 0 N = 134 N = 100 N = 2 0 N = 2 0 N = 2 0
Allozy mes MEP-2*
*I00 *125
*lo0 *80
*loo *I30
AAT-4* *I00 *50 *25
*lo0 *20
*lo0 *-80 *60
LDH-4* *lo0 *60
TPI-3* *loo *lo5
*I00 *95
*I00 *I0
CK-I* *I00 *82
*lo0 *80
MDH-3*
IDHP-3*
IDDH-1*
IDDH-2*
FBALD-3*
MDH- I *
PGLUA*
0.583 0.417
1 .000 0.000
I .ooo 0.000
0.900 0.050 0.050
0.983 0.017
0.717 0.283 0.000
0.967 0.033
0.9 17 0.083
0.867 0.133
0.983 0.017
0.983 0.017
1.000 0.000
No. of alleles 22 No. of private alleles 3
Avg. exp. het. 0.138 (+SD) ( 0.1 68)
0.365 0.635
0.989 0.01 1
0.973 0.027
0.884 0.116 0.000
0.940 0.060
0.468 0.506 0.026
1 .ooo 0.000
0.800 0.200
0.810 0.190
1 .000 0.000
1 .000 0.000
0.964 0.036
22 4
0.166
0.815 0.185
1 .000 0.000
1 .000 0.000
0.765 0.085 0.150
0.814 0.186
0.327 0.673 0.000
1.000 0.000
0.735 0.265
0.788 0.212
1.000 0.000
1 .000 0.000
1.000 0.000
19 0
0.181 (k0.195) (k0.192)
Single locus DNA B 5 2700 bp 2800 bp 5500 bp 5700 bp
Ssa A4511 2900 bp 3300 bp 3500 bp 3700 bp 5500 bp
3800 bp 4100 bp 4200 bp 4300 bp 4500 bp 4800 bp 5000 bp 5300 bp 5500 bp 5700 bp 6500 bp 6600 bp 6700 bp 6800 bp 6900 bp 7000 bp 7300 bp 7700 bp 8000 bp 8300 bp 9400 bp 13500 bp 16000 bp
E4
No. of alleles
0.900 0.025 0.075 0.000
0.125 0.325 0.050 0.500 0.000
0.028 0.000 0.000 0.000 0.000 0.000 0.083 0.028 0.028 0.278 0.083 0.028 0.056 0.028 0.139 0.028 0.028 0.083 0.000 0.083 0.000 0.000 0.000
21
No. of private alleles 5
AVB. exu. het. 0.574
0.816 0.053 0.105 0.026
0.000 0.075 0.000 0.800 0.125
0.050 0.125 0.025 0.050 0.025 0.025 0.100 0.000 0.000 0.000 0.025 0.000 0.000 0.000 0.200 0.025 0.125 0.025 0.100 0.000 0.050 0.025 0.025
23
8
0.529 ( f S D 1 (i0.357) (f0.338)
0.575 0.000 0.425 0.000
0.325 0.000 0.000 0.675 0.000
0.000 0.025 0.025 0.000 0.000 0.125 0.425 0.050 0.000 0.200 0.000 0.000 0.000 0.000 0.000 0.000 0.125 0.000 0.000 0.025 0.000 0.000 0.000
12
0
0.571 ( f 0.167)
Range of exp. het. 0.188-0.892 0.328-0.919 0.450-0.762
Range of exp.het. 0.000-0.494 0.000-0.527 0.000-0.443 Multilocus DNA Avg. no. of variable bands 33.0 36.3 25.5 ( k SD) ( i 5 . 1 ) (k5 .4 ) (5-4.5) Avg. exp. het. 0.593 0.61 3 0.440 ( k SD) (k0.068) (k0.017) (k0.106)
Range of exp. het. 0.519-0.676 0.594-0.635 0.299-0.525
244 I. B. Mjdner0d et al. Hereditas 127 (1 997)
S-values for the farmed population (0.505) were sig- nificantly higher than comparable values for both Tana (0.423) and Numedalsliigen (0.394; P < 0.05 in both cases), while Tana and Numedalslagen did not differ significantly (P > 0.05). In contrast to the other markers, the multilocus DNA fingerprints revealed significantly lower (P < 0.01) heterozygosity for the farmed fish compared with the wild populations.
Interpopulation genetic differentiation
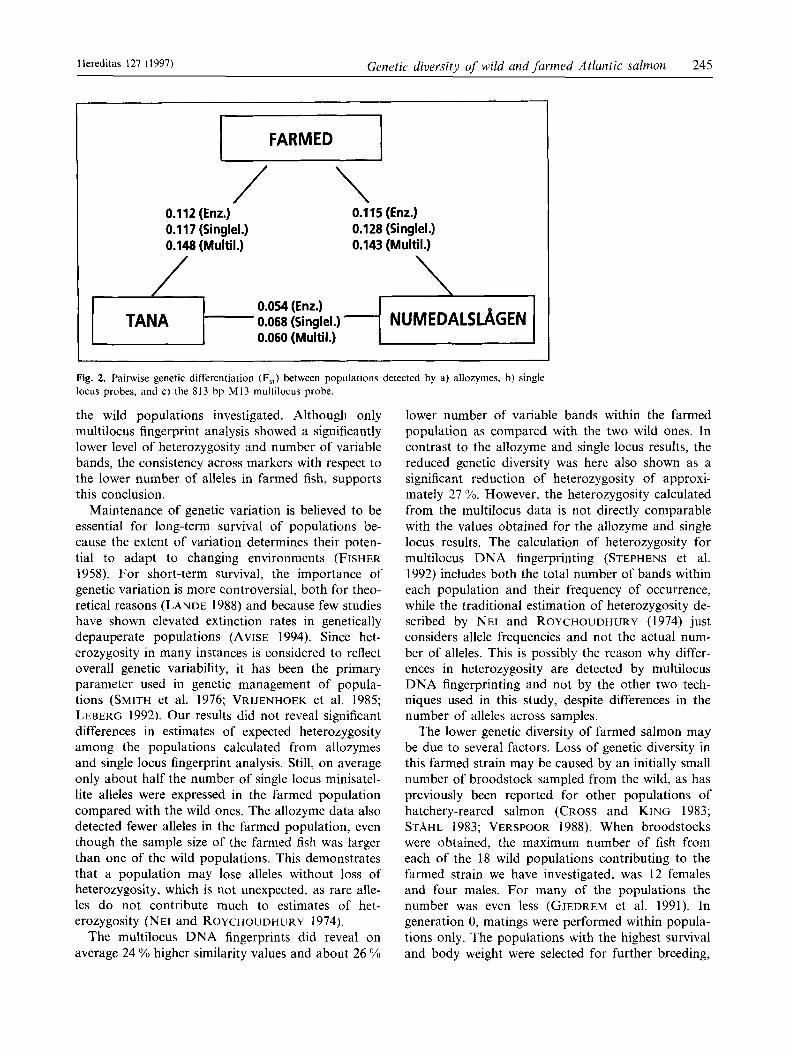
All genetic markers revealed significant genetic differ- entiation between the populations. The estimates of relative genetic differentiation (FSt) were consistent across markers and varied more across loci within each marker than between the markers (Table 3). The two wild populations appeared to be genetically most similar by all techniques (F5t range: 0.054-0.068), while the farmed population was genetically most divergent (Fig. 2). The F,, values between the wild populations and the farmed were in the same range (0.112-0.148) for all markers. Private alleles (i.e., alleles detected in one population only) were found for both allozymes and single locus probes (Table l), but none were diagnostic (fixed) in any population.
The allozyme loci detected significant interpopula- tion genetic variation (P<O.Ol) for four of the 12 polymorphic loci investigated. Based on allozymes, F,, across all populations was 0.109 (Table 3). The presence of private alleles is a further indication of population differentiation. Three private alleles were detected in the River Numedalsliigen and four in the River Tana at allozyme loci, while none were de- tected in the farmed population (Table 1).
All three single locus minisatellite loci indicated significant population subdivision (P < O.OOl), and F,, estimated across all populations was 0.106 (Table 3).
Table 2. Average similarity values (S-values) within and between populations as detected using the 813 bp M13 multilocus probe of REFSETH et al. (1994). Each populution is represented by 20Jish. N , is the number of puirwise comparisons; SE, is the standard error of eight average values resulting from two persons sepa- rately interpreting four gels
Populations N Average S-value ( f SE)
Intrapopulation Tana 8 x 45 0.423 (k0.013) Numedalsligen 8 x 45 0.394 ( k0.022) Farmed 8 x 45 0.505 (a0.026)
Tana/Numedalsligen 8 x 100 0.363 (k0.010) Tana/Farmed 8 x 100 0.359 (k0.025) Numedalsligen/Farmed 8 x 100 0.346 (k0.015)
Interpopulation
Table 3. Interpopulation (FJ, intrapopulation (F&J and global (FJ genetic diversity estimated from three classes of genetic markers for Atlantic salmon
Locus Fst
Allozymes MEP-2* MDH-3* IDHP-3* AAT-4* IDDH-I* IDDH-2* LDH-4* TPI-3* FBALD-3* MDH-I* CK-I* PGLUA* Over all loci
B5 Ssu A4511 E4 Over all loci
Single locus DNA
Multilocus DNA
0.263“ #
0.003 0.016 0.045 # #
0.140#” 0.102”# 0.039 0.039 0.001 0.019 0.017 0.027 0.1 09 # #
0.144 # # #
0.129# # #
0.076# # #
0.106## #
0.135###
Fit
0.323 -0.003 -0.005 -0.062
0.148 0.279 0.013 0.141 0.021 0.008 0.007
0.169
0.320 0.216 0.184 0.222
- 0.003
0.081 - 0.006 -0.022 -0.112
0.009 0.197
- 0.027 0.106 0.022
-0.01 1 -0.010 -0.03 1
0.067
0.206 0.099 0.117 0.130
Note: The calculation of F,, values and significance of F,, differs between multilocus minisatellites and the other markers (see text; statistical analyses). # #, statistically sig- nificant at the 1 % level after sequential Bonferroni adjust- ment for multiple tests (RICE 1989); # # #, statistically significant at the 0.1 % level after adjustment for multiple tests
Five private alleles were detected in the River Numedalsliigen and eight in the River Tana for single locus minisatellite loci (Table 1). No private alleles were found in the farmed population.
The multilocus data revealed statistically significant (P < 0.001) differences between average intrapopula- tion- and interpopulation S-values, with higher mean bandsharing values within than between populations (average values of 0.441 and 0.356, respectively). The multilocus probe showed the highest value of F,, estimated across all populations (0.135, Table 3). No private bands were registered for any of the popula- tions by this probe.
DISCUSSION
Genetic variability within and between farmed and wild salmon
Three classes of genetic markers all revealed that the strain of Norwegian farmed salmon we have studied (one out of four strains; the “1972-population”, GJE- DREM et al. 1991) contains less genetic variation than
Hereditas 127 (1997) Genetic diversity of wild and farmed Atluntic salmon 245
/ \ 0.112 (Enz.) 0.115 (Enz.) 0.117 (Singlel.) 0.128 (Singlel.) 0.148 (Multil.) 0.143 (Multil.)
--I NUMEDALSLAGEN [ 0.054 (Enz.) 0.068 (Singlel.) 0.060 (Multil.)
Fig. 2. Pairwise genetic differentiation (F-,) between populations detected by a) allozymes, b) single locus probes, and c) the 813 bp M13 multilocus probe.
the wild populations investigated. Although only multilocus fingerprint analysis showed a significantly lower level of heterozygosity and number of variable bands, the consistency across markers with respect to the lower number of alleles in farmed fish, supports this conclusion.
Maintenance of genetic variation is believed to be essential for long-term survival of populations be- cause the extent of variation determines their poten- tial to adapt to changing environments (FISHER 1958). For short-term survival, the importance of genetic variation is more controversial, both for theo- retical reasons (LANDE 1988) and because few studies have shown elevated extinction rates in genetically depauperate populations (AVISE 1994). Since het- erozygosity in many instances is considered to reflect overall genetic variability, it has been the primary parameter used in genetic management of popula- tions (SMITH et al. 1976; VRIJENHOEK et al. 1985; LEBERG 1992). Our results did not reveal significant differences in estimates of expected heterozygosity among the populations calculated from allozymes and single locus fingerprint analysis. Still, on average only about half the number of single locus minisatel- lite alleles were expressed in the farmed population compared with the wild ones. The allozyme data also detected fewer alleles in the farmed population, even though the sample size of the farmed fish was larger than one of the wild populations. This demonstrates that a population may lose alleles without loss of heterozygosity, which is not unexpected, as rare alle- les do not contribute much to estimates of het- erozygosity (NEI and ROYCHOUDHURY 1974).
The multilocus DNA fingerprints did reveal on average 24 YO higher similarity values and about 26 O/o
lower number of variable bands within the farmed population as compared with the two wild ones. In contrast to the allozyme and single locus results, the reduced genetic diversity was here also shown as a significant reduction of heterozygosity of approxi- mately 27 YO. However, the heterozygosity calculated from the multilocus data is not directly comparable with the values obtained for the allozyme and single locus results. The calculation of heterozygosity for multilocus DNA fingerprinting (STEPHENS et al. 1992) includes both the total number of bands within each population and their frequency of occurrence, while the traditional estimation of heterozygosity de- scribed by NET and ROYCHOUDHURY (1974) just considers allele frequencies and not the actual num- ber of alleles. This is possibly the reason why differ- ences in heterozygosity are detected by multilocus DNA fingerprinting and not by the other two tech- niques used in this study, despite differences in the number of alleles across samples.
The lower genetic diversity of farmed salmon may be due to several factors. Loss of genetic diversity in this farmed strain may be caused by an initially small number of broodstock sampled from the wild, as has previously been reported for other populations of hatchery-reared salmon (CROSS and KING 1983; STAHL 1983; VERSPOOR 1988). When broodstocks were obtained, the maximum number of fish from each of the 18 wild populations contributing to the farmed strain we have investigated, was 12 females and four males. For many of the populations the number was even less (GJEDREM et al. 1991). In generation 0, matings were performed within popula- tions only. The populations with the highest survival and body weight were selected for further breeding,
246 I . B. Mjalnerad et al. Hereditas 127 (1997)
which included both within- and between population matings. In this way, several populations were ex- cluded when selecting the fish that performed best under farming conditions. Consequently, despite the large number of populations at the onset of the selection program, only one or two populations dom- inated in each of the four strains in the third genera- tion (GJ0EN 1989; GJEDREM et al. 1991). In that generation, a single river (the River Namsen) repre- sented more than 70 YO of the farmed strain we have investigated.
The genetic differentiation between our sample of farmed fish and a 1986-sample of juveniles from the River Namsen (VUORINEN and BERG 1989), is rela- tively high (F,, = 0.070), despite the high contribution of Namsen fish in the farmed strain. The comparable F,, values for the River Tana and the River Numedalsligen versus the farmed fish (calculated from the same set of nine polymorphic loci), are 0.085 and 0.086, respectively. All loci that were poly- morphic in either the Namsen- or the farmed sample, showed significant (P < 0.05) heterogeneity in allele frequencies between these two samples. In terms of intrapopulation diversity, the River Namsen sample studied by VUORINEN and BERG (1989) contained two rare MDH-3* alleles (*80 and *75) not found in the farmed fish, but did not have the IDDH-l*20* allele of the farmed fish in our study. (The number of alleles were 11 in the Namsen sample and 10 in the farmed fish). Average expected heterozygosity ( f SD) for the nine loci was nonsignificantly higher in farmed (0.159 f 0.193) than in wild Namsen fish (0.130 f 0.214). The genetic divergence of the farmed fish relative to its principal founding population, demonstrates that the culture and breeding condi- tions have changed the genetic constitution of the farmed fish even in loci that have not been targeted in the selection program. Apart from founder effects, artificial and natural selection in the culture environ- ment may have changed the overall allelic composi- tion of the farmed fish relative to wild fish (EKNATH and DOYLE 1985). The relative role of drift and selection, however, remains unresolved in our analy- sis.
Our results may also reflect differences in the ge- netic structure between farmed and wild populations. The four populations of farmed fish in the Norwegian breeding program have been kept as separate lineages with a fixed life cycle for several generations (GJERDE 1993), and, consequently, our sample from one of the populations consists of individuals of similar age. Natural populations on the other hand, consist of several yearclasses that interbreed because of large variation in individual life history (SAUNDERS and SCHOM 1985) and, moreover, natural populations
exchange individuals because of straying (STAHL 1981). Compared to wild populations, the degree of genetic variability in farmed salmon is therefore ex- pected to be lower within each yearclass (and popula- tion/strain) and higher between yearclasses (and populations/strains). This result was also found by STAHL (1 987) in a comparison of hatchery-produced and wild salmon.
Consistency of genetic differentiation across markers
Significant differentiation between the populations was found by all markers, supporting earlier allozyme studies showing that populations of Atlantic salmon are genetically distinct (STAHL 1987). The multilocus 8 13 bp M 13 probe revealed significantly lower band- sharing coefficients in interpopulation comparisons than in intrapopulation comparisons, and the F,, values for both allozyme and single locus data were significantly different from zero. Our estimates of genetic differentiation (FSt across all populations) were concordant across markers, ranging from 0.106 for single locus DNA to 0.109 and 0.135 for al- lozymes and multilocus DNA, respectively. This is consistent with a study by GALVIN (1995), who com- pared populations of Atlantic salmon on a much smaller geographic scale, revealing F,, values in ap- proximately the same range by allozymes and single locus DNA minisatellite analysis (average F,, value for allozymes and single locus DNA fingerprinting were 0.017 and 0.027, respectively). Within each of these studies, there is considerable variation in F, values between loci within each marker type, suggest- ing that the average F,, values do not differ signifi- cantly between types of genetic markers.
Utility of the genetic markers for aquaculture and jisheries management
Our results show that, for the populations investi- gated, allozymes and DNA minisatellites show simi- lar estimates of genetic differentiation. To resolve the amount of genetic variation within populations of Atlantic salmon, however, both single locus- and multilocus minisatellites are more sensitive than al- lozymes. A factor to consider when employing single locus minisatellites, is deviation from Hardy-Wein- berg equilibrium (expressed as heterozygote defi- ciency at the DNA locus E4 in this study) that might result from two alleles being so close in size that a heterozygote is “hidden” and scored as a homozygote (O’REILLY and WRIGHT 1995). Such problems of resolution become more apparent for loci with high numbers of alleles. However, we believe that for studies of Atlantic salmon, this technique has great potential, as individual loci can be analysed both time- and cost-efficiently by PCR, if locus-specific
Hereditas 127 (1997) Genetic diversity of wild and farmed Atlantic salmon 247
primers are designed (see GALVIN et al. 1995). Multi- locus DNA fingerprinting on the other hand, cannot be tested against Hardy-Weinberg expectations. In addition, the inconsistency of bandsharing across gels restricts the total sample size. However, as several highly variable loci are screened simultaneously by one multilocus probe, changes in genetic variability are more easily detected by this technique than by the other two techniques used in this study. For animal breeding, wild stock enhancement programs and con- servation of wild populations, multilocus DNA fingerprinting may be an efficient way of monitoring levels of genetic variability within stocks.
ACKNOWLEDGEMENTS
We wish to acknowledge John Taggart, Diogo Thomaz, Andrew Ferguson, Terry Burke, Paulo Prodohl and Eric Verspoor for both providing the single locus minisatellite probes and for kind hospitality during Ingrid Mj~rlnererd’s stay in Leicester and Belfast to learn DNA techniques. The single locus probes E4 and B5 were developed with funding support from the SOAFED Marine Laboratory and the Atlantic Salmon Trust, and the pSsa-A45/1 was developed with economic support from the Natural Environment Research Council (U.K.). We are also grateful to Kjell Moen and Reidar Rasmusen who helped collecting the material, John Stacy for help with the multilocus data analyses, and Jarle Mork for critical reading of the manuscript. Financial support for this work was provided by the Norwegian Research Council and Norwegian Insti- tute for Nature Research.
REFERENCES Aebersold PB, Winans GA, Tee1 DJ, Milner GB and Utter
FM, (1987). Manual for starch gel electrophoresis: a method for the detection of genetic variation. U.S. Dep. Commer., NOAA Tech. Rep. NMFS 61: 1-19.
Allendorf FW and Utter FM, (1979). Population genetics. In: Fish Physiology Vol. 8 (eds WS Hoar, DJ Randall and JR Brett) Academic Press, New York p. 407-454.
Avise JC, (1994). Molecular Markers, Natural History, and Evolution. Chapman and Hall, New York.
Bentzen P, Taylor EB and Wright JM, (1993). A novel synthetic probe for DNA fingerprinting salmonid fishes. J. Fish Biol. 43: 313-316.
Burke T and Bruford MW, (1987). DNA fingerprinting in birds. Nature 327: 149- 152.
Burke T, Hanotte 0, Bruford MW and Cairns E, (1991). Multilocus and single locus minisatellite analysis in pop- ulation biological studies. In: DNA Fingerprinting: Ap- proaches and Applications (eds T Burke, G Dolf, R Wolff and AJ Jeffreys) Birkhauser, Base1 p. 154-168.
Cross T F and King J, (1983). Genetic effects of hatchery rearing in Atlantic salmon. Aquaculture 33: 33-40.
Degnan SM, (1993). Genetic variability and population differentiation inferred from DNA fingerprinting in sil- vereyes (Aves: Zosteropidae). Evolution 47: 1105- l 117.
Eknath AE and Doyle RW, (1985). Indirect selection for growth and life-history traits in Indian carp aquaculture I. Effects of broodstock management. Aquaculture 49: 73 - 84.
Elo K, Vuorinen JA and Niemela E, (1994). Genetic re- sources of Atlantic salmon (Salmo salar L.) in Ten0 and Naatamo Rivers, northernmost Euorope. Hereditas 120:
Faulkes CG, Abbott DG and Mellor AL, (1990). Investiga- tion of genetic diversity in wild colonies of naked mole- rats (Heterocephalus glaber) by DNA fingerprinting. J. Zool. London 221: 87-97.
Feinberg AP and Vogelstein B, (1983). A technique for radiolabeling DNA restriction endonuclease fragments to high specific activity. Anal. Biochem. 132: 6- 13.
Fisher RA, (1958). The Genetical Theory of Natural Selec- tion, 2nd revised edition. Dover Publ., New York.
Galau, GA, Hughes, DW and Dure L, (1986). Abscisic acid induction of cloned cotton late embryogenesis-abundant (LEA) mRNAs. Plant Mol. Biol. 7: 155-170.
Calvin P, (1995). Molecular genetics of Atlantic salmon (Salmo salar) in the River Shannon system in Ireland. Ph.D. thesis. University College Cork, Ireland.
Calvin P, Sadusky T, McGregor D. and Cross T, (1995). Population genetics of Atlantic cod using amplified single locus minisatellite VNTR analysis. J. Fish Biol. 47(Suppl. A): 200-208.
Gilbert DA, Lehman N, O’Brien SJ. and Wayne RK, (1990). Genetic fingerprinting reflects population differ- entiation in the California Channel Island fox. Nature
Gjedrem T, Gj~jen HM and Gjerde B, (1991). Genetic origin of Norwegian farmed Atlantic salmon. Aquacul- ture 98: 41-50.
Gjerde B, (1993). Breeding and selection. In: Salmon Aqua- culture (eds K Heen, R Monahan and F Utter) Fishing News Books, Blackwell Sci. Publ., Oxford, p. 187-208.
Gjeren HM, (1989). Genetic composition of the broodstock at AKVAFORSK. Estimates of heterozygosity, effects of strain differences and heterosis. Cand. agric. thesis. Agri- cultural University of Norway, As.
Goudet J, (1995). Fstat version 1.2: a computer program to calculate F-statistics. J. Hered. 86: 485-486.
Heath DD, Devlin RH, Hilbish TJ and Iwama GK, (1995). Multilocus fingerprints in seven species of salmonids. Can. J. Zool. 73: 600-606.
Heggberget TG, Lund RA, Ryman N and St&hl G, (1986). Growth and genetic variation of Atlantic salmon (Salmo salar) from different sections of the River Alta, North Norway. Can. J. Fish. Aquat. Sci. 43: 1828-1835.
Jordan WC, Youngson AF, Hay DW and Ferguson A, (1992). Genetic protein variation in natural populations of Atlantic salmon (Salmo salar). Can. J. Fish. Aquat. Sci. 49: 1863- 1872.
King DPF, Hovey SJ, Thompson D and Scott A, (1993). Mitochondria1 DNA variation in Atlantic salmon, Salmo salar L., populations. J. Fish Biol. 42: 25-33.
Laikre L, Prodohl PA, Jorde PE and Ryman N, (1995). Genetic variability at minisatellite and allozyme loci in brown trout (Salmo trutta) - A comparison. Hereditas
Lande R, (1988). Genetics and demography in biological conservation. Science 241: 1455- 1460.
Leberg PL, (1992). Effects of population bottlenecks on genetic diversity as measured by allozyme electrophore- sis. Evolution 46: 471-494.
Manly BFJ, (1994). RT a program for randomization testing, Version 1.02C. CASM. University of Otago, New Zealand.
19-28.
344: 164-767.
123: 191-195.
248 I. B. Mjdner0d et al. Hereditas 127 (1997)
Mantel N, (1967). The detection of disease clustering and a generalized regression approach. Cancer Res. 27: 209- 220.
McConnell SK, Reilly PO, Hamilton L, Wright JM and Bentzen P, (1995). Polymorphic microsatellite loci from Atlantic salmon (Salmo salar): genetic differentiation of North American and European populations. Can. J. Fish. Aquat. Sci. 52: 1863- 1872.
Nei M, (1973). Analysis of gene diversity in subdivided populations. Proc. Natl. Acad. Sci. USA 70: 3321-3323.
Nei M and Roychoudhury AK, (1974). Sampling variances of heterozygosity and genetic distance. Genetics 76: 379- 390.
O’Reilly P and Wright JM, (1995). The evolving technology of DNA fingerprinting and its application to fisheries and aquaculture. J. Fish Biol. 47 (Suppl. A): 29-55.
Prodohl PA, Taggart JB and Ferguson A, (1992). Genetic variability within and among sympatric brown trout (Salmo trutta) populations: multilocus DNA fingerprint analysis. Hereditas 117: 45-50.
Raymond M and Rousset R, (1995). A population genetics software for exact tests and ecumenicism. J. Hered. 86: 248 -249.
Reeve HK, Westneat DF, Noon WA, Sherman PW and Aquadro CF, (1990). DNA “fingerprinting” reveals high levels of inbreeding in colonies of the eusocial naked mole-rat. Proc. Natl. Acad. Sci. USA 87: 2496-2500.
Refseth UH, Mjelnered IB and Jakobsen KS, (1994). Im- proved multilocus DNA fingerprinting pattern of At- lantic salmon (Salmo salar) using a M13 probe containing both tandem repeat regions. Mol. Mar. Biol. Biotechnol. 3: 347-354.
Rice WR, (1989). Analyzing tables of statistical tests. Evo- lution 43: 223-225.
Rousset F and Raymond M, (1997). Statistical analyses of population genetic data: new tools, old concepts. Trends Ecol. Evol. 12: 313-317.
Ryman N and Stihl G, (1981). Genetic perspectives of the identification and conservation of Scandinavian stocks of fish. Can. J. Fish. Aquat. Sci. 38: 1562-1575.
Sanchez JA, Clabby C, Ramos D, Blanco G, Flavin F, Vazquez E and Powell R, (1996). Protein and microsatel- lite single locus variability in Salmo salar L. (Atlantic salmon). Heredity 77: 423-432.
Saunders RL and Schom CB, (1985). Importance of the variation in life history parameters of Atlantic salmon (Salmo salar). Can. J. Fish. Aquat. Sci. 42: 615-618.
Scribner KT, Arntzen JW and Burke T, (1994). Compara- tive analysis of intra- and interpopulation genetic diver- sity in Bufo bufo, using allozyme, single-locus microsatellite, and multilocus minisatellite data. Mol. Biol. Evol. 11: 737-748.
Shaklee JB, Allendorf FW, Morizot DC and Whitt GS, (1990). Gene nomenclature for protein-coding loci in fish. Trans. Am. Fish. SOC. 119: 2-15.
Slettan A, Olsaker I and Lie 0, (1993). Isolation and characterization of variable (GT), repetitive sequences from Atlantic salmon, Salmo salar L. - Anim. Genet. 21: 377-389.
Smith MH, Hillestad HO, Manlove MN and Marchinton RL, (1976). Use of population genetics data for manage- ment of fish and wildlife populations. Trans. North Am. Wildl. Nat. Resour. Conf. 41: 119-133.
Stephens JC, Gilbert DA, Yuhki N and O’Brien SJ, (1992).
Estimation of heterozygosity for single-probe multilocus DNA fingerprints. Mol. Biol. Evol. 9: 729-743.
Stihl G, (1981). Genetic differentiation among natural populations of Atlantic salmon (Salmo salar) in North- ern Sweden. In: Fish Gene Pools (ed. N Ryman) Ecol. Bull. (Stockholm) 34: 95- 105.
Stihl G, (1983). Differences in the amount and distribution of genetic variation between natural populations and hatchery stocks of Atlantic salmon. Aquaculture 33: 23-32.
Stihl G, (1987). Genetic population structure of Atlantic salmon. In: Population Genetics and Fishery Manage- ment (eds N Ryman and F Utter) University of Wash- ington Press, Seattle, WA, p. 121-140.
Stihl G and Hindar K, (1988). Genetisk struktur hos norsk laks: status og perspektiver. (In Norwegian). Rapp. 1988- 1, Fiskeforskningen, Direktoratet for naturforvaltning, Trondheim, Norway.
Taggart JB and Ferguson A, (1990). Hypervariable mini- satellite DNA single locus probes for the Atlantic salmon, Salmo salar L. J. Fish Biol. 37: 991-993.
Taggart JB, Hynes RA, Prodohl PA and Ferguson A, (1992). A simplified protocol for routine total DNA isolation from salmonid fishes. J. Fish Biol. 40: 963-965.
Taggart JB, Prodohl PA and Ferguson A, (1995a). Genetic markers for Atlantic salmon (Salmo salar L.): single locus inheritance and joint segregation analyses of mini- satellite (VNTR) DNA loci. Anim. Genet. 26: 13-20.
Taggart JB, Verspoor E, Galvin, PT, Moran P and Fergu- son A, (1995b). A minisatellite DNA marker for discrim- inating between European and North American Atlantic salmon (Salmo salar). Can. J. Fish. Aquat. Sci. 52: 2305-2311.
Thomaz DMPF, (1995). Alternative life-history strategies in male Atlantic salmon (Salmo salar L.). Ph.D. thesis. University of Leicester, U.K.
Triggs SJ, Williams MJ, Marshall SJ and Chambers GK, (1992). Genetic structure of blue duck (Hymenolaimus malacorhynchos) populations revealed by DNA finger- printing. Auk 109: 80-89.
Verspoor E, (1988). Reduced genetic variability in first-gen- eration hatchery populations of Atlantic salmon (Salmo salar). Can. J. Fish. Aquat. Sci. 45: 1686-1690.
Vrijenhoek RC, Douglas ME and Meffe GK, (1985). Con- servation genetics of endangered fish populations in Ari- zona. Science 229: 400-402.
Vuorinen J and Berg OK, (1989). Genetic divergence of anadromous and nonanadromous Atlantic salmon (Salmo salar) in the River Namsen, Norway. Can. J. Fish. Aquat. Sci. 46: 406-409.
Wayne RK, Lehman N, Girman D, Gogan PJP, Gilbert DA, Hansen K, Peterson RO, Seal US, Eisenhawer A, Mech LD and Krumenaker RJ, (1991). Conservation genetics of the endangered Isle Royale gray wolf. Con- serv. Biol. 5: 41-51.
Weir BS and Cockerham CC, (1984). Estimating F-statis- tics for the analysis of population structure. Evolution
Wetton JH, Royston EC, Parkin DT and Walters D, (1987). Demographic study of wild house sparrow popu- lation by DNA fingerprinting. Nature 327: 147-149.
Wilson IF, Bourke EA and Cross TF, (1995). A triose- phosphate isomerase polymorphism in the Atlantic salmon Salmo salar L. Biochem. Genet. 33: 25-33.
38: 1358-1370.
Related Documents


![IIToday, by value and quantity, Atlantic salmon (Salmo salar) are by far the largest marine farmed commodity, with more than 2.4 million tonnes produced annually [7]. First intensively](https://static.cupdf.com/doc/110x72/61413ac083382e045471f34b/ii-today-by-value-and-quantity-atlantic-salmon-salmo-salar-are-by-far-the-largest.jpg)