Behavior Genetics, Vol. 19, No. 2, 1989 Genetic and Environmental Contributions to the Covariance Between Occupational Status, Educational Attainment, and IQ: A Study of Twins Kristian Tambs, 1 Jon Martin Sundet, 2 Per Magnus, 3 and K~re Berg 3 Received 3 Jan. 1987--Final28 Mar, I988 Scores of occupational status, educational attainment, and IQ were ob- tained for 507 monozygotic and 575 dizygotic male twin pairs born 1931- 1935 and 1944-1960. A multivariate genetic analysis with statistics from different cohorts showed heterogeneity between cohorts, and analyses were performed in four separate cohorts. The only set of results which departed clearly from the rest was found for the group born 1931-1935, where the ratio of environmental to genetic effects exceeded those of the other groups. Typical heritabitity values in the three youngest groups (weighted means) were .43, ,51, and .66 for occupation, education, and IQ, respectively. The values in the oldest group were ,16, .10, and .37, but this sample is small and the estimates are unstable. Genetic variance influencing educational attainment also contributed approximately one- fourth of the genetic variance for occupational status and nearly half the genetic variance for IQ. The values for the between-families variances (reflecting family environment and assortative mating) varied from 2 to 35% in the three youngest groups but were higher for education (62%) and IQ (45%) in the oldest groups. All the between-families variance was common to all three variables. For educational attainment and IQ, the bulk of this between-families variance is probably genetic variance due to assortative mating. The common-factor environmental within-family variances were generally small, and the specific estimates seemed to contain mainly measurement error. KEY WORDS: intelligence; educational attainment; occupational status; covariance anal- ysis; heritability; twins. Department of Behavioural Sciences in Medicine, University of Oslo, 0317 Oslo 3, Norway. 2 Institute of Psychology, University of Oslo, 0317 Oslo 3, Norway. 3 Institute of Medical Genetics, University of Oslo, 0317 Oslo 3, Norway. 2O9 0001-8244/89/0300-0209506.00/0 1989 Plenum Publishing Corporation

Welcome message from author
This document is posted to help you gain knowledge. Please leave a comment to let me know what you think about it! Share it to your friends and learn new things together.
Transcript
Behavior Genetics, Vol. 19, No. 2, 1989
Genetic and Environmental Contributions to the Covariance Between Occupational Status, Educational Attainment, and IQ: A Study of Twins Kristian Tambs, 1 Jon Martin Sundet, 2 Per Magnus, 3 and K~re Berg 3
Received 3 Jan. 1987--Final 28 Mar, I988
Scores o f occupational status, educational attainment, and IQ were ob- tained for 507 monozygotic and 575 dizygotic male twin pairs born 1931- 1935 and 1944-1960. A multivariate genetic analysis with statistics from different cohorts showed heterogeneity between cohorts, and analyses were performed in four separate cohorts. The only set o f results which departed clearly from the rest was found for the group born 1931-1935, where the ratio of environmental to genetic effects exceeded those of the other groups. Typical heritabitity values in the three youngest groups (weighted means) were .43, ,51, and .66 for occupation, education, and IQ, respectively. The values in the oldest group were ,16, .10, and .37, but this sample is small and the estimates are unstable. Genetic variance influencing educational attainment also contributed approximately one- fourth of the genetic variance for occupational status and nearly half the genetic variance for IQ. The values for the between-families variances (reflecting family environment and assortative mating) varied from 2 to 35% in the three youngest groups but were higher for education (62%) and IQ (45%) in the oldest groups. All the between-families variance was common to all three variables. For educational attainment and IQ, the bulk o f this between-families variance is probably genetic variance due to assortative mating. The common-factor environmental within-family variances were generally small, and the specific estimates seemed to contain mainly measurement error.
KEY WORDS: intelligence; educational attainment; occupational status; covariance anal- ysis; heritability; twins.
Department of Behavioural Sciences in Medicine, University of Oslo, 0317 Oslo 3, Norway. 2 Institute of Psychology, University of Oslo, 0317 Oslo 3, Norway. 3 Institute of Medical Genetics, University of Oslo, 0317 Oslo 3, Norway.
2O9
0001-8244/89/0300-0209506.00/0 �9 1989 Plenum Publishing Corporation
210 Tambs, Sundet, Magnus, and Berg
INTRODUCTION
The substantial intercorrelations among psychometrical intelligence (IQ), educational attainment, and occupational status are well documented. These relations are predictable a priori from the fact that intelligence tests were originally validated against school performance, which in turn in- fluences career advancement. Still, the causal relationships are far from clear-cut and can be illuminated (if not elucidated) by considering the relative impact of environmental and genetic factors and the extent to which such impacts are common or specific for each of the variables. This study offers some tentative answers to these questions, using the method developed by Martin and Eaves (1977).
In large samples of Norwegian twins, including the subjects from the present study, Heath et al. (1985a,b) have shown that the relative con- tributions from genetic and environmental sources vary across cohorts for education, and Sunder et al. (1988) have shown a similar trend for IQ. Even in a smaller sample, we were able to explore such trends further, also examining the trends for occupational status and for the relative values of common and specific variances.
A number of twin studies (Martin and Eaves, 1977; Fulker, 1978; Martin et al. , 1984; Tambs et al., 1986) have shown that the between- family variance, VB, for various abilities, education, and socioeconomic variables appears to be due to a single common factor. This is to say that any genetic effect due to assortative mating is common for these variables, and so is any effect of the family environment (Eaves et al. , 1984). An important objective of this study was to test the expectation of no VB specific to any single measure.
MATERIALS AND METHODS
Sample
The sample consisted of 507 male monozygotic (MZ) pairs and 575 male dizygotic (DZ) pairs. At age 18-19 years, about 90% of the male population is investigated physically and psychologically before the en- trance to the compulsory military service. From the army files, IQ scores were available for the cohorts born 1931-1935 and 1944-1960.
The data were obtained by the matching of the army files with the Norwegian Twin Panel. The panel contains all Norwegian like-sexed twin pairs born 1915-1960 where both were alive at age 20 and for whom addresses could be found in census data. Zygosity has been assigned for 80% of the pairs, in which at least one of the twins returned a mailed
Covariance Analysis of Occupation, Education, and IQ 211
questionnaire. This questionnaire has been shown to misclassify less than 3% of the cases (Magnus et al., 1983).
In about 60% of the pairs with known zygosity, both twins have responded to a second questionnaire, containing, among others, questions about profession and education. In 1850 pairs, zygosity and IQ were re- trieved for both twins. From this sample, complete data from the second questionnaire were obtained in 1082 pairs, or about 31% of the total male twin panel population from the 22 year classes.
Test and Questionnaire
The ability testing of army recruits was started in 1950 with recruits born 1931. Three test scores are recorded, from which only one, "general ability level," was available for the total present sample. This general ability test is composed of three subtests: "arithmetic problems," "word similarities" (Faglig Memorandum No. 12, 1956), and "figure rules" (Lundgren and Skjenstad, 1953), which is a slightly modified version of Raven's Progressive Matrices. The test is scaled as "stanine" scores, a normal distribution with range 1-9, mean 5.00, and standard deviation 1.96. The test-retest reliabilities of the subtests are .84, .90, and .72, respectively, the corresponding Cronbach's alphas are .87, .93, and .94 (Faglig Memorandum No. 12, 1956). Unfortunately, no exact estimates of correlations with other tests are known, but for 48 of the twins, Wechs- ler Adult Intelligence Scale (WAIS) scores from 1981 to 1984 were avail- able. With time spans between the two test sessions varying from 2 to 25 years, the correlation was .75.
Two different measures of educational attainment were recorded, educational level, which ranged from 1 to 4, and years of education. The two measures were converted to z scores and summed. Using this com- posite instead of educational level has the disadvantage that a person who progresses slowly to reach a certain level is scored as more highly edu- cated than a person who proceeds at an ordinary rate. On the other hand, unlike the level scale, the composite is sensitive to education which is not closely tied to or necessary for the ultimate vocational education. For instance, a teacher who is also educated as an engineer will have a higher score than a person educated as either an engineer or a teacher. Besides, the composite is probably more statistically reliable than each of its com- ponents. From the intercorrelation of .85, the reliability for the composite may be estimated at .92. The distribution of years of education was skewed with the tail upward, whereas the distribution of educational level was approximately normal. The skewness and kurtosis of the sum score were .67 and .61, respectively.

212 Tambs, Sundet, Magnus, and Berg
Occupational status was scaled 0-4 according to the scoring key: (4) white-collar supervisory, runs own business, professionals; (3) white-collar intermediate, runs small business; (2) white-collar lower level, skilled workers; (1) workers, students; and (0) no paid work. Occupation was recorded in a somewhat crude way, applying only
the first two digits in Nordisk Yrkeklassifisering (1978). In this classifi- cation system, which is routinely applied in Scandinavia and Finland, occupations are assigned by means of a five digit code. Using only two digits, some of the categories become rather heterogeneous, e.g., the teacher group includes university professors as well as nursery teachers. As a result, some subjects may have been misclassified on the status scale, impairing the reliability of occupational status.
Model
The model and estimation procedure are thoroughly described by Martin and Eaves (1977). Models describing both the sources and the s tructure of covariation are fitted to the variances (mean squares) and covariances (mean products) of the variable within and between MZ and DZ pairs, by a maximum-likelihood procedure. Genetic and environmen- tal variance components common for all variables and components spe- cific for each variable are estimated. Suffice it here to describe the model by the equations:
~WMZ = EwcEwc' + Ews 2,
~BMZ = 2(GcGc' + Gs 2) + EwcEwc' + E w s 2 -1- 2(EBcEBc' + EBs2),
~]WDZ = ~(GcGc' + Gs z) + EwcEwc' + E w s z,
~(GcGc' + Gs 2) + EwcEwc' + Ews 2 + 2(EBcE~c' + EBs2), ZBDz
where the matrices ~]WMZ' ~BMZ' •WDZ' and ZBDZ represent the (ex- pected) mean squares and mean products within and between MZ and DZ pairs, respectively. Gc, Ewc, and EBC are the matrices of loadings on genetic, environmental within-family, and between-families factors, respectively. Gs 2, Ews 2, and EBS are the diagonal matrices of the cor- responding specific variances.
The model rests on the usual set of assumptions for the classical twin design, discussed by Eaves et al. (1978). Of special importance here is
Covariance Analysis of Occupation, Education, and IQ 213
the assumption of no genetic spouse correlation, since assortative mating is, in fact, substantial. The effect is to increase the additive genetic vari- ance but this will be completely confounded with the effect of the family environment.
Estimation Procedure
Estimates of the parameters were obtained by use of the LISREL Version IV computer program (J6reskog and S6rbom, 1978). Given ob- served mean squares and products, this program arrives at maximum- likelihood estimates of the model parameters by means of an iterative procedure. The program also supplies a chi-square value, indicating the model fit, and standard errors of (the square root of) the estimated vari- ance components. A check of the identification status of the model is performed.
RESULTS
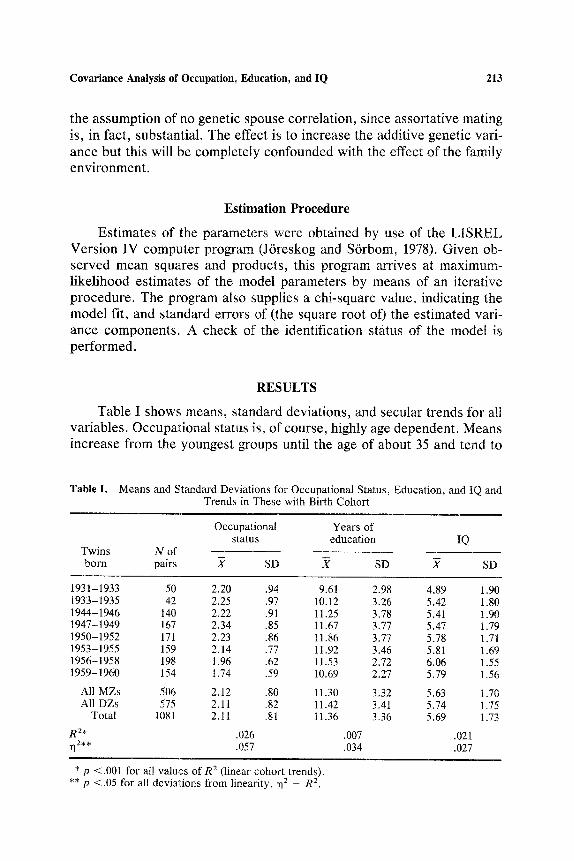
Table I shows means, standard deviations, and secular trends for all variables. Occupational status is, of course, highly age dependent. Means increase from the youngest groups until the age of about 35 and tend to
Table I. Means and Standard Deviations for Occupational Status, Education, and IQ and Trends in These with Birth Cohort
Occupational Years of status education IQ
Twins N of born pairs _g SD .~ SD X SD
1931-1933 50 2.20 .94 9.61 2.98 4.89 1.90 1933-1935 42 2.25 .97 10.12 3.26 5.42 1.80 1944-1946 140 2.22 .91 11.25 3.78 5.41 1.90 1947-1949 167 2.34 .85 11.67 3.77 5.47 1.79 1950-1952 171 2.23 .86 11.86 3.77 5.78 1.71 1953-1955 159 2.14 .77 11.92 3.46 5.81 1.69 1956-1958 198 1.96 .62 11.53 2.72 6.06 1.55 1959-1960 154 1.74 .59 10.69 2.27 5.79 1.56
All MZs 506 2.12 .80 11.30 3,32 5.63 1.70 All DZs 575 2.11 .82 11.42 3,41 5,74 1.75
Total 1081 2.11 .81 l 1.36 3.36 5.69 1.73
R 2. .026 .007 .021 rl z** .057 .034 .027
* p <.001 for all values of R 2 (linear cohort trends). ** p <.05 for all deviations from linearity, 3q 2 - - R 2.

214 Tambs, Sundet, Magnus, and Berg
decrease from the age of 50. Mean educational attainment in twins in- creases dramatically over the three decades. From 1957, however, there is a decline in mean values and standard deviations, which is probably due to the young age of these respondents at the time of the data collec- tion. Receiving the questionnaire at age 20-24, some of the twins had not finished their education, and this results in a ceiling effect in the youngest groups. No differences in means or variances between MZ and DZ twins reach significance.
The army tests have not been renormed so secular trends for IQ are reflected directly by the stanine scores. The mean scores increase and the standard deviations decrease toward the younger groups, a trend also observed in performances on the WAIS test (Engvik and Tambs, 1985).
Mean IQ scores close to the population mean suggest that no sample selection has occurred. Still, a comparison with the scores of twins who did not respond to the questionnaires shows a selection effect, originally camouflaged by a tendency for twins to score below the population mean. Means and standard deviations for questionnaire responders and nonre- sponders are shown in Table II. The response ratio is somewhat higher for MZs than DZs. Young twins respond more frequently than old twins. From the sample with known IQ, 33% of the oldest group and 53% of the youngest group have returned the second questionnaire.
Lykken et al. (1987) have suggested that the willingness to participate in twin studies may be directly affected by differences within pairs on certain salient traits. They showed that such recruitment bias can have large effects on the results. Just like individual selection, selection against large pair differences is likely to be accompanied by a reduction in total variance which is larger for DZs than MZs. It may also be detected as a correlation between willingness to respond and absolute differences within pairs. A "responsiveness" scale was computed, with the values 0
Table II. Selection Effect; Mean IQ Scores for Responders and Nonresponders to the Questionnaires a
Responded to both questionnaires
Responded only to the zygosity class.
questionnaire Non-responders
Zygosity X cr N X ~ N X ~ N
Monozygotic 5.58 1.76 1387 5.11 1.85 547 5.09 2.02 99 Dizygotic 5.59 1.77 1904 5.09 1.85 1066 4.68 1.85 237 Unknown 4.70 1.98 718
a No mean values or standard deviations are significantly different between zygosity groups.
Covariance Analysis of Occupation, Education, and IQ 215
(nonresponders), 1 (returned only the zygosity classification question- naire), and 2 (returned the second or both questionnaires). The correlation between responsiveness and IQ was . 19 and the cotwin correlation for responsiveness was .37 for MZs and. 17 for DZs. The correlation between absolute differences in IQ within pairs and individual responsiveness was .012 for MZs and - .005 for DZs. These correlations were computed in slightly truncated samples, omitting subjects from 229 concordant pairs of nonresponders where zygosity was unknown. Even in the total sample (including the group with unknown zygosity) the correlation coefficient did not attain clear significance (r = - .038, z = 1.83). What slight cor- relation is found probably reflects a spurious effect from zygosity. That is, the response ratio is slightly lower, and IQ differences are larger, in DZs than MZs. The mean squares for IQ within pairs did not vary sig- nificantly between the final sample and the pairs with incomplete ques- tionnaire data (F = 1.03 in MZs and F = 1.10 in DZs).
Data on the occupation of the twin spouses and on educational at- tainment for parents were available. The spouse correlation for occupa- tional status was .27 (before and after controlling for age). While nearly nonexistent among the (male) twins, housework, which was scored as the lowest category, was quite common among their spouses, probably re- sulting in somewhat decreased spouse correlation. In the four age groups, the correlations were .21, .28, .31, and. 13 for the oldest to the youngest, respectively. The spouse correlation for the educational attainment com- posite was .67, reduced only to .66 after controlling for age. The values for each age group were .86, .70, .63, and .52, respectively, decreasing with year of birth.
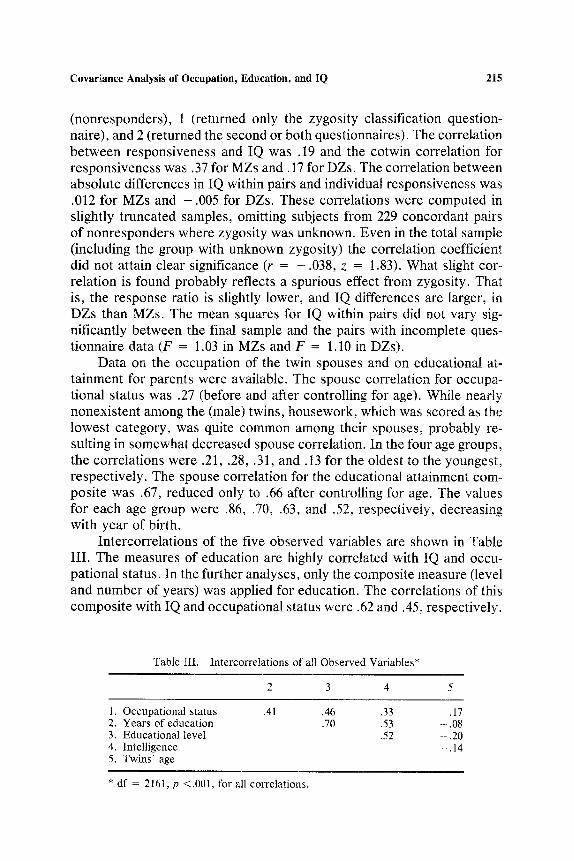
Intercorrelations of the five observed variables are shown in Table III. The measures of education are highly correlated with IQ and occu- pational status. In the further analyses, only the composite measure (level and number of years) was applied for education. The correlations of this composite with IQ and occupational status were .62 and .45, respectively.
Table III. Intercorrelations of all Observed Variables*
2 3 4 5
1. Occupational status .41 .46 .33 .17 2. Years of education .70 .53 - .08 3. Educational level .52 - . 2 0 4. Intelligence - . 14 5. Twins ' age
* df = 2161, p <.001, for all correlations.

216 Tambs, Sundet, Magnus, and Berg
The correlation between IQ and occupational status (.32) is only slightly larger than expected from their common relationship with education alone.
Genetic Analysis The results of Heath et al. (1985a,b) and Sundet et al. (1988) showed
secular trends for education and IQ for the relative contributions of ge- netic and environmental sources. To test for heterogeneity between co- horts, the observed mean squares/products from four age groups for oc- cupation, education, and IQ were analyzed separately in each age groups, and the model was fitted to the four sets of statistics simultaneously. The chi-square values and the degrees of freedom for each separate analysis were then subtracted from those for the latter analysis. The age groups consisted of 97 pairs born 1931-1935, 361 pairs born 1944-1950, 399 pairs born 1951-1957, and 221 pairs born 1958-1960. Only the year classes 1958-1960 are included in the youngest group. In this way, the ceiling effect for education, due to the young age at the time of reporting, is limited to the smallest possible sample. The trends for mean values and standard deviations (Table I) hardly reflect directly the distribution dif- ferences for genes and environmental factors. For example, due to scale assymmetries or otherwise, the standard deviations may depend on mean scores. To have such effects removed, the scores were rescaled to z scores separately for each age group.
In all age groups, the fit of the model did not deteriorate by fixing the VB (variance between families) specifics to zero, consistent with the notion that VB in all three measurements is due to a single common factor. The model fits were mostly good in the various groups (oldest to y o u n g e s t ) : X9 2 = 7.07, p = .63; X9 z = 17.79, p = .04; X92 = 11.01, p = .28; and X92 = 7.47, p = .59. When inspecting the residuals (observed- expected statistics) the main problem in the 1944-1950 group turned out to be too small mean squares for occupation in the MZ sample and cor- respondingly large in DZs. For the analysis of all the statistics combined, X 2 with 81 dfwas 118.43 (p = .005). The chi-square value for the difference of the model fit, • = 75.09 (p = .005), shows heterogeneity between cohorts.
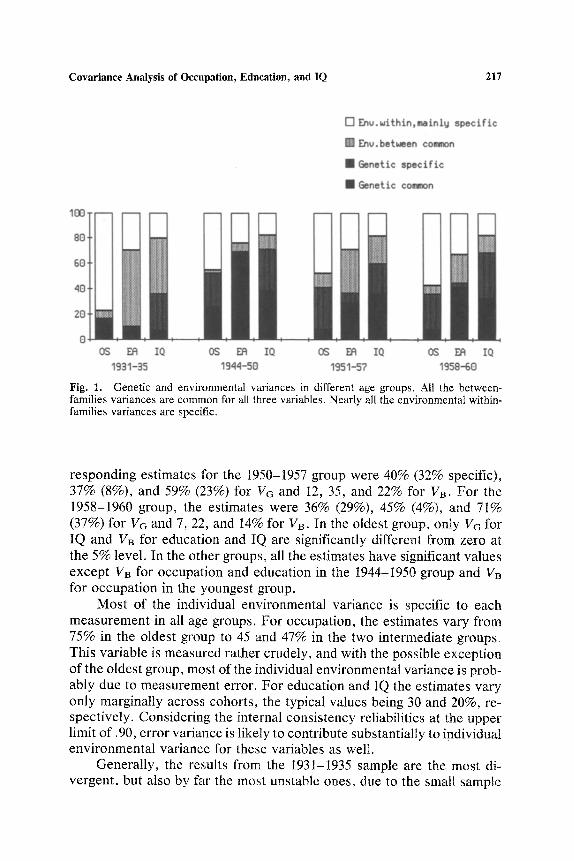
The results for each age group are shown in Fig. 1. In the 1931-1935 group, the values of genetic variance, Va, were 16, 10, and 37% for oc- cupation, education, and IQ, respectively. All the genetic variance was common for occupation and education; 30% was specific for IQ. The corresponding values for (common) VB, were 6, 62, and 45%. In the 1944- 1950 group the values for Va were 51% (26% specific), 70% (all common), and 71% (32% specific), and those for VB were 2, 7, and 12%. The cor-
Covariance Analysis of Occupation, Education, and IQ 217
Fig. 1. Genetic and environmental variances in different age groups. All the between- families variances are common for all three variables. Nearly all the environmental within- families variances are specific.
responding estimates for the 1950-1957 group were 40% (32% specific), 37% (8%), and 59% (23%) for Va and 12, 35, and 22% for VB. For the 1958-1960 group, the estimates were 36% (29%), 45% (4%), and 71% (37%) for Vo and 7, 22, and 14% for VB. In the oldest group, only V~ for IQ and VB for education and IQ are significantly different from zero at the 5% level. In the other groups, all the estimates have significant values except VB for occupation and education in the 1944-1950 group and VB for occupation in the youngest group.
Most of the individual environmental variance is specific to each measurement in all age groups. For occupation, the estimates vary from 75% in the oldest group to 45 and 47% in the two intermediate groups. This variable is measured rather crudely, and with the possible exception of the oldest group, most of the individual environmental variance is prob- ably due to measurement error. For education and IQ the estimates vary only marginally across cohorts, the typical values being 30 and 20%, re- spectively. Considering the internal consistency reliabilities at the upper limit of .90, error variance is likely to contribute substantially to individual environmental variance for these variables as well.
Generally, the results from the 1931-1935 sample are the most di- vergent, but also by far the most unstable ones, due to the small sample
218 Tambs, Sundet, Magnus, and Berg
size. The main tendency is small genetic effects and larger between-fam- ilies effects in this age group, especially for educational attainment. Only two pairs of corresponding estimates vary across subsamples with sig- nificantly different values, both for educational attainment in the two oldest groups: common (and, for this variable, total) genetic variance is larger in the 1944-1950 than in the 1931-1935 group (z = 2.08, p < .04), and VB is larger in the 1931-1935 group than in the 1944-1950 group (z = 2.25, p < .03).
Correcting for Assortative Mating
Assortative mating represents a problem in the comparison of MZ and DZ twins, resulting in additive genetic variance which is confounded with environmental family variance in the estimate of VB. Martin (1978) has suggested an easy correction procedure. The between-family variance may be expressed as
VB = VEB + A M ,
where VEB is the variance due to family environment and A M is the genetic effect due to assortative mating. The latter may be expressed as A M =
VGA/(1 - A ) , where V~ is the random mating additive genetic variance and A the correlation between the additive deviations of spouses. A is related to the spouse correlation, ~, by A = hZ~L or h z = A / ~ , where h 2 is the narrow heritability, h 2 contains V~ and A M and may also be ex- pressed as
h2 = VG + A M
V T '
where VT is the total variance. Substituting h 2 with A/~ , and A M with VcA/ (1 - A), A may now be expressed as a function of Vc , VT, and ~L, for which there are observed or estimated values, and A M and h z may be estimated.
No estimate of the spouse correlation for IQ was available but GrCn- dahl (1985) reported a correlation of .30 between 250 twins and their spouses for the WAIS test. Substituting this value for ~ for all three variables gives calculated values for A M which approach or exceed those for VB in all but the oldest group. The values for occupation, education, and IQ are .01, .01, and .05 in the 1931-1935 group, larger than VB for all variables in the 1944-1950 group, .06, .20, and .18 in the 1951-1957 group, and .05, .30, and larger than VB in the 1958-1960 group. In the 1944-1950 group, spouse correlation values as low as .08 for occupation,

Covariance Analysis of Occupation, Education, and IQ 219
�9 12 for education, and. 17 for IQ were sufficient for A M = VB, compared to the observed values of .27, .70, and .30.
DISCUSSION
Means and standard deviations do not vary significantly across zyg- osity, but for IQ they vary across questionnaire responders and nonre- sponders. Still, the nonsignificant relationship between liability to respond and cotwin differences for IQ suggests no large sample selection bias for the genetic analysis. In a univeriate genetic analysis described elsewhere (Tambs et al., 1989), no heterogeneity between the statistics for IQ scores from different selection groups could be detected.
The ratios of estimated genetic and environmental effects are gen- erally in line with earlier findings. For occupational attainment, defini- tions and methods of measurement probably vary considerably across cultures. Nevertheless, the results for genetic variance (weighted mean of 41% across cohorts) accords with Fulker's (1978) findings, ranging from 28 to 46%, depending on age and statistical models. Tambs and Sundet (1985) have estimated the genetic variance for this variable at 32-64%.
Assuming that the major part of VB is genetic variance due to as- sortative mating, the results indicate a total genetic variance (VG and AM) of approximately 60% for educational attainment, which is in line with earlier results. Fulker (1978) has estimated genetic variance at 45-46% in schooling (1978), reanalyzing Taubman's (1977) data. Vogler and Fulker (1983) have estimated the heritability for educational attainment at about .60 in males, reanalyzing a number of data sets. In a more complete sample of Norwegian twins with parents, Heath et al. (1985a,b) have estimated the heritability of educational attainment applying polychoric correlations in a path-analytical design. In three subsamples of males born 1915-1939, 1940-1949, and 1950-1959, the estimates including dominance variation were 48, 74, and 67%, respectively.
The weighted mean value for genetic variance for IQ is 64%, in- creasing to approximately 80% when correcting for AM. This is slightly larger than the typical values from the literature (Bouchard and McGue, 198I). On the other hand, Tambs et aI. (1984, 1986) and Tambs and Sundet (1985) estimated values of VG in full-scale and subscale WAIS scores in Norwegian twins at 55-85%, not including the genetic effect due to AM, In a large sample including the present one, Sundet et al. (1988) estimated Vo at 68%, applying a univariate model.
The effects of specific genotypes on IQ and occupational status may seem surprisingly large. However, Fulker's (1978) results indicate that
220 Tambs, Sundet, Magnus, and Berg
only a minor part of the genetic effects on schooling and occupational status was common.
The lack of any specific VB is in full agreement with earlier evidence for occupation, education, and IQ (Fulker, 1978; Tambs and Sundet, 1985) and for different abilities (Martin and Eaves, 1977; Martin et al. , 1984, Tambs et al. , 1986). The VB is substantial for educational attainment and IQ. In some of the age groups, the observed value of the spouse correlation for education greatly exceeds the value corresponding to VB = A M . This may suggest the existence of some bias effects, neutralizing A M to some extent, so that a full correction for A M is tantamount to an overcorrection. Nevertheless, with the exception of the oldest group, most of the between- family effect is probably due to assortative mating. The result of no spe- cific between-family effects is in line with Eaves et al. (1984). They con- cluded that the effects of assortative mating may well be generalized for multiple abilities and educational and socioeconomic variables, meaning that all spouse correlations for such variables and across such variables stem from a single common factor.
In isolation, the results do not permit many safe conclusions about secular trends, but the tendencies are in line with earlier findings. One major trend is small heritability for the oldest group. Heritability is great- est for subjects born 1940-1950 and tends to decrease slightly for the younger groups, and this accords with results from Heath et al. (1985a, b) and Sundet et al. (1988). For occupational status, VEw seems to replace some of the Va in the oldest group. One may speculate whether hap- penstance may have determined to a large extent the choice of occupation during the first postwar years or whether the reliability of measurement is simply lower for the oldest group. The large VB for the oldest group for education and IQ may well reflect sociocultural differences between families during the "hard thirties." Correspondingly, it is tempting to attribute the lack of environmental family effect for the younger groups to social conditions during childhood and adolescence. In this period Nor- wegian society, and particularly the educational system, was character- ized by social-democratic egalitarian politics.
ACKNOWLEDGMENTS
The authors are indebted to Marit Hornberg Solaas and coworkers at Department of Medical Genetics, University of Oslo, who participated in the work of the zygosity classification and the collection of information to the Norwegian Twin Panel. We are also indebted to the late leader of the Psychological Department of the Norwegian Army, Eivind Baade, with co-workers, and to the former leader of the department, Vidkunn
Covariance Analysis of Occupation, Education, and IQ 221
Coucheron Thrane. TorbjCrn Mourn, Department of Behavioural Sci- ences in Medicine, University of Oslo, offered valuable advice.
R E F E R E N C E S
Bouchard, T., and McGue, M. (1981). Family studies of intelligence. A review. Science 212:1055-1059.
Eaves, L. J., Last, K. A., Young, P. A., and Martin, N. G. (1978). Model-fitting approaches to the analysis of human behaviour. Heredity 41:249-320.
Eaves, L. J., Heath, A. C., and Martin, N. G. (1984). A note on the generalized effects of assortative mating, Behav. Genet. 14:371-376.
Engvik, H., and Tambs, K. (1985). WA1S. Supplementary Manual, ISV-Test, Oslo, Norway.
Faglig Memorandum nr. 12. B UtskrivningsprOvene (1956). Note, Department of Psychol- ogy, Norwegian Army, Oslo.
Fulker, D. W. (1978). Multivariate extensions of a biometrical model of twin data. In Nance, W. E. (ed.), Progress in Clinical and Biological Research, Vol. 24a Alan R. Liss, New York.
GrCndal, K. (1986). Metodiske aspekter og begrensninger ved arvelighetsanalyser belyst ved 1Q-data fra eneggede tvillinger og deres familier, Dissertation, University of Oslo, Oslo, Norway.
Heath, A. C., Berg, K., Eaves, L. J., Solaas, M. H., Corey, L. A., Sundet, J., Magnus, P., and Nance, W. E. (1985a). Educational policy and the heritability of educational attainment. Nature 314:734-736.
Heath, A. C., Berg, K., Eaves, L. J., Solaas, M. H., Sundet, J. M., Nance, W, E., Corey, L. A., and Magnus P. (1985b). No decline in assortative mating for educational leve!. Behav. Genet. 15:349-369.
JOreskog, K. G., and S6rbom, D. (1978). LISREL: Analysis of Linear Structural Relation- ships by the Method of Maximum Likelihood, Version IV, International Educational Services, Chicago.
Lundgren, E. A., and Skjenstad, H. (1953). Figurregler, Test manual, Department of Psy- chology, Norwegian Army, Oslo, Norway.
Lykken, T. D., McGue, M., and Tellegen, A. (1987). Recruitment bias in twin research: The rule of two-thirds reconsidered. Behav. Genet. 17:343-362.
Magnus, P., Berg, K., and Nance, W. E. (1983). Predicting zygosity in Norwegian twin pairs born 1915-1960. Clin. Genet. 24:103-112.
Martin, N. G. (1978). Genetics of sexual and social attitudes in twins. In Twin Research: Psychology and Methodology, Alan R. Liss, New York.
Martin, N. G., and Eaves, L. J. (1977). The genetical analysis of covariance structure. Heredity 53(1):79-95.
Martin, N. G., and Wilson, S. R. (1982). Bias in the estimation of heritability from truncated samples of twins. Behav. Genet. 12:467-472.
Martin, N. G., Jardine, R., and Eaves, L. J. (1984). Is there only one set of genes for different abilities? A reanalysis of the National Merit Scholarship Qualifying Test (NMSQT) data. Behav. Genet. 14:355-370.
Nordisk Yrkesklassifisering (1978). Arbetsmarknadsstyrelsen, Helsingborg, Sweden. Rideng (1980). SSB's nye kommunetypologi, Central Bureau of Statistics, Oslo, Norway. Sundet, J. M., Tambs, K., Magnus, P., and Berg, K. (1988). On the question of secular
trends in the heritability of intelligence test scores. A study of Norwegian twins Intel- ligence 12:47-59.
Tambs, K., and Sundet, J. M. (1985). Heredity and environmental influence in educational attainment. The effect of genes and environmental factors on differences in education attainment, intelligence, professional status, and need achievement estimated in a twin study. Tidsskr. Samfunnsforsk. 26:437-456.
222 Tambs, Sundet, Magnus, and Berg
Tambs, K., Sundet, J. M., Magnus, P., and Berg, K. (1989). No recruitment bias for ques- tionnaire data related to IQ in classical twin studies. Person. individ. Diff. 10:269-271.
Tambs, K., Sundet, J. M., and Magnus, P. (1984). Heritability analysis of the WAIS subtests. A study of twins. Intelligence 8:283-293.
Tambs, K., Sundet, J. M., and Magnus, P. (1986). Genetic and environmental contributions to the covariation between the Wechsler Adult Intelligence Scale (WAIS) Subtest: A study of twins. Behav. Genet. 16:475-491.
Taubman, P. (ed.) (1977). Kinometrics : The Determinants o f Socioeconomic Success Within and Between Families, North-Holland, Amsterdam.
Vogler, G. P., and Fulker, D. W. (1983). Familial resemblance for educational attainment. Behav. Genet. 13:341-354.
Edited by N. G. Martin
Related Documents