1 Title:Genetic analysis of two Portuguese populations of 1 Ruditapes decussatus by RAPD profiling 2 3 Authors: 4 Jorge C. Pereira 1 , Raquel Chaves 1,2* , Alexandra Leitão 3 , Domitilia Matias 3 , Henrique 5 Guedes-Pinto 1 6 Institutions: 7 1 Institute for Biotechnology and Bioengineering, Centre of Genomics and 8 Biotechnology, UTAD (IBB/CGB-UTAD), P-5001-801 Vila Real, Portugal. 9 2 Department of Genetics and Biotechnology, UTAD, P-5001-801 Vila Real, Portugal. 10 3 Instituto Nacional de Recursos Biológicos (INRB/L-IPIMAR), Av. 5 de Outubro, 8700- 11 305 Olhão, Portugal. 12 Author E-mail address: [email protected] 13 Corresponding author: 14 * Raquel Chaves 15 Institute for Biotechnology and Bioengineering, Centre of Genetics and Biotechnology, 16 University of Trás-os-Montes and Alto Douro, IBB-CGB/UTAD. P-5001-801 Vila Real, 17 Portugal 18 Tel.: +351 259 350841; fax: +351 259 350572. 19 E-mail address: [email protected] 20 21 peer-00633607, version 1 - 19 Oct 2011 Author manuscript, published in "Helgoland Marine Research 65, 3 (2010) 361-367" DOI : 10.1007/s10152-010-0229-9

Welcome message from author
This document is posted to help you gain knowledge. Please leave a comment to let me know what you think about it! Share it to your friends and learn new things together.
Transcript
1
TitleGenetic analysis of two Portuguese populations of 1
Ruditapes decussatus by RAPD profiling 2
3
Authors 4
Jorge C Pereira1 Raquel Chaves
12 Alexandra Leitatildeo
3 Domitilia Matias
3 Henrique 5
Guedes-Pinto1 6
Institutions 7
1 Institute for Biotechnology and Bioengineering Centre of Genomics and 8
Biotechnology UTAD (IBBCGB-UTAD) P-5001-801 Vila Real Portugal 9
2 Department of Genetics and Biotechnology UTAD P-5001-801 Vila Real Portugal 10
3 Instituto Nacional de Recursos Bioloacutegicos (INRBL-IPIMAR) Av 5 de Outubro 8700-11
305 Olhatildeo Portugal 12
Author E-mail address jorgecpereiraportugalmailpt 13
Corresponding author 14
Raquel Chaves 15
Institute for Biotechnology and Bioengineering Centre of Genetics and Biotechnology 16 University of Traacutes-os-Montes and Alto Douro IBB-CGBUTAD P-5001-801 Vila Real 17 Portugal 18
Tel +351 259 350841 fax +351 259 350572 19
E-mail address rchavesutadpt 20
21
peer
-006
3360
7 v
ersi
on 1
- 19
Oct
201
1Author manuscript published in Helgoland Marine Research 65 3 (2010) 361-367
DOI 101007s10152-010-0229-9
2
Abstract 22
The clam Ruditapes decussatus is commercially important in the South of Portugal The Random 23
Amplified Polymorphic DNA (RAPD) technique was applied to assess the genetic diversity and 24
population structure of two Portuguese populations occurring in the Ria Formosa (Faro) and the Ria de 25
Alvor respectively Twenty five individuals of each population were investigated by RAPD profiles 26
Genetic diversity within populations measured by percentage of polymorphic loci (P) varied between 27
6857 (Alvor) and 7388 (Faro) Shannonrsquos information index (H) and Neiacutes gene diversity (h) were 28
0281 and 0176 respectively for the Alvor population and 0356 and 0234 for the Faro population 29
Overall genetic variation within R decussatus populations was high The total genetic diversity (HT) was 30
explained by a low variation between populations (GST=0145) which is consistent with high gene flow 31
(Nm=29) The analysis of molecular variance (AMOVA) showed that 65 of variability is within 32
populations and 35 between populations (ΦPT = 0345 Pgt=0001) The value of Neirsquos genetic distance 33
was 00881 showing a low degree of population genetic distance despite the different geographic origin 34
This is the first study on the population genetics of R decussatus by RAPD technique The results may be 35
useful for restocking programs and aquaculture 36
Keywords RAPDs Ruditapes decussatus Genetic diversity Genetic differentiation 37
Abbreviations RAPDs Random Amplified Polymorphic DNA PCR Polymerase Chain Reaction PBS 38 Phosphate Buffered Saline Solution s seconds min minutes dNTPs Deoxyribonucleotide triphosphate 39 bp base pair 40
41
42
peer
-006
3360
7 v
ersi
on 1
- 19
Oct
201
1
3
1 Introduction 43
The grooved carpet shell clam Ruditapes decussatus is widely distributed along the coastal and 44
estuarine areas of Europe and North Africa In Portugal R decussatus is among the most common clam 45
species found in the market for human consumption and the one with the highest economic importance 46
Its market price can reach four times the price of other clam species (Fernaacutendez et al 2000) About 80 47
of shellfish production originates from aquaculture which is based on seed collected from natural 48
recruitment banks and planted by producers in ongrowing parks (Matias et al 2009) In spite of the 49
speciesrsquo great commercial importance studies on the genetic diversity are very scarce regarding only to 50
allozymes (Worms et al 1982 Jarne et al 1988 Borsa et al 1991 Jordaens at al 2000) A sustainable 51
exploitation of the natural resource and improvement in aquaculture requires a deeper knowledge of the 52
genetic variability and genetic relationships of the different clam populations 53
The classical strategies for the evaluation of genetic variation such as morphology and 54
embryology have been outdated by the availability of molecular markers techniques (Weising et al 55
1995) In general molecular markers are based on polymorphisms found in DNA The values obtained 56
will be different for each individual population or species depending of the resolution of the DNA 57
markers used One of the molecular markers technique currently used is the Random Amplified 58
Polymorphic DNA (RAPD) (Williams et al 1990 Welsh and McClelland 1990) that provides an useful 59
tool to study the genetic variability of a population This technique consists in the PCR (Polymerase 60
Chain Reaction) amplification of small inverted repeats scattered in the genome using a single short 61
primer of arbitrary sequence allowing a scan throughout the genome more randomly than the 62
conventional techniques The ability to examine genomic variation without previous sequence 63
information (Williams et al 1990) the relatively low cost of the technique and the requirement of only 64
some nanograms of template DNA represent the major advantages of the use of RAPD technique in 65
population studies RAPDs have showed to be an extremely sensitive method for detecting DNA variation 66
and for the establishment of genetic relationships between closely related organisms (Peacuteres et al 1998) 67
Among the multiple applications of RAPDs are their use in population genetic studies (Haig et al 1994) 68
taxonomy (Chapco et al 1992) determination of paternity (Lewis and Snow 1992) and mapping 69
(Michelmore et al 1991) The two main and often mentioned disadvantages of this type of molecular 70
markers are a lack of reproducibility and the loss of complete genotypic information due to the fact that 71
most RAPD bands are dominantly inherited The potential use of RAPD analysis in phylogenetic studies 72
and population genetics has been documented in a wide variety of organisms (Hadrys et al 1992) In 73
marine invertebrates this technique has successfully been used in analysing genetic polymorphisms at the 74
interspecific level in oysters (Klinbunga et al 2000) and mussels (Rego et al 2002) and at the 75
intraspecific level in scallops (Patwary et al 1994) abalone (Huang et al 2000) and oysters (Hirschfeld et 76
al 1999 Klinbunga et al 2001) 77
In the present study RAPD profiling was applied to measure the genetic diversity and 78
interpopulational differentiation of two Portuguese populations of the clam R decussatus 79
80
81
82
peer
-006
3360
7 v
ersi
on 1
- 19
Oct
201
1
4
2 Material and methods 83
21 Sample collection and DNA extraction 84
Ruditapes decussatus individuals were collected from two Portuguese populations 25 85
individuals from Ria Formosa (Faro 37deg 2prime 0Prime N 7deg 55prime 0Prime W) and 25 individuals from Ria de Alvor 86
(Alvor 37deg 8prime 0Prime N 8deg 36prime 0Prime W) Algarve South of Portugal After two days of depuration the material 87
was dissected and kept in 70 ethanol until further use The protocol for DNA extraction followed the 88
one by Pereira (2008) where 5-25 mg of adductor muscle was placed in a 2 ml eppendorf with 100 microl of 89
1times PBS and distilled water for 10 min each The tissue was cut in small pieces and homogenized with a 90
Pestle Pellet (Sigma) Afterwards 180 microl MDT (Tissue Lysis Buffer) 20 microl EDT (Proteinase K) were 91
added and the samples were incubated overnight at 55ordmC for complete digestion After centrifugation at 92
10000 rpm for 3 min at room temperature the supernatant was transferred to a new 2 ml eppendorf The 93
subsequent addition of 180 microl LDT (Lysis Buffer) was followed by a 15 s vortexing and a flash spin 94
down After incubation at 70ordm C for 10 min 240 microl of absolute ethanol was added and the tubes were 95
vortexed and spinned down Finally the lysate was transferred to a cartridge of the automatic nucleic-acid 96
isolation system QuickGene-800 and the ldquoDNA tissue moderdquo was selected 97
22 PCR amplification 98
Several experiments were made to optimize the reproducibility of the RAPD assay closely 99
following the protocol of Williams et al (1990) in which concentrations of template DNA dNTPs 100
MgCl2 concentration and Taq polymerase were varied to determine which conditions produced the 101
strongest and most reproducible patterns Amplification reactions were performed in volumes of 25 microl 102
containing 50 ng of genomic template DNA 100 microM of each dATP dCTP dGTP and dTTP 02 microM of 103
the primer and 05 units of Taq DNA polymerase (Fermentas Life Sciences) Amplification was 104
performed in a Thermal Cycler (T-personal Biometra) in a total of 45 cycles 1 min at 94ordmC 1 min at 30-105
36ordmC and 2 min at 72ordmC The total volume of the PCR products were evaluated in 2 agarose gels and 106
visualized by ethidium bromide staining After electrophoresis DNA bands profiling were observed 107
under UV light and the images were saved in a gel analyzer (UVIDOC) 108
23 Data analysis 109
The genetic diversity within populations and the genetic differentiation between populations 110
where quantified using GeneAlEx 61 Genetic Analysis Software (Peakall and Smouse 2007) and 111
POPGENE 32 (Yen et al 1996) programs The genetic diversity within populations was estimated by 112
calculating percentage polymorphic loci (P) number of expected alleles (na) effective allele number 113
(ne) Neiacutes gene diversity (Nei 1973) (h) Shannons information index (H) total gene diversity (HT) and 114
average gene diversity within populations (HS) 115
In order to estimate the genetic differentiation between populations analogous of FST fixation 116
index measures such as coefficient of gene differentiation (GST) (Nei 1987) and ΦPT (AMOVA) were 117
used The analysis of molecular variance (AMOVA) was calculated with the software GeneAlEx 61 118
(Peakall and Smouse 2007) for variation among individuals within populations and among populations 119
Due to the absence of assumptions AMOVA is widely applicable and powerful The fact that allele 120
frequencies are not calculated led to the application of this method to analyze dominant data type like 121
peer
-006
3360
7 v
ersi
on 1
- 19
Oct
201
1
5
RAPDs (Huff et al 1993) The values of gene flow (Nm) (McDermott and McDonald 1993) and standard 122
genetic distance of Nei (1972) were estimated 123
124
3 Results 125
31 Genetic diversity within populations 126
The application of RAPD technique to the genome of Ruditapes decussatus produces a 127
significant number of amplified fragments Of the twenty screened primers ten amplified 245 clear and 128
reproducible bands (Table 1) 168 bands were amplified in the Alvor population and 183 in the Faro 129
population (Fig 1) with lengths ranging from 180 to 1500 bp The primer OPE-15 generated the highest 130
number of bands (21 bands in the Alvor population and 24 in the Faro population) primer OPE-02 in the 131
Faro population and primers OPE-01 and OPE-16 in the Alvor population produced the lowest number 132
of bandsmarkers (Table 1) The two populations have 62 (Alvor) and 77 (Faro) private bands 133
respectively 134
A summary of the genetic diversity of the populations based on the RAPD markers is presented 135
in Table 2 Since dominant data have some shortcomings in calculation of genetic diversity (Lowe et al 136
2004) the method developed by Lynch and Milligan (1994) present in GeneAlEx 61 Genetic Analysis 137
Software (Peakall and Smouse 2007) was used to calculate allele frequencies The percentage of 138
polymorphism (P) of the two Portuguese populations was 6857 (Alvor) and 7388 (Faro) while the 139
number of expected alleles (na) and the number of effective alleles (ne) were 1371 and 1267 for the 140
Alvor and 1486 and 1389 for the Faro population Neirsquos gene diversity index (h) and Shannonrsquos 141
information index (H) were estimated for the two populations of R decussatus the Alvor population 142
showed values of 0176 and 0281 while values for the Faro population were 0234 and 0356 143
32 Population genetic structure 144
Genetic diversity based on all bands showed that the total gene diversity (HT) measured in terms 145
of the total expected heterozygosity was 02396 the gene diversity within populations (HS) was 02047 146
and gene diversity among populations (DST= HT-HS) was 00349 (Table 3) Using these diversity indices it 147
was possible to calculate the coefficient of gene differentiation (GST=DSTHT=01450) which measures the 148
proportion of total genetic diversity occurring among populations and is analogous to Wrightrsquos FST values 149
This means that only approximately 145 of the genetic variation observed in this study was due to 150
differentiation among populations while 855 is due to variation within populations 151
Estimates of GST also allows to estimate another genetic parameter the gene flow (Nm=05(1 - 152
GST)GST)) (McDermott and McDonald 1993) which was calculated to Nm = 29 According to Crow and 153
Aoki (1984) gene flow values of Nm lt 1 should be interpreted as little or no gene flow Thus the value of 154
Nm = 29 would suggest high genetic exchange between the two populations studied 155
AMOVA (Analysis of Molecular Variance) (Table 4) showed that 65 of the variability was 156
within populations whilst 35 was among them Analogous to Wrightrsquos FST is also the ΦPT value 157
estimated with AMOVA it amounted to 0345 (Pgt=0001) based on permutation across the full data set 158
To compare the degree of genetic differentiation among populations the standard genetic 159
distance of Nei (1972) was estimated The value of Neirsquos genetic distance was D = 00881 while the 160
peer
-006
3360
7 v
ersi
on 1
- 19
Oct
201
1
6
value of genetic identity was I = 09157 indicating low genetic differentiation between the two 161
populations 162
163
4 Discussion 164
RAPD assay was used in order to analyze the genetic diversity and differentiation in two 165
southern Portuguese populations of Ruditapes decussatus The technique was found to be effective in 166
revealing polymorphisms in this species since all 10 random primers produced at least one polymorphic 167
fragment The major limitations of this technique are its lack of reproducibility (Ford-Lloyd and Painting 168
1996 Weising et al 1994 Guadagnuolo et al 2001) and its sensitivity to small variations in PCR 169
conditions In order to overcome these limitations DNA of high quality was used and three repetitions 170
were performed for the same primers and individuals which generate the same results 171
Genetic diversity within populations is of great concern to ecologists and geneticists A reduced 172
genetic variation is thought to affect the ability of populations to adapt to changing environments thereby 173
increasing their probability of extinction (Beardmore 1983) Waugh and Powell (1992) stated that the 174
analysis of polymorphism by molecular markers could help to select priority areas for conservation and 175
provide vital information for the development of genetic sampling and improvement 176
In total the analysis of the genetic variability within populations by RAPDs based on percentage 177
of polymorphic loci (P) effective allele numbers (na) expected numbers of alleles (ne) Nei`s gene 178
diversity (h) and Shannon`s Index (H) suggests that the two populations present very high levels of 179
genetic diversity These results are similar to those by Borsa and Thiriot-Quieacutevreux (1990) Passamonti et 180
al (1997) and Jordaens et al (2000) who studied populations of this species especially the Azores 181
population using allozymes as molecular markers The high levels of genetic variation suggest that these 182
bivalves are phenotypically plastic and may respond adequately to changing environments In contrast 183
very low genetic differentiation was found among the two studied populations Only 145 (GST = 0145) 184
of the genetic variability was among populations while 855 was within populations The gene flow 185
(Nm) value (Slatkin 1993) allows evaluating whether or not each of the considered population of a species 186
evolves as an independent unit Theory predicts that a global value of Nmgt1 prevents random 187
differentiation by genetic drift (Slatkin 1993) The calculated level of gene flow (Nm = 29) would allow 188
the two populations to act as a single interbreeding population However this conclusion should be 189
considered cautiously because the mathematical assumptions underlying estimates of genetic diversity 190
and differentiation may not be completely realistic (Whitlock and McCauly 1999) Similar results were 191
obtained with the method of analysis of molecular variance (AMOVA) that showed a high genetic 192
variation within populations and low genetic differentiation between them However the value of fixation 193
index (ΦPT =0345) suggested that the populations may have some structure although the degree of 194
differentiation was not large This differentiation may be due to geographical isolation or hydrological 195
factors 196
The values of the distance and genetic identity (Nei 1972) estimated for the two populations 197
were 09176 and 00860 respectively These values support the high degree of genetic identity and the 198
low level of genetic differentiation of the two populations 199
peer
-006
3360
7 v
ersi
on 1
- 19
Oct
201
1
7
In conclusion the two populations of R decussatus studied presented high values of genetic 200
variability within populations and low values of genetic differentiation between them demonstrating a 201
high degree of genetic homogeneity The value of the gene flow (Nm) GST and ΦPT quantification 202
demonstrate that the exchange of genes between the two populations is high A high degree of genetic 203
homogeneity among populations has also been described for populations of other marine invertebrates 204
such as Concholepas concholepas (Gallardo and Carrasco 1996) Ostrea chilensis (Toro and Aguila 205
1996) and Venus antique (Gallardo et al 1998) The high values found for the genetic diversity within 206
populations associated with low values of genetic variation among populations suggest panmixy as the 207
dominant mode of reproduction (Armbruster 1997 1998 Fernaacutendez-Tajes et al 2007) 208
Mollusc species with extended larval planktonic phases are generally thought to disperse further 209
and to show higher rates of gene flow larger geographic ranges lower levels of genetic differentiation 210
among populations and high levels of genetic variation within populations (Scheltema and Williams 211
1983 Waples 1987 Williams and Benzie 1993 Palumbi 1995) The life cycle of R decussatus presents a 212
larval planktonic stage which lasts about three weeks followed by benthic juvenile and adult stages 213
During the larval phase larvae can travel many miles driven by currents before settling in favourable 214
habitats 215
Due to overexploitation the R decussatus population at Alvor suffered a strong decline This led 216
to a restocking by man for commercial purposes with seed from other local populations mainly from the 217
Ria Formosa population which is the most important source of R decussatus natural seed (juveniles) for 218
this activities The dispersal of planktonic larvae as well as the introduction of Ria Formosa seed in the 219
Alvor population may have contributed to the low values of genetic differentiation between these two 220
populations These results can be very useful in designing programmes for the management of marine 221
resources Furthermore studies on the genetic variability of R decussatus should be extended to a larger 222
number of local population using other types of molecular markers in order to provide a broader scientific 223
for defining the best practices to improve a sustainable aquaculture production 224
225 226 pe
er-0
0633
607
ver
sion
1 -
19 O
ct 2
011
8
Acknowledgements 227
This work was supported by a PhD grant Ref SFRHBD277202006 a research project Ref 228
PTDCMAR721632006 (European Union with a research project Ref FCOMP-01-0124-FEDER-229
007384) and the ldquoPrograma Ciecircncia 20072008rdquo of the Science and Technology Foundation (FCT) from 230
Portugal 231
We also wish to thank the IPIMARTavira Portugal team for their local support in sampling and to the 232
referee for valuable comments that greatly improved the manuscript 233
234
References 235
Armbruster G (1997) Genetische Verarmung aufgrund von Populationseinbruumlchen Eine Analyse 236
bei der seltenen Landschneckenart Cochlicopa ninens (Gallenstein 1848) Nature Landscape 72444-446 237
Armbruster G (1998) Bei einer verbreiteten Landschnecke Cochlicopa lubrica (O F Muumlller) 238
wird die Frequenz von molekularen phaumlnotypen durch Selbstbefruchtung und habitatspezifische Selektion 239
beeinflusst Laufener Seminarbeitraumlge 298 der Bayerischen Akademie Naturschutz und 240
Landschaftspflege (ANL) 39-49 241
Beardmore JA (1983) Extinction survival and genetic variation In C M Schoenwald-Cox S 242
M Chambers B MacBryde and L Thomas [eds] Genetics and conservation 125ndash151 Benjamin-243
Cummings Menlo Park CA 244
Borsa P Thiriot-Quievreux C (1990) Karyological and allozymic characterization of Ruditapes 245
philippinarum R aureus and R decussatus (Bivalvia Veneridae) Aquaculture 90209-227 246
Borsa P Zainui M Delay B (1991) Heterozygote deficiency and population structure in the 247
bivalve Ruditapes decussatus Heredity 66 l-8 248
Borsa P Jousselin Y Delay B (1992) Relationships between allozymic heterozygosity body 249
size and survival to natural anoxic stress in the palourde Ruditapes decussatus (Bivalvia Veneridae) J 250
Exp Mar Biol Ecol 155169-181 251
Borsa P Jaren P Belkhir K Bonhomme F (1994) Genetic structure of the palourde Ruditapes 252
decussatus L in Mediterranean In Beaumont AR (ed) Genetics and Evolution of Aquatic Organisms 253
Chapman and Hall London pp 103-113 254
Chapco W Kelln RA McFadyen DA (1992) Intraspecific mitochondrial DNA variation in the 255
migratory grasshopper Melanoplus sanguinipes Heredity 69547ndash557 256
Crow JF Aoki K (1984) Group selection for polygenic behavioral trait estimating the degree of 257
population subdivision Proc Natl Acad Sci USA 816073-6077 258
Fernaacutendez A Garciacutea T Asensio L Rodriacuteguez MAacute Gonzaacutelez I Ceacutespedes A Hernaacutendez PE 259
Martiacuten R (2000) Identification of the clam species Ruditapes decussatus (Grooved Carpet Shell) 260
Venerupis pullastra (Pullet Carpet Shell) and Ruditapes philippinarum (Japanese Carpet Shell) by 261
PCRRFLP J Agric Food Chem 48 3336ndash3341 262
Fernaacutendez-Tajes J Gaspar M Martiacutenez-Patintildeo D McDonough N Roberts D Gonzaacutelez-Tizoacuten 263
A Martiacutenez-Lage A Meacutendez J (2007) Genetic variation of the razor clam Ensis siliqua (Jeffreys 1875) 264
along the European coast based on random amplified polymorphic DNA markers Aquaculture Res 265
381205ndash1212 266
peer
-006
3360
7 v
ersi
on 1
- 19
Oct
201
1
9
Ford-Lloyd B Painting K (1996) Measuring Genetic Variation Using Molecular Markers 267
IPGRI Rome 268
Gallardo M Carrasco J (1996) Genetic cohesiveness among population of Concholepas 269
concholepas (Gastropoda Muricidae) in southern Chile J Exp Mar Biol Ecol 197 237-249 270
Gallardo M Penaloza L Clasing E (1998) Gene flow and allozymic population structure in the 271
clam Venus antique (King amp Broderip) (Bivalvia Veneriidae) from southern Chile J Exp Mar Biol Ecol 272
230 193-205 273
Guadagnuolo R Savova-Bianchi D Felber F (2001) Gene flow from wheat (Triticum aestivum 274
L) to jointed goatgrass ( Aegilops cylindrica Host) as revealed by RAPD and microsatellite markers 275
Theor Appl Genet 103 1ndash8 276
Hadrys H Balick M Schierwater B (1992) Applications of randomly amplified polymorphic 277
DNA (RAPD) in molecular ecology Mol Ecol 155ndash63 278
Haig SM Rhimer JM e Heckel DG (1994) Poppulation differentiation in randomly amplified 279
polymorphic DNA of red-cocked woodpeckers Picoides borealis Mol Ecol 3 581-595 280
Hirschfeld D Dhar AK Rask K Alcivar-Warren A (1999) Genetic diversity in the eastern oyster 281
(Crassostrea virginica) from Massachusetts using RAPD technique J Shellfish Res 18121ndash125 282
Huang BX Peakall R Hanna PJ (2000) Analysis of genetic structure of blacklip abalone 283
(Haliotis rubra) populations using RAPD minisatellite and microsatellite markers Mar Biol 136 207-284
216 285
Huff DR Peakall R Smouse PE (1983) RAPD Variation within and among Natural Populations 286
of Outcrossing Buffalograss [Buchloe dactyloides (Nutt)] [J] Theor Appl Genet 86 927ndash934 287
Jarne P Berrebi P Guelorget O (1988) Variabiliteacute geacuteneacutetique et morphometrique de cinc 288
populations de la palourde Ruditapes decussatus (mollusque bivalve) Oceanol Acta 11401-407 289
Jordaens K De Wolf H Willems T Van Dongen S Brito C Frias Martins AM Backeljau T 290
(2000) Loss of genetic variation in a strongly isolated Azorean population of the edible clam Tapes 291
decussates J Shellfish Res 1929ndash34 292
Klinbunga S Ampayup P Tassanakajon A Jarayabhand P Yoosukh W (2000) Development of 293
species-specific markers of the tropical oyster (Crassostrea belcheri) in Thailand Mar Biotechno 2476-294
484 295
Klinbunga S Ampayup P Tassanakajon A Jarayabhand P Yoosukh W (2001) Genetic 296
diversity and molecular markers of cupped oysters (Genera Crassostrea Saccostrea and Striostrea) in 297
Thailand revealed by RAPD analysis Mar Biotechnol 3133-144 298
Klinbunga S Khamnamtong N Puanglarp NTassanakajonA Jarayabhand P Hirono I Aoki T 299
Menasveta P (2003) Genetic diversity and molecular markers of the tropical abalone (Haliotis asinia) 300
inThailand Mar Biotechnol 5507-517 301
Lewis PO Snow AA (1992) Deterministic paternity exclusion using RAPD markers Mol Ecol 302
1155-60 303
Lowe AJ Harris SA Ashton P (2004) Ecological Genetics Design Analysis and Application 304
Blackwell Oxford 305
Lynch M Milligan BG (1994) Analysis of population genetic structure with RAPD markers 306
peer
-006
3360
7 v
ersi
on 1
- 19
Oct
201
1
10
Mol Ecol 391ndash99 307
Matias D Joaquim S Leitatildeo A Massapina C (2009) Effect of geographic origin temperature 308
and timing of broodstock collection on conditioning spawning success and larval viability of Ruditapes 309
decussatus (Linneacute 1758) Aquacult Int 17 257-271 310
McDonald BA McDermott JM (1993) Population genetics of plant pathogenic fungi Bioscience 311
43311-319 312
Michelmore RW Paran I Kesseli RV (1991) Identification of markers linked to disease 313
resistance genes by bulked segregant analysis A rapid method to detect markers in specific regions by 314
using segregating populations Proc Natl Acad Sci USA 88 9828-9832 315
Nei M (1972) Genetic distance between populations Am Nat 106283ndash292 316
Nei M (1973) Analysis of gene diversity in subdivided populations Proc Natl Acad Sci USA 317
703321ndash3323 318
Nei M (1976) Mathematical models of speciation and genetic distance In Karlin S Nevo E 319
(eds) Population Genetics and Ecology Academic Press New York pp 723-766 320
Nei M (1978) The theory of genetic distance and evolution of human races Jpn J Hum Genet 23 321
341-369 322
Nei M (1978) Estimation of average heterozygosity and genetic distance from a small number of 323
individuals Genetics 89583ndash590 324
Nei M (1987) Molecular evolutionary genetics Columbia University Press New York pp 512 325
Palumbi SR (1995) Using genetics as an indirect estimator of larval dispersal In McEdwards L 326
(ed) Ecology of Marine Invertebrate Larvae CRC Press Inc Boca Raton pp 369-387 327
Patwary MU Kenchington EL Bird CJ Zouros E (1994) The use of random amplified 328
polymorphic DNA markers in genetic studies of the sea scallop Placopecten magellanicus (Gmellin 329
1791) J Shellfish Res 13 547ndash553 330
Peakall R Smouse PE (2006) GENEALEX 6 genetic analysis in Excel Population genetic 331
software for teaching and research Mol Ecol Notes 6288-295 332
Pereira J (2008) Perfis de RAPD-PCR em populaccedilotildees de Ruditapes decussatus (Linnaeus 1758) 333
do sul de Portugal Avaliaccedilatildeo da diversidade geneacutetica Master thesis 334
Peacuteres T Albornoz J Domiacutenguez A (1998) An evaluation of RAPD fragment reproducibility and 335
nature Mol Ecol 7 1347-1357 336
Rego I Martiacutenez A Gonzaacutelez-Tizoacuten A Vieites J Leira F Meacutendez J (2002) PCR Technique 337
for Identification of Mussel Species J Agr Food Chem 50 (7)1780 -1784 338
Scheltema RS Williams IP (1983) Long distance dispersal of planktonic larvae and the 339
biogeography and evolution of some polynesian and western pacific mollusks Bull Mar Sci 33 545-565 340
Slatkin M (1993) Isolation by distance in equilibrium and nonequilibrium populations Evolution 341
47264-279 342
Toro J Aguila P (1996) Genetic differentiation of populations of the oyster Ostrea chilensis in 343
Southern Chile Aquat Living Resour 975-78 344
Waugh R Powell W (1992) Using RAPD markers for crop improvement Trends Biotechnal 345
10186ndash191 346
peer
-006
3360
7 v
ersi
on 1
- 19
Oct
201
1
11
Waples RS (1987) A multispecies approach to the analysis of gene flow in marine shore fishes 347
Evolution 41385-400 348
Weising K Nybom H Wolff K Meyer W (1995) DNA fingerprinting in plants and fungi CRC 349
Press London 350
Welsh J McClelland M (1990) Fingerprinting genomes using PCR with arbitrary primers 351
Nucleic Acids Res 187213ndash7218 352
Whitlock MC McCauley DE (1999) Indirect measures of gene flow and migration FST doesnrsquot 353
equal 1(4Nm+1) Heredity 82117-125 354
Williams JGK Kubelik AR Livak KJ Rafalski JA Tingey SV (1990) DNA polymorphisms 355
amplified by arbitrary primers are useful as genetic markers Nucleic Acids Res 186531ndash6535 356
Williams ST Benzie JAH (1993) Genetic consequences of long larval life in the starfish Linckia 357
laevigata (Echinodermata Asteroidea) on the Great Barrier Reef Mar Biol 11771-77 358
Worms J Pasteur N (1982) Polymorphisme biochimique de la palourde Venerupis decussata 359
de 1eacutetang du Peacutevost (France) Oceanol Acta 5395-397 360
Yen FC Yang R Boyle TJ Ye Z Xiyan JM (2000) PopGene32 Microsoft Windowsbased 361
freeware for population Genetic analysis version 132 Molecular Biology and Biotechnology Centre 362
University of Alberta Edmonton 363
364
Figure legends 365
Fig 1 Number of bands and mean heterozygosity in two Ruditapes decussatus populations 366
367
Table 1 Selected primers for the evaluation of genetic diversity in the two populations of Ruditapes 368 decussatus 369 370
Name Sequence (5`-3`)
T
(ordmC) Alvor Faro
Number of
bands
Range of
bands
Number of
bands
Range of
bands
OPE-01 CCCAAGGTCC 33 12 250-900 20 380-1500
OPE-02 GGTGCGGGAA 36 15 300-880 10 520-1200
OPE-03 CCAGATGCAC 36 17 300-880 16 350-1100
OPE-06 AAGACCCCTC 36 22 250-1500 17 250-1100
OPE-10 CACCAGGTGA 36 17 250-1300 23 250-1500
OPE-11 GAGTCTCAGG 36 17 180-1200 18 180-1300
OPE-12 TTATCGCCCC 33 15 280-750 12 380-950
OPE-14 TGCGGCTGAG 33 20 320-1000 21 250-1000
OPE-15 ACGCACAACC 33 21 200-800 24 180-1000
OPE-16 GGTGACTGTG 36 12 320-850 21 200-1500
371 372
Table 2 Genetic variation within two Portuguese populations of Ruditapes decussatus (N - number of 373 sampled individuals na - Number of expected allels ne - effective allele number h - Neis gene diversity 374 H - mean Shannons information index P - percentage polymorphic loci calculated with all alleles 375 included SE - standard error 376 377
peer
-006
3360
7 v
ersi
on 1
- 19
Oct
201
1
12
N na ne h H P
Alvor 25
Mean 1371 1267 0176 0281 6857
SE 0059 0018 0010 01654
Faro 25
Mean 1486 1389 0234 0356 7388
SE 0056 0023 0012 0017
Total 50 Mean 1429 1328 0205 0319 7122
SE 0041 0015 0008 0011
378 379
Table 3 Genetic variation among the Portuguese populations of Ruditapes decussatus based on the 380 diversity indices of Nei (1973) 381 382
HT Total gene diversity 02396
HS Gene diversity within populations 02047
DST Gene diversity among populations 00349
GST Coefficient of gene differentiation 01450
Nm Gene flow 29
383 Table 4 Analysis of Molecular Variance (AMOVA) in the two Portuguese populations of Ruditapes 384 decussatus 385 386 387
Source df SS Variance () Fixation index (ΦPT)
Among pops 1 463320 35 0345
Within pops 48 1569520 65
Total 49 2032840 100
388 389
peer
-006
3360
7 v
ersi
on 1
- 19
Oct
201
1
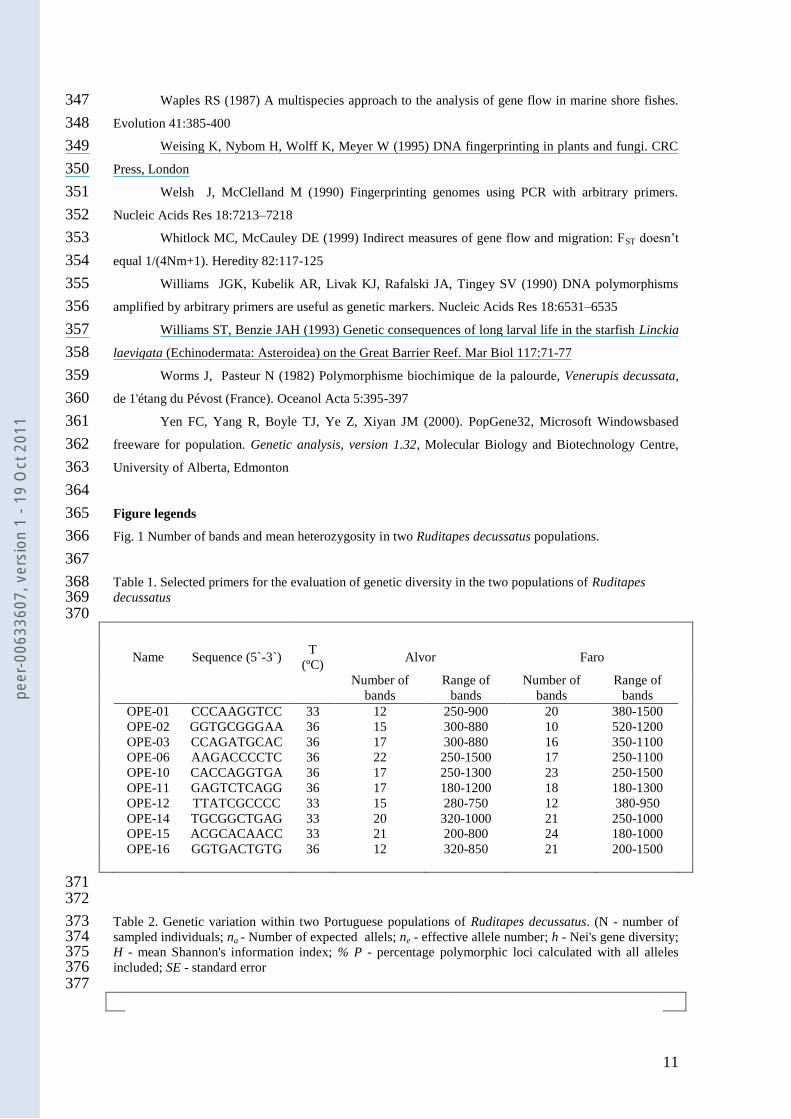
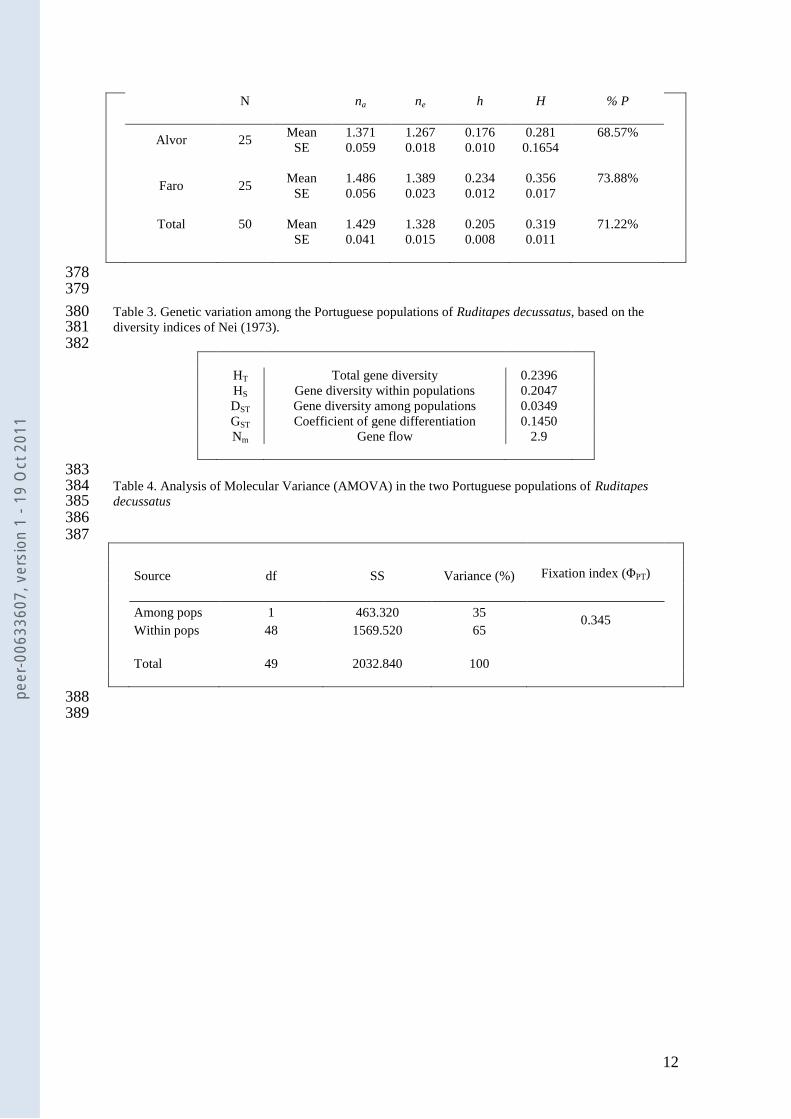
Related Documents