Citation: Singh, M.; Avtar, R.; Kumar, N.; Punia, R.; Pal, A.; Lakra, N.; Kumari, N.; Kumar, D.; Naruka, A.; Bishnoi, M.; et al. Genetic Analysis for Resistance to Sclerotinia Stem Rot, Yield and Its Component Traits in Indian Mustard [Brassica juncea (L.) Czern & Coss.]. Plants 2022, 11, 671. https://doi.org/10.3390/plants 11050671 Academic Editors: Irina N. Anisimova, Svetlana Goryunova and Eugene Radchenko Received: 4 January 2022 Accepted: 23 February 2022 Published: 28 February 2022 Publisher’s Note: MDPI stays neutral with regard to jurisdictional claims in published maps and institutional affil- iations. Copyright: © 2022 by the authors. Licensee MDPI, Basel, Switzerland. This article is an open access article distributed under the terms and conditions of the Creative Commons Attribution (CC BY) license (https:// creativecommons.org/licenses/by/ 4.0/). plants Article Genetic Analysis for Resistance to Sclerotinia Stem Rot, Yield and Its Component Traits in Indian Mustard [Brassica juncea (L.) Czern & Coss.] Manjeet Singh 1, * , Ram Avtar 1 , Neeraj Kumar 1 , Rakesh Punia 1 , Ajay Pal 2 , Nita Lakra 3 , Nisha Kumari 1 , Dalip Kumar 1 , Anu Naruka 1 , Mahavir Bishnoi 1 , Rajbir Singh Khedwal 1 , Raju Ram Choudhary 1 , Anoop Singh 4 , Ravindra Kumar Meena 1 , Ankit Dhillon 1 and Vivek K. Singh 1, * 1 Department of Genetics and Plant Breeding, CCS Haryana Agricultural University, Hisar 125004, India; [email protected] (R.A.); [email protected] (N.K.); [email protected] (R.P.); [email protected] (N.K.); [email protected] (D.K.); [email protected] (A.N.); [email protected] (M.B.); [email protected] (R.S.K.); [email protected] (R.R.C.); [email protected] (R.K.M.); [email protected] (A.D.) 2 Department of Biochemistry, CCS Haryana Agricultural University, Hisar 125004, India; [email protected] 3 Department of Molecular Biology, Biotechnology and Bioinformatics, CCS Haryana Agricultural University, Hisar 125004, India; [email protected] 4 Department of Botany, Maharshi Dayanand University, Rohtak 124001, India; [email protected] * Correspondence: [email protected] (M.S.); [email protected] (V.K.S.); Tel.: +91-9053127937 (M.S.); +91-9451895240 (V.K.S.) Abstract: Understanding the mode of gene action that controls seed yield and Sclerotinia stem rot resistance in Indian mustard is critical for boosting yield potential. In a line × tester mating design, ten susceptible lines and four resistant testers were used to conduct genetic analysis. The significance of general combining ability (GCA) and specific combining ability (SCA) variances revealed that both additive and non-additive gene actions were involved in the inheritance of Sclerotinia stem rot resistance and yield attributing traits. In addition to 1000-seed weight and number of primary and secondary branches/plant, the genotypes RH 1569 (line) and DRMR 2035 (tester) appeared to be the strongest general combiners for Sclerotinia stem rot resistance. RH 1657 × EC 597317 was the only cross among several that demonstrated a significant desired SCA value for Sclerotinia rot resistance. Regarding SCA effects for yield and component traits, the cross RH 1658 × EC 597328 performed best, with a non-significant but acceptable negative SCA effect for resistance. DRMR 2035, RH 1222-28, RH 1569, RH 1599-41, RH 1657, RH 1658, and EC 597328 are promising genotypes to use as parents in future heterosis breeding and for obtaining populations with high yield potential and greater resistance to Sclerotinia stem rot disease in Indian mustard, based on GCA effects of parents, per se performance, and SCA effects of hybrids. Days to 50% flowering, number of primary branches/plant, main shoot length, and 1000-seed weight all had a high genotypic coefficient of variability (GCV), broad-sense heritability (h 2 bs), and genetic advance as percent of the mean (GAM) values, as well as significant and desirable correlations and direct effects on seed yield. As a result, these traits have been recognized as the most critical selection criterion for Indian mustard breeding programs. Keywords: Sclerotinia stem rot; gene action; combining ability; heterosis breeding; selection criteria 1. Introduction India is the world’s 4th largest grower and producer of oil-producing crops, accounting for ~19% of worldwide acreage and 2.7% of production. Oilseed crops, just after cereals, play an important role in the Indian agricultural economy. India is on track to become the world’s third-largest consumer market and an importer of edible oils, meeting over 60% of its domestic consumption through imports at the cost of USD 10 billion per year [1–3]. Plants 2022, 11, 671. https://doi.org/10.3390/plants11050671 https://www.mdpi.com/journal/plants

Welcome message from author
This document is posted to help you gain knowledge. Please leave a comment to let me know what you think about it! Share it to your friends and learn new things together.
Transcript
�����������������
Citation: Singh, M.; Avtar, R.; Kumar,
N.; Punia, R.; Pal, A.; Lakra, N.;
Kumari, N.; Kumar, D.; Naruka, A.;
Bishnoi, M.; et al. Genetic Analysis
for Resistance to Sclerotinia Stem Rot,
Yield and Its Component Traits in
Indian Mustard [Brassica juncea (L.)
Czern & Coss.]. Plants 2022, 11, 671.
https://doi.org/10.3390/plants
11050671
Academic Editors: Irina
N. Anisimova, Svetlana Goryunova
and Eugene Radchenko
Received: 4 January 2022
Accepted: 23 February 2022
Published: 28 February 2022
Publisher’s Note: MDPI stays neutral
with regard to jurisdictional claims in
published maps and institutional affil-
iations.
Copyright: © 2022 by the authors.
Licensee MDPI, Basel, Switzerland.
This article is an open access article
distributed under the terms and
conditions of the Creative Commons
Attribution (CC BY) license (https://
creativecommons.org/licenses/by/
4.0/).
plants
Article
Genetic Analysis for Resistance to Sclerotinia Stem Rot, Yieldand Its Component Traits in Indian Mustard [Brassica juncea (L.)Czern & Coss.]Manjeet Singh 1,* , Ram Avtar 1 , Neeraj Kumar 1, Rakesh Punia 1, Ajay Pal 2 , Nita Lakra 3 , Nisha Kumari 1 ,Dalip Kumar 1, Anu Naruka 1, Mahavir Bishnoi 1 , Rajbir Singh Khedwal 1 , Raju Ram Choudhary 1,Anoop Singh 4 , Ravindra Kumar Meena 1 , Ankit Dhillon 1 and Vivek K. Singh 1,*
1 Department of Genetics and Plant Breeding, CCS Haryana Agricultural University, Hisar 125004, India;[email protected] (R.A.); [email protected] (N.K.); [email protected] (R.P.);[email protected] (N.K.); [email protected] (D.K.); [email protected] (A.N.);[email protected] (M.B.); [email protected] (R.S.K.);[email protected] (R.R.C.); [email protected] (R.K.M.); [email protected] (A.D.)
2 Department of Biochemistry, CCS Haryana Agricultural University, Hisar 125004, India; [email protected] Department of Molecular Biology, Biotechnology and Bioinformatics, CCS Haryana Agricultural University,
Hisar 125004, India; [email protected] Department of Botany, Maharshi Dayanand University, Rohtak 124001, India; [email protected]* Correspondence: [email protected] (M.S.); [email protected] (V.K.S.); Tel.: +91-9053127937 (M.S.);
+91-9451895240 (V.K.S.)
Abstract: Understanding the mode of gene action that controls seed yield and Sclerotinia stem rotresistance in Indian mustard is critical for boosting yield potential. In a line × tester mating design,ten susceptible lines and four resistant testers were used to conduct genetic analysis. The significanceof general combining ability (GCA) and specific combining ability (SCA) variances revealed thatboth additive and non-additive gene actions were involved in the inheritance of Sclerotinia stemrot resistance and yield attributing traits. In addition to 1000-seed weight and number of primaryand secondary branches/plant, the genotypes RH 1569 (line) and DRMR 2035 (tester) appeared tobe the strongest general combiners for Sclerotinia stem rot resistance. RH 1657 × EC 597317 wasthe only cross among several that demonstrated a significant desired SCA value for Sclerotinia rotresistance. Regarding SCA effects for yield and component traits, the cross RH 1658 × EC 597328performed best, with a non-significant but acceptable negative SCA effect for resistance. DRMR 2035,RH 1222-28, RH 1569, RH 1599-41, RH 1657, RH 1658, and EC 597328 are promising genotypes touse as parents in future heterosis breeding and for obtaining populations with high yield potentialand greater resistance to Sclerotinia stem rot disease in Indian mustard, based on GCA effects ofparents, per se performance, and SCA effects of hybrids. Days to 50% flowering, number of primarybranches/plant, main shoot length, and 1000-seed weight all had a high genotypic coefficient ofvariability (GCV), broad-sense heritability (h2bs), and genetic advance as percent of the mean (GAM)values, as well as significant and desirable correlations and direct effects on seed yield. As a result,these traits have been recognized as the most critical selection criterion for Indian mustard breedingprograms.
Keywords: Sclerotinia stem rot; gene action; combining ability; heterosis breeding; selection criteria
1. Introduction
India is the world’s 4th largest grower and producer of oil-producing crops, accountingfor ~19% of worldwide acreage and 2.7% of production. Oilseed crops, just after cereals,play an important role in the Indian agricultural economy. India is on track to become theworld’s third-largest consumer market and an importer of edible oils, meeting over 60%of its domestic consumption through imports at the cost of USD 10 billion per year [1–3].
Plants 2022, 11, 671. https://doi.org/10.3390/plants11050671 https://www.mdpi.com/journal/plants
Plants 2022, 11, 671 2 of 23
Domestic demand for edible oils and fats has been proliferating at 6% per year, but domesticoutput has only increased by 2% per year. The country’s significant scarcity of edible oilshas been attributed to several issues, including the country’s ever-growing population,sudden climate change, rising household income, low productivity of oilseed crops, and acomplicated disease–pest syndrome. Poor production performance of oilseed crops is themost important reason for India’s demand–supply mismatch in vegetable oils. Rapeseed–mustard is the third most extensively produced oilseed crop in India, accounting for ~32%of the country’s total oil pool [4].
Indian mustard [Brassica juncea (L.) Czern & Coss.] is the most widely cultivatedoilseed crop in India, out of six economically important species of the rapeseed–mustardgroup, due to its greater sustainability to grow under diverse agro-climatic conditions [5–7].Natural amphiploid (2n = 4x = 36, AABB) India mustard is developed by natural crossing andgenome doubling between two diploid progenitors, Brassica campestris (2n = 2x = 20, AA)and Brassica nigra (2n = 2x = 16, BB) [8]. To meet the escalating demand for vegetable oils forIndia’s ever-increasing population, the productivity of Indian mustard must be increased.Even though this crop has achieved significant progress in terms of yield enhancement [4],current production is insufficient to meet the country’s demand. The requisite productivitygoals can be met by producing high-yielding hybrids, which is possible in this crop dueto abundant heterosis for seed yield and its components and a stable cytoplasmic malesterility/fertility restoration system [9–17]. Pure line-breeding procedures are also thoughtto reach the equilibrium point in yield enhancement since they do not produce enoughgenetic variability. In Indian mustard, hybrids, on the other hand, allow for a greaterfraction of genetic variability and a more accessible high heterotic impact [18]. Accordingto Sodhi et al. [19], heterosis breeding could be a viable option to pure line breeding forincreasing Indian mustard yield potential, as it provides a yield advantage of 19–40% overthe best pure line types. As a result, hybrids are one of the most viable alternatives forbreaking the yield barriers in Indian mustard.
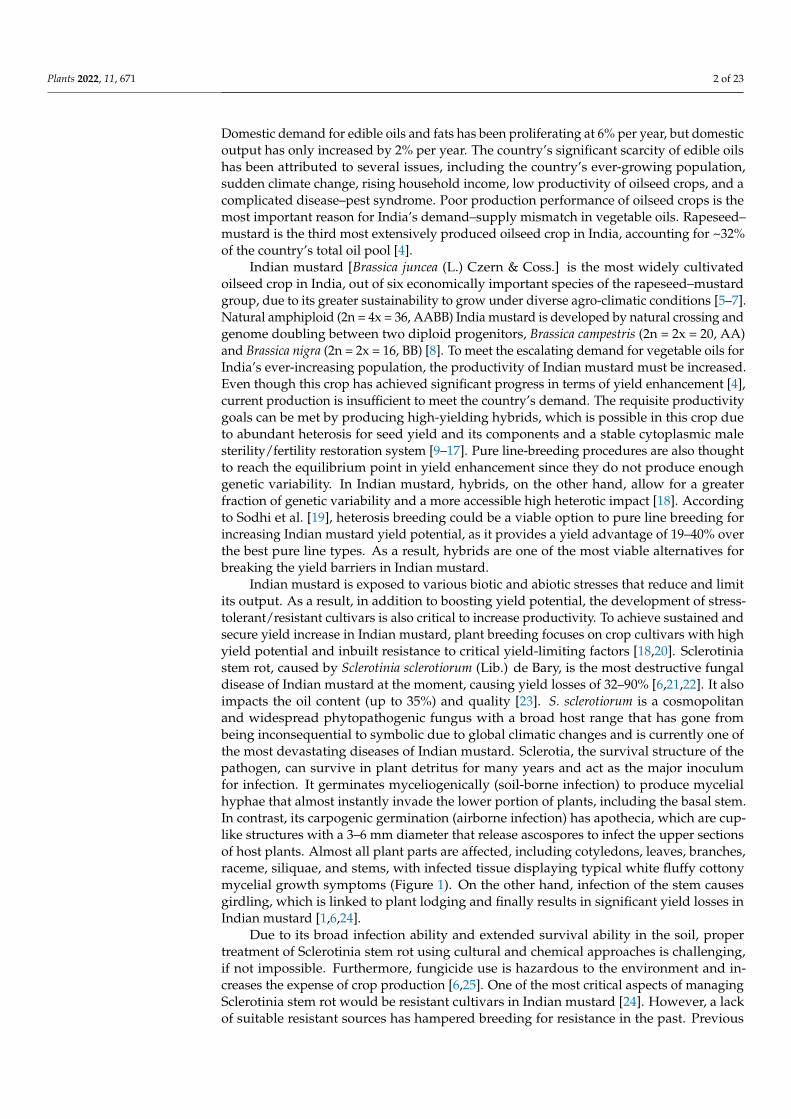
Indian mustard is exposed to various biotic and abiotic stresses that reduce and limitits output. As a result, in addition to boosting yield potential, the development of stress-tolerant/resistant cultivars is also critical to increase productivity. To achieve sustained andsecure yield increase in Indian mustard, plant breeding focuses on crop cultivars with highyield potential and inbuilt resistance to critical yield-limiting factors [18,20]. Sclerotiniastem rot, caused by Sclerotinia sclerotiorum (Lib.) de Bary, is the most destructive fungaldisease of Indian mustard at the moment, causing yield losses of 32–90% [6,21,22]. It alsoimpacts the oil content (up to 35%) and quality [23]. S. sclerotiorum is a cosmopolitanand widespread phytopathogenic fungus with a broad host range that has gone frombeing inconsequential to symbolic due to global climatic changes and is currently one ofthe most devastating diseases of Indian mustard. Sclerotia, the survival structure of thepathogen, can survive in plant detritus for many years and act as the major inoculumfor infection. It germinates myceliogenically (soil-borne infection) to produce mycelialhyphae that almost instantly invade the lower portion of plants, including the basal stem.In contrast, its carpogenic germination (airborne infection) has apothecia, which are cup-like structures with a 3–6 mm diameter that release ascospores to infect the upper sectionsof host plants. Almost all plant parts are affected, including cotyledons, leaves, branches,raceme, siliquae, and stems, with infected tissue displaying typical white fluffy cottonymycelial growth symptoms (Figure 1). On the other hand, infection of the stem causesgirdling, which is linked to plant lodging and finally results in significant yield losses inIndian mustard [1,6,24].
Due to its broad infection ability and extended survival ability in the soil, propertreatment of Sclerotinia stem rot using cultural and chemical approaches is challenging,if not impossible. Furthermore, fungicide use is hazardous to the environment and in-creases the expense of crop production [6,25]. One of the most critical aspects of managingSclerotinia stem rot would be resistant cultivars in Indian mustard [24]. However, a lackof suitable resistant sources has hampered breeding for resistance in the past. Previous
Plants 2022, 11, 671 3 of 23
attempts to uncover resistant sources against Sclerotinia stem rot failed miserably becauseall Indian mustard genotypes tested were sensitive/highly susceptible, and whatever resis-tant sources were declared were connected to wild and other Brassicaceae species [22–34].However, in recent years, increased attention has led to identifying a few Indian mustardgenotypes resistant to the disease [1,6,33–35].
Plants 2022, 11, x FOR PEER REVIEW 3 of 25
Due to its broad infection ability and extended survival ability in the soil, proper treatment of Sclerotinia stem rot using cultural and chemical approaches is challenging, if not impossible. Furthermore, fungicide use is hazardous to the environment and increases the expense of crop production [6,25]. One of the most critical aspects of managing Scle-rotinia stem rot would be resistant cultivars in Indian mustard [24]. However, a lack of suitable resistant sources has hampered breeding for resistance in the past. Previous at-tempts to uncover resistant sources against Sclerotinia stem rot failed miserably because all Indian mustard genotypes tested were sensitive/highly susceptible, and whatever re-sistant sources were declared were connected to wild and other Brassicaceae species [22–34]. However, in recent years, increased attention has led to identifying a few Indian mus-tard genotypes resistant to the disease [1,6,33–35].
Figure 1. Sclerotinia sclerotiorum life cycle and complex mode of infection in Indian mustard. (A) Sclerotia in the Indian mustard plant debris. (B) Myceliogenic germination of sclerotia resulting in actively growing mycelia on dead leaves. (C) Initiation of myceliogenic infection on basal stem with characteristic symptoms: water-soaked lesions with fluffy, white mycelium. (D) Highly infected stem with bleached and necrotic tissues that finally expand blotches of fluffy white mycelium, usu-ally with black colored sclerotia. (E) Carpogenic germination of sclerotia leads to the formation of apothecia. (F) Apothecia release ascospores embedded on senescing petals and get stuck on healthy siliqua. (G) Infected siliquae with characteristic symptom of fluffy mycelial growth. (H) Spread of
Figure 1. Sclerotinia sclerotiorum life cycle and complex mode of infection in Indian mustard.(A) Sclerotia in the Indian mustard plant debris. (B) Myceliogenic germination of sclerotia resulting inactively growing mycelia on dead leaves. (C) Initiation of myceliogenic infection on basal stem withcharacteristic symptoms: water-soaked lesions with fluffy, white mycelium. (D) Highly infected stemwith bleached and necrotic tissues that finally expand blotches of fluffy white mycelium, usually withblack colored sclerotia. (E) Carpogenic germination of sclerotia leads to the formation of apothecia.(F) Apothecia release ascospores embedded on senescing petals and get stuck on healthy siliqua.(G) Infected siliquae with characteristic symptom of fluffy mycelial growth. (H) Spread of disease byplant-to-plant contact and infected siliquae spread inoculum on mustard raceme. (I) Infection spreadfurther on plant raceme, (J) infected petal fall on leaf to initiate infection, infection spread further tocause (K) complete destruction of leaf and (L) stalk of mustard.
Plants 2022, 11, 671 4 of 23
Because Sclerotinia stem rot is one of the most critical constraints to Indian mustardproduction, cultivars with built-in resistance to this disease will be given even moreimportance to boost and sustain productivity and make this crop more profitable. Next toyield enhancement, breeding for disease resistance is essential in attaining optimal progressin edible oil production to satisfy future demands [18,20]. The success of any plant breedingprogram aimed at incorporating desirable traits, on the other hand, is entirely dependent onthe availability of source material and understanding of genetic regulation of the trait(s) inquestion. As a result, crop breeders are constantly vigilant in determining desirable genetictraits to determine the most practical approach for breeding novel and elite cultivars [36].Combining ability analysis frequently aids in selecting the best genotypic combinations forthe development of superior hybrids [37].
Furthermore, plant breeders have a key difficulty in identifying the ideal parentalcombination to exploit heterosis in the F1 generation and produce superior transgressivesegregants in the F2 and subsequent segregating generations in any hybridization program.A high per se performance genotype may not inevitably create better hybrids and/ortransgressive segregants when employed in hybridization. Combining ability is a crucialnotion that aids in selecting promising parents for hybridization and sheds light on thenature of gene actions that influence superior traits. Line × tester analysis is the most oftenused of the various mating designs available for combining ability and heterotic effectestimation with knowledge on the genetic control of metric traits in crop plants [38].
Furthermore, environmental or genotype × environmental interaction may causevariation across genotypes for several traits [39,40]. As a result, genotypes should bechosen based on their genetic rather than phenotypic characteristics [41]. Trait selectionnecessitates a thorough understanding of the nature and extent of genotypic variation andtransmissibility and selection progress. The following selection indicators are commonlyused to predict genetic gain under selection: genotypic coefficient of variation(GCV),phenotypic coefficient of variation (PCV), broad-sense heritability (h2bs), and geneticadvance as percent of mean (GAM) [42,43]. Furthermore, knowledge of the interrelationshipbetween resistance and yield and its components is critical for determining appropriateselection criteria for breeding Indian mustard for high yield potential and Sclerotiniastem rot resistance. As a result, correlation and path analysis is essential for designingan effective selection strategy and increasing the efficiency of breeding programs [44,45].Plant breeders can use selection indices to fully utilize the response to selection for one ormore characteristics. In reality, indices-based selection exhibits the response with directselection and the correlated response because the selection is competent for other characters.Families from the base population should be assessed to derive genetic and phenotypicestimates such as h2bs, GAM, genetic correlation, and path coefficients for examining thecollection of traits [46].
In this context, the current study was carried out to gather information about the natureand extent of gene action, combining ability effects and estimation of selection indices forSclerotinia stem rot resistance, seed yield, and its component traits in Indian mustard.
2. Materials and Methods2.1. Experimental Plant Materials and Crop Cultivation
The plant materials for this study consisted of 14 different genotypes of Indian mus-tard chosen for their different responses to Sclerotinia stem rot, seed yield, and its com-ponent traits (Table 1). The parental genotypes chosen as lines (females) are advancedlines with high yield potential developed at CCS HAU, Hisar, and have a narrow ge-netic base. In contrast, the parents chosen as testers (males) were obtained from vari-ous locations (DRMR Bharatpur and exotic collections from China and Australia) andhave a broad genetic base. During the 2018–2019 Rabi season, 10 lines (susceptible geno-types) and 4 testers (resistant genotypes) were used in a Line × Tester mating design.As a result, the experimental materials included 40 F1 hybrids, 14 parents (10 Lines and4 Testers), and two standard checks (RH 0749 and RH 725). During the Rabi season of
Plants 2022, 11, 671 5 of 23
2019–2020, these plant materials were tested in a Randomized Complete Block Design(RCBD) with three replications at the Research Farm of Oilseeds Section, Department ofGenetics and Plant Breeding, CCS HAU, Hisar. The plots were paired rows of 4 m lengthwith a 30 × 10 cm separation (row × plant). Except for any fungicidal treatment to reduceSclerotinia stem rot, the entire recommended package and practices were followed to es-tablish a healthy crop.The best environmental conditions for Sclerotinia stem rot epidemicdevelopment in Indian mustard include high relative humidity (>80%), a temperature rangeof 5 to 25 ◦C, and wet soil [1]. According to the weather data in Supplementary Table S1,the crop’s field conditions were favorable for disease growth.
Table 1. List of parental lines used in the present investigation along with their pedigree, source/origin,and their response towards Sclerotinia stem rot.
Parents(Lines/Testers) Genotype Code Pedigree Sources/Origin Response to Sclerotinia
Stem Rot Reference
Lines
RH 1566 RH 0734/RH 0202 CCS HAU, Hisar/India Susceptible [6,35]RH 1569 RH 0735/RH 0119 CCS HAU, Hisar/India Highly susceptible [6,35]
RH 1599-41 RH 0802/JM 18 CCS HAU, Hisar/India Highly susceptible [35]RH 1599-44 RH 0803/RH (00) 7003 CCS HAU, Hisar/India Highly susceptible [35]
RH 1633 RB 50/RH 0555 CCS HAU, Hisar/India Highly susceptible [6,35]RH 1657 RH 0803/RH 0745 CCS HAU, Hisar/India Susceptible [35]RH 1658 RH 0804/RH 0745 CCS HAU, Hisar/India Susceptible [35]RH 1664 RH 0835/JM 18 CCS HAU, Hisar/India Highly susceptible [35]
RH 1899-53 RH 1008/NPJ 153 CCS HAU, Hisar/India Susceptible [35]PM 26 VEJ Open/Pusa Agrani IARI, New Delhi/India Susceptible [35]
Testers
RH 1222-28 RH 0406/RH 0401-B CCS HAU, Hisar/India Resistant [6,33–35]DRMR 2035 PHR-1/BEC-107 DRMR, Bharatpur/India Highly resistant [6,33,35]EC 597328 Exotic Exotic Collection/Chinese Resistant [6,33,35]EC 597317 Exotic Exotic Collection/Australia Moderately resistant [33,35]
2.2. Field Evaluation and Data Collection for Seed Yield and Its Component Traits
The seed yield and its component traits were recorded as follow: days to 50% flowering(number of days from sowing to when 50% of the plants had flowered) and days to maturity(number of days from sowing to when 80% of the plants had reached physiological maturity)both recorded on plot basis, while other phenotypic traits were recorded from ten randomlyselected un-inoculated/healthy plants from the center of each row as follows: plant height(measured in cm from the base of the plant to tip of the main raceme), number of primarybranches/plant (assessed branches derived from the base of the main stem), number ofsecondary branches/plant (assessed branches emerged from the primary branches), mainshoot length (measured in cm from base of most top primary branch to the tip of theplant), number of siliquae on main shoot (siliquae borne on main raceme), siliqua length(measured in cm from the 9 individual siliqua/plant, three each from bottom-, middle-,and top-borne branches), number of seeds/siliqua (counted from the same siliquae usedto estimate siliqua length), 1000-seed weight (grams), seed yield/plant (grams), and oilcontent (determined in % using Soxhlet apparatus method).
2.3. Sclerotinia Sclerotiorum Inoculum Preparation, Artificial Disease Inoculation, andResistance Assessment
For the pure culture preparation, S. sclerotiorum sclerotia (Hisar isolate) were employed.These sclerotia were first precisely washed in double distilled water, then surface sterilizedby soaking for 10–12 s in 0.1% sodium hypochlorite solution. Sclerotia were then gentlyrinsed 3–4 times with distilled water to remove any remaining germicide before beingdehydrated on aseptic blotter paper. Finally, these sclerotia were cut in half using surgicalblades and aseptically transferred to Petri-plates containing Potato Dextrose Agar (PDA).These plates were kept in a BOD incubator at 22 ± 1 ◦C for five days. Using the techniquesprovided by Li et al. [26] and Singh et al. [1] a five-day-old pure culture of S. sclerotiorumwas used to inoculate the main stems of 10 randomly chosen and labeled plants (other
Plants 2022, 11, 671 6 of 23
than the 10 representative plants selected for the assessment of yield and its componenttraits)from each genotype/replication. Mycelial discs (5 mm2) were cut from the bordersof pure culture plates, placed on a paraffin wax strip (together with a moist cotton swab)and wrapped tightly around the main stem, as in our prior investigations [1,6]. Lesionlength (cm) was measured on each infected plant using a linear ruler at 20 days afterinoculation for each genotype/replicate, and the average was taken. According to thescale proposed by Garg et al. [47], genotypes were classified as highly resistant [meanlesion length (MLL) ≤ 2.5 cm], resistant (2.6–5.0 cm), moderately resistant (5.1–7.5 cm),susceptible (7.6–10.0 cm), and highly susceptible (>10.0 cm) based on MLL.
Based on the lesion length (cm) recorded from each plant, the following parameterswere computed to determine genotypic response to Sclerotinia stem rot.
2.3.1. Mean Lesion Length (cm)
Mean lesion length (cm) was calculated by averaging the lesion length (cm) measuredfrom the inoculated main stems among all the tested plants by using the following formula:
Mean lesion length (cm) =∑n
i=1 Lesion length (cm)
Total number o f plants tested(n)
2.3.2. Disease Severity Index (DSI)
Disease severity index was computed by the following equation described by Ooi [48]:
DSI = ∑(No. o f plants in speci f ic scale × disease scale)Total no. o f plants tested
DSI = ∑(n × 0) + (n × 1) + (n × 2) + (n × 3) + (n × 4)Total no. o f plants (n)
2.4. Statistical Analysis
The line × tester analysis procedure was utilized to estimate general and specificcombining ability effects and variances, as outlined by Kempthorne [49] and elaboratedby Singh and Chaudhary [50]. The genotypic coefficient of variability (GCV), phenotypiccoefficient of variability (PCV), broad-sense heritability (h2bs), genetic advance (GA),and genetic advance as percent of the mean (GAM) were calculated according to Singhand Chaudhary [50]. Genotypic and phenotypic correlations between Sclerotinia stem rotresistance assessment parameters and seed yield and its component traits were evaluatedas per Johnson et al. [51]. Seed yield/plant was used as a response variable, while itscomponent traits were used as a causative variable, and path coefficients were calculatedusing genotypic correlation coefficients [52]. The statistical analysis was performed usingthe computer program Windowstat 8.0 (INDOSTAT Services Ltd., Hyderabad, India).
3. Results3.1. Analysis of Variance for Line × Tester Analysis
Total variance from the combined ANOVA of Line × Tester was divided into variancesowing to parents, lines (females), testers (males), females vs. males (lines vs. testers), crosses,parents vs. crosses, and GCA (general combining ability) and SCA (special combiningability) effects (Table 2). Parents, crosses (except days to maturity), and parents vs. crosses(except days to maturity, plant height, number of secondary branches per plant, and MLL)all exhibited significant variation in all of the traits evaluated in this study. There was alsoa significant difference in terms of variance owing to all source components of ANOVA fortraits such as days to 50% flowering, main shoot length, number of seeds/siliqua, oil content,MLL, and DSI. Except for variation owing to testers and line vs.testers, the charactersnumber of primary branches/plant, number of siliquae on main shoot, siliqua length,and 1000-seed weight showed significant variation for all components of the source ofvariation. Table 2 shows that the mean squares attributable to GCA effects (lines) for the
Plants 2022, 11, 671 7 of 23
characters days to 50% flowering, days to maturity, plant height, siliqua length, 1000-seedweight, mean lesion length, and disease severity index was very significant. The number ofsiliquae on the main shoot, 1000-seed weight, MLL, and DSI were all determined to havesignificant mean squares attributable to GCA effects (testers). Except for days to maturityand plant height, mean squares owing to SCA effects were highly significant (p ≤ 0.01).
Table 2. ANOVA of Line × Tester analysis for seed yield and its component traits and Sclerotiniastem rot resistance in Indian mustard.
Traits
Mean Squares
Genotypes Parents (P) Lines (L) Testers (T) L vs. T Crosses (C) P vs. C LineEffects
TesterEffects
L × TEffects
DF 68.91 ** 88.35 ** 72.53 ** 13.00 * 456.77 ** 53.21 ** 428.38 ** 182.51 ** 19.48 13.86 **DM 56.39 ** 99.42 ** 115.94 ** 50.31 98.12 43.49 0.01 95.82 ** 49.83 25.34PH 525.29 ** 1464.21 ** 1549.49 ** 237.79 4376.01 ** 224.34 ** 56.58 597.66 ** 224.57 99.87
NPB 2.12 ** 2.00 ** 2.18 ** 0.64 4.47 ** 2.10 ** 4.66 ** 2.93 2.49 1.78 **NSB 17.89 ** 17.06 ** 21.68 ** 8.25 * 1.86 18.49 ** 5.39 18.02 39.4 16.32 **MSL 141.49 ** 123.44 ** 148.93 ** 61.23 * 80.64 * 120.38 ** 1199.74 ** 71.46 333.89 112.96 **
NSMS 84.29 ** 43.03 ** 47.63 ** 19.95 70.79 * 98.18 ** 78.82 * 101.31 403.79 ** 63.19 **SL 0.49 ** 0.50 ** 0.58 ** 0.40 ** 0.02 0.33 ** 6.77 ** 0.70 ** 0.21 0.21 **
NSPS 4.17 ** 3.33 ** 2.89 ** 3.27 ** 7.49 ** 2.76 ** 70.47 ** 3.13 1.02 2.82 **TSW 1.36 ** 1.98 ** 2.29 ** 1.69 ** 0.01 1.16 ** 0.89 ** 2.70 ** 3.95 ** 0.34 **SYP 41.52 ** 26.03 * 20.85 26.17 72.33 * 28.90 ** 735.29 ** 44.88 5.58 26.16OC 1.03 ** 1.52 ** 1.62 ** 1.62 ** 0.25 ** 0.89 ** 0.35 ** 1.39 0.76 0.74 **
MLL 18.94 ** 38.11 ** 17.23 ** 7.97 * 316.47 ** 12.83 ** 8.15 35.12 ** 19.91 * 4.61 **DSI 1.52 ** 3.12 ** 0.85 ** 0.91 ** 30.13 ** 0.99 ** 1.21 * 2.52 ** 1.57 * 0.42 **
** Significant at p ≤ 0.01; * Significant at p ≤ 0.05; DF-Days to Flowering (50%); DF-Days to flowering, DM—Daysto maturity, PH—Plant height (cm), NPB—Number of primary branches/plant, NSB—Number of secondarybranches/plant, MSL—Main shoot length (cm), NSMS—Number of siliquae on main shoot, SL—Siliqua length(cm), NSS—Number of seeds/siliqua, TSW—1000 seed weight (g), SYP—Seed yield/plant (g), OC—Oil content(%), MLL—Mean lesion length (cm), DSI—Disease severity index.
3.2. Mean Performance of Parents and F1 Hybrids
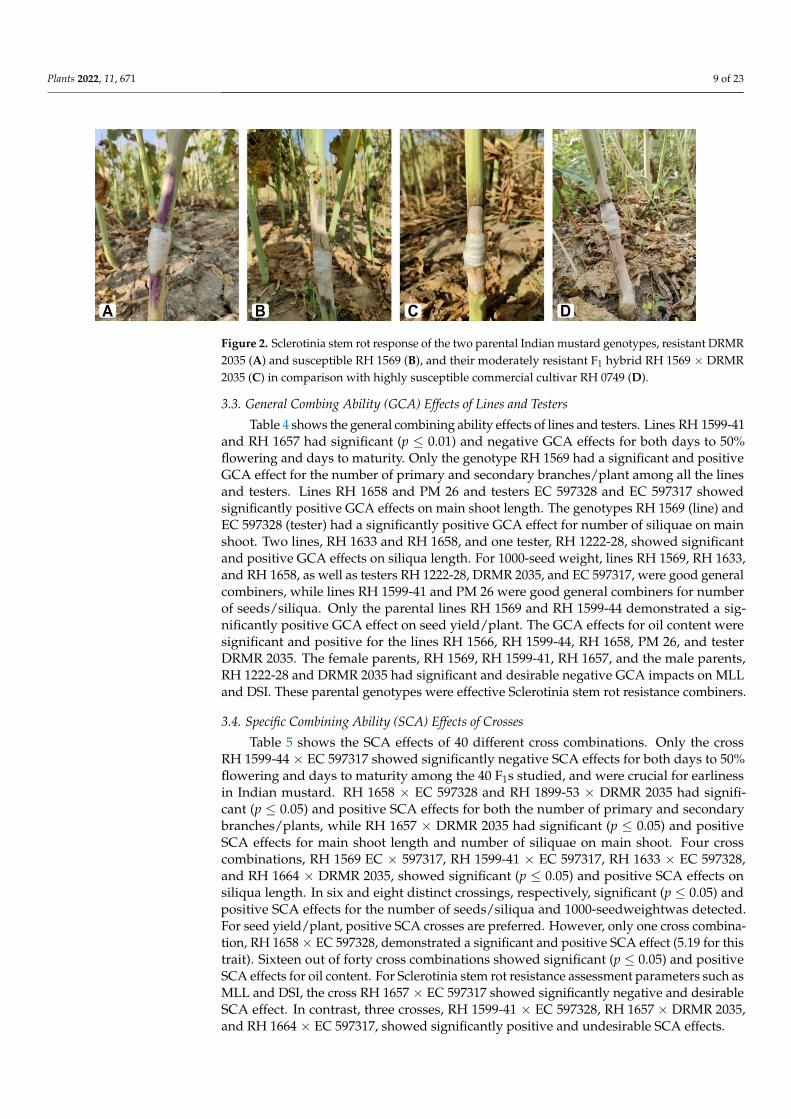
Table 3 shows the mean performance of the parent genotypes, F1 hybrids, and two stan-dard checks (commercial cultivars) in Sclerotinia stem rot resistance, seed yield, and itsattributes. For the majority of the traits tested, all genotypes exhibited significant vari-ation. Days to 50% flowering ranged from 35.0 to 53.0 days, with a mean of 42.7 days,whereas days to maturity have minimum, maximum, and mean values of 137.0, 157.0,and 150.0 days, respectively. The average plant height was 205.5 cm, with a range of149.5 to 232.0 cm. Number of secondary branches/plant, main shoot length, number ofsiliquae on the main shoot, siliqua length, number of seeds/siliqua, and 1000-seed weight,among other yield parameters, showed wide variation that may be exploited in a varietaldevelopment program. Seed yield varied significantly between genotypes, ranging from15.6 to 31.4 g/plant. The F1 hybrids viz., RH 1599-44 × DRMR 2035, RH 1599-44 × EC597317, RH 1658 × EC 597328, and RH 1664 RH × 1222-28 exhibited increased yield poten-tial due to superior performance for traits such as the number of primary and secondarybranches/plants, main shoot length, and number of seeds/siliqua. Aside from that, these F1hybrids had relatively high oil content. The MLL and DSI for Sclerotinia stem rot resistanceranged from 2.28 to 13.96 cm and 0.50 to 3.83, respectively. The parental genotype DRMR2035 displayed a highly resistant response (MLL < 2.5 cm), whereas RH 1222-28 and EC597328 exhibited a resistant response (MLL > 2.6 but <5.0 cm). However, most of thegenotypes with high resistance were low yielders. Although, it is notable that the F1 hybridRH 1569 × DRMR 2035 not only outperformed the best-released cultivar (RH 725) in termsof seed and oil yield (SYP = 29.00 g/plant; OC = 40.03%) but was also reasonably resistantto Sclerotinia stem rot (Figure 2). This combination can improve Sclerotinia stem resistanceand seed and oil yield.
Plants 2022, 11, 671 8 of 23
Table 3. Mean performance of parents and their F1 hybrids for Sclerotinia stem rot resistanceassessment parameters as well as seed yield and its component traits.
Genotypes DF DM PH NPB NSB MSL NSMS SL NSS TSW SYP OC MLL DSI
RH 1566 52.00 156.67 225.00 7.00 19.00 73.17 56.77 3.65 13.24 4.98 24.30 38.73 8.94 2.93RH 1569 48.00 150.67 216.34 7.67 18.50 68.50 56.83 4.50 14.90 5.94 24.85 39.50 9.88 3.23
RH 1599-41 39.00 141.33 183.72 5.83 20.50 89.34 52.84 3.87 15.37 4.31 20.30 39.83 12.14 3.63RH 1599-44 46.00 153.67 221.17 5.99 17.34 76.67 54.84 3.73 14.07 4.77 21.15 39.80 12.85 3.57
RH 1633 41.00 149.00 202.01 6.84 20.34 89.00 56.17 4.10 16.37 6.11 25.35 38.63 13.58 3.67RH 1657 43.00 149.00 202.50 7.01 20.67 74.84 56.67 3.47 14.40 4.66 21.20 40.23 7.61 2.40RH 1658 38.00 151.67 178.67 5.84 20.00 79.33 48.84 4.00 14.77 6.47 23.95 38.53 7.63 2.47RH 1664 43.00 144.67 192.67 5.67 15.17 71.17 44.83 4.80 15.90 5.54 18.85 38.63 12.96 3.70
RH 1899-53 46.00 155.00 204.95 7.67 24.84 73.17 51.50 3.50 13.60 4.05 24.90 40.30 7.56 2.43PM 26 36.00 137.00 149.45 5.33 16.50 79.67 52.00 3.60 14.34 4.07 18.45 38.50 10.16 3.13
RH 1222-28 51.00 157.00 222.22 7.00 17.67 78.67 54.67 4.33 15.14 6.16 21.60 38.77 3.72 1.20DRMR 2035 50.00 150.33 232.00 7.50 21.67 76.84 59.67 3.47 12.60 4.81 15.60 38.70 2.28 0.50EC 597328 48.00 154.00 212.58 6.66 19.50 73.83 53.83 3.97 13.60 4.42 18.60 38.73 4.97 1.47EC 597317 53.00 147.67 214.17 7.67 20.17 68.34 55.84 4.10 13.70 4.96 21.90 40.20 6.06 1.80
RH 1566 × RH 1222-28 46.00 155.00 217.84 7.67 19.50 77.33 58.00 4.37 15.97 5.67 27.80 38.67 8.38 2.73RH 1566 × DRMR 2035 45.00 155.33 210.84 7.17 20.00 77.50 56.00 4.14 15.83 5.41 27.30 40.07 8.15 2.63RH 1566 × EC 597328 47.00 146.00 211.34 7.36 20.66 73.73 54.40 3.90 13.55 4.16 22.70 39.83 9.63 3.03RH 1566 × EC 597317 50.00 157.00 209.00 5.17 15.19 84.00 57.17 3.87 14.60 5.43 25.70 39.93 7.70 2.47
RH 1569 × RH 1222-28 45.00 151.00 204.84 8.34 24.67 88.50 60.00 4.43 16.04 5.73 29.55 38.73 6.49 1.97RH 1569 × DRMR 2035 43.00 151.67 218.67 7.83 21.34 80.67 58.34 4.37 16.37 5.48 29.00 40.03 5.67 1.57RH 1569 × EC 597328 45.00 148.33 215.00 7.17 21.50 89.50 69.50 3.90 16.04 4.86 30.15 38.77 6.41 2.03RH 1569 × EC 597317 51.00 151.67 213.83 8.82 22.00 78.17 56.50 5.33 14.94 5.84 26.35 38.83 8.52 2.80
RH 1599-41 × RH 1222-28 36.00 145.33 192.84 6.67 18.17 83.17 54.84 4.00 16.40 5.35 26.70 38.80 5.54 1.70RH 1599-41 × DRMR 2035 36.00 142.00 203.67 6.17 16.50 79.17 56.17 3.93 15.77 4.60 24.10 38.83 6.16 1.77RH 1599-41 × EC 597328 40.00 144.33 211.67 7.17 20.50 88.67 57.17 4.07 16.80 4.41 24.50 38.70 9.87 3.03RH 1599-41 × EC 597317 36.00 149.00 207.67 6.19 18.34 86.49 50.00 4.47 18.03 4.98 24.50 38.80 6.19 1.77
RH 1599-44 × RH 1222-28 42.00 155.67 211.17 8.00 22.17 84.67 61.00 4.20 16.87 4.77 28.55 39.80 9.44 2.83RH 1599-44 × DRMR 2035 41.00 152.00 199.98 7.50 20.50 76.17 50.67 3.83 17.23 5.16 30.51 40.23 8.89 2.73RH 1599-44 × EC 597328 43.00 151.33 213.50 6.67 18.33 89.67 60.50 4.27 14.73 4.31 30.10 39.93 9.31 3.07RH 1599-44 × EC 597317 40.00 145.00 202.00 7.50 18.67 75.84 47.83 4.30 16.17 5.49 30.60 38.73 10.23 3.20RH 1633 × RH 1222-28 49.00 153.67 211.67 6.50 17.84 76.50 48.33 4.74 15.17 6.92 26.60 38.83 12.21 3.50RH 1633 × DRMR 2035 45.00 155.33 210.33 7.67 19.50 76.17 54.17 4.57 16.47 6.31 26.40 38.87 9.93 3.10RH 1633 × EC 597328 45.00 150.33 198.67 6.17 17.34 96.17 60.50 4.90 16.84 5.21 25.05 38.77 13.96 3.57RH 1633 × EC 597317 46.00 154.00 209.50 7.50 18.17 85.34 59.17 4.83 13.70 6.72 27.20 38.70 12.82 3.47
RH 1657 × RH 1222-28 40.00 149.33 206.71 8.17 22.00 77.83 41.84 4.50 15.57 5.20 21.90 39.87 7.60 2.47RH 1657 × DRMR 2035 40.00 149.00 194.34 7.67 19.84 85.00 54.00 4.47 15.60 4.98 25.80 38.80 9.24 2.90RH 1657 × EC 597328 40.00 143.33 209.67 6.84 23.50 90.33 63.00 4.30 14.50 4.47 22.60 38.97 7.68 2.43RH 1657 × EC 597317 38.00 146.00 211.50 5.83 15.67 72.67 42.17 4.50 16.47 4.66 21.30 38.70 6.37 1.87
RH 1658 × RH 1222-28 36.00 146.00 193.34 7.17 18.50 98.00 55.67 4.83 15.80 6.18 29.80 38.83 9.29 3.03RH 1658 × DRMR 2035 35.00 147.33 187.17 6.34 17.17 77.00 46.50 4.87 16.50 5.71 20.10 38.87 11.23 3.27RH 1658 × EC 597328 37.00 150.33 195.83 8.17 23.50 89.84 58.17 4.83 16.27 5.42 31.40 39.90 10.21 2.97RH 1658 × EC 597317 38.00 146.00 201.50 6.50 20.84 78.67 50.84 4.40 15.57 6.01 23.00 39.33 11.08 3.50
RH 1664 × RH 1222-28 40.00 152.00 204.83 8.34 23.00 87.17 60.67 4.77 16.24 5.78 30.80 38.77 8.41 2.70RH 1664 × DRMR 2035 39.00 150.33 194.67 7.34 20.67 80.67 51.00 4.73 16.20 5.22 24.70 38.73 8.99 2.57RH 1664 × EC 597328 38.00 148.33 203.33 8.00 21.00 78.33 63.67 4.27 16.83 4.86 26.30 38.67 11.44 3.57RH 1664 × EC 597317 42.00 149.00 212.17 6.84 17.34 76.50 53.50 4.20 15.67 4.28 25.70 38.90 13.37 3.83
RH 1899-53 × RH 1222-28 45.00 149.67 215.84 5.84 16.34 72.67 60.84 4.37 15.03 5.22 20.50 38.77 7.85 2.53RH 1899-53 × DRMR 2035 43.00 151.00 208.34 7.50 22.33 86.33 51.34 4.23 15.80 5.17 30.10 38.83 8.30 2.50RH 1899-53 × EC 597328 39.00 154.00 217.83 5.83 19.67 89.67 61.84 4.27 17.17 4.89 27.05 38.83 9.74 3.17RH 1899-53 × EC 597317 47.00 155.00 213.03 6.84 19.16 81.17 56.67 4.40 14.93 5.22 24.90 38.83 10.49 3.23
PM 26 × RH 1222-28 40.00 151.33 194.48 6.67 18.47 84.50 58.17 4.54 17.25 5.18 21.90 38.47 7.94 2.60PM 26 × DRMR 2035 38.00 149.33 188.17 7.50 25.50 89.17 54.67 4.57 15.57 5.25 29.80 40.07 8.36 2.53PM 26 × EC 597328 41.00 143.33 197.67 6.67 21.67 88.50 56.83 4.27 15.67 4.87 25.10 38.70 9.98 3.10PM 26 × EC 597317 36.00 149.00 193.67 5.84 16.34 81.34 50.00 4.34 17.17 4.96 28.35 39.90 11.16 3.40
RH 725 (Check) 46.00 153.67 219.17 7.17 17.00 79.83 58.67 4.75 14.73 6.26 27.85 39.97 9.34 3.43RH 0749 (Check) 46.00 156.67 215.17 6.00 16.33 79.17 51.17 4.30 15.77 6.79 26.50 38.80 11.39 3.00
S.E. (m) 1.09 3.08 6.23 0.31 0.91 2.41 2.11 0.14 0.50 0.10 2.13 0.07 0.97 0.27C.D. (p ≤ 0.05) 3.06 8.64 17.47 0.88 2.55 6.74 5.92 0.41 1.41 0.27 5.97 0.20 2.72 0.76
DF—Days to 50% flowering; DM—Days to maturity; PH—Plant height (cm); NPB—Number of primarybranches/plant; NSB—No. of secondary branches/plant; MSL—Main shoot length (cm); NSMS—No. of siliquaeon main shoot; SL—Siliqua length (cm); NSS—No. of seeds/siliqua; TSW—1000-seed weight (g); SYP—Seedyield/plant (g); OC—Oil content (%); MLL—Mean lesion length (cm); DSI—Disease severity index.
Plants 2022, 11, 671 9 of 23Plants 2022, 11, x FOR PEER REVIEW 10 of 25
Figure 2. Sclerotinia stem rot response of the two parental Indian mustard genotypes, resistant DRMR 2035 (A) and susceptible RH 1569 (B), and their moderately resistant F1 hybrid RH 1569 × DRMR 2035 (C) in comparison with highly susceptible commercial cultivar RH 0749 (D).
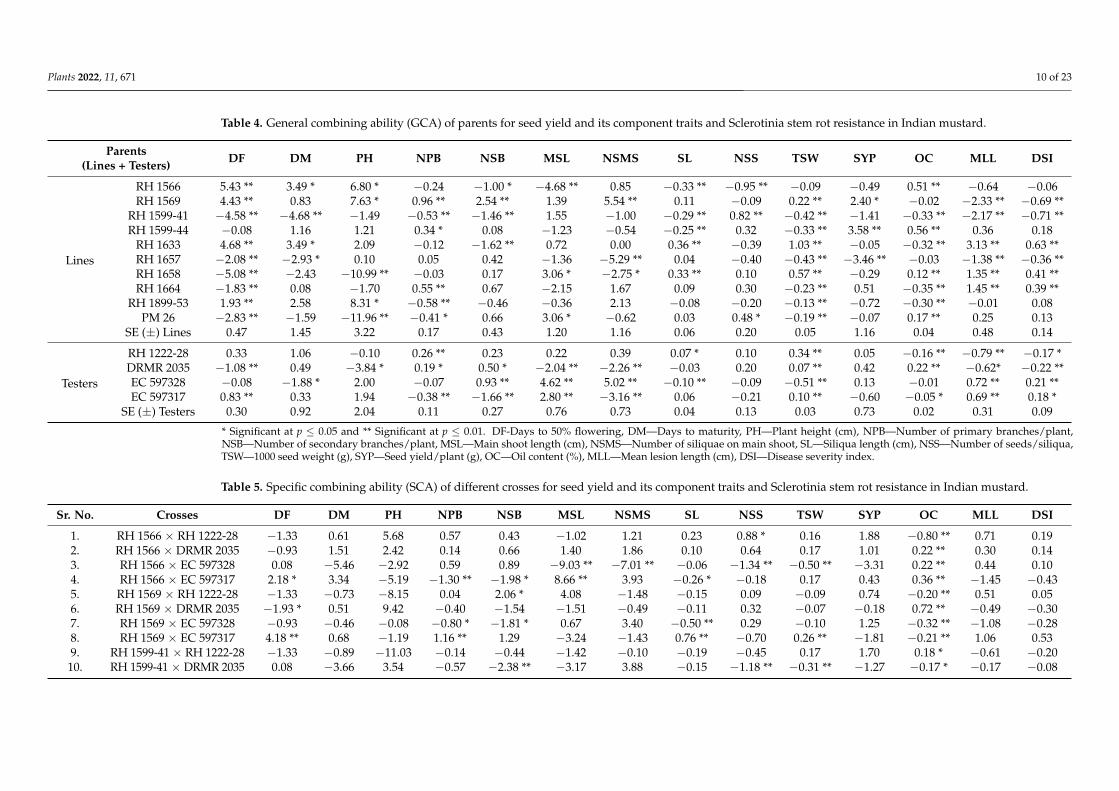
3.3. General Combing Ability (GCA) Effects of Lines and Testers Table 4 shows the general combining ability effects of lines and testers. Lines RH
1599-41 and RH 1657 had significant (p ≤ 0.01) and negative GCA effects for both days to 50% flowering and days to maturity. Only the genotype RH 1569 had a significant and positive GCA effect for the number of primary and secondary branches/plant among all the lines and testers. Lines RH 1658 and PM 26 and testers EC 597328 and EC 597317 showed significantly positive GCA effects on main shoot length. The genotypes RH 1569 (line) and EC 597328 (tester) had a significantly positive GCA effect for number of siliquae on main shoot. Two lines, RH 1633 and RH 1658, and one tester, RH 1222-28, showed significant and positive GCA effects on siliqua length. For 1000-seed weight, lines RH 1569, RH 1633, and RH 1658, as well as testers RH 1222-28, DRMR 2035, and EC 597317, were good general combiners, while lines RH 1599-41 and PM 26 were good general com-biners for number of seeds/siliqua. Only the parental lines RH 1569 and RH 1599-44 demonstrated a significantly positive GCA effect on seed yield/plant. The GCA effects for oil content were significant and positive for the lines RH 1566, RH 1599-44, RH 1658, PM 26, and tester DRMR 2035. The female parents, RH 1569, RH 1599-41, RH 1657, and the male parents, RH 1222-28 and DRMR 2035 had significant and desirable negative GCA impacts on MLL and DSI. These parental genotypes were effective Sclerotinia stem rot resistance combiners.
Figure 2. Sclerotinia stem rot response of the two parental Indian mustard genotypes, resistant DRMR2035 (A) and susceptible RH 1569 (B), and their moderately resistant F1 hybrid RH 1569 × DRMR2035 (C) in comparison with highly susceptible commercial cultivar RH 0749 (D).
3.3. General Combing Ability (GCA) Effects of Lines and Testers
Table 4 shows the general combining ability effects of lines and testers. Lines RH 1599-41and RH 1657 had significant (p ≤ 0.01) and negative GCA effects for both days to 50%flowering and days to maturity. Only the genotype RH 1569 had a significant and positiveGCA effect for the number of primary and secondary branches/plant among all the linesand testers. Lines RH 1658 and PM 26 and testers EC 597328 and EC 597317 showedsignificantly positive GCA effects on main shoot length. The genotypes RH 1569 (line) andEC 597328 (tester) had a significantly positive GCA effect for number of siliquae on mainshoot. Two lines, RH 1633 and RH 1658, and one tester, RH 1222-28, showed significantand positive GCA effects on siliqua length. For 1000-seed weight, lines RH 1569, RH 1633,and RH 1658, as well as testers RH 1222-28, DRMR 2035, and EC 597317, were good generalcombiners, while lines RH 1599-41 and PM 26 were good general combiners for numberof seeds/siliqua. Only the parental lines RH 1569 and RH 1599-44 demonstrated a sig-nificantly positive GCA effect on seed yield/plant. The GCA effects for oil content weresignificant and positive for the lines RH 1566, RH 1599-44, RH 1658, PM 26, and testerDRMR 2035. The female parents, RH 1569, RH 1599-41, RH 1657, and the male parents,RH 1222-28 and DRMR 2035 had significant and desirable negative GCA impacts on MLLand DSI. These parental genotypes were effective Sclerotinia stem rot resistance combiners.
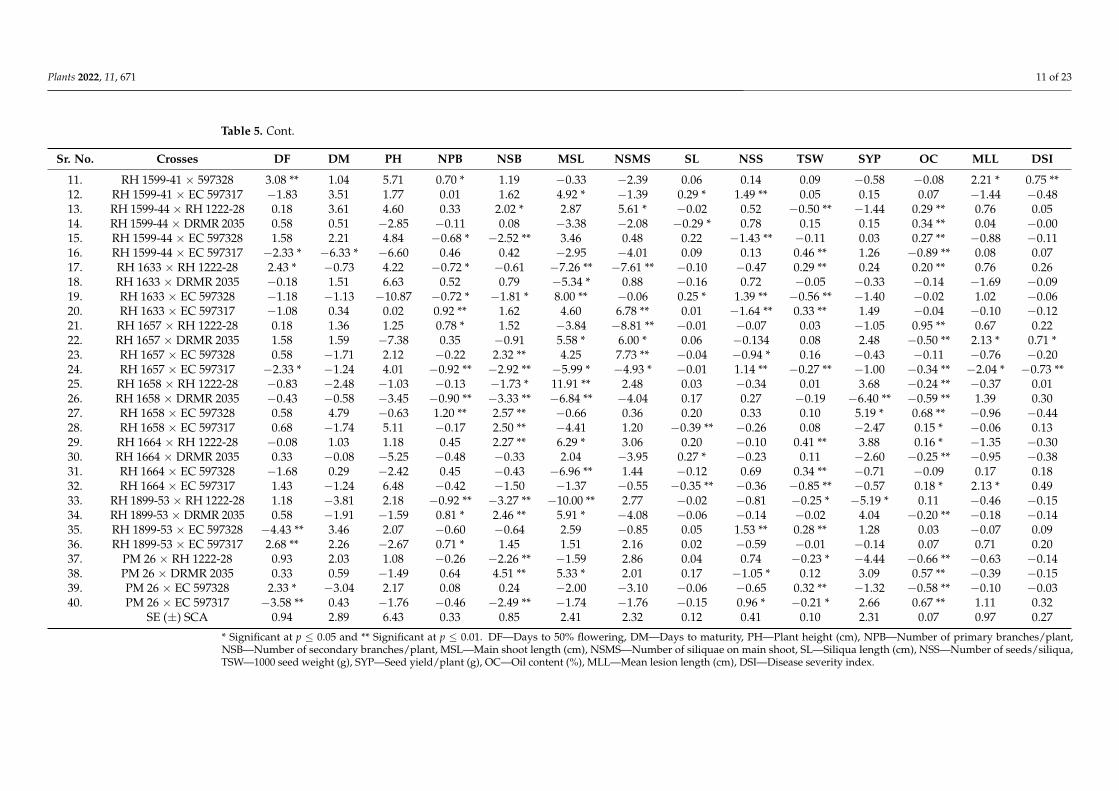
3.4. Specific Combining Ability (SCA) Effects of Crosses
Table 5 shows the SCA effects of 40 different cross combinations. Only the crossRH 1599-44 × EC 597317 showed significantly negative SCA effects for both days to 50%flowering and days to maturity among the 40 F1s studied, and were crucial for earlinessin Indian mustard. RH 1658 × EC 597328 and RH 1899-53 × DRMR 2035 had signifi-cant (p ≤ 0.05) and positive SCA effects for both the number of primary and secondarybranches/plants, while RH 1657 × DRMR 2035 had significant (p ≤ 0.05) and positiveSCA effects for main shoot length and number of siliquae on main shoot. Four crosscombinations, RH 1569 EC × 597317, RH 1599-41 × EC 597317, RH 1633 × EC 597328,and RH 1664 × DRMR 2035, showed significant (p ≤ 0.05) and positive SCA effects onsiliqua length. In six and eight distinct crossings, respectively, significant (p ≤ 0.05) andpositive SCA effects for the number of seeds/siliqua and 1000-seedweightwas detected.For seed yield/plant, positive SCA crosses are preferred. However, only one cross combina-tion, RH 1658 × EC 597328, demonstrated a significant and positive SCA effect (5.19 for thistrait). Sixteen out of forty cross combinations showed significant (p ≤ 0.05) and positiveSCA effects for oil content. For Sclerotinia stem rot resistance assessment parameters such asMLL and DSI, the cross RH 1657 × EC 597317 showed significantly negative and desirableSCA effect. In contrast, three crosses, RH 1599-41 × EC 597328, RH 1657 × DRMR 2035,and RH 1664 × EC 597317, showed significantly positive and undesirable SCA effects.
Plants 2022, 11, 671 10 of 23
Table 4. General combining ability (GCA) of parents for seed yield and its component traits and Sclerotinia stem rot resistance in Indian mustard.
Parents(Lines + Testers) DF DM PH NPB NSB MSL NSMS SL NSS TSW SYP OC MLL DSI
Lines
RH 1566 5.43 ** 3.49 * 6.80 * −0.24 −1.00 * −4.68 ** 0.85 −0.33 ** −0.95 ** −0.09 −0.49 0.51 ** −0.64 −0.06RH 1569 4.43 ** 0.83 7.63 * 0.96 ** 2.54 ** 1.39 5.54 ** 0.11 −0.09 0.22 ** 2.40 * −0.02 −2.33 ** −0.69 **
RH 1599-41 −4.58 ** −4.68 ** −1.49 −0.53 ** −1.46 ** 1.55 −1.00 −0.29 ** 0.82 ** −0.42 ** −1.41 −0.33 ** −2.17 ** −0.71 **RH 1599-44 −0.08 1.16 1.21 0.34 * 0.08 −1.23 −0.54 −0.25 ** 0.32 −0.33 ** 3.58 ** 0.56 ** 0.36 0.18
RH 1633 4.68 ** 3.49 * 2.09 −0.12 −1.62 ** 0.72 0.00 0.36 ** −0.39 1.03 ** −0.05 −0.32 ** 3.13 ** 0.63 **RH 1657 −2.08 ** −2.93 * 0.10 0.05 0.42 −1.36 −5.29 ** 0.04 −0.40 −0.43 ** −3.46 ** −0.03 −1.38 ** −0.36 **RH 1658 −5.08 ** −2.43 −10.99 ** −0.03 0.17 3.06 * −2.75 * 0.33 ** 0.10 0.57 ** −0.29 0.12 ** 1.35 ** 0.41 **RH 1664 −1.83 ** 0.08 −1.70 0.55 ** 0.67 −2.15 1.67 0.09 0.30 −0.23 ** 0.51 −0.35 ** 1.45 ** 0.39 **
RH 1899-53 1.93 ** 2.58 8.31 * −0.58 ** −0.46 −0.36 2.13 −0.08 −0.20 −0.13 ** −0.72 −0.30 ** −0.01 0.08PM 26 −2.83 ** −1.59 −11.96 ** −0.41 * 0.66 3.06 * −0.62 0.03 0.48 * −0.19 ** −0.07 0.17 ** 0.25 0.13
SE (±) Lines 0.47 1.45 3.22 0.17 0.43 1.20 1.16 0.06 0.20 0.05 1.16 0.04 0.48 0.14
Testers
RH 1222-28 0.33 1.06 −0.10 0.26 ** 0.23 0.22 0.39 0.07 * 0.10 0.34 ** 0.05 −0.16 ** −0.79 ** −0.17 *DRMR 2035 −1.08 ** 0.49 −3.84 * 0.19 * 0.50 * −2.04 ** −2.26 ** −0.03 0.20 0.07 ** 0.42 0.22 ** −0.62* −0.22 **EC 597328 −0.08 −1.88 * 2.00 −0.07 0.93 ** 4.62 ** 5.02 ** −0.10 ** −0.09 −0.51 ** 0.13 −0.01 0.72 ** 0.21 **EC 597317 0.83 ** 0.33 1.94 −0.38 ** −1.66 ** 2.80 ** −3.16 ** 0.06 −0.21 0.10 ** −0.60 −0.05 * 0.69 ** 0.18 *
SE (±) Testers 0.30 0.92 2.04 0.11 0.27 0.76 0.73 0.04 0.13 0.03 0.73 0.02 0.31 0.09
* Significant at p ≤ 0.05 and ** Significant at p ≤ 0.01. DF-Days to 50% flowering, DM—Days to maturity, PH—Plant height (cm), NPB—Number of primary branches/plant,NSB—Number of secondary branches/plant, MSL—Main shoot length (cm), NSMS—Number of siliquae on main shoot, SL—Siliqua length (cm), NSS—Number of seeds/siliqua,TSW—1000 seed weight (g), SYP—Seed yield/plant (g), OC—Oil content (%), MLL—Mean lesion length (cm), DSI—Disease severity index.
Table 5. Specific combining ability (SCA) of different crosses for seed yield and its component traits and Sclerotinia stem rot resistance in Indian mustard.
Sr. No. Crosses DF DM PH NPB NSB MSL NSMS SL NSS TSW SYP OC MLL DSI
1. RH 1566 × RH 1222-28 −1.33 0.61 5.68 0.57 0.43 −1.02 1.21 0.23 0.88 * 0.16 1.88 −0.80 ** 0.71 0.192. RH 1566 × DRMR 2035 −0.93 1.51 2.42 0.14 0.66 1.40 1.86 0.10 0.64 0.17 1.01 0.22 ** 0.30 0.143. RH 1566 × EC 597328 0.08 −5.46 −2.92 0.59 0.89 −9.03 ** −7.01 ** −0.06 −1.34 ** −0.50 ** −3.31 0.22 ** 0.44 0.104. RH 1566 × EC 597317 2.18 * 3.34 −5.19 −1.30 ** −1.98 * 8.66 ** 3.93 −0.26 * −0.18 0.17 0.43 0.36 ** −1.45 −0.435. RH 1569 × RH 1222-28 −1.33 −0.73 −8.15 0.04 2.06 * 4.08 −1.48 −0.15 0.09 −0.09 0.74 −0.20 ** 0.51 0.056. RH 1569 × DRMR 2035 −1.93 * 0.51 9.42 −0.40 −1.54 −1.51 −0.49 −0.11 0.32 −0.07 −0.18 0.72 ** −0.49 −0.307. RH 1569 × EC 597328 −0.93 −0.46 −0.08 −0.80 * −1.81 * 0.67 3.40 −0.50 ** 0.29 −0.10 1.25 −0.32 ** −1.08 −0.288. RH 1569 × EC 597317 4.18 ** 0.68 −1.19 1.16 ** 1.29 −3.24 −1.43 0.76 ** −0.70 0.26 ** −1.81 −0.21 ** 1.06 0.539. RH 1599-41 × RH 1222-28 −1.33 −0.89 −11.03 −0.14 −0.44 −1.42 −0.10 −0.19 −0.45 0.17 1.70 0.18 * −0.61 −0.20
10. RH 1599-41 × DRMR 2035 0.08 −3.66 3.54 −0.57 −2.38 ** −3.17 3.88 −0.15 −1.18 ** −0.31 ** −1.27 −0.17 * −0.17 −0.08
Plants 2022, 11, 671 11 of 23
Table 5. Cont.
Sr. No. Crosses DF DM PH NPB NSB MSL NSMS SL NSS TSW SYP OC MLL DSI
11. RH 1599-41 × 597328 3.08 ** 1.04 5.71 0.70 * 1.19 −0.33 −2.39 0.06 0.14 0.09 −0.58 −0.08 2.21 * 0.75 **12. RH 1599-41 × EC 597317 −1.83 3.51 1.77 0.01 1.62 4.92 * −1.39 0.29 * 1.49 ** 0.05 0.15 0.07 −1.44 −0.4813. RH 1599-44 × RH 1222-28 0.18 3.61 4.60 0.33 2.02 * 2.87 5.61 * −0.02 0.52 −0.50 ** −1.44 0.29 ** 0.76 0.0514. RH 1599-44 × DRMR 2035 0.58 0.51 −2.85 −0.11 0.08 −3.38 −2.08 −0.29 * 0.78 0.15 0.15 0.34 ** 0.04 −0.0015. RH 1599-44 × EC 597328 1.58 2.21 4.84 −0.68 * −2.52 ** 3.46 0.48 0.22 −1.43 ** −0.11 0.03 0.27 ** −0.88 −0.1116. RH 1599-44 × EC 597317 −2.33 * −6.33 * −6.60 0.46 0.42 −2.95 −4.01 0.09 0.13 0.46 ** 1.26 −0.89 ** 0.08 0.0717. RH 1633 × RH 1222-28 2.43 * −0.73 4.22 −0.72 * −0.61 −7.26 ** −7.61 ** −0.10 −0.47 0.29 ** 0.24 0.20 ** 0.76 0.2618. RH 1633 × DRMR 2035 −0.18 1.51 6.63 0.52 0.79 −5.34 * 0.88 −0.16 0.72 −0.05 −0.33 −0.14 −1.69 −0.0919. RH 1633 × EC 597328 −1.18 −1.13 −10.87 −0.72 * −1.81 * 8.00 ** −0.06 0.25 * 1.39 ** −0.56 ** −1.40 −0.02 1.02 −0.0620. RH 1633 × EC 597317 −1.08 0.34 0.02 0.92 ** 1.62 4.60 6.78 ** 0.01 −1.64 ** 0.33 ** 1.49 −0.04 −0.10 −0.1221. RH 1657 × RH 1222-28 0.18 1.36 1.25 0.78 * 1.52 −3.84 −8.81 ** −0.01 −0.07 0.03 −1.05 0.95 ** 0.67 0.2222. RH 1657 × DRMR 2035 1.58 1.59 −7.38 0.35 −0.91 5.58 * 6.00 * 0.06 −0.134 0.08 2.48 −0.50 ** 2.13 * 0.71 *23. RH 1657 × EC 597328 0.58 −1.71 2.12 −0.22 2.32 ** 4.25 7.73 ** −0.04 −0.94 * 0.16 −0.43 −0.11 −0.76 −0.2024. RH 1657 × EC 597317 −2.33 * −1.24 4.01 −0.92 ** −2.92 ** −5.99 * −4.93 * −0.01 1.14 ** −0.27 ** −1.00 −0.34 ** −2.04 * −0.73 **25. RH 1658 × RH 1222-28 −0.83 −2.48 −1.03 −0.13 −1.73 * 11.91 ** 2.48 0.03 −0.34 0.01 3.68 −0.24 ** −0.37 0.0126. RH 1658 × DRMR 2035 −0.43 −0.58 −3.45 −0.90 ** −3.33 ** −6.84 ** −4.04 0.17 0.27 −0.19 −6.40 ** −0.59 ** 1.39 0.3027. RH 1658 × EC 597328 0.58 4.79 −0.63 1.20 ** 2.57 ** −0.66 0.36 0.20 0.33 0.10 5.19 * 0.68 ** −0.96 −0.4428. RH 1658 × EC 597317 0.68 −1.74 5.11 −0.17 2.50 ** −4.41 1.20 −0.39 ** −0.26 0.08 −2.47 0.15 * −0.06 0.1329. RH 1664 × RH 1222-28 −0.08 1.03 1.18 0.45 2.27 ** 6.29 * 3.06 0.20 −0.10 0.41 ** 3.88 0.16 * −1.35 −0.3030. RH 1664 × DRMR 2035 0.33 −0.08 −5.25 −0.48 −0.33 2.04 −3.95 0.27 * −0.23 0.11 −2.60 −0.25 ** −0.95 −0.3831. RH 1664 × EC 597328 −1.68 0.29 −2.42 0.45 −0.43 −6.96 ** 1.44 −0.12 0.69 0.34 ** −0.71 −0.09 0.17 0.1832. RH 1664 × EC 597317 1.43 −1.24 6.48 −0.42 −1.50 −1.37 −0.55 −0.35 ** −0.36 −0.85 ** −0.57 0.18 * 2.13 * 0.4933. RH 1899-53 × RH 1222-28 1.18 −3.81 2.18 −0.92 ** −3.27 ** −10.00 ** 2.77 −0.02 −0.81 −0.25 * −5.19 * 0.11 −0.46 −0.1534. RH 1899-53 × DRMR 2035 0.58 −1.91 −1.59 0.81 * 2.46 ** 5.91 * −4.08 −0.06 −0.14 −0.02 4.04 −0.20 ** −0.18 −0.1435. RH 1899-53 × EC 597328 −4.43 ** 3.46 2.07 −0.60 −0.64 2.59 −0.85 0.05 1.53 ** 0.28 ** 1.28 0.03 −0.07 0.0936. RH 1899-53 × EC 597317 2.68 ** 2.26 −2.67 0.71 * 1.45 1.51 2.16 0.02 −0.59 −0.01 −0.14 0.07 0.71 0.2037. PM 26 × RH 1222-28 0.93 2.03 1.08 −0.26 −2.26 ** −1.59 2.86 0.04 0.74 −0.23 * −4.44 −0.66 ** −0.63 −0.1438. PM 26 × DRMR 2035 0.33 0.59 −1.49 0.64 4.51 ** 5.33 * 2.01 0.17 −1.05 * 0.12 3.09 0.57 ** −0.39 −0.1539. PM 26 × EC 597328 2.33 * −3.04 2.17 0.08 0.24 −2.00 −3.10 −0.06 −0.65 0.32 ** −1.32 −0.58 ** −0.10 −0.0340. PM 26 × EC 597317 −3.58 ** 0.43 −1.76 −0.46 −2.49 ** −1.74 −1.76 −0.15 0.96 * −0.21 * 2.66 0.67 ** 1.11 0.32
SE (±) SCA 0.94 2.89 6.43 0.33 0.85 2.41 2.32 0.12 0.41 0.10 2.31 0.07 0.97 0.27
* Significant at p ≤ 0.05 and ** Significant at p ≤ 0.01. DF—Days to 50% flowering, DM—Days to maturity, PH—Plant height (cm), NPB—Number of primary branches/plant,NSB—Number of secondary branches/plant, MSL—Main shoot length (cm), NSMS—Number of siliquae on main shoot, SL—Siliqua length (cm), NSS—Number of seeds/siliqua,TSW—1000 seed weight (g), SYP—Seed yield/plant (g), OC—Oil content (%), MLL—Mean lesion length (cm), DSI—Disease severity index.
Plants 2022, 11, 671 12 of 23
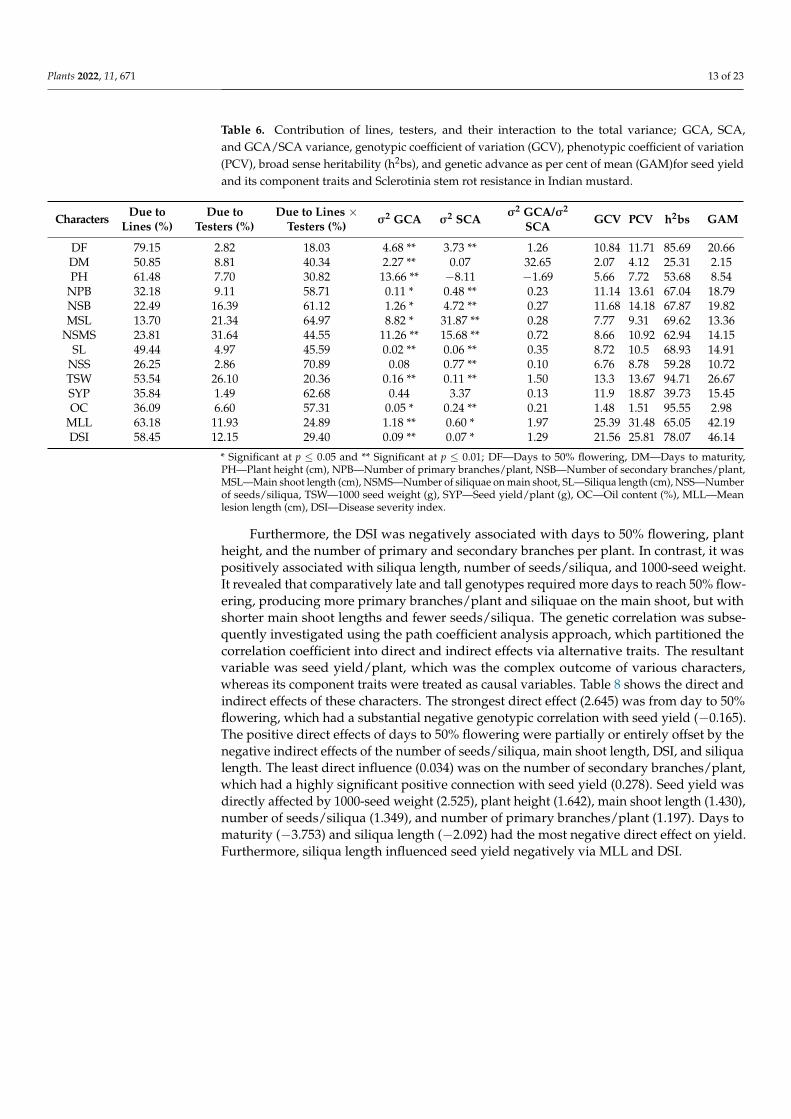
3.5. Genetic Parameters and Selection Indices for Sclerotinia Stem Rot Resistance, Yield, and ItsComponent Traits
Table 6 shows the proportional contribution of lines, testers, and their interactionsto total variance, genotypic and phenotypic coefficients of variation, heritability, and GA.In general, lines outperformed testers for every character, except main shoot length (21.34%)and number of siliquae on main shoot (31.64%), where testers outperformed the lines.The contribution of lines was highest for the character, day to 50% flowering (79.15%),followed by plant height (61.48%), DSI (58.45%) and MLL (47.14%), while it was lowest formain shoot length (13.70%). Testers contributed the most to the number of siliquae on themain shoot (31.64%), 1000-seed weight (26.10%), and main shoot length (21.34%), but theleast to seed yield/plant (1.49%). The number of seeds/siliqua (70.89%) had the highestline × tester interaction, whereas days to 50% flowering had the lowest (18.03%). For thecharacters, number of primary and secondary branches/plant, main shoot length, numberof siliquae on main shoot, siliqua length, number of seeds/siliqua, seed yield/plant, and oilcontent, the SCA variances were higher than the GCA variances. In contrast, the GCAvariance was high for the other traits. The SCA variances were significant (p ≤ 0.05),with the main shoot length (31.87) being the largest, followed by the number of siliquaeon the main shoot (15.68), and the days to maturity (0.07) and DSI (0.07) being the lowest.Plant height (13.66) had the highest GCA variance, whereas oil content had the lowest(0.05). The proportions of σ2 GCA/σ2 SCA were less than unity (<1) for characters such asnumber of primary and secondary branches/plant, main shoot length, number of siliquaeon main shoot, siliqua length, number of seeds/siliqua, seed yield/plant, and oil content,but were greater than unity (>1) for the remaining characters such as days to 50% flowering,days to maturity, plant height, 1000-seed weight, MLL, and DSI. All examined traits hadonly marginally larger PCV than GCV, except for seed yield/plant, which had a 1.5-foldhigher PCV than GCV value. The GCV and PCV of all the characters in this experimentranged from low to high. Oil content had the lowest GCV and PCV values (1.48% GCVand 1.51% PCV), whereas MLL had the greatest (25.39% GCV and 31.48% PCV). Estimatesof broad-sense heritability (h2bs) ranged from very low (25.31% for days to maturity)to very high (95.55% for oil content). Days to 50% flowering, 1000-seed weight and oilcontent had high heritability estimates (>80%), while the number of primary and secondarybranches/plant, main shoot length, number of siliquae on main shoot, siliqua length, MLL,and DSI had moderately high heritability estimates (60–79%). Days to maturity and seedyield/plant have low heritability estimates (<40%). GAM for days to maturity and DSIranged from 2.15 to 46.14. For DSI, MLL, 1000-seed weight and days to 50% flowering,GAM was relatively high (>20%).
3.6. Correlation and Path Analysis
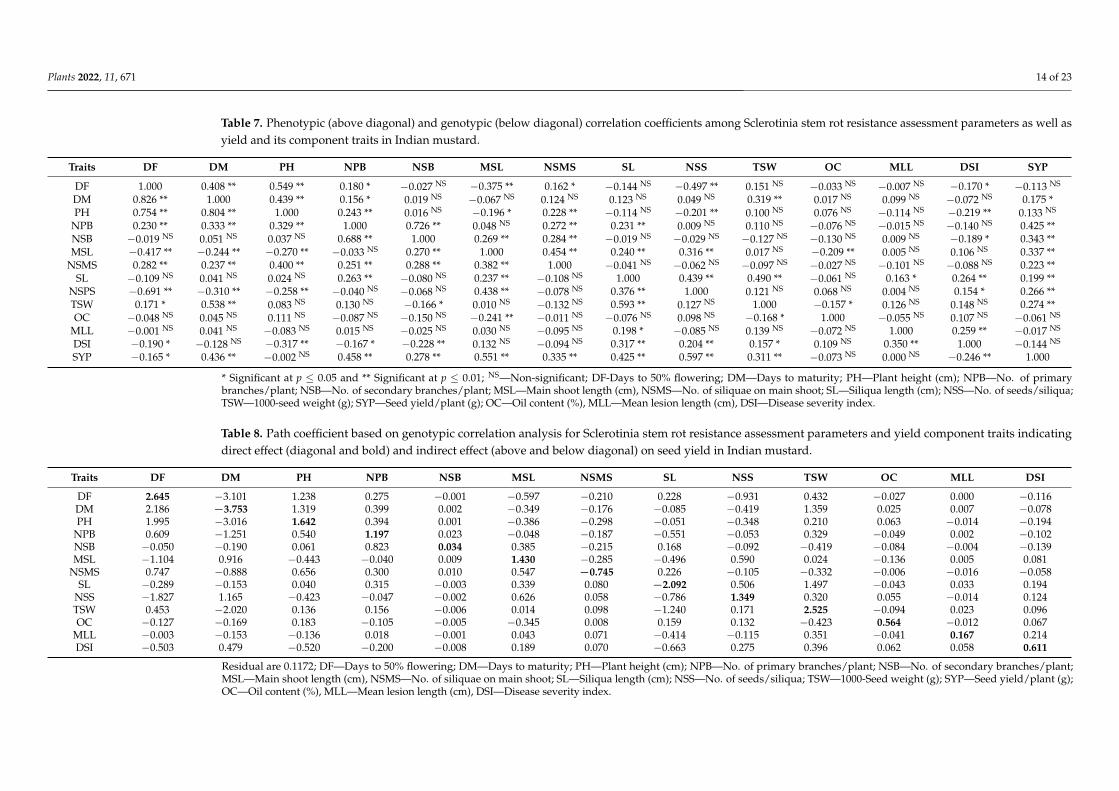
Table 7 shows the phenotypic and genotypic correlation coefficients between pairsof traits. Most of the examined variables had significant phenotypic and genotypic corre-lations. There was close agreement between the two; nevertheless, the differences wereprominent in some cases, implying that environmental factors play a significant rolein estimating these parameters. Days to maturity, number of primary and secondarybranches/plant, main shoot length, number of siliquae on main shoot, siliqua length, num-ber of seeds/siliqua, and 1000-seed weight were all significantly and positively correlatedwith seed yield at both genotypic and phenotypic levels. In contrast, days to 50% floweringand DSI had a significant negative association with seed yield at the genotypic level. Ex-cept for main shoot length, none were significantly correlated with oil content, and seedyield and oil content were not connected to one another or to MLL. Still, both resistance-related measures, namely, MLL and DSI, had a positive correlation at both genotypic andphenotypic levels.
Plants 2022, 11, 671 13 of 23
Table 6. Contribution of lines, testers, and their interaction to the total variance; GCA, SCA,and GCA/SCA variance, genotypic coefficient of variation (GCV), phenotypic coefficient of variation(PCV), broad sense heritability (h2bs), and genetic advance as per cent of mean (GAM)for seed yieldand its component traits and Sclerotinia stem rot resistance in Indian mustard.
Characters Due toLines (%)
Due toTesters (%)
Due to Lines ×Testers (%) σ2 GCA σ2 SCA σ2 GCA/σ2
SCAGCV PCV h2bs GAM
DF 79.15 2.82 18.03 4.68 ** 3.73 ** 1.26 10.84 11.71 85.69 20.66DM 50.85 8.81 40.34 2.27 ** 0.07 32.65 2.07 4.12 25.31 2.15PH 61.48 7.70 30.82 13.66 ** −8.11 −1.69 5.66 7.72 53.68 8.54
NPB 32.18 9.11 58.71 0.11 * 0.48 ** 0.23 11.14 13.61 67.04 18.79NSB 22.49 16.39 61.12 1.26 * 4.72 ** 0.27 11.68 14.18 67.87 19.82MSL 13.70 21.34 64.97 8.82 * 31.87 ** 0.28 7.77 9.31 69.62 13.36
NSMS 23.81 31.64 44.55 11.26 ** 15.68 ** 0.72 8.66 10.92 62.94 14.15SL 49.44 4.97 45.59 0.02 ** 0.06 ** 0.35 8.72 10.5 68.93 14.91
NSS 26.25 2.86 70.89 0.08 0.77 ** 0.10 6.76 8.78 59.28 10.72TSW 53.54 26.10 20.36 0.16 ** 0.11 ** 1.50 13.3 13.67 94.71 26.67SYP 35.84 1.49 62.68 0.44 3.37 0.13 11.9 18.87 39.73 15.45OC 36.09 6.60 57.31 0.05 * 0.24 ** 0.21 1.48 1.51 95.55 2.98
MLL 63.18 11.93 24.89 1.18 ** 0.60 * 1.97 25.39 31.48 65.05 42.19DSI 58.45 12.15 29.40 0.09 ** 0.07 * 1.29 21.56 25.81 78.07 46.14
* Significant at p ≤ 0.05 and ** Significant at p ≤ 0.01; DF—Days to 50% flowering, DM—Days to maturity,PH—Plant height (cm), NPB—Number of primary branches/plant, NSB—Number of secondary branches/plant,MSL—Main shoot length (cm), NSMS—Number of siliquae on main shoot, SL—Siliqua length (cm), NSS—Numberof seeds/siliqua, TSW—1000 seed weight (g), SYP—Seed yield/plant (g), OC—Oil content (%), MLL—Meanlesion length (cm), DSI—Disease severity index.
Furthermore, the DSI was negatively associated with days to 50% flowering, plantheight, and the number of primary and secondary branches per plant. In contrast, it waspositively associated with siliqua length, number of seeds/siliqua, and 1000-seed weight.It revealed that comparatively late and tall genotypes required more days to reach 50% flow-ering, producing more primary branches/plant and siliquae on the main shoot, but withshorter main shoot lengths and fewer seeds/siliqua. The genetic correlation was subse-quently investigated using the path coefficient analysis approach, which partitioned thecorrelation coefficient into direct and indirect effects via alternative traits. The resultantvariable was seed yield/plant, which was the complex outcome of various characters,whereas its component traits were treated as causal variables. Table 8 shows the direct andindirect effects of these characters. The strongest direct effect (2.645) was from day to 50%flowering, which had a substantial negative genotypic correlation with seed yield (−0.165).The positive direct effects of days to 50% flowering were partially or entirely offset by thenegative indirect effects of the number of seeds/siliqua, main shoot length, DSI, and siliqualength. The least direct influence (0.034) was on the number of secondary branches/plant,which had a highly significant positive connection with seed yield (0.278). Seed yield wasdirectly affected by 1000-seed weight (2.525), plant height (1.642), main shoot length (1.430),number of seeds/siliqua (1.349), and number of primary branches/plant (1.197). Days tomaturity (−3.753) and siliqua length (−2.092) had the most negative direct effect on yield.Furthermore, siliqua length influenced seed yield negatively via MLL and DSI.
Plants 2022, 11, 671 14 of 23
Table 7. Phenotypic (above diagonal) and genotypic (below diagonal) correlation coefficients among Sclerotinia stem rot resistance assessment parameters as well asyield and its component traits in Indian mustard.
Traits DF DM PH NPB NSB MSL NSMS SL NSS TSW OC MLL DSI SYP
DF 1.000 0.408 ** 0.549 ** 0.180 * −0.027 NS −0.375 ** 0.162 * −0.144 NS −0.497 ** 0.151 NS −0.033 NS −0.007 NS −0.170 * −0.113 NS
DM 0.826 ** 1.000 0.439 ** 0.156 * 0.019 NS −0.067 NS 0.124 NS 0.123 NS 0.049 NS 0.319 ** 0.017 NS 0.099 NS −0.072 NS 0.175 *PH 0.754 ** 0.804 ** 1.000 0.243 ** 0.016 NS −0.196 * 0.228 ** −0.114 NS −0.201 ** 0.100 NS 0.076 NS −0.114 NS −0.219 ** 0.133 NS
NPB 0.230 ** 0.333 ** 0.329 ** 1.000 0.726 ** 0.048 NS 0.272 ** 0.231 ** 0.009 NS 0.110 NS −0.076 NS −0.015 NS −0.140 NS 0.425 **NSB −0.019 NS 0.051 NS 0.037 NS 0.688 ** 1.000 0.269 ** 0.284 ** −0.019 NS −0.029 NS −0.127 NS −0.130 NS 0.009 NS −0.189 * 0.343 **MSL −0.417 ** −0.244 ** −0.270 ** −0.033 NS 0.270 ** 1.000 0.454 ** 0.240 ** 0.316 ** 0.017 NS −0.209 ** 0.005 NS 0.106 NS 0.337 **
NSMS 0.282 ** 0.237 ** 0.400 ** 0.251 ** 0.288 ** 0.382 ** 1.000 −0.041 NS −0.062 NS −0.097 NS −0.027 NS −0.101 NS −0.088 NS 0.223 **SL −0.109 NS 0.041 NS 0.024 NS 0.263 ** −0.080 NS 0.237 ** −0.108 NS 1.000 0.439 ** 0.490 ** −0.061 NS 0.163 * 0.264 ** 0.199 **
NSPS −0.691 ** −0.310 ** −0.258 ** −0.040 NS −0.068 NS 0.438 ** −0.078 NS 0.376 ** 1.000 0.121 NS 0.068 NS 0.004 NS 0.154 * 0.266 **TSW 0.171 * 0.538 ** 0.083 NS 0.130 NS −0.166 * 0.010 NS −0.132 NS 0.593 ** 0.127 NS 1.000 −0.157 * 0.126 NS 0.148 NS 0.274 **OC −0.048 NS 0.045 NS 0.111 NS −0.087 NS −0.150 NS −0.241 ** −0.011 NS −0.076 NS 0.098 NS −0.168 * 1.000 −0.055 NS 0.107 NS −0.061 NS
MLL −0.001 NS 0.041 NS −0.083 NS 0.015 NS −0.025 NS 0.030 NS −0.095 NS 0.198 * −0.085 NS 0.139 NS −0.072 NS 1.000 0.259 ** −0.017 NS
DSI −0.190 * −0.128 NS −0.317 ** −0.167 * −0.228 ** 0.132 NS −0.094 NS 0.317 ** 0.204 ** 0.157 * 0.109 NS 0.350 ** 1.000 −0.144 NS
SYP −0.165 * 0.436 ** −0.002 NS 0.458 ** 0.278 ** 0.551 ** 0.335 ** 0.425 ** 0.597 ** 0.311 ** −0.073 NS 0.000 NS −0.246 ** 1.000
* Significant at p ≤ 0.05 and ** Significant at p ≤ 0.01; NS—Non-significant; DF-Days to 50% flowering; DM—Days to maturity; PH—Plant height (cm); NPB—No. of primarybranches/plant; NSB—No. of secondary branches/plant; MSL—Main shoot length (cm), NSMS—No. of siliquae on main shoot; SL—Siliqua length (cm); NSS—No. of seeds/siliqua;TSW—1000-seed weight (g); SYP—Seed yield/plant (g); OC—Oil content (%), MLL—Mean lesion length (cm), DSI—Disease severity index.
Table 8. Path coefficient based on genotypic correlation analysis for Sclerotinia stem rot resistance assessment parameters and yield component traits indicatingdirect effect (diagonal and bold) and indirect effect (above and below diagonal) on seed yield in Indian mustard.
Traits DF DM PH NPB NSB MSL NSMS SL NSS TSW OC MLL DSI
DF 2.645 −3.101 1.238 0.275 −0.001 −0.597 −0.210 0.228 −0.931 0.432 −0.027 0.000 −0.116DM 2.186 −3.753 1.319 0.399 0.002 −0.349 −0.176 −0.085 −0.419 1.359 0.025 0.007 −0.078PH 1.995 −3.016 1.642 0.394 0.001 −0.386 −0.298 −0.051 −0.348 0.210 0.063 −0.014 −0.194
NPB 0.609 −1.251 0.540 1.197 0.023 −0.048 −0.187 −0.551 −0.053 0.329 −0.049 0.002 −0.102NSB −0.050 −0.190 0.061 0.823 0.034 0.385 −0.215 0.168 −0.092 −0.419 −0.084 −0.004 −0.139MSL −1.104 0.916 −0.443 −0.040 0.009 1.430 −0.285 −0.496 0.590 0.024 −0.136 0.005 0.081
NSMS 0.747 −0.888 0.656 0.300 0.010 0.547 −0.745 0.226 −0.105 −0.332 −0.006 −0.016 −0.058SL −0.289 −0.153 0.040 0.315 −0.003 0.339 0.080 −2.092 0.506 1.497 −0.043 0.033 0.194
NSS −1.827 1.165 −0.423 −0.047 −0.002 0.626 0.058 −0.786 1.349 0.320 0.055 −0.014 0.124TSW 0.453 −2.020 0.136 0.156 −0.006 0.014 0.098 −1.240 0.171 2.525 −0.094 0.023 0.096OC −0.127 −0.169 0.183 −0.105 −0.005 −0.345 0.008 0.159 0.132 −0.423 0.564 −0.012 0.067
MLL −0.003 −0.153 −0.136 0.018 −0.001 0.043 0.071 −0.414 −0.115 0.351 −0.041 0.167 0.214DSI −0.503 0.479 −0.520 −0.200 −0.008 0.189 0.070 −0.663 0.275 0.396 0.062 0.058 0.611
Residual are 0.1172; DF—Days to 50% flowering; DM—Days to maturity; PH—Plant height (cm); NPB—No. of primary branches/plant; NSB—No. of secondary branches/plant;MSL—Main shoot length (cm), NSMS—No. of siliquae on main shoot; SL—Siliqua length (cm); NSS—No. of seeds/siliqua; TSW—1000-Seed weight (g); SYP—Seed yield/plant (g);OC—Oil content (%), MLL—Mean lesion length (cm), DSI—Disease severity index.
Plants 2022, 11, 671 15 of 23
4. Discussion
Breeding cultivars with high yield potential and resistance to major diseases is aprimary goal of crop improvement projects. When hybridization is attempted in a specificmating design, identifying the best parental genotype combinations allows breeders totake advantage of their heterotic effects and shows that superior transgressive segregantsare available in the F2 and subsequent segregating generations of that cross. The ability toexamine the combining ability and heterotic effects in selecting superior parents for thefuture requires the mean values of parents and F1 combinations. Line × Tester analysis isthe best way to examine the potentiality of contrasting lines (females) and testers (males)for their combining ability and gene action for different traits [38]. Based on their per seperformance and combining ability effects, the current study was conducted to identifythe best parental genotypes and their cross combinations for Sclerotinia stem rot resistance,seed yield, and component traits. The data from the traits analyzed can establish a helpfulbreeding strategy for future high-yielding Indian mustard hybrids/varieties with increasedSclerotinia stem rot resistance.
There must be sufficient genetic variation within the selected lines for any crop breed-ing program to succeed. The mean square due to genotypes for agronomic traits, MLL,and DSI was highly significant (p ≤ 0.01) in the analysis of variance (ANOVA), show-ing that there was a lot of genotypic variation for these characters among the genotypestested. As a result, line × tester analysis can split total genetic variance into its appropriateorthogonal components. For most of the traits tested, ANOVA for line × tester matingdesign demonstrated the significance of their orthogonal components, namely, parents,crosses, and parent vs. Crosses. This implies a high level of genetic variability in both males(testers) and females (lines) parents and their F1 hybrids, allowing for a more in-depthinvestigation of genetic variation by combining ability analysis and the measurement ofthe extent heterosis for these traits. Kaur et al. [53], Meena et al. [54–56], Vaghela et al. [57],Chaudhary et al. [58], and Gupta et al. [9] observed high genetic variability for yield andits component traits in Indian mustard. Godoy et al. [59], Castano et al. [60], Achbaniet al. [61], and Grecizes-Besset et al. [62] in sunflower and Ferreira et al. [63] in commonbean revealed high genetic variability for resistance/susceptibility to S. sclerotiorum.
Combining ability analysis is frequently used to compare parental performanceand better understand the basis of gene action that causes trait manifestation. Further-more, combining ability is often helpful in forecasting the heterotic response of specificlines/genotypes in various cross combinations and acquiring superior transgressive segre-gants in the F2 and subsequent segregating generations. The GCA effect is used to selectdesirable parents, while the SCA effect is used to evaluate testcross progenies to formheterotic hybrids [37,38,64]. For days to flowering, siliqua length, and 1000-seed weight,significant mean squares attributable to lines and/or testers (GCA) effects and line × tester(SCA) effects show an interplay of additive and non-additive gene effects for the expressionof these traits. While additive genetic action influenced the inheritance of days to maturityand plant height, non-additive gene action was significant for expressing the rest of thetraits, as revealed by significant mean square due to lines, testers (GCA) and line × tester(SCA) effects for these traits, respectively. Both additive and non-additive genetic effectsinfluenced Sclerotinia stem rot resistance, as evidenced by significant mean squares of lines,testers, and line × tester interactions for both resistance evaluation criteria, namely, MLLand DSI. These findings are consistent with those of Khan et al. [32], Disi et al. [30], Godoyet al. [59], Castano et al. [60], and Achbani et al. [61], who found that both additive andnon-additive genetic action influenced Sclerotinia rot resistance inheritance and could beimproved using the recurrent selection procedure. The significant effect of GCA on thesum of squares of SCA suggested that early generation selection of resistant progeniescould be successful.
When utilized in hybridization, selecting parents based on their per se performancemay not always be a fair method because a phenotypically worthy parent may not alwaysproduce superior hybrids and transgressive segregants in the segregating generations.
Plants 2022, 11, 671 16 of 23
As a result, it is necessary to choose parents based on their genetic assets. The parentssignificant GCA effects are primarily due to their additive and additive × additive geneeffects, a fixable component in segregating generations. Based on their GCA effects, parentsshould be chosen for hybridization to isolate superior segregants in the F2 and followinggenerations [38,63,64]. Our findings revealed that none of the parents were good generalcombiners for all of the traits investigated. This conclusion suggests that collective breedingstrategies with optimal mating designs must accumulate desirable alleles into a singlegenetic background. Higher negative GCA values offered better resistance to Sclerotiniastem rot, while higher positive GCA values indicated increased susceptibility. The lineRH 1599-41 was involved in three of the top four Sclerotinia stem rot-resistant and earlyflowering hybrids and had the highest negative GCA effect for DSI and early maturity.Regrettably, it proved to be a poor combiner in seed yield per plant. Positive combiningability and heterotic effects are beneficial for yield component traits like number of primaryand secondary branches/plant, seeds/siliqua, siliqua length, and 1000-seed weight becausethey provide potential for improving yield. Despite ranking second in general effects foryield, the line RH 1569 may be the best choice because it has a good GCA effect for themajority of important yield component traits such as number of primary and secondarybranches/plant, number of siliquae on main shoot, and 1000-seed weight, while also havingthe best general effects for Sclerotinia stem rot resistance. The best general combiners forresistance and the two most crucial yield-related qualities, 1000-seed weight and number ofmajor branches/plant, were DRMR 2035 and RH 1222-28 among testers. Short plant statureand vegetative period are also essential to creating lodging tolerant and comparatively largeseed filling period cultivars of Indian mustard for yield and Sclerotinia stem rot resistance.While early maturity allows enough time to raise the following crop, late maturity reducesyield and oil quality due to increased temperature during the final stages of the crop [65].Negative combining ability and heterotic effects are thus required for these traits. PM 26and RH 1658 are good general combiners for shortening vegetative development andreducing plant height.
Overall, the genotypes RH 1569 (line) and DRMR 2035 (tester) looked to be thestrongest general combiners for Sclerotinia stem rot resistance and most yield componenttraits. They should do so well in hybrid combinations with other parents. The greatestcriterion for maximizing heterosis in F1 hybrids is to choose parents based on their SCAvalues. Negative SCA crosses for days to flowering, maturity, and plant height werewanted, while positive SCA crosses for other yield-related attributes were desired.
Contrary to what was expected based on the parent’s GCA, significant SCA effectsin the desired direction demonstrate positive deflections with regards to the F1 crosses.The SCA effect, which considers loci with non-additive and epistatic gene effects, can alsoidentify high heterotic F1 hybrids. Negative SCA effects for MLL and DSI are desiredbecause they lead to resistance, whereas positive SCA adds to Sclerotinia stem rot suscep-tibility. RH 1657 × EC 597317 was the only cross that demonstrated a significant desiredSCA value for MLL and DSI among other cross combinations, showing the involvement ofa particular effect in this hybrid’s resistance expression. It could be because of the goodgeneral combiner RH 1657, which has additive effects, and the lousy combiner parent(EC 597317), which has epistatic effects. However, it revealed adverse SCA effects for themajority of yield-related traits. All other crossings, except for cross RH 1657 × EC 597317,had unacceptable and/or insignificant SCA effects for both resistance evaluation criteria,demonstrating that genes/alleles giving Sclerotinia stem rot resistance are recessive oversusceptibility. Furthermore, crosses involving both parents with significant GCA effectsfor resistance had poorer SCA effects, implying the existence of a complex non-allelicgene interaction for resistance and/or that both of these parents may have identical resis-tance alleles thus could not benefit from fixable gene effects. Similarly, Van Becelaere andMiller [66] found that GCA effects of both male and female lines were crucial for Sclerotiniahead rot resistance in sunflower, but SCA effects were not significant. The ranking ofhybrids for resistance assessment parameters in terms of mean values and SCA effects
Plants 2022, 11, 671 17 of 23
revealed that the lowest mean values did not always predict significant adverse SCA ef-fects, and vice versa. Ross et al. [67] found a pattern of combining ability effects in grainsorghum, as did Satyanarayana [68] in rice. Most of the hybrids had insignificant SCAeffects for both seed yield and its component traits. The hybrid RH 1658 × EC 597328,on the other hand, had the best SCA effects for yield and components, as well as an in-significant but desirable negative SCA effect for resistance. This cross can develop hybridsor transgressive segregants with excellent seed and oil yields and resistance to Sclerotiniastem rot. The cross RH 1599-44 × EC 597317 showed significant SCA effects for loweringplant height and vegetative and maturity periods in this study. As a result, including theparents in a specific mating design such as diallel or triallel may increase the possibility ofproducing high-yielding, resistant segregants and developing hybrids. The inconsistencyof GCA and SCA effects suggests that these traits have complex gene connections.
The contribution to the total variation of the lines, testers, and their interactionssupport prior results that general effects were more relevant than specific effects for Scle-rotinia rot resistance [59,61,62]. On the other hand, specific effects had a greater impacton yield component traits and oil content [9,11,54,57]. GCA and SCA variances revealedthe role of both additive and non-additive gene action in the expression of most examinedtraits. The significance of SCA in creating heterotic crosses for most yield-related traitswas highlighted by higher SCA variance than GCA variance of lines and testers. The al-lele frequencies between parental genotypes determine the magnitude of the GCA/SCAvariance ratio. For most of the yield-attributing traits, such as number of primary andsecondary branches/plant, main shoot length, number of siliquae on main shoot, siliqualength, number of seeds/siliqua, and oil content, this ratio revealed the predominanceof non-additive gene action (SCA variance). This indicates that selecting superior plantsfor these traits should be deferred to subsequent generations. Although additive geneaction (GCA variance) was essential for days to flowering, days to maturity, plant height,and Sclerotinia rot resistance, selection of phenotypically superior plants would be effectivein early generations. These findings are consistent with those of Meena et al. [54], Vaghelaet al. [57], and Gupta et al. [69], but differ from those of Dahiya et al. [70] and Chaudharyet al. [58]. Because both additive and non-additive gene actions were necessary for the in-heritance of the studied traits, hybridization methods that simultaneously use additive andnon-additive gene effects, such as diallel selective mating scheme or reciprocal recurrentcrossing, could be helpful in the genetic improvement of the traits under consideration.
The current study’s PCV values were larger than the GCV values for all traits, show-ing that environmental effects on the characteristics were more relevant than genotypiceffects. Previous publications on higher PCV values than GCV values for yield and com-ponent traits in Indian mustard [71–75] complement our findings. Seed yield/plant hada considerable discrepancy for PCV and GCV, owing to the greater confounding effect ofenvironment on this characteristic. Furthermore, due to the concealing effect of the envi-ronment, GCV and PCV estimates do not substantiate the exhaustive extent of heritablevariation, which may be assessed more precisely with heritability and genetic advanceestimates [76]. Heritability and genetic advancement of a particular trait determine geneticgain or responsiveness to selection. Singh [77] divided broad-sense heritability estimates(h2bs) into four categories: low (<40%), moderate (40–59%), moderately high (60–79%),and extremely high (>80%). Days to 50% flowering, 1000-seed weight, oil content, num-ber of primary and secondary branches/plant, main shoot length, number of siliquaeon main shoot, siliqua length, MLL, and DSI all had moderately high to extremely highheritability values in this study. If these traits are employed to boost seed and oil yield andSclerotinia stems rot resistance in Indian mustard, the projected gain from the selectionwill be considerable. The high heritability estimates also suggest that the environmentpoorly influences certain traits. Heritability estimates for plant height and number ofseeds/siliqua were intermediate, indicating that these parameters’ environmental andgenetic effects were indistinguishable. Days to maturity and seed yield/plant have lowheritability estimates, and direct selection for these traits would be challenging due to the
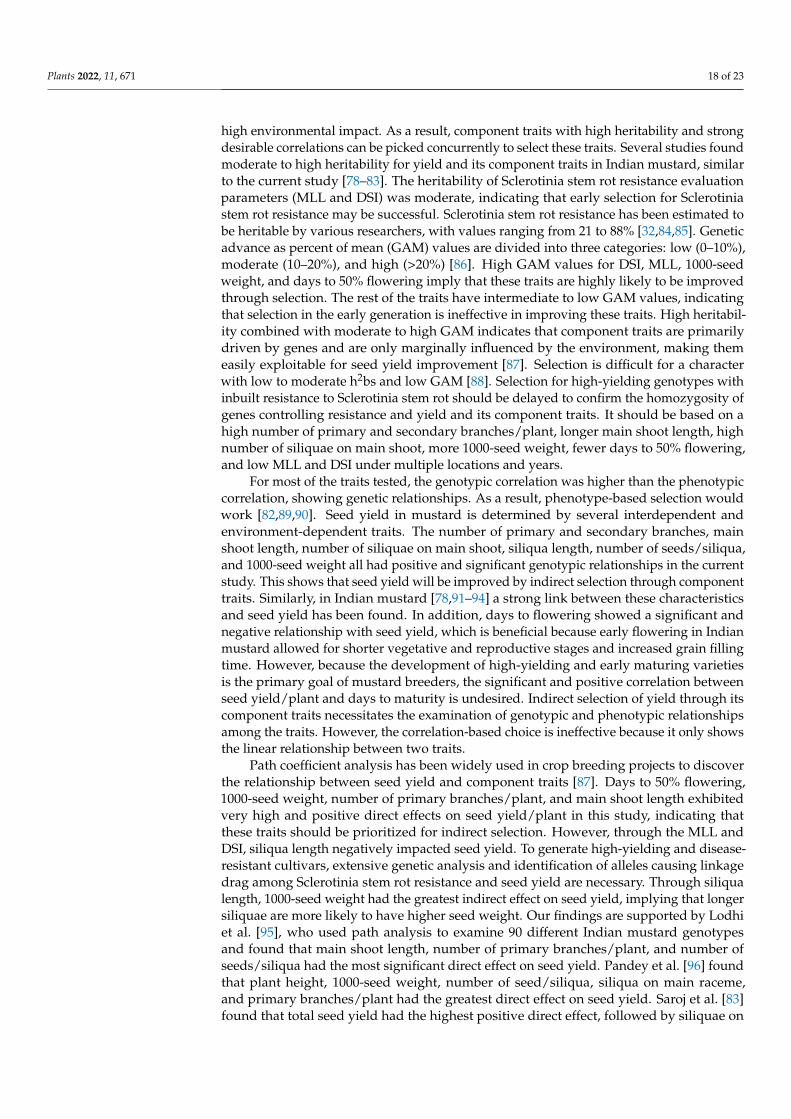
Plants 2022, 11, 671 18 of 23
high environmental impact. As a result, component traits with high heritability and strongdesirable correlations can be picked concurrently to select these traits. Several studies foundmoderate to high heritability for yield and its component traits in Indian mustard, similarto the current study [78–83]. The heritability of Sclerotinia stem rot resistance evaluationparameters (MLL and DSI) was moderate, indicating that early selection for Sclerotiniastem rot resistance may be successful. Sclerotinia stem rot resistance has been estimated tobe heritable by various researchers, with values ranging from 21 to 88% [32,84,85]. Geneticadvance as percent of mean (GAM) values are divided into three categories: low (0–10%),moderate (10–20%), and high (>20%) [86]. High GAM values for DSI, MLL, 1000-seedweight, and days to 50% flowering imply that these traits are highly likely to be improvedthrough selection. The rest of the traits have intermediate to low GAM values, indicatingthat selection in the early generation is ineffective in improving these traits. High heritabil-ity combined with moderate to high GAM indicates that component traits are primarilydriven by genes and are only marginally influenced by the environment, making themeasily exploitable for seed yield improvement [87]. Selection is difficult for a characterwith low to moderate h2bs and low GAM [88]. Selection for high-yielding genotypes withinbuilt resistance to Sclerotinia stem rot should be delayed to confirm the homozygosity ofgenes controlling resistance and yield and its component traits. It should be based on ahigh number of primary and secondary branches/plant, longer main shoot length, highnumber of siliquae on main shoot, more 1000-seed weight, fewer days to 50% flowering,and low MLL and DSI under multiple locations and years.
For most of the traits tested, the genotypic correlation was higher than the phenotypiccorrelation, showing genetic relationships. As a result, phenotype-based selection wouldwork [82,89,90]. Seed yield in mustard is determined by several interdependent andenvironment-dependent traits. The number of primary and secondary branches, mainshoot length, number of siliquae on main shoot, siliqua length, number of seeds/siliqua,and 1000-seed weight all had positive and significant genotypic relationships in the currentstudy. This shows that seed yield will be improved by indirect selection through componenttraits. Similarly, in Indian mustard [78,91–94] a strong link between these characteristicsand seed yield has been found. In addition, days to flowering showed a significant andnegative relationship with seed yield, which is beneficial because early flowering in Indianmustard allowed for shorter vegetative and reproductive stages and increased grain fillingtime. However, because the development of high-yielding and early maturing varietiesis the primary goal of mustard breeders, the significant and positive correlation betweenseed yield/plant and days to maturity is undesired. Indirect selection of yield through itscomponent traits necessitates the examination of genotypic and phenotypic relationshipsamong the traits. However, the correlation-based choice is ineffective because it only showsthe linear relationship between two traits.
Path coefficient analysis has been widely used in crop breeding projects to discoverthe relationship between seed yield and component traits [87]. Days to 50% flowering,1000-seed weight, number of primary branches/plant, and main shoot length exhibitedvery high and positive direct effects on seed yield/plant in this study, indicating thatthese traits should be prioritized for indirect selection. However, through the MLL andDSI, siliqua length negatively impacted seed yield. To generate high-yielding and disease-resistant cultivars, extensive genetic analysis and identification of alleles causing linkagedrag among Sclerotinia stem rot resistance and seed yield are necessary. Through siliqualength, 1000-seed weight had the greatest indirect effect on seed yield, implying that longersiliquae are more likely to have higher seed weight. Our findings are supported by Lodhiet al. [95], who used path analysis to examine 90 different Indian mustard genotypesand found that main shoot length, number of primary branches/plant, and number ofseeds/siliqua had the most significant direct effect on seed yield. Pandey et al. [96] foundthat plant height, 1000-seed weight, number of seed/siliqua, siliqua on main raceme,and primary branches/plant had the greatest direct effect on seed yield. Saroj et al. [83]found that total seed yield had the highest positive direct effect, followed by siliquae on
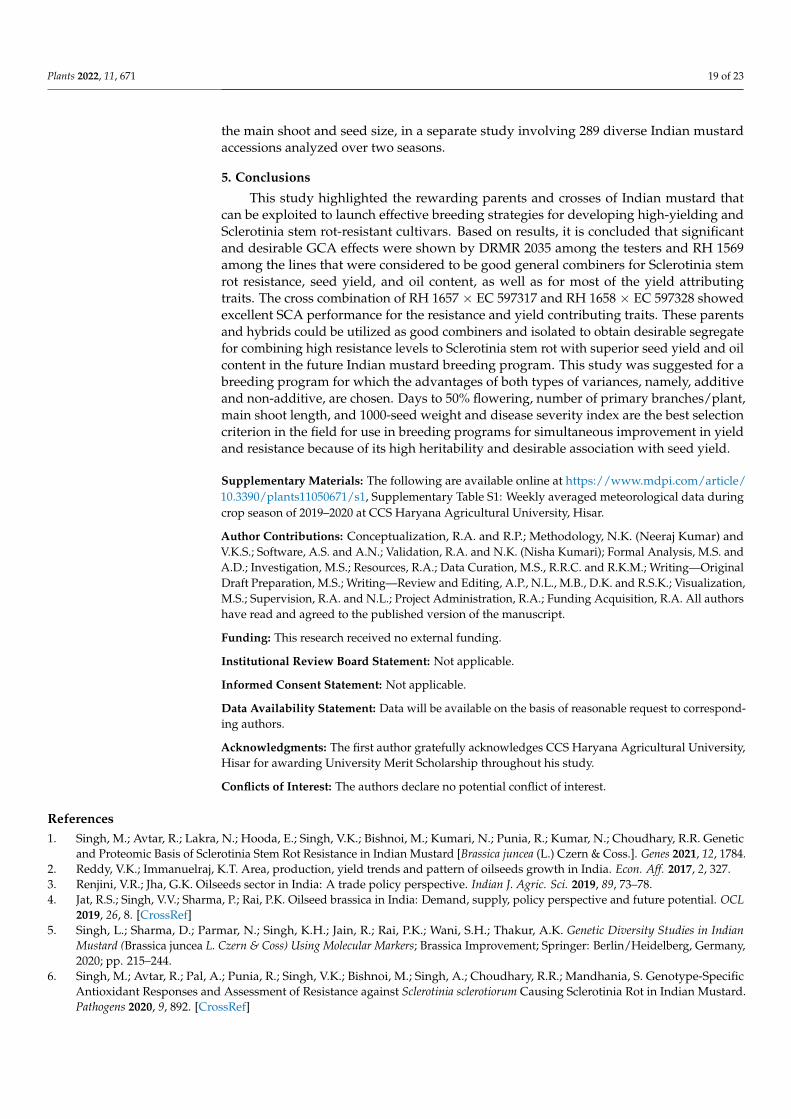
Plants 2022, 11, 671 19 of 23
the main shoot and seed size, in a separate study involving 289 diverse Indian mustardaccessions analyzed over two seasons.
5. Conclusions
This study highlighted the rewarding parents and crosses of Indian mustard thatcan be exploited to launch effective breeding strategies for developing high-yielding andSclerotinia stem rot-resistant cultivars. Based on results, it is concluded that significantand desirable GCA effects were shown by DRMR 2035 among the testers and RH 1569among the lines that were considered to be good general combiners for Sclerotinia stemrot resistance, seed yield, and oil content, as well as for most of the yield attributingtraits. The cross combination of RH 1657 × EC 597317 and RH 1658 × EC 597328 showedexcellent SCA performance for the resistance and yield contributing traits. These parentsand hybrids could be utilized as good combiners and isolated to obtain desirable segregatefor combining high resistance levels to Sclerotinia stem rot with superior seed yield and oilcontent in the future Indian mustard breeding program. This study was suggested for abreeding program for which the advantages of both types of variances, namely, additiveand non-additive, are chosen. Days to 50% flowering, number of primary branches/plant,main shoot length, and 1000-seed weight and disease severity index are the best selectioncriterion in the field for use in breeding programs for simultaneous improvement in yieldand resistance because of its high heritability and desirable association with seed yield.
Supplementary Materials: The following are available online at https://www.mdpi.com/article/10.3390/plants11050671/s1, Supplementary Table S1: Weekly averaged meteorological data duringcrop season of 2019–2020 at CCS Haryana Agricultural University, Hisar.
Author Contributions: Conceptualization, R.A. and R.P.; Methodology, N.K. (Neeraj Kumar) andV.K.S.; Software, A.S. and A.N.; Validation, R.A. and N.K. (Nisha Kumari); Formal Analysis, M.S. andA.D.; Investigation, M.S.; Resources, R.A.; Data Curation, M.S., R.R.C. and R.K.M.; Writing—OriginalDraft Preparation, M.S.; Writing—Review and Editing, A.P., N.L., M.B., D.K. and R.S.K.; Visualization,M.S.; Supervision, R.A. and N.L.; Project Administration, R.A.; Funding Acquisition, R.A. All authorshave read and agreed to the published version of the manuscript.
Funding: This research received no external funding.
Institutional Review Board Statement: Not applicable.
Informed Consent Statement: Not applicable.
Data Availability Statement: Data will be available on the basis of reasonable request to correspond-ing authors.
Acknowledgments: The first author gratefully acknowledges CCS Haryana Agricultural University,Hisar for awarding University Merit Scholarship throughout his study.
Conflicts of Interest: The authors declare no potential conflict of interest.
References1. Singh, M.; Avtar, R.; Lakra, N.; Hooda, E.; Singh, V.K.; Bishnoi, M.; Kumari, N.; Punia, R.; Kumar, N.; Choudhary, R.R. Genetic
and Proteomic Basis of Sclerotinia Stem Rot Resistance in Indian Mustard [Brassica juncea (L.) Czern & Coss.]. Genes 2021, 12, 1784.2. Reddy, V.K.; Immanuelraj, K.T. Area, production, yield trends and pattern of oilseeds growth in India. Econ. Aff. 2017, 2, 327.3. Renjini, V.R.; Jha, G.K. Oilseeds sector in India: A trade policy perspective. Indian J. Agric. Sci. 2019, 89, 73–78.4. Jat, R.S.; Singh, V.V.; Sharma, P.; Rai, P.K. Oilseed brassica in India: Demand, supply, policy perspective and future potential. OCL
2019, 26, 8. [CrossRef]5. Singh, L.; Sharma, D.; Parmar, N.; Singh, K.H.; Jain, R.; Rai, P.K.; Wani, S.H.; Thakur, A.K. Genetic Diversity Studies in Indian
Mustard (Brassica juncea L. Czern & Coss) Using Molecular Markers; Brassica Improvement; Springer: Berlin/Heidelberg, Germany,2020; pp. 215–244.
6. Singh, M.; Avtar, R.; Pal, A.; Punia, R.; Singh, V.K.; Bishnoi, M.; Singh, A.; Choudhary, R.R.; Mandhania, S. Genotype-SpecificAntioxidant Responses and Assessment of Resistance against Sclerotinia sclerotiorum Causing Sclerotinia Rot in Indian Mustard.Pathogens 2020, 9, 892. [CrossRef]

Plants 2022, 11, 671 20 of 23
7. Singh, B.K.; Choudhary, S.B.; Yadav, S.; Malhotra, E.V.; Rani, R.; Ambawat, S.; Pandey, A.; Kumar, R.; Kumar, S.; Sharma, H.K.;et al. Genetic structure identification and assessment of interrelationships between Brassica and allied genera using newlydeveloped genic-SSRs of Indian Mustard (Brassica juncea L.). Indian Crops Prod. 2018, 113, 111–120. [CrossRef]
8. Xue, J.Y.; Wang, Y.; Chen, M.; Dong, S.; Shao, Z.Q.; Liu, Y. Maternal inheritance of U’s triangle and evolutionary process of Brassicamitochondrial genomes. Front. Plant Sci. 2020, 11, 805. [CrossRef]
9. Gupta, V.P.; Sekhon, M.S.; Satija, D.R. Studies on genetic diversity, heterosis and combining ability in Indian mustard[Brassica juncea L. (Czern & Coss)]. Indian J. Genet. Plant Breed. 1991, 51, 448–453.
10. Pradhan, A.K.; Sodhi, Y.S.; Mukhopadhyay, A.; Pental, D. Heterosis breeding in Indian mustard (Brassica juncea L. Czern & Coss):Analysis of component characters contributing to heterosis for yield. Euphytica 1993, 69, 219–229.
11. Ghosh, S.K.; Gulati, S.C.; Raman, R. Combining ability and heterosis for seed yield and its components in Indian mustard(Brassica juncea (L.) Czern & Coss). Indian J. Genet. Plant Breed. 2002, 62, 29–33.
12. Ramchiary, N.; Padmaja, K.L.; Sharma, S.; Gupta, V.; Sodhi, Y.S.; Mukhopadhyay, A.; Arumugam, N.; Pental, D.; Pradhan, A.K.Mapping of yield influencing QTL in Brassica juncea: Implications for breeding of a major oilseed crop of dryland areas.Theor. Appl. Genet. 2007, 115, 807–817. [CrossRef]
13. Yadava, S.K.; Arumugam, N.; Mukhopadhyay, A.; Sodhi, Y.S.; Gupta, V.; Pental, D.; Pradhan, A.K. QTL mapping of yield-associated traits in Brassica juncea: Meta-analysis and epistatic interactions using two different crosses between east European andIndian gene pool lines. Theor. Appl. Genet. 2012, 125, 1553–1564. [CrossRef]
14. Kumar, A.; Yadav, N.P.; Kumar, K. Study for restoration ability in cytoplasmic male sterile system in Indian mustard[Brassica juncea (L.) Czern & Coss.]. Electron. J. Plant Breed. 2014, 5, 280–283.
15. Gudi, S.; Atri, C.; Goyal, A.; Kaur, N.; Akhtar, J.; Mittal, M.; Kaur, K.; Kaur, G.; Banga, S.S. Physical mapping of introgressed chro-mosome fragment carrying the fertility restoring (Rfo) gene for Ogura CMS in Brassica juncea L. Czern & Coss. Theor. Appl. Genet.2020, 133, 2949–2959.
16. Kumar, H.; Akhatar, J.; Wani, S.H. Recent Advances in Cytoplasmic Male Sterility (CMS) in Crop Brassicas. In Brassica Improvement;Wani, S., Thakur, A., Jeshima Khan, Y., Eds.; Springer: Cham, Switzerland, 2020; pp. 31–48.
17. Chand, S.; Patidar, O.P.; Chaudhary, R.; Saroj, R.; Chandra, K.; Meena, V.K.; Limbalkar, O.M.; Patel, M.K.; Pardeshi, P.P.; Vasisth, P.Rapeseed-Mustard Breeding in India: Scenario, Achievements and Research Needs. In Brassica Breeding and Biotechnology;IntechOpen: London, UK, 2021.
18. Yadava, D.K.; Vasudev, S.; Singh, N.; Mohapatra, T.; Prabhu, K.V. Breeding major oil crops: Present status and future researchneeds. Technol. Innov. Major World Oil Crops 2012, 1, 17–51.
19. Sodhi, Y.S.; Chandra, A.; Verma, J.K.; Arumugam, N.; Mukhopadhyay, A.; Gupta, V.; Pental, D.; Pradhan, A.K. A new cytoplasmicmale sterility system for hybrid seed production in Indian oilseed mustard Brassica juncea. Theor. Appl. Genet. 2006, 114, 93–99.[CrossRef]
20. Panjabi, P.; Yadava, S.K.; Kumar, N.; Bangkim, R.; Ramchiary, N. Breeding Brassica juncea and B. rapa for sustainable oilseedproduction in the changing climate: Progress and prospects. In Genomic Designing of Climate-Smart Oilseed Crops; Springer:Berlin/Heidelberg, Germany, 2019; pp. 275–369.
21. Sharma, P.; Samkumar, A.; Rao, M.; Singh, V.V.; Prasad, L.; Mishra, D.C.; Bhattacharya, R.; Gupta, N.C. Genetic diversity studiesbased on morphological variability, pathogenicity and molecular phylogeny of the Sclerotinia sclerotiorum population from Indianmustard (Brassica juncea). Front. Microbiol. 2018, 9, 169. [CrossRef]
22. Tiwari, R.; Kaur, J.; Bisht, N.C. Extra-large G-proteins influence plant response to Sclerotinia sclerotiorum by regulating glucosinolatemetabolism in Brassica juncea. Mol. Plant Pathol. 2021, 22, 1180–1194. [CrossRef]
23. Inturrisi, F.C.; Barbetti, M.J.; Tirnaz, S.; Patel, D.A.; Edwards, D.; Batley, J. Molecular characterization of disease resistance inBrassica juncea–The current status and the way forward. Plant Pathol. 2021, 70, 13–34. [CrossRef]
24. Saharan, G.S.; Mehta, N. Sclerotinia Diseases of Crop Plants: Biology, Ecology and Disease Management; Springer Science & BusinessMedia: Berlin/Heidelberg, Germany, 2008.
25. Kamal, M.M.; Savocchia, S.; Lindbeck, K.D.; Ash, G.J. Biology and biocontrol of Sclerotinia sclerotiorum (Lib.) de Bary in oilseedBrassicas. Australas. Plant Pathol. 2016, 45, 1–14. [CrossRef]
26. Li, C.X.; Li, H.; Sivasithamparam, K.; Fu, T.D.; Li, Y.C.; Liu, S.Y.; Barbetti, M.J. Expression of field resistance under WesternAustralian conditions to Sclerotinia sclerotiorum in Chinese and Australian Brassica napus and Brassica juncea germplasm and itsrelation with stem diameter. Aust. J. Agric. Res. 2006, 57, 1131–1135. [CrossRef]
27. Zhao, J.; Meng, J. Genetic analysis of loci associated with partial resistance to Sclerotinia sclerotiorum in rapeseed (Brassica napus L.).Theor. Appl. Genet. 2003, 106, 759–764. [CrossRef]
28. Zhao, J.; Udall, J.A.; Quijada, P.A.; Grau, C.R.; Meng, J.; Osborn, T.C. Quantitative trait loci for resistance to Sclerotinia sclerotiorumand its association with a homeologous non-reciprocal transposition in Brassica napus L. Theor. Appl. Genet. 2006, 112, 509–516.[CrossRef]
29. Kim, H.S.; Diers, B.W. Inheritance of partial resistance to Sclerotinia stem rot in soybean. Crop Sci. 2000, 40, 55–61. [CrossRef]30. Disi, J.O.; Mei, J.; Wei, D.; Ding, Y.; Qian, W. Inheritance of leaf and stem resistance to Sclerotinia sclerotiorum in a cross between
Brassica incana and Brassica oleracea var. alboglabra. J. Agric. Sci. 2014, 152, 146–152. [CrossRef]
Plants 2022, 11, 671 21 of 23
31. Moellers, T.C.; Singh, A.; Zhang, J.; Brungardt, J.; Kabbage, M.; Mueller, D.S.; Grau, C.R.; Ranjan, A.; Smith, D.L.; Chowda-Reddy,R.V.; et al. Main and epistatic loci studies in soybean for Sclerotinia sclerotiorum resistance reveal multiple modes of resistance inmulti-environments. Sci. Rep. 2017, 7, 3554. [CrossRef]
32. Khan, M.A.; Cowling, W.; Banga, S.S.; You, M.P.; Tyagi, V.; Bharti, B.; Barbetti, M.J. Quantitative Inheritance of Sclerotinia StemRot Resistance in Brassica napus and Relationship to Cotyledon and Leaf Resistances. Plant Dis. 2022, 106, 127–136. [CrossRef]
33. Sharma, P.; Singh, S.; Singh, V.V.; Gupta, N.C.; Prasad, L.; Meena, P.D.; Ambawat, S.; Rai, P.K. Identification and characterizationof new resistance sources against Sclerotinia stem rot (Sclerotinia sclerotiorum) in oilseed brassica. Indian J. Mycol. Plant Pathol.2018, 48, 35–44.
34. Gupta, N.C.; Sharma, P.; Rao, M.; Rai, P.K.; Gupta, A.K. Evaluation of non-injury inoculation technique for assessing Sclerotiniastem rot (Sclerotinia sclerotiorum) in oilseed Brassica. J. Microbiol. Methods 2020, 175, 105983. [CrossRef]
35. Singh, M.; Avtar, R.; Singh, V.K.; Mahavir; Kumari, N.; Anu; Rathore, V. Genetic diversity in Indian mustard (Brassica juncea)genotypes for Sclerotinia stem rot (Sclerotinia sclerotiorum) using SSR markers. Indian J. Agric. Sci. 2021, 91, 914–919.
36. Bradshaw, J.E. Quantitative Genetics and Genomic Selection. In Plant Breeding: Past, Present and Future; Springer:Berlin/Heidelberg, Germany, 2016; pp. 161–206.
37. Stuber, C.W. Heterosis in plant breeding. In Plant Breed Reviews; Janick, J., Ed.; John Wiley & Sons, Inc.: New York, NY, USA, 1994;pp. 227–251.
38. Fasahat, P.; Rajabi, A.; Rad, J.M.; Derera, J. Principles and utilization of combining ability in plant breeding. Biom. Biostat. Int. J.2016, 4, 1–24. [CrossRef]
39. Fernie, A.R.; Tadmor, Y.; Zamir, D. Natural genetic variation for improving crop quality. Curr. Opin. Plant Biol. 2006, 9, 196–202.[CrossRef]
40. Johnson, M.T.; Prashad, C.M.; Lavoignat, M.; Saini, H.S. Contrasting the effects of natural selection, genetic drift and gene flow onurban evolution in white clover (Trifolium repens). Proc. R. Soc. B 2018, 285, 20181019. [CrossRef]
41. Hazel, L.N. The genetic basis for constructing selection indexes. Genetics 1943, 28, 476–490. [CrossRef]42. Kingsolver, J.G.; Hoekstra, H.E.; Hoekstra, J.M.; Berrigan, D.; Vignieri, S.N.; Hill, C.E.; Hoang, A.; Gibert, P.; Beerli, P. The strength
of phenotypic selection in natural populations. Am. Nat. 2001, 157, 245–261. [CrossRef]43. Adjah, K.L.; Abe, A.; Adetimirin, V.O.; Asante, M.D. Genetic variability, heritability and correlations for milling and grain
appearance qualities in some accessions of rice (Oryza sativa L.). Physiol. Mol. Biol. Plants 2020, 26, 1309–1317. [CrossRef]44. Immanuel, S.C.; Pothiraj, N.; Thiyagarajan, K.; Bharathi, M.; Rabindran, R. Genetic parameters of variability, correlation and path
coefficient studies for grain yield and other yield attributes among rice blast disease resistant genotypes of rice (Oryza sativa L.).Afr. J. Biotechnol. 2011, 10, 3322–3334. [CrossRef]
45. Aman, J.; Bantte, K.; Alamerew, S.; Sbhatu, D.B. Correlation and path coefficient analysis of yield and yield components of qualityprotein maize (Zea mays L.) hybrids at Jimma, western Ethiopia. Int. J. Agron. 2020, 2020, 9651537. [CrossRef]
46. Fellahi, Z.E.A.; Hannachi, A.; Bouzerzour, H. Analysis of direct and indirect selection and indices in bread wheat(Triticum aestivum L.) segregating progeny. Int. J. Agron. 2018, 2018, 8312857. [CrossRef]
47. Garg, H.; Atri, C.; Sandhu, P.S.; Kaur, B.; Renton, M.; Banga, S.K.; Singh, H.; Singh, C.; Barbetti, M.J.; Banga, S.S. High level ofresistance to Sclerotinia sclerotiorum in introgression lines derived from hybridization between wild crucifers and the crop Brassicaspecies B. napus and B. juncea. Field Crops Res. 2010, 117, 51–58. [CrossRef]
48. Ooi, K.H. Pencirian dan Pengawalankimia Fusarium oxysporum, Penyebabpenyakitlayu Vascular Pada Rosel. Ph.D. Thesis,University Sains Malaysia, Penang, Malaysia, 2002; p. 355.
49. Kempthorne, O. An Introduction to Genetic Statistics; John Wiley and Sons: New York, NY, USA, 1957.50. Singh, R.K.; Chaudhary, B.D. Line × Tester analysis. In Biometrical Methods in Quantitative Genetic Analysis; Kalyani Publishers:
New Delhi, India, 1985; pp. 215–223.51. Johnson, H.W.; Robinson, H.F.; Comstock, R.E. Genotypic and phenotypic correlations in soybeans and their implications in
selection. Agron. J. 1955, 47, 477–483. [CrossRef]52. Dewey, D.R.; Lu, K. A Correlation and Path-Coefficient Analysis of Components of Crested Wheatgrass Seed Production 1.
Agron. J. 1959, 51, 515–518. [CrossRef]53. Kaur, G.; Kaur, M.; Kumar, R. Line × Tester analysis for quantitative traits in Indian mustard (Brassica juncea L.). J. Oilseed Brassica
2020, 11, 77–87.54. Meena, H.S.; Kumar, A.; Ram, B.; Singh, V.V.; Meena, P.D.; Singh, B.K.; Singh, D. Combining ability and heterosis for seed yield
and its components in Indian mustard (Brassica juncea L.). J. Agric. Sci. Technol. 2015, 17, 1861–1871.55. Meena, R.L.; Chauhan, J.S.; Singh, K.H.; Rathore, S.S. Genetic Variability and Correlation Analysis in Indian Mustard
[Brassica juncea (L.) Czern & Coss.] under Drought Stress. Indian J. Plant Genet. Resour. 2015, 28, 329–334.56. Meena, C.P.; Chauhan, J.S.; Singh, M.; Singh, K.H.; Rathore, S.S.; Meena, M.L. Genetic parameters and correlations for seed yield
and morphological characters in Indian mustard [Brassica juncea (L.) Czern and Coss.]. J. Oilseeds Res. 2014, 31, 114–117.57. Vaghela, P.O.; Thakkar, D.A.; Bhadauria, H.S.; Sutariya, D.A.; Parmar, S.K.; Prajapati, D.V. Heterosis and combining ability for
yield and its component traits in Indian mustard (Brassica juncea L.). J. Oilseed Brassica 2011, 2, 39–43.58. Chaudhary, S.P.S.; Sharma, S.N.; Singh, A.K. Line × tester analysis in Indian mustard [Brassica juncea (L.) Czern & Coss.]. Indian J.
Genet. Plant Breed. 1997, 57, 168–173.
Plants 2022, 11, 671 22 of 23
59. Godoy, M.; Castano, F.; Re, J.; Rodríguez, R. Sclerotinia resistance in sunflower. II. Combining ability and midparent heterosis forreaction to ascospore infections at flowering. Euphytica 2012, 188, 299–307. [CrossRef]
60. Castano, F.; Baldini, M.; Re, J.; Vannozzi, G.P.; Rodriguez, R.; Turi, M.; Tahmasebi-Enferadi, S. Genotypic responses and diallelanalysis for an early resistance test to Sclerotinia sclerotiorum in sunflower. OCL 2002, 9, 474–478. [CrossRef]
61. Achbani, E.H.; de Tourvieille, L.D.; Vear, F. Resistance of sunflower (Helianthus annuus L.) to terminal bud attack by Sclerotiniasclerotiorum (Lib.) de Bary. Eur. J. Plant Pathol. 1996, 102, 421–429. [CrossRef]
62. Grezes-Besset, B.; Tournade, G.; Arnauld, O.; Urs, R.; George, P.; Castellanet, P.; Toppan, A. A greenhouse method to assesssunflower resistance to Sclerotinia root and basal stem infections. Plant Breed. 1994, 112, 215–222. [CrossRef]
63. Ferreira, L.U.; Melo, P.G.S.; Vieira, R.F.; Lobo Junior, M.; Pereira, H.S.; Melo, L.C.; Souza, T.L.P.O. Combining ability as a strategyfor selecting common bean parents and populations resistant to white mold. Crop Breed. Appl. Biotechnol. 2018, 18, 276–283.[CrossRef]
64. Labroo, M.R.; Studer, A.J.; Rutkoski, J.E. Heterosis and hybrid crop breeding: A multidisciplinary review. Front. Genet. 2021, 12, 234.[CrossRef] [PubMed]
65. Akabari, V.R.; Sasidharan, N. Evaluation of the heterotic potential for seed yield and its attributing traits in Indian mustard(Brassica juncea L.). J. Oilseed Brassica 2016, 7, 180–185.
66. Van Becelaere, G.; Miller, J.F. Combining ability for resistance to Sclerotinia head rot in sunflower. Crop Sci. 2004, 44, 1542–1545.[CrossRef]
67. Ross, W.M.; Gorz, H.J.; Haskins, F.A.; Hookstra, G.H.; Rutto, J.K.; Ritter, R. Combining Ability Effects for Forage Residue Traits inGrain Sorghum Hybrids. Crop Sci. 1983, 23, 97–101. [CrossRef]
68. Satyanarayana, P.V. Studies on combining ability and heterosis in rice. Int. Rice Res. Notes 1998, 23, 10.69. Gupta, P.; Chaudhary, H.B.; Lal, S.K. Heterosis and combining ability analysis for yield and its components in Indian mustard
(Brassica juncea L. Czern & Coss). Front. Agric. China 2010, 4, 299–307.70. Dahiya, N.; Bhajan, R.; Rashmi; Pant, U. Heterosis and combining ability for different traits in local germplasm and varietal
crosses in Brassica juncea L. Int. J. Chem. Stud. 2018, 6, 1884–1887.71. Pawar, P.D.; Nair, B.; Charjan, S.U.; Manojkumar, D. Evaluation of induced genetic variability, heritability and genetic advance in
Indian mustard (Brassica juncea L.). J. Soils Crops 2018, 28, 115–120.72. Rout, S.; Kerkhi, S.A.; Gupta, A. Estimation of genetic variability, heritability and genetic advance in relation to seed yield and its
attributing traits in Indian mustard. J. Pharmacogn. Phytochem. 2019, 8, 4119–4123.73. Pal, S.; Dubey, N.; Avinashe, H.; Khan, S.; Reddy, P.J. Estimation of genetic variability, correlation and path analysis for yield and
yield contributing characters in Indian mustard (Brassica juncea L.). J. Pharmacogn. Phytochem. 2019, 4, 102–105.74. Tripathi, N.; Kumar, K.; Tiwari, R.; Verma, O.P. Assessing genetic variability in Indian mustard (Brassica juncea L. Czern and
Coss.) for seed yield and it’s contributing attributes under normal and saline/alkaline condition. J. Pharmacogn. Phytochem. 2019,8, 1322–1324.
75. Kumar, R.; Kaur, S.; Bala, K.; Kaur, S.; Sharma, L. Assessment of genetic variability, correlation and path analysis for yield traits inF1 hybrids of Indian mustard (Brassica juncea L.). Agriways 2019, 7, 1–7.
76. Manjeet; Verma, P.K.; Sheoran, R.K.; Nain, M.; Avtar, R. Evaluation of sesame (Sesamum indicum L.) genotypes for geneticvariability based on different traits under rainfed conditions. Electron. J. Plant Breed. 2020, 11, 54–59.
77. Singh, B.D. Plant Breeding: Principles and Methods; Kalyani Publishers: New Delhi, India, 2001; p. 506.78. Tiwari, A.K.; Singh, S.K.; Tomar, A.; Singh, M. Heritability, genetic advance and correlation coefficient analysis in Indian mustard
(Brassica Juncea (L.) Czern & Coss). J. Pharmacogn. Phytochem. 2017, 6, 356–359.79. Singh, J.P.C.M.; Tomar, P. Genetic variability, heritability, genetic advance and character association of Indian mustard
(Brassica juncea L.). J. Oilseed Brassica 2019, 10, 80–86.80. Ray, J.; Singh, O.P.; Pathak, V.N.; Verma, S.P. Assessment of genetic variability, heritability, genetic advance and selection indices
for yield contributing traits in Indian mustard [Brassica juncea]. IJCS 2019, 7, 1096–1099.81. Yadav, R.K.; Yadav, R.G. Genetic variability and path coefficient analysis for seed yield and its related attributes in indian mustard
(Brassica juncea L. czern and coss.) under late sown condition. Progress. Agric. 2020, 20, 117–122. [CrossRef]82. Patel, P.B.; Patel, P.J.; Patel, J.R.; Patel, P.C. Elucidation of genetic variability and inter-relationship studies for seed yield and
quality traits in Indian mustard [Brassica juncea (L.) Czern and Coss]. Electron. J. Plant Breed. 2021, 12, 589–596.83. Saroj, R.; Soumya, S.L.; Singh, S.; Sankar, S.M.; Chaudhary, R. Unraveling the Relationship Between Seed Yield and Yield-Related
Traits in a Diversity Panel of Brassica juncea Using Multi-Traits Mixed Model. Front. Plant Sci. 2021, 12, 651936. [CrossRef]84. Derbyshire, M.C.; Khentry, Y.; Severn-Ellis, A.; Mwape, V.; Saad, N.S.M.; Newman, T.E.; Taiwo, A.; Regmi, R.; Buchwaldt, L.;
Denton-Giles, M.; et al. Modeling first order additive × additive epistasis improves accuracy of genomic prediction for Sclerotiniastem rot resistance in canola. Plant Genome 2021, 14, e20088. [CrossRef] [PubMed]
85. Roy, J.; Shaikh, T.M.; Luis, E.; Hosain, S.; Chapara, V.; Rahman, M. Genome-Wide Association Mapping and Genomic Predictionfor Adult Stage Sclerotinia Stem Rot Resistance in Brassica Napus (L) Under Field Environments. Sci. Rep. 2021, 11, 21773.[CrossRef] [PubMed]
86. Johnson, H.W.; Robinson, H.F.; Comstock, R.E. Estimation of genetic and environmental variability in soybean. Agron. J. 1955,47, 314–318. [CrossRef]
Plants 2022, 11, 671 23 of 23
87. Mengistu, G.; Shimelis, H.; Laing, M.; Lule, D.; Mathew, I. Genetic variability among Ethiopian sorghum landrace accessions formajor agro-morphological traits and anthracnose resistance. Euphytica 2020, 216, 1–15. [CrossRef]
88. Taneva, K.; Bozhanova, V.; Petrova, I. Variability, heritability and genetic advance of some grain quality traits and grain yield indurum wheat genotypes. Bulg. J. Agric. Sci. 2019, 25, 288–295.
89. Chaturvedi, V.D.; Maurya, K.N.; Upadhyay, D.K.; Singh, P.K.; Chaubey, S. Genetic diversity for yield and its contributingcomponents in Indian mustard [Brassica juncea (L.) Czern & Coss.]. J. Pharm. Innov. 2021, 10, 748–754.
90. Nanjundan, J.; Aravind, J.; Radhamani, J.; Singh, K.H.; Kumar, A.; Thakur, A.K.; Singh, K.; Meena, K.N.; Tyagi, R.K.; Singh, D.Development of Indian mustard [Brassica juncea (L.) Czern.] core collection based on agro-morphological traits. Genet. Resour.Crop Evol. 2022, 69, 145–162. [CrossRef]
91. Devi, B. Correlation and Path analysis in Indian mustard (Brassica juncea L.) in agro-climatic condition of Jhasi (UP). J. Pharmacogn.Phytochem. 2018, 7, 1678–1681.
92. Roy, R.K.; Kumar, A.; Kumar, S.; Kumar, A.; Kumar, R.R. Correlation and Path Analysis in Indian Mustard (Brassica juncea L.Czern and Coss) under Late Sown Condition. Environ. Ecol. 2018, 36, 247–254.
93. Gupta, A.; Pant, N.C.; Dwivedi, U.; Tiwari, S.; Pandey, C.S.; Dhoundiyal, R.; Maurya, K.N.; Verma, O.P. Studies on correlation andpath coefficient analysis for yield and yield related traits in Indian mustard (Brassica juncea L. Czern & Coss.) under timely andlate sown conditions. J. Pharmacogn. Phytochem. 2018, 7, 2545–2551.
94. Ompal, S.A.; Chand, P.; Singh, S.K.; Yadav, M.K. Study of correlation and path coefficient analysis in Indian mustard(Brassica juncea L. Czern & Coss). J. Pharmacogn. Phytochem. 2018, 7, 890–894.
95. Lodhi, B.; Avtar, N.T.R.; Singh, A. Genetic variability, association and path analysis in Indian mustard (Brassica juncea). J. OilseedBrassica 2016, 1, 26–31.
96. Pandey, S.K.; Srivastava, K.K.; Negi, S.; Khan, N.A.; Singh, R.K. Variability, trait relationship and path analysis for seed yield andseed quality parameters in Indian mustard (Brassica juncea L.). J. Oilseed Brassica 2020, 11, 69–76.
Related Documents