General Relativistic Orbital Decay in a 7 Minute Orbital Period Eclipsing Binary System Kevin B. Burdge 1* , Michael W. Coughlin 1 , Jim Fuller 1 , Thomas Kupfer 2 , Eric C. Bellm 3 , Lars Bildsten 2,4 , Matthew J. Graham 1 , David L. Kaplan 5 , Jan van Roestel 1 , Richard G. Dekany 6 , Dmitry A. Duev 1 , Michael Feeney 6 , Matteo Giomi 7 , George Helou 8 , Stephen Kaye 6 , Russ R. Laher 8 , Ashish A. Mahabal 1 , Frank J. Masci 8 , Reed Riddle 6 , David L. Shupe 8 , Maayane T. Soumagnac 9 , Roger M. Smith 6 , Paula Szkody 3 , Richard Walters 6 & S. R. Kulkarni 1 , Thomas A. Prince 1 1 Division of Physics, Mathematics and Astronomy, California Institute of Technology, Pasadena, CA, USA 2 Kavli Institute for Theoretical Physics, University of California Santa-Barbara, Santa Barbara, CA, USA 3 Department of Astronomy, University of Washington, Seattle, WA, USA 4 Department of Physics, University of California, Santa Barbara, CA, USA 5 Department of Physics, University of Wisconsin-Milwaukee, Milwaukee, WI, USA 6 Caltech Optical Observatories, California Institute of Technology, Pasadena, CA, USA 7 Humboldt-Universit¨ at zu Berlin, Berlin, Germany 8 IPAC, California Institute of Technology, Pasadena, CA, USA 9 Benoziyo Center for Astrophysics, Weizmann Institute of Science, Rehovot, Israel General relativity 1 predicts that short orbital period binaries emit significant gravitational radiation, and the upcoming Laser Interferometer Space Antenna (LISA) 2 is expected to 1 arXiv:1907.11291v1 [astro-ph.SR] 25 Jul 2019

Welcome message from author
This document is posted to help you gain knowledge. Please leave a comment to let me know what you think about it! Share it to your friends and learn new things together.
Transcript
General Relativistic Orbital Decay in a 7 Minute OrbitalPeriod Eclipsing Binary System
Kevin B. Burdge1∗, Michael W. Coughlin1, Jim Fuller1, Thomas Kupfer2, Eric C. Bellm3, Lars
Bildsten2,4, Matthew J. Graham1, David L. Kaplan5, Jan van Roestel1, Richard G. Dekany6, Dmitry
A. Duev1, Michael Feeney6, Matteo Giomi7, George Helou8, Stephen Kaye6, Russ R. Laher8,
Ashish A. Mahabal1, Frank J. Masci8, Reed Riddle6, David L. Shupe8, Maayane T. Soumagnac9,
Roger M. Smith6, Paula Szkody3, Richard Walters6 & S. R. Kulkarni1, Thomas A. Prince1
1Division of Physics, Mathematics and Astronomy, California Institute of Technology, Pasadena,
CA, USA
2Kavli Institute for Theoretical Physics, University of California Santa-Barbara, Santa Barbara,
CA, USA
3Department of Astronomy, University of Washington, Seattle, WA, USA
4Department of Physics, University of California, Santa Barbara, CA, USA
5Department of Physics, University of Wisconsin-Milwaukee, Milwaukee, WI, USA
6Caltech Optical Observatories, California Institute of Technology, Pasadena, CA, USA
7Humboldt-Universitat zu Berlin, Berlin, Germany
8IPAC, California Institute of Technology, Pasadena, CA, USA
9Benoziyo Center for Astrophysics, Weizmann Institute of Science, Rehovot, Israel
General relativity1 predicts that short orbital period binaries emit significant gravitational
radiation, and the upcoming Laser Interferometer Space Antenna (LISA)2 is expected to
1
arX
iv:1
907.
1129
1v1
[as
tro-
ph.S
R]
25
Jul 2
019

detect tens of thousands of such systems3; however, few have been identified4, and only one is
eclipsing–the double white dwarf binary SDSS J065133.338+284423.375, which has an orbital
period of 12.75 minutes. Here, we report the discovery of an eclipsing double white dwarf
binary system with an orbital period of only 6.91 minutes, ZTF J153932.16+502738.8. This
system has an orbital period close to half that of SDSS J065133.338+284423.37, and an orbit
so compact that the entire binary could fit within the diameter of the planet Saturn. The
system exhibits a deep eclipse, and a double-lined spectroscopic nature. We observe rapid
orbital decay, consistent with that expected from general relativity. ZTF J153932.16+502738.8
is a significant source of gravitational radiation close to the peak of LISA’s sensitivity2, and
should be detected within the first week of LISA observations.
The Zwicky Transient Facility (ZTF)6,7 is a northern-sky synoptic survey using the 48-inch
Samuel Oschin Telescope at Palomar Observatory. In June 2018, we undertook an initial search for
periodic sources among all of the 20 million ZTF lightcurves available at that time. The analysis
identified ZTF J153932.16+502738.8 (henceforth referred to as ZTF J1539+5027), as a candidate
binary system with a short orbital period. On the same night as identifying the candidate, an
observation with the Kitt Peak 84-Inch Electron Multiplying Demonstrator (KPED)8 confirmed
the discovery, and revealed a remarkably deep eclipse occurring precisely every 6.91 minutes.
Next, we used the high-speed imaging photometer CHIMERA9 on the 200-inch Hale telescope at
Palomar Observatory to observe the system (Figure 1), confirming the deep primary eclipse, and
revealing a shallow secondary eclipse.
2

-1 -0.5 0 0.5 1
Orbital Phase
0
0.2
0.4
0.6
0.8
1
Norm
aliz
ed F
lux
-1 -0.5 0 0.5 1
Orbital Phase
19.5
20
20.5
21
21.5
Appare
nt M
agnitude (
g)
-1 -0.5 0 0.5 1
Orbital Phase
0
0.5
1
Norm
aliz
ed F
lux
c)
a) b)
Figure 1: Lightcurve of ZTF J1539+5027 a) The binned CHIMERA g′ lightcurve of ZTF
J1539+5027, phase-folded on the 6.91 minute orbital period. At phase 0, the lightcurve exhibits
a deep primary eclipse, indicating that the hot primary star is producing most of the observed
light. Outside of eclipse, there is a quasi-sinusoidal modulation because the primary star heavily
irradiates one side of its companion. At phases ±0.5, the secondary eclipse occurs as the hot
primary transits the irradiated face of its companion. b) The phase-folded ZTF g-band lightcurve
of the object. We were able to discover the object because of its periodic behavior. c) A binned g′
lightcurve obtained with KPED, phase-folded on the orbital period. Error bars are 1σ intervals.
3

The short orbital period means that the two components must be dense objects–white dwarfs.
Because the primary eclipse is significantly deeper than the secondary eclipse, we can infer that
one white dwarf (the primary) is hotter and more luminous than its companion (the secondary),
as the detected flux is almost completely attenuated when the cooler object occults the hotter. By
modelling the lightcurve (Methods), we can estimate the orbital inclination, i, the radius of the
primary, R1, and the secondary, R2, relative to the semi-major axis of the orbit, a (Methods).
Because of ZTF J1539+5027’s extremely short orbital period, general relativity predicts that
it will undergo rapid orbital decay due to the emission of gravitational radiation10. With CHIMERA
and KPED, we can precisely measure the time of eclipse, and use these eclipse times to measure a
changing orbital period. If a system has a constant orbital period derivative, we expect the deviation
of eclipse times, ∆teclipse, (compared to those of a system with constant orbital period) to grow
quadratically in time. Equation 1
∆teclipse(t− t0) =(1
2f(t0)(t− t0)2 +
1
6f(t0)(t− t0)3 + ...
)P (t0) (1)
illustrates this, where t0 is the reference epoch, P (t0) is the orbital period at the reference epoch,
f(t0), f(t0), etc, are the orbital frequency and its time derivatives at the reference epoch, and t− t0
is the time since the reference epoch.
We also used IRSA/IPAC11 to retrieve photometry from archival Palomar Transient Factory
(PTF/iPTF) data12 spanning 2009, 2010, 2011, and 2016. Figure 2 shows a fit of all of the timing
epochs with a second order polynomial, which resulted in a highly significant detection of the
orbital decay, corresponding to an orbital period derivative of P = (−2.373± 0.005)× 10−11s s−1
4
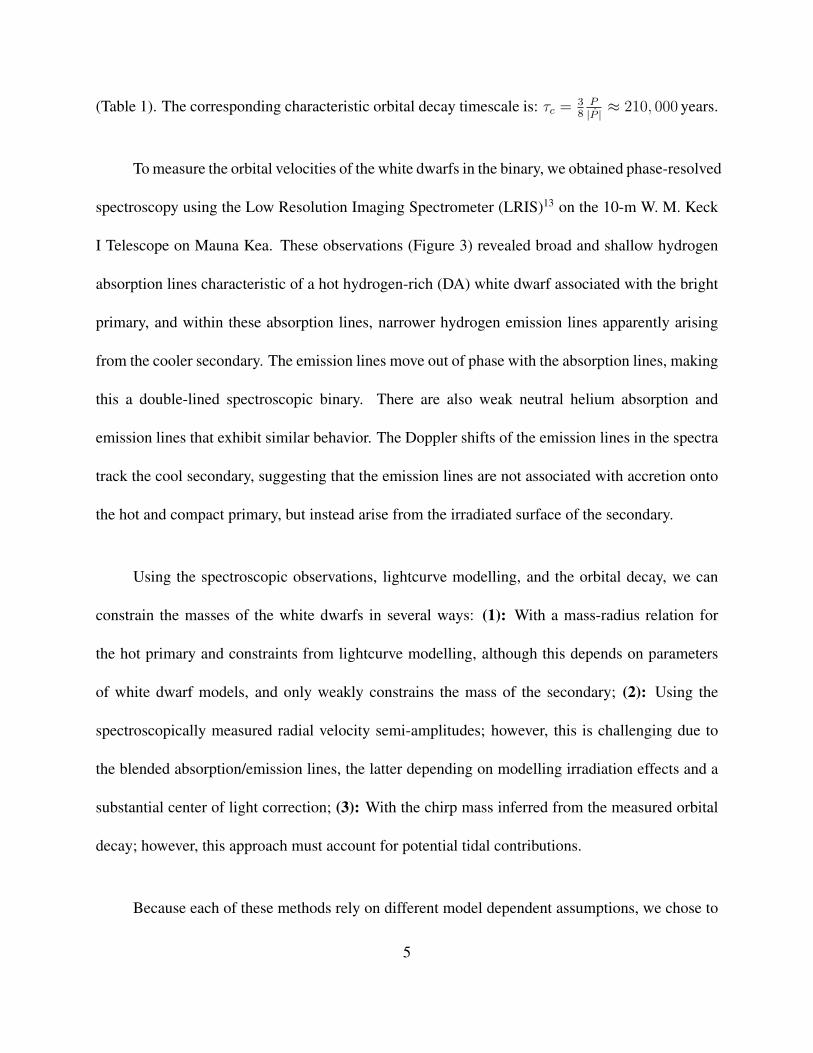
(Table 1). The corresponding characteristic orbital decay timescale is: τc = 38
P|P | ≈ 210, 000 years.
To measure the orbital velocities of the white dwarfs in the binary, we obtained phase-resolved
spectroscopy using the Low Resolution Imaging Spectrometer (LRIS)13 on the 10-m W. M. Keck
I Telescope on Mauna Kea. These observations (Figure 3) revealed broad and shallow hydrogen
absorption lines characteristic of a hot hydrogen-rich (DA) white dwarf associated with the bright
primary, and within these absorption lines, narrower hydrogen emission lines apparently arising
from the cooler secondary. The emission lines move out of phase with the absorption lines, making
this a double-lined spectroscopic binary. There are also weak neutral helium absorption and
emission lines that exhibit similar behavior. The Doppler shifts of the emission lines in the spectra
track the cool secondary, suggesting that the emission lines are not associated with accretion onto
the hot and compact primary, but instead arise from the irradiated surface of the secondary.
Using the spectroscopic observations, lightcurve modelling, and the orbital decay, we can
constrain the masses of the white dwarfs in several ways: (1): With a mass-radius relation for
the hot primary and constraints from lightcurve modelling, although this depends on parameters
of white dwarf models, and only weakly constrains the mass of the secondary; (2): Using the
spectroscopically measured radial velocity semi-amplitudes; however, this is challenging due to
the blended absorption/emission lines, the latter depending on modelling irradiation effects and a
substantial center of light correction; (3): With the chirp mass inferred from the measured orbital
decay; however, this approach must account for potential tidal contributions.
Because each of these methods rely on different model dependent assumptions, we chose to
5

10-3
10-2
Gravitational Wave Frequency (Hz)
10-21
10-20
10-19
Gra
vitational W
ave C
hara
cte
ristic S
train
0 1 2 3 4 5 6 7
Epoch (Hundreds of Thousands of Orbits) 105
-10
-5
0
5
Resid
uals
(s)
6.8 7 7.2 7.4
105
-1
0
1
2009 2011 2013 2015 2017 2019Year
-2500
-2000
-1500
-1000
-500
0
Eclip
se A
rriv
al T
ime D
evia
tion (
s)
-6
-5
-4
-3
-2
-1
0
Orb
ital P
hase S
hift
t/P
SDSS J0651+2844 (12.8 min)
V407 Vul (9.5 min)
HM Cnc (5.4 min)
b)a)
ZTF J1539+5027(6.9 min)
Figure 2: Orbital decay and gravitational wave strain of ZTF J1539+5027 a) A 2nd order
polynomial fit to the deviation of the measured eclipse times as a function of time, compared to a
system with constant orbital period. The consistency with a quadratic deviation demonstrates that
the orbital period decreases with time. The orbital decay inferred is consistent with that expected
from gravitational wave emission. The initial four timing epochs come from PTF/iPTF photometry,
and the remainder were obtained with CHIMERA and KPED. b) The characteristic gravitational
wave strain and frequency for ZTF J1539+5027 (red star in the plot). See Table 1 for masses
and the distance. The black diamonds are other known LISA sources, all of which are compact
binaries4. The smooth black curve is the expected sensitivity threshold of LISA after 4 years of
integration2. For HM Cancri (right-most point) we have assumed a uniform prior in distance from
4.2-20 kpc20,29. Error bars on panel a) are 1σ. Errors on panel b) are taken from4 for all points
except ZTF J1539 and HM Cnc, which are 68% CIs.
6

4250 4300 4350 4400 4450Wavelength (Å)
3
3.5
4
4.5
5
Rel
ativ
e F
lux
4250 4300 4350 4400 4450Wavelength (Å)
4
4.5
5
5.5
Rel
ativ
e F
lux
3400 3600 3800 4000 4200 4400 4600 4800 5000Wavelength (Å)
0.2
0.4
0.6
0.8
1
1.2
Nor
mal
ized
Flu
x
Redshifted Absorption Line of Primary
Blueshifted Absorption Line of Primary
a) b)
c)
Redshifted Emission Line of Secondary
Blueshifted Emission Line of Secondary
Figure 3: Optical spectrum of ZTF J1539+5027 a) The LRIS spectrum of ZTF J1539+5027
immediately after the primary eclipse. This is an ideal phase to isolate the photosphere of the
hot primary, because it minimizes flux contributed by the irradiated face of the secondary. The
smooth blue line is a fit of a white dwarf atmospheric model to this spectrum, yielding an effective
photospheric temperature of Teff,1 = 48, 900± 900K and a logarithm of surface gravity log(g)1 =
7.75± 0.06 log(cm s−2) for the hot primary. b) and c) Two phase resolved spectra of the hydrogen
n = 5 to n = 2 transition at ≈ 4340 A. The smooth red line is a double gaussian fit to the
absorption and emission line used to measure the Doppler shifts of these features b) illustrates
a phase in which the emission line associated with the cooler secondary is redshifted, while the
absorption line associated with the primary is blueshifted. c) exhibits the opposing phase.
7
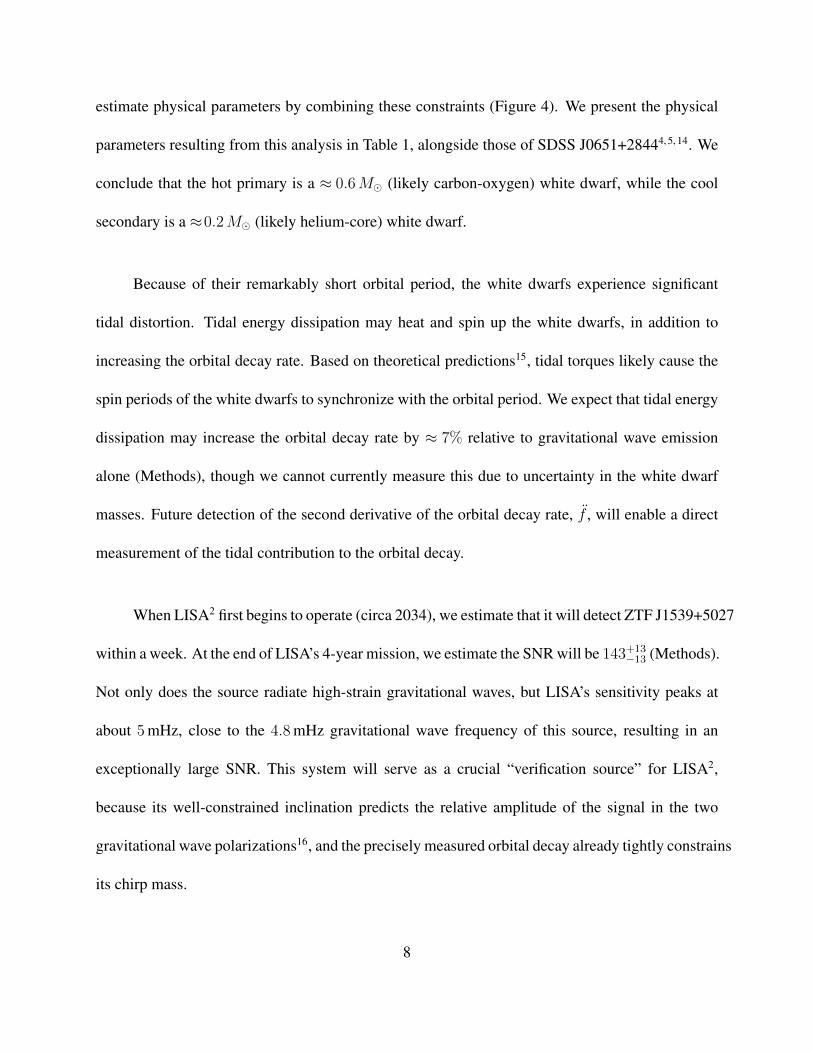
estimate physical parameters by combining these constraints (Figure 4). We present the physical
parameters resulting from this analysis in Table 1, alongside those of SDSS J0651+28444, 5, 14. We
conclude that the hot primary is a ≈ 0.6M� (likely carbon-oxygen) white dwarf, while the cool
secondary is a ≈0.2M� (likely helium-core) white dwarf.
Because of their remarkably short orbital period, the white dwarfs experience significant
tidal distortion. Tidal energy dissipation may heat and spin up the white dwarfs, in addition to
increasing the orbital decay rate. Based on theoretical predictions15, tidal torques likely cause the
spin periods of the white dwarfs to synchronize with the orbital period. We expect that tidal energy
dissipation may increase the orbital decay rate by ≈ 7% relative to gravitational wave emission
alone (Methods), though we cannot currently measure this due to uncertainty in the white dwarf
masses. Future detection of the second derivative of the orbital decay rate, f , will enable a direct
measurement of the tidal contribution to the orbital decay.
When LISA2 first begins to operate (circa 2034), we estimate that it will detect ZTF J1539+5027
within a week. At the end of LISA’s 4-year mission, we estimate the SNR will be 143+13−13 (Methods).
Not only does the source radiate high-strain gravitational waves, but LISA’s sensitivity peaks at
about 5 mHz, close to the 4.8 mHz gravitational wave frequency of this source, resulting in an
exceptionally large SNR. This system will serve as a crucial “verification source” for LISA2,
because its well-constrained inclination predicts the relative amplitude of the signal in the two
gravitational wave polarizations16, and the precisely measured orbital decay already tightly constrains
its chirp mass.
8
0.3 0.4 0.5 0.6 0.7 0.8 0.9 1.0 1.1 1.2M1 (M¯)
0.1
0.2
0.3
0.4
0.5
0.6
0.7
0.8
M2(
M¯
)
Figure 4: Constraints on component masses in ZTFJ1539+5027 A graphical representation
of the analysis used to derive final values for the masses of the two white dwarfs, with an
inset illustrating the two components of the binary drawn to scale based on these parameters
together with Roche potentials. The background white bins represent the constraint imposed by
the measured spectroscopic radial velocity semi-amplitudes. The red line is a 50% contour level
of the constraint inferred from applying a mass-radius relation to the hot primary white dwarf30,
and combining it with the ratio of the primary’s radius to the semi-major axis, R1
a, inferred from
lightcurve modelling. The magenta dashed lines are constraints imposed by the measured chirp
mass; the upper dashed line assumes orbital decay purely due to general relativity, whereas the
lower dashed line includes a 10 percent tidal contribution. The blue line is a 50% contour level
representing a combination of all of these constraints (Table 1).
9

ZTF J1539+5027 poses challenges for models of binary evolution and the physics of accretion.
The spectroscopically measured temperature of the hot primary is Teff,1 = 48, 900 ± 900 K. The
cooling age of such a hot white dwarf is≈ 2.5 million years17, significantly shorter than the > 200
million year cooling age of the secondary18. Thus, some recent heating must have occurred. Tidal
heating could increase the surface temperature of the primary to nearly 50, 000 K, though more
realistic calculations (Methods) suggest temperatures closer to half this value. A more plausible
explanation is that the heating is due to recent accretion, especially since the radius of the secondary
indicates it is on the brink of Roche lobe overflow. Such accretion could heat the primary to its
observed temperature for accretion rates of M & 10−9M� yr−1 (Methods).
However, we see no evidence for active accretion. The only other known binary systems
with orbital periods shorter than 10 minutes, V407 Vul (P ≈ 9.5 minutes)19 and HM Cancri
(P ≈ 5.4 minutes)20, were discovered because of periodic X-ray emission, thought to arise from
a hot spot formed by direct impact accretion21. Unlike the other two sub-10-minute binaries, ZTF
J1539+5027 exhibits no detectable X-ray flux. Based on an upper limits from observations by
the XRT X-ray telescope on the Neil Gehrels Swift Observatory22, the EPIC-pn instrument on
the XMM Newton Observatory23, and optical constraints, we have estimated an upper limit of
M < 2 × 10⁻⁸M� yr−1, contributing 10% of its energy to a hot spot. Reaching this upper limit
requires fine-tuning the accretion hot spot temperature (Methods). Active accretion could still be
occurring if the accretion energy is channeled primarily into heating the optically thick atmosphere
of the accretor, and is then radiated at the 50, 000 K observed.
10

It is also possible that the accretion proceeds intermittently. One way of temporarily halting
accretion could be a recent nova eruption on the surface of the primary. We expect that a 0.6M�
white dwarf accreting from a companion at a rate of M ∼ 10−9M� yr−1 should experience24
recurrent novae on timescales of ∼ 105 yr. However, while mass transfer may temporarily cease
after each nova, calculations suggest that it is unlikely to catch the system in this short-lived phase
(Methods). We conclude that the most likely scenarios are intermittent accretion with a mechanism
allowing for phases of little-to-no mass transfer, or active accretion in which the accretion energy
is radiated almost entirely in the ultraviolet and optical.
The orbit of ZTF J1539+5027 will continue to decay for ≈ 130, 000 years until it reaches
a period of ≈5 minutes at which point the degenerate core of the secondary will begin to expand
in response to mass loss, dramatically increasing the rate of mass transfer25. If the mass transfer
is stable, which is likely based on the mass ratio26 of q ∼ 1/3, the binary will evolve into an AM
CVn system and the orbital period will increase. Alternatively, unstable mass transfer would result
in a merger that could produce an R Cor Bor star27, or, less likely, a detonation of accreted helium
on the primary could lead to a double-detonation that disrupts the primary28.
11

Table 1: Table of Parameters
ZTF J1539+5027 SDSS J0651+2844
M1 0.610+0.017−0.022M� 0.49+0.02
−0.02 M�
M2 0.210+0.014−0.015M� 0.247+0.015
−0.015M�
R1 1.562+0.038−0.038 × 10⁻² R� 1.42+0.1
−0.1 × 10⁻²R�
R2 3.140+0.054−0.052 × 10⁻² R� 3.71+0.12
−0.12 × 10⁻² R�
a 11.218+0.080−0.082 × 10⁻² R� 16.48+0.39
−0.43 × 10⁻² R�
i 84.15+0.64−0.57 degrees 86.9+1.6
−1.0 degrees
T0 2458305.6827886± 0.0000012 BJDTDB 2455652.5980910± 0.0000084 BJDTDB
P 414.7915404± 0.0000029 s 765.206543± 0.000055 s
P (−2.373± 0.005)× 10−11 s s−1 (−0.98± 0.28)× 10−11 s s−1
d 2.34± 0.14 kpc (spec.) 1.0± 0.1 kpc (spec.) 0.9± 0.5 kpc (parallax)
Teff,1 48, 900± 900 K 8, 700± 500 K
Teff,2 < 10, 000 K 16, 530± 200 K
log(g)1 7.75± 0.06 log(cm s−2)
log(g)2 6.76± 0.04 log(cm s−2)
K1 292+254−283 km s−1
K2 961+178−139 km s−1 616.9+5.0
−5.0 km s−1
4 Yr LISA SNR 143+14−13 94+12
−10 (using spec. distance)
References 4,5,14
12
1. Einstein, A. Naherungsweise Integration der Feldgleichungen der Gravitation.
Sitzungsberichte der Koniglich Preußischen Akademie der Wissenschaften (Berlin), Seite
688-696. (1916).
2. Amaro-Seoane, P. et al. Laser interferometer space antenna. arXiv preprint arXiv:1702.00786
(2017).
3. Nissanke, S., Vallisneri, M., Nelemans, G. & Prince, T. A. Gravitational-wave emission from
compact galactic binaries. The Astrophysical Journal 758, 131 (2012).
4. Kupfer, T. et al. LISA verification binaries with updated distances from Gaia data release 2.
Monthly Notices of the Royal Astronomical Society 480, 302–309 (2018).
5. Brown, W. R. et al. A 12-minute orbital period detached white dwarf eclipsing binary. The
Astrophysical Journal Letters 737, L23 (2011).
6. Bellm, E. C. et al. The Zwicky Transient Facility: System overview, performance, and first
results. Publications of the Astronomical Society of the Pacific 131, 018002 (2018).
7. Graham, M. J. et al. The Zwicky Transient Facility: Science objectives. arXiv preprint
arXiv:1902.01945 (2019).
8. Coughlin, M. W. et al. The Kitt Peak Electron Multiplying CCD demonstrator. Monthly
Notices of the Royal Astronomical Society 485, 1412–1419 (2019).
13

9. Harding, L. K. et al. CHIMERA: a wide-field, multi-colour, high-speed photometer at the
prime focus of the Hale telescope. Monthly Notices of the Royal Astronomical Society 457,
3036–3049 (2016).
10. Taylor, J. H., Fowler, L. & McCulloch, P. Measurements of general relativistic effects in the
binary pulsar PSR1913+ 16. Nature 277, 437 (1979).
11. Masci, F. J. et al. The IPAC image subtraction and discovery pipeline for the Intermediate
Palomar Transient Factory. Publications of the Astronomical Society of the Pacific 129, 014002
(2016).
12. Law, N. M. et al. The Palomar Transient Factory: System overview, performance, and first
results. Publications of the Astronomical Society of the Pacific 121, 1395 (2009).
13. McCarthy, J. K. et al. Blue channel of the Keck low-resolution imaging spectrometer. In
Optical Astronomical Instrumentation, vol. 3355, 81–93 (International Society for Optics and
Photonics, 1998).
14. Hermes, J. et al. Rapid orbital decay in the 12.75-minute binary white dwarf J0651+ 2844.
The Astrophysical Journal Letters 757, L21 (2012).
15. Fuller, J. & Lai, D. Dynamical tides in compact white dwarf binaries: helium core white
dwarfs, tidal heating and observational signatures. Monthly Notices of the Royal Astronomical
Society 430, 274–287 (2013).
14

16. Shah, S., Nelemans, G. & van der Sluys, M. Using electromagnetic observations to aid
gravitational-wave parameter estimation of compact binaries observed with LISA-II. The
effect of knowing the sky position. Astronomy & Astrophysics 553, A82 (2013).
17. Holberg, J. & Bergeron, P. Calibration of synthetic photometry using DA white dwarfs. The
Astronomical Journal 132, 1221 (2006).
18. Istrate, A. G. et al. Models of low-mass helium white dwarfs including gravitational settling,
thermal and chemical diffusion, and rotational mixing. Astronomy & Astrophysics 595, A35
(2016).
19. Ramsay, G., Cropper, M., Wu, K., Mason, K. & Hakala, P. Detection of the optical counterpart
of the proposed double degenerate polar RX J1914+ 24. Monthly Notices of the Royal
Astronomical Society 311, 75–84 (2000).
20. Roelofs, G. H. et al. Spectroscopic evidence for a 5.4 minute orbital period in HM Cancri.
The Astrophysical Journal Letters 711, L138 (2010).
21. Marsh, T. & Steeghs, D. V407 Vul: a direct impact accretor. Monthly Notices of the Royal
Astronomical Society 331, L7–L11 (2002).
22. Gehrels, N. et al. The Swift gamma-ray burst mission. The Astrophysical Journal 611, 1005
(2004).
23. Jansen, F. et al. XMM-Newton observatory-I. The spacecraft and operations. Astronomy &
Astrophysics 365, L1–L6 (2001).
15

24. Wolf, W. M., Bildsten, L., Brooks, J. & Paxton, B. Hydrogen burning on accreting white
dwarfs: stability, recurrent novae, and the post-nova supersoft phase. The Astrophysical
Journal 777, 136 (2013).
25. Kaplan, D. L., Bildsten, L. & Steinfadt, J. D. Orbital evolution of compact white dwarf
binaries. The Astrophysical Journal 758, 64 (2012).
26. Marsh, T. R., Nelemans, G. & Steeghs, D. Mass transfer between double white dwarfs.
Monthly Notices of the Royal Astronomical Society 350, 113–128 (2004).
27. Paczynski, B. Evolution of single stars. IV. helium stars. Acta Astronomica 21, 1 (1971).
28. Shen, K. J., Kasen, D., Miles, B. J. & Townsley, D. M. Sub-Chandrasekhar-mass white dwarf
detonations revisited. The Astrophysical Journal 854, 52 (2018).
29. Bildsten, L., Townsley, D. M., Deloye, C. J. & Nelemans, G. The thermal state of the accreting
white dwarf in AM Canum Venaticorum binaries. The Astrophysical Journal 640, 466 (2006).
30. Althaus, L. G., Camisassa, M. E., Bertolami, M. M. M., Corsico, A. H. & Garcıa-Berro,
E. White dwarf evolutionary sequences for low-metallicity progenitors: The impact of third
dredge-up. Astronomy & Astrophysics 576, A9 (2015).
16

Methods
1 Summary of Observations
Extended Data Table 1 provides a summary of all observations used in our analysis.
2 Period Finding
We identified ZTF J1539+5027 by using the conditional entropy31 period finding algorithm on
20 million available ZTF lightcurves containing more than 50 epochs as of June 5, 2018, which
originated exclusively from the ZTF collaboration’s extragalactic high cadence survey (Bellm et
al., PASP in press). These lightcurves correspond to approximately 10 million sources, each with
a ZTF-g and ZTF-r lightcurve.
ZTF J1539+5027 exhibited the most significant signal of all the objects whose strongest
(lowest entropy) period fell in the 6–7 minute range. We used a Graphics Processing Unit (GPU)
implementation of the conditional entropy algorithm included in the pycuda based cuvarbase
package (available on GitHub). The algorithm was executed on a pair of NVIDIA GTX 1080 Ti
GPUs.
3 Lightcurve Modelling
To model the lightcurve, we used data from three nights of CHIMERA g′ observations (July 5-7
2018), with a total of 12, 999 individual 3-s exposures.
To fit the CHIMERA data, we used the ellc package32 to model the lightcurve and fit for the
17

ratio of the radii to the semi-major axis, r1 = R1/a, r2 = R2/a, inclination, i, mass ratio, q = M2
M1,
surface brightness ratio, J , of the unheated face of the secondary compared to the hot primary, and
the mid-eclipse time of the primary eclipse, t0. We adopted a linear limb darkening model, with
limb darkening coefficients for the primary (ldc1) and secondary (ldc2). We treated the primary
as a spherical object, but invoked a Roche approximation for the secondary. We also included a
gravity darkening coefficient for the secondary (gdc2) and a single free heating parameter (heat2)
to attempt to fit the sinusoidal variation due to the irradiation of the secondary, which acts as an
albedo of the secondary, but in this system must be larger than 1 to achieve a good fit because a
significant amount of incident ultraviolet light is reprocessed into optical wavelengths.
We allowed the limb and gravity darkening coefficients to vary as free parameters in the
fit, using uniform priors for each with values of ldc1 = 0.15 ± 0.15, ldc2 = 0.4 ± 0.2, and
gdc2 = 0.6± 0.1, based on extrapolations of existing models33,34.
We performed the final fit using the period derived from the quadratic fit to the timing epochs
(Table 1). We left r1, r2, i, J , q, t0, ldc1, ldc2, gdc2, and heat2 as free parameters. Extended
Data Figure 1 illustrates the corner plots from this fit, but excludes t0, which did not exhibit
significant covariance with any other parameter. We fixed the eccentricity to 0, because measuring
this quantity depends on the shape of the secondary eclipse, which in turn depends on the poorly
understood irradiation of the secondary. We ruled out the possibility of significant eccentricity,
because we failed to detect any sign of apsidal precession in the eclipse time measurements, and
furthermore, we tried fitting for this using the lightcurve modelling, and found a value consistent
with 0. Because we lack a good physical model for the irradiation of the secondary, we also do
18
not account for Doppler beaming, which we expect to alter the shape of the lightcurve at the few
percent level, peaking at phases between the eclipses, where the irradiation dominates the behavior
of the lightcurve.
4 Orbital Decay
To measure the orbital decay, we independently fit each night of KPED and CHIMERA data for
mid-eclipse times using the lightcurve modelling performed with ellc. We convert all timestamps
to Barycentric Julian Dates (BJD) in Barycentric Dynamical Time (TDB) to achieve the required
timing precision. Because the eclipse time is not strongly covariant with model dependent parameters
such as gravity and limb darkening, we omitted these from the fits to reduce complexity (but still
fitting for all other parameters described in the previous section). We also extracted photometry
from archival PTF/iPTF data, and because of significant smearing due to the exposure time of 60-s
(particularly for the primary eclipse), we extracted timing epochs by performing a least squares fit
of a sinusoid to this data (Extended Data Figure 2).
After obtaining the timing epochs, we measured the deviation of each eclipse time since
the start of observations relative to a model with a constant orbital period (Figure 2). This was
non-trivial, because the eclipse time had drifted by multiple orbits since the PTF epochs. However,
upon allowing for an integer number of orbits to have passed, only one solution yielded a significant
fit when using a quadratic model (corresponding to 5 orbits since the initial epoch). A linear
model failed in all cases, and a cubic model produced a cubic coefficient consistent with 0, so for
the final emphemeris, we chose to use a least squares fit of a quadratic to the these mid-eclipse
19

r1 = 0.139+0.0030.003
0.264
0.272
0.280
0.288
r 2
r2 = 0.280+0.0040.004
0.030
0.036
0.042
0.048
J
J = 0.036+0.0030.003
83
84
85
86
i
i = 84.146+0.6540.570
3.50
3.75
4.00
4.25
4.50
hea
t 2
heat2 = 3.851+0.1590.147
0.32
0.36
0.40
0.44
0.48
q
q = 0.395+0.0430.031
0.06
0.12
0.18
0.24
0.30
l
dc1
ldc1 = 0.151+0.1010.105
0.24
0.32
0.40
0.48
0.56
l
dc2
ldc2 = 0.395+0.1360.135
0.130
0.135
0.140
0.145
0.150
r1
0.52
0.56
0.60
0.64
0.68
g
dc2
0.264
0.272
0.280
0.288
r2
0.030
0.036
0.042
0.048
J
83 84 85 86
i3.5
03.7
54.0
04.2
54.5
0
heat2
0.32
0.36
0.40
0.44
0.48
q0.0
60.1
20.1
80.2
40.3
0
ldc1
0.24
0.32
0.40
0.48
0.56
ldc2
0.52
0.56
0.60
0.64
0.68
gdc2
gdc2 = 0.614+0.0600.071
Figure 5: Extended Data Figure 1: Corner plots of lightcurve modelling The corner plots of
the lightcurve fit to 12, 999 g′ epochs taken with CHIMERA on July 5, 6, and 7 2018. Please note
that the two limb darkening coefficients, as well as gravity darkening of the secondary (bottom
three panels), were allowed to vary to ensure that assumptions regarding them were not strongly
covariant with the other physical quantities of interest.
20

0.2 0.4 0.6 0.8 1Orbital Phase
-250
-200
-150
-100
-50
0
50
100
150
Flu
x (
Rela
tive to R
efe
rence Im
age)
Palomar Transient Factory Data (2009)
0 0.2 0.4 0.6 0.8 1Orbital Phase
-300
-250
-200
-150
-100
-50
0
50
100
150
Flu
x (
Rela
tive to R
efe
rence Im
age)
Palomar Transient Factory Data (2010)
0 0.2 0.4 0.6 0.8 1Orbital Phase
-300
-250
-200
-150
-100
-50
0
50
100
150
Flu
x (
Rela
tive to R
efe
rence Im
age)
Palomar Transient Factory Data (2011)
0 0.2 0.4 0.6 0.8 1Orbital Phase
-300
-200
-100
0
100
200
Flu
x (
Rela
tive to R
efe
rence Im
age)
Intermediate Palomar Transient Factory Data (2016)
Figure 6: Extended Data Figure 2: Fits to archival Palomar Transient Factory Data Least
squares fits of single harmonic sinusoids (smooth blue lines) to archival Palomar Transient Factory
and Intermediate Palomar Transient Factory data used to determine the orbital decay rate. This
archival data was extracted by using forced photometry on difference images. Because this is a
least squares fit of a sinusoid to the data, this timing technique uses the reflection effect in the
system as its primary clock, rather than the mid-eclipse time. All error bars are 1 sigma. To
determine the time of the epoch, we take the mean of all epochs used, and then calculate the phase
of eclipse nearest to this mean time.
21

times to estimate P (this fit is the red curve down in (Figure 3a), which resulted in an adjusted
R2 = 0.999995. This quadratic fit is independent of any model assumptions about decay due
to tidal contribution, general relativity, or any other mechanism; it only indicates that the orbital
period is decreasing with with an approximately constant rate as a function of time over the course
of the observations.
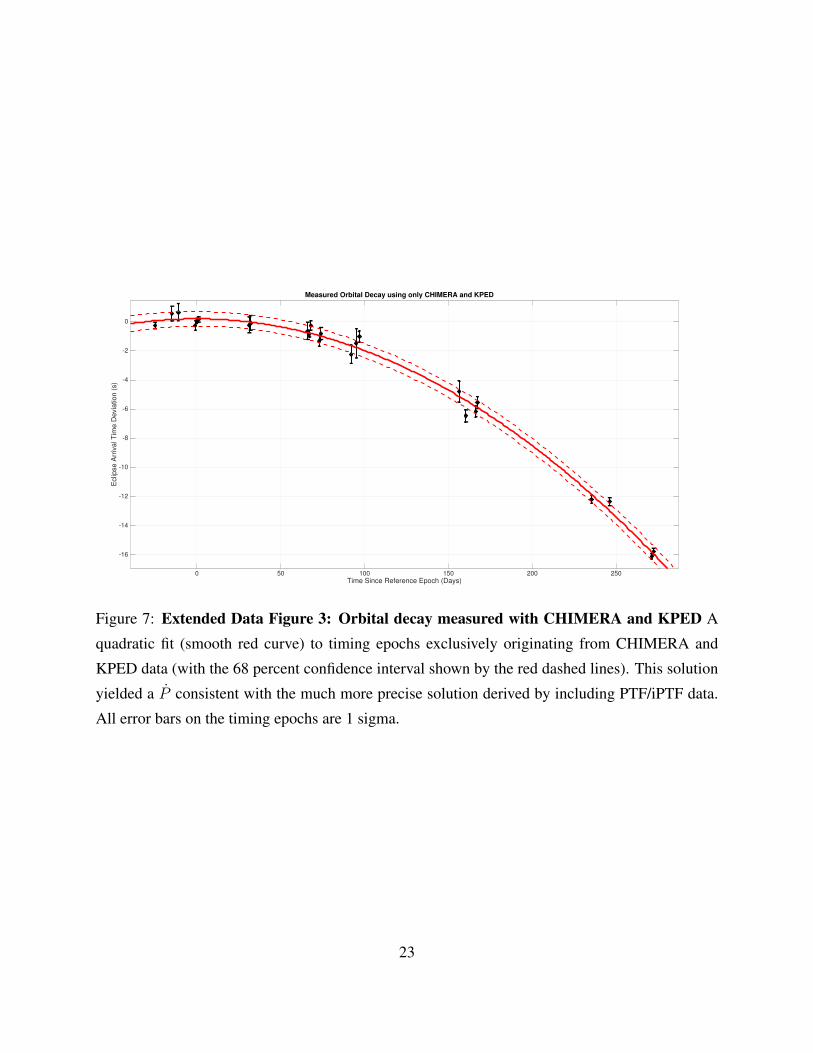
In addition to extracting P , we verified our measurement by fitting a quadratic to only
mid-eclipse times extracted from CHIMERA and KPED data (Extended Data Figure 3), and
obtained a value of P = (−2.487 ± 0.19) × 10−11s s−1, consistent with the P = (−2.373 ±
0.005) × 10−11s s−1 value obtained when including PTF/iPTF data. Moreover, these values are
both consistent with the value of P = (−2.378± 0.049)× 10−11s s−1 obtained by fitting only the
four PTF/iPTF epochs and excluding all CHIMERA and KPED data.
With P measured, we assessed how much contribution there was due to “secular acceleration”35
and differential Galactic acceleration36. For the former we used the proper motion as measured
from the second data release of Gaia37, µ = 5.1 ± 2.2 mas yr−1. This caused an apparent excess
PShk of (8.3± 3.6)× 10−7(d/1 kpc) ms yr−1 where d is the distance. This term must be subtracted
from the measured value to obtain the intrinsic P . Similarly, differential Galactic acceleration
leads to an apparent PDGR of −3.5 × 10⁻⁷ ms yr−1 at a distance of 2.4 kpc, computed using the
MWPotential2014 potential38. Both of these contributions are significantly smaller than the
measured P and are therefore negligible compared to the uncertainties from tidal contributions
(Section 9).
22
0 50 100 150 200 250Time Since Reference Epoch (Days)
-16
-14
-12
-10
-8
-6
-4
-2
0
Eclip
se
Arr
iva
l T
ime
De
via
tio
n (
s)
Measured Orbital Decay using only CHIMERA and KPED
Figure 7: Extended Data Figure 3: Orbital decay measured with CHIMERA and KPED A
quadratic fit (smooth red curve) to timing epochs exclusively originating from CHIMERA and
KPED data (with the 68 percent confidence interval shown by the red dashed lines). This solution
yielded a P consistent with the much more precise solution derived by including PTF/iPTF data.
All error bars on the timing epochs are 1 sigma.
23
5 Spectroscopic Analysis
To perform the spectroscopic analysis, first we coadded 317 individual spectra (all taken with a 52s
exposure) into 12 phase-bins, using the emphemeris for the mid-eclipse time of the primary eclipse
to define phase 0. We then fit stellar atmospheric models39 and obtained measurements of the
logarithm of the surface gravity of the primary, log(g)1, and its effective photospheric temperature,
Teff,1, using the spectrum immediately after the phase of the primary eclipse (phase 0.0833), to
minimize the flux contributed by the irradiated face of the secondary (Figure 3a).
In order to measure radial-velocity semi-amplitudes of the objects, K1 and K2, we used a
double Gaussian model to fit the line associated with the hydrogen n = 5 to n = 2 transition in
each phase-binned spectrum to extract the Doppler shifts of the emission and absorption lines.
To derive overall radial velocities, we adopted an out-of-phase sine wave model for the
absorption and emission features
v1(j) = K1measured sin
(2πj
12
)+ A, v2(j) = K2measured sin
(2πj
12+ π
)+B, (2)
where j encodes the index of the phase-bin and A and B are the systemic velocities of each white
dwarf, K1measured and K2measured are the observed velocity semi-amplitudes, and v1(j) and v2(j)
are the Doppler shifted velocities associated with each phase-bin (Extended Data Figure 4). We
required the two systemic velocities to satisfy A > B when sampling, because the gravitational
redshift of the primary should exceed that of the secondary because of the primary’s larger surface
gravity. We used a Kernel Density Estimator (KDE) applied to the posterior distributions for
the measured velocity semi-amplitudes K1measured and K2measured to assign the probabilities when
24
sampling.
In order to derive masses from these spectroscopic fits, we applied corrections to the measured
velocity semi-amplitudes. First, we applied a smearing correction of 20% to both K1measured and
K2measured, due to our phase binned spectra each being co-additions of spectra taken over a third
of the orbital phase (though each individual spectrum was taken over only an eight of the orbital
phase, broader coadditions were necessary to reach sufficient SNR for measuring radial velocities).
We used a prior of C = 0.68± 0.04 for the center of light correction term, based on the mass ratio
estimate40. This modified the velocity amplitude of the secondary by:
K2 =K2measured
1− C R2
a(1 + q)
(3)
where R2/a was taken from the lightcurve fitting, and the mass ratio was defined as q = K1/K2
(thus requiring us to solve this expression to isolate K2). We applied the center-of-light correction
to the secondary, because one face of it is heavily irradiated (meaning that the emission lines arise
from a location different than the center of mass).
6 Mass and Radius Analysis
There are three main constraints that contribute to the overall mass and radius estimates.
6.1 Spectroscopic Constraint: Using Kepler’s law and Classical Mechanics, we can relate the
velocity semi-amplitude, inclination, and period of a binary to the masses with a binary mass
function:
25

0 0.1 0.2 0.3 0.4 0.5 0.6 0.7 0.8 0.9
-500
0
500D
opple
r S
hift (k
m/s
)
Primary
0 0.1 0.2 0.3 0.4 0.5 0.6 0.7 0.8 0.9
Orbital Phase
-500
0
500
Dopple
r S
hift (k
m/s
)
Secondary
Figure 8: Extended Data Figure 4: Radial velocity measurements of ZTFJ1539+5027 A plot
of the measured Doppler shifts vs. orbital phase for the primary and secondary. The primary
eclipse occurs at orbital phase 0. In the top panel, we plot measured Doppler shifts of the more
massive primary, extracted from 12 phase bins of coadded spectra. The dashed blue line illustrates
the fit of a sinusoid to this data (adjusted R2 = 0.7118). The lower panel shows the Doppler shift
measurements of the secondary, and also the best fit sinusoid to this data (adjusted R2 = 0.9757).
Because of the low SNR of the spectra, these fits have large uncertainties (especially in the case of
the primary, with its shallow and broad absorption lines). This is reflected in the broad distribution
of possible masses associated with the spectroscopic constraint illustrated in Figure 4. All error
bars are 68% CIs.
26

M32 sin3(i)
(M1 +M2)2=PK3
1
2πG(4)
where G is the gravitational constant. Because we have measured both K1 and K2, as well as P
and i, we can write two such equations, and derive constraints on the two masses (Figure 4).
6.2 White Dwarf Model Constraint: We used a mass-radius relation from models for a carbon-oxygen
white dwarf30, which depends on mass, metallicity, hydrogen fractional mass in the atmosphere,
and radius, together with the spectroscopic measurements of Teff,1 and log(g)1, to derive constraints
on these properties. In these fits, we marginalized over metalicity and hydrogen mass fraction. We
used the measured ratio of the radius of the primary to the semi-major axis R1
a(from the lightcurve
modelling), and combined this with Kepler’s law, and the white dwarf model constraints30, to
constrain the system parameters. This also weakly constrains the mass of the secondary, which
enters into Kepler’s law as contributing to the total mass of the system.
6.3 Chirp Mass Fit: We used the measured f to infer the chirp mass, Mc = (M1M2)35
(M1+M2)15
, which is
be related to the orbital decay rate by Equation 5:
f =96
5π
83
(GMc
c3
) 53
f113 (5)
where c is the speed of light. Because the chirp mass inferred from f assumes the decay is
caused purely by general relativity, we also computed a chirp mass assuming a 10 percent tidal
contribution to f as a lower bound on Mc.
27

6.4 Combined Fit: To combine all of the constraints described above, we created a KDE based on
the M1 and M2 estimates from the spectroscopic, white dwarf model, and chirp mass constraints.
The posterior distribution of this combined analysis yielded the values for the masses reported
in Table 1. The radii were computed using r1 and r2 from the lightcurve modelling, and the
semi-major axis a determined with the masses and the orbital period.
7 Distance Estimate
Because no reliable parallax measurement exists for ZTF J1539+5027, we instead used its bolometric
luminosity to estimate the distance. First, we measured the apparent magnitude of the hot primary
without contribution from the irradiated face of the secondary by performing a least squares fit of
a sinusoid to the ZTF-g lightcurve, omitting data from the eclipse, and measuring the minimum of
this sinusoid. This yields an apparent ZTF-g band apparent magnitude of 20.38± 0.05.
Next, we used the atmospherically determined temperature of the primary, Teff,1 ≈ 48, 900 K,
to infer the absolute g′ luminosity of the 0.6M� DA white dwarf17. The spectroscopic temperature
puts ZTF J1539+5027 approximately between two temperatures in the models–one corresponding
to Teff,1 = 45, 000 K and the other to Teff,1 = 55, 000 K. These corresponded to g′ absolute
magnitudes of 8.71 and 8.35, respectively, and we adopted these values as the lower and upper
bounds on the object’s absolute luminosity, and assume a uniform distribution of possible absolute
luminosities between these values. Using this to solve for the distance of the object, we estimated a
distance of d = 2.34±0.14 kpc, though we emphasize that the error bars derived using atmospherically
determined quantities tend to be underestimated. We also incorporated a uniform distribution of
28
E(B − V ) in the range of 0 to 0.04 to account for the effects of extinction at these coordinates41.
8 Gravitational Wave Strain
The expression for the characteristic strain42 used in Figure 2b (including the value plotted for ZTF
J1539+5027) is:
Sc =2(GMc)
5/3(πf)2/3
c4d
√fTobs (6)
where d is the distance to the object, Tobs is the integrated observation time of the LISA mission.
Though it is the conventional quantity used to construct such diagrams, the characteristic strain
does not capture any information about source inclination, detector response, etc.
In order to compute the signal to noise42 for LISA, we directly invoked the signal amplitude
at the detector A =√|F+|2|h+|2 + |F×|2|h×|2, where h+ and h× are the two gravitational wave
polarization amplitudes, and F+ and F× are the LISA detector response patterns corresponding to
these polarizations. The h+ polarization amplitude includes a factor of (1 + cos2 (i)) and the h×
polarization a factor of 2 cos (i), meaning that systems like ZTF J1539+5027 with an inclination
close to 90 degrees exhibit a gravitational wave signal up to a factor of√
8 smaller than an
equivalent face-on system with an inclination close to 0 degrees in situations where F+ ≈ F×.
In Table 1, we include an estimate for both the SNR of ZTF J1539+5027, and SDSS J0651+2844
computed using the same technique.
29

9 Tidal Effects
Tidal Contribution to Orbital Decay Tidal dissipation can transfer orbital energy into rotational
and thermal energy within the stars. The former effect can cause the orbit to decay slightly faster
than gravitational radiation alone, while the latter effect can increase the surface temperatures of
the stars. Studies of tidal synchronization and heating predict that tidal energy dissipation scales
more strongly with orbital period than gravitational radiation15, 43. As the orbit decays and the
white dwarfs draw nearer to each other, tides begin to act on a shorter timescale than orbital decay,
spinning up the stars toward synchronous rotation. The “critical” orbital period, Pc, below which
tidal spin-up can occur faster than orbital decay, lies in the range Pc ∼ 45 − 130 minutes43,
depending on the white dwarf mass and age. In any case, at an orbital period of only 6.91 minutes,
we expect the stars in ZTF J1539+5027 to be spinning synchronously with the orbit. In this regime,
the rate of tidal energy transfer from the orbit to the stellar interiors is
Etide ' 4π2IPGW
P 3, (7)
where I = I1 +I2 is the combined moment of inertia of the two stars, and PGW is the orbital period
decay caused by gravitational waves.
Comparing Equation 7 with the orbital energy lost to gravitational wave emission, the tidal
contribution Ptide to the total orbital decay rate P is given by
Ptide
PGW
' 12π2Ia
GM1M2P 2. (8)
The moment of inertia of star 1 is I1 = κ1M1R21 (and similarly for star 2), where κ1 is a dimensionless
30

constant determined by the internal structure of the white dwarf. Equation 8 can also be written as
Ptide
PGW
' 3(M1 +M2)2
M1M2
[κ1
M1
M1 +M2
(R1
a
)2
+ κ2M2
M1 +M2
(R2
a
)2]. (9)
From the white dwarf models (Section 10), we find κ1 ' 0.14 and κ2 ' 0.11. Using M1 '
0.61M�, M2 ' 0.21M�, R1/a ' 0.14, R2/a ' 0.28, we find Ptide/PGW ' 0.067. Thus, we
expect the orbit to decay several percent faster than gravitational radiation alone, provided that the
stars are tidally locked. There is an additional effect of orbital decay caused by orbital energy used
to raise a tidal bulge in each star 16, 44, but we find it to be more than an order of magnitude smaller
than Equation 9.
Tidal Heating The tidal energy dissipation within the white dwarfs is partitioned between kinetic
energy used to spin up the white dwarfs and heat that can diffuse out and increase their surface
temperatures. For an aligned, sub-synchronous and rigidly rotating white dwarf, the ratio of tidal
heating to tidal energy dissipation is Eheat/Etide = 1 − P/Pspin, where Pspin is the spin period of
the white dwarf43. At orbital periods below the critical value Pc, the spin period, Pspin, decreases
to approach the orbital period. Calculations suggest that the tidal heating rate in this regime is
expected to be Eheat ∼ Etide(P/Pc)15, such that the tidal heating rate is much smaller than the
energy dissipation rate, because most of the energy is converted to rotational energy.
To estimate an upper limit on the surface temperature of each white dwarf that can be
obtained from tidal heating alone, we assume Eheat ∼ Etide ≈ 6π2I/(P 2tGW), where tGW = 32
P|P |
is the gravitational wave timescale. If the tidal heat is instantaneously reradiated, this corresponds
31
to a surface temperature
Ttide =
(Eheat
4πσBR2
)1/4
=
(3πκM
2σBP 2tGW
)1/4
, (10)
where σB is the Stefan-Boltzmann constant, and M is the mass of the white dwarf. Note that
this temperature depends only weakly on the white dwarf mass and moment of inertia, and is
independent of the white dwarf radius. Using the same values as above and the measured value
tGW ≈ 830, 000 yr, we find an upper limit of Ttide ≈ 44, 000 K for the primary white dwarf.
However, accounting for the suppression factor P/Pc ∼ 6.9/60, such that Eheat ∼ Etide(P/Pc),
yields a more realistic temperature Ttide ≈ 25, 000 K. Hence, while tidal heating may be able
to heat the primary to temperatures near that observed, our best estimate suggests substantially
lower temperatures. Applying Equation 10 to the secondary white dwarf predicts an upper limit
due to tidal heating of Ttide ≈ 33, 000 K, but our best estimate is Ttide ≈ 19, 000 K. A measured
nightside temperature near this value would be consistent with tidal heat powering the nightside
flux of the secondary. However, the value of the surface brightness ratio in g′ suggests a secondary
temperature of Teff,2 < 10, 000 K.
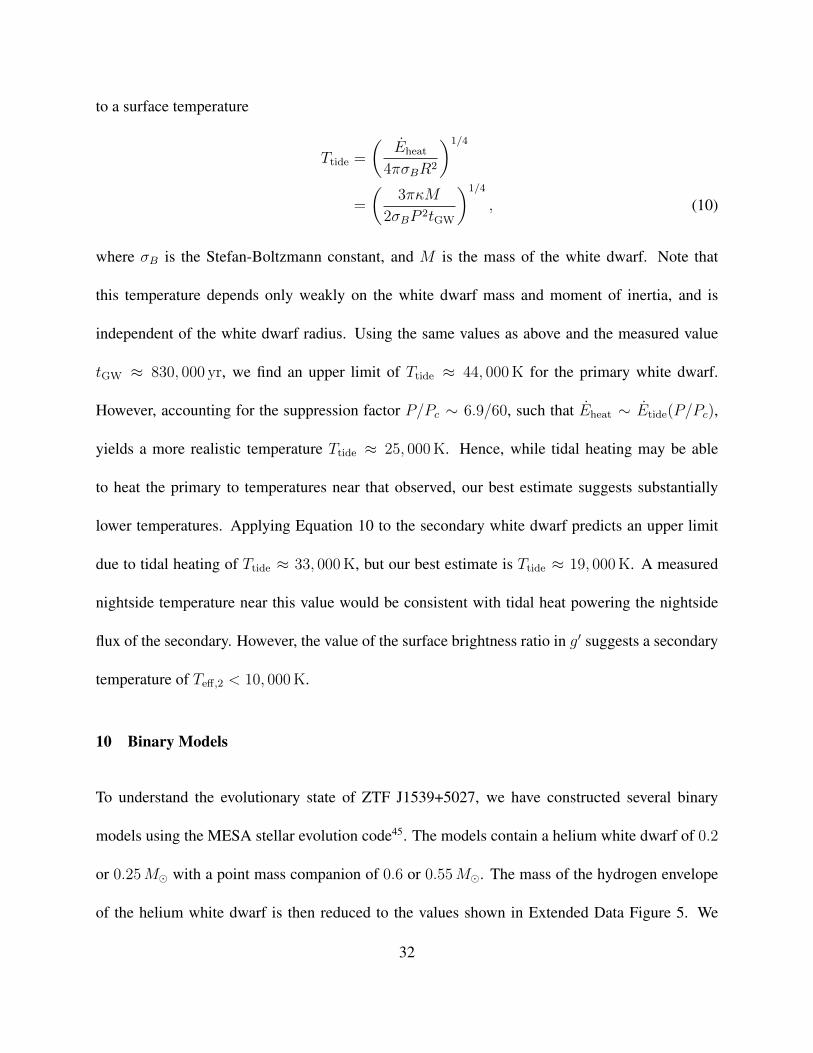
10 Binary Models
To understand the evolutionary state of ZTF J1539+5027, we have constructed several binary
models using the MESA stellar evolution code45. The models contain a helium white dwarf of 0.2
or 0.25M� with a point mass companion of 0.6 or 0.55M�. The mass of the hydrogen envelope
of the helium white dwarf is then reduced to the values shown in Extended Data Figure 5. We
32

initialize these runs at orbital periods of 1 hour to mimic the end of a common envelope event that
formed the tight binary. The helium white dwarf is evolved simultaneously with the orbit, with
angular momentum losses due to gravitational waves and fully non-conservative mass transfer.
Extended Data Figure 5 shows a plot of the mass loss rate from the secondary as function of
orbital period. The secondary overflows its Roche lobe and begins mass transfer at orbital periods
ranging from P ∼ 6.5 − 13 minutes, and the expected mass loss rates at P = 7 minutes are
typically M ∼ 3 × 10⁻⁹M� yr−1 (ranging from 0 up to 10−8M� yr−1, depending on the white
dwarf masses and hydrogen envelope mass). During the initial phase of slow mass transfer, the
secondary loses its non-degenerate hydrogen envelope as the Roche lobe contracts inward. The
mass accreting onto the primary can greatly heat it as gravitational potential energy is converted
to heat. The energy released by accretion is Eaccrete ∼ GM1M/R1, with order unity corrections
due to its non-zero kinetic and gravitational energy when it is lost from the secondary. We do not
evolve the primary (accretor), but we may crudely estimate its temperature by assuming that the
accretion energy is uniformly radiated as a blackbody over its surface. The corresponding accretion
temperature (assuming 100% efficiency) is
Taccretion =
(GM1M
4πσBR3
)1/4
. (11)
The bottom panel of Extended Data Figure 5 shows that once mass transfer begins, it can easily
increase the primary’s temperature to T1 & 50, 000 K.
33
4 6 8 10 12 14
10−9
10−8
10−7
10−6
Mas
sTr
ansf
erR
ate
(M�
/yr)
Mac = 0.6M�,Mdo = 0.2M�,MH = 1.8×10⁻³M�Mac = 0.6M�,Mdo = 0.2M�,MH = 9×10⁻⁴M�Mac = 0.55M�,Mdo = 0.25M�,MH = 1.2×10⁻³M�Mac = 0.55M�,Mdo = 0.25M�,MH = 6×10⁻⁴M�
4 6 8 10 12 14Orbital Period (minutes)
0
50
100
150
200
250
Acc
retio
nTe
mpe
ratu
re(1
03K
)
Mass transferbegins
H-shell removal
Period minimum
Orbital expansionas AM CVn
Figure 9: Extended Data Figure 5: Binary evolution models Binary stellar evolution models for
systems similar to ZTF J1539+5027. Top: Mass transfer rate as a function of orbital period.
Systems begin at large orbital period and move towards smaller period due to gravitational
radiation, and in some cases they move back out due to stable mass transfer. Except for high-mass
donors with thin hydrogen envelopes, mass transfer is expected to begin at orbital periods longer
than 7 minutes. Bottom: Corresponding accretion temperature from Equation 11.
34
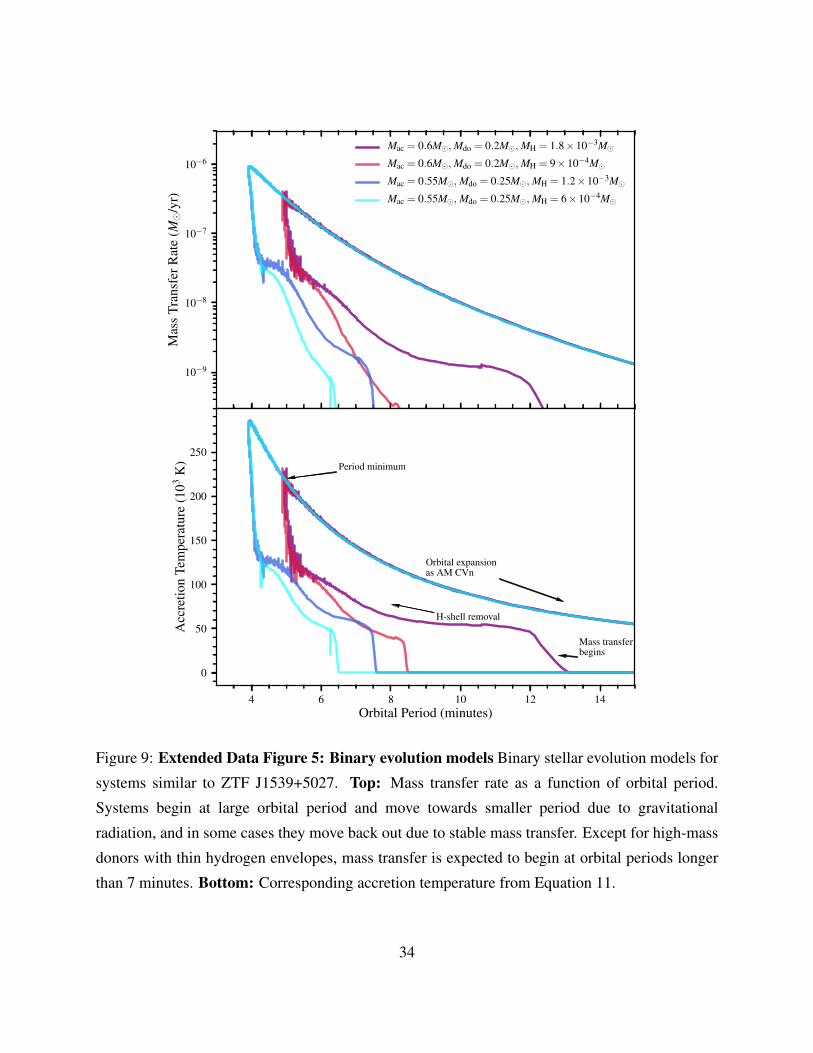
11 Constraint on Accretion
Although accretion could explain the high temperature of the primary, we have not detected
any evidence of ongoing mass-transfer. We have constrained the possibility of active accretion
contributing luminosity to an accretion hot spot using both optical and X-ray data. The upper
limit we inferred is M < 2 × 10⁻⁸M� yr−1, and this is only possible in a very narrow hot spot
temperature range (Extended Data Figure 6). For both the optical and X-ray constraint we have
assumed that only 10% of accretion energy is being converted to the luminosity of the hot spot. This
is based on a model where we assume 90% of the accretion energy is being deposited into heating
the optically thick photosphere of the white dwarf, while only 10% is contributing to luminosity
immediatly re-radiated in the form of a hot spot. We estimated the upper limit by computing
the X-ray flux using NASA’s WebPIMMS mission count rate simulator, using a 3-sigma upper
limit on the background count rate determined from the X-ray images. We assumed a hydrogen
column density46 of nH = 1.5 × 1020 cm−2. We used the distance of d = 2.4 kpc to convert
the upper limit on the unabsorbed X-ray flux to an X-ray luminosity. For the optical constraint,
we computed an upper limit on the optical luminosity of the hot spot as 10% the luminosity
of the photosphere of the hot primary, based on an absence of emission lines in our coadded
spectra, which have an SNR of approximately 10. We calculated the upper limit on M at various
temperatures by integrating a Planck function at the corresponding temperature over the instrument
passbands, and then computed the maximum bolometric luminosity, Laccretion, an emitting region
at this temperature could have and still be consistent with the non-detections in these passbands.
We then determined the corresponding upper limit on M by equating Laccretion = 0.1GM1M/R1.
35

We obtained the XMM EPIC-pn data from the public XMM-Newton science archive (observation
ID: 0800971501 PI: Pratt, Gabriel). The SWIFT observation was obtained with our own program
(observation ID: 00010787001, 00010787002 PI: Kulkarni).
12 Novae
The high temperature of the primary may plausibly be explained if the white dwarf is cooling after
having recently undergone a nova outburst, caused by accretion of hydrogen from the secondary
or a tidally induced nova 47. The nova likely ejects an amount of mass comparable to the hydrogen
shell mass which must be accreted, which for a 0.6M� white dwarf is MH ∼ 10−4M�24.
Following the nova, the orbit widens slightly, and the system is brought out of contact such that
mass transfer from the secondary ceases. The change in semi-major axis following the loss of
the nova shell is ∆a/a ∼ MH/(M1 + M2). The length of time the binary is detached before
gravitational wave emission brings the system back into contact is
tdetach = tGW∆a
a∼ tGW
MH
M1 +M2
. (12)
Using MH = 10−4M�, we estimate tdetach ∼ 100 yr. This can be compared to the time spent
accreting mass between subsequent novae.
taccrete =MH
M. (13)
As the non-degenerate hydrogen envelope of the low-mass secondary is stripped off (see discussion
in25), the approximate mass transfer rate is expected to be M . 10−8M� yr−1 (Extended Data
Figure 5). The time between novae outbursts is thus taccrete & 104 years. Then the ratio of time
36

50000 100000 150000 200000 250000 300000 350000 400000 450000 500000Temperature of Accretion Region (K)
10 13
10 12
10 11
10 10
10 9
10 8
10 7
10 6Up
per L
imit
on M
ass T
rans
fer R
ate
(M/y
r)
Upper Limit (Optical)Upper Limit (XMM)Upper Limit (SWIFT)
Figure 10: Extended Data Figure 6: X-ray and optical constraints on accretion inZTFJ1539+5027 The constraints on mass transfer resulting from the non-detection of any
signatures of accretion in both the optical and X-ray bands. The upper limits are expressed
in terms of the mass accretion rate contributing to the accretion luminosity of a hypothetical
hot spot. The solid red curve illustrates the constraint imposed by the XMM EPIC-pn X-ray
non-detection, which rules out significant mass transfer contributing to a hot spot with temperatures
greater than ≈ 150, 000 K, while the green dotted line illustrates a weaker upper limit imposed by
the non-detection in a SWIFT XRT observation. We constructed the dashed blue curve, which
represents the optical constraint, by requiring that any accretion luminosity originating from a
hot spot should contribute < 10% to the luminosity in the band ranging from 320 to 540 nm,
as we know from the optical spectrum (Figure 3) that this light is dominated by the ≈ 50, 000 K
photosphere of the hot primary, and also see no signature of a hot spot in the CHIMERA lightcurve
(Figure 1). We chose the threshold of < 10%, because given the SNR of the spectra, we expect
we should be able to detect optically thin emission with an amplitude at the 10% level. Other
white dwarfs with such a hot spot (such as HM Cancri) exhibit such emission, particularly in lines
associated with ionized helium.
37
spent in a detached state relative to an accreting state is tdetach/taccrete < 10−2. Hence, while it is
possible that the system is in a detached state following a nova caused by mass transfer, the chances
of catching the system in this state are small. To help rule out the possibility, we used the WASP
instrument on the Hale telescope to obtain a deep H-α image of the field and found no evidence
for a remnant nova shell; however, this analysis was limited by the lack of an off-band image.
13 Population Implications
From 48, the merger rate of He+CO WDs in the Milky Way is roughly 0.003 yr−1. This number
is reached from both observational and population synthesis arguments. The number of systems
with decay time equal or less than the ∼210 kyr decay time of ZTF J1539+5027 is thus ∼630.
Out to the distance of 2.3 kpc, given a local surface density of 68M� pc−2 from 49, the stellar
mass is ∼ 109M�, roughly 2% of the total disk mass of ∼ 5 × 10⁹M�. We thus expect to find
∼13 binaries with a similar distance and merging timescale as ZTF J1539+5027. The fraction of
eclipsing systems is roughly R/a ∼ 0.25 for our measured parameters, hence we may expect ∼3
eclipsing systems like ZTF J1539+5027. ZTF can detect such systems in most of the volume out
to its distance, as long as they are as bright as this system. We may be missing slightly longer
period systems that are dimmer because they have not yet started mass transfer. We comment
that the estimate from 48 found that many double WDs must be born at short orbital periods in
order to explain the abundance of short period systems relative to longer period systems, and ZTF
J1539+5027 may support that conclusion.
38

Extended Data Table 1: Summary of Observations
Instrument Exposure Time (s)
Configuration Number of Epochs Observation Dates (UTC)
LRIS 52 Blue Arm (600/4000 grism 4x4 binning) 317 Exposures June 16, July 12, 13 2018
CHIMERA 3 Sloan g’ (Frame Transfer Readout) 9 Nights (2-6 hours per night) July 5, 6, 7, August 6, 7, September 17, 18, Dec 9 2018, Feb 26 2019
KPED 1
8
Sloan g’ (Electron Multiplying Mode) 15 Nights (1-8 hours per night) June 11, 21, 25, Sept 10, 11, 12, Oct 6, 9, 11, Dec 13, 19, 20, Mar 9, Apr 3, 4
PTF/iPTF 60 PTF r 166 Exposures 2009, 2010, 2011, 2016
ZTF 30 ZTF g 90 Exposures March-June 2018
ZTF 30 ZTF r 92 Exposures March-June 2018
WASP 300 H-alpha 11 Exposures August 12 2018
SWIFT 2,000 XRT 2 Exposures August 5 2018
XMM 26,477 EPIC-pn 1 Exposure Feb 3 2018
39

14 Data Availability
Upon request, the first author will provide reduced photometric and spectroscopic data, and available
ZTF data for the object. We have included the eclipse time data used to construct the orbital
decay diagram in Figures 2a, Extended Data Figure 2, and Extended Data Figure 3. The X-ray
observations are already in the public domain, and their observation IDs have been supplied in the
text. The proprietary period for the spectroscopic data will expire at the start of 2020, at which
point this data will also be public and readily accessible.
15 Code Availability
Upon request, the first author will provide code (primarily in python) used to analyze the observations
and data such as posterior distributions used to produce the figures in the text (MATLAB was used
to generate most of the figures).
Acknowledgements KBB thanks the National Aeronautics and Space Administration and the Heising
Simons Foundation for supporting his research.
Based on observations obtained with the Samuel Oschin Telescope 48-inch and the 60-inch Telescope
at the Palomar Observatory as part of the Zwicky Transient Facility project. ZTF is supported by the
National Science Foundation under Grant No. AST-1440341 and a collaboration including Caltech, IPAC,
the Weizmann Institute for Science, the Oskar Klein Center at Stockholm University, the University of
Maryland, the University of Washington (UW), Deutsches Elektronen-Synchrotron and Humboldt University,
Los Alamos National Laboratories, the TANGO Consortium of Taiwan, the University of Wisconsin at
40

Milwaukee, and Lawrence Berkeley National Laboratories. Operations are conducted by Caltech Optical
Observatories, IPAC, and UW.
The KPED team thanks the National Science Foundation and the National Optical Astronomical Observatory
for making the Kitt Peak 2.1-m telescope available. The KPED team thanks the National Science Foundation,
the National Optical Astronomical Observatory and the Murty family for support in the building and operation
of KPED. In addition, they thank the CHIMERA project for use of the Electron Multiplying CCD (EMCCD).
Some of the data presented herein were obtained at the W.M. Keck Observatory, which is operated as a
scientific partnership among the California Institute of Technology, the University of California and the
National Aeronautics and Space Administration. The Observatory was made possible by the generous
financial support of the W.M. Keck Foundation. The authors wish to recognize and acknowledge the very
significant cultural role and reverence that the summit of Mauna Kea has always had within the indigenous
Hawaiian community. We are most fortunate to have the opportunity to conduct observations from this
mountain.
This research benefited from interactions at the ZTF Theory Network Meeting that were funded by the
Gordon and Betty Moore Foundation through Grant GBMF5076 and support from the National Science
Foundation through PHY-1748958
We thank John Hoffman, the creator of cuvarbase. We thank Thomas Marsh, Sterl Phinney, and Valeryia
Korol for valuable discussions. We thank Gregg Hallinan and Christoffer Fremling for helping observe the
object.
Competing Interests The authors declare that they have no competing financial interests.
Contributions KBB discovered the object, conducted the lightcurve analysis, eclipse time analysis, and
41

was the primary author of the manuscript. KBB and MWC conducted the spectroscopic analysis. KBB,
MWC, and TAP conducted the combined mass-radius analysis. KBB and MWC reduced the optical data.
KBB, MWC, and DLK reduced and analysed the X-ray observations. JF conducted the theoretical analysis,
including that on tides, and MESA evolutionary models. KBB, MWC, TK, SRK, JvR, and TAP all contributed
to collecting data on the object. KBB, MWC, JF, TK, ECB, LB, MJG, DLK, JvR, SRK, and TAP contributed
to the physical interpretation of the object. TK, ECB, RGD, MF, MG, SK, RRL, AAM, FJM, RR, DLS,
MTS, RMS, PS and RW contributed to the implementation of ZTF; MJG is the project scientist, TAP and
GH are Co-PIs, and SRK is PI of ZTF. RGD, DAD, MF, RR contributed to the implementation of KPED;
MWC is project scientist, and SRK is PI of KPED. TAP is KBB’s PhD advisor.
Correspondence Correspondence and requests for materials should be addressed to Kevin B Burdge (email:
31. Graham, M. J., Drake, A. J., Djorgovski, S., Mahabal, A. A. & Donalek, C. Using conditional
entropy to identify periodicity. Monthly Notices of the Royal Astronomical Society 434,
2629–2635 (2013).
32. Maxted, P. ellc: A fast, flexible light curve model for detached eclipsing binary stars and
transiting exoplanets. Astronomy & Astrophysics 591, A111 (2016).
33. Gianninas, A., Strickland, B., Kilic, M. & Bergeron, P. Limb-darkening coefficients for
eclipsing white dwarfs. The Astrophysical Journal 766, 3 (2013).
34. Claret, A. & Bloemen, S. Gravity and limb-darkening coefficients for the Kepler, CoRoT,
Spitzer, uvby, UBVRIJHK, and Sloan photometric systems. Astronomy & Astrophysics 529,
42

A75 (2011).
35. Shklovskii, I. Possible causes of the secular increase in pulsar periods. Soviet Astronomy 13,
562 (1970).
36. Lorimer, D. R. & Kramer, M. Handbook of Pulsar Astronomy (2012).
37. Brown, A. et al. Gaia data release 2-summary of the contents and survey properties. Astronomy
& Astrophysics 616, A1 (2018).
38. Bovy, J. galpy: A python library for galactic dynamics. The Astrophysical Journal Supplement
Series 216, 29 (2015).
39. Levenhagen, R. S., Diaz, M. P., Coelho, P. R. T. & Hubeny, I. A grid of synthetic spectra
for hot DA white dwarfs and its application in stellar population synthesis. The Astrophysical
Journal Supplement Series 231, 1 (2017).
40. Horne, K. & Schneider, D. P. Evidence for a high-mass white dwarf in nova V1500 Cygni
1975. The Astrophysical Journal 343, 888–901 (1989).
41. Green, G. M. et al. Galactic reddening in 3d from stellar photometry–an improved map.
Monthly Notices of the Royal Astronomical Society 478, 651–666 (2018).
42. Korol, V. et al. Prospects for detection of detached double white dwarf binaries with Gaia,
LSST and LISA. Monthly Notices of the Royal Astronomical Society 470, 1894–1910 (2017).
43. Fuller, J. & Lai, D. Dynamical tides in compact white dwarf binaries: tidal synchronization
and dissipation. Monthly Notices of the Royal Astronomical Society 421, 426–445 (2012).
43

44. Benacquista, M. J. Tidal perturbations to the gravitational inspiral of J0651+ 2844. The
Astrophysical Journal Letters 740, L54 (2011).
45. Paxton, B. et al. Modules for experiments in stellar astrophysics (MESA): binaries, pulsations,
and explosions. The Astrophysical Journal Supplement Series 220, 15 (2015).
46. Kalberla, P. M. et al. The Leiden/Argentine/Bonn (LAB) survey of galactic HI-final data
release of the combined LDS and IAR surveys with improved stray-radiation corrections.
Astronomy & Astrophysics 440, 775–782 (2005).
47. Fuller, J. & Lai, D. Tidal novae in compact binary white dwarfs. The Astrophysical Journal
Letters 756, L17 (2012).
48. Brown, W. R., Kilic, M., Kenyon, S. J. & Gianninas, A. Most double degenerate low-mass
white dwarf binaries merge. The Astrophysical Journal 824, 46 (2016).
49. Bovy, J. & Rix, H.-W. A direct dynamical measurement of the Milky Way’s disk surface
density profile, disk scale length, and dark matter profile at 4 kpc < R < 9 kpc. The
Astrophysical Journal 779, 115 (2013).
44
Related Documents