BOHLER ENGINEERING♦ 1600 MANOR DRIVE ♦ SUITE 200 ♦ CHALFONT, PA 18914 ♦ 215.996.9100 General Project Description and Stormwater Management Calculations Project: Proposed Chase Bank West Chester Pike & S. Newtown Street Road Newtown Township Delaware County, PA Project Number: PC171098 Client: The Carol B. Blank 2012 Trusts for Children dated December 13, 2012 F/B/O Jill, The Carol B. Blank 2012 Trusts for Children dated December 13, 2012 F/B/O Sally, and the Carol B. Blank 2012 Trusts for Children dated December 13, 2012 F/B/O Phillip, as Tenants in Common 925 West Lancaster Avenue Suite 200 Bryn Mawr, PA 19010 Date: March 15, 2019 Revised: April 2, 2019 Last Revised: July 9, 2019 Professional Engineer: John P. Alejnikov PA License #PE086400

Welcome message from author
This document is posted to help you gain knowledge. Please leave a comment to let me know what you think about it! Share it to your friends and learn new things together.
Transcript
BOHLER ENGINEERING♦ 1600 MANOR DRIVE ♦ SUITE 200 ♦ CHALFONT, PA 18914 ♦ 215.996.9100
General Project Description and Stormwater Management Calculations
Project: Proposed Chase Bank West Chester Pike & S. Newtown Street Road Newtown Township Delaware County, PA Project Number: PC171098 Client: The Carol B. Blank 2012 Trusts for Children dated December 13, 2012 F/B/O Jill, The
Carol B. Blank 2012 Trusts for Children dated December 13, 2012 F/B/O Sally, and the Carol B. Blank 2012 Trusts for Children dated December 13, 2012 F/B/O Phillip, as Tenants in Common
925 West Lancaster Avenue Suite 200 Bryn Mawr, PA 19010 Date: March 15, 2019 Revised: April 2, 2019 Last Revised: July 9, 2019
Professional Engineer: John P. Alejnikov PA License #PE086400
Table of Contents
General Project Description/ Stormwater Management .................................................... 1 General Project Description ............................................................................................ 1 Stormwater Management ............................................................................................... 1 USGS Location Map ....................................................................................................... 2 Soils Map ...................................................................................................................... 3 Point of Interest #1 ............................................................................................................ 6 Hydrograph Summary Reports ........................................................................................ 7 Hydrograph Return Period Recap .................................................................................. 14 BMP Worksheets 4 & 5 ................................................................................................ 15 Pre-Development Runoff Calculations ............................................................................ 17 Post-Development Runoff Calculations .......................................................................... 18 Runoff Volume Summary ............................................................................................. 19 Runoff Rate Summary ................................................................................................. 20 Storm Drainage Calculations ............................................................................................. 21 Plan View ................................................................................................................... 22 Inlet Area Runoff Calculations ...................................................................................... 23 Pipe Report ................................................................................................................. 24 Node Report ............................................................................................................... 25 Combined Pipe/Node Report ........................................................................................ 26 Point of Interest #1 Hydrographs ..................................................................................... 27 Pre-Development ........................................................................................................ 28 Post-Development On-site to UGB-1 ............................................................................. 35 UGB-1 On-site Routing................................................................................................. 42 Post-Development Bypass ............................................................................................ 50 Post-Development Off-site to UGB-1 ............................................................................. 57 Post-Development Total to UGB-1 ................................................................................. 64 UGB-1 Total Routing .................................................................................................... 71 Appendix ................................................................................................................ Attached Stormwater Management Area Evaluation Report by Whitestone Associates Pre-Development Area Plan Post-Development Area Plan Inlet Drainage Area Plan
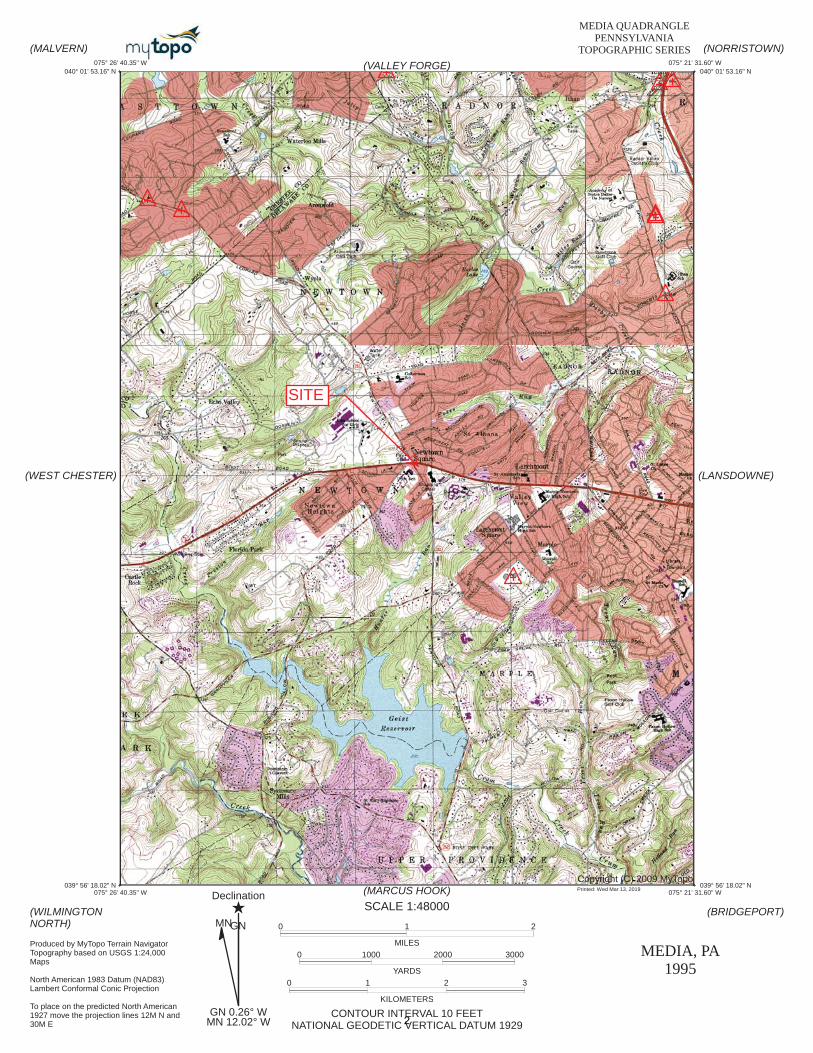
General Project Description/Stormwater Management GENERAL PROJECT DESCRIPTION The Carol B. Blank 2012 Trusts for Children dated December 13, 2012 F/B/O Jill, The Carol B. Blank 2012 Trusts for Children dated December 13, 2012 F/B/O Sally, and the Carol B. Blank 2012 Trusts for Children dated December 13, 2012 F/B/O Phillip, as Tenants in Common proposes to re-tenant a portion of the existing vacant building located at 3604 West Chester Pike in Newtown Township, PA into a financial institution. The proposal includes the installation of parking, utilities, landscaping and stormwater management controls necessary to support the redevelopment. Pertinent data characterizing the existing and future site conditions are shown on the accompanying Preliminary/Final Land Development Plans. STORMWATER MANAGEMENT The pre-development condition of the site consists of one point of interest, which is indicated on the attached Pre-Development Drainage Area Plan. The areas tributary to this point of interest has been delineated and hydrographs have been generated for the 1, 2, 5, 10, 25, 50, and 100-year storms. The pre-development conditions were analyzed based on existing conditions for all areas tributary to the point of interest. The post-development condition of the site maintains the same point of interest and relative drainage patterns. Although there is a decrease in impervious area of 0.07 acres, 20% of existing impervious coverage was considered meadow to meet Newtown Township Stormwater Management Ordinance requirements. As a result, there is an overall increase in runoff rates and volume. Therefore, one underground stormwater management basin has been designed. The area tributary to the underground basin has been delineated and hydrographs have been generated for the 1, 2, 5, 10, 25, 50, and 100-year storms. These hydrographs have been routed through the basin and added to the hydrographs generated for any bypass areas to determine the total post-development discharge rate. The Dekalb Rational Method was utilized for calculating the peak runoff rates and generating hydrographs for the pre- and post-development conditions as defined in the computer watershed software Hydraflow Hydrographs 2018. The hydrographs were generated based on the precipitation amounts dictated by the NOAA Atlas 14 for each storm event. The results of the analysis indicate that the redevelopment will decrease runoff rates and volume due to the aforementioned implementation of the underground stormwater management basin. The storm drainage system has been designed to intercept runoff at topographic low points and areas of significant runoff quantities and convey stormwater to the stormwater management basin. StormCAD version 8i has been utilized for designing the storm conveyance system. Conveyance design precipitation amounts are based on NOAA Atlas 14 for a 100-year storm event. The proposed stormwater management program described above has been designed to comply with the Newtown Township Stormwater Management Ordinance, NPDES Phase II (where applicable) and the Stormwater Management Act of 1978. R:\17\PC171098\Technical\Reports\SWM\Rev-1\PC171098 SWM-1.docx
1
(LANSDOWNE)
(VALLEY FORGE)
(MARCUS HOOK)
(BRIDGEPORT)
(NORRISTOWN)
(WILMINGTON NORTH)
(MALVERN)
(WEST CHESTER)
Copyright (C) 2009 MyTopo
CONTOUR INTERVAL 10 FEETNATIONAL GEODETIC VERTICAL DATUM 1929
SCALE 1:48000
0 1 2
MILES
0 1000 2000 3000
YARDS
0 1 2 3
KILOMETERS
Declination
MN 12.02° WGN 0.26° W
MNGN
MEDIA, PA1995
075° 21' 31.60" W
075° 21' 31.60" W+ 040° 01' 53.16" N
+ 039° 56' 18.02" N 039° 56' 18.02" N +
040° 01' 53.16" N +
075° 26' 40.35" W
075° 26' 40.35" W
Produced by MyTopo Terrain NavigatorTopography based on USGS 1:24,000 Maps
North American 1983 Datum (NAD83)Lambert Conformal Conic Projection
To place on the predicted North American 1927 move the projection lines 12M N and 30M E
MEDIA QUADRANGLEPENNSYLVANIA
TOPOGRAPHIC SERIES
Printed: Wed Mar 13, 2019
SITE
2
39° 5
9' 2
0'' N
75° 24' 17'' W39
° 5
9' 2
0'' N
75° 23' 40'' W
39° 5
9' 2
'' N
75° 24' 17'' W
39° 5
9' 2
'' N
75° 23' 40'' W
N
Map
pro
ject
ion:
Web
Mer
cato
r C
orne
r coo
rdin
ates
: WGS
84
Edge
tics
: UTM
Zon
e 18
N W
GS84
Feet
Met
ers
Map
Sca
le: 1
:3,9
90 if p
rinte
d on
A la
ndsc
ape
(11"
x 8
.5")
shee
t.
Soi
l Map
may
not
be
valid
at
this
sca
le.
3
4
5

Point of Interest #1
6

Hydrograph Summary Report
Hyd. Hydrograph Peak Time Time to Hyd. Inflow Maximum Total Hydrograph
No. type flow interval Peak volume hyd(s) elevation strge used Description
(origin) (cfs) (min) (min) (cuft) (ft) (cuft)
1 Dekalb 2.267 1 25 2,033 ------ ------ ------ DA-1E
3 Dekalb 1.635 1 25 1,467 ------ ------ ------ DA-1P to UGB-1
4 Reservoir 0.321 1 40 845 3 399.88 1,102 UGB-1 On-site Routing
6 Dekalb 0.550 1 25 493 ------ ------ ------ DA-1P Bypass
9 Dekalb 0.514 1 25 461 ------ ------ ------ DA-1P Offsite to UGB-1
10 Combine 2.149 1 25 1,928 3, 9 ------ ------ DA-1P Total to UGB-1
11 Reservoir 0.608 1 34 1,306 10 400.29 1,335 UGB-1 All Flow Routing
PC171098 Hydraflow_Rev-2.gpw Return Period: 1 Year Tuesday, 07 / 9 / 2019
Hydraflow Hydrographs Extension for Autodesk® Civil 3D® 2019 by Autodesk, Inc. v2020
7
Hydrograph Summary Report
Hyd. Hydrograph Peak Time Time to Hyd. Inflow Maximum Total Hydrograph
No. type flow interval Peak volume hyd(s) elevation strge used Description
(origin) (cfs) (min) (min) (cuft) (ft) (cuft)
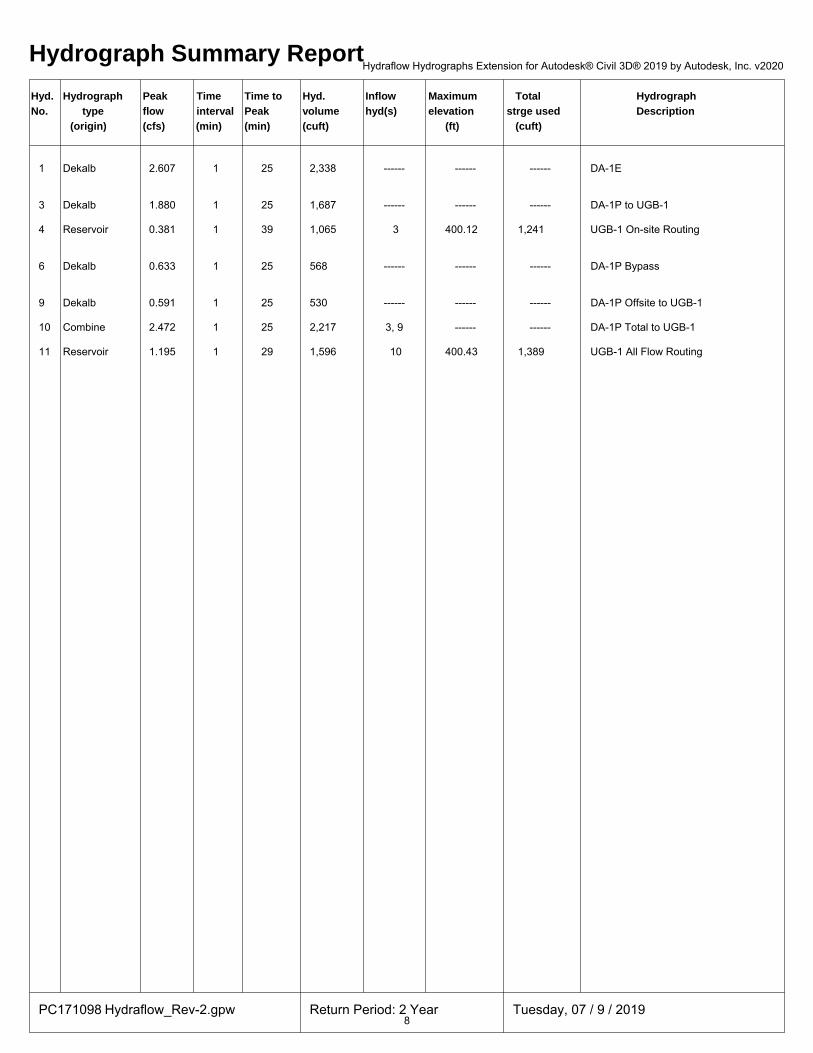
1 Dekalb 2.607 1 25 2,338 ------ ------ ------ DA-1E
3 Dekalb 1.880 1 25 1,687 ------ ------ ------ DA-1P to UGB-1
4 Reservoir 0.381 1 39 1,065 3 400.12 1,241 UGB-1 On-site Routing
6 Dekalb 0.633 1 25 568 ------ ------ ------ DA-1P Bypass
9 Dekalb 0.591 1 25 530 ------ ------ ------ DA-1P Offsite to UGB-1
10 Combine 2.472 1 25 2,217 3, 9 ------ ------ DA-1P Total to UGB-1
11 Reservoir 1.195 1 29 1,596 10 400.43 1,389 UGB-1 All Flow Routing
PC171098 Hydraflow_Rev-2.gpw Return Period: 2 Year Tuesday, 07 / 9 / 2019
Hydraflow Hydrographs Extension for Autodesk® Civil 3D® 2019 by Autodesk, Inc. v2020
8

Hydrograph Summary Report
Hyd. Hydrograph Peak Time Time to Hyd. Inflow Maximum Total Hydrograph
No. type flow interval Peak volume hyd(s) elevation strge used Description
(origin) (cfs) (min) (min) (cuft) (ft) (cuft)
1 Dekalb 3.118 1 25 2,797 ------ ------ ------ DA-1E
3 Dekalb 2.249 1 25 2,017 ------ ------ ------ DA-1P to UGB-1
4 Reservoir 0.724 1 31 1,396 3 400.33 1,348 UGB-1 On-site Routing
6 Dekalb 0.757 1 25 679 ------ ------ ------ DA-1P Bypass
9 Dekalb 0.707 1 25 634 ------ ------ ------ DA-1P Offsite to UGB-1
10 Combine 2.956 1 25 2,652 3, 9 ------ ------ DA-1P Total to UGB-1
11 Reservoir 2.064 1 27 2,031 10 400.60 1,449 UGB-1 All Flow Routing
PC171098 Hydraflow_Rev-2.gpw Return Period: 5 Year Tuesday, 07 / 9 / 2019
Hydraflow Hydrographs Extension for Autodesk® Civil 3D® 2019 by Autodesk, Inc. v2020
9
Hydrograph Summary Report
Hyd. Hydrograph Peak Time Time to Hyd. Inflow Maximum Total Hydrograph
No. type flow interval Peak volume hyd(s) elevation strge used Description
(origin) (cfs) (min) (min) (cuft) (ft) (cuft)
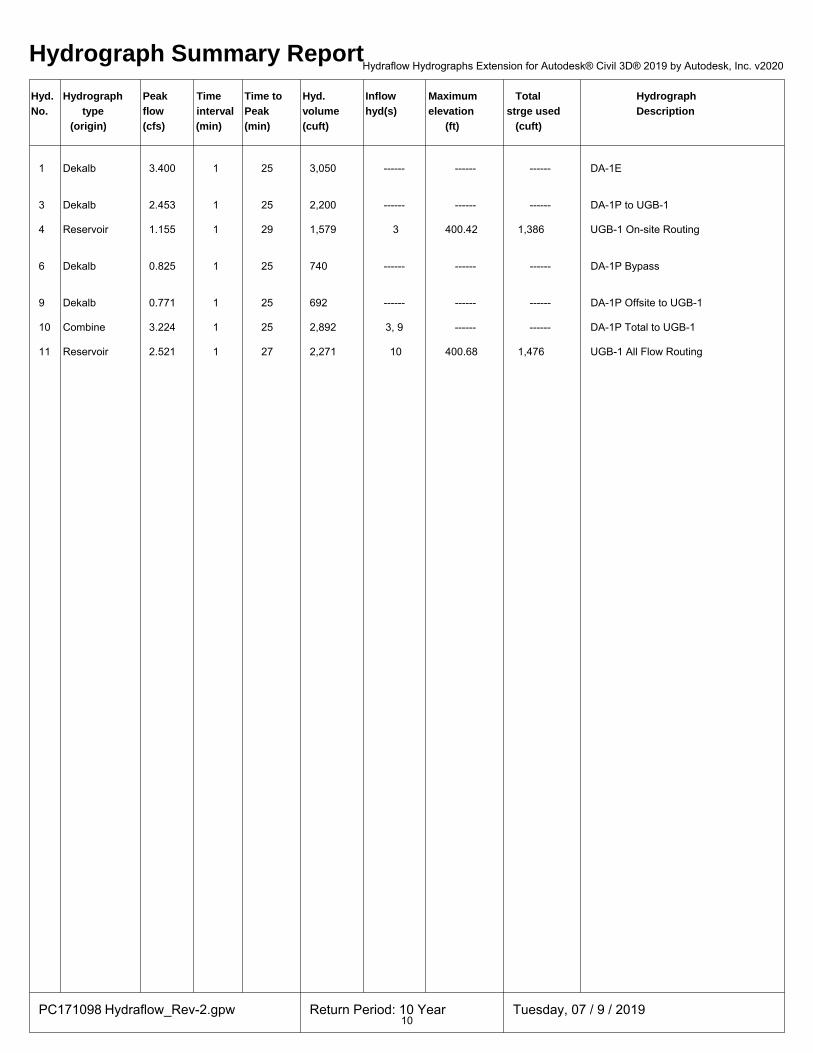
1 Dekalb 3.400 1 25 3,050 ------ ------ ------ DA-1E
3 Dekalb 2.453 1 25 2,200 ------ ------ ------ DA-1P to UGB-1
4 Reservoir 1.155 1 29 1,579 3 400.42 1,386 UGB-1 On-site Routing
6 Dekalb 0.825 1 25 740 ------ ------ ------ DA-1P Bypass
9 Dekalb 0.771 1 25 692 ------ ------ ------ DA-1P Offsite to UGB-1
10 Combine 3.224 1 25 2,892 3, 9 ------ ------ DA-1P Total to UGB-1
11 Reservoir 2.521 1 27 2,271 10 400.68 1,476 UGB-1 All Flow Routing
PC171098 Hydraflow_Rev-2.gpw Return Period: 10 Year Tuesday, 07 / 9 / 2019
Hydraflow Hydrographs Extension for Autodesk® Civil 3D® 2019 by Autodesk, Inc. v2020
10
Hydrograph Summary Report
Hyd. Hydrograph Peak Time Time to Hyd. Inflow Maximum Total Hydrograph
No. type flow interval Peak volume hyd(s) elevation strge used Description
(origin) (cfs) (min) (min) (cuft) (ft) (cuft)
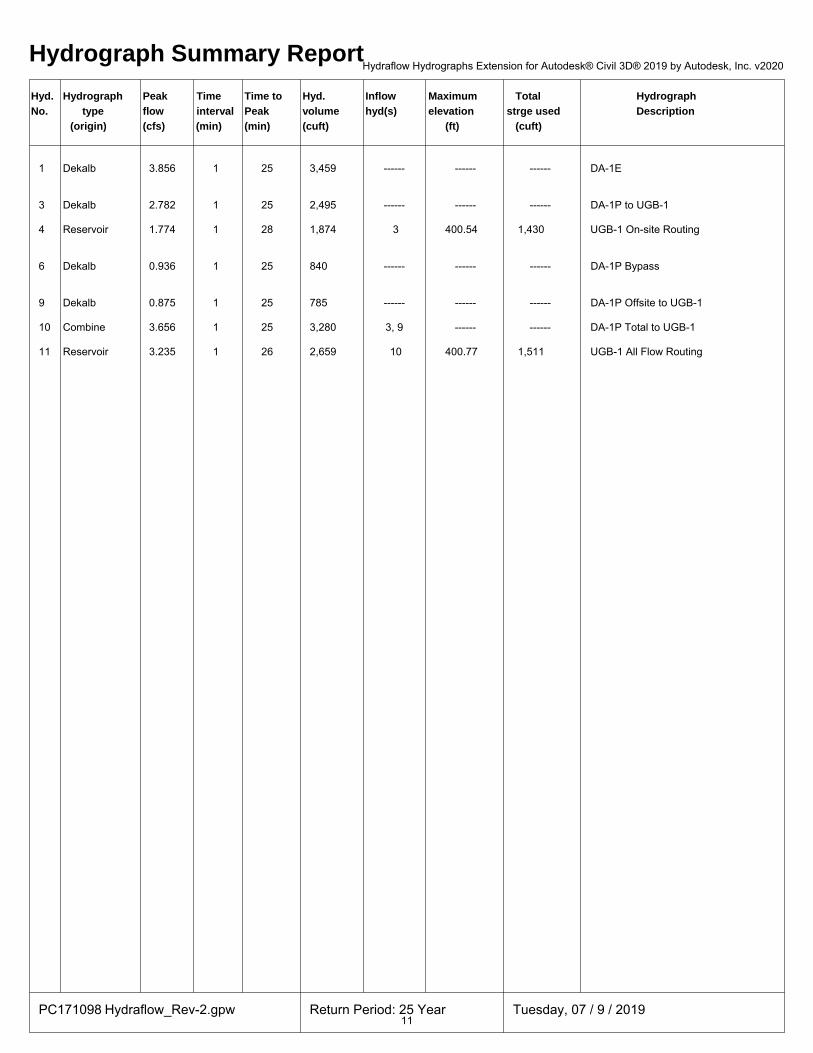
1 Dekalb 3.856 1 25 3,459 ------ ------ ------ DA-1E
3 Dekalb 2.782 1 25 2,495 ------ ------ ------ DA-1P to UGB-1
4 Reservoir 1.774 1 28 1,874 3 400.54 1,430 UGB-1 On-site Routing
6 Dekalb 0.936 1 25 840 ------ ------ ------ DA-1P Bypass
9 Dekalb 0.875 1 25 785 ------ ------ ------ DA-1P Offsite to UGB-1
10 Combine 3.656 1 25 3,280 3, 9 ------ ------ DA-1P Total to UGB-1
11 Reservoir 3.235 1 26 2,659 10 400.77 1,511 UGB-1 All Flow Routing
PC171098 Hydraflow_Rev-2.gpw Return Period: 25 Year Tuesday, 07 / 9 / 2019
Hydraflow Hydrographs Extension for Autodesk® Civil 3D® 2019 by Autodesk, Inc. v2020
11

Hydrograph Summary Report
Hyd. Hydrograph Peak Time Time to Hyd. Inflow Maximum Total Hydrograph
No. type flow interval Peak volume hyd(s) elevation strge used Description
(origin) (cfs) (min) (min) (cuft) (ft) (cuft)
1 Dekalb 4.308 1 25 3,864 ------ ------ ------ DA-1E
3 Dekalb 3.107 1 25 2,787 ------ ------ ------ DA-1P to UGB-1
4 Reservoir 2.331 1 27 2,166 3 400.64 1,466 UGB-1 On-site Routing
6 Dekalb 1.046 1 25 938 ------ ------ ------ DA-1P Bypass
9 Dekalb 0.977 1 25 877 ------ ------ ------ DA-1P Offsite to UGB-1
10 Combine 4.084 1 25 3,664 3, 9 ------ ------ DA-1P Total to UGB-1
11 Reservoir 3.760 1 26 3,042 10 400.85 1,534 UGB-1 All Flow Routing
PC171098 Hydraflow_Rev-2.gpw Return Period: 50 Year Tuesday, 07 / 9 / 2019
Hydraflow Hydrographs Extension for Autodesk® Civil 3D® 2019 by Autodesk, Inc. v2020
12
Hydrograph Summary Report
Hyd. Hydrograph Peak Time Time to Hyd. Inflow Maximum Total Hydrograph
No. type flow interval Peak volume hyd(s) elevation strge used Description
(origin) (cfs) (min) (min) (cuft) (ft) (cuft)
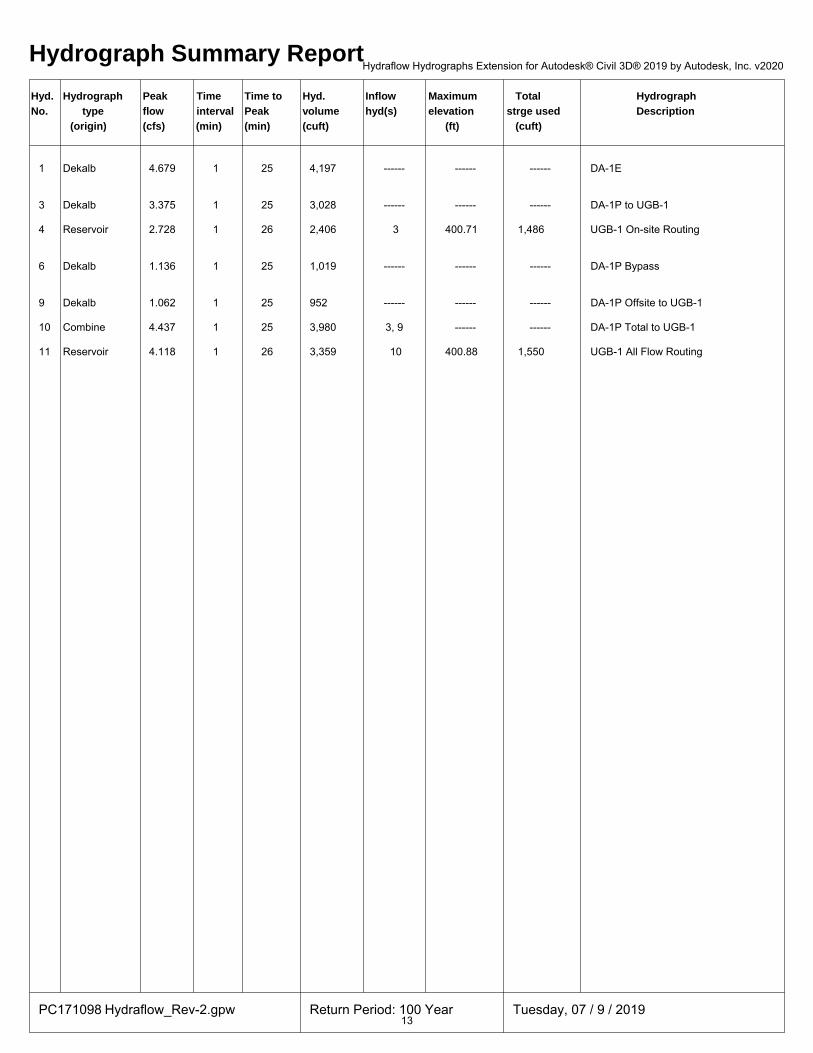
1 Dekalb 4.679 1 25 4,197 ------ ------ ------ DA-1E
3 Dekalb 3.375 1 25 3,028 ------ ------ ------ DA-1P to UGB-1
4 Reservoir 2.728 1 26 2,406 3 400.71 1,486 UGB-1 On-site Routing
6 Dekalb 1.136 1 25 1,019 ------ ------ ------ DA-1P Bypass
9 Dekalb 1.062 1 25 952 ------ ------ ------ DA-1P Offsite to UGB-1
10 Combine 4.437 1 25 3,980 3, 9 ------ ------ DA-1P Total to UGB-1
11 Reservoir 4.118 1 26 3,359 10 400.88 1,550 UGB-1 All Flow Routing
PC171098 Hydraflow_Rev-2.gpw Return Period: 100 Year Tuesday, 07 / 9 / 2019
Hydraflow Hydrographs Extension for Autodesk® Civil 3D® 2019 by Autodesk, Inc. v2020
13
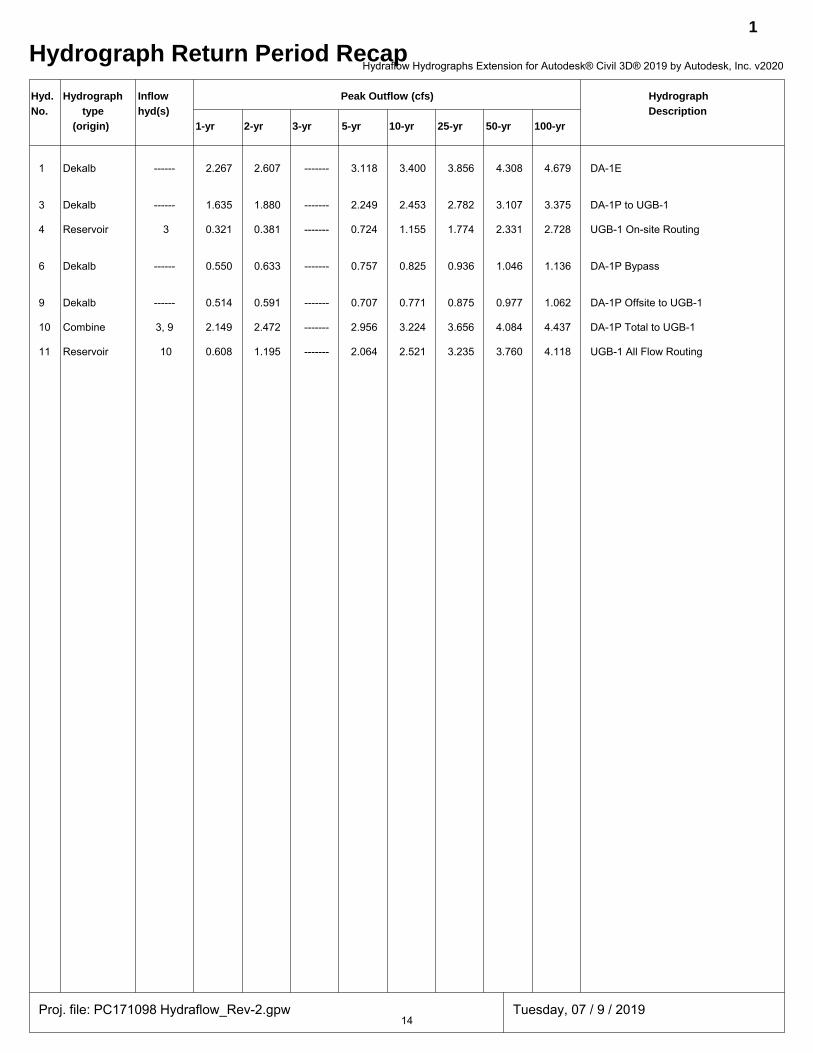
Hydrograph Return Period Recap1
Hyd. Hydrograph Inflow Peak Outflow (cfs) Hydrograph
No. type hyd(s) Description
(origin) 1-yr 2-yr 3-yr 5-yr 10-yr 25-yr 50-yr 100-yr
1 Dekalb ------ 2.267 2.607 ------- 3.118 3.400 3.856 4.308 4.679 DA-1E
3 Dekalb ------ 1.635 1.880 ------- 2.249 2.453 2.782 3.107 3.375 DA-1P to UGB-1
4 Reservoir 3 0.321 0.381 ------- 0.724 1.155 1.774 2.331 2.728 UGB-1 On-site Routing
6 Dekalb ------ 0.550 0.633 ------- 0.757 0.825 0.936 1.046 1.136 DA-1P Bypass
9 Dekalb ------ 0.514 0.591 ------- 0.707 0.771 0.875 0.977 1.062 DA-1P Offsite to UGB-1
10 Combine 3, 9 2.149 2.472 ------- 2.956 3.224 3.656 4.084 4.437 DA-1P Total to UGB-1
11 Reservoir 10 0.608 1.195 ------- 2.064 2.521 3.235 3.760 4.118 UGB-1 All Flow Routing
Proj. file: PC171098 Hydraflow_Rev-2.gpw Tuesday, 07 / 9 / 2019
Hydraflow Hydrographs Extension for Autodesk® Civil 3D® 2019 by Autodesk, Inc. v2020
14
3800-PM-BCW0405b 12/2017Checklist
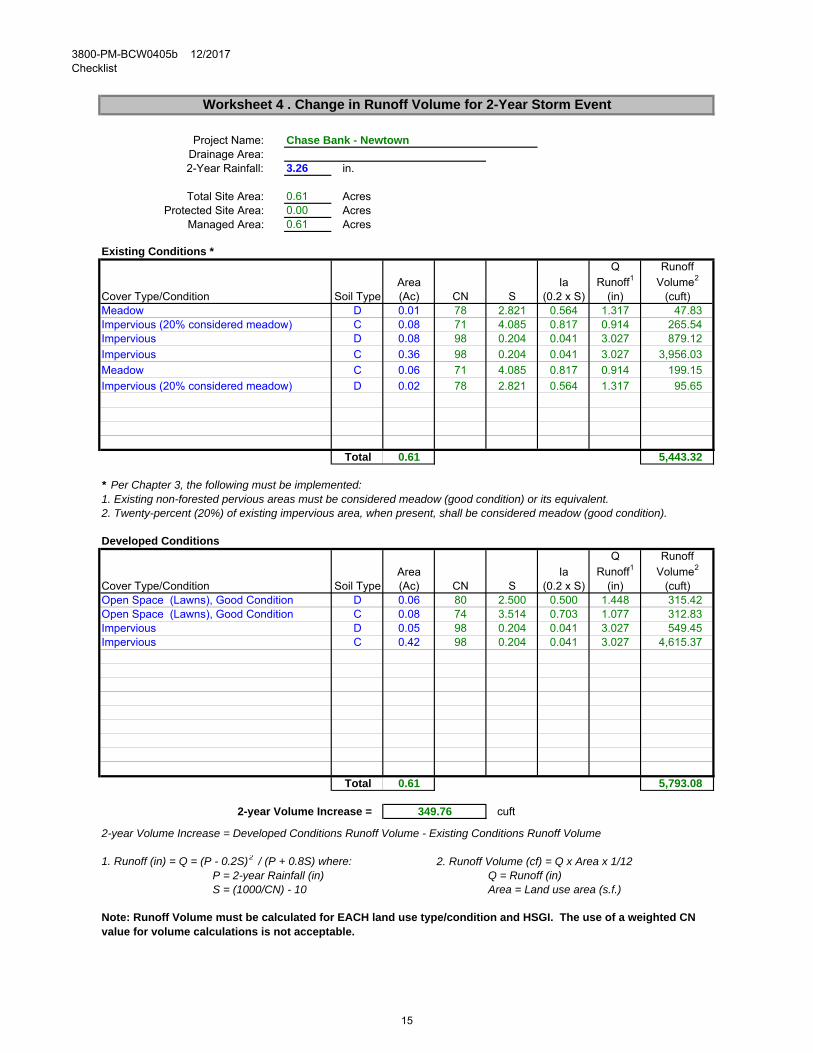
Project Name:Drainage Area:2-Year Rainfall: 3.26 in.
Total Site Area: 0.61 AcresProtected Site Area: 0.00 Acres
Managed Area: 0.61 Acres
Existing Conditions *Q Runoff
Area Ia Runoff1 Volume2
Soil Type (Ac) CN S (0.2 x S) (in) (cuft)D 0.01 78 2.821 0.564 1.317 47.83C 0.08 71 4.085 0.817 0.914 265.54D 0.08 98 0.204 0.041 3.027 879.12C 0.36 98 0.204 0.041 3.027 3,956.03C 0.06 71 4.085 0.817 0.914 199.15D 0.02 78 2.821 0.564 1.317 95.65
Total 0.61 5,443.32
* Per Chapter 3, the following must be implemented:1. Existing non-forested pervious areas must be considered meadow (good condition) or its equivalent.2. Twenty-percent (20%) of existing impervious area, when present, shall be considered meadow (good condition).
Developed ConditionsQ Runoff
Area Ia Runoff1 Volume2
Soil Type (Ac) CN S (0.2 x S) (in) (cuft)D 0.06 80 2.500 0.500 1.448 315.42C 0.08 74 3.514 0.703 1.077 312.83D 0.05 98 0.204 0.041 3.027 549.45C 0.42 98 0.204 0.041 3.027 4,615.37
Total 0.61 5,793.08
2-year Volume Increase = cuft
2-year Volume Increase = Developed Conditions Runoff Volume - Existing Conditions Runoff Volume
1. Runoff (in) = Q = (P - 0.2S)2 / (P + 0.8S) where: 2. Runoff Volume (cf) = Q x Area x 1/12P = 2-year Rainfall (in) Q = Runoff (in)S = (1000/CN) - 10 Area = Land use area (s.f.)
Impervious
Impervious
Worksheet 4 . Change in Runoff Volume for 2-Year Storm Event
Chase Bank - Newtown
Cover Type/ConditionMeadow
Impervious (20% considered meadow)
Cover Type/Condition
Note: Runoff Volume must be calculated for EACH land use type/condition and HSGI. The use of a weighted CN value for volume calculations is not acceptable.
349.76
Impervious
Impervious (20% considered meadow)
MeadowImpervious
Open Space (Lawns), Good ConditionOpen Space (Lawns), Good Condition
15
3800-PM-BCW0405b 12/2017Checklist
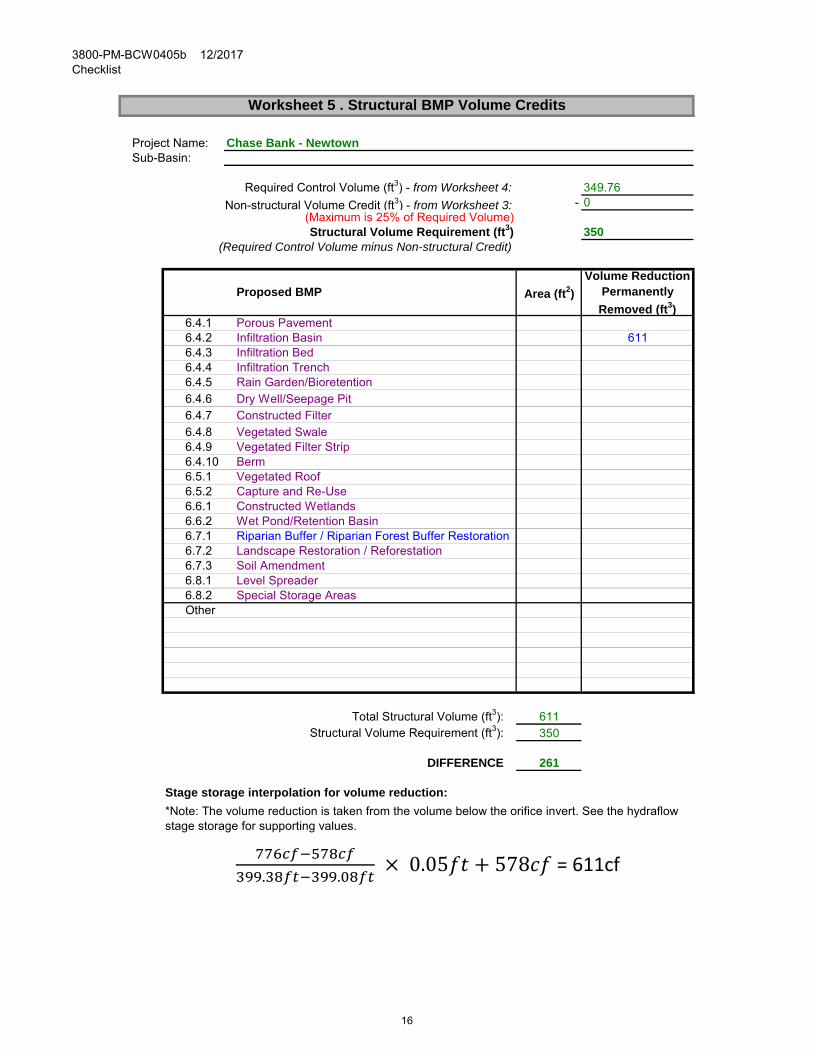
Project Name:Sub-Basin:
349.76- 0
350(Required Control Volume minus Non-structural Credit)
Area (ft2)
Volume Reduction Permanently
Removed (ft3)6.4.16.4.2 6116.4.36.4.46.4.56.4.66.4.76.4.86.4.96.4.106.5.16.5.26.6.16.6.26.7.16.7.26.7.36.8.16.8.2Other
611Structural Volume Requirement (ft3): 350
DIFFERENCE 261
Stage storage interpolation for volume reduction:
*Note: The volume reduction is taken from the volume below the orifice invert. See the hydraflow stage storage for supporting values.
Worksheet 5 . Structural BMP Volume Credits
Chase Bank - Newtown
Proposed BMP
Non-structural Volume Credit (ft3) - from Worksheet 3:
Required Control Volume (ft3) - from Worksheet 4:
Structural Volume Requirement (ft3)
Porous PavementInfiltration Basin
Total Structural Volume (ft3):
Constructed WetlandsWet Pond/Retention Basin
Infiltration BedInfiltration TrenchRain Garden/BioretentionDry Well/Seepage PitConstructed FilterVegetated Swale
Special Storage Areas
Riparian Buffer / Riparian Forest Buffer RestorationLandscape Restoration / ReforestationSoil AmendmentLevel Spreader
(Maximum is 25% of Required Volume)
Vegetated Filter StripBermVegetated RoofCapture and Re-Use
. . 0.05 578 = 611cf
16
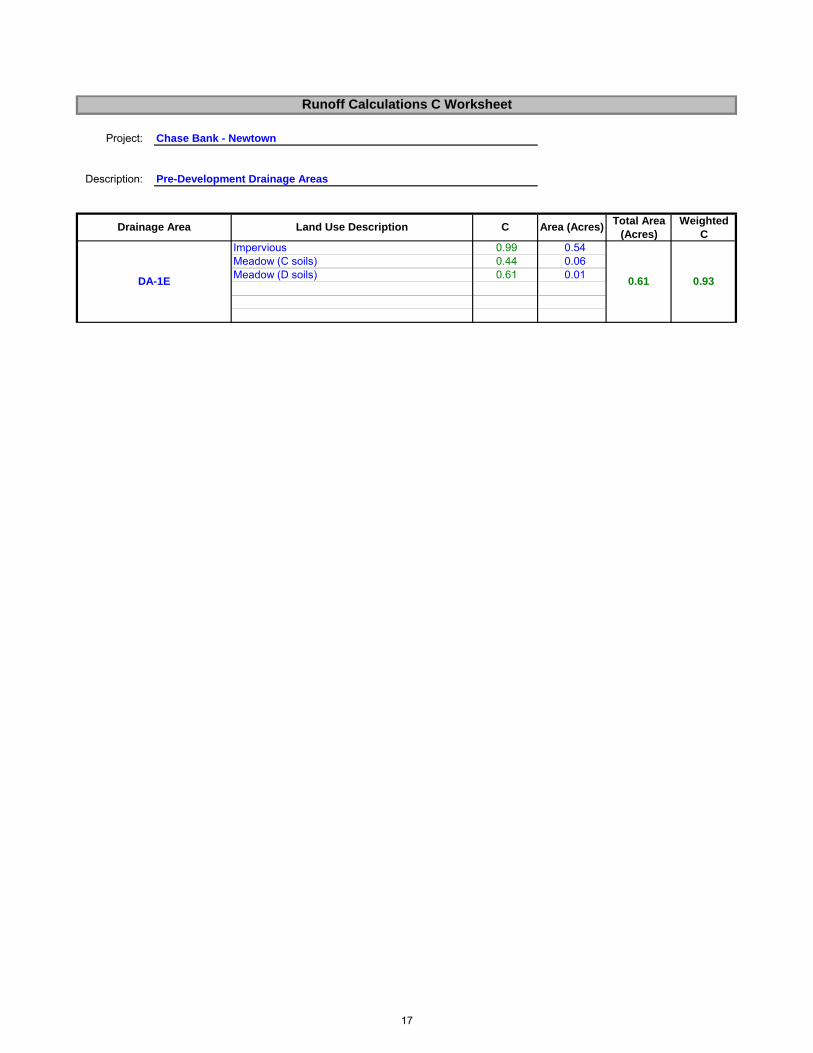
Project: Chase Bank - Newtown
Description: Pre-Development Drainage Areas
Total Area Weighted(Acres) C
0.99 0.540.44 0.060.61 0.01
Area (Acres)
ImperviousMeadow (C soils)
C
Meadow (D soils)
Runoff Calculations C Worksheet
0.61DA-1E
Land Use DescriptionDrainage Area
0.93
17
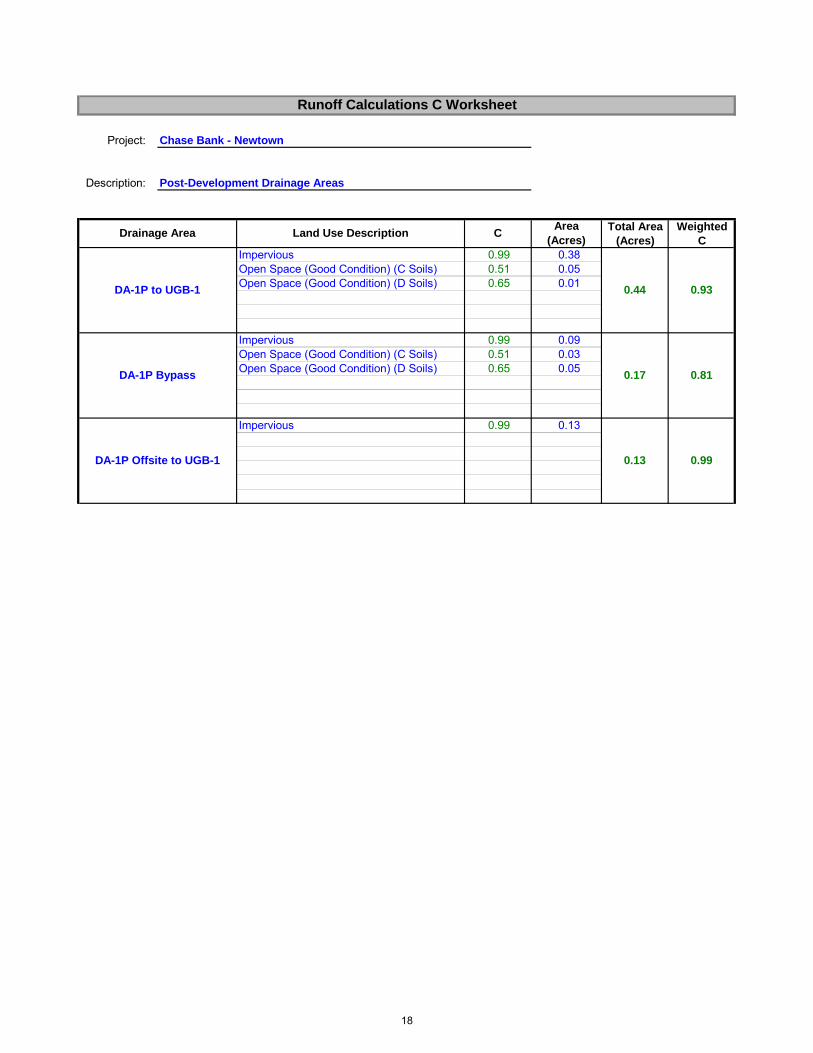
Project: Chase Bank - Newtown
Description: Post-Development Drainage Areas
Total Area Weighted(Acres) C
0.99 0.380.51 0.050.65 0.01
0.99 0.090.51 0.030.65 0.05
0.99 0.13
DA-1P Offsite to UGB-1
Impervious
0.13 0.99
DA-1P Bypass
Impervious
0.17 0.81
Open Space (Good Condition) (C Soils)Open Space (Good Condition) (D Soils)
DA-1P to UGB-1
Impervious
0.44 0.93
Open Space (Good Condition) (C Soils)Open Space (Good Condition) (D Soils)
Runoff Calculations C Worksheet
Drainage Area Land Use Description CArea
(Acres)
18
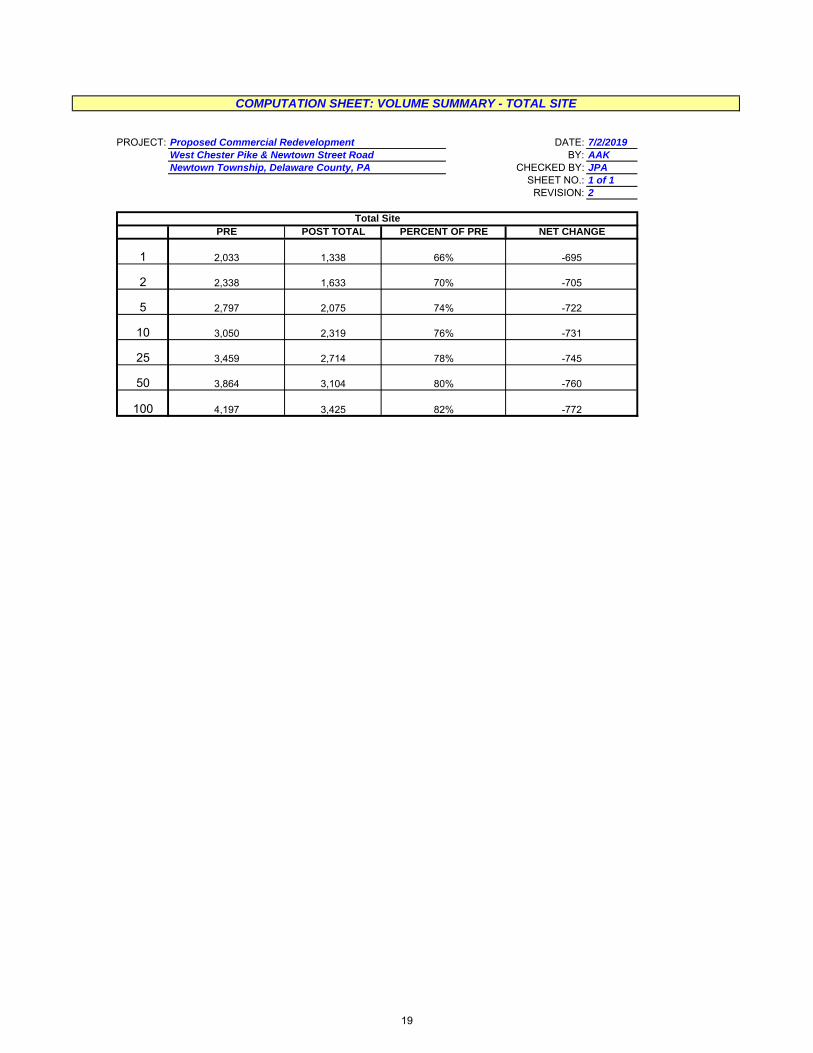
PROJECT: DATE: 7/2/2019BY: AAK
CHECKED BY: JPASHEET NO.: 1 of 1
REVISION: 2
Total Site
Newtown Township, Delaware County, PA
Proposed Commercial Redevelopment
1,338 66% -695
PRE POST TOTAL PERCENT OF PRE NET CHANGE
2 2,338 1,633 70% -705
1 2,033
2,319 76% -731
5 2,797 2,075 74% -722
25 3,459 2,714 78% -745
10 3,050
-772
50 3,864 3,104 80% -760
West Chester Pike & Newtown Street Road
COMPUTATION SHEET: VOLUME SUMMARY - TOTAL SITE
100 4,197 3,425 82%
19
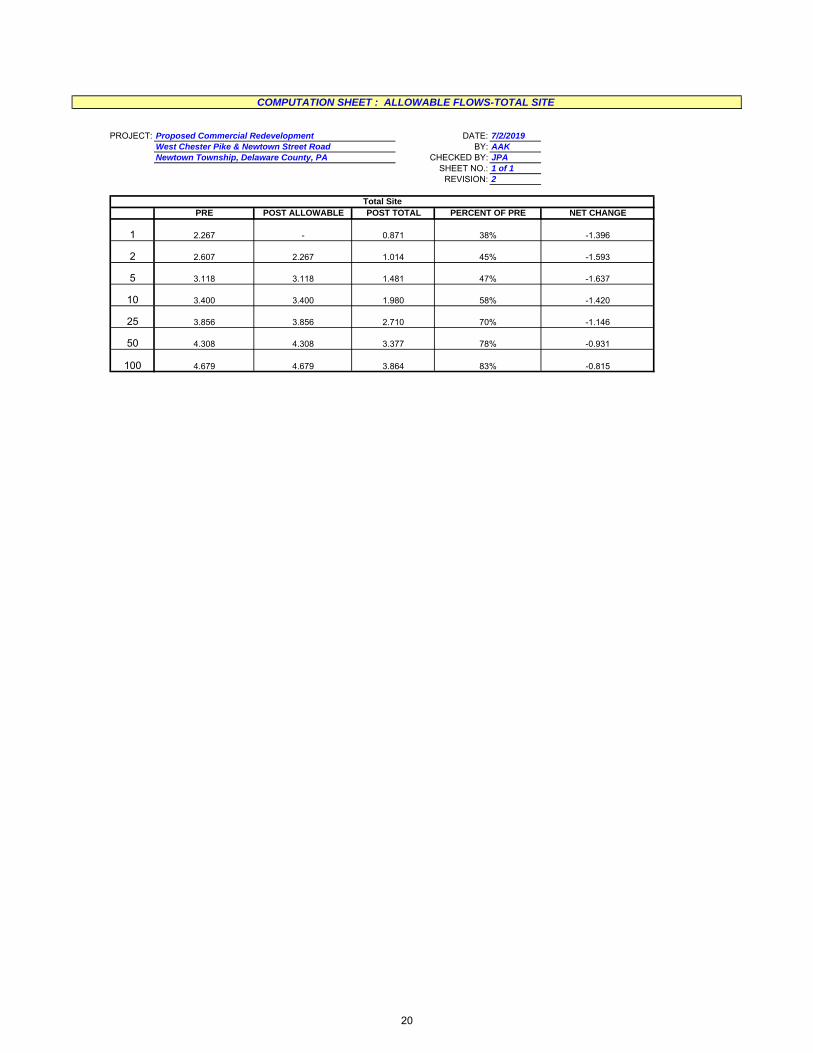
PROJECT: DATE: 7/2/2019BY: AAK
CHECKED BY: JPASHEET NO.: 1 of 1
REVISION: 2
-1.396
Proposed Commercial RedevelopmentWest Chester Pike & Newtown Street RoadNewtown Township, Delaware County, PA
Total SitePRE POST ALLOWABLE POST TOTAL PERCENT OF PRE
-1.593
1 2.267 - 0.871 38%
NET CHANGE
58%
2 2.607 2.267 1.014 45%
25 3.856 3.856 2.710 70% -1.146
10 3.400
50 4.308 4.308 3.377 78% -0.931
-0.815100 4.679 4.679 3.864 83%
-1.637
-1.420
COMPUTATION SHEET : ALLOWABLE FLOWS-TOTAL SITE
5 3.118 3.118 1.481 47%
3.400 1.980
20

Storm Drainage Calculations
21
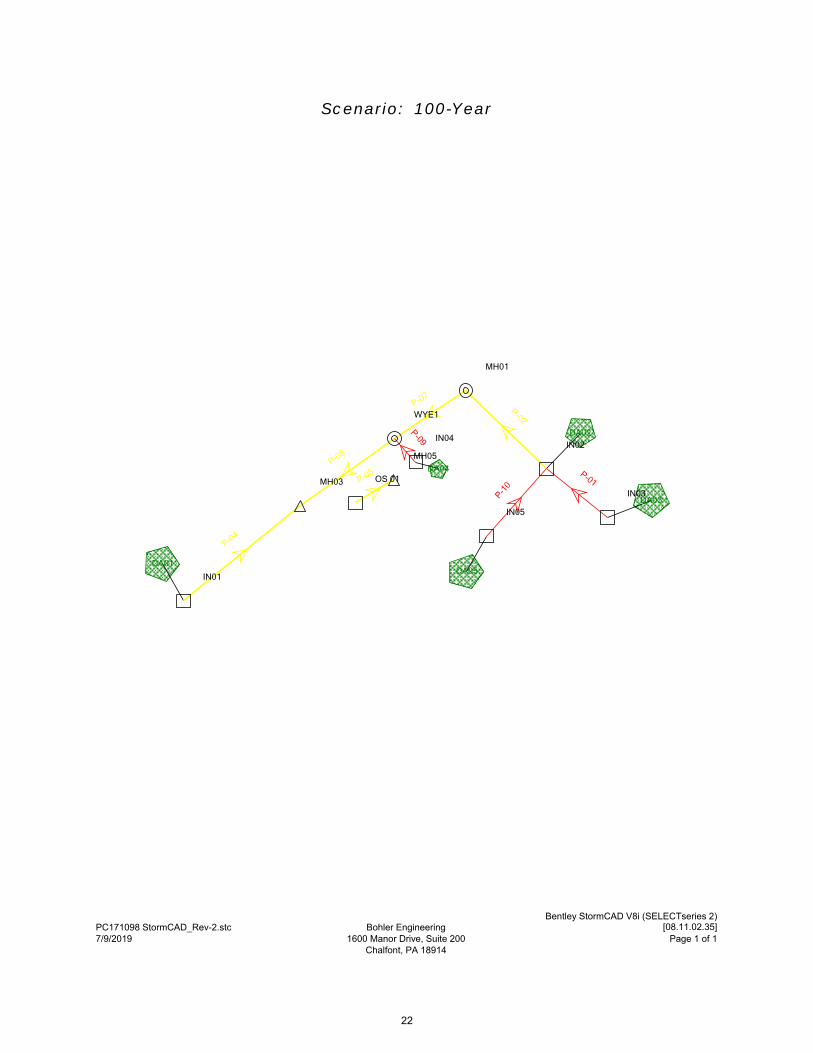
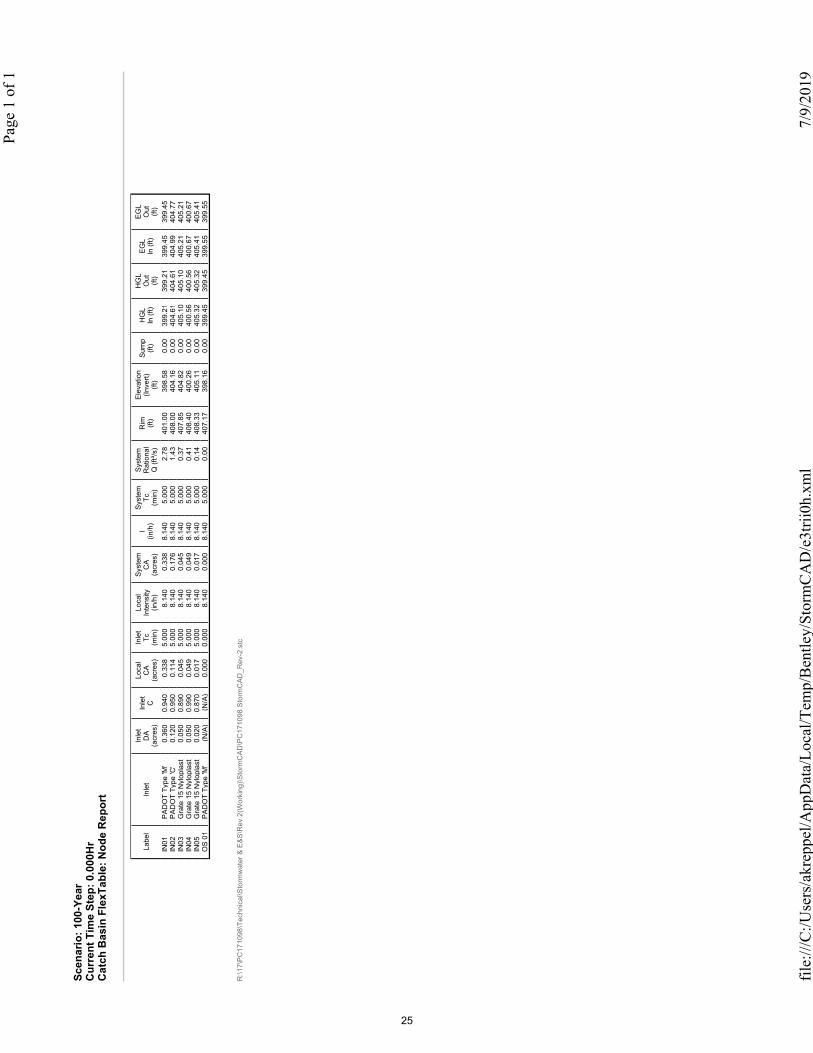
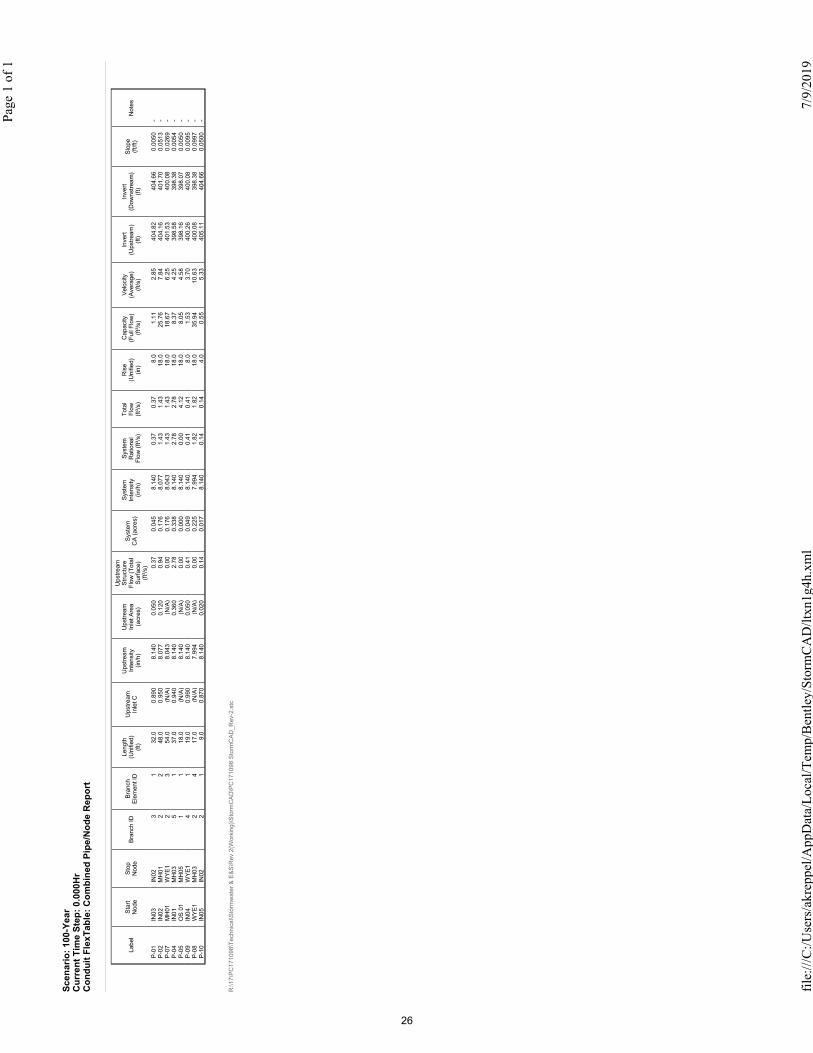
Scenario: 100-Year
DA05
DA04
DA03
DA02
DA01
P-02
P-01
P-07P-09
P-05P-08
P-04
P-10MH03
MH05
MH01
WYE1
OS 01
IN01
IN04IN02
IN03
IN05
Chalfont, PA 18914Page 1 of 11600 Manor Drive, Suite 2007/9/2019
Bentley StormCAD V8i (SELECTseries 2)[08.11.02.35]Bohler EngineeringPC171098 StormCAD_Rev-2.stc
22
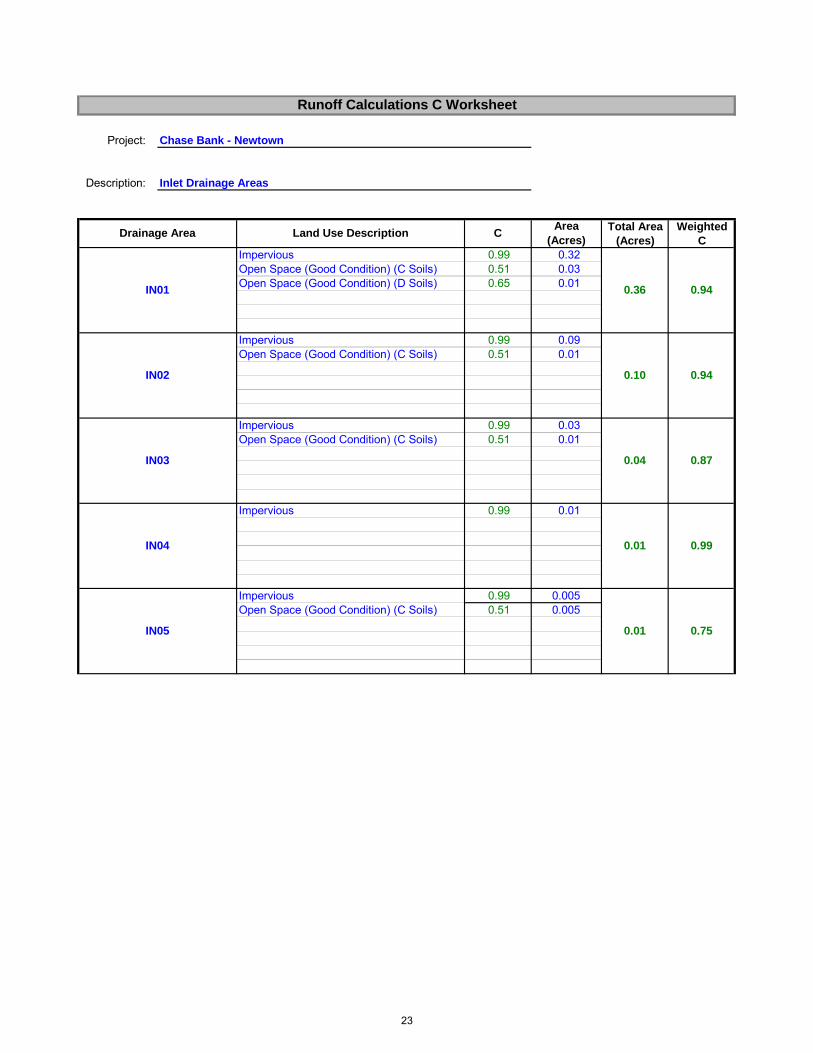
Project: Chase Bank - Newtown
Description: Inlet Drainage Areas
Total Area Weighted(Acres) C
0.99 0.320.51 0.030.65 0.01
0.99 0.090.51 0.01
0.99 0.030.51 0.01
0.99 0.01
0.99 0.0050.51 0.005
IN05
Impervious
0.01 0.75
Open Space (Good Condition) (C Soils)
IN04
Impervious
0.01 0.99
IN03
Impervious
0.04 0.87
Open Space (Good Condition) (C Soils)
IN02
Impervious
0.10 0.94
Open Space (Good Condition) (C Soils)
IN01
Impervious
0.36 0.94
Open Space (Good Condition) (C Soils)Open Space (Good Condition) (D Soils)
Runoff Calculations C Worksheet
Drainage Area Land Use Description CArea
(Acres)
23
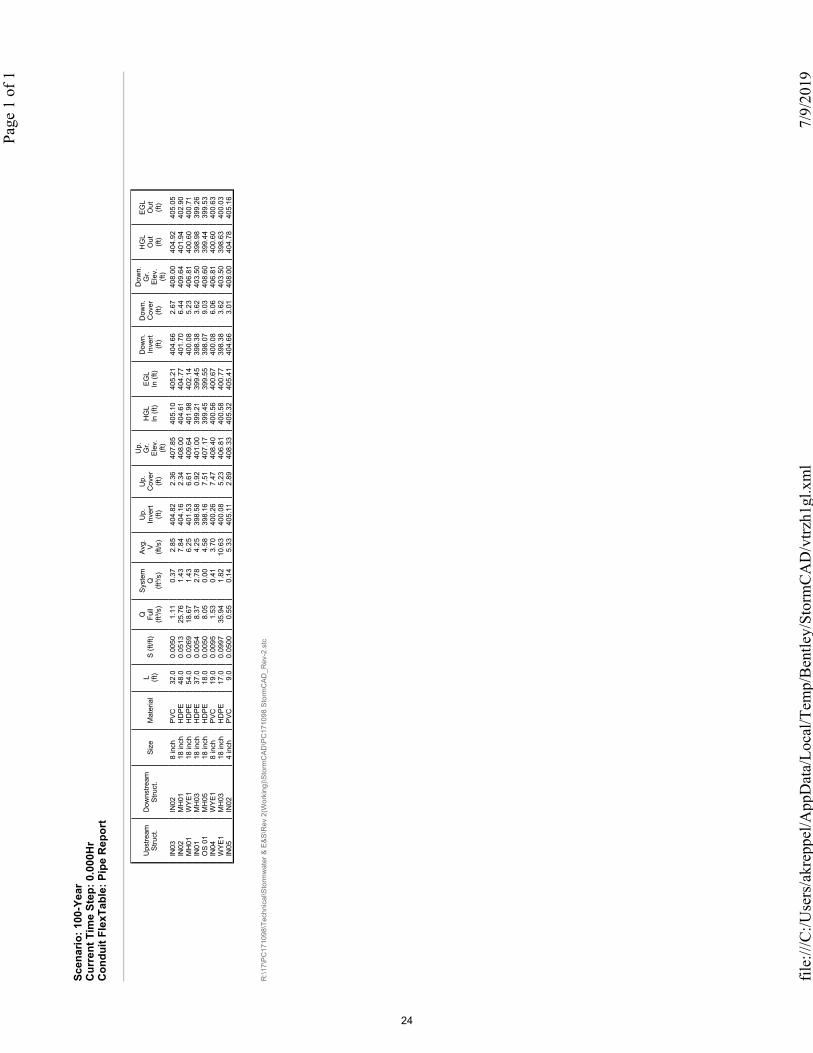
Scen
ario
: 100
-Yea
rC
urre
nt T
ime
Step
: 0.0
00H
rC
ondu
it Fl
exTa
ble:
Pip
e R
epor
t
R:\1
7\P
C17
1098
\Tec
hnic
al\S
torm
wat
er &
E&
S\R
ev 2
(Wor
king
)\Sto
rmC
AD
\PC
1710
98 S
torm
CA
D_R
ev-2
.stc
Ups
tream
S
truct
.D
owns
tream
S
truct
.S
ize
Mat
eria
lL (ft
)S
(ft/f
t)Q
Fu
ll (ft
³/s)
Sys
tem
Q
(ft
³/s)
Avg
. V
(ft
/s)
Up.
In
vert
(ft)
Up.
C
over
(ft
)
Up.
G
r. E
lev.
(ft
)
HG
L In
(ft)
EG
L In
(ft)
Dow
n.
Inve
rt (ft
)
Dow
n.
Cov
er
(ft)
Dow
n.
Gr.
Ele
v.
(ft)
HG
L O
ut
(ft)
EG
L O
ut
(ft)
IN03
IN02
8 in
chP
VC
32.0
0.00
501.
110.
372.
8540
4.82
2.36
407.
8540
5.10
405.
2140
4.66
2.67
408.
0040
4.92
405.
05IN
02M
H01
18 in
chH
DP
E48
.00.
0513
25.7
61.
437.
8440
4.16
2.34
408.
0040
4.61
404.
7740
1.70
6.44
409.
6440
1.94
402.
90M
H01
WY
E1
18 in
chH
DP
E54
.00.
0269
18.6
71.
436.
2540
1.53
6.61
409.
6440
1.98
402.
1440
0.08
5.23
406.
8140
0.60
400.
71IN
01M
H03
18 in
chH
DP
E37
.00.
0054
8.37
2.78
4.25
398.
580.
9240
1.00
399.
2139
9.45
398.
383.
6240
3.50
398.
9839
9.26
OS
01
MH
0518
inch
HD
PE
18.0
0.00
508.
050.
004.
5839
8.16
7.51
407.
1739
9.45
399.
5539
8.07
9.03
408.
6039
9.44
399.
53IN
04W
YE
18
inch
PV
C19
.00.
0095
1.53
0.41
3.70
400.
267.
4740
8.40
400.
5640
0.67
400.
086.
0640
6.81
400.
6040
0.63
WY
E1
MH
0318
inch
HD
PE
17.0
0.09
9735
.94
1.82
10.6
340
0.08
5.23
406.
8140
0.58
400.
7739
8.38
3.62
403.
5039
8.63
400.
03IN
05IN
024
inch
PV
C9.
00.
0500
0.55
0.14
5.33
405.
112.
8940
8.33
405.
3240
5.41
404.
663.
0140
8.00
404.
7840
5.16
Page
1of
1
7/9/
2019
file:
///C
:/Use
rs/a
krep
pel/A
ppD
ata/
Loca
l/Tem
p/B
entle
y/St
orm
CA
D/v
trzh1
gl.x
ml
24
Scen
ario
: 100
-Yea
rC
urre
nt T
ime
Step
: 0.0
00H
rC
atch
Bas
in F
lexT
able
: Nod
e R
epor
t
R:\1
7\P
C17
1098
\Tec
hnic
al\S
torm
wat
er &
E&
S\R
ev 2
(Wor
king
)\Sto
rmC
AD
\PC
1710
98 S
torm
CA
D_R
ev-2
.stc
Labe
lIn
let
Inle
t D
A
(acr
es)
Inle
t C
Loca
l C
A
(acr
es)
Inle
t Tc
(m
in)
Loca
l In
tens
ity
(in/h
)
Sys
tem
C
A
(acr
es)
I (in
/h)
Sys
tem
Tc
(m
in)
Sys
tem
R
atio
nal
Q (f
t³/s)
Rim
(ft
)
Ele
vatio
n (In
vert)
(ft
)
Sum
p (ft
)H
GL
In (f
t)
HG
L O
ut
(ft)
EG
L In
(ft)
EG
L O
ut
(ft)
IN01
PA
DO
T Ty
pe 'M
'0.
360
0.94
00.
338
5.00
08.
140
0.33
88.
140
5.00
02.
7840
1.00
398.
580.
0039
9.21
399.
2139
9.45
399.
45IN
02P
AD
OT
Type
'C'
0.12
00.
950
0.11
45.
000
8.14
00.
176
8.14
05.
000
1.43
408.
0040
4.16
0.00
404.
6140
4.61
404.
9940
4.77
IN03
Gra
te 1
5 N
ylop
last
0.05
00.
890
0.04
55.
000
8.14
00.
045
8.14
05.
000
0.37
407.
8540
4.82
0.00
405.
1040
5.10
405.
2140
5.21
IN04
Gra
te 1
5 N
ylop
last
0.05
00.
990
0.04
95.
000
8.14
00.
049
8.14
05.
000
0.41
408.
4040
0.26
0.00
400.
5640
0.56
400.
6740
0.67
IN05
Gra
te 1
5 N
ylop
last
0.02
00.
870
0.01
75.
000
8.14
00.
017
8.14
05.
000
0.14
408.
3340
5.11
0.00
405.
3240
5.32
405.
4140
5.41
OS
01
PA
DO
T Ty
pe 'M
'(N
/A)
(N/A
)0.
000
0.00
08.
140
0.00
08.
140
5.00
00.
0040
7.17
398.
160.
0039
9.45
399.
4539
9.55
399.
55
Page
1of
1
7/9/
2019
file:
///C
:/Use
rs/a
krep
pel/A
ppD
ata/
Loca
l/Tem
p/B
entle
y/St
orm
CA
D/e
3trii
0h.x
ml
25
Scen
ario
: 100
-Yea
rC
urre
nt T
ime
Step
: 0.0
00H
rC
ondu
it Fl
exTa
ble:
Com
bine
d Pi
pe/N
ode
Rep
ort
R:\1
7\PC
1710
98\T
echn
ical
\Sto
rmw
ater
& E
&S\R
ev 2
(Wor
king
)\Sto
rmC
AD\P
C17
1098
Sto
rmC
AD
_Rev
-2.s
tc
Labe
lSt
art
Nod
eSt
op
Nod
eBr
anch
IDBr
anch
El
emen
t ID
Leng
th
(Uni
fied)
(ft
)U
pstre
am
Inle
t C
Ups
tream
In
tens
ity
(in/h
)
Ups
tream
In
let A
rea
(acr
es)
Ups
tream
St
ruct
ure
Flow
(Tot
al
Surfa
ce)
(ft³/s
)
Syst
em
CA
(acr
es)
Syst
em
Inte
nsity
(in
/h)
Syst
em
Rat
iona
l Fl
ow (f
t³/s)
Tota
l Fl
ow
(ft³/s
)
Ris
e (U
nifie
d)
(in)
Cap
acity
(F
ull F
low
) (ft
³/s)
Velo
city
(A
vera
ge)
(ft/s
)
Inve
rt (U
pstre
am)
(ft)
Inve
rt (D
owns
tream
) (ft
)Sl
ope
(ft/ft
)N
otes
P-01
IN03
IN02
31
32.0
0.89
08.
140
0.05
00.
370.
045
8.14
00.
370.
378.
01.
112.
8540
4.82
404.
660.
0050
-P-
02IN
02M
H01
22
48.0
0.95
08.
077
0.12
00.
940.
176
8.07
71.
431.
4318
.025
.76
7.84
404.
1640
1.70
0.05
13-
P-07
MH
01W
YE1
23
54.0
(N/A
)8.
043
(N/A
)0.
000.
176
8.04
31.
431.
4318
.018
.67
6.25
401.
5340
0.08
0.02
69-
P-04
IN01
MH
035
137
.00.
940
8.14
00.
360
2.78
0.33
88.
140
2.78
2.78
18.0
8.37
4.25
398.
5839
8.38
0.00
54-
P-05
OS
01M
H05
11
18.0
(N/A
)8.
140
(N/A
)0.
000.
000
8.14
00.
004.
1218
.08.
054.
5839
8.16
398.
070.
0050
-P-
09IN
04W
YE1
41
19.0
0.99
08.
140
0.05
00.
410.
049
8.14
00.
410.
418.
01.
533.
7040
0.26
400.
080.
0095
-P-
08W
YE1
MH
032
417
.0(N
/A)
7.99
4(N
/A)
0.00
0.22
57.
994
1.82
1.82
18.0
35.9
410
.63
400.
0839
8.38
0.09
97-
P-10
IN05
IN02
21
9.0
0.87
08.
140
0.02
00.
140.
017
8.14
00.
140.
144.
00.
555.
3340
5.11
404.
660.
0500
-Page
1of
1
7/9/
2019
file:
///C
:/Use
rs/a
krep
pel/A
ppD
ata/
Loca
l/Tem
p/B
entle
y/St
orm
CA
D/lt
xn1g
4h.x
ml
26

Point of Interest #1 Hydrographs
27
Hydrograph ReportHydraflow Hydrographs Extension for Autodesk® Civil 3D® 2019 by Autodesk, Inc. v2020 Tuesday, 07 / 9 / 2019
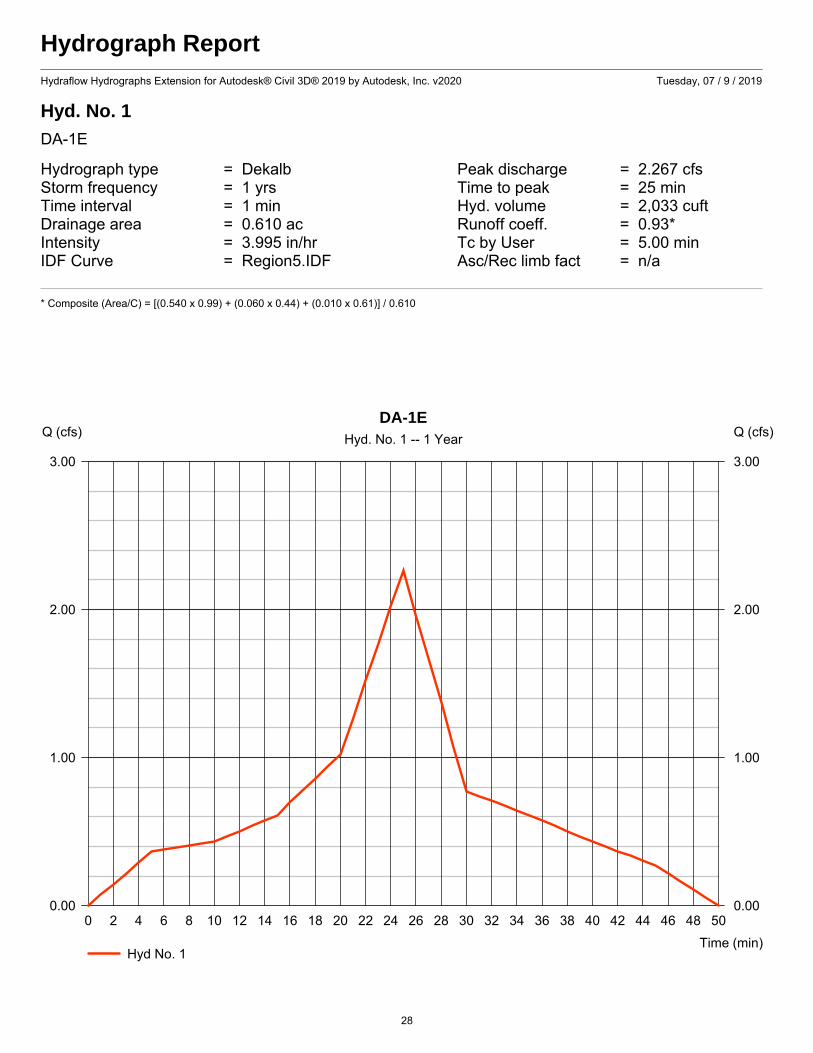
Hyd. No. 1
DA-1E
Hydrograph type = Dekalb Peak discharge = 2.267 cfsStorm frequency = 1 yrs Time to peak = 25 minTime interval = 1 min Hyd. volume = 2,033 cuftDrainage area = 0.610 ac Runoff coeff. = 0.93*Intensity = 3.995 in/hr Tc by User = 5.00 minIDF Curve = Region5.IDF Asc/Rec limb fact = n/a
* Composite (Area/C) = [(0.540 x 0.99) + (0.060 x 0.44) + (0.010 x 0.61)] / 0.610
0 2 4 6 8 10 12 14 16 18 20 22 24 26 28 30 32 34 36 38 40 42 44 46 48 50
Q (cfs)
0.00 0.00
1.00 1.00
2.00 2.00
3.00 3.00
Q (cfs)
Time (min)
DA-1EHyd. No. 1 -- 1 Year
Hyd No. 1
28
Hydrograph ReportHydraflow Hydrographs Extension for Autodesk® Civil 3D® 2019 by Autodesk, Inc. v2020 Tuesday, 07 / 9 / 2019
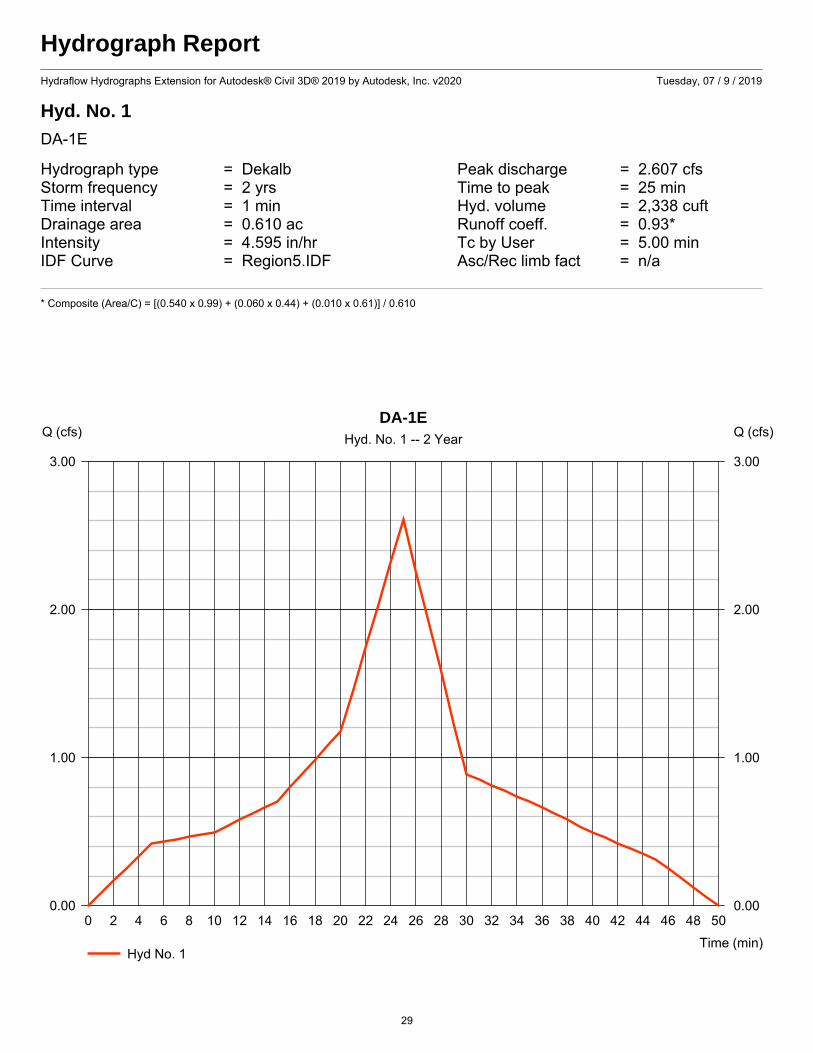
Hyd. No. 1
DA-1E
Hydrograph type = Dekalb Peak discharge = 2.607 cfsStorm frequency = 2 yrs Time to peak = 25 minTime interval = 1 min Hyd. volume = 2,338 cuftDrainage area = 0.610 ac Runoff coeff. = 0.93*Intensity = 4.595 in/hr Tc by User = 5.00 minIDF Curve = Region5.IDF Asc/Rec limb fact = n/a
* Composite (Area/C) = [(0.540 x 0.99) + (0.060 x 0.44) + (0.010 x 0.61)] / 0.610
0 2 4 6 8 10 12 14 16 18 20 22 24 26 28 30 32 34 36 38 40 42 44 46 48 50
Q (cfs)
0.00 0.00
1.00 1.00
2.00 2.00
3.00 3.00
Q (cfs)
Time (min)
DA-1EHyd. No. 1 -- 2 Year
Hyd No. 1
29
Hydrograph ReportHydraflow Hydrographs Extension for Autodesk® Civil 3D® 2019 by Autodesk, Inc. v2020 Tuesday, 07 / 9 / 2019
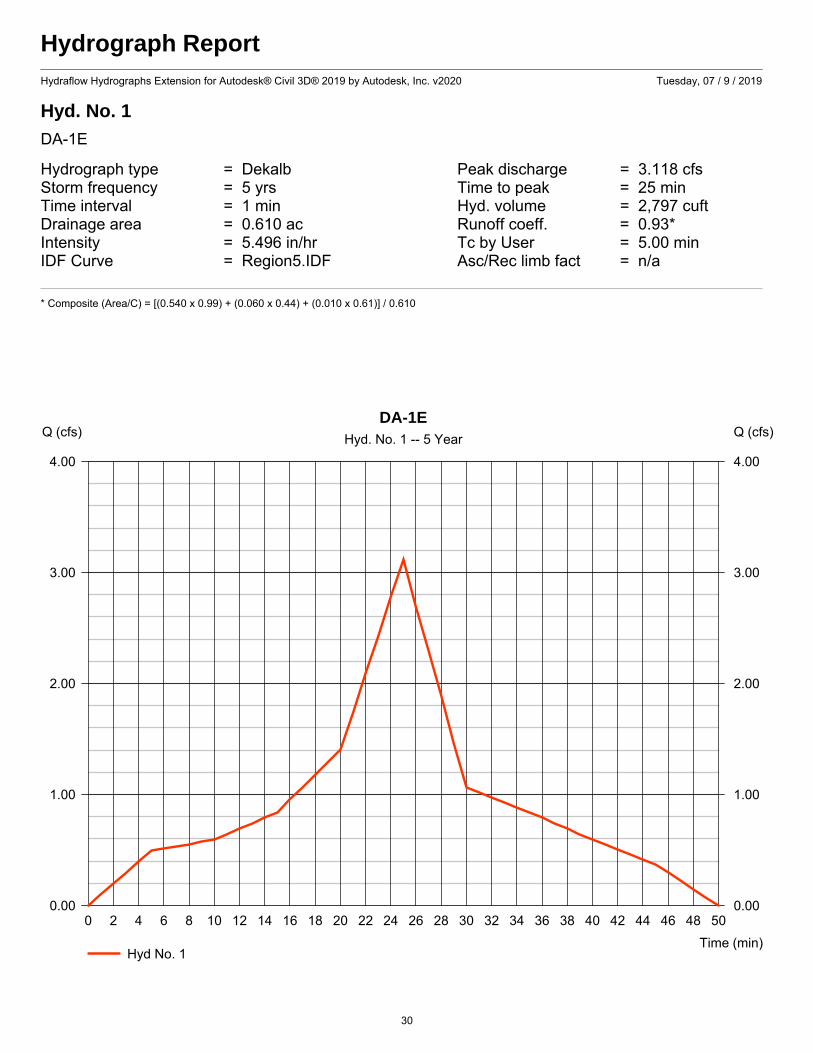
Hyd. No. 1
DA-1E
Hydrograph type = Dekalb Peak discharge = 3.118 cfsStorm frequency = 5 yrs Time to peak = 25 minTime interval = 1 min Hyd. volume = 2,797 cuftDrainage area = 0.610 ac Runoff coeff. = 0.93*Intensity = 5.496 in/hr Tc by User = 5.00 minIDF Curve = Region5.IDF Asc/Rec limb fact = n/a
* Composite (Area/C) = [(0.540 x 0.99) + (0.060 x 0.44) + (0.010 x 0.61)] / 0.610
0 2 4 6 8 10 12 14 16 18 20 22 24 26 28 30 32 34 36 38 40 42 44 46 48 50
Q (cfs)
0.00 0.00
1.00 1.00
2.00 2.00
3.00 3.00
4.00 4.00
Q (cfs)
Time (min)
DA-1EHyd. No. 1 -- 5 Year
Hyd No. 1
30

Hydrograph ReportHydraflow Hydrographs Extension for Autodesk® Civil 3D® 2019 by Autodesk, Inc. v2020 Tuesday, 07 / 9 / 2019
Hyd. No. 1
DA-1E
Hydrograph type = Dekalb Peak discharge = 3.400 cfsStorm frequency = 10 yrs Time to peak = 25 minTime interval = 1 min Hyd. volume = 3,050 cuftDrainage area = 0.610 ac Runoff coeff. = 0.93*Intensity = 5.993 in/hr Tc by User = 5.00 minIDF Curve = Region5.IDF Asc/Rec limb fact = n/a
* Composite (Area/C) = [(0.540 x 0.99) + (0.060 x 0.44) + (0.010 x 0.61)] / 0.610
0 2 4 6 8 10 12 14 16 18 20 22 24 26 28 30 32 34 36 38 40 42 44 46 48 50
Q (cfs)
0.00 0.00
1.00 1.00
2.00 2.00
3.00 3.00
4.00 4.00
Q (cfs)
Time (min)
DA-1EHyd. No. 1 -- 10 Year
Hyd No. 1
31
Hydrograph ReportHydraflow Hydrographs Extension for Autodesk® Civil 3D® 2019 by Autodesk, Inc. v2020 Tuesday, 07 / 9 / 2019
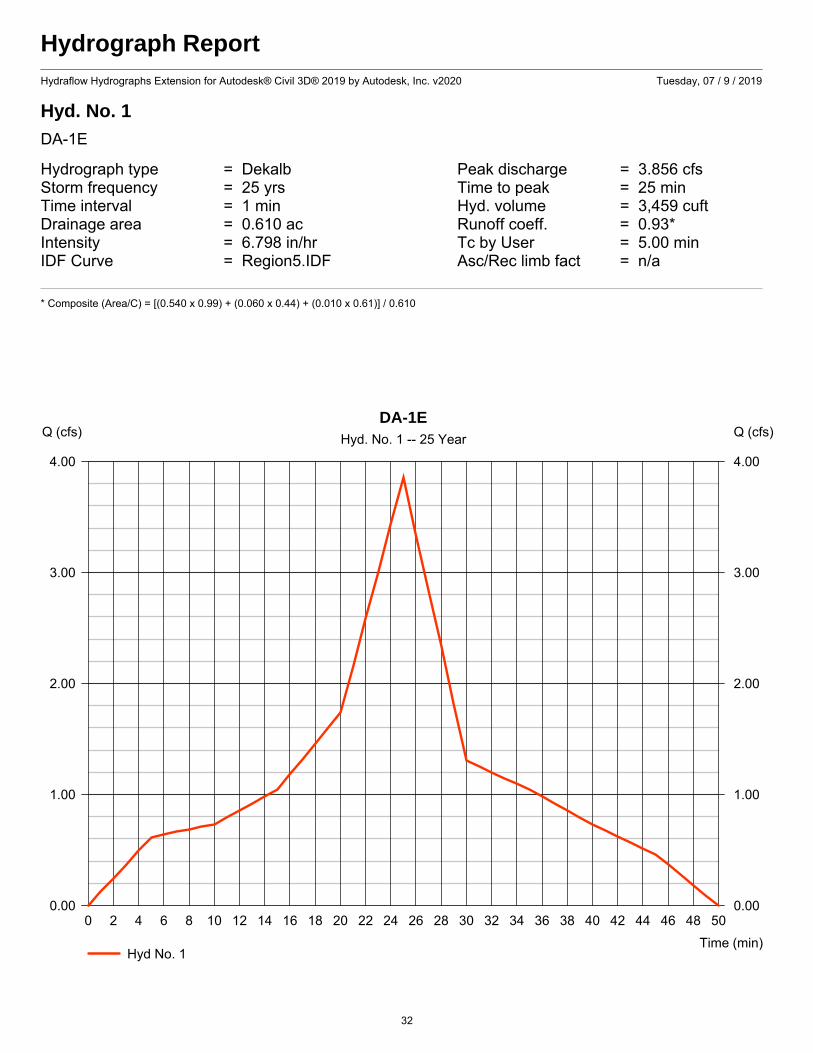
Hyd. No. 1
DA-1E
Hydrograph type = Dekalb Peak discharge = 3.856 cfsStorm frequency = 25 yrs Time to peak = 25 minTime interval = 1 min Hyd. volume = 3,459 cuftDrainage area = 0.610 ac Runoff coeff. = 0.93*Intensity = 6.798 in/hr Tc by User = 5.00 minIDF Curve = Region5.IDF Asc/Rec limb fact = n/a
* Composite (Area/C) = [(0.540 x 0.99) + (0.060 x 0.44) + (0.010 x 0.61)] / 0.610
0 2 4 6 8 10 12 14 16 18 20 22 24 26 28 30 32 34 36 38 40 42 44 46 48 50
Q (cfs)
0.00 0.00
1.00 1.00
2.00 2.00
3.00 3.00
4.00 4.00
Q (cfs)
Time (min)
DA-1EHyd. No. 1 -- 25 Year
Hyd No. 1
32
Hydrograph ReportHydraflow Hydrographs Extension for Autodesk® Civil 3D® 2019 by Autodesk, Inc. v2020 Tuesday, 07 / 9 / 2019
Hyd. No. 1
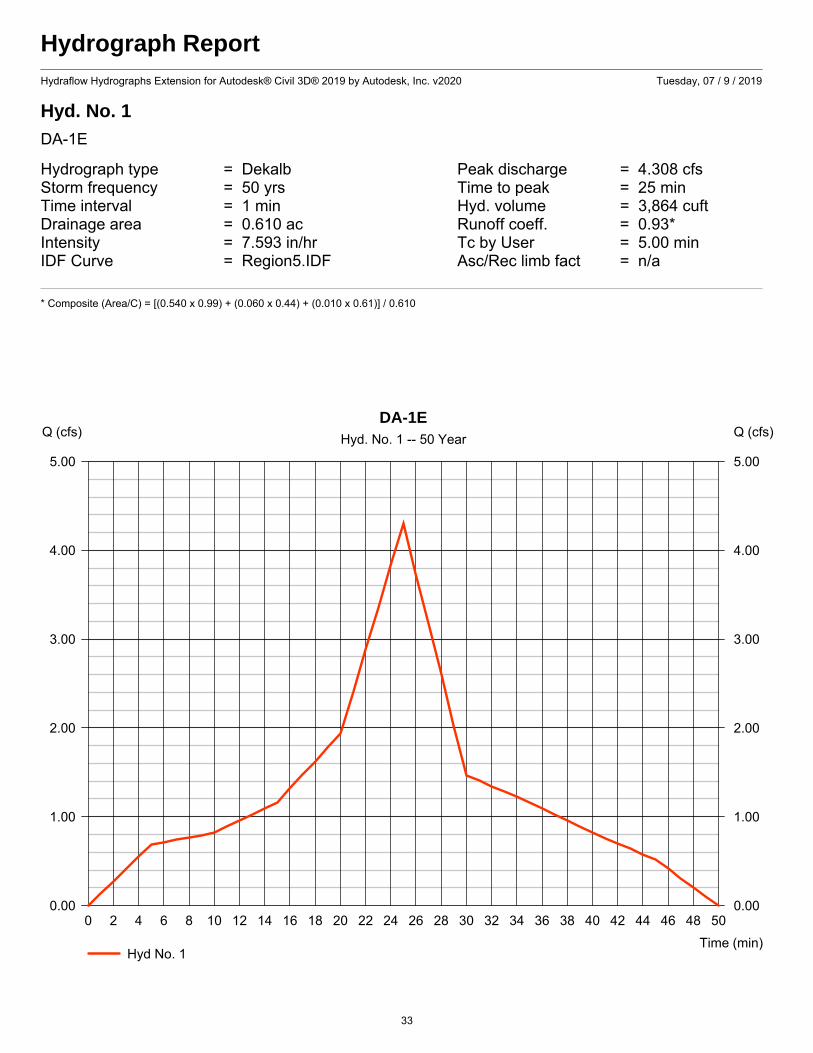
DA-1E
Hydrograph type = Dekalb Peak discharge = 4.308 cfsStorm frequency = 50 yrs Time to peak = 25 minTime interval = 1 min Hyd. volume = 3,864 cuftDrainage area = 0.610 ac Runoff coeff. = 0.93*Intensity = 7.593 in/hr Tc by User = 5.00 minIDF Curve = Region5.IDF Asc/Rec limb fact = n/a
* Composite (Area/C) = [(0.540 x 0.99) + (0.060 x 0.44) + (0.010 x 0.61)] / 0.610
0 2 4 6 8 10 12 14 16 18 20 22 24 26 28 30 32 34 36 38 40 42 44 46 48 50
Q (cfs)
0.00 0.00
1.00 1.00
2.00 2.00
3.00 3.00
4.00 4.00
5.00 5.00
Q (cfs)
Time (min)
DA-1EHyd. No. 1 -- 50 Year
Hyd No. 1
33

Hydrograph ReportHydraflow Hydrographs Extension for Autodesk® Civil 3D® 2019 by Autodesk, Inc. v2020 Tuesday, 07 / 9 / 2019
Hyd. No. 1
DA-1E
Hydrograph type = Dekalb Peak discharge = 4.679 cfsStorm frequency = 100 yrs Time to peak = 25 minTime interval = 1 min Hyd. volume = 4,197 cuftDrainage area = 0.610 ac Runoff coeff. = 0.93*Intensity = 8.248 in/hr Tc by User = 5.00 minIDF Curve = Region5.IDF Asc/Rec limb fact = n/a
* Composite (Area/C) = [(0.540 x 0.99) + (0.060 x 0.44) + (0.010 x 0.61)] / 0.610
0 2 4 6 8 10 12 14 16 18 20 22 24 26 28 30 32 34 36 38 40 42 44 46 48 50
Q (cfs)
0.00 0.00
1.00 1.00
2.00 2.00
3.00 3.00
4.00 4.00
5.00 5.00
Q (cfs)
Time (min)
DA-1EHyd. No. 1 -- 100 Year
Hyd No. 1
34
Hydrograph ReportHydraflow Hydrographs Extension for Autodesk® Civil 3D® 2019 by Autodesk, Inc. v2020 Tuesday, 07 / 9 / 2019
Hyd. No. 3
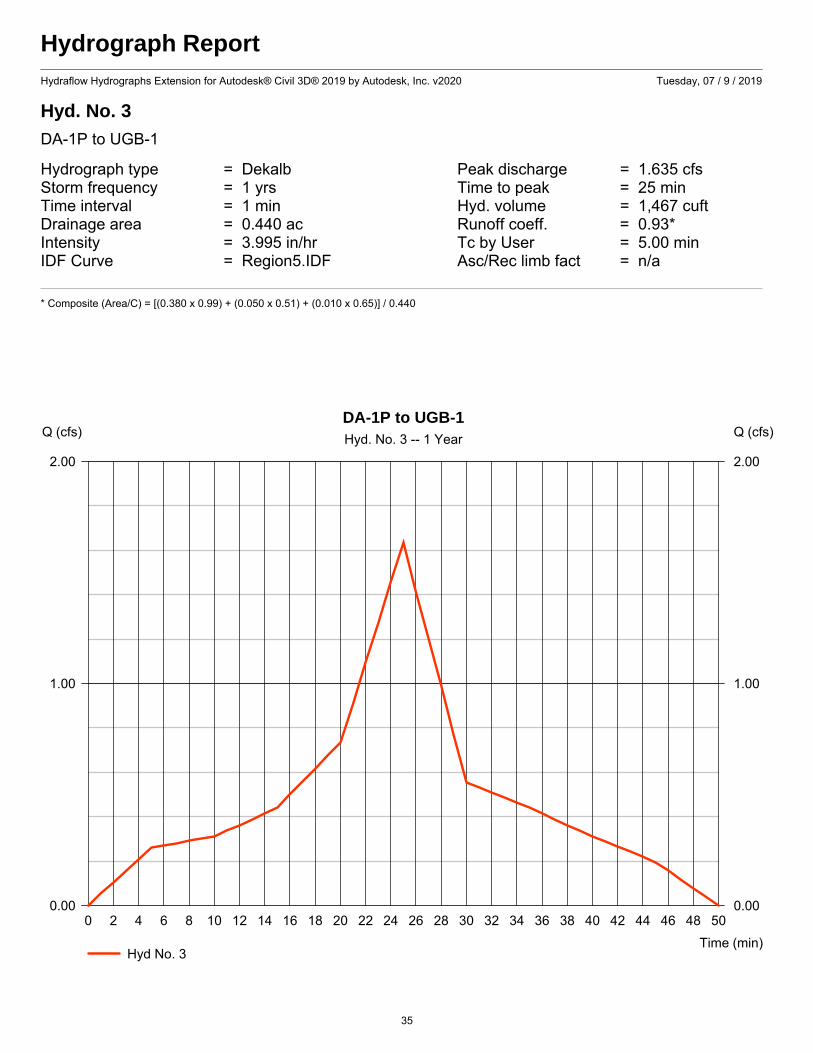
DA-1P to UGB-1
Hydrograph type = Dekalb Peak discharge = 1.635 cfsStorm frequency = 1 yrs Time to peak = 25 minTime interval = 1 min Hyd. volume = 1,467 cuftDrainage area = 0.440 ac Runoff coeff. = 0.93*Intensity = 3.995 in/hr Tc by User = 5.00 minIDF Curve = Region5.IDF Asc/Rec limb fact = n/a
* Composite (Area/C) = [(0.380 x 0.99) + (0.050 x 0.51) + (0.010 x 0.65)] / 0.440
0 2 4 6 8 10 12 14 16 18 20 22 24 26 28 30 32 34 36 38 40 42 44 46 48 50
Q (cfs)
0.00 0.00
1.00 1.00
2.00 2.00
Q (cfs)
Time (min)
DA-1P to UGB-1Hyd. No. 3 -- 1 Year
Hyd No. 3
35
Hydrograph ReportHydraflow Hydrographs Extension for Autodesk® Civil 3D® 2019 by Autodesk, Inc. v2020 Tuesday, 07 / 9 / 2019
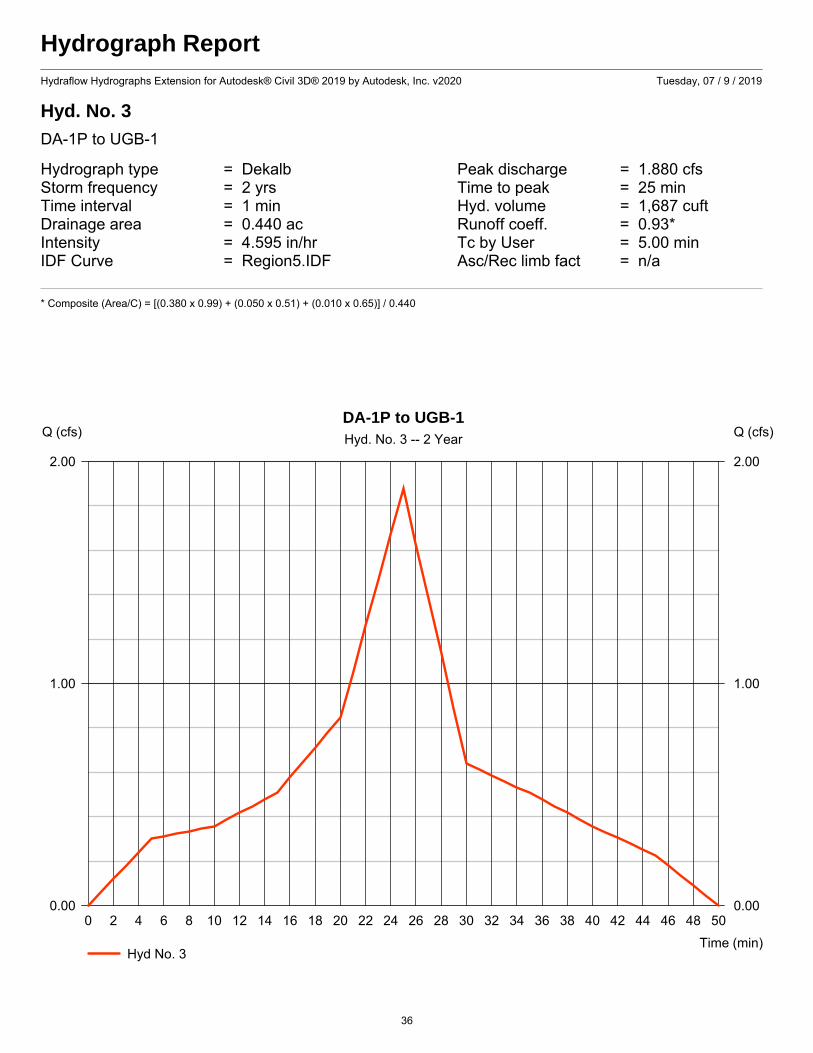
Hyd. No. 3
DA-1P to UGB-1
Hydrograph type = Dekalb Peak discharge = 1.880 cfsStorm frequency = 2 yrs Time to peak = 25 minTime interval = 1 min Hyd. volume = 1,687 cuftDrainage area = 0.440 ac Runoff coeff. = 0.93*Intensity = 4.595 in/hr Tc by User = 5.00 minIDF Curve = Region5.IDF Asc/Rec limb fact = n/a
* Composite (Area/C) = [(0.380 x 0.99) + (0.050 x 0.51) + (0.010 x 0.65)] / 0.440
0 2 4 6 8 10 12 14 16 18 20 22 24 26 28 30 32 34 36 38 40 42 44 46 48 50
Q (cfs)
0.00 0.00
1.00 1.00
2.00 2.00
Q (cfs)
Time (min)
DA-1P to UGB-1Hyd. No. 3 -- 2 Year
Hyd No. 3
36
Hydrograph ReportHydraflow Hydrographs Extension for Autodesk® Civil 3D® 2019 by Autodesk, Inc. v2020 Tuesday, 07 / 9 / 2019
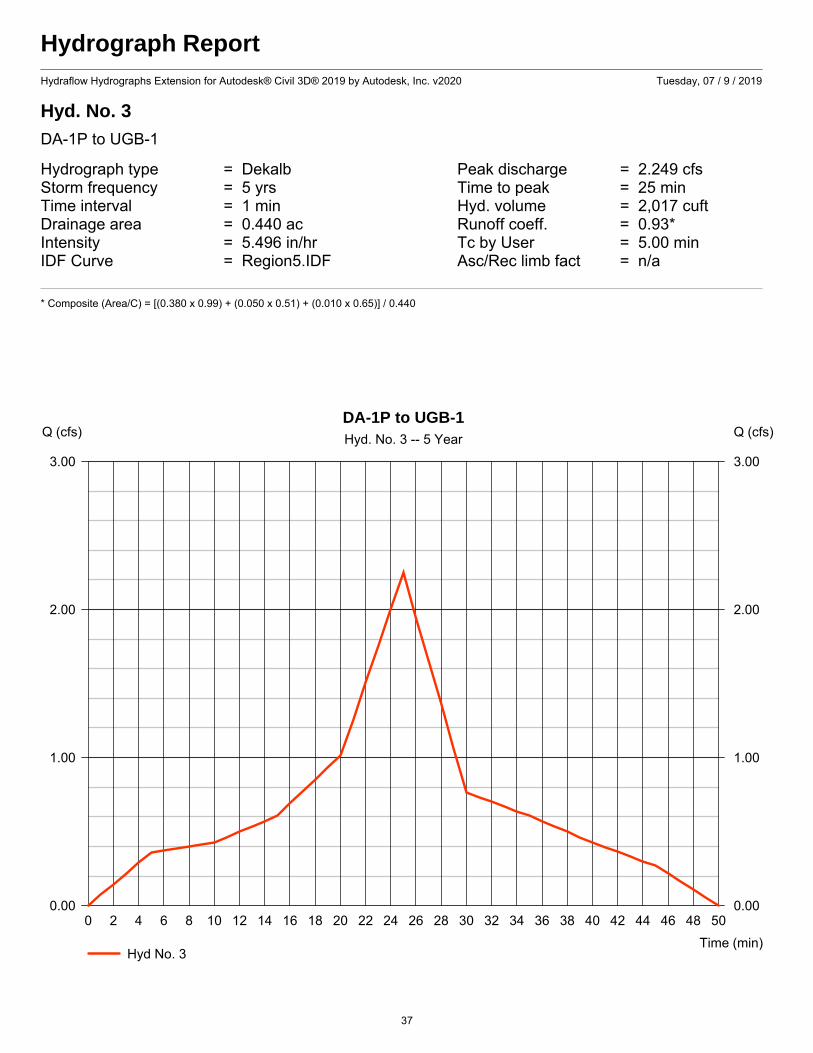
Hyd. No. 3
DA-1P to UGB-1
Hydrograph type = Dekalb Peak discharge = 2.249 cfsStorm frequency = 5 yrs Time to peak = 25 minTime interval = 1 min Hyd. volume = 2,017 cuftDrainage area = 0.440 ac Runoff coeff. = 0.93*Intensity = 5.496 in/hr Tc by User = 5.00 minIDF Curve = Region5.IDF Asc/Rec limb fact = n/a
* Composite (Area/C) = [(0.380 x 0.99) + (0.050 x 0.51) + (0.010 x 0.65)] / 0.440
0 2 4 6 8 10 12 14 16 18 20 22 24 26 28 30 32 34 36 38 40 42 44 46 48 50
Q (cfs)
0.00 0.00
1.00 1.00
2.00 2.00
3.00 3.00
Q (cfs)
Time (min)
DA-1P to UGB-1Hyd. No. 3 -- 5 Year
Hyd No. 3
37
Hydrograph ReportHydraflow Hydrographs Extension for Autodesk® Civil 3D® 2019 by Autodesk, Inc. v2020 Tuesday, 07 / 9 / 2019
Hyd. No. 3
DA-1P to UGB-1
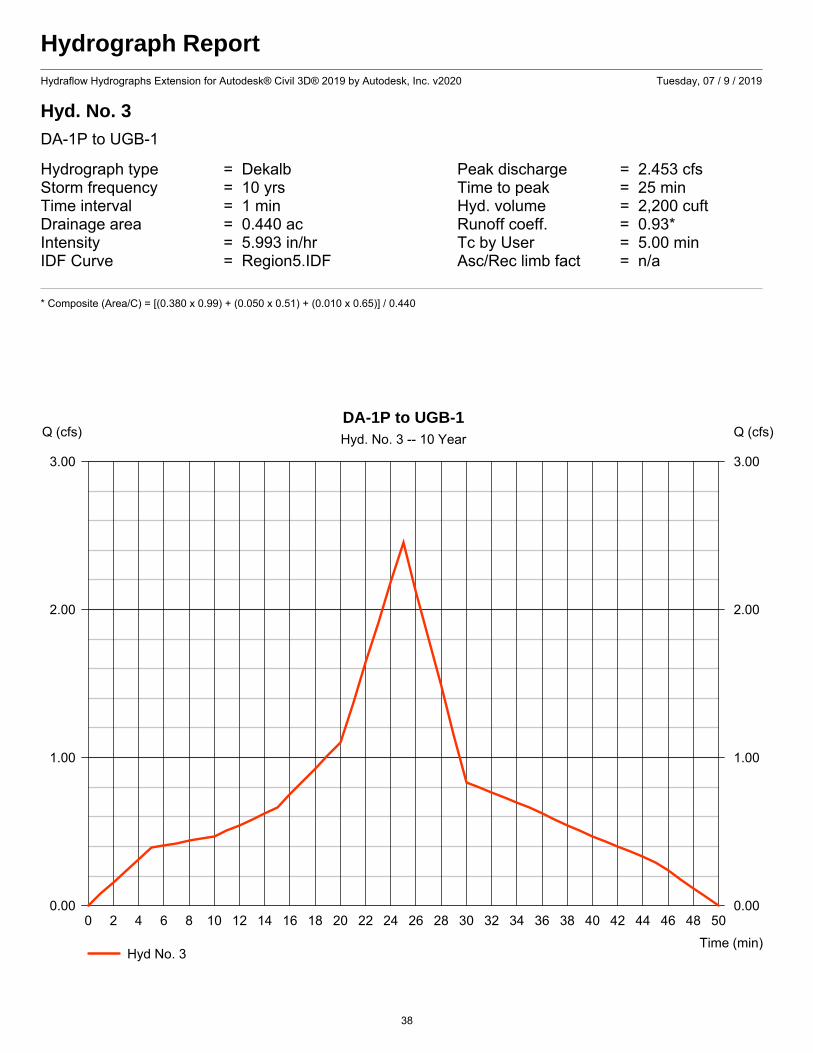
Hydrograph type = Dekalb Peak discharge = 2.453 cfsStorm frequency = 10 yrs Time to peak = 25 minTime interval = 1 min Hyd. volume = 2,200 cuftDrainage area = 0.440 ac Runoff coeff. = 0.93*Intensity = 5.993 in/hr Tc by User = 5.00 minIDF Curve = Region5.IDF Asc/Rec limb fact = n/a
* Composite (Area/C) = [(0.380 x 0.99) + (0.050 x 0.51) + (0.010 x 0.65)] / 0.440
0 2 4 6 8 10 12 14 16 18 20 22 24 26 28 30 32 34 36 38 40 42 44 46 48 50
Q (cfs)
0.00 0.00
1.00 1.00
2.00 2.00
3.00 3.00
Q (cfs)
Time (min)
DA-1P to UGB-1Hyd. No. 3 -- 10 Year
Hyd No. 3
38
Hydrograph ReportHydraflow Hydrographs Extension for Autodesk® Civil 3D® 2019 by Autodesk, Inc. v2020 Tuesday, 07 / 9 / 2019
Hyd. No. 3
DA-1P to UGB-1
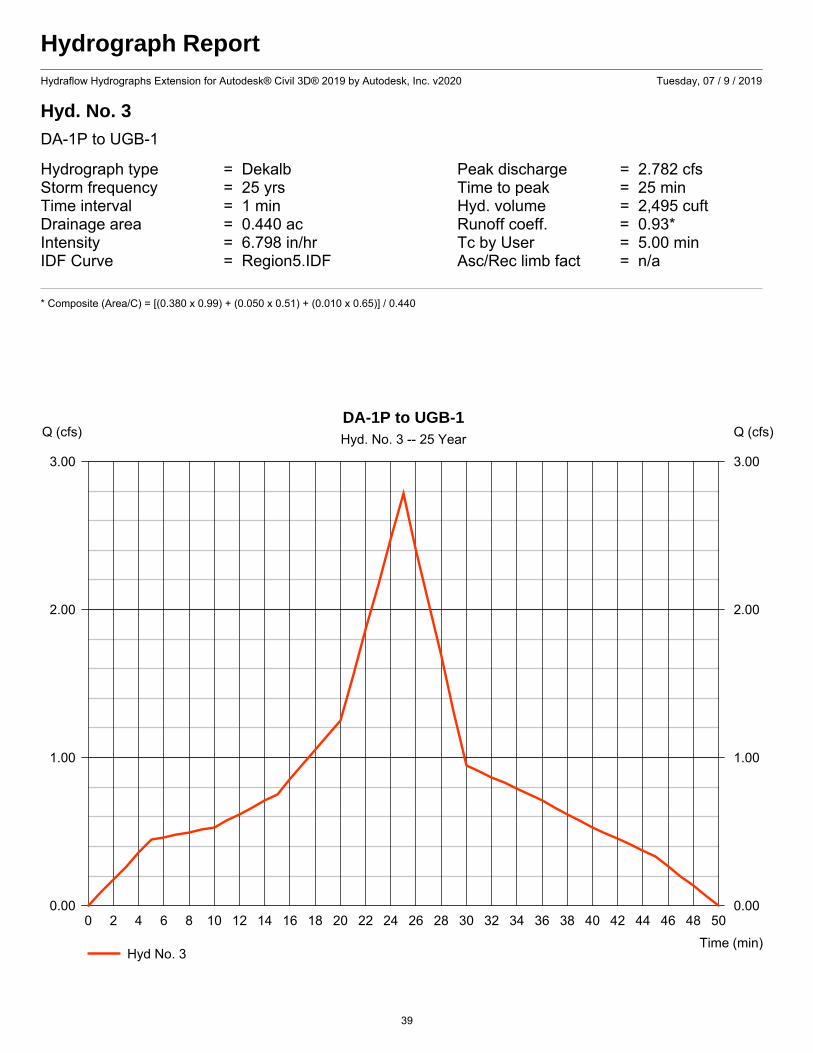
Hydrograph type = Dekalb Peak discharge = 2.782 cfsStorm frequency = 25 yrs Time to peak = 25 minTime interval = 1 min Hyd. volume = 2,495 cuftDrainage area = 0.440 ac Runoff coeff. = 0.93*Intensity = 6.798 in/hr Tc by User = 5.00 minIDF Curve = Region5.IDF Asc/Rec limb fact = n/a
* Composite (Area/C) = [(0.380 x 0.99) + (0.050 x 0.51) + (0.010 x 0.65)] / 0.440
0 2 4 6 8 10 12 14 16 18 20 22 24 26 28 30 32 34 36 38 40 42 44 46 48 50
Q (cfs)
0.00 0.00
1.00 1.00
2.00 2.00
3.00 3.00
Q (cfs)
Time (min)
DA-1P to UGB-1Hyd. No. 3 -- 25 Year
Hyd No. 3
39
Hydrograph ReportHydraflow Hydrographs Extension for Autodesk® Civil 3D® 2019 by Autodesk, Inc. v2020 Tuesday, 07 / 9 / 2019
Hyd. No. 3
DA-1P to UGB-1
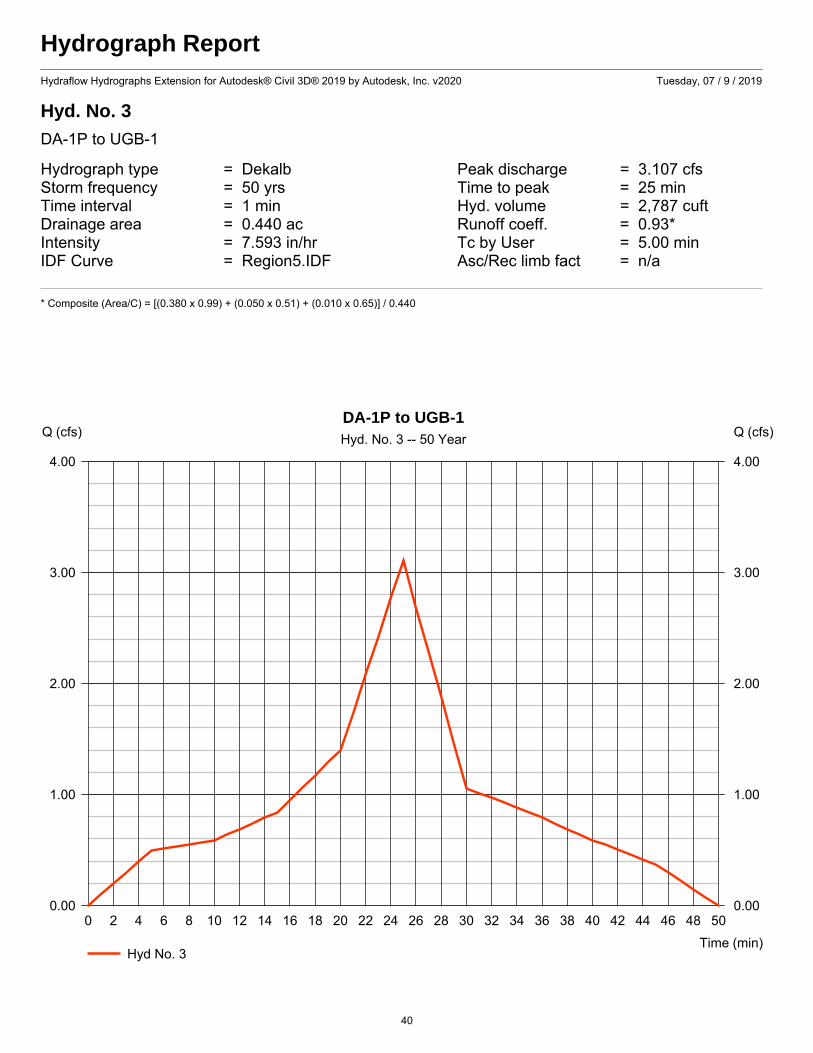
Hydrograph type = Dekalb Peak discharge = 3.107 cfsStorm frequency = 50 yrs Time to peak = 25 minTime interval = 1 min Hyd. volume = 2,787 cuftDrainage area = 0.440 ac Runoff coeff. = 0.93*Intensity = 7.593 in/hr Tc by User = 5.00 minIDF Curve = Region5.IDF Asc/Rec limb fact = n/a
* Composite (Area/C) = [(0.380 x 0.99) + (0.050 x 0.51) + (0.010 x 0.65)] / 0.440
0 2 4 6 8 10 12 14 16 18 20 22 24 26 28 30 32 34 36 38 40 42 44 46 48 50
Q (cfs)
0.00 0.00
1.00 1.00
2.00 2.00
3.00 3.00
4.00 4.00
Q (cfs)
Time (min)
DA-1P to UGB-1Hyd. No. 3 -- 50 Year
Hyd No. 3
40
Hydrograph ReportHydraflow Hydrographs Extension for Autodesk® Civil 3D® 2019 by Autodesk, Inc. v2020 Tuesday, 07 / 9 / 2019
Hyd. No. 3
DA-1P to UGB-1
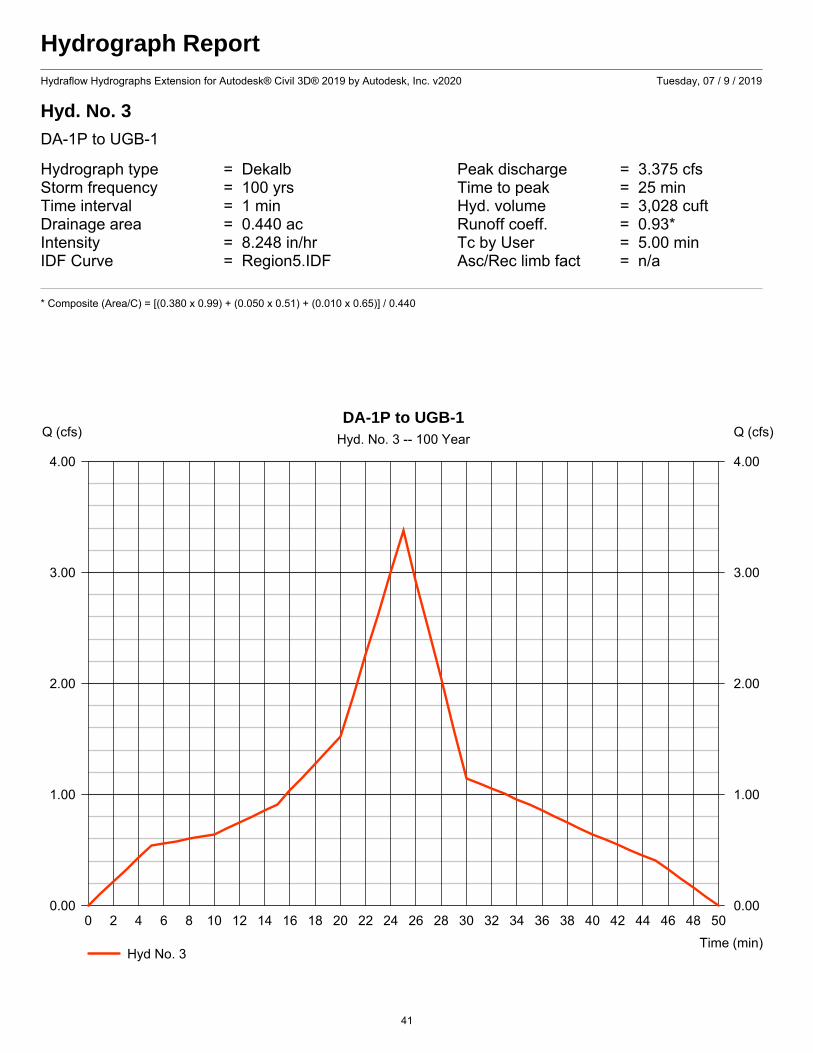
Hydrograph type = Dekalb Peak discharge = 3.375 cfsStorm frequency = 100 yrs Time to peak = 25 minTime interval = 1 min Hyd. volume = 3,028 cuftDrainage area = 0.440 ac Runoff coeff. = 0.93*Intensity = 8.248 in/hr Tc by User = 5.00 minIDF Curve = Region5.IDF Asc/Rec limb fact = n/a
* Composite (Area/C) = [(0.380 x 0.99) + (0.050 x 0.51) + (0.010 x 0.65)] / 0.440
0 2 4 6 8 10 12 14 16 18 20 22 24 26 28 30 32 34 36 38 40 42 44 46 48 50
Q (cfs)
0.00 0.00
1.00 1.00
2.00 2.00
3.00 3.00
4.00 4.00
Q (cfs)
Time (min)
DA-1P to UGB-1Hyd. No. 3 -- 100 Year
Hyd No. 3
41
Hydrograph ReportHydraflow Hydrographs Extension for Autodesk® Civil 3D® 2019 by Autodesk, Inc. v2020 Tuesday, 07 / 9 / 2019
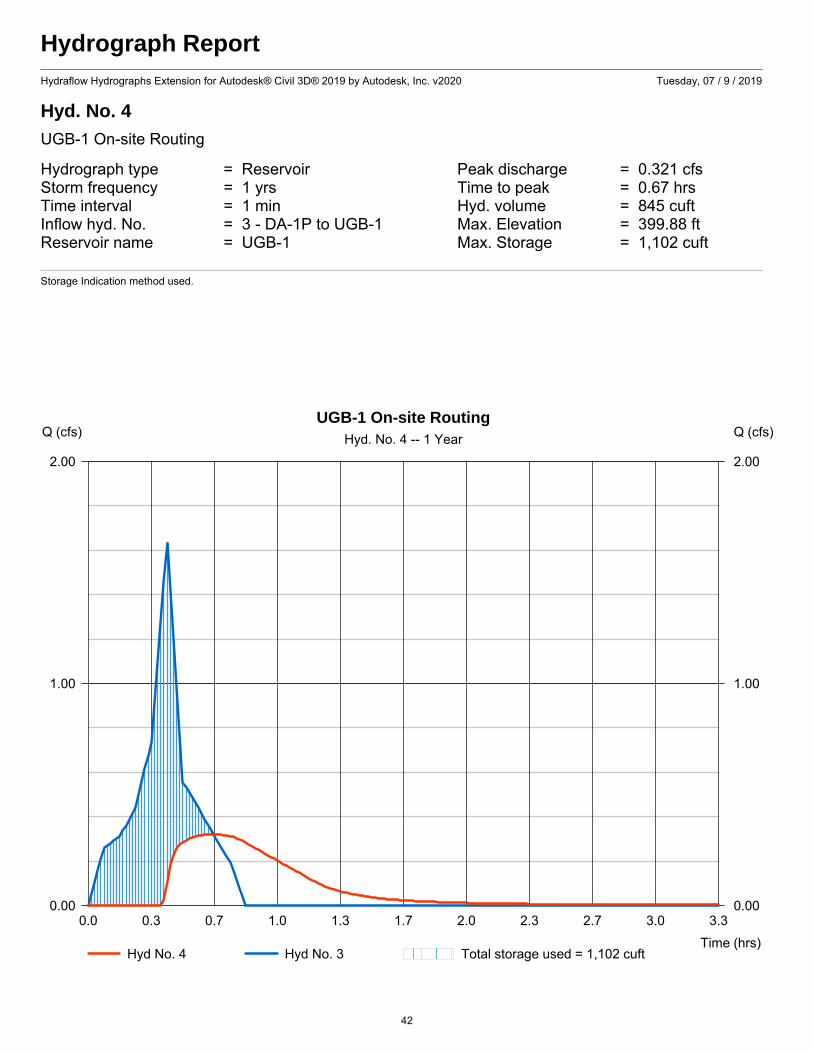
Hyd. No. 4
UGB-1 On-site Routing
Hydrograph type = Reservoir Peak discharge = 0.321 cfsStorm frequency = 1 yrs Time to peak = 0.67 hrsTime interval = 1 min Hyd. volume = 845 cuftInflow hyd. No. = 3 - DA-1P to UGB-1 Max. Elevation = 399.88 ftReservoir name = UGB-1 Max. Storage = 1,102 cuft
Storage Indication method used.
0.0 0.3 0.7 1.0 1.3 1.7 2.0 2.3 2.7 3.0 3.3
Q (cfs)
0.00 0.00
1.00 1.00
2.00 2.00
Q (cfs)
Time (hrs)
UGB-1 On-site RoutingHyd. No. 4 -- 1 Year
Hyd No. 4 Hyd No. 3 Total storage used = 1,102 cuft
42

Pond ReportHydraflow Hydrographs Extension for Autodesk® Civil 3D® 2019 by Autodesk, Inc. v2020 Tuesday, 07 / 9 / 2019
Pond No. 1 - UGB-1
Pond DataUG Chambers -Invert elev. = 398.38 ft, Rise x Span = 2.00 x 2.00 ft, Barrel Len = 45.00 ft, No. Barrels = 5, Slope = 0.00%, Headers = YesEncasement -Invert elev. = 397.88 ft, Width = 3.42 ft, Height = 3.00 ft, Voids = 40.00%
Stage / Storage TableStage (ft) Elevation (ft) Contour area (sqft) Incr. Storage (cuft) Total storage (cuft)
0.00 397.88 n/a 0 00.30 398.18 n/a 106 1060.60 398.48 n/a 116 2220.90 398.78 n/a 167 3891.20 399.08 n/a 189 5781.50 399.38 n/a 198 7761.80 399.68 n/a 198 9752.10 399.98 n/a 189 1,1642.40 400.28 n/a 167 1,3312.70 400.58 n/a 116 1,4463.00 400.88 n/a 106 1,553
Culvert / Orifice Structures Weir Structures
[A] [B] [C] [PrfRsr] [A] [B] [C] [D]
Rise (in) = 18.00 4.00 Inactive 0.00Span (in) = 18.00 4.00 0.00 0.00No. Barrels = 1 1 0 0Invert El. (ft) = 398.16 399.13 0.00 0.00Length (ft) = 9.00 1.00 0.00 0.00Slope (%) = 0.50 0.00 0.00 n/aN-Value = .013 .013 .013 n/aOrifice Coeff. = 0.60 0.60 0.60 0.60Multi-Stage = n/a Yes No No
Crest Len (ft) = 11.54 2.00 0.00 0.00Crest El. (ft) = 407.75 400.20 0.00 0.00Weir Coeff. = 3.33 3.33 3.33 3.33Weir Type = 1 Rect --- ---Multi-Stage = Yes Yes No No
Exfil.(in/hr) = 0.000 (by Wet area)TW Elev. (ft) = 0.00
Note: Culvert/Orifice outflows are analyzed under inlet (ic) and outlet (oc) control. Weir risers checked for orifice conditions (ic) and submergence (s).
0.00 0.50 1.00 1.50 2.00 2.50 3.00 3.50 4.00 4.50 5.00
Stage (ft)
0.00 397.88
1.00 398.88
2.00 399.88
3.00 400.88
Elev (ft)
Discharge (cfs)
Stage / Discharge
Total Q
43
Hydrograph ReportHydraflow Hydrographs Extension for Autodesk® Civil 3D® 2019 by Autodesk, Inc. v2020 Tuesday, 07 / 9 / 2019
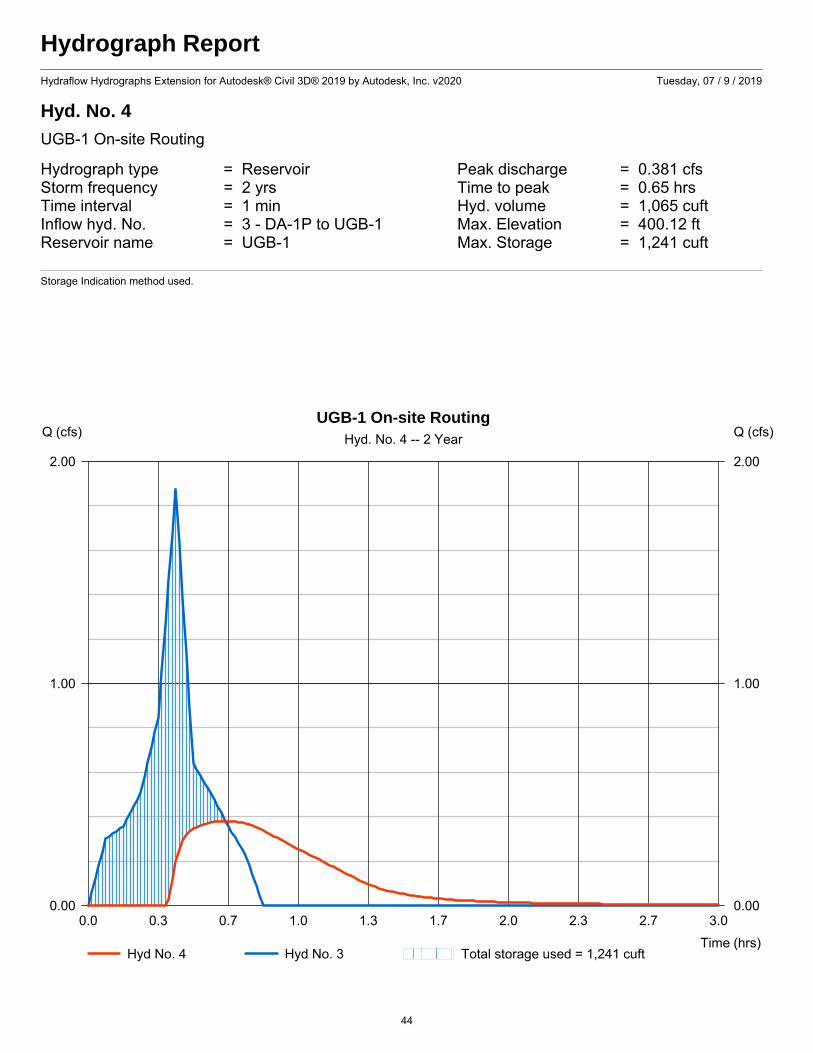
Hyd. No. 4
UGB-1 On-site Routing
Hydrograph type = Reservoir Peak discharge = 0.381 cfsStorm frequency = 2 yrs Time to peak = 0.65 hrsTime interval = 1 min Hyd. volume = 1,065 cuftInflow hyd. No. = 3 - DA-1P to UGB-1 Max. Elevation = 400.12 ftReservoir name = UGB-1 Max. Storage = 1,241 cuft
Storage Indication method used.
0.0 0.3 0.7 1.0 1.3 1.7 2.0 2.3 2.7 3.0
Q (cfs)
0.00 0.00
1.00 1.00
2.00 2.00
Q (cfs)
Time (hrs)
UGB-1 On-site RoutingHyd. No. 4 -- 2 Year
Hyd No. 4 Hyd No. 3 Total storage used = 1,241 cuft
44
Hydrograph ReportHydraflow Hydrographs Extension for Autodesk® Civil 3D® 2019 by Autodesk, Inc. v2020 Tuesday, 07 / 9 / 2019
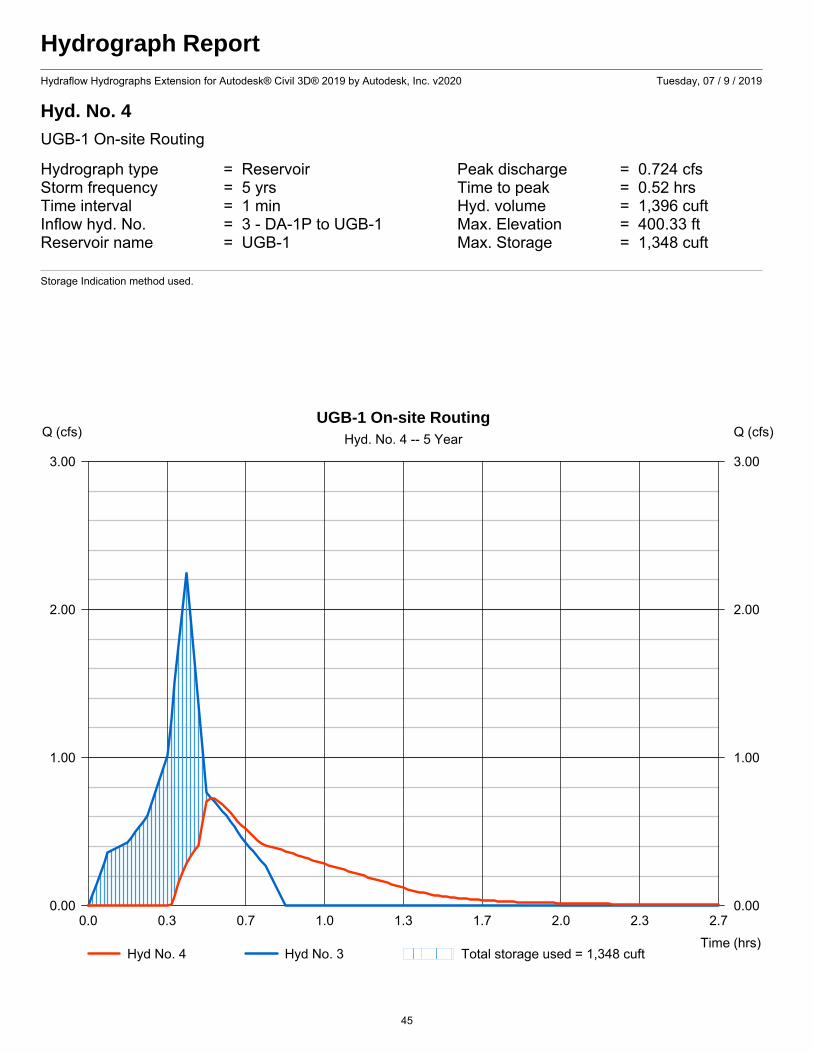
Hyd. No. 4
UGB-1 On-site Routing
Hydrograph type = Reservoir Peak discharge = 0.724 cfsStorm frequency = 5 yrs Time to peak = 0.52 hrsTime interval = 1 min Hyd. volume = 1,396 cuftInflow hyd. No. = 3 - DA-1P to UGB-1 Max. Elevation = 400.33 ftReservoir name = UGB-1 Max. Storage = 1,348 cuft
Storage Indication method used.
0.0 0.3 0.7 1.0 1.3 1.7 2.0 2.3 2.7
Q (cfs)
0.00 0.00
1.00 1.00
2.00 2.00
3.00 3.00
Q (cfs)
Time (hrs)
UGB-1 On-site RoutingHyd. No. 4 -- 5 Year
Hyd No. 4 Hyd No. 3 Total storage used = 1,348 cuft
45
Hydrograph ReportHydraflow Hydrographs Extension for Autodesk® Civil 3D® 2019 by Autodesk, Inc. v2020 Tuesday, 07 / 9 / 2019
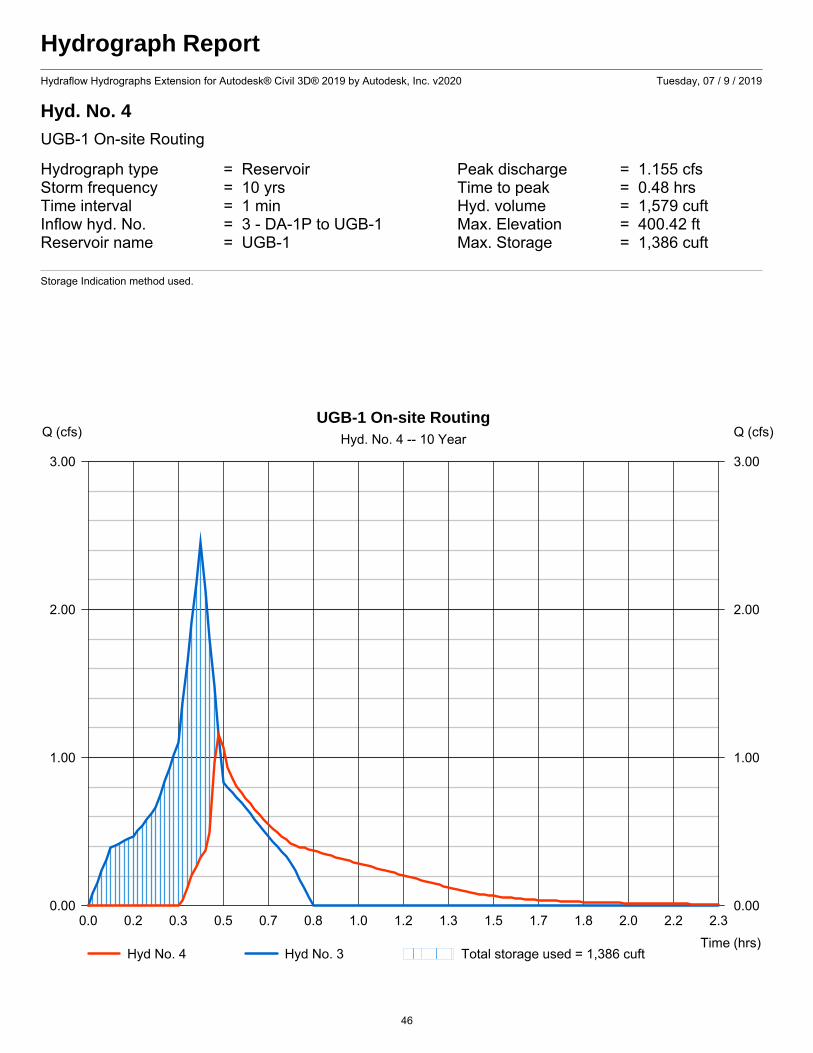
Hyd. No. 4
UGB-1 On-site Routing
Hydrograph type = Reservoir Peak discharge = 1.155 cfsStorm frequency = 10 yrs Time to peak = 0.48 hrsTime interval = 1 min Hyd. volume = 1,579 cuftInflow hyd. No. = 3 - DA-1P to UGB-1 Max. Elevation = 400.42 ftReservoir name = UGB-1 Max. Storage = 1,386 cuft
Storage Indication method used.
0.0 0.2 0.3 0.5 0.7 0.8 1.0 1.2 1.3 1.5 1.7 1.8 2.0 2.2 2.3
Q (cfs)
0.00 0.00
1.00 1.00
2.00 2.00
3.00 3.00
Q (cfs)
Time (hrs)
UGB-1 On-site RoutingHyd. No. 4 -- 10 Year
Hyd No. 4 Hyd No. 3 Total storage used = 1,386 cuft
46
Hydrograph ReportHydraflow Hydrographs Extension for Autodesk® Civil 3D® 2019 by Autodesk, Inc. v2020 Tuesday, 07 / 9 / 2019
Hyd. No. 4
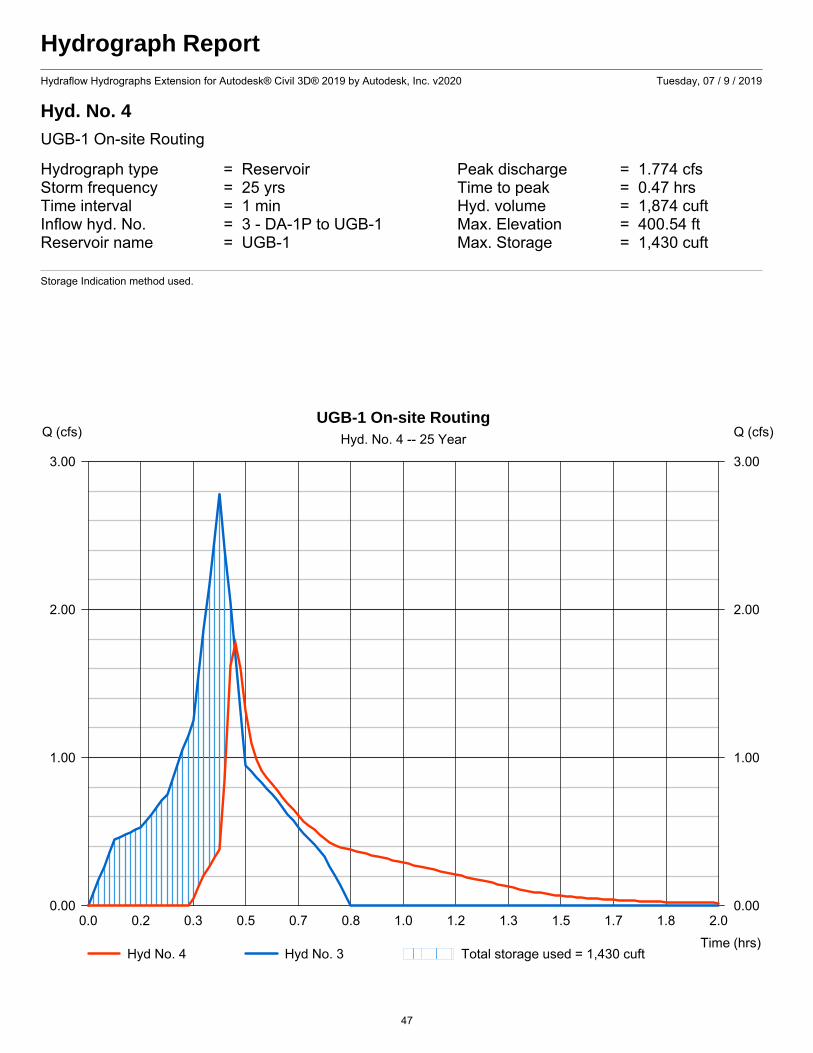
UGB-1 On-site Routing
Hydrograph type = Reservoir Peak discharge = 1.774 cfsStorm frequency = 25 yrs Time to peak = 0.47 hrsTime interval = 1 min Hyd. volume = 1,874 cuftInflow hyd. No. = 3 - DA-1P to UGB-1 Max. Elevation = 400.54 ftReservoir name = UGB-1 Max. Storage = 1,430 cuft
Storage Indication method used.
0.0 0.2 0.3 0.5 0.7 0.8 1.0 1.2 1.3 1.5 1.7 1.8 2.0
Q (cfs)
0.00 0.00
1.00 1.00
2.00 2.00
3.00 3.00
Q (cfs)
Time (hrs)
UGB-1 On-site RoutingHyd. No. 4 -- 25 Year
Hyd No. 4 Hyd No. 3 Total storage used = 1,430 cuft
47
Hydrograph ReportHydraflow Hydrographs Extension for Autodesk® Civil 3D® 2019 by Autodesk, Inc. v2020 Tuesday, 07 / 9 / 2019
Hyd. No. 4
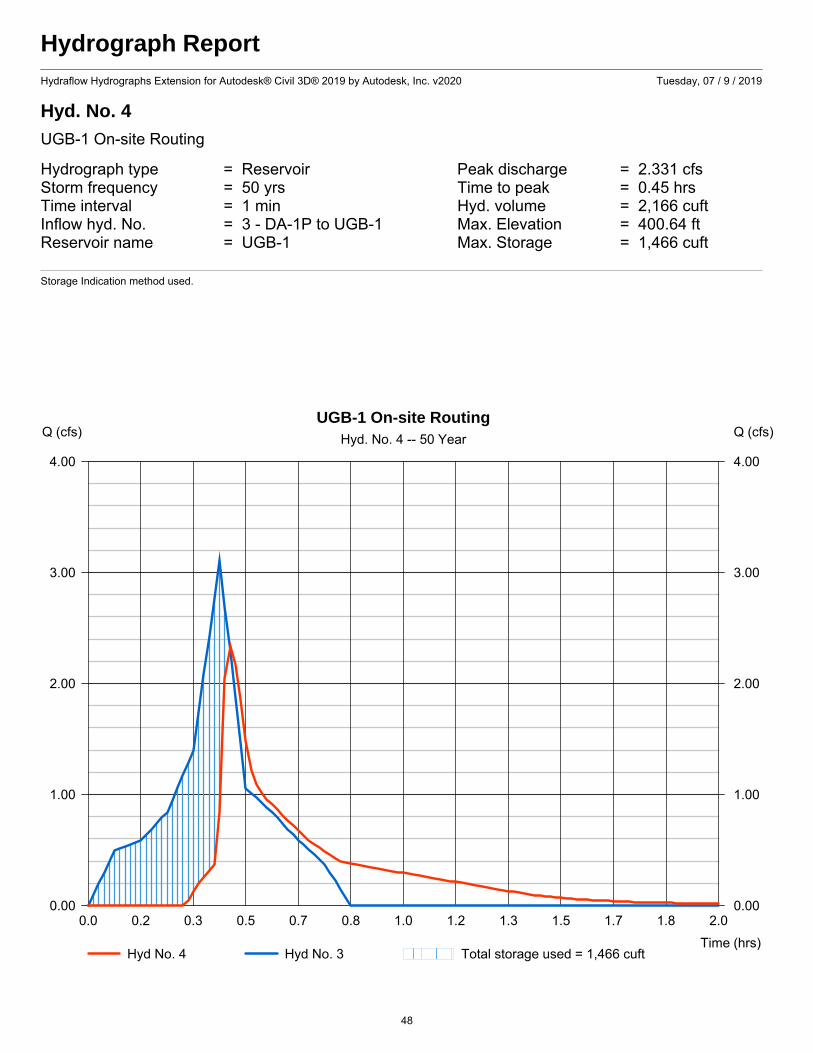
UGB-1 On-site Routing
Hydrograph type = Reservoir Peak discharge = 2.331 cfsStorm frequency = 50 yrs Time to peak = 0.45 hrsTime interval = 1 min Hyd. volume = 2,166 cuftInflow hyd. No. = 3 - DA-1P to UGB-1 Max. Elevation = 400.64 ftReservoir name = UGB-1 Max. Storage = 1,466 cuft
Storage Indication method used.
0.0 0.2 0.3 0.5 0.7 0.8 1.0 1.2 1.3 1.5 1.7 1.8 2.0
Q (cfs)
0.00 0.00
1.00 1.00
2.00 2.00
3.00 3.00
4.00 4.00
Q (cfs)
Time (hrs)
UGB-1 On-site RoutingHyd. No. 4 -- 50 Year
Hyd No. 4 Hyd No. 3 Total storage used = 1,466 cuft
48
Hydrograph ReportHydraflow Hydrographs Extension for Autodesk® Civil 3D® 2019 by Autodesk, Inc. v2020 Tuesday, 07 / 9 / 2019
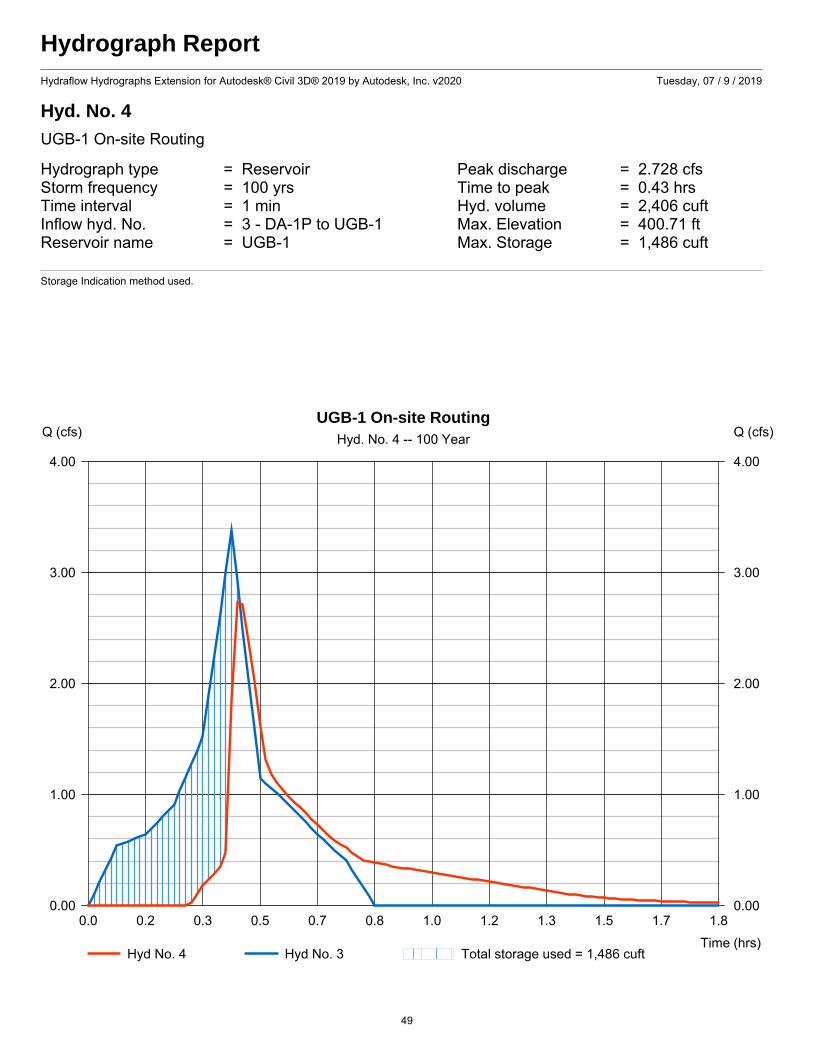
Hyd. No. 4
UGB-1 On-site Routing
Hydrograph type = Reservoir Peak discharge = 2.728 cfsStorm frequency = 100 yrs Time to peak = 0.43 hrsTime interval = 1 min Hyd. volume = 2,406 cuftInflow hyd. No. = 3 - DA-1P to UGB-1 Max. Elevation = 400.71 ftReservoir name = UGB-1 Max. Storage = 1,486 cuft
Storage Indication method used.
0.0 0.2 0.3 0.5 0.7 0.8 1.0 1.2 1.3 1.5 1.7 1.8
Q (cfs)
0.00 0.00
1.00 1.00
2.00 2.00
3.00 3.00
4.00 4.00
Q (cfs)
Time (hrs)
UGB-1 On-site RoutingHyd. No. 4 -- 100 Year
Hyd No. 4 Hyd No. 3 Total storage used = 1,486 cuft
49

Hydrograph ReportHydraflow Hydrographs Extension for Autodesk® Civil 3D® 2019 by Autodesk, Inc. v2020 Tuesday, 07 / 9 / 2019
Hyd. No. 6
DA-1P Bypass
Hydrograph type = Dekalb Peak discharge = 0.550 cfsStorm frequency = 1 yrs Time to peak = 0.42 hrsTime interval = 1 min Hyd. volume = 493 cuftDrainage area = 0.170 ac Runoff coeff. = 0.81*Intensity = 3.995 in/hr Tc by User = 5.00 minIDF Curve = Region5.IDF Asc/Rec limb fact = n/a
* Composite (Area/C) = [(0.090 x 0.99) + (0.030 x 0.51) + (0.050 x 0.65)] / 0.170
0 0 0 0 0 0 0 0 0 0 0 0 0 0 0 1 1 1 1 1 1 1 1 1 1 1
Q (cfs)
0.00 0.00
0.10 0.10
0.20 0.20
0.30 0.30
0.40 0.40
0.50 0.50
0.60 0.60
0.70 0.70
0.80 0.80
0.90 0.90
1.00 1.00
Q (cfs)
Time (hrs)
DA-1P BypassHyd. No. 6 -- 1 Year
Hyd No. 6
50
Hydrograph ReportHydraflow Hydrographs Extension for Autodesk® Civil 3D® 2019 by Autodesk, Inc. v2020 Tuesday, 07 / 9 / 2019
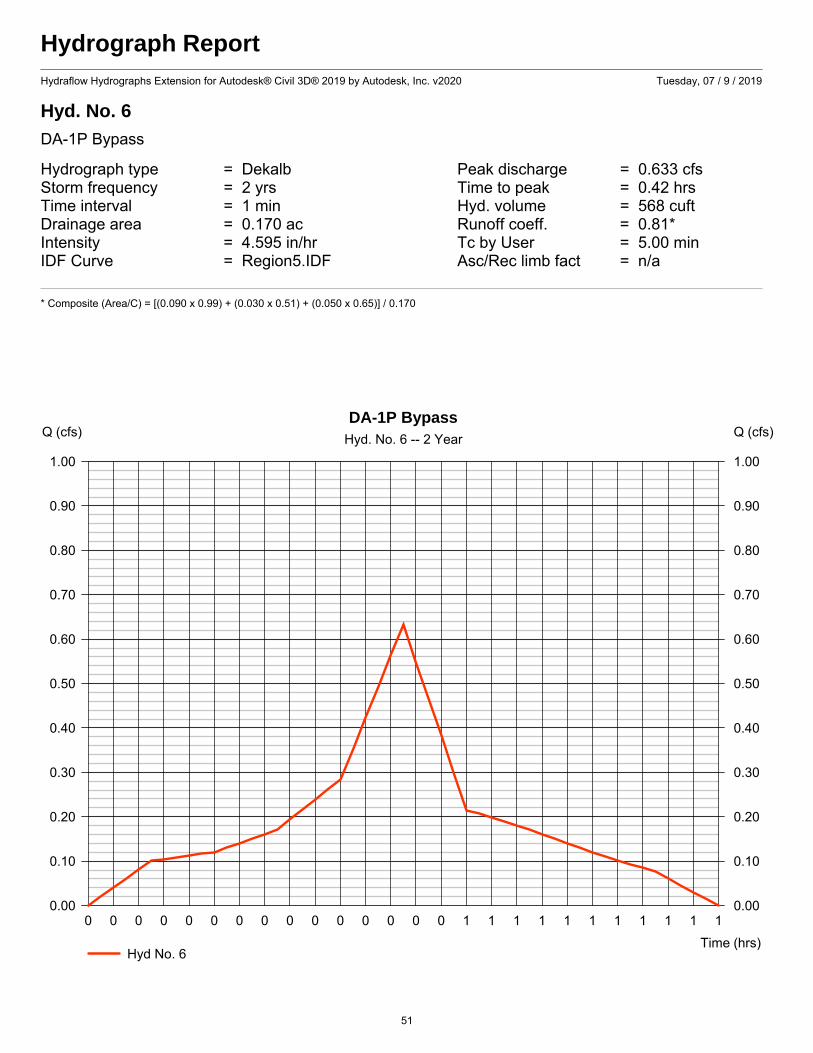
Hyd. No. 6
DA-1P Bypass
Hydrograph type = Dekalb Peak discharge = 0.633 cfsStorm frequency = 2 yrs Time to peak = 0.42 hrsTime interval = 1 min Hyd. volume = 568 cuftDrainage area = 0.170 ac Runoff coeff. = 0.81*Intensity = 4.595 in/hr Tc by User = 5.00 minIDF Curve = Region5.IDF Asc/Rec limb fact = n/a
* Composite (Area/C) = [(0.090 x 0.99) + (0.030 x 0.51) + (0.050 x 0.65)] / 0.170
0 0 0 0 0 0 0 0 0 0 0 0 0 0 0 1 1 1 1 1 1 1 1 1 1 1
Q (cfs)
0.00 0.00
0.10 0.10
0.20 0.20
0.30 0.30
0.40 0.40
0.50 0.50
0.60 0.60
0.70 0.70
0.80 0.80
0.90 0.90
1.00 1.00
Q (cfs)
Time (hrs)
DA-1P BypassHyd. No. 6 -- 2 Year
Hyd No. 6
51
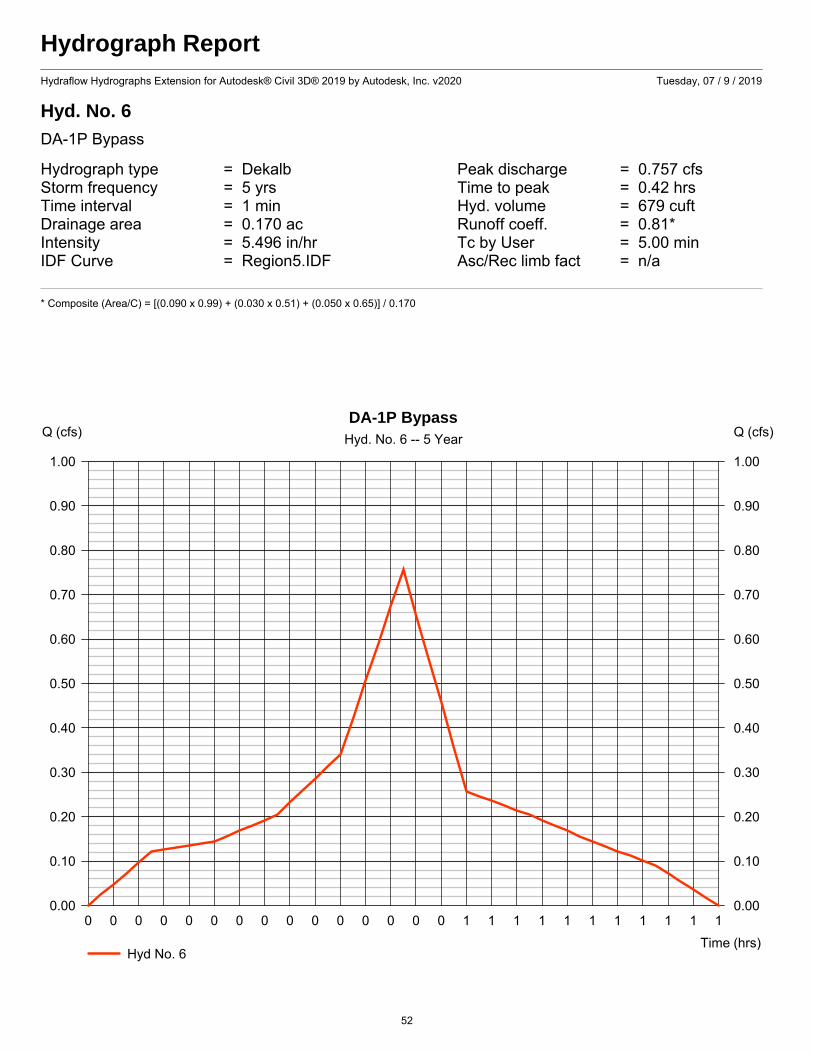
Hydrograph ReportHydraflow Hydrographs Extension for Autodesk® Civil 3D® 2019 by Autodesk, Inc. v2020 Tuesday, 07 / 9 / 2019
Hyd. No. 6
DA-1P Bypass
Hydrograph type = Dekalb Peak discharge = 0.757 cfsStorm frequency = 5 yrs Time to peak = 0.42 hrsTime interval = 1 min Hyd. volume = 679 cuftDrainage area = 0.170 ac Runoff coeff. = 0.81*Intensity = 5.496 in/hr Tc by User = 5.00 minIDF Curve = Region5.IDF Asc/Rec limb fact = n/a
* Composite (Area/C) = [(0.090 x 0.99) + (0.030 x 0.51) + (0.050 x 0.65)] / 0.170
0 0 0 0 0 0 0 0 0 0 0 0 0 0 0 1 1 1 1 1 1 1 1 1 1 1
Q (cfs)
0.00 0.00
0.10 0.10
0.20 0.20
0.30 0.30
0.40 0.40
0.50 0.50
0.60 0.60
0.70 0.70
0.80 0.80
0.90 0.90
1.00 1.00
Q (cfs)
Time (hrs)
DA-1P BypassHyd. No. 6 -- 5 Year
Hyd No. 6
52
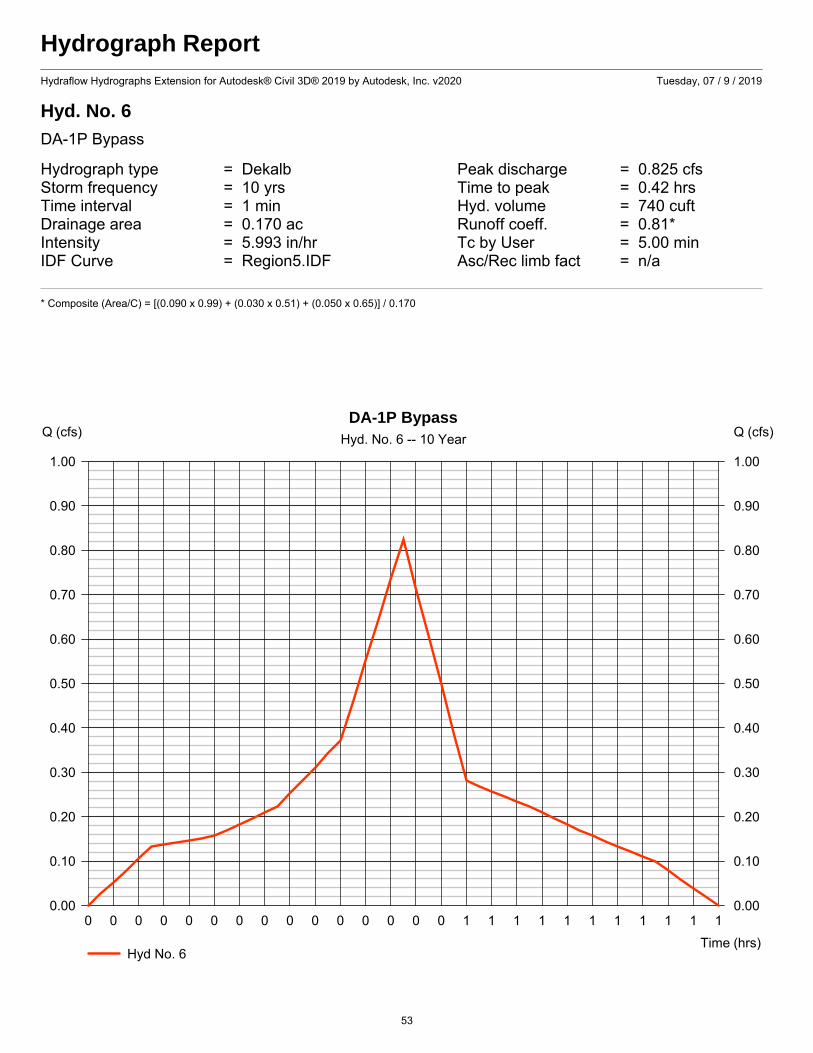
Hydrograph ReportHydraflow Hydrographs Extension for Autodesk® Civil 3D® 2019 by Autodesk, Inc. v2020 Tuesday, 07 / 9 / 2019
Hyd. No. 6
DA-1P Bypass
Hydrograph type = Dekalb Peak discharge = 0.825 cfsStorm frequency = 10 yrs Time to peak = 0.42 hrsTime interval = 1 min Hyd. volume = 740 cuftDrainage area = 0.170 ac Runoff coeff. = 0.81*Intensity = 5.993 in/hr Tc by User = 5.00 minIDF Curve = Region5.IDF Asc/Rec limb fact = n/a
* Composite (Area/C) = [(0.090 x 0.99) + (0.030 x 0.51) + (0.050 x 0.65)] / 0.170
0 0 0 0 0 0 0 0 0 0 0 0 0 0 0 1 1 1 1 1 1 1 1 1 1 1
Q (cfs)
0.00 0.00
0.10 0.10
0.20 0.20
0.30 0.30
0.40 0.40
0.50 0.50
0.60 0.60
0.70 0.70
0.80 0.80
0.90 0.90
1.00 1.00
Q (cfs)
Time (hrs)
DA-1P BypassHyd. No. 6 -- 10 Year
Hyd No. 6
53
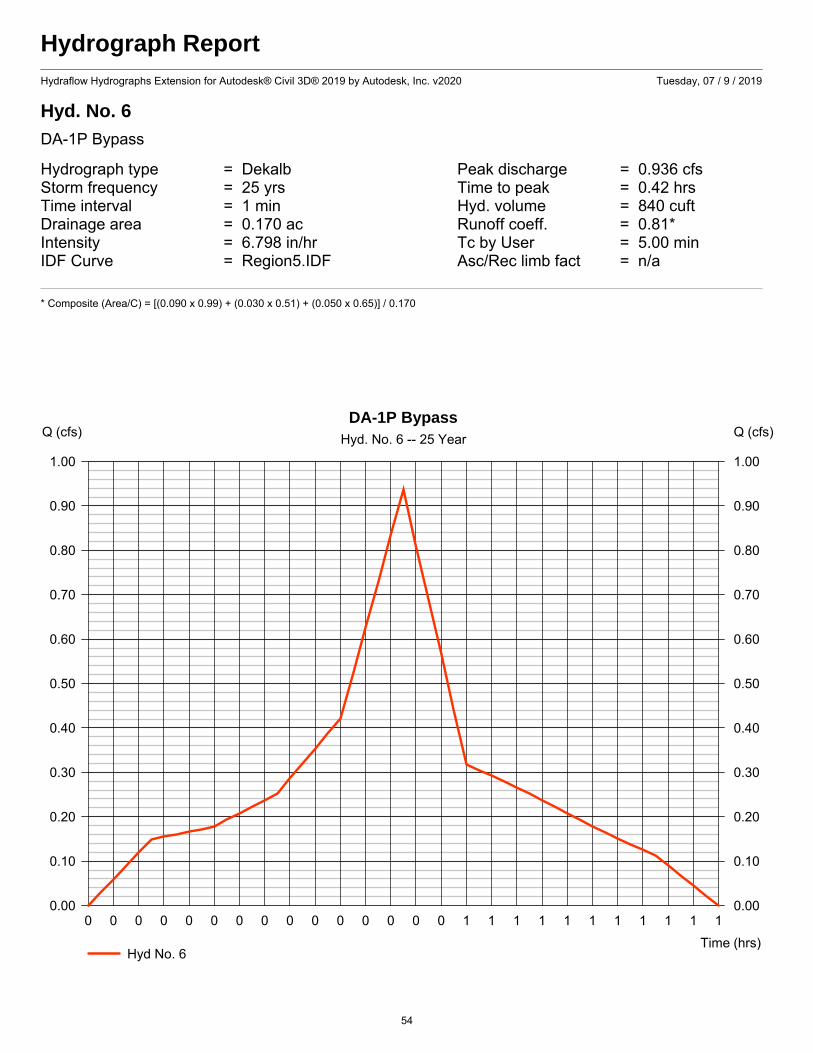
Hydrograph ReportHydraflow Hydrographs Extension for Autodesk® Civil 3D® 2019 by Autodesk, Inc. v2020 Tuesday, 07 / 9 / 2019
Hyd. No. 6
DA-1P Bypass
Hydrograph type = Dekalb Peak discharge = 0.936 cfsStorm frequency = 25 yrs Time to peak = 0.42 hrsTime interval = 1 min Hyd. volume = 840 cuftDrainage area = 0.170 ac Runoff coeff. = 0.81*Intensity = 6.798 in/hr Tc by User = 5.00 minIDF Curve = Region5.IDF Asc/Rec limb fact = n/a
* Composite (Area/C) = [(0.090 x 0.99) + (0.030 x 0.51) + (0.050 x 0.65)] / 0.170
0 0 0 0 0 0 0 0 0 0 0 0 0 0 0 1 1 1 1 1 1 1 1 1 1 1
Q (cfs)
0.00 0.00
0.10 0.10
0.20 0.20
0.30 0.30
0.40 0.40
0.50 0.50
0.60 0.60
0.70 0.70
0.80 0.80
0.90 0.90
1.00 1.00
Q (cfs)
Time (hrs)
DA-1P BypassHyd. No. 6 -- 25 Year
Hyd No. 6
54
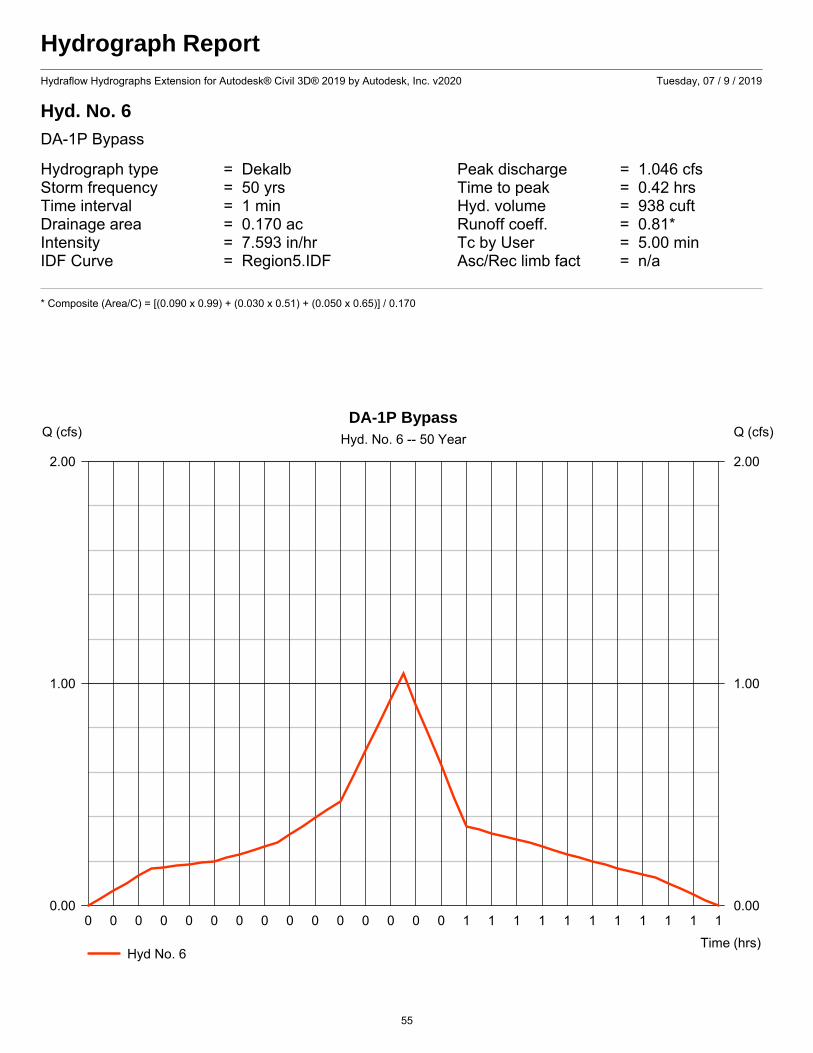
Hydrograph ReportHydraflow Hydrographs Extension for Autodesk® Civil 3D® 2019 by Autodesk, Inc. v2020 Tuesday, 07 / 9 / 2019
Hyd. No. 6
DA-1P Bypass
Hydrograph type = Dekalb Peak discharge = 1.046 cfsStorm frequency = 50 yrs Time to peak = 0.42 hrsTime interval = 1 min Hyd. volume = 938 cuftDrainage area = 0.170 ac Runoff coeff. = 0.81*Intensity = 7.593 in/hr Tc by User = 5.00 minIDF Curve = Region5.IDF Asc/Rec limb fact = n/a
* Composite (Area/C) = [(0.090 x 0.99) + (0.030 x 0.51) + (0.050 x 0.65)] / 0.170
0 0 0 0 0 0 0 0 0 0 0 0 0 0 0 1 1 1 1 1 1 1 1 1 1 1
Q (cfs)
0.00 0.00
1.00 1.00
2.00 2.00
Q (cfs)
Time (hrs)
DA-1P BypassHyd. No. 6 -- 50 Year
Hyd No. 6
55

Hydrograph ReportHydraflow Hydrographs Extension for Autodesk® Civil 3D® 2019 by Autodesk, Inc. v2020 Tuesday, 07 / 9 / 2019
Hyd. No. 6
DA-1P Bypass
Hydrograph type = Dekalb Peak discharge = 1.136 cfsStorm frequency = 100 yrs Time to peak = 0.42 hrsTime interval = 1 min Hyd. volume = 1,019 cuftDrainage area = 0.170 ac Runoff coeff. = 0.81*Intensity = 8.248 in/hr Tc by User = 5.00 minIDF Curve = Region5.IDF Asc/Rec limb fact = n/a
* Composite (Area/C) = [(0.090 x 0.99) + (0.030 x 0.51) + (0.050 x 0.65)] / 0.170
0 0 0 0 0 0 0 0 0 0 0 0 0 0 0 1 1 1 1 1 1 1 1 1 1 1
Q (cfs)
0.00 0.00
1.00 1.00
2.00 2.00
Q (cfs)
Time (hrs)
DA-1P BypassHyd. No. 6 -- 100 Year
Hyd No. 6
56
Hydrograph ReportHydraflow Hydrographs Extension for Autodesk® Civil 3D® 2019 by Autodesk, Inc. v2020 Tuesday, 07 / 9 / 2019
Hyd. No. 9
DA-1P Offsite to UGB-1
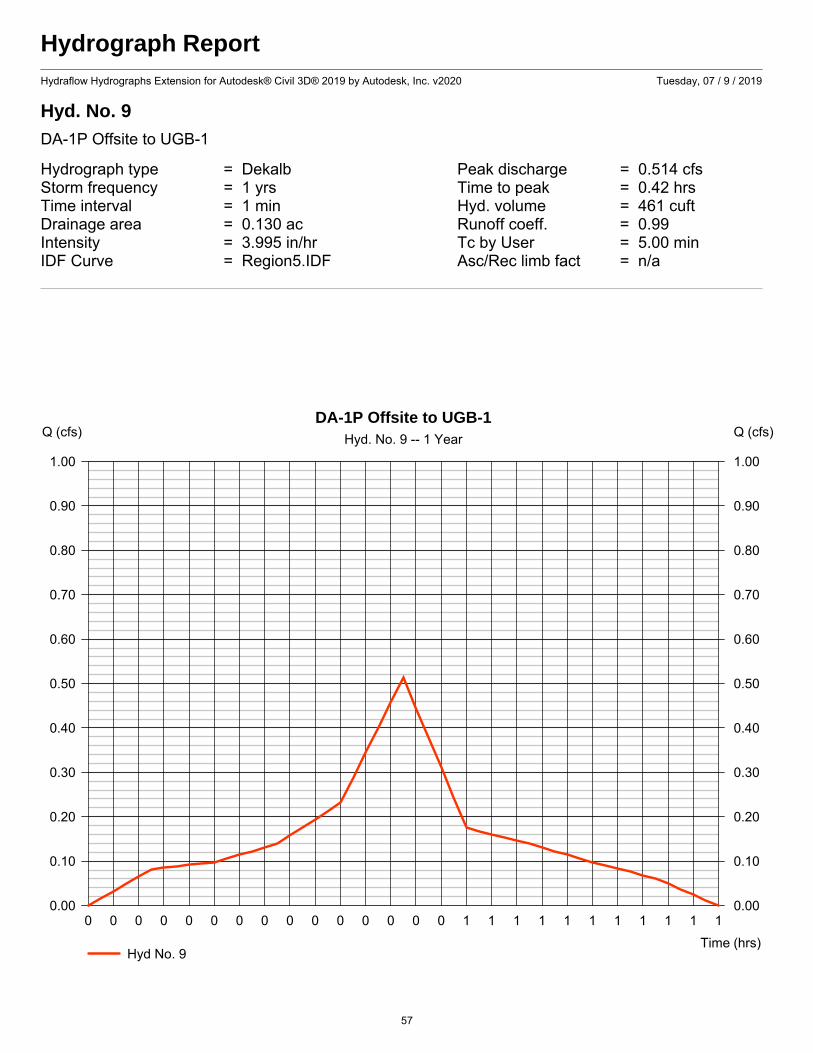
Hydrograph type = Dekalb Peak discharge = 0.514 cfsStorm frequency = 1 yrs Time to peak = 0.42 hrsTime interval = 1 min Hyd. volume = 461 cuftDrainage area = 0.130 ac Runoff coeff. = 0.99Intensity = 3.995 in/hr Tc by User = 5.00 minIDF Curve = Region5.IDF Asc/Rec limb fact = n/a
0 0 0 0 0 0 0 0 0 0 0 0 0 0 0 1 1 1 1 1 1 1 1 1 1 1
Q (cfs)
0.00 0.00
0.10 0.10
0.20 0.20
0.30 0.30
0.40 0.40
0.50 0.50
0.60 0.60
0.70 0.70
0.80 0.80
0.90 0.90
1.00 1.00
Q (cfs)
Time (hrs)
DA-1P Offsite to UGB-1Hyd. No. 9 -- 1 Year
Hyd No. 9
57

Hydrograph ReportHydraflow Hydrographs Extension for Autodesk® Civil 3D® 2019 by Autodesk, Inc. v2020 Tuesday, 07 / 9 / 2019
Hyd. No. 9
DA-1P Offsite to UGB-1
Hydrograph type = Dekalb Peak discharge = 0.591 cfsStorm frequency = 2 yrs Time to peak = 0.42 hrsTime interval = 1 min Hyd. volume = 530 cuftDrainage area = 0.130 ac Runoff coeff. = 0.99Intensity = 4.595 in/hr Tc by User = 5.00 minIDF Curve = Region5.IDF Asc/Rec limb fact = n/a
0 0 0 0 0 0 0 0 0 0 0 0 0 0 0 1 1 1 1 1 1 1 1 1 1 1
Q (cfs)
0.00 0.00
0.10 0.10
0.20 0.20
0.30 0.30
0.40 0.40
0.50 0.50
0.60 0.60
0.70 0.70
0.80 0.80
0.90 0.90
1.00 1.00
Q (cfs)
Time (hrs)
DA-1P Offsite to UGB-1Hyd. No. 9 -- 2 Year
Hyd No. 9
58
Hydrograph ReportHydraflow Hydrographs Extension for Autodesk® Civil 3D® 2019 by Autodesk, Inc. v2020 Tuesday, 07 / 9 / 2019
Hyd. No. 9
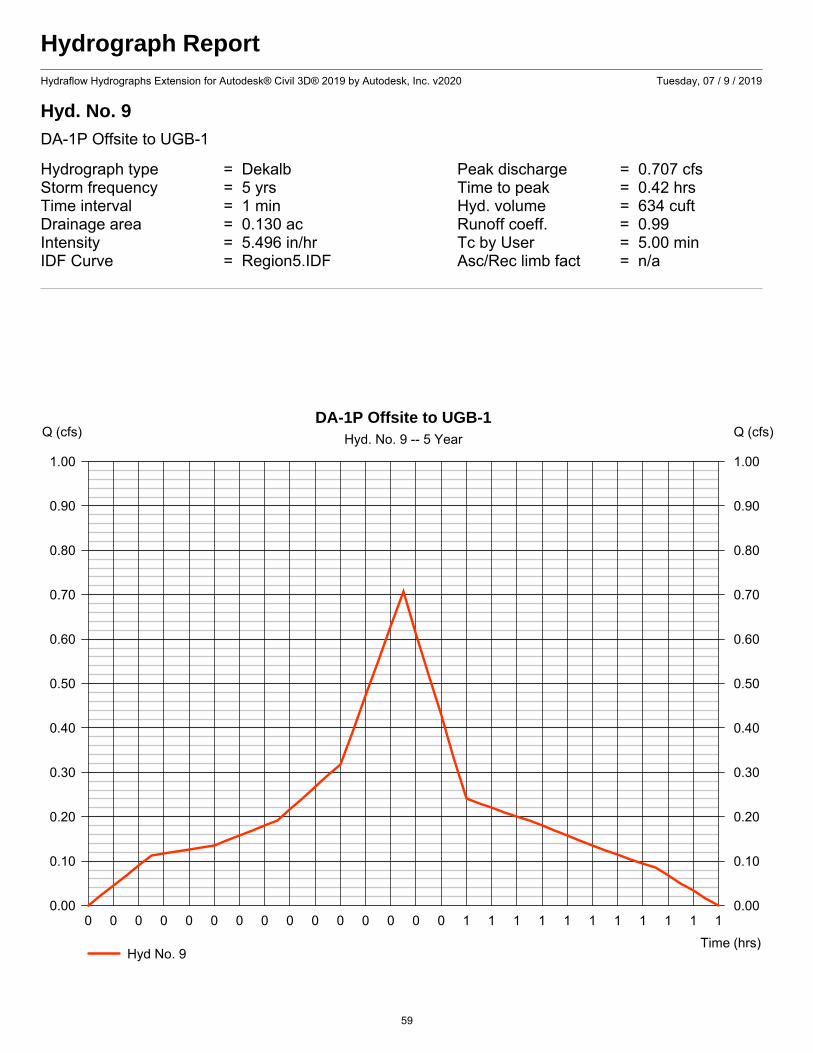
DA-1P Offsite to UGB-1
Hydrograph type = Dekalb Peak discharge = 0.707 cfsStorm frequency = 5 yrs Time to peak = 0.42 hrsTime interval = 1 min Hyd. volume = 634 cuftDrainage area = 0.130 ac Runoff coeff. = 0.99Intensity = 5.496 in/hr Tc by User = 5.00 minIDF Curve = Region5.IDF Asc/Rec limb fact = n/a
0 0 0 0 0 0 0 0 0 0 0 0 0 0 0 1 1 1 1 1 1 1 1 1 1 1
Q (cfs)
0.00 0.00
0.10 0.10
0.20 0.20
0.30 0.30
0.40 0.40
0.50 0.50
0.60 0.60
0.70 0.70
0.80 0.80
0.90 0.90
1.00 1.00
Q (cfs)
Time (hrs)
DA-1P Offsite to UGB-1Hyd. No. 9 -- 5 Year
Hyd No. 9
59
Hydrograph ReportHydraflow Hydrographs Extension for Autodesk® Civil 3D® 2019 by Autodesk, Inc. v2020 Tuesday, 07 / 9 / 2019
Hyd. No. 9
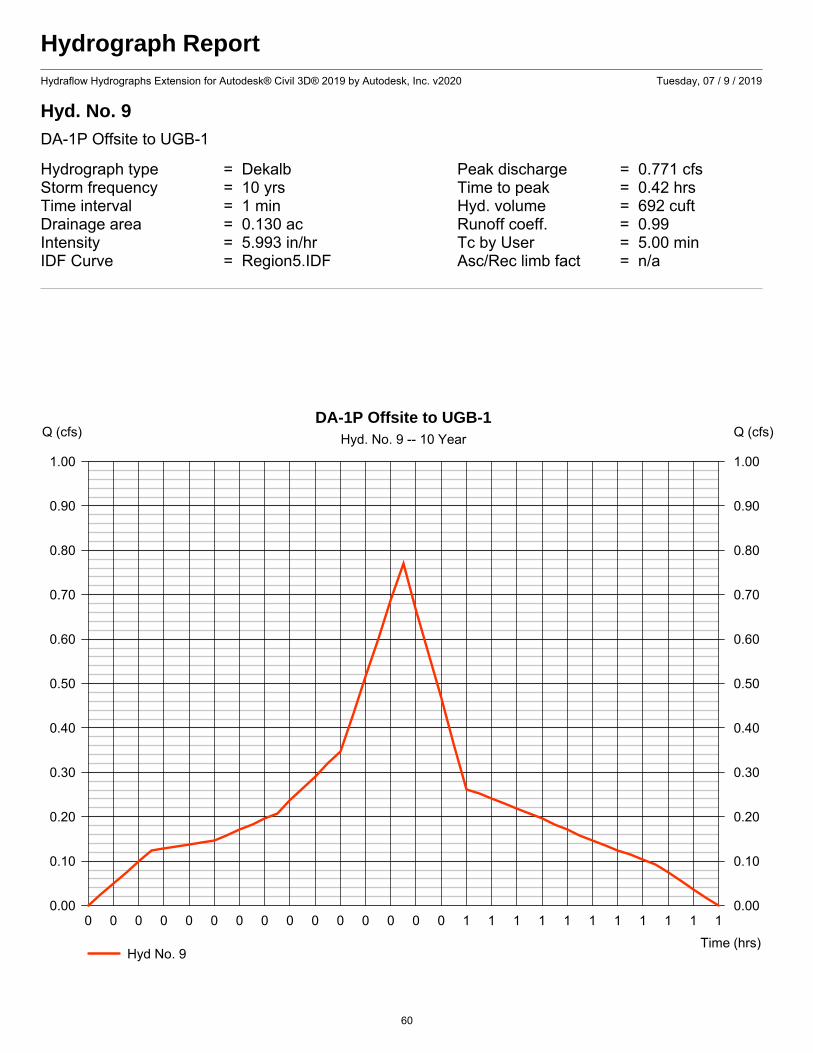
DA-1P Offsite to UGB-1
Hydrograph type = Dekalb Peak discharge = 0.771 cfsStorm frequency = 10 yrs Time to peak = 0.42 hrsTime interval = 1 min Hyd. volume = 692 cuftDrainage area = 0.130 ac Runoff coeff. = 0.99Intensity = 5.993 in/hr Tc by User = 5.00 minIDF Curve = Region5.IDF Asc/Rec limb fact = n/a
0 0 0 0 0 0 0 0 0 0 0 0 0 0 0 1 1 1 1 1 1 1 1 1 1 1
Q (cfs)
0.00 0.00
0.10 0.10
0.20 0.20
0.30 0.30
0.40 0.40
0.50 0.50
0.60 0.60
0.70 0.70
0.80 0.80
0.90 0.90
1.00 1.00
Q (cfs)
Time (hrs)
DA-1P Offsite to UGB-1Hyd. No. 9 -- 10 Year
Hyd No. 9
60
Hydrograph ReportHydraflow Hydrographs Extension for Autodesk® Civil 3D® 2019 by Autodesk, Inc. v2020 Tuesday, 07 / 9 / 2019
Hyd. No. 9
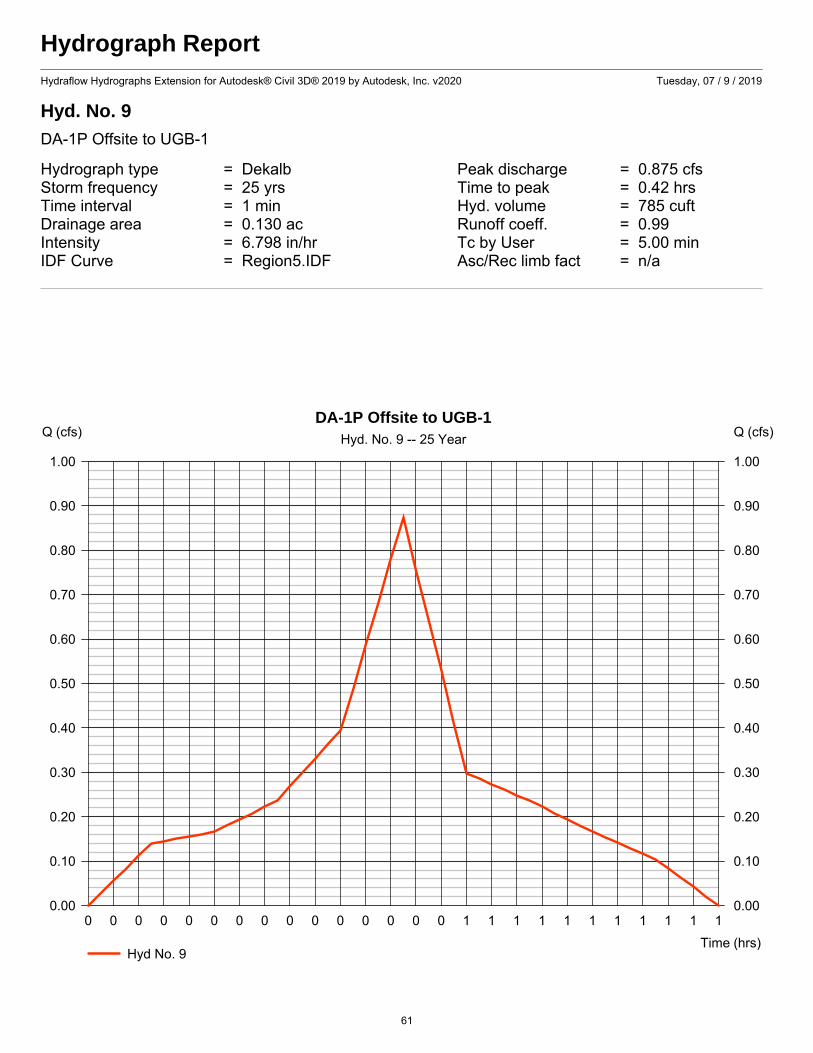
DA-1P Offsite to UGB-1
Hydrograph type = Dekalb Peak discharge = 0.875 cfsStorm frequency = 25 yrs Time to peak = 0.42 hrsTime interval = 1 min Hyd. volume = 785 cuftDrainage area = 0.130 ac Runoff coeff. = 0.99Intensity = 6.798 in/hr Tc by User = 5.00 minIDF Curve = Region5.IDF Asc/Rec limb fact = n/a
0 0 0 0 0 0 0 0 0 0 0 0 0 0 0 1 1 1 1 1 1 1 1 1 1 1
Q (cfs)
0.00 0.00
0.10 0.10
0.20 0.20
0.30 0.30
0.40 0.40
0.50 0.50
0.60 0.60
0.70 0.70
0.80 0.80
0.90 0.90
1.00 1.00
Q (cfs)
Time (hrs)
DA-1P Offsite to UGB-1Hyd. No. 9 -- 25 Year
Hyd No. 9
61
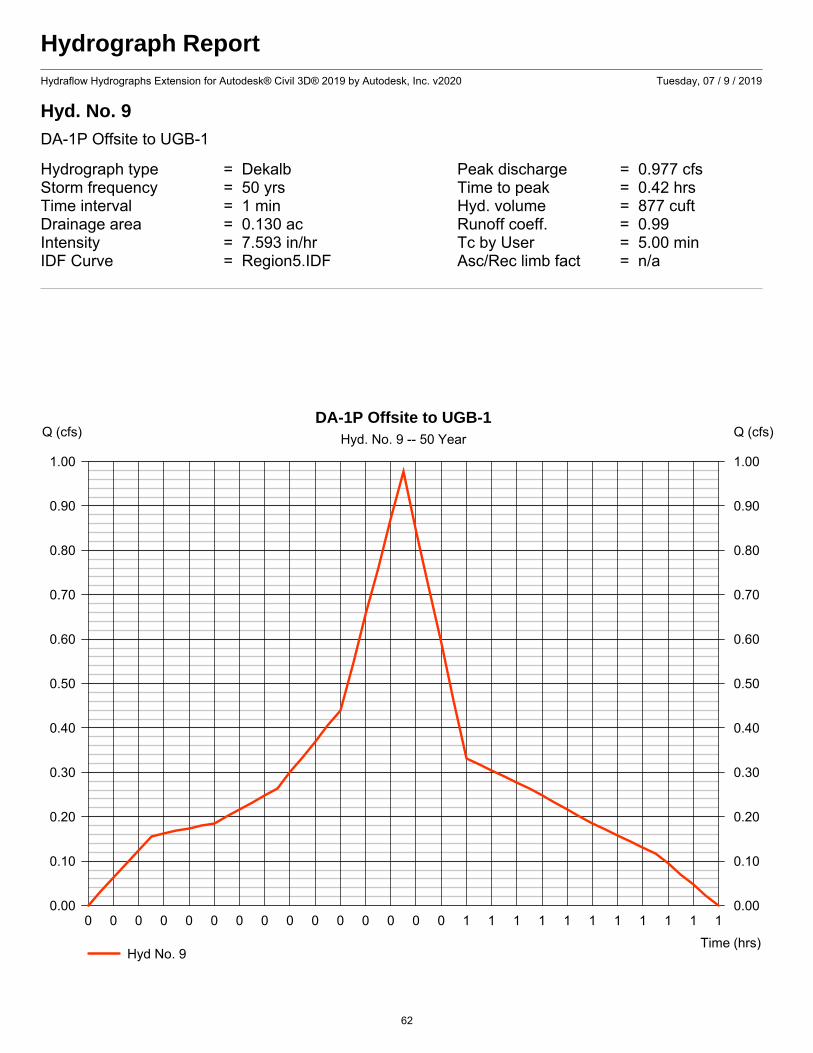
Hydrograph ReportHydraflow Hydrographs Extension for Autodesk® Civil 3D® 2019 by Autodesk, Inc. v2020 Tuesday, 07 / 9 / 2019
Hyd. No. 9
DA-1P Offsite to UGB-1
Hydrograph type = Dekalb Peak discharge = 0.977 cfsStorm frequency = 50 yrs Time to peak = 0.42 hrsTime interval = 1 min Hyd. volume = 877 cuftDrainage area = 0.130 ac Runoff coeff. = 0.99Intensity = 7.593 in/hr Tc by User = 5.00 minIDF Curve = Region5.IDF Asc/Rec limb fact = n/a
0 0 0 0 0 0 0 0 0 0 0 0 0 0 0 1 1 1 1 1 1 1 1 1 1 1
Q (cfs)
0.00 0.00
0.10 0.10
0.20 0.20
0.30 0.30
0.40 0.40
0.50 0.50
0.60 0.60
0.70 0.70
0.80 0.80
0.90 0.90
1.00 1.00
Q (cfs)
Time (hrs)
DA-1P Offsite to UGB-1Hyd. No. 9 -- 50 Year
Hyd No. 9
62
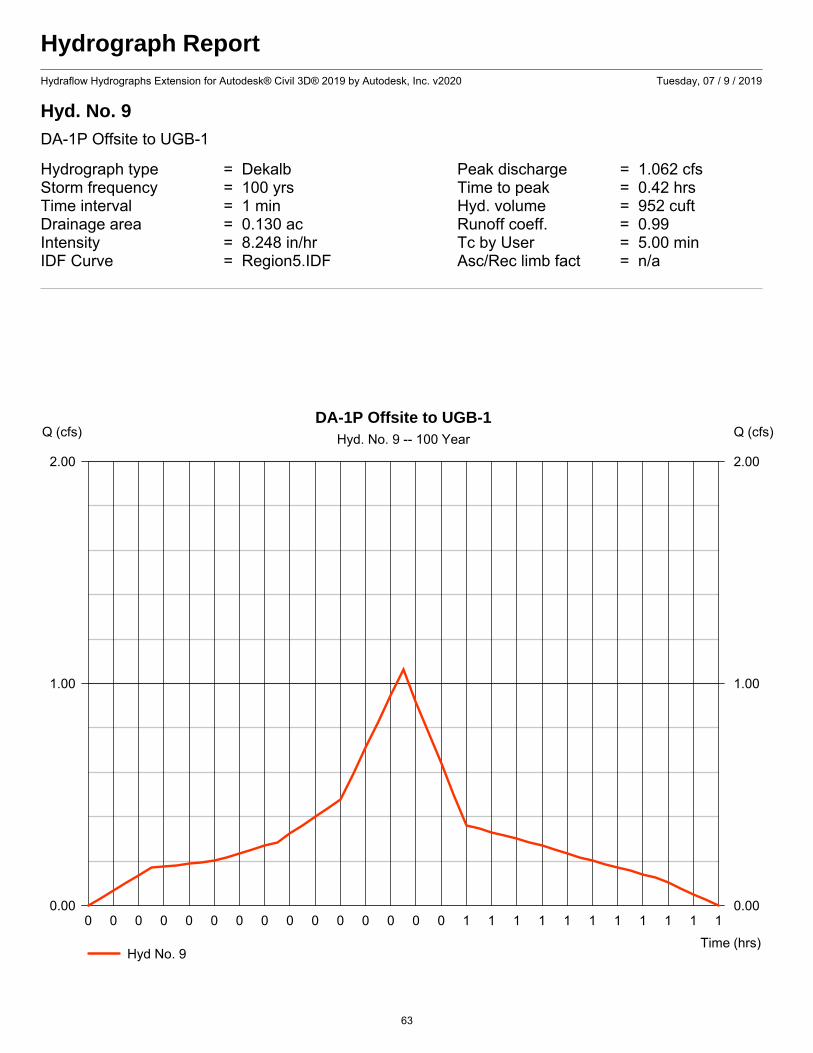
Hydrograph ReportHydraflow Hydrographs Extension for Autodesk® Civil 3D® 2019 by Autodesk, Inc. v2020 Tuesday, 07 / 9 / 2019
Hyd. No. 9
DA-1P Offsite to UGB-1
Hydrograph type = Dekalb Peak discharge = 1.062 cfsStorm frequency = 100 yrs Time to peak = 0.42 hrsTime interval = 1 min Hyd. volume = 952 cuftDrainage area = 0.130 ac Runoff coeff. = 0.99Intensity = 8.248 in/hr Tc by User = 5.00 minIDF Curve = Region5.IDF Asc/Rec limb fact = n/a
0 0 0 0 0 0 0 0 0 0 0 0 0 0 0 1 1 1 1 1 1 1 1 1 1 1
Q (cfs)
0.00 0.00
1.00 1.00
2.00 2.00
Q (cfs)
Time (hrs)
DA-1P Offsite to UGB-1Hyd. No. 9 -- 100 Year
Hyd No. 9
63
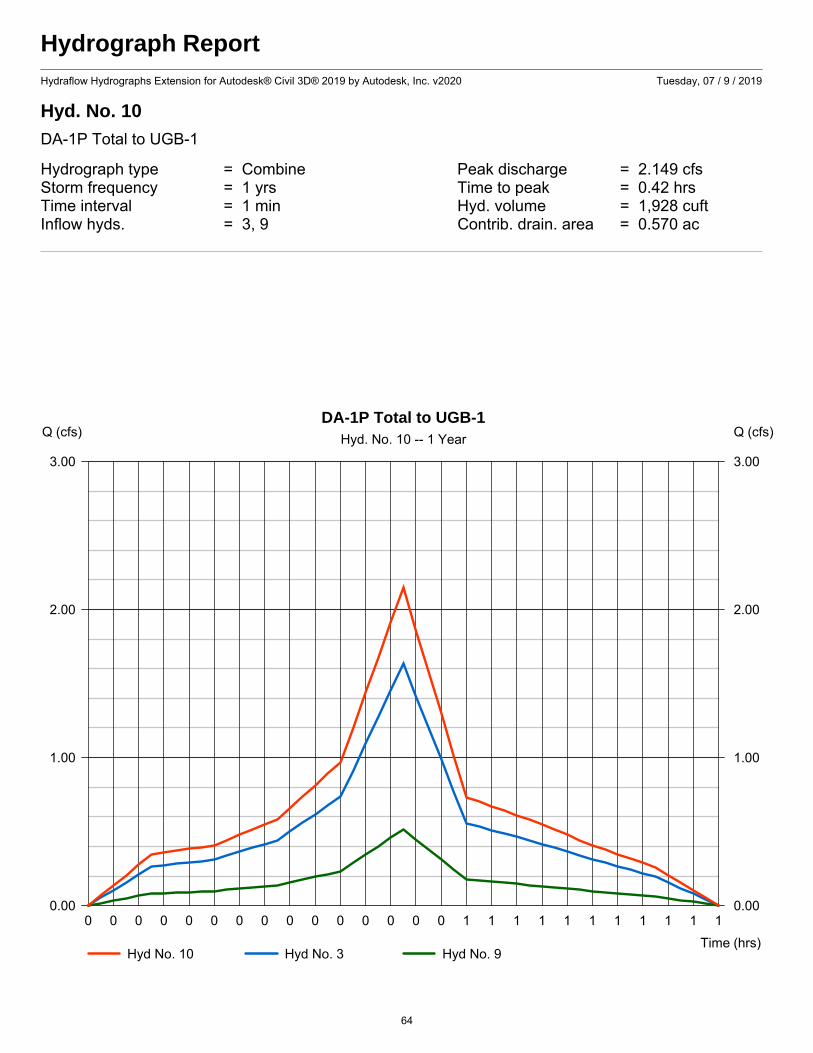
Hydrograph ReportHydraflow Hydrographs Extension for Autodesk® Civil 3D® 2019 by Autodesk, Inc. v2020 Tuesday, 07 / 9 / 2019
Hyd. No. 10
DA-1P Total to UGB-1
Hydrograph type = Combine Peak discharge = 2.149 cfsStorm frequency = 1 yrs Time to peak = 0.42 hrsTime interval = 1 min Hyd. volume = 1,928 cuftInflow hyds. = 3, 9 Contrib. drain. area = 0.570 ac
0 0 0 0 0 0 0 0 0 0 0 0 0 0 0 1 1 1 1 1 1 1 1 1 1 1
Q (cfs)
0.00 0.00
1.00 1.00
2.00 2.00
3.00 3.00
Q (cfs)
Time (hrs)
DA-1P Total to UGB-1Hyd. No. 10 -- 1 Year
Hyd No. 10 Hyd No. 3 Hyd No. 9
64
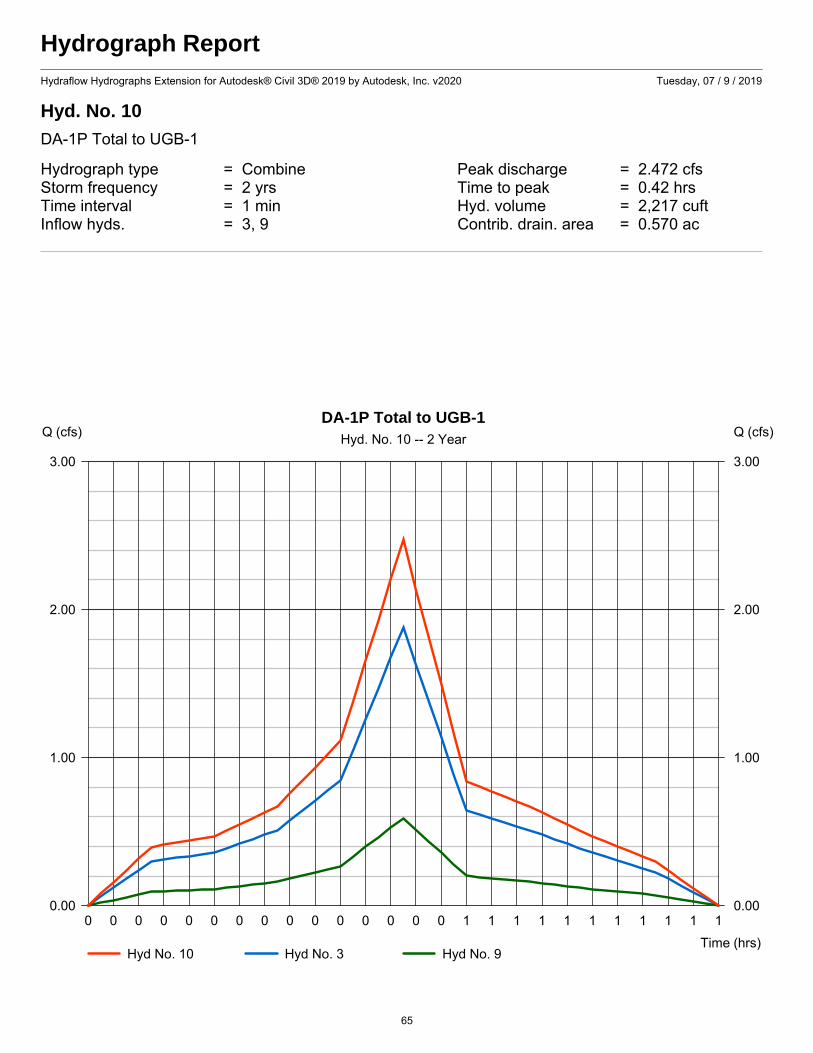
Hydrograph ReportHydraflow Hydrographs Extension for Autodesk® Civil 3D® 2019 by Autodesk, Inc. v2020 Tuesday, 07 / 9 / 2019
Hyd. No. 10
DA-1P Total to UGB-1
Hydrograph type = Combine Peak discharge = 2.472 cfsStorm frequency = 2 yrs Time to peak = 0.42 hrsTime interval = 1 min Hyd. volume = 2,217 cuftInflow hyds. = 3, 9 Contrib. drain. area = 0.570 ac
0 0 0 0 0 0 0 0 0 0 0 0 0 0 0 1 1 1 1 1 1 1 1 1 1 1
Q (cfs)
0.00 0.00
1.00 1.00
2.00 2.00
3.00 3.00
Q (cfs)
Time (hrs)
DA-1P Total to UGB-1Hyd. No. 10 -- 2 Year
Hyd No. 10 Hyd No. 3 Hyd No. 9
65
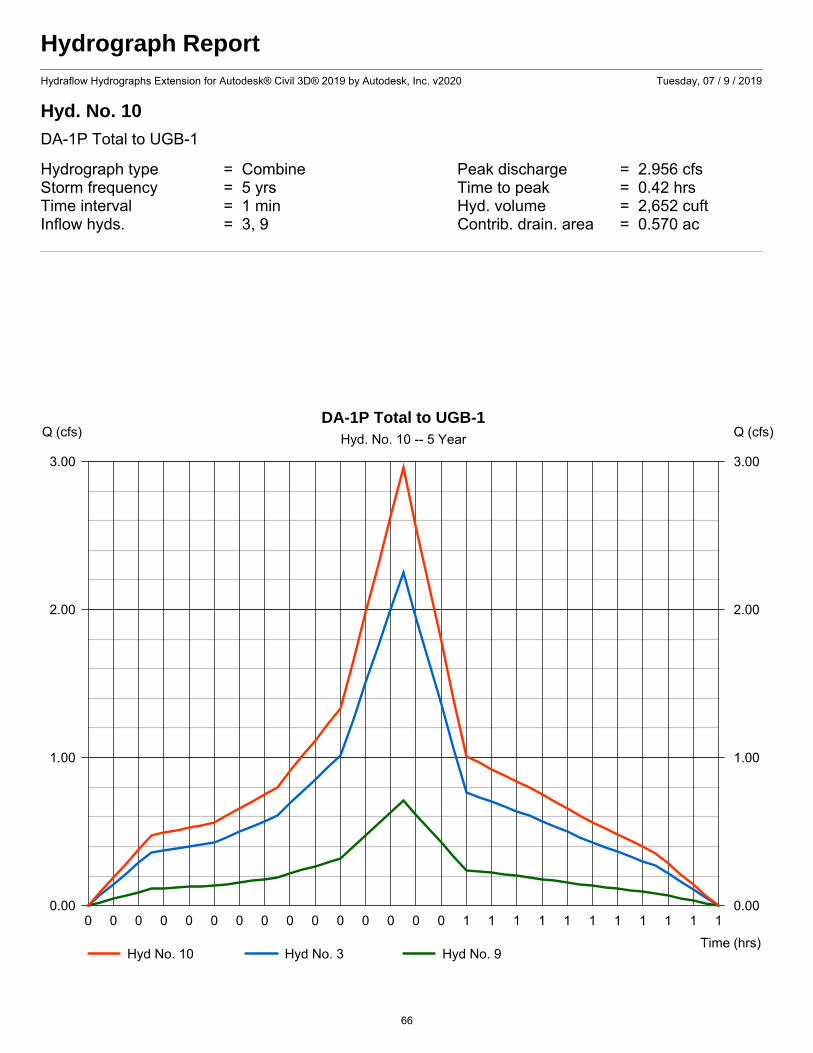
Hydrograph ReportHydraflow Hydrographs Extension for Autodesk® Civil 3D® 2019 by Autodesk, Inc. v2020 Tuesday, 07 / 9 / 2019
Hyd. No. 10
DA-1P Total to UGB-1
Hydrograph type = Combine Peak discharge = 2.956 cfsStorm frequency = 5 yrs Time to peak = 0.42 hrsTime interval = 1 min Hyd. volume = 2,652 cuftInflow hyds. = 3, 9 Contrib. drain. area = 0.570 ac
0 0 0 0 0 0 0 0 0 0 0 0 0 0 0 1 1 1 1 1 1 1 1 1 1 1
Q (cfs)
0.00 0.00
1.00 1.00
2.00 2.00
3.00 3.00
Q (cfs)
Time (hrs)
DA-1P Total to UGB-1Hyd. No. 10 -- 5 Year
Hyd No. 10 Hyd No. 3 Hyd No. 9
66
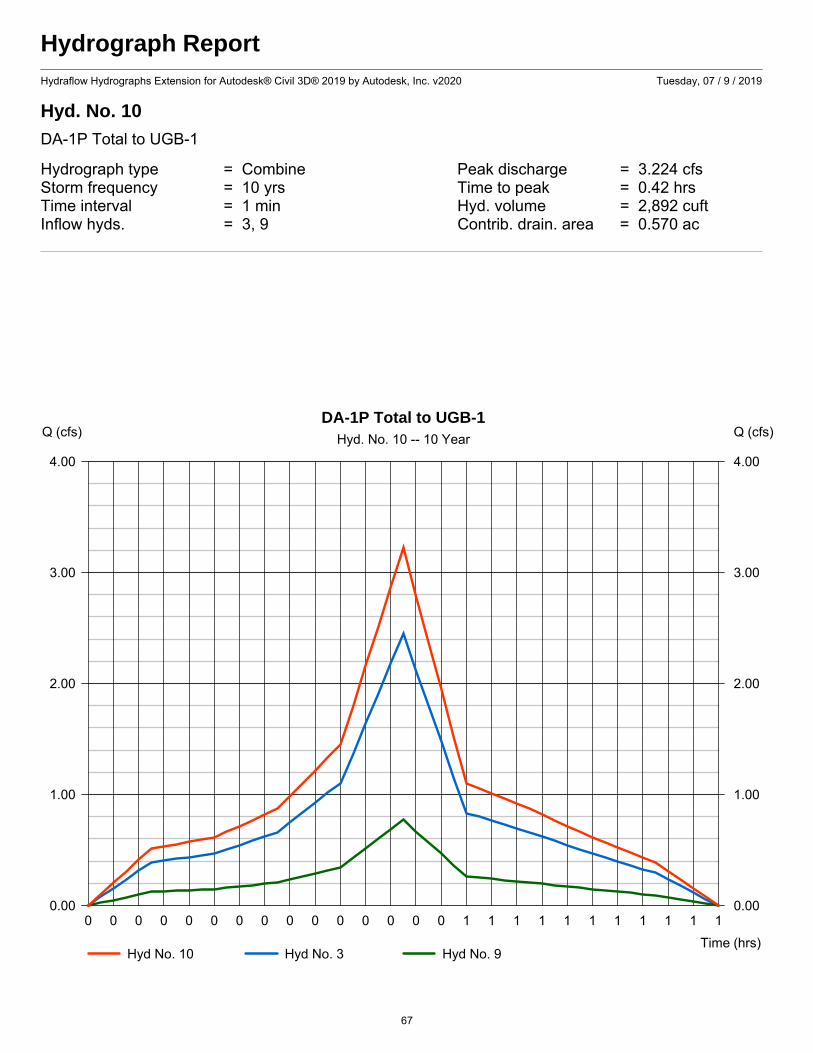
Hydrograph ReportHydraflow Hydrographs Extension for Autodesk® Civil 3D® 2019 by Autodesk, Inc. v2020 Tuesday, 07 / 9 / 2019
Hyd. No. 10
DA-1P Total to UGB-1
Hydrograph type = Combine Peak discharge = 3.224 cfsStorm frequency = 10 yrs Time to peak = 0.42 hrsTime interval = 1 min Hyd. volume = 2,892 cuftInflow hyds. = 3, 9 Contrib. drain. area = 0.570 ac
0 0 0 0 0 0 0 0 0 0 0 0 0 0 0 1 1 1 1 1 1 1 1 1 1 1
Q (cfs)
0.00 0.00
1.00 1.00
2.00 2.00
3.00 3.00
4.00 4.00
Q (cfs)
Time (hrs)
DA-1P Total to UGB-1Hyd. No. 10 -- 10 Year
Hyd No. 10 Hyd No. 3 Hyd No. 9
67

Hydrograph ReportHydraflow Hydrographs Extension for Autodesk® Civil 3D® 2019 by Autodesk, Inc. v2020 Tuesday, 07 / 9 / 2019
Hyd. No. 10
DA-1P Total to UGB-1
Hydrograph type = Combine Peak discharge = 3.656 cfsStorm frequency = 25 yrs Time to peak = 0.42 hrsTime interval = 1 min Hyd. volume = 3,280 cuftInflow hyds. = 3, 9 Contrib. drain. area = 0.570 ac
0 0 0 0 0 0 0 0 0 0 0 0 0 0 0 1 1 1 1 1 1 1 1 1 1 1
Q (cfs)
0.00 0.00
1.00 1.00
2.00 2.00
3.00 3.00
4.00 4.00
Q (cfs)
Time (hrs)
DA-1P Total to UGB-1Hyd. No. 10 -- 25 Year
Hyd No. 10 Hyd No. 3 Hyd No. 9
68
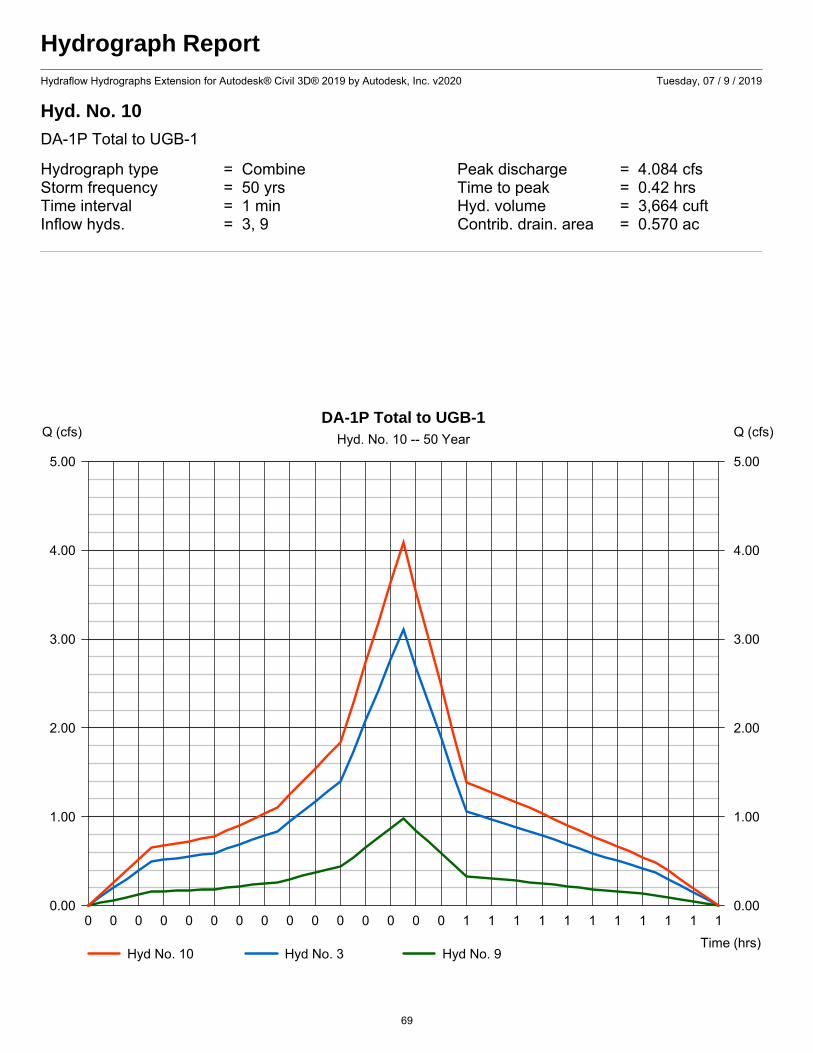
Hydrograph ReportHydraflow Hydrographs Extension for Autodesk® Civil 3D® 2019 by Autodesk, Inc. v2020 Tuesday, 07 / 9 / 2019
Hyd. No. 10
DA-1P Total to UGB-1
Hydrograph type = Combine Peak discharge = 4.084 cfsStorm frequency = 50 yrs Time to peak = 0.42 hrsTime interval = 1 min Hyd. volume = 3,664 cuftInflow hyds. = 3, 9 Contrib. drain. area = 0.570 ac
0 0 0 0 0 0 0 0 0 0 0 0 0 0 0 1 1 1 1 1 1 1 1 1 1 1
Q (cfs)
0.00 0.00
1.00 1.00
2.00 2.00
3.00 3.00
4.00 4.00
5.00 5.00
Q (cfs)
Time (hrs)
DA-1P Total to UGB-1Hyd. No. 10 -- 50 Year
Hyd No. 10 Hyd No. 3 Hyd No. 9
69
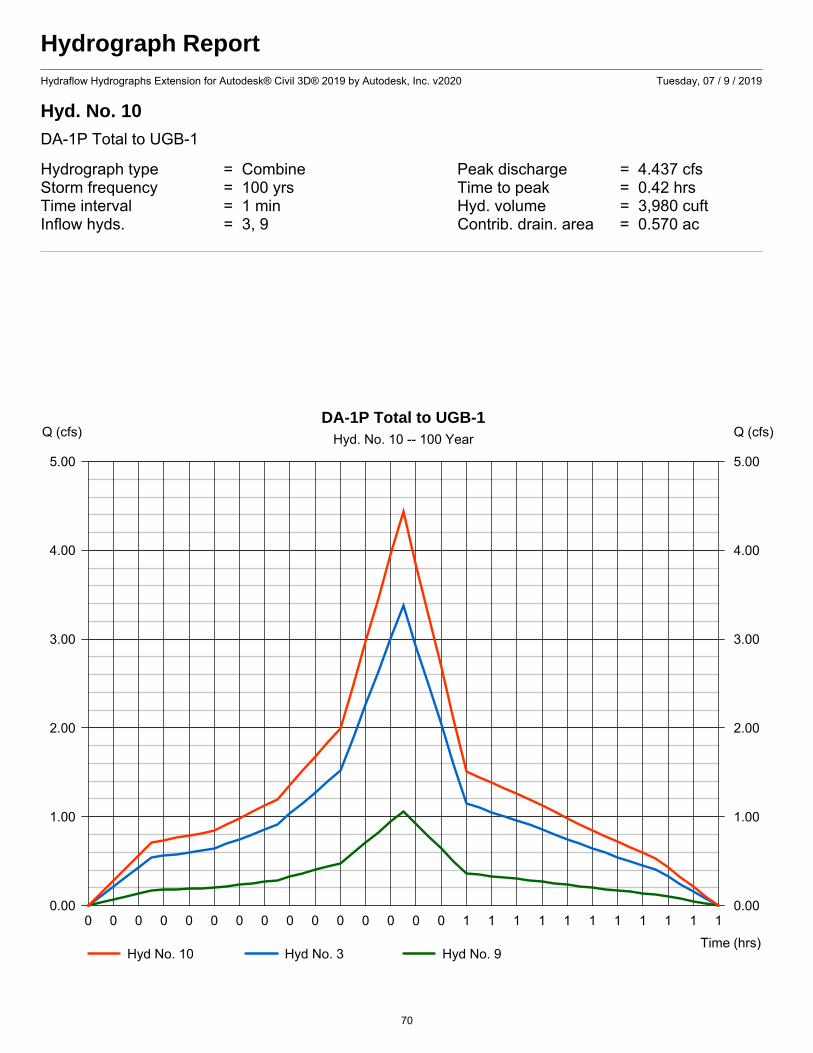
Hydrograph ReportHydraflow Hydrographs Extension for Autodesk® Civil 3D® 2019 by Autodesk, Inc. v2020 Tuesday, 07 / 9 / 2019
Hyd. No. 10
DA-1P Total to UGB-1
Hydrograph type = Combine Peak discharge = 4.437 cfsStorm frequency = 100 yrs Time to peak = 0.42 hrsTime interval = 1 min Hyd. volume = 3,980 cuftInflow hyds. = 3, 9 Contrib. drain. area = 0.570 ac
0 0 0 0 0 0 0 0 0 0 0 0 0 0 0 1 1 1 1 1 1 1 1 1 1 1
Q (cfs)
0.00 0.00
1.00 1.00
2.00 2.00
3.00 3.00
4.00 4.00
5.00 5.00
Q (cfs)
Time (hrs)
DA-1P Total to UGB-1Hyd. No. 10 -- 100 Year
Hyd No. 10 Hyd No. 3 Hyd No. 9
70

Hydrograph ReportHydraflow Hydrographs Extension for Autodesk® Civil 3D® 2019 by Autodesk, Inc. v2020 Tuesday, 07 / 9 / 2019
Hyd. No. 11
UGB-1 All Flow Routing
Hydrograph type = Reservoir Peak discharge = 0.608 cfsStorm frequency = 1 yrs Time to peak = 0.57 hrsTime interval = 1 min Hyd. volume = 1,306 cuftInflow hyd. No. = 10 - DA-1P Total to UGB-1 Max. Elevation = 400.29 ftReservoir name = UGB-1 Max. Storage = 1,335 cuft
Storage Indication method used.
0.0 0.3 0.7 1.0 1.3 1.7 2.0 2.3 2.7
Q (cfs)
0.00 0.00
1.00 1.00
2.00 2.00
3.00 3.00
Q (cfs)
Time (hrs)
UGB-1 All Flow RoutingHyd. No. 11 -- 1 Year
Hyd No. 11 Hyd No. 10 Total storage used = 1,335 cuft
71
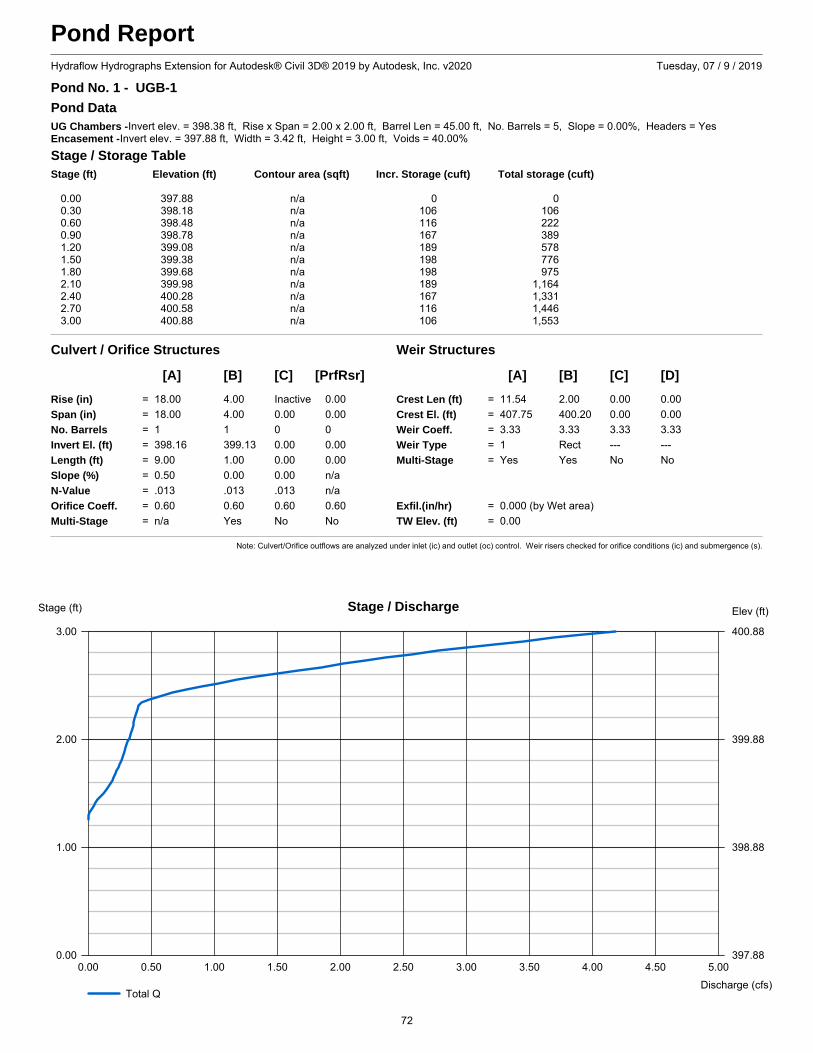
Pond ReportHydraflow Hydrographs Extension for Autodesk® Civil 3D® 2019 by Autodesk, Inc. v2020 Tuesday, 07 / 9 / 2019
Pond No. 1 - UGB-1
Pond DataUG Chambers -Invert elev. = 398.38 ft, Rise x Span = 2.00 x 2.00 ft, Barrel Len = 45.00 ft, No. Barrels = 5, Slope = 0.00%, Headers = YesEncasement -Invert elev. = 397.88 ft, Width = 3.42 ft, Height = 3.00 ft, Voids = 40.00%
Stage / Storage TableStage (ft) Elevation (ft) Contour area (sqft) Incr. Storage (cuft) Total storage (cuft)
0.00 397.88 n/a 0 00.30 398.18 n/a 106 1060.60 398.48 n/a 116 2220.90 398.78 n/a 167 3891.20 399.08 n/a 189 5781.50 399.38 n/a 198 7761.80 399.68 n/a 198 9752.10 399.98 n/a 189 1,1642.40 400.28 n/a 167 1,3312.70 400.58 n/a 116 1,4463.00 400.88 n/a 106 1,553
Culvert / Orifice Structures Weir Structures
[A] [B] [C] [PrfRsr] [A] [B] [C] [D]
Rise (in) = 18.00 4.00 Inactive 0.00Span (in) = 18.00 4.00 0.00 0.00No. Barrels = 1 1 0 0Invert El. (ft) = 398.16 399.13 0.00 0.00Length (ft) = 9.00 1.00 0.00 0.00Slope (%) = 0.50 0.00 0.00 n/aN-Value = .013 .013 .013 n/aOrifice Coeff. = 0.60 0.60 0.60 0.60Multi-Stage = n/a Yes No No
Crest Len (ft) = 11.54 2.00 0.00 0.00Crest El. (ft) = 407.75 400.20 0.00 0.00Weir Coeff. = 3.33 3.33 3.33 3.33Weir Type = 1 Rect --- ---Multi-Stage = Yes Yes No No
Exfil.(in/hr) = 0.000 (by Wet area)TW Elev. (ft) = 0.00
Note: Culvert/Orifice outflows are analyzed under inlet (ic) and outlet (oc) control. Weir risers checked for orifice conditions (ic) and submergence (s).
0.00 0.50 1.00 1.50 2.00 2.50 3.00 3.50 4.00 4.50 5.00
Stage (ft)
0.00 397.88
1.00 398.88
2.00 399.88
3.00 400.88
Elev (ft)
Discharge (cfs)
Stage / Discharge
Total Q
72
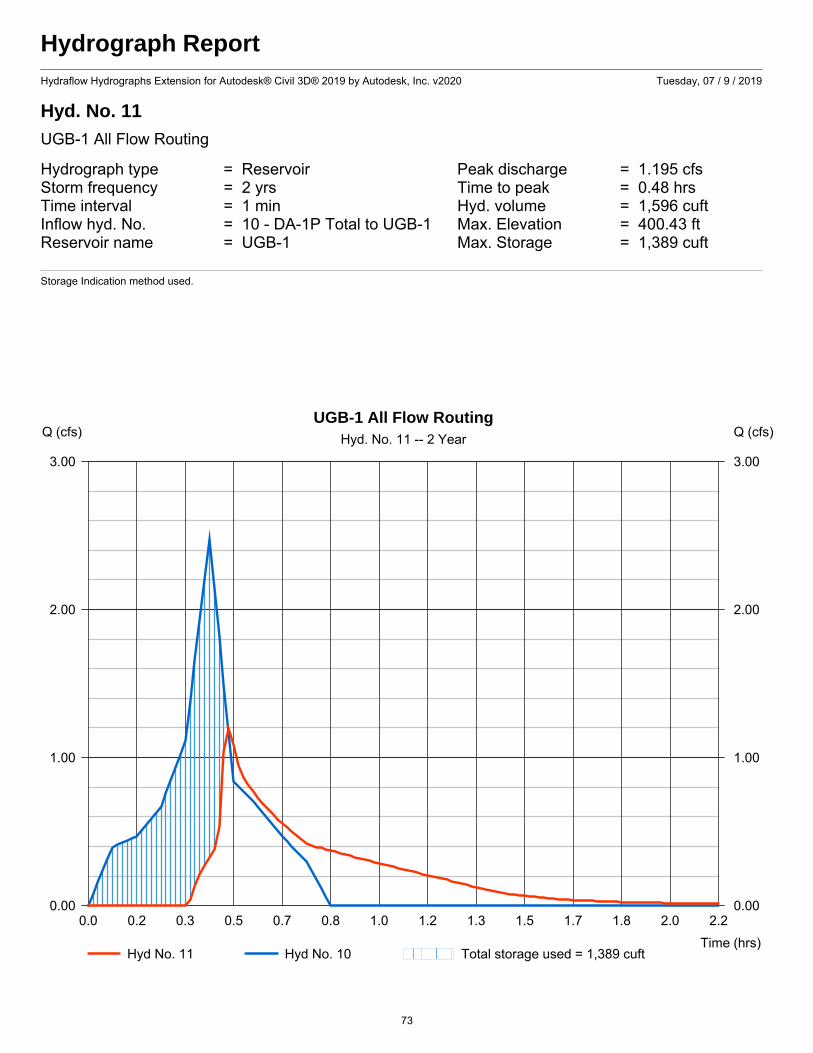
Hydrograph ReportHydraflow Hydrographs Extension for Autodesk® Civil 3D® 2019 by Autodesk, Inc. v2020 Tuesday, 07 / 9 / 2019
Hyd. No. 11
UGB-1 All Flow Routing
Hydrograph type = Reservoir Peak discharge = 1.195 cfsStorm frequency = 2 yrs Time to peak = 0.48 hrsTime interval = 1 min Hyd. volume = 1,596 cuftInflow hyd. No. = 10 - DA-1P Total to UGB-1 Max. Elevation = 400.43 ftReservoir name = UGB-1 Max. Storage = 1,389 cuft
Storage Indication method used.
0.0 0.2 0.3 0.5 0.7 0.8 1.0 1.2 1.3 1.5 1.7 1.8 2.0 2.2
Q (cfs)
0.00 0.00
1.00 1.00
2.00 2.00
3.00 3.00
Q (cfs)
Time (hrs)
UGB-1 All Flow RoutingHyd. No. 11 -- 2 Year
Hyd No. 11 Hyd No. 10 Total storage used = 1,389 cuft
73
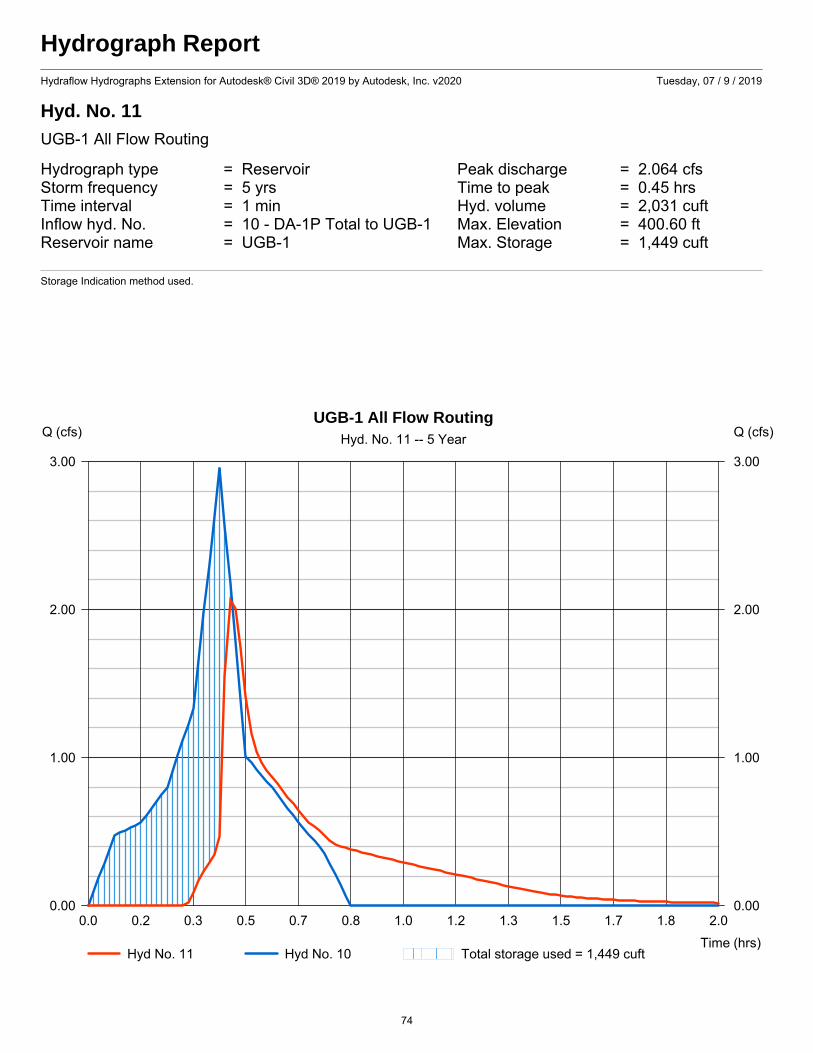
Hydrograph ReportHydraflow Hydrographs Extension for Autodesk® Civil 3D® 2019 by Autodesk, Inc. v2020 Tuesday, 07 / 9 / 2019
Hyd. No. 11
UGB-1 All Flow Routing
Hydrograph type = Reservoir Peak discharge = 2.064 cfsStorm frequency = 5 yrs Time to peak = 0.45 hrsTime interval = 1 min Hyd. volume = 2,031 cuftInflow hyd. No. = 10 - DA-1P Total to UGB-1 Max. Elevation = 400.60 ftReservoir name = UGB-1 Max. Storage = 1,449 cuft
Storage Indication method used.
0.0 0.2 0.3 0.5 0.7 0.8 1.0 1.2 1.3 1.5 1.7 1.8 2.0
Q (cfs)
0.00 0.00
1.00 1.00
2.00 2.00
3.00 3.00
Q (cfs)
Time (hrs)
UGB-1 All Flow RoutingHyd. No. 11 -- 5 Year
Hyd No. 11 Hyd No. 10 Total storage used = 1,449 cuft
74
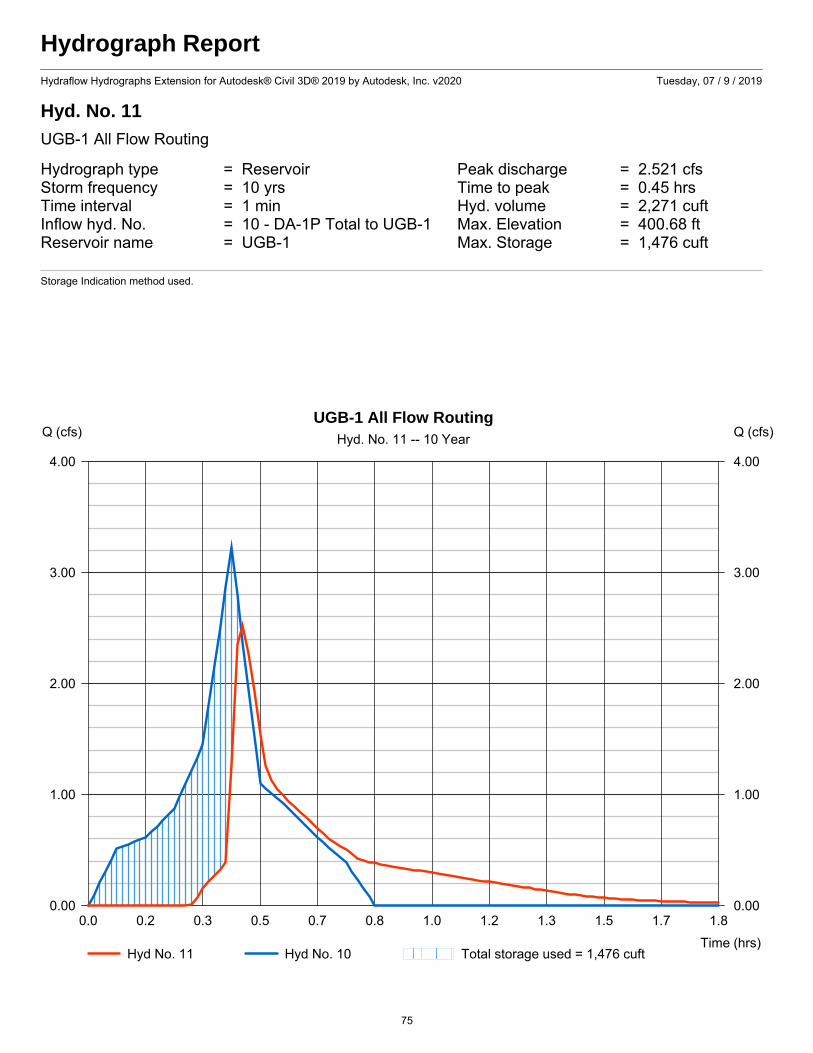
Hydrograph ReportHydraflow Hydrographs Extension for Autodesk® Civil 3D® 2019 by Autodesk, Inc. v2020 Tuesday, 07 / 9 / 2019
Hyd. No. 11
UGB-1 All Flow Routing
Hydrograph type = Reservoir Peak discharge = 2.521 cfsStorm frequency = 10 yrs Time to peak = 0.45 hrsTime interval = 1 min Hyd. volume = 2,271 cuftInflow hyd. No. = 10 - DA-1P Total to UGB-1 Max. Elevation = 400.68 ftReservoir name = UGB-1 Max. Storage = 1,476 cuft
Storage Indication method used.
0.0 0.2 0.3 0.5 0.7 0.8 1.0 1.2 1.3 1.5 1.7 1.8
Q (cfs)
0.00 0.00
1.00 1.00
2.00 2.00
3.00 3.00
4.00 4.00
Q (cfs)
Time (hrs)
UGB-1 All Flow RoutingHyd. No. 11 -- 10 Year
Hyd No. 11 Hyd No. 10 Total storage used = 1,476 cuft
75
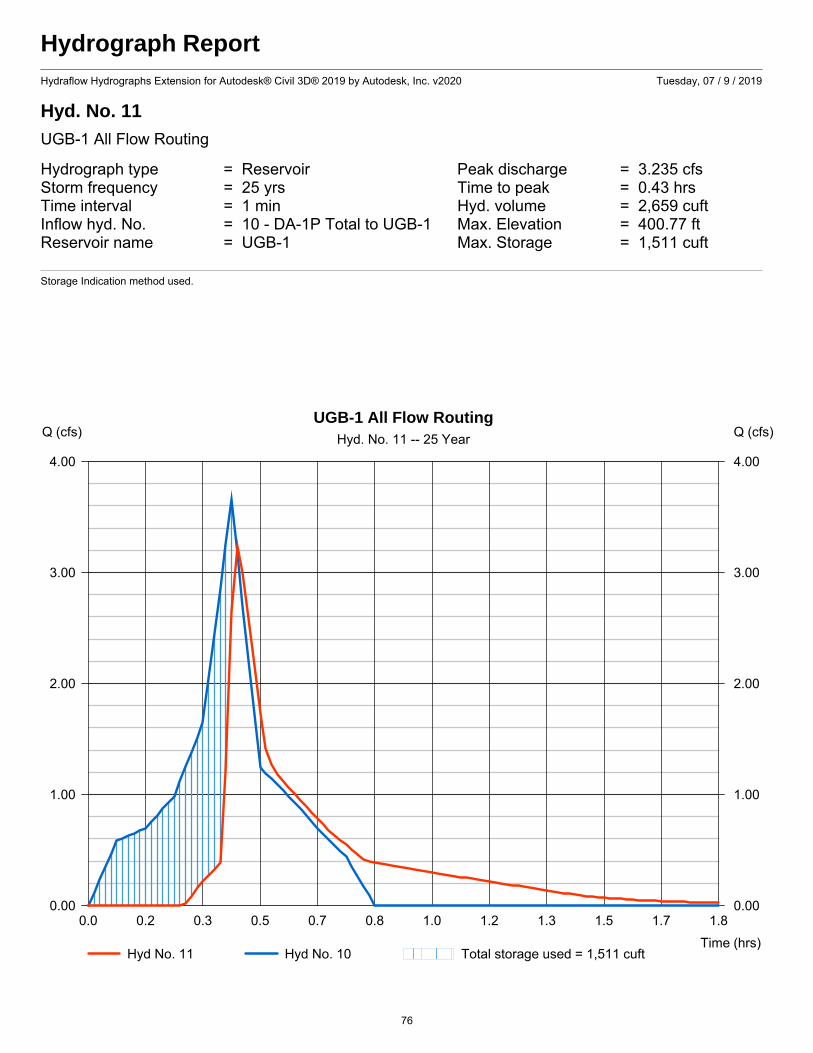
Hydrograph ReportHydraflow Hydrographs Extension for Autodesk® Civil 3D® 2019 by Autodesk, Inc. v2020 Tuesday, 07 / 9 / 2019
Hyd. No. 11
UGB-1 All Flow Routing
Hydrograph type = Reservoir Peak discharge = 3.235 cfsStorm frequency = 25 yrs Time to peak = 0.43 hrsTime interval = 1 min Hyd. volume = 2,659 cuftInflow hyd. No. = 10 - DA-1P Total to UGB-1 Max. Elevation = 400.77 ftReservoir name = UGB-1 Max. Storage = 1,511 cuft
Storage Indication method used.
0.0 0.2 0.3 0.5 0.7 0.8 1.0 1.2 1.3 1.5 1.7 1.8
Q (cfs)
0.00 0.00
1.00 1.00
2.00 2.00
3.00 3.00
4.00 4.00
Q (cfs)
Time (hrs)
UGB-1 All Flow RoutingHyd. No. 11 -- 25 Year
Hyd No. 11 Hyd No. 10 Total storage used = 1,511 cuft
76
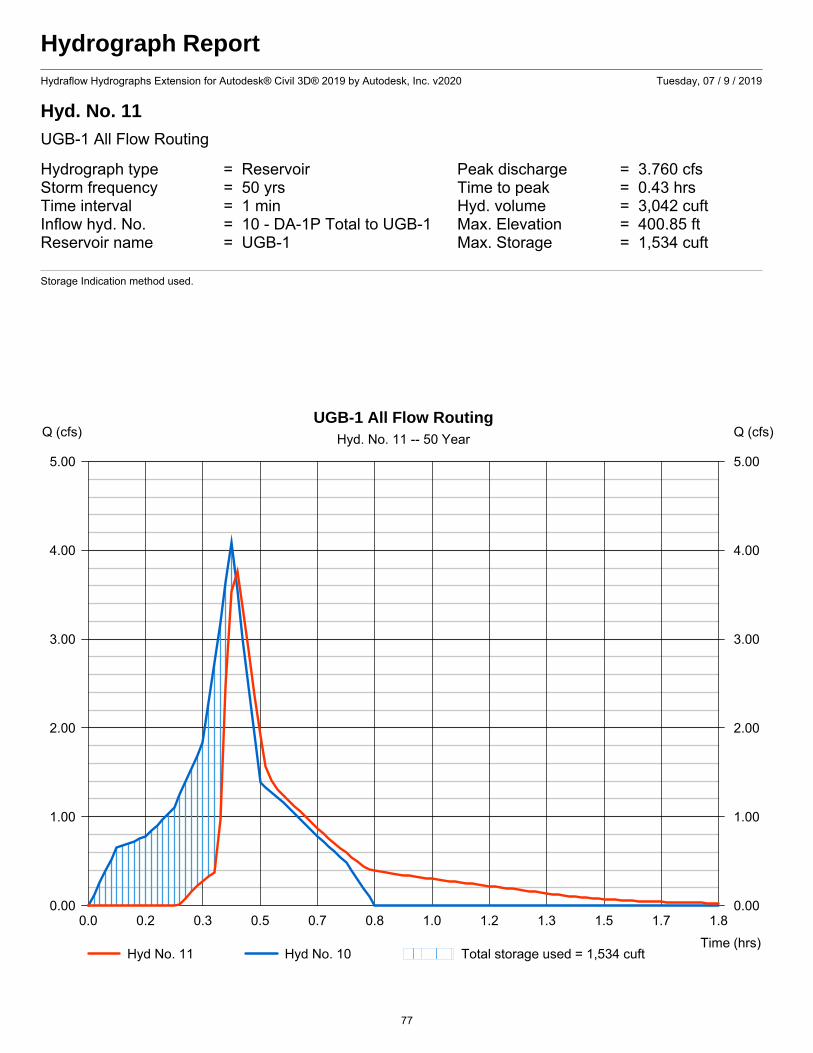
Hydrograph ReportHydraflow Hydrographs Extension for Autodesk® Civil 3D® 2019 by Autodesk, Inc. v2020 Tuesday, 07 / 9 / 2019
Hyd. No. 11
UGB-1 All Flow Routing
Hydrograph type = Reservoir Peak discharge = 3.760 cfsStorm frequency = 50 yrs Time to peak = 0.43 hrsTime interval = 1 min Hyd. volume = 3,042 cuftInflow hyd. No. = 10 - DA-1P Total to UGB-1 Max. Elevation = 400.85 ftReservoir name = UGB-1 Max. Storage = 1,534 cuft
Storage Indication method used.
0.0 0.2 0.3 0.5 0.7 0.8 1.0 1.2 1.3 1.5 1.7 1.8
Q (cfs)
0.00 0.00
1.00 1.00
2.00 2.00
3.00 3.00
4.00 4.00
5.00 5.00
Q (cfs)
Time (hrs)
UGB-1 All Flow RoutingHyd. No. 11 -- 50 Year
Hyd No. 11 Hyd No. 10 Total storage used = 1,534 cuft
77
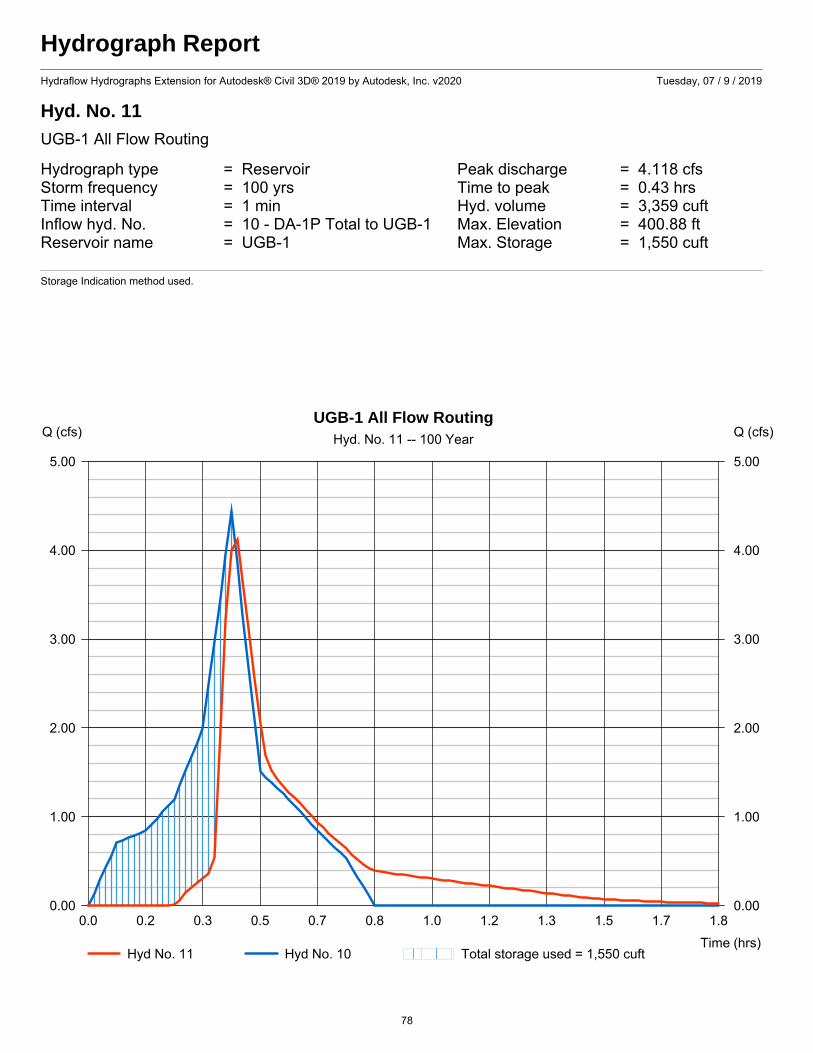
Hydrograph ReportHydraflow Hydrographs Extension for Autodesk® Civil 3D® 2019 by Autodesk, Inc. v2020 Tuesday, 07 / 9 / 2019
Hyd. No. 11
UGB-1 All Flow Routing
Hydrograph type = Reservoir Peak discharge = 4.118 cfsStorm frequency = 100 yrs Time to peak = 0.43 hrsTime interval = 1 min Hyd. volume = 3,359 cuftInflow hyd. No. = 10 - DA-1P Total to UGB-1 Max. Elevation = 400.88 ftReservoir name = UGB-1 Max. Storage = 1,550 cuft
Storage Indication method used.
0.0 0.2 0.3 0.5 0.7 0.8 1.0 1.2 1.3 1.5 1.7 1.8
Q (cfs)
0.00 0.00
1.00 1.00
2.00 2.00
3.00 3.00
4.00 4.00
5.00 5.00
Q (cfs)
Time (hrs)
UGB-1 All Flow RoutingHyd. No. 11 -- 100 Year
Hyd No. 11 Hyd No. 10 Total storage used = 1,550 cuft
78

Appendix
79
NEW BRITAIN CORPORATE CENTER 1600 MANOR DRIVE
SUITE 220 CHALFONT, PA 18914
215.712.2700 whitestoneassoc.com
Celebrating 25 Years 1994 – 2019
Other Office Locations: WARREN, NJ
908.668.7777 SOUTHBOROUGH, MA
508.485.0755 ROCKY HILL, CT 860.726.7889
WALL, NJ 732.592.2101
STERLING, VA 703.464.5858
EVERGREEN, CO 303.670.6905
June 14, 2019 via email BOHLER ENGINEERING PA, LLC New Britain Corporate Center 1600 Manor Drive, Suite 200 Chalfont, Pennsylvania 18914 Attention: Adam S. Benosky, RLA Principal Regarding: STORMWATER MANAGEMENT AREA EVALUATION
PROPOSED COMMERCIAL SITE REDEVELOPMENT 3604 WEST CHESTER PIKE NEWTOWN TOWNSHIP, DELAWARE COUNTY, PENNSYLVANIA
WHITESTONE PROJECT NO.: GP1916361.000 Dear Mr. Benosky: Whitestone Associates, Inc. (Whitestone) is pleased to submit this Stormwater Management Area Evaluation report for the proposed stormwater management (SWM) facilities at the site referenced above. The investigation was performed in general accordance with Whitestone’s April 25, 2019 proposal to Bohler Engineering PA, LLC (Bohler). The test locations and elevations were based on information provided by Bohler, which included a March 21, 2019 (last revised April 2, 2019) Preliminary/Final Land Development Plan Set prepared by Bohler. PROJECT DESCRIPTION At the time of the field investigation, the site was developed with a single-story vacant restaurant/convenience store building with associated pavements and utilities. The proposed site improvements pertinent to this report include construction of a SWM subsurface basin associated with the proposed site redevelopment. The proposed subsurface basin is located in the southern/central portion of the site with an approximate bottom elevation of 397.50 feet, as referenced from the North American Vertical Datum of 1988 (NAVD88). The area of the proposed SWM facility is shown on the Test Location Plan included as Figure 1. FIELD INVESTIGATION The investigation included an evaluation of three soil borings (identified as B-1 through B-3) and performing three in-situ infiltration tests utilizing cased-borehole methodology. The subsurface investigation and infiltration testing program was performed in general accordance with standards presented in the Pennsylvania Department of Environmental Protection (PADEP) Stormwater Best Management Practices Manual (BMP Manual).
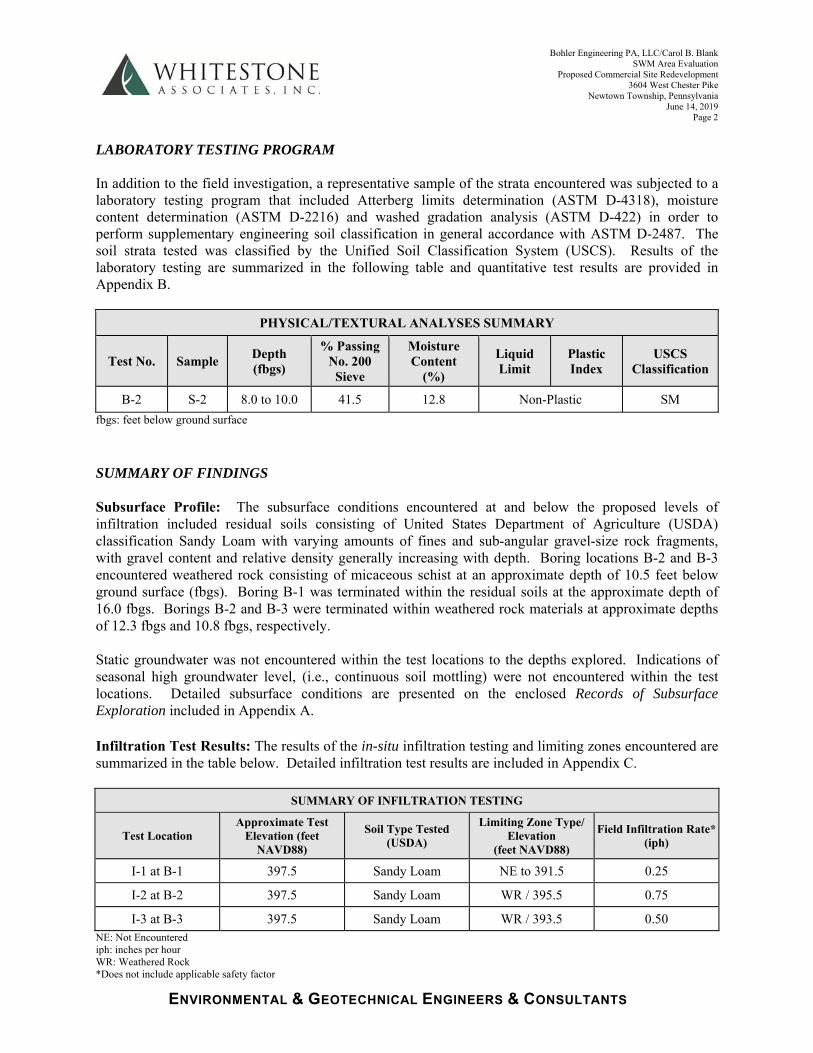
Bohler Engineering PA, LLC/Carol B. Blank SWM Area Evaluation
Proposed Commercial Site Redevelopment 3604 West Chester Pike
Newtown Township, Pennsylvania June 14, 2019
Page 2
ENVIRONMENTAL & GEOTECHNICAL ENGINEERS & CONSULTANTS
LABORATORY TESTING PROGRAM In addition to the field investigation, a representative sample of the strata encountered was subjected to a laboratory testing program that included Atterberg limits determination (ASTM D-4318), moisture content determination (ASTM D-2216) and washed gradation analysis (ASTM D-422) in order to perform supplementary engineering soil classification in general accordance with ASTM D-2487. The soil strata tested was classified by the Unified Soil Classification System (USCS). Results of the laboratory testing are summarized in the following table and quantitative test results are provided in Appendix B.
PHYSICAL/TEXTURAL ANALYSES SUMMARY
Test No. Sample Depth (fbgs)
% Passing No. 200
Sieve
Moisture Content
(%)
Liquid Limit
Plastic Index
USCS Classification
B-2 S-2 8.0 to 10.0 41.5 12.8 Non-Plastic SM
fbgs: feet below ground surface
SUMMARY OF FINDINGS Subsurface Profile: The subsurface conditions encountered at and below the proposed levels of infiltration included residual soils consisting of United States Department of Agriculture (USDA) classification Sandy Loam with varying amounts of fines and sub-angular gravel-size rock fragments, with gravel content and relative density generally increasing with depth. Boring locations B-2 and B-3 encountered weathered rock consisting of micaceous schist at an approximate depth of 10.5 feet below ground surface (fbgs). Boring B-1 was terminated within the residual soils at the approximate depth of 16.0 fbgs. Borings B-2 and B-3 were terminated within weathered rock materials at approximate depths of 12.3 fbgs and 10.8 fbgs, respectively. Static groundwater was not encountered within the test locations to the depths explored. Indications of seasonal high groundwater level, (i.e., continuous soil mottling) were not encountered within the test locations. Detailed subsurface conditions are presented on the enclosed Records of Subsurface Exploration included in Appendix A. Infiltration Test Results: The results of the in-situ infiltration testing and limiting zones encountered are summarized in the table below. Detailed infiltration test results are included in Appendix C.
SUMMARY OF INFILTRATION TESTING
Test Location Approximate Test
Elevation (feet NAVD88)
Soil Type Tested (USDA)
Limiting Zone Type/ Elevation
(feet NAVD88)
Field Infiltration Rate*(iph)
I-1 at B-1 397.5 Sandy Loam NE to 391.5 0.25
I-2 at B-2 397.5 Sandy Loam WR / 395.5 0.75
I-3 at B-3 397.5 Sandy Loam WR / 393.5 0.50 NE: Not Encountered iph: inches per hour WR: Weathered Rock *Does not include applicable safety factor
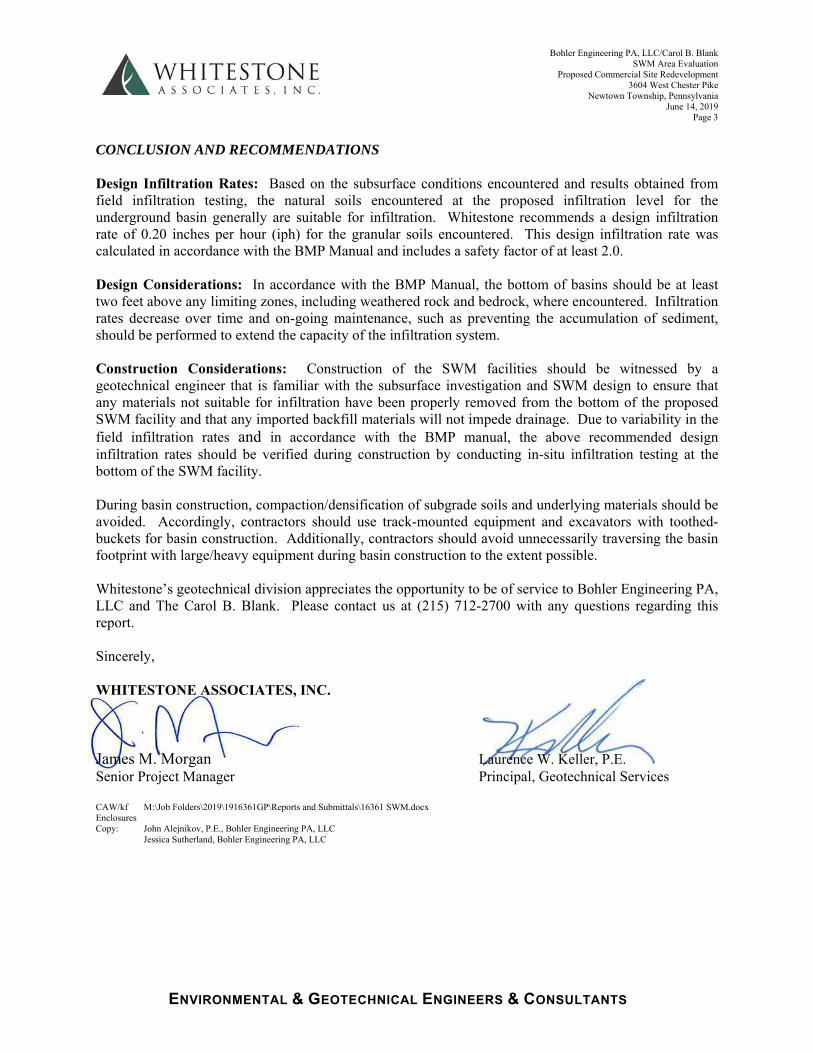
Bohler Engineering PA, LLC/Carol B. Blank SWM Area Evaluation
Proposed Commercial Site Redevelopment 3604 West Chester Pike
Newtown Township, Pennsylvania June 14, 2019
Page 3
ENVIRONMENTAL & GEOTECHNICAL ENGINEERS & CONSULTANTS
CONCLUSION AND RECOMMENDATIONS Design Infiltration Rates: Based on the subsurface conditions encountered and results obtained from field infiltration testing, the natural soils encountered at the proposed infiltration level for the underground basin generally are suitable for infiltration. Whitestone recommends a design infiltration rate of 0.20 inches per hour (iph) for the granular soils encountered. This design infiltration rate was calculated in accordance with the BMP Manual and includes a safety factor of at least 2.0. Design Considerations: In accordance with the BMP Manual, the bottom of basins should be at least two feet above any limiting zones, including weathered rock and bedrock, where encountered. Infiltration rates decrease over time and on-going maintenance, such as preventing the accumulation of sediment, should be performed to extend the capacity of the infiltration system. Construction Considerations: Construction of the SWM facilities should be witnessed by a geotechnical engineer that is familiar with the subsurface investigation and SWM design to ensure that any materials not suitable for infiltration have been properly removed from the bottom of the proposed SWM facility and that any imported backfill materials will not impede drainage. Due to variability in the field infiltration rates and in accordance with the BMP manual, the above recommended design infiltration rates should be verified during construction by conducting in-situ infiltration testing at the bottom of the SWM facility. During basin construction, compaction/densification of subgrade soils and underlying materials should be avoided. Accordingly, contractors should use track-mounted equipment and excavators with toothed-buckets for basin construction. Additionally, contractors should avoid unnecessarily traversing the basin footprint with large/heavy equipment during basin construction to the extent possible. Whitestone’s geotechnical division appreciates the opportunity to be of service to Bohler Engineering PA, LLC and The Carol B. Blank. Please contact us at (215) 712-2700 with any questions regarding this report. Sincerely, WHITESTONE ASSOCIATES, INC. James M. Morgan Laurence W. Keller, P.E. Senior Project Manager Principal, Geotechnical Services CAW/kf M:\Job Folders\2019\1916361GP\Reports and Submittals\16361 SWM.docx Enclosures Copy: John Alejnikov, P.E., Bohler Engineering PA, LLC Jessica Sutherland, Bohler Engineering PA, LLC
FIGURE 1 Test Location Plan
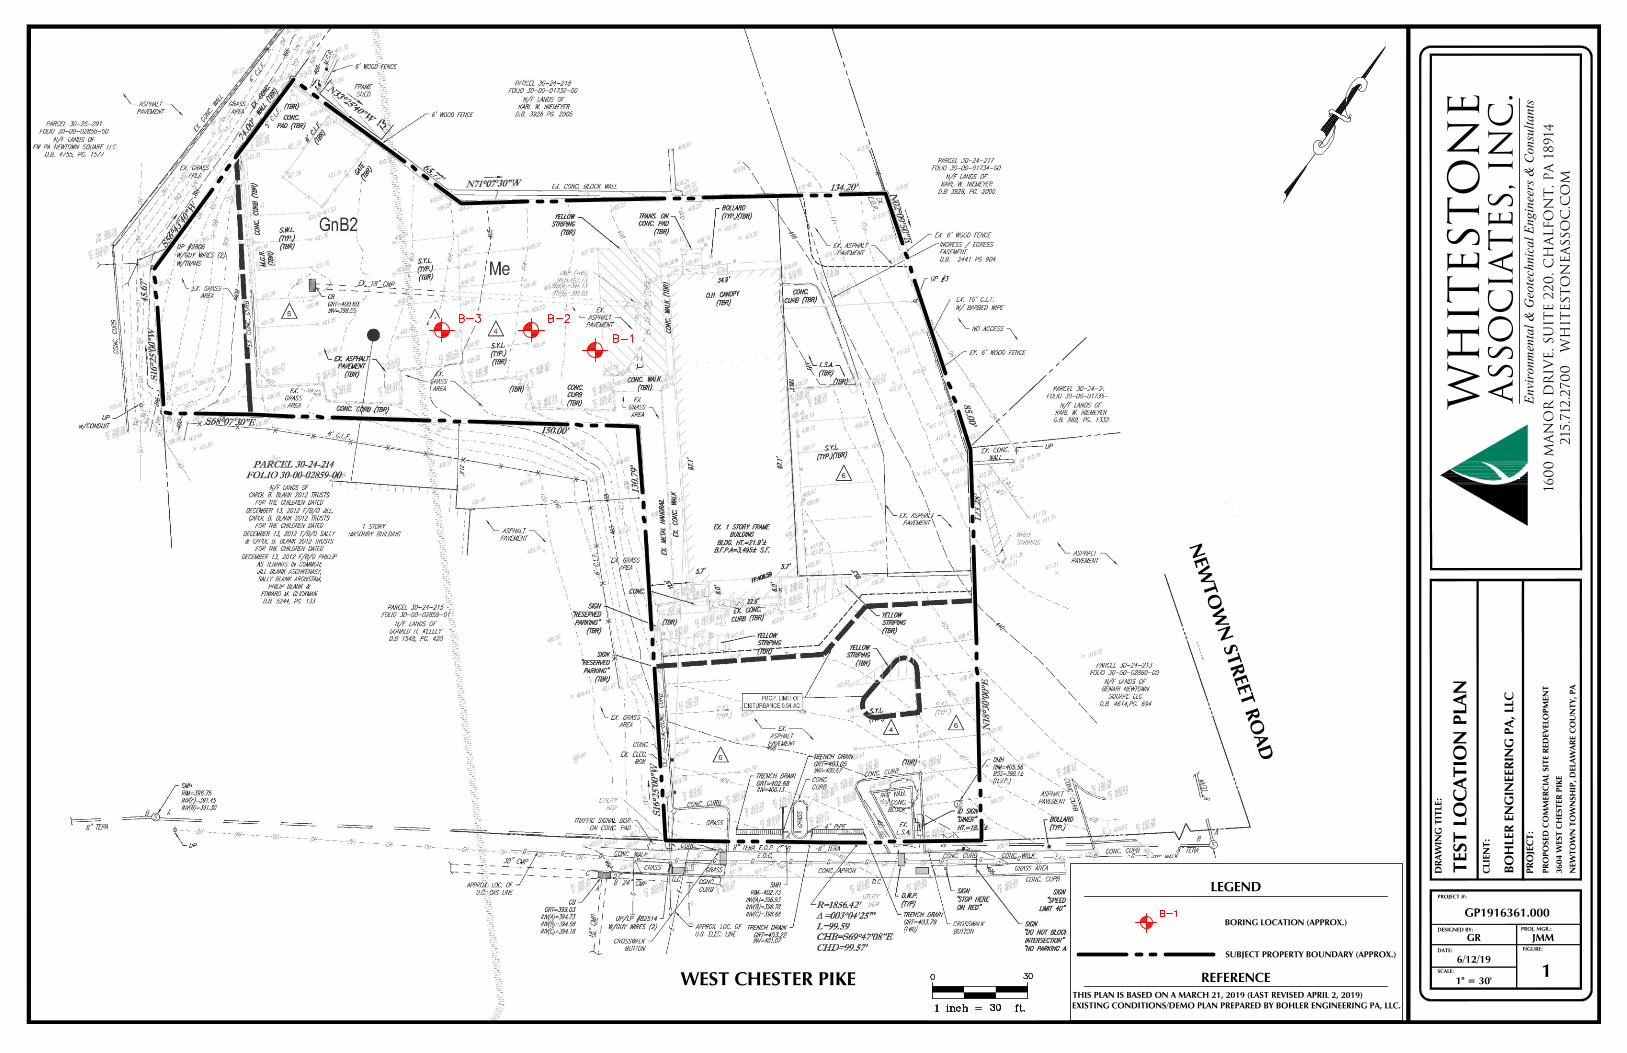
FIGURE:DATE:
PROJECT #:
SCALE:
Envi
ronm
enta
l & G
eote
chni
cal E
ngin
eers
& C
onsu
ltant
s
WH
ITEST
ON
EA
SSO
CIA
TES,
IN
C.
CLI
ENT:
DESIGNED BY: PROJ. MGR.:
GP1916361.000
6/12/19
1" = 30'1
BOH
LER
ENG
INEE
RIN
G P
A, L
LC
PRO
POSE
D C
OM
MER
CIA
L SI
TE R
EDEV
ELO
PMEN
T
3604
WES
T C
HES
TER
PIKE
NEW
TOW
N T
OW
NSH
IP, D
ELAW
ARE
CO
UN
TY, P
A
GR
PRO
JEC
T:
DRA
WIN
G T
ITLE
:
JMM
160
0 M
AN
OR
DR
IVE, S
UIT
E 2
20, C
HA
LFO
NT
, PA
1891
421
5.71
2.27
00
W
HIT
EST
ON
EA
SSO
C.C
OM
LEGEND
REFERENCE
SUBJECT PROPERTY BOUNDARY (APPROX.)
THIS PLAN IS BASED ON A MARCH 21, 2019 (LAST REVISED APRIL 2, 2019)EXISTING CONDITIONS/DEMO PLAN PREPARED BY BOHLER ENGINEERING PA, LLC.
TEST
LO
CAT
ION
PLA
N
BORING LOCATION (APPROX.)
WEST CHESTER PIKE
NEW
TOW
N STREET RO
AD
AutoCAD SHX Text
1 inch = ft.
AutoCAD SHX Text
0
AutoCAD SHX Text
30
AutoCAD SHX Text
30
AutoCAD SHX Text
B-1
AutoCAD SHX Text
B-1
AutoCAD SHX Text
B-2
AutoCAD SHX Text
B-3
APPENDIX A Records of Subsurface Exploration
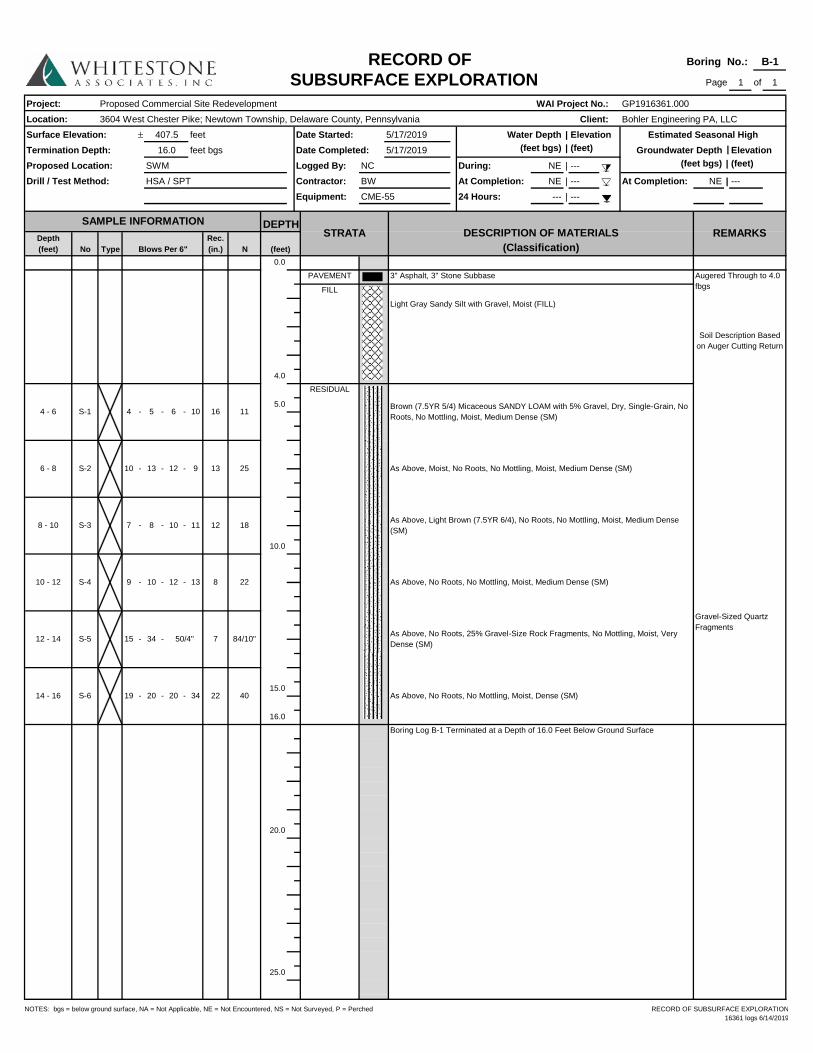
NOTES: bgs = below ground surface, NA = Not Applicable, NE = Not Encountered, NS = Not Surveyed, P = Perched RECORD OF SUBSURFACE EXPLORATION 16361 logs 6/14/2019
1 1
Project:Location:Surface Elevation: ± |Termination Depth: Date Completed: | |Proposed Location: | --- |
At Completion: | --- NE || ---
No Type0.0
4.0
5.0
10.0
15.0
16.0
20.0
25.0
84/10"
40
Augered Through to 4.0 fbgs
50/4"
Soil Description Based on Auger Cutting Return
As Above, No Roots, No Mottling, Moist, Medium Dense (SM)
As Above, No Roots, 25% Gravel-Size Rock Fragments, No Mottling, Moist, Very Dense (SM)
As Above, No Roots, No Mottling, Moist, Dense (SM)
Gravel-Sized Quartz Fragments
As Above, Moist, No Roots, No Mottling, Moist, Medium Dense (SM)
Brown (7.5YR 5/4) Micaceous SANDY LOAM with 5% Gravel, Dry, Single-Grain, No Roots, No Mottling, Moist, Medium Dense (SM)
-
- 20 - 34
7
22
15 -
-19S-614 - 16
34
20
10 - 12 S-4 9 - 10
12 - 14 S-5
Proposed Commercial Site Redevelopment WAI Project No.: GP1916361.000
Drill / Test Method: HSA / SPT Contractor: BW NE At Completion: ---
SWM Logged By: NC During: NE
RECORD OF Boring No.: B-1
SUBSURFACE EXPLORATION Page of
16.0 feet bgs 5/17/2019 (feet bgs) (feet) Elevation
3604 West Chester Pike; Newtown Township, Delaware County, Pennsylvania Client: Bohler Engineering PA, LLC
407.5 feet Date Started: 5/17/2019 Water Depth Elevation
Equipment: CME-55 24 Hours: ---
DEPTHSTRATA DESCRIPTION OF MATERIALS REMARKSDepth
(feet) Blows Per 6"Rec. (in.) N (feet) (Classification)
3" Asphalt, 3" Stone Subbase
Light Gray Sandy Silt with Gravel, Moist (FILL)
PAVEMENT
FILL
4 - 6 S-1 4 - 5 - 6 - 10 16 11
RESIDUAL
8 - 10 S-3 7 -
9 13 256 - 8 S-2 10 - 13 - 12 -
188 - 10 - 11 12
13 8 22
As Above, Light Brown (7.5YR 6/4), No Roots, No Mottling, Moist, Medium Dense (SM)
- 12 -
Estimated Seasonal HighGroundwater Depth
(feet bgs) (feet)
Boring Log B-1 Terminated at a Depth of 16.0 Feet Below Ground Surface
SAMPLE INFORMATION
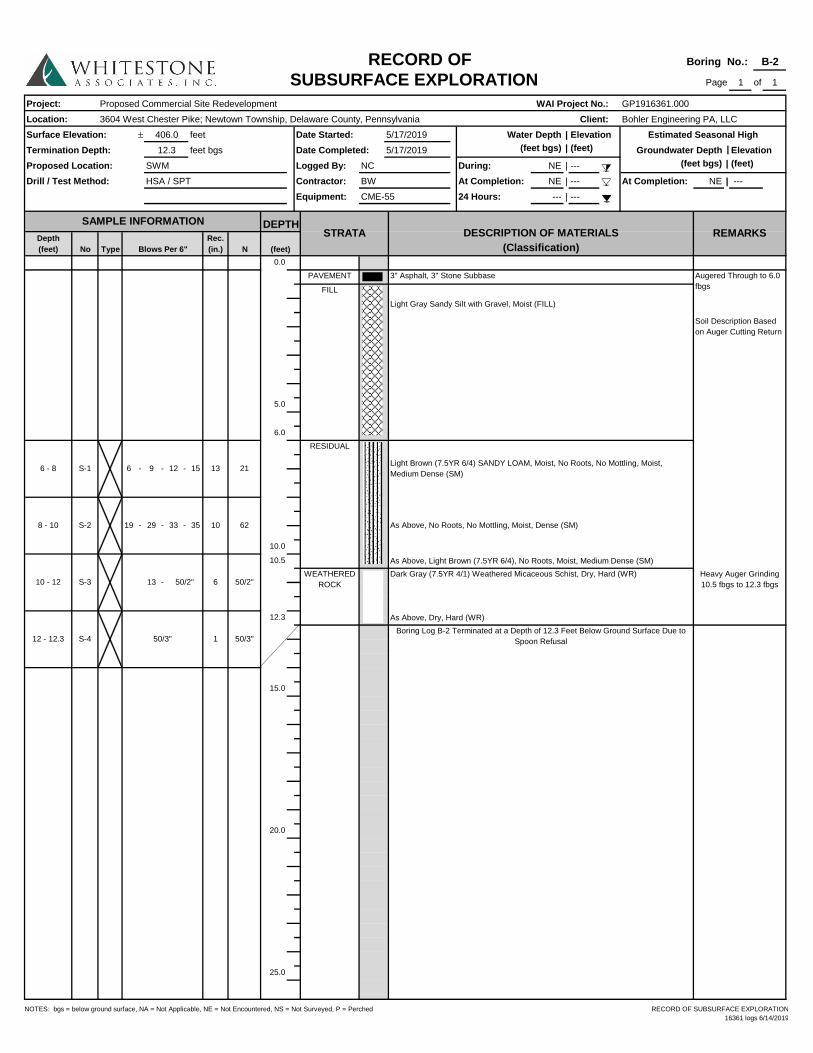
NOTES: bgs = below ground surface, NA = Not Applicable, NE = Not Encountered, NS = Not Surveyed, P = Perched RECORD OF SUBSURFACE EXPLORATION 16361 logs 6/14/2019
1 1
Project:Location:Surface Elevation: ± |Termination Depth: Date Completed: | |Proposed Location: | --- |
At Completion: | --- At Completion: NE || ---
No Type0.0
5.0
6.0
10.0
10.5
12.3
15.0
20.0
25.0
(feet bgs)
1 50/3"12 - 12.3 S-4 50/3"
As Above, Light Brown (7.5YR 6/4), No Roots, Moist, Medium Dense (SM)
WEATHERED ROCK
Heavy Auger Grinding 10.5 fbgs to 12.3 fbgs- 6 50/2"10 - 12 S-3 13 50/2"
As Above, No Roots, No Mottling, Moist, Dense (SM)- 33 - 35 10 628 - 10 S-2 19 - 29
RESIDUAL
Light Brown (7.5YR 6/4) SANDY LOAM, Moist, No Roots, No Mottling, Moist, Medium Dense (SM)
- 12 - 15 13 216 - 8 S-1 6 - 9
PAVEMENT 3" Asphalt, 3" Stone Subbase
Soil Description Based on Auger Cutting Return
Augered Through to 6.0 fbgsFILL
Light Gray Sandy Silt with Gravel, Moist (FILL)
SAMPLE INFORMATION DEPTHSTRATA DESCRIPTION OF MATERIALS REMARKSDepth
(feet) Blows Per 6"Rec. (in.) N (feet) (Classification)
Equipment: CME-55 24 Hours: ---
RECORD OF Boring No.: B-2
SUBSURFACE EXPLORATION Page of
12.3 feet bgs 5/17/2019 (feet bgs) (feet)Estimated Seasonal High
3604 West Chester Pike; Newtown Township, Delaware County, Pennsylvania Client: Bohler Engineering PA, LLC
406.0 feet Date Started: 5/17/2019 Water Depth ElevationGroundwater Depth Elevation
Boring Log B-2 Terminated at a Depth of 12.3 Feet Below Ground Surface Due to Spoon Refusal
Dark Gray (7.5YR 4/1) Weathered Micaceous Schist, Dry, Hard (WR)
As Above, Dry, Hard (WR)
Proposed Commercial Site Redevelopment WAI Project No.: GP1916361.000
Drill / Test Method: HSA / SPT Contractor: BW NE ---
SWM Logged By: NC During: NE (feet)
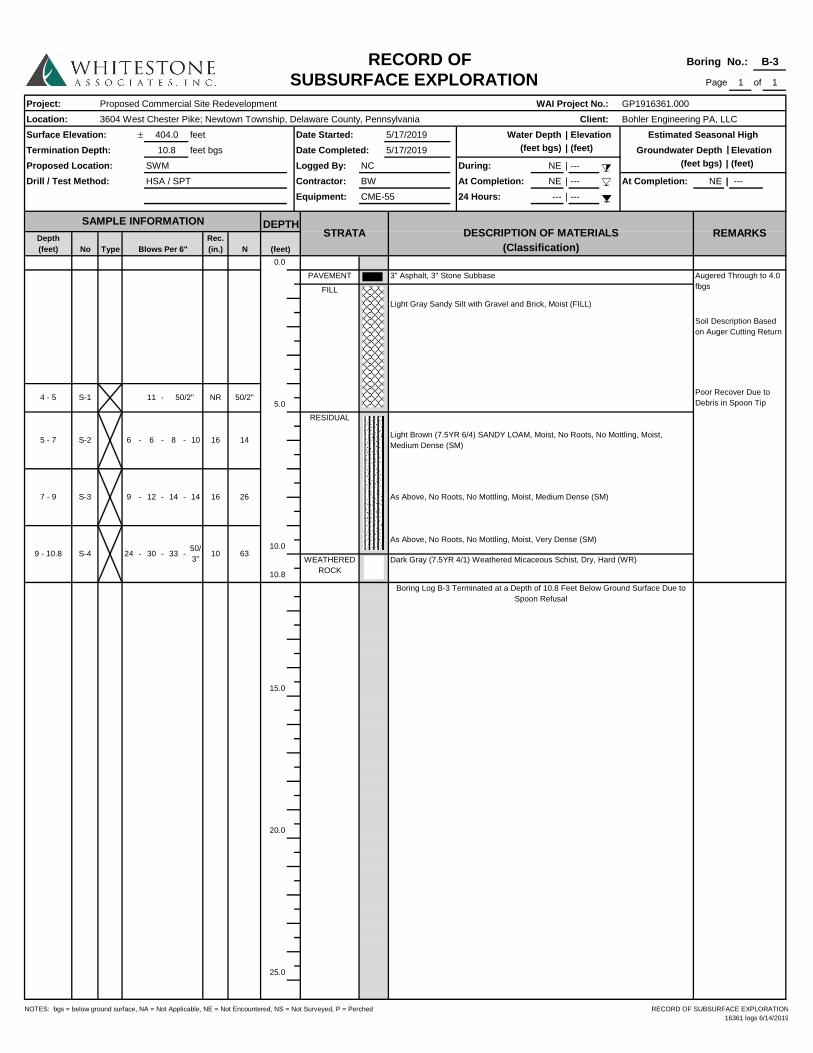
NOTES: bgs = below ground surface, NA = Not Applicable, NE = Not Encountered, NS = Not Surveyed, P = Perched RECORD OF SUBSURFACE EXPLORATION 16361 logs 6/14/2019
1 1
Project:Location:Surface Elevation: ± |Termination Depth: Date Completed: | |Proposed Location: | --- |
At Completion: | --- At Completion: NE || ---
No Type0.0
5.0
10.0
10.8
15.0
20.0
25.0
Proposed Commercial Site Redevelopment WAI Project No.: GP1916361.000
RECORD OF Boring No.: B-3
SUBSURFACE EXPLORATION Page of
3604 West Chester Pike; Newtown Township, Delaware County, Pennsylvania Client: Bohler Engineering PA, LLC
404.0 feet Date Started: 5/17/2019 Water Depth Elevation Estimated Seasonal HighElevation
SWM Logged By: NC During: NE (feet bgs) (feet)10.8 feet bgs 5/17/2019 (feet bgs) (feet) Groundwater Depth
---
Equipment: CME-55 24 Hours: ---
Drill / Test Method: HSA / SPT Contractor: BW NE
Blows Per 6"Rec. (in.) N (feet) (Classification)
SAMPLE INFORMATION DEPTHSTRATA DESCRIPTION OF MATERIALS REMARKSDepth
(feet)
Soil Description Based on Auger Cutting Return
PAVEMENT 3" Asphalt, 3" Stone Subbase Augered Through to 4.0 fbgsFILL
Light Gray Sandy Silt with Gravel and Brick, Moist (FILL)
- 33 -50/3"
30
- 14 - 1412
Light Brown (7.5YR 6/4) SANDY LOAM, Moist, No Roots, No Mottling, Moist, Medium Dense (SM)
4 - 5 S-1 11 50/2" NR 50/2"Poor Recover Due to Debris in Spoon Tip
5 - 7 S-2 6 - 6 - 8 - 10
RESIDUAL
-
16 14
7 - 9
9 - 10.8
S-3
S-4
9
24
-
-
16
10
26
63WEATHERED
ROCK
Boring Log B-3 Terminated at a Depth of 10.8 Feet Below Ground Surface Due to Spoon Refusal
Dark Gray (7.5YR 4/1) Weathered Micaceous Schist, Dry, Hard (WR)
As Above, No Roots, No Mottling, Moist, Very Dense (SM)
As Above, No Roots, No Mottling, Moist, Medium Dense (SM)
APPENDIX B Laboratory Analysis
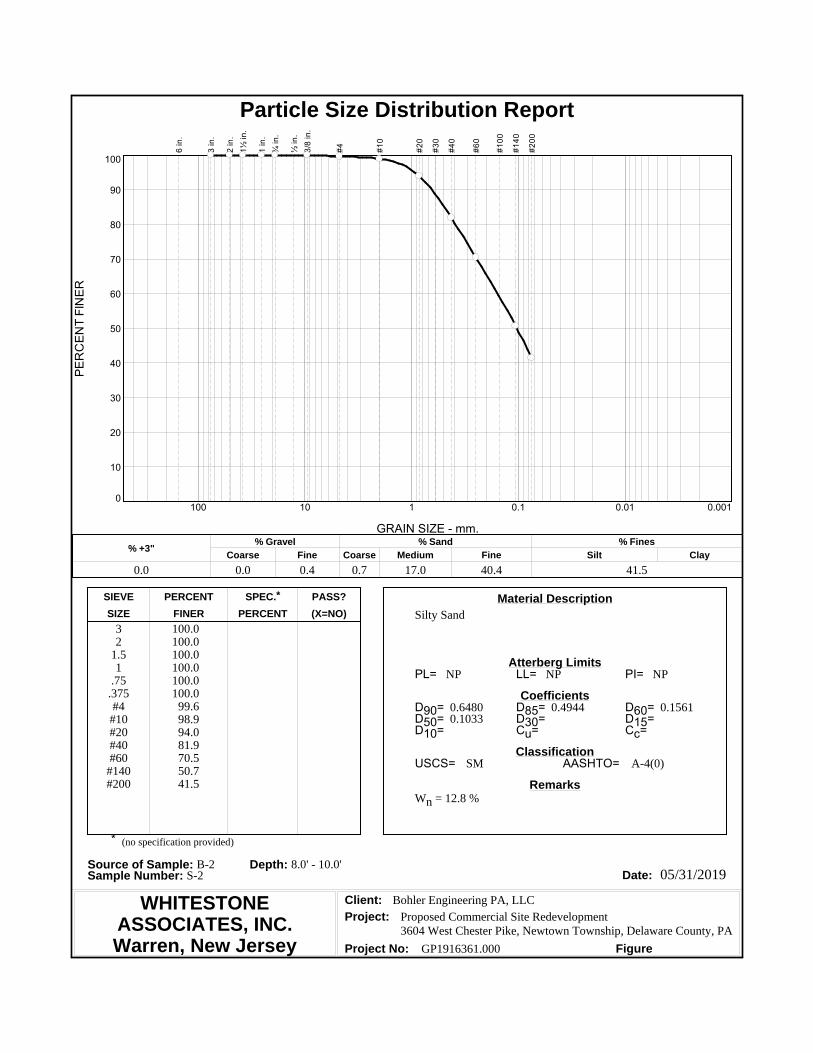
WHITESTONEASSOCIATES, INC.Warren, New Jersey
05/31/2019
(no specification provided)
PL= LL= PI=
D90= D85= D60=D50= D30= D15=D10= Cu= Cc=
USCS= AASHTO=
*
Silty Sand32
1.51
.75.375#4#10#20#40#60
#140#200
100.0100.0100.0100.0100.0100.0
99.698.994.081.970.550.741.5
NP NP NP
0.6480 0.4944 0.15610.1033
SM A-4(0)
Wn = 12.8 %
Bohler Engineering PA, LLC
Proposed Commercial Site Redevelopment3604 West Chester Pike, Newtown Township, Delaware County, PA
GP1916361.000
Material Description
Atterberg Limits
Coefficients
Classification
Remarks
Source of Sample: B-2 Depth: 8.0' - 10.0'Sample Number: S-2 Date:
Client:Project:
Project No: Figure
SIEVE PERCENT SPEC.* PASS?
SIZE FINER PERCENT (X=NO)
PER
CEN
T FI
NER
0
10
20
30
40
50
60
70
80
90
100
GRAIN SIZE - mm.
0.0010.010.1110100
% +3"Coarse
% GravelFine Coarse Medium
% SandFine Silt
% FinesClay
0.0 0.0 0.4 0.7 17.0 40.4 41.5
6 in
.
3 in
.
2 in
.1½
in.
1 in
.¾
in.
½ in
.3/
8 in
.
#4 #10
#20
#30
#40
#60
#100
#140
#200
Particle Size Distribution Report
APPENDIX C Infiltration Testing Results
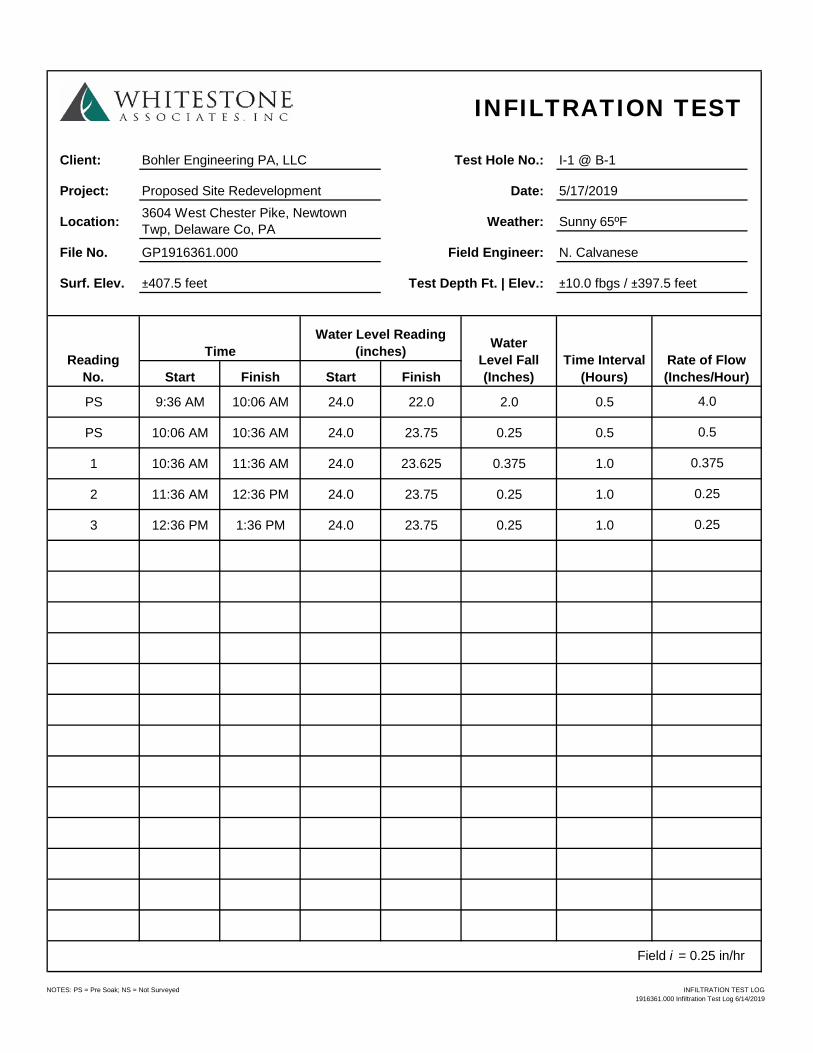
NOTES: PS = Pre Soak; NS = Not Surveyed INFILTRATION TEST LOG1916361.000 Infiltration Test Log 6/14/2019
Client:
Project:
Location:
File No.
Surf. Elev.
Start Finish Start Finish
PS 9:36 AM 10:06 AM 24.0 22.0 2.0 0.5
PS 10:06 AM 10:36 AM 24.0 23.75 0.25 0.5
1 10:36 AM 11:36 AM 24.0 23.625 0.375 1.0
2 11:36 AM 12:36 PM 24.0 23.75 0.25 1.0
3 12:36 PM 1:36 PM 24.0 23.75 0.25 1.0
Field i = 0.25 in/hr
4.0
0.5
0.375
0.25
WaterLevel Fall(Inches)
Time Interval(Hours)
Rate of Flow(Inches/Hour)
I-1 @ B-1
5/17/2019
Sunny 65ºF
N. Calvanese
TimeWater Level Reading
(inches)
Proposed Site Redevelopment
GP1916361.000
±407.5 feet
ReadingNo.
0.25
Test Hole No.:
Date:
INFILTRATION TEST
±10.0 fbgs / ±397.5 feet
3604 West Chester Pike, Newtown Twp, Delaware Co, PA
Bohler Engineering PA, LLC
Weather:
Field Engineer:
Test Depth Ft. | Elev.:
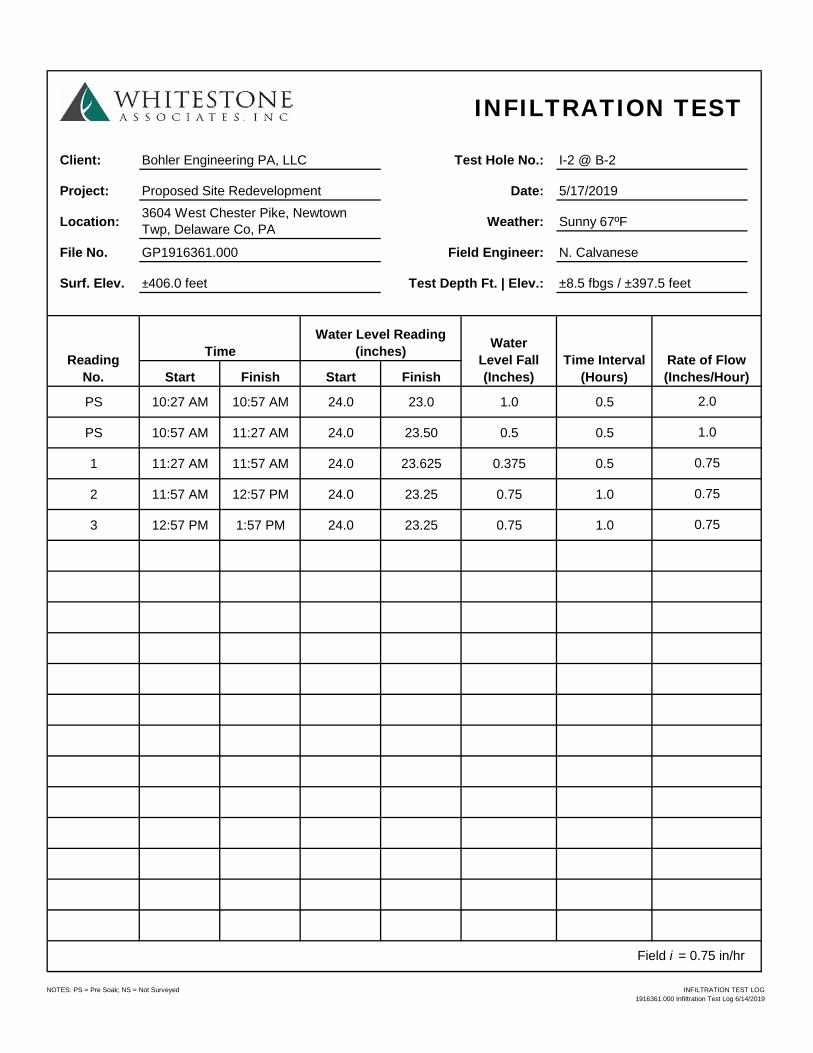
NOTES: PS = Pre Soak; NS = Not Surveyed INFILTRATION TEST LOG1916361.000 Infiltration Test Log 6/14/2019
Client:
Project:
Location:
File No.
Surf. Elev.
Start Finish Start Finish
PS 10:27 AM 10:57 AM 24.0 23.0 1.0 0.5
PS 10:57 AM 11:27 AM 24.0 23.50 0.5 0.5
1 11:27 AM 11:57 AM 24.0 23.625 0.375 0.5
2 11:57 AM 12:57 PM 24.0 23.25 0.75 1.0
3 12:57 PM 1:57 PM 24.0 23.25 0.75 1.0
±8.5 fbgs / ±397.5 feet
INFILTRATION TEST
Bohler Engineering PA, LLC Test Hole No.: I-2 @ B-2
Proposed Site Redevelopment Date: 5/17/2019
Weather: Sunny 67ºF3604 West Chester Pike, Newtown Twp, Delaware Co, PA
Rate of Flow(Inches/Hour)
GP1916361.000 Field Engineer: N. Calvanese
±406.0 feet Test Depth Ft. | Elev.:
ReadingNo.
TimeWater Level Reading
(inches) WaterLevel Fall(Inches)
Time Interval(Hours)
2.0
1.0
0.75
0.75
0.75
Field i = 0.75 in/hr
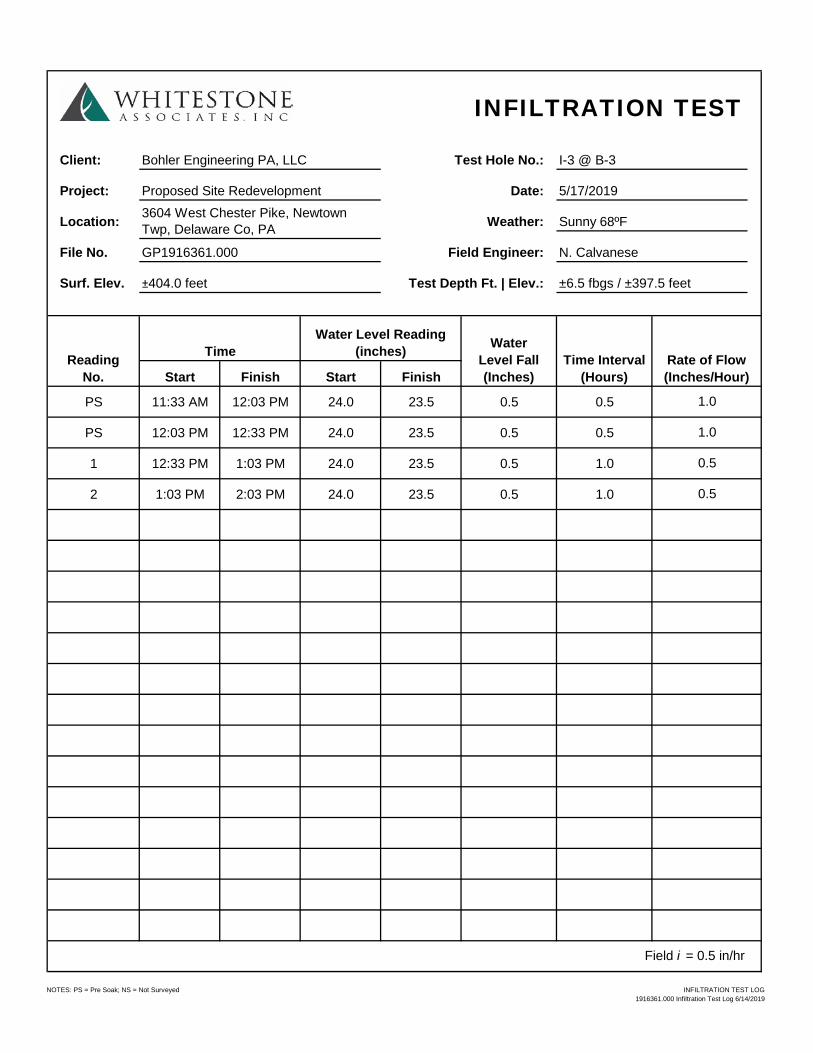
NOTES: PS = Pre Soak; NS = Not Surveyed INFILTRATION TEST LOG1916361.000 Infiltration Test Log 6/14/2019
Client:
Project:
Location:
File No.
Surf. Elev.
Start Finish Start Finish
PS 11:33 AM 12:03 PM 24.0 23.5 0.5 0.5
PS 12:03 PM 12:33 PM 24.0 23.5 0.5 0.5
1 12:33 PM 1:03 PM 24.0 23.5 0.5 1.0
2 1:03 PM 2:03 PM 24.0 23.5 0.5 1.0
±6.5 fbgs / ±397.5 feet
INFILTRATION TEST
Bohler Engineering PA, LLC Test Hole No.: I-3 @ B-3
Proposed Site Redevelopment Date: 5/17/2019
Weather: Sunny 68ºF3604 West Chester Pike, Newtown Twp, Delaware Co, PA
Rate of Flow(Inches/Hour)
GP1916361.000 Field Engineer: N. Calvanese
±404.0 feet Test Depth Ft. | Elev.:
ReadingNo.
TimeWater Level Reading
(inches) WaterLevel Fall(Inches)
Time Interval(Hours)
1.0
1.0
0.5
0.5
Field i = 0.5 in/hr
APPENDIX D Supplemental Information (USCS, Terms and Symbols)
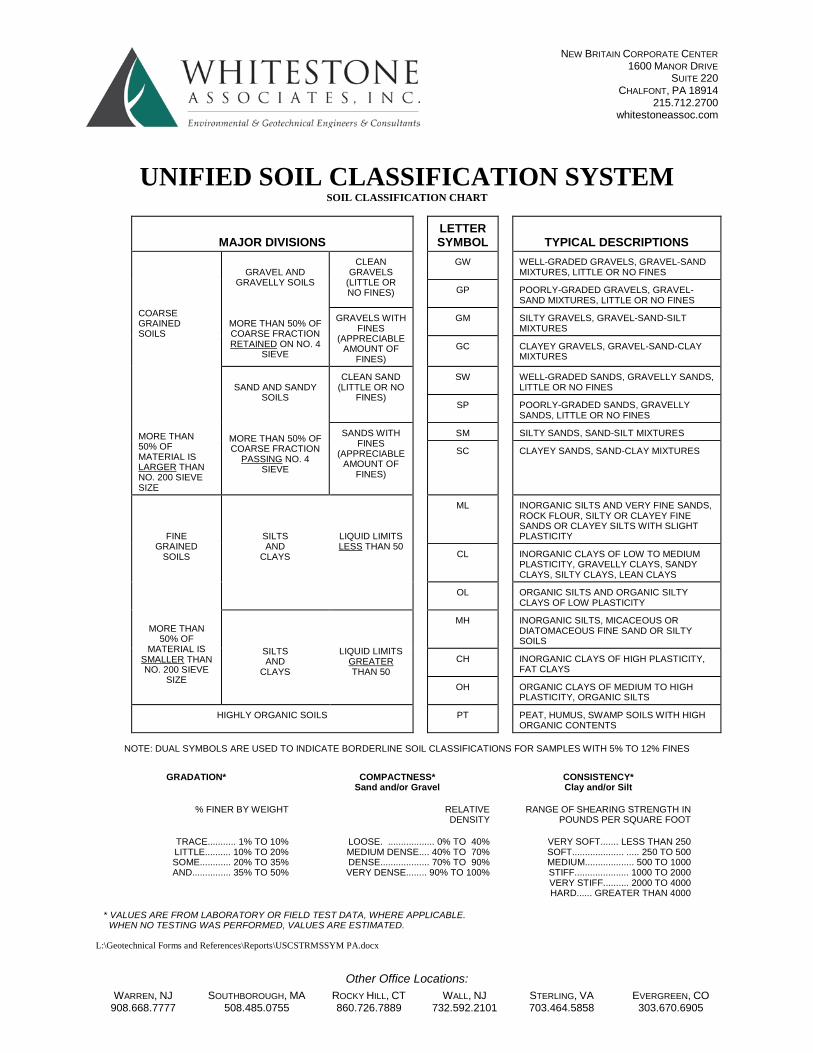
NEW BRITAIN CORPORATE CENTER 1600 MANOR DRIVE
SUITE 220 CHALFONT, PA 18914
215.712.2700 whitestoneassoc.com
Other Office Locations: WARREN, NJ
908.668.7777 SOUTHBOROUGH, MA
508.485.0755 ROCKY HILL, CT 860.726.7889
WALL, NJ 732.592.2101
STERLING, VA 703.464.5858
EVERGREEN, CO 303.670.6905
UNIFIED SOIL CLASSIFICATION SYSTEM SOIL CLASSIFICATION CHART
MAJOR DIVISIONS
LETTER SYMBOL
TYPICAL DESCRIPTIONS
COARSE GRAINED SOILS MORE THAN 50% OF MATERIAL IS LARGER THAN NO. 200 SIEVE SIZE
GRAVEL AND
GRAVELLY SOILS
MORE THAN 50% OF COARSE FRACTION RETAINED ON NO. 4
SIEVE
CLEAN GRAVELS
(LITTLE OR NO FINES)
GW WELL-GRADED GRAVELS, GRAVEL-SAND MIXTURES, LITTLE OR NO FINES
GP POORLY-GRADED GRAVELS, GRAVEL-SAND MIXTURES, LITTLE OR NO FINES
GRAVELS WITH FINES
(APPRECIABLE AMOUNT OF
FINES)
GM SILTY GRAVELS, GRAVEL-SAND-SILT MIXTURES
GC CLAYEY GRAVELS, GRAVEL-SAND-CLAY MIXTURES
SAND AND SANDY
SOILS
MORE THAN 50% OF COARSE FRACTION
PASSING NO. 4 SIEVE
CLEAN SAND (LITTLE OR NO
FINES)
SW WELL-GRADED SANDS, GRAVELLY SANDS, LITTLE OR NO FINES
SP POORLY-GRADED SANDS, GRAVELLY SANDS, LITTLE OR NO FINES
SANDS WITH FINES
(APPRECIABLE AMOUNT OF
FINES)
SM SILTY SANDS, SAND-SILT MIXTURES
SC CLAYEY SANDS, SAND-CLAY MIXTURES
FINE GRAINED
SOILS
MORE THAN 50% OF
MATERIAL IS SMALLER THAN NO. 200 SIEVE
SIZE
SILTS AND
CLAYS
LIQUID LIMITS LESS THAN 50
ML INORGANIC SILTS AND VERY FINE SANDS, ROCK FLOUR, SILTY OR CLAYEY FINE SANDS OR CLAYEY SILTS WITH SLIGHT PLASTICITY
CL INORGANIC CLAYS OF LOW TO MEDIUM PLASTICITY, GRAVELLY CLAYS, SANDY CLAYS, SILTY CLAYS, LEAN CLAYS
OL ORGANIC SILTS AND ORGANIC SILTY CLAYS OF LOW PLASTICITY
SILTS AND
CLAYS
LIQUID LIMITS GREATER THAN 50
MH INORGANIC SILTS, MICACEOUS OR DIATOMACEOUS FINE SAND OR SILTY SOILS
CH INORGANIC CLAYS OF HIGH PLASTICITY, FAT CLAYS
OH ORGANIC CLAYS OF MEDIUM TO HIGH PLASTICITY, ORGANIC SILTS
HIGHLY ORGANIC SOILS PT PEAT, HUMUS, SWAMP SOILS WITH HIGH ORGANIC CONTENTS
NOTE: DUAL SYMBOLS ARE USED TO INDICATE BORDERLINE SOIL CLASSIFICATIONS FOR SAMPLES WITH 5% TO 12% FINES
GRADATION* COMPACTNESS* Sand and/or Gravel
CONSISTENCY* Clay and/or Silt
% FINER BY WEIGHT RELATIVE DENSITY
RANGE OF SHEARING STRENGTH IN POUNDS PER SQUARE FOOT
TRACE........... 1% TO 10% LITTLE.......... 10% TO 20% SOME............ 20% TO 35% AND............... 35% TO 50%
LOOSE. .................. 0% TO 40% MEDIUM DENSE.... 40% TO 70% DENSE................... 70% TO 90% VERY DENSE........ 90% TO 100%
VERY SOFT....... LESS THAN 250 SOFT.................... ..... 250 TO 500 MEDIUM................... 500 TO 1000 STIFF..................... 1000 TO 2000 VERY STIFF.......... 2000 TO 4000 HARD...... GREATER THAN 4000
* VALUES ARE FROM LABORATORY OR FIELD TEST DATA, WHERE APPLICABLE. WHEN NO TESTING WAS PERFORMED, VALUES ARE ESTIMATED.
L:\Geotechnical Forms and References\Reports\USCSTRMSSYM PA.docx
NEW BRITAIN CORPORATE CENTER 1600 MANOR DRIVE
SUITE 220 CHALFONT, PA 18914
215.712.2700 whitestoneassoc.com
Other Office Locations: WARREN, NJ
908.668.7777 SOUTHBOROUGH, MA
508.485.0755 ROCKY HILL, CT 860.726.7889
WALL, NJ 732.592.2101
STERLING, VA 703.464.5858
EVERGREEN, CO 303.670.6905
GEOTECHNICAL TERMS AND SYMBOLS SAMPLE IDENTIFICATION The Unified Soil Classification System is used to identify the soil unless otherwise noted. SOIL PROPERTY SYMBOLS N: Standard Penetration Value: Blows per ft. of a 140 lb. hammer falling 30" on a 2" O.D. split-spoon. Qu: Unconfined compressive strength, TSF. Qp: Penetrometer value, unconfined compressive strength, TSF. Mc: Moisture content, %. LL: Liquid limit, %. PI: Plasticity index, %. δd: Natural dry density, PCF.
▾: Apparent groundwater level at time noted after completion of boring. DRILLING AND SAMPLING SYMBOLS NE: Not Encountered (Groundwater was not encountered). SS: Split-Spoon - 1 ⅜” I.D., 2" O.D., except where noted. ST: Shelby Tube - 3” O.D., except where noted. AU: Auger Sample. OB: Diamond Bit. CB: Carbide Bit WS: Washed Sample. RELATIVE DENSITY AND CONSISTENCY CLASSIFICATION Term (Non-Cohesive Soils) Standard Penetration Resistance Very Loose 0-4 Loose 4-10 Medium Dense 10-30 Dense 30-50 Very Dense Over 50 Term (Cohesive Soils) Qu (TSF) Very Soft 0 - 0.25 Soft 0.25 - 0.50 Firm (Medium) 0.50 - 1.00 Stiff 1.00 - 2.00 Very Stiff 2.00 - 4.00 Hard 4.00+ PARTICLE SIZE Boulders 8 in.+ Coarse Sand 5mm-0.6mm Silt 0.074mm-0.005mm Cobbles 8 in.-3 in. Medium Sand 0.6mm-0.2mm Clay -0.005mm Gravel 3 in.-5mm Fine Sand 0.2mm-0.074mm L:\Geotechnical Forms and References\Reports\USCSTRMSSYM PA.docx
Related Documents