NASA TECHNICAL. MEMORANDU M NASA TM X-2614 CN4 t X C GENERAL METHODOLOGY: COSTING, BUDGETING, AND TECHNIQUES FOR BENEFIT-COST AND COST-EFFECTIVENESS ANALYSIS by D. Michael Stretchberry and Gerald F. Hehi Lewis Research Center Cleveland. Ohio 44B5 NATIONAL AERONAUTICS AND SPACE ADMINISTRATION • WASHINGTON, D. C. • AUGUST 1972 https://ntrs.nasa.gov/search.jsp?R=19720022329 2018-07-27T13:57:41+00:00Z

Welcome message from author
This document is posted to help you gain knowledge. Please leave a comment to let me know what you think about it! Share it to your friends and learn new things together.
Transcript

N A S A TECHNICAL.
MEMORANDU M
NASA TM X-2614
CN4tX
C
GENERAL METHODOLOGY: COSTING,
BUDGETING, AND TECHNIQUESFOR BENEFIT-COST ANDCOST-EFFECTIVENESS ANALYSIS
by D. Michael Stretchberry and Gerald F. Hehi
Lewis Research Center
Cleveland. Ohio 44B5
NATIONAL AERONAUTICS AND SPACE ADMINISTRATION • WASHINGTON, D. C. • AUGUST 1972
https://ntrs.nasa.gov/search.jsp?R=19720022329 2018-07-27T13:57:41+00:00Z

1 Report No
NASA TM X-26142 Government Accession No
4 Title and SubtitleGENERAL METHODOLOGY COSTING, BUDGETING, ANDTECHNIQUES FOR BENEFIT -COST AND COST-EFPECTIVENESS ANALYSIS
7 Author(s)
D Michael Stretchberry and Gerald F Hem
9 Performing Organization Name and Address
Lewis Research CenterNational Aeronautics and SpaceCleveland, Ohio 44135
Administration
12 Sponsoring Agency Name and Address
National Aeronautics and Space AdministrationWashington, D C 20546
3 Recipient's Catalog No
5 Report Date
August 1972
6 Performing Organization Code
8 Performing Organization Report No
E-690610 Work Unit No
682-10
11 Contract or Grant No
13 Type of Report and Period Covered
Technical Memorandum14 Sponsoring Agency Code
15 Supplementary Notes
16 Abstract
In the first part of the report the general concepts of costing, budgeting, and benefit-costratio and cost-effectiveness analysis are discussed The three common methods of costingare presented Budgeting distributions are discussed. The use of discounting proceduresis outlined The benefit-cost ratio-and cost-effectiveness analysis is defined and their cur-rent application to NASA planning is pointed out. The second part discusses specific prac-tices and techniques Actual costing and budgeting procedures are outlined. The recom-mended method of calculating benefit-cost ratios is described A standardized method ofcost-effectiveness analysis is discussed. Long-range planning is discussed
17 Key Words (Suggested by Author(s) )
Cost estimating, Capital budgeting, Benefit-cost analysis, Benefit-cost ratio, Cost-effectiveness analysis, Long-range planning,Engineering economy
19 Security Classif (of this report)
Unclassified
18 Distribution Statement
Unclassified - unlimited
20 Security Classif (of this page) 21 No of Pages
Unclassified 1922 Price*
$3.00
K For sale by (he National Technical Information Service, Springfield, Virginia 22151

GENERAL METHODOLOGY: COSTING, BUDGETING, AND TECHNIQUES
FOR BENEFIT-COST AND COST-EFFECTIVENESS ANALYSIS
by D. Michael Stretchberry and Gerald F. Hein
Lewis Research Center
SUMMARY
Benefit-cost ratio and cost-effectiveness analysis are two powerful planning toolsthat NASA should utilize more. Better utilization of NASA's current funding as well asbetter opportunities to gain increased future funding could result. However, the use ofbenefit-cost analysis depends on whether the benefits can be specified and quantified.Thus, methods of determining the benefits of NASA programs should be developed. Thisreport summarizes the general concepts and specific practices of costing and budgetingwhich are necessary for benefit-cost analyses. Then, benefit-cost ratio and cost-effectiveness analyses are discussed.
Each part of the costing statement is discussed, and methods are given to do the nec-essary costing and budgeting tabulations. The method of calculating the benefit-costratio of a program is given. A standardized approach of doing cost-effectiveness anal-ysis is described. The use of the incremental benefit-cost ratio is illustrated. Somecommon problems of cost-effectiveness analyses are discussed. Long-range planning isdiscussed and an example of simulation is outlined.
INTRODUCTION
This report summarizes the general methodology of costing and budgeting of pro-posed programs. It also summarizes the use of benefit-cost ratios and cost-effectiveness analysis to evaluate programs or alternatives to do a program. The gen-eral concepts that influence costing, budgeting, and benefit-cost analysis are discussedfirst. Long-range planning concepts are also presented. Then specific practices andtechniques are discussed and illustrated for most of the general concepts.
Long-range planning is important for government agencies as well as for businesses.Benefit-cost analysis (which includes both benefit-cost ratio and cost-effectiveness

analysis) is a powerful planning tool. NASA's budget has been decreasing steadily forseveral years. At its peak, the goals of NASA were well defined and funds were easilyavailable. Now, however, opinions on what NASA should do in the future differ consider-ably. Any program that is chosen must be done as economically as possible. Benefit-cost analysis can be used to select the best program and then can be used to choose themost economical alternative to do the program. However, the use of benefit-cost anal-ysis depends on whether the benefits can be specified and quantified. This is difficult.General comments are made about this planning tool and the problems which arise whentrying to use the tool.
General concepts will be discussed first. The three methods of costing - the engi-neering method, the cost estimating relationship, and the proportional method - will bedefined. The various budget distributions characteristic of the different types of costswill be described. The potential importance of benefit-cost ratios and cost-effectivenessanalysis for long-range planning is discussed. Capital recovery costs and present worthof costs and benefits are needed for benefit-cost analysis. These in turn require the useof a discount rate. Some general comments on long-range planning are also included.
Specific procedures and techniques are then described. The costing statement con-sists of tables of investment, annual operations, capital recovery, and the budget distri-bution, and also text to discuss each. Each part is discussed and methods are given todo any necessary tabulations. The method of calculating the benefit-cost ratio of a pro-gram is given. The internal rate of return is also used to rank different programs. Astandardized approach of doing cost-effectiveness analyses is described. The use of theincremental benefit-cost ratio is illustrated. Some examples of effectiveness criteriaare given. A few common problems of cost-effectiveness analyses are also discussed.A simulation example is given.
GENERAL CONCEPTS
The first section of this report discusses the general concepts and principles that in-fluence costing, budgeting, and benefit-cost analysis of a proposed program. These con-cepts are principles that have originated from economic theory, accounting, managementfinance, operations research, and others.
Costing and Budgeting
Costing methods (refs. 1 and 2). - The three techniques used for program costingare the following:
(1) Engineering method (detailed cost estimate) - Each part of the program is costedindividually and all costs are added to obtain total program cost.

(2) Proportional method - The known costs of a program are used as the basis of thecost estimate for the future program. The known costs are scaled up or down to the re-quired size for the future program.
(3) Cost Estimating Relationship (CER) - A mathematical relation is determined be-tween historical program costs and various characteristics of previous programs. Thisrelation is used to predict future program costs on the basis of known design parameters.
All three methods are normally used in varying degrees for determining cost esti-mates. Estimates made with the engineering method tend to be lower than the truecost. It should be noted that the proportional method of estimation is an extrapolationfrom a single-point cost estimating relationship. Thus the proportional method of esti-mation is not valid mathematically. The use of a CER is generally the most satisfactory,but it also has limitations. First the relationships is valid only within the limits of thedata used to establish the CER. Moreover, any extrapolation beyond the bounds of theoriginal data of a CER has decreased accuracy as the distance from the bounds in-creases. Cost estimates should be made using other methods if the bounds of the CERare exceeded significantly. If other methods are not available, the one obtained byextrapolation from a CER may be used judiciously since cost functions seldom have ex-treme discontinuities. However, the associated statistics such as confidence intervalsare meaningless. If such an extrapolation from a CER is used, it should be specified assuch, and the bounds of the cost estimate should be approximated as best as possible.
Budgeting. - The costs to start and sustain a program are of three types (ref. 2):research and development (R&D), investment, and annual operations. These costs havedifferent funding distributions over time. The R&D cost distribution usually resemblesa normal curve (refs. 1 and 2). If the program incorporates technical advances or mod-ifications in the future, then the R&D investment distribution will be repeated. The dis-tribution for investment of manufactured hardware can also be approximately normal ifhardware production is in small lots. Large volumes of hardware production require anapproximately linear rise to a constant level (ref. 3). Hardware investment will be peri-odically repeated due to the limited lifetime of any piece of hardware. Annual operationscosts will start soon after hardware investment is started and will usually rise to theirmaximum and approximately constant level at about the time that initial hardware invest-ment is completed. The annual operations will not change from year to year unless theprogram is changed.
The actual amount spent each year is the total of the three types of costs that areactually spent each year. Thus the budget for any year in the future is simply the sum ofthe three costs for that year. All the dollar figures should be initially expressed in cur-rent dollars for all costing and budgeting. However, once the budgeted amounts areknown for the current year and all years in the future, then the effects of inflation can be

Benefit-Cost Analysis
Benefit-cost ratio (ref. 4). - Both private and public decision makers must choosebetween different types of programs which are competing for limited resources. Thebenefit-cost ratios of programs are used to rank the programs to decide which will bedone first. The benefit-cost ratio is the sum of all the benefits over the life of the pro-gram divided by the sum of all the costs. Both benefits and costs of all years are ex-pressed in present value. The program with highest ratio should be chosen first becauseit has the greatest benefit per unit cost. However, no program should be done if .theratio is less than one. In addition to consideration of the benefit-cost ratio, additionalinformation such as the magnitudes of the costs and benefits should be examined.
Cost-effectiveness analysis. - When considering alternatives for the same program,a cost-effectiveness analysis is done. This analysis examines the alternatives and com-pares both costs and benefits (effectiveness) to choose the "best" alternative. However,a direct comparison of benefit-cost ratios of the alternatives is incorrect. Incrementalbenefit-cost ratios must be calculated and used for comparing the alternatives (refs. 1,5, and 6). Incremental costs or benefits are the increases in costs or benefits from onealternative to the next and not the total costs or benefits of an alternative. The more ob-vious cost-effectiveness analyses are those where either the costs for all the alternativesare the same and the effectiveness or benefits are different or where the benefits are thesame but the costs differ. Note that effectiveness criteria do not have to be dollar (eco-nomic) benefits necessarily. They can be performance criteria.
A program is justified by use of the benefit-cost ratio. In this case there must bereason to believe that the benefits (usually dollars) are greater than the costs (usuallydollars). For example, a weather satellite program is chosen because the benefit-costratio is greater than one (and greater than the ratios of other potential programs). Thena cost-effectiveness analysis is done to choose the best way of doing the program. Cri-teria now would normally be performance related. Terms that are often used to implythe concept of effectiveness are utility, productivity, worth, merit, and benefit (ref. 7).The term benefit is favored by the Office of Management and Budget while the term worthis generally favored by engineers.
The value of benefit-cost analysis to NASA. - Benefit-cost ratios and cost-effectiveness analysis are two important tools that should be used more by NASA. Theuse of these tools will help NASA to make decisions in order to best utilize its budget.The benefit-cost ratios can also be used to demonstrate the worth of NASA programs.But none of this can be done unless the benefits are specified and quantified. The costsof programs can usually be estimated but the benefits are difficult to identify. Standardmethods are required to identify the benefits resulting from NASA programs. Workshould be done to develop these standard methods. Both direct and indirect benefits must

be specified as well as short-term and long-term benefits. The benefits must then beconverted to quantitative values if at all possible. With increased competition for scarcefunds, the areas of benefit analysis and program selection are emerging as two ex-tremely important planning tools.
Units of measure of costs and benefits. - The costs and benefits of a program maybe expressed in several different units. (See ref. 7 for a listing.) Costs are nearly al-ways expressed in dollars except in the case of human life (although values have been es-timated for the economic worth of an average lifetime). Benefits may be expressed indollars, dollar analogues, human lives, time saved, and in terms of goods or servicesreceived. Other units of cost and/or benefit may be used but the units tend to be some-what intangible and extremely difficult to measure. For example, national morale maysuffer (negative benefit) or improve (positive benefit) as a result of a program, or ournational image abroad may be affected (cost or benefit). Besides being difficult to meas-ure, the value of the morale unit is quite subjective and the measure itself may be short-lived. When feasible, program costs and benefits should be expressed in dollars. Whendissimilar units arise in a benefit-cost analysis and there is no acceptable method oftransformation to similar units, the information should be given without comparison.
The cost and benefits to be included (ref. 8). - The terms "cost" and "benefit" areused loosely by some in discussing benefit-cost analysis. Only some "costs" and"benefits" should be included in the benefit-cost analysis. Of course, those direct costsof the program and the direct benefits resulting from the program should be included.These costs and benefits accrue to the agency that proposes the program. Some costsand benefits accrue to persons other than the agency that proposes the program. Theseare called externalities (or spillovers) and must also be included. For example, a Fed-eral program may be estimated to cost a certain amount and this amount is provided forin the Federal budget. But if private spending is also required to implement the program,then this must be considered a cost. The private spending is a cost regardless if it isvoluntary or mandatory.
Secondary costs or benefits should not be included. For example consider a cropmonitoring satellite. The benefit is the increased crop produced because of the bettermonitoring and planning possible due to the satellite. The costs are the satellite costplus the cost of the extra inputs to grow the crop. However, no other costs or benefitsare imputed for the processes done to the extra crop before it reaches the consumer.These are secondary costs and benefits and are a component of the benefit calculatedbefore.
Other ways of comparing programs. - There are two other widely used ways of com-paring programs (ref. 5). Both are related to the benefit-cost ratio tool. The first iscalled the equivalent annual cost and the other is the rate of return (also known as the in-ternal rate of return). The equivalent annual cost is simply the sum of the annual opera-tions cost and the annual share of the investment cost. The rate of return is an interest

rate that indicates the investment yield of the program. All three tools give identical re-sults. It is a matter of convenience or tradition whichever is used. All three utilize theconcept of the discount rate which will now be discussed.
Discount rates (refs. 5 and 4). - Money has a time value which, for example, makes$1.00 received today worth more than $1.00 received next year. This is so because the$1.00 received today could be invested to yield more than $1. 00 by next year. The timevalue of money has implications for benefit-cost analysis.
The equivalent annual cost of a program (which is more precisely known as theequivalent uniform annual cost (ref. 5)) must include a capital recovery cost. The cap-ital recovery cost accounts for several factors. First, it accounts for a specific year'suse of the total investment cost. Investment costs are not explicitly a part of the equiv-alent annual cost of a program. The capital recovery cost also takes into account the un-certainty of a program. The uncertainty can be due to the difficulty of forecasting costsand benefits accurately or the threat of obsolescence. Finally, for private industry, aprofit margin must be included. When the discount rate (an interest rate) and the life-time of the investment have been determined, the capital recovery cost can then be cal-culated. The discount rate is at least as large as the interest rate on money borrowed tofinance the program. This rate is adjusted upward to reflect the uncertainty of the pro-gram and the profit margin required by private industry. Currently the Office of Manage-ment and Budget recommends that all federal government programs use a discount rateof 10 percent and then check for sensitivity between about 8 to 12 percent. For privateindustry the discount rate should be about 15 percent for low risk programs and as muchas 20 percent for high risk programs.
Another use of the discount rate is the calculation of the present worth of all futurecosts and benefits. This is required for calculating benefit-cost ratios and for perform-ing cost-effectiveness analyses. In this manner, meaningful comparisons can be madefor various program alternatives.
Long-Range Planning
Long-range planning is concerned with a period of more than one year. Normallythis type of planning is done for a five-year period. Short-range planning is concernedprimarily with periods of less than one year and with budgeting and accounting activities.The activities of long-range planning according to one author are (ref. 9)-
(1) Forecasting(2) Budgeting and accounting(3) Setting goals and designing action programsForecasting. - The purpose of the forecast is to provide an estimation or description
of the future so that alternatives to various contingencies may be developed. The .

techniques used in forecasting and the required statistics have been greatly improved inrecent years, and information required to make realistic forecasts is no longer so ex-pensive as to render the costs prohibitive. Despite advances, however, the quality oflong-range forecasting falls short of what is possible because many forecasts are simplyextrapolations of trend. In other words, the future is assumed to be a continuation of thepresent. Thus the value of forecasting is reduced because the range of contingenciesconsidered is extremely narrow.
Budgeting and accounting. - The primary function of budgeting is the translation ofplans into financial terms. Quite often budgeting is equated to planning; hence, manycontrollers and budgetary directors are given the responsibility for planning which mayaccount for some of the lack of emphasis on forecasting activities. For short-rangeplanning which is primarily the allocation of resources within existing policy, this situa-tion is not critical. However, for long-term policy determination that may be designedto alter the course of the organization, planning requirements usually exceed the limitsof budgeting and accounting. In addition to resource allocation, the budgeting and account-ing functions include the exposition of less obvious implications of financial plans and theconsultation to management required to achieve financial goals in the administration ofprograms.
Setting goals and designing action programs. - The requirements for this, the mostimportant function, are-
(1) To analyze projections of the future in order to realistically set desired goals(2) To analyze specific obstacles preventing the fulfillment of goals(3) To design a program of action, not subjective affirmations, designed to overcome
the obstaclesThe fulfillment of these three requirements ensures the avoidance of crisis manage-
ment or decisions designed to "fill the gaps. " The performance of these functions alsoallows the luxury of avoiding subjective estimates since the genuine and specific problemshave been well-defined. If the gaps are not identified, it is impossible to clarify theproblems and needs, and so programs will not be meaningfully designed.
SPECIFIC PRACTICES
Applications of general concepts presented thus far will now be discussed. Specificprocedures and techniques will be given and examples will be used for illustration whenpossible.

Program Costing
The program costing statement should be utilized, which should include cost tablesand explanatory text. There should be tables of R&D investment, hardware investment,annual operations, capital recovery, and the budget distribution. The explanatory textshould describe and explain the tables. Topics should include "Costing Limitations andProblems, " "Investment," "Annual Operations, " and "Budget. "
The investment table should have separate listings for R&D and hardware invest-ment, and have a grand total. Investment items are land, buildings, equipment, and one-time services. An amount for "Development and Systems Engineering" equal to 10 per-cent (nominal) of investment should be allowed for those parts of the hardware investmentfor which R&D costs have not explicitly been determined.
The annual operations table accounts for items such as maintenance, staffing, andutilities. Maintenance each year may be assumed to be 10 percent of the hardware in-vestment. Staffing costs may be estimated by doubling salaries for professionals and us-ing a factor of 1. 5 for nonprofessionals to account for overhead, vacations, and benefits.For cases where continuous operation is required, five shifts per week will allow for un-avoidable absences.
A table of annual capital recovery costs is also important. A capital recovery costmust be calculated for every investment item. To calculate capital recovery, both thediscount rate and the estimated life of the item must be known. Interest tables (ref. 5)tabulate the "capital recovery factors" necessary to calculate the capital recovery cost.For example, assume a piece of electronic gear is estimated to have a 10-year life andthat the discount rate is 5 percent. From the interest tables the capital recovery factorfor 10 years at 5 percent is 0.12950. The capital recovery cost is the investment cost ofthe piece of electronic gear times 0.12950. Thus more than one-tenth of the investmentcost must be assigned to each year even though the life of the gear is 10 years. This isdue to the time value of money. A capital recovery cost is also calculated for "Develop-ment and Systems Engineering. "
Sensitivity calculations for the discount rate should be tabulated in the capital recov-ery table. These calculations involve refiguring the capital recovery costs at the min-imum and maximum discount rates. For example, for government programs the dis-count rate recommended by OMB is 10 percent. The capital recovery costs are calcu-lated using 10 percent and these cost figures are then used as needed in the benefit-costratio and cost-effectiveness analyses. Capital recovery costs should then also be calcu-lated using a discount rate of 8 and 12 percent. The purpose of doing this is to determineif the equivalent annual cost or the cost-effectiveness analysis changes significantly witha change in the discount rate.
8
Budgeting
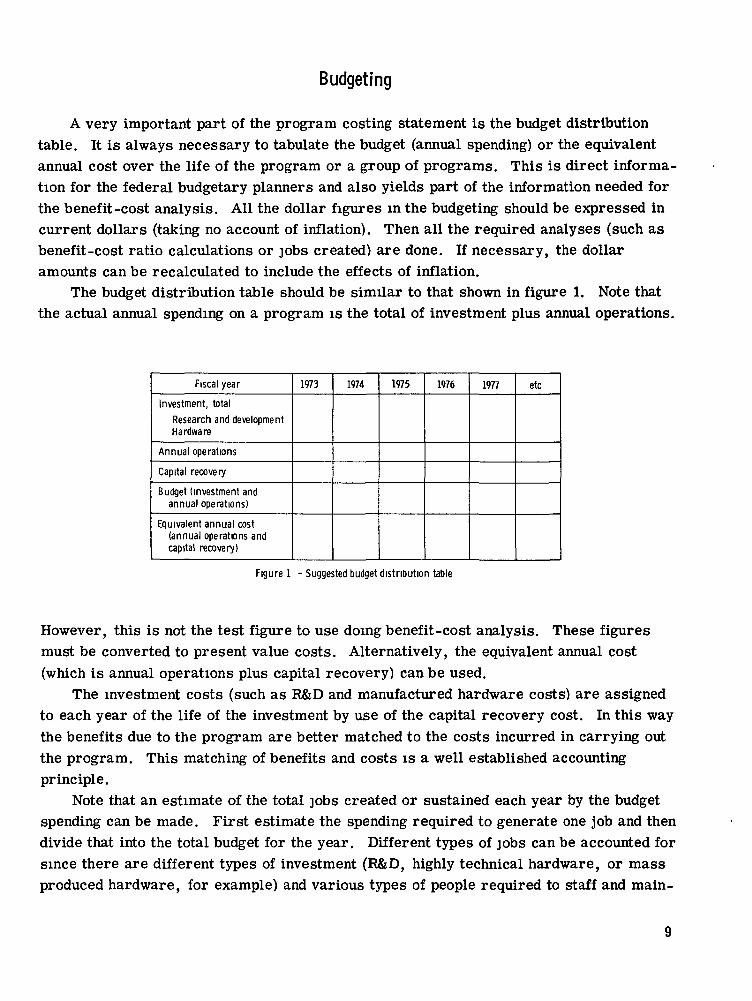
A very important part of the program costing statement is the budget distributiontable. It is always necessary to tabulate the budget (annual spending) or the equivalentannual cost over the life of the program or a group of programs. This is direct informa-tion for the federal budgetary planners and also yields part of the information needed forthe benefit-cost analysis. All the dollar figures in the budgeting should be expressed incurrent dollars (taking no account of inflation). Then all the required analyses (such asbenefit-cost ratio calculations or jobs created) are done. If necessary, the dollaramounts can be recalculated to include the effects of inflation.
The budget distribution table should be similar to that shown in figure 1. Note thatthe actual annual spending on a program is the total of investment plus annual operations.
Fiscal year
Investment, totalResearch and developmentHardware
Annual ope rat ions
Capital recovery
Budget (investment andannual operations)
Equivalent annual cost(annual operations andcapital recovery)
1973 1974 1975 1976 1977 etc
Figure 1 - Suggested budget distribution table
However, this is not the test figure to use doing benefit-cost analysis. These figuresmust be converted to present value costs. Alternatively, the equivalent annual cost(which is annual operations plus capital recovery) can be used.
The investment costs (such as R&D and manufactured hardware costs) are assignedto each year of the life of the investment by use of the capital recovery cost. In this waythe benefits due to the program are better matched to the costs incurred in carrying outthe program. This matching of benefits and costs is a well established accountingprinciple.
Note that an estimate of the total jobs created or sustained each year by the budgetspending can be made. First estimate the spending required to generate one job and thendivide that into the total budget for the year. Different types of jobs can be accounted forsince there are different types of investment (R&D, highly technical hardware, or massproduced hardware, for example) and various types of people required to staff and main-
9

tain the program. But note that only if there is a net addition to spending, total privateand public, will jobs be created. Also, spending must be maintained each year to sus-tain the jobs.
Examples of the funding distributions to be used for all the items in the aforemen-tioned budgeting table are shown in figure 2. The relative position of each distributionmay be changed to fit a particular program. In the figure, 0 percent is the start of fund-ing for the program. The full operations point is 100 percent. The R&D investment isassumed in this example to extend from 0 to 80 percent and is shaped normally. Thehardware investment is assumed to be distributed normally also if only a few units are to
Fulloperationspoint
R&Dinvestment
Hardwareinvestment
Annual'operations
Capitalrecovery
0 20 40 60 80 100Percent of initial investment period, yr
Figure 2 - Possible funding distributions for various typesof costs
be purchased. (For example, a program using only two or three satellites would have itshardware investment distributed normally (ref. 10). If a program will use many units,the distribution will be trapezoidal shaped as will be discussed below). Annual operationsare assumed to start at 40 percent and rise linearly to its full cost at 100 percent. Cap-ital recovery costs are assumed to start the same time as hardware investment and riseto its full cost at 100 percent. The capital recovery distribution will be directly propor-tional to the cumulative hardware investment.
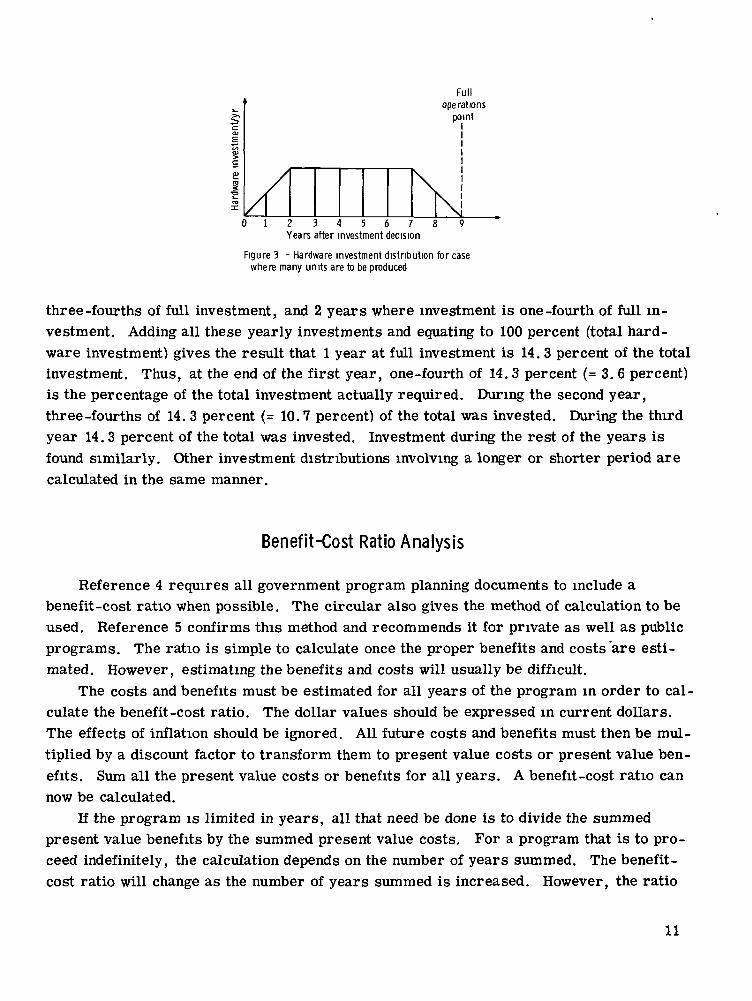
The trapezoidal shaped hardware investment distribution cited previously for themulti-unit case is shown in figure 3. It increases approximately linearly in 1 or 2 yearsto a maximum constant value. This level of investment is funded until 1 or 2 years beforethe end of the investment period. For the last 1 or 2 years investment decreases linearlyto zero. The figure shows how the percentage of total investment for each year can becalculated. As an example, assume a hardware investment for 9 years with the invest-ment linearly increasing for 2 years at the beginning and linearly decreasing for 2 yearsat the end of the investment period. This 9-year trapezoidal hardware investment distri-bution extends from the 20-percent point in figure 2 to the 100-percent point (full opera-tions point). Note that there are 5 full investment years, 2 years where investment is
10
Fulloperations
point
0 1 2 3 4 5 6 7 8 9Years after investment decision
Figure 3 - Hardware investment distribution for casewhere many units are to be produced
three-fourths of full investment, and 2 years where investment is one-fourth of full in-vestment. Adding all these yearly investments and equating to 100 percent (total hard-ware investment) gives the result that 1 year at full investment is 14. 3 percent of the totalinvestment. Thus, at the end of the first year, one-fourth of 14. 3 percent (= 3. 6 percent)is the percentage of the total investment actually required. During the second year,three-fourths of 14. 3 percent (= 10.7 percent) of the total was invested. During the thirdyear 14.3 percent of the total was invested. Investment during the rest of the years isfound similarly. Other investment distributions involving a longer or shorter period arecalculated in the same manner.
Benefit-Cost Ratio Analysis
Reference 4 requires all government program planning documents to include abenefit-cost ratio when possible. The circular also gives the method of calculation to beused. Reference 5 confirms this method and recommends it for private as well as publicprograms. The ratio is simple to calculate once the proper benefits and costs are esti-mated. However, estimating the benefits and costs will usually be difficult.
The costs and benefits must be estimated for all years of the program in order to cal-culate the benefit-cost ratio. The dollar values should be expressed in current dollars.The effects of inflation should be ignored. All future costs and benefits must then be mul-tiplied by a discount factor to transform them to present value costs or present value ben-efits. Sum all the present value costs or benefits for all years. A benefit-cost ratio cannow be calculated.
If the program is limited in years, all that need be done is to divide the summedpresent value benefits by the summed present value costs. For a program that is to pro-ceed indefinitely, the calculation depends on the number of years summed. The benefit-cost ratio will change as the number of years summed is increased. However, the ratio
11
will approach a constant value assuming the estimated benefits are constant due to a pro-gram of constant equivalent annual costs.
Often the internal rate of return is used instead of the benefit-cost ratio to rank pro-grams. The internal rate of return is that discount rate which equates the summed pres-ent value costs and the summed present value benefits. While it can be calculated by it-erative methods, tables are normally used.
Sensitivity analysis of the discount rate should be done at this stage to determine howthe benefit-cost ratio changes with changes in the discount rate.
Cost-Effectiveness Analysis
A standardized approach. - Chapter 7 of reference 7 gives a standardized approach tocost-effectiveness evaluations. The author states that there has been a lack of uniformityof evaluations. Therefore, he has tried to extract common elements from numerous eval-uations and then standardize the basic cost-effectiveness analysis. The approach liststen specific steps. However, the ten steps fit into four general areas: (1) the goals andrequirements of the program are specified and defined, (2) alternates for doing the pro-gram are conceived, (3) evaluation criteria are established, and (4) the analysis is per-formed. In area (4), a fixed-cost or fixed-effectiveness approach is recommended. How-ever, this is not strictly required. Incremental benefit-cost ratios can be used in thegeneral case where the alternatives are not either fixed cost or fixed effectiveness.
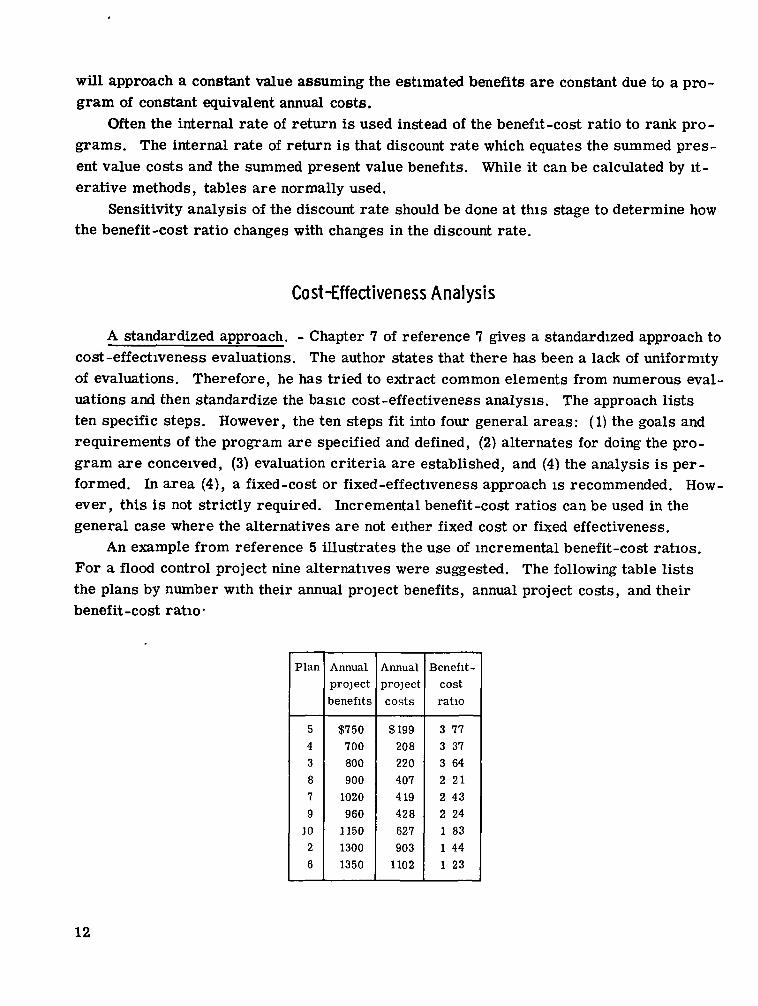
An example from reference 5 illustrates the use of incremental benefit-cost ratios.For a flood control project nine alternatives were suggested. The following table liststhe plans by number with their annual project benefits, annual project costs, and theirbenefit-cost ratio-
Plan
543879
1026
Annualprojectbenefits
$750700800900
1020960
115013001350
Annualprojectcosts
$199208220407419428627903
1102
Benefit-costratio
3 773 373 642 212 432 241 831 441 23
12
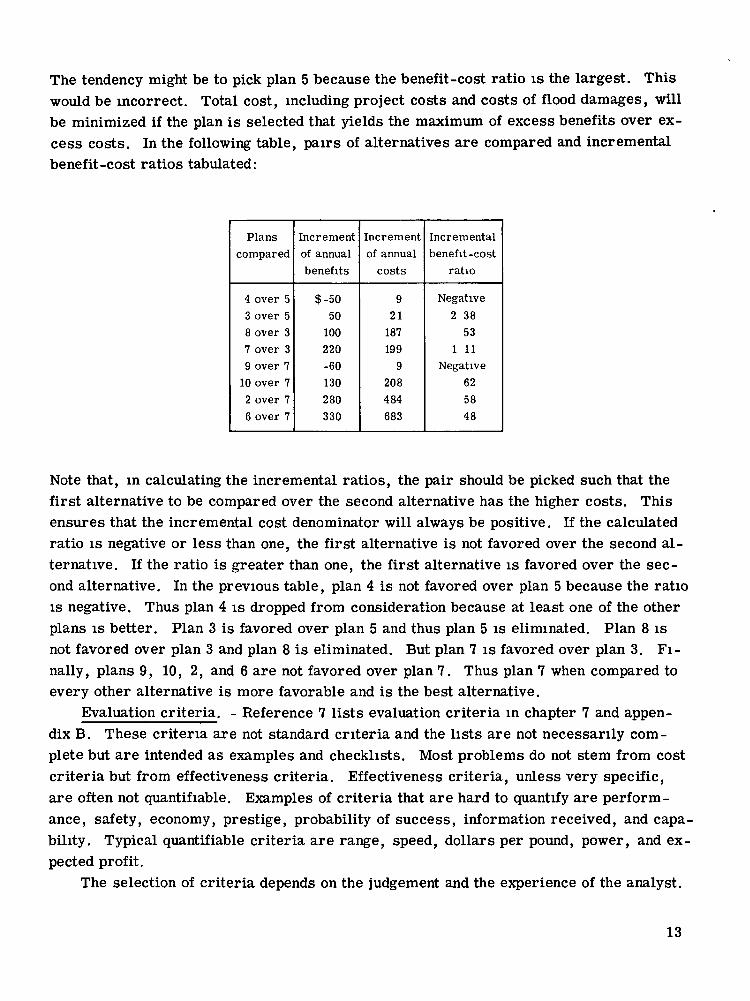
The tendency might be to pick plan 5 because the benefit-cost ratio is the largest. Thiswould be incorrect. Total cost, including project costs and costs of flood damages, willbe minimized if the plan is selected that yields the maximum of excess benefits over ex-cess costs. In the following table, pairs of alternatives are compared and incrementalbenefit-cost ratios tabulated:
Planscompared
4 over 53 over 58 over 37 over 39 over 7
10 over 72 over 76 over 7
Incrementof annualbenefits
$-5050
100220-60130280330
Incrementof annual
costs
921
187199
9208484683
Incrementalbenefit -cost
ratio
Negative2 38
531 11
Negative625848
Note that, in calculating the incremental ratios, the pair should be picked such that thefirst alternative to be compared over the second alternative has the higher costs. Thisensures that the incremental cost denominator will always be positive. If the calculatedratio is negative or less than one, the first alternative is not favored over the second al-ternative. If the ratio is greater than one, the first alternative is favored over the sec-ond alternative. In the previous table, plan 4 is not favored over plan 5 because the ratiois negative. Thus plan 4 is dropped from consideration because at least one of the otherplans is better. Plan 3 is favored over plan 5 and thus plan 5 is eliminated. Plan 8 isnot favored over plan 3 and plan 8 is eliminated. But plan 7 is favored over plan 3. Fi-nally, plans 9, 10, 2, and 6 are not favored over plan 7. Thus plan 7 when compared toevery other alternative is more favorable and is the best alternative.
Evaluation criteria. - Reference 7 lists evaluation criteria in chapter 7 and appen-dix B. These criteria are not standard criteria and the lists are not necessarily com-plete but are intended as examples and checklists. Most problems do not stem from costcriteria but from effectiveness criteria. Effectiveness criteria, unless very specific,are often not quantifiable. Examples of criteria that are hard to quantify are perform-ance, safety, economy, prestige, probability of success, information received, and capa-bility. Typical quantifiable criteria are range, speed, dollars per pound, power, and ex-pected profit.
The selection of criteria depends on the judgement and the experience of the analyst.
13

Too few criteria or the wrong criteria can be selected and the analysis will not be valid.Too many criteria (10 or more according to ref. 7) will tend to paralyze the decisionprocess.
Common problems to avoid. - The following are some points to consider which willhelp to avoid common problems of cost-effectiveness evaluations:
(1) Benefit-cost ratio: The actual magnitude of the numerator and denominator of theratio and the risk associated with each alternative should not be ignored.
(2) Quantification: It is sometimes impossible to quantify all cost-effectiveness cri-teria which are pertinent to the evaluation or decision.
(3) Interrelations- Some cost-effectiveness criteria may not be transformed by arelation to a common criterion such as dollars cost or dollars effectiveness.
(4) Use of a single cost-effectiveness criterion: One single criterion can seldom beused as the sole basis of an evaluation.
(5) Weighting: There is no generally acceptable method of developing weights tojudge the relative importance of various criteria.
(6) Assumption-of-probabilities- Probabilities are often not known but rather are as-sumed and may lead to erroneous conclusions. Hence, one must use prudence and com-mon sense in evaluating these probability estimates and the conclusions which result.
(7) Use of a fixed amortization period: The use of unrealistic life-times for systemsmay produce misleading results because of the sensitivity of annual and total costs andbenefits to system life.
(8) Neglect of spillover effects- There will be horizontal and vertical externalities(spillovers) both good and bad that may need to be considered.
Two Projections
Since planning is concerned primarily with the formulation of alternatives, it is nec-essary for management to perceive changes. There must be an understanding of thefollowing:
(1) Trends and shifts affecting the economy(2) Technical developments(3) Competition(4) Consumer demands(5) Changing nature of organizational operations
It is impossible to adequately treat all the techniques associated with the perception ofchange but examples will be given to demonstrate the necessity of recognizing change andthe performance of the forecasting function. This information is from an unpublished1965 monograph by Joseph DiMario entitled "Effective Strategic Planning. "
14
Subjectivity in forecasting, goal setting, and the design of programs must be avoided.An example of what to avoid is now provided which deals with the 1964-1965 World's Fair.Attendance at the fair totaled 27 million people in 1964. Attendance in 1965 was projectedto be 39. 5 million or an increase of 39 percent. This projection was unrealistic for tworeasons-
(1) Attendance in the second year of a fair historically drops at least 30 percent be-low that of the first year.
(2) The admission price was raised 25 percent in 1965.Attendance during the first 2 months of 1965 ran 50 000 people per day below the 1964
level. The projection of 39. 5 million people for 1965 may have been realistic if someplan had been initiated to ensure the meeting of the goal, but such was not the case.
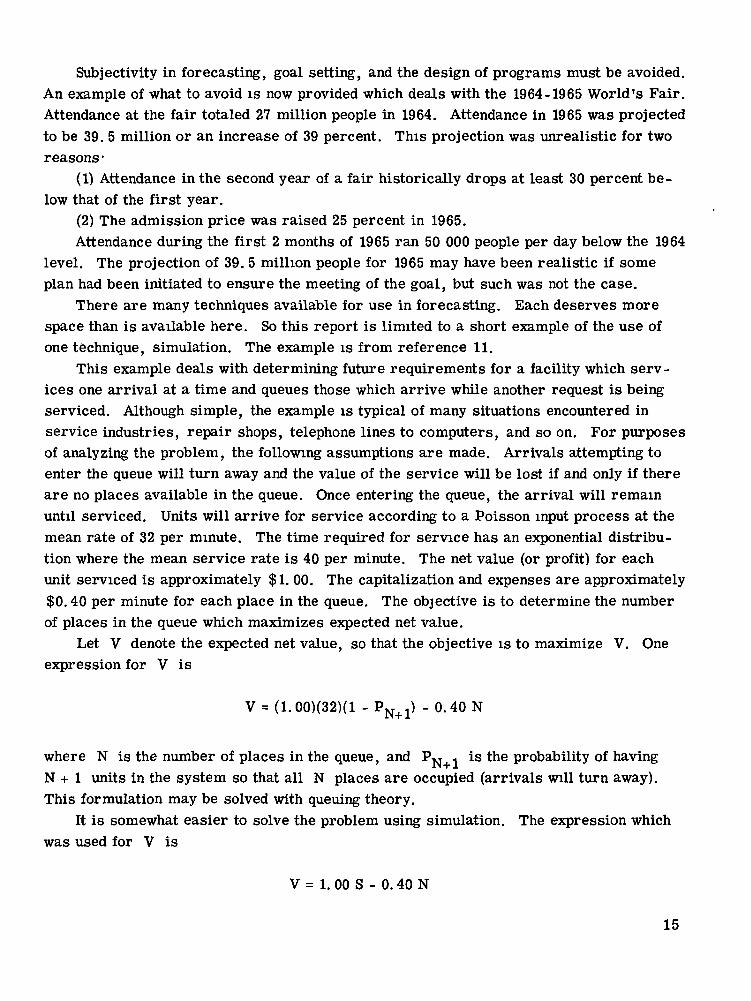
There are many techniques available for use in forecasting. Each deserves morespace than is available here. So this report is limited to a short example of the use ofone technique, simulation. The example is from reference 11.
This example deals with determining future requirements for a facility which serv-ices one arrival at a time and queues those which arrive while another request is beingserviced. Although simple, the example is typical of many situations encountered inservice industries, repair shops, telephone lines to computers, and so on. For purposesof analyzing the problem, the following assumptions are made. Arrivals attempting toenter the queue will turn away and the value of the service will be lost if and only if thereare no places available in the queue. Once entering the queue, the arrival will remainuntil serviced. Units will arrive for service according to a Poisson input process at themean rate of 32 per minute. The time required for service has an exponential distribu-tion where the mean service rate is 40 per minute. The net value (or profit) for eachunit serviced is approximately $1. 00. The capitalization and expenses are approximately$0. 40 per minute for each place in the queue. The objective is to determine the numberof places in the queue which maximizes expected net value.
Let V denote the expected net value, so that the objective is to maximize V. Oneexpression for V is
- 0 . 4 0 N
where N is the number of places in the queue , and P^ .. is the probability of havingN + 1 units in the system so that all N places are occupied (arrivals will turn away).This formulation may be solved with queuing theory.
It is somewhat easier to solve the problem using simulation. The expression whichwas used for V is
V = 1.00 S - 0.40 N
15

where S is the number of units serviced per minute. By using simulation to estimateS for various values of N, the optimal value of N was estimated.
The first step was to run the simulation model for various values of N in order toobtain preliminary estimates of V. This run revealed that N = (5, 6, 7, 8) were thecandidates for the optimal value of N, with N = (6, 7) as the prime candidates. Thispreliminary investigation was also used to determine reasonable starting conditions, toestimate the time required for the simulated system to essentially reach a steady -statecondition, and to estimate the required sample sizes. The next step was to execute longsimulation runs for each of these four values of N. Each of these runs was continued for
, 1500 simulated minutes after the system essentially reached a steady-state condition.The 1500 minutes were divided into 15 equal portions of 100 minutes each. The data re-corded were the average net value for each of the portions. The same sequences of ran-dom numbers were used for each of the runs so that the sequences of inter -arrival timesand service times would be the same on the respective runs. When comparing the per-formance for two values of N, the relevant information was the value of d1, the differ-ence in the average net value during portion i between the first and second values of Nfor i = 1, 2, . . . , 15.
For example, consider N = 7 and N = 8. The estimates of V obtained from thecorresponding simulation runs were $28. 045 and $27.973, respectively, so that the dif-ference was $0. 072. However, this does not prove that the true value of V is larger forN = 7 than for N = 8. It is necessary to take statistical error into account. By takingthe difference for each of the 15 portions, the average difference,
d = di = $°- °72n L=l
and the sample standard deviation of the difference
= $0.58n - 1
were obtained, where the sample size was n = 15. The estimated standard deviation ofthe average difference is s/\n = $0.0408. Thus, the corresponding t statistic is
t = —— = 1.76s/Vn"
16
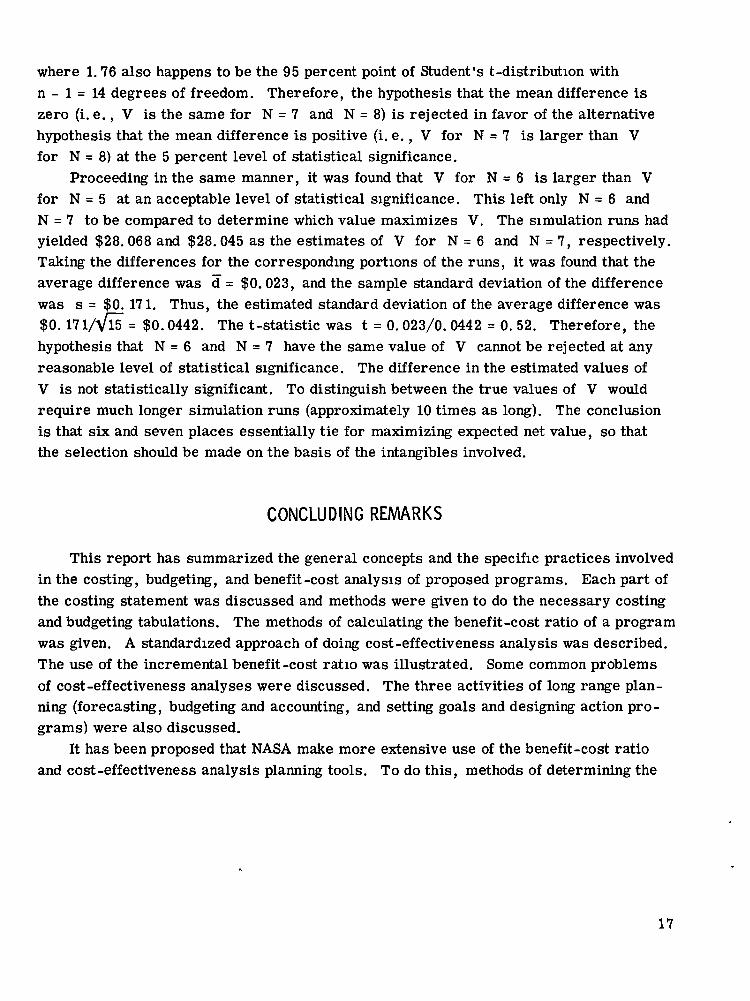
where 1. 76 also happens to be the 95 percent point of Student's t-distribution withn - 1 = 14 degrees of freedom. Therefore, the hypothesis that the mean difference iszero (i. e., V is the same for N = 7 and N = 8) is rejected in favor of the alternativehypothesis that the mean difference is positive (i. e., V for N = 7 is larger than Vfor N = 8) at the 5 percent level of statistical significance.
Proceeding in the same manner, it was found that V for N = 6 is larger than Vfor N = 5 at an acceptable level of statistical significance. This left only N = 6 andN = 7 to be compared to determine which value maximizes V. The simulation runs hadyielded $28.068 and $28.045 as the estimates of V for N = 6 and N = 7, respectively.Taking the differences for the corresponding portions of the runs, it was found that theaverage difference was d = $0.023, and the sample standard deviation of the differencewas s = $0. 171. Thus, the estimated standard deviation of the average difference was$0.171/VlF = $0.0442. The t-statistic was t = 0. 023/0. 0442 = 0. 52. Therefore, thehypothesis that N = 6 and N = 7 have the same value of V cannot be rejected at anyreasonable level of statistical significance. The difference in the estimated values ofV is not statistically significant. To distinguish between the true values of V wouldrequire much longer simulation runs (approximately 10 times as long). The conclusionis that six and seven places essentially tie for maximizing expected net value, so thatthe selection should be made on the basis of the intangibles involved.
CONCLUDING REMARKS
This report has summarized the general concepts and the specific practices involvedin the costing, budgeting, and benefit-cost analysis of proposed programs. Each part ofthe costing statement was discussed and methods were given to do the necessary costingand budgeting tabulations. The methods of calculating the benefit-cost ratio of a programwas given. A standardized approach of doing cost-effectiveness analysis was described.The use of the incremental benefit-cost ratio was illustrated. Some common problemsof cost-effectiveness analyses were discussed. The three activities of long range plan-ning (forecasting, budgeting and accounting, and setting goals and designing action pro-grams) were also discussed.
It has been proposed that NASA make more extensive use of the benefit-cost ratioand cost-effectiveness analysis planning tools. To do this, methods of determining the
17

benefits of NASA programs must be developed. Better utilization of NASA's currentfunding as well as better opportunities to gain increased future funding could result.
Lewis Research Center,National Aeronautics and Space Administration,
Cleveland, Ohio, May 12, 1972,682-10.
REFERENCES
1. Seiler, Karl, HI: Introduction to Systems Cost-Effectiveness. Wiley-Interscience,1969.
2. Quade, E. S. • Analysis for Military Decisions. Rand McNally and Co., 1964.
3. Morris, William T.: Analysis of Management Decisions. Rev. ed.,Richard D. Irwin,- Inc. , 1964.
4. Anon.: Circular No. A-94, Bureau of the Budget, Executive Office of the President,June 26, 1969.
5. Grant, Eugene L.; and Ireson, W. Grant. Principles of Engineering Economy.Fifth ed. , Ronald Press Co., 1964.
6. Ferguson, Charles E. • Microeconomic Theory. Rev. ed., Richard D. Irwin, Inc.,1969.
7. English, J. Morley, ed. : Cost-Effectiveness: Economic Evaluation of EngineeredSystems. John Wiley & Sons, Inc. , 1968.
8. Prest, A. R. ; and Turvey, R. • Cost-Benefit Analysis- A Survey.Economic J. , Dec. 1965, pp. 683-735.
9. Warren, E. Kirby. Where Long Range Planning Goes Wrong. Management Rev. ,vol. 51, no. 5, May 1962.
10. Anon. • A Quarterly Cost Profile for GSFC Space Satellite Projects.NASA Goddard Space Flight Center, Feb. 1970.
11. Hillier, Fredericks.; and Lieberman, Gerald J,: Introduction to OperationsResearch. Holden-Day, Inc., 1967.
18 NASA-Langley, 1972 34 E-6906

NATIONAL AERONAUTICS AND SPACE ADMISTRATION
WASHINGTON. D.C. 20546
OFFICIAL BUSINESS
PENALTY FOR PRIVATE USE $300FIRST CLASS MAIL
POSTAGE AND FEES PAID
NATIONAL AERONAUTICS AND
SPACE ADMINISTRATION
NASA 451
DT\CT\/ACTED If Undeliverable (Section 158Postal Manual) Do Not Return
"The aeronautical and space activities of the United States shall beconducted so as to contribute . . . to the expansion of human knowl-edge of phenomena in the atmosphere and space. The Administrationshall provide for the widest practicable and appropriate disseminationof information concerning its activities and the results thereof."
— NATIONAL AERONAUTICS AND SPACE ACT OF 1958
NASA SCIENTIFIC AND TECHNICAL PUBLICATIONS
TECHNICAL REPORTS: Scientific andtechnical information considered important,complete, and a lasting contribution to existingknowledge.
TECHNICAL NOTES: Information less broadin scope but nevertheless of importance as acontribution to existing knowledge.
TECHNICAL MEMORANDUMS:Information receiving limited distributionbecause of preliminary data, security classifica-tion, or other reasons.
CONTRACTOR REPORTS: Scientific andtechnical information generated under a NASAcontract or grant and considered an importantcontribution to existing knowledge.
TECHNICAL TRANSLATIONS: Informationpublished in a foreign language consideredto merit NASA distribution in English.
SPECIAL PUBLICATIONS: Informationderived from or of value to NASA activities.Publications include conference proceedings,monographs, data compilations, handbooks,sourcebooks, and special bibliographies.
TECHNOLOGY UTILIZATIONPUBLICATIONS: Information on technologyused by NASA that may be of particularinterest in commercial and other non-aerospaceapplications. Publications include Tech Briefs.,Technology Utilization Reports and
Technology Surveys.
Details on the availability of these publications may be obtained from:
SCIENTIFIC AND TECHNICAL INFORMATION OFFICE
NATIONAL AERONAUTICS AND SPACE ADMINISTRATIONWashington, D.C. 20546
Related Documents


