General formulae for the Feynman-a method with the bunching technique Yasunori Kitamura a, *, Tsuyoshi Misawa b , Hironobu Unesaki b , Seiji Shiroya b a Department of Fundamental Energy Science, Graduate School of Energy Science, Kyoto University, Yoshida-honmachi, Sakyo-ku, Kyoto 606-8501, Japan b Department of Nuclear Energy Science, Research Reactor Institute, Kyoto University, Kumatori-cho, Sennan-gun, Osaka 590-0494, Japan Received 29 July 1999; received in revised form 20 August 1999; accepted 18 October 1999 Abstract Recently, the bunching technique has been widely utilized in the Feynman-a experiment using a multi-channel scaler (MCS) to measure the prompt neutron decay constant p . Although the bunching technique enables us to perform ecient experiments, it was pointed out that an inherent count-loss process arises due to the channel advance time between adjacent MCS channels. Through derivation of a Feynman-a variance-to-mean formula con- taining by means of the multi-gate Pa´ l-Bell equation, Yamane and Hayashi ([Yamane, Y. & Hayashi, Y. 1995]. Annals of Nuclear Energy, 22(8), 533) indicated that this count-loss pro- cess does not play any important roles when the channel advance time is much smaller than the dwell time T. However, the =T ratio often becomes large in thermal systems at deep- subcritical states or fast ones, because the dwell time should be chosen to be much smaller than reciprocals of p values for such systems. On the other hand, since the ratio of the dead time d of neutron detectors to the dwell time becomes also large when the =T ratio is not small, the count-loss process due to the dead time cannot be neglected. Therefore, Feynman-a variance-to-mean and covariance-to-mean formulae containing both and d were derived by means of the compound detection probabilities. Based on the covariance-to-mean formula, a new experimental technique was developed and examined at the Kyoto University Critical Assembly. The result of the examination indicated that one can measure exact p values when =T ratios are known, even though =T and d=T ratios are not small. # 2000 Elsevier Science Ltd. All rights reserved. Annals of Nuclear Energy 27 (2000) 1199–1216 www.elsevier.com/locate/anucene 0306-4549/00/$ - see front matter # 2000 Elsevier Science Ltd. All rights reserved. PII: S0306-4549(99)00113-9 * Corresponding author. Tel.: +81-724-51-2379; fax: +81-724-51-2603. E-mail address: [email protected] (Y. Kitamura).

Welcome message from author
This document is posted to help you gain knowledge. Please leave a comment to let me know what you think about it! Share it to your friends and learn new things together.
Transcript
General formulae for the Feynman-a methodwith the bunching technique
Yasunori Kitamuraa,*, Tsuyoshi Misawab,Hironobu Unesakib, Seiji Shiroyab
aDepartment of Fundamental Energy Science, Graduate School of Energy Science,
Kyoto University, Yoshida-honmachi, Sakyo-ku, Kyoto 606-8501, JapanbDepartment of Nuclear Energy Science, Research Reactor Institute, Kyoto University,
Kumatori-cho, Sennan-gun, Osaka 590-0494, Japan
Received 29 July 1999; received in revised form 20 August 1999; accepted 18 October 1999
Abstract
Recently, the bunching technique has been widely utilized in the Feynman-a experiment
using a multi-channel scaler (MCS) to measure the prompt neutron decay constant �p.Although the bunching technique enables us to perform e�cient experiments, it was pointedout that an inherent count-loss process arises due to the channel advance time � between
adjacent MCS channels. Through derivation of a Feynman-a variance-to-mean formula con-taining � by means of the multi-gate Pa l-Bell equation, Yamane and Hayashi ([Yamane, Y. &Hayashi, Y. 1995]. Annals of Nuclear Energy, 22(8), 533) indicated that this count-loss pro-cess does not play any important roles when the channel advance time is much smaller than
the dwell time T. However, the �=T ratio often becomes large in thermal systems at deep-subcritical states or fast ones, because the dwell time should be chosen to be much smallerthan reciprocals of �p values for such systems. On the other hand, since the ratio of the dead
time d of neutron detectors to the dwell time becomes also large when the �=T ratio is notsmall, the count-loss process due to the dead time cannot be neglected. Therefore, Feynman-avariance-to-mean and covariance-to-mean formulae containing both � and d were derived by
means of the compound detection probabilities. Based on the covariance-to-mean formula, anew experimental technique was developed and examined at the Kyoto University CriticalAssembly. The result of the examination indicated that one can measure exact �p values when�=T ratios are known, even though �=T and d=T ratios are not small.# 2000 Elsevier Science
Ltd. All rights reserved.
Annals of Nuclear Energy 27 (2000) 1199±1216
www.elsevier.com/locate/anucene
0306-4549/00/$ - see front matter # 2000 Elsevier Science Ltd. All rights reserved.
PI I : S0306-4549(99 )00113 -9
* Corresponding author. Tel.: +81-724-51-2379; fax: +81-724-51-2603.
E-mail address: [email protected] (Y. Kitamura).
1. Introduction
It is well known that some important reactor kinetics parameters such as theprompt neutron decay constant �p can be measured by using the reactor noise ana-lysis methods (Williams, 1974). Although many of them were developed in earlydays of reactor physics, research activities have been intensively pursued on the basisof the reactor noise analysis methods, and a large number of papers are having beenpublished because of their theoretical lucidity and practical usefulness.In the Feynman-a method, by using a single or plural pulse type neutron detec-
tors, neutron counts accumulated within various lengths of counting-gate time (gatewidths) are measured to obtain the reactor kinetics parameters from the gate widthdependence of the Y value which is calculated as variance-to-mean ratio minus unityor covariance-to-mean ratio of thus measured neutron counts. In conventionalexperiments, hence, it takes a long time. On the other hand, in the bunching tech-nique proposed by Misawa et al. (1990), neutron counts within a fundamental count-ing-gate time (dwell time) are accumulated by using a multi-channel scaler (MCS), andneutron counts of longer gate widths are synthesized by bunching neutron countsstored in adjacent MCS channels.Recently, the bunching technique has been widely applied to various research
reactors or critical assemblies (Hashimoto et al., 1996a,b; Wallerbos and Hoogen-boom, 1998c). Although the bunching technique enables us to perform e�cientexperiments, it was pointed out that an inherent count-loss process arises due to thechannel advance time � between adjacent MCS channels. In order to evaluate thiscount-loss process, Yamane and Hayashi (1995) derived a Feynman-a variance-to-mean formula containing � by means of the multi-gate Pa l-Bell equation, andWallerbos and Hoogenboom (1998a) performed an experimental demonstration ofthis formula in the HTR-PROTEUS facility.In the paper of Yamane and Hayashi (1995), the following experimental knowl-
edge was also presented; this count-loss process does not play any important roleswhen the channel advance time is much smaller than the dwell time T (e.g. �=Tratios are less than 0.1%). Although the �=T ratio becomes enough small for ther-mal systems at the critical state, it often exceeds 0.1% for measurement of �p valuesfor thermal ones at deep-subcritical states or fast ones, because the dwell timeshould be chosen to be much smaller than reciprocals of �p values. On the otherhand, since the ratio of the dead time d of neutron detectors to the dwell timebecomes also large when the �=T ratio is not small, the count-loss process due to thedead time cannot be neglected. Therefore, new formulae for the Feynman-a var-iance-to-mean and covariance-to-mean methods containing both � and d werederived by means of the compound detection probabilities. These were derived asgeneral formulae including all e�ects pointed out so far; the delayed neutron and the®nite measurement time e�ects (Wallerbos and Hoogenboom, 1998b) in addition totwo kinds of the count-loss e�ects due to the channel advance time and the deadtime. On the basis of thus derived covariance-to-mean formula, an experimentaltechnique was newly developed to measure exact �p values when �=T and d=T ratiosare not small.
1200 Y. Kitamura et al. / Annals of Nuclear Energy 27 (2000) 1199±1216
In the present paper, derivation of the Feynman-a variance-to-mean and covar-iance-to-mean formulae and the experimental technique are described in Section 2.Section 3 describes experimental setups for an examination of the technique per-formed at the Kyoto University Critical Assembly (KUCA). Finally, conclusions aresummarized in Section 5 on the basis of the experimental results and their discussionin Section 4.
2. Derivation of general formulae
2.1. Feynman-a variance-to-mean method
2.1.1. De®nition of the Yvar valueHere, it is assumed that ¯uctuation of neutron population in a single core system
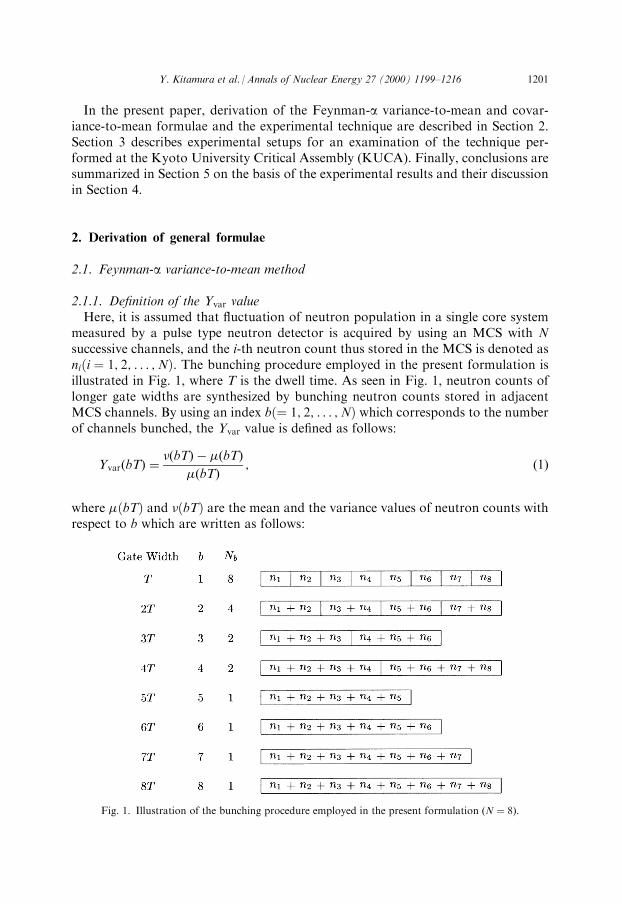
measured by a pulse type neutron detector is acquired by using an MCS with Nsuccessive channels, and the i-th neutron count thus stored in the MCS is denoted asni�i � 1; 2; . . . ;N�. The bunching procedure employed in the present formulation isillustrated in Fig. 1, where T is the dwell time. As seen in Fig. 1, neutron counts oflonger gate widths are synthesized by bunching neutron counts stored in adjacentMCS channels. By using an index b�� 1; 2; . . . ;N� which corresponds to the numberof channels bunched, the Yvar value is de®ned as follows:
Yvar�bT� � ��bT� ÿ ��bT���bT� ; �1�
where ��bT� and ��bT� are the mean and the variance values of neutron counts withrespect to b which are written as follows:
Fig. 1. Illustration of the bunching procedure employed in the present formulation (N � 8).
Y. Kitamura et al. / Annals of Nuclear Energy 27 (2000) 1199±1216 1201
��bT� � 1
Nb
XNb
i�1
Xbj�1
nb�iÿ1��j; �2�
��bT� � 1
Nb
XNb
i�1
Xbj�1
nb�iÿ1��j
!2
ÿ 1
Nb
XNb
i�1
Xbj�1
nb�iÿ1��j
!2
; �3�
where Nb is the total sample number with respect to b which is identical with amaximum integer within N=b.When the expected value of the Yvar value is denoted as hYvar�bT�i, it can be
obtained as follows:
hYvar�bT�i � h��bT�i ÿ h��bT�ih��bT�i ; �4�
where h��bT�i and h��bT�i are the expected values of ��bT� and ��bT� which arecalculated as follows:
h��bT�i � 1
Nb
XNb
i�1
Xbj�1
nb�iÿ1��j
* +� 1
Nb
XbNb
i�1ni
* +� 1
Nb
XbNb
i�1hnii; �5�
h��bT�i � 1
Nb
XNb
i�1
Xbj�1
nb�iÿ1��j
!2* +ÿ 1
N2b
XbNb
i�1ni
!2* +
� 1
Nb
XNb
i�1
Xbj�1hn2b�iÿ1��ji �
2
Nb
XNb
i�1
Xbÿ1j�1
Xbÿjk�1hnb�iÿ1��jnb�iÿ1��j�ki
ÿ 1
N2b
XbNb
i�1hn2i i ÿ
2
N2b
XbNbÿ1
i�1
XbNbÿi
j�1hnini�ji
� Nb ÿ 1
N2b
XbNb
i�1hnii �Nb ÿ 1
N2b
XbNb
i�1hni�ni ÿ 1�i
� 2
Nb
XNb
i�1
Xbÿ1j�1
Xbÿjk�1hnb�iÿ1��jnb�iÿ1��j�ki ÿ 2
N2b
XbNbÿ1
i�1
XbNbÿi
j�1hnini�ji: �6�
Now, one can see that the expected value of the Yvar value can be derived by calcu-lating expressions for the right-hand sides of Eqs. (5) and (6) which include the ®rst-order moment and two kinds of the second-order moments of neutron counts storedin the MCS.
2.1.2. Expression for the ®rst-order moment
Assuming that every MCS sweep begins at time 0 for simplicity, it can be con-sidered that ni is acquired in the time interval from �iÿ 1�T� �iÿ 1�� to
1202 Y. Kitamura et al. / Annals of Nuclear Energy 27 (2000) 1199±1216
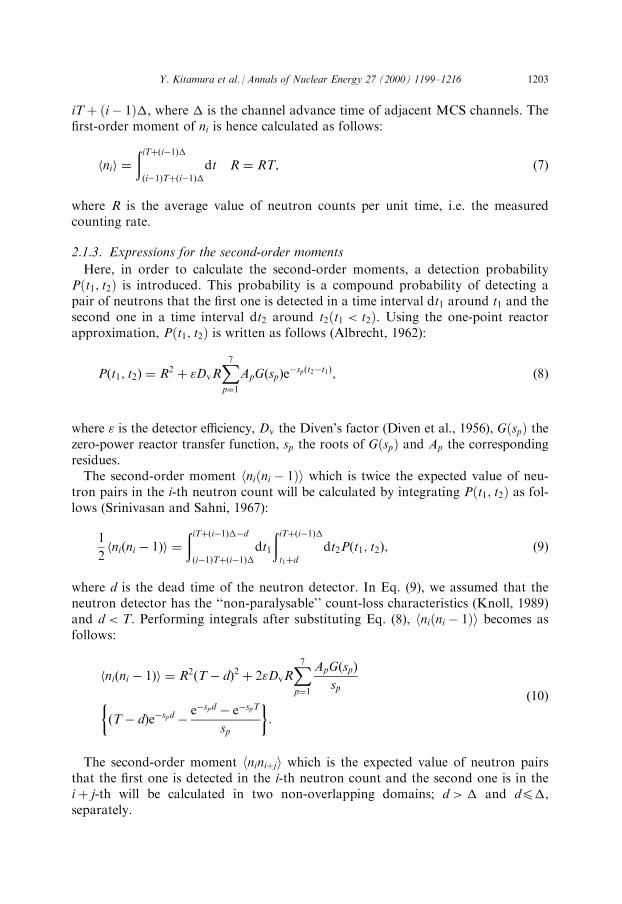
iT� �iÿ 1��, where � is the channel advance time of adjacent MCS channels. The®rst-order moment of ni is hence calculated as follows:
hnii ��iT��iÿ1���iÿ1�T��iÿ1��
dt R � RT; �7�
where R is the average value of neutron counts per unit time, i.e. the measuredcounting rate.
2.1.3. Expressions for the second-order moments
Here, in order to calculate the second-order moments, a detection probabilityP�t1; t2� is introduced. This probability is a compound probability of detecting apair of neutrons that the ®rst one is detected in a time interval dt1 around t1 and thesecond one in a time interval dt2 around t2�t1 < t2�. Using the one-point reactorapproximation, P�t1; t2� is written as follows (Albrecht, 1962):
P�t1; t2� � R2 � "DvRX7p�1
ApG�sp�eÿsp�t2ÿt1�; �8�
where " is the detector e�ciency, Dv the Diven's factor (Diven et al., 1956), G�sp� thezero-power reactor transfer function, sp the roots of G�sp� and Ap the correspondingresidues.The second-order moment hni�ni ÿ 1�i which is twice the expected value of neu-
tron pairs in the i-th neutron count will be calculated by integrating P�t1; t2� as fol-lows (Srinivasan and Sahni, 1967):
1
2hni�ni ÿ 1�i �
�iT��iÿ1��ÿd�iÿ1�T��iÿ1��
dt1
�iT��iÿ1��t1�d
dt2P�t1; t2�; �9�
where d is the dead time of the neutron detector. In Eq. (9), we assumed that theneutron detector has the ``non-paralysable'' count-loss characteristics (Knoll, 1989)and d < T. Performing integrals after substituting Eq. (8), hni�ni ÿ 1�i becomes asfollows:
hni�ni ÿ 1�i � R2�Tÿ d�2 � 2"DvRX7p�1
ApG�sp�sp
�Tÿ d�eÿspd ÿ eÿspd ÿ eÿspT
sp
� �:
�10�
The second-order moment hnini�ji which is the expected value of neutron pairsthat the ®rst one is detected in the i-th neutron count and the second one is in thei� j-th will be calculated in two non-overlapping domains; d > � and d4�,separately.
Y. Kitamura et al. / Annals of Nuclear Energy 27 (2000) 1199±1216 1203
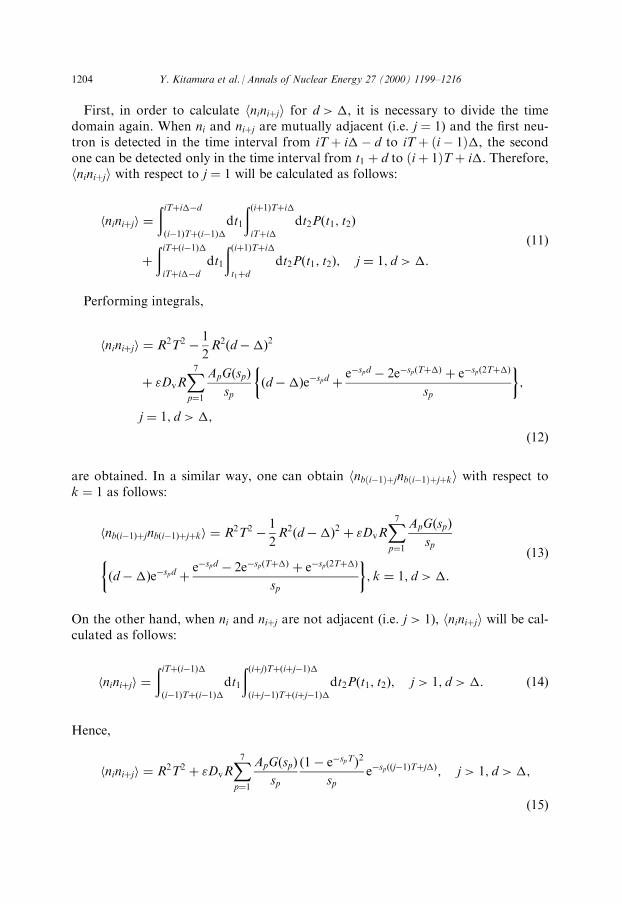
First, in order to calculate hnini�ji for d > �, it is necessary to divide the timedomain again. When ni and ni�j are mutually adjacent (i.e. j � 1) and the ®rst neu-tron is detected in the time interval from iT� i�ÿ d to iT� �iÿ 1��, the secondone can be detected only in the time interval from t1 � d to �i� 1�T� i�. Therefore,hnini�ji with respect to j � 1 will be calculated as follows:
hnini�ji ��iT�i�ÿd�iÿ1�T��iÿ1��
dt1
��i�1�T�i�iT�i�
dt2P�t1; t2�
��iT��iÿ1��iT�i�ÿd
dt1
��i�1�T�i�t1�d
dt2P�t1; t2�; j � 1; d > �:
�11�
Performing integrals,
hnini�ji � R2T2 ÿ 1
2R2�dÿ��2
� "DvRX7p�1
ApG�sp�sp
�dÿ��eÿspd � eÿspd ÿ 2eÿsp�T��� � eÿsp�2T���
sp
� �;
j � 1; d > �;
�12�
are obtained. In a similar way, one can obtain hnb�iÿ1��jnb�iÿ1��j�ki with respect tok � 1 as follows:
hnb�iÿ1��jnb�iÿ1��j�ki � R2T2 ÿ 1
2R2�dÿ��2 � "DvR
X7p�1
ApG�sp�sp
�dÿ��eÿspd � eÿspd ÿ 2eÿsp�T��� � eÿsp�2T���
sp
� �; k � 1; d > �:
�13�
On the other hand, when ni and ni�j are not adjacent (i.e. j > 1), hnini�ji will be cal-culated as follows:
hnini�ji ��iT��iÿ1���iÿ1�T��iÿ1��
dt1
��i�j�T��i�jÿ1���i�jÿ1�T��i�jÿ1��
dt2P�t1; t2�; j > 1; d > �: �14�
Hence,
hnini�ji � R2T2 � "DvRX7p�1
ApG�sp�sp
�1ÿ eÿspT�2sp
eÿsp��jÿ1�T�j��; j > 1; d > �;
�15�
1204 Y. Kitamura et al. / Annals of Nuclear Energy 27 (2000) 1199±1216
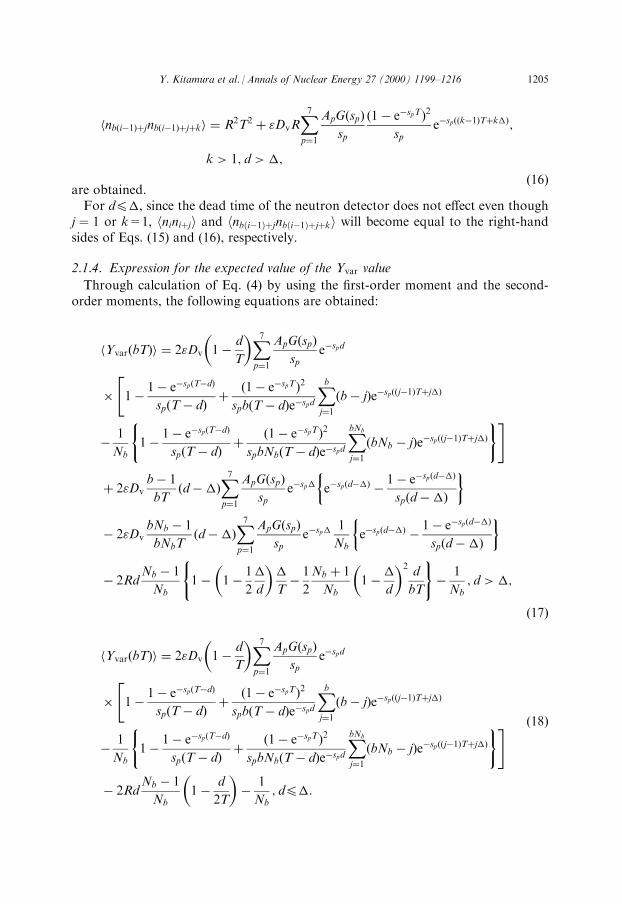
hnb�iÿ1��jnb�iÿ1��j�ki � R2T2 � "DvRX7p�1
ApG�sp�sp
�1ÿ eÿspT�2sp
eÿsp��kÿ1�T�k��;
k > 1; d > �;
�16�are obtained.For d4�, since the dead time of the neutron detector does not e�ect even though
j � 1 or k=1, hnini�ji and hnb�iÿ1��jnb�iÿ1��j�ki will become equal to the right-handsides of Eqs. (15) and (16), respectively.
2.1.4. Expression for the expected value of the Yvar value
Through calculation of Eq. (4) by using the ®rst-order moment and the second-order moments, the following equations are obtained:
hYvar�bT�i � 2"Dv 1ÿ d
T
� �X7p�1
ApG�sp�sp
eÿspd
� 1ÿ 1ÿ eÿsp�Tÿd�
sp�Tÿ d� ��1ÿ eÿspT�2
spb�Tÿ d�eÿspdXbj�1�bÿ j�eÿsp��jÿ1�T�j��
"
ÿ 1
Nb1ÿ 1ÿ eÿsp�Tÿd�
sp�Tÿ d� ��1ÿ eÿspT�2
spbNb�Tÿ d�eÿspdXbNb
j�1�bNb ÿ j�eÿsp��jÿ1�T�j��
( )#
� 2"Dvbÿ 1
bT�dÿ��
X7p�1
ApG�sp�sp
eÿsp� eÿsp�dÿ�� ÿ 1ÿ eÿsp�dÿ��
sp�dÿ��� �
ÿ 2"DvbNb ÿ 1
bNbT�dÿ��
X7p�1
ApG�sp�sp
eÿsp� 1
Nbeÿsp�dÿ�� ÿ 1ÿ eÿsp�dÿ��
sp�dÿ��� �
ÿ 2RdNb ÿ 1
Nb1ÿ 1ÿ 1
2
�
d
� ��
Tÿ 1
2
Nb � 1
Nb1ÿ�
d
� �2d
bT
( )ÿ 1
Nb; d > �;
�17�
hYvar�bT�i � 2"Dv 1ÿ d
T
� �X7p�1
ApG�sp�sp
eÿspd
� 1ÿ 1ÿ eÿsp�Tÿd�
sp�Tÿ d� ��1ÿ eÿspT�2
spb�Tÿ d�eÿspdXbj�1�bÿ j�eÿsp��jÿ1�T�j��
"
ÿ 1
Nb1ÿ 1ÿ eÿsp�Tÿd�
sp�Tÿ d� ��1ÿ eÿspT�2
spbNb�Tÿ d�eÿspdXbNb
j�1�bNb ÿ j�eÿsp��jÿ1�T�j��
( )#
ÿ 2RdNb ÿ 1
Nb1ÿ d
2T
� �ÿ 1
Nb; d4�:
�18�
Y. Kitamura et al. / Annals of Nuclear Energy 27 (2000) 1199±1216 1205
For reference, neglecting the channel advance time �, Eq. (17) becomes as follows:
hYvar�bT�i � 2"Dv 1ÿ d
bT
� �X7p�1
ApG�sp�sp
eÿspd 1ÿ 1ÿ eÿsp�bTÿd�
sp�bTÿ d�� �
ÿ 2"Dv 1ÿ d
bNbT
� �X7p�1
ApG�sp�sp
eÿspd1
Nb1ÿ 1ÿ eÿsp�bNbTÿd�
sp�bNbTÿ d�� �
ÿ 2RdNb ÿ 1
Nb1ÿ 1
2
Nb � 1
Nb
d
bT
� �ÿ 1
Nb:
�19�
On the other hand, neglecting the dead time d and taking the limit Nb ! 1, Eq.(18) becomes as follows:
hYvar�bT�i � 2"Dv
X7p�1
ApG�sp�sp
1ÿ 1ÿ eÿspT
spT� �1ÿ eÿspT�2
spbT
Xbj�1�bÿ j�eÿsp��jÿ1�T�j��
( ):
�20�
It can be found that Eqs. (19) and (20) are the Feynman-a variance-to-mean for-mulae derived by Wallerbos and Hoogenboom (1998b) and Yamane and Hayashi(1995), respectively.
2.2. Feynman-a covariance-to-mean method
2.2.1. De®nitions of the Ycov valuesAgain, it is assumed that ¯uctuation of neutron population in a single core system
measured by two neutron detectors (detector-#1 and detector-#2) is acquired byusing a multi-input type MCS with N successive channels for each input, and the j-thneutron count for detector-#i is denoted as ni;j�i � 1; 2; j � 1; 2; . . . ;N�. By using b,two kinds of the Ycov values are de®ned as follows:
Ycov;1�bT� � c�bT��2�bT� ; �21�
Ycov;2�bT� � c�bT��1�bT� ; �22�
where �1�bT�, �2�bT� and c�bT� are the mean values for the detector-#1 and thedetector-#2 and the covariance value of neutron counts with respect to b which arewritten as follows:
1206 Y. Kitamura et al. / Annals of Nuclear Energy 27 (2000) 1199±1216
�1�bT� � 1
Nb
XNb
i�1
Xbj�1
n1;b�iÿ1��j; �23�
�2�bT� � 1
Nb
XNb
i�1
Xbj�1
n2;b�iÿ1��j; �24�
c�bT� � 1
Nb
XNb
i�1
Xbj�1
n1;b�iÿ1��j
! Xbj�1
n2;b�iÿ1��j
!( )ÿ 1
Nb
XNb
i�1
Xbj�1
n1;b�iÿ1��j
!
� 1
Nb
XNb
i�1
Xbj�1
n2;b�iÿ1��j
!: �25�
The expected values of �1�bT� and �2�bT� can be calculated as follows:
h�1�bT�i � 1
Nb
XNb
i�1
Xbj�1
n1;b�iÿ1��j
* +� 1
Nb
XbNb
i�1n1;i
* +� 1
Nb
XbNb
i�1hn1;ii; �26�
h�2�bT�i � 1
Nb
XNb
i�1
Xbj�1
n2;b�iÿ1��j
* +� 1
Nb
XbNb
i�1n2;i
* +� 1
Nb
XbNb
i�1hn2;ii: �27�
On the other hand, the expected value of c�bT� can be calculated as follows:
hc�bT�i � 1
Nb
XNb
i�1
Xbj�1
n1;b�iÿ1��j
! Xbj�1
n2;b�iÿ1��j
!( )* +
ÿ 1
N2b
XbNb
i�1n1;i
! XbNb
i�1n2;i
!* +� 1
Nb
XNb
i�1
Xbj�1hn1;b�iÿ1��jn2;b�iÿ1��ji
� 1
Nb
XNb
i�1
Xbÿ1j�1
Xbÿjk�1hn1;b�iÿ1��jn2;b�iÿ1��j�ki � hn1;b�iÿ1��j�kn2;b�iÿ1��ji�
ÿ 1
N2b
XbNb
i�1hn1;in2;ii ÿ 1
N2b
XbNbÿ1
i�1
XbNbÿi
j�1hn1;in2;i�ji � hn1;i�jn2;ii�
� Nb ÿ 1
N2b
XbNb
i�1hn1;in2;ii � 2
Nb
XNb
i�1
Xbÿ1j�1
Xbÿjk�1hn1;b�iÿ1��jn2;b�iÿ1��j�ki
ÿ 2
N2b
XbNbÿ1
i�1
XbNbÿi
j�1hn1;in2;i�ji:
�28�
Here, it can be found again that the expected values of the Ycov values can bederived when expressions for the right-hand sides of Eqs. (26)±(28) are given.
Y. Kitamura et al. / Annals of Nuclear Energy 27 (2000) 1199±1216 1207
2.2.2. Expressions for the ®rst-order momentsAssuming that every MCS sweep begins at time 0, it can be considered that
both n1;i and n2;i are acquired in the time interval from �iÿ 1�T� �iÿ 1�� toiT� �iÿ 1��. Hence, the ®rst-order moments of n1;i and n2;i are obtained asfollows:
hn1;ii ��iT��iÿ1���iÿ1�T��iÿ1��
dtR1 � R1T; �29�
hn2;ii ��iT��iÿ1���iÿ1�T��iÿ1��
dtR2 � R2T; �30�
where R1 and R2 are the measured counting rates by each neutron detector.
2.2.3. Expressions for the second-order moments
As is well known, the dead time of neutron detectors does not appear explicitly inthe Feynman-a covariance-to-mean formula, because it does not play any importantroles in deriving expressions for the second-order moments.First, we will obtain the second-order moment hn1;in2;ii which is twice the expected
value of neutron pairs in the i-th neutron counts. Based on the fact that the ®rstdetection in one neutron detector does not prevent the second detection in the otherdetector, hn1;in2;ii will be calculated as follows:
1
2hn1;in2;ii �
�iT��iÿ1���iÿ1�T��iÿ1��
dt1
�iT��iÿ1��t1
dt2P12�t1; t2�; �31�
where P12�t1; t2� is the compound detection probability which employs two neutrondetectors and is written by using the detector e�ciencies "1 and "2 as follows:
P12�t1; t2� � R1R2 � F"1"2Dv
X7p�1
ApG�sp�eÿsp�t2ÿt1�; �32�
where F is the average ®ssion rate. Performing integrals in Eq. (31) after substitutingEq. (32), hn1;in2;ii becomes as follows:
hn1;in2;ii � R1R2T2 � 2F"1"2Dv
X7p�1
ApG�sp�sp
Tÿ 1ÿ eÿspT
sp
� �: �33�
In a similar way, the second-order moments hn1;in2;i�ji and hn1;b�iÿ1��jn2;b�iÿ1��j�kiwill be calculated. For example, hn1;in2;i�ji can be calculated by integratingP12�t1; t2� as follows:
1208 Y. Kitamura et al. / Annals of Nuclear Energy 27 (2000) 1199±1216
hn1;in2;i�ji ��iT��iÿ1���iÿ1�T��iÿ1��
dt1
��i�j�T��i�jÿ1���i�jÿ1�T��i�jÿ1��
dt2P12�t1; t2�: �34�
Thus obtained second-order moments are written as follows:
hn1;in2;i�ji � R1R2T2 � F"1"2Dv
X7p�1
ApG�sp�sp
�1ÿ eÿspT�2sp
eÿsp��jÿ1�T�j��; �35�
hn1;b�iÿ1��jn2;b�iÿ1��j�ki � R1R2T2 � F"1"2Dv
X7p�1
ApG�sp�sp
�1ÿ eÿspT�2sp
eÿsp��kÿ1�T�k��:
�36�
2.2.4. Expressions for the expected values of the Ycov values
By using Eqs. (26)±(28) after substituting the ®rst-order and the second-ordermoments, the expected values of the Ycov values are obtained as follows:
hYcov;1�bT�i � 2"1Dv
X7p�1
ApG�sp�sp
1ÿ 1ÿ eÿspT
spT� �1ÿ eÿspT�2
spbT
Xbj�1�bÿ j�eÿsp��jÿ1�T�j��
"
ÿ 1
Nb1ÿ 1ÿ eÿspT
spT� �1ÿ eÿspT�2
spbNbT
XbNb
j�1�bNb ÿ j�eÿsp��jÿ1�T�j��
( )#;
�37�
hYcov;2�bT�i � 2"2Dv
X7p�1
ApG�sp�sp
1ÿ 1ÿ eÿspT
spT� �1ÿ eÿspT�2
spbT
Xbj�1�bÿ j�eÿsp��jÿ1�T�j��
"
ÿ 1
Nb1ÿ 1ÿ eÿspT
spT� �1ÿ eÿspT�2
spbNbT
XbNb
j�1�bNb ÿ j�eÿsp��jÿ1�T�j��
( )#:
�38�For reference, neglecting the channel advance time � in Eqs. (37) and (38), each
equation becomes equivalent to the conventional Feynman-a covariance-to-meanformulae.
2.3. Data analysis
Here, we will describe a new experimental technique developed on the basis of theFeynman-a covariance-to-mean formula derived in the present study. It should beemphasized again that the goal of the experimental technique is to realize measurement
Y. Kitamura et al. / Annals of Nuclear Energy 27 (2000) 1199±1216 1209
of �p values including those for thermal systems at deep-subcritical states and fastones. The reason why the experimental technique is based on the covariance-to-meanformula is that the dead time d is inherently eliminated as seen in Eq. (37) or (38)unlike the variance-to-mean formulae.First, we will consider the total sample number Nb which is a maximum integer
within N=b. Obviously, one can understand that the di�erence between Nb and N=bbecomes serious as increasing b. However, the di�erence can be regarded to be smallwhen b is not very large. Assuming Nb ' N=b, one can obtain an approximated formof Eq. (37) as follows:
hYcov;1�bT�i
� 2"1Dv
X7p�1
ApG�sp�sp
1ÿ 1ÿ eÿspT
spT� �1ÿ eÿspT�2
spbT
Xbj�1�bÿ j�eÿsp��jÿ1�T�j��
"
ÿ 1
NT1ÿ 1ÿ eÿspT
spT� �1ÿ eÿspT�2
spNT
XNj�1�Nÿ j�eÿsp��jÿ1�T�j��
( )bT
#
� 2"1Dv
X7p�1
ApG�sp�sp
1ÿ 1ÿ eÿspT
spT� �1ÿ eÿspT�2
spbT
Xbj�1�bÿ j�eÿsp��jÿ1�T�j��
( )ÿ BbT;
�39�
where B is a constant. By performing summation with respect to j, one can obtainthe following formula after some rearrangements:
hYcov;1�bT�i � 2"1Dv
X7p�1
ApG�sp�sp
1ÿ �ÿ1� espT��ÿ1� esp��sp�ÿ1� esp�T����T
� �
� 1ÿ 1ÿ eÿsp�T���b
sp�ÿ1� esp�T����2esp��ÿ1� espT�2 Tÿ
�ÿ1� esp���ÿ1� esp�T����spesp��ÿ1� espT�
� �b
2666437775ÿ BbT:
�40�
Here, we will introduce the one-group delayed neutron approximation and thefollowing assumption:
�d�T��� < �p�T��� << 1; �41�
where �p and �d are the prompt neutron decay constant and the e�ective delayedneutron decay constant, respectively. Hence, an approximated formula can beobtained as follows:
1210 Y. Kitamura et al. / Annals of Nuclear Energy 27 (2000) 1199±1216
hYcov;1�bT�i � 2"1DvApG��p��p 1��
T
� � 1ÿ 1ÿ eÿ�p 1�
�
T
� �bT
�p 1��
T
� �bT
8>>><>>>:9>>>=>>>;
� 2"1DvAdG��d��d 1��
T
� � 1ÿ 1ÿ eÿ�d 1�
�
T
� �bT
�d 1��
T
� �bT
8>>><>>>:9>>>=>>>;ÿ BbT;
�42�
where the subscript ``p'' or ``d'' denotes the prompt and the delayed neutrons,respectively.Finally, by introducing the following assumption:
�d 1��
T
� �bT << 1; �43�
one can obtain the following results:
hYcov;1�bT�i � Y� 1ÿ 1ÿ eÿ��bT
��bT
� �� CbT; �44�
Y� � 2"1DvApG��p���
; �45�
�� � �p 1��
T
� �; �46�
where C is a constant. In Eq. (44), one can see a similar expression to that seen in theconventional Feynman-a covariance-to-mean formula, although the �� value isbiased from �p due to the �=T ratio. This fact indicates that exact �p values areobtained by using �=T ratios and �� values which can be measured by conventionalexperiments of the Feynman-a covariance-to-mean method.
3. Experimental
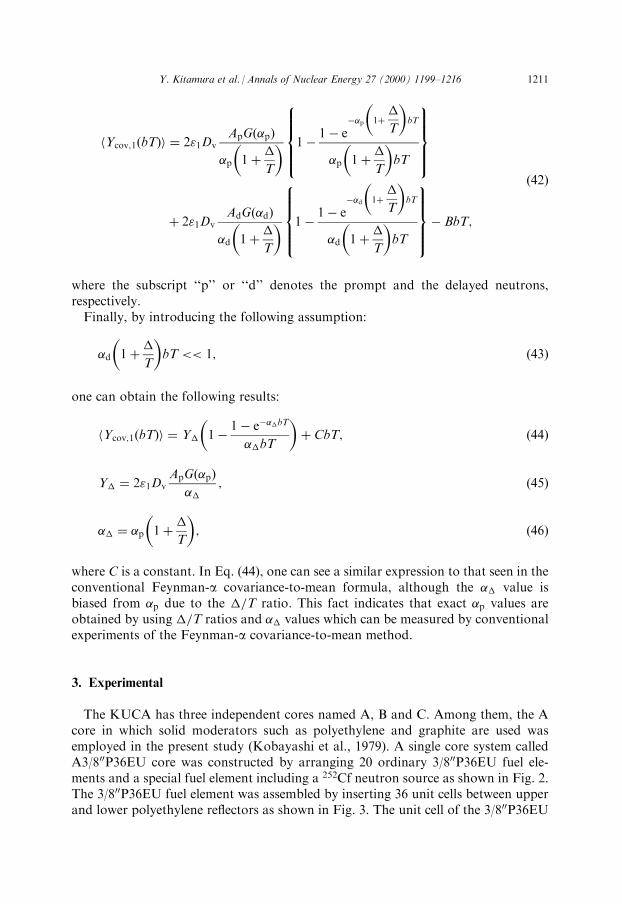
The KUCA has three independent cores named A, B and C. Among them, the Acore in which solid moderators such as polyethylene and graphite are used wasemployed in the present study (Kobayashi et al., 1979). A single core system calledA3/800P36EU core was constructed by arranging 20 ordinary 3/800P36EU fuel ele-ments and a special fuel element including a 252Cf neutron source as shown in Fig. 2.The 3/800P36EU fuel element was assembled by inserting 36 unit cells between upperand lower polyethylene re¯ectors as shown in Fig. 3. The unit cell of the 3/800P36EU
Y. Kitamura et al. / Annals of Nuclear Energy 27 (2000) 1199±1216 1211
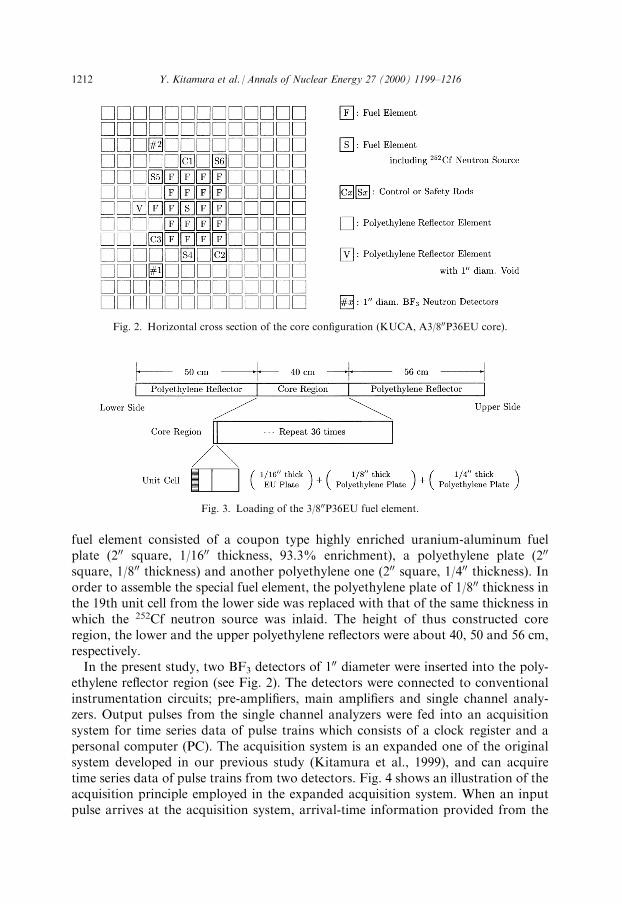
fuel element consisted of a coupon type highly enriched uranium-aluminum fuelplate (200 square, 1/1600 thickness, 93.3% enrichment), a polyethylene plate (200
square, 1/800 thickness) and another polyethylene one (200 square, 1/400 thickness). Inorder to assemble the special fuel element, the polyethylene plate of 1/800 thickness inthe 19th unit cell from the lower side was replaced with that of the same thickness inwhich the 252Cf neutron source was inlaid. The height of thus constructed coreregion, the lower and the upper polyethylene re¯ectors were about 40, 50 and 56 cm,respectively.In the present study, two BF3 detectors of 1
00 diameter were inserted into the poly-ethylene re¯ector region (see Fig. 2). The detectors were connected to conventionalinstrumentation circuits; pre-ampli®ers, main ampli®ers and single channel analy-zers. Output pulses from the single channel analyzers were fed into an acquisitionsystem for time series data of pulse trains which consists of a clock register and apersonal computer (PC). The acquisition system is an expanded one of the originalsystem developed in our previous study (Kitamura et al., 1999), and can acquiretime series data of pulse trains from two detectors. Fig. 4 shows an illustration of theacquisition principle employed in the expanded acquisition system. When an inputpulse arrives at the acquisition system, arrival-time information provided from the
Fig. 2. Horizontal cross section of the core con®guration (KUCA, A3/800P36EU core).
Fig. 3. Loading of the 3/800P36EU fuel element.
1212 Y. Kitamura et al. / Annals of Nuclear Energy 27 (2000) 1199±1216
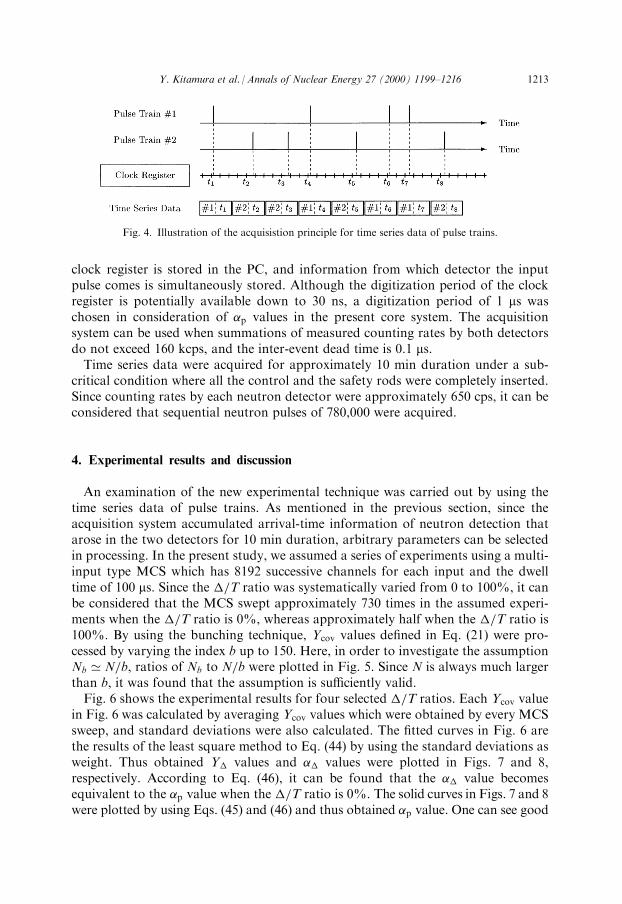
clock register is stored in the PC, and information from which detector the inputpulse comes is simultaneously stored. Although the digitization period of the clockregister is potentially available down to 30 ns, a digitization period of 1 ms waschosen in consideration of �p values in the present core system. The acquisitionsystem can be used when summations of measured counting rates by both detectorsdo not exceed 160 kcps, and the inter-event dead time is 0.1 ms.Time series data were acquired for approximately 10 min duration under a sub-
critical condition where all the control and the safety rods were completely inserted.Since counting rates by each neutron detector were approximately 650 cps, it can beconsidered that sequential neutron pulses of 780,000 were acquired.
4. Experimental results and discussion
An examination of the new experimental technique was carried out by using thetime series data of pulse trains. As mentioned in the previous section, since theacquisition system accumulated arrival-time information of neutron detection thatarose in the two detectors for 10 min duration, arbitrary parameters can be selectedin processing. In the present study, we assumed a series of experiments using a multi-input type MCS which has 8192 successive channels for each input and the dwelltime of 100 ms. Since the �=T ratio was systematically varied from 0 to 100%, it canbe considered that the MCS swept approximately 730 times in the assumed experi-ments when the �=T ratio is 0%, whereas approximately half when the �=T ratio is100%. By using the bunching technique, Ycov values de®ned in Eq. (21) were pro-cessed by varying the index b up to 150. Here, in order to investigate the assumptionNb ' N=b, ratios of Nb to N=b were plotted in Fig. 5. Since N is always much largerthan b, it was found that the assumption is su�ciently valid.Fig. 6 shows the experimental results for four selected �=T ratios. Each Ycov value
in Fig. 6 was calculated by averaging Ycov values which were obtained by every MCSsweep, and standard deviations were also calculated. The ®tted curves in Fig. 6 arethe results of the least square method to Eq. (44) by using the standard deviations asweight. Thus obtained Y� values and �� values were plotted in Figs. 7 and 8,respectively. According to Eq. (46), it can be found that the �� value becomesequivalent to the �p value when the �=T ratio is 0%. The solid curves in Figs. 7 and 8were plotted by using Eqs. (45) and (46) and thus obtained �p value. One can see good
Fig. 4. Illustration of the acquisistion principle for time series data of pulse trains.
Y. Kitamura et al. / Annals of Nuclear Energy 27 (2000) 1199±1216 1213
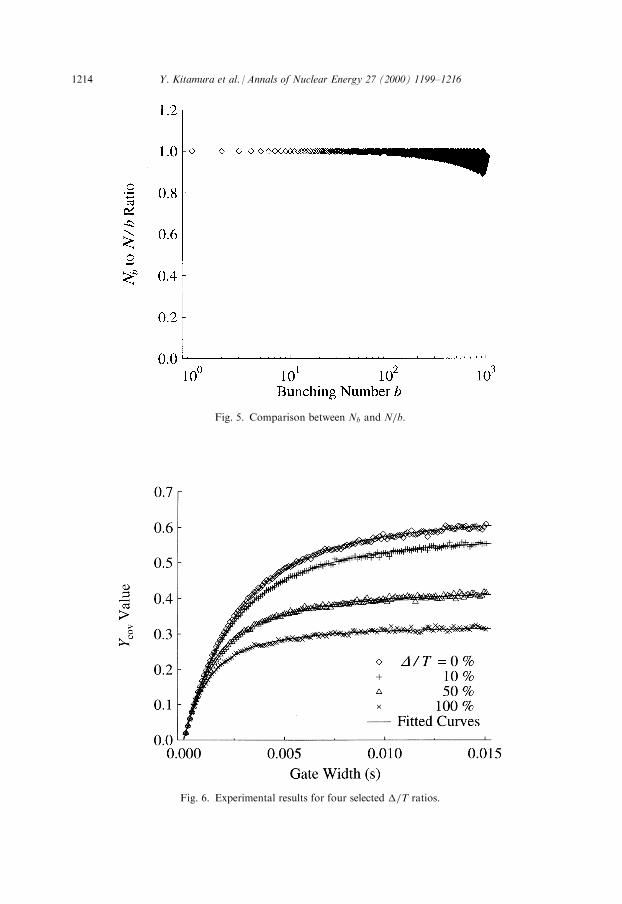
Fig. 5. Comparison between Nb and N=b.
Fig. 6. Experimental results for four selected �=T ratios.
1214 Y. Kitamura et al. / Annals of Nuclear Energy 27 (2000) 1199±1216
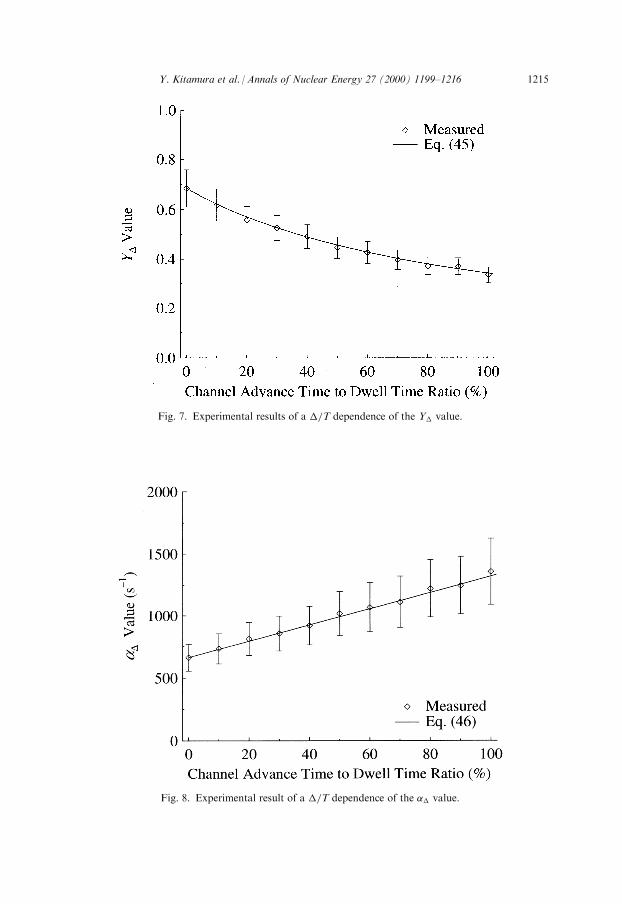
Fig. 7. Experimental results of a �=T dependence of the Y� value.
Fig. 8. Experimental result of a �=T dependence of the �� value.
Y. Kitamura et al. / Annals of Nuclear Energy 27 (2000) 1199±1216 1215
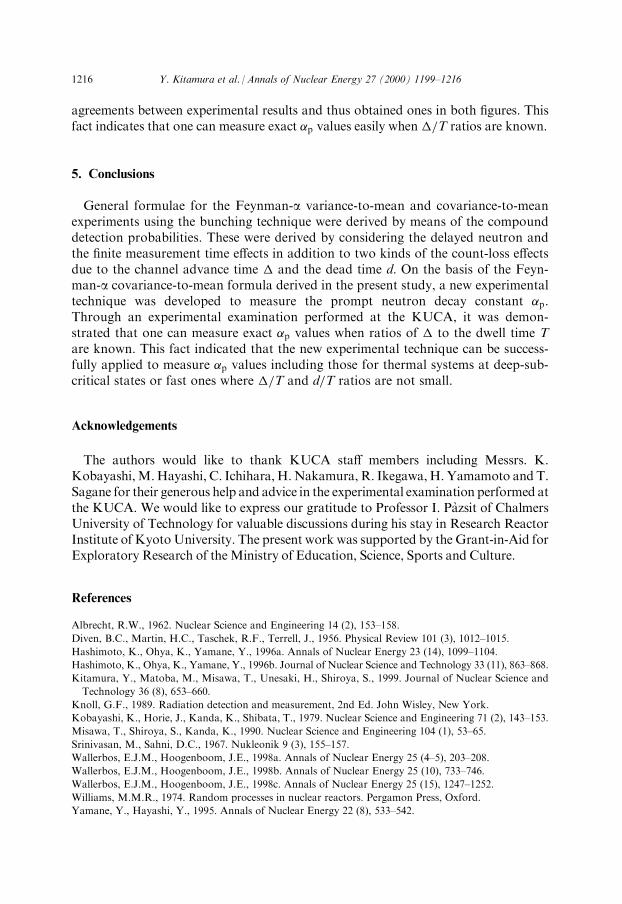
agreements between experimental results and thus obtained ones in both ®gures. Thisfact indicates that one can measure exact �p values easily when �=T ratios are known.
5. Conclusions
General formulae for the Feynman-a variance-to-mean and covariance-to-meanexperiments using the bunching technique were derived by means of the compounddetection probabilities. These were derived by considering the delayed neutron andthe ®nite measurement time e�ects in addition to two kinds of the count-loss e�ectsdue to the channel advance time � and the dead time d. On the basis of the Feyn-man-a covariance-to-mean formula derived in the present study, a new experimentaltechnique was developed to measure the prompt neutron decay constant �p.Through an experimental examination performed at the KUCA, it was demon-strated that one can measure exact �p values when ratios of � to the dwell time Tare known. This fact indicated that the new experimental technique can be success-fully applied to measure �p values including those for thermal systems at deep-sub-critical states or fast ones where �=T and d=T ratios are not small.
Acknowledgements
The authors would like to thank KUCA sta� members including Messrs. K.Kobayashi,M.Hayashi, C. Ichihara, H.Nakamura, R. Ikegawa,H. Yamamoto and T.Sagane for their generous help and advice in the experimental examination performed atthe KUCA. We would like to express our gratitude to Professor I. PaÁ zsit of ChalmersUniversity of Technology for valuable discussions during his stay in Research ReactorInstitute of KyotoUniversity. The present work was supported by the Grant-in-Aid forExploratory Research of theMinistry of Education, Science, Sports and Culture.
References
Albrecht, R.W., 1962. Nuclear Science and Engineering 14 (2), 153±158.
Diven, B.C., Martin, H.C., Taschek, R.F., Terrell, J., 1956. Physical Review 101 (3), 1012±1015.
Hashimoto, K., Ohya, K., Yamane, Y., 1996a. Annals of Nuclear Energy 23 (14), 1099±1104.
Hashimoto, K., Ohya, K., Yamane, Y., 1996b. Journal of Nuclear Science and Technology 33 (11), 863±868.
Kitamura, Y., Matoba, M., Misawa, T., Unesaki, H., Shiroya, S., 1999. Journal of Nuclear Science and
Technology 36 (8), 653±660.
Knoll, G.F., 1989. Radiation detection and measurement, 2nd Ed. John Wisley, New York.
Kobayashi, K., Horie, J., Kanda, K., Shibata, T., 1979. Nuclear Science and Engineering 71 (2), 143±153.
Misawa, T., Shiroya, S., Kanda, K., 1990. Nuclear Science and Engineering 104 (1), 53±65.
Srinivasan, M., Sahni, D.C., 1967. Nukleonik 9 (3), 155±157.
Wallerbos, E.J.M., Hoogenboom, J.E., 1998a. Annals of Nuclear Energy 25 (4±5), 203±208.
Wallerbos, E.J.M., Hoogenboom, J.E., 1998b. Annals of Nuclear Energy 25 (10), 733±746.
Wallerbos, E.J.M., Hoogenboom, J.E., 1998c. Annals of Nuclear Energy 25 (15), 1247±1252.
Williams, M.M.R., 1974. Random processes in nuclear reactors. Pergamon Press, Oxford.
Yamane, Y., Hayashi, Y., 1995. Annals of Nuclear Energy 22 (8), 533±542.
1216 Y. Kitamura et al. / Annals of Nuclear Energy 27 (2000) 1199±1216
Related Documents


![F435l Feynman, Richard P....F435l Feynman, Richard P. Lições de física de Feynman [recurso eletrônico] : edição defi nitiva / Richard P. Feynman, Robert B. Leighton, Matthew](https://static.cupdf.com/doc/110x72/60f9952864588249d76c85f5/f435l-feynman-richard-p-f435l-feynman-richard-p-lies-de-fsica-de-feynman.jpg)


