2017-18 General Development Plan

Welcome message from author
This document is posted to help you gain knowledge. Please leave a comment to let me know what you think about it! Share it to your friends and learn new things together.
Transcript

2017-18
General
Development
Plan


Alberta-Pacific Forest Industries Inc.
Northland Forest Products Ltd.
General Development Plan
May 2017 to April 2022
April 20, 2017


5
Table of Contents
Table of Contents ................................................................................................................... 5
List of Tables ......................................................................................................................... 6
List of Maps ........................................................................................................................... 7
Introduction ............................................................................................................................ 8
Harvest Schedule ................................................................................................................. 10
Periodic Cut Control ............................................................................................................ 12
Planning Unit Development ................................................................................................ 13
First Nations Consultations and Public Input ...................................................................... 15
First Nations Consultation ....................................................................................... 15
Landscape Advisory Group ..................................................................................... 15
Distribution of the 2017-2018 Annual Operating Plan ............................................ 16
Map Reading Area at Mill Site and TimberNorth Office ........................................ 16
Tours and Presentations ........................................................................................... 16
Alberta-Pacific Regional Offices ............................................................................. 16
Conclusion ............................................................................................................... 16
Variance Tracking ............................................................................................................... 17
Spatial Harvest Sequence (SHS) ............................................................................. 17
Stand Structure ......................................................................................................... 17
Alberta-Pacific ............................................................................................. 17
Northland ..................................................................................................... 18
Appendix 1 Detailed Fiber Supply for Operating Years 2017-18 to 2021-22 .................... 19
Appendix 2 Periodic Cut Control Details ............................................................................ 29
Appendix 3 Operational Variance Summary ....................................................................... 39
6
List of Tables
Table 1 Five Year Fiber Supply ........................................................................................... 11
Table 2 Planning Unit First Entry Year .............................................................................. 13
Table 3 Alberta-Pacific Planning Unit Expiry ..................................................................... 14
Appendix 1 Table 1, Alberta-Pacific and Northland Harvest (FMU A14).......................... 21
Appendix 1 Table 1, Alberta-Pacific and Northland Harvest (FMU A15).......................... 22
Appendix 1 Table 1, Alberta-Pacific and Northland Harvest (FMU L1) ............................ 23
Appendix 1 Table 1, Alberta-Pacific Harvest (FMU L2) .................................................... 23
Appendix 1 Table 1, Alberta-Pacific and Northland Harvest (FMU L3) ............................ 24
Appendix 1 Table 1, Alberta-Pacific and Northland Harvest (FMU L8) ............................ 24
Appendix 1 Table 1, Alberta-Pacific Harvest (FMU L11) .................................................. 25
Appendix 1 Table 1, Alberta-Pacific Harvest (FMU S11) .................................................. 26
Appendix 1 Table 1, Alberta-Pacific Harvest (FMU S14) .................................................. 26
Appendix 1 Table 1, Alberta-Pacific Harvest (FMU S18) .................................................. 26
Appendix 1 Table 1, Alberta-Pacific Harvest (FMU S22) .................................................. 27
Appendix 1 Table 1, Alberta-Pacific Harvest (FMU S23) .................................................. 28
Appendix 2 Table 1, Alberta-Pacific Quadrant 2016-2021 FMU Cut Control ................... 31
Appendix 2 Table 2, Northland Quadrant 2016-2021 FMU Cut Control............................ 36
Appendix 2 Table 3, Quadrant 2016-2021 Local Timber Use Cut Control ........................ 37
Appendix 3 Table 1, Alberta-Pacific Operational Variance Summary (FMU A14) ........... 41
Appendix 3 Table 2, Alberta-Pacific Operational Variance Summary (FMU L1).............. 41
Appendix 3 Table 3, Alberta-Pacific Operational Variance Summary (FMU L2).............. 42
Appendix 3 Table 4, Alberta-Pacific Operational Variance Summary (FMU L3).............. 43
Appendix 3 Table 5, Alberta-Pacific Operational Variance Summary (FMU L8).............. 44
Appendix 3 Table 6, Alberta-Pacific Operational Variance Summary (FMU L11)............ 45
Appendix 3 Table 7, Alberta-Pacific Operational Variance Summary (FMU S11) ............ 46
Appendix 3 Table 8, Alberta-Pacific Operational Variance Summary (FMU S14) ............ 46
Appendix 3 Table 9, Alberta-Pacific Operational Variance Summary (FMU S18) ............ 47
Appendix 3 Table 10, Alberta-Pacific Operational Variance Summary (FMU S22) .......... 47
Appendix 3 Table 11, Alberta-Pacific Operational Variance Summary (FMU S23) .......... 48
Appendix 3 Table 12, Northland Operational Variance Summary (FMU A14) ................. 49
Appendix 3 Table 13, Northland Operational Variance Summary (FMU L1) .................... 50

7
Appendix 3 Table 14, Northland Operational Variance Summary (FMU L3) .................... 50
Appendix 3 Table 15, Northland Operational Variance Summary (FMU L8) .................... 51
List of Maps
Overview Map:
Access Development Plan on General Development Plan (1:500,000)

8
Introduction
The purpose of this General Development Plan (GDP) is to provide a projection of activities
for FMA9100029, CTQA140005, CTQA150001, CTQL010005, CTQL030016 and
CTQL080003 from May 1, 2017 to April 30, 2022 to:
guide the integration of activities,
provide a focus for collecting stakeholder information,
schedule timber disposition administration activities,
predict variance from the Spatial Harvest Sequence (SHS),
predict cut control status and,
coordinate the development and reclamation of roads.
Northland holds coniferous timber quota CTQA100002 in FMU A10. There will be no
operations scheduled under this CTQ for this GDP and it has not been included.
The General Development Plan provides planned boundaries for access to areas that contain
timber suitable for harvest (planning units). Each planning unit is designed to support
harvest activities for three to five years. Harvest activities include:
access construction,
falling and decking,
hauling,
road reclamation and
harvest slash abatement.
Subsequent to the above listed harvest activities, various potential silviculture activities may
occur within the harvest areas. These activities are required to achieve reforestation targets
set by the Alberta Government. Silviculture activities may include:
site preparation,
planting,
vegetation management and
reforestation surveys.

9
Incidental activities are likely to occur within planning unit footprints to support these
activities. These incidental activities include, but are not limited to:
decking areas / log storage sites,
burrow pits,
surface material exploration and
temporary work camps.
References to years or annual periods in this plan refer to the timber year from May 1 to
April 30.
The current quadrant is a full 5 year period beginning May 1, 2016.
The GDP is a rolling five-year plan that is updated annually. As a planning unit moves
closer to the current year, more planning activities are completed within the planning unit
boundary. Specific concerns are more easily addressed in the early years. The dates
depicted in this plan are subject to change.

10
Harvest Schedule
The Harvest Schedule includes information on the locations and volumes for Alberta-
Pacific’s and Northland’s harvesting from within their respect dispositions from May 1,
2017 to April 30, 2022.
In the GDP the following codes apply:
N refers to non-frozen ground conditions.
F refers to frozen ground conditions. Generally November 15
to March 31.
Decid refers to Alberta-Pacific’s deciduous harvested from the
deciduous landbase.
Inc Decid refers to Alberta-Pacific’s incidental deciduous harvested from
the Alberta-Pacific’s coniferous landbase.
Conif (Al-Pac) refers to Alberta-Pacific’s coniferous harvested from the
coniferous landbase.
Conif (NFPL) refers to Northland’s coniferous harvested from the coniferous
landbase.
Inc Conif refers to Alberta-Pacific’s the incidental coniferous harvested
from the deciduous landbase.

11
Table 1
Five Year Fiber Supply (vol. in ,000 of m3)
Source Wood Type 2017-18 2018-19 2019-20 2020-21 2021-22
Alberta-Pacific FMA Harvest
Deciduous Timber 1,902 1,589 1,638 1,644 1,623
Incidental Deciduous 86 32 14 12 12
Incidental Coniferous 224 250 312 360 353
Coniferous Timber 188 108 52 55 32
Northland Quota Harvest
Coniferous Timber 356 409 409 397 412
Annual periods refer to the Forest Management Operating Year (for example: 2017-18 is from May 1, 2017to April 30, 2018).

12
Periodic Cut Control
Appendix 2 Table 1, Alberta-Pacific Quadrant 2016-2021 FMU Cut Control provides the
quadrant actual and projected deliveries in relation to the respective Quadrant Allowable
Cuts (QACs). The QACs are based on the January 13, 2014 letter from Dan Wilkinson
containing revised Annual Allowable Cut (AAC) Tables and subsequent adjustments as
published on the Alberta Agriculture and Forestry (AAF) website.
Appendix 2 Table 2, Northland Quadrant 2016-2021 FMU Cut Control provides the
quadrant actual and projected deliveries in relation to the respective Quadrant Allowable
Cuts (QACs). The QACs are based on Coniferous Timber Quota Certificates for
CTQA140005, CTQA150001, CTQL010005, CTQL030016 and CTQL080003.
The 5% volume reduction for stand structure for Alberta-Pacific was removed during the
approved Timber Supply Analysis. The 1% of the AAC that is available for local use is
included in the QACs. The 1% local use is managed by AAF and utilization to date is in
Appendix 2 Table 3, Quadrant 2016-2021 Local Timber Use Cut Control.
Once the new FMP is approved Alberta-Pacific will apply for carry over adjustment from
Quadrant 5. Volumes in Appendix 2 Table 1, Alberta-Pacific Quadrant 2016-2021 FMU
Cut Control reflect an estimated carry over adjustment.
A Timber Revenue audit for May 1, 2016 to April 30, 2017 will be scheduled in October
2017.
13
Planning Unit Development
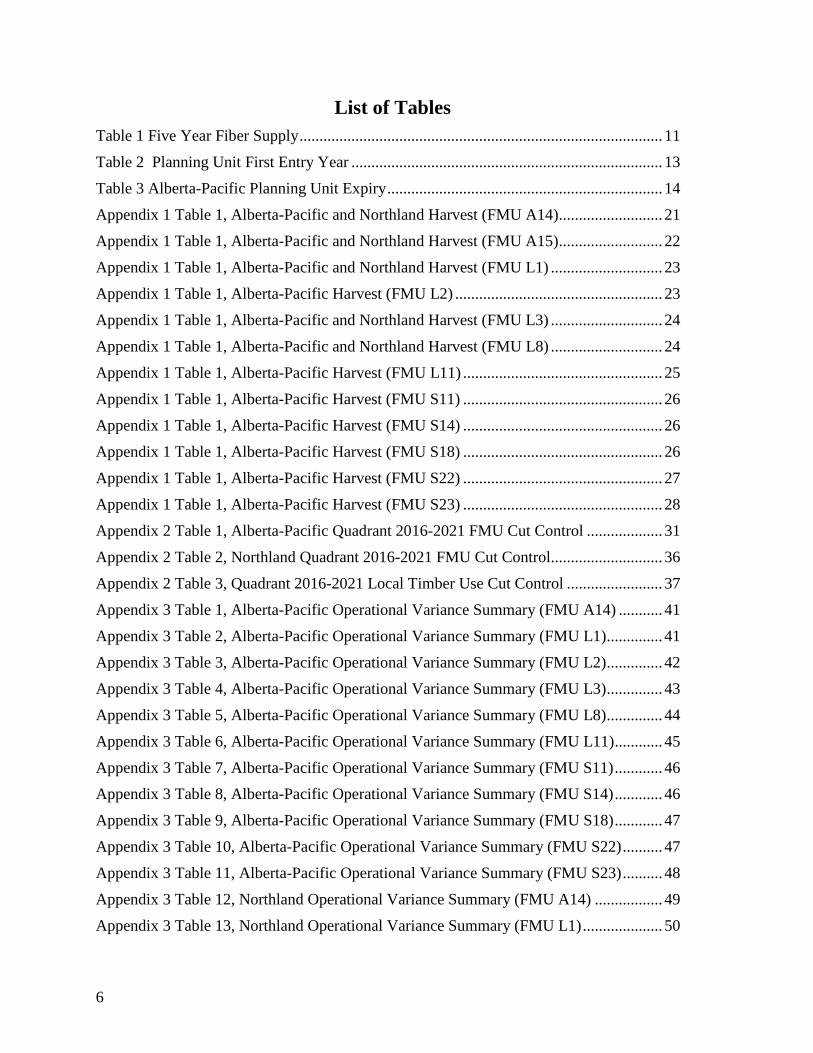
Planning unit development timing is shown in the following table listing entry year. Forest
Harvest Plan (FHP) submissions for acceptance or appraisal should occur the year before the
entry year, however, considerable uncertainty is created by the potential for alternative fiber
sources such as industrial salvage and other underutilized forest operations. Plans integrated
with other Timber Operators, Researchers, Oil Sands Proponents and Steam Assisted
Gravity Drainage (SAGD) operations will be developed in accordance with the timing
requirements of the other operators.
Table 2
Planning Unit First Entry Year
2017-18 2018-19 2019-20 2020-21 2021-22
067254(A) 070124(A) 073124(A) 070104(A) 068264(A)
070134(A) 076044(A) 077154(I) 072144(A) 069134(A)
070144(A) 078154(I) 079094(A) 076144(N) 070254(A)
072244(AF) 080084(AF) 080075(A) 078244(A) 071144(A)
073194(A) 084094(N) 081045(A) 079084(A) 072154(N)
075144(N) 085045(A) 086045(A) 082055(A) 082094(N)
075155(NF) 085055(A) 091144(N) 083064(AS) 083074(A)
078024(A) 091114(AM) 098074(NM) 083104(N) 084074(AS)
086104(N) 091134(N) 085184(I) 087055(A)
086124(I) 095114(NM) 089224(A) 091124(N)
087244(A) 097094(NM) 093104(NM) 091114(N)
088064(NW) 099084(NM) 094084(NM) 092134(N)
091094(NW) 095084(AM) 093224(A)
094094(NFM) 099114(NM)
094114(NM) 100114(N)
A = Alberta-Pacific Plan; N = Northland Plan; I = Integrated Plan between Alberta-Pacific and
Northland; F = Approved FHP; W = Wildfire Salvage Plan; M = Surface Mineable Area (SMA)
Integrated Salvage Plan; S = Steam Assisted Gravity Drainage (SAGD) Integrated Salvage Plan;
Q = Plan Developed with Other Timber Tenure Holder.
Planning units expiring in the timber year ending April 30, 2017 that require extension are:
071224 – Extension required to April 30, 2018 to complete harvesting, hauling and
reclamation activities.
072124 – Extension required to April 30, 2018 to complete harvesting, hauling and
reclamation activities.
083224 – Extension required to April 30, 2018 to complete harvesting, hauling and
reclamation activities.
092234 – FHP submitted for new 5-year approval.

14
Planning units that are expiring or complete and Alberta-Pacific would like to have closed
are:
077244 – Harvest activities completed.
The Alberta-Pacific planning units that will expire in this GDP are shown in Table 3.
Table 3
Alberta-Pacific Planning Unit Expiry (expiry date is April 30 annually)
2018 2019 2020 2021 2022
081055 080024 068254 072154
084174 084035 071204 072244
085015 085074 072144 072254
093234 086104 080084 077244
090204 084144 081074
086234 084064
085064
089084
090084
091104
The following are the planning unit expiry dates for Northland’s approved FHPs:
EAH 2015 – Oct 22, 2020
EAH 2016-2021 (093104) – Oct 26, 2021
EFM 2016-2021 (089084) – January 4, 2022
EMT 2014-2017 (075144) – January 8, 2020
FS 085064 – April 30, 2021
HR 2014-01 – November 17, 2019
HRR 2016-2021 – November 29, 2021
Husky 2016-2021 (094084) – October 26, 2021
LHC 2016-2021 – November 17, 2020
NSB 2016-2021 (090084) – December 20, 2021
Current status of the approved planning units is included in 2017-18 Operating Schedule and
Timber Production (OS) Appendix 3, Planning Unit Outstanding Items.
An Active Block Report will be provided to AAF monthly. The report will show the
completed and outstanding activities for all of Alberta-Pacific’s active harvest areas.
Planning unit specific progress reports will be provided upon request.
15
Northland will provide a block reporting strategy to AAF prior to operations being covered
under this AOP commencing.
First Nations Consultations and Public Input
The goal of the Annual Operating Plan (AOP) - public input process is to inform the public
and obtain input into the AOPs. This is done through a number of methods including
posting plans on Alberta-Pacific’s and Northland’s public websites, public information
sessions, the Landscape Advisory Group, mill and woodlands tours, and school
presentations.
First Nations Consultation
Alberta-Pacific and Northland have performed procedural aspects of First Nations and Metis
Settlements consultation as per Alberta’s current Government of Alberta’s Policy on
Consultation with First Nations on Land and Natural Resource Management, 2013, the
Government of Alberta’s Policy on Consultation with Metis Settlements on Land and
Natural Resource Management, 2015 and the First Nations and Metis Settlements Pre-
consultation Assessment provided by AAF on March 1, 2017. An adequacy assessment
request with supporting documentation will be sent to AAF in April 2017.
Alberta-Pacific and Northland prepared a detailed descriptive document for the corridors on
the Access Development Map that are being consulted on. These road documents (Road
Addendums), have been presented to all First Nations and Metis Settlements identified in
the Pre-Consultation Assessment (AAF March 1, 2017).
Landscape Advisory Group
The Forest Landscape Advisory Group (LAG) is a key part of Alberta-Pacific’s
“Community Engagement Strategy,” which aims to ensure the consistency, co-ordination,
efficiency and effectiveness of community engagement activities initiated by Alberta-
Pacific. The LAG assists Alberta-Pacific in focusing resources, implementing programs and
adopting practices, where and as appropriate, for the benefit of Alberta-Pacific, the FMA
area Communities and the environment. The LAG is advisory in nature, however, if and
where required to make a recommendation or decision, the group operates by consensus.
The LAG provides information from a stakeholder and public perspective to assist Alberta-
Pacific in landscape planning and operational decision making by the Woodlands group.

16
Distribution of the 2017-2018 Annual Operating Plan
The complete Annual Operating Plan and Forest Harvest Plans are posted annually on
Alberta-Pacific’s and Northland’s public websites to give the public a chance to review
these documents at their convenience.
Map Reading Area at Mill Site and TimberNorth Office
Company representatives are available for review of the AOP at the Alberta-Pacific and
Northland millsites and the TimberNorth Office in Athabasca. There were no requests for
this service in the past year.
Tours and Presentations
Alberta-Pacific and Northland conducts woodlands tours to demonstrate the Companies’
ecosystem management and harvesting practices. There are tours of the millsite, harvest
block tours, and harvest operations demonstrations. Though the tours are not specifically a
component of the AOP Public Input process, they allow Alberta-Pacific and Northland to
present information and respond to inquiries about all aspects of the Company.
Alberta-Pacific Regional Offices
A regional office is located in Wabasca. Company representatives at this office assist in the
Company’s trapper contact program and aboriginal affairs. These representatives are
available to answer questions concerning all aspects of Alberta-Pacific’s business or direct
the public to the correct contact person at the millsite. This office has been beneficial to the
public and the Company.
Conclusion
Information sessions, tours, presentations, publications and visits by schools and the public
to the millsite or our regional offices allowed many people to ask questions and get answers
regarding what was happening, and how to get in touch with the proper people regarding
economic opportunities.
Any information received from stakeholders is dealt with according to the status of the
planning unit and the type of information. Information not considered confidential is
included in Forest Harvest Plans.

17
Variance Tracking
Spatial Harvest Sequence (SHS)
The Alberta-Pacific Spatial Harvest Sequence was approved in 2008 to cover the period of
September 1, 2006 to August 31, 2021. The first five year period ended on August 31, 2011
and the second five year period ended on April 30, 2016. The variance reported in this AOP
is part of the third five year period.
Jack Pine variances in L11 will be addressed in the next Timber Supply Analysis by
adjusting site classes to be included in the netdown.
Appendix 3, Operational Variance Summary includes the reporting required in the GDP.
SHS variances from amendments to FHPs will be reported as per OGR 4.1.10.
Stand Structure
Alberta-Pacific’s and Northland’s strategy is to retain varying amounts of structure at the
stand level as per the FMP and OGRs. The Companies have developed stand structure
monitoring programs using a combination of update aerial photography and field
verification.
Alberta-Pacific
The following is the structure retention report for 2014-15:
Merchantable stand structure clumps were measured in 105 blocks (2,816 ha) over 9
FMUs utilizing the 2015 update photography. The stand structure retained within
the blocks averaged 3.1%.
A single tree count was photo interpreted for 17 blocks (571 ha) to assess single tree
retention. The single tree retention averaged 1.3% of the volume.
Stand structure analysis results for 2015-16 harvesting will be reported in the 2018-19 AOP
after the 2016 update photography interpretation has been completed.

18
Northland
The following is the structure retention report for 2015-16:
For blocks under 24ha, stand structure was left as snags, non-merchantable stems,
single trees, and small clumps to protect non-timber values.
For blocks between 24 and 100ha the following retention was left:
o An average of 1.4% retention was left standing in clumps in A15. Additional
single tree retention was left as well
o An average of 4.8% retention was left standing in clumps in A14. Additional
single tree retention was left as well.
There were 3 blocks that were harvested over 100ha. An average of 5.3% retention
was left in small and large patches at the FMU Level. Additional retention was left
as single tree structure.
Retention left during 2016-17 harvesting will be reported in the AOP following the year that
update photography is captured.

19
Appendix 1
Detailed Fiber Supply for Operating
Years 2017-18 to 2021-22


21
Appendix 1 Table 1,
Alberta-Pacific and Northland Harvest (FMU A14) (Values in cubic meters)
Planning Wood 2017-18 2017-18 2018-19 2018-19 2019-20 2019-20 2020-21 2020-21 2021-22 2021-22
Unit FMU Type N F N F N F N F N F
082094 A14 Conif (NFPL) 0 0 0 0 0 0 0 0 0 57,750
083104 A14 Conif (NFPL) 0 0 0 0 0 0 0 36,750 0 0
084094 A14 Conif (NFPL) 0 0 0 49,875 0 0 0 0 0 0
084174 A14 Decid 0 0 0 130,900 0 0 0 0 0 0 Inc Decid 0 0 0 17,600 0 0 0 0 0 0
Inc Conif 0 0 0 13,300 0 0 0 0 0 0
Conif (Al-Pac) 0 0 0 60,700 0 0 0 0 0 0
085074 A14 Decid 41,400 0 0 0 0 0 0 0 0 0
Inc Decid 0 0 0 0 0 0 0 0 0 0 Inc Conif 1,400 0 0 0 0 0 0 0 0 0
Conif (Al-Pac) 0 0 0 0 0 0 0 0 0 0
085184 A14 Decid 0 0 0 0 0 0 0 50,000 0 100,000
Inc Decid 0 0 0 0 0 0 0 0 0 0
Inc Conif 0 0 0 0 0 0 0 13,500 0 27,000 Conif (NFPL) 0 0 0 0 0 0 0 50,000 0 0
086104 A14 Decid 0 57,600 0 0 0 0 0 0 0 0 Inc Decid 0 0 0 0 0 0 0 0 0 0
Inc Conif 0 5,900 0 0 0 0 0 0 0 0
Conif (NFPL) 0 30,000 0 0 0 0 0 0 0 0
086124 A14 Decid 0 15,000 0 0 0 0 0 0 0 0
Inc Decid 0 0 0 0 0 0 0 0 0 0 Inc Conif 0 4,000 0 0 0 0 0 0 0 0
Conif (NFPL) 0 100,000 0 100,000 0 0 0 0 0 0
088064 A14 Conif (NFPL) 0 30,000 0 0 0 0 0 0 0 0
089084 A14 Decid 0 32,000 0 0 0 0 0 0 0 0 Inc Decid 0 0 0 0 0 0 0 0 0 0
Inc Conif 0 14,700 0 0 0 0 0 0 0 0
Conif (NFPL) 0 10,000 0 0 0 0 0 0 0 0
Total A14 Decid 41,400 104,600 0 130,900 0 0 0 50,000 0 100,000
Inc Decid 0 0 0 17,600 0 0 0 0 0 0
Inc Conif 1,400 24,600 0 13,300 0 0 0 13,500 0 27,000
Conif (Al-Pac) 0 0 0 60,700 0 0 0 0 0 0
Conif (NFPL) 0 170,000 0 149,875 0 0 0 86,750 0 57,750
22
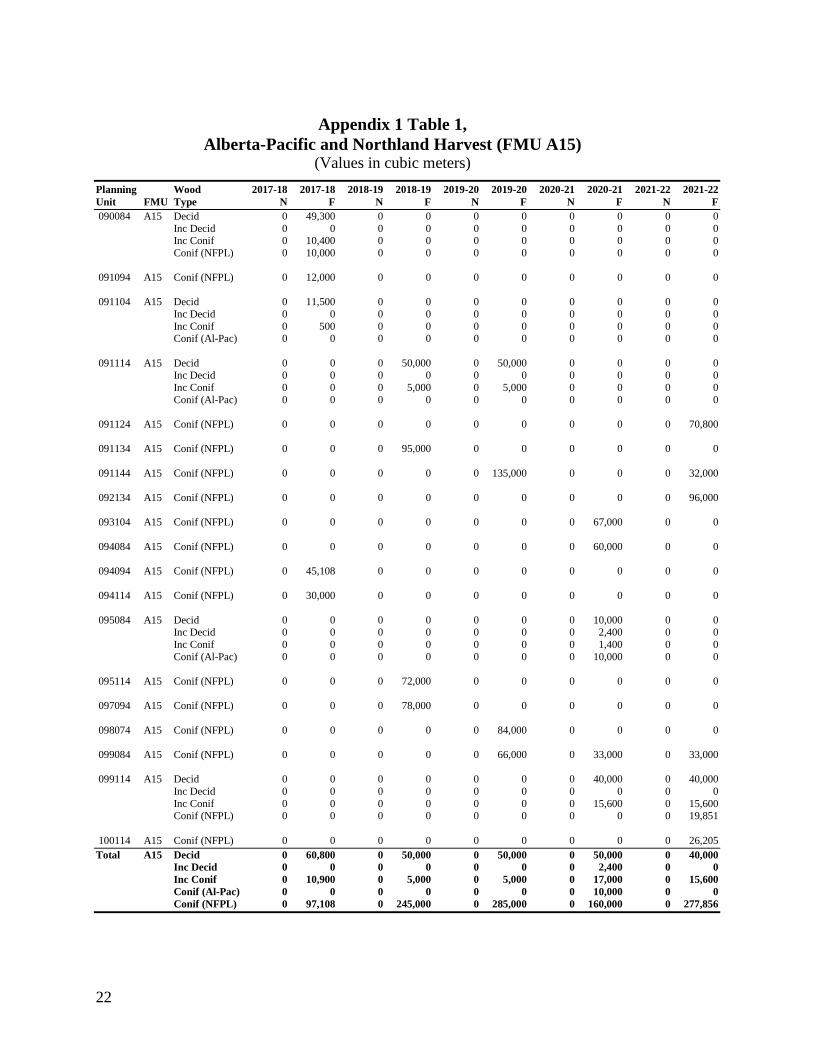
Appendix 1 Table 1,
Alberta-Pacific and Northland Harvest (FMU A15) (Values in cubic meters)
Planning Wood 2017-18 2017-18 2018-19 2018-19 2019-20 2019-20 2020-21 2020-21 2021-22 2021-22
Unit FMU Type N F N F N F N F N F
090084 A15 Decid 0 49,300 0 0 0 0 0 0 0 0
Inc Decid 0 0 0 0 0 0 0 0 0 0 Inc Conif 0 10,400 0 0 0 0 0 0 0 0
Conif (NFPL) 0 10,000 0 0 0 0 0 0 0 0
091094 A15 Conif (NFPL) 0 12,000 0 0 0 0 0 0 0 0
091104 A15 Decid 0 11,500 0 0 0 0 0 0 0 0
Inc Decid 0 0 0 0 0 0 0 0 0 0
Inc Conif 0 500 0 0 0 0 0 0 0 0 Conif (Al-Pac) 0 0 0 0 0 0 0 0 0 0
091114 A15 Decid 0 0 0 50,000 0 50,000 0 0 0 0 Inc Decid 0 0 0 0 0 0 0 0 0 0
Inc Conif 0 0 0 5,000 0 5,000 0 0 0 0
Conif (Al-Pac) 0 0 0 0 0 0 0 0 0 0
091124 A15 Conif (NFPL) 0 0 0 0 0 0 0 0 0 70,800
091134 A15 Conif (NFPL) 0 0 0 95,000 0 0 0 0 0 0
091144 A15 Conif (NFPL) 0 0 0 0 0 135,000 0 0 0 32,000
092134 A15 Conif (NFPL) 0 0 0 0 0 0 0 0 0 96,000
093104 A15 Conif (NFPL) 0 0 0 0 0 0 0 67,000 0 0
094084 A15 Conif (NFPL) 0 0 0 0 0 0 0 60,000 0 0
094094 A15 Conif (NFPL) 0 45,108 0 0 0 0 0 0 0 0
094114 A15 Conif (NFPL) 0 30,000 0 0 0 0 0 0 0 0
095084 A15 Decid 0 0 0 0 0 0 0 10,000 0 0 Inc Decid 0 0 0 0 0 0 0 2,400 0 0
Inc Conif 0 0 0 0 0 0 0 1,400 0 0
Conif (Al-Pac) 0 0 0 0 0 0 0 10,000 0 0
095114 A15 Conif (NFPL) 0 0 0 72,000 0 0 0 0 0 0
097094 A15 Conif (NFPL) 0 0 0 78,000 0 0 0 0 0 0
098074 A15 Conif (NFPL) 0 0 0 0 0 84,000 0 0 0 0
099084 A15 Conif (NFPL) 0 0 0 0 0 66,000 0 33,000 0 33,000
099114 A15 Decid 0 0 0 0 0 0 0 40,000 0 40,000
Inc Decid 0 0 0 0 0 0 0 0 0 0
Inc Conif 0 0 0 0 0 0 0 15,600 0 15,600 Conif (NFPL) 0 0 0 0 0 0 0 0 0 19,851
100114 A15 Conif (NFPL) 0 0 0 0 0 0 0 0 0 26,205
Total A15 Decid 0 60,800 0 50,000 0 50,000 0 50,000 0 40,000
Inc Decid 0 0 0 0 0 0 0 2,400 0 0
Inc Conif 0 10,900 0 5,000 0 5,000 0 17,000 0 15,600
Conif (Al-Pac) 0 0 0 0 0 0 0 10,000 0 0
Conif (NFPL) 0 97,108 0 245,000 0 285,000 0 160,000 0 277,856

23
Appendix 1 Table 1,
Alberta-Pacific and Northland Harvest (FMU L1) (Values in cubic meters)
Planning Wood 2017-18 2017-18 2018-19 2018-19 2019-20 2019-20 2020-21 2020-21 2021-22 2021-22
Unit FMU Type N F N F N F N F N F
069134 L1 Decid 0 0 0 0 0 0 0 0 60,000 65,000
Inc Conif 0 0 0 0 0 0 0 0 10,800 11,700
070104 L1 Decid 0 0 0 0 0 0 0 145,000 0 45,000
Inc Conif 0 0 0 0 0 0 0 26,100 0 8,100
070124 L1 Decid 0 0 160,000 25,000 50,000 75,000 30,000 0 0 0 Inc Conif 0 0 28,800 4,500 9,000 13,500 5,400 0 0 0
070134 L1 Decid 57,700 0 0 0 0 0 0 0 0 0 Inc Conif 2,100 0 0 0 0 0 0 0 0 0
072124 L1 Decid 37,098 0 0 0 0 0 0 0 0 0 Inc Conif 2,734 0 0 0 0 0 0 0 0 0
073124 L1 Decid 0 0 0 0 0 70,000 0 130,000 0 0
Inc Conif 0 0 0 0 0 12,600 0 23,400 0 0
Total L1 Decid 94,798 0 160,000 25,000 50,000 145,000 30,000 275,000 60,000 110,000
Inc Conif 4,834 0 28,800 4,500 9,000 26,100 5,400 49,500 10,800 19,800
Appendix 1 Table 1,
Alberta-Pacific Harvest (FMU L2) (Values in cubic meters)
Planning Wood 2017-18 2017-18 2018-19 2018-19 2019-20 2019-20 2020-21 2020-21 2021-22 2021-22
Unit FMU Type N F N F N F N F N F
071204 L2 Decid 56,000 0 0 0 0 0 0 0 0 0 Inc Conif 6,400 0 0 0 0 0 0 0 0 0
071224 L2 Decid 0 11,500 0 0 0 0 0 0 0 0
Inc Conif 0 400 0 0 0 0 0 0 0 0 072244 L2 Decid 61,608 0 20,500 38,200 0 0 0 0 0 0
Inc Conif 4,324 0 1,900 5,200 0 0 0 0 0 0
073194 L2 Decid 55,900 0 27,100 2,700 50,000 38,500 20,000 65,000 20,000 21,000
Inc Conif 3,100 0 1,600 100 9,900 4,800 4,400 10,300 4,400 4,600
Total L2 Decid 173,508 11,500 47,600 40,900 50,000 38,500 20,000 65,000 20,000 21,000
Inc Conif 13,824 400 3,500 5,300 9,900 4,800 4,400 10,300 4,400 4,600

24
Appendix 1 Table 1,
Alberta-Pacific and Northland Harvest (FMU L3) (Values in cubic meters)
Planning Wood 2017-18 2017-18 2018-19 2018-19 2019-20 2019-20 2020-21 2020-21 2021-22 2021-22
Unit FMU Type N F N F N F N F N F
075144 L3 Conif (NFPL) 0 96,000 0 0 0 0 0 0 0 0
075154 L3 Conif (NFPL) 0 43,000 0 0 0 0 0 0 0 0
076164 L3 Conif (NFPL) 0 0 0 0 0 0 0 150,000 0 52,865
077154 L3 Decid 0 0 0 0 0 65,000 0 43,000 0 12,000 Inc Conif 0 0 0 0 0 20,100 0 13,300 0 3,800
Conif (NFPL) 0 0 0 0 0 124,000 0 0 0 0
078154 L3 Decid 0 0 0 91,200 0 61,200 0 0 0 0
Inc Conif 0 0 0 7,100 0 10,500 0 0 0 0
Conif (NFPL) 0 0 0 15,000 0 0 0 0 0 0
084174 L3 Decid 0 0 0 22,600 0 0 0 0 0 0
Inc Conif 0 0 0 3,700 0 0 0 0 0 0
Total L3 Decid 0 0 0 113,800 0 126,200 0 43,000 0 12,000
Inc Conif 0 0 0 10,800 0 30,600 0 13,300 0 3,800
Conif (NFPL) 0 139,000 0 15,000 0 124,000 0 150,000 0 52,865
Appendix 1 Table 1,
Alberta-Pacific and Northland Harvest (FMU L8) (Values in cubic meters)
Planning Wood 2017-18 2017-18 2018-19 2018-19 2019-20 2019-20 2020-21 2020-21 2021-22 2021-22
Unit FMU Type N F N F N F N F N F
070144 L8 Decid 62,300 0 0 0 0 0 0 0 0 0 Inc Conif 2,000 0 0 0 0 0 0 0 0 0
071144 L8 Decid 0 0 0 0 0 0 0 0 70,000 75,000 Inc Conif 0 0 0 0 0 0 0 0 14,000 15,000
072144 L8 Decid 0 0 0 0 0 0 55,000 0 0 25,000 Inc Conif 0 0 0 0 0 0 11,000 0 0 5,000
072154 L8 Decid 59,004 0 0 0 0 0 0 0 0 0 Inc Conif 3,475 0 0 0 0 0 0 0 0 0
Conif (NFPL) 0 0 0 0 0 0 0 0 0 23,885
Total L8 Decid 121,304 0 0 0 0 0 55,000 0 70,000 100,000
Inc Conif 5,475 0 0 0 0 0 11,000 0 14,000 20,000
Conif (NFPL) 0 0 0 0 0 0 0 0 0 23,885
25
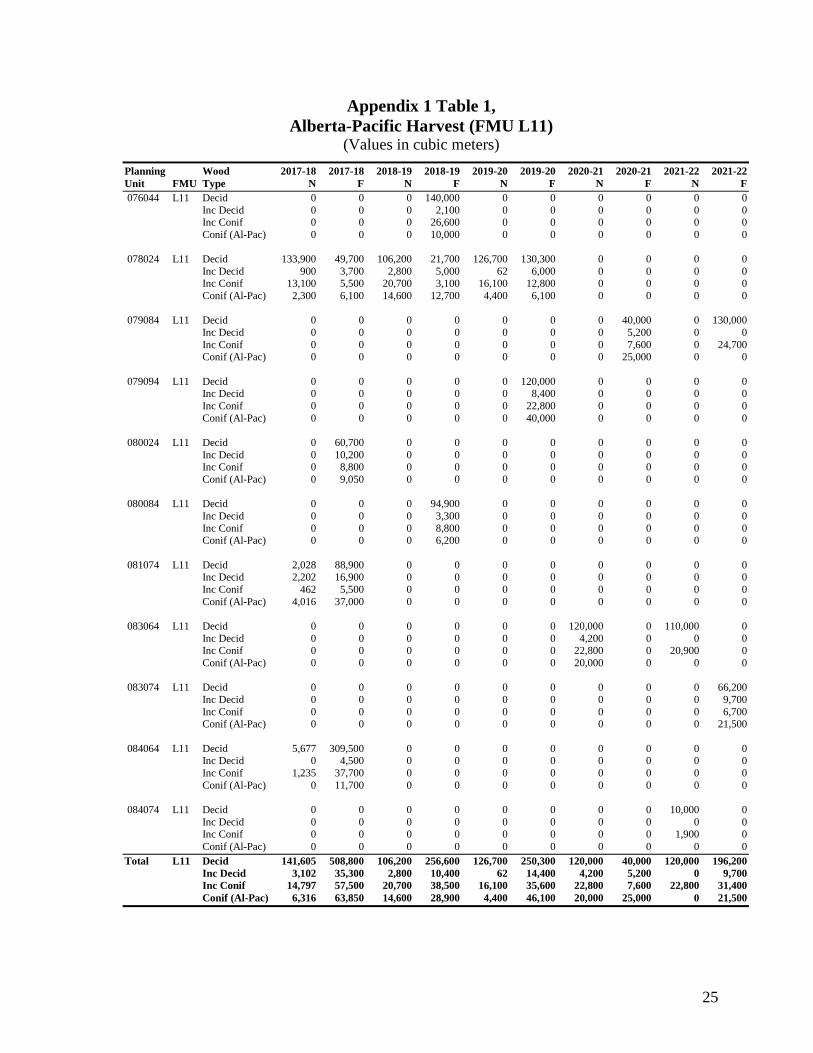
Appendix 1 Table 1,
Alberta-Pacific Harvest (FMU L11) (Values in cubic meters)
Planning Wood 2017-18 2017-18 2018-19 2018-19 2019-20 2019-20 2020-21 2020-21 2021-22 2021-22
Unit FMU Type N F N F N F N F N F
076044 L11 Decid 0 0 0 140,000 0 0 0 0 0 0
Inc Decid 0 0 0 2,100 0 0 0 0 0 0 Inc Conif 0 0 0 26,600 0 0 0 0 0 0
Conif (Al-Pac) 0 0 0 10,000 0 0 0 0 0 0
078024 L11 Decid 133,900 49,700 106,200 21,700 126,700 130,300 0 0 0 0
Inc Decid 900 3,700 2,800 5,000 62 6,000 0 0 0 0 Inc Conif 13,100 5,500 20,700 3,100 16,100 12,800 0 0 0 0
Conif (Al-Pac) 2,300 6,100 14,600 12,700 4,400 6,100 0 0 0 0
079084 L11 Decid 0 0 0 0 0 0 0 40,000 0 130,000
Inc Decid 0 0 0 0 0 0 0 5,200 0 0
Inc Conif 0 0 0 0 0 0 0 7,600 0 24,700 Conif (Al-Pac) 0 0 0 0 0 0 0 25,000 0 0
079094 L11 Decid 0 0 0 0 0 120,000 0 0 0 0 Inc Decid 0 0 0 0 0 8,400 0 0 0 0
Inc Conif 0 0 0 0 0 22,800 0 0 0 0
Conif (Al-Pac) 0 0 0 0 0 40,000 0 0 0 0
080024 L11 Decid 0 60,700 0 0 0 0 0 0 0 0
Inc Decid 0 10,200 0 0 0 0 0 0 0 0 Inc Conif 0 8,800 0 0 0 0 0 0 0 0
Conif (Al-Pac) 0 9,050 0 0 0 0 0 0 0 0
080084 L11 Decid 0 0 0 94,900 0 0 0 0 0 0
Inc Decid 0 0 0 3,300 0 0 0 0 0 0
Inc Conif 0 0 0 8,800 0 0 0 0 0 0 Conif (Al-Pac) 0 0 0 6,200 0 0 0 0 0 0
081074 L11 Decid 2,028 88,900 0 0 0 0 0 0 0 0
Inc Decid 2,202 16,900 0 0 0 0 0 0 0 0
Inc Conif 462 5,500 0 0 0 0 0 0 0 0
Conif (Al-Pac) 4,016 37,000 0 0 0 0 0 0 0 0
083064 L11 Decid 0 0 0 0 0 0 120,000 0 110,000 0
Inc Decid 0 0 0 0 0 0 4,200 0 0 0 Inc Conif 0 0 0 0 0 0 22,800 0 20,900 0
Conif (Al-Pac) 0 0 0 0 0 0 20,000 0 0 0
083074 L11 Decid 0 0 0 0 0 0 0 0 0 66,200
Inc Decid 0 0 0 0 0 0 0 0 0 9,700
Inc Conif 0 0 0 0 0 0 0 0 0 6,700 Conif (Al-Pac) 0 0 0 0 0 0 0 0 0 21,500
084064 L11 Decid 5,677 309,500 0 0 0 0 0 0 0 0 Inc Decid 0 4,500 0 0 0 0 0 0 0 0
Inc Conif 1,235 37,700 0 0 0 0 0 0 0 0
Conif (Al-Pac) 0 11,700 0 0 0 0 0 0 0 0
084074 L11 Decid 0 0 0 0 0 0 0 0 10,000 0
Inc Decid 0 0 0 0 0 0 0 0 0 0 Inc Conif 0 0 0 0 0 0 0 0 1,900 0
Conif (Al-Pac) 0 0 0 0 0 0 0 0 0 0
Total L11 Decid 141,605 508,800 106,200 256,600 126,700 250,300 120,000 40,000 120,000 196,200
Inc Decid 3,102 35,300 2,800 10,400 62 14,400 4,200 5,200 0 9,700
Inc Conif 14,797 57,500 20,700 38,500 16,100 35,600 22,800 7,600 22,800 31,400
Conif (Al-Pac) 6,316 63,850 14,600 28,900 4,400 46,100 20,000 25,000 0 21,500

26
Appendix 1 Table 1,
Alberta-Pacific Harvest (FMU S11) (Values in cubic meters)
Planning Wood 2017-18 2017-18 2018-19 2018-19 2019-20 2019-20 2020-21 2020-21 2021-22 2021-22
Unit FMU Type N F N F N F N F N F
084035 S11 Decid 120,045 35,000 86,600 0 0 0 0 0 0 0
Inc Conif 4,019 3,000 3,500 0 0 0 0 0 0 0
085015 S11 Decid 0 16,100 0 0 0 0 0 0 0 0
Inc Conif 0 1,400 0 0 0 0 0 0 0 0
085045 S11 Decid 0 0 25,000 75,000 0 75,000 0 55,000 0 0 Inc Conif 0 0 6,000 18,000 0 18,000 0 13,200 0 0
085055 S11 Decid 0 0 39,000 35,000 111,000 0 0 25,000 0 0 Inc Conif 0 0 9,400 8,500 26,600 0 0 5,900 0 0
086045 S11 Decid 0 0 0 0 99,000 0 210,000 0 46,000 85,000 Inc Conif 0 0 0 0 23,800 0 50,400 0 11,000 20,400
087055 S11 Decid 0 0 0 0 0 0 0 0 164,000 0
Inc Conif 0 0 0 0 0 0 0 0 39,000 0
Total S11 Decid 120,045 51,100 150,600 110,000 210,000 75,000 210,000 80,000 210,000 85,000
Inc Conif 4,019 4,400 18,900 26,500 50,400 18,000 50,400 19,100 50,000 20,400
Appendix 1 Table 1,
Alberta-Pacific Harvest (FMU S14) (Values in cubic meters)
Planning Wood 2017-18 2017-18 2018-19 2018-19 2019-20 2019-20 2020-21 2020-21 2021-22 2021-22
Unit FMU Type N F N F N F N F N F
Total S14 Decid 0 0 0 0 0 0 0 0 0 0
Inc Conif 0 0 0 0 0 0 0 0 0 0
Appendix 1 Table 1,
Alberta-Pacific Harvest (FMU S18) (Values in cubic meters)
Planning Wood 2017-18 2017-18 2018-19 2018-19 2019-20 2019-20 2020-21 2020-21 2021-22 2021-22
Unit FMU Type N F N F N F N F N F
078244 S18 Decid 0 0 0 0 0 0 0 90,000 35,000 95,000 Inc Conif 0 0 0 0 0 0 0 23,400 9,100 24,700
080075 S18 Decid 0 0 0 0 100,000 135,000 0 0 0 0 Inc Conif 0 0 0 0 26,000 35,100 0 0 0 0
081045 S18 Decid 0 0 0 0 0 135,000 0 90,000 0 0 Inc Conif 0 0 0 0 0 35,100 0 23,400 0 0
081055 S18 Decid 100,000 74,300 50,000 60,000 0 0 0 0 0 0 Inc Conif 21,100 5,700 13,000 15,600 0 0 0 0 0 0
082055 S18 Decid 0 0 0 0 0 0 120,000 60,000 90,000 0
Inc Conif 0 0 0 0 0 0 31,200 15,600 23,400 0
Total S18 Decid 100,000 74,300 50,000 60,000 100,000 270,000 120,000 240,000 125,000 95,000
Inc Conif 21,100 5,700 13,000 15,600 26,000 70,200 31,200 62,400 32,500 24,700

27
Appendix 1 Table 1,
Alberta-Pacific Harvest (FMU S22) (Values in cubic meters)
Planning Wood 2017-18 2017-18 2018-19 2018-19 2019-20 2019-20 2020-21 2020-21 2021-22 2021-22
Unit FMU Type N F N F N F N F N F
083224 S22 Decid 0 0 0 0 0 0 0 0 0 0
Inc Decid 0 27,500 0 0 0 0 0 0 0 0 Inc Conif 0 0 0 0 0 0 0 0 0 0
Conif (Al-Pac) 0 76,800 0 0 0 0 0 0 0 0
086234 S22 Decid 75,200 3,700 0 0 0 0 0 0 0 0
Inc Decid 0 0 0 0 0 0 0 0 0 0 Inc Conif 16,100 300 0 0 0 0 0 0 0 0
Conif (Al-Pac) 0 0 0 0 0 0 0 0 0 0
087244 S22 Decid 0 100,000 0 100,000 0 0 0 0 0 0
Inc Decid 0 3,900 0 0 0 0 0 0 0 0
Inc Conif 0 25,000 0 25,000 0 0 0 0 0 0 Conif (Al-Pac) 0 17,000 0 0 0 0 0 0 0 0
089224 S22 Decid 0 0 0 0 0 0 0 115,000 30,000 130,000 Inc Decid 0 0 0 0 0 0 0 0 0 2,300
Inc Conif 0 0 0 0 0 0 0 28,800 7,500 32,500
Conif (Al-Pac) 0 0 0 0 0 0 0 0 0 10,000
090204 S22 Decid 0 0 0 0 0 0 0 0 0 0
Inc Decid 0 15,700 0 0 0 0 0 0 0 0 Inc Conif 0 0 0 0 0 0 0 0 0 0
Conif (Al-Pac) 0 23,900 0 0 0 0 0 0 0 0
092234 S22 Decid 0 0 92,400 9,100 48,800 4,800 45,400 2,600 0 0
Inc Decid 0 0 800 0 0 0 0 0 0 0
Inc Conif 0 0 10,400 700 800 400 4,800 1,100 0 0 Conif (Al-Pac) 0 0 3,200 400 1,300 100 0 0 0 0
093224 S22 Decid 0 0 0 0 0 0 0 0 0 10,000
Inc Decid 0 0 0 0 0 0 0 0 0 0
Inc Conif 0 0 0 0 0 0 0 0 0 2,500
Conif (Al-Pac) 0 0 0 0 0 0 0 0 0 0
Total S22 Decid 75,200 103,700 92,400 109,100 48,800 4,800 45,400 117,600 30,000 140,000
Inc Decid 0 47,100 800 0 0 0 0 0 0 2,300
Inc Conif 16,100 25,300 10,400 25,700 800 400 4,800 29,900 7,500 35,000
Conif (Al-Pac) 0 117,700 3,200 400 1,300 100 0 0 0 10,000

28
Appendix 1 Table 1,
Alberta-Pacific Harvest (FMU S23) (Values in cubic meters)
Planning Wood 2016-17 2016-17 2017-18 2017-18 2018-19 2018-19 2019-20 2019-20 2020-21 2020-21
Unit FMU Type N F N F N F N F N F
067254 S23 Decid 0 30,000 0 40,000 0 35,000 0 30,000 0 0
Inc Conif 0 5,700 0 7,600 0 6,700 0 5,700 0 0
068254 S23 Decid 8,727 29,500 0 0 0 0 0 0 0 0
Inc Conif 1,105 4,400 0 0 0 0 0 0 0 0
068264 S23 Decid 0 0 0 0 0 0 0 0 63,300 20,000 Inc Conif 0 0 0 0 0 0 0 0 4,000 3,800
070254 S23 Decid 0 0 0 0 0 0 0 0 0 5,000 Inc Conif 0 0 0 0 0 0 0 0 0 950
072254 S23 Decid 51,600 0 46,200 0 57,500 0 53,200 0 0 0
Inc Conif 2,010 0 1,800 0 2,300 0 2,000 0 0 0
Total S23 Decid 60,327 59,500 46,200 40,000 57,500 35,000 53,200 30,000 63,300 25,000
Inc Conif 3,115 10,100 1,800 7,600 2,300 6,700 2,000 5,700 4,000 4,750
Grand Total Decid 928,187 974,300 653,000 936,300 643,000 994,800 653,600 990,600 698,300 924,200
Inc Decid 3,102 82,400 3,600 28,000 62 14,400 4,200 7,600 0 12,000
Inc Conif 84,664 138,900 97,100 152,800 114,500 197,400 132,000 228,300 146,000 207,050
Conif (Al-Pac) 6,316 181,550 17,800 90,000 5,700 46,200 20,000 35,000 0 31,500
Conif (NFPL) 0 406,108 0 409,875 0 409,000 0 396,750 0 412,356

29
Appendix 2
Periodic Cut Control Details


31
Appendix 2 Table 1,
Alberta-Pacific Quadrant 2016-2021 FMU Cut Control
From May 1, 2016 to April 30, 2021
(Volumes in cubic meters)
FMU Species 2016-17 2017-18 2018-19 2019-20 2020-21 Quad 5 Total
Adjust.
A14 Decid AAC 126,923 126,923 126,923 126,923 126,923 -48,454 586,161
Scheduled 0 114,000 130,900 0 50,000 294,900 Actual (1) 165,000 0 0 0 0 165,000
% of AAC 130% 90% 103% 0% 39% 78%
Inc Conif AAC 34,309 34,309 34,309 34,309 34,309 171,545
Scheduled 0 11,300 13,300 0 13,500 38,100
Actual (1) 24,000 0 0 0 0 24,000 % of AAC 70% 33% 39% 0% 39% 36%
Conif AAC 53,096 53,096 53,096 53,096 53,096 265,480
Scheduled 0 0 0 0 0 0
Actual (1) 0 0 0 0 0 0 % of AAC 0% 0% 0% 0% 0% 0%
Inc Decid AAC 37,664 37,664 37,664 37,664 37,664 188,320 Scheduled 0 28,000 50,600 1,000 20,000 99,600
Actual (1) 27,000 0 0 0 0 27,000
% of AAC 72% 74% 134% 3% 53% 67%
A15 Decid AAC 119,032 119,032 119,032 119,032 119,032 595,160
(Non-SMA) Scheduled 0 0 0 0 40,000 40,000 Actual (1) 0 0 0 0 0 0
% of AAC 0% 0% 0% 0% 34% 7%
Inc Conif AAC 46,848 46,848 46,848 46,848 46,848 234,240
Scheduled 0 0 0 0 15,600 15,600
Actual (1) 0 0 0 0 0 0
% of AAC 0% 0% 0% 0% 33% 7%
Conif AAC 43,399 43,399 43,399 43,399 43,399 216,995 Scheduled 0 0 0 0 0 0
Actual (1) 0 0 0 0 0 0
% of AAC 0% 0% 0% 0% 0% 0%
Inc Decid AAC 125,726 125,726 125,726 125,726 125,726 628,630
Scheduled 0 3,000 23,500 50,100 8,200 84,800 Actual (1) 0 0 0 0 0 0
% of AAC 0% 2% 19% 40% 7% 13%

32
Appendix 2 Table 1,
Alberta-Pacific Quadrant 2016-2021 FMU Cut Control
From May 1, 2016 to April 30, 2021
(Volumes in cubic meters)
FMU Species 2016-17 2017-18 2018-19 2019-20 2020-21 Quad 5 Total
Adjust.
A15 Decid AAC 355,000 355,000 355,000 355,000 355,000 1,775,000
(SMA) Scheduled 0 0 50,000 50,000 10,000 110,000 Actual (1) 0 0 0 0 0 0
% of AAC 0% 0% 14% 14% 3% 6%
Inc Conif AAC 95,106 95,106 95,106 95,106 95,106 475,530
Scheduled 0 0 5,000 5,000 1,400 11,400
Actual (1) 0 0 0 0 0 0 % of AAC 0% 0% 5% 5% 1% 2%
Conif AAC 88,492 88,492 88,492 88,492 88,492 442,460
Scheduled 0 0 0 0 10,000 10,000
Actual (1) 0 0 0 0 0 0 % of AAC 0% 0% 0% 0% 11% 2%
Inc Decid AAC 121,588 121,588 121,588 121,588 121,588 607,940 Scheduled 0 18,500 37,500 34,500 47,400 137,900
Actual (1) 6,000 0 0 0 0 6,000
% of AAC 5% 15% 31% 28% 39% 24%
L1 Decid AAC 166,677 166,677 166,677 166,677 166,677 8,096 841,481
Scheduled 0 94,798 185,000 195,000 305,000 779,798 Actual (1) 60,000 0 0 0 0 60,000
% of AAC 36% 57% 111% 117% 183% 100%
Inc Conif AAC 30,053 30,053 30,053 30,053 30,053 150,265
Scheduled 0 4,834 33,300 35,100 54,900 128,134
Actual (1) 5,500 0 0 0 0 5,500
% of AAC 18% 16% 111% 117% 183% 89%
Inc Decid AAC 10,436 10,436 10,436 10,436 10,436 52,180 Scheduled 0 2,000 3,000 3,000 3,000 11,000
Actual (1) 0 0 0 0 0 0
% of AAC 0% 19% 29% 29% 29% 21%
L2 Decid AAC 112,563 112,563 112,563 112,563 112,563 6,216 569,031
Scheduled 0 185,008 88,500 88,500 85,000 447,008 Actual (1) 115,000 0 0 0 0 115,000
% of AAC 102% 164% 79% 79% 76% 99%
Inc Conif AAC 24,773 24,773 24,773 24,773 24,773 123,865
Scheduled 0 14,248 8,800 14,700 14,700 52,448
Actual (1) 10,000 0 0 0 0 10,000 % of AAC 40% 58% 36% 59% 59% 50%
Inc Decid AAC 31,965 31,965 31,965 31,965 31,965 159,825 Scheduled 0 30,500 30,500 30,500 30,500 122,000
Actual (1) 11,500 0 0 0 0 11,500
% of AAC 36% 95% 95% 95% 95% 84%

33
Appendix 2 Table 1,
Alberta-Pacific Quadrant 2016-2021 FMU Cut Control
From May 1, 2016 to April 30, 2021
(Volumes in cubic meters)
FMU Species 2016-17 2017-18 2018-19 2019-20 2020-21 Quad 5 Total
Adjust.
L3 Decid AAC 63,364 63,364 63,364 63,364 63,364 -29,351 287,469
Scheduled 0 0 113,800 126,200 43,000 283,000 Actual (1) 0 0 0 0 0 0
% of AAC 0% 0% 180% 199% 68% 98%
Inc Conif AAC 19,939 19,939 19,939 19,939 19,939 99,695
Scheduled 0 0 10,800 30,600 13,300 54,700
Actual (1) 0 0 0 0 0 0 % of AAC 0% 0% 54% 153% 67% 55%
Inc Decid AAC 34,735 34,735 34,735 34,735 34,735 173,675
Scheduled 0 36,000 4,000 32,000 39,000 111,000
Actual (1) 0 0 0 0 0 0 % of AAC 0% 104% 12% 92% 112% 64%
L8 Decid AAC 54,861 54,861 54,861 54,861 54,861 36,012 310,317 Scheduled 0 121,304 0 0 55,000 176,304
Actual (1) 125,000 0 0 0 0 125,000
% of AAC 228% 221% 0% 0% 100% 97%
Inc Conif AAC 10,940 10,940 10,940 10,940 10,940 54,700
Scheduled 0 5,475 0 0 11,000 16,475 Actual (1) 15,500 0 0 0 0 15,500
% of AAC 142% 50% 0% 0% 101% 58%
Inc Decid AAC 10,890 10,890 10,890 10,890 10,890 54,450
Scheduled 0 8,500 8,500 8,500 8,500 34,000
Actual (1) 0 0 0 0 0 0
% of AAC 0% 78% 78% 78% 78% 62%
L11 Decid AAC 318,995 318,995 318,995 318,995 318,995 -10,775 1,584,200 Scheduled 0 335,228 362,800 377,000 160,000 1,235,028
Actual (1) 250,000 0 0 0 0 250,000
% of AAC 78% 105% 114% 118% 50% 94%
Inc Conif AAC 60,700 60,700 60,700 60,700 60,700 303,500
Scheduled 0 33,362 59,200 51,700 30,400 174,662 Actual (1) 28,500 0 0 0 0 28,500
% of AAC 47% 55% 98% 85% 50% 67%
Conif AAC 107,028 107,028 107,028 107,028 107,028 535,140
Scheduled 0 58,466 50,500 50,500 45,000 204,466
Actual (1) 500 0 0 0 0 500 % of AAC 0% 55% 47% 47% 42% 38%
Inc Decid AAC 26,279 26,279 26,279 26,279 26,279 131,395 Scheduled 0 33,902 13,200 14,462 9,400 70,964
Actual (1) 0 0 0 0 0 0
% of AAC 0% 129% 50% 55% 36% 54%

34
Appendix 2 Table 1,
Alberta-Pacific Quadrant 2016-2021 FMU Cut Control
From May 1, 2016 to April 30, 2021
(Volumes in cubic meters)
FMU Species 2016-17 2017-18 2018-19 2019-20 2020-21 Quad 5 Total
Adjust.
S11 Decid AAC 142,029 142,029 142,029 142,029 142,029 517,562 1,227,707
Scheduled 0 171,145 260,600 285,000 290,000 1,006,745 Actual (1) 120,000 0 0 0 0 120,000
% of AAC 84% 121% 183% 201% 204% 92%
Inc Conif AAC 33,675 33,675 33,675 33,675 33,675 168,375
Scheduled 0 8,419 45,400 68,400 69,500 191,719
Actual (1) 8,500 0 0 0 0 8,500 % of AAC 25% 25% 135% 203% 206% 119%
Inc Decid AAC 33,658 33,658 33,658 33,658 33,658 168,290
Scheduled 0 30,000 30,000 30,000 30,000 120,000
Actual (1) 28,000 0 0 0 0 28,000 % of AAC 83% 89% 89% 89% 89% 88%
S14 Decid AAC 136,620 136,620 136,620 136,620 136,620 683,100 Scheduled 0 0 0 0 0 0
Actual (1) 0 0 0 0 0 0
% of AAC 0% 0% 0% 0% 0% 0%
Inc Decid AAC 15,778 15,778 15,778 15,778 15,778 78,890
Scheduled 0 15,500 15,500 15,500 15,500 62,000 Actual (1) 0 0 0 0 0 0
% of AAC 0% 98% 98% 98% 98% 79%
S18 Decid AAC 222,437 222,437 222,437 222,437 222,437 82,886 1,195,071
Scheduled 0 174,300 110,000 370,000 360,000 1,014,300
Actual (1) 180,000 0 0 0 0 180,000
% of AAC 81% 78% 49% 166% 162% 100%
Inc Conif AAC 58,413 58,413 58,413 58,413 58,413 292,065 Scheduled 0 26,800 28,600 96,200 93,600 245,200
Actual (1) 5,000 0 0 0 0 5,000
% of AAC 9% 46% 49% 165% 160% 86%
Inc Decid AAC 57,560 57,560 57,560 57,560 57,560 287,800
Scheduled 0 104,000 43,500 43,500 43,500 234,500 Actual (1) 56,000 0 0 0 0 56,000
% of AAC 97% 181% 76% 76% 76% 101%
S22 Decid AAC 355,681 355,681 355,681 355,681 355,681 1,778,405
Scheduled 0 178,900 201,500 53,600 163,000 597,000
Actual (1) 280,000 0 0 0 0 280,000 % of AAC 79% 50% 57% 15% 46% 49%
Inc Conif AAC 90,240 90,240 90,240 90,240 90,240 451,200 Scheduled 0 41,400 36,100 1,200 34,700 113,400
Actual (1) 65,000 0 0 0 0 65,000
% of AAC 72% 46% 40% 1% 38% 40%
Conif AAC 22,649 22,649 22,649 22,649 22,649 113,245
Scheduled 0 117,700 1,400 1,400 0 120,500 Actual (1) 3,000 0 0 0 0 3,000
% of AAC 13% 520% 6% 6% 0% 109%
Inc Decid AAC 19,904 19,904 19,904 19,904 19,904 99,520
Scheduled 0 56,100 9,800 9,000 9,000 83,900
Actual (1) 0 0 0 0 0 0
% of AAC 0% 282% 49% 45% 45% 84%

35
Appendix 2 Table 1,
Alberta-Pacific Quadrant 2016-2021 FMU Cut Control
From May 1, 2016 to April 30, 2021
(Volumes in cubic meters)
FMU Species 2016-17 2017-18 2018-19 2019-20 2020-21 Quad 5 Total
Adjust.
S23 Decid AAC 89,029 89,029 89,029 89,029 89,029 17,351 462,496
Scheduled 0 119,827 86,200 92,500 83,200 381,727 Actual (1) 80,000 0 0 0 0 80,000
% of AAC 90% 135% 97% 104% 93% 100%
Inc Conif AAC 17,101 17,101 17,101 17,101 17,101 85,505
Scheduled 0 13,215 9,400 9,000 7,700 39,315
Actual (1) 28,000 0 0 0 0 28,000 % of AAC 164% 77% 55% 53% 45% 79%
Inc Decid AAC 13,711 13,711 13,711 13,711 13,711 68,555
Scheduled 0 9,000 9,000 12,000 12,000 42,000
Actual (1) 50,000 0 0 0 0 50,000 % of AAC 365% 66% 66% 88% 88% 134%
Total Decid AAC 2,263,211 2,263,211 2,263,211 2,263,211 2,263,211 579,543 11,895,598
Scheduled 0 1,494,510 1,589,300 1,637,800 1,644,200 6,365,810
Actual (1) 1,375,000 0 0 0 0 1,375,000
% of AAC 61% 66% 70% 72% 73% 65%
Inc Conif AAC 522,097 522,097 522,097 522,097 522,097 0 2,610,485
Scheduled 0 159,053 249,900 311,900 360,300 1,081,153
Actual (1) 190,000 0 0 0 0 190,000
% of AAC 36% 30% 48% 60% 69% 49%
Conif AAC 314,664 314,664 314,664 314,664 314,664 0 1,573,320
Scheduled 0 176,166 51,900 51,900 55,000 334,966
Actual (1) 3,500 0 0 0 0 3,500
% of AAC 1% 56% 16% 16% 17% 22%
Inc Decid AAC 539,894 539,894 539,894 539,894 539,894 0 2,699,470
Scheduled 0 375,002 278,600 284,062 276,000 1,213,664
Actual (1) 178,500 0 0 0 0 178,500
% of AAC 33% 69% 52% 53% 51% 52%
(1) Actuals for 2016/2017 are estimates based on production and unaudited.

36
Appendix 2 Table 2,
Northland Quadrant 2016-2021 FMU Cut Control
From May 1, 2016 to April 30, 2021
(Volumes in cubic meters)
FMU Species 2016-17 2017-18 2018-19 2019-20 2020-21 Total
A14 Conif AAC 107,457 107,457 107,457 107,457 107,457 537,285
CTQA140005 Scheduled 0 130,000 0 0 86,750 216,750
Actual (1) 85,000 0 0 0 0 85,000 % of AAC 79% 121% 0% 0% 81% 56%
A15 Conif AAC 65,075 65,075 65,075 65,075 65,075 325,375 CTQA150001 Scheduled 0 12,000 135,000 135,000 0 282,000
(Non-SMA) Actual (1) 0 0 0 0 0 0
% of AAC 0% 18% 207% 207% 0% 87%
A15 Conif AAC 139,518 139,518 139,518 139,518 139,518 697,590 CTQA150001 Scheduled 0 75,108 150,000 150,000 160,000 535,108
(SMA) Actual (1) 0 0 0 0 0 0
% of AAC 0% 54% 108% 108% 115% 77%
L1 Conif AAC 33,962 33,962 33,962 33,962 33,962 169,810
CTQL010005 Scheduled 0 0 0 0 0 0 Actual (1) 0 0 0 0 0 0
% of AAC 0% 0% 0% 0% 0% 0%
L3 Conif AAC 4,777 4,777 4,777 4,777 4,777 23,885
CTQL030016 Scheduled 0 139,000 124,000 124,000 150,000 537,000
Actual (1) 0 0 0 0 0 0 % of AAC 0% 102% 91% 91% 110% 79%
L8 Conif AAC 53,096 53,096 53,096 53,096 53,096 265,480 CTQL080003 Scheduled 0 0 0 0 0 0
Actual (1) 0 0 0 0 0 0
% of AAC 0% 0% 0% 0% 0% 0%
Total Conif AAC 827,940 827,940 827,940 827,940 827,940 4,139,700
Scheduled 0 441,608 507,000 512,100 494,450 1,955,158
Actual (1) 85,000 0 0 0 0 85,000
% of AAC 10% 53% 61% 62% 60% 49%
(1) Actuals for 2016/2017 are estimates based on production and unaudited.

37
Appendix 2 Table 3,
Quadrant 2016-2021 Local Timber Use Cut Control
From May 1, 2016 to April 30, 2021
(Volumes in cubic meters)
FMU
Primary Decid
QAC (m3) Local Use
Decid (m3) % Used for
Local Use
A14 634,615 0 0%
A15 (Non-SMA) 595,160 0 0%
A15 (SMA) 1,775,000 0 0%
L01 833,385 0 0%
L02 562,815 0 0%
L03 316,820 0 0%
L08 274,305 0 0%
L11 1,594,975 0 0%
S11 710,145 0 0%
S14 683,100 0 0%
S18 1,112,185 0 0%
S22 1,778,405 0 0%
S23 445,145 0 0%


39
Appendix 3
Operational Variance Summary


41
Appendix 3 Table 1,
Alberta-Pacific Operational Variance Summary (FMU A14)
A14 D Covertype Sw Covertype Sb Covertype Pj Covertype
Allowable FMU Level 5 Year SHS Area (ha) 5,239 1,751 192 1,333
FMU SHS Area (ha) with Planning Units 0 0 0 0
SHS Area (ha) Planned for Harvest in HPs 0 0 0 0
Permanently Deleted SHS Area (ha) in HPs 0 0 0 0
Deferred SHS Area (ha) in HPs 0 0 0 0
Total FMU Variance (1)
0% 0% 0% 0%
Additions (ha) in HPs 0 0 0 0
Bypassed SHS Area (ha) in HPs 0 0 0 0
Total FMU Harvest Area (ha) (2)
0 0 0 0
(1) Total FMU Variance is the Permanently Deleted SHS Area (ha) in HPs and Deferred SHS Area (ha) in HPs expressed as a percentage
of the Allowable FMU Level 5 Year SHS Area.
(2) Total FMU Harvest Area (ha) is the sum of the SHS Area (ha) Planned for Harvest in HPs and Additions (ha) in HPs.
Appendix 3 Table 2,
Alberta-Pacific Operational Variance Summary (FMU L1)
L1 D Covertype Sw Covertype Sb Covertype Pj Covertype
Allowable FMU Level 5 Year SHS Area (ha) 4,394 0 0 0
FMU SHS Area (ha) with Planning Units 0 0 0 0
SHS Area (ha) Planned for Harvest in HPs 0 0 0 0
Permanently Deleted SHS Area (ha) in HPs 0 0 0 0
Deferred SHS Area (ha) in HPs 0 0 0 0
Total FMU Variance (1)
0% 0% 0% 0%
Additions (ha) in HPs 0 0 0 0
Bypassed SHS Area (ha) in HPs 0 0 0 0
Total FMU Harvest Area (ha) (2)
0 0 0 0
(1) Total FMU Variance is the Permanently Deleted SHS Area (ha) in HPs and Deferred SHS Area (ha) in HPs expressed as a percentage
of the Allowable FMU Level 5 Year SHS Area (ha).
(2) Total FMU Harvest Area (ha) is the sum of the SHS Area (ha) Planned for Harvest in HPs and Additions (ha) in HPs.

42
Appendix 3 Table 3,
Alberta-Pacific Operational Variance Summary (FMU L2)
L2 D Covertype Sw Covertype Sb Covertype Pj Covertype
Allowable FMU Level 5 Year SHS Area (ha) 3,507 0 0 0
FMU SHS Area (ha) with Planning Units 605 0 0 0
SHS Area (ha) Planned for Harvest in HPs 57 0 0 0
Permanently Deleted SHS Area (ha) in HPs 23 0 0 0
Deferred SHS Area (ha) in HPs 508 0 0 0
Total FMU Variance (1)
15% 0% 0% 0%
Additions (ha) in HPs 529 0 0 0
Bypassed SHS Area (ha) in HPs 0 0 0 0
Total FMU Harvest Area (ha) (2)
586 0 0 0
(1) Total FMU Variance is the Permanently Deleted SHS Area (ha) in HPs and Deferred SHS Area (ha) in HPs expressed as a percentage
of the Allowable FMU Level 5 Year SHS Area (ha).
(2) Total FMU Harvest Area (ha) is the sum of the SHS Area (ha) Planned for Harvest in HPs and Additions (ha) in HPs.
Planning Unit 072244 D Covertype Sw Covertype Sb Covertype Pj Covertype
Total SHS Area (ha) within Planning Unit 605 0 0 0
SHS Area (ha) Planned for Harvest in HP 57 0 0 0
Permanently Deleted SHS Area (ha) in HP 23 0 0 0
Deferred SHS Area (ha) in HP 508 0 0 0
Planning Unit Variance (1)
88% 0% 0% 0%
Additions (ha) in HP 529 0 0 0
Bypassed SHS Area (ha) in HP 0 0 0 0
Total Planning Unit Harvest Area (ha) (2)
586 0 0 0
(1) Planning Unit Variance is the Permanently Deleted SHS Area (ha) in HP and Deferred SHS Area (ha) in HP expressed as a percentage
of the Total SHS Area (ha) within Planning Unit.
(2) Total Planning Unit Harvest Area (ha) is the sum of the SHS Area (ha) Planned for Harvest in HP and Additions (ha) in HP.

43
Appendix 3 Table 4,
Alberta-Pacific Operational Variance Summary (FMU L3)
L3 D Covertype Sw Covertype Sb Covertype Pj Covertype
Allowable FMU Level 5 Year SHS Area (ha) 1,867 0 0 0
FMU SHS Area (ha) with Planning Units 0 0 0 0
SHS Area (ha) Planned for Harvest in HPs 0 0 0 0
Permanently Deleted SHS Area (ha) in HPs 0 0 0 0
Deferred SHS Area (ha) in HPs 0 0 0 0
Total FMU Variance (1)
0% 0% 0% 0%
Additions (ha) in HPs 0 0 0 0
Bypassed SHS Area (ha) in HPs 0 0 0 0
Total FMU Harvest Area (ha) (2)
0 0 0 0
(1) Total FMU Variance is the Permanently Deleted SHS Area (ha) in HPs and Deferred SHS Area (ha) in HPs expressed as a percentage
of the Allowable FMU Level 5 Year SHS Area (ha).
(2) Total FMU Harvest Area (ha) is the sum of the SHS Area (ha) Planned for Harvest in HPs and Additions (ha) in HPs.
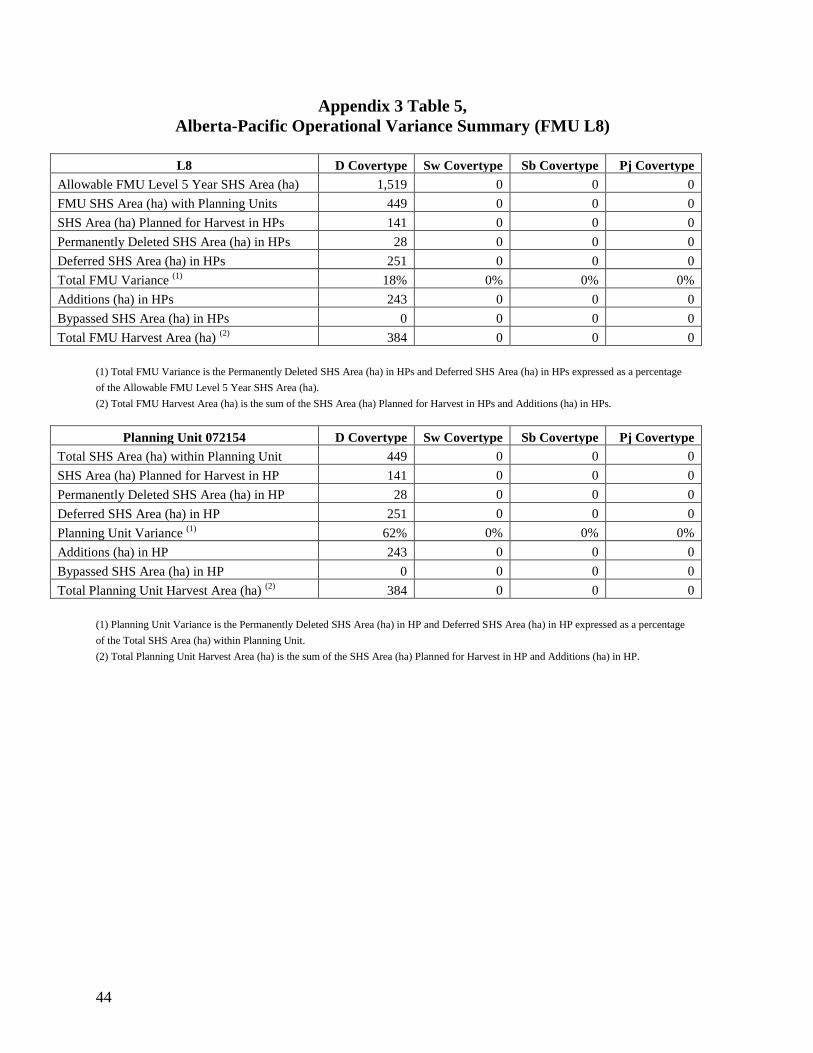
44
Appendix 3 Table 5,
Alberta-Pacific Operational Variance Summary (FMU L8)
L8 D Covertype Sw Covertype Sb Covertype Pj Covertype
Allowable FMU Level 5 Year SHS Area (ha) 1,519 0 0 0
FMU SHS Area (ha) with Planning Units 449 0 0 0
SHS Area (ha) Planned for Harvest in HPs 141 0 0 0
Permanently Deleted SHS Area (ha) in HPs 28 0 0 0
Deferred SHS Area (ha) in HPs 251 0 0 0
Total FMU Variance (1)
18% 0% 0% 0%
Additions (ha) in HPs 243 0 0 0
Bypassed SHS Area (ha) in HPs 0 0 0 0
Total FMU Harvest Area (ha) (2)
384 0 0 0
(1) Total FMU Variance is the Permanently Deleted SHS Area (ha) in HPs and Deferred SHS Area (ha) in HPs expressed as a percentage
of the Allowable FMU Level 5 Year SHS Area (ha).
(2) Total FMU Harvest Area (ha) is the sum of the SHS Area (ha) Planned for Harvest in HPs and Additions (ha) in HPs.
Planning Unit 072154 D Covertype Sw Covertype Sb Covertype Pj Covertype
Total SHS Area (ha) within Planning Unit 449 0 0 0
SHS Area (ha) Planned for Harvest in HP 141 0 0 0
Permanently Deleted SHS Area (ha) in HP 28 0 0 0
Deferred SHS Area (ha) in HP 251 0 0 0
Planning Unit Variance (1)
62% 0% 0% 0%
Additions (ha) in HP 243 0 0 0
Bypassed SHS Area (ha) in HP 0 0 0 0
Total Planning Unit Harvest Area (ha) (2)
384 0 0 0
(1) Planning Unit Variance is the Permanently Deleted SHS Area (ha) in HP and Deferred SHS Area (ha) in HP expressed as a percentage
of the Total SHS Area (ha) within Planning Unit.
(2) Total Planning Unit Harvest Area (ha) is the sum of the SHS Area (ha) Planned for Harvest in HP and Additions (ha) in HP.

45
Appendix 3 Table 6,
Alberta-Pacific Operational Variance Summary (FMU L11)
L11 D Covertype Sw Covertype Sb Covertype Pj Covertype
Allowable FMU Level 5 Year SHS Area (ha) 9,226 1,160 635 3,498
FMU SHS Area (ha) with Planning Units 1,980 197 25 1,005
SHS Area (ha) Planned for Harvest in HPs 1,076 95 4 454
Permanently Deleted SHS Area (ha) in HPs 276 74 17 467
Deferred SHS Area (ha) in HPs 476 0 0 0
Total FMU Variance (1)
8% 6% 3% 13%
Additions (ha) in HPs 752 22 0 45
Bypassed SHS Area (ha) in HPs 0 0 0 0
Total FMU Harvest Area (ha) (2)
1,829 118 4 499
(1) Total FMU Variance is the Permanently Deleted SHS Area (ha) in HPs and Deferred SHS Area (ha) in HPs expressed as a percentage
of the Allowable FMU Level 5 Year SHS Area (ha).
(2) Total FMU Harvest Area (ha) is the sum of the SHS Area (ha) Planned for Harvest in HPs and Additions (ha) in HPs.
Planning Unit 081074 D Covertype Sw Covertype Sb Covertype Pj Covertype
Total SHS Area (ha) within Planning Unit 1,980 197 25 1,005
SHS Area (ha) Planned for Harvest in HP 1,076 95 4 454
Permanently Deleted SHS Area (ha) in HP 276 74 17 467
Deferred SHS Area (ha) in HP 476 0 0 0
Planning Unit Variance (1)
38% 37% 67% 47%
Additions (ha) in HP 752 22 0 45
Bypassed SHS Area (ha) in HP 0 0 0 0
Total Planning Unit Harvest Area (ha) (2)
1,829 118 4 499
(1) Planning Unit Variance is the Permanently Deleted SHS Area (ha) in HP and Deferred SHS Area (ha) in HP expressed as a percentage
of the Total SHS Area (ha) within Planning Unit.
(2) Total Planning Unit Harvest Area (ha) is the sum of the SHS Area (ha) Planned for Harvest in HP and Additions (ha) in HP.

46
Appendix 3 Table 7,
Alberta-Pacific Operational Variance Summary (FMU S11)
S11 D Covertype Sw Covertype Sb Covertype Pj Covertype
Allowable FMU Level 5 Year SHS Area (ha) 4,450 0 0 0
FMU SHS Area (ha) with Planning Units 0 0 0 0
SHS Area (ha) Planned for Harvest in HPs 0 0 0 0
Permanently Deleted SHS Area (ha) in HPs 0 0 0 0
Deferred SHS Area (ha) in HPs 0 0 0 0
Total FMU Variance (1)
0% 0% 0% 0%
Additions (ha) in HPs 0 0 0 0
Bypassed SHS Area (ha) in HPs 0 0 0 0
Total FMU Harvest Area (ha) (2)
0 0 0 0
(1) Total FMU Variance is the Permanently Deleted SHS Area (ha) in HPs and Deferred SHS Area (ha) in HPs expressed as a percentage
of the Allowable FMU Level 5 Year SHS Area (ha).
(2) Total FMU Harvest Area (ha) is the sum of the SHS Area (ha) Planned for Harvest in HPs and Additions (ha) in HPs.
Appendix 3 Table 8,
Alberta-Pacific Operational Variance Summary (FMU S14)
S14 D Covertype Sw Covertype Sb Covertype Pj Covertype
Allowable FMU Level 5 Year SHS Area (ha) 0 0 0 0
FMU SHS Area (ha) with Planning Units 0 0 0 0
SHS Area (ha) Planned for Harvest in HPs 0 0 0 0
Permanently Deleted SHS Area (ha) in HPs 0 0 0 0
Deferred SHS Area (ha) in HPs 0 0 0 0
Total FMU Variance (1)
0% 0% 0% 0%
Additions (ha) in HPs 0 0 0 0
Bypassed SHS Area (ha) in HPs 0 0 0 0
Total FMU Harvest Area (ha) (2)
0 0 0 0
(1) Total FMU Variance is the Permanently Deleted SHS Area (ha) in HPs and Deferred SHS Area (ha) in HPs expressed as a percentage
of the Allowable FMU Level 5 Year SHS Area (ha).
(2) Total FMU Harvest Area (ha) is the sum of the SHS Area (ha) Planned for Harvest in HPs and Additions (ha) in HPs.

47
Appendix 3 Table 9,
Alberta-Pacific Operational Variance Summary (FMU S18)
S18 D Covertype Sw Covertype Sb Covertype Pj Covertype
Allowable FMU Level 5 Year SHS Area (ha) 6,736 0 0 0
FMU SHS Area (ha) with Planning Units 0 0 0 0
SHS Area (ha) Planned for Harvest in HPs 0 0 0 0
Permanently Deleted SHS Area (ha) in HPs 0 0 0 0
Deferred SHS Area (ha) in HPs 0 0 0 0
Total FMU Variance (1)
0% 0% 0% 0%
Additions (ha) in HPs 0 0 0 0
Bypassed SHS Area (ha) in HPs 0 0 0 0
Total FMU Harvest Area (ha) (2)
0 0 0 0
(1) Total FMU Variance is the Permanently Deleted SHS Area (ha) in HPs and Deferred SHS Area (ha) in HPs expressed as a percentage
of the Allowable FMU Level 5 Year SHS Area (ha).
(2) Total FMU Harvest Area (ha) is the sum of the SHS Area (ha) Planned for Harvest in HPs and Additions (ha) in HPs.
Appendix 3 Table 10,
Alberta-Pacific Operational Variance Summary (FMU S22)
S22 D Covertype Sw Covertype Sb Covertype Pj Covertype
Allowable FMU Level 5 Year SHS Area (ha) 10,553 496 21 391
FMU SHS Area (ha) with Planning Units 0 0 0 0
SHS Area (ha) Planned for Harvest in HPs 0 0 0 0
Permanently Deleted SHS Area (ha) in HPs 0 0 0 0
Deferred SHS Area (ha) in HPs 0 0 0 0
Total FMU Variance (1)
0% 0% 0% 0%
Additions (ha) in HPs 0 0 0 0
Bypassed SHS Area (ha) in HPs 0 0 0 0
Total FMU Harvest Area (ha) (2)
0 0 0 0
(1) Total FMU Variance is the Permanently Deleted SHS Area (ha) in HPs and Deferred SHS Area (ha) in HPs expressed as a percentage
of the Allowable FMU Level 5 Year SHS Area (ha).
(2) Total FMU Harvest Area (ha) is the sum of the SHS Area (ha) Planned for Harvest in HPs and Additions (ha) in HPs.

48
Appendix 3 Table 11,
Alberta-Pacific Operational Variance Summary (FMU S23)
S23 D Covertype Sw Covertype Sb Covertype Pj Covertype
Allowable FMU Level 5 Year SHS Area (ha) 2,375 0 0 0
FMU SHS Area (ha) with Planning Units 987 0 0 0
SHS Area (ha) Planned for Harvest in HPs 0 0 0 0
Permanently Deleted SHS Area (ha) in HPs 108 0 0 0
Deferred SHS Area (ha) in HPs 882 0 0 0
Total FMU Variance (1)
100% 0% 0% 0%
Additions (ha) in HPs 987 0 0 0
Bypassed SHS Area (ha) in HPs 0 0 0 0
Total FMU Harvest Area (ha) (2)
987 0 0 0
(1) Total FMU Variance is the Permanently Deleted SHS Area (ha) in HPs and Deferred SHS Area (ha) in HPs expressed as a percentage
of the Allowable FMU Level 5 Year SHS Area (ha).
(2) Total FMU Harvest Area (ha) is the sum of the SHS Area (ha) Planned for Harvest in HPs and Additions (ha) in HPs.
Planning Unit 072254 D Covertype Sw Covertype Sb Covertype Pj Covertype
Total SHS Area (ha) within Planning Unit 987 0 0 0
SHS Area (ha) Planned for Harvest in HP 0 0 0 0
Permanently Deleted SHS Area (ha) in HP 108 0 0 0
Deferred SHS Area (ha) in HP 882 0 0 0
Planning Unit Variance (1)
100% 0% 0% 0%
Additions (ha) in HP 987 0 0 0
Bypassed SHS Area (ha) in HP 0 0 0 0
Total Planning Unit Harvest Area (ha) (2)
987 0 0 0
(1) Planning Unit Variance is the Permanently Deleted SHS Area (ha) in HP and Deferred SHS Area (ha) in HP expressed as a percentage
of the Total SHS Area (ha) within Planning Unit.
(2) Total Planning Unit Harvest Area (ha) is the sum of the SHS Area (ha) Planned for Harvest in HP and Additions (ha) in HP.
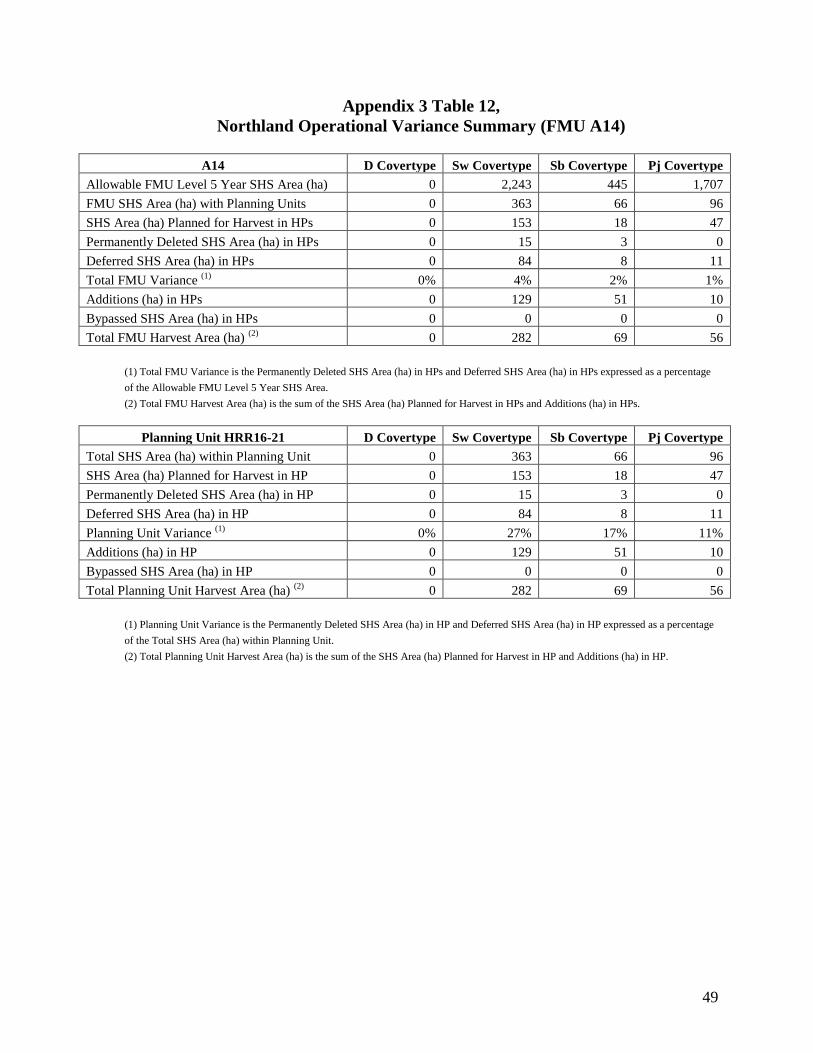
49
Appendix 3 Table 12,
Northland Operational Variance Summary (FMU A14)
A14 D Covertype Sw Covertype Sb Covertype Pj Covertype
Allowable FMU Level 5 Year SHS Area (ha) 0 2,243 445 1,707
FMU SHS Area (ha) with Planning Units 0 363 66 96
SHS Area (ha) Planned for Harvest in HPs 0 153 18 47
Permanently Deleted SHS Area (ha) in HPs 0 15 3 0
Deferred SHS Area (ha) in HPs 0 84 8 11
Total FMU Variance (1)
0% 4% 2% 1%
Additions (ha) in HPs 0 129 51 10
Bypassed SHS Area (ha) in HPs 0 0 0 0
Total FMU Harvest Area (ha) (2)
0 282 69 56
(1) Total FMU Variance is the Permanently Deleted SHS Area (ha) in HPs and Deferred SHS Area (ha) in HPs expressed as a percentage
of the Allowable FMU Level 5 Year SHS Area.
(2) Total FMU Harvest Area (ha) is the sum of the SHS Area (ha) Planned for Harvest in HPs and Additions (ha) in HPs.
Planning Unit HRR16-21 D Covertype Sw Covertype Sb Covertype Pj Covertype
Total SHS Area (ha) within Planning Unit 0 363 66 96
SHS Area (ha) Planned for Harvest in HP 0 153 18 47
Permanently Deleted SHS Area (ha) in HP 0 15 3 0
Deferred SHS Area (ha) in HP 0 84 8 11
Planning Unit Variance (1)
0% 27% 17% 11%
Additions (ha) in HP 0 129 51 10
Bypassed SHS Area (ha) in HP 0 0 0 0
Total Planning Unit Harvest Area (ha) (2)
0 282 69 56
(1) Planning Unit Variance is the Permanently Deleted SHS Area (ha) in HP and Deferred SHS Area (ha) in HP expressed as a percentage
of the Total SHS Area (ha) within Planning Unit.
(2) Total Planning Unit Harvest Area (ha) is the sum of the SHS Area (ha) Planned for Harvest in HP and Additions (ha) in HP.

50
Appendix 3 Table 13,
Northland Operational Variance Summary (FMU L1)
L1 D Covertype Sw Covertype Sb Covertype Pj Covertype
Allowable FMU Level 5 Year SHS Area (ha) 0 431 72 817
FMU SHS Area (ha) with Planning Units 0 0 0 0
SHS Area (ha) Planned for Harvest in HPs 0 0 0 0
Permanently Deleted SHS Area (ha) in HPs 0 0 0 0
Deferred SHS Area (ha) in HPs 0 0 0 0
Total FMU Variance (1)
0% 0% 0% 0%
Additions (ha) in HPs 0 0 0 0
Bypassed SHS Area (ha) in HPs 0 0 0 0
Total FMU Harvest Area (ha) (2)
0 0 0 0
(1) Total FMU Variance is the Permanently Deleted SHS Area (ha) in HPs and Deferred SHS Area (ha) in HPs expressed as a percentage
of the Allowable FMU Level 5 Year SHS Area.
(2) Total FMU Harvest Area (ha) is the sum of the SHS Area (ha) Planned for Harvest in HPs and Additions (ha) in HPs.
Appendix 3 Table 14,
Northland Operational Variance Summary (FMU L3)
L3 D Covertype Sw Covertype Sb Covertype Pj Covertype
Allowable FMU Level 5 Year SHS Area (ha) 0 3,146 977 647
FMU SHS Area (ha) with Planning Units 0 0 0 0
SHS Area (ha) Planned for Harvest in HPs 0 0 0 0
Permanently Deleted SHS Area (ha) in HPs 0 0 0 0
Deferred SHS Area (ha) in HPs 0 0 0 0
Total FMU Variance (1)
0% 0% 0% 0%
Additions (ha) in HPs 0 0 0 0
Bypassed SHS Area (ha) in HPs 0 0 0 0
Total FMU Harvest Area (ha) (2)
0 0 0 0
(1) Total FMU Variance is the Permanently Deleted SHS Area (ha) in HPs and Deferred SHS Area (ha) in HPs expressed as a percentage
of the Allowable FMU Level 5 Year SHS Area.
(2) Total FMU Harvest Area (ha) is the sum of the SHS Area (ha) Planned for Harvest in HPs and Additions (ha) in HPs.

51
Appendix 3 Table 15,
Northland Operational Variance Summary (FMU L8)
L8 D Covertype Sw Covertype Sb Covertype Pj Covertype
Allowable FMU Level 5 Year SHS Area (ha) 0 126 0 60
FMU SHS Area (ha) with Planning Units 0 0 0 0
SHS Area (ha) Planned for Harvest in HPs 0 0 0 0
Permanently Deleted SHS Area (ha) in HPs 0 0 0 0
Deferred SHS Area (ha) in HPs 0 0 0 0
Total FMU Variance (1)
0% 0% 0% 0%
Additions (ha) in HPs 0 0 0 0
Bypassed SHS Area (ha) in HPs 0 0 0 0
Total FMU Harvest Area (ha) (2)
0 0 0 0
(1) Total FMU Variance is the Permanently Deleted SHS Area (ha) in HPs and Deferred SHS Area (ha) in HPs expressed as a percentage
of the Allowable FMU Level 5 Year SHS Area.
(2) Total FMU Harvest Area (ha) is the sum of the SHS Area (ha) Planned for Harvest in HPs and Additions (ha) in HPs.
Related Documents


![The Unseen [Development Document]](https://static.cupdf.com/doc/110x72/5790539a1a28ab900c8ceb10/the-unseen-development-document.jpg)