JOURNAL OF GEOPHYSICAL RESEARCH, VOL. 106, NO. ClO, PAGES 22,313-22,329, OCT0I3ERI5, 2001 General circulation and intel'gyre dynanlÏcs in the eastel'n North Atlantic fl'oln a regional pl'in1itive equation 1110del Thierry Pend uff' Laboratoire des Ecoulements Géophysiques eL Industriels, Grenoble, F'rance Alain Colin de Verdière Laboratoire de Physique cles Océans, Université cie BreLagne Occidentale, Brest, France Bernard Barnicr Laboratoire des Ecoulements Géophysiques et Industriels, Grenoble, France Abstract. The mean circulation of the eastern North AiJantic is investigatecl uning a regional 0.8° x cos(la,titucle)-renolution configuration of the SPEM primitive equation nigma coorclinate moclel, forcecl by neasonal ancl monthly surface Huxen. The computational clomain is sUlTounclecl by three self .. aclapting open bounclaries which evacuate the outgoing perturbations ancl laterally control the baroclinic mocles in inHow regions, but let the mocle! acljust the barotropic mocle to a large extent. The final solution is stable and reproduces most features of thebasin's me an circulation weIl: A realistic Azores Currcnt, the observecl paUls ancl transports of subpolar currents, of the branches of the North Atlantic Current, of the intergyre zone moclal and intennediate water masses clown to about 2000 lll. Some unrealistic circulation features, attributed to the modest ·resolution ancl to certain limitations of the sigma coordinates, are founcl below 2000 lll. The buoyancy and vorticity balances arc investigated in the intergyre zone. The Subpolar Mocle Water (SPMW), subductecl at a realistic rate, continues its southward journey toward the ocean's interior in accordance with the ventilatecl thennocline theory, with edcly cliapycnal fluxes exerting a moclerating effect. The poleward motion observecl between 300 and 1000 III is well reprocluced north of 45°N and governed by similar dynamics, but is absent south of 45°N within the upper Mediterranean "Vater. 1. Introduction The mean circulation ane! e!ynamics of the North At- lantic Ocean are better known west of the Mid-Atlantic Ridge (IvIAR) than east of it. This situation has histori- cal origins but still persists, probably because the ocean dynamics e!iffer between the two basins. In the western basin the mean flow is dominated by the Gulf Stream extension, a permanent, intense and thin (about 100 km-wide) jet that remains confined within a rather lim- ited area (about 2°-wide [Kelly, 1991]). East of '15°YV the major current (North Atlantic Current, NAC) is weaker and splits into several branches whose number, Îlltensity, T-S structure, and path are subject to in- tense interannual variability [Sy et al., 1992]. Other major fealures of the mean circulation in the eastern 1 Now al; Center for Oceall .. Atmospheric Preclict;ion Stucl- ies, Florida Sta(;e University, Tallahassee, Florida, USA. Copyright 2001 by the American Geophysical Union. Paper llluuber 2000JC000346. 0148-0227/01 /2000J C000346$09. 00 basin, such as the warm \Vater export toward the Nor- wegian Sea [Orvik et al., 1999], its return flow above the Greenland-Iceland-Scotland sills [Bacon, 1998], or the current regime between the subpolaT ane! the sub- tropical gyres [SV, 1988] are linkee! with the NAC and also exhibit an important interannual variability. Present estimates of the large-scale circulation in the basin are thus restricted to given periods, areas or im- mersions: The early eighties [SV, 1988; Arhan et al., 1989; Sy et al., 1992; Gana and Pmvost, 1993], the late winter in the eighties [Paillet and Me'I"cier, 1997] (noted PIvI97 thereafter), the near-surface mean CÜ'cu- lation during the eighties [Brügge, 1995], or the early nineties [Otto and van Aken, 1996]. Schmitz and Mc .. Cartney [1993, p. 29] proposee! a synthesis of numerous local measurements and schemes of the North Atlantic mean circulation, but pointee! out that "there are still significant gaps in our knowlee!ge of [this] circulation." Among available in situ measurements, hydrographic data are the most abune!ant east of the IvIAR and consti- tute an interesting starting point to evaluate the mean circulation. I-Iowever, hydrography-based direct esti- rnates of transports across individual sections may not 22,313

Welcome message from author
This document is posted to help you gain knowledge. Please leave a comment to let me know what you think about it! Share it to your friends and learn new things together.
Transcript
JOURNAL OF GEOPHYSICAL RESEARCH, VOL. 106, NO. ClO, PAGES 22,313-22,329, OCT0I3ERI5, 2001
General circulation and intel'gyre dynanlÏcs in the eastel'n North Atlantic fl'oln a regional pl'in1itive equation 1110del
Thierry Pend uff' Laboratoire des Ecoulements Géophysiques eL Industriels, Grenoble, F'rance
Alain Colin de Verdière Laboratoire de Physique cles Océans, Université cie BreLagne Occidentale, Brest, France
Bernard Barnicr Laboratoire des Ecoulements Géophysiques et Industriels, Grenoble, France
Abstract. The mean circulation of the eastern North AiJantic is investigatecl uning a regional 0.8° x cos(la,titucle)-renolution configuration of the SPEM primitive equation nigma coorclinate moclel, forcecl by neasonal ancl monthly surface Huxen. The computational clomain is sUlTounclecl by three self .. aclapting open bounclaries which evacuate the outgoing perturbations ancl laterally control the baroclinic mocles in inHow regions, but let the mocle! acljust the barotropic mocle to a large extent. The final solution is stable and reproduces most features of thebasin's me an circulation weIl: A realistic Azores Currcnt, the observecl paUls ancl transports of subpolar currents, of the branches of the North Atlantic Current, of the intergyre zone moclal and intennediate water masses clown to about 2000 lll. Some unrealistic circulation features, attributed to the modest ·resolution ancl to certain limitations of the sigma coordinates, are founcl below 2000 lll. The buoyancy and vorticity balances arc investigated in the intergyre zone. The Subpolar Mocle Water (SPMW), subductecl at a realistic rate, continues its southward journey toward the ocean's interior in accordance with the ventilatecl thennocline theory, with edcly cliapycnal fluxes exerting a moclerating effect. The poleward motion observecl between 300 and 1000 III is well reprocluced north of 45°N and governed by similar dynamics, but is absent south of 45°N within the upper Mediterranean "Vater.
1. Introduction
The mean circulation ane! e!ynamics of the North Atlantic Ocean are better known west of the Mid-Atlantic Ridge (IvIAR) than east of it. This situation has historical origins but still persists, probably because the ocean dynamics e!iffer between the two basins. In the western basin the mean flow is dominated by the Gulf Stream extension, a permanent, intense and thin (about 100 km-wide) jet that remains confined within a rather limited area (about 2°-wide [Kelly, 1991]). East of '15°YV the major current (North Atlantic Current, NAC) is weaker and splits into several branches whose number, Îlltensity, T-S structure, and path are subject to intense interannual variability [Sy et al., 1992]. Other major fealures of the mean circulation in the eastern
1 Now al; Center for Oceall .. Atmospheric Preclict;ion Stuclies, Florida Sta(;e University, Tallahassee, Florida, USA.
Copyright 2001 by the American Geophysical Union.
Paper llluuber 2000JC000346. 0148-0227/01 /2000J C000346$09. 00
basin, such as the warm \Vater export toward the Norwegian Sea [Orvik et al., 1999], its return flow above the Greenland-Iceland-Scotland sills [Bacon, 1998], or the current regime between the subpolaT ane! the subtropical gyres [SV, 1988] are linkee! with the NAC and also exhibit an important interannual variability.
Present estimates of the large-scale circulation in the basin are thus restricted to given periods, areas or immersions: The early eighties [SV, 1988; Arhan et al., 1989; Sy et al., 1992; Gana and Pmvost, 1993], the late winter in the eighties [Paillet and Me'I"cier, 1997] (noted PIvI97 thereafter), the near-surface mean CÜ'culation during the eighties [Brügge, 1995], or the early nineties [Otto and van Aken, 1996]. Schmitz and Mc .. Cartney [1993, p. 29] proposee! a synthesis of numerous local measurements and schemes of the North Atlantic mean circulation, but pointee! out that "there are still significant gaps in our knowlee!ge of [this] circulation."
Among available in situ measurements, hydrographic data are the most abune!ant east of the IvIAR and constitute an interesting starting point to evaluate the mean circulation. I-Iowever, hydrography-based direct estirnates of transports across individual sections may not
22,313
22,314 PENDUF'F ET AL.: I~ASTEllN NOIUE ATLANTIC CIIlCULATlON AND DYNAÎlIIICS
accurately rcprcsent the dynatnic:al illl pact of topography 011 the large-sc:a.le flow, ShOWll 1'.0 Iw crucial a.t these latitudes [W'/I.nsch a'/ld J?,oc'ln1l/.ich, 1985; J17'ha'/l cl. al., 1989], becilllse il levd of no motion has to be c:hosen. This e:hoice is partly arbitrar.\', lias il sigllificèlnt impact on U[() total transport [PJ\!HJ7], ane! œrtainly clis torts Lhe topographie: drect. III aclclitioll to Ul(' i1\tcraml1lal variability, this cxplains why geostl'Ophic: cstilllates of tlte NAC trausport a!Jove the iVIAR coyer a. wicle l'auge [see 8y et (lI., 1992, Table 2]. North of about LiooN, geostl'Ophic estimates of the cmrent transports shoulcl tllllS be intel'j)retecl with caution.
One may also e!ecluc:e the lllean Ho\\' in the basin l'rom a set of dynamical equations ancl a T-S flnnllal clilllatology based on several decacles of hydrographic clata.. A mean velocity fielcl representative of these clecades may be computecl l'rom such a stratification by an inverse model (as was clone for one particular se as on by PiVI97), but the possible mean contribution of the wincl- and buoyancy-driven variability cannot be addressecl. Our approach is to initialize a prognostic non-eclcly-resolving primitive equation modd of the basin with a c:limatological T-S stratification representative of a given season, ane! to integrate the moclel with a realistic seasonal
forcing lllll:il ~tabilizatiotl. The Huai Hlean sl.ratification and circulation arc tltus adjustecl lllutually and 1'.0 the smfacc ancl laLc~ml rorcing, ancl expliciLly integrate the ocean variability up to seascJIlal timescales. Pl'Ovicled that tlte III ode! , its lnlr~ral ancl Slll'I'ace forcings are l'diable, ancl that the spin-up lemls to a realistic and sta.ble sollltion, this pl'Ognostic approach hdps 1'.0 cOlllplement in situ or inverse cstimates or the mean circula.tion. This is the first ailll of the present study.
Our second goa.l is to investigate the origin of subsUl'face currents in the so-ca.llecl intergyre region, loc:atee! between the NAC and the Azores CUiTent (AC). The ventilatecl thenlloc:line theOl'y [Luyl,en et a.l, 1983] provicies an explanation of tlte way in which layers lying beIowa directly wincl-clriven surface layer can be put into motion: In regions of clownware! Elcman pumping, fluicl columns can be subcluctecl beneath the surface layer and continue their southwarcl journey conserving their low potential vorticity acquired at outcrop lines. An important resul t of this adiabatic calculation was the appearance of shaclow zones along eastern bounclaries, which occur due to the strict aclherence to the conclibons of potential VOl'ticity conservation and zero normal geostl'Ophic velocity at the eastern bounclary. An-
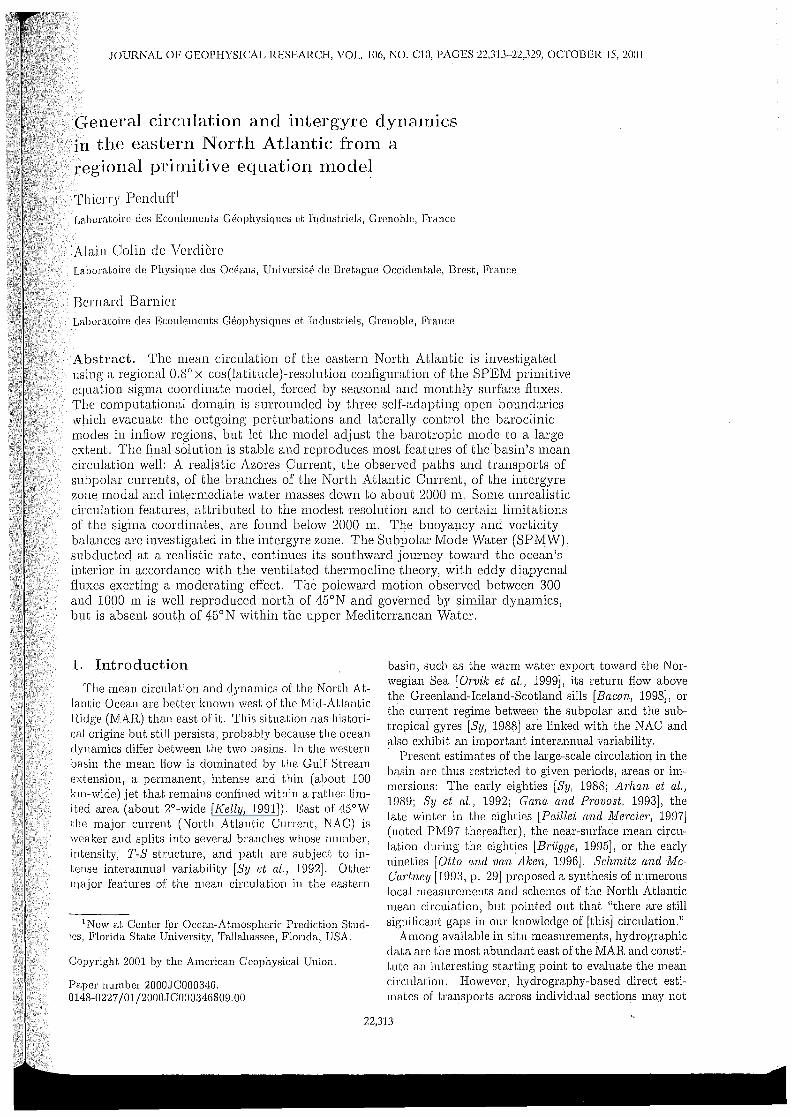
60W 50W 40W 30W 20W lOW OE
-6000.00 -5000.00 -4000.00 -3000.00 -2000.00 -1000.00 .00
Figure 1. The eastern North Atlantic original topogmphy. Straight lines represent the computationaJ domain limits.
PENDUFF E'r AL.: EASTERN NOHTH ATLANTIC CIH.CULATION AND DYNAMICS 22,315
otlter way or puttillg dt~ep layers ill motion is through intentaI tmb\llcnt diffusioll, Luy/.cn and Slow:llle! [198G] descril)() case studies ill which solutiolls appropriate to the s\lbl;ropical gyre heatillg, subpolar gyre COOlillg, and wind stress distributions are obtainecl through Sverdrup dYllll111ics. AlLhough the smface stress distrib\ltion can be considered as givcn, iL is anothcr nmLtcr for the heatillg-coolillg di:3triblltiollS thal. are dosely interrelatcd with the largc-scale advectioll field one wishes to calculate, An altemative to the arbitrary distribution of their cross-isopyena.l flux is to "observe" the links betwcell the large-scale circulation and the turbulent forcing fields in a numericaJ model, and to interpret those links at the level of Sverdrup dynamics, For this to be a fruitful exerc:ise, the model solution shoulcl be dose to the real circulation so that the motions of known water masses can be associatecl with difrerent contributiolls to the stretching term in the planetary vorticity eqllation. Once our eastern North Atlantic mode! proclllces realistic How rates for the water masses, we shall investigate how the Subpolar iVIode ,Vatel' and the Mediterranean vVater are set in motion.
1'0 date, the results of several North Atlantic models have been published and a number of comparisons made [T,.ég'll:iel', 1992; B'l'Yw! et al., 1995; DYNAMO G1'Ou]J, 1997]. These com parisolls reveal significant dit:.. ferences and discrepancies eas t of the MAR (dis torted andweak NAC, absence of the AC), even at high resolution. These weaknesses may be linked to the inabiiity of most basin-scale models to reproduce the Gulf Stream separation pro cess properly. Our numerical domain was thus restricted to the eastern basin through the use of "self:"adapting" open boundaries [Pend1ljj' et al., 2000] (noted POO hereafter), partly controlled by recent climatologieal T-S fields.
The paper is divided into several sections. In section 2 we briefly summarize the model configuration. In section 3 the fina1 mean circulation is describecl and compared with available estimates. The impact of internaI diHusive pro cesses on the motion of the water masses in the intergyre zone is investigated in section 4. Our results are sUlnmarized in section 5.
2. lVloclel Configuration
The present study is conducted using the SPEIvI5.1 primitive equation model at a resolution of 0.8° in longitude and 0.8°x cos(cP) in latitude cl). The limits of the study area are justiHed in POO and shown in Figure 1. SPEIvI uses sigma coordinates on the vertical, which allow a lnore natura.l treatment of the bottom topography conclition. The possible tendeney of geopotential coordinate mode!s to overestimate the blocking cfrect of the MAR [T'l'égnie'l', 1992] is a1so avoiclecl \Vith this approach. In order to limit the spurious velo cities genel'atecl by tnmcation errors in the pressure gradient calculation, the topography was smoothed using the criterion adopted by Bm"nie'l' et ni. [1998] and valida.ted in a "resting stratification case" (see the latter paper). The actual topography used in our simulations is clepicted in Figure 2 and leads to erroneous velo ci-
ties slllallcr than 0.25 cm ç 1 ovcr 1ll0st of the clolllain. The regions where mllncrical errors induce u!Il'calistic l'entures arc poilltecl out in section 3.
Alollg the IVcstCl'll (40 0 W), soutlWl'll (300N), ane! castel'1l (0.8°W) lilllits, origillal self-ae!apting open bOll1lclaries (013s) evacuate the outgoing perturbations thro\lgh radiation eq\laticlIls, amI, ill illfllJW regiolls, COll
straill the interior circulation by a strong relaxation of the baroclinic variables to a sensonal c:limatology. This lateral baroclinic climatology alld the initial stratification come t'rom the recent T-S climatology of Rey'lw:nd el; al. [1998] (noted H.LM13 hereafter). These fields are basee! on several decades of hydrographic data and exhibit lllarked horizontal density gradients, thus provie!ing the main incoming currcnts with ct realistic location and baroclinic structure (especia.lly along L100W). Along thesc tluee () Es the vertica.lly integrated How (ltereafter referred to as "barot.ropic" and denoted '//1), and consequenUy a large part of the lateral dynarnical forcing, is adjusted to the interior clynamics by the model itself. This novel degree of freedom is a key element in our simulations. During model integration. along the northern "fixed" boundaries of the domain (6G.5°N), the telllperatme, sa.linity, and baroclinic velocity fields \Vere kept equal ta their RLiVlB climatological seasonal estimates, and the barotropic stream function \Vas prescribed to a linear profile bet\Veen Greenland, lceland and the northeastern corner. The reader is referred to POO for a detailed description of the lateral forcing and of its impact on the interior solution. Table 1 and Table 2 summarize the parameters involved in this lateral forcing. The other model parameters, the buoyancy and mechanical surface forcings are presented in Table 3.
3. Annual Mean Circulation
POO present the dynamical and thermodynamical adjustment of the basin and show that the annually averaged solution totally stabilizes arter 35 years of integration. This is remarlmble in the presence of such extensive self-adapting open boundaries. 1'0 complement the vector plots presented in POO, a scheme of the model mcan circulation after 38 years of integration is shown in Figure 3 for three layers. The horizontal transports of individual currents indicated in this figure \Vere computed across several zonal and meridional sections; the vertical transports were then deduced l'rOlll the divergence of horizontal lllass fluxes between these sections to dose t.he mass budget. Figure 4 present.s the annually and clepth-averagecl Ho\\' ('1/)).
3.1. North Atlantic Current and the Subpolar Gyre
The NAC enters the doma.in between LI3°N and about 53°N and crosses the NIAR at 30 0 W between LILiaN and 58°N, Tt brings 40.5 Sv abovc the lVIAR into the eastern basin (29.8 Sv, 7.4 Sv, and 3.3 Sv in the Uuee depth ranges shown in Figure 3, respectively); most of this transport (29.8 Sv) is confined to the upper 800 m. The barotropic: mass Hux is significantly lm'ger than the Svcrdrup transport (Figure 5) across the same merid-
22,316 PENDUFF ET AL.: EASTERN NOHTH ATLANTIC CIRCULATION AND DYNMilICS
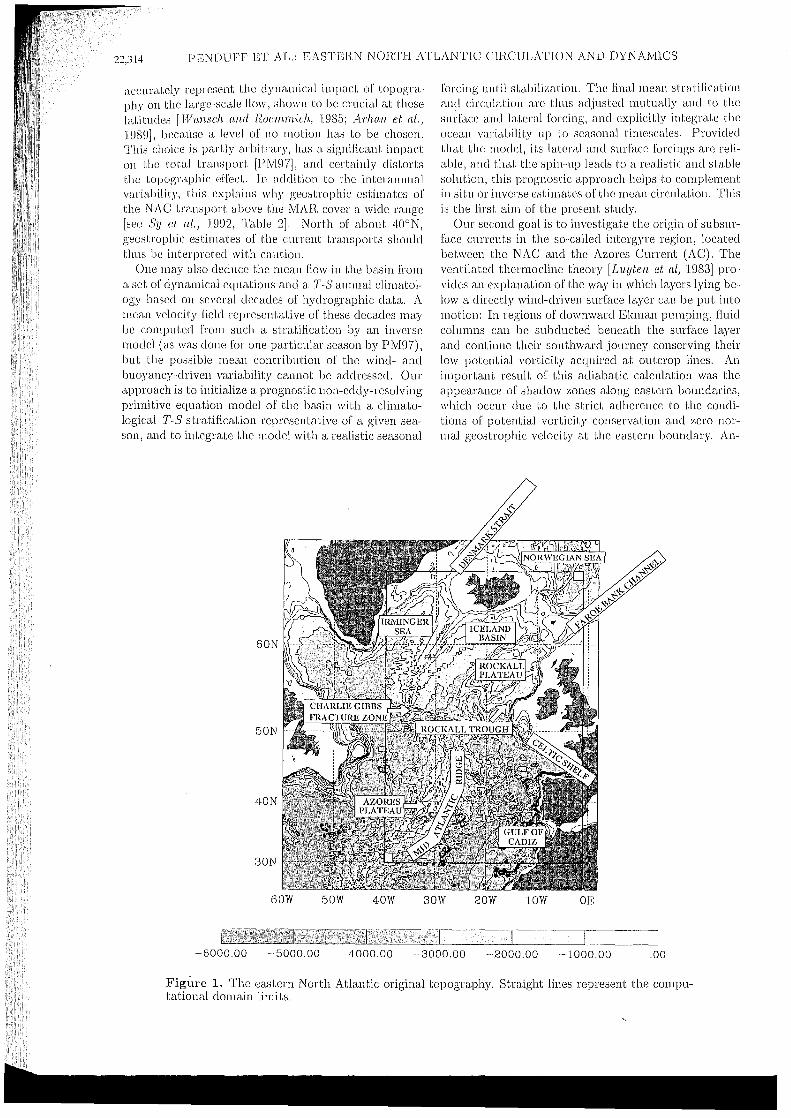
Open bounclaries
--- Fixecl bounclaries
50N f---Al"'-------·+----
LiON
30N
60W 50W 40W 30W 20W lOi\' DE
-6000.00 -5000.00 -4000.00 -3000.00 -2000.00 -1000.00 .00
Figure 2. Model topography in meters. Plain Enes locate the northern fixed boundaries where the model variables are prescribed; dashedlines locate the three self-adaptative open boundaries; unshaded three grid point square regions at the southwestern and northeastern corners correspond to artificial islands (necessary at the intersectioll of two open boundaries).
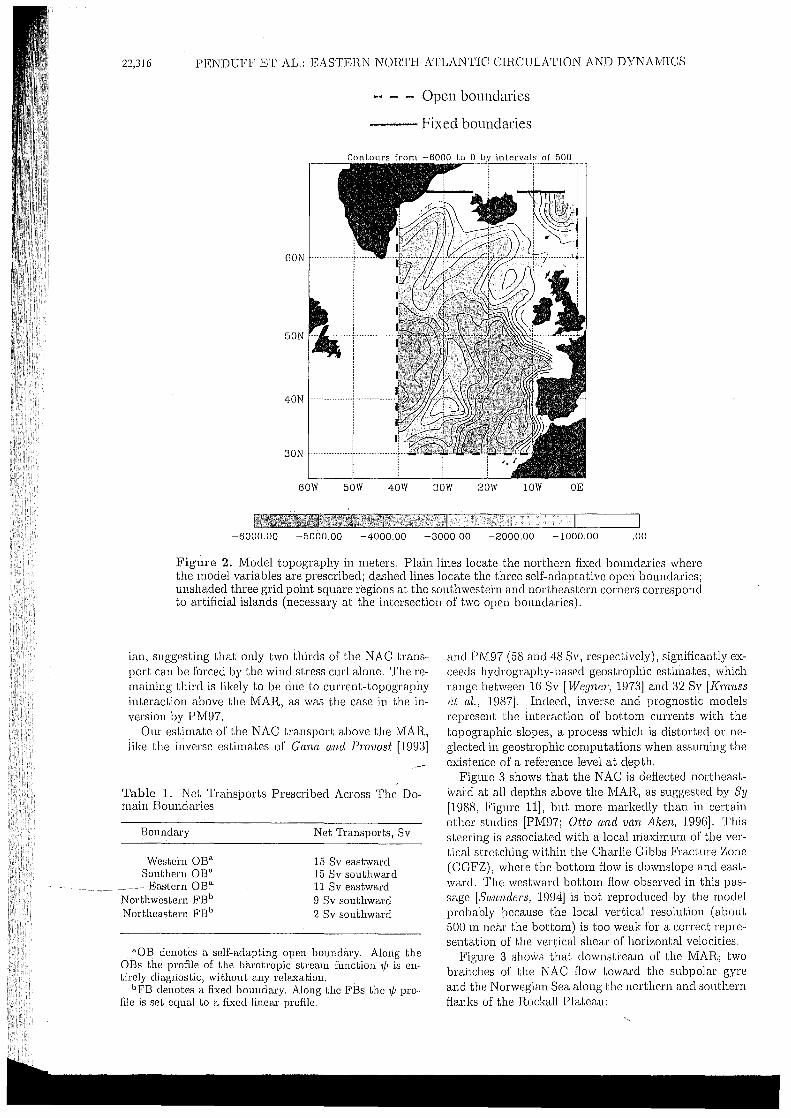
ian, suggesting that only two thirds of the NAC transport can be forced by the wind stress curl alone. The remaining third is likely to be due to current-topography interaction above the MAR, as was the case in the inversion by PM97.
Our estimate of the NAC transport above the MAR, like the inverse estimates of Cana and Pmvost [1993]
Table 1. Net Trai:lsports Prescribed Across The Do!nain Boundaries
Bounclary
'Western OB" Southern OB"
~ ___ --Eastern-OB" Northwestern FB b
Northeastern FB b
Net Transports, Sv
15 Sv eastwarcl 15 Sv southwm-cl 11 Sv eastwarcl 9 Sv southwarcl 2 Sv southwf1rcl
l'OB clenotes aseJf~aclaptillg open bounclary. AloIig the OBs the profile of the bitrotropic stream function 'If; is entirely cliagIiostic, without any relaxation.
bFB clenotes a Hxecl bounclary. Along the FBs the '1/) profile is set equal to a Hxecl linear profile.
and PM97 (58 and 48 Sv, respectively), significantly exceeds hydrography-based geostrophic estill1ates, which range between 16 Sv [WegneT', 1973] and 32 Sv [Kmuss et al., 1987]. Indeed, inverse and prognostic models represent the interaction of bottOll1 currents with the topographic slopes, a pro cess which is distorted or neglected in geostrophic computations when assuming the existence of a reference level at depth.
Figure 3 shows that the NAC is deflectednortheastward at all depths above the MAR, as suggested by Sy [1988, Figure 11], but more markedly than in certain other studies [PM97; Otto and van Aken, 1996]. This steering is associated with a local niéL-..::ill1urn of the vertical stretching within the Charlie Gibbs Fracture Zone (CGFZ), where the bottoll1 flow is downslope and eastwarc!. The westward bOtt0111 flow observed in this passage [Sœll:ndel's, 1994] is not reproduced by the model probably because the local vertical resolution (about 500 rn nem the bot tom) is too weale fol' a correct repl'esentation of the vertical shear of horizontal velocities.
Figure 3 shmvs that downstream of the MAR; two branches of the NAC flow toward the subpolar gyre and the Norwegimt Sea along the northern and southern flanles of the RocImll Plateau:
PENDUFF' ET AL.: EASTERN NORTH ATLANTIC CIRCULATION AND DYNAlvIICS
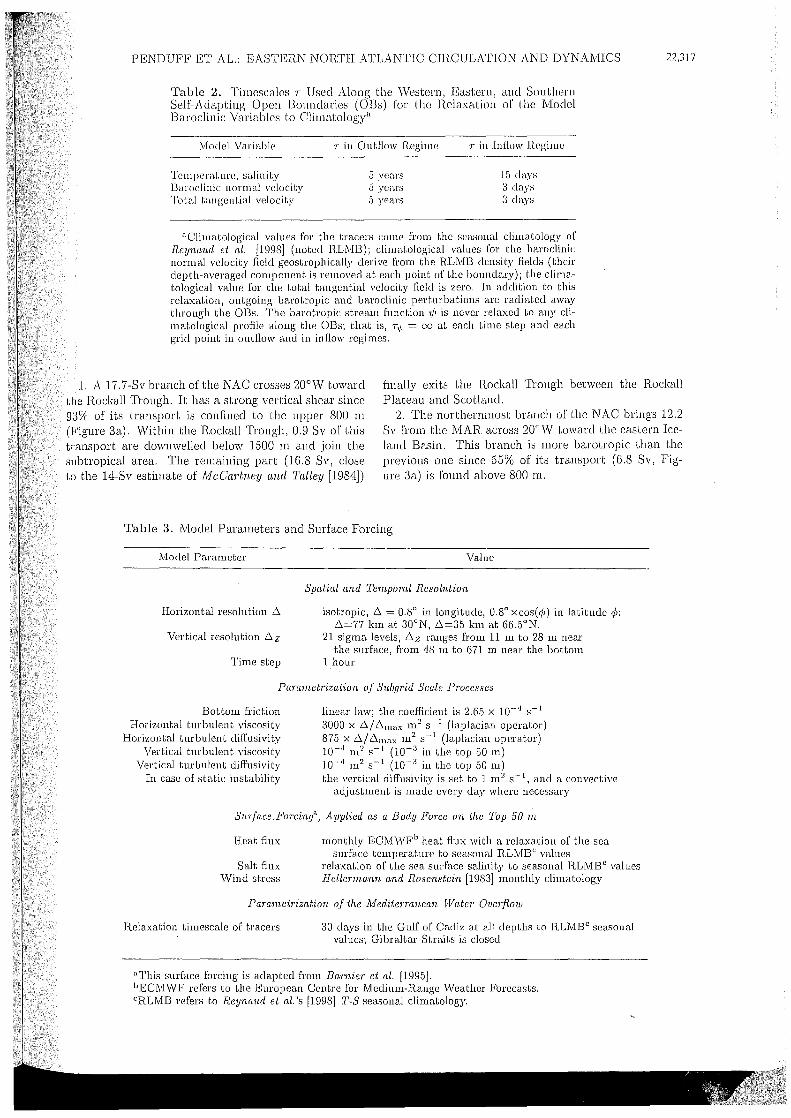
Table 2. Tirncscales T Usecl Along the \~lestem, EasterIl, aIld Southeru Self-Aclaptillg Open BO\luclaries (013s) for the RelaxatioIl of the j'lŒoclei I3aroclinic Variables to Clilllatology"
iVloclel Vmiable
1'(~tnperatu1'e, sali nit y Baroclinic llOrIlletl velocity Total t,wgelltial velocity
T iu Outflow Regill1e
5 yeal's 5 ycars 5 yea.rs
T in [uflow 11egirne
l5 days 3 cJays 3 days
"Climatological values for the tracers cOllle from the seasollal c:Jimatology of Reynrt'I/,d cl al. [1998J (notcd RLI\lIB); clirnatological values for the ba1'oc:Jinic normal velocity field gcosl;rophically derive From the HLIVIB density fields (their depUr-averaged component is removed at each poiut of the bouudary); the c:Jimatological value for the total tangential velocity field is zero. In addition to this relaxation, outgoing barotropic and barocJinic perturbations are radial;ed away through the OBs. The ba1'otropic stream fllnction 'II; is never relaxed to any climatological profile alollg the OBs; that is, Tv' = 00 at each tillle step and each grid point in olllJlow and in illflow regimcs.
22,317
1. A 17.7-Sv brandl of the NAC crosses 20 0 W towarcl the Rockall Trough. Il has a strong vertical shear since 93% of its transport is confined to the upper 800 III
(Figure 3a). Within the Rockall Trough, 0.9 Sv of this traIlsport are downwelled below 1500 m and join the subtropical area. The remaining part (16.8 Sv, close to the ILl-Sv estimate of McCartney and Talley [198 L1])
finally exits the Roclmll Trough between the Rockall Plateau and Scotland.
2. The northernmost branch of the NAC briugs 12.2 Sv from the MAR. across 200 'W toward the eastern 1celand Basin. This branch is more barotropic than the previous one since 55% of its transport (6.8 Sv, Figure 3a) i8 found above 800 rn.
Table 3. Tvlodel Parameters and Surface Forcing
Moclel Parameter
Horizontal resolution 6.
Vertical resolution 6. z
1'ime step
Value
Spatial and Tempoml Resolution
isotropie, 6. = 0.80 in longitude, 0.80 x cos( <p) in latitude q): 6.=77 km at 30 0 N, 6.=35 km at 66.5°N.
21 sigma levels, 6. z ranges from 11 m to 28 m nem the surface, l'rom 48 !Tl to 671 !Tl near the bottom
1 hour
Pammetrization of Snbgr'id Scale Pmcesses
Bottonl frict;ion Horizontal turbulent viscosi ty
Horizontal turbulent cliffusivity Vertical turbulent viscosity
Vertical turbulent cliffusivity In case of static instability
linear law; the coefficient is 2.65 x 10⁻⁴ S-I
3000 X 6./6.max m 2 S-l (Japlacian operator)
875 x 6./6. lIlax rn2 S-l (Japlacian operator)
10-4 m 2 S-1 (10- 3 in the top 50 m) 10-'1 m 2 s-r (10- 3 in the top 50 m) t;[re vertical cliffusivity is set to 1 m 2 s-r, and a convective
adjustment is made every day where necessary
Snrfo,ceForC'Î'ng", Applied as a Body Force on the Top 50 ln
I-Ieat flux
Salt flux \Vind stress
monthly ECIVnVF b heat flux with a relaxation of tJre sea surface temperature to seasonal RLMB e values
relaxation of the sea surface salinity to seasonal RLîvIB e values Hellennann and Rosenstein [1983J montJrly climatology
Pa1"(l,rnetr-ization of the NlediterTo,nean Water O'Uerjiow
Relaxation timescale of tracers 30 days in the Gulf of Cadi" aot ail clepths to B.,LiVIBe seasonal values; Gibraltar Straits is cJosecl
"This surface forcing is adapted t'rom BnT'nier et al. [1995J. bECiVIvVF refers to tire European Centre for iVIeclium-Range vVeather F'orec<lo5ts. eRLiVIB refers to Reynaud et o,l.'s [1998J T-S seasonal climatology.
22,318 PENDUF'F ET AL.: EASTEHN NOHTH ATLANTIC CIIWULATION AND DYNAlvIICS
(A) 0-800m (II) 800-1S00m
atz=800m atz=lS00m
(C) lS00m-hottolll
Lowcr right quarter:
150()-25(XJ III in circlcs
n~n2~11-bolloln in
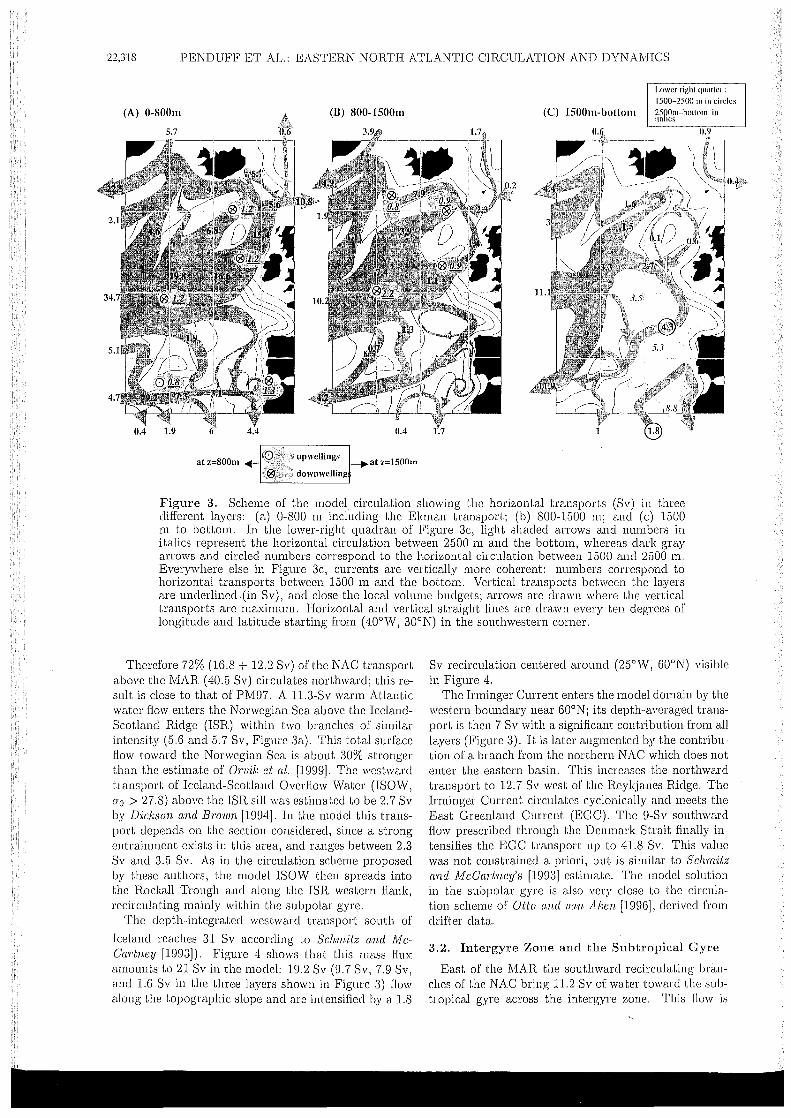
Figure 3. Scheme of the model, circulation showing the horizontal transports (Sv) in three cliIferent layers: (a) 0-800 m including the Ebmm transport; (b) 800-1500 m; and (c) 1500 m to bottom. In the lower-right quaclran of Figure 3c, light shaclecl arrows and numbers in italics represent the horizontal circulation between 2500 m and the bottom, whereas dark gray alTOWS and circled numbers correspond to the horizontal circulation between 1500 and 2500 m. Everywhere else in Figure 3c, currents are vertically more coherent: numbers correspond to horizontal transports between 1500 m and the bottom. Vertical transports between the layers are unclerlined.(in Sv), and close the local volume budgets; arrows are drawn where the vertical transports are maximum. Horizontal ancl vertical straight lines are clrawn every ten clegrees of longitude and latitude starting from (40 0 W, 30 0 N) in the southwestern corner.
Therefore 72% (16.8 + 12.2 Sv) of the NAC transport ab ove the MAR (40.5 Sv) circulates northward; this result is close to that of PM97. A 11.3-Sv warm Atlantic water flow enters the Norwegian Sea above the lcelandScotland Ridge (ISR) within two branches of similar intensity (5.6 and 5.7 Sv, Figure 3a). This total surface How toward the Norwegian Sea is about 30% stronger than the estimate of OT'/)'ik et al. [1999]. The westward transport of lceland-Scotland Overflow Water (ISOW, 0"0 > 27.8) above the ISR sill was estimated to be 2.7 Sv by D-i.ckson and BTOWT! [1994]. In the model this transport depends on the section considered, since a strong entrainment exists in this area, and ranges between 2.3 Sv and 3.5 Sv. As in the circulation scheme proposed by these authors, the model ISOW then spreads into the Rocka.ll Trough and along the ISR western flank, recirculating mainly within the subpolar gyre.
The depth-integrated westward transport south of
lceland l'caches 31 Sv according to Schmitz and McCa1'tney [1993]). Figure '1 shows that this mass flux amounts to 21 Sv in the model: 19.2 Sv (9.7 Sv, 7.9 Sv, and 1.6 Sv in the three layers shown in Figure 3) fiow along the topographie slope and are intensified by a 1.8
Sv recirculation centered around (25°"\V, 60 0 N) visible in Figure 4,
The Irminger Current enters the model domain by the western boundary near 60o N; its depth-averaged transport is then 7 Sv with a significant contribution t'rom ail layers (Figure 3). It is later augmented by the contribution of a branch from the l1orthe1'11 NAC which do es not enter the easte1'11 basin. This increases the northward transport to 12.7 Sv west of the Reykjanes Ridge. The Irminger Current circulates cyclonically and meets the East Greenland Current (EGC). The 9-Sv southward fiow prescribed through the Denmark SU'ait finally intensifies the EGC transport up to '11.8 Sv. This value was not constrained a priori, but is similar to Schrnitz and McCa7'tney's [1993] estimate. The model solution in the subpolar gyre is also very close to the circulation scheme of 0/;[0 and van Aken [1996], derived [rom drift el' data.
3.2. Intergyre Zone and the Subtropical Gyre
East of the MAR the southward recirculating branches of the NAC bring 11.2 Sv of water toward the subtropical gyre across the intergyre zone. This flow is
PENDU[i'F' ET AL.: EASTERN NORTH ATLANTIC CIH,CULATION AND DYNATvIICS
o
-250
-500
-750
-1000
-1250
-1500
-1750
-2000
lon -20.00
lat L� ______ ~IL-______ JI ________ ~I~----~~I------~I~------~I~----__=1
30 35 40 45 50 55 60 65
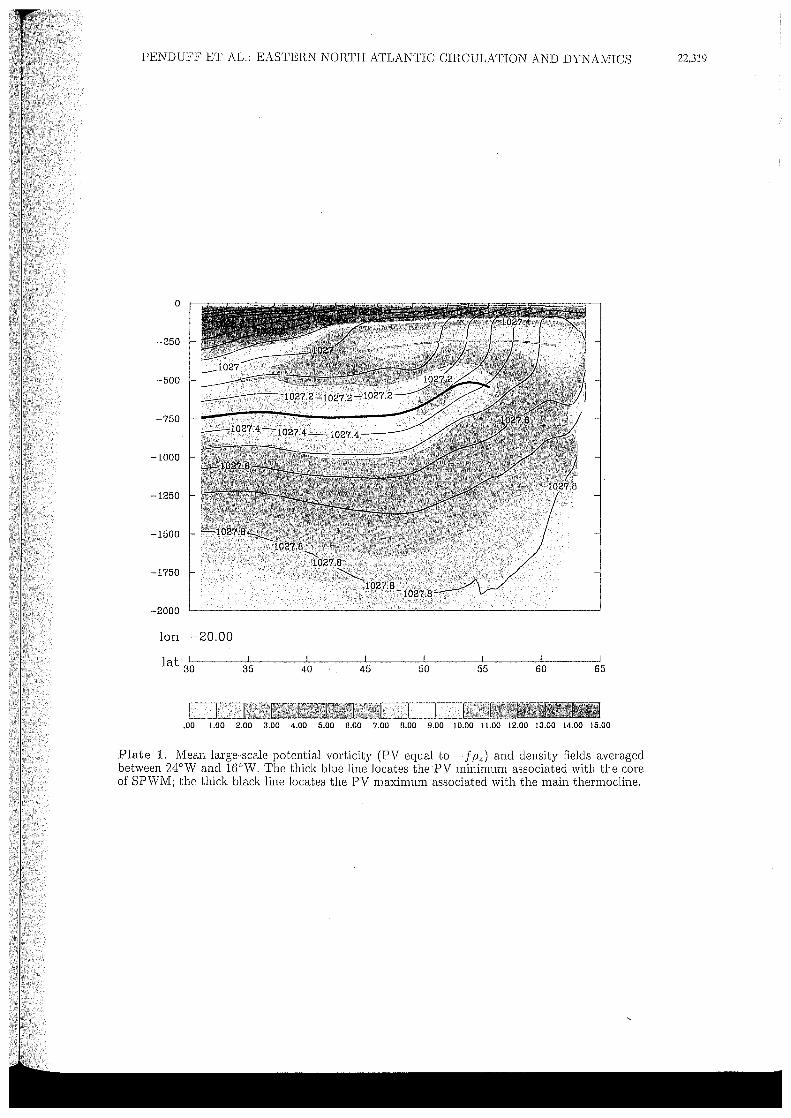
Plate 1. Mean large-scale potential vorticity (PV equal to - f Pz) and density fields averaged between 24°VV and 16°,V. The thick blue line locates the PV minimum associated with the core of SPWM; the thick black line locates the PV maximum associated with the main thermocline.
22,319
22,320 PENDUFF ET AL.: EASTERN NOnTH ATLANTIC CJnCULATION AND DYNA.lVnCS
I3AlWTlWPlC STrŒAMF'UNCTION - YEAH 38
Conlour:! {1<(l1II -tîO lu [JO Il}' illltir"'l\l~ of 2
30W 20W lOW'
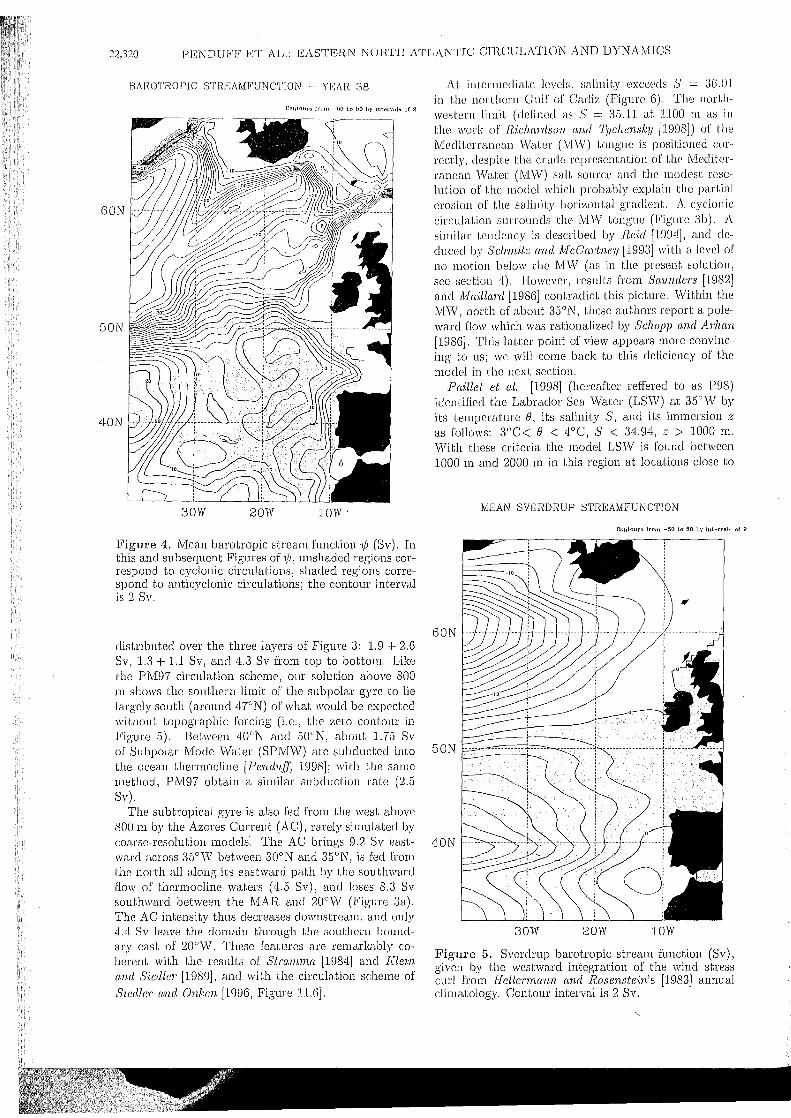
Figure 4. J\tIean barotropic stream function·t/J (Sv). In this and subsequent Figures of 't/J, unshaclecl regions correspond to cyclonic circulations, shaded regioJ15 correspond to anticyclonic circulations; the contour interval is 2 Sv.
distributed over the tl1l'ee layers of Figure 3: 1.9 + 2.6 Sv, 1.3 + 1.1 Sv, and 4.3 Sv from top to bottol1l. Like the PJ\tI97 circulation scheme, our solution above 800 111 shows the southern limit of the subpolar gyre to lie largely south (around L17°N) of what would be expected without topographic forcing (i.e., the zero contour in Figure 5). Between LwoN and 50oN, about 1.75 Sv of Subpolar Mode Water (SPMW) are subducted into the ocean thermocline [Pcnd1lif, 1998]; with the same method, PM97 obta.in a sirnilar subduction rate (2.5 Sv).
The subtropical gyre is also fee! b:om the west ab ove 800 III by the Azores Current (AC), rarely simulatee! by coarse-resolutioll 1ll0e!e!S. The AC brings 9.2 Sv eastward a.cross 35°W between 300 N and 35°N, is fed l'rom the llorth a.1I along its eastward path by the southward How of therl1locline waters (LL5 Sv), and loses 8.3 Sv southward between the MAR. a.ne! 20 0 W (Figure 3a). The AC intensity tlms decreases downstrearn, and only 4.4 Sv leave the domain thl'Ough the southerl1 bounelary east of 20 o ·W. These featul'es are remarlmbly coherent with the results of Stm,m:m.a [198 L1] and Klc'i,n (l'lui Siedlcl' [1989], and \Vith the circulation scheme of
Siedlcl' and Onken [1996, Figure 11.6].
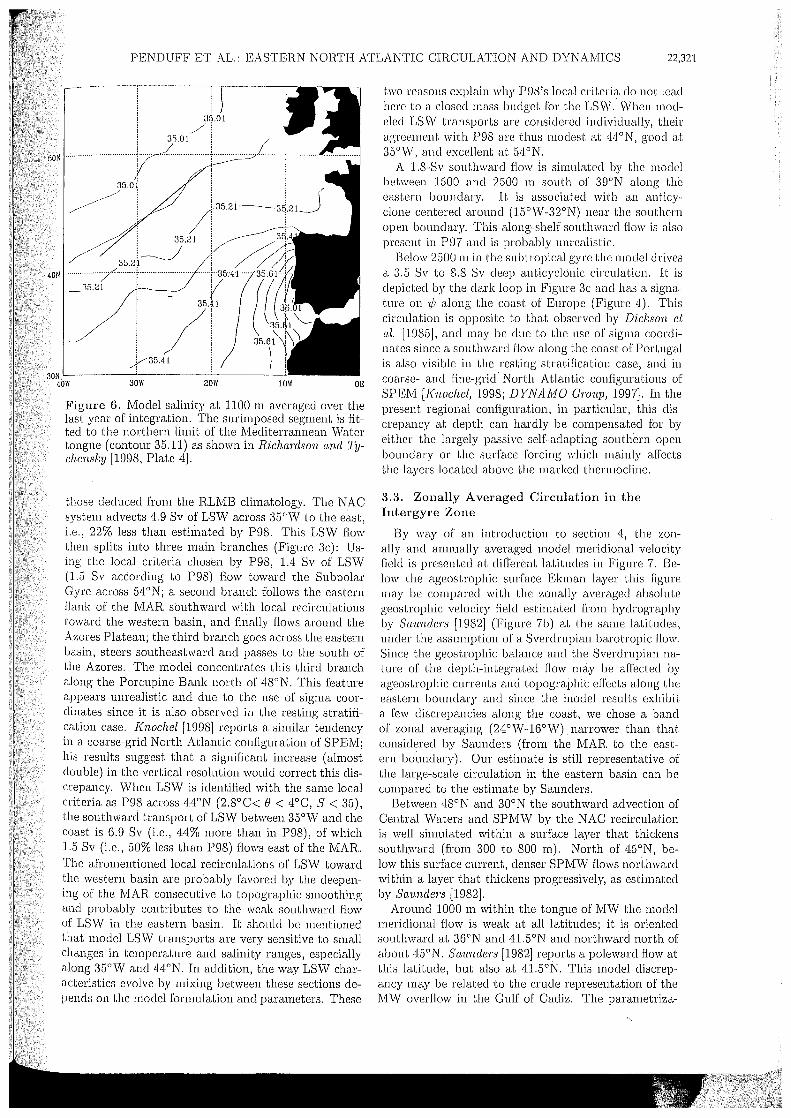
At illtel'Illediate leve!s, salillity exceeds S = 36.01 ill the llO]'!.ll()l'll Gllif or Ca.diz (Figure 6). The Ilorthwestel'll lilllit (defüwd as S = 35.11 at 1100 111 as ill the work of Ric!/.(mlson a.nd T:ljdwnsky [1998]) or the iVIeditel'l'i1.llean l,Vatel' (ivn~T) tOllgue is positioned COl'l'ecU)', dcspite the crucle reprcsellta.tiotl of the iVIecliterl'èllleall Watel' (M\V) salt SOLll'ee and l,he Ulodesl, resolution 0[' the mode! whic:lt probably expla.in the partial erosion or the salinity ho]'i~onta.l gradient. A cyclonic circulation SllITOllUcls the MW tOllgue (Figure 3b). A similar tendenc)' is clesc:ribecl by Reid [1994], and e!eclucecl by Sch'lll:itz and McCa:rtney [1993] with a level of no motioll be!ow the fvIW (as in the present SOIUUOll, see section 4). However, results fro111 S(lUnde7's [1982] ancl Mailla1'll [1986] c:ontl'ae!ict this picture. Within the NI\V, north of about 30 oN, these authol's report a polewarcl flo\\' which was l'ationalizecl by Schopp and }b'han [1986]. This latter point of view appears more convincing to us; we will come ba.ck to this cldiciency of the mode! in the next section.
Paillet ct al. [1998] (hereaner refferee! to as P98) ie!entified the Labrador Sea. IVater (LSW) at 30 0 Vil by its tempera.ture e, its salinity S, and its immersion z as follows: 3°C< e < LloC, S < 3L1.94, z > 1000 m. "Vith these criteria the mode! LSW is fOlllld between 1000 m and 2000 m in this region at locations close to
MEAN SVERDRUP STREAMFUNCTION
Contours trom -50 to 50 by inlf!rvl11s of 2
60N
50N
40N
30W 20W 10W
Figure 5. Sverdrup barotl'opic stream function (Sv), given by the westwarcl iutegration of the wincl stress curl 1rom Hellc1'1lwnn and Rosenstein's [1983] annual c:lil1latology. Contour interval is 2 Sv.
PENDUFF ET AL.: EA.STERN NORTH ATLANTIC CIRCULATION AND DYNAIVlICS 22,321
5DN
35.21
3DNL---------~-----------L----------~ 4DW 30W 20W 10W DE
Figure 6. lVlodel salinity at 1100 m averaged over the last year of integration. The surimposed segment is [itted to the northern limit of the Mediterrannean Water tongue (contour 35.11) as shown in Richanlson and Tychensky [1998, Plate 4J.
those deduced from the RLMB climatology. The NAC system advects 4.9 Sv of LSW across 35°W to the east, i.e., 22% less than estimated by P98. This LSW flow then splits into three main branches (Figure 3c): Using the local criteria chosen by 1'98, 1.4 Sv of LS'iV (1.5 Sv according to P98) flow toward the Subpolar Gyre across 54°N; a second branch follows the eastern Hank of the MAR southward with local recirculations toward the western basin, and finally flows arouncl the Azores Plateau; the third branch goes across the eastern basin, steel's southeastward and passes to the south of the Azores. The model concentrates this third branch along the Porcupine Bank north of 48°N. This feature appears unrealistic and due to the use of sigma coordinates since it is also observed in the resting stratification case. Knochel [1998J reports a similar tendency ill a coarse-grid North Atlantic configuration of SPEi'vI; his results suggest that a significant increase (almost double) in the vertical resolution would correct this discrepancy. When LSW is identified with the same local criteria as P98 across "14°N (2.8°C< g < 4°C, S < 35), the southward transport of LSvV between 35°W and the coast is 6.9 Sv (i.e., "14% more than in P98), of which 1.5 Sv (i.e., 50% less than P98) flows east of the i'vIAR. The afromentioned local recirculations of LSW toward the western basin are probably favored by the deepening of the lVIAR consecutive to topographic smoothing and probably cOIltributes to the weak southward flow of LS'iV in the eastern basin. It should be rnentioned that model LSVi' transports are very sensitive to small changes in temperature and salinity ranges, especially along 35°VV and "14°N. In addition, the way LSW characteristics evolve by mixing between these sections depends on the model formulation and parameters. These
two reaSOIlS explain why P98's local criteria cio not lead here to a closedll1ass budget for the LSW. Whell modelee! LSW transports are consideree! inclividually, their agreement with P98 are UnIS rnodest a.t LiLloN, good at 35°\V, aue! excellent at 5LloN.
A 1.8-Sv souUl\vard How is sinllliated by the model between 1500 aud 2500 Hl south of 39°N along the eastel1l boundary. IL is associated with an a.nticyclone ceIltered around (15°'iV-32°N) near the southern open boundary. This along-shelf souUnval'd How is also present in P97 and is probably unrealistic.
Below 2500 m in the subtropical gyre the model drives a 3.5 Sv to 8.8 Sv deep allticyclollic circulation. Tt is clepicted by the dark loop in Figure 3c ancl ha.s a siglla.ture on '1/) along the coast of Europe (Figure 4). This circulation is opposite to that observed by Dickson el;
al. [1985], and may be clue to the use of sigma coordinates since a southward How along the coast of Portugal is also visible in the resting stratification case, and in coarse- and fine-grid' North Atlantic configurations of SPEM [Knochel, 1998; DYNAMO Gm'Up, 1997J. In the present regional configuration, in particular, this discrepancy at depth can hardly be compensated for by either the Im'gely passive self-adapting southern open boundary or the surface forcing which mainly affects the layers located above the marlœd thermocline.
3.3. Zonally Averaged Circulation in the Intergyre Zone
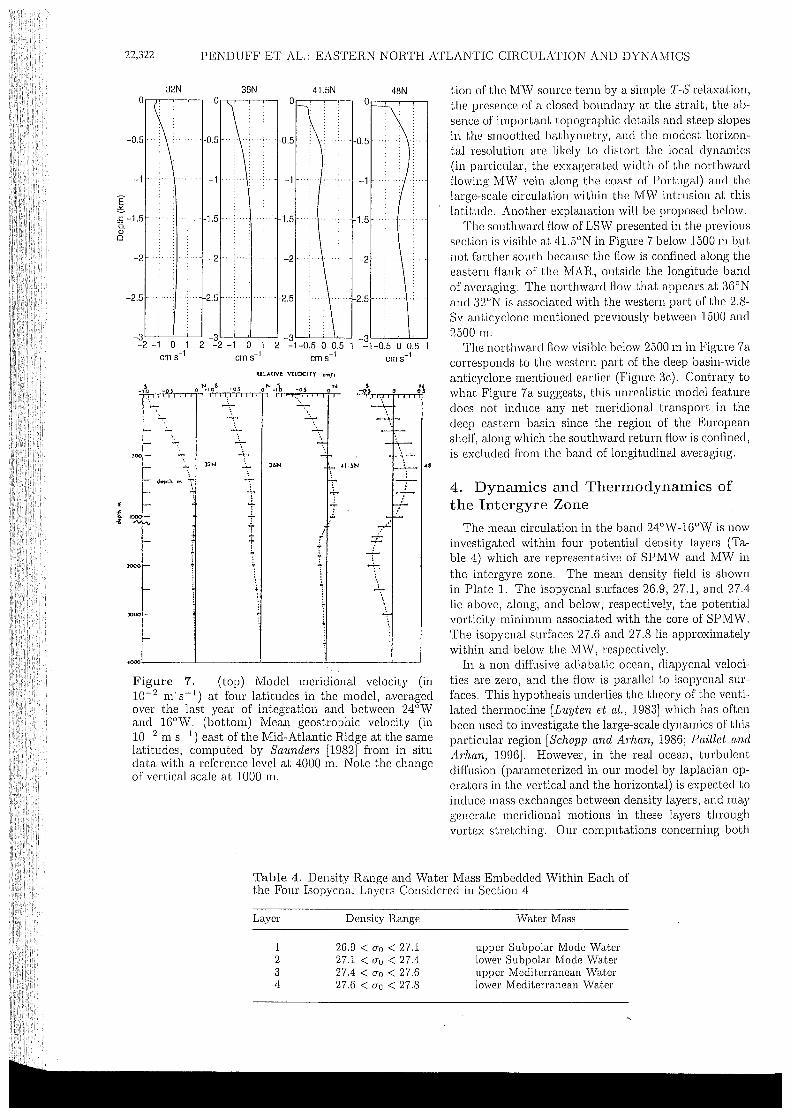
By way of an introduction to section 4, the zonally and annually averaged model meridional velo city field is presented at different latitudes in Figure 7. Below the ageostrophic surface Ekman layer this figure may be compared with the zonally averaged absolute geostrophic velo city field estimated from hydrography by Sa'Undel's [1982J (Figure 7b) at the same latitudes, under the assumption of a Sverdrupian barotropic flow. Since the geostrophic balance and the Sverdrupian nature of the depth-integrated How may be affected by ageostrophic currents and topographic effects along the eastern boundary and sin ce the model results exhibit a few discrepancies along the coast, we chose a band of zonal averaging (24°I'V-16°W) narrower than that considered by Saunders (t'rom the lVIAR to the eastern boundary). Our estimate is still representative of the large-scale circulation in the eastern basin can be compared to the estimate by Saunders.
Between 48°N and 30 0 N the southward advection of Central Waters and SPMW by the N AC recirculation is well simulated within a surface layer that thiclœns southward (from 300 to 800 m). North of L15°N, below this surface current, denser SPlVIIV flows northward within a layer that thiclœns progressively, as estimatecl by Saundcl's [1982J.
Around 1000 m within the tongue of MW the model meridional How is weak at aIl latitudes; it is oriented southward at 36°N and 41.5°N and northward north of about 45°N. Sa'Undel's [1982J reports a poleward How at this latitude, but also at 41.5°N. This model discrepancy may be related to the crude l'l'presentation of the lVIW overHow in the Gulf of Cadiz. The parametriza-
22,322 PENDUFF ET AL.: EASTERN NORTH ATLANTIC CIRCULATION AND DYNAMICS
32N 36N 41.5N 48N
-1
I li -1.5-<Il o
-2
-2.5
-3 -3 -3 -3 L--'---'--l..l.--' -2 -1 0 1 2 -2 -1 0 1 2 -1-0.5 0 0.5 1 -1-0.5 0 0.5
cm s-l cm S-l cm s-l cm s-l
ItElArrvE VUOCIfY t'"fJ
o "'!l oS .... Ol l ,
~
12N J6 ...
... 0'
i J-'"~,
1 =T
T t r
T T
~oot
\. \ ,
.oooL--'-------"-__ ~----'--_ __' Figure 7. (top) Model meridional velo city (in 10-2 m' S-l) at four latitudes in the model, averaged over the last year of integration and between 24°'W and 16°W. (bottom) Mean geostrophic velo city (in 10-2 m S-l) east of the Mid-Atlantic Ridge at the same latitudes, computed by Sav,ndeTs [1982] from in situ data with a reference level at '1000 m. Note the change of vertical scale at 1000 m.
tion of the MW source tenn by a simple T-S relaxation, the presence of a closed boundary at the strait, the absence of important topographic cletails and steep slopes in the smoothed ba.thymetry, and the l110dest horizontal resolution are likely to dis tort the local dynamics (in particular, the exxageratecl width of the northward Howing M\V vein along the coast of Port1Jgal) a.nd tlw large-scale circulation wi thin the MW intrusion at this latitude. Another explanation will be proposed below.
The southward How of LSvV presented in the previous section is visible at ,n.5°N in Figure 7 below 1500 m but not farther south because the flow is confined along the eastern flank of the IVlAR, outside the longitude band of averaging. The northwarcl flow that appears at 36°N and 32°N is associated \Vith the western part of the 2.8-Sv anticyclone mentioned previously between 1500 and 2500 m.
The northward How visible below 2500 m in Figure 7a corresponds to the western part of the deep basin-wide anticyclone mentioned earlier (Figure 3c). Contrary to what Figure 7a suggests, this unrealistic model feature does not induce any net meridional transport in the deep eastern basin since the region of the European shelf, along which the southward return flow is confined, is excluded from the band of longitudinal averaging.
4. Dynamics and Thermodynamics of the Intergyre Zone
The mean circulation in the band 24°'W-16°W is now investigated within four potential density layers (Table 4) which are representative of SPMW a.nd MW in the intergyre zone. The mean density field is shown in Plate l. The isopycnal surfaces 26.9, 27.1, and 27.4 lie above, along, and below, respectively, the potential vorticity minimum associated with the core of SPM\V. The isopycnal surfaces 27.6 and 27.8 lie approximately within and below the 1\11\'\1, respectively.
In a non diffusive adiabatic ocean, diapycnal velo cities are zero, and the flow is parallel to isopycnal surfaces. This hypothesis underlies the theory of the ven tilated thermocline [Luyten et al., 1983] which has often been used to investigate the large-scale dynamics of this particular region [Sehopp and ATha:n, 1986; Paillet and Al'han, 1996]. However, in the real ocean, turbulent diffusion (parameterized in our model by laplacian operators in the vertical and the horizontal) is expected to induce mass ex changes betweo.n density layers, and may generate meridional motions in these layers through vortex stret.ching. Our computations conce1'l1ing both
Table 4. Density Range and Water Mass Embedded vVithin Each of t.he Four Isopycna.l Layers Considered in Section 4
Layer
1 2 3 4
Density Range
26.9 < (TQ < 27.1 27.1 < (Ta < 27.'1 27.'1 < (Ta < 27.6 27.6 < (To < 27.8
yVater Mass
upper Subpolar Mocle \Vater lower Subpolar fI/Iocle yVal;er upper Mecliterrallcall \Vater lower Mecliterraneall Water
PENDUFF ET AL.: EASTERN NOHTH ATLANTIC CIllCULATION AND DYNAiVIICS 22,323
pt oœ~ses are explained in sectioll '1. 1; the dynatnical impact of vertical and hori2011tal dilfusion is presented in section 4.2; the illlportallce of diapycnal tnwsfers with respect to the adiabatic part of the (low is discllssed ill seci;Îoll '1.3.
4.1. Diagnostics
4.1.1. Buoyancy balance. The density equation may be written as follow8 (subscripts /, and z denote the temporal and vertical pa.rtial deri vatives):
" " Ir ],(., PI +:li .vp-l-'lV.p= = t"pzz -1- "V-p-l-S, (1)
where p, :li", w, 1(v, 1(", and S denote the density field, the ltori20ntal and vertica.l velocity fields, the vertical and horizontal diffusion coefficients, and the surface density fluxes, respec:tively. Since the annually averagecl stratification is stable and since the vertical coordinate z increases upward, p= is negative everywhere.
In the following sections, wc shall fOClts on the Inean state of the ocean interior, which is not directly affected by atmospheric fluxes S, nor by convective events. The first andlast terms in equation (1) will thus be neglected and our investigations restricted to south of about 50oN. Away l'rom convection regions, after a temporal averaging, equation (1) provides the following expression for the annual mean vertical velo city field w:
WcV WeH
In this equation, 'W is expressed as the sum of its isopycnal (w;) and diapycnal ('Wc) components. Diapycnal
velo ci tics Wc can be induced by vertical and horizontal diffusion, the respective contributions of which are denoted by 'WcV and WcN. Along a steady isopycnal surface a positive value of 'WcV (WcH, respectively) means that vertical (horizontal, respectively) diffusion induces an upward transport across the surface which tends to inHate the lighter layer located above the isopycnal at the expense of the heavier one located below, and therefore to decrease the density averaged over this pair of layers. Since the annually averaged density field is almost steady, such a trend in the density equation (2) must be compensated for by other tenns. Despite the fact that the values of 1(u and Kit are set by numerical stability requirements and may be overestimated in the model, and that sorne pro cesses known to induce diapycnal mass transfers (like double diffusion below the lVIW intrusion [11'l·7ul'lI., 1987; Paillet et al., 1998]) are not taken into account, our annually averaged nurnerical solution may provide information about the origin and the dfect of 'lUeV anc! WcH on the meridional circulation in the intergyre zone.
The model vertical velo city 'W was deduced from the annually averagecl horizonta.l How using SPETvI's original conti nuit y equation. The tenns 'Wi, 'Wev, and 'lUeIl
were computec! hom the annual mean density and velocity fields, and from the local values of 1(u and 1("
according to their individual expressions given in equa-
tion (2). The tenus 'W, 'Wi, 'lUe V , and 'WcH weI'() tlten intcl'Jlola.ted and smootlted a.loug the (ive selected isopycnal ~llrfaces, alld averaged between 2LIO\V andLGO\~T.
The balance in equa.tion (2) cannot be verifiee! perl'ecLly ill the mode] solution beCaUSl) surface fluxes force convective lllixing down tu a certain level, because of the averaging and interpola.tillg errors, and because T and S trends may persist. The ma.ximum residual vertical velocity tolerated in equation (2) was arbitrarily set to 'Wlim = 2 X 10⁻⁷ 111 S-I. During the 38th year of integration the temperature trend in the subtropical gyre is about 2.5 x lO-:J oC pel' year above 1000 m and 5 times sm aller below 1000 m (sec POO). Taking typical values of (Jz frmn Plate 1 (10- 3 ° C 111 -1 and 5 x 10⁻⁴ oC rn-1 above and below 1000 m) and a thermal expansion coeHicient of about - 2 x 10⁻⁴ (0 C)-I shows that this thermal drift illduces in equation (2) an imbalance srnaller than 2 x 10⁻⁸ m s-1 above 1000 m and 2.5 smaller below that depth. The errors induced by the salinity drift, computed with a haline contraction coefficient of 8 x 10⁻⁴ are several orders of magnitude sm aller than those due to the thermal drift. These errors are clearly smaller than 'Wlill1: the imbalance in equation (2) is expected to be due to convective events and/ or to the interpolation procedure rather than to temperature and salinity drifts.
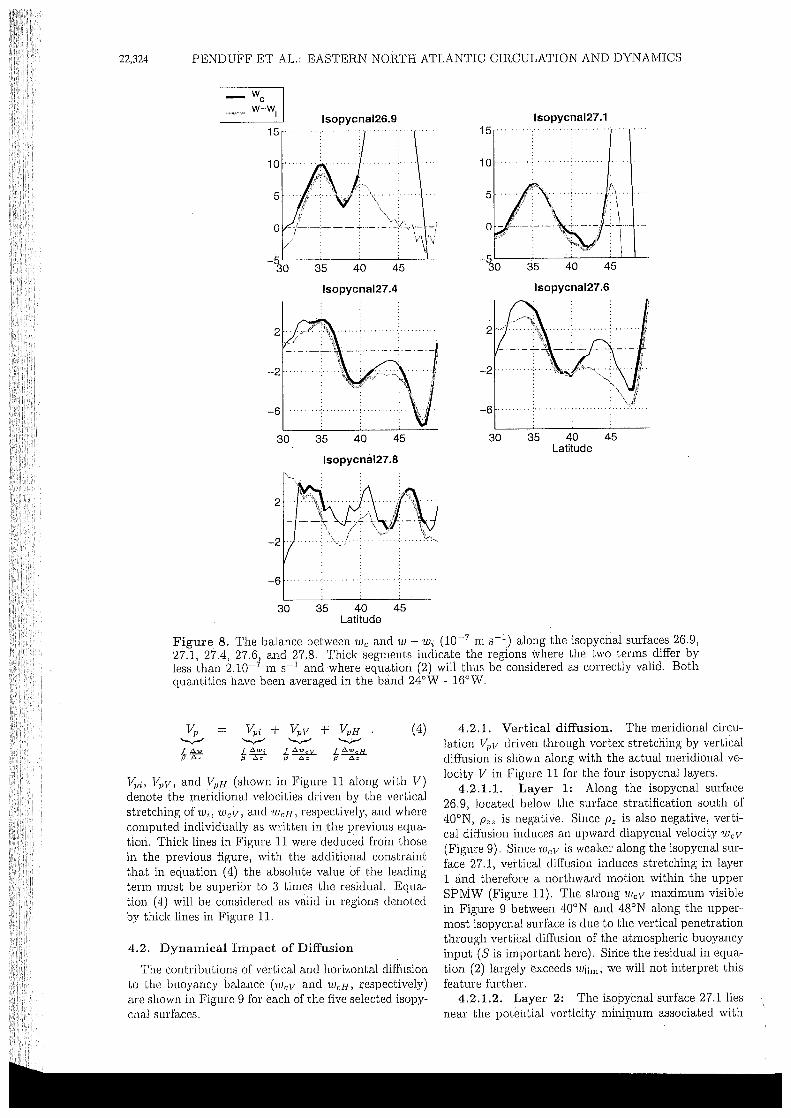
Figure 8 highlights the regions where our results can be interpreted, i.e., where the residual in equation (2) (the departure between 'lUe and 'W - 'lUi) is smaller than 'Wlim. In Figures 8 and 9, thick lines indicate where this criterion is verified. Equation (2) appears to be more correct along the three upper isopycnal surfaces than along the other two (the model dynamics in isopycnal layers 3 and 4 will thus be interpreted with caution), but SOllle large-scale trends malœ sense everywhere. Figure 9 presents the meridional profiles of 'lUcV and WcH
along the five selected isopycnal surfaces. 4.1.2. Vorticity balance. In the isopycnallay
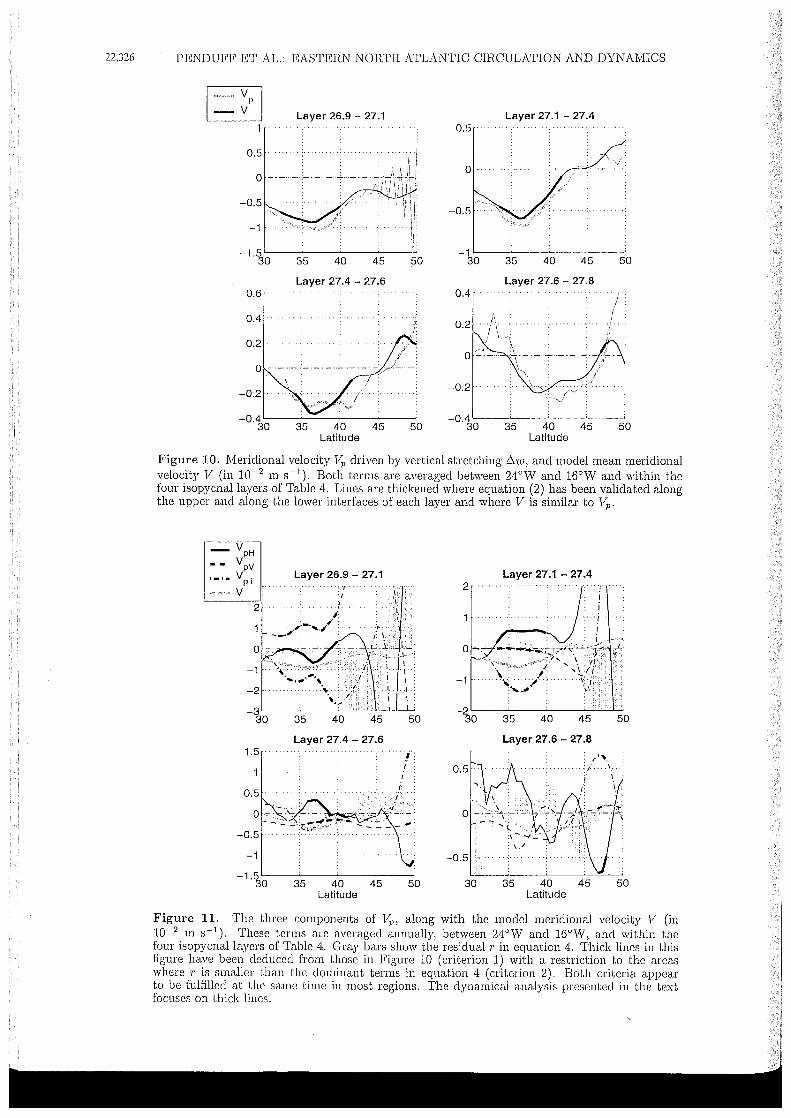
ers of Table 4 we shall investigate how the model mean meridional circulation, averaged between 24°'W and 16°\<V, is inHuenœd by the difi'erent components of vertical stretching. Let us consider an isopycnallayer of local thickness ~z, and let 1~) den ote the layer-averagedlocal meridional circulation induœd by vortex stretching. It is proportional to ~'W, the vertical velo city difference between the upper and lower limits of the layer:
f ~w 7J ~z' (3)
where f and (3 denote the Coriolis parame ter and its meridional gradient respectively. 1~) was computed l'rom the actual model vertical velo city 'W interpolated along the isopycnals given in Table '1. Figure 10 presents 11 andl!". Thick lines in this figure locaLe the areas where the following conditions are fullfilled in a given isopycnal layer: l'lUI < 'lUlim along its upper and lower limits, and the large-scale trends of 11 are similar to those driven by vortex stretching (1'~)). There the large-scale How is mainly controlled by geostl'Ophy. Substituting (2) in (3) gi ves the following expression for 1!,):
22,324 PENDUFF ET AL.: EASTERN NORTH ATLANTIC CIllCULATION AND DYNAIVIICS
=:~WII Isopycnal26.9
15 .
\.
_5L---~----~--~--~
30 35 40 45
Isopycnal27.4
30 35 40 45
Isopycnal27.8
-6
30 35 40 45 Latitude
15 .
10
30
Isopycnal27.1
Isopycnal27.6
35 40 45 Latitude
Figure 8. The balance between 'Wc aild 'W - 'Wi (10-7 m S-l) along the isopycnal surfaces 26.9, 27.1, 27.4, 27.6, and 27.8. Thick segments indicate the regions where the two terms differ by less than 2.10- 7 m S-l and where equation (2) wili thus be considered as correctly valid. Both quantities have been averaged in the band 24°W - 16°W.
(4)
1~)i, 1~N, and 1~J!I (shown in Figure 1l along with 11) denote the meridional velocities driven by the vertical stretching of Wi, 'Weil, and 'WcII, respectively, and where computed individually as written in the previous equation. Thick lin es in Figure 1l were deduced from those in the previous figure, with the additional constraint that in equation (4) the absolute value of the leading terrn must be superior to 3 times the residual. Equation (4) will be considered as valid in regions denoted by thick lines in Figure 1l.
4.2. Dynamical Impact of Diffusion
The contributions of vertical and horizontal diffusion to the buoyancy balance ('Weil and 'WcH, J;espectively) are shown in Figure 9 for each of the rive selected isopycnal surfaces.
4.2.1. Vertical diffusion. The meridional circulation 1~N driven through vortex stretching by vertical diffusion is shawn along with the actual meridional velocity 11 in Figure 1l for the four isopycnal layers.
4.2.1.1. . Layer 1: Along the isopycnal surface 26.9, located below the surface stratification south of 40o N, pzz is negative. Since Pz is also negative, vertical diffusion induces an upward diapycnal velo city 'Weil
(Figure 9). Since 'Weil is weaker along the isopycnal surface 27.1, vertical diffusion induces stretching in layer 1 and therefore a northward motion within the upper SPMW (Figure 11). The strong 'Weil maximum visible in Figüre 9 between 400 N and 48°N along the uppermost isopycnal surface is due to the vertical penetration through vertical diffusion of the atmospheric buoyancy input (5 is important here). Silice the residual in equation (2) Im'gely exceeds 'Wlim, we will not interpret this feature further.
4.2.1.2. Layer 2: The isopycnal surface 27.1 lies near the potential vorticity minÜ.pum associated with
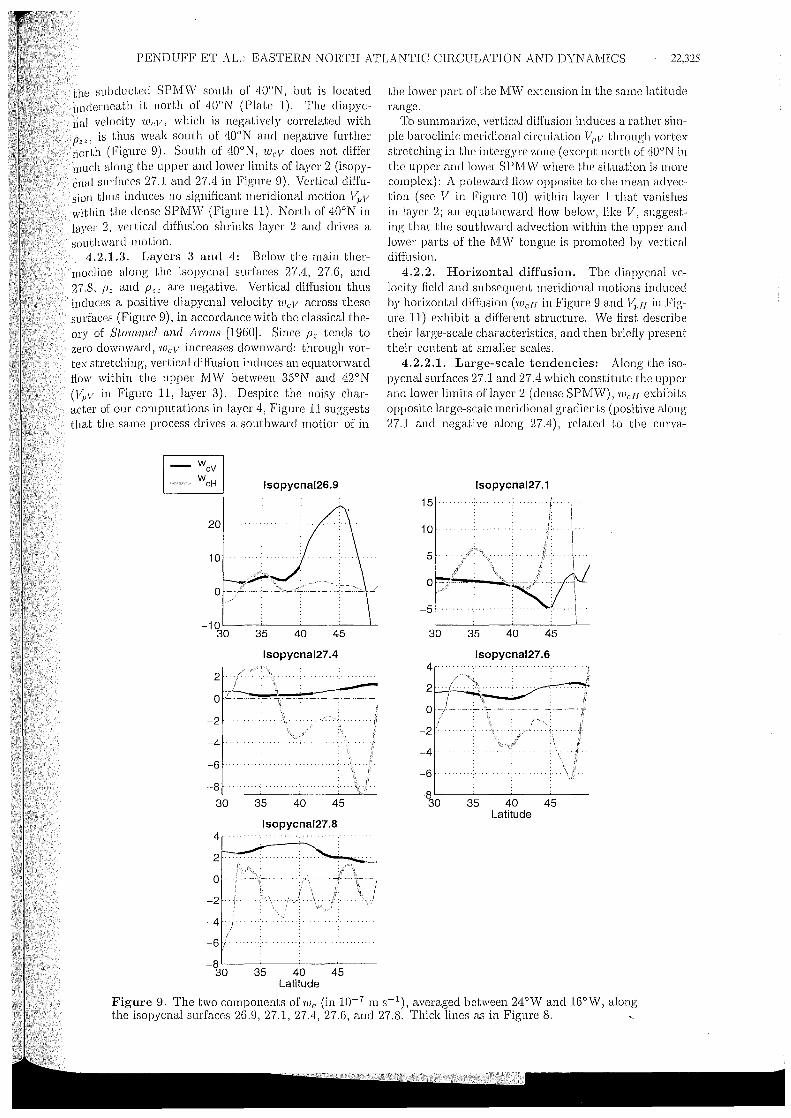
PENDUFF ET AL.: EASTERN NOHTH ATLANTIC CIRCULATION AND DYNAMICS 22,325
the subcluctecl SPMW south of 'JOoN, but is located undel'lleath it north of 'JOoN (Plate 1). The diapycnal velocity wc\!, whieh is negatively correlated with pzz, is thus weak south of 400N and negative flll'ther north (Figlll'e 9). South of LIDoN, 'Wc\! do es not difIer rnueh along the upper and 10IVer limits of layer 2 (isopyenal surfaces 27.1 a.nd 27.'1 in F'ignre 9). Vertical difFusion thus illcluces no signiJieant meridional motion \~N within the dense SPMW (Figure 11). North of 400N in layer 2, vertica.l diffusion shrinks layer 2 and drives a southwétrd motion.
L1.2.1.3. Layers 3 and Ll: Below the ma.in therrnocline along the isopyenal surfaces 27.4, 27.6, and 27.8, Pz and pzz are negative. Vertical diffusion thus indu ces a. positive diapyenal velocity 'Wc\! aeross these surfaces (Figure 9), in accordance with the classieal theory of S/;ommel and A1'Ons [1960]. Since Pz tends to zero downward, 'Weil increases downward: througlt vortex stretehing, vertical diffusion induces an equatonvard How within the upper MvV between 35°N and 42°N (\~N in Figure Il, layer 3). Despite the noisy character of our computations in layer 4, Figure 11 suggests that the same process drives a southward motion of in
Isopycnal26.9
20··
10
o
-10~--~----~--~----~
30 35 40 45
Isopycnal27.4
2(':' .: ....•... ,~~ o ·~·-"-"·.-·ë· -"'-:""'---' -:.- ... - ... -
-2
-4
-6
-8 L-____ ~ ____ ~ ____ ~~~
30 35 40 45
Isopycnal27.8 4
_8L---------~----------30 35 40 45
Latitude
the lo\\'er part of the i'vnV extension in the sarne latitude range.
1'0 summarize, vertical difl'usioll induces a rather simple baroclinic meridional circulation l~N through vortex stretehing in Uw intergyre zone (except north of LiooN in the upper andlower SPM,V \\'here the situation is more complex): A polewarcl Ho\\' opposite to the rnean advection (see V in Figure 10) within layer 1 that vallishes in layer 2; an eq uatorward How below, lilce V, suggesting that the southward advection within the upper and lower parts of the IVIW ton gue is promot.ed by vertical difl'usion.
4.2.2. Horizontal diffusion. The diapycnal veloc:ity field and subsequent meridionalmotions incluced by horizontal diffusion (WcH in Figure 9 and \~JH in Figure 11) exhibit a different structure. IVe first deseribe their large-seale charaeteristics, and then briefly present their content at sm aller seales.
4.2.2.1. Large-seale tendencies: Along the isopyenal surfaces 27.1 and 27,4 wllieh constitute the upper andlower limits oflayer 2 (dense SPlVIW), 'WcH exhibits opposite large-seale meridional gradients (positive along 27.1 and negative along 27,4), relatecl t.o the curva-
15
10
30
Isopycnal27.1
'/'. r 1 1 .f.:.
35 40 45
Isopycnal27.6
o 7-'-''-''['--'---''':_--'
-2 ;'
-4
-6
. "."'. "
.. ./i.
.. : ... \)'.
_8L---~----~----~----
30 35 40 45 Latitude
Figure 9. The two components of 'Wc (in 10-7 111 S-1), averagecl between 2'1°VV and 16°,V, along the isopyenal surfaces 26.9, 27.1, 27,4, 27.6, and 27.8. Thiek lines as in Figure 8.
22,326 PENDUFF ET AL.: EASTERN NORTH ATLANTIC CIRCULATION AND DYNA1VIICS
Layer 26.9 - 27.1
-1.5'---~--~--~--'-
30 35 40 45 50
Layer 27.4 - 27.6 0.6
0.4
0.2 .
-0.2
-0.4'---~--~--~-~ 30 35 40 45 50
Latitude
Layer 27.1 - 27.4 0.5
-1'---~--~--~-~
30 35 40 45 50
Layer 27.6 - 27.8 0.4
-O.4L-_~--~-~--~
30 35 40 45 50 Latitude
Figure 10. IVIeridional velo city IIp driven by vertical stretching 6.w, and model mean meridional velo city 11 (in 10-2 m S-l). Both terms are averaged between 24°'W and 16°\V and within the four isopycnallayers of Table 4. Lines are thickened where equation (2) has been validated along the upper and along the lower inte~faces of each layer and where 11 is similar to 1Ip.
Layer 27.4 - 27.6 1.5 ,
1 1 1
1 Q5 i
-1.5'---~--~--~-~
30 35 40 45 50 Latitude
Layer 27.1 - 27.4
_2L--~--~-~~~~
30 35 40 45 50
Layer 27.6 - 27.8
l' ". 0.5 ":/,, .\.
: ;' \.'
--. \ .. ..' i f °r~2~:·:T~-~.;~t8(J-Cl!.~<)C~i\
, : \ ,/ ~ ':' ~ . -0.5····:,,·: .......•
30
· . . · . . · . . .
35 40 45 Latitude
50
Figure 11. The three components of 1~), along with the model meridional velo city 11 (in 10-2 m S-l). These tenl1S are averaged annually, between 2Ll°\V and 16°'W, and within the four isopycnallayers of Table Ll. Gray bars show the residual l' in equation 4. Thick tines in this figure have been deduced from those in Figure 10 (criterion 1) with a restriction to the areas where T is smaller than the dominant terms in equation 4 (criterion 2). Both criteria appear to be fulfilled at the saIne time in most regions. The dynamical analysis presentee! in the text focuses on thick lines.
PENDUFF ET AL.: EASTI<;RN NOHTH ATLANTIC CIRCULATION AND DYNAMICS 22,327
ture of isop)'cnal surfaces. Betweell 33°N and 42°N \Vi thill the lowel' SP IVIVV the subsequellt vertical stretching th us induces a. northwarcl JllOtiOIl which Coullteracts the equatorward motion or dense SPMW sinlUlatecl b)' the model ('~dl êllld V ill Figure Il). Along the iso pycna.1 surfaces 27.'1 and 27.6, Weil decreases Ilortll\vard ill a simili1l' fnshioll inclicatiIlg tha!; horizontal diffusion does not drive an)' large-scale mericlional circulation throngh vortex stretching in the upper MvV (Figure Il). However, 'WeH exhibits no large-scale rnericlional gradient along the isopycnal surface 27.8. In layer 4 (lower M'iV), horizontal difl'usion is Iike!y to contribute to the simulated equatorwarel flow V north of about LiDON and to oppose it south of LiDON.
4.2.2.2. 8111a11e1' scaIes: The eliapycnal velocity 'WcH ineluced by horizontal diffusion also varies at scales of about 600 km. Figure 9 shows a regular succession of 'WcH extrerna nectr 35°N, LiDoN, and LI5°N-LI8°N throughout the water colunm. The southernmost peak is visible along the northern Hank of the AC (35°N) where the four uppermost isopycnal surfaces exhibit a dome-Iike shape (Plate 1). Horizontal diffusion tends to flatten this curvature an Iighten the water column. Through vertical stretching, this eliffusive effec!; locally intensifies the equatorward f10w V in layer l, and counteracts it in layers 3 and 4 (Figure Il).
The 'WcH local minimum (elensity gain) diagnosed at 'lQoN across the four uppermost isop.l'cnal surfaces (and at L17°N across 27.'1 and 27.6) comes from the loca1 tendency of the isop.l'cnal surfaces to rise northward. Since these minima are not located at exactly the same latitude, their effect OIl meridional motions is complex and difficul t to interpret.
4.3. Adiabatic and Diabatic Motions: 8unllna1'y
The impact of diffusion on the intergyre circulation is now compared with the adiabatic motion Vpi that could exist within the isopycna.lla.l'ers without an.l' diap.l'cnal mass Hux, between solid isopycnal surfaces. Unlike Vpjl
and I~JH, which are forced locally by diap.l'cnal edd.l' fluxes, V;,i is forced in the regions where the density la.l'ers outcrop (by high latitude convection or Ekman pumping). A motion may thus be considered as adiabatic w here 1~J\I and 1~!l1 are smaller than I~Ji.
Figure 11 shows that the meridional stuctures of 11 and 1~,i are similar south of about 40 0 N in layers 1 a.nd 2. Within the SPMW the model behavior is comparable to the idealized ventilated thermocline solutions, but the ventilation of SPMW is slowed by eddy diffusion et~ fects (vertical diffusion in the upper SPMW, horizontal diffusion in the lower SPMW). The situation is comparable north of about 45°N in layer 3, where the realistic poleward flow simulated b.l' the model coulel exist without diap.l'cnal mixing (11 and I~Ji > 0). This corroborates the analytical results of Schapp and A'I'han [1986] based on the ventilated thermocline adiabatic hypothesis. This flow is probably driven northward by positive Ekman pumping in the subpolar g.l're, where our third layer outcrops. As for the SPlVIW, the rnodel suggests that this motion is sloweel down by horizontal diffusion,
JlcrhaJls too mu ch since V is rather weak. vVe lllentioneel a.bove that the observee! polewarclmotion of M\V is lIOt simula.ted by the rnoclel between 36°N and 45°N. 1"l'Oin a local analysis based on in situ data, lb/w.n [1987] deIllOllstratecl tha.t this 1t10tiOll ma.l' be clriven b.l' salt fillgering below the iV[\V intrusion. This mechanism, wltich generates up gradient elellsity fluxes through clifferential salinit)' and temperature vertical clifl'usioll, is Ilot parameterized in the mode\. Ir this process is actually at worle ami significant thl'oughout the basin, the subsequent northware! motion is thus not expectecl to be sirnulated b.l' the model south of 45°N.
The clownward clecrease of Pz below the main thermocline is lilœl.l' to induce a downward increase of 'WeI',
a negative 1~J\I through vortex stretching, and a southward motion of diabatic origin within la.l'ers 3 and Ll. Indeed, within the upper and lower iVl\~l, I~Ji does not follow V as weil as within the SPlVIW.
5. Conclusion
The aims of this worle were to describe and validate the mean solution obtained in a coarse-resolution regional moclel of the eastern North Atlantic, and to investigate the large-sc ale equilibrium dynamics of the interg.l're zone. The computational domain is restricted to the basin of intel'est thl'Ough the use of three selfadapting open boundaries that leave the barotropic curreats locally unconstrained. The mode! is integrateel over 38 .l'ears with a variable surface and baroclinic lateral forcing, and l'eaches a stead.l' annual-mean state (moclulated by the seasonal cycle) despite the wide opening of the basin to the rest of the Atlantic. The final annuall.l' averaged circulation, stratification anel forcing are adjusted mutuall.l' and provide a plausible picture of the ocean mean state in the basin.
The North Atlantic Current (NAC) brings about 40 Sv into the eastern basin ab ove the Miel-Atlantic Ridge (lvIAR), where it shifts slightl.l' northward. As shown in recent studies, 30% of this transport seem to be induced b.l' topographic efl'ects. East of the MAR the NAC splits into till'ee main branches whose paths and transports agree with different in situ estimates. Two thircls of the NAC recirculates toward the subpolal' g.l're. A 13-Sv Irminger Current circulates cyclonica.lly and joins the East Greenland Current which transport reaches the realistic value of LlO Sv.
South of about L17°N above 800 m, 4.5 Sv of thermocline waters are advected toward a realistic Azores Current (AC), which transport exceeds 9 Sv across 35°W and elecreases eastward. As far as we lenow, the AC had uever been simulated by coarse-resolution models. The combined use of a self-adapting western open bouncla.l'Y tha.t maintains the ba.roclinic structure of incoming currents and of a T-S climatology [Reynaud et al.) 1998] that represents the density fronts quite weil partly explains this interesting feature. Unlilee another wind data set that we used in a sellsitivit.l' experiment [Penrl'ujj; 1998], the wind climatology of Hellennann and Rasensl;ein [1983] also contributes to the presence of the AC since its mean curl forces an eastward flo\\' between
22,328 PENDUFF ET AL.: .EASTERN NOHTH ATLANTIC CIRCULATION A.ND DYNAMICS
30 0 N and 35°N (Figure 5). The local entraiIllllent of surface waters into the IVI\V in the Gulf of Caclil\, pararneteri~ecl by a simple relaxation of tracers, also significantly increases the AC transport. This feature was previollsly mentionecl by Jia [2000]. The sensitivity of the AC transport to the wind forcing and to the relaxation in the c: ull' of Cacli~ COllfilTllS that the transport or incollling currents (in particular AC and NAC) is not prescribecl along the western self-aclapting open bOUIlCIal'\, but is inlluencecl by iuterior processes.
South of the NAC above 2000 !YI the rnain circulation is correctly simulated. Its dynamicaJ origin was investigatecl through the buoyancy and vorticity balances. The southward motion of thennocline waters and Subpolar IVlode 'Water agrees with previous studies ancl is consistent with a ventilated thermocline acliabatic solution, globally slowecl clown by cliIfusive effects. A similar clynamical regime is found between 500 and 1000 m north of '15°N, where the How is directecl northwarc!. Positive Ekman pumping in the subpolar gyre is likely to drive this northward motion adiabatically, as shown by Scho]JJi and .Ib·han [1986] with a model of the ventilatecl thermocline; this How is slowed down in the present moclel by eddy diffusive effects. South of '15°N, vertical diffusion indu ces a slow southwarcl clrift of the M\V through vortex stretching, instead of the observed northward flow. The absence in the moclel of any parametrization of salt fingering, a process which could force this motion [Al'han, 1987; S]Jrill, 1999], is a possible explanation for this discrepancy. Another explanation is the crude representation of the lVrW overflow process in the Gulf of Cadiz and of the subsequent spreacling of the MW into the Atlantic (simple relaxation of tracers and closed boundary near the Strait of Gibraltar, com'se resolution, sllloothecl topography). The paths and transports of Labrador Sea vVater over the basin globally agree with observations.
Our computation of the tenus involved in the buoyancy and vorticity balances is rather simple and could be improved. First, our annually averaged solution represents a steady clirnatological state that is lm'gely modulated by interannual variability in the real ocean, especially within the intergyre zone as noted in the introduction; the use of an lllultiyear surface forcing would certainly generate a more realistic fluctuating regirne in the illtergyre zone. On the other hand, the explicit representation of mesoscale eddies, a better vertical resolution, and an efficient parametrization of salt fingering are likely to make the model solution and of OUl' diagnostics more realistic. In the future, an on-line C0111-
putation of diffusive terrns would be necessary to close the buoyancy and vorticity balances, and to quantiry the contribution of the mesoscale eclclies.
Acknowleclgments. Useful discussions \Vith IvI. Arhan and J. Paillet are gratefully ackno\VledgecL ,'Ve thank the t\Vo anonymous revie\Vers who contributed to irnprove the manuscript. This research was supported by a. DR.ET doctoral fellowship for 3 years, and by a SHOM research contract for the fourth year.
References Arhan, IvI., Ou the large scaJe dyllalllics of the Mediter
rallcan outJlow, Dcc]) Sel/. Res., 34, 1187-1208, 1987. Arhan, I\lL, A. Colin de Verdiere, and l'l. IVlercier, Direct; ob
servatious or the Ulean circulation at 48°N in the Atlant;ic Ocean, J. Thys. Oceml.ogr., ./9,161-181,1989.
Bacon, S., Dccadal variability in the outJlo\V ('rom the Nordic Seas to the cleep Atlantic Ocean, Na.tnrc, 394, 871-874, 1998.
Baruicr, B., L. Siefridt, and P. Marchesiello, Thermal forcing for a global ocean circulation model using a t;hree-year clilllatology of ECIVlWF analyses, J. Mn7'. Syst., 6, 363-380, 1995.
Bmnicr, B., P. Marchesiello, A.P. de I\lliranda, J.M. IVlolines, and l'vI. Coulibaly, A sigma-coordinat;e primitive equation model for studyiug the circulation in the South Atlantic, I, l'dodel configuration with error estimates, DCCl! Sea. Res., 45, 573-608, 1998.
Brügge, 13., Near-surface mean ciculation and kinetic energy in the central North Atlantic l'rom drifter data, J. Geophys. Res., 100,20,5'13-20,55'1, 1995.
Bryan, F.O., C.W. Biining, and "V.R l'lolland, On the midlatitude circulation in a high-resolutÏon model of the North Atlantic, J. Phys. Oceanogr·., 25, 289-305, 1995.
Dickson, RIL, and J. Brown, The production of North Atlantic Deep ,'Vatel': Sources, rates, and pathways, J. Geophys. Res., 99, 12,319-12,341, 1994.
Dickson, RR, J. Gould, T.J. lvlüller, and C. Maillard, Estimates of the mean circulation iu the deep (> 2000m) layer of the eastern North Atlantic, PTOg. Ocennogt., 14, 103-127, 1985.
DYNAMO Group, DYNAMO, Dynamics of North Atlantic Ivlodels: Simulation and assimilation with high resolution models, 334 pp., Inst. für Meereskunde, Kiel, Germany, 1997. .
Gana, S., and C. Provos t, Circulation and fluxes of the Central Atlantic in 1983/1984 estimatecl by inverse analysis of " Topogulf" hydrographic data, J. MaT. Syst., 4, 67-92, 1993.
Gill, A.E., AtmospheTe-Ocean Dynamics, Int. Geophys. SeT., vol 30, 662 pp., Academic, San Diego, Calif., 1982.
I-Iellermann, S., and IvL R.osenstein, Normal monthly wind stress on the world ocean with elTor estimates, J. Phys. Ocea'/1.ogt., 13, 1093-1104, 1983.
Jia, Y.L., Formation of an Azores Current due to Ivlediterranean overflow in a modeling study of the North Atlantic, J. Phys. OceanogT., 30, 2342-2358, 2000.
Kelly, K, The meandering Gulf Stream as seen by the Geosat altimeter: Surface transport, position and velocity variance l'rom 73°,V to 46°,V, J. Geophys. Res., 96, 16,721-16,738, 1991.
Klein, B., and G. Siecller, Ou the origill of the Azores Current, J. Geophys. Res., 94, 6159-6168, 1989.
Knocltel, 1-1., Développement et validation d'un modèle numérique de circulation océanique à coordonnées (]' pour l'étude climatique de l'Atlantique Nord, Ph.D. thesis, 210 pp., Univ. J. Fourier, Grenoble, France, 1998.
Krauss, ,'V., E. Fahrbach, A. Aitsam, J. Elken, and P. Koske, The North Atlantic Current and its associated eddy Held southeast of Flemish Cap, Deel! Sen Res., 34, 1l63-1185, 1987.
Luyten, J.R.., and 1-1. Stommel, Gyres driven by combined wind alld buoyancy flux, J. Phys. Ocennogr., 16, 1551-1560, 1986.
Luyten, J.R.., J. Pedlosky, and l'l. StomInel, The vent;ilated thermocline, J. Thys. OCeo,nog7·., 13, 292-309, 1983.
iVlaillard, C., Atlas hydrologique de l'Atlantique Nord-Est, 32 pp, lnst. Fr. de R.ech. pour l'Exploit. de la Mer, Brest, France, 1986.
McCartney, IvLS., and L.D. Talley, ,'Varrn-to-cold water con-
PENDUFF ET AL.: EASTEHN NOHTIr ATLANTIC CIRCULATION AND DYNAMICS 22,329
version in the uorthern North Atlantic Ocean, J. Phys. Occml.ogr., 14, 922-935, 1984.
Orvik, ICA., O. Skagseth, aud l'vI. Mork, Atlantic iuflow to the Nordic Seas in the Svinoy sact;ion, Inl. WOCB Newsl., 3'l, 18-20, 1999.
Otto, L., aud H.I'vI. l'ail Aken, Surface circulat;iou in the northeast Atlantic as observed with clrifters, Dcc]! Sea Res., 43, 467-499, 1996.
Paillel;, J., and l'vI. Arhan, Shallow pycuocliues and mocle water subcluction in the eastern North Atlantic, J. Phys. Oceanogl·., 26', 96-114, 1996.
Paillet, J., and H. f'dercier, An inverse model of the eastern North Atlantic general circulation and therrnocJine ventilation, Decp Sea Res., Pad l, 44, 1293-1328, 1997.
Paillet, .1., l'vI. Arhan, ancl M.S. lvlcCartney, Spreading of Letbraclor Sea IVater in the eMtern North Atletntic, J. Geophys. Res., 103, 10,223-10,239, 1998.
Penduff, 'l'., Etucle de let clynmuique de l'Atletntique NordEst à l'aide d'un modèle numérique régionetl, 261 pp., Ph.D. thesis, Univ. de Bretagne Occidentetle, Brest, Fr'anœ, 1998.
Penduff, T., A. Colin cle Verdière, and B. Barnier, Self~ adapting open boundm-ies for a sigma coordinate model of the eastei'n North Atlantic, J. Geophys. Res., 105, 11,279-11,297, 2000.
Reid, J.L., On the totetl geostrophic circulettion of the North Atlantic Ocean: Flow pettterns, tracers and tretnsports, P1"Og. Oceanogl·., 33, 1-92, 1994.
Reynaud, 'l'., P. Legrand, H. l'vlercier, and B. Barnier, A new analysis of hydrogretphic data in the Atletntic and its application to an inverse modelling study, WOCE Newsl., 32, 29-31, 1998.
Richm-clson, P.L., and A. Tychensky, Meddy trajectories in the Cetnary BMin measured during the SEMAPHORE experiment, 1993-1995, J. Geophys. Res., 103, 25,029-25,045, 1998.
Saunders, P.M., Circulettion in the eMtern North Atlantic, J. Mar. Res., 40, suppl., 641-657, 1982.
Saunders, P.M., The flux of Overflow \Vater through the Charlie-Gibbs Fr'acture Zone, J. Geophys. Res., 99, 12,343-12,355, 1994.
Schmitz, \V.J., Jr, and l'vl.S. McCa.rtney, On the North Atlantic circulation, Rev. Geophys., 31(1), 29-49, 1993.
Schopp, R., etnd M. Arhan, A ventilated middepth circulation model for the eastern North Atlantic, J. Phys. Ocennogr., 16',344-357,1986.
Schott, F.A., and C. Boning, Evaluation of the vVOCE model in the western equatorial Atlantic: Upper layer circulation, J. Geophys. Res., 96', 6993-7004, 1991.
Siedler, G., and R. Onken, Eastern recirculation, in The
Wnrrrtwa.lCl·S]!here of the Norlh Atlantic Ocean, edited by IV. Krauss, pp. 339-36'1, Gebrüder Borntraeger, Stuttgart, Germany, 1996.
Spall, l'vl.A., A simple model of the large-scale circ1l1at;ion of i'vlediterralleanWater ancl Labrador Seil\Vater, Deep Sm Res., 46', 181-20'1, 1999.
Speer, KG., J. Gould, and :r. LaCasce, Year-long trajectories in the Labrador Sea 'Vater of the eastern North Atlantic Ocean, Deep Sea Re8., 46', 165-179, 1999.
Stommel, H., and A.B. Arons, On t;!le abyssal circubtion of the world ocean, II, An idealizedmodel of the circulation pattern and amplitude in oceanic basins, Decp Sea Res., 6', 217-233, 1960.
Stramma, L., Geostrophic transport in the warm water sphere of the easl;ern subtropical North Atlantic, J. Mm'. Res., 42, 537-558, 1984.
Sy, A., Investigation of large-scale circulal;ion patterns in the central North Atlantic: The North Atlantic CurreIlt, the Azores Current, and the Mediterranean vVater plume in the area of the Ivlid-Atlantic R.idge, Dccp Sca Res., 35, 383-'113, 1988.
Sy, A., V. Scltauer, and J. l'vleincke, The North Atlantic Current and its associated hych'ographic structure ab ove and eastwm'ds of the lvlid-Atlantic Ridge, Deep Sea Res., 39, 825-853, 1992.
Tréguier, A.IV1., Kinetic energy flnalysis of an eddy-resolving, primitive equation model of the North Atlantic, J. Geophys. Res., 9'l, 687-701, 1992.
\Vegner, G., Geostrophische OberfHichenstromung im nordlichen N orclatlantischen Ozean im international en geophysikalischen Jahr 1957/58, Ber:. Dtsch. Wiss. Komm. für: Meer:esforsch., 22, 411-426, 1973.
\Vunsch, C., and D. Roemmich, ls the North Atlantic in Sverdrup Balance? J. Phys. Oceanogr., 15, 1876-1880, 1985.
B. Bm-nier, Laboratoire des Écoulements Géophysiques et Industriels, UlVlR 5519 CNRS, BP 53X, 38041 Grenoble Cedex, France. ([email protected])
A. Colin de Verdière, Laboratoire cie Physique des Océetns, UI'vIR 6523, Université-CNRS-IFR.ElVlER, Université de Bretagne Occidentale, 29285 Brest, Fr·ance. (Alain. Colin[email protected])
T. Penduff, Center for Ocean-Atmospheric Prediction Studies, Florida State University, R.M. Johnson Building, 2035 E. Paul Dirac, Suite 200, TallahMsee, FL 32306-2840, USA. ([email protected])
(ReceivedlVlarcll 30, 2000; revised June 7, 2001; accepted June 14, 2001.)
Related Documents