Gene transcription profiling in pollutant exposed mussels (Mytilus spp.) using a new low-density oligonucleotide microarray Francesco Dondero a, ⁎ , Luciana Piacentini a , Francesco Marsano a , Mauro Rebelo a , Laura Vergani b , Paola Venier c , Aldo Viarengo a a Department of Environmental and Life Science (DISAV), University of Piemonte Orientale Amedeo Avogadro, Via Bellini 25G, 15100 Alessandria, Italy b Department of Biology, University of Genova, Italy c Department of Biology, University of Padova, Italy Received 12 August 2005; received in revised form 30 January 2006; accepted 2 February 2006 Available online 21 April 2006 Received by T. Gojobori Abstract In this study we describe the design and implementation of a novel low-density oligonucleotide microarray (the “Mytox-chip”). It consists of 24 mussel genes involving both normalizing elements and stress response related genes, each represented on the array with one or two different 50 mer oligonucleotide-probe reporters spotted in replicated samples on glass-activated slides. Target genes were selected on the basis of their potential involvement in mechanisms of pollutant and xenobiotic response. They are implicated in both basic and stress related cellular processes such as shock response, biotransformation and excretion, cell-cycle regulation, immune defense, drug metabolism, etc. The microarray was tested on mussels exposed to sublethal concentrations of mercury or a crude North Sea oil mixture. RNA samples were extracted from digestive glands of control and treated mussels for the synthesis of fluorescence labeled cDNAs to be used in dual color hybridizations. Transcription rates of two metallothionein iso-genes (mt10 and mt20), a p53-like gene and actin were quantitatively estimated also by real-time PCR to confirm microarray data. Significant alterations in the gene transcription patterns were seen in response to both treatments. © 2006 Elsevier B.V. All rights reserved. Keywords: Aquatic organism; Gene expression; Mercury; Oil; Pollutants; Quantitative PCR 1. Introduction During the last decades, coastal ecosystems have been sub- ject to increased contamination from both inorganic, e.g. heavy metals, and organic compounds, e.g. polycyclic aromatic hy- drocarbons and polychlorinated biphenyls (PCBs). Pollution caused by these contaminants represents one of the major fac- tors of environmental stress in aquatic environments, where the term ‘environmental stress’ defines all the conditions in which physiological processes of a living system are altered by ex- ternal factors. In marine organisms, and in particular in mussels, the effects of these contaminants have been extensively studied in monitoring programs (Viarengo and Canesi, 1991). In these mollusk organisms, heavy metals are known to affect the signal transduction pathways, disrupting free calcium concentration homeostasis (Viarengo, 1994; Marchi et al., 2004), and altering tyrosine kinase cascades (Canesi et al., 2001), of which the latter has also been described in mussels exposed to PCBs (Canesi et al., 2003). In addition, specimens exposed to xeno- biotic pollutants usually respond with an increased production of reactive oxygen species (ROS) (Winston et al., 1996), with direct consequences on lipid peroxidation (Moore, 1988) and DNA damage (Machella et al., 2005). In general, responses to stress stimuli are supported by a more or less important re- program of the gene expression, where a specific gene can be Gene 376 (2006) 24 – 36 www.elsevier.com/locate/gene Abbreviations: Bp, base pair; Cat, catalase; Cyp-A, cyclophilin-A; Gst, glutathione transferase; Hsp, heat shock protein; Krs, stress responsive kinase; Mgd-1, Mytilus galloprovincialis defensin-1; M-MuLV H - RT, point mutated RNAse H (minus) Moloney Murine Leukemia Virus reverse transcriptase; Mrp, multidrug-resistance protein; Mt, metallothionein; Mvp, major vault protein; Mytc-a, myticin-a; Mytl-b, mytilin-b; NSO, North Sea Oil; PCR, polymerase chain reaction; rRNA, ribosomal RNA; RT-PCR, reverse-transcription poly- merase chain reaction; SDS, sodium dodecyl sulphate; SSC, standard saline citrate; Q-PCR, real time quantitative polymerase chain reaction. ⁎ Corresponding author. Tel.: +39 0131360238; fax: +39 0131360243. E-mail address: [email protected] (F. Dondero). 0378-1119/$ - see front matter © 2006 Elsevier B.V. All rights reserved. doi:10.1016/j.gene.2006.02.015

Welcome message from author
This document is posted to help you gain knowledge. Please leave a comment to let me know what you think about it! Share it to your friends and learn new things together.
Transcript

) 24–36www.elsevier.com/locate/gene
Gene 376 (2006
Gene transcription profiling in pollutant exposed mussels (Mytilus spp.)using a new low-density oligonucleotide microarray
Francesco Dondero a,⁎, Luciana Piacentini a, Francesco Marsano a, Mauro Rebelo a,Laura Vergani b, Paola Venier c, Aldo Viarengo a
a Department of Environmental and Life Science (DISAV), University of Piemonte Orientale Amedeo Avogadro, Via Bellini 25G, 15100 Alessandria, Italyb Department of Biology, University of Genova, Italyc Department of Biology, University of Padova, Italy
Received 12 August 2005; received in revised form 30 January 2006; accepted 2 February 2006Available online 21 April 2006
Received by T. Gojobori
Abstract
In this study we describe the design and implementation of a novel low-density oligonucleotide microarray (the “Mytox-chip”). It consists of24 mussel genes involving both normalizing elements and stress response related genes, each represented on the array with one or two different50 mer oligonucleotide-probe reporters spotted in replicated samples on glass-activated slides. Target genes were selected on the basis of theirpotential involvement in mechanisms of pollutant and xenobiotic response. They are implicated in both basic and stress related cellular processessuch as shock response, biotransformation and excretion, cell-cycle regulation, immune defense, drug metabolism, etc. The microarray was testedon mussels exposed to sublethal concentrations of mercury or a crude North Sea oil mixture. RNA samples were extracted from digestive glandsof control and treated mussels for the synthesis of fluorescence labeled cDNAs to be used in dual color hybridizations. Transcription rates of twometallothionein iso-genes (mt10 and mt20), a p53-like gene and actin were quantitatively estimated also by real-time PCR to confirm microarraydata. Significant alterations in the gene transcription patterns were seen in response to both treatments.© 2006 Elsevier B.V. All rights reserved.
Keywords: Aquatic organism; Gene expression; Mercury; Oil; Pollutants; Quantitative PCR
1. Introduction
During the last decades, coastal ecosystems have been sub-ject to increased contamination from both inorganic, e.g. heavymetals, and organic compounds, e.g. polycyclic aromatic hy-drocarbons and polychlorinated biphenyls (PCBs). Pollutioncaused by these contaminants represents one of the major fac-
Abbreviations: Bp, base pair; Cat, catalase; Cyp-A, cyclophilin-A; Gst,glutathione transferase; Hsp, heat shock protein; Krs, stress responsive kinase;Mgd-1, Mytilus galloprovincialis defensin-1; M-MuLV H− RT, point mutatedRNAse H (minus) Moloney Murine Leukemia Virus reverse transcriptase; Mrp,multidrug-resistance protein; Mt, metallothionein; Mvp, major vault protein;Mytc-a, myticin-a; Mytl-b, mytilin-b; NSO, North Sea Oil; PCR, polymerasechain reaction; rRNA, ribosomal RNA; RT-PCR, reverse-transcription poly-merase chain reaction; SDS, sodium dodecyl sulphate; SSC, standard salinecitrate; Q-PCR, real time quantitative polymerase chain reaction.⁎ Corresponding author. Tel.: +39 0131360238; fax: +39 0131360243.E-mail address: [email protected] (F. Dondero).
0378-1119/$ - see front matter © 2006 Elsevier B.V. All rights reserved.doi:10.1016/j.gene.2006.02.015
tors of environmental stress in aquatic environments, where theterm ‘environmental stress’ defines all the conditions in whichphysiological processes of a living system are altered by ex-ternal factors. In marine organisms, and in particular in mussels,the effects of these contaminants have been extensively studiedin monitoring programs (Viarengo and Canesi, 1991). In thesemollusk organisms, heavy metals are known to affect the signaltransduction pathways, disrupting free calcium concentrationhomeostasis (Viarengo, 1994; Marchi et al., 2004), and alteringtyrosine kinase cascades (Canesi et al., 2001), of which thelatter has also been described in mussels exposed to PCBs(Canesi et al., 2003). In addition, specimens exposed to xeno-biotic pollutants usually respond with an increased productionof reactive oxygen species (ROS) (Winston et al., 1996), withdirect consequences on lipid peroxidation (Moore, 1988) andDNA damage (Machella et al., 2005). In general, responses tostress stimuli are supported by a more or less important re-program of the gene expression, where a specific gene can be
25F. Dondero et al. / Gene 376 (2006) 24–36
alternatively induced or suppressed depending on its physio-logical role, as recently demonstrated for yeast cells challengedwith a set of stress agents (Gasch et al., 2000). In light of theseconsiderations, it can be proposed that changes of the tran-scriptional profile of specific genes could represent a powerfulbiomarker tool to evidence the effects of environmental pollu-tion in sentinel organisms.
Gene expression can be evaluated at different levels, fromRNA transcription to protein translation. Gene transcription canbe quantified by classical assays, like Northern blotting andreverse-transcription polymerase chain reaction (RT-PCR). Arelatively new technology is represented by DNA microarrays,introduced some ten years ago and enabling a simultaneousquantification of a large pool of genes (Schena et al., 1995). Themicroarray technology is relative inexpensive, flexible, rapid,easy to automate, and requires limited amounts of RNA sam-ples. Moreover, it can enhance the sensitivity and interpretabil-ity of standard bioassays (DeRisi et al., 1997), and DNAmicroarrays are now employed in various fields ranging frommedicine (diagnosis and effectiveness of a therapy) to toxi-cology, from phylogenetics and more recently to ecotoxicology(Nuwasyr et al., 1999). To this end, as stated by Neumann andGalvez (2002) “the greatest utility of DNA microarrays may bein predicting the toxicological modes of action of anthropogenicsubstances on host physiology, particularly in non-model or-ganisms”. Toxicogenomics can also be useful for the identifi-cation of gene sets predictive of toxic outcomes and diagnosticsin relation to the exposure to stress or to specific classes ofpollutants (Thomas et al., 2001). An earlier study employed aDNA expression array to detect toxic stress response in theEuropean flounder (Platichthys flesus) sampled from the es-tuaries of rivers Tyne and Alde in the UK, identifying a numberof transcripts differentially expressed due to different pollutionlevels (Williams et al., 2003). This study confirms a possible useof DNA microarray technology in biomonitoring projects.
Marine bivalves, such as Mytilus galloprovincialis and M.edulis, are often employed as sentinel organisms of aquatic pol-lution because they are resistant to high doses of contaminants,showing at the same time alterations of physiological and bio-chemical parameters which can be used in the biological moni-toring of sea water (Cajaraville et al., 2000). For these reasons,we decided to evaluate whether changes in gene transcriptionoccur in mussels after exposure to organic contaminants, re-presented by a mixture of hydrocarbons (North Sea Oil; NSO),and to inorganic contaminants, represented by mercury (Hg). Tothis aim we designed and developed a novel low-density DNAmicroarray which includes both genes whose sequences werealready available in theGenbank (http://www.ncbi.nlm.nih.gov/),as well as newly identified genes.
2. Materials and methods
2.1. Animals and treatments
Specimens of M. galloprovincialis (individuals with shelllength 40–60 mm) were purchased from an aquaculture farm inLa Spezia, Italy, acclimatized in aquaria containing re-
circulating filtered sea water (3.5% salinity) at 16 °C for3 days. Hg was added in the form of chloride salt for six days at adaily dose of 150 μg L− 1 (750 nM).
Specimens ofM. edulis were maintained in aquaria equippedwith a continuous import–efflux system of natural sea water atthe Akvamijø Marine Station in Stavanger, Norway. After anacclimatization period, animals were treated for eight days with0.5 ppm crude oil mixture (North Sea Oil) dispersed in the ab-sence of any organic solvent over the water surface as averagedroplet sizes of 10 μm.
In both cases a set of control mussels was kept in the sameconditions of the experimentally treated animals, with the ex-clusion of toxicant administration.
After treatments, mussel digestive glands were immediatelydissected out and kept at −20 °C in a RNA preserving solution(RNA Later, Sigma-Aldrich), or alternatively flash frozen intoliquid nitrogen and stored at −80 °C until analysis.
2.2. RNA extraction and purification
Total RNA was extracted from mussel digestive glands bythe acid phenol–chloroform procedure according to Chomc-zynski and Sacchi (1987), using the TRI-Reagent (Sigma-Aldrich). The quality and the purity of RNA preparations werechecked both by UV-spectroscopy and by TBE agarose gelelectrophoresis, in the presence of 47.5% formamide, 0.0125%SDS, 0.0125% ethidium bromide, 0.25 mM EDTA. For micro-array analysis, poly(A)+ RNA was enriched from total RNAusing oligo-tex particles through the NucleoTrap® mRNAreagent kit (Macherey-Nagel, Düren, Germany), according tothe manufacturer's instruction.
2.3. Cloning of mussel genes by means of RT-PCR
About 5 μg of total RNA were reverse-transcribed using200 U point mutated M-MuLV RNAse H minus reverse tran-scriptase (Fermentas Inc., MD, USA) using anchored oligo-dT(20)V primer in a reaction volume of 20 μl. Then 1 μl of the RTmixture was subjected to 35 cycles of PCR amplification in thepresence of 1× reaction buffer, 0.5–2 μM gene-specific primers,0.2 mM each dNTP, 1.5 mM MgCl2, 0.625 U Red Taq DNApolymerase (Sigma-Aldrich). Thermal protocol consisted of5 min initial denaturation at 94 °C, followed by 35 cycles: 30 sdenaturation at 94 °C, 30 s gradient annealing 40–55 °C, 40 sextension at 68 °C. Finally, additional 10 min at 72 °C wereperformed to improve further TA cloning ligation reaction.Gene specific primers were deduced from ClustalW alignment(Thompson et al., 1994) of orthologue DNA or protein se-quences. The Primer Premier 5 software (PREMIER BiosoftInternational, CA, USA) was used to design degenerated pri-mers. Primer sequences are listed in Table 1. The PCR productswere checked on 2% agarose gel, purified through silica gelcolumn chromatography and subcloned into the PCR2.1 vectorby topoisomerases mediated ligation reaction, using the TOPOTA cloning system (Invitrogen, CA, USA), essentially as de-scribed by the manufacturer's instructions. Several independentclones were sequenced at the MWG-Biotech facility (Ebersberg,

Table 1Primer sequences (forward; reverse) used in the RT-PCR cloning experiments and for Q-PCR analysis
RT-PCR primers Forward primer sequence (5′–3′) Reverse primer sequence (5′–3′)
Gene IDCat AAYCCVCAGACBCAYMTGAAGGATCC GCCCTGRTYVGTCTTGWARTGGAACcyp-A CYAGYACSTTYGGBAATGG GASCCVAGVCCAAAYACgaba-a-trans-3 CCAACGTCATCTGTGGAATG GTCCTTGATCGTGCAGTGTGhsp27 GCAYGARGARMGSVAGGACGRVCATGG GTCAGBRYRCCSTCDGRDGASASRGWGGKrs ATSACYTCWGGAGCCATCCARAATGG TNTGGATYGTTATGGARYAYTGTGGp53 RGAAACAAATCTACMACATGG GGGCAWGCACAKATTCKWACTTCHelic AACCTGCGCACYCAYCAGAAG GAGTGATTYGYATCCTCTG
Q-PCR primers Forward primer sequence (5′–3′) Reverse primer sequence (5′–3′)
Mt10 Q-PCR GGGCGCCGACTGTAAATGTTC CACGTTGAAGGYCCTGTACACC-Mt20 Q-PCR TGTGAAAGTGGCTGCGGA GTACAGCCACATCCACACGCP53-Q-PCR CCAACTTGCTAAATTTGTTGAAGA TTGGTCCTCCTACACATGACActin Q-PCR CTCTTGATTTCGAGCAGGAAA AGGATGGTTGGAATAATGATTrRNA18S-Q-PCR TCGATGGTACGTGATATGCC CGTTTCTCATGCTCCCTCTC
Primer sequences are given as 5′–3′. Iupac code for nucleic acid sequences: Y, C or T; W, A or T; R, A or G; N, A or T or G or C; M, A or C; B, T or C or G; S, C or G;V, A or C or G.For the legend to gene ID see Table 2.
26 F. Dondero et al. / Gene 376 (2006) 24–36
Germany), using the fluorescence di-deoxy-dye terminator re-action and a capillary DNA microsequencer.
2.4. Microarray synthesis
For most genes two different 50 mer oligonucleotide-report-ers were designed and synthesized using the Oligos4Array soft-ware, a part of the MWG-Biotech AG proprietary computationalplatform BioGIST, starting from the sequences available fromthe GenBank database or from the ones cloned de novo by ourgroup. Probe sequences are available on request. Approximately50 fmol of each high purity salt free (HPSF) 5′MTTaminolinker-modified oligonucleotide were spotted (120 μm diameter) overepoxy glass activated surface, at the MWG-Biotech facility.
2.5. Fluorescence labeled cDNA probe synthesis
Fluorescence labeled cDNA probes were prepared from ap-proximately 2 to 5 μg of poly(A)+ enriched RNA, prepared froma pool of 5–6 digestive gland biopsies. Cy3-labeled dCTP andCy5-labeled dCTP (Amersham Biosciences, Freeburg, Ger-many) were directly incorporated into the probes through areverse-transcription reaction, using a high efficiency point mu-tated RNAse H minus M-MuLV reverse transcriptase. Briefly,RNAwas denatured at 70 °C for 5 min and incubated on ice for1 min in the presence of 250 ng random hexamers (Invitrogen).After 5 min at 25 °C for priming, the reaction was carried out at42 °C for 120 min in the presence of 400 U RevertAid™ M-MuLV RNAse H minus RT (Fermentas), 50 mM Tris–HCl pH8.3; 50 mM KCl, 4 mM MgCl2; 10 mM DTT; 0.5 mM dATP;0.5 mM dTTP; 0.5 mM dGTP; 0.1 mM dCTP; 2 mMCy3-dCTPor Cy5-dCTP. mRNA was removed from the single-strandedcDNA by a two step procedure: first mRNAwas denaturated byalkaline treatment in 0.1 N NaOH in the presence of 10 mM di-sodium EDTA, then after pH neutralization with the addition of0.1 N HCl and 0.38 M Hepes acid, oligomers and unincorpo-rated nucleotides were removed by spin column chromatogra-
phy using the GenElute purification kit (Sigma-Aldrich).Qualitative and quantitative analysis of Cy3- or Cy5-dCTPincorporation into cDNA probes was performed by spectropho-tometric analysis in the range of 720–220 nm. For quantitation ithas been used 150000 and 250000 M−1 cm−1 as molar extinc-tion coefficients at 550 and 650 nm, for Cy3 and Cy5 labeling,respectively.
2.6. Microarray hybridization
Equal amounts (approximately 20–40 pmol) of purified Cy3-and Cy5-labeled cDNAs were simultaneously precipitated inethanol and resuspended in 18 μl of 5× SSC buffer containing0.1% SDS, 25% formamide (hyb-buffer). The solution wasboiled for 3 min at 95 °C and immediately chilled on ice for3 min, then the mixture was applied to the microarray slide pre-hybridized for 1 h at 42 °C in hyb-buffer supplemented with 1%bovine serum albumine. The slide was placed into a microarrayhybridization chamber (MWG-Biotech) filled with 100 μl 3×SSC and incubated at 42 °C for 16 h. The slide was then washedfor removing excess probe and any unspecific hybridization.Three washing steps were carried out: first washing in 2× SSC,0.1% SDS; second washing in 1× SSC; third washing in 0.5×SSC. All the washing steps were performedwith gently shackingat room temperature, using buffers pre-warmed at 30 °C. Beforescanning, the slides were dried by brief centrifugation at 500 ×g.cDNA synthesis, labeling and hybridization were repeated atleast four times for each treatment in independent experiments.The dye swap labeling procedure was employed for each hy-bridization experiment, using Cy3 and Cy5 to label alternativelycontrol and experimental cDNA samples.
2.7. Microarray scanning and statistical analysis
The microarray slides were scanned using a Chip Reader unit(Bio-Rad Laboratories, CA, USA) equipped with two lasersources for the excitation at 532 and 635 nm. Lasers were set at

Fig. 1. Schematic representation of the Mytilus spp. low-density microarray(mytox-chip). The mytox-chip consists of two identical replicated sub-arrays asthe one herein indicated. For all mussel genes, except mrp2, mgd1, hsp27, mvp,cyp4Y1 and krs, two different 50-mer aminomodified oligoprobe reporters havebeen synthesized and spotted onto epoxy-activated glass slides. Solid circlesrepresent the rRNA features used for linear normalization of the two channelintensities. Crossed circles representA. thaliananegative control features. For fullgene names refer to Table 2.
27F. Dondero et al. / Gene 376 (2006) 24–36
100% power, while for each specific analysis the two opticalphotomultipliers (PMTs) were set in order to achieve similarfluorescence signal intensities for the 18S and 28S rRNA re-porters present in the microarray. Using the manufacturersoftware 16 bit Tagged Image File Format (Tiff) images weregenerated then, the Genepix 5.1 software (Axon Inc., USA) wasused to achieve numerical data for each spot on the array and toperform linear normalization of the two channel data over notsaturated 18S and 28S rRNA intensities. The local backgroundoption was set on. As general quality control criteria, spotswhose net median fluorescence intensities were below 300 andsignal to noise ratio below 3 were flagged absent in order to beexcluded from further analysis. Further analysis of the micro-array data was performed using the Genespring 6.2 software(Silicon Genetics, Redwood City CA, USA). Median raw fluo-rescence intensities andmedian background values were import-ed into Genespring from the Genepix generated spreadsheets.Genespring settings were the following: to account for dye swap,the signal channel and control channel measurements were re-versed when applicable. Each gene's measured intensity wasdivided by its control channel in each sample to get a ratio thatwas further normalized against the value obtained from the si-multaneous hybridization of Cy3/Cy5-labeled cDNA probesgenerated from a reference cDNA pool. Each measurement foreach gene in those specific samples was divided by themedian ofthat gene's measurements in the corresponding control samples.If none of the control measurements were flagged present thenno data were reported. Microarray analysis was performed intoLog of Ratio mode, where the normalized expression level ofeach gene (also named normalized intensity) is represented bythe fold change value relative to the control level. Logarithms ofthe expression ratios are used as basis for statistical analysis. TheWelch t-test and the Benjamini and Hochberg false discoveryrate multiple testing correction were also applied to detect dif-ferentially expressed genes (pb0.05). A preliminary set of ex-periments was performed to ensure the suitability to test bothM. galloprovincialis and M. edulis RNA samples.
2.8. Real-time PCR
Real-time quantitative PCR analysis ofmt10,mt20, actin andp53 were performed on the same RNA samples used for micro-array analysis, essentially as described (Dondero et al., 2005).One (1) microgram of total RNA was reverse-transcribed tocDNA using 200U of RNAse H−M-MuLVreverse transcriptase(Fermentas), in the presence of 250 ng random hexamers (In-vitrogen), following the manufacturer's instructions. Fifty (50)nanograms of RNA reverse-transcribed cDNA was amplifiedinto an Icycler real-time PCR apparatus (Bio-Rad), utilizing thefollowing reaction mixture: 1× SybrGreen PCR Master Mix(Invitrogen), 1.5 mM MgCl2, 10 nM fluorescein, 0.2 μM eachMT Q-PCR specific primer pair (see Table 1).
Data were normalized against the expression of a ribosomal18S target, amplified starting from 50 pg RNA reverse-tran-scribed cDNA using the primer pair reported in Table 1.Thermal protocol for all genes was as follows: 3 min at 95 °C,followed by 40 cycles (15 s at 95 °C, 30 s at 55 °C, 20 s at 72 °C
where the signal was acquired). A melting curve of PCRproducts (55–90 °C) was also performed to ensure the absenceof artifacts. Data analysis and non-parametric statistics wereachieved using the Relative expression software tool (REST)(Pfaffl et al., 2002).
3. Results
3.1. Microarray architecture
The novel mussel low density microarray (the mytox-chip)consists of two replicated sub-arrays, each accounting for 24mussel genes plus two negative controls, for a total of 106features (Fig. 1, Table 2). For most genes, except mrp2, mgd-1, hsp27, mvp, cypA, cyp4Y1, and krs for which we couldperform preliminary hybridization analysis (data not shown),two different oligonucleotide-probes were synthesized. Theprobes immobilized on the matrix — over 26×76 mm glassslide — have the same length (50 mer) and identical GCcontent (50%) to guarantee optimal hybridization conditions.All probes have been designed starting from complete orpartial cDNA sequences, using the proprietary Oligo4software package at the MWG-Biotech facility, with particularattention to guarantee an optimal gene specificity also in thecase of homologue genes, such as mt and mrp isotypes. Forthe normalization of dual color data, positive controls such asthe 18S and 28S rRNA genes were included. Negative controlsconsist of two different probes belonging to the Arabidopsisthaliana genome (ara23, and ara7) that have been alreadyused in several other microarrays.

Table 2Investigated genes present onto the low density microarray
Feature Gene reporter ID Gene name Description Blast hit/e value Genbank accession
1:1 Actin#1 Actin Cytoskeleton microfilament protein NA AF1574911:2 Mrp#1 Multidrug resistance
related proteinABC transporter NA AF397143
1:3 Mrp#21:4/1:5 Mrp2 Multidrug resistance
related protein-2ABC transporter NA AF397142
1:6 lys#1 Lysozyme Antimicrobial protein NA AF3346651:7 lys#21:8 Actin#2 Actin Cytoskeleton protein NA AF1574912:1 Mytl-b#1 Mytilin-b Antimicrobial precursor peptide NA AF1623362:2 Mytl-b#22:3 Mytc-a#1 Myticin-a Antimicrobial precursor peptide NA AF1623342:4 Mytc-a#2 Specifically synthesized into hemocytes2:5/2:6 Mgd-1 Mytilus defensin Antimicrobial precursor peptide NA AF162337
Specifically synthesized into hemocytes2:7 Hsp70#1 Heat shock
protein 70 kDMolecular chaperon NA AF172607
2:8 Hsp70#23:1/3:2 Hsp27 Heat shock
protein 27 kDPartial cds, 124 nt AAA62175; Heat shock
protein 27 [Homo sapiens],9e−16
DQ158076Molecular chaperon. Stabilization of actinmicrofilaments (Lavoie et al., 1995),apoptosis (Rane et al., 2003)
3:3/3:4 Mvp Major vault protein Main protein component of the vaultribonucleo-complex, associated with multidrugresistance phenotypes (Suprenant, 2002)
NA AF172605
3:5 gst-pi #1 Glutathionetransferase-pi
Enzyme component of the phase IIbiotransformation process. Catalyze theconjugation of glutathione to xenobiotichydrophobic compounds.
NA AF2279773:6 gst-pi #2
3:7 ara7 ara7 A. thaliana negative control NA NA3:8/4:1 Cyp4Y1 Cytochrome p450 4y1 Enzyme component of the phase I
biotransformation process.NA AF072855
4:2 cat#1 Catalase Partial cds, 189 nt NP_033934; catalase 1[Mus musculus]; 4e−23
DQ1580734:3 cat#2 Catalysis of the catalase reaction:
response to oxidative stress4:4 r18S#1 18S RNA Small subunit ribosomal RNA gene NA L334514:5/4:6 Krs Stress responsive
kinasePartial cds, 288 nt; serine/threonine kinaseresponsive to stress, alternative to the p38MAPK pathway (Taylor et al., 1996).
NP_067395; Serine/threonine kinase 4;STE20-like kinase MST1[Mus musculus]
DQ158074
Oxidative stress, (Pombo et al., 1996).4:7 Helic#1 RNA helicases Partial cds, 320 nt; O94508; Cell cycle control
protein cwf11 [S. pombe]8e−34
DQ1580754:8 Helic#2 DEAD box containing DNA–RNA helicases.
Pre-mRNA splicing (Ohi et al., 2002)5:1 Cyp-A#1 Cyclophilin-a Partial cds, 202 nt; cyclosporin A binding
protein with peptidil–prolil isomerase activityB53522; 20k cyclophilin[Toxoplasma gondii];4e−26
DQ1580775:2 Cyp-A#2
5:3 Gaba#1 Gamma aminobutyricacid transporter-3
Partial cds, 383 nt; NP_653095; Gamma-aminobutyric acid(GABA-A) transporter 3[Mus musculus]; 7e−32
DQ1598855:4 Gaba#2 Gamma-aminobutyric acid (GABA)
transporters (Liu et al., 1993). Combiningwith the neurotransmitter GABA-A (gammaaminobutyric acid) to initiate a changein cell activity.
5:5 p53#1 p-53 homolog Partial cds, 478 nt; AAF67734; P73-likeprotein [Mya arenaria];1e−81
DQ1580795:6 p53#2 DNA damage response; regulation of apoptosis.
Softshell clam leukemia (Kelley et al., 2001).5:7 mt20#1 Metallothionein
mt 20 IVHeavy metal binding protein NA AY566247
5:8 mt20#26:1 mt10#1 Metallothionein
mt10 IIIHeavy metal binding protein NA AY566248
6:2 mt10#26:3 h1#1 Histone h1 Chromatine acid-soluble basic protein. NA AJ4164246:4 h1#2 DNA packing6:5 h2_a#1 Histone h2_a Chromatine acid-soluble basic protein. NA AJ4929236:6 h2_a#2 Nucloesome core particle component.6:7 h4#1 Histone h4 Chromatine acid-soluble basic protein. AJ492925
Nucloesome core particle component.6:8 r18S#2 18S rRNA Small subunit ribosomal RNA gene NA L33451
28 F. Dondero et al. / Gene 376 (2006) 24–36

Feature Gene reporter ID Gene name Description Blast hit/e value Genbank accession
7:1 r28S#1 28S RNA Large subunit ribosomal RNA gene NA DQ1580787:2 h4#2 Histone h4 Chromatine acid-soluble basic protein.
Nucloesome core particle component.NA AJ492925
7:3 r28S#2 28S RNA Large subunit RNA gene NA DQ1580787:4 ara7 ara7 A. thaliana negative control NA NA7:5 ara23 ara23 A. thaliana negative control NA NA7:6 Actin#2 Actin Cytoskeleton protein NA AF157491
Shown are the position (row:column) of each reporter oligonucleotide-probe (Feature), gene reporter identification (ID), gene name, description, best BlastX hit withthe related e-value (only for newly identified genes) and Genbank accession number. NA, not applicable.
Table 2 (continued )
29F. Dondero et al. / Gene 376 (2006) 24–36
3.2. Microarray test and applications
To evaluate changes in gene expression induced in responseto pollutant exposure, specimens of M. galloprovincialis weretreated for 6 days with 150 μg/L (750 nM) Hg and specimens ofM. edulis for 8 days with 0.5 ppm of a crude oil extracted inNorway (North Sea Oil, NSO). The latter was mechanicallydispersed into the water column without the use of organicsolvents. In both cases, hybridization experiments were perform-ed using the developed low density microarray.
Dual color hybridizations disclosed evident alterations ofgene expression patterns due to the Hg treatment (Fig. 2). InTable 3 we listed the normalized expression levels obtained forthe different reporter probes present onto the “mytox-chip”.
We could observe an up-regulation of the twometallothioneingenes mt10 and mt20, which are involved in heavy metal ho-meostasis and detoxification. While mt20 showed a markedinduction, with an average normalized expression of 3.9±0.81(calculated as the weighted mean±S.D. between the two probereporters of the same gene),mt10was only slightly up-regulated(1.66±0.19). Mercury also caused a modulation of the expres-sion of histone genes: while the core histone h2_a was up-regulated by the exposure (2.77±0.06), the linker histone h1wasinstead down-regulated (0.49±0.05). A down-regulation wasalso observed for genes involved in the humoral immune-response system, i.e. lysozyme (0.39±0.06), mytlin-b (0.23±0.02) and mytcin-a (0.21±0.01); and for those involved indetoxification processes, i.e. glutathion-S-transferase-pi (0.48±0.08) and the abc transporter mrp2 (0.39±0.05). Also actin wasmarkedly down-regulated by mercury (0.40±0.02). Instead, thefollowing genes were not modulated by the mercury treatment:mrp, mgd-1, hsp70, mvp, cat, h4, hsp27 and krs. Genes codingfor gaba-a transporter, RNA helicases, cyp-A, p53 and cyp4y1were instead excluded from the analysis since they did notprovide reliable data.
Also the exposure to the organic pollutant mixture caused anevident alteration of mussel gene expression patterns (Fig. 3), infact the scatter plot distribution (Fig. 3B) clearly evidences thatseveral mussel genes were down-regulated.
Table 4 shows normalized expression levels obtained for thedifferent reporter probes present onto the ‘mytox-chip’. Simi-larly to what was observed for the Hg treatment, exposure toNSO resulted in down-regulated expression levels of genesinvolved in the immune defense: the antimicrobial peptide pre-
cursor mytilin-b (0.64±0.15) and lysozyme (0.69±0.08); butalso that of actin (0.48±0.07) and the abc transporter mrp2(0.51±0.07). Furthermore, several other genes were signifi-cantly down-regulated by the NSO exposure: hsp70 (0.66±0.11), the major vault protein mvp gene (0.54±0.15); metal-lothioneins mt10 (0.63±0.05) and mt20 (0.58±0.15); the RNAhelicases (0.57±0.14) and the p53-like gene (0.57±0.13). Onlycatalase showed a significant up-regulation (1.23±0.22).Myticin-a, mgd-1, hsp27, gst-pi, cyp4Y1, krs, h1, h2 and h4were instead not modulated by this treatment. Gaba-a trans-porter, mrp and cyp-A were not determined since they did notprovide a reliable hybridization.
3.3. Q-PCR confirmation analysis
Genes for which a protocol was already established, i.e.mt10,mt20, actin and p53 (Fig. 4) were analyzed by means of quan-titative real-time polymerase chain reaction (Q-PCR) — SybrGreen™ chemistry (Fig. 4). For what concerns actin, normalizedexpression patterns obtained from the two different techniqueswere absolutely similar: 0.30 and 0.40 in the Q-PCR analysis,versus 0.40 and 0.48 in the microarray, respectively after Hg andNSO treatments.
In the case of metallothioneins, NSO determined 0.45 and0.53 fold change for mt10 and mt20 respectively (microarrayoutcomes were 0.63 and 0.58). By contrast, in the case of Hg theQ-PCR analysis provided a 4 and over 60 fold induction, re-spectively. Microarray outcomes were in accordance but dis-played smaller fold change values: 1.66 and 3.94.
No variation in the expression of the mussel p53-like genewas found due to the Hg treatment (0.97 relative expression; nodata were obtained from the microarray). Conversely, in the caseof the NSO exposure, 0.50 fold change was recorded, in ac-cordance with the microarray results (0.57).
4. Discussion
In this work we present the development of a low densityoligonucleotide microarray to study alterations of gene expres-sion profiles after exposure to anthropogenic pollutants, such asmercury (Hg) and crude oil (NSO).
Genes represented on the microarray were identified frompublic databases, essentially from the NCBI Genbank. It shouldbe taken into account that when this project started only a few

Table 3Hg modulated genes
Gene reporter ID Normalized expression SD p-value
Mt20#1 6.48 (1.156 to 38.86) 1.36 0.0107h2_a#2 2.80 (2.646 to 2.976) 0.06 0.00109Mt20#2 2.54 (0.77 to 9.989) 1.01 0.0495⁎
Mt10#2 1.87 (1.085 to 2.328) 0.25 0.000589h2_a#1 1.47 (0.65 to 2.854) 0.30 0.0232Mt10#1 1.42 (0.828 to 1.847) 0.28 0.0163h1#1 0.51 (0.426 to 0.757) 0.06 0.00296gst-pi#1 0.48 (0.23 to 0.696) 0.08 0.00162Actin#1 0.47 (0.373 to 0.658) 0.05 0.000148Lysoz#2 0.41 (0.221 to 0.72) 0.08 0.00254h1#2 0.40 (0.233 to 0.785) 0.07 0.00154mrp2 0.39 (0.291 to 0.739) 0.05 0.00166Actin#2 0.37 (0.238 to 0.517) 0.03 1.55e−5Lysoz#1 0.37 (0.153 to 0.645) 0.08 0.00468Mytc_a#2 0.29 (0.0859 to 1.034) 0.09 0.0199mytl_b#1 0.27 (0.147 to 0.561) 0.04 0.00178mytc_a#1 0.20 (0.125 to 0.26) 0.01 0.0025mytl_b#2 0.19 (0.111 to 0.523) 0.02 0.000889
Shown are gene reporter ID, normalized expression relative to control level (withminimum and maximum values, standard deviation (SD) and t-test p-value. Datarepresents the mean of at least three independent experiments (n=6). TheBenjamini and Hochberg false discovery rate multiple testing correction wasapplied to the Welch t-test (pb0.05). ⁎Mt20#2 reporter did not pass testingcorrection. It should be considered that the mt20#2 reporter supplied higherhybridization signal in the control channel, and in consequence lower relativeexpression levels, with respect to the mt20#1 probe (6.48 versus 2.54 normalizedexpression). This could be due to the cross hybridization of this reporter with themt10 mRNA that is constitutively expressed at high level in mussel digestivegland cells (Dondero et al., 2005).
Fig. 2. Hg effects on gene expression. (A) A typical dual color hybridizationanalysis of Cy3/Cy5-labelled cDNAs from Hg-treated vs control mussels,obtained by means of a dual laser source microchip scanner. For datanormalization, the two channel were balanced on RNA intensities. (B) Scatterplot distribution of the normalized intensities comparing the experimental dataset (Hg-treatedmussels vs control ones) and the control data set obtained from thesimultaneous hybridization of the microarray with dual-color probes preparedfrom a single cDNA type (self-hybridization) (more details on the normalizationprocedure are present in the materials and methods). See Table 3 for statistics anddetails on differentially expressed genes.
30 F. Dondero et al. / Gene 376 (2006) 24–36
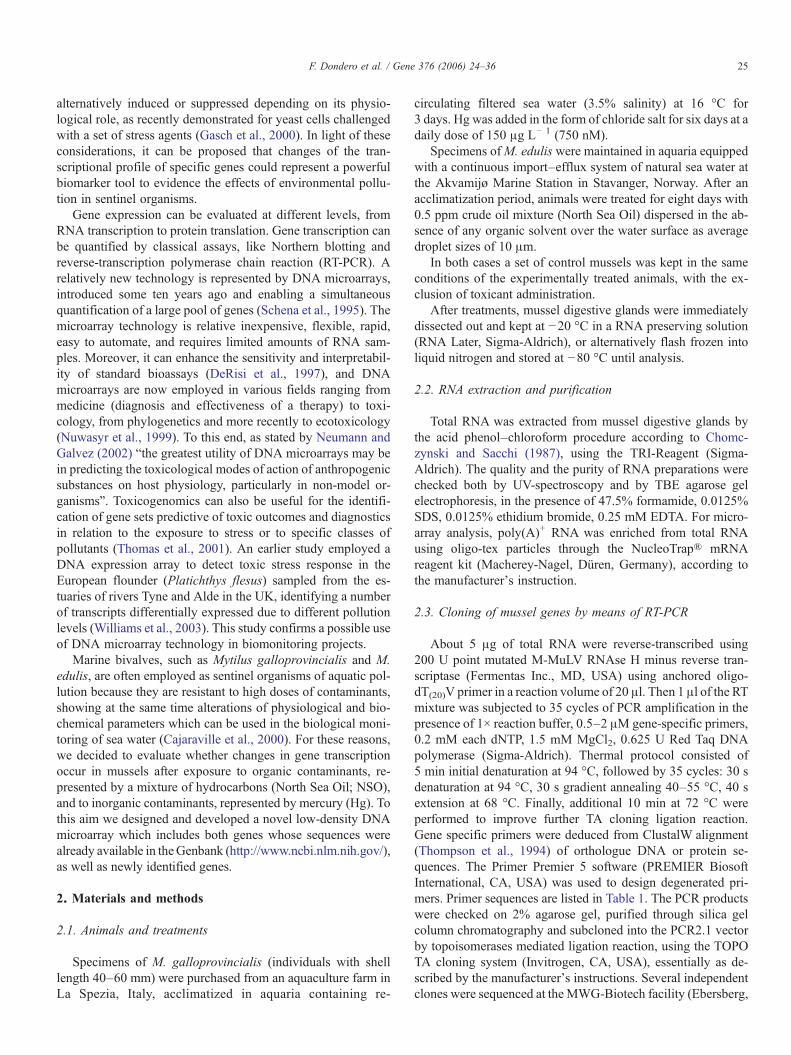
mussel nucleotide sequences were publicly available from whichseventeen candidate genes could be selected (see Table 2). Apartfrom these seventeen genes, we identified the partial cDNAsequence of another seven genes putatively involved in stressresponse pathways, such as a p53-like gene, heat shock protein27, catalase, and stress responsive kinase. Such clones wereidentified in the mussel digestive gland by means of reverse-transcription PCR and the use of degenerated primers (Fig. 5).
Among the already identified mussel genes, hsp70 encodes amolecular chaperon implicated in protein refolding after thermal
and chemical stress. cyp4y1 is a gene assigned to the cytochromep450 cyp4 family. In analogy with mammalian systems, it hasbeen suggested that components belonging to the P450 super-family are involved in phase-1 biotransformation processes ofendo- and xenobiotic compounds also in mussels (Livingstoneet al., 1989). cyp4Y1 was recently identified in the digestivetissues of M. edulis and its expression seems to be inhibited byincreasing concentrations of the hydrocarbon beta-naphtho-flavone (Snyder, 1998). Conversely, glutathione-S-transferase(gst-pi) acts in phase two biotransformation processes, while theABC superfamily multidrug resistance proteinsMRP andMRP2are putatively involved in the excretion of conjugated metabo-lites (biotransformation, phase 3) (Leudeking and Koehler,2004). The major vault protein (MVP) is a component of thevault particle, whose up-regulation has been associated withdrug resistance (Suprenant, 2002), but its physiological rolestill remains to be clarified. Myticin-a (MYTC-a), mytlin-b(MYTL-b) and defensin (MGD-1) are antimicrobial peptidesbelonging to the mussel innate immunity (Mitta et al., 2000a,b).Mussel lysozyme (LYZ) belongs to the i-class (invertebrate) oflysozyme-like proteins. To date its function remains elusive,however, in general lysozyme is a protein active against bac-terial peptidoglycan wall and with well known antibiotic pro-perties, but insomecases—as in the truestomachof ruminants—it is considered a major digestive enzyme (Bachali et al., 2002).Histones H1, H2 and H4 are structural proteins involved in thechromatin packing and are considered general markers of DNA

Table 4NSO modulated genes
Gene reporter ID Normalized expression SD p-value
Cat#2 1.233 (0.992 to 1.691) 0.22 0.0431⁎
Mytl_b#1 0.724 (0.267 to 0.976) 0.27 0.0434⁎
Hsp70#2 0.678 (0.435 to 0.942) 0.18 0.0141Lysoz#2 0.667 (0.477 to 0.925) 0.09 0.00157Hsp70#1 0.657 (0.292 to 0.952) 0.13 0.0194Mt10#2 0.647 (0.528 to 0.855) 0.11 0.00116Mt10#1 0.622 (0.388 to 0.801) 0.06 0.00256Mytl_b#2 0.605 (0.229 to 1.022) 0.18 0.03840Mt20#1 0.577 (0.244 to 0.866) 0.15 0.0109P53#2 0.567 (0.322 to 0.807) 0.13 0.0323⁎
Helic#2 0.566 (0.349 to 1.133) 0.14 0.0128Mvp 0.54 (0.325 to 1.54) 0.15 0.01Mrp2 0.512 (0.174 to 0.744) 0.07 0.000002Actin#1 0.495 (0.279 to 1.007) 0.10 0.00206Actin#2 0.477 (0.0967 to 0.896) 0.09 0.000648
Shown are gene reporter ID, normalized expression relative to control level
31F. Dondero et al. / Gene 376 (2006) 24–36
synthesis (Wolffe, 1998). Metallothioneins are non-catalyticpeptides acting in the processes of metal detoxification and oxyl-radical scavenging, and the two variants included in the ‘mytox.chip’ (mt10 and mt20) have differential expression patterns(Dondero et al., 2005).
Among the newly sequenced genes, HSP27 is a class of lowmass molecular chaperons, whose over-expression in mamma-lian cells has been reported to supply resistance to heat shock andoxidative stress (Lavoie et al., 1995). Cellular thermo-resistanceseems to be provided via the modulation of actin microfilamentdynamics, a process that depends on phosphorylation of theHSP27 oligomeric structure by components of the p38 mitogenactivated protein kinase (MAPK) cascade (Landry and Huot,1995). Moreover, HSP27 is also involved in the control ofapoptosis in neutrophils (Rane et al., 2003). Genes coding for theP53 protein family have already been described in marine bi-valves, e.g.Mya arenaria (Van Beneden et al., 1997) and Spisula
Fig. 3. NSO effects on gene expression. (A) A typical dual color hybridisationanalysis of Cy5/Cy3-labelled cDNAs from NSO-treated vs control mussels,showing a general inhibition of gene transcription due to the oil treatment. (B)Scatter plot distribution of the normalized intensities. See Table 4 for statisticsand other details on differentially expressed genes.
(with minimum and maximum values, standard deviation (SD) and the t-testp-values. Data represent the mean of at least three independent experiments(n=6). The Benjamini and Hochberg false discovery rate multiple testing cor-rection was also applied to the t-test (pb0.05). ⁎Did not pass testing correction.Some a posteriori considerations, however, allowed us to consider these data:mytl-b#1 and hsp70#1 outcomes are highly consistent with those of sister probes;Q-PCR analysis provided full confirmation for the p53-like expression (0.50 vs0.57, respectively); catalase was only moderately over-expressed (1.23 foldchange) and this may be the reason of the testing correction failure.
solidissima (Cox et al., 2003). More recently, the identificationof p53 genes in soft tissues ofMytilus spp. was reported (Ciocanand Rotchell, 2005; Muttray et al., 2005). The role of thisprotein family in marine invertebrates has however not yet beenclarified, but data from studies on leukemic hemocytes of M.arenaria suggest a similar role as in mammals in the control ofneoplasia formation (Barker et al., 1997; Kelley et al., 2001).
Fig. 4. Q-PCR confirmation of microarray data. Actin, mt20, mt10 and p53-likeexpression have been analyzed by real-time PCR, using a 18S rRNA target asreference gene for data normalization. Microarray data for the investigated geneswere confirmed, using this more sophisticated technique. These results indicatea high accuracy and sensitivity of the mytox-chip that was able to detect evenvery low fold change of expression and to correctly distinguish the expressionlevels of the two 3 metallothionein cognate genes. Data represent the mean of atleast four independent experiments. Calculation of relative expression levels andstatistics (pairwise randomization test, pb0.05 ) were obtained using the RESTsoftware (Pfaffl et al., 2002). Experimental coefficient of variation (CV) wasbelow 5% for all the investigated targets.
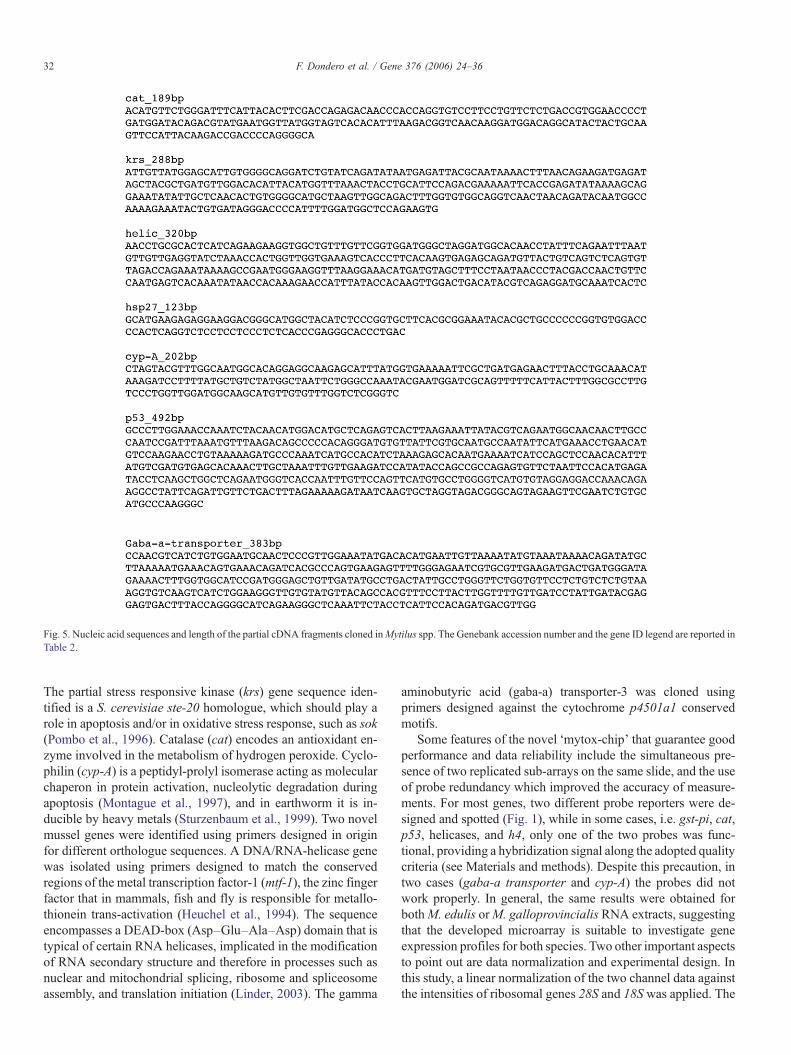
Fig. 5. Nucleic acid sequences and length of the partial cDNA fragments cloned inMytilus spp. The Genebank accession number and the gene ID legend are reported inTable 2.
32 F. Dondero et al. / Gene 376 (2006) 24–36
The partial stress responsive kinase (krs) gene sequence iden-tified is a S. cerevisiae ste-20 homologue, which should play arole in apoptosis and/or in oxidative stress response, such as sok(Pombo et al., 1996). Catalase (cat) encodes an antioxidant en-zyme involved in the metabolism of hydrogen peroxide. Cyclo-philin (cyp-A) is a peptidyl-prolyl isomerase acting as molecularchaperon in protein activation, nucleolytic degradation duringapoptosis (Montague et al., 1997), and in earthworm it is in-ducible by heavy metals (Sturzenbaum et al., 1999). Two novelmussel genes were identified using primers designed in originfor different orthologue sequences. A DNA/RNA-helicase genewas isolated using primers designed to match the conservedregions of the metal transcription factor-1 (mtf-1), the zinc fingerfactor that in mammals, fish and fly is responsible for metallo-thionein trans-activation (Heuchel et al., 1994). The sequenceencompasses a DEAD-box (Asp–Glu–Ala–Asp) domain that istypical of certain RNA helicases, implicated in the modificationof RNA secondary structure and therefore in processes such asnuclear and mitochondrial splicing, ribosome and spliceosomeassembly, and translation initiation (Linder, 2003). The gamma
aminobutyric acid (gaba-a) transporter-3 was cloned usingprimers designed against the cytochrome p4501a1 conservedmotifs.
Some features of the novel ‘mytox-chip’ that guarantee goodperformance and data reliability include the simultaneous pre-sence of two replicated sub-arrays on the same slide, and the useof probe redundancy which improved the accuracy of measure-ments. For most genes, two different probe reporters were de-signed and spotted (Fig. 1), while in some cases, i.e. gst-pi, cat,p53, helicases, and h4, only one of the two probes was func-tional, providing a hybridization signal along the adopted qualitycriteria (see Materials and methods). Despite this precaution, intwo cases (gaba-a transporter and cyp-A) the probes did notwork properly. In general, the same results were obtained forbothM. edulis orM. galloprovincialis RNA extracts, suggestingthat the developed microarray is suitable to investigate geneexpression profiles for both species. Two other important aspectsto point out are data normalization and experimental design. Inthis study, a linear normalization of the two channel data againstthe intensities of ribosomal genes 28S and 18S was applied. The

33F. Dondero et al. / Gene 376 (2006) 24–36
accuracy of this approach was evidenced in the Q-PCR analysis,where normalization against ribosomal 18S provided results thatwere in perfect accordance with those obtained from microarrayhybridizations. Under a quantitative point of view, however,some differences were seen for the mt20 gene expression, withQ-PCR providing higher fold induction with respect to theoutcome of the microarrays (Fig. 4). A possible explanation forthis discrepancy may be linked to the differences in dynamicrange between the two systems.
To improve the confidence of the data, dual color hybridiza-tions were performed at least in quadruplicates, and each set ofexperiment included the reversing dye orientation procedure tocorrect data for the dye effect (Liang et al., 2003). To identifydifferentially expressed genes, we did not set a default thresholdof the fold change a priori, but instead the statistical significancecriterion was adopted, so that also moderate gene modulationscould be appreciated: the Benjamini and Hochberg false discov-ery rate multiple testing correction (Hochberg and Benjamini,1990) was combined withWelch's t-test to improve the power ofthe statistical analysis.
Analyzing and comparing the gene transcription patterns as-sociated with treatments with the two different classes of pollu-tants (NSO and mercury) some interesting information could beevinced. According to the expectations, we observed a markedinduction of metallothioneins in response to mercury. The higherinducibility of mercury on mt20 expression with respect tomt10confirms the preferential role of mt20 in heavy metal detoxi-fication in mussels, while the cognate gene mt10 appears morelinked to homeostasis and handling of essential metals (Donderoet al., 2005).
An interesting result arising from microarray analysis wasthat histone genes were modulated by Hg, although the si-multaneous up-regulation of h2_a (2.8 fold) and the down-regulation of h1 (0.5 fold) are rather difficult to interpret. It iswell established that these structural proteins play different rolesin the packing of chromatin. While, for instance, H2_A is a corehistone, H1 directly interacts with the linker DNA responsiblefor the sealing of the nucleosome (Wolffe, 1998). Both core andlinker histones may be involved in the transcriptional regulationof individual genes. In particular, core histones, such as H2A, aretranscription factors that have been proposed to play importantroles in the recruitment of other specific nuclear regulatoryproteins (Spotswood and Turner, 2002) and therefore a possiblerole of histone H2 in stress response cannot be excluded. Forexample, in the fission yeast S. pombe, phosphorylation of H2Adetermines sensitivity to a wide range of genotoxic agents,causing recruitment of the checkpoint protein CRB2 at DNAstrand breaks, maintaining checkpoint arrest, and influencingDNA repair (Nakamura et al., 2004).
The microarray analyses indicated that basal expression ofmussel histone h1 is constitutive, which is in analogy with othereukaryotic organisms. High basal expression was also seen foractin and the abc transporter mrp2 (data not shown). Interest-ingly, these genes were all down-regulated in individuals ex-posed to Hg (Table 3 and Fig. 2). An earlier study on the bakingyeast S. cerivisiae applying a full genome microarray to cellsexposed to a large variety of stress stimuli indicated that inhib-
ited transcription rates of constitutively expressed genes mayrepresent a general response to stress, that has evolved to con-serve energy reserves as well as other cellular resources withmore specific functions, such as induction of detoxificationgenes and those associated with (chemical) resistance (Gasch etal., 2000). On the other hand, down-regulation of mrp2 on a parwith that of gst-pi was unexpected, since the increase of relatedenzymatic activities has already been reported in marine bi-valves after mercury challenge (Khessiba et al., 2001; Achard etal., 2004). Moreover, the induction of these two genes representsa prompt response to Hg exposure, as demonstrated in differentcell systems, i.e. yeast and mammals (Aleo et al., 2005; Gueldryet al., 2003; Kim et al., 2004). However in our experiment,mussels were chronically exposed to a high dose of mercury(0.75 μM for six days), a concentration that is likely to producepathological alterations of mussel cellular functions. One pos-sible explanation for the gst–mrp2 system repression mightreside in a potent activation of the lysosomal–vacuolar system,rendering de-compartmentalization of latent degrading enzy-mes, such as nucleases, and at a later stage enhancing autophagy(Moore, 1988; Viarengo et al., 1992), a condition that may maskanabolic processes like an increased gene transcription.
Another set of genes whose expression was dramatically af-fected by the mercury treatment was those belonging to thehumoral immune defense system. The gene encoding lysozymewas significantly down-regulated (0.39 fold change), while thestrongest decrement was recorded for mytilin and myticin pre-cursor peptide mRNAs, with average expression levels of 0.23and 0.21, respectively.Mgd-1, again encoding an anti-microbialpeptide, was instead not affected by the treatment (0.90). My-ticin and defensin mRNAs are exclusively expressed in cir-culating and epithelia infiltrating hemocytes, while mytilin isalso transcribed in enterocytes (Mitta et al., 2000a). Moreover,the same study revealed that defensin and mytilin messengersmay be packed both together or in different hemocytes. Verylittle is known about the regulation of these immunologicalrelevant genes, but our data suggest that the Hg treatment alteredseverely their gene expression patterns in the digestive gland,and as a consequence these effects might render mollusks moresusceptible to pathogen infections.
In conclusion, Hg affected the expression of several geneclasses, and such molecular effects can probably contribute toHg toxicity. One reasonable question is why the massiveactivation of metallothioneins, in particular mt20 (more than60 fold induction detected by Q-PCR analysis), was not ableto contrast the impact on the expression of other genes. Itshould be pointed out that analyses of mussel digestive glandprotein extracts did not result in a significant increase of totalMT protein levels in exposed animals after one week exposure(data not shown), which is according to what has beenreported in previous studies (Dondero et al., 2005; Geret andCosson, 2002). A possible explanation may be that in musselthe MT20 represents only a small fraction of the total MTcontent (Dondero et al., 2005); secondly, Hg-thioneins usuallyshow a rapid half-life, as reported for mammalian cells(Durman and Palmiter, 1981). Contrary to the heavy metaltreatment, exposure to organic chemicals (NSO) revealed
34 F. Dondero et al. / Gene 376 (2006) 24–36
down-regulation of both metallothionein genes (mt10 andmt20) (Table 4) in the dual color hybridization analysis. Thisfinding was fully confirmed by the Q-PCR analysis,demonstrating the high accuracy of the low density microarray(Fig. 4). Moreover, to our knowledge this is the first directevidence that sub-lethal doses of organic aromatic chemicalsdo not induce metallothionein genes in mussels. Therefore itcan be stated that in such marine bivalves, mt expressionrepresents a robust indicator of heavy metal contamination andexposure. In analogy with the Hg treatment, two of theconstitutively expressed genes (actin and the abc transportermrp2), as well as mvp, hsp70, and the RNA helicasesdisplayed reduced expression in individuals challenged withoil. Instead, stress related genes (gst-pi, krs, hsp27) exhibitedsteady expression rates, while the catalase gene was eveninduced, suggesting that the stress syndrome probably did notreach pathological levels. This impression was also confirmedby the evaluation of a set of physiological biomarkers in thesame tissues (Dagnino et al., unpublished observation).Lysozyme and mytilin-b showed reduced levels of expressionalso in NSO treated animals. In Mytilus edulis the ezymelysozyme is primarily associated with the crystalline style anddigestive gland, pointing to the fact that its main functioncould be related with the heterotrophic utilization of bacteria(McHenery et al., 1979). However coastal bivalves are notobligatory dependent on bacteria for feeding and therefore alsoa role as antimicrobial protein might be postulated (Bachali etal., 2002). Instead, the involvement of antimicrobial peptidesin the mussel innate immunity has been confirmed by recentstudies, in particular showing that mytilin-b has a potent andrapid killing activity against pathogenic bacteria (Mitta et al.,2000b,c). Bacteria challenging can change gene expressionpatterns of mytilins and also the fate of hemocytes that arerecruited at the site of infection (Mitta et al., 2000c). Our datademonstrate that the exposure to both inorganic and organicpollutants may interfere with the expression of at least twoimmune related genes, i.e. mytilin-b, lysozyme (but alsomyticin in the case of the Hg treatment) and therefore wesuggest that environmental contaminants not only can affectthe organism's physiology, but also they can alter the innatedefense capability and as a consequence the scope foradaptation to natural conditions. As a corollary of theseargumentations, we also suggest the possible use of suchgenes as biomarker of stress in marine bivalves.
Some further consideration on the newly identified mussel p53-like gene should also be made. This gene is likely to belong to thep63/73 gene family that has already been described in bivalves(Cox et al., 2003), which in mammals is expressed several splicingvariants. The full length gene variants-α andβ include the p53-liketransactivating (TA) domain that provides their function during pro-apoptosis, whileΔN genes lack the TA domain and instead behaveas negative isoforms that dominate active variants (Moll et al.,2001). As the mussel probes were designed against an exon incommon with the possible variants that are likely to occur inanalogy with the mammalian scenario, our microarray and Q-PCRanalyses provided information on total p63/p73 expression, i.e.summation of several variants. A future study could investigate
whether the p53-like down-regulation observed after NSOexposure is linked to the degradation of constitutively expressedΔN variants (the dominant negative ones) in favor of an evenmoderately increased transcription of the full length variants (theones that may be able to transactivate specific genes involved inpro-apoptotic or cell cycle regulating processes).
In conclusion, we have shown that the novel oligonucleotideDNA microarray can represent a valid tool to improve theknowledge in the field of molecular toxicology also for mussels.The integration of biological effects of pollutants with both geneand protein expression profiles will provide a more correctinterpretation of how molecular adaptations take place and howa stress syndrome develops in challenged organisms. Further-more, since transcription patterns were significantly modulatedby exposure to pollutants, and since mussels are establishedsentinel organisms often employed in marine biomonitoringprograms, the ‘Mytox-chip’ appears to be a technology with ahigh potential. Finally, the recently developed sequence cata-logues available for Mytilus spp. (Venier et al., 2003, inpreparation) will permit the generation of more specific arraysincluding a large number of stress related genes.
Acknowledgments
This work was granted by the 5th UE Framework Programproject Biological Effects of Environmental Pollution in marinecoastal ecosystems (BEEP). (Contract No. EVK3-2000-00543).The authors thank one of the anonymous referees for his interestand generous help to improve the quality of this work.
References
Achard, M., Baudrimont, M., Boudou, A., Bourdineaud, J.P., 2004. Inductionof a multixenobiotic resistance protein (MXR) in the Asiatic clamCorbicula fluminea after heavy metals exposure. Aquat. Toxicol. 67,347–357.
Aleo, M.F., et al., 2005. Endogenous thiols and MRP transporters contribute toHg2+ efflux in HgCl2-treated tubular MDCK cells. Toxicology 206,137–151.
Bachali, S., et al., 2002. Phylogenetic analysis of invertebrate lysozyme and theevolution of lysozyme function. J. Mol. Evol. 54, 652–664.
Barker, C.M., Calvert, R.J., Walker, C.W., Reinisch, C.L., 1997. Detection ofmutant p53 in clam leukemia cells. Exp. Cell Res. 232, 240–245.
Cajaraville, M.P., Bebianno, M.J., Blaso, J., Porte, C., Sarasquete, C., Viarengo,A., 2000. The use of biomarkers to assess the impact pollution in coastalenvironments of the Iberian Peninsula: a practical approach. Sci. TotalEnviron. 247, 295–311.
Canesi, L., Betti, M., Ciacci, C., Gallo, G., 2001. Insulin-like effect of zinc inmytilus digestive gland cells: modulation of tyrosine kinase-mediated cellsignaling. Gen. Comp. Endocrinol. 122, 60–66.
Canesi, L., et al., 2003. Effects of PCB congeners on the immune function ofMytilus hemocytes: alterations of tyrosine kinase-mediated cell signaling.Aquat. Toxicol. 63, 293–306.
Chomczynski, P., Sacchi, N., 1987. Single-step method of RNA isolation byacid guanidinium thiocyanate-phenol-chloroform extraction. Anal. Bio-chem. 162, 156–159.
Ciocan, C.M., Rotchell, J.M., 2005. Conservation of cancer genes in the marineinvertebrate Mytilus edulis. Environ. Sci. Technol. 39, 3029–3033.
Cox, R.L., Stephens, R.E., Reinisch, C.L., 2003. p63/73 homologues in surfclam: novel signaling motifs and implications for control of expression.Gene 320, 49–58.
35F. Dondero et al. / Gene 376 (2006) 24–36
DeRisi, J.L., Iyer, V.R., Brown, P.O., 1997. Exploring the metabolic and geneticcontrol of gene expression on a genomic scale. Science 278, 680–686.
Dondero, F., Piacentini, L., Banni, M., Rebelo, M., Burlando, B., Viarengo, A.,2005. Quantitative PCR analysis of two molluscan metallothionein genesunveils differential expression and regulation. Gene 345, 259–270.
Durman, D.M., Palmiter, R.D., 1981. Transcriptional regulation of the mousemetallothionein-I gene by heavy metals. J. Biol. Chem. 256, 5712–5716.
Gasch, A.P., et al., 2000. Genomic expression programs in the response of yeastcells to environmental changes. Mol. Biol. Cell 11, 4242–4257.
Geret, F., Cosson, R.P., 2002. Induction of specific isoforms of metallothioneinin mussel tissues after exposure to cadmium or mercury. Arch. Environ.Contam. Toxicol. 42, 36–42.
Gueldry, O., et al., 2003. Ycf1p-dependent Hg(II) detoxification in Saccharo-myces cerevisiae. Eur. J. Biochem. 270, 2486–2496.
Heuchel, R., Radtke, F., Georgiev, O., Stark, G., Aguet, M., Schaffner, W., 1994.The transcription factor MTF-1 is essential for basal and heavy metal-induced metallothionein gene expression. EMBO J. 13, 2870–2875.
Hochberg, Y., Benjamini, Y., 1990. More powerful procedures for multiplesignificance testing. Stat. Med. 9, 811–818.
Kelley, M.L., et al., 2001. Expression of homologues for p53 and p73 in thesoftshell clam (Mya arenaria), a naturally-occurring model for humancancer. Oncogene 20, 748–758.
Khessiba, A., Hoarau, P., Gnassia-Barelli, M., Aissa, P., Romeo, M., 2001.Biochemical response of the mussel Mytilus galloprovincialis from Bizerta(Tunisia) to chemical pollutant exposure. Arch. Environ. Contam. Toxicol.40, 222–229.
Kim, H.G., Kim, B.C., Kim, K., Park, E.H., Lim, C.J., 2004. Transcriptionalregulation of the Schizosaccharomyces pombe gene encoding glutathione S-transferase I by a transcription factor Pap1. J. Microbiol. 42, 353–356.
Landry, J., Huot, J., 1995. Modulation of actin dynamics during stress andphysiological stimulation by a signaling pathway involving p38MAP kinaseand heat-shock protein 27. Biochem. Cell. Biol. 73, 703–707.
Lavoie, J.N., Lambert, H., Hickey, E., Weber, L.A., Landry, J., 1995.Modulation of cellular thermoresistance and actin filament stabilityaccompanies phosphorylation-induced changes in the oligomeric structureof heat shock protein 27. Mol. Cell. Biol. 15, 505–516.
Leudeking, A., Koehler, A., 2004. Regualtion of expression of multixenobioticresistance (MXR) genes by environmental factors in the blue musselsMytilus edulis. Aquat. Toxicol. 69, 1–10.
Liang, M., Briggs, A.G., Rute, E., Greene, A.S., Cowley Jr., A.W., 2003.Quantitative assessment of the importance of dye switching andbiological replication in cDNA microarray studies. Physiol. Genomics14, 199–207.
Linder, P., 2003. Yeast RNA helicases of the DEAD-box family involved intranslation initiation. Biol. Cell 95, 157–163.
Liu, Q.R., Lopez-Corcuera, B., Mandiyan, S., Nelson, H., Nelson, N., 1993.Molecular characterization of four pharmacologically distinct gamma-aminobutyric acid transporters in mouse brain. J. Biol. Chem. 268,2106–2112.
Livingstone, D.R., Kirchin, M.A., Wiseman, A., 1989. Cytochrome P-450 andoxidative metabolism in molluscs. Xenobiotica 19, 1041–1062.
Machella, N., Regoli, F., Santella, R.M., 2005. Immunofluorescent detection of8-oxo-dG and PAH bulky adducts in fish liver and mussel digestive gland.Aquat. Toxicol. 71, 335–343.
Marchi, B., Burlando, B., Moore, M.N., Viarengo, A., 2004. Mercury-andcopper-induced lysosomal membrane destabilisation depends on [Ca2+]idependent phospholipase A2 activation. Aquat. Toxicol. 66, 197–204.
McHenery, J.G., Birkbeck, T.H., Allen, J.A., 1979. The occurrence of lysozymein marine bivalves. Comp. Biochem. Physiol., B 63, 25–29.
Mitta, G., et al., 2000a. Differential distribution and defense involvement ofantimicrobial peptides in mussels. J. Cell Sci. 113, 2759–2769.
Mitta, G., Vandenbulcke, F., Roch, P., 2000b. Original involvement of anti-microbial peptides in mussel innate immunity. FEBS Lett. 486, 185–189.
Mitta, G., Vandenbulcke, F., Hubert, F., Salzet, M., Roch, P., 2000c.Involvement of mytilins in mussel antimicrobial defense. J. Biol. Chem.276, 12954–12962.
Moll, U.M., Erster, S., Zaika, A., 2001. p53, p63 and p73-solos, alliances andfeuds among family members. Biochim. Biophys. Acta 1552, 47–59.
Montague, J.W., Hughes Jr., F.M., Cidlowski, J.A., 1997. Native recombinantcyclophilins A, B, and C degrade DNA independently of peptidylprolyl cis–trans-isomerase activity. Potential roles of cyclophilins in apoptosis. J. Biol.Chem. 272, 6677–6684.
Moore, M.N., 1988. Cytochemical responses of the lysosomal system andNADPH-ferrihemoprotein reductase in molluscan digestive gland cells toenvironmental and experimental exposure to xenobiotics. Mar. Ecol., Prog.Ser. 46, 81–89.
Muttray, A.F., Cox, R.L., St-Jean, S., van Poppelen, P., Reinisch, C.L., Baldwin,S.A., 2005. Identification and phylogentic comparison of p53 in two distinctmussel species. Comp. Biochem. Physiol. 140B, 237–250.
Nakamura, T.M., Du, L.L., Redon, C., Russell, P., 2004. Histone H2Aphosphorylation controls Crb2 recruitment at DNA breaks, maintainscheckpoint arrest, and influences DNA repair in fission yeast. Mol.Cell. Biol. 24, 6215–6230 (Erratum in: Mol Cell Biol. 2004, 24,7820).
Neumann, N.F., Galvez, F., 2002. Microarrays and toxicogenomics: applicationsfor ecotoxicology? Biotechnol. Adv. 20, 391–419.
Nuwasyr, M., Bitter, J., Trent, C., Barret, J.C., Afshari, C., 1999. Microarraysand toxicology: the advent of toxicogenomics. Mol. Carcinog. 24, 153–159.
Ohi, M.D., Link, A.J., Ren, L., Jennings, J.L., McDonald, W.H., Gould, K.L.,2002. Proteomics analysis reveals stable multiprotein complexes in bothfission and budding yeasts containing Myb-related Cdc5p/Cef1p, novelpre-mRNA splicing factors, and snRNAs. Mol. Cell. Biol. 22,2011–2024.
Pfaffl, M.W., Horgan, G.W., Dempfle, L., 2002. Relative expression softwaretool (REST) for group-wise comparison and statistical analysis of relativeexpression results in real-time PCR. Nucleic Acids Res. 30, e36.
Pombo, C.M., Bonventre, J.V., Molnar, A., Kyriakis, J., Force, T., 1996.Activation of a human Ste20-like kinase by oxidant stress defines a novelstress response pathway. EMBO J. 15, 4537–4546.
Rane, M.J., et al., 2003. Heat shock protein 27 controls apoptosis by regulatingAkt activation. J. Biol. Chem. 278, 27828–27835.
Schena, M., Shalon, D., Davis, R.W., Brown, P.O., 1995. Quantitative moni-toring of gene expression patterns with a complementary DNA microarray.Science 270, 467–470.
Snyder, M.J., 1998. Cytochrome P450 enzymes belonging to the CYP4 familyfrommarine invertebrates. Biochem. Biophys. Res. Commun. 249, 187–190.
Spotswood, H.T., Turner, B.M., 2002. An increasingly complex code. J. Clin.Invest. 110, 577–582.
Sturzenbaum, S.R., Morgan, A.J., Kille, P., 1999. Characterization andquantification of earthworm cyclophilins: identification of invariant andheavy metal responsive isoforms. Biochim. Biophys. Acta 1489, 467–473.
Suprenant, K.A., 2002. Vault ribonucleoprotein particles: sarcophagi, gondolas,or safety deposit boxes? Biochemistry 41, 14447–14454.
Taylor, L.K., Wang, H.C., Erikson, R.L., 1996. Newly identified stress-responsive protein kinases, Krs-1 and Krs-2. Proc. Natl. Acad. Sci. U. S. A.93, 10099–10104.
Thomas, R.S., et al., 2001. Identification of toxicologically predictive gene setsusing cDNA microarrays. Mol. Pharmacol. 60, 1189–1194.
Thompson, J.D., Higgins, D.G., Gibson, T.J., 1994. CLUSTAL W: improvingthe sensitivity of progressive multiple sequence alignment through sequenceweighting, position specific gap penalties and weight matrix choice. NucleicAcids Res. 22, 4673–4680.
Van Beneden, R.J., Walker, C.W., Laughner, E.S., 1997. Characterization ofgene expression of a p53 homologue in the soft-shell clam (Mya arenaria).Mol. Mar. Biol. Biotechnol. 6, 116–122.
Venier, P., Pallavicini, A., De Nardi, B., Lanfranchi, G., 2003. Towards acatalogue of genes transcribed in multiple tissues of Mytilus galloprovin-cialis. Gene 314, 29–40.
Venier, P., De Pitta', C., Pallavicini, A., Marsano, F., Varotto, L., Romualdi, C.,Dondero F., Viarengo A., Lanfranchi, G., in preparation. Mussel mRNAprofiles as novel indicators of chemical pollutants in coastal waters.
Viarengo, A., 1994. Heavy metals in marine invertebrates: mechanisms ofregulation and toxicity at the cellular level. CRC Crit. Rev. Aquat. Sci. 1,295–317.
Viarengo, A., Canesi, L., 1991. Mussel as biological indicators of pollution.Aquaculture 94, 225–243.

36 F. Dondero et al. / Gene 376 (2006) 24–36
Viarengo, A., Moore, M.N., Pertica, M., Mancinelli, G., Accomando, R.,1992. A simple procedure for evaluating the protein degradation rate inmussel (Mytilus galloprovincialis Lam.) tissues and its application in astudy of phenanthrene effects on protein catabolism. Comp. Biochem.Physiol. 103B, 27–32.
Williams, T.D., Gensberg, K., Minchin, S.D., Chipman, J.K., 2003. A DNAexpression array to detect toxic stress response in European flounder(Platichthys flesus). Aquat. Toxicol. 65, 141–157.
Winston, G.W., Moore, M.N., Kirchin, M.A., Soverchia, P., 1996. Productionof reactive oxygen species by hemocytes from the marine mussel, Mytilusedulis: lysosomal localization and effect of xenobiotics. Comp. Biochem.Physiol. 113C, 221–229.
Wolffe, A., 1998. Chromatin: Structure and Function. Academic Press, SanDiego, USA.
Related Documents