‘Gene Shaving’ as a method for identifying distinct sets of genes with similar expression patterns Tim Randolph & Garth Tan Presentation for Stat 593E May 15, 2003

‘Gene Shaving’ as a method for identifying distinct sets of genes with similar expression patterns Tim Randolph & Garth Tan Presentation for Stat 593E.
Dec 20, 2015
Welcome message from author
This document is posted to help you gain knowledge. Please leave a comment to let me know what you think about it! Share it to your friends and learn new things together.
Transcript

‘Gene Shaving’ as a method for identifying distinct sets of genes with similar expression patterns
Tim Randolph & Garth Tan
Presentation for Stat 593E
May 15, 2003
Presentation Outline
• Biology Background
• Reminder of Principle Component Analysis
• What is Gene Shaving ?
• The ‘Gene Shaving’ Algorithm
• Applications of Gene Shaving
• Conclusions
What is “gene expression”?
• Each cell contains a complete copy of all genes.
• The difference between a skin cell and bone cell is determined by which genes are producing proteins
i.e., which genes are being “expressed”.
• The expression of DNA information occurs in two steps: Transcription: DNA mRNA Translation: mRNA protein
• DNA microarrays measure transcription (i.e., the mRNA produced)


Reference cells sample
test cells sample
Label with dye
Transcription
Hybridize to array

The Dataset
N x p expression matrix X:
• p columns (patients)
• N rows (genes)
Green: under-expressed genes.
Red: over-expressed genes.
X = [xij ]

The ratio of the red and green intensities for each spot indicates the relative abundance of the corresponding DNA probe in the two nucleic acid target samples.
Xij = log2 (R/G)
Xij < 0, gene is over expressed in test sample relative to reference sample
Xij = 0, gene is expressed equally
Xij > 0, gene is under expressed in test sample relative to reference.sample.

• Knowing the list of human genes does not mean we know what they do.
• cDNA arrays help study the variation of gene expression across samples (e.g., tissues, or patients).
• Major challenge is interpreting data that consists of the expression levels of, say 6000 genes and 50 patients.
• Present goal: create a clustering that organizes genes with coherent behavior across samples.
Remarks

1st eigengene (principal component of XT)
Singular value decomposition of XT:
XT = U VT
=1
r
u1
v1
XTV= U
1 u1 = XTv1 = linear comb. columns of X
T (genes) with highest variance
g1 g2 gN

Introduction
• What is Gene Shaving ?A new statistical method that identifies subsets of
genes with coherent expression patterns and large variation across different conditions
Differs from hierarchical clustering and other widely used methods for analyzing gene expression in that genes may belong to more that one cluster.

The Gene Shaving Algorithm
Estimating the Optimal Cluster Size K
• Gene Shaving requires a quality measure for a cluster
• To select a good cluster, the method focuses on high coherence between members of the cluster

Estimating the Optimal Cluster Size K (cont.)
• The method defines the following measures of variances for a cluster Sk:
• The ‘Between Variance’ is the variance of the mean
gene
• The ‘Within Variance’ measures the variability of
each gene about the average

• A useful measure for choosing cluster size is the percent variance:
• A large R2 implies a tight cluster of coherent genes• Gene Shaving uses this measure for selecting a cluster
from the shaving sequence Sk
Estimating the Optimal Cluster Size K (cont.)
• Once a cluster is selected from the sequence, we can proceed to finding the optimal cluster size
• Let Dk be the R2 measure for the k-th sequence member.
• We wish to find the “Gap” between this value Dk
and D*bk, which is the R2 measure for cluster S*b
k
• This S*bk is the clustering sequence from a permuted
matrix X*b
Estimating the Optimal Cluster Size K (cont.)

• The “Gap” function is defined as:
Where D*k is the average of D*b
k over b.
• The optimal cluster size K is selected such that this “Gap” is the largest:
Estimating the Optimal Cluster Size K (cont.)

The Gene Shaving Algorithm(cont.)

So Far:form clusters Sk with
• high variance across samples;
• high correlation among genes within a cluster;
• low correlation between genes in different clusters.
The procedure seeks clusters Sk by maximizing v(Sk) = var(vector of col. avgs.)
Now incorporate supervision: use info, y, about the patients, and seek Sk by maximizing
(1- ) v(Sk) + J( v(Sk) , y )

Goal is in predicting patient survivalFind genes whose expression correlates with patient
survival.Produce groupings of patients which are statistically
different in survival.
Use additional information about the patients, y = (y1,…, yp), and combine unsupervised & supervised criteria into the objective function:
(1- ) v(Sk) + J( v(Sk) , y ) 0 1

Maximize (1- ) v(Sk) + J( v(Sk) , y )
• Information measure J( v(Sk) , y ) is a quadratic function that depends on the type of patient information, y.
• y = (y1,…, yp) may identify catagories of patients.
• Used here: y = (p patient survival times), and
J(v(Sk) , y) = g gT
where g is the score vector of the Cox model for predictingsurvival.

They chose = 0.1 as it “seemed to give a good mix of high gene correlation and low p-value for the Cox model”.
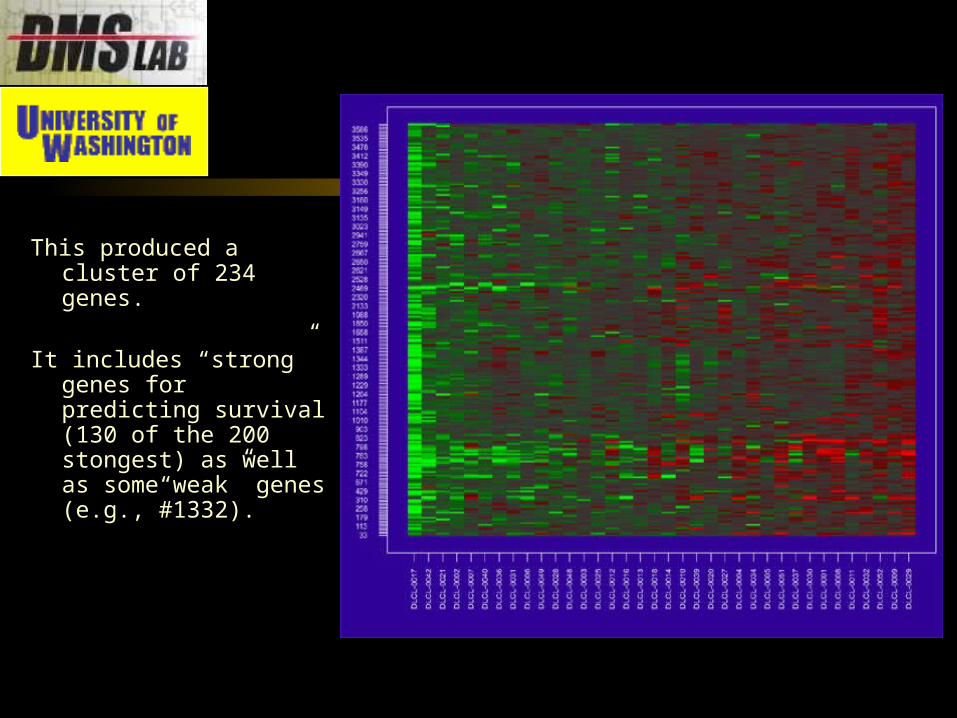
This produced a cluster of 234 genes.
It includes “strong” genes for predicting survival (130 of the 200 stongest) as well as some“weak” genes (e.g., #1332).

(a) Gap curve for supervised shaving. (b) Survival curves in the two groups defined by the low or high expression of the 234 genes. Group I has high expression of positive genes, and low expression of negative genes; Group 2 has low expression of positive genes, and high expression of negative genes. Negative genes are those preceded by a minus sign in Table 2.
Conclusions
• The proposed gene shaving methods search for clusters of genes showing both high variation across the samples, and correlation across the genes.
• This method is a potentially useful tool for exploration of gene expression data and identification of interesting clusters of genes worth further investigation
Related Documents