GENE PREDICTION presented by Rituparna Addy Department of Biotechnology Haldia Institute of Technology

GENE PREDICTION presentation
Aug 16, 2015
Welcome message from author
This document is posted to help you gain knowledge. Please leave a comment to let me know what you think about it! Share it to your friends and learn new things together.
Transcript
GENE PREDICTION presented by Rituparna AddyDepartment of BiotechnologyHaldia Institute of Technology
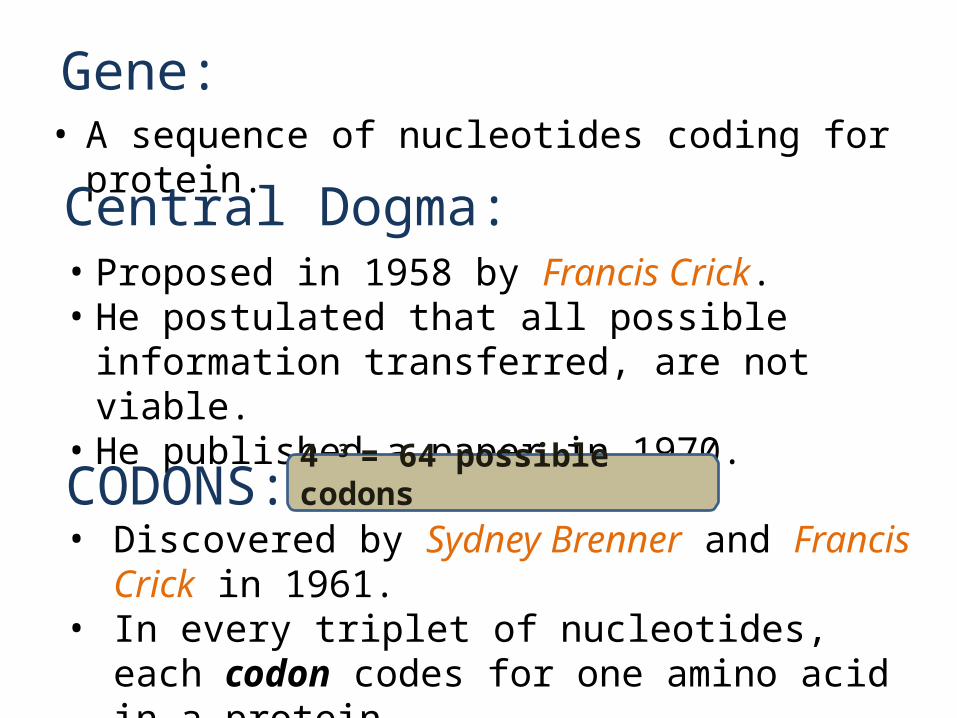
• A sequence of nucleotides coding for protein.Gene:
Central Dogma:• Proposed in 1958 by Francis Crick.• He postulated that all possible information
transferred, are not viable.• He published a paper in 1970.
CODONS:• Discovered by Sydney Brenner and Francis Crick in
1961.• In every triplet of nucleotides, each codon codes for
one amino acid in a protein.
4 3 = 64 possible codons
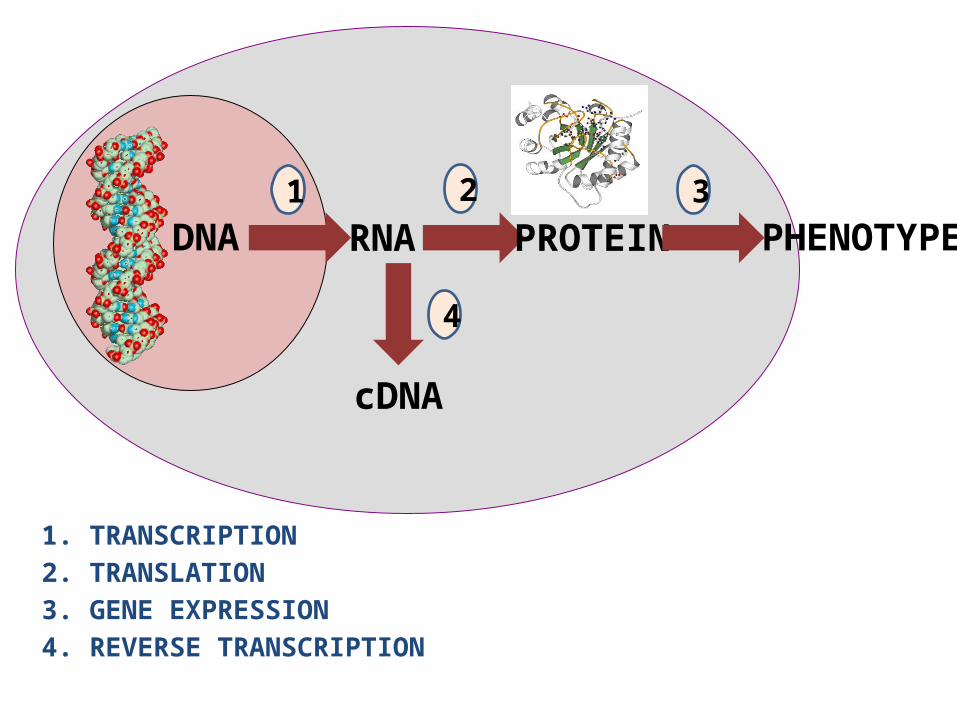
DNA RNA PROTEIN PHENOTYPE
cDNA
2
4
1 3
1. TRANSCRIPTION2. TRANSLATION3. GENE EXPRESSION4. REVERSE TRANSCRIPTION
DEfiniTION
• It is a prerequisite for detailed functional annotation of genes and genomes.
• It can detect location of ORFs (Open Reading Frames), structures of introns and exons.
• It describes all the genes computationally with near 100% accuracy.
• It can reduce the amount of experimental verification work required.
TYPES
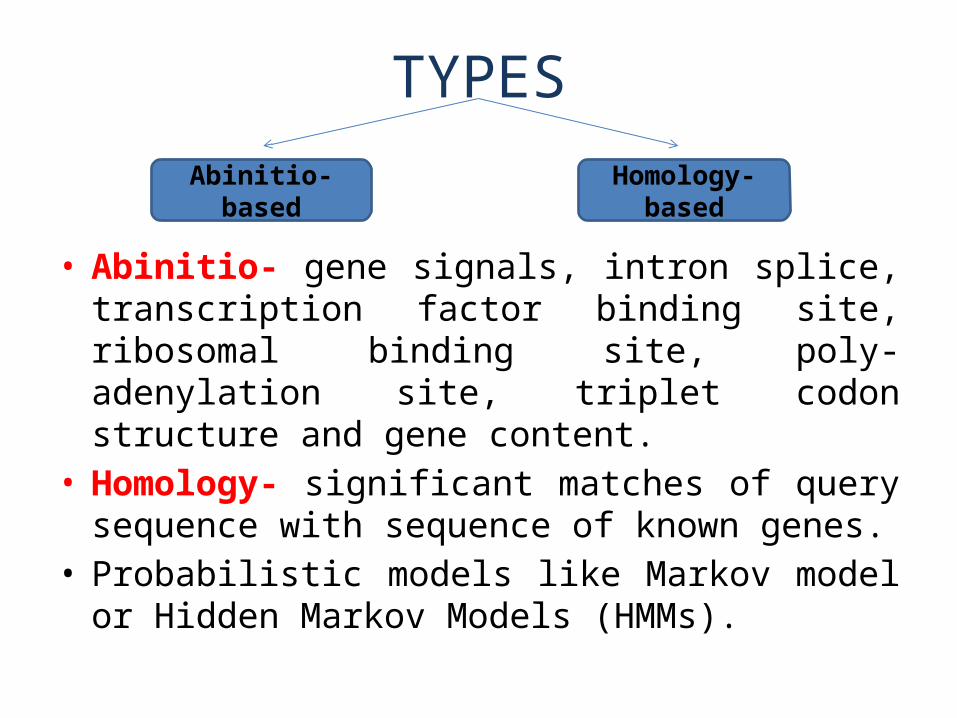
• Abinitio- gene signals, intron splice, transcription factor binding site, ribosomal binding site, poly-adenylation site, triplet codon structure and gene content.
• Homology- significant matches of query sequence with sequence of known genes.
• Probabilistic models like Markov model or Hidden Markov Models (HMMs).
Abinitio-based Homology-based

Gene finding software/program
• It is organism-specific.• It works best on genes that are reasonably similar to
a known gene detected previously.• It finds protein coding regions far better than non-
coding regions.• It can predict the most probable exons and
suboptimal exons.• It is reasonably successful in finding genes in a
genome. But still it is imperfect!
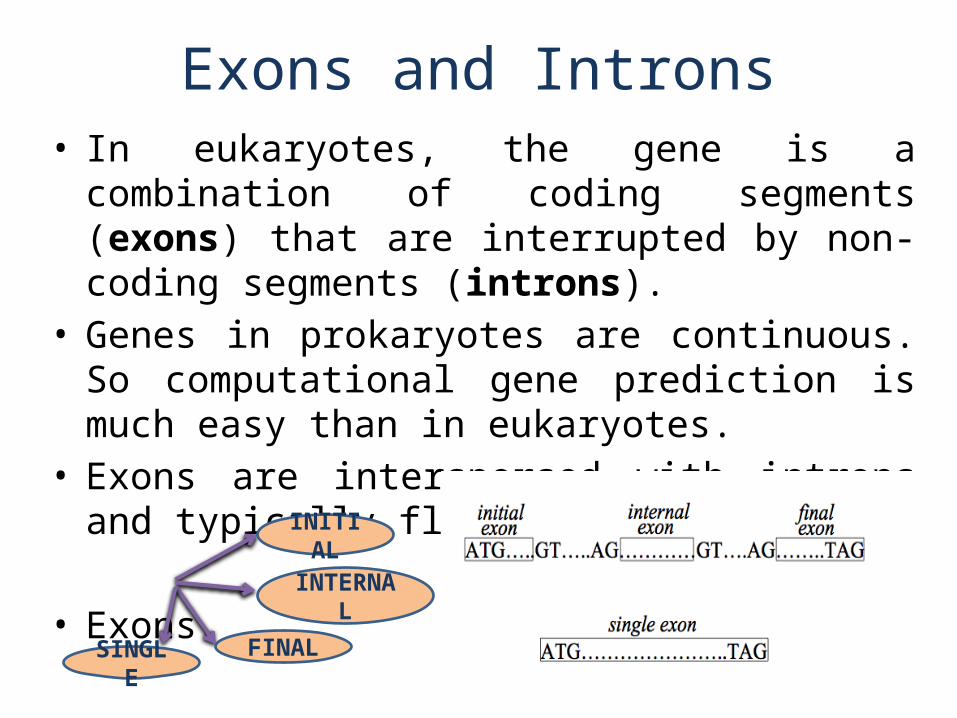
Exons and Introns• In eukaryotes, the gene is a combination of coding
segments (exons) that are interrupted by non-coding segments (introns).
• Genes in prokaryotes are continuous. So computational gene prediction is much easy than in eukaryotes.
• Exons are interspersed with introns and typically flanked by GT and AG.
• ExonsINITIAL
INTERNAL
FINALSINGLE
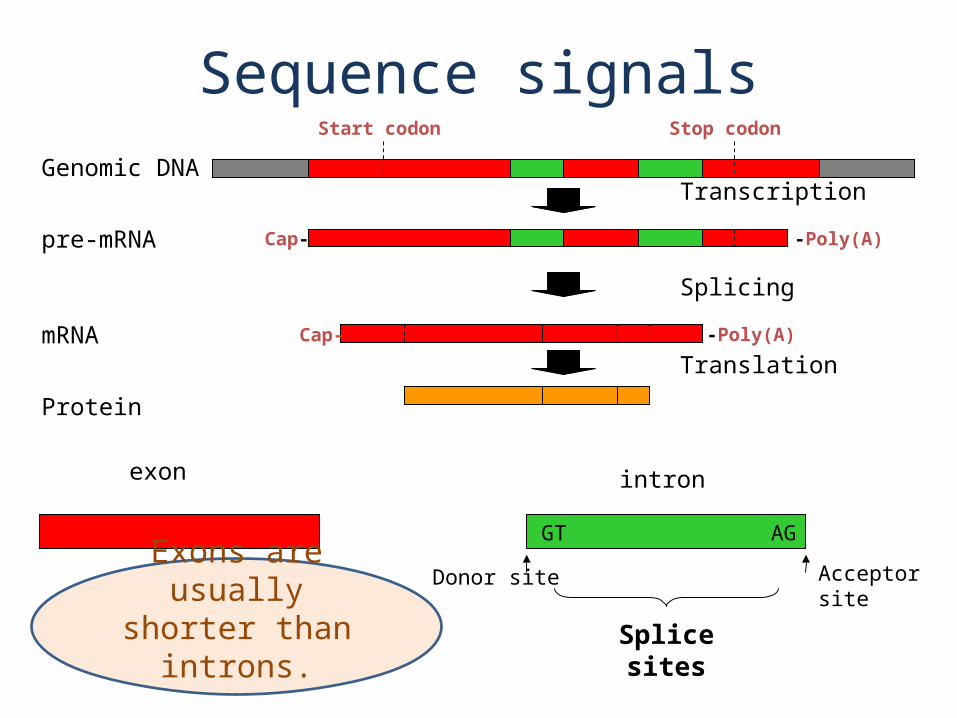
Translation
Protein
Splicing
mRNA Cap- -Poly(A)
Transcription
pre-mRNA Cap- -Poly(A)
Genomic DNA
Start codon Stop codon
GT AG
exon intron
Splice sites
Donor site Acceptor site
Sequence signals
Exons are usually shorter than introns.
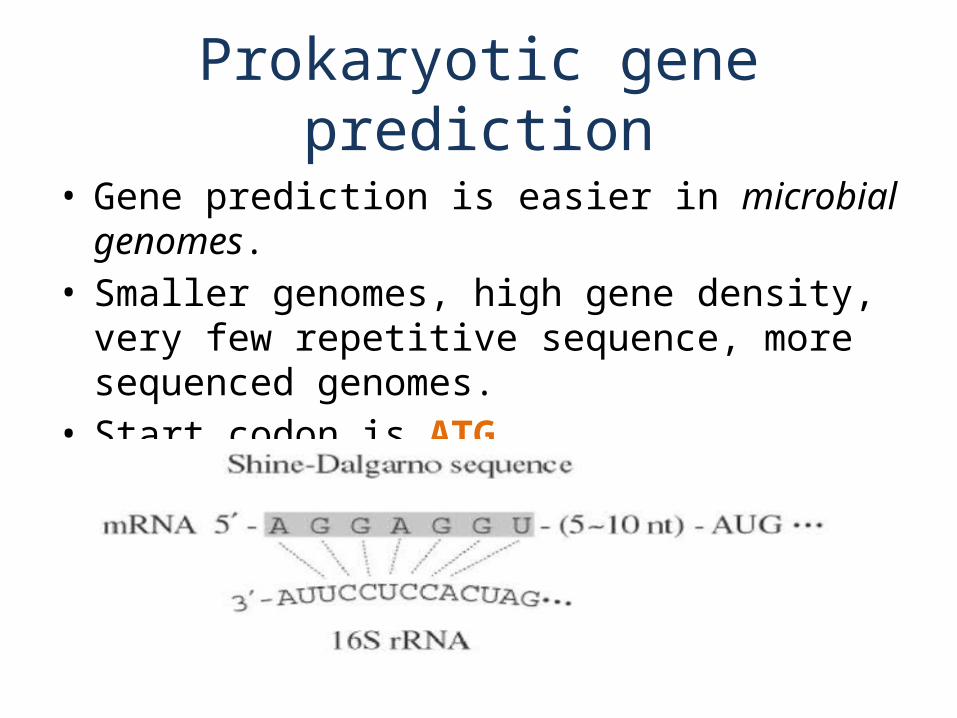
Prokaryotic gene prediction
• Gene prediction is easier in microbial genomes.• Smaller genomes, high gene density, very few
repetitive sequence, more sequenced genomes.• Start codon is ATG.• Ribosomal binding site/Shine Dalgarno sequence.
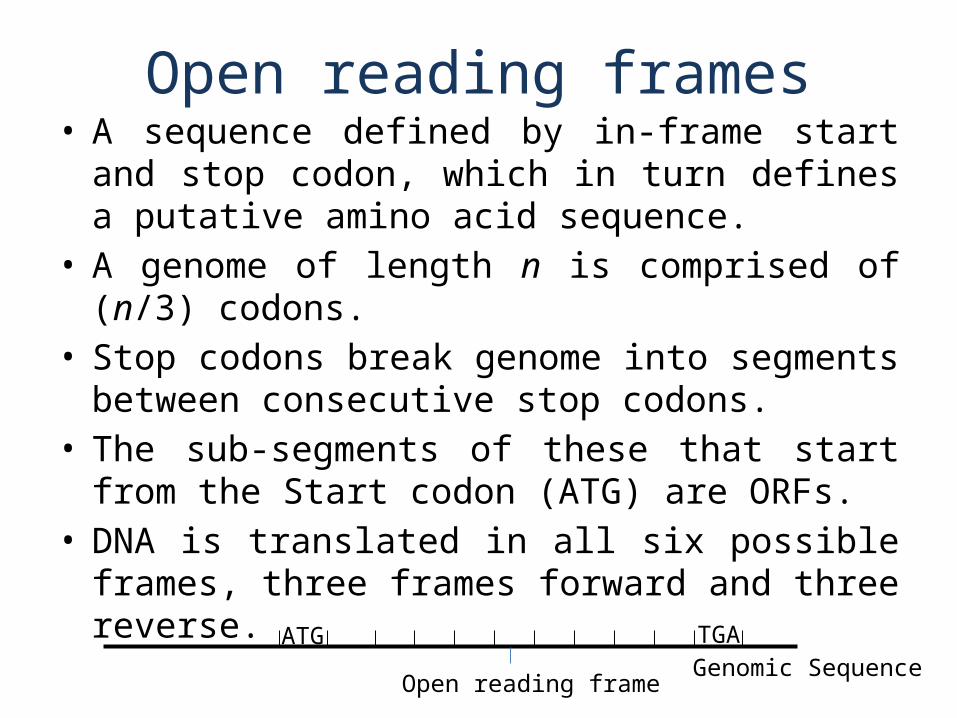
Open reading frames• A sequence defined by in-frame start and stop
codon, which in turn defines a putative amino acid sequence.
• A genome of length n is comprised of (n/3) codons.• Stop codons break genome into segments between
consecutive stop codons.• The sub-segments of these that start from the Start
codon (ATG) are ORFs.• DNA is translated in all six possible frames, three
frames forward and three reverse.
ATG TGAGenomic Sequence
Open reading frame

CTGCAGACGAAACCTCTTGATGTAGTTGGCCTGACACCGACAATAATGAAGACTACCGTCTTACTAACACCTGCAGACGAAACCTCTTGATGTAGTTGGCCTGACACCGACAATAATGAAGACTACCGTCTTACTAACACCTGCAGACGAAACCTCTTGATGTAGTTGGCCTGACACCGACAATAATGAAGACTACCGTCTTACTAACACCTGCAGACGAAACCTCTTGATGTAGTTGGCCTGACACCGACAATAATGAAGACTACCGTCTTACTAACACGACGTCTGCTTTGGAGAACTACATCAACCGGACTGTGGCTGTTATTACTTCTGATGGCAGAATGATTGTG
GACGTCTGCTTTGGAGAACTACATCAACCGGACTGTGGCTGTTATTACTTCTGATGGCAGAATGATTGTGGACGTCTGCTTTGGAGAACTACATCAACCGGACTGTGGCTGTTATTACTTCTGATGGCAGAATGATTGTGGACGTCTGCTTTGGAGAACTACATCAACCGGACTGTGGCTGTTATTACTTCTGATGGCAGAATGATTGTG
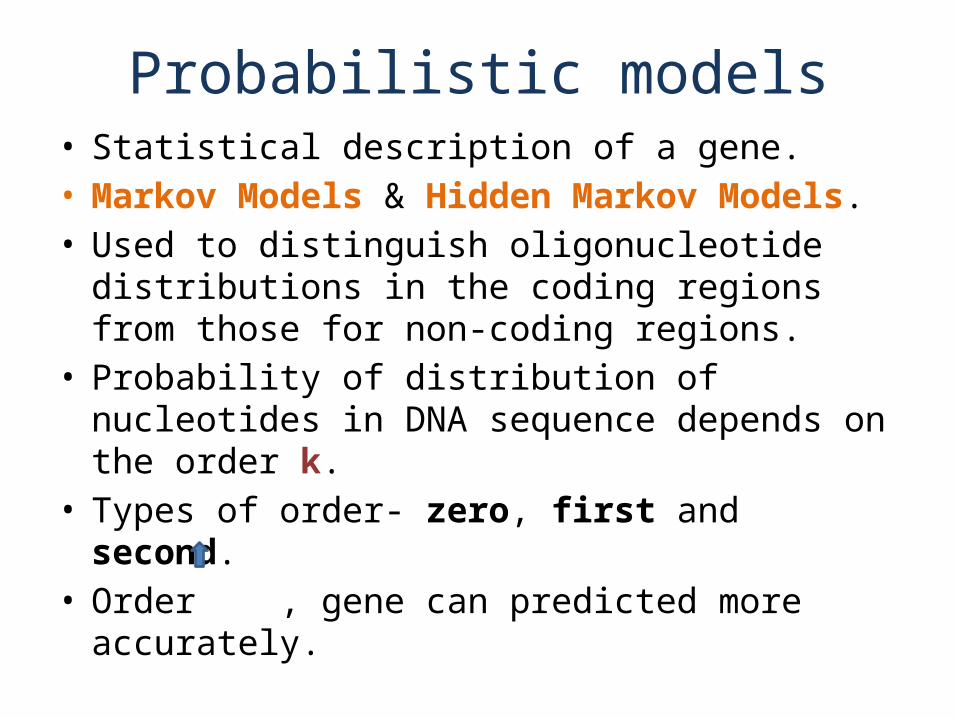
Probabilistic models• Statistical description of a gene.• Markov Models & Hidden Markov Models.• Used to distinguish oligonucleotide distributions in
the coding regions from those for non-coding regions.
• Probability of distribution of nucleotides in DNA sequence depends on the order k.
• Types of order- zero, first and second.• Order , gene can predicted more accurately.

ZERO FIRST SECOND
Each base occurs independently with a given probability
Occurrence depends on the base preceding it
Preceding of two bases to determine which base follows
Non-coding sequences --- Coding sequence
• Fifth order Markov model calculates the probability of hexamer bases and it can detect nucleotide correlations in in coding regions more accurately.
• Interpolated Markov Model (IMM) is a variable length model and samples the largest number of sequence patterns with k ranging from 1 to 8.
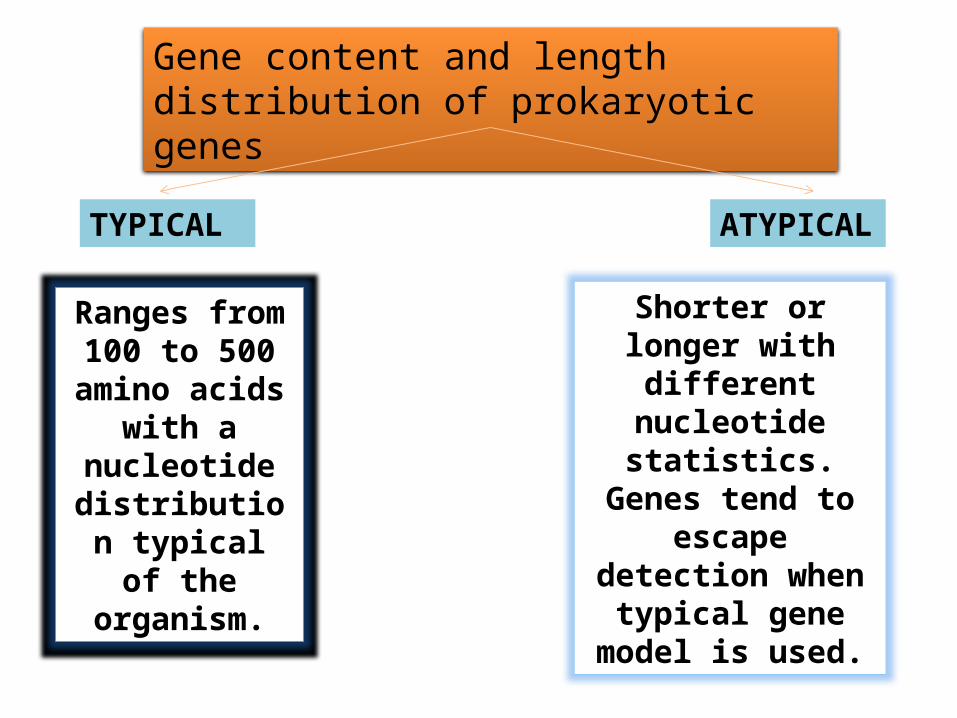
Gene content and length distribution of prokaryotic genes
TYPICAL ATYPICAL
Ranges from 100 to 500 amino acids with a nucleotide distribution
typical of the organism.
Shorter or longer with different
nucleotide statistics.Genes tend to escape
detection when typical gene model is
used.
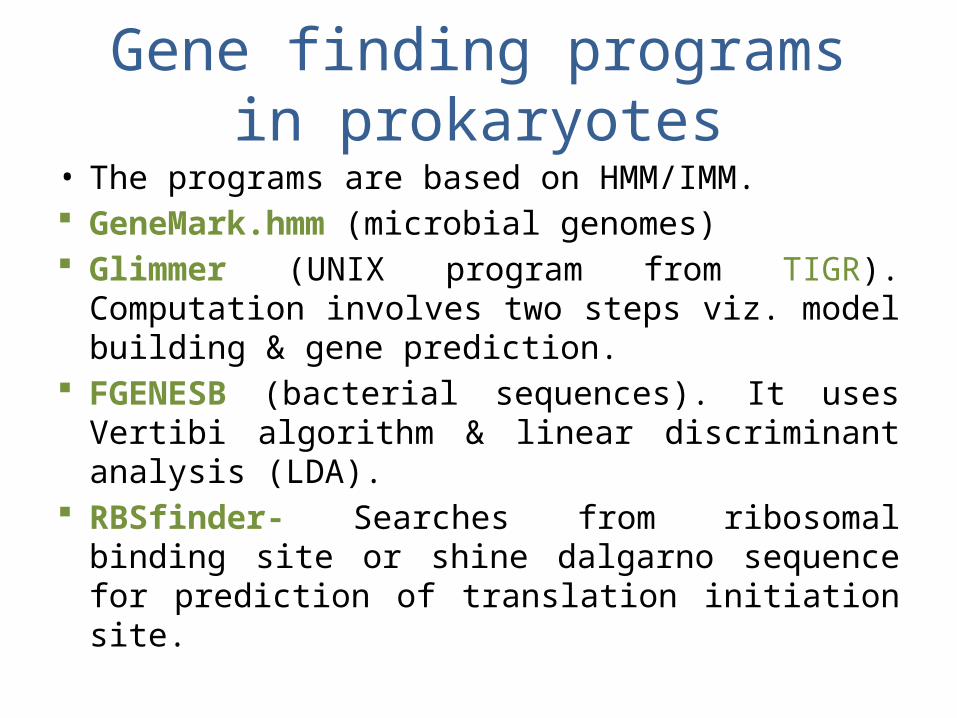
Gene finding programs in prokaryotes
• The programs are based on HMM/IMM. GeneMark.hmm (microbial genomes) Glimmer (UNIX program from TIGR). Computation
involves two steps viz. model building & gene prediction.
FGENESB (bacterial sequences). It uses Vertibi algorithm & linear discriminant analysis (LDA).
RBSfinder- Searches from ribosomal binding site or shine dalgarno sequence for prediction of translation initiation site.
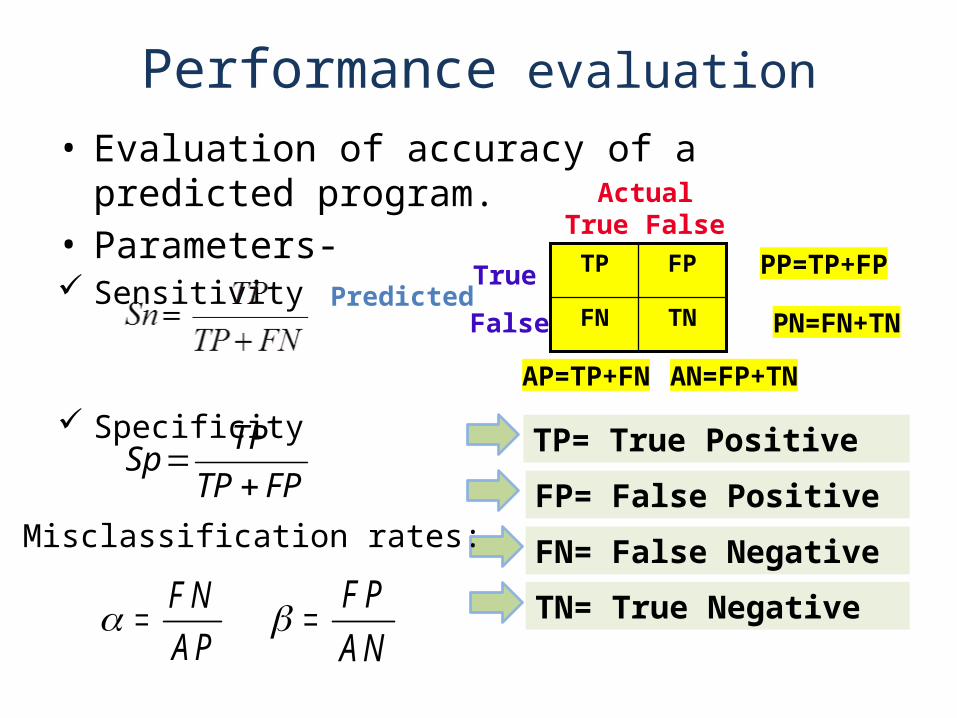
Performance evaluation• Evaluation of accuracy of a predicted program.• Parameters- Sensitivity
Specificity
ActualTrue False
PP=TP+FP
PN=FN+TN
AP=TP+FNAN=FP+TN
PredictedTrue
False TNFN
FPTP
SpTP
TP FPTP= True Positive
FP= False Positive
FN= False Negative
TN= True Negative
Misclassification rates:
F N
A P
F P
A N
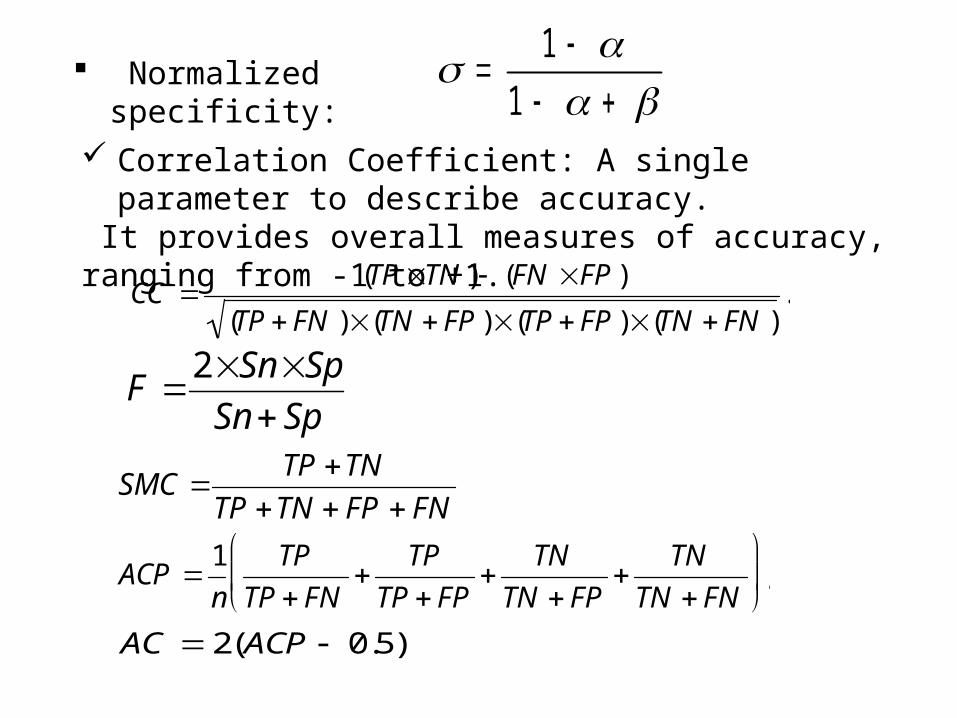
Normalized specificity:
1
1
SpSn
SpSnF
2
ACP 1
n
TP
TP FN
TP
TP FP
TN
TN FP
TN
TN FN
,
FNFPTNTP
TNTPSMC
AC 2(ACP 0.5).
Correlation Coefficient: A single parameter to describe accuracy.
It provides overall measures of accuracy, ranging from -1 to +1.
CC (TPTN ) (FN FP)
(TP FN )(TN FP)(TP FP)(TN FN ).
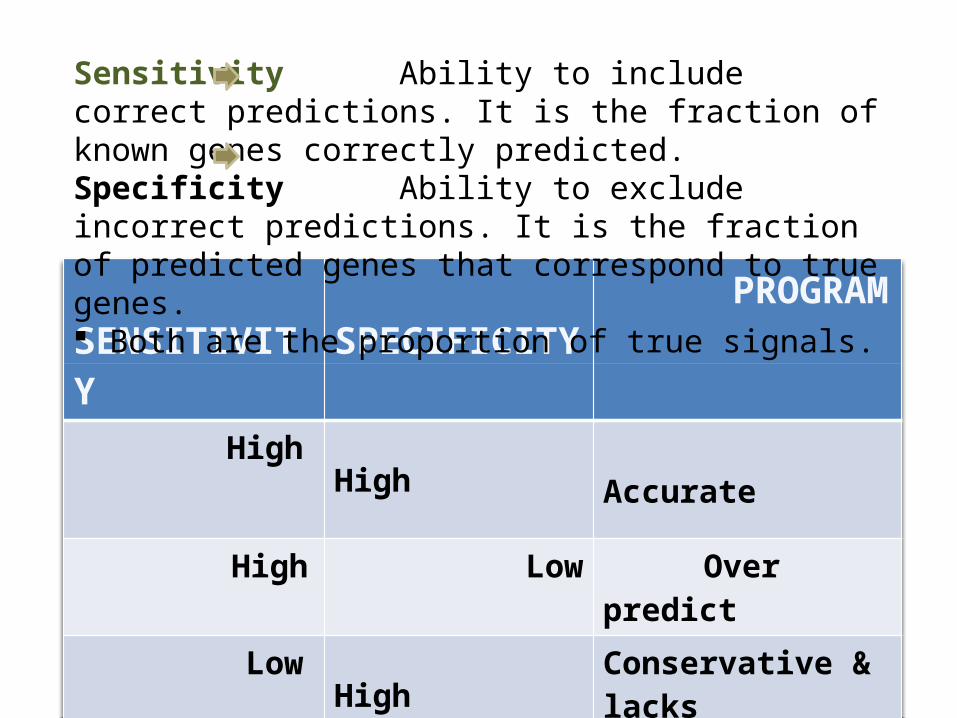
SENSITIVITY SPECIFICITY PROGRAM
High High Accurate
High Low Over predict
Low High Conservative & lacks predictive power
Sensitivity Ability to include correct predictions. It is the fraction of known genes correctly predicted.Specificity Ability to exclude incorrect predictions. It is the fraction of predicted genes that correspond to true genes. Both are the proportion of true signals.
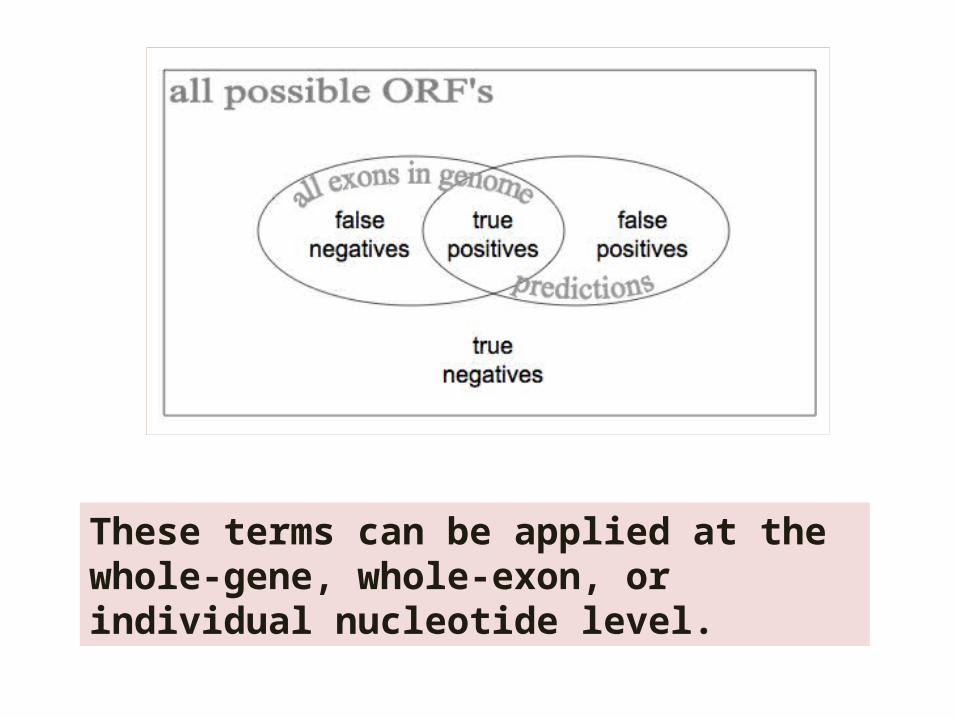
These terms can be applied at the whole-gene, whole-exon, or individual nucleotide level.
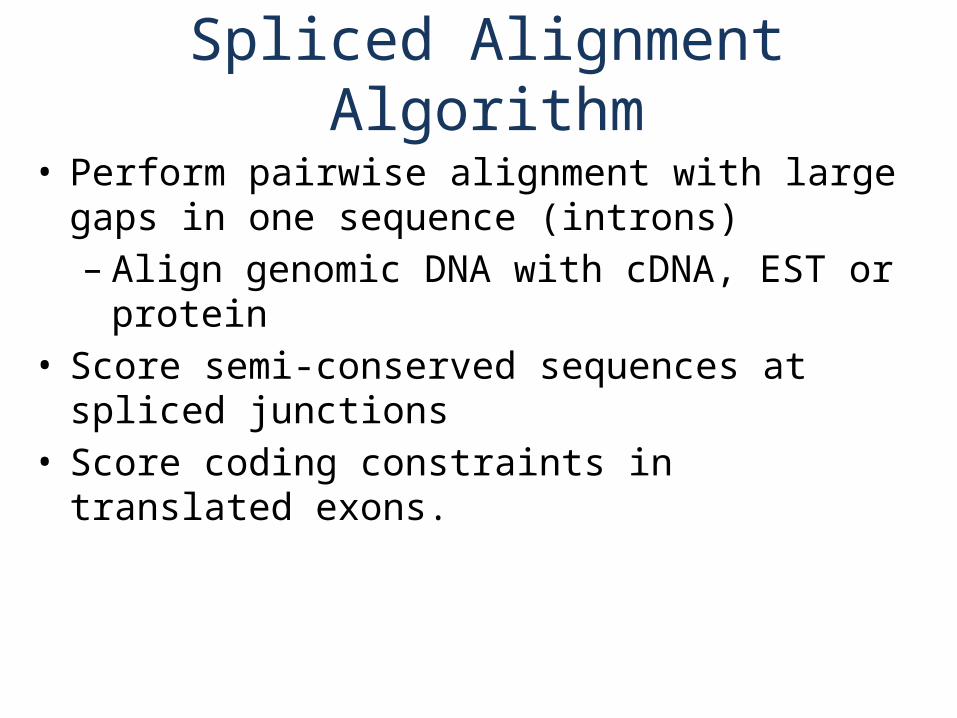
Spliced Alignment Algorithm• Perform pairwise alignment with large gaps in one
sequence (introns)– Align genomic DNA with cDNA, EST or protein
• Score semi-conserved sequences at spliced junctions• Score coding constraints in translated exons.
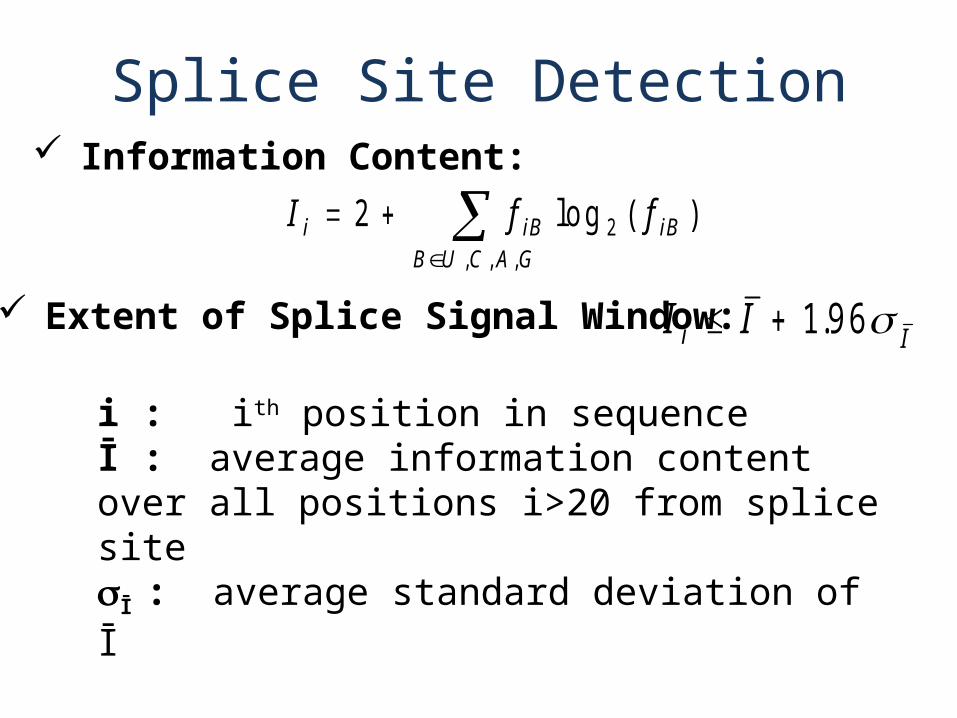
Splice Site Detection Information Content:
I f fi iBB U C A G
iB 2 2
, , ,
lo g ( )
Extent of Splice Signal Window: I Ii I 1 9 6.
i : ith position in sequenceĪ : average information content over all positions i>20 from splice siteĪ : average standard deviation of Ī
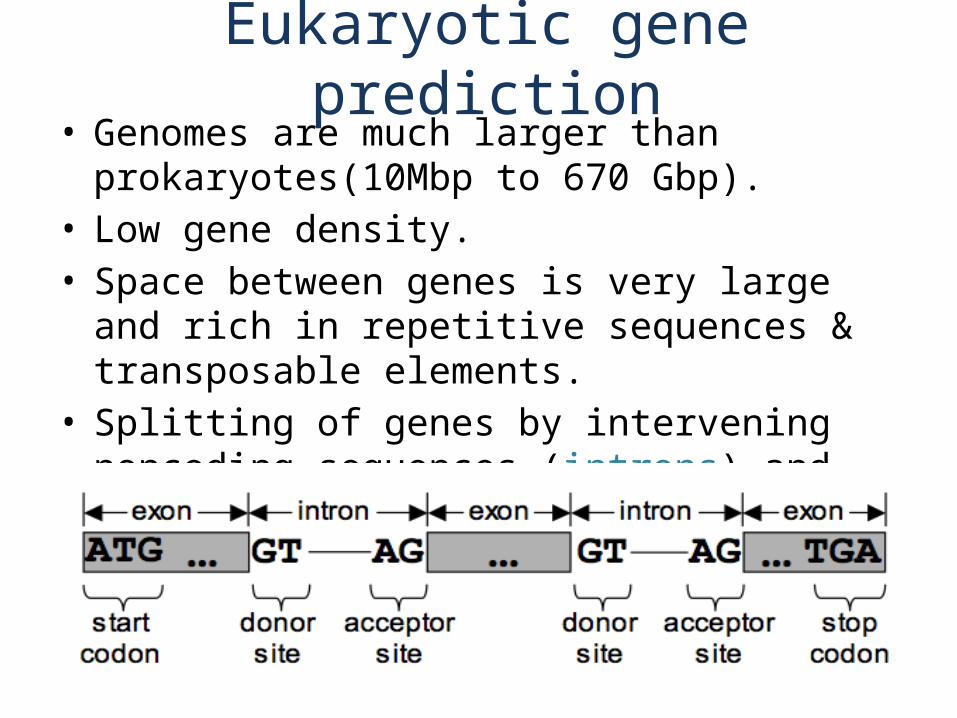
Eukaryotic gene prediction• Genomes are much larger than prokaryotes(10Mbp to
670 Gbp).• Low gene density.• Space between genes is very large and rich in
repetitive sequences & transposable elements.• Splitting of genes by intervening noncoding sequences
(introns) and joining of coding sequences (exons).

• Splice junctions follow GT-AG rule.• An intron at the 5’ splice junction has a consensus
motif GTAAGT and that at 3’ end NCAG.
• Genes have a high density of CG dinucleotides near the transcription start site. This region is CpG island. It helps to identify the transcription initiation site of an eukaryotic gene.
• Some post-transcriptional modification occur with the transcript to become mature mRNA viz. Capping, Splicing and Polyadenylation.
exon 2exon 1
AcceptorSite
DonorSite
GT AG
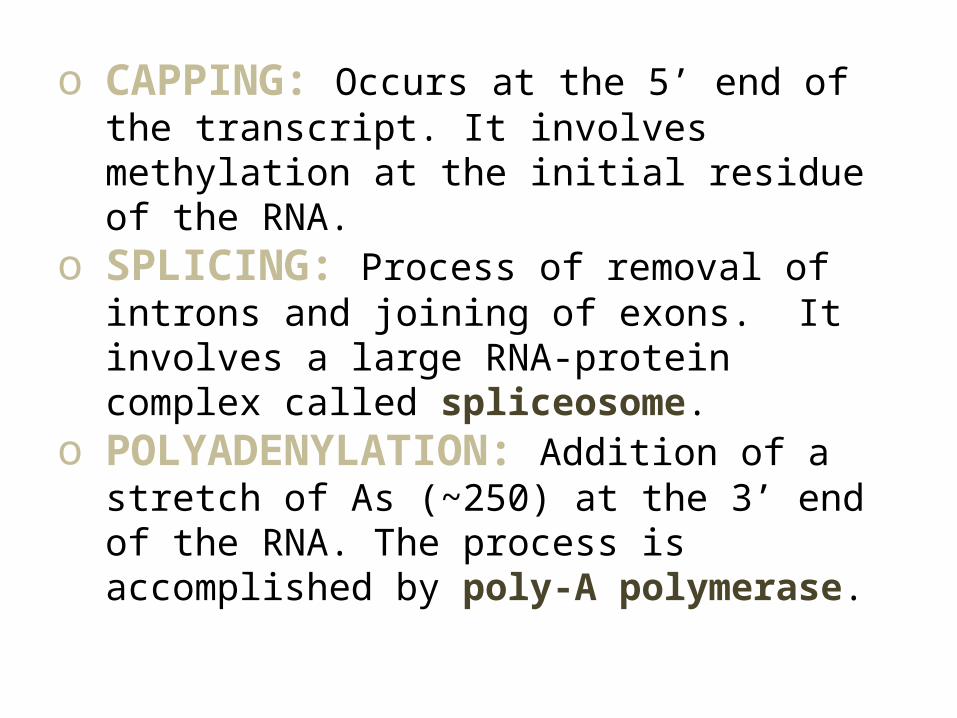
o CAPPING: Occurs at the 5’ end of the transcript. It involves methylation at the initial residue of the RNA.
o SPLICING: Process of removal of introns and joining of exons. It involves a large RNA-protein complex called spliceosome.
o POLYADENYLATION: Addition of a stretch of As (~250) at the 3’ end of the RNA. The process is accomplished by poly-A polymerase.
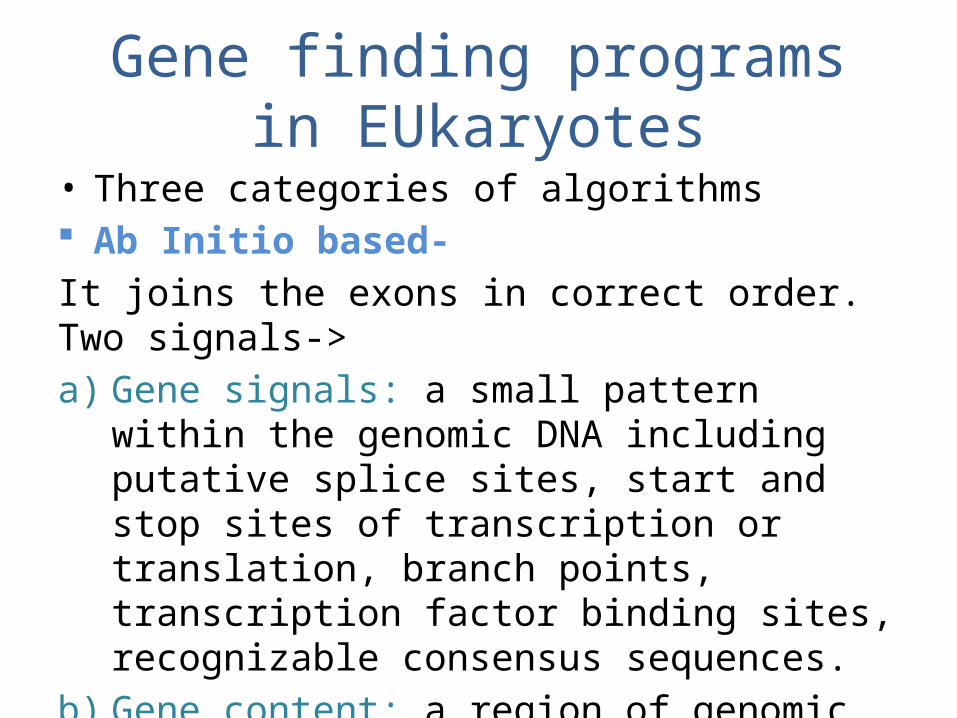
Gene finding programs in EUkaryotes
• Three categories of algorithms Ab Initio based-It joins the exons in correct order. Two signals->a) Gene signals: a small pattern within the genomic
DNA including putative splice sites, start and stop sites of transcription or translation, branch points, transcription factor binding sites, recognizable consensus sequences.
b) Gene content: a region of genomic DNA including nucleotide and amino acid distribution, Synonymous codon usage and hexamer frequencies.
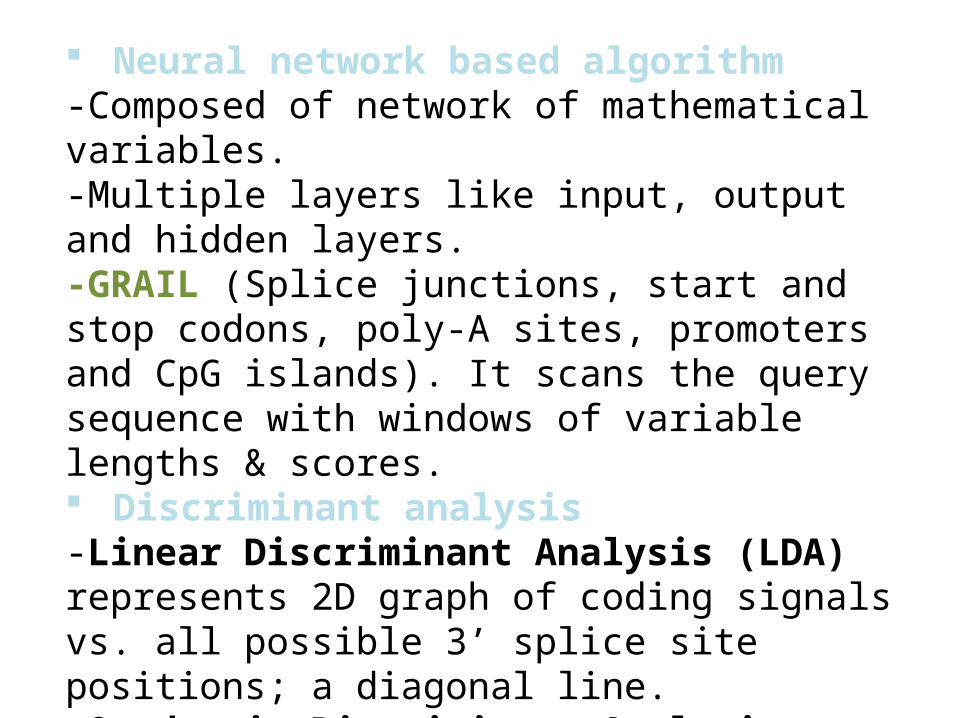
Neural network based algorithm-Composed of network of mathematical variables.-Multiple layers like input, output and hidden layers.-GRAIL (Splice junctions, start and stop codons, poly-A sites, promoters and CpG islands). It scans the query sequence with windows of variable lengths & scores. Discriminant analysis-Linear Discriminant Analysis (LDA) represents 2D graph of coding signals vs. all possible 3’ splice site positions; a diagonal line.-Quadratic Discriminant Analysis (QDA) represents quadratic function; a curved line.-FGENES (LDA)
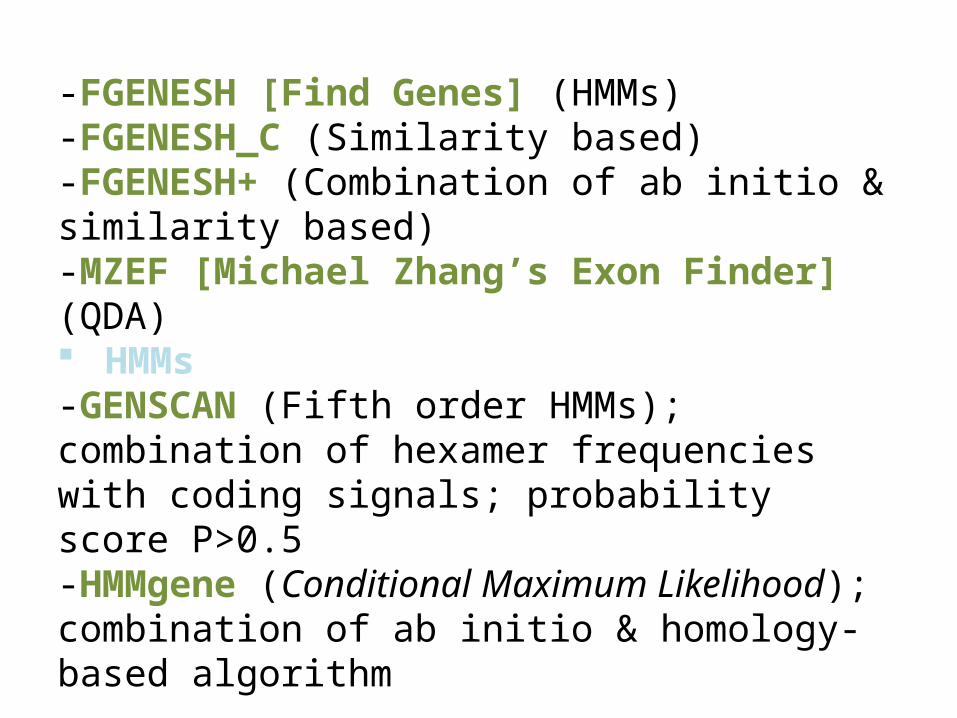
-FGENESH [Find Genes] (HMMs)-FGENESH_C (Similarity based)-FGENESH+ (Combination of ab initio & similarity based)-MZEF [Michael Zhang’s Exon Finder] (QDA) HMMs-GENSCAN (Fifth order HMMs); combination of hexamer frequencies with coding signals; probability score P>0.5-HMMgene (Conditional Maximum Likelihood); combination of ab initio & homology-based algorithm
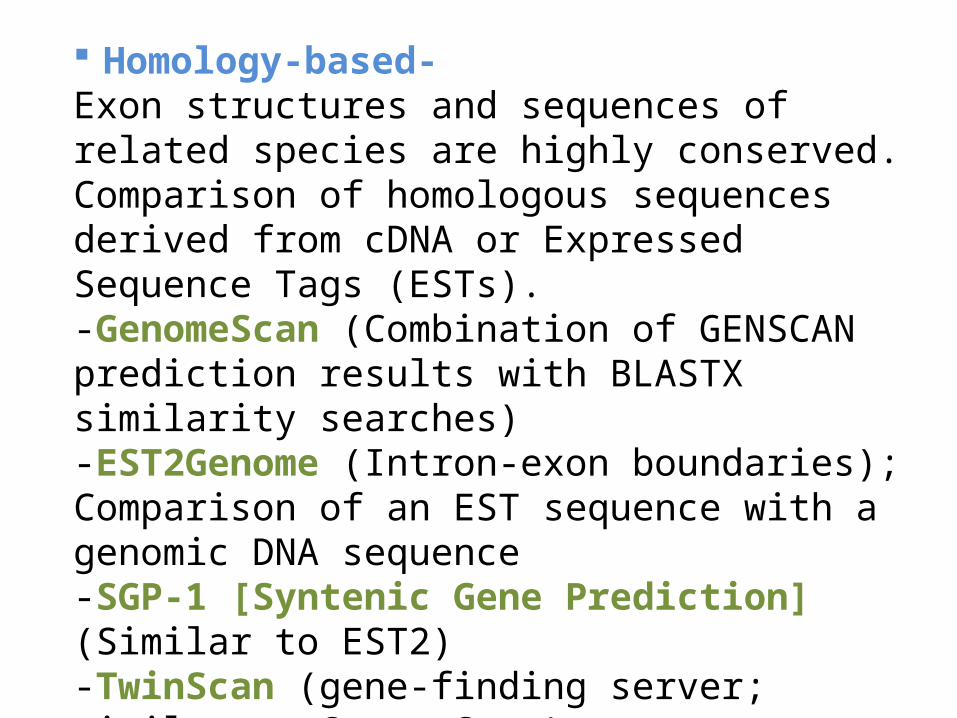
Homology-based-Exon structures and sequences of related species are highly conserved.Comparison of homologous sequences derived from cDNA or Expressed Sequence Tags (ESTs).-GenomeScan (Combination of GENSCAN prediction results with BLASTX similarity searches)-EST2Genome (Intron-exon boundaries); Comparison of an EST sequence with a genomic DNA sequence-SGP-1 [Syntenic Gene Prediction] (Similar to EST2)-TwinScan (gene-finding server; similar to GenomeScan)
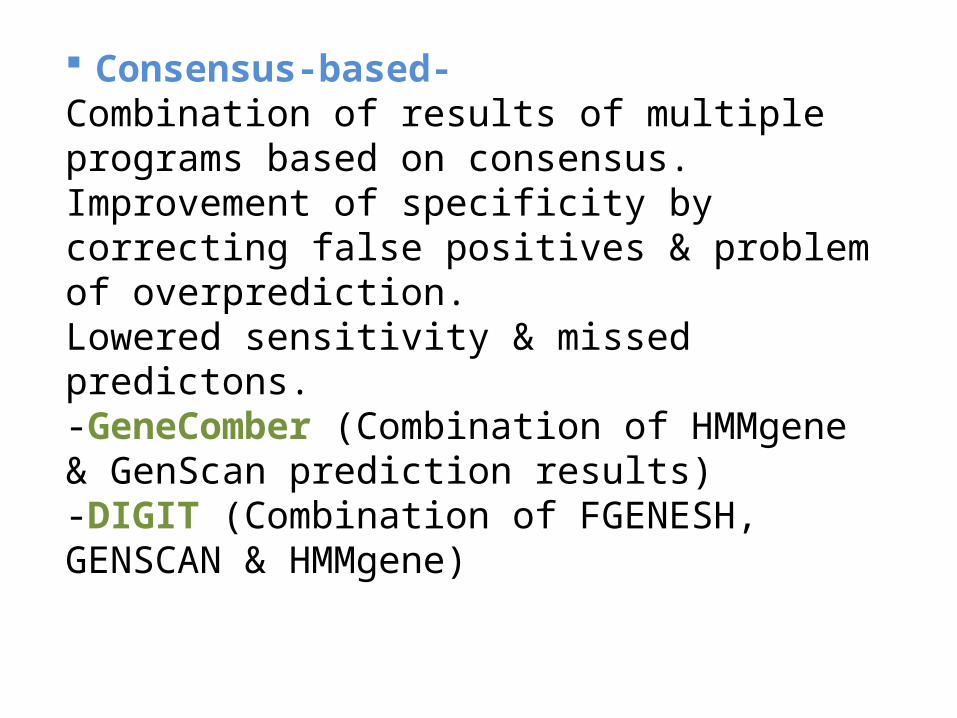
Consensus-based-Combination of results of multiple programs based on consensus.Improvement of specificity by correcting false positives & problem of overprediction.Lowered sensitivity & missed predictons.-GeneComber (Combination of HMMgene & GenScan prediction results)-DIGIT (Combination of FGENESH, GENSCAN & HMMgene)
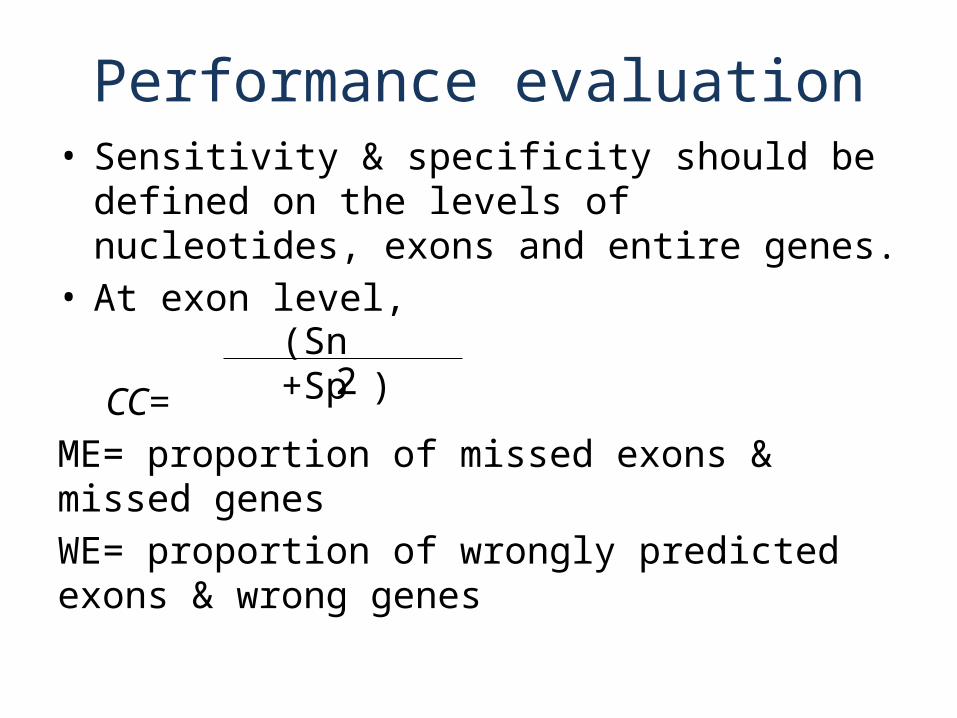
Performance evaluation• Sensitivity & specificity should be defined on the
levels of nucleotides, exons and entire genes.• At exon level,
CC=ME= proportion of missed exons & missed genesWE= proportion of wrongly predicted exons & wrong genes
(Sn +Sp )2
cONCLUSION• The computational prediction of genes are most
important process in genome & sequence analysis. • The prediction can be easy for prokaryotes because
of non-interrupted genes. HMMs based predictions provide best accuracy.
• Current algorithms are categorized ab initio, homology & consensus based. The statistical & homology information generate improved performance of gene finding.
• With this advancement of computational techniques the gene prediction process will become more feasible.
REFERENCES http://www.4ulr.com/products/currentprotocols/bioinformatics.html http://proxy.lib.iastate.edu:2103/nrg/journal/v3/n9/full/nrg890_fs.html http://proxy.lib.iastate.edu:2103/nrg/journal/v5/n4/full/nrg1315_fs.html Xiong J.; Essential bioinformatics; QH 324.2.X56 2006

THANK YOU
Related Documents