Title: Gene flow and Andean uplift shape the diversification of Gasteracantha cancriformis (Araneae: Araneidae) in Northern South America Short running title: Andean uplift and genetic connectivity in spiders Fabian C. Salgado-Roa 1,2 , Carolina Pardo-Diaz 1 , Eloisa Lasso De Paulis 2,3 , Carlos F. Arias 3 , Vera Nisaka Solferini 4 , Camilo Salazar 1 1 Programa de Biología, Facultad de Ciencias Naturales y Matemáticas, Universidad del Rosario, Cra. 24 No 63C-69, Bogotá D.C. 111221, Colombia 2 Departamento de Ciencias Biológicas, Universidad de los Andes, Carrera 1 #18A- 12, Bogotá, Colombia 3 Smithsonian Tropical Research Institute, Ancón, Panamá 4 Department of Genetics, Evolution and Bioagents, Institute of Biology, University of Campinas, Campinas, Sao Paulo, Brazil ACKNOWLEDGEMENTS For collecting permits, we thank Ministerio de Ambiente y Desarrollo Sostenible and ANLA in Colombia (Permiso Marco # 0530) and ICMBio in Brazil (27127 and 38889). We also thank multiple volunteers and friends for their logistic support and help with fieldwork in Colombia and Brazil. We are very grateful to Ariadna Morales for helping with the implementation of PHRAPL. FCS was funded by COLCIENCIAS (Joven Investigador Program Call 761-2016, contract FCN1705-CE101). CS and CPD were funded by COLCIENCIAS Grant FP44842-005-2017. CFA was . CC-BY-NC-ND 4.0 International license It is made available under a (which was not peer-reviewed) is the author/funder, who has granted bioRxiv a license to display the preprint in perpetuity. The copyright holder for this preprint . http://dx.doi.org/10.1101/250977 doi: bioRxiv preprint first posted online Jan. 19, 2018;

Welcome message from author
This document is posted to help you gain knowledge. Please leave a comment to let me know what you think about it! Share it to your friends and learn new things together.
Transcript
Title: Gene flow and Andean uplift shape the diversification of Gasteracantha
cancriformis (Araneae: Araneidae) in Northern South America
Short running title: Andean uplift and genetic connectivity in spiders
Fabian C. Salgado-Roa1,2, Carolina Pardo-Diaz1, Eloisa Lasso De Paulis2,3, Carlos
F. Arias3, Vera Nisaka Solferini4, Camilo Salazar1
1Programa de Biología, Facultad de Ciencias Naturales y Matemáticas, Universidad
del Rosario, Cra. 24 No 63C-69, Bogotá D.C. 111221, Colombia
2Departamento de Ciencias Biológicas, Universidad de los Andes, Carrera 1 #18A-
12, Bogotá, Colombia
3Smithsonian Tropical Research Institute, Ancón, Panamá
4Department of Genetics, Evolution and Bioagents, Institute of Biology, University of
Campinas, Campinas, Sao Paulo, Brazil
ACKNOWLEDGEMENTS
For collecting permits, we thank Ministerio de Ambiente y Desarrollo Sostenible and
ANLA in Colombia (Permiso Marco # 0530) and ICMBio in Brazil (27127 and 38889).
We also thank multiple volunteers and friends for their logistic support and help with
fieldwork in Colombia and Brazil. We are very grateful to Ariadna Morales for helping
with the implementation of PHRAPL. FCS was funded by COLCIENCIAS (Joven
Investigador Program Call 761-2016, contract FCN1705-CE101). CS and CPD were
funded by COLCIENCIAS Grant FP44842-005-2017. CFA was
.CC-BY-NC-ND 4.0 International licenseIt is made available under a (which was not peer-reviewed) is the author/funder, who has granted bioRxiv a license to display the preprint in perpetuity.
The copyright holder for this preprint. http://dx.doi.org/10.1101/250977doi: bioRxiv preprint first posted online Jan. 19, 2018;
supported by Convocatoria ‘Es tiempo de volver’-COLCIENCIAS-2014, contract No.
656–2014. NVS was funded by FAPESP (grants #2012/ 02526-7, #2013/50491-0
and #2013/08293-7). All authors declare no conflict of interest.
ABSTRACT
Aim The Andean uplift has played a major role shaping the current Neotropical
biodiversity. However, in arthropods other than butterflies, little is known about how
this geographic barrier has impacted species historical diversification. Here we
examined the phylogeography of the widespread and color polymorphic spider
Gasteracantha cancriformis to: (i) evaluate the effect of the northern Andean uplift on
its divergence and, (ii) assess whether its diversification occurred in the presence of
gene flow.
Location Northern Andes and Brazil
Methods We inferred phylogenetic relationships and divergence times in G.
cancriformis using mitochondrial and nuclear data from 105 individuals in northern
South America. Genetic diversity, divergence and population structure were
quantified. We also compared multiple demographic scenarios for this species using
a model-based approach (PHRAPL) to establish divergence with or without gene
flow. Finally, we evaluated the association between genetic variation and color
polymorphism.
Results Both nuclear and mitochondrial data supported two well-differentiated
clades, which correspond to populations occurring in opposite sides of the Eastern
cordillera of the Colombian Andes. The splitting between these clades occurred in
the early Pleistocene, around 2.13 million years ago (95% HPD = 0.98–3.93).
.CC-BY-NC-ND 4.0 International licenseIt is made available under a (which was not peer-reviewed) is the author/funder, who has granted bioRxiv a license to display the preprint in perpetuity.
The copyright holder for this preprint. http://dx.doi.org/10.1101/250977doi: bioRxiv preprint first posted online Jan. 19, 2018;
Despite this vicariant event, there is shared genetic variation between the clades,
which is better explained by a scenario of historical divergence in the face of gene
flow. Color polymorphism was randomly scattered in both clades and is not
statistically associated with the genetic variation studied here.
Main Conclusions The final uplift of Eastern cordillera of the Colombian Andes was
identified as the major force that shaped the diversification of G. cancriformis in
Northern South America, resulting in a cis- and trans-Andean phylogeographic
structure for the species. The divergence in the face of gene flow between cis- and
trans-Andean populations found for this spider has been likely facilitated by the
presence of low-elevation passes across the Eastern Colombian cordillera. Our work
constitutes the first example where the Andean uplift coupled with gene flow
influenced the evolutionary history of an arachnid lineage.
Keywords
Gene flow, Andean uplift, Colombian Andes, Gasteracantha cancriformis, Andean
passes
INTRODUCTION
The Northern Andes in South America is one of the most biodiverse regions on the
planet, and the origins of this rich diversity has been linked to past geological and
climatic events such as the uplift of the Andes and quaternary climatic oscillations
(Kattan et al., 2004). The effect of these geoclimatic events in promoting divergence
between Neotropical populations and species can be elucidated with genetic data,
especially by detecting deviations from the expected coalescent patterns in neutral
loci (Rull, 2011). Most studies addressing this question have identified the uplift of
the Northern Andes as a major driver of Neotropical diversification in a scenario
.CC-BY-NC-ND 4.0 International licenseIt is made available under a (which was not peer-reviewed) is the author/funder, who has granted bioRxiv a license to display the preprint in perpetuity.
The copyright holder for this preprint. http://dx.doi.org/10.1101/250977doi: bioRxiv preprint first posted online Jan. 19, 2018;
consistent with allopatric differentiation, wherein the complex topography of the
Andes isolated populations on both sides of this barrier thus restricting gene flow
(Antonelli et al., 2009; Brumfield & Capparella, 1996; Hoorn et al., 2010). In contrast
with this classic view, a recent comparative phylogeographic study found discordant
divergence times for multiple avian lineages with cross-Andean distribution, a result
that is better explained by dispersal ability across the Andes rather than a single
vicariant event (Smith et al., 2014). In line with this finding, new evidence supports
the notion that common diversification modes in Neotropical birds include secondary
contact between cross-Andean populations or divergence in presence of gene flow
facilitated by low-elevation corridors along the Andes (Cadena, Pedraza, &
Brumfield, 2016; Oswald et al., 2017).
However, our current knowledge on the modes of animal diversification in the
Northern Andes is mostly based in vertebrates and, although arthropods are the
most diverse group of animals, analyses of their diversification in this region remain
scarce (De-silva et al., 2017; Turchetto-Zolet et al., 2013). Some studies limited to
insects, especially butterflies, show that the Andean mountains have had an
important role triggering their diversification, where speciation with and without gene
flow across the Andes has occurred (Arias et al., 2014; Chazot et al., 2016, 2017;
De-silva et al., 2017; Díaz et al., 2014; Dick, Roubik, Gruber, & Bermingham, 2004;
Elias et al., 2009). Yet, a comprehensive understanding on how the Andean orogeny
has promoted Neotropical animal diversification needs the inclusion of additional
arthropod taxa, like arachnids.
Gasteracantha cancriformis (Linnaeus, 1758) is a Neotropical orb-web and color
polymorphic spider that has at least eight known morphs (Gawryszewski, 2007). This
color polymorphism, however, is still enigmatic (Gawryszewski & Motta, 2012). The
.CC-BY-NC-ND 4.0 International licenseIt is made available under a (which was not peer-reviewed) is the author/funder, who has granted bioRxiv a license to display the preprint in perpetuity.
The copyright holder for this preprint. http://dx.doi.org/10.1101/250977doi: bioRxiv preprint first posted online Jan. 19, 2018;
species has a wide distribution in the Neotropical region, occurring in both sides of
the Andes and in the Colombian inter-Andean valleys. This distribution makes it a
great model to test whether the uplift of the Andes has influenced its diversification at
the population level.
Here, we implemented a multilocus approach to study the genetic connectivity
between polymorphic populations of G. cancriformis across the Northern Andes (Fig.
1, table S1) and tested scenarios of strict vicariance vs. diversification with gene
flow. We also evaluated if lineage clustering in this spider is explained by geography
or color pattern. Overall, this work contributes to deepen our understanding on how
Andean orogeny has shaped processes of biotic diversification and biogeography in
the Neotropics.
MATERIALS AND METHODS
Sample collection
We used standard aerial searching and beating methods to sample a total of 105
individuals of G. cancriformis from 17 localities distributed from the North of
Colombia to Southeastern Brazil (Fig. 1, Table S1). Specimens were color coded
following Gawryszewski (2007), preserved in a 20% dimethylsulphoxide (DMSO)
solution saturated with NaCl and stored at −80 ºC. Colombian samples were
deposited in the Arthropods Collection of the Universidad del Rosario (CAUR#229)
and Brazilian specimens were deposited in the Coleção Científica de Aracnídeos e
Miriápodes of the Instituto Butantan (São Paulo, Brazil).
DNA extraction, amplification and sequencing
DNA was extracted from legs using the Wizard Genomic DNA purification kit
(Promega), following the manufacturer's protocol. We amplified two mitochondrial
.CC-BY-NC-ND 4.0 International licenseIt is made available under a (which was not peer-reviewed) is the author/funder, who has granted bioRxiv a license to display the preprint in perpetuity.
The copyright holder for this preprint. http://dx.doi.org/10.1101/250977doi: bioRxiv preprint first posted online Jan. 19, 2018;
genes, the Cytochrome Oxidase I (587 pb; COI; Folmer, Black, Hoeh, Lutz, &
Vrijenhoek, 1994) and the 16S ribosomal DNA gene (397 pb; 16s; Simon et al.,
1994), using the conditions reported elsewhere (Blackledge et al., 2009; McHugh,
Yablonsky, Binford, & Agnarsson, 2014; Peres et al., 2015). We also sequenced two
nuclear loci, the internal transcribed spacer 2 (296 pb; ITS;White, Bruns, Lee, &
Taylor, 1990) and 28S ribosomal DNA gene (681 pb; 28s; Hedin & Maddison, 2001),
which have been previously used in spiders (Moradmand, Schönhofer, & Jäger,
2014; Peres et al., 2015). Finally, we used the published transcriptome of G.
cancriformis (Prosdocimi et al., 2011) and designed the primers forward: 5’-
CAATTACACCTGGGAATCTTCTG-3’ and reverse: 5’-
CCCTGACAAAATTCAAATAGTCG-3’ to amplify a 560 bp fragment of the heat
shock protein 90 (HSP90), a gene that was used previously in phylogenetic studies
in Heliconius (Salazar et al., 2010). PCR reactions for this marker were performed in
a 10μL reaction volume containing 1x PCR buffer, 2.5 mM MgCl2, 500 μM dNTPs,
0.5μM each primer, 0.5 U Platinum Taq (INVITROGEN) and 30–40 ng of DNA. The
PCR cycling profile was 94°C for 5 min, 40 cycles at 94°C for 30 s, Tm 54°C for 30 s
and 72°C for 1 min and final extension at 72°C during 10 min. For all loci, we
visualized 1μL of the PCR reaction in a 1.5% agarose gel to verify the success of
PCR. Positive amplicons were cleaned up by ExoSAP-IT (USB Corp., Cleveland,
OH) and their sequencing was carried out by ELIM Biopharmaceuticals Inc.
(Hayward, CA).
Gene sequences were read, edited and assembled with CLC MAIN WORKBENCH
(QIAGEN), to obtain a consensus sequence per-individual. For nuclear loci,
haplotype inference for heterozygous calls was conducted with the PHASE algorithm
implemented in DNASP V5.10 (Librado & Rozas, 2009) with 5,000 iterations per
.CC-BY-NC-ND 4.0 International licenseIt is made available under a (which was not peer-reviewed) is the author/funder, who has granted bioRxiv a license to display the preprint in perpetuity.
The copyright holder for this preprint. http://dx.doi.org/10.1101/250977doi: bioRxiv preprint first posted online Jan. 19, 2018;
simulation and accepting inferred haplotypes with a confidence higher than 90%.
Then, we used MEGA 6.0 (Tamura, Stecher, Peterson, Filipski, & Kumar, 2013)
using the CLUSTAL W algorithm (Thompson, Higgins, & Gibson, 1994) to create
alignments for each loci; these alignments were visually inspected and corrected.
Alignments were translated to protein and verified for stop codons in MESQUITE V3.04
(Maddison & Maddison, 2015).
Molecular phylogenetics and divergence times
The nucleotide substitution model for each mitochondrial gene was selected using
the BIC criterion in jMODELTEST 0.1.1 (Posada, 2008). The most suitable models
were HKY+I for COI and TIM+I for 16S.
Tree topologies were estimated with Bayesian inference (BI) using BEAST 1.7.4
(Drummond, Suchard, Xie, & Rambaut, 2012) and including two Micrathena vigorsi
individuals as outgroups (Table S1). We unlinked the substitution model for each
gene and linked the clock model and tree. We applied a lognormal relaxed clock to
estimate divergence times using a mutation rate of 0.0112 (SD=0.001)
substitution/site/million years, previously reported for node dating and calibration in
spiders (Bartoleti et al., 2017; Bidegaray-Batista et al., 2011; Kuntner, Arnedo,
Trontelj, Lokovšek, & Agnarsson, 2013). We ran two runs of 100 million generations
sampling every 1000 generations. The initial 10000 trees were discarded as burn-in
using TREEANNOTATOR (DRUMMOND & BOUCKAERT, 2015). We examined the output in
TRACER1.5 (Rambaut & Drummond, 2014) to confirm that all effective sample size
(ESS) values were greater than 200 and the convergence of the chains to the
stationary distribution. The maximum credibility tree that best represented the
posterior distribution was visualized and edited with FIGTREE1.4 (Rambaut, 2012).
.CC-BY-NC-ND 4.0 International licenseIt is made available under a (which was not peer-reviewed) is the author/funder, who has granted bioRxiv a license to display the preprint in perpetuity.
The copyright holder for this preprint. http://dx.doi.org/10.1101/250977doi: bioRxiv preprint first posted online Jan. 19, 2018;
Phylogenetic reconstruction was also done with Maximum Likelihood (ML) in IQ-TREE
(Nguyen, Schmidt, Von Haeseler, & Minh, 2015) using the same substitution models
described before and applying the edge-proportional partition. Node support was
assessed with 1000 bootstrap replicates.
Population genetics
We calculated haplotype (h) and nuclear (π) diversity, number of segregating sites
(ss) and Tajima’s D with DNASP V5.10 (LIBRADO & ROZAS, 2009). Genetic structure
was evaluated using FST at two different levels: (i) among phylogenetic clades (i.e.
populations occurring in opposite sides of the Eastern cordillera of the Colombian
Andes) and (ii) among populations, and significance of deviations from panmixia was
assessed with the Hudson’s permutation test (Hudson, Boos, & Kaplan, 1992). An
analysis of molecular variance (AMOVA) was also calculated for the same levels of
differentiation with ARLEQUIN 3.5 (Excoffier & Lischer, 2010) using 10000
permutations.
Using the nuclear dataset we identified the number of population genetic clusters (K)
with the Bayesian clustering approach implemented in STRUCTURE 2.3.4 (Pritchard,
Stephens, & Donnelly, 2000). We ran the analysis under the admixture model, with a
50,000 burn-in and 100,000 MCMC sampling generations for K ranging from 1 to 13
(localities with only one individual were removed from this analysis), with 20
iterations for each value of K. We determined the K that better reflects our data
applying three complementary approaches as recommended by Janes et al. (2017):
(i) according to the delta K method of Evanno (Evanno, Regnaut, & Goudet, 2005),
(ii) plotting the likelihood of K for each value of K (Earl & vonHoldt, 2012) and, (iii)
.CC-BY-NC-ND 4.0 International licenseIt is made available under a (which was not peer-reviewed) is the author/funder, who has granted bioRxiv a license to display the preprint in perpetuity.
The copyright holder for this preprint. http://dx.doi.org/10.1101/250977doi: bioRxiv preprint first posted online Jan. 19, 2018;
reporting multiple barplots for K values between 2 and 5. All these tests were
implemented in CLUMPAK (Kopelman et al., 2015). An additional validation of the
genetic clusters for each locus was done with multivariate analysis. For this, fasta
sequences were transformed into a genind object and loaded into the adegenet R
package (Jombart & Ahmed, 2011), where we performed a principal component
analysis (PCA). We retained the first two components for a subsequent Canonical
Discriminant Analysis using the R package candisc (Friendly & Fox, 2017).
As isolation by distance (IBD) can obscure population structure signals, we
investigated the presence of IBD for each locus using Mantel (Mantel, 1967) with the
R package vegan (Dixon, 2003). For this, pairwise geographic distances among
localities were calculated with the function distm from R package geosphere
(Hijmans, 2016) while genetic distances were estimated by linearizing the FST values
obtained previously. We also implemented a partial Mantel test (Smouse, Long, &
Sokal, 1986) to separate the effect of geographic distance from the population
assignments, based on STRUCTURE results.
Considering the recent concerns about Mantel test (Legendre, Fortin, & Borcard,
2015; Legendre & Fortin, 2010; Meirmans, 2012), we also tested linear correlations
between the logarithm of the geographic distances and genetic distances as
recommended by Legendre & Fortin (2010) and Diniz-Filho et al. (2013).
Demographic model testing
We used PHRAPL (Jackson et al., 2017) to choose a demographic model that fits
our data. PHRAPL compares the topologies obtained from empirical data with those
simulated under multiple demographic models and then, by calculating the
proportion of times that simulated topologies match the empirical ones, it
.CC-BY-NC-ND 4.0 International licenseIt is made available under a (which was not peer-reviewed) is the author/funder, who has granted bioRxiv a license to display the preprint in perpetuity.
The copyright holder for this preprint. http://dx.doi.org/10.1101/250977doi: bioRxiv preprint first posted online Jan. 19, 2018;
approximates the log-likelihood of the data given a model. PHRAPL calculates
Akaike Information Criterion (AIC) as a measure of lack of model fit, whilst the
associated AIC weights (wAIC) can be interpreted as model probabilities.
PHRAPL can compare various demographic models, which can be broadly
categorized as: (i) isolation-only (IO), (ii) migration-only (MO), (iii) isolation-with-
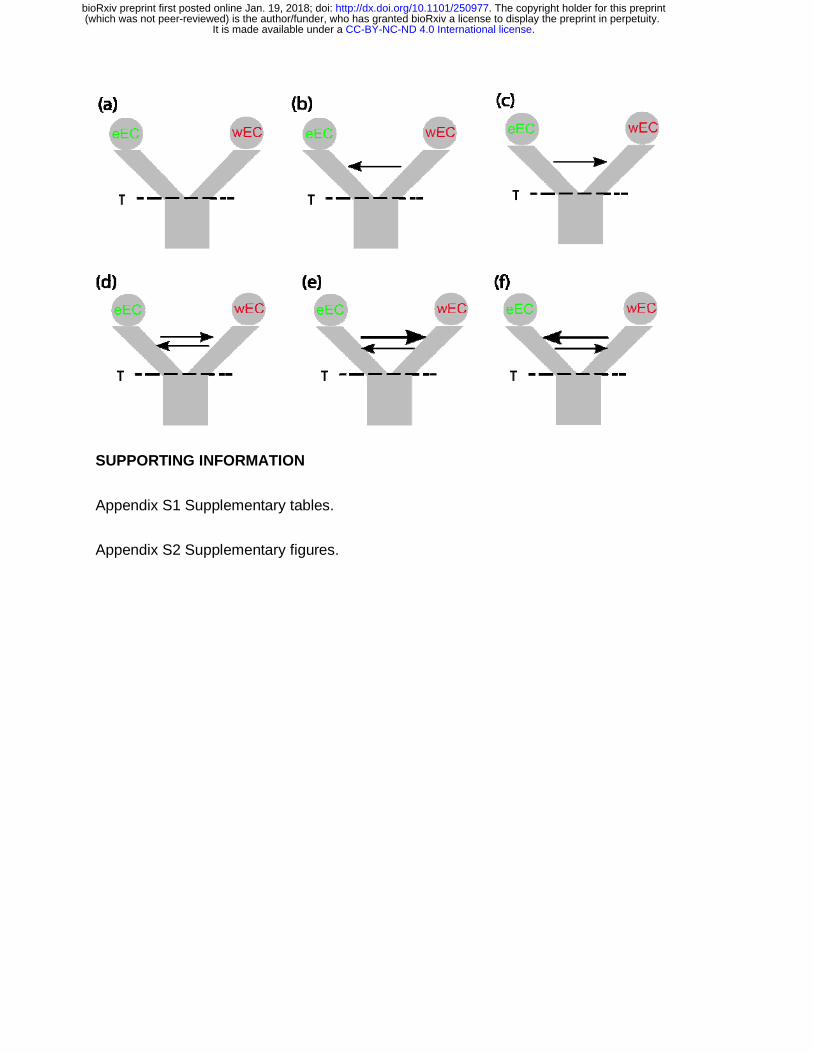
migration (IM) and, (iv) mixed models (ME). We tested six models that fall into the IO
and IM categories. The first is an IO model with a single coalescent event and no
migration, while the other five are IM models that assume constant gene flow along
the branch length and differ in the direction and strength of migration (Fig. 4).
As input for PHRAPL we assigned each individual to its collecting site (east or west
of the Eastern cordillera) and loaded five midpoint rooted trees estimated with
IQTREE (one per locus; Nguyen et al., 2015). We used jMODELTEST (Posada, 2008)
to select the most plausible pattern of sequence evolution for each gene (COI:
HKY+I, 16S: TIM+I, ITS: K80+I, 28S: F81+I, HSP90: GTR+I)
We subsampled four tips per group and 100 subsamples per gene, giving a total of
500 observed trees. Then, 100,000 trees were simulated for each model using a grid
of parameter values for population divergence (t = 0.30,0.58,1.40,2.54,4.1) and
migration (m = 0.10,0.22,0.46,1.00,2.15), in units of 4N and 4Nm respectively. In
case gene flow was detected in our dataset, we tested two additional models that
correspond to recent (τ-9τ/10) and ancient secondary contact (τ-τ/5), starting from
the tips.
Phenotype by genotype association
To test whether there is an association between the coloration of individuals and
their genetic variation, we ran a chi-square Monte Carlo test under the null
.CC-BY-NC-ND 4.0 International licenseIt is made available under a (which was not peer-reviewed) is the author/funder, who has granted bioRxiv a license to display the preprint in perpetuity.
The copyright holder for this preprint. http://dx.doi.org/10.1101/250977doi: bioRxiv preprint first posted online Jan. 19, 2018;
hypothesis of independence between coloration and genetic haplotypes. This
analysis was run for each locus and establishing color morphs categories following
Gawryszewski (2007). The analysis included only Colombian individuals as Brazilian
samples do not have color records.
RESULTS
Phylogenetic relationships and divergence time
Both BI and ML showed the same phylogenetic pattern where two highly supported
clades are recovered, with their internal relationships unresolved (Fig. 2). These
major clades correspond to populations at the eastern (eEC) and western (wEC)
sides of the eastern cordillera of the Colombian Andes (EC), with some individuals
from the foothills of the EC showing shared haplotypes between both clades (Fig. 2).
Other physiographic features in the Neotropics, such as the western and central
cordilleras of the Colombian Andes or the Brazilian dry diagonal, do not cause
population structure in G. cancriformis. Accordingly, Brazilian samples were
monophyletic within the eEC clade (Fig. 2). The divergence time for the two main
clades was estimated at ca. 2.13 Ma (95% HPD = 0.98–3.93 Ma), which is very
close to the Pliocene/Pleistocene boundary and concordant with the final EC uplift
(Gregory-Wodzicki, 2000).
Population Genetics
Mitochondrial and nuclear sequences were clustered in two genetically differentiated
groups, corresponding to the eEC and wEC clades (FST_mtDNA=0.60; FST_ITS=0.24;
FST_28S=0.25; FST_HSP90=0.20; for all loci P<0.05 in the Hudson’s permutation
test). Mitochondrial nucleotide diversity was higher in the eEC clade than in the wEC
.CC-BY-NC-ND 4.0 International licenseIt is made available under a (which was not peer-reviewed) is the author/funder, who has granted bioRxiv a license to display the preprint in perpetuity.
The copyright holder for this preprint. http://dx.doi.org/10.1101/250977doi: bioRxiv preprint first posted online Jan. 19, 2018;
clade (Table 1); however, this did not hold true for nuclear loci, which may be due to
differences in effective size and other causes of mito-nuclear discordance (Toews &
Brelsford, 2012). None of the loci showed significant Tajimas’ D, suggesting neutral
evolution (Table 1). For all loci, genetic structure was more pronounced among
populations sampled at different sides of the EC than among populations at the
same side (Fig. S1). This pattern was also reflected in the AMOVA analysis where
part of the variation is explained by differences among regions (eEC and wEC
clades; Table S2), although for nuclear loci, most of the variance is due to
differences within population.
All methods applied to select the optimal value of K consistently revealed two groups
(K=2; Fig. 3, Fig. S2 & S3), which agrees with the phylogenetic analyses and the
population pairwise FST values (Fig. 2 & Fig. S1). In agreement with those results,
the canonical discriminant analyses also identified two geographical clusters (Fig.
S4). Individuals from both groups share variation among them. For example, most
individuals from Villavicencio (eastern foothills of the EC) presented either wEC or
eEC mtDNA, whilst their nDNA was up to 30% from the wEC clade; even more,
there were two individuals from this locality with wEC mtDNA and almost ~80% of
their nDNA was of wEC origin (Fig. 2, Fig. 3 & Fig. S5). Likewise, two individuals
from Boquia and Bucaramanga (west and central cordillera, respectively) presented
wEC mtDNA but their nDNA showed almost 50% of shared ancestry with the eEC
populations (Fig. 2, Fig. 3 & Fig. S5). We ruled out any effect of isolation by distance
rather than Andean divergence causing the geographical population structure
observed here (Fig. S6, Table S3).
Demographic models
.CC-BY-NC-ND 4.0 International licenseIt is made available under a (which was not peer-reviewed) is the author/funder, who has granted bioRxiv a license to display the preprint in perpetuity.
The copyright holder for this preprint. http://dx.doi.org/10.1101/250977doi: bioRxiv preprint first posted online Jan. 19, 2018;
PHRAPL revealed different wAIC values and high ∆AIC between models including
gene flow (IM) and isolation only (IO; Table 2 & Table S4). The model with no
migration had the lowest wAIC, indicating that a single vicariant event with no
genetic exchange is not plausible yet, it is difficult to differentiate between
symmetrical vs. asymmetrical gene flow (Table 2 & Table S4). When we tested
recent vs. ancient secondary contact, the latter model was better supported, ruling
out recent secondary contact but suggesting at least some isolation caused by the
vicariant event (Table 2). These results imply that gene flow is responsible for the G.
cancriformis shared ancestry between eEC and wEC geographical regions.
Phenotype by genotype association
We found the white phenotype as the most frequent morph in all populations, while
the black-white morphology was only present in the eEC populations. Nonetheless,
in the Colombian Cauca valley (wEC), we collected a black morph that has not been
previously reported (Fig. S7). However, our molecular sampling (mtDNA and nDNA)
revealed a statistical association between genetic variation and geography, but such
association was not found for color polymorphism (Table S5). This is also evident in
the mtDNA phylogeny, where individuals of different colors group in the same clade
(Fig. 2).
DISCUSSION
Our mitochondrial and nuclear data consistently showed two well-supported genetic
clusters separated by the EC of the Colombian Andes. The divergence of these G.
cancriformis groups occurred during the late Miocene and early Pleistocene, which is
coincident with the final uplift of this part of the Andes (Gregory-Wodzicki, 2000). In
.CC-BY-NC-ND 4.0 International licenseIt is made available under a (which was not peer-reviewed) is the author/funder, who has granted bioRxiv a license to display the preprint in perpetuity.
The copyright holder for this preprint. http://dx.doi.org/10.1101/250977doi: bioRxiv preprint first posted online Jan. 19, 2018;
contrast, the western and central Colombian cordilleras as well as the dry diagonal in
Brazil do not seem to contribute to the diversification of these spider populations.
This contrasts with previous reports where the Brazilian dry diagonal has been found
as a natural barrier to gene flow in taxa such as frogs, birds and lizards (Fouquet et
al., 2014; Harvey & Brumfield, 2015; Werneck et al., 2012). Also, the genetic
homogeneity found within the wEC clade may be explained by the topography itself
of the western and central Colombian cordilleras, which are considerably narrower
than the eastern one (Guarnizo et al., 2015), likely facilitating dispersal of individuals
across this region.
Species diversification driven by the uplift of the Andes has been documented in
several organisms including birds (Chaves, Pollinger, Smith, & LeBuhn, 2007;
Fernandes, Wink, Sardelli, & Aleixo, 2014; Ribas, Moyle, Miyaki, & Cracraft, 2007),
reptiles (Teixeira et al., 2016), amphibians (García-R et al., 2012; Guarnizo et al.,
2015; Guarnizo, Amézquita, & Bermingham, 2009), bees (Dick et al., 2004) and
butterflies (Elias et al., 2009). Yet, the persistence of gene flow between populations
separated by the Andes is far less known (Hoffmann & Baker, 2003; Miller et al.,
2008; Oswald et al., 2017). Here, despite the vicariance associated with the Andean
uplift that resulted in eEC and wEC Andean clades for G. cancriformis, we found
individuals with shared ancestry between the main two geographical groups. The
approximate likelihood demographic model implemented identified gene flow as the
most likely explanation for this. Furthermore, the model with the best support implies
divergence in the face of gene flow after τ/5 generations forward in time, which
suggests a short allopatric period.
Altitudinal depressions across the Andes can contribute to dispersal of individuals,
thus allowing admixture between populations that occur at opposite sides of this
.CC-BY-NC-ND 4.0 International licenseIt is made available under a (which was not peer-reviewed) is the author/funder, who has granted bioRxiv a license to display the preprint in perpetuity.
The copyright holder for this preprint. http://dx.doi.org/10.1101/250977doi: bioRxiv preprint first posted online Jan. 19, 2018;
barrier. In fact, the EC of the Colombian Andes is not a uniform barrier along its
length and counts with at least two depressions, the Andalucía pass and the Suaza-
Pescado valleys, which may be acting as dispersal corridors (Cadena et al., 2016).
To our knowledge, scenarios consistent with Andean altitudinal depressions
facilitating dispersion and gene flow have only been reported in the Peruvian
Porculla pass, where six co-distributed bird taxon pairs showed asynchronous
divergence times likely due to independent dispersal events coupled with gene flow
(Oswald et al., 2017). In arthropods, there is evidence for dispersal through the
Andes (Dick et al., 2004), but the persistence of gene flow across this barrier has not
been shown. We hypothesize that eEC and wEC populations of G. cancriformis have
used such kind of passes to cross the Eastern Cordillera and reproduce with
populations in opposite sides, even after they have achieved some degree of
divergence. This could be facilitated by aerial dispersal mechanisms like ballooning,
where the friction between air and the spider with its silk can make an individual
move up to 3,200 Km (Gressitt, 1965). Although this displacement strategy has not
been observed in G. cancriformis, it is used by its sister taxa (Bell et al., 2005).
Color polymorphism in the opisthosoma of G. cancriformis did not explain the
structure found in this species. However, the lack of association of mtDNA or nDNA
haplotypes with coloration may be due to the nature of the loci studied, as they
evolve neutrally and are not members of any known pigmentation pathway in
arthropods (Wittkopp & Beldade, 2009). Even so, the mtDNA phylogenetic pattern
suggests, to some extent, that this polymorphism pre-dates the geographical split.
Alternatively, the genetic connectivity between the populations at both sides of the
Andes may be favoring the flow of color alleles thus maintaining phenotypic
variation. This remains to be tested.
.CC-BY-NC-ND 4.0 International licenseIt is made available under a (which was not peer-reviewed) is the author/funder, who has granted bioRxiv a license to display the preprint in perpetuity.
The copyright holder for this preprint. http://dx.doi.org/10.1101/250977doi: bioRxiv preprint first posted online Jan. 19, 2018;
The scenario of vicariance coupled with gene flow found here support the original
ideas of Chapman (1917, 1926) and Haffer (1967a , 1967b), who claimed that the
similarities in the composition of the flora and fauna at both sides of the Andes might
be due to dispersals through altitudinal depressions in the cordilleras (Chapman,
1917, 1926; Haffer, 1967, 1967).This case constitutes one of the few
phylogeographic studies in arthropods, and the first arachnids showing that the
Andes act as a permeable barrier, rather than an absolute one, for the free
movement of alleles.
Data availability
Sequences were deposited in GenBank under accession numbers xxxx-xxxx.
REFERENCES
Antonelli, A., Quijada-Mascareñas, A., Crawford, A. J., Bates, J. M., Velazco, P. M.,
& Wüster, W. (2009). Molecular Studies and Phylogeography of Amazonian
Tetrapods and their Relation to Geological and Climatic Models. In Amazonia:
Landscape and Species Evolution (pp. 386–404). Wiley-Blackwell Publishing
Ltd. http://doi.org/10.1002/9781444306408.ch24
Arias, C. F., Salazar, C., Rosales, C., Kronforst, M. R., Linares, M., Bermingham, E.,
& McMillan, W. O. (2014). Phylogeography of Heliconius cydno and its closest
relatives: Disentangling their origin and diversification. Molecular Ecology,
23(16), 4137–4152. http://doi.org/10.1111/mec.12844
Bartoleti, L. F. de M., Peres, E. A., Sobral-Souza, T., Fontes, F. von H. M., Silva, M.
J. da, & Solferini, V. N. (2017). Phylogeography of the dry vegetation endemic
species Nephila sexpunctata (Araneae: Araneidae) suggests recent expansion
.CC-BY-NC-ND 4.0 International licenseIt is made available under a (which was not peer-reviewed) is the author/funder, who has granted bioRxiv a license to display the preprint in perpetuity.
The copyright holder for this preprint. http://dx.doi.org/10.1101/250977doi: bioRxiv preprint first posted online Jan. 19, 2018;
of the Neotropical Dry Diagonal. Journal of Biogeography, 44(9), 2007–2020.
http://doi.org/10.1111/jbi.12998
Bell, J. R., Bohan, D. A., Shaw, E. M., & Weyman, G. S. (2005). Ballooning dispersal
using silk: world fauna, phylogenies, genetics and models. Bulletin of
Entomological Research, 95(02), 69–114. http://doi.org/10.1079/BER2004350
Bidegaray-Batista, L., Arnedo, M. A., Phillips, M., Rambaut, A., Liebowitz, T., Chan,
L., … Wilson, A. (2011). Gone with the plate: the opening of the Western
Mediterranean basin drove the diversification of ground-dweller spiders. BMC
Evolutionary Biology, 11(1), 317. http://doi.org/10.1186/1471-2148-11-317
Black, M., Hoeh, W., Lutz, R., & Vrijenhoek, R. (1994). DNA primers for amplification
of mitochondrial cytochrome c oxidase subunit I from diverse metazoan
invertebrates, 3, 294–299.
Blackledge, T. A., Scharff, N., Coddington, J. A., Szüts, T., Wenzel, J. W., Hayashi,
C. Y., & Agnarsson, I. (2009). Reconstructing web evolution and spider
diversification in the molecular era. Proceedings of the National Academy of
Sciences of the United States of America, 106(13), 5229–34.
http://doi.org/10.1073/pnas.0901377106
Brumfield, R. T., & Capparella, A. P. (1996). Historical Diversification of Birds in
Northwestern South America: A Molecular Perspective on the Role of Vicariant
Events. Evolution, 50(4), 1607. http://doi.org/10.2307/2410897
Cadena, C. D., Pedraza, C. A., & Brumfield, R. T. (2016). Climate , Habitat
Associations and the Potential Distributions of Neotropical Birds�: Implications
for Diversification Across the Andes. Rev. Acad. Colomb. Cienc. Ex. Fis. Nat.,
40(155), 275–287.
.CC-BY-NC-ND 4.0 International licenseIt is made available under a (which was not peer-reviewed) is the author/funder, who has granted bioRxiv a license to display the preprint in perpetuity.
The copyright holder for this preprint. http://dx.doi.org/10.1101/250977doi: bioRxiv preprint first posted online Jan. 19, 2018;
Chapman, F. M. (1917). The Distribution of Bird-Life in Colombia: A Contribution to a
Biological Survey of South America.
Chapman, F. M. (1926). The Distribution of Bird-Life in Ecuador: A Contribution to a
Study of the Origin of Andean Bird-Life. Bulletin of the American Museum of
Natural History, 55, 784.
Chaves, J. A., Pollinger, J. P., Smith, T. B., & LeBuhn, G. (2007). The role of
geography and ecology in shaping the phylogeography of the speckled
hummingbird (Adelomyia melanogenys) in Ecuador. Molecular Phylogenetics
and Evolution, 43(3), 795–807.
http://doi.org/https://doi.org/10.1016/j.ympev.2006.11.006
Chazot, N., Willmott, K. R., Condamine, F. L., De-Silva, D. L., Freitas, A. V. L.,
Lamas, G., … Elias, M. (2016). Into the Andes: multiple independent
colonizations drive montane diversity in the Neotropical clearwing butterflies
Godyridina. Molecular Ecology, 25(22), 5765–5784.
http://doi.org/10.1111/mec.13773
Chazot, N., Willmott, K. R., Lamas, G., Freitas, A. V. L., Piron-prunier, F., Arias, C.
F., … Elias, M. (2017). Renewed diversification following Miocene landscape
turnover in a Neotropical butterfly radiation. bioRxiv.
De-silva, D. L., Chazot, N., Silva-, K. L., Lamas, G., Mallet, J., Willmott, K. R., &
Elias, M. (2017). North Andean origin and diversification of the largest ithomiine
butterfly genus, 1–17. http://doi.org/10.1038/srep45966
Díaz, S., Panzera, F., Jaramillo-O, N., Pérez, R., Fernández, R., Vallejo, G., …
Gómez-Palacio, A. (2014). Genetic, Cytogenetic and Morphological Trends in
.CC-BY-NC-ND 4.0 International licenseIt is made available under a (which was not peer-reviewed) is the author/funder, who has granted bioRxiv a license to display the preprint in perpetuity.
The copyright holder for this preprint. http://dx.doi.org/10.1101/250977doi: bioRxiv preprint first posted online Jan. 19, 2018;
the Evolution of the Rhodnius (Triatominae: Rhodniini) Trans-Andean Group.
PLoS ONE, 9(2), e87493. http://doi.org/10.1371/journal.pone.0087493
Dick, C. W., Roubik, D. W., Gruber, K. F., & Bermingham, E. (2004). Long-distance
gene flow and cross-Andean dispersal of lowland rainforest bees (Apidae:
Euglossini) revealed by comparative mitochondrial DNA phylogeography.
Molecular Ecology, 13(12), 3775–3785. http://doi.org/10.1111/j.1365-
294X.2004.02374.x
Diniz-filho, J. A. F., Soares, T. N., Lima, J. S., Dobrovolski, R., Landeiro, V. L., Pires,
M., … Bini, L. M. (2013). Mantel test in population genetics, 485, 475–485.
Dixon, P. (2003). VEGAN, a package of R functions for community ecology. Journal
of Vegetation Science, 14(6), 927–930. http://doi.org/10.1111/j.1654-
1103.2003.tb02228.x
Drummond, A. J., & Bouckaert, R. R. (2015). Bayesian Evolutionary Analysis with
BEAST. Cambridge: Cambridge University Press.
Drummond, A. J., Suchard, M. A., Xie, D., & Rambaut, A. (2012). Bayesian
Phylogenetics with BEAUti and the BEAST 1.7. Molecular Biology and Evolution
, 29 (8 ), 1969–1973. http://doi.org/10.1093/molbev/mss075
Earl, D. A., & vonHoldt, B. M. (2012). STRUCTURE HARVESTER: a website and
program for visualizing STRUCTURE output and implementing the Evanno
method. Conservation Genetics Resources, 4(2), 359–361.
http://doi.org/10.1007/s12686-011-9548-7
Elias, M., Joron, M., Willmott, K., Silva-BrandÃo, K. L., Kaiser, V., Arias, C. F., …
Jiggins, C. D. (2009). Out of the Andes: Patterns of diversification in clearwing
.CC-BY-NC-ND 4.0 International licenseIt is made available under a (which was not peer-reviewed) is the author/funder, who has granted bioRxiv a license to display the preprint in perpetuity.
The copyright holder for this preprint. http://dx.doi.org/10.1101/250977doi: bioRxiv preprint first posted online Jan. 19, 2018;
butterflies. Molecular Ecology, 18(8), 1716–1729. http://doi.org/10.1111/j.1365-
294X.2009.04149.x
Evanno, G., Regnaut, S., & Goudet, J. (2005). Detecting the number of clusters of
individuals using the software structure: a simulation study. Molecular Ecology,
14(8), 2611–2620. http://doi.org/10.1111/j.1365-294X.2005.02553.x
Excoffier, L., & Lischer, H. E. L. (2010). Arlequin suite ver 3.5: a new series of
programs to perform population genetics analyses under Linux and Windows.
Molecular Ecology Resources, 10(3), 564–7. http://doi.org/10.1111/j.1755-
0998.2010.02847.x
Fernandes, A. M., Wink, M., Sardelli, C. H., & Aleixo, A. (2014). Multiple speciation
across the Andes and throughout Amazonia�: the case of the spot-backed
antbird species complex ( Hylophylax naevius / Hylophylax naevioides ), 1094–
1104. http://doi.org/10.1111/jbi.12277
Fouquet, A., Santana Cassini, C., Fernando Baptista Haddad, C., Pech, N., &
Trefaut Rodrigues, M. (2014). Species delimitation, patterns of diversification
and historical biogeography of the Neotropical frog genus Adenomera (Anura,
Leptodactylidae). Journal of Biogeography, 41(5), 855–870.
http://doi.org/10.1111/jbi.12250
Friendly, M., & Fox, J. (2017). Visualizing Generalized Canonical Discriminant and
Canonical Correlation Analysis. Vienna, Austria. Retrieved from https://cran.r-
project.org/web/packages/candisc/candisc.pdf
García-R, J. C., Crawford, A. J., Mendoza, Á. M., Ospina, O., Cardenas, H., &
Castro, F. (2012). Comparative Phylogeography of Direct-Developing Frogs
.CC-BY-NC-ND 4.0 International licenseIt is made available under a (which was not peer-reviewed) is the author/funder, who has granted bioRxiv a license to display the preprint in perpetuity.
The copyright holder for this preprint. http://dx.doi.org/10.1101/250977doi: bioRxiv preprint first posted online Jan. 19, 2018;
(Anura: Craugastoridae: Pristimantis) in the Southern Andes of Colombia. PLoS
ONE, 7(9), e46077. http://doi.org/10.1371/journal.pone.0046077
Gawryszewski, F. M. (2007). Policromatismo e stabilimentum em Gasteracantha
cancriformis (Araneae, Araneidae): caracterização e as hipóteses da atração de
presas e da proteção da teia. Universidade de Brasilia.
Gawryszewski, F. M., & Motta, P. C. (2012). Colouration of the orb-web spider
Gasteracantha cancriformis does not increase its foraging success. Ethology
Ecology & Evolution, 24(1), 23–38.
http://doi.org/10.1080/03949370.2011.582044
Gregory-Wodzicki, K. M. (2000). Uplift history of the Central and Northern Andes: A
review. Geological Society of America Bulletin, 112(7), 1091–1105.
http://doi.org/10.1130/0016-7606
Gressitt, J. L. (1965). Biogeography and ecology of land arthropods of Antarctica. In
J. Van Miegham & P. Van Oye (Eds.), Biogeography and Ecology of Antarctica.
Monographiae Biologicae, vol. 15 (pp. 431–490). Springer, Dordrecht.
Guarnizo, C. E., Amézquita, A., & Bermingham, E. (2009). The relative roles of
vicariance versus elevational gradients in the genetic differentiation of the high
Andean tree frog, Dendropsophus labialis. Molecular Phylogenetics and
Evolution, 50(1), 84–92.
http://doi.org/https://doi.org/10.1016/j.ympev.2008.10.005
Guarnizo, C. E., Paz, A., Muñoz-Ortiz, A., Flechas, S. V., Méndez-Narváez, J., &
Crawford, A. J. (2015). DNA Barcoding Survey of Anurans across the Eastern
Cordillera of Colombia and the Impact of the Andes on Cryptic Diversity. PLOS
ONE, 10(5), e0127312. http://doi.org/10.1371/journal.pone.0127312
.CC-BY-NC-ND 4.0 International licenseIt is made available under a (which was not peer-reviewed) is the author/funder, who has granted bioRxiv a license to display the preprint in perpetuity.
The copyright holder for this preprint. http://dx.doi.org/10.1101/250977doi: bioRxiv preprint first posted online Jan. 19, 2018;
Haffer, J. (1967). Speciation in Colombian forest birds west of Andes. Novitates
Zoologicae, 2294(2294), 1–57.
Haffer, J. (1967). Zoogeographical Notes on the “Non-Forest” Lowland Bird Faunas
of Northwestern South America. El Hornero, 10(4), 315–333.
Harvey, M. G., & Brumfield, R. T. (2015). Genomic variation in a widespread
Neotropical bird (Xenops minutus) reveals divergence, population expansion,
and gene flow. Molecular Phylogenetics and Evolution, 83, 305–16.
http://doi.org/10.1016/j.ympev.2014.10.023
Hedin, M. C., & Maddison, W. P. (2001). A Combined Molecular Approach to
Phylogeny of the Jumping Spider Subfamily Dendryphantinae (Araneae:
Salticidae). Molecular Phylogenetics and Evolution, 18(3), 386–403.
http://doi.org/10.1006/mpev.2000.0883
Hijmans, R. J. (2016). geosphere: Spherical Trigonometry.
Hoffmann, F. G., & Baker, R. J. (2003). Comparative phylogeography of short-tailed
bats (Carollia: Phyllostomidae). Molecular Ecology, 12(12), 3403–3414.
http://doi.org/10.1046/j.1365-294X.2003.02009.x
Hoorn, C., Wesselingh, F. P., ter Steege, H., Bermudez, M. a, Mora, a, Sevink, J.,
… Antonelli, a. (2010). Amazonia through time: Andean uplift, climate change,
landscape evolution, and biodiversity. Science (New York, N.Y.), 330(6006),
927–931. http://doi.org/10.1126/science.1194585
Hudson, R. R., Boos, D. D., & Kaplan, N. L. (1992). A statistical test for detecting
geographic subdivision. Molecular Biology and Evolution, 9(1), 138–151.
.CC-BY-NC-ND 4.0 International licenseIt is made available under a (which was not peer-reviewed) is the author/funder, who has granted bioRxiv a license to display the preprint in perpetuity.
The copyright holder for this preprint. http://dx.doi.org/10.1101/250977doi: bioRxiv preprint first posted online Jan. 19, 2018;
Jackson, N. D., Morales, A. E., Carstens, B. C., & O’Meara, B. C. (2017). PHRAPL:
Phylogeographic Inference Using Approximate Likelihoods. Systematic Biology,
19, 431–435. http://doi.org/10.1093/sysbio/syx001
Janes, J. K., Miller, J. M., Dupuis, J. R., Malenfant, R. M., Gorrell, J. C., Cullingham,
C. I., & Andrew, R. L. (2017). The K = 2 conundrum. Molecular Ecology, 26(14),
3594–3602. http://doi.org/10.1111/mec.14187
Jombart, T., & Ahmed, I. (2011). adegenet 1 . 3-1�: new tools for the analysis of
genome-wide SNP data, 27(21), 3070–3071.
http://doi.org/10.1093/bioinformatics/btr521
Kattan, G. H., Franco, P., & Rojas, V. (2004). Biological diversification in a complex
region�: a spatial analysis of faunistic diversity and biogeography of the Andes
of Colombia, 1829–1839.
Kopelman, N. M., Mayzel, J., Jakobsson, M., Rosenberg, N. A., & Mayrose, I.
(2015). CLUMPAK: a program for identifying clustering modes and packaging
population structure inferences across K. Molecular Ecology.
http://doi.org/10.1111/1755-0998.12387
Kuntner, M., Arnedo, M. A., Trontelj, P., Lokovšek, T., & Agnarsson, I. (2013). A
molecular phylogeny of nephilid spiders: Evolutionary history of a model lineage.
Molecular Phylogenetics and Evolution, 69(3), 961–979.
http://doi.org/10.1016/j.ympev.2013.06.008
Legendre, P., & Fortin, M.-J. (2010). Comparison of the Mantel test and alternative
approaches for detecting complex multivariate relationships in the spatial
analysis of genetic data. Molecular Ecology Resources, 10(5), 831–844.
http://doi.org/10.1111/j.1755-0998.2010.02866.x
.CC-BY-NC-ND 4.0 International licenseIt is made available under a (which was not peer-reviewed) is the author/funder, who has granted bioRxiv a license to display the preprint in perpetuity.
The copyright holder for this preprint. http://dx.doi.org/10.1101/250977doi: bioRxiv preprint first posted online Jan. 19, 2018;
Legendre, P., Fortin, M.-J., & Borcard, D. (2015). Should the Mantel test be used in
spatial analysis? Methods in Ecology and Evolution, 6(11), 1239–1247.
http://doi.org/10.1111/2041-210X.12425
Librado, P., & Rozas, J. (2009). DnaSP v5�: a software for comprehensive analysis
of DNA polymorphism data, 25(11), 1451–1452.
http://doi.org/10.1093/bioinformatics/btp187
Maddison, W., & Maddison, D. (2015). Mesquite: A modular system for evolutionary
analysis, version 3.04. 2015 Available: http://mesquiteproject.
org/mesquite/download/download. html.
Mantel, N. (1967). The Detection of Disease Clustering and a Generalized
Regression Approach. Cancer Research, 27(2 Part 1), 209 LP – 220.
McHugh, A., Yablonsky, C., Binford, G. J., & Agnarsson, I. (2014). Molecular
phylogenetics of Caribbean Micrathena (Araneae: Araneidae) suggests multiple
colonization events and single island endemism. Invertebrate Systematics,
Accepted F(2012), 337–349. http://doi.org/10.1071/IS13051
Meirmans, P. G. (2012). The trouble with isolation by distance. Molecular Ecology,
21(12), 2839–2846. http://doi.org/10.1111/j.1365-294X.2012.05578.x
Miller, M. J., Bermingham, E., Klicka, J., Escalante, P., do Amaral, F. S. R., Weir, J.
T., & Winker, K. (2008). Out of Amazonia again and again: episodic crossing of
the Andes promotes diversification in a lowland forest flycatcher. Proceedings.
Biological Sciences, 275(1639), 1133–42. http://doi.org/10.1098/rspb.2008.0015
Moradmand, M., Schönhofer, A. L., & Jäger, P. (2014). Molecular phylogeny of the
spider family Sparassidae with focus on the genus Eusparassus and notes on
.CC-BY-NC-ND 4.0 International licenseIt is made available under a (which was not peer-reviewed) is the author/funder, who has granted bioRxiv a license to display the preprint in perpetuity.
The copyright holder for this preprint. http://dx.doi.org/10.1101/250977doi: bioRxiv preprint first posted online Jan. 19, 2018;
the RTA-clade and “Laterigradae.” Molecular Phylogenetics and Evolution, 74,
48–65. http://doi.org/10.1016/j.ympev.2014.01.021
Nguyen, L. T., Schmidt, H. A., Von Haeseler, A., & Minh, B. Q. (2015). IQ-TREE: A
fast and effective stochastic algorithm for estimating maximum-likelihood
phylogenies. Molecular Biology and Evolution, 32(1), 268–274.
http://doi.org/10.1093/molbev/msu300
Oswald, J. A., Overcast, I., Mauck, W. M., Andersen, M. J., & Smith, B. T. (2017).
Isolation with asymmetric gene flow during the nonsynchronous divergence of
dry forest birds. Molecular Ecology, 26(5), 1386–1400.
http://doi.org/10.1111/mec.14013
Peres, E. A., Sobral-Souza, T., Perez, M. F., Bonatelli, I. A. S., Silva, D. P., Silva, M.
J., & Solferini, V. N. (2015). Pleistocene niche stability and lineage
diversification in the subtropical spider Araneus omnicolor (Araneidae). PLoS
ONE, 10(4). http://doi.org/10.1371/journal.pone.0121543
Posada, D. (2008). jModelTest: Phylogenetic model averaging. Molecular Biology
and Evolution, 25(7), 1253–1256. http://doi.org/10.1093/molbev/msn083
Pritchard, J. K., Stephens, M., & Donnelly, P. (2000). Inference of Population
Structure Using Multilocus Genotype Data. Genetics, 155(2).
Prosdocimi, F., Bittencourt, D., da Silva, F. R., Kirst, M., Motta, P. C., & Rech, E. L.
(2011). Spinning Gland Transcriptomics from Two Main Clades of Spiders
(Order: Araneae) - Insights on Their Molecular, Anatomical and Behavioral
Evolution. PLOS ONE, 6(6). http://doi.org/10.1371/journal.pone.0021634
.CC-BY-NC-ND 4.0 International licenseIt is made available under a (which was not peer-reviewed) is the author/funder, who has granted bioRxiv a license to display the preprint in perpetuity.
The copyright holder for this preprint. http://dx.doi.org/10.1101/250977doi: bioRxiv preprint first posted online Jan. 19, 2018;
Ribas, C. C., Moyle, R. G., Miyaki, C. Y., & Cracraft, J. (2007). The assembly of
montane biotas: linking Andean tectonics and climatic oscillations to
independent regimes of diversification in Pionus parrots. Proceedings. Biological
Sciences, 274(1624), 2399–408. http://doi.org/10.1098/rspb.2007.0613
Rull, V. (2011). Neotropical biodiversity: Timing and potential drivers. Trends in
Ecology and Evolution, 26(10), 508–513.
http://doi.org/10.1016/j.tree.2011.05.011
Salazar, C., Baxter, S. W., Pardo-Diaz, C., Wu, G., Surridge, A., Linares, M., …
Jiggins, C. D. (2010). Genetic Evidence for Hybrid Trait Speciation in Heliconius
Butterflies. PLOS Genetics, 6(4), e1000930. Retrieved from
https://doi.org/10.1371/journal.pgen.1000930
Simon, C., Frati, F., Beckenbach, A., Crespi, B., Liu, H., & Flook, P. (1994).
Evolution, Weighting, and Phylogenetic Utility of Mitochondrial Gene Sequences
and a Compilation of Conserved Polymerase Chain Reaction Primers. Annals of
the Entomological Society of America, 87(6), 651–701.
http://doi.org/10.1093/aesa/87.6.651
Smith, B. T., McCormack, J. E., Cuervo, A. M., Hickerson, M. J., Aleixo, A., Cadena,
C. D., … Brumfield, R. T. (2014). The drivers of tropical speciation. Nature,
515(7527), 406–9. http://doi.org/10.1038/nature13687
Smouse, P. E., Long, J. C., & Sokal, R. R. (1986). Multiple Regression and
Correlation Extensions of the Mantel Test of Matrix Correspondence. Systematic
Zoology, 35(4), 627. http://doi.org/10.2307/2413122
.CC-BY-NC-ND 4.0 International licenseIt is made available under a (which was not peer-reviewed) is the author/funder, who has granted bioRxiv a license to display the preprint in perpetuity.
The copyright holder for this preprint. http://dx.doi.org/10.1101/250977doi: bioRxiv preprint first posted online Jan. 19, 2018;
Tamura, K., Stecher, G., Peterson, D., Filipski, A., & Kumar, S. (2013). MEGA6:
Molecular evolutionary genetics analysis version 6.0. Molecular Biology and
Evolution, 30(12), 2725–2729. http://doi.org/10.1093/molbev/mst197
Teixeira, M., Prates, I., Nisa, C., Silva-Martins, N. S. C., Strüssmann, C., &
Rodrigues, M. T. (2016). Molecular data reveal spatial and temporal patterns of
diversification and a cryptic new species of lowland Stenocercus Duméril &
Bibron, 1837 (Squamata: Tropiduridae). Molecular Phylogenetics and Evolution,
94(Part A), 410–423. http://doi.org/https://doi.org/10.1016/j.ympev.2015.09.010
Thompson, J. D., Higgins, D. G., & Gibson, T. J. (1994). CLUSTAL W: improving the
sensitivity of progressive multiple sequence alignment through sequence
weighting, position-specific gap penalties and weight matrix choice. Nucleic
Acids Research, 22(22), 4673–4680. http://doi.org/10.1093/nar/22.22.4673
Toews, D. P. L., & Brelsford, A. (2012). The biogeography of mitochondrial and
nuclear discordance in animals. Molecular Ecology, 21(16), 3907–3930.
http://doi.org/10.1111/j.1365-294X.2012.05664.x
Turchetto-Zolet, A. C., Pinheiro, F., Salgueiro, F., & Palma-Silva, C. (2013).
Phylogeographical patterns shed light on evolutionary process in South
America. Molecular Ecology, 22(5), 1193–1213.
http://doi.org/10.1111/mec.12164
Werneck, F. P., Gamble, T., Colli, G. R., Rodrigues, M. T., & Sites Jr, J. W. (2012).
Deep diversification and long-term persistence in the south american “dry
diagonal”: integrating continent-wide phylogeography and distribution modeling
of geckos. Evolution, 66(10), 3014–3034. http://doi.org/10.1111/j.1558-
5646.2012.01682.x
.CC-BY-NC-ND 4.0 International licenseIt is made available under a (which was not peer-reviewed) is the author/funder, who has granted bioRxiv a license to display the preprint in perpetuity.
The copyright holder for this preprint. http://dx.doi.org/10.1101/250977doi: bioRxiv preprint first posted online Jan. 19, 2018;
White, T. J., Bruns, T., Lee, S., & Taylor, J. (1990). Amplification and Direct
Sequencing of Fungal Ribosomal Rna Genes for Phylogenetics. In PCR
Protocols: A Guide to Methods and Applications (pp. 315–322).
http://doi.org/http://dx.doi.org/10.1016/B978-0-12-372180-8.50042-1
Wittkopp, P. J., & Beldade, P. (2009). Development and evolution of insect
pigmentation: Genetic mechanisms and the potential consequences of
pleiotropy. Seminars in Cell & Developmental Biology, 20(1), 65–71.
http://doi.org/https://doi.org/10.1016/j.semcdb.2008.10.002
.CC-BY-NC-ND 4.0 International licenseIt is made available under a (which was not peer-reviewed) is the author/funder, who has granted bioRxiv a license to display the preprint in perpetuity.
The copyright holder for this preprint. http://dx.doi.org/10.1101/250977doi: bioRxiv preprint first posted online Jan. 19, 2018;
Author contributions: F.C.S-R., E.L.P., C.S. and V.N.S. conceived the idea and
designed the experiments. F.C.S.-R. collected the individuals. F.C.S.-R. and C.P-D.
processed the samples in the laboratory and got the sequences. V.N.S. C.S. and
C.F.A. contributed with material, tools and reagents. F.C.S-R. and C.S. analyzed the
data. F.C.S.-R, C.S. and C.P-D wrote the manuscript. All authors approved the final
version submitted.
.CC-BY-NC-ND 4.0 International licenseIt is made available under a (which was not peer-reviewed) is the author/funder, who has granted bioRxiv a license to display the preprint in perpetuity.
The copyright holder for this preprint. http://dx.doi.org/10.1101/250977doi: bioRxiv preprint first posted online Jan. 19, 2018;
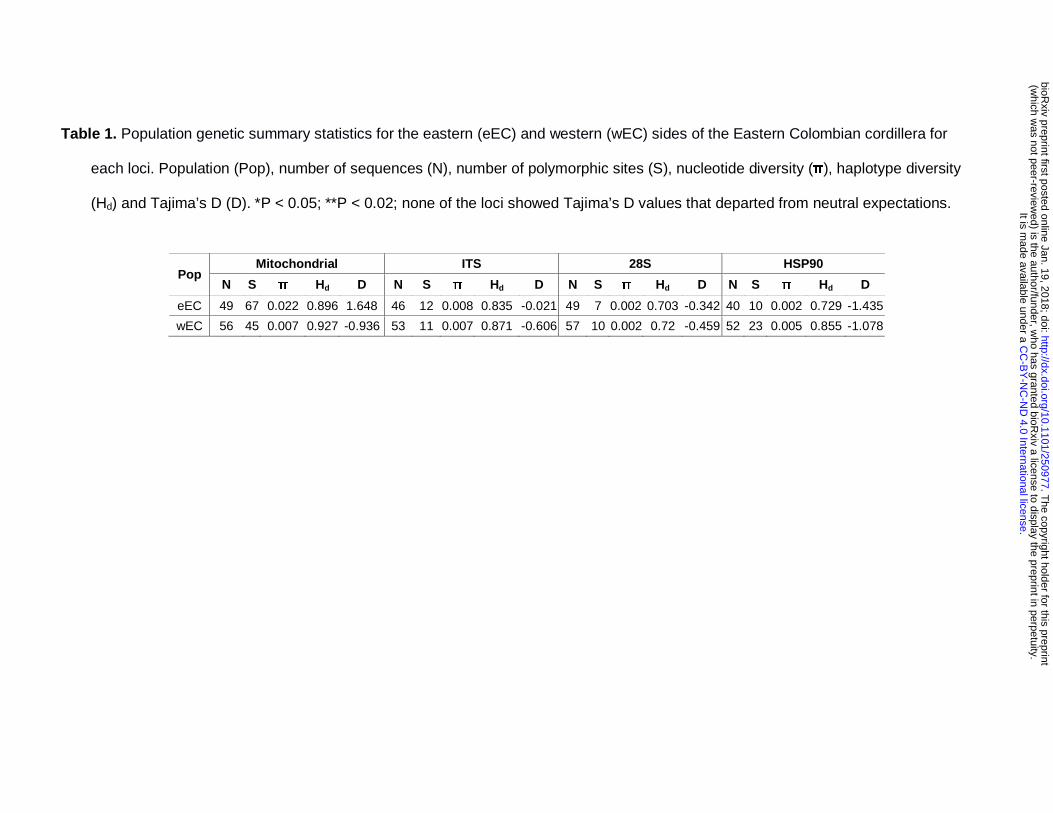
Table 1. Population genetic summary statistics for the eastern (eEC) and western (wEC) sides of the Eastern Colombian cordillera for
each loci. Population (Pop), number of sequences (N), number of polymorphic sites (S), nucleotide diversity (π), haplotype diversity
(Hd) and Tajima’s D (D). *P < 0.05; **P < 0.02; none of the loci showed Tajima’s D values that departed from neutral expectations.
Pop Mitochondrial ITS 28S HSP90
N S π Hd D N S π Hd D N S π Hd D N S π Hd D
eEC 49 67 0.022 0.896 1.648 46 12 0.008 0.835 -0.021 49 7 0.002 0.703 -0.342 40 10 0.002 0.729 -1.435
wEC 56 45 0.007 0.927 -0.936 53 11 0.007 0.871 -0.606 57 10 0.002 0.72 -0.459 52 23 0.005 0.855 -1.078
.C
C-B
Y-N
C-N
D 4.0 International license
It is made available under a
(which w
as not peer-reviewed) is the author/funder, w
ho has granted bioRxiv a license to display the preprint in perpetuity.
The copyright holder for this preprint
. http://dx.doi.org/10.1101/250977
doi: bioR
xiv preprint first posted online Jan. 19, 2018;
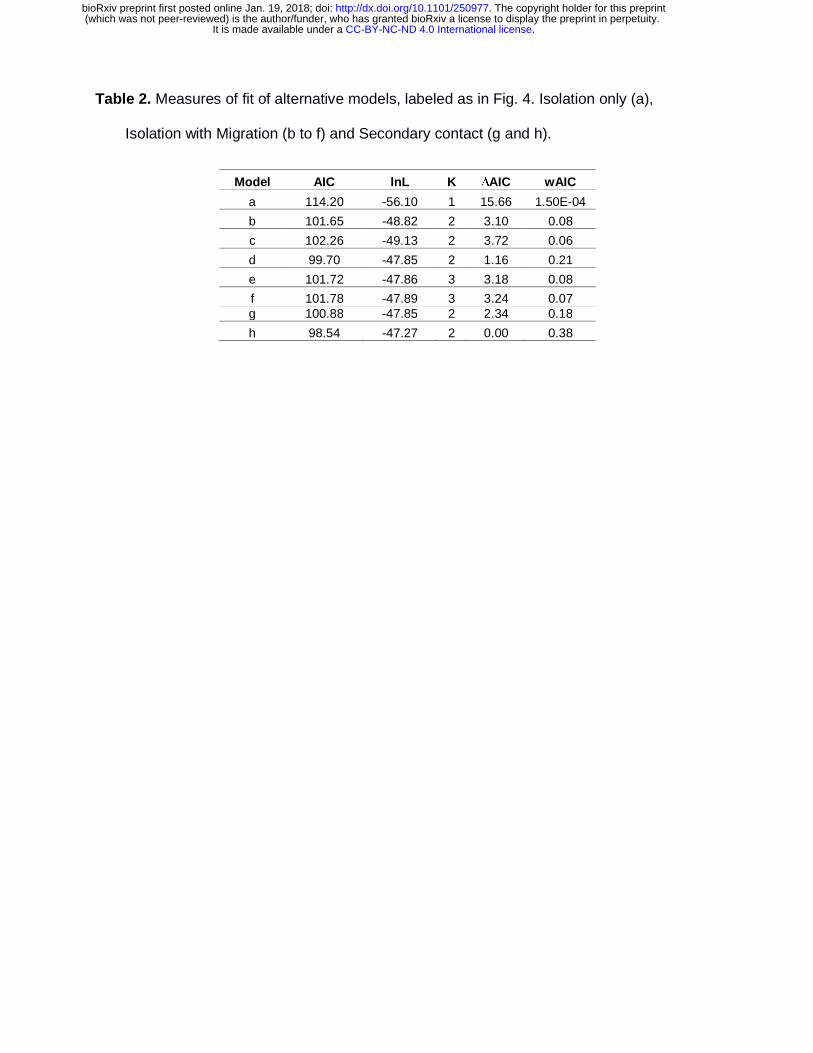
Table 2. Measures of fit of alternative models, labeled as in Fig. 4. Isolation only (a),
Isolation with Migration (b to f) and Secondary contact (g and h).
Model AIC lnL K ∆AIC wAIC
a 114.20 -56.10 1 15.66 1.50E-04
b 101.65 -48.82 2 3.10 0.08
c 102.26 -49.13 2 3.72 0.06
d 99.70 -47.85 2 1.16 0.21
e 101.72 -47.86 3 3.18 0.08
f 101.78 -47.89 3 3.24 0.07 g 100.88 -47.85 2 2.34 0.18
h 98.54 -47.27 2 0.00 0.38
.CC-BY-NC-ND 4.0 International licenseIt is made available under a (which was not peer-reviewed) is the author/funder, who has granted bioRxiv a license to display the preprint in perpetuity.
The copyright holder for this preprint. http://dx.doi.org/10.1101/250977doi: bioRxiv preprint first posted online Jan. 19, 2018;
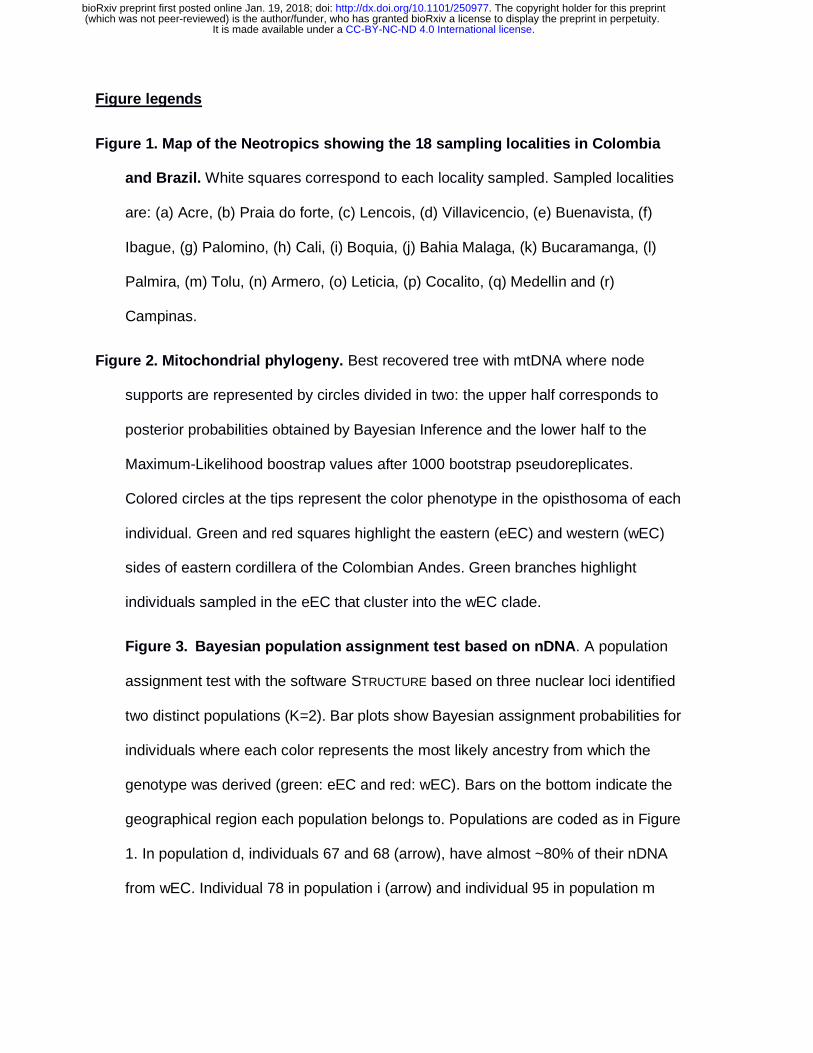
Figure legends
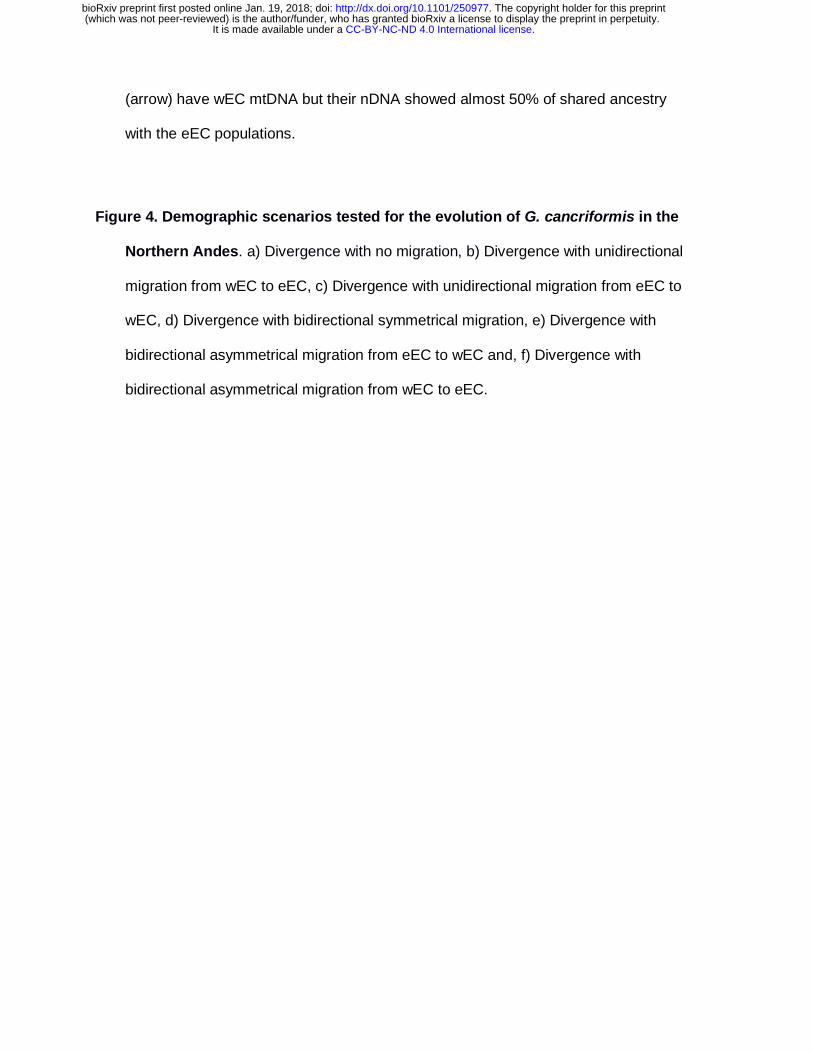
Figure 1. Map of the Neotropics showing the 18 sampling localities in Colombia
and Brazil. White squares correspond to each locality sampled. Sampled localities
are: (a) Acre, (b) Praia do forte, (c) Lencois, (d) Villavicencio, (e) Buenavista, (f)
Ibague, (g) Palomino, (h) Cali, (i) Boquia, (j) Bahia Malaga, (k) Bucaramanga, (l)
Palmira, (m) Tolu, (n) Armero, (o) Leticia, (p) Cocalito, (q) Medellin and (r)
Campinas.
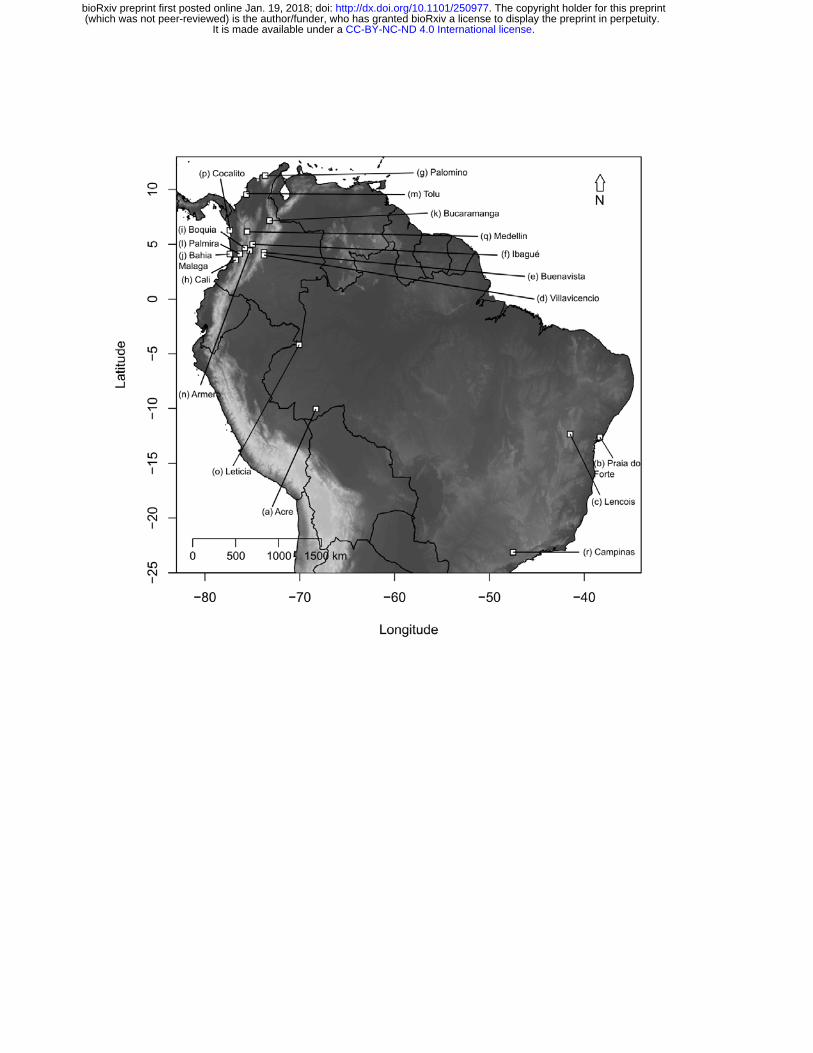
Figure 2. Mitochondrial phylogeny. Best recovered tree with mtDNA where node
supports are represented by circles divided in two: the upper half corresponds to
posterior probabilities obtained by Bayesian Inference and the lower half to the
Maximum-Likelihood boostrap values after 1000 bootstrap pseudoreplicates.
Colored circles at the tips represent the color phenotype in the opisthosoma of each
individual. Green and red squares highlight the eastern (eEC) and western (wEC)
sides of eastern cordillera of the Colombian Andes. Green branches highlight
individuals sampled in the eEC that cluster into the wEC clade.
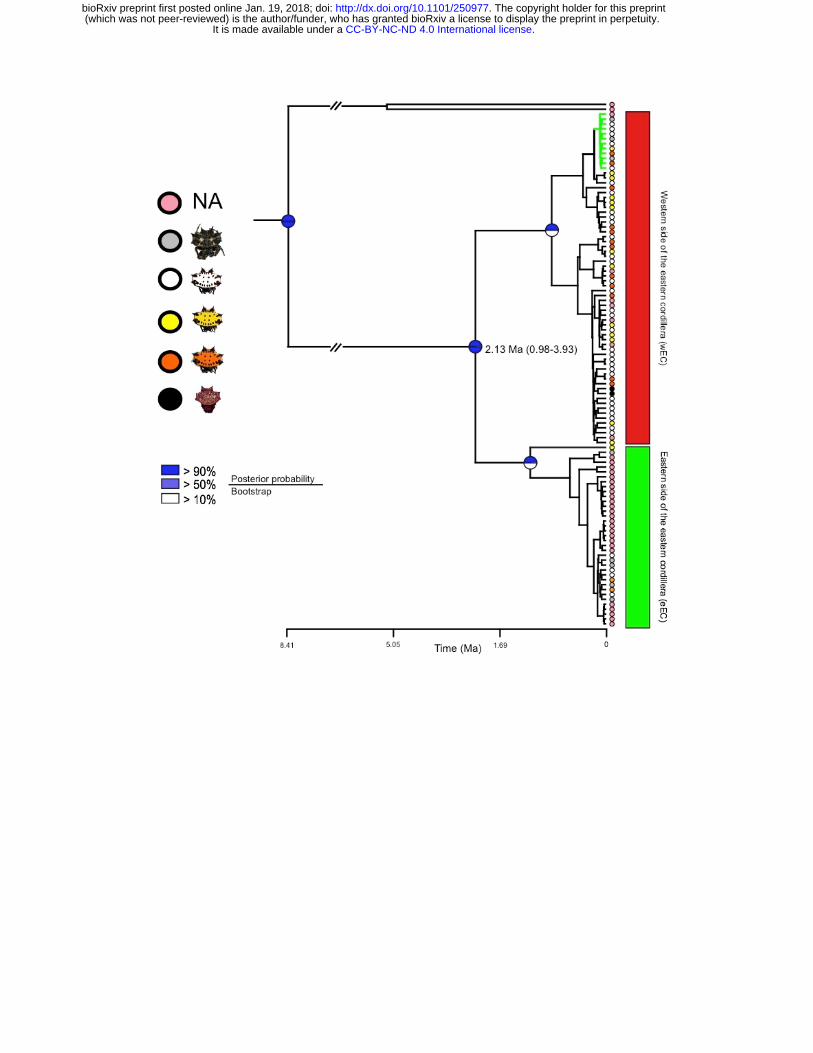
Figure 3. Bayesian population assignment test based on nDNA. A population
assignment test with the software STRUCTURE based on three nuclear loci identified
two distinct populations (K=2). Bar plots show Bayesian assignment probabilities for
individuals where each color represents the most likely ancestry from which the
genotype was derived (green: eEC and red: wEC). Bars on the bottom indicate the
geographical region each population belongs to. Populations are coded as in Figure
1. In population d, individuals 67 and 68 (arrow), have almost ~80% of their nDNA
from wEC. Individual 78 in population i (arrow) and individual 95 in population m
.CC-BY-NC-ND 4.0 International licenseIt is made available under a (which was not peer-reviewed) is the author/funder, who has granted bioRxiv a license to display the preprint in perpetuity.
The copyright holder for this preprint. http://dx.doi.org/10.1101/250977doi: bioRxiv preprint first posted online Jan. 19, 2018;
(arrow) have wEC mtDNA but their nDNA showed almost 50% of shared ancestry
with the eEC populations.
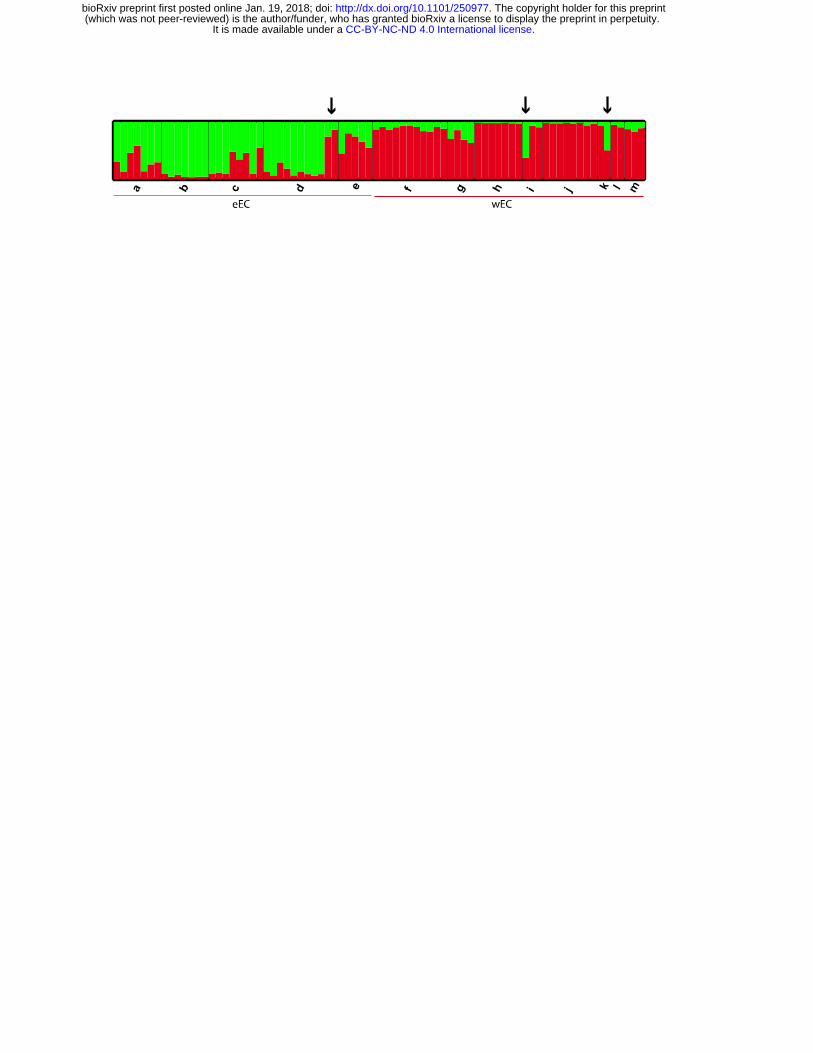
Figure 4. Demographic scenarios tested for the evolution of G. cancriformis in the
Northern Andes. a) Divergence with no migration, b) Divergence with unidirectional
migration from wEC to eEC, c) Divergence with unidirectional migration from eEC to
wEC, d) Divergence with bidirectional symmetrical migration, e) Divergence with
bidirectional asymmetrical migration from eEC to wEC and, f) Divergence with
bidirectional asymmetrical migration from wEC to eEC.
.CC-BY-NC-ND 4.0 International licenseIt is made available under a (which was not peer-reviewed) is the author/funder, who has granted bioRxiv a license to display the preprint in perpetuity.
The copyright holder for this preprint. http://dx.doi.org/10.1101/250977doi: bioRxiv preprint first posted online Jan. 19, 2018;
SUPPORTING INFORMATION
Appendix S1 Supplementary tables.
Appendix S2 Supplementary figures.
.CC-BY-NC-ND 4.0 International licenseIt is made available under a (which was not peer-reviewed) is the author/funder, who has granted bioRxiv a license to display the preprint in perpetuity.
The copyright holder for this preprint. http://dx.doi.org/10.1101/250977doi: bioRxiv preprint first posted online Jan. 19, 2018;
Related Documents