University of London Tania Rafid Adib Gene expression signatures in serous epithelial-ovarian eaneer Wolfson Institute for Biomedical Research University College London MD Thesis May 2005 Supervisors: Professor Chris Boshoff Dr Jonathan Ledermann

Welcome message from author
This document is posted to help you gain knowledge. Please leave a comment to let me know what you think about it! Share it to your friends and learn new things together.
Transcript
University of London
Tania Rafid Adib
Gene expression signatures in
serous epithelial-ovarian eaneer
Wolfson Institute for Biomedical Research
University College London
MD Thesis May 2005
Supervisors:
Professor Chris Boshoff
Dr Jonathan Ledermann

UMI Number: U592613
All rights reserved
INFORMATION TO ALL USERS The quality of this reproduction is dependent upon the quality of the copy submitted.
In the unlikely event that the author did not send a complete manuscript and there are missing pages, these will be noted. Also, if material had to be removed,
a note will indicate the deletion.
Dissertation Publishing
UMI U592613Published by ProQuest LLC 2013. Copyright in the Dissertation held by the Author.
Microform Edition © ProQuest LLC.All rights reserved. This work is protected against
unauthorized copying under Title 17, United States Code.
ProQuest LLC 789 East Eisenhower Parkway
P.O. Box 1346 Ann Arbor, Ml 48106-1346
A bstract
Ovarian cancer has the highest mortality rate of the gynaecological cancers. This is
partly due to the lack of effective screening markers. In this study, oligonucleotide
microarrays complementary to -12,000 genes were used to establish a gene
expression microarray (GEM) profile for normal ovarian tissue, as compared to stage
III ovarian serous adenocarcinoma and omental metastases from the same
individuals. The GEM profiles of the primary and secondary tumours from the same
individuals were essentially alike, reflecting the fact that these tumours had already
metastasised and acquired the metastatic phenotype. A novel biomarker,
mammaglobin-2 (MGB2), was identified which is highly expressed specific to ovarian
cancer. MGB2, in combination with other putative markers identified here, could have potential for screening.
1

A ck no w ledg em ents
I am very grateful to all those people who have helped me in the completion of this
thesis. I would first and foremost like to thank Chris Boshoff for his help and guidance
in planning and executing the scientific work which has gone towards this thesis, and
especially for his continued enthusiasm and support. Thanks also to Jonathan Ledermann for the clinical input, and Chris Perrett for the clinical samples. Many
thanks to those who helped me with the scientific techniques, especially Dimitra
Bourmpoullia and Damien Hewitt, and thanks to Stephen Henderson for help on the
microarray analysis. This work was partly funded by the Royal Free Trustees.
I would also like to thank my husband Jonathan for his support, patience and help with document formatting!
2
Co ntents
Abstract.........................................................................................................................1Acknowledgements......................................................................................................2Contents....................................................................................................................... 3Figures......................................................................................................................... 7Tables.......................................................................................................................... 9Abbreviations............................................................................................................. 10Chapter 1 ................................................................................................................... 14Introduction................................................................................................................ 14
1.1 Classification of Ovarian Tumours.......................................................................151.1.1 Histogenetic Classification of Ovarian Neoplasms.................................. 15
1.2 Epidemiology....................................................................................................... 171.2.1 Hereditary Epithelial Ovarian Cancer............................................................17
1.2.1.1 The Breast and Ovarian Cancer Syndrome........................................... 171.2.1.2 Hereditary Nonpolyposis Colorectal Cancer Syndrome......................... 181.2.1.3 Site-Specific Ovarian Cancer..................................................................19
1.2.2 Sporadic Ovarian Cancer..............................................................................191.2.2.1 Country of Origin, Race and Age............................................................191.2.2.2 Aetiology of Sporadic Epithelial Ovarian Cancer.................................... 22
1.2.2.2.1 Incessant Ovulation..........................................................................221.2.2.2.2 Gonadotrophins................................................................................231.2.2.2.3 Infertility............................................................................................231.2.2.2.4 Hormone Replacement Therapy..................................................... 241.2.2.2.5 Talc and Asbestos............................................................................241.2.2.2.6 Tubal Ligation and Hysterectomy.................................................... 251.2.2.2.7 Pelvic Inflammatory Disease........................................................... 251.2.2.2.8 Endometriosis...................................................................................261.2.2.2.9 The Unifying Role of Inflammation in Ovarian Cancer.....................26
1.3 Pathology of Serous Cystadenocarcinomas....................................................... 291.3.1 Histopathology...............................................................................................291.3.2 Staging.......................................................................................................... 31
1.4 Molecular Biology of Sporadic Epithelial Ovarian Cancer................................... 341.4.1 Introduction.................................................................................................... 341.4.2 Oncogenes and Tumour Suppressor Genes................................................ 35
1.4.2.1 Oncogenes..............................................................................................351.4.2.2 Tumour Suppressor Genes.....................................................................38
1.4.3 Cytogenetic Alterations..................................................................................431.4.4 Peptide Growth Factors.................................................................................441.4.5 Metastasis Suppressor Genes..................................................................... 46
1.4.5.1 E-Cadherin (CDH1).................................................................................461.4.5.2 Nm23 (NME1 & 2)...................................................................................46
1.4.6 Cell Survival and Cell Death Pathways........................................................ 473
1.4.6.1 Senescence............................................................................................471.4.6.2 Apoptosis................................................................................................481.4.6.3 Proliferation.............................................................................................491.4.6.4 DNA Index...............................................................................................49
1.5 Invasion and Metastasis of Ovarian Cancer........................................................ 50
1.6 Microarrays.......................................................................................................... 551.6.1 Introduction....................................................................................................551.6.2 Comparison Between Oligonucleotide and cDNA Arrays............................. 56
1.6.2.1 Probes....................................................................................................561.6.2.2 Target Preparation..................................................................................571.6.2.3 Scanning.................................................................................................58
1.6.3 Data Analysis................................................................................................581.6.3.1 Normalisation..........................................................................................581.6.3.2 Clustering................................................................................................59
1.6.3.2.1 Unsupervised Clustering................................................................. 591.6.3.2.2 Supervised Clustering..................................................................... 61
1.6.3.3 Verification of Results............................................................................ 611.6.4 The Application of Microarrays to Cancer Pathways.................................... 62
1.6.4.1 Cancer Classification............................................................................. 621.6.4.2 Identification of Metastatic Markers........................................................ 641.6.4.3 Gene expression profiling of ovarian tumours........................................ 67
1.6.5 The Use of Microarrays in Ovarian Cancer.................................................. 671.6.5.1 Understanding Ovarian Carcinogenesis................................................ 671.6.5.2 Ovarian Cancer Biomarkers................................................................... 68
1.6.6 Access to Array Databases...........................................................................71
1.7 Screening for Ovarian Cancer..............................................................................73Aims Of This Thesis...................................................................................................77Chapter 2 ................................................................................................................... 78Materials And Methods..............................................................................................78
2.1 Clinical Samples..................................................................................................782.1.1 Collection of Clinical Samples.......................................................................782.1.2 Histopathological Verification........................................................................81
2.1.2.1 Haematoxylin and Eosin Staining Protocol............................................ 812.1.3 Microdissection..............................................................................................81
2.2 RNA Sample Preparation.....................................................................................832.2.1 RNA Extraction..............................................................................................832.2.2 RNA Quantification Using the Agilent 2100 Bioanalyzer.............................. 832.2.3 DNase Treatment of RNA..............................................................................87
2.3 Oligonucleotide Microarray..................................................................................882.3.1 Generation of Microarray Target................................................................. 88
2.3.1.1 Synthesis of Double-Stranded cDNA From Total RNA.......................... 902.3.1.2 Clean-up of Double-Stranded cDNA...................................................... 912.3.1.3 In Vitro Transcription...............................................................................922.3.1.4 Clean Up and Quantification of In Vitro Transcription Products.............92
4
2.3.1.5 Fragmentation of the cRNA for Target Preparation................................ 932.3.1.6 Preparation of the Hybridisation Target................................................. 94
2.4 Data Analysis.......................................................................................................982.4.1 Expression Summary....................................................................................982.4.2 Average Linkage Hierarchical Clustering...................................................... 992.4.3 Comparative GEM Data..............................................................................100
2.5 Real-Time Quantitative Reverse Transcriptase Polymerase ChainReaction (QRT-PCR)............................................................................................... 101
2.5.1 General........................................................... 1012.5.2 Prevention of contamination........................................................................1012.5.3 Instrumentation and Chemistry....................................................................1022.5.4 Definitions Used in Real-Time PCR.............................................................1022.5.5 Genes Selected for QRT-PCR.....................................................................1032.5.6 Oligonucleotide design................................................................................103
2.5.6.1 Primer Express® Software...................................................................1032.5.6.2 Primer sequences.................................................................................104
2.5.7 Conventional PCR.......................................................................................1042.5.8 Gel Electrophoresis of Small Fragments.................................................... 1052.5.9 Purification of cDNA fragments....................................................................1052.5.10 DNA Sequencing.......................................................................................1062.5.11 QRT-PCR Consumables and Parameters.................................................106
2.5.11.1 Consumables......................................................................................1062.5.11.2 Parameters and PCR Conditions........................................................106
2.6 Semi-Quantitative Reverse Transcriptase Polymerase Chain Reaction (RT-PCR) For Chemokine Analysis.........................................................................108
2.6.1 Primer Design.............................................................................................. 1082.6.2 Reverse Transcription: Basic Principles......................................................1092.6.3 Experimental Conditions..............................................................................1102.6.4 The Polymerase Chain Reaction (PCR)......................................................1102.6.5 Prevention of Contamination.......................................................................1112.6.6 Basic Principles........................................................................................... 1112.6.7 PCR Amplification........................................................................................ 1132.6.8 Visualisation Using Agarose Gel.................................................................114
2.7 Immunohistochemistry....................................................................................... 117Chapter 3 ..................................................................................................................118Results......................................................................................................................118
3.1 Clinical Material.................................................................................................. 1183.1.1 Microdissection............................................................................................ 118
3.2 RNA Quality....................................................................................................... 120
3.3 Oligonucleotide Array Target Preparation..........................................................1233.3.1 In Vitro Transcription................................................................................... 1233.3.2 Fragmentation of cRNA............................................................................... 124
5
3.4 Scanning and Generation of Array Image..........................................................125
3.5 GEM Profiling of Serous Ovarian Cancer: Primary Ovarian Disease................ 1263.5.1 Hierarchical Clustering................................................................................1263.5.2 Primary Ovarian Cancer Compared to Normal Ovarian Tissue.................. 1273.5.3 Omental metastasis.....................................................................................1303.5.4 New biomarkers........................................................................................... 132
3.6 Real-Time Quantitative Reverse Transcription PCR (QTR-PCR)..................... 1513.6.1 Primer Optimisation.....................................................................................1513.6.2 Validation Experiment..................................................................................1533.6.3 Expression Levels.......................................................................................1553.6.4 Validation of Array Data with QRT-PCR......................................................158
3.7 Immunohistochemistry.......................................................................................159
3.8 Chemokine Receptor Expression In Ovarian Cancers.......................................160Chapter 4 ................................................................................................................. 161Discussion................................................................................................................ 161
4.1 GEM Profile of Primary Ovarian Cancer............................................................161
4.2 GEM Profile of Primary and Secondary Ovarian Serous Adenocarcinoma 164
4.3 Metastatic Spread.............................................................................................. 167
4.4 Origin of Epithelial Ovarian Cancers..................................................................170
4.5 Ovarian Cancer Biomarkers...............................................................................175
4.6 The Future......................................................................................................... 177Conclusion................................................................................................................178References................................................................................................................179
6
F igures
Figure 1.1. Incidence of ovarian cancer worldwide.................................................... 19Figure 1.2. Age-standardised incidence rates for ovarian cancer (per 100,000 females per year) in the European Union, 1995.........................................................20Figure 1.3. Five-year relative survival rates after diagnosis of ovarian cancer........... 20Figure 1.4. Number of new cases of ovarian cancer diagnosed and age-specific ratesper 100,000 women in the UK, 1999..........................................................................21Figure 1.5. Number of deaths from ovarian cancer and age-specific mortality rates per 100,000 women in the UK, 1999..........................................................................21Figure taken from Cancer Research UK Statistics.................................................... 21Figure 1.6. Macroscopic appearance of serous ovarian adenocarcinoma................ 30Figure 1.7. Microscopic appearance.......................................................................... 30Figure 1.8. Staging of ovarian cancer, primary tumour and metastases (FIGO and TNM).......................................................................................................................... 33Figure 1.9. The phases of the cell cycle.................................................................... 37Figure 1.10. Role of oncogenes and tumour suppressor genes in signal transduction pathways and the cell cycle in tumour cells............................................................... 41Figure 1.11. The six hallmarks of cancer................................................................... 51Figure 1.12. The interplay between epithelial tumour cells and the stroma...............53Figure 1.13. Members and receptors of the VEGF family..........................................54Figure 2.1. Agilent 2100 Bioanalyzer machine and accompanying laptop................ 84Figure 2.2. RNA 6000 LabChip..................................................................................85Figure 2.3. Electropherogram of RNA 6000 ladder, and gel-like image (right).......... 85Figure 2.4. Electropherogram of high quality RNA.................................................... 86Figure 2.5. Electropherogram of degraded RNA....................................................... 86Figure 2.6. Electropherogram of genomic DNA contamination................................. 86Figure 2.7. Affymetrix probe array..............................................................................95Figure 2.8. Boxplot showing image intensities of 16 chips before (A) and after (B) normalisation.............................................................................................................. 99Figure 2.9. Standard curve graph.............................................................................103Figure 2.10. Summary of reverse transcription........................................................109Figure 2.11. Basic steps of a PCR reaction.......................................... 111Figure 2.12 RT-PCR reaction................................................................................... 114Figure 2.13 Serial dilutions of CCR5 chemokine in sample 02 (primary ovarian cancer)...................................................................................................................... 116Figure 3.1. Microdissection...................................................................................... 119
7
Figure 3.2. Purified total RNA..................................................................................120Figure 3.3. Bioanalyzer data for total RNA of sample 0 1 ........................................121Figure 3.4. Bioanalyzer data.................................................................................... 121Figure 3.5. Electropherogram showing 12 well plate............................................. 122Figure 3.6. Electropherogram to resemble classic agarose ge l............................. 122Figure 3.7. Electropherogram of in vitro transcription step..................................... 123Figure 3.8. Electropherogram of fragmentation products....................................... 124Figure 3.9. Macroscopic image of oligonucleotide arrays....................................... 125Figure 3.10. Cluster dendogram of normal and ovarian cancer samples.................126Figure 3.11. Heatmap showing genes up-regulated in serous ovarian primary and omental metastatic tumours compared to normal ovary...........................................128Figure 3.12. Box and whisker plots show expression of selected genes in both normal (shaded, n=4) and primary tissues (unshaded, n=6)....................................129Figure 3.13. Genes down-regulated in primary and secondary serous ovarian cancer compared to normal ovary........................................................................................130Figure 3.14. genes up-regulated in omental metastasis relative to normal ovary and primary ovarian cancer.............................................................................................131Figure 3.15. Expression of genes in metastatic and primary ovarian cancer samples (n=12, 6-paired)........................................................................................................131Figure 3.16. Gene expression profile of putative biomarker MGB2 in ovarian serous adenocarcinoma and a panel of other tissues..........................................................133Figure 3.17. Optimisation graphs for MGB2, KLK6, hepsin, SAA1 and GAPDH 153Figure 3.18. Ct validation experiment.......................................................................154Figure 3.19. Relative efficiency plot.........................................................................154Figure 3.20. 96 well plate.........................................................................................155Figure 3.21. KLK6 fold expression based on above expression data (Table 3.5). ..157Figure 3.22. Fold expression of hepsin, MGB2, KLK6 and SAA1 in low malignant potential (LMP) tumour, primary ovarian cancer (O) and omental metastasis (M) relative to normal ovary............................................................................................ 157Figure 3.23. Comparison of quantitative RT-PCR and GEM data............................158Figure 3.24. Immunohistochemical Staining for hepsin............................................159Figure 3.25. Semi-quantitative RT-PCR expression data for chemokines in ovarian cancer....................................................................................................................... 160Figure 3.26. GEM data for chemokines in ovarian cancer....................................... 160Figure 4.1. Models of metastasis..............................................................................166Figure 4.2. Mechanism of chemokine-mediated metastasis of breast cancer...........168Figure 4.3. Laser capture microdissection............................................................... 172Figure 4.4. LCM on a heterogeneous tissue sample................................................173
8
Ta b les
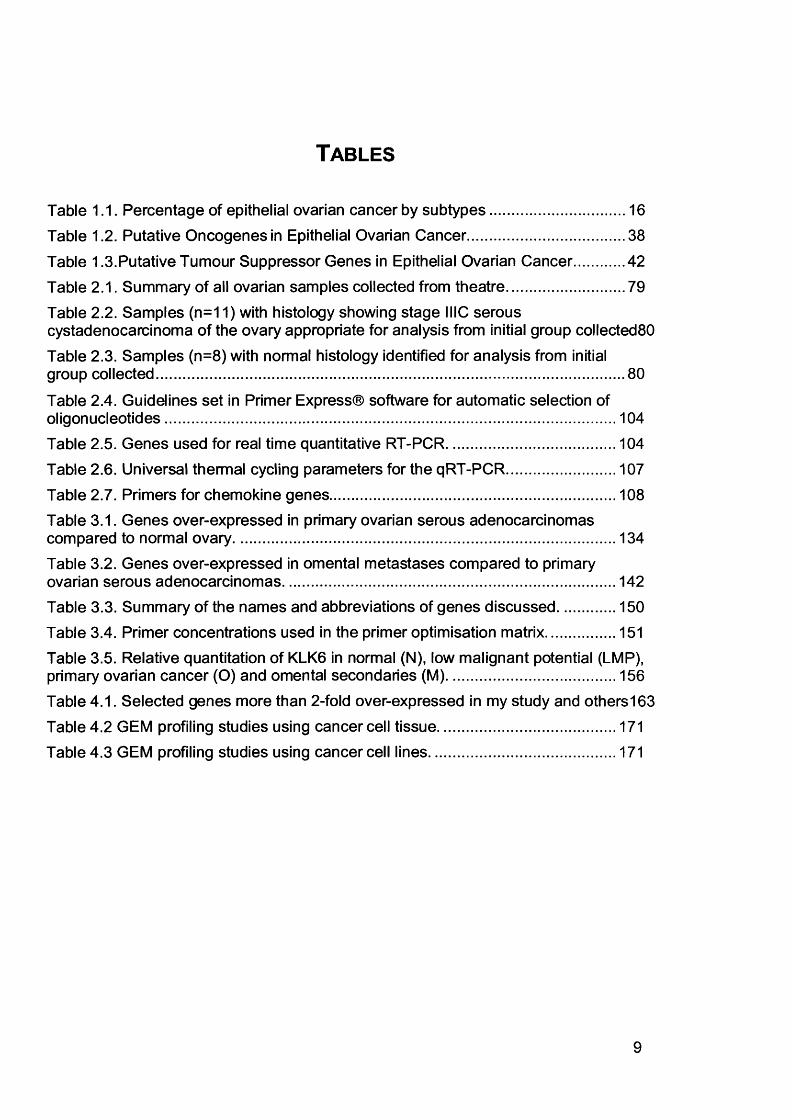
Table 1.1. Percentage of epithelial ovarian cancer by subtypes............................... 16Table 1.2. Putative Oncogenes in Epithelial Ovarian Cancer.................................... 38Table 1.3.Putative Tumour Suppressor Genes in Epithelial Ovarian Cancer............42Table 2.1. Summary of all ovarian samples collected from theatre........................... 79Table 2.2. Samples (n=11) with histology showing stage IIIC serous cystadenocarcinoma of the ovary appropriate for analysis from initial group collected80Table 2.3. Samples (n=8) with normal histology identified for analysis from initial group collected...........................................................................................................80
Table 2.4. Guidelines set in Primer Express® software for automatic selection of oligonucleotides....................................................................................................... 104Table 2.5. Genes used for real time quantitative RT-PCR....................................... 104Table 2.6. Universal thermal cycling parameters for the qRT-PCR......................... 107Table 2.7. Primers for chemokine genes..................................................................108Table 3.1. Genes over-expressed in primary ovarian serous adenocarcinomas compared to normal ovary........................................................................................134Table 3.2. Genes over-expressed in omental metastases compared to primary ovarian serous adenocarcinomas............................................................................ 142Table 3.3. Summary of the names and abbreviations of genes discussed..............150Table 3.4. Primer concentrations used in the primer optimisation matrix.................151Table 3.5. Relative quantitation of KLK6 in normal (N), low malignant potential (LMP), primary ovarian cancer (O) and omental secondaries (M)....................................... 156Table 4.1. Selected genes more than 2-fold over-expressed in my study and others163Table 4.2 GEM profiling studies using cancer cell tissue......................................... 171Table 4.3 GEM profiling studies using cancer cell lines........................................... 171
9
A bb reviatio ns
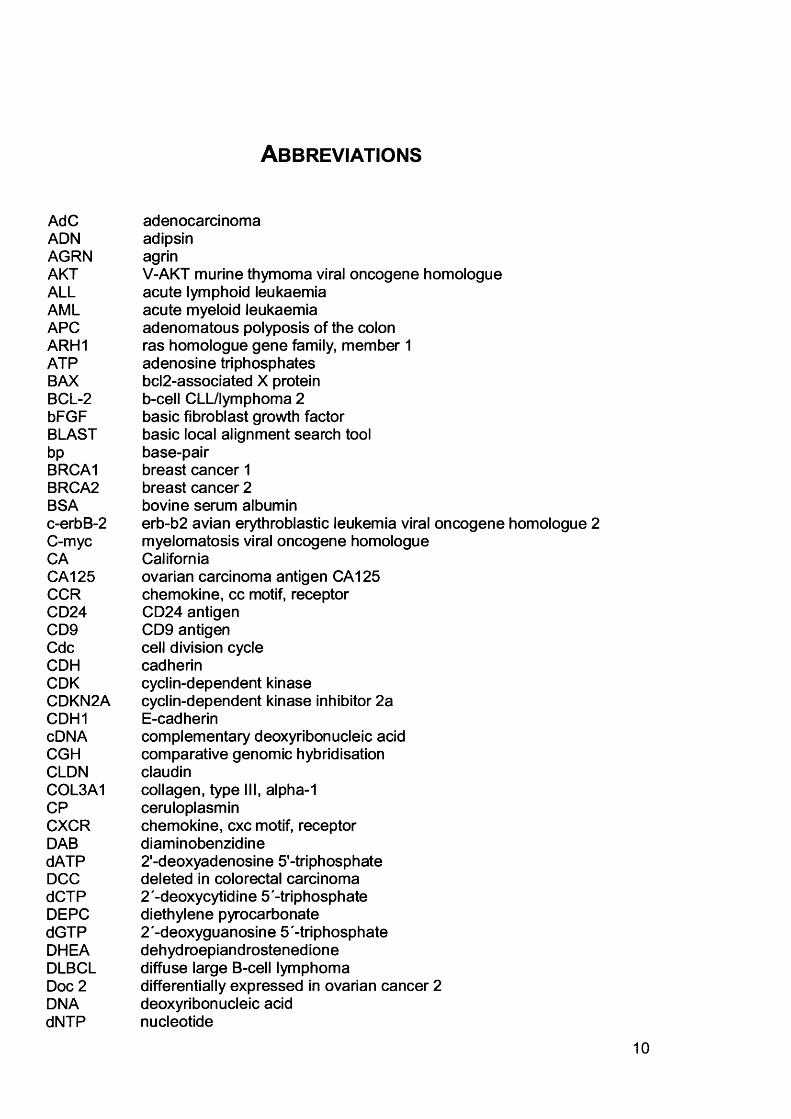
AdC adenocarcinomaADN adipsinAGRN agrinAKT V-AKT murine thymoma viral oncogene homologueALL acute lymphoid leukaemiaAML acute myeloid leukaemiaAPC adenomatous polyposis of the colonARH1 ras homologue gene family, member 1ATP adenosine triphosphatesBAX bcl2-associated X proteinBCL-2 b-cell CLL/lymphoma 2bFGF basic fibroblast growth factorBLAST basic local alignment search toolbp base-pairBRCA1 breast cancer 1BRCA2 breast cancer 2BSA bovine serum albuminc-erbB-2 erb-b2 avian erythroblastic leukemia viral oncogene homologue 2C-myc myelomatosis viral oncogene homologueCA CaliforniaCA125 ovarian carcinoma antigen CA125CCR chemokine, cc motif, receptorCD24 CD24 antigenCD9 CD9 antigenCdc cell division cycleCDH cadherinCDK cyclin-dependent kinaseCDKN2A cyclin-dependent kinase inhibitor 2aCDH1 E-cadherincDNA complementary deoxyribonucleic acidCGH comparative genomic hybridisationCLDN claudinCOL3A1 collagen, type III, alpha-1CP ceruloplasminCXCR chemokine, cxc motif, receptorDAB diaminobenzidinedATP 2'-deoxyadenosine 5'-triphosphateDCC deleted in colorectal carcinomadCTP 2'-deoxycytidine 5'-triphosphateDEPC diethylene pyrocarbonatedGTP 2 '-deoxyguanosine 5 '-triphosphateDHEA dehydroepiandrostenedioneDLBCL diffuse large B-cell lymphomaDoc 2 differentially expressed in ovarian cancer 2DNA deoxyribonucleic aciddNTP nucleotide
10
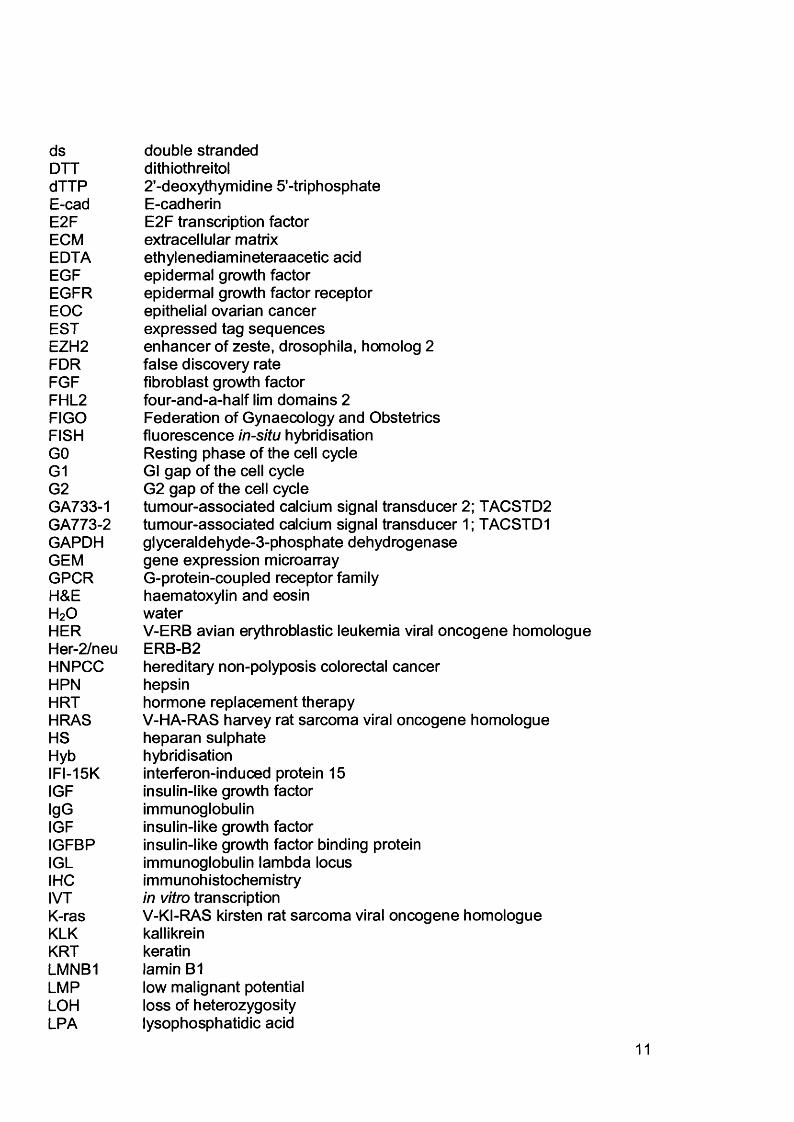
ds double strandedDTT dithiothreitoldTTP 2'-deoxythymidine 5'-triphosphateE-cad E-cad herinE2F E2F transcription factorECM extracellular matrixEDTA ethylenediamineteraacetic acidEGF epidermal growth factorEGFR epidermal growth factor receptorEOC epithelial ovarian cancerEST expressed tag sequencesEZH2 enhancer of zeste, drosophila, homolog 2FDR false discovery rateFGF fibroblast growth factorFHL2 four-and-a-half lim domains 2FIGO Federation of Gynaecology and ObstetricsFISH fluorescence in-situ hybridisationGO Resting phase of the cell cycleG1 Gl gap of the cell cycleG2 G2 gap of the cell cycleGA733-1 tumour-associated calcium signal transducer 2; TACSTD2GA773-2 tumour-associated calcium signal transducer 1; TACSTD1GAPDH glyceraldehyde-3-phosphate dehydrogenaseGEM gene expression microarrayGPCR G-protein-coupled receptor familyH&E haematoxylin and eosinh2o waterHER V-ERB avian erythroblastic leukemia viral oncogene homologueHer-2/neu ERB-B2HNPCC hereditary non-polyposis colorectal cancerHPN hepsinHRT hormone replacement therapyHRAS V-HA-RAS harvey rat sarcoma viral oncogene homologueHS heparan sulphateHyb hybridisationIFI-15K interferon-induced protein 15IGF insulin-like growth factorigG immunoglobulinIGF insulin-like growth factorIGFBP insulin-like growth factor binding proteinIGL immunoglobulin lambda locusIHC immunohistochemistryIVT in vitro transcriptionK-ras V-KI-RAS kirsten rat sarcoma viral oncogene homologueKLK kallikreinKRT keratinLMNB1 lamin B1LMP low malignant potentialLOH loss of heterozygosityLPA lysophosphatidic acid
11
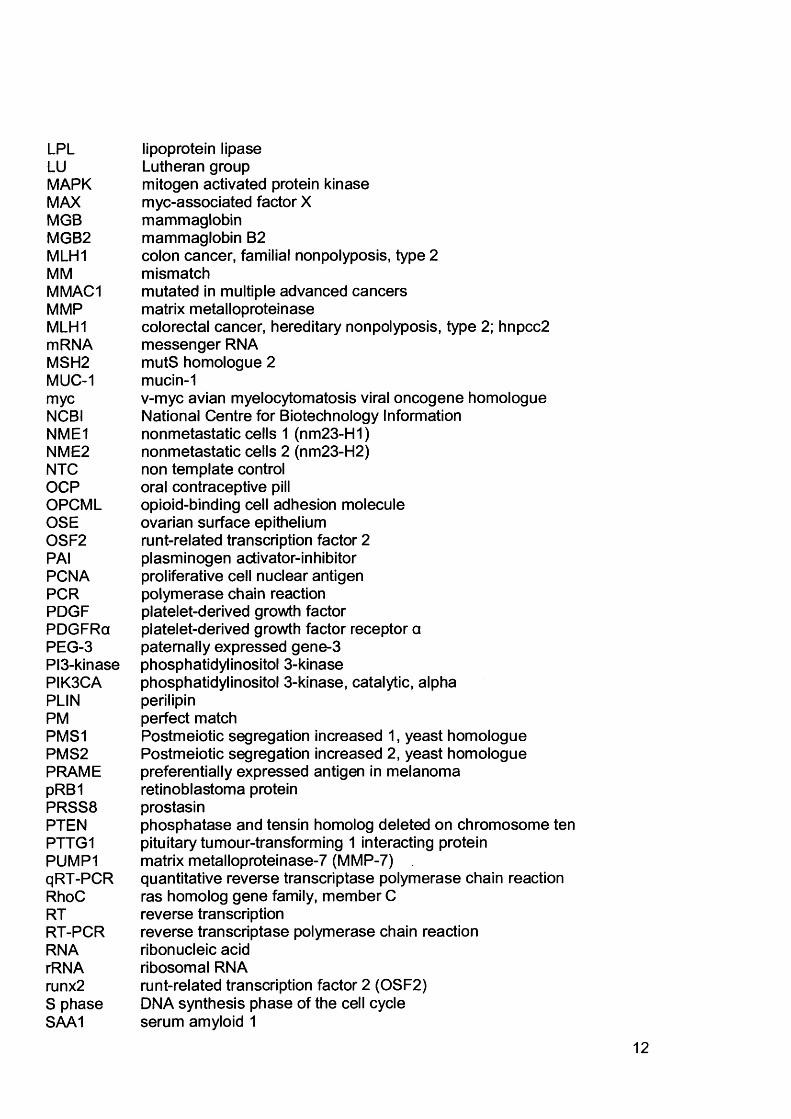
LPL lipoprotein lipaseLU Lutheran groupMAPK mitogen activated protein kinaseMAX myc-associated factor XMGB mammaglobinMGB2 mammaglobin B2MLH1 colon cancer, familial nonpolyposis, type 2MM mismatchMMAC1 mutated in multiple advanced cancersMMP matrix metalloproteinaseMLH1 colorectal cancer, hereditary nonpolyposis, type 2; hnpcc2mRNA messenger RNAMSH2 mutS homologue 2MUC-1 mucin-1myc v-myc avian myelocytomatosis viral oncogene homologueNCBI National Centre for Biotechnology InformationNME1 nonmetastatic cells 1 (nm23-H1)NME2 nonmetastatic cells 2 (nm23-H2)NTC non template controlOCP oral contraceptive pillOPCML opioid-binding cell adhesion moleculeOSE ovarian surface epitheliumOSF2 runt-related transcription factor 2PAI plasminogen activator-inhibitorPCNA proliferative cell nuclear antigenPCR polymerase chain reactionPDGF platelet-derived growth factorPDGFRa platelet-derived growth factor receptor aPEG-3 paternally expressed gene-3PI3-kinase phosphatidylinositol 3-kinasePIK3CA phosphatidylinositol 3-kinase, catalytic, alphaPLIN perilipinPM perfect matchPMS1 Postmeiotic segregation increased 1, yeast homologuePMS2 Postmeiotic segregation increased 2, yeast homologuePRAME preferentially expressed antigen in melanomapRB1 retinoblastoma proteinPRSS8 prostasinPTEN phosphatase and tensin homolog deleted on chromosome tenPTTG1 pituitary tumour-transforming 1 interacting proteinPUMP1 matrix metalloproteinase-7 (MMP-7)qRT-PCR quantitative reverse transcriptase polymerase chain reactionRhoC ras homolog gene family, member CRT reverse transcriptionRT-PCR reverse transcriptase polymerase chain reactionRNA ribonucleic acidrRNA ribosomal RNArunx2 runt-related transcription factor 2 (OSF2)S phase DNA synthesis phase of the cell cycleSAA1 serum amyloid 1
SAGE serial analysis of gene expressionSAPE streptavidin-phycoerythrinsiRNA small interfering RNASLPI secretory leukocyte protease inhibitorSOM self-organising mapss single strandedSSIIRT Superscript II reverse transcriptaseSPARC secreted protein acidic and rich in cysteineSPP1 secreted phosphoprotein 1STK15 serine/threonine protein kinase 15SVM support vector machineTACSTD1 tumour-associated calcium signal transducer 1 (GA773-2)TAE T ris-acetate-EDT ATEPI TGFp-regulated and epithelial cell-enriched phosphataseTGF transforming growth factorTGF-a transforming growth factor-aTGF-p transforming growth factor-pTGFR transforming growth factor receptorTJ tight junctionTVS transvaginal ultrasoundTIMP tissue inhibitor of metalloproteinasetRNA transfer RNAUK United Kingdom of Great Britain and Northern IrelandUKCTOCS UK Collaborative trial of ovarian cancer screeningu-PA urokinase-type plasminogen activatoruPAM urokinase-type plasminogen activator inhibitoruPAR urokinase-type plasminogen activator receptorUV ultravioletVEGF vascular endothelial growth factorVEGF-C vascular endothelial growth factor-CVEGF-D vascular endothelial growth factor-DVEGFR-1 vascular endothelial growth factor receptor-1VEGFR-2 vascular endothelial growth factor receptor-2VEGFR-3 vascular endothelial growth factor receptor-3WHI Women’s Health InitiativeWISP-2 wnt-inducible signalling protein-2
13
C hapter 1
Introduction
Ovarian cancer is the fourth most common cancer in women, after breast, colorectal
and lung cancers. The UK has one of the highest incidences of ovarian cancer in
Europe, with around 6,800 new cases being diagnosed each year, and 4,000 deaths
[Cancer Research UK, 2002]. In America, ovarian cancer accounts for 4 percent of all cancers among women and ranks fifth as a cause of their deaths from cancer.
The American Cancer Society statistics for ovarian cancer predicted that there would
be approximately 25,400 new cases and 14,300 deaths in 2003 [Jemal et al., 2003].
70% of women present at an advanced FIGO (International Federation of Gynaecology and Obstetrics) stage, and overall 60% of patients with ovarian cancer
will die from their disease. The high mortality of ovarian cancer is due firstly to the
fact that the disease is relatively asymptomatic in its early stages, and that the
symptoms of late stage disease, such as abdominal discomfort, weight loss, diarrhoea or constipation, vaginal bleeding and shortness of breath, are non-specific
complaints. Secondly, ovaries are inaccessible pelvic organs, and therefore effective
screening methods for early stage disease have remained elusive. Finally, no pre- malignant phenotype has been identified which is known to proceed through a
stepwise progression to cancer which is amenable for screening. Survival figures for
epithelial ovarian cancer (EOC), when diagnosed in its earliest stages, give rates of
greater than 90%. However, stage IV disease has a 5 year survival of around 15%
with overall 5 year survival for all four stages of 25%. This has remained largely
unchanged over the past 20 years, despite new chemotherapeutic agents.
The recent availability of gene expression microarrays has transformed the study of
cancer biology and has enabled the simultaneous examination of thousands of
genes in parallel. This promises to extend our knowledge of the molecular events in
the evolution and progression of ovarian cancer, extend cancer classification and
identify molecules for effective prevention, detection and treatment of this disease.
This thesis concerns the use of gene expression microarrays to identify novel
markers in ovarian cancer which may contribute to this knowledge.
14
1.1 Classification of Ovarian Tumours
The classification of all ovarian tumours is based on the tissue of origin. This is best
understood in terms of the embryology of the ovary. The development can be divided into four main stages. First, the primordial germ cells become detached from the
endoderm of the yolk sac wall and migrate to the genital ridges, which are bilateral
thickenings of coelomic epithelium. Second, the coelomic epithelium undergoes
proliferation, along with the underlying mesenchyme. During the third stage, the
ovary divides into a central medulla and a peripheral cortex. The fourth stage
comprises development of the cortex and involution of the medulla. The histogenetic classification categorises ovarian neoplasms according to whether they originate
from the coelomic epithelium, germ cells or mesenchyme.
1.1.1 Histogenetic Classification of Ovarian Neoplasms
The histological classification of ovarian tumours by the World Health Organisation
(WHO) is based on histogenetic principles, that is, ovarian tumours are characterised according to whether they are derived from coelomic surface epithelial cells, germ
cells, or mesenchyme (the stroma and the sex cord). Epithelial ovarian tumours,
which constitute 85-90% of malignant ovarian tumours, are further classified into
histological types as follows: serous, mucinous, endometrioid, clear cell, transitional cell tumours (Brenner tumours), carcinosarcoma, mixed epithelial tumour,
undifferentiated carcinoma, and others. Carcinosarcoma of the ovary, also known as
malignant mixed mesodermal tumour (MMMT) behaves in a different way to other
epithelial ovarian cancers in that it has a later age of onset, worse response to
platinum-based chemotherapy and overall poor prognosis [Brown et al., 2004]. Clear
cell and endometrioid carcinomas are highly associated with endometriosis. In stage distribution, serous carcinoma is found predominantly is stage III or IV. In contrast,
clear cell and endometrioid carcinomas tend to remain confined to the ovary. Clear
cell and endometrioid carcinomas may be unique histological types compared with
serous carcinomas with respect to stage distribution and association with
endometriosis.
15
Classification of Ovarian Tumours
Tumours Derived from Coelomic EpitheliumSerous tumourMucinousEndometrioidClear cellBrennerUndifferentiatedCarcinosarcoma & mixed mesodermal
Tumours Derived from Germ CellsTeratoma Dysgerminoma Embryonal carcinoma Endodermal sinus tumour Choriocarcinoma Gonadoblastoma
Tumours Derived from Gonadal StromaGranulosa-theca cell tumours Sertoli-Leydig tumours
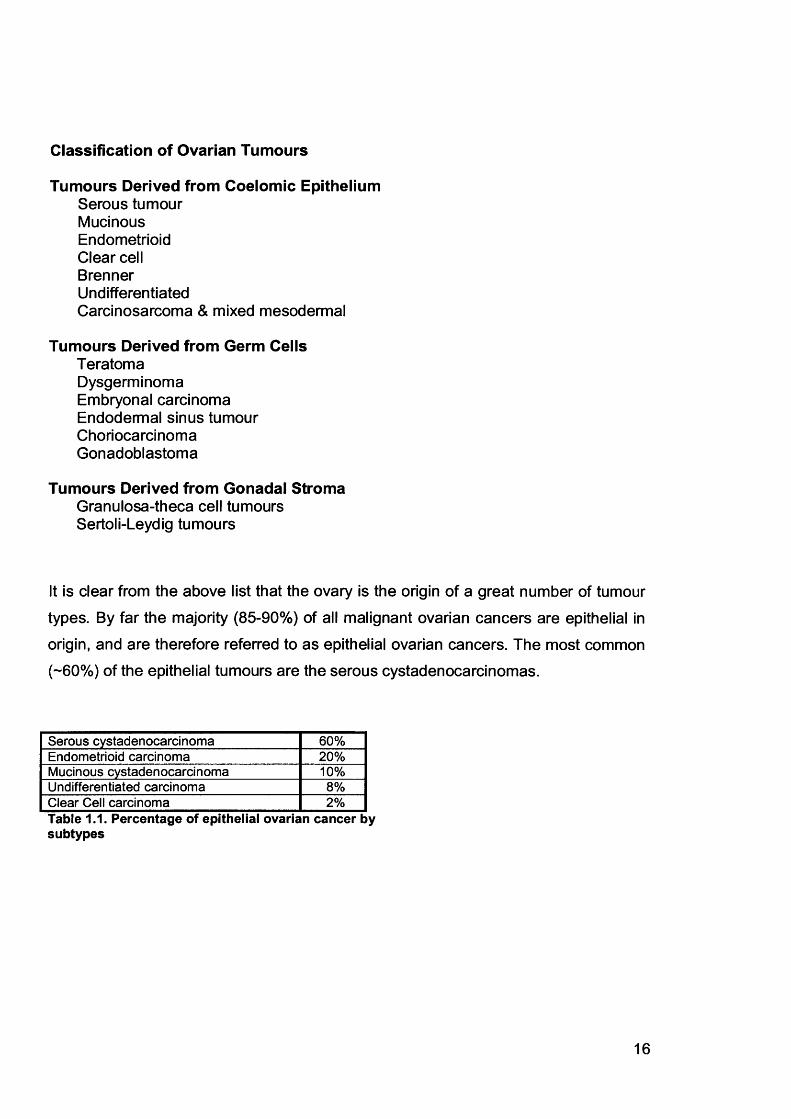
It is clear from the above list that the ovary is the origin of a great number of tumour types. By far the majority (85-90%) of all malignant ovarian cancers are epithelial in
origin, and are therefore referred to as epithelial ovarian cancers. The most common
(-60%) of the epithelial tumours are the serous cystadenocarcinomas.
Serous cystadenocarcinoma 60%Endometrioid carcinoma 20%Mucinous cystadenocarcinoma 10%Undifferentiated carcinoma 8%Clear Cell carcinoma 2%Table 1.1. Percentage of epithelial ovarian cancer by subtypes
16
1.2 Epidemiology
Epithelial ovarian cancer (EOC) is a disease of perimenopausal and postmenopausal
women. The mean age of diagnosis is between 50 and 70 years of age. 90% of all
EOC’s are thought to be sporadic, and 10% are familial.
1.2.1 Hereditary Epithelial Ovarian Cancer
A family history of ovarian cancer accounts for the greatest of all known risk factors,
other than age, for the disease [Parazzini et al., 1991], with about 10% of all EOC’s
resulting from a hereditary predisposition [Claus et al., 1996]. This thesis is not
concerned with hereditary ovarian cancer, so it is only briefly mentioned.
1.2.1.1 The Breast and Ovarian Cancer Syndrome
The breast and ovarian cancer syndrome is responsible for about 90% of all cases of
hereditary ovarian cancer [Narod et al., 1995a]. Approximately 10% of these women
are carriers of the breast/ovarian cancer susceptibility genes, BRCA1 and BRCA2
[Risch et al., 2001]. The lifetime risk of EOC in the general population is about 1.4%, while that for gene carriers, such as Ashkenazi Jews ranges between 16-30%
[Struewing et al., 1997;Claus et al., 1996;Whittemore et al., 1997]. Families who
have a total of five or more breast or ovarian cancers in first or second degree
relatives are thought to qualify, as are families where at least three relatives have
early-onset (less than 60 years) breast or ovarian cancer [Narod et al., 1995b]. Both
BRCA1 and BRCA2 are tumour suppressor genes and are transmitted in an autosomal dominant fashion.
The BRCA1 gene, located on chromosome 17q, is associated with an increased risk
of both ovarian and breast cancers, with a lifetime risk of ovarian cancer of 20-40%
[Whittemore et al., 1997;Ford et al., 1994]. BRCA1 mutations are responsible for
5.7% of ovarian cancers in women under the age of 40 years in the general population, 4.6% between the ages of 40 and 50, and 1.1% above the age of 50
[Ford et al., 1995]. Features suggestive of a BRCA1 mutation include a family history
17
of: two or more cases of ovarian cancer, ovarian and breast cancer in the same
woman, one or more cases of pre-menopausal breast cancer with a case of ovarian
cancer diagnosed at any age, two or more cases of postmenopausal breast cancer and one or more cases of ovarian cancer diagnosed at any age or male breast
cancer.
The BRCA2 gene on chromosome 13q is also associated with high rates of ovarian
and breast cancer. The lifetime risk of breast cancer has been reported to be similar
to that of BRCA1 (55-85%), while the lifetime risk of ovarian cancer is estimated to
be 10-20% [Ford et al., 1998]. BRCA2 is also associated with up to 40% risk of male
breast cancer [Couch et al., 1996], as well as an increased risk of pancreatic cancer
[Hahn et al., 2003]. BRCA2 features are similar to those outlined for BRCA1, but also
include a family history of pancreas cancer in addition to breast and/or ovarian
cancer. The role of the BRCA1 and BRCA2 genes in sporadic ovarian cancer remains unclear, since somatic mutations in either gene are uncommon. However,
recently mutations in EMSY were identified in 17% of high-grade ovarian cancers
[Hughes-Davies et al., 2003]. EMSY maps to chromosome 11 q13.5, a region known
to be involved in breast and ovarian cancers. EMSY encodes a protein, EMSY, which
binds to, and silences the function of BRCA2. This implicates the BRCA2 pathway of
tumour suppression in sporadic ovarian cancer.
1.2.1.2 Hereditary Nonpolyposis Colorectal Cancer Syndrome
Hereditary Non-Polyposis Colorectal Cancer (HNPCC), also known as Lynch II
syndrome is a hereditary syndrome most commonly characterized by an increased risk of colorectal, endometrial and ovarian cancers. It is closely linked with mutations
in the DNA mismatch repair genes MSH2, MLH1, PMS1, and PMS2 [Lynch and
Smyrk, 1996]. The lifetime risk for colorectal cancer is 80%, for endometrial cancer approximately 40%, and for ovarian cancer is 10% [Aarnio et al., 1995]. Other
associated cancers include stomach, small bowel, urinary tract, and biliary tract.
18
1.2.1.3 Site-Specific Ovarian Cancer
It was previously thought that families with an excess of ovarian cancer but no
incidences of breast cancer form a third distinct group. However, genetic linkage
analyses have only demonstrated linkage to BRCA1 [Steichen-Gersdorf et al., 1994],
suggesting that these families are a variant of the breast and ovarian cancer
syndrome where early-onset breast cancer is rare or has not yet appeared. There is
a fourth group, comprising very young (less than 30 years old) women who have
invasive ovarian cancer, but one recent study demonstrated that this is unlikely to be
due to genetic predisposition [Stratton et al., 1999].
1.2.2 Sporadic Ovarian Cancer
90% of EOC is sporadic. The precise aetiology is not known, but several
environmental, dietary and hormonal causes are suggested. These are detailed here.
1.2.2.1 Country of Origin, Race and Age
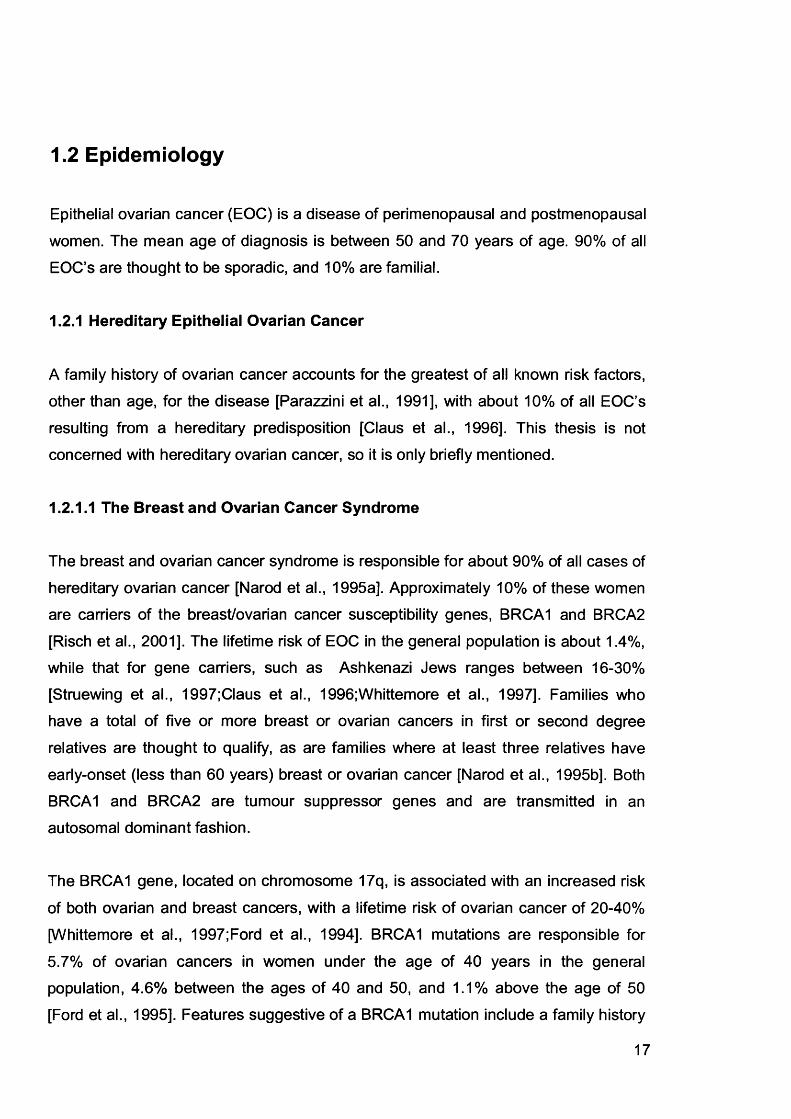
Epithelial ovarian cancer is predominantly a cancer of the developed world.
Approximately 190,000 new cases and 114,000 deaths occur worldwide annually.
Figure 1.1. Incidence of ovarian cancer worldwide. Figure taken from WHO, World Health Report.
19
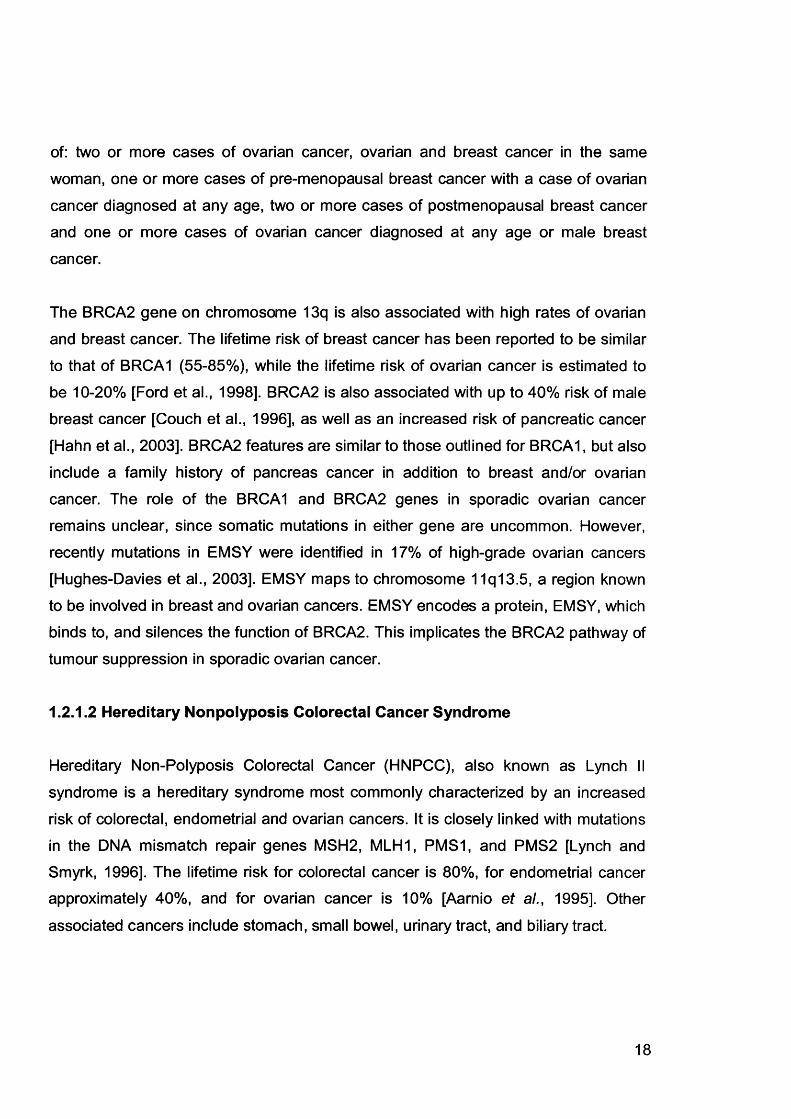
The highest rates are found in the countries of Northern and Western Europe, USA
and Canada. The lowest rates are found in Africa and Asia (see Figures 1.1 and 1.2).
^ | < 10.8 I I < 13.2 m < 15.7 m 18.1 H < 2 0 . 6
Figure 1.2. Age-standardised incidence rates for ovarian cancer (per 100,000 females per year) in the European Union, 1995.Figure taken from Ferlay et al, 1999. Cancer incidence, mortality and prevalence in the European Union.
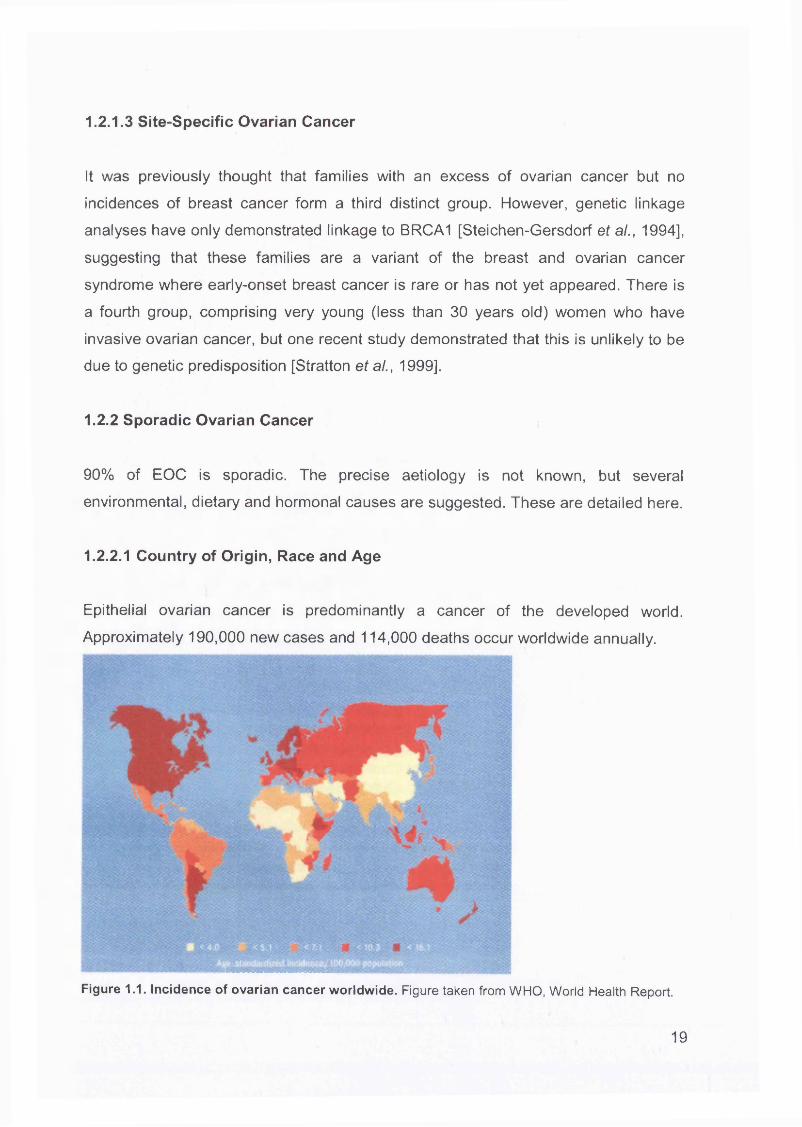
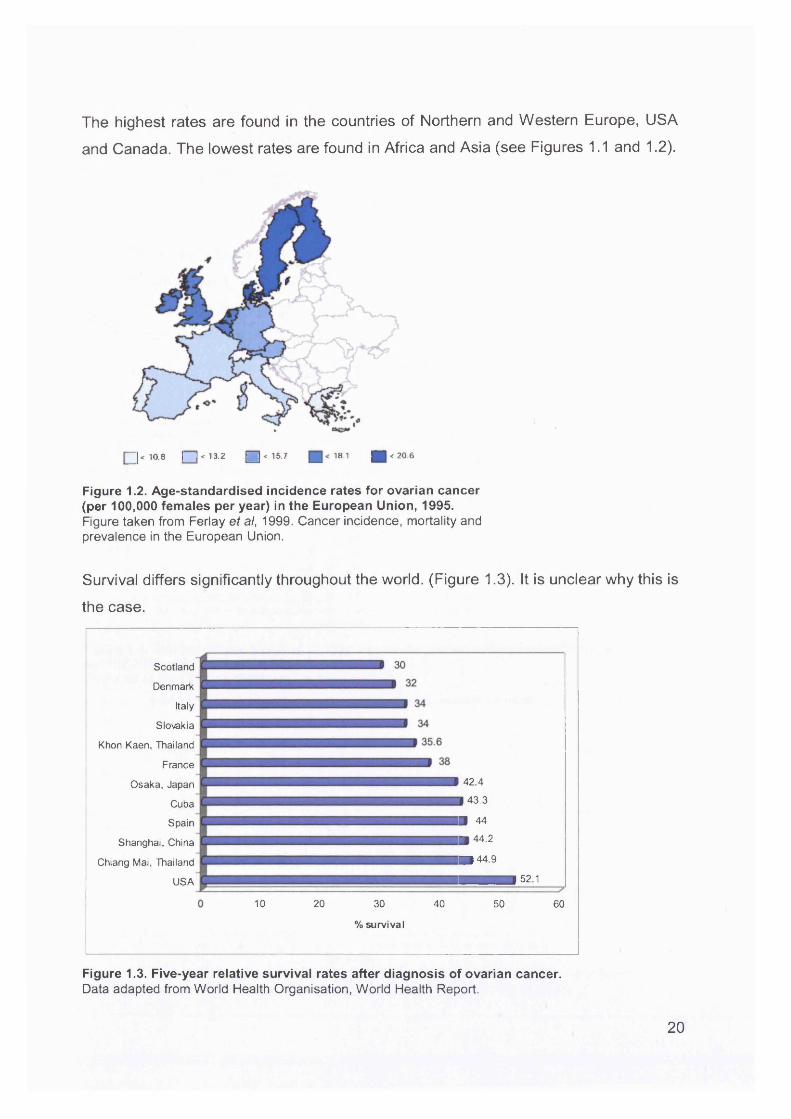
Survival differs significantly throughout the world. (Figure 1.3). It is unclear why this is
the case.
Scotland
Denmark
Italy
Slo\rakia
Khon Kaen, Thailand
France
Osaka, Japan 42 4
Cuba 43.3
Spain B 44
Shanghai, China B 4^-2
Chiang Mai, Thailand B ) 44.9
USA — 521
10 20 30 40 50 60
% survival
Figure 1.3. Five-year relative survival rates after diagnosis of ovarian cancer.Data adapted from World Health Organisation, World Health Report.
20
2094
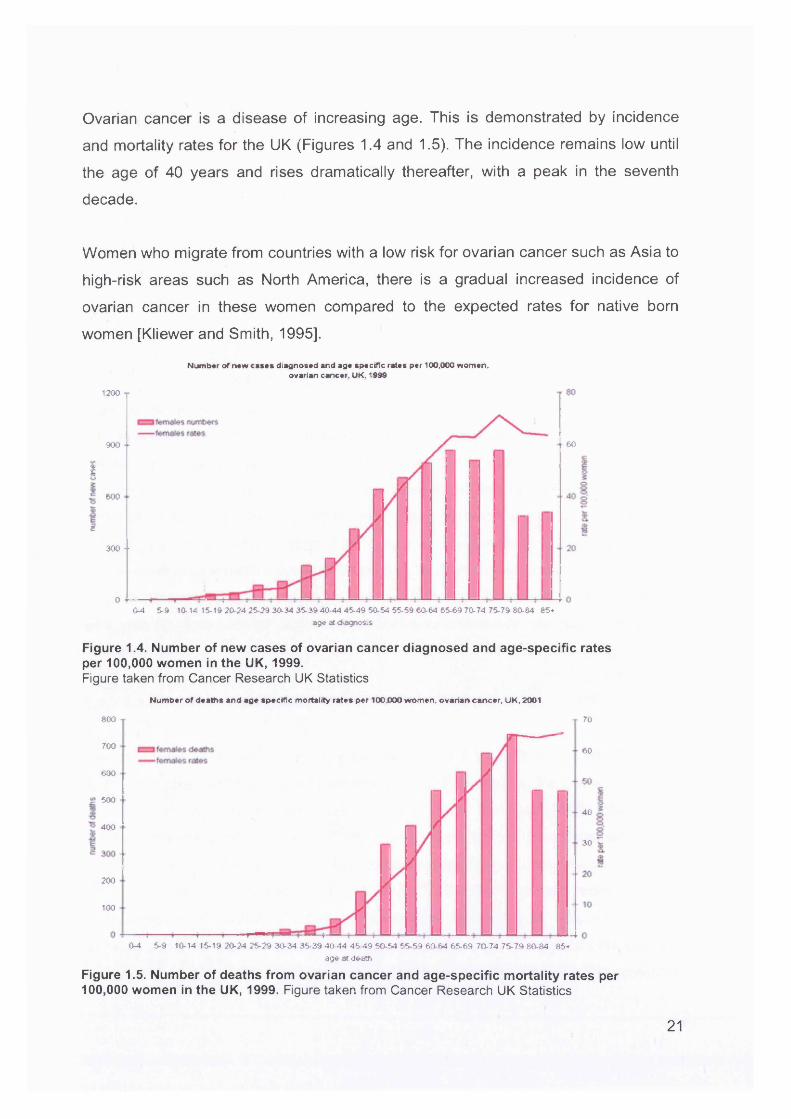
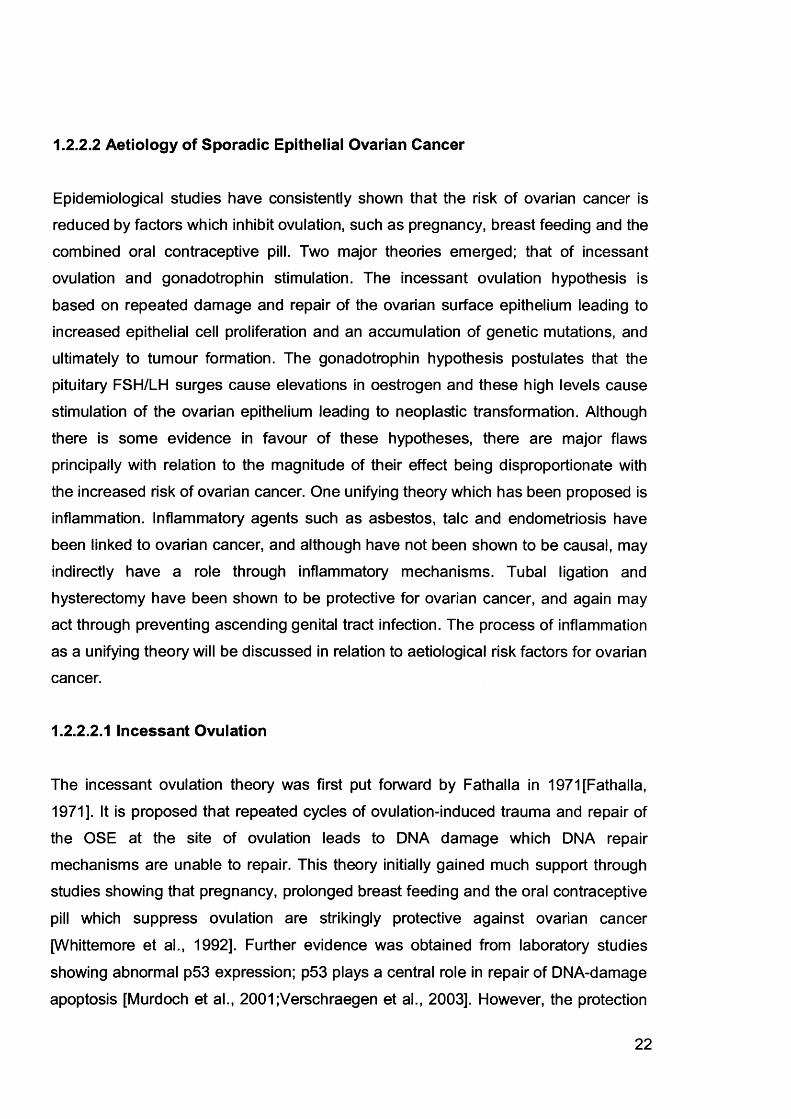
Ovarian cancer is a disease of increasing age. This is demonstrated by incidence
and mortality rates for the UK (Figures 1.4 and 1.5). The incidence remains low until
the age of 40 years and rises dramatically thereafter, with a peak in the seventh
decade.
Women who migrate from countries with a low risk for ovarian cancer such as Asia to
high-risk areas such as North America, there is a gradual increased incidence of
ovarian cancer in these women compared to the expected rates for native born
women [Kliewer and Smith, 1995].
Number of mew cases diagnosed and age specific rates per 100,000 women, ovarian cancer. UK. 1990
1200
60900
«/»
1600
2300 - •
o 4—0-4 5-9 10-14 15-19 20-24 25-29 30-34 35-39 40 44 45-49 50-54 55-59 60-64 65-69 70-74 75-79 80-64 85*
age at diagnosis
Figure 1.4. Number of new cases of ovarian cancer diagnosed and age-specific rates per 100,000 women in the UK, 1999.Figure taken from Cancer Research UK Statistics
Number of deaths and age specific mortality rates per 100.000 women, ovarian cancer. UK. 2001
600 70
700 60
600
.c 50040
400
30
200
100
0-4 5-9 10-14 15-19 20-24 25-29 30-34 35-39 40-44 45-49 50-54 55-59 60-64 65-69 70-74 75-79 80-84 85 -
age at death
Figure 1.5. Number of deaths from ovarian cancer and age-specific mortality rates per 100,000 women in the UK, 1999. Figure taken from Cancer Research UK Statistics
21
1.2.2.2 Aetiology of Sporadic Epithelial Ovarian Cancer
Epidemiological studies have consistently shown that the risk of ovarian cancer is reduced by factors which inhibit ovulation, such as pregnancy, breast feeding and the
combined oral contraceptive pill. Two major theories emerged; that of incessant
ovulation and gonadotrophin stimulation. The incessant ovulation hypothesis is
based on repeated damage and repair of the ovarian surface epithelium leading to increased epithelial cell proliferation and an accumulation of genetic mutations, and
ultimately to tumour formation. The gonadotrophin hypothesis postulates that the
pituitary FSH/LH surges cause elevations in oestrogen and these high levels cause
stimulation of the ovarian epithelium leading to neoplastic transformation. Although
there is some evidence in favour of these hypotheses, there are major flaws
principally with relation to the magnitude of their effect being disproportionate with
the increased risk of ovarian cancer. One unifying theory which has been proposed is
inflammation. Inflammatory agents such as asbestos, talc and endometriosis have
been linked to ovarian cancer, and although have not been shown to be causal, may
indirectly have a role through inflammatory mechanisms. Tubal ligation and
hysterectomy have been shown to be protective for ovarian cancer, and again may
act through preventing ascending genital tract infection. The process of inflammation
as a unifying theory will be discussed in relation to aetiological risk factors for ovarian cancer.
1.2.2.2.1 Incessant Ovulation
The incessant ovulation theory was first put forward by Fathalla in 1971 [Fathalla,
1971]. It is proposed that repeated cycles of ovulation-induced trauma and repair of the OSE at the site of ovulation leads to DNA damage which DNA repair
mechanisms are unable to repair. This theory initially gained much support through studies showing that pregnancy, prolonged breast feeding and the oral contraceptive
pill which suppress ovulation are strikingly protective against ovarian cancer
[Whittemore et al., 1992]. Further evidence was obtained from laboratory studies
showing abnormal p53 expression; p53 plays a central role in repair of DNA-damage
apoptosis [Murdoch et al., 2001;Verschraegen et al., 2003]. However, the protection
22
is disproportionate as 5 year oral contraceptive usage gives a 50% risk reduction
whilst only reducing the lifetime number of ovulations by 10-20% [Vessey and
Painter, 1995]. In addition, there is evidence that the suppression of ovulation by
pregnancy, breast feeding or the OCP has a greater effect in terms of risk reduction
compared to the same length of suppression due to a late menarche or early
menopause [Whittemore et al., 1992]. Although it is true that the extremes of
menstrual life may be anovulatory, this further gives doubt as to whether it is purely the prevention of ovulation which is at play, or whether there is another process to
account for this effect.
1.2.2.2.2 Gonadotrophins
The gonadotrophin theory proposes stimulation of the ovarian epithelium within
inclusion cysts by high levels of oestrogen caused by high FSH and LH levels leads
to ovarian cancer [Cramer and Welch, 1983]. As pregnancy provides the greatest
overall risk reduction [Tung et al., 2005] and is associated with low basal levels of
gonadotrophins, it was suggested that this was the mechanism by which the
protective effect was conferred. However, pregnancy is also associated with very high levels of oestrogen, so this theory cannot hold. Other evidence that refutes this
theory is the lack of correlation of serum levels of gonadotrophins with risk of
developing ovarian cancer [Helzlsouer et al., 1995].
1.2.2.2.3 Infertility
It would follow from the incessant ovulation theory that anovulatory infertility is
protective against ovarian cancer due to a lack of ovulation. There has been an ongoing debate regarding the link between ovarian cancer and infertility since it was
first suggested in 1974 [Joly et al., 1974]. One study compared anovulatory infertility
with other causes of infertility and found an relative risk of 1.8 [Rossing et al., 1994].
More recent studies have shown that it is not the drugs used per se, rather that
nulliparous women with unexplained infertility in whom assisted conception was
unsuccessful, had an inherently higher risk [Venn et al., 1999;Doyle et al., 2002].
23
1.2.2.2.4 Hormone Replacement Therapy
The use of hormone replacement therapy (HRT) has increased dramatically over the
past 10 years. Several studies have investigated the possible links of HRT with
cancer. Three studies [Lacey, Jr. et al., 2002;Riman et al., 2002;Purdie et al., 1999]
suggest the risk of EOC with HRT use only applies to the use of unopposed
oestrogens, with the risk increasing with the duration of use: odds ratio 1.8 (95% Cl 1.1-3.0) between 10 and 19 years of use, increasing to an odds ratio of 3.2 (95% Cl
1.7-5.7) after 20 years [Lacey, Jr. et al., 2002]. More recently, the women’s health
initiative (WHI) trial [Anderson et al., 2003] reported on 16,600 postmenopausal
women with an intact uterus taking either placebo or combined oestrogen and
progesterone HRT. Women without a uterus were also recruited, and were given either placebo or unopposed oestrogen. The first trial was stopped early in 2002
because an increased rate of breast cancers was found in HRT users, which outweighed the benefits of therapy. An increased rate of 58% for ovarian cancer was
found, which was not significant. 27 ovarian cancers per 100,000 women were
diagnosed in the placebo group compared with 42 per 100,000 in the treatment arm.
There was no difference in tumour anatomy, stage or grade of disease between the two groups. The second trial is still ongoing and is expected to complete in 2005, and
should provide information on the effect of unopposed oestrogen use on ovarian cancer.
Overall, HRT has not been found to increase the risk of ovarian cancer. However,
one study has demonstrated an increased risk of endometrioid and clear cell
epithelial ovarian cancers with the use of unopposed oestrogen [Garg et al.,
1998].Postmenopausal HRT use causes increased levels of oestrogen with concomitant decreased levels of gonadotrophins, so would further argue against the
gonadotrophin hypothesis.
1.2.2.2.5 Talc and Asbestos
In the 1960’s it was noted that occupational exposure to asbestos was associated with the development of abdominal mesotheliomas, histologically similar to invasive
24
epithelial ovarian cancer [KEAL, 1960;Newhouse et al., 1977]. Talc (hydrated
magnesium trisilicate) is a compound chemically related to asbestos, so a link
between talc and EOC was suggested. Scientific evidence exists to demonstrate that
asbestos and talc particles can travel to the upper genital tract in the presence of
patent fallopian tubes [Heller et al., 1996a;Heller et al., 1996b;Venter, 1981]. Women
using talc for perineal dusting and on sanitary napkins have a relative risk of invasive
epithelial ovarian cancer of up to 3.28 (p<0.001) compared to women not performing either practices [Cramer et al., 1982]. The role of talc as a causative agent, however,
is not universally accepted, as evidence to the contrary has been given [Wehner, 2002;Wong et al., 1999;Shen et al., 1998].
1.2.2.2.6 Tubal Ligation and Hysterectomy
Tubal ligation has been associated with a reduction in the risk of ovarian cancer with
odds ratios of 0.2 to 0.9 [Green et al., 1997;Rosenblatt and Thomas, 1996]. The
protective effect of hysterectomy without oophorectomy has shown similar risk
reduction with odds ratios ranging between 0.03 and 0.8 [Loft et al., 1997]. This could
be due to ovaries being inspected at the time of surgery and removed if they look abnormal. However, some studies have shown that the protective effect is sustained
over 20-25 years [Cramer and Xu, 1995]. It has been suggested that this may be due
to the prevention of inflammatory and potentially carcinogenic agents, such as talc,
ascending the genital tract. Interestingly, one study showed a 50% decreased risk of
ovarian cancer in women using talc but having had a sterilisation compared with a
30% increased risk in those using talc but not having been sterilised [Whittemore et
al., 1989]. The same study found no protective effect of hysterectomy in women with
a previous tubal ligation. The magnitude of the protection form the effects of talc are greater than expected, which suggests that other agents may also ascend the genital
tract and cause inflammation, such as sexually transmitted infections.
1.2.2.2.7 Pelvic Inflammatory Disease
Pelvic inflammatory disease (PID) is an inflammation of the ovaries, fallopian tubes
and endometrium due to sexually transmitted infections which ascend the genital
25
tract. An association between PID and ovarian cancer has been found, with the risk
increasing proportionately with the number of infective episodes [Shu et al.,
1989;Risch and Howe, 1995]. These women were more likely to have had PID at an
early age, be nulliparous and infertile. PID causes inflammation and damage to the
fallopian tube epithelium, and thereby tubal infertility; in fact women with tubal infertility have been reported to have a 3 fold risk of ovarian cancer [Rossing et al.,
1994]. Therefore the association between PID and ovarian cancer lends further
support for an inflammatory role in the causation of this disease.
1.2.2.2.8 Endometriosis
Endometriosis has been suggested to be a possible premalignant lesion of ovarian cancer, as a high proportion of endometrioid and clear cell cancers have associated
endometriosis adjacent to malignant cells [Heaps et al., 1990]. In addition,
endometriosis is associated with decreased fertility and general endocrine dysfunction, both of which could be important in ovarian carcinogenesis.
Endometriosis is characterised by the presence of endometrium in places other than
the lining of the uterus, most often the ovaries. This causes a local inflammatory
reaction, with the presence of macrophages and inflammatory cytokines. This again
suggests that inflammation may have a role in ovarian cancer.
1.2.2.2.9 The Unifying Role of Inflammation in Ovarian Cancer
The many risk factors detailed above have led to a number of different theories on the overall mechanism causing ovarian cancer. These include incessant ovulation,
high gonadotrophin levels and direct hormonal effects. It has been proposed that
inflammation may be the key mechanism which underlies the effects of the different
exposures, and is discussed below.
The role of inflammation may be mediated by the production of toxic oxidants by the
process of inflammation causing direct DNA damage. This damage may then lead to
cancer. DNA mutations occur more frequently in rapidly dividing cells where errors in
replication and repair are not corrected; chronic inflammation is associated with a
26
high cell turnover, so DNA integrity may be affected.
There is evidence that inflammatory molecules are increased in ovarian cancer.
Chemokines, cytokines, adhesion molecules and other components of the
extracellular matrix may contribute to a tissue environment that supports tumour proliferation and invasion. Chemokines have been found in ovarian cancers and
ascites [Negus et al., 1995], and are known to facilitate the migration of immune cells
into the tumour environment. Prostaglandins which are also mediators of
inflammation are found in elevated amounts in ovarian cancers compared to normal
ovaries [Gubbay et al., 2005]. Non-steroidal anti-inflammatory medications which
reduce prostaglandin levels and have been found to be associated with a reduced
risk of epithelial cancers including ovarian, breast and colon cancers [Harris et al., 2005]. This lends weight to the inflammation theory.
Ovulation itself may predispose to carcinogenesis. The process of follicle rupture and
subsequent invagination of epithelial cells around the edge of the wound can lead to
entrapment of inclusion cysts. These cysts have been shown to be present in high
frequency in women with ovarian cancer in the contralateral unaffected ovary. They are also more common in the ovaries of women who have a high genetic predisposition to ovarian cancer. These women may have ovarian surface epithelia
which are already predisposed to ovarian cancer and one feature of this
predisposition is the presence of inclusion cysts. P53 mutations are a frequent
finding in ovarian cancer and are thought to be due to spontaneous errors in DNA
synthesis [Jones et al., 1991]. One study has shown that ovarian cancers which have
a p53 mutation are associated with an increase in the number of lifetime ovulations
[Schildkraut et al., 1997]. However, this has not been replicated by others [Webb et
al., 1998]. The carcinogenic effect of ovulation may be mediated by inflammation.
There is a significant elevation of inflammatory markers around the ovulatory follicles
[Espey, 1994] which affects the surrounding epithelium causing cellular oxidative
damage and thereby leading to mutagenesis.
In summary, ovulation, endometriosis, PID and talc can induce inflammation and
increase the risk of ovarian cancer. Conversely, sterilisation and hysterectomy
27

protect the ovaries from the effect of substances which cause inflammation and
thereby reduce the risk. The process of inflammation causes DNA damage and
repair, oxidative stress, an increase in inflammatory molecules, all of which may be
carcinogenic. Inflammation may be a unifying theory to explain the epidemiological
risk factors for ovarian cancer although more laboratory studies are required for confirmation.
28
1.3 Pathology of Serous Cystadenocarcinomas
1.3.1 Histopathology
Each epithelial ovarian cancer subtype resembles its tissue of origin. Serous
cystadenocarcinomas resemble cells of the fallopian tube, mucinous tumours
resemble the cervical cells, endometrioid tumours the endometrium and clear cell
tumours the transitional cell epithelium of the bladder.
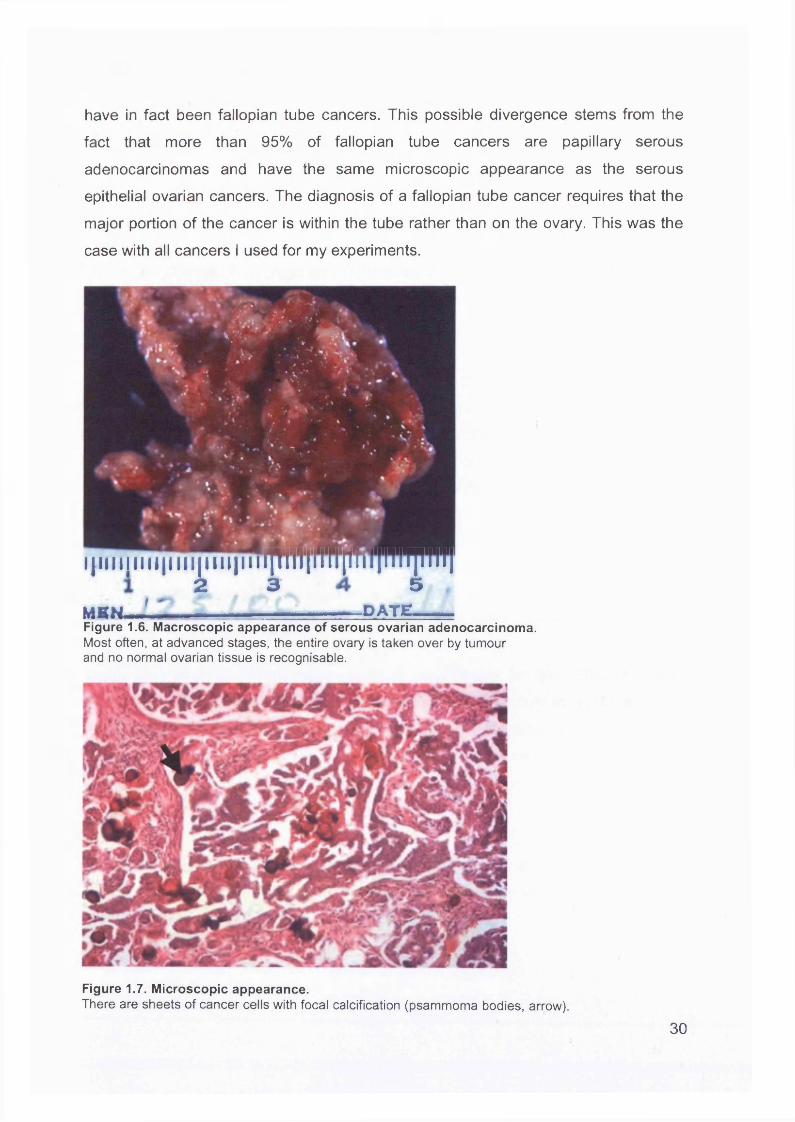
Serous cystadenocarcinomas are the most commonly encountered histologic type,
comprising just over 40% of all primary ovarian neoplasms. Approximately 30-50%
are malignant and 35-50% of tumours are bilateral. They tend to be large tumours with multiple and cystic spaces containing friable papillary projections, and solid nodules of adenocarcinoma (Figure 1.6). The fluid within the cysts tends to be watery
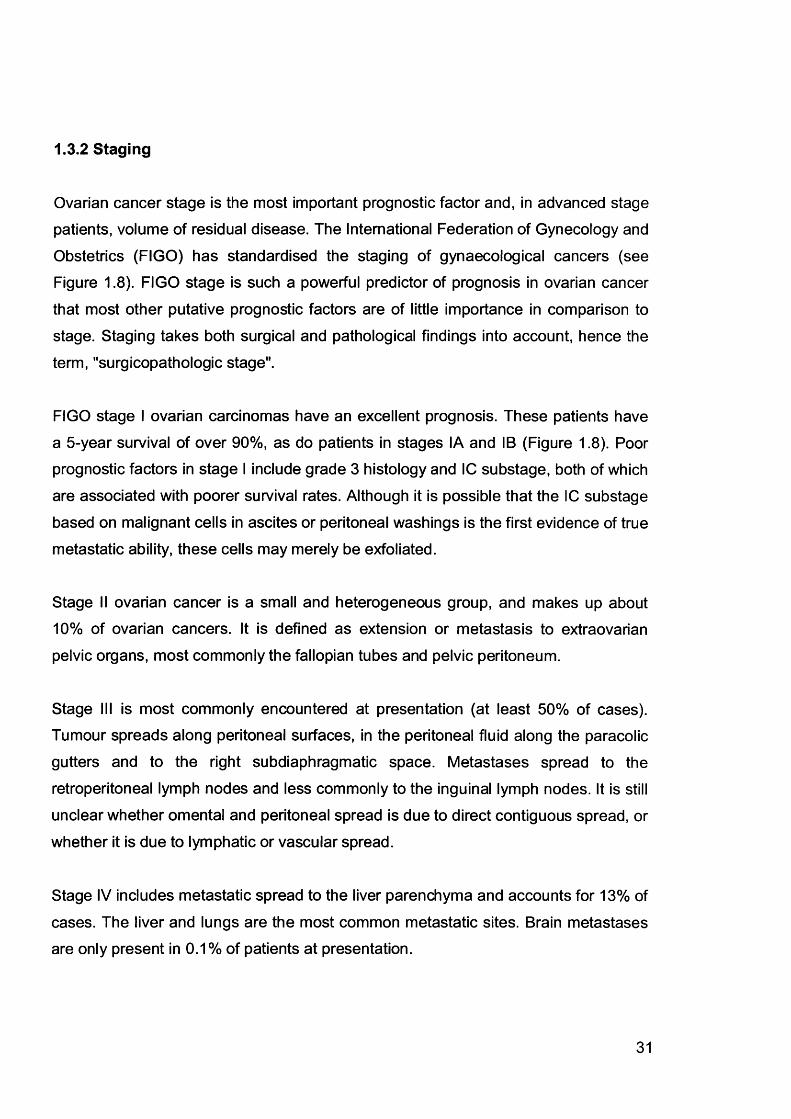
and thin or “serous" in nature. At a microscopic level, psammoma bodies are
frequently seen; these are small, laminated calcospherites composed of
microcrystals similar to calcium-phosphate apatite crystals of bone, and are produced intracellularly. They are believed to be a consequence of dystrophic
calcification associated with cellular degeneration. Tumours containing psammoma
bodies (Figure 1.7) have an above-average survival, possibly because of their diploid
DNA content and low S-phase fraction [Kuhn et al., 1989].
Serous adenocarcinomas can be classified according to their grade, with grade I
(well-differentiated) tumours being composed almost entirely of glands and papillae,
grade III (poorly-differentiated) almost entirely of sheets of malignant cells, with grade II containing a mixture of the two. Grading of tumours is very important as this confer
varying prognoses. Median survival times for patients with grades I, II and III tumours are 4.6, 2.3 and 1.5 years, respectively [Demopoulos et al., 1984].
For this thesis I only focused on serious carcinoma, because if I included all different
histological subtypes, I would have had to collect enough samples from the each
group and the overall project would have been too complicated to complete within 24 months. I used serous ovarian adenocarcinomas for my study, although these may
29
have in fact been fallopian tube cancers. This possible divergence stems from the
fact that more than 95% of fallopian tube cancers are papillary serous
adenocarcinomas and have the same microscopic appearance as the serous
epithelial ovarian cancers. The diagnosis of a fallopian tube cancer requires that the
major portion of the cancer is within the tube rather than on the ovary. This was the
case with all cancers I used for my experiments.
j - k .• ^
'.-V >■ ..... v- .
4 11111111 < 11111^11111111111111111 i p I t 1111111111 jI -D A TE .MBH.
Figure 1.6. Macroscopic appearance of serous ovarian adenocarcinoma.Most often, at advanced stages, the entire ovary is taken over by tumour and no normal ovarian tissue is recognisable.
Figure 1.7. Microscopic appearance.There are sheets of cancer cells with focal calcification (psammoma bodies, arrow).
30
1.3.2 Staging
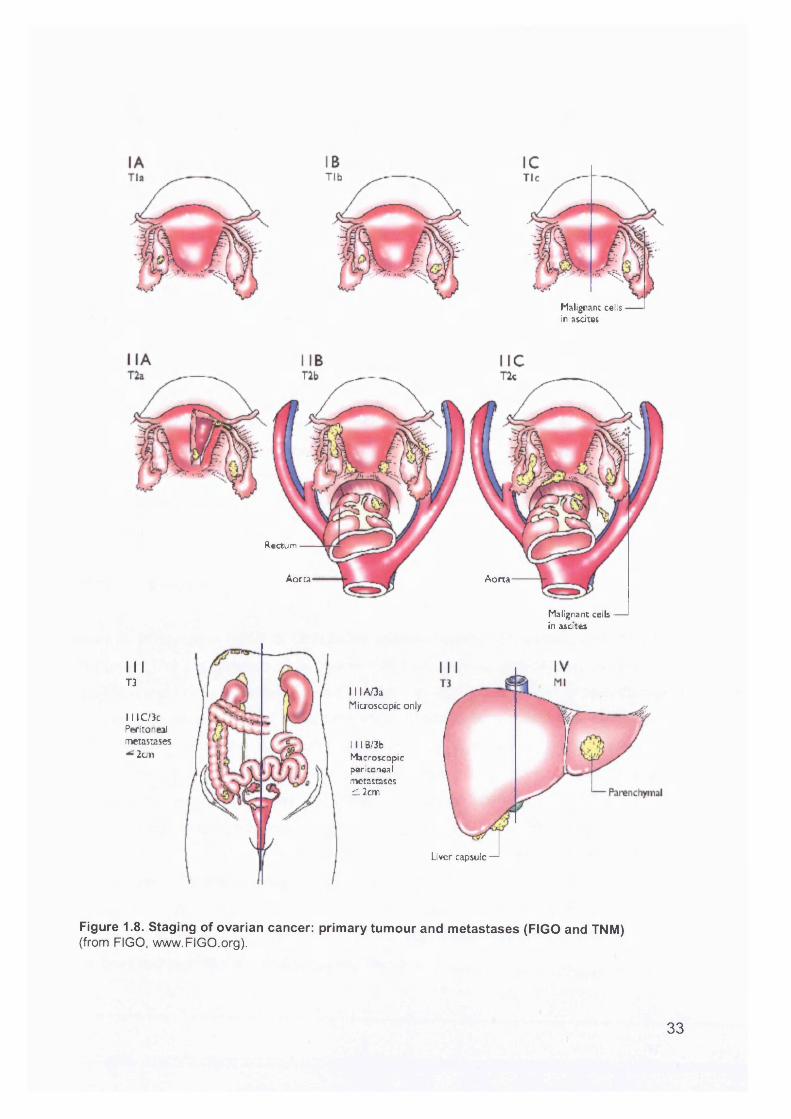
Ovarian cancer stage is the most important prognostic factor and, in advanced stage patients, volume of residual disease. The International Federation of Gynecology and
Obstetrics (FIGO) has standardised the staging of gynaecological cancers (see Figure 1.8). FIGO stage is such a powerful predictor of prognosis in ovarian cancer
that most other putative prognostic factors are of little importance in comparison to
stage. Staging takes both surgical and pathological findings into account, hence the
term, "surgicopathologic stage".
FIGO stage I ovarian carcinomas have an excellent prognosis. These patients have
a 5-year survival of over 90%, as do patients in stages IA and IB (Figure 1.8). Poor prognostic factors in stage I include grade 3 histology and IC substage, both of which
are associated with poorer survival rates. Although it is possible that the IC substage
based on malignant cells in ascites or peritoneal washings is the first evidence of true
metastatic ability, these cells may merely be exfoliated.
Stage II ovarian cancer is a small and heterogeneous group, and makes up about 10% of ovarian cancers. It is defined as extension or metastasis to extraovarian
pelvic organs, most commonly the fallopian tubes and pelvic peritoneum.
Stage III is most commonly encountered at presentation (at least 50% of cases). Tumour spreads along peritoneal surfaces, in the peritoneal fluid along the paracolic
gutters and to the right subdiaphragmatic space. Metastases spread to the
retroperitoneal lymph nodes and less commonly to the inguinal lymph nodes. It is still unclear whether omental and peritoneal spread is due to direct contiguous spread, or
whether it is due to lymphatic or vascular spread.
Stage IV includes metastatic spread to the liver parenchyma and accounts for 13% of
cases. The liver and lungs are the most common metastatic sites. Brain metastases are only present in 0.1 % of patients at presentation.
31
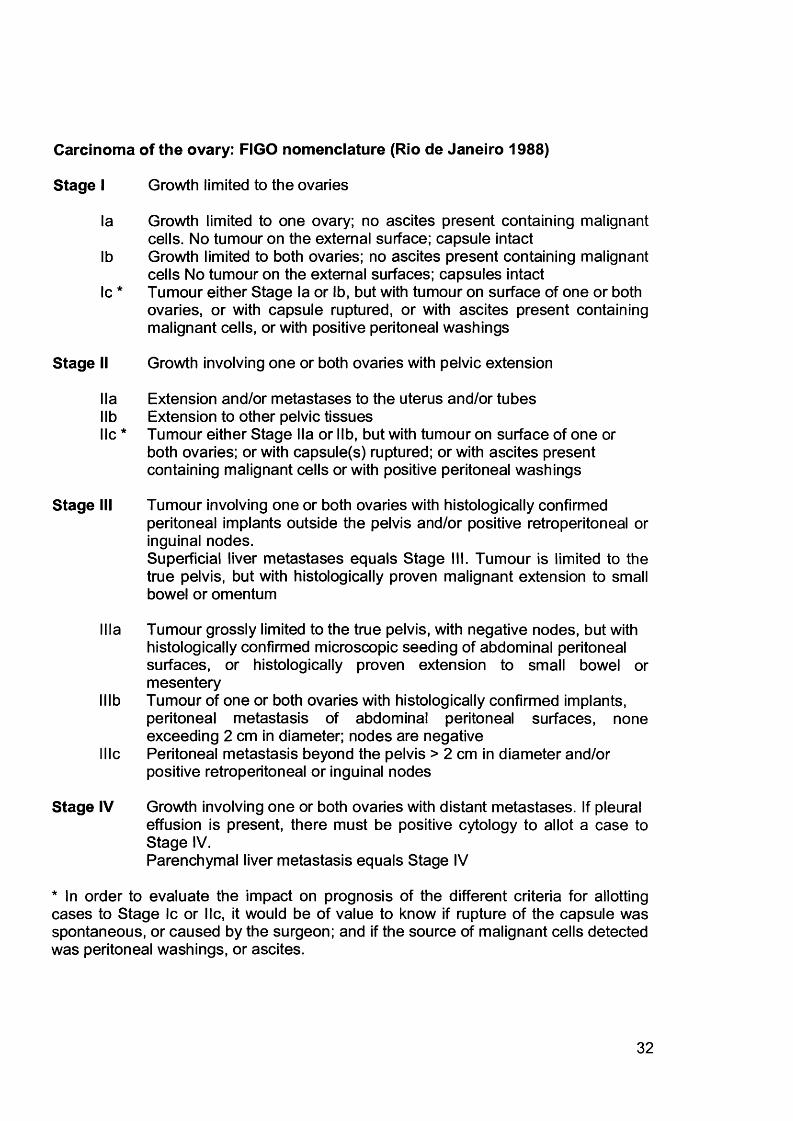
Carcinoma of the ovary: FIGO nomenclature (Rio de Janeiro 1988)
Stage I Growth limited to the ovaries
la Growth limited to one ovary; no ascites present containing malignantcells. No tumour on the external surface; capsule intact
lb Growth limited to both ovaries; no ascites present containing malignantcells No tumour on the external surfaces; capsules intact
Ic * Tumour either Stage la or lb, but with tumour on surface of one or bothovaries, or with capsule ruptured, or with ascites present containing malignant cells, or with positive peritoneal washings
Stage II Growth involving one or both ovaries with pelvic extension
I la Extension and/or metastases to the uterus and/or tubeslib Extension to other pelvic tissueslie * Tumour either Stage lla or lib, but with tumour on surface of one or
both ovaries; or with capsule(s) ruptured; or with ascites present containing malignant cells or with positive peritoneal washings
Stage III Tumour involving one or both ovaries with histologically confirmedperitoneal implants outside the pelvis and/or positive retroperitoneal or inguinal nodes.Superficial liver metastases equals Stage III. Tumour is limited to the true pelvis, but with histologically proven malignant extension to small bowel or omentum
Ilia Tumour grossly limited to the true pelvis, with negative nodes, but with histologically confirmed microscopic seeding of abdominal peritoneal surfaces, or histologically proven extension to small bowel or mesentery
lllb Tumour of one or both ovaries with histologically confirmed implants, peritoneal metastasis of abdominal peritoneal surfaces, none exceeding 2 cm in diameter; nodes are negative
I lie Peritoneal metastasis beyond the pelvis > 2 cm in diameter and/or positive retroperitoneal or inguinal nodes
Stage IV Growth involving one or both ovaries with distant metastases. If pleural effusion is present, there must be positive cytology to allot a case to Stage IV.Parenchymal liver metastasis equals Stage IV
* In order to evaluate the impact on prognosis of the different criteria for allotting cases to Stage Ic or lie, it would be of value to know if rupture of the capsule was spontaneous, or caused by the surgeon; and if the source of malignant cells detected was peritoneal washings, or ascites.
32
Malignant cells in ascites
Rectum
Aorta Aorta
I I !T3
111 C/3c Peritoneal metastases
2cm
111 A/3aMicroscopic only
111 B/3b Macroscopic peritoneal metastasescl 2cm
Malignant cells ■ in ascites
Liver capsule —
Figure 1.8. Staging of ovarian cancer: primary tumour and metastases (FIGO and TNM)(from FIGO, www.FIGO.org).
33
1.4 Molecular Biology of Sporadic Epithelial Ovarian
Cancer
Epithelial ovarian cancer is thought to arise from the epithelial cells that line the
surface of the ovary or from cells that line inclusion cysts immediately beneath the
ovarian surface. By the time the disease is diagnosed, multiple tumour nodules are
found studding the peritoneal surfaces. Molecular techniques have shown that more
than 90% of EOC’s are clonal diseases that originate from the progeny of single
cells. Where ovarian tumours have been compared to their corresponding peritoneal
metastases, both show inactivation of the same X chromosome, areas of loss of
heterozygosity (LOH) on the same chromosomes, and, when present, have the same
base mutated in the p53 tumour suppressor gene indicating monoclonality [Jacobs et al., 1992;Mok et al., 1992;Li et al., 1993].
Over the last decade a number of genetic abnormalities have been detected in epithelial ovarian cancers.
1.4.1 Introduction
Cancer arises as a result of cumulative genetic changes in somatic cells and their progeny. The progression of a cancer cell from normal, pre-cancer, cancer, local
invasion and finally to metastasis is a function of a clonal expansion of cells that have
acquired a selective growth advantage which allows them to outnumber neighbouring
cells. The cells in the neoplastic clone undergo changes in gene activity as a
consequence of genetic and epigenetic changes. Ultimately, a cell population
establishes which can grow regardless of normal controls of proliferation and
surrounding tissues. Hanahan and Weinberg [Hanahan and Weinberg, 2000] have
identified six hallmark features which best define the cancer cell phenotype: self-
sufficiency in growth signals, insensitivity to growth-inhibitory (antigrowth) signals,
evasion of programmed cell death (apoptosis), limitless replicative potential,
sustained angiogenesis, and tissue invasion and metastasis. These traits are found
in most and perhaps all types of human cancers.
34
The accumulation of genetic changes in cells during cancer development and
progression have been most comprehensively described for colorectal cancer
[Kinzler and Vogelstein, 1996] where the initial event is inactivation of the tumour
suppressor gene APC, which allows a normal mucosal cell in the colonic epithelium
to become an adenomatous polyp. Subsequently, mutations in oncogenes (e.g. C-
myc or K-ras) or in tumour suppressor genes (e.g. p53 or DCC) lead to the
progression from adenoma to carcinoma. Mismatch-repair genes recognise and correct mismatches which occur during DNA replication. In tumours where
inactivation of the mismatch-repair genes has occurred, the rate at which DNA
mutations occur is accelerated by the genetic instability. The APC gene has been
described as the “gatekeeper” of the colonic epithelium, and in colon cancer, there is
good evidence to suggest that disruption of the APC pathway is necessary for the initiation of the cancer. However, for epithelial ovarian cancer, as for most other
cancers, such detailed knowledge of the early genetic events is lacking. The following details what is known about the molecular genetics of ovarian cancer.
1.4.2 Oncogenes and Tumour Suppressor Genes
Several factors are involved in the evolution of a cancer. These include alterations or
mutations in specific oncogenes, and are divided into two categories: those that
activate proto-oncogenes which promote cellular proliferation or inhibit cell death,
and those that inactivate tumour suppressor genes which promote cell proliferation or promote cell death. These are discussed below.
1.4.2.1 Oncogenes
Oncogenes result from gain-of-function mutations in their normal cellular counterpart,
proto-oncogenes, the normal function of which is to drive cellular proliferation. The
most common mechanisms for mutational activation of proto-oncogenes are (i) gene
amplification, leading to over-expression of an otherwise normal protein product, (ii)
point mutation, leading to constitutive activation of a mutant form of the protein
product and (iii) chromosomal translocation, which results in juxtaposition of the
oncogene with the promoter region of a constitutively expressed gene, thereby
35
resulting in over-expression of the oncogene-encoded protein.
The Her-2/neu (c-erbB-2) is one of the most extensively investigated proto
oncogenes. It encodes a 185-kDa transmembrane glycoprotein with intrinsic tyrosine
kinase activity, located on chromosome 17q21. It belongs to a family of growth factor receptors, including the epidermal growth factor receptor (EGFR or HER-1) and
HER-3 and HER-4 [Carraway, III and Cantley, 1994]. HER-2 amplifies the signal
provided by other HER receptors and so plays a central role in HER signalling. Overexpression of HER-2 oncogene has been found in 20-30% of ovarian cancers
[Hellstrom et al., 2001 ;McKenzie et al., 1993;Berchuck, 1995] and is associated with
a poor prognosis [Yu et al., 1993;McKenzie et al., 1993;Cirisano and Karlan,
1996;Rubin et al., 1993]. A poor prognosis could be related to a more aggressive phenotype due to ligand activation of the over-expressed receptor. Heregulin can
inhibit clonogenic growth of ovarian cells that over-express HER-2 [Xu et al., 1999],
but increases the ability of the same cells to invade matrigel membranes and to express proteases [Xu et al., 1997]. Therefore the poor prognosis associated with
HER-2 over-expression may be due to increased invasiveness rather than to increased proliferation.
The G1 cyclin proteins regulate the progression of a cell through the G1-S phase of the cell cycle. The sequential activation of cyclin D1 followed by cyclin E leads to the
inactivation of pRB1 (retinoblastoma protein) by phosphorylation, and allows the cell to enter the S phase of the cycle.
Up to 70% of ovarian tumours, mainly the late stage serous subtype over-express
cyclin D1, and this confers a poor prognosis. The importance of cyclin E is less clear.
12-18% of ovarian tumours, especially clear cell tumours [Session et al., 1999] have been reported to over-express cyclin E, although no information was given regarding prognosis.
Myc is a member of the helix-loop-helix/leucine zipper superfamily of genes. It is
located on chromosome 8q24 and encodes a DNA-binding protein which, on
heterodimerisation with the MAX protein, binds to target DNA sequences and
36
induces transcription of several genes [Dang et al., 1999]. Myc plays a role in many
cellular mechanisms including cell cycle control, differentiation, adhesion and
apoptosis [Dang et al., 1999]. Studies have shown myc amplification in 28-50% of
EOC’s [Baker et al., 1990;Bauknecht et al., 1993;Katsaros et al., 1995]. The clinical
relevance, is, however, not clear [Bauknecht et al., 1993].
Ras mutations occur in less than 20% of serous ovarian cancers [Enomoto et al.,
1990]. However, physiologic activation of Ras has been found in a majority of ovarian
cancer cell lines [Patton et al., 1998]. Activation of Ras may relate to the activity of
receptor tyrosine kinases or to cross-talk from phosphatidylinositol 3-kinase (PI3-
kinase).
MMitosis
GOResting
SDNA Synthesis
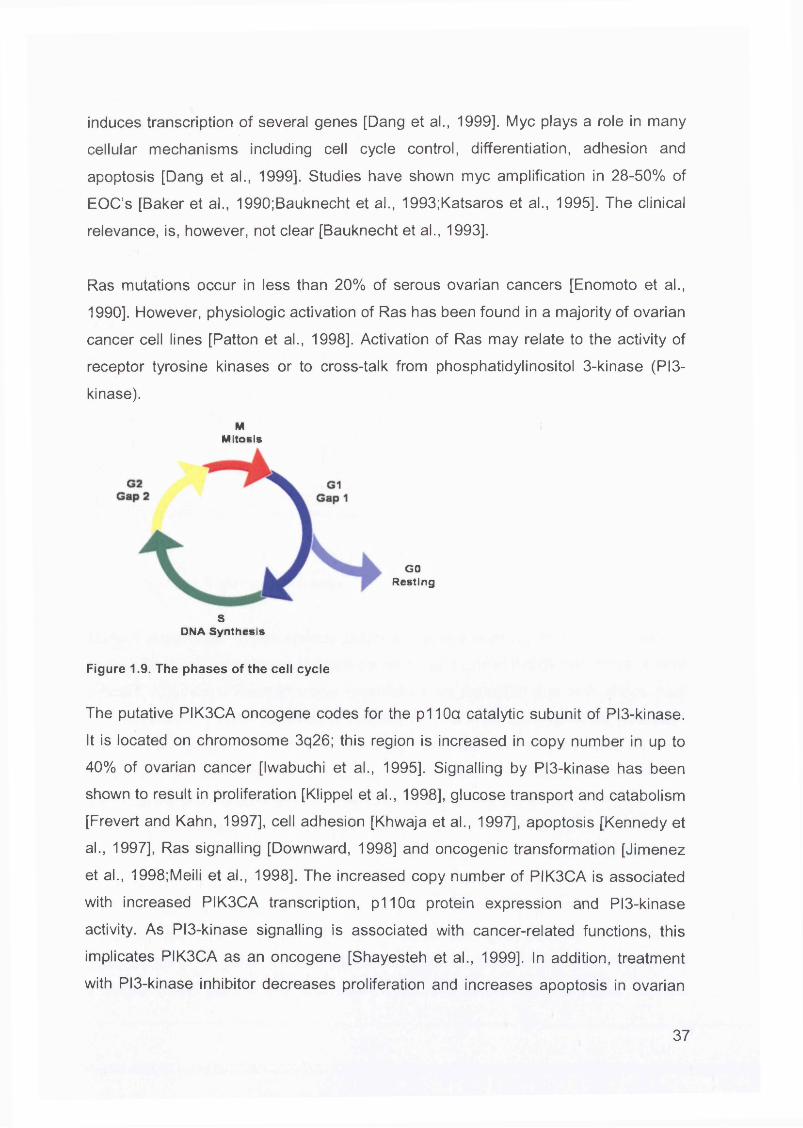
Figure 1.9. The phases of the cell cycle
The putative PIK3CA oncogene codes for the p110a catalytic subunit of PI3-kinase.
It is located on chromosome 3q26; this region is increased in copy number in up to
40% of ovarian cancer [Iwabuchi et al., 1995]. Signalling by PI3-kinase has been
shown to result in proliferation [Klippel et al., 1998], glucose transport and catabolism
[Frevert and Kahn, 1997], cell adhesion [Khwaja et al., 1997], apoptosis [Kennedy et
al., 1997], Ras signalling [Downward, 1998] and oncogenic transformation [Jimenez
et al., 1998;Meili et al., 1998]. The increased copy number of PIK3CA is associated
with increased PIK3CA transcription, p110a protein expression and PI3-kinase
activity. As PI3-kinase signalling is associated with cancer-related functions, this
implicates PIK3CA as an oncogene [Shayesteh et al., 1999]. In addition, treatment
with PI3-kinase inhibitor decreases proliferation and increases apoptosis in ovarian
37
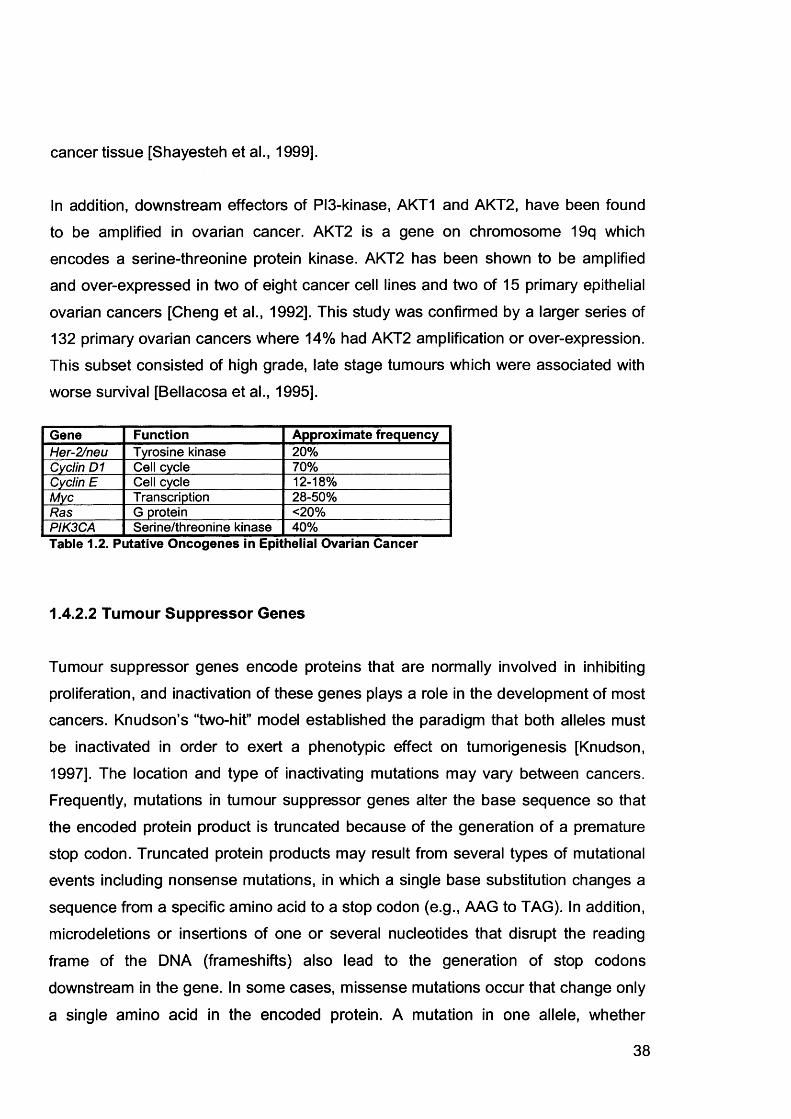
cancer tissue [Shayesteh et al., 1999].
In addition, downstream effectors of PI3-kinase, AKT1 and AKT2, have been found
to be amplified in ovarian cancer. AKT2 is a gene on chromosome 19q which
encodes a serine-threonine protein kinase. AKT2 has been shown to be amplified and over-expressed in two of eight cancer cell lines and two of 15 primary epithelial
ovarian cancers [Cheng et al., 1992]. This study was confirmed by a larger series of
132 primary ovarian cancers where 14% had AKT2 amplification or over-expression.
This subset consisted of high grade, late stage tumours which were associated with
worse survival [Bellacosa et al., 1995].
Gene Function Approximate frequencyHer-2/neu Tyrosine kinase 20%Cyclin D1 Cell cycle 70%Cyclin E Cell cycle 12-18%Myc Transcription 28-50%Ras G protein <20%PIK3CA Serine/threonine kinase 40%Table 1.2. Putative Oncogenes in Epithelial Ovarian Cancer
1.4.2.2 Tumour Suppressor Genes
Tumour suppressor genes encode proteins that are normally involved in inhibiting
proliferation, and inactivation of these genes plays a role in the development of most
cancers. Knudson’s “two-hit” model established the paradigm that both alleles must
be inactivated in order to exert a phenotypic effect on tumorigenesis [Knudson,1997]. The location and type of inactivating mutations may vary between cancers.
Frequently, mutations in tumour suppressor genes alter the base sequence so that
the encoded protein product is truncated because of the generation of a premature
stop codon. Truncated protein products may result from several types of mutational
events including nonsense mutations, in which a single base substitution changes a
sequence from a specific amino acid to a stop codon (e.g., AAG to TAG). In addition,
microdeletions or insertions of one or several nucleotides that disrupt the reading
frame of the DNA (frameshifts) also lead to the generation of stop codons
downstream in the gene. In some cases, missense mutations occur that change only
a single amino acid in the encoded protein. A mutation in one allele, whether
38
germline or somatic, is revealed after somatic inactivation of the homologous wild-
type allele. In theory, the same spectrum of mutational events could contribute to
inactivation of the second allele, but what is typically observed in tumours is homozygosity or hemizygosity for the first mutation, indicating “loss” of the wild-type
allele. The loss of the heterozygosity (LOH) has become recognised as the hallmark
of tumour suppressor gene inactivation (see later).
The p53 tumour suppressor gene maps to chromosome 17p13.1 and encodes a
nuclear phosphoprotein. P53 is considered the guardian of the genome because of
its role in activating genes involved in growth arrest or apoptosis following DNA
damage [Lane, 1992]. Alteration of the p53 gene is the most common molecular event in ovarian cancer [Casey et al., 1996;Hartmann et al., 1994;Berchuck et al.,
1994]. In a normal cell, p53 regulates transcription of other genes involved in cell
cycle arrest, such as p21. P53 is usually inactivated according to Knudson’s “two-hit”
model. This leads in the majority of cases to missense mutations that change a
single amino acid in the DNA binding domain of the p53 gene, and on to over
expression of non-functional p53 protein. The rate of p53 mutation varies with the
stage of disease; 10-20% of stage I/ll cancers have the mutation, compared to 40- 60% at advanced stages (lll/IV). The increased rate of p53 over-expression in late
stage tumours may signify that this is a late event in ovarian carcinogenesis, and where p53 is over-expressed it is associated with a worse prognosis [Marks et al.,
1991;Reles et al., 2001]. However, the evidence is conflicting with some studies not confirming this result.
The RB1 (retinoblastoma) protein (pRb) acts as a critical cell cycle regulator. In its
hypophosphorylated, active form, pRb binds to the E2F transcription factor and
prevents the cell from entering S phase [Gillett and Barnes, 1998]. However, following phosphorylation by cyclin D1 and cyclin-dependent kinases (CDKs) and the
subsequent release of E2F, the inhibitory effect of pRb is removed allowing
progression from the G1 to S phase of the cell cycle. 30-52% of ovarian tumours
demonstrate LOH at the RB1 locus, but express wild-type protein [Dodson et al.,
1994;Kim et al., 1994;Li et al., 1991]. These data suggest that either RB1 is
inactivated without affecting protein levels, or that a second suppressor gene lies
39
close to the RB1 gene. A definitive role for RB1 in ovarian cancer remains to be
determined.
The tumour suppressor gene CDKN2A, located on chromosome 9p21, encodes the
cell cycle regulatory protein p16. Inactivation of the CDKN2A gene could lead to
uncontrolled cell growth. Defects of the 'Rb/cyclin D1/p16 pathway' have been shown
to play a critical role in the development of virtually all human malignancies. A significant positive association has been reported between p16 expression and
clinical outcome for epithelial ovarian cancer patients. P16 acts by inhibiting binding
between CDK4 and CDK6 and the D cyclins. This results in hypophosphorylation of
pRb and causes cell cycle arrest at G1 phase. Homozygous deletion of p16 have
been reported in 12-18% of ovarian tumours [Kudoh et al., 2002;lchikawa et al.,
1996]. There is evidence that p16 inactivation in primary serous papillary tumours
occurs by methylation [Niederacher et al., 1999]. However, other studies have failed to find any methylation in these cancers [Ichikawa et al., 1996;Ryan et al., 1998].
These data suggest that the CDKN2A gene is involved in the tumorigenesis of ovarian cancer, but the exact mechanism of CDKN2A gene inactivation in serous papillary ovarian cancer remains unclear.
PTEN (phosphatase and tensin homolog deleted on chromosome ten), a tumour suppressor gene located on chromosome 10q23, is also known as MMAC1 (mutated
in multiple advanced cancers) and TEPI (TGFIJ-regulated and epithelial cell-enriched phosphatase). PTEN encodes a protein that functions as a dual-specificity phosphatase in vitro [Myers et al., 1997], thereby recognising and dephosphorylating
tyrosine and serine/threonine residues. PTEN is involved in the PI3-kinase-mediated
growth signalling pathway [Maehama and Dixon, 1998], anoikis [Di Cristofano and Pandolfi, 2000], inhibition of cell adhesion, integrin-mediated cell migration and
tumour invasion [Tamura et al., 1999a;Tamura et al., 1999b;Gu et al., 1999]. LOH at the PTEN locus has been reported in 28% of serous and 43% of endometrioid
ovarian cancers [Obata and Hoshiai, 2000;Kurose et al., 2001]. These data suggest
that PTEN may play a role in carcinogenesis of a subset of ovarian tumours.
The ARHI (ras homologue gene family, member I) gene, previously known as
40
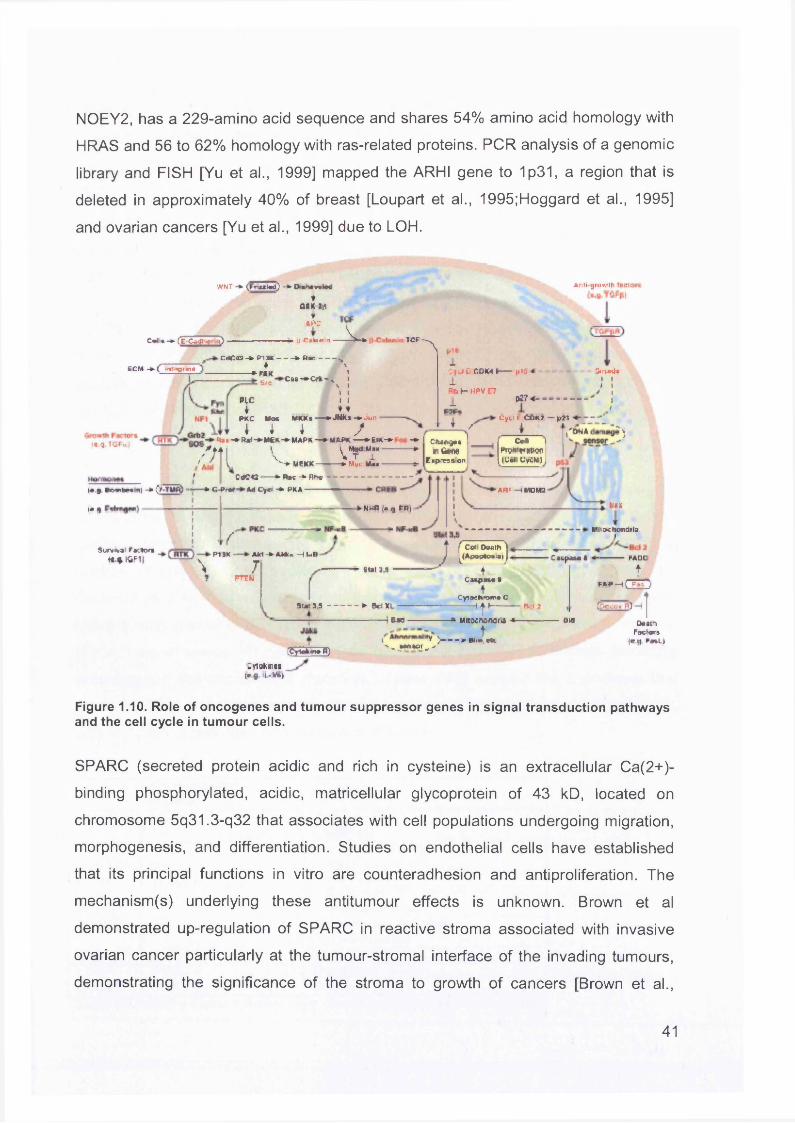
N0EY2, has a 229-amino acid sequence and shares 54% amino acid homology with
HRAS and 56 to 62% homology with ras-related proteins. PCR analysis of a genomic
library and FISH [Yu et al., 1999] mapped the ARHI gene to 1p31, a region that is
deleted in approximately 40% of breast [Loupart et al., 1995;Hoggard et al., 1995]
and ovarian cancers [Yu et al., 1999] due to LOH.
C*n* -*• Cz Cadi * 0
(CM ■* ( Inl'^i «i«
'■VNT - * (Framad) * D«n«v«Ucf
*asK ai>.ic ^
► J-C ntcn in - i TCFA
s «
CdCTO-A P lM C A D w --------♦ \ *■ r i x 1-CM-*Crt('% I\ I 1 I
PLC I Ir ♦♦
P *C Woe MfcKs — A JNKa -A Jar
I I I sR ». -A »rn -A MfcK -A M A P * — A M A P * — » S K - » ■ -A I C f tM f lM
1 ~a ridnw. Exp-ea»on
||1«1C fJ u .C O M t p tli •1Rb ( - HPV E7 1 <*7«~
Cyci i: Cftk*' t\
A nliijrtw .-IF
SmAdi I l t I
;/
— p i i
{C-9* TGFu’t
m v , _ _ i• C tfte — *>ftrc -*■ Rho
y fttod MnxT l
Mvu U » -
CMrrowtnrtwnI Loll UyCM)
'ON* )
» g Sr>wibr« n| -A > T M R ) ■] • GJ>rot Ad C yo -A P A A -
( • 9 •
S u r v * j i Facto**-»C.».KiF1J \
f•P 11K -
PTEN
- AM -» AMt« H U B
7
-ANw n>qPR|-* | J —
'AR F-IM O M 2
Sim 3,5 J f Cot Doath ^ ,jApogto»*l J h
* . mux■ MitochondriaL
3(«l 3 ,5 -------------a Bel XL* i o»o ■
[CYlafcowR)
"V )--- *w,«V% , JMMOJ _ >
IC acpaM »
ICytochrome c
I | t -------------R.I 7
>• Mitacrwnora * -----------
t
■ Caspasa * -----------FADC
ff»p- iCEHjecoy fQ
ow OaatnFactors1* 9- F«*L)
Ltrtofcwcs;e u -V&)
Figure 1.10. Role of oncogenes and tumour suppressor genes in signal transduction pathways and the cell cycle in tumour cells.
SPARC (secreted protein acidic and rich in cysteine) is an extracellular Ca(2+)-
binding phosphorylated, acidic, matricellular glycoprotein of 43 kD, located on
chromosome 5q31.3-q32 that associates with cell populations undergoing migration,
morphogenesis, and differentiation. Studies on endothelial cells have established
that its principal functions in vitro are counteradhesion and anti proliferation. The
mechanism(s) underlying these antitumour effects is unknown. Brown et al
demonstrated up-regulation of SPARC in reactive stroma associated with invasive
ovarian cancer particularly at the tumour-stromal interface of the invading tumours,
demonstrating the significance of the stroma to growth of cancers [Brown et al.,
41
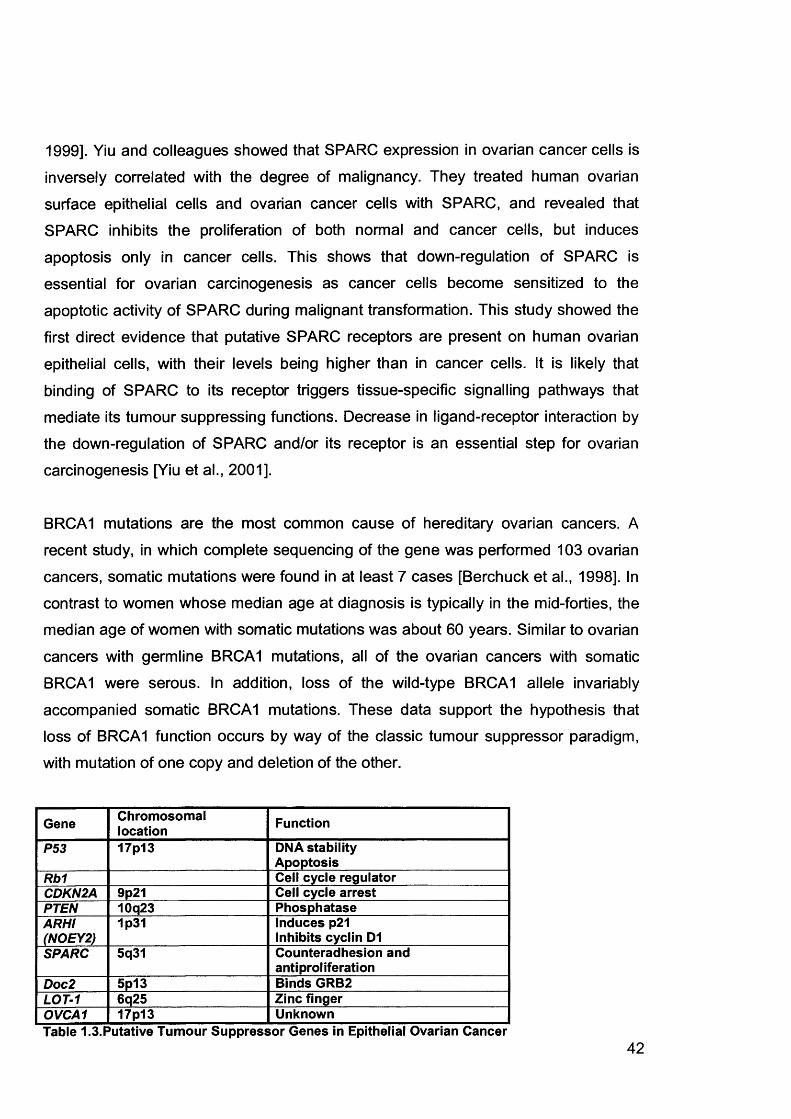
1999]. Yiu and colleagues showed that SPARC expression in ovarian cancer cells is
inversely correlated with the degree of malignancy. They treated human ovarian
surface epithelial cells and ovarian cancer cells with SPARC, and revealed that
SPARC inhibits the proliferation of both normal and cancer cells, but induces apoptosis only in cancer cells. This shows that down-regulation of SPARC is
essential for ovarian carcinogenesis as cancer cells become sensitized to the
apoptotic activity of SPARC during malignant transformation. This study showed the
first direct evidence that putative SPARC receptors are present on human ovarian
epithelial cells, with their levels being higher than in cancer cells. It is likely that
binding of SPARC to its receptor triggers tissue-specific signalling pathways that mediate its tumour suppressing functions. Decrease in ligand-receptor interaction by
the down-regulation of SPARC and/or its receptor is an essential step for ovarian
carcinogenesis [Yiu et al., 2001].
BRCA1 mutations are the most common cause of hereditary ovarian cancers. A
recent study, in which complete sequencing of the gene was performed 103 ovarian
cancers, somatic mutations were found in at least 7 cases [Berchuck et al., 1998]. In
contrast to women whose median age at diagnosis is typically in the mid-forties, the median age of women with somatic mutations was about 60 years. Similar to ovarian
cancers with germline BRCA1 mutations, all of the ovarian cancers with somatic
BRCA1 were serous. In addition, loss of the wild-type BRCA1 allele invariably
accompanied somatic BRCA1 mutations. These data support the hypothesis that loss of BRCA1 function occurs by way of the classic tumour suppressor paradigm, with mutation of one copy and deletion of the other.
Gene Chromosomallocation Function
P53 17p13 DNA stability Apoptosis
Rb1 Cell cycle regulatorCDKN2A 9p21 Cell cycle arrestPTEN 10q23 PhosphataseARHI 1p31 Induces p21(NOEY2) Inhibits cyclin D1SPARC 5q31 Counteradhesion and
antiproliferationDoc2 5p13 Binds GRB2LOT-1 6q25 Zinc fingerOVCA1 17p13 UnknownTable 1.3.Putative Tumour Suppressor Genes in Epithelial Ovarian Cancer
42
1.4.3 Cytogenetic Alterations
There are genetic changes at the chromosomal as well as the molecular level.
Comparative genomic hybridisation (CGH) studies have demonstrated that most
ovarian cancers have chromosomal gains, losses and complex translocations often
of large segments of chromosomes. Gains on chromosomes 3 and 8, and losses on
chromosomes 16 and 17 are the most common karyotypic findings in ovarian cancer
[Iwabuchi et al., 1995]. Chromosome regions frequently affected with allelic imbalance include 1p [Chenevix-Trench et al., 1992], 2q [Saretzki et al., 1997], 3p
[Lounis et al., 1998], 5q [Tavassoli et al., 1996], 6q25 [Colitti et al., 1998], 7q31
[Zenklusen et al., 1995], 9p [Devlin et al., 1996], 11 p15 [Lu et al., 1997], 11 q
[Launonen et al., 1998], 12p12 [Hatta et al., 1997], 13q [Yang-Feng et al., 1992], 17q12 [Foulkes et al., 1993], 18q [Saretzki et al., 1997], 19q [Bicher et al., 1997], 22q
[Englefield et al., 1994], and Xq [Choi et al., 1997]. There are differences between
serous adenocarcinomas and the other histological subtypes. Serous tumours mostly
have gains at 1q and 11q, whereas endometrioid tumours have gains at 1q and 10q,
and mucinous have gains at 17q. Once the areas of chromosomal abnormality are pinpointed, molecular techniques such as LOH studies using microsatellite markers
can be applied to narrow the target to the gene-locus level. These regions of
recurrent abnormality are thought to encode genes involved in ovarian carcinogenesis when differentially expressed as a result of abnormal copy number or
mutation. Certain oncogenes and tumour suppressor genes have been identified in
several regions of allelic imbalance, and specific karyotypic abnormalities have been
associated with clinical outcome [Saretzki et al., 1997;Launonen et al., 1998;Schwab
and Amler, 1990], although it is unclear whether the extent of these genetic alterations reflects the inactivation of multiple tumour suppressor genes or whether it
is the result of generalised instability of the genome. Many studies have consistently
shown that poorly differentiated, late stage tumours have more genetic alterations
than well differentiated, early stage or LMP tumours [Iwabuchi et al., 1995;Dodson et
al., 1993]. This could be due to an accumulation of genetic changes during the
evolution of a tumour, or it could be that late stage, high-grade cancers are more
aggressive even early in their development due to specific mutations or increased
genomic instability. If the latter theory is correct, then this could have significant
43
implications for screening, as cancers which are inherently more aggressive are
more likely to metastasise confer a worse prognosis.
1.4.4 Peptide Growth Factors
Growth factors are produced by many different cell types and exert their effects via
autocrine and paracrine mechanisms. They function as stimulators or inhibitors of the
division, differentiation and migration of cells and are involved in carcinogenesis, in
which they influence a variety of functions including cell proliferation, cell invasion,
metastasis formation, angiogenesis, local immune system functions and extracellular
matrix synthesis.
The EGF-related peptides have been the most extensively studied in ovarian cancer. EGF, transforming growth factor (TGF)-a and amphiregulin bind to, and activate, the
EGF receptor (EGFR). All three factors have been identified in ovarian tumours and
cultured ovarian cancer cells. Studies have shown TGF-a to be present in 50-100%,
EGF in 28-71% and amphiregulin in 18% of ovarian cancers [Kommoss et al., 1990;Morishige et al., 1991;Owens et al., 1991b;Kohler et al., 1992;Stromberg et al.,
1994]. TGF-a has been detected in the sera of 62% of women with ovarian cancers
compared with 28% with benign ovarian tumours and 11% of normal female controls [Chien et al., 1997]. Similarly, TGF-a has been detected in the urine of 79% of
ovarian cancer patients compared with 17% of patients with benign tumours and 23% of controls [Feldkamper et al., 1994].
The EGFR, a glycosylated membrane-spanning protein, has been found to be
present in 33-75% of primary ovarian tumours by ligand binding [Bauknecht et al.,
1988;Battaglia et al., 1989;Morishige et al., 1991;Owens et al., 1991a] and by
immunohistochemistry [Berchuck et al., 1991;Henzen-Logmans et al., 1992;Owens
et al., 1992]. Levels of EGFR are higher in malignant than benign tumours or normal
ovary, suggesting a possible role in malignant progression, and are related to poor
prognosis [Bauknecht et al., 1988;Battaglia et al., 1989;Berchuck et al., 1991].
The TGF-p family are involved in cell growth regulation, angiogenesis and tissue
44
remodelling. TGF-p peptides have an inhibitory rather than stimulatory role. They
have been shown to inhibit the growth of both ovarian cancer cells (by 95%),
immortalised ovarian cancer cell lines [Berchuck et al., 1990;Marth et al., 1992;Bartlett et al., 1992;Jozan et al., 1992] and normal ovarian epithelial cells grown
in culture [Hurteau et al., 1994]. It has been suggested that TGF-p is an important regulator of normal ovarian epithelium and autocrine inhibition may be lost in many
cancer cell lines. Some ovarian cancers that are growth-inhibited by TGF-p are also
more likely to undergo apoptosis [Havrilesky et al., 1995].
Inhibin, another member of the TGF- p family, is increased in the sera of patients
with EOC and is associated with increased survival [Blaakaer et al., 1993;Cooke et
al., 1995].
The insulin-like growth factors (IGF), IGF-I and IGF-II are important mitogenic growth
factors which show close structural homology to insulin [Barreca and Minuto, 1989].
The IGFs, IGF receptors (insulin, type I and type II receptors) and IGF binding proteins (IGFBPs) have been identified in many ovarian tumours [Beck et al.,
1994;van Dam et al., 1994;Weigang et al., 1994] and ovarian cancer cell lines
[Resnicoff et al., 1993;Hofmann et al., 1994] and have a stimulatory effect. As both
IGF-I and its receptor are co-expressed, and autocrine mechanism can be postulated. IGFBP-2 levels have been shown to be high in sera of ovarian cancer
patients [Flyvbjerg et al., 1997] and in malignant ovarian cyst fluid [Karasik et al., 1994] and correlate with aggressiveness of the tumour.
Platelet-derived growth factor (PDGF) expression is elevated in ovarian cancers and
undetectable in normal ovaries and benign tumours [Henriksen et al., 1993;Versnel
et al., 1994]. Tumours expressing the PDGF receptor are associated with shorter
overall survival [Henriksen et al., 1993]. The concomitant expression of both PDGF and its receptor is related to disease progression, suggesting autocrine growth
regulation.
Basic fibroblast growth factor (bFGF) and its receptor are both expressed in ovarian
cancer cells, again suggesting an autocrine mechanism, and function in a stimulatory
45
manner [Crickard et al., 1994]. FGFs stimulate both mitogenesis and angiogenesis.
In summary, ovarian cancers produce and respond to many peptide growth factors such as epidermal growth factor, transforming growth factor-a, insulin-like growth
factors, platelet-derived growth factor and basic fibroblast growth factor. The concomitant over-expression of both growth factor and receptor suggests an
autocrine stimulatory mechanism. However, as normal ovarian epithelial cells also
produce and respond to the same peptide growth factors found in ovarian cancer
cells, it is unclear whether these growth factors play a role in the development of
tumours or merely maintain cell growth once tumours are established.
1.4.5 Metastasis Suppressor Genes
1.4.5.1 E-Cadherin (CDH1)
E-cadherin is a transmembrane glycoprotein, which, through its attachment to the
actin cytoskeleton via a, ft and y-catenin, functions as a cell adhesion molecule. Loss
of functional E-cadherin or catenin is associated with ability of cancer cells to detach from the primary tumour, thereby facilitating metastasis progression. E-cadherin
(CDH1) mutations are rare in ovarian cancer [Risinger et al., 1994]. CDH1 protein
expression is reduced in poorly differentiated ovarian tumours and ovarian cancer
metastases compared with primary tumours, implying that loss of CDH1 correlates
with acquired invasive and metastatic potential [Davies et al., 1998]. The CDH1 pathway may potentially be disrupted via mutations in the catenin genes, and
missense mutations of ft-catenin have been reported in endometrioid ovarian
tumours but rarely in other histological subtypes [Gamallo et al., 1999;Wright et al., 1999]. Reduction or absence of either ft- or a-catenin expression in ovarian tumours
is associated with increased metastatic potential and poor prognosis [Davies et al.,
1998].
1.4.5.2 Nm23 (NME1 & 2)
The nm23-H1 (NME1) and nm23-H2 (NME2) genes are located on chromosome
46
17q21.3 and encode nucleoside diphosphate kinase A and B respectively. These
proteins catalyse the phosphorylation of nucleoside diphosphates using ATP, resulting in the production of the corresponding nucleoside triphosphates [Lombardi
et al., 2000]. Reduced expression of NME1 and NME2 is associated with a highly
metastatic phenotype in ovarian tumours and cell lines [Simone et al., 2001 ;Tas et
al., 2002;Galani et al., 2002]. NME1 may also be important in the progression of
ovarian tumours as reduced NME1 expression is associated with late stage disease lymph node involvement and distant metastasis [Mandai et al., 1994].
1.4.6 Cell Survival and Cell Death Pathways
1.4.6.1 Senescence
Normal somatic cells can undergo division only a finite number of times, and after a
certain number of doublings, undergo senescence. This is characterised by arrest of
proliferation without loss of biochemical function or viability. The maximum number of
doublings has often been referred to as the “Hayflick limit”, that is, there is a counting
mechanism or “molecular clock” which can trigger senescence at the appropriate time. Cellular senescence is due to the shortening of repetitive DNA sequences
(TTAGGG) called telomeres that cap the ends of each chromosome. Telomeres
stabilise chromosomes and prevent recombination during mitosis. Chromosomes
have long telomeric sequences at birth, which then become progressively shorter each time the cell divides. Cancer cells must bypass senescence in order to gain the
ability to replicate an unlimited number of times, and undergo immortalisation, and
essential step in malignant transformation of normal cells. They accomplish this by
inducing the expression of telomerase which acts to lengthen the telomeres [Shay,
1998]. Telomerase is a ribonudeoprotein whose RNA acts as a template for telomere
extension and the protein catalyses the synthesis of new telomeric repeats.
The expression of telomerase is limited to those cells actively dividing, so it has been
suggested that telomerase would be a useful diagnostic marker in patients with
cancer. Researchers have demonstrated that telomerase activity is detectable in
most ovarian cancers [Duggan et al., 1998;Wan et al., 1997]. It has been suggested
47
that persistence of telomerase activity in peritoneal washings after primary therapy
for advanced ovarian cancer may predict the presence of microscopic residual
disease in some cases even when the cytological washings and biopsies are negative. More studies are required before this is demonstrated as a feasible clinical
tool.
1.4.6.2 Apoptosis
Apoptosis plays a vital role in a variety of human diseases, including cancer. It is an
active, energy-dependent process that involves endonuclease and protease
cleavage of DNA and proteins. Morphologically it is characterised by cytoplasmic
shrinkage, active membrane blebbing, chromatin condensation and fragmentation
into membrane-enclosed vesicles [Kerr et al., 1972;Wyllie et al., 1980]. This is
different to necrosis which is characterised by loss of osmoregulation and cellular
fragmentation. Because the balance between cell proliferation and cell death controls
the size of a cell population, tumour growth can result from either increased
proliferation or decreased apoptosis. Suppression of apoptosis can lead to cells
becoming malignant by allowing the accumulation of genetic mutations, growth factor-independent tumour cell growth, and escape from cell-cycle checkpoints which
would normally induce apoptosis.
An important role of apoptosis is to eliminate cells which have undergone mutation,
thereby preventing malignant transformation. When cells are exposed to mutagens
such as radiation, the cell cycle is arrested so that DNA repair may take place. If the
DNA cannot be repaired, then apoptosis has to occur to remove any abnormal cells
before they become malignant. The p53 tumour suppressor gene plays a critical part
in regulation of cell cycle arrest and apoptosis. Other genes involved in this process
include bcl-2, which was first identified at a translocation breakpoint in B-cell lymphomas. Bcl-2 expression inhibits apoptosis although paradoxically, the
continued expression of bcl-2 in ovarian cancers is associated with a good prognosis [Herod et al., 1996;Henriksen et al., 1995]. The bcl-XL expression (a structural and
functional homologue of bcl-2) also inhibits apoptosis in ovarian cancer cells in
response to chemotherapy [Liu et al., 1998]. Other related genes such as bax and
48
bcl-XS are pro-apoptotic. Studies have found high bax expression in primary ovarian
cancers, and this was associated with a good response to chemotherapy [Tai et al.,
1998].
1.4.6.3 Proliferation
Increased proliferation is a hallmark of cancer cells. Proliferation can be measured by
assessing the DNA content of cells or by immunohistochemical staining Ki67 or
proliferative cell nuclear antigen (PCNA), which are proteins expressed by
proliferating cells. Ki67 is expressed in G1, S and G2 phases of the cell cycle but not
in GO cells. Ki67 correlates with poor survival in ovarian cancer [Anttila et al., 1998].
1.4.6.4 DNA Index
Aneuploidy is present in most malignant tumours and in many early stage
carcinomas. It is defined as cells with chromosome numbers greater or smaller than the normal diploid complement. A variety of methods have been used to demonstrate
aneuploidy including karyotyping [Wang et al., 2000], flow cytometry [Eissa et al.,
1998], image analysis [Guidozzi et al., 1996] and fluorescence in situ hybridisation
(FISH) [Mark et al., 1999]. Many groups have investigated the value of ploidy in
ovarian cancer. Advanced stage (I I I/I V), poorly differentiated tumours are aneuploid
in 65-90% of cases and aneuploid tumours have an aggressive clinical course and a poor outcome [Ozalp et al., 2001 ;But and Gorisek, 2000]. Aneuploidy is present early
during tumour progression [Skirnisdottir et al., 2001] and it appears that the altered
DNA content, and its underlying cause, may play a role in both the development and
progression of ovarian tumours. Therefore although the DNA index may not be
predictive in patients with advanced stage ovarian carcinoma, it may help predict the
risk of recurrence in patients with early-stage disease as these tumours are less commonly aneuploid [Schueler et al., 1996].
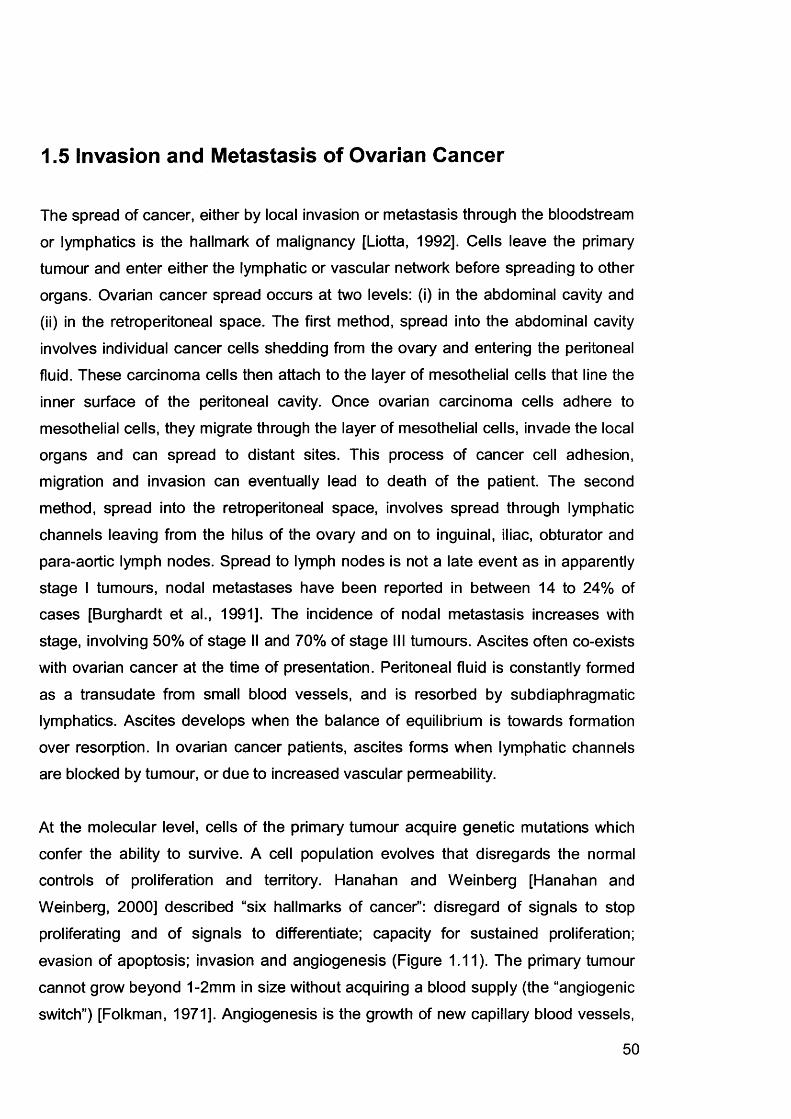
1.5 Invasion and Metastasis of Ovarian Cancer
The spread of cancer, either by local invasion or metastasis through the bloodstream
or lymphatics is the hallmark of malignancy [Liotta, 1992]. Cells leave the primary tumour and enter either the lymphatic or vascular network before spreading to other
organs. Ovarian cancer spread occurs at two levels: (i) in the abdominal cavity and
(ii) in the retroperitoneal space. The first method, spread into the abdominal cavity
involves individual cancer cells shedding from the ovary and entering the peritoneal
fluid. These carcinoma cells then attach to the layer of mesothelial cells that line the
inner surface of the peritoneal cavity. Once ovarian carcinoma cells adhere to
mesothelial cells, they migrate through the layer of mesothelial cells, invade the local
organs and can spread to distant sites. This process of cancer cell adhesion, migration and invasion can eventually lead to death of the patient. The second
method, spread into the retroperitoneal space, involves spread through lymphatic
channels leaving from the hilus of the ovary and on to inguinal, iliac, obturator and
para-aortic lymph nodes. Spread to lymph nodes is not a late event as in apparently stage I tumours, nodal metastases have been reported in between 14 to 24% of cases [Burghardt et al., 1991]. The incidence of nodal metastasis increases with
stage, involving 50% of stage II and 70% of stage III tumours. Ascites often co-exists with ovarian cancer at the time of presentation. Peritoneal fluid is constantly formed
as a transudate from small blood vessels, and is resorbed by subdiaphragmatic lymphatics. Ascites develops when the balance of equilibrium is towards formation over resorption. In ovarian cancer patients, ascites forms when lymphatic channels
are blocked by tumour, or due to increased vascular permeability.
At the molecular level, cells of the primary tumour acquire genetic mutations which
confer the ability to survive. A cell population evolves that disregards the normal controls of proliferation and territory. Hanahan and Weinberg [Hanahan and
Weinberg, 2000] described “six hallmarks of cancer”: disregard of signals to stop
proliferating and of signals to differentiate; capacity for sustained proliferation;
evasion of apoptosis; invasion and angiogenesis (Figure 1.11). The primary tumour
cannot grow beyond 1-2mm in size without acquiring a blood supply (the “angiogenic
switch”) [Folkman, 1971]. Angiogenesis is the growth of new capillary blood vessels,
50
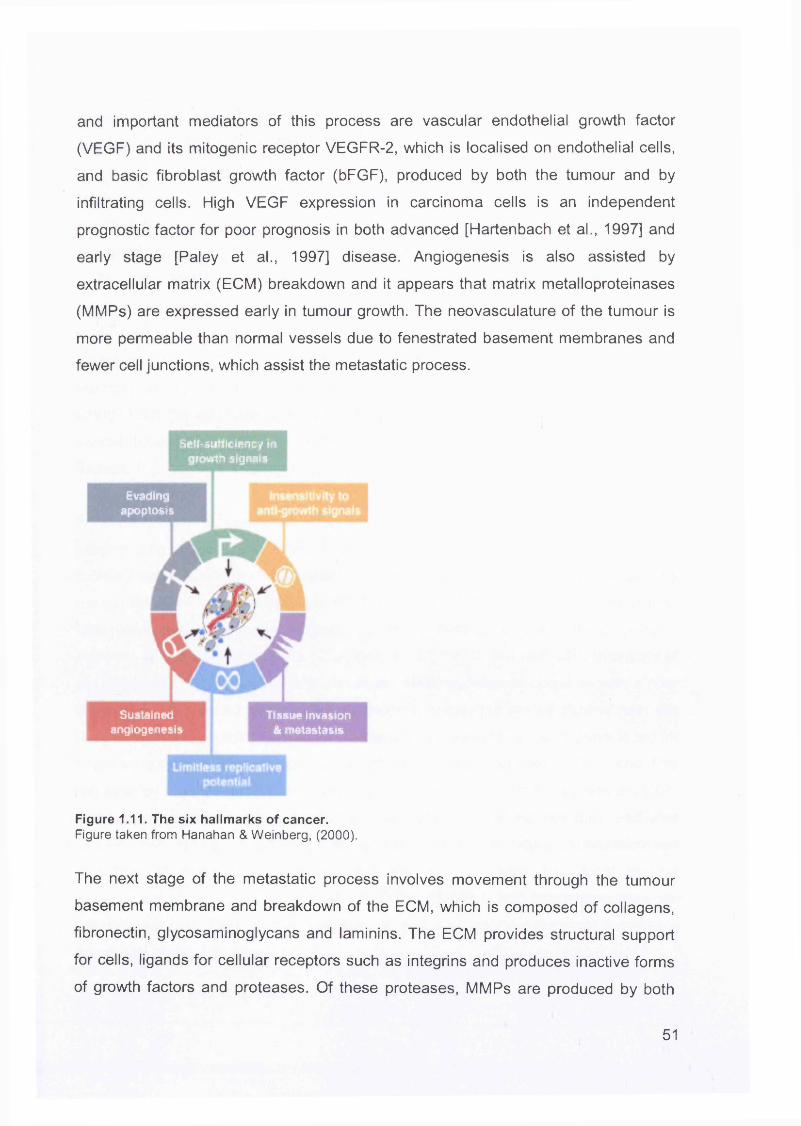
and important mediators of this process are vascular endothelial growth factor
(VEGF) and its mitogenic receptor VEGFR-2, which is localised on endothelial cells,
and basic fibroblast growth factor (bFGF), produced by both the tumour and by
infiltrating cells. High VEGF expression in carcinoma cells is an independent
prognostic factor for poor prognosis in both advanced [Hartenbach et al., 1997] and
early stage [Paley et al., 1997] disease. Angiogenesis is also assisted by
extracellular matrix (ECM) breakdown and it appears that matrix metalloproteinases
(MMPs) are expressed early in tumour growth. The neovasculature of the tumour is
more permeable than normal vessels due to fenestrated basement membranes and
fewer cell junctions, which assist the metastatic process.
Self-sufficiency in growth signets
Evadingapoptosis
Sustainedangiogenesis
Tissue invasion & metastasis
Figure 1.11. The six hallmarks of cancer.Figure taken from Hanahan & Weinberg, (2000).
The next stage of the metastatic process involves movement through the tumour
basement membrane and breakdown of the ECM, which is composed of collagens,
fibronectin, glycosaminoglycans and laminins. The ECM provides structural support
for cells, ligands for cellular receptors such as integrins and produces inactive forms
of growth factors and proteases. Of these proteases, MMPs are produced by both
51
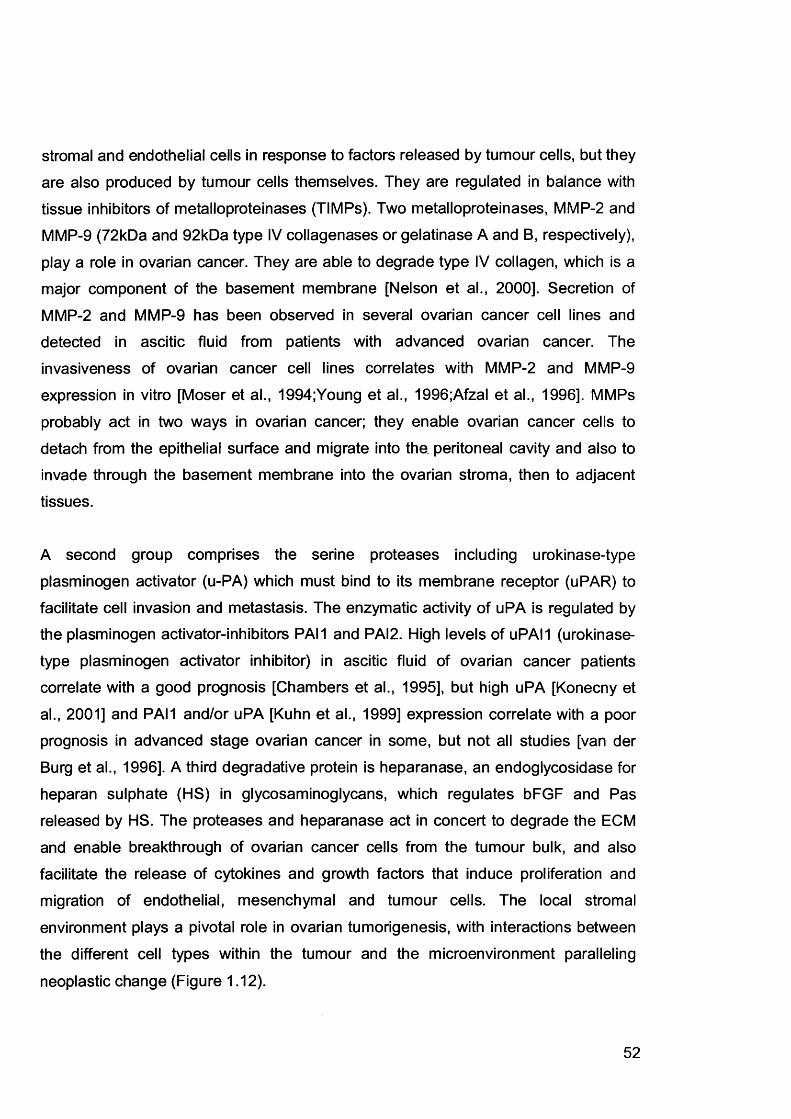
stromal and endothelial cells in response to factors released by tumour cells, but they
are also produced by tumour cells themselves. They are regulated in balance with tissue inhibitors of metalloproteinases (TIMPs). Two metalloproteinases, MMP-2 and
MMP-9 (72kDa and 92kDa type IV collagenases or gelatinase A and B, respectively),
play a role in ovarian cancer. They are able to degrade type IV collagen, which is a major component of the basement membrane [Nelson et al., 2000]. Secretion of
MMP-2 and MMP-9 has been observed in several ovarian cancer cell lines and
detected in ascitic fluid from patients with advanced ovarian cancer. The
invasiveness of ovarian cancer cell lines correlates with MMP-2 and MMP-9
expression in vitro [Moser et al., 1994;Young et al., 1996;Afzal et al., 1996]. MMPs
probably act in two ways in ovarian cancer; they enable ovarian cancer cells to
detach from the epithelial surface and migrate into the peritoneal cavity and also to invade through the basement membrane into the ovarian stroma, then to adjacent
tissues.
A second group comprises the serine proteases including urokinase-type
plasminogen activator (u-PA) which must bind to its membrane receptor (uPAR) to
facilitate cell invasion and metastasis. The enzymatic activity of uPA is regulated by the plasminogen activator-inhibitors PAI1 and PAI2. High levels of uPAH (urokinase-
type plasminogen activator inhibitor) in ascitic fluid of ovarian cancer patients correlate with a good prognosis [Chambers et al., 1995], but high uPA [Konecny et
al., 2001] and PAH and/or uPA [Kuhn et al., 1999] expression correlate with a poor
prognosis in advanced stage ovarian cancer in some, but not all studies [van der
Burg et al., 1996]. A third degradative protein is heparanase, an endoglycosidase for
heparan sulphate (HS) in glycosaminoglycans, which regulates bFGF and Pas
released by HS. The proteases and heparanase act in concert to degrade the ECM
and enable breakthrough of ovarian cancer cells from the tumour bulk, and also
facilitate the release of cytokines and growth factors that induce proliferation and migration of endothelial, mesenchymal and tumour cells. The local stromal
environment plays a pivotal role in ovarian tumorigenesis, with interactions between
the different cell types within the tumour and the microenvironment paralleling
neoplastic change (Figure 1.12).
52
Invasion is characterised by cellular movement. Ovarian cancer cells move either by
passive translocation in response to mechanical pressure or by active migration. In
many ovarian epithelial tumours, E-cadherin (the adherens junction component) is
lost, leading to reduced cell-cell adhesion, enabling cells to detach and spread to the
peritoneum [Fujioka et al., 2001]. Low E-cadherin levels are strong markers of poor
prognosis [Herrera et al., 2002].
EndotheliumFibroblast
Immune cel
Stroma
membraneBasement
Epithelium
Epithelial cellsOCarcinoma cells
Figure 1.12. The interplay between epithelial tumour cells and the stroma.Figure taken from Liotta & Kohn, (2001).
The next stage of dissemination of malignant cells from the primary tumour to
adjacent tissue or to distant organs via lymphatics or the bloodstream is the hallmark
of metastasis. Metastasis is the leading cause of death in patients in most epithelial
malignancies. Haematogenous spread regulated by VEGF controlling angiogenesis
is well characterised. However, this is not the main route of spread for ovarian
cancer, and it is possible that lymphangiogenesis plays an even more important role.
VEGF is known to signal through two tyrosine kinase receptors, VEGFR-1 and
VEGFR-2, which are expressed primarily but not exclusively on vascular endothelial
cells. The field of lymphangiogenesis research gained momentum with the discovery
of a third VEGF receptor, VEGFR-3, which was found to be predominantly expressed
53
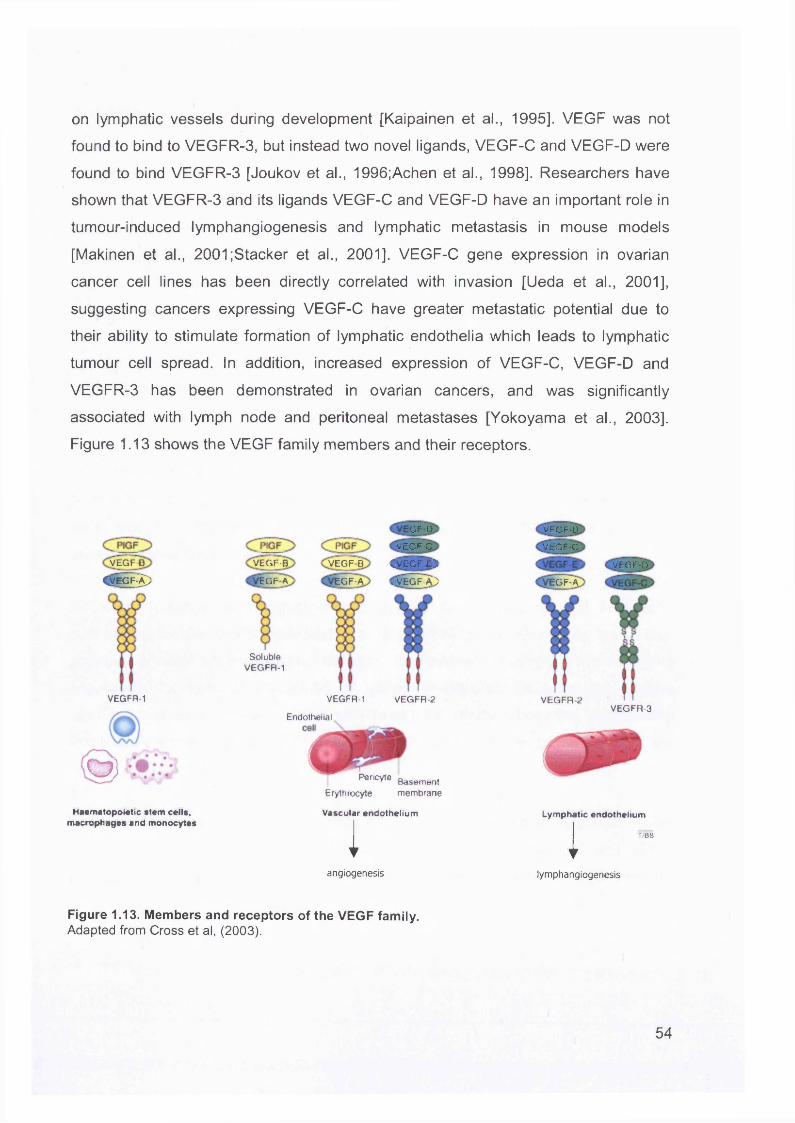
on lymphatic vessels during development [Kaipainen et al., 1995]. VEGF was not
found to bind to VEGFR-3, but instead two novel ligands, VEGF-C and VEGF-D were
found to bind VEGFR-3 [Joukov et al., 1996;Achen et al., 1998]. Researchers have
shown that VEGFR-3 and its ligands VEGF-C and VEGF-D have an important role in
tumour-induced lymphangiogenesis and lymphatic metastasis in mouse models
[Makinen et al., 2001;Stacker et al., 2001]. VEGF-C gene expression in ovarian
cancer cell lines has been directly correlated with invasion [Ueda et al., 2001],
suggesting cancers expressing VEGF-C have greater metastatic potential due to
their ability to stimulate formation of lymphatic endothelia which leads to lymphatic
tumour cell spread. In addition, increased expression of VEGF-C, VEGF-D and
VEGFR-3 has been demonstrated in ovarian cancers, and was significantly
associated with lymph node and peritoneal metastases [Yokoyama et al., 2003].
Figure 1.13 shows the VEGF family members and their receptors.
VEGrDCVEGF )
VEGFR-1
O )
Haematopoietic stem cells, macrophages and monocytes
GF-D
VECF-C
CVEGF-EVEGF-B VEGF B
vVEGF-A}EOF A EGF-A
SolubleVEGFR-1
VEGFR-1 VEGFR-2
Endothelial
* * * * Basement Erylhrocyte m embrane
V ascu lar e n d o th e liu m
1
VECF-D
VEGF-C
VEGF-D
GF-A
VEGFR-2VEGFR-3
Lymphatic endothelium
T/BS1angiogenesis lymphangiogenesis
Figure 1.13. Members and receptors of the VEGF family.Adapted from Cross et al, (2003).
54
1.6 Microarrays
1.6.1 Introduction
The completion of the human genome project will vastly increase our knowledge of
the genomic sequences of humans and the genes that they encode. Traditional techniques for detecting and quantitating gene expression levels include northern
blots [Alwine et al., 1977], S1 nuclease protection [Berk and Sharp, 1977], differential
display [Liang and Pardee, 1992], sequencing of cDNA libraries [Adams et al.,
1991;Okubo et al., 1992] and serial analysis of gene expression (SAGE) [Velculescu
et al., 1995]. These are both laborious and time consuming. With the advent of
microarray technology, the study of gene function has been revolutionised. The expression pattern of thousands of genes can be screened in parallel to give a gene-
expression or molecular profile of a certain cell or tissue. Microarray technology has been advancing rapidly in the past few years, and improvements have been made at
every step, including array production, probe manufacture, hybridisation, scanning,
data analysis and data mining.
A major challenge in the postgenomic age is the development of systematic approaches for identifying the biological function of all genes. Microarray technology
provides a major advance toward this goal. It provides a strategy to monitor gene expression for tens of thousands of genes in parallel. Because the relative
abundance of gene expression often reflects specific cellular processes, a sufficiently
large and diverse set of gene expression profiles from different tissue samples are
providing insight into gene functions.
Two main DNA microarray technologies have been developed to investigate gene
expression analysis. These are oligonucleotide-based microarrays and cDNA
microarrays. These are discussed and compared with emphasis on oligonucleotide
arrays.
55
1.6.2 Comparison Between Oligonucleotide and cDNA Arrays
The basic principle of both types of microarrays is the precise positioning of DNA fragments (probes) at high density on a solid support so that they can function as
molecular detectors. The probe refers to the DNA arrayed since it is equivalent to the probe used in a northern blot analysis. Every strand of nucleic acid has the capacity
to recognise complementary sequences through base pairing. Nucleic acid arrays
work on the principle that labelled RNA or DNA molecules in solution (target)
hybridise to DNA molecules attached at specific locations on a surface. This process
of hybridisation can be highly parallel; every RNA/DNA sequence can be investigated
simultaneously.
1.6.2.1 Probes
Probes for cDNA arrays are usually PCR products representing specific genes, with sequences generated from databases such as GenBank or UniGene, and partially
sequenced cDNAs (or ESTs) from any cDNA library of interest. The probes are
robotically printed on to glass slides or nylon membranes as spots at defined
locations, and are referred to as probe cells. The spots are 100-300pm in size, are spaced the same distance apart and contain one single length (up to 1,000 base pairs) of double-stranded DNA. Using this technique, glass substrates the size of a microscope slide can accommodate approximately 30,000 cDNAs.
Oligonucleotide arrays differ from spotted cDNA arrays in that they utilise short 20-
25-mer oligonucleotide lengths based on DNA sequences generated from a given
gene. These can either be synthesised in situ directly on to silicon wafers by photolithography (high-density oligonucleotide arrays from Affymetrix,
http://www.affymetrix.com) or presynthesised then printed on to glass slides. In the
case of photolithographically synthesised arrays, -107 copies of each selected
oligonucleotide are synthesised base by base in hundreds of thousands of different
24pm x 24pm areas on a 1.28 x 1.28 cm glass surface. Because oligonucleotide
arrays are designed and synthesised based only on information of the DNA
sequence, physical intermediates such as PCR products and cDNAs are not needed.
56
The 25mer oligonucleotides are designed so that they are as unique, sensitive and
sequence-specific as possible, and as dissimilar to other gene family members, other
genes and other RNAs which may be present in the sample (e.g. rRNAs, tRNAs and
mRNA). The arrays are designed in silico (designed by computer programs that select the best probes without cross hybridisation to other targets) negating the need
to prepare, verify, quantitate and catalogue a long list of PCR products and cDNAs.
In addition, because probes can be designed to represent the most unique part of a
particular transcript, it is possible to detect closely related genes and splice variants. For both types of array, the probes are designed from sequences near the 3’ end of
the gene (near the poly-A tail in eukaryotic mRNA) in order to decrease problems
with RNA degradation.
An important feature of oligonucleotide arrays is probe redundancy, where the same
gene has many oligonucleotides with different sequences designed to hybridise to it.
This greatly improves the signal-to-noise ratio, improves the accuracy of RNA
quantitation, prevents effects due to cross-hybridisation and greatly reduces the false positive and miscall rates. Another level of probe redundancy is the use of mismatch (MM) control probes which are identical to the perfect match (PM) probes except for one base pair. This increases specificity by removing background and cross
hybridisation signals, and enables the array to discriminate between “real” signals and those due to non-specific or semi-specific hybridisation. Redundant PM/MM
probe sets can differentiate whether the intended RNA molecule is generating a hybridisation signal; a single spot intensity generated by cDNA arrays is not as discriminative.
1.6.2.2 Target Preparation
Oligonucleotide arrays differ to cDNA arrays in the preparation of the target (sample of interest). For both types, RNA extracted from cells or tissue, transcribed into DNA,
labelled, hybridised to the DNA probes on the microarray surface then detected by
either phosphor-imaging or fluorescence scanning. Oligonucleotide arrays use
double-stranded cDNA to serve as template for a reverse transcription reaction in
which labelled nucleotides are incorporated into cRNA. The most commonly used
57
label is nonfluorescent biotin which is subsequently labelled by staining with a
fluorescent streptavidin conjugate. These arrays are very robust and produce highly
reproducible data, so that signals from separate arrays can be compared with one another. In the case of cDNA spotted arrays, however, the process of gridding is not
accurate enough to allow comparison between separate arrays. Therefore the target
preparation process involves labelling of two distinct RNA populations by two
separate fluorescent dyes (the most commonly used are Cy3 and Cy5), mixing and
hybridisation to the same array.
1.6.2.3 Scanning
After the targets are labelled and hybridised (usually for approximately 16 hours), the arrays are scanned. For the oligonucleotide arrays, the light emitted from each probe
cell is proportional to the bound target at each location, therefore the presence or
absence of a particular transcript above background and noise levels can be
assessed. In the case of cDNA arrays, two fluorescent dyes are used, causing competitive binding, so the ratio of fluorescence intensities between the two dyes in
one spot gives information on the extent of up- or down-regulation of a gene.
1.6.3 Data Analysis
Microarray experiments generate vast amounts of data. This is usually in the form of long lists of spot intensities and intensity ratios, generated either by comparing
several samples to a control (oligonucleotide arrays) or by pairwise comparison of two samples (cDNA arrays). The aim is then to convert these data into meaningful
information.
1.6.3.1 Normalisation
The intensity information from the values of each of the probes in a probeset is combined together to get an expression measure (MAS 5.0 statistical algorithm from
Affymetrix 2001). Normalisation is needed when dealing with experiments from more
than one array. There are two main types of variation, interesting variation and
58
obscuring variation. An example of interesting variation is the differences in gene
expression between normal and malignant tissues. Obscuring variation is that
introduced by performing the experiments themselves e.g. unequal quantities of starting RNA, differences in sample preparation (e.g. labelling) and array processing
(scanning) and differences in hybridisation efficiency.
Affymetrix normalisation is performed on expression summary values. This approach
does not work well in the case of non-linear relationships between arrays. Other
approaches include using non-linear smooth curves [Li and Hung, 2001] and
transforming the data so that the distribution of probe intensities is the same across a
set of arrays; both parametric and non-parametric methods can be used to achieve
this. These approaches depend on the choice of a baseline array.
1.6.3.2 Clustering
Analysing microarray data involves classifying individual genes into a set of
categories. Some methods classify genes into predefined categories (supervised clustering), whereas other methods use categories that are discovered during the
analysis (unsupervised clustering). Both supervised and unsupervised clustering
methods assign a category to gene (using expression measurements across array experiments), the categories being biological functions of genes or diagnoses
associated with pathologic specimens.
1.6.3.2.1 Unsupervised Clustering
Unsupervised clustering techniques for analyzing microarrays include hierarchical
clustering, k-means clustering and self-organising maps. They are useful for initial
data exploration, and have been validated under certain circumstances by their
successful "rediscovery" of known classes of genes [Alizadeh et al., 2000;Eisen et
al., 1998;Wen et al., 1998]. A disadvantage, however is that because prior biological
knowledge is not incorporated, all measurements within the expression profile
contribute equally to the analysis. This means that measurements that have little or
nothing to do with distinguishing the groups of interest can confound the placement
59
of a sample into the correct category.
Hierarchical Clustering
Average-linkage hierarchical clustering was the first method to be used for ordering
microarray data [Eisen et al., 1998]. This approach finds the pair of genes with the
most similar expression profiles, and iteratively builds a hierarchy by pairing genes (or existing clusters) that are most similar. The resulting hierarchy is shown using
dendrograms. Genes which have similar functions are often co-expressed and so
cluster together. In this way, the functions of yet uncharacterised genes can be
assigned based on the functions of genes with which they cluster. This can be
extended to samples from similar origins, which will cluster together due to their expressing similar sets of genes [Perou et al., 1999].
K-means Clustering
K-means clustering requires a parameter, k, which represents the expected number of clusters [Tavazoie et al., 1999]. First, cluster centres are chosen at random. Using
the distance metric, each profile is assigned iteratively to the cluster whose centre it
is nearest to; then the cluster centre is recalculated depending on the profiles within the cluster.
Self-Organising Maps (SOMs)
Self-organising maps are topological neural networks [Tamayo et al., 1999]. Clusters
are already organised into a “map” where clusters which are similar are topologically
close together. The number and topology of the clusters are already specified. The
clustering is similar to the k-means method except that the cluster centres are recalculated at each iteration based on the profiles within each cluster as well as the
profiles in separate clusters.
60
1.6.3.2.2 Supervised Clustering
Supervised clustering techniques such as support vector machine (SVM) incorporate previous biological knowledge. For example, a supervised approach might be used
to predict whether a gene is involved in ovarian carcinogenesis by comparing its
expression profile to the profiles of both genes known to be involved and genes
known not to be involved in ovarian carcinogenesis. Recent reports have
demonstrated the ability of supervised classification to assign functions to genes [Brown et al., 2000] and to type leukaemia (myeloid vs. lymphoid) [Golub et al.,
1999], based on microarray data.
The main disadvantage of supervised methods is that they are hypothesis driven. If a hypothesis is based on prior knowledge, supervised methods will help to accept or
reject it. They cannot reveal the unexpected and do not form new hypotheses or data
classifications. For example, if tumours fall into two unanticipated classes on the basis of their expression profiles, a supervised method will not be able to discover
this. Another disadvantage is the possibility of misclassification of samples; supervised methods will not discover, in general, samples that were mistakenly labelled and used in, say, the training set.
1.6.3.3 Verification of Results
As microarray technology is still in its infancy, the techniques are continually being
improved. Problems may arise such as probes not detecting the correct transcript
species as a result of cross-hybridisation or adverse secondary structure. Verification
of a subset of results by well-established techniques such as quantitative reverse transcription polymerase chain reaction (qRT-PCR) or northern hybridisation is
important. QRT-PCR or Northern blotting is still considered standard to verify array
data especially where only a few replicates are used. Comparative array analysis
with other datasets available in the public domain is also helpful to verify array results.
61
1.6.4 The Application of Microarrays to Cancer Pathways
Gene expression profiling of cancers has expanded greatly in the past few years,
and is becoming the most comprehensive approach for characterising human
cancers at a molecular level. Gene expression profiling provides a global overview of the mechanisms and pathways involving numerous genes operating at a cellular
level in many cancers, such as breast, colon, lung, stomach, ovary and head and
neck. A vast amount of data has been generated, with some of these genes already known to be involved in the carcinogenic process, and many whose functions are still
presently unknown. Similarly, the patterns of expression of genes with a known
function can reveal information on novel phenotypic features of cells and tissues
being studied.
1.6.4.1 Cancer Classification
Accurate classification of cancers is vital since correct treatment hinges on detailed
knowledge of the primary tumour and presence or absence of metastatic spread. Until now, diagnosis has been determined histologically by appearance alone. The problem with this approach is that tumours, including tumour subtypes with similar
histopathological appearance can have vastly divergent clinical outcomes and
responses to treatment. Classification of tumours using gene expression profiles is
providing a new dimension.
Golub and colleagues were the first to report that the expression patterns of diverse
classes of genes contained information that could be used to classify tumours,
specifically leukaemias [Golub et al., 1999]. They suggested a class discovery and a
class prediction model. Class discovery defines previously unrecognised tumour
subtypes, and class prediction refers to the assignment of tumours into defined categories according to their current state or future outcomes. 38 leukaemia cases
were taken and analysed by self-organising maps (SOMs) using high-density
oligonucleotides microarray containing almost 7,000 genes. A distinct molecular
difference was shown between acute myeloid leukaemia (AML) and acute
lymphoblastic leukaemia (ALL) based on the gene expression profiles. For class
62
prediction, tumours were assigned one of the two groups based on the class
discovery. For example, one tumour had initially been diagnosed histopathologically
as AML, but showed atypical morphology. Gene expression profiling demonstrated
high expression of genes suggesting this was a tumour of mesenchymal origin.
Subsequent cytogenetic re-analysis confirmed this to be a rhabdomyosarcoma, and treatment was changed accordingly. The authors stress that this method is an aid
rather than a replacement to classic histopathological diagnoses.
A study by Alizadeh and colleagues [Alizadeh et al., 2000] investigated diffuse large
B-cell lymphoma (DLBCL), an aggressive malignancy of mature B lymphocytes and
the most common subtype of non-Hodgkin’s lymphoma. Classification of this disease
based on morphology has been largely unsuccessful, due to lack of agreement on
histological appearance of possible subtypes. The clinical course is variable: although 40% of patients respond well to therapy, 60% do not, and ultimately
succumb to their disease. Hierarchical clustering identified two molecularly distinct
groups of DLBCL: the gene expression pattern of one group was indicative of B-cell
differentiation pattern in germinal centres of lymph nodes, and the other group
expressed genes induced during in vitro activation of peripheral B cells. Patients with the germinal centre B-like DLBCL had a significantly better overall survival rate. This study demonstrates that tumours can be classified into previously unrecognised but clinically significant subgroups.
Breast cancers are a heterogeneous group of tumours, with several different
subtypes, with correspondingly variable prognoses. Perou et al [Perou et al., 1999] defined a further subtype of oestrogen-receptor negative group with basaloid
features. Although histopathologists recognise the basaloid breast cancer subset, it
has never been treated as a distinct clinical entity in clinical practice. This study,
along with others [Jones et al., 2000;Jones et al., 2001;Tsuda et al., 2000] demonstrate that this group of tumours has a different gene expression profile and a
metastatic pattern similar to ductal carcinomas in general. Microarrays can define the gene expression profile of this subset of ductal tumours, and other groups will most
likely be discovered in the process.
63
Ross et al. [Ross et al., 2000] used cDNA microarrays to determine the expression of 8,000 genes within the 60 cell lines used in the National Cancer Institute screen for anticancer drugs. Hierarchical clustering analysis grouped cells of the same tissue
origin together. Cell lines derived from leukaemia, melanoma, the central nervous
system, colon, kidney and ovarian tissue clustered in distinct groups. However,
breast cancer cell lines clustered in many different branches, suggesting a
heterogeneous pattern of gene expression. Specifically, the profile obtained for two related breast carcinoma cell lines, MDA MB435 and MDA-N, which were derived
independently from the same patient, was similar to that from melanoma cell lines.
This suggested either that some breast cancers may have expression profiles
exhibiting neuroendocrine features or that the cell lines are actually derived from a
melanoma.
Cancers from divergent tissue types can also be classified into groups according to
their gene expression profile. Taking gene expression profiles of 90 normal tissue
samples, and 218 tumour samples containing 14 different tumour types,
Ramaswamy et al showed that these cancers can be classified with an accuracy
approaching 78% [Ramaswamy et al., 2001]. This group also showed that well differentiated tumours differ from poorly differentiated cancers, and very highly
related tumour types are harder to classify. Another similar study looking at GEM
profiles of 175 carcinomas from different tumour types used supervised machine learning algorithms to first filter genes not involved in tumour classification, then
ranked the remaining genes according to their contribution to predict tumour types to
classify these tumours [Su et al., 2001]. This approach allowed the prediction of tumour origin of 90% of the tumours studied.
1.6.4.2 Identification of Metastatic Markers
The pathways involved in invasion and progression of disease are poorly
understood. Identification of genes responsible for metastasis can lead to the
development of drugs aimed at preventing the expression of these genes and thus
individualising patient treatment. The following microarray studies have shed some
light on the identification of potential key regulators of human cancer.
64
A gene involved in the metastasis of melanoma, RhoC has been identified [Clark et
al., 2000]. Highly metastatic melanoma cell lines were compared with non-metastatic lines. GEM profiling revealed a cluster of genes, including RhoC which were over
expressed in metastasis. Functional studies demonstrated that RhoC over
expression facilitated metastasis whereas dominant-negative RhoC inhibited
metastasis in animal models. The authors concluded that RhoC may regulate
invasion by triggering cytoskeletal organisation in response to signals stimulating cell motility. Drugs targeted towards RhoC could be used to reduce the spread of primary
melanoma.
Prostate cancer is one of the most common cancers in men. It is histopathologically
heterogeneous with a clinically diverse outcome, and is almost incurable once
metastasised. Dhanasekharan et al have described a molecular signature for prostate cancer progression by comparing the gene expression profiles of normal
prostate, primary prostate cancers and metastatic prostate samples [Dhanasekaran
et al., 2001]. 55 genes were found to be over-expressed in metastatic specimens, of which the Polycomb protein enhancer of zeste homologue 2 (EZH2) was the most
significantly up-regulated. In a follow-up study by the same group of researchers, EZH2 was further investigated and confirmed to be more highly expressed in
metastatic prostate tissue than benign tissue [Varambally et al., 2002]. When
expression of EZH2 was inhibited using small interfering RNA (siRNA), cellular
growth of prostate cancer cells was significantly reduced. High EZH2 expression was
correlated with poor prognosis. This suggests that EZH2 is a good marker for prostate cancer invasion and metastasis by its role in regulating cell growth. Drug
treatment targeted against EZH2 may prevent metastatic spread of prostate cancer.
Breast cancer is one of the commonest cancers in women. The presence of lymph node metastases at the time of primary surgery is currently used to determine whether patients require adjuvant treatment in the form of cytotoxic or radiation
therapy. These are associated with significant side-effects, and identifying in situ
disease which is likely to metastasise is invaluable in improving quality of life for
patients. Van’t Veer and colleagues performed microarray studies on 78 breast cancers from patients with no lymph node metastases who had not received adjuvant
65
therapy ['t Veer et al., 2002]. These patients were followed up and a gene expression
profile was generated to differentiate between tumours which went on to metastasise
and those which did not. A “poor prognosis signature” comprising 70 differentially expressed genes was generated. This prognosis signature was then tested on
another group of newly diagnosed breast cancer patients and accurately predicted disease outcome. The authors concluded that the signature for poor prognosis is
already present in primary tumours, and this can be used at the time of initial surgery to predict survival. Such studies in the future may help to identify women with early
breast cancer who will benefit from adjuvant chemotherapy after initial local treatment. However, there is currently a debate regarding the validity of the analysis
used by V’ant Veer and colleagues to identify this high risk group.
Cancers in children can be devastating. Medulloblastoma is one such tumour; it is a highly metastatic cancer of the brain which is often difficult to distinguish
histopathologically from other tumours. It is a lethal cancer due to its propensity for
spread, and there is a need for reliable molecular markers that can distinguish this
cancer from the non-metastatic types. MacDonald and colleagues used gene expression profiling to identify genes differentially expressed between the metastatic and non-metastatic medulloblastomas [MacDonald et al., 2001]. They found that
platelet-derived growth factor receptor a (PDGFRa) and members of the Ras/MAPK
(mitogen activated protein kinase) downstream pathway were slightly over-expressed
in the metastatic tumours both at the RNA and protein levels. Functional studies demonstrated reduction of cell adhesion and migration in a medulloblastoma cell line
in response to inhibitors of PDGFRa and the Ras/MAPK pathway. These findings
suggest that PDGFRa and the Ras/MAPK pathway are involved in metastatic spread
and that inhibitors of this pathway can be exploited for the treatment of medulloblastoma.
Potentially more effective drugs can be designed by using large-scale studies
correlating gene expression profiles with drug responses [Scherf et al.,
2000;Zembutsu et al., 2002]. Gene expression profiling can be used to monitor,
validate and improve cancer drugs. Studies have been performed aimed at
monitoring the metabolism and toxicology of anticancer therapies [Zhou et al.,
66
2002;Gerhold et al., 2001]. Other studies have identified the cellular targets of drugs
and delineated the molecular mechanisms of drug action [Dimitroulakos et al.,
2002;Chang et al., 2002]. These data should contribute to new drug design which is individually tailored to patients with minimum of adverse drug events.
1.6.4.3 Gene expression profiling of ovarian tumours
A series of studies have been performed investigating the gene expression profiles in
ovarian cancers. These have been for the purpose of gaining insight into the
progression pathway of ovarian carcinogenesis [Tapper et al., 2001;Matei et al.,
2002;Jazaeri et al., 2003;Shridhar et al., 2001] and also for discovering gene products that can act as ovarian cancer specific markers and used for screening.
1.6.5 The Use of Microarrays in Ovarian Cancer
1.6.5.1 Understanding Ovarian Carcinogenesis
The molecular pathways crucial for initiation and progression of EOC remain largely unknown. Prognosis for EOC differs according to histological subtype, grade and
stage of disease. Gene expression profiling may contribute to our knowledge and so improve patient outcome after treatment. Tapper and colleagues have attempted to
define genes involved in ovarian cancer progression [Tapper et al., 2001]. They compared gene expression profiles from benign, local highly differentiated and
advanced ovarian serous adenocarcinomas. The most significantly up-regulated
gene between local, well-differentiated and benign tumours was cell division cycle 42
(cdc42) homologue, and that between local and advanced tumours was collagen
type III alpha 1 (COL3A1) also known as type III or fetal collagen. Whilst this is a very
good attempt at defining genes along the progression pathway, it assumes that benign tumours are a pre-malignant lesion, which is not the generally accepted view.
Ovarian cancer stage is one of the most important independent prognostic indicators;
Shridhar et al compared GEM profiles of five stage I, two stage II and seven stage III
ovarian cancers with normal ovary [Shridhar et al., 2001]. Hierarchical clustering
67
showed a clear distinction between normal and malignant tissues, although the
tumour stages did not cluster together, and the gene expression profiles of early and
late stage tumours were essentially the same, suggesting that a malignant signature
is present at an early point in carcinogenesis. Comparative genomic hybridisation (CGH) analysis was performed in order to investigate whether any of the results from
the GEM analysis could be correlated with genomic alterations, and showed that the
main difference was regional gain and/or amplification in late-stage tumours. The
inconsistency in the microarray and CGH data could be attributed to epigenetic mechanisms such as CpG island methylation, which have previously been reported
to be early events in ovarian tumorigenesis [Cheng et al., 1997]. These are early
studies with small sample sizes and need to be confirmed in larger prospective
studies where known prognostic indicators e.g. tumour grade are taken into account. However, these studies do suggest that genes identified by microarrays play an
important role in the future in the prognostic classification of early ovarian cancer.
Well differentiated tumours are generally thought to have a better prognosis than
undifferentiated cancers. Two groups [Matei et al., 2002;Jazaeri et al., 2003]
compared the GEM profiles of grade 1 and grade 3 serous adenocarcinomas. Different genes were identified by each group, with serine/threonine protein kinase
15 (STK15) and runt-related transcription factor 2 (runx2 or OSF2) being the two most up-regulated genes in grade 3 compared to grade 1 tumours.
1.6.5.2 Ovarian Cancer Biomarkers
Ovarian cancer presents late due to a lack of symptoms at an early stage, and the
lack of an effective screening strategy. It is likely that advanced ovarian cancer is a different disease from limited disease. The initial genetic events leading to
uncontrolled cell growth in tumours that present as advanced disease might also confer to those cells the propensity for early invasion and aggressive clinical
behaviour. Therefore, screening strategies to detect early disease may not be that
successful. Having said that, CA125 is currently the only marker in general use for
ovarian cancer screening, but is neither sensitive nor specific enough to be used as a
population based screening tool.
68
The circulation tumour antigen, CA125 is currently the only marker in general use for
ovarian cancer screening, but is neither sensitive nor specific enough to be used as a population based screening tool. CA125 is elevated in only 50% of stage I tumours, so many microarray studies have been directed at discovering new potential
biomarkers for ovarian cancer which can be used either alone or in conjunction with
CA125 or other molecular markers.
Welsh et al compared normal ovarian tissue with serous papillary adenocarcinomas
using oligonucleotide arrays and also included ovarian cancer cell lines, and RNA
from endothelial and activated B cells to control for blood vessels and infiltrating
immune cells [Welsh et al., 2001]. Genes most highly expressed in ovarian tumours
were CD24, HE4, CD9 with tumour-associated antigen GA773-2 (TACSTD1),
cytokeratins 7,8,18 and 19 and mucin-1 (MUC-1) also being highly up-regulated.
Ismail et al also compared normal ovary with papillary serous ovarian
adenocarcinomas, but in this case using primary cultures [Ismail et al., 2000]. There is always some concern where cell lines are used as short-term culture may favour
the growth of only a subset of epithelial cells. However, they identified osteoblast
specific factor-2 (OSF-2) as a highly ranked gene in primary ovarian cancers. Follow-
on studies are needed to verify that these genes are up-regulated only in primary
cancers and not, as is the case for CA125, in a multitude of benign conditions.
Three other studies have also compared normal ovarian tissue with ovarian cancers. HE4, matrix metalloproteinase 7 (MMP7 or PUMP1), progesterone binding protein,
ryudocan, MUC-1, membrane protein E16 and BA46 were reported as over
expressed in the cancer group. However, the cancers represented a mixed population of different EOC subtypes and stages, each of which have widely varying clinical outcomes. Therefore only broad conclusions can be drawn from these studies [Wang et al., 1999;Schummer et al., 1999;Tonin et al., 2001].
The only study so far to verify biomarkers identified in microarray experiments
serologically investigated the potential use of prostasin [Mok et al., 2001b]. This
potential marker was found to be raised in the sera of patients with serous ovarian
cancer and only marginally raised in mucinous or LMP tumours. It proved to have low
69
sensitivity in early-stage disease, and was found to have no correlation with CA125.
The authors suggest combining the two markers could increase the sensitivity; based
on screening of 37 patients and 100 controls, a sensitivity of 92% was achieved
(95% confidence interval (Cl) 78.1-98.3%) and a specificity of 94% (95% Cl 87.4- 97.7%). This compared with sensitivities of 51.4% (95% Cl 34.4-68.1%) for prostasin
and 64.9% (95% Cl 47.5-79.8%) for CA125 for a specificity of 94% for prostasin. The
authors only tested this marker in patients with benign or malignant gynaecological
conditions. Prostasin can be found in eight normal human tissues: prostate, kidney,
liver, pancreas, salivary gland, lung, bronchus and colon, so whether it functions as a
good screening marker remains to be determined.
Microarrays contain thousands of genes and ESTs which represent many different gene functions and are involved in numerous pathways. Not all of these are relevant
to the study of ovarian cancer. Based on findings from SAGE analysis of up-
regulated genes in ovarian cancer [Hough et al., 2001] and other cDNA array data,
Sawiris et al have produced the “Ovachip” which consists of 516 cDNA clones [Sawiris et al., 2002]. This specialised array does not include irrelevant genes which may contribute to biological noise affecting data analyses. However, this assumes
that all genes thought to be involved in ovarian carcinogenesis have been identified,
and may miss vital new genes as yet not discovered.
Many studies have investigated the gene expression profile of ovarian cancer using microarray technology. Most studies use snap frozen fresh tissue for analysis, commonly ovarian serous adenocarcinomas. Results from cell lines give varying
results, especially as there are significant differences in the gene expression profiles
of cell lines according to the length of time they have been in culture [Santin et al.,2004].
A wealth of data has been generated from studies investigating the gene expression
profiles to differentiate serous adenocarcinoma from normal ovarian tissue, with
many upregulated genes being involved in cell growth, differentiation, adhesion,
apoptosis and migration [Donninger et al., 2004;Meinhold-Heerlein et al., 2005;De et
al., 2004]. Specifically, creatine kinase B [Huddleston et al., 2005], KLK10
70
[Shvartsman et al., 2003], osteopontin [Kim et al., 2002b] and FGF2 [De et al., 2004]
have been proposed as putative novel targets to be further investigated as useful
markers for ovarian cancer.
Patients with stage 11 I/I V ovarian cancer who respond well to chemotherapy have an
improved survival than those who respond badly. Studies have identified a gene
expression signature which distinguishes short-term (<2-3 years) from long-term (>7
years) survivors [Berchuck et al., 2005], with many of the genes identified being
involved with immune function [Lancaster et al., 2004]. The expression pattern for
long-term survivors was similar to a set of stage I/ll cancers, suggesting a common
favourable biology. In addition The MAL gene, known to be associated with
chemoresistance was highly expressed in short-term survivors[Berchuck et al.,
2005].
One of the aims of identifying putative markers is to test them either individually or as
a on a panel of serum markers in order to test whether they can be used to for
screening of early stage disease. Mor et al tested osteopontin, insulin-like growth factor-11, leptin and prolactin and found that any protein individually could not distinguish patients with ovarian cancer from those unaffected, but in combination
could detect the disease with a sensitivity of 95%, a specificity of 95% and a positive predictive value of 95% [Mor et al., 2005].
1.6.6 Access to Array Databases
With the enormous amount of data generated from DNA microarray experiments, it
would be reasonable to conclude that this information should be available in the
public domain, in order that a re-analysis may be performed by other researchers, to
verify the original claims, but more importantly to compare these findings with their own datasets. This would be best accomplished by posting raw data in a centralised
public database. In fact, some DNA databases have been generated, due to the requirement of certain scientific journals that DNA sequence data are sent to
GenBank prior to submission of an article.
71
Obviously, not all data generated can be compared equally because different arrays may be used in different experiments, with different probes for the same gene.
Accession numbers are used to identify genes, and these vary between
organisations according to which array is being used. Therefore it is imperative to confirm that the same genes are being compared. Normalisation of arrays may differ,
and this must be checked by a trained bioinformaticist. However, even if global
normalisation is implemented, the actual intensity values for the same gene may
vary.
Difficulties arise when comparing high-density oligonucleotide arrays and cDNA
arrays. Oligonucleotide arrays generate robust data and more reproducible results than cDNA arrays, where the absolute hybridisation intensities often vary due to
differences in the amount of DNA deposited on the array for various genes.
72
1.7 Screening for Ovarian Cancer
Given the poor prognosis associated with the development of advanced ovarian
cancer and the clear increased survival at early stage disease, there has been much
enthusiasm for the development of effective screening strategies aimed at early
detection. There is currently no evidence to justify mass population screening; however, concentrating on subpopulation screening, identification of novel
serological biomarkers, and multimodality screening with transvaginal ultrasound
(TVS) and novel imaging, it is hoped that these refinements may eventually translate
into a reduction in ovarian cancer mortality.
Many features of ovarian cancer have led to the frustrations encountered in
attempting to screen for the disease; the anatomical location of the ovaries means they cannot be directly inspected, and epithelial ovarian cancers have no defined
precursor lesion and a poorly defined natural history. The time required for localised
disease to progress to disseminated disease is not known, so it is unclear what the
screening interval should be. The low prevalence of ovarian cancer in the general population means that screening must have a very high specificity in order to avoid
unnecessary surgical interventions. Suboptimal specificity will lead to high financial
and personal costs that may not be acceptable when balanced against the benefits of screening. Therefore routine screening for ovarian cancer is currently not
recommended, but studies are underway to identify new screening modalities and novel applications for screening regimens in high-risk populations.
Serum CA125 is the tumour marker which has been most extensively studied in
ovarian cancer screening. Bast et al discovered that serum levels of CA-125 were elevated in 82% of women with advanced ovarian cancer but in less than 1% of presumed healthy women and it was suggested that it could be used as a serum
marker for EOC [Bast, Jr. et al., 1983]. Soon afterwards, the JANUS study showed
encouraging evidence that CA125 levels increase for a period of time before the
development of clinically apparent ovarian cancer [Zurawski, Jr. et al., 1988]. Despite
these findings, the usefulness of CA125 in detecting preclinical ovarian cancer is
limited by a lack of sensitivity in stage I disease and poor specificity in that the
73
marker is elevated in numerous benign and malignant conditions such as
endometriosis, fibroids and any condition leading to peritoneal inflammation [Jacobs
and Bast, Jr., 1989].
Despite these drawbacks, two large European screening trials have been completed
that evaluate CA125 as a first-line test, with TVS being performed in cases where
CA125 is raised. The first of these trials was reported by Einhorn [Einhorn et al.,
1992]. In this trial, 5500 women were screened initially with CA125; 175 women had
elevated levels and were followed up with serial CA-125 and TVS. 16 laparotomies
were performed on those with abnormal results, with 6 cases of ovarian cancer detected, distributed evenly between stages I, II, and III. Three cases of ovarian
cancer were diagnosed in the control group. The other large study was reported by Jacobs [Jacobs et al., 1993] which involved 22,000 healthy postmenopausal women.
Again patients with elevated CA125 underwent subsequent TVS. 11 ovarian cancers
were diagnosed for 41 laparotomies performed. However, eight women with negative
screens subsequently developed ovarian cancer. As CA125 has insufficient
specificity, sensitivity, and predictive values, algorithms incorporating age and rate of change of CA125 have been developed in order to improve the performance of CA125 as a screening tool [Skates et al., 1995].
TVS has been investigated as a tool for ovarian cancer screening. Van Nagell et al.
[van, Jr. et al., 1990] reported on one thousand asymptomatic women over forty years of age who underwent TVS screening. Of these, 31 had abnormal scans and
24 patients underwent laparotomy. One Krukenberg tumour was found, but no cases
of primary ovarian carcinoma were detected. Given the unacceptable number of
laparotomies performed to detect one case of malignancy, subsequent studies have
focused on postmenopausal populations and defining ovarian scan morphology [van, Jr. et al., 1991;DePriest et al., 1993]. The same researchers have reported on the results of annual TVS screening performed on 14,469 asymptomatic women [van, Jr.
et al., 2000]. In this report, 57,214 scans were performed, and 180 patients
underwent laparotomy for 17 ovarian cancers detected: 11 stage I, 3 stage II, and 3
stage III. In this study, TVS as a screening modality gave a sensitivity of 81%, specificity of 98.9%, positive predictive value of 9.4%, and negative predictive value
74
of 99.97%. Excluding cases of nonepithelial and low malignant potential (LMP)
tumours, the survival of patients with ovarian cancer in the annually screened
population was 92.9% at 2 years and 83.6% at 5 years. This study was, however, not randomised so any assessment regarding the possible reduction in risk of mortality
cannot be made. However, the financial and personal cost of annual TVS screening and subjecting 10 women to a surgical intervention to identify one cancer, make
population screening with TVS as a single modality unacceptable.
More recent screening trials have focused on multimodal screening designs. Jacobs
reported the results of the first completed randomised trial of ovarian cancer
screening [Jacobs et al., 1999]. This prospective study included 22,000 postmenopausal women aged over 45 who were randomised either to screening
(10,997 women) or follow-up with no screening (10,958 women). The primary screen
in this study consisted of serum CA125 measurement. Women who were found to
have a CA125 level of over 30l)/ml were asked to attend for an ultrasound scan. At
the beginning of the study the scans were performed abdominally and when TVS
became available this was the preferred route. 468 women with a CA125 level above 30U/ml underwent a total of 781 scans. 29 women underwent surgery, with 6 cases of ovarian cancer diagnosed, 3 stage I/ll, and 3 stage III cancers. The remaining 23
women had false-positive results with benign conditions such as benign ovarian tumours and fibroids. Four operations were performed for each cancer detected,
giving a positive predictive value of 21. A further 10 women developed ovarian cancer after the period of screening during the 8 year follow-up, bringing the total to 16 in the screened group. 20 women in the control arm were diagnosed with ovarian
cancer. The prevalence in the 2 groups was not significantly different, with stage
distribution and histological type of cancer being similar, but the cancers in the
screened group were of a lower grade. Although the mortality did not differ significantly between the 3 groups, this study was conducted primarily as a basis of the feasibility of multi modal screening with CA125 and ultrasound scanning.
Compliance was good, with 86% of women attending for at least one screen. This
has prompted the initiation of a large randomised trial, the UK Collaborative Trial of
ovarian cancer screening (UKCTOCS). The aim is to recruit 200,000
postmenopausal women aged between 50 and 74 years who will be randomised in a
75
1:1:2 ratio to one of 3 arms: ultrasound scan alone, multimodal screening using an
algorithm for risk of ovarian cancer and a control group. The screened groups will
undergo 6 screens at annual intervals. The 2 screening strategies will be compared in order to evaluate the benefit of adding CA125 measurement to the screening
procedure. The primary end point will be ovarian cancer mortality 7 years after randomisation, with the data being accrued by postal questionnaire and through the
cancer registry. The results of this trial will provide invaluable information as to the
benefit of screening employing current tools, in the general population.
Serum markers other than CA125 have been evaluated. Lysophosphatidic acid
(LPA) was assessed in a small pilot series; LPA levels were elevated in 90% of stage I ovarian cancers and in 100% of patients with stages 11—IV [Xu et al., 1998]. Larger studies are needed to fully evaluate the usefulness of LPA.
To date, strategies for ovarian cancer screening have had inadequate sensitivity and
specificity to justify population screening. Efforts aimed at the development of new
screening strategies, identification of novel serum biomarkers and preventative measures are urgently needed; if successful, these strategies and measures could have a substantial impact on the lives of women.
76

A ims O f T his T hesis
Epithelial ovarian cancer has the highest mortality rate of the gynaecological cancers. Approximately 75% of women have advanced stage disease at the time of
diagnosis. Despite aggressive surgery and improvements in chemotherapeutic regimes, the prognosis for these women has remained poor over the past 20 years, at around 25% 5 year survival. This is due in part to the lack of effective prevention
or molecular markers for early stage detection. When detected at stage I, the survival
rate is around 95%. Clearly, improvements in early detection of this disease are
paramount.
The aim of this thesis is to identify a gene expression profile for serous epithelial
ovarian cancer which contributes to the understanding of ovarian cancer and which reveals putative novel tumour markers.
77
C hapter 2
Materials A nd M ethods
2.1 Clinical Samples
2.1.1 Collection of Clinical Samples
Clinical samples were obtained at the time of surgery at both University College and Royal Free Hospitals. As soon as the specimen was removed from the patient, a
small representative biopsy from the tissue concerned was cut, placed in a sterile
container and then immediately into dry ice (at -80°C). The samples were labelled
then stored in a -80°C freezer until the histology report was available. 47 samples of
ovary and omentum in total were collected. All patients were undergoing primary
staging laparotomies prior to chemotherapeutic intervention. This study was only
concerned with investigating stage INC malignant serous cystadenocarcinomas where the corresponding omentum was available; therefore many samples had to be
discarded as the pathology report showed they represented other histologies. The details are summarised in Table 2.1. Eleven patients were diagnosed with stage INC
serous adenocarcinoma of the ovary and were therefore used in the study; 18 patients had other malignant histology and 10 patients had benign histologies. In addition, biopsies of 8 normal ovaries from patients undergoing elective surgery (total
abdominal hysterectomy and bilateral salpingoophorectomy) for benign conditions were collected, where no abnormality was detected in the ovaries, uterus, cervix and
fallopian tubes.
Ovarian epithelium was macrodissected from the underlying stroma in the normal
ovaries for subsequent analysis. For the real-time quantitative RT-PCR data three
serous tumours of low malignant potential were used in addition, which were
obtained from the tumour bank at the Royal Free Hospital School of Medicine and these were gifts from Dr. Christopher Perrett.
78
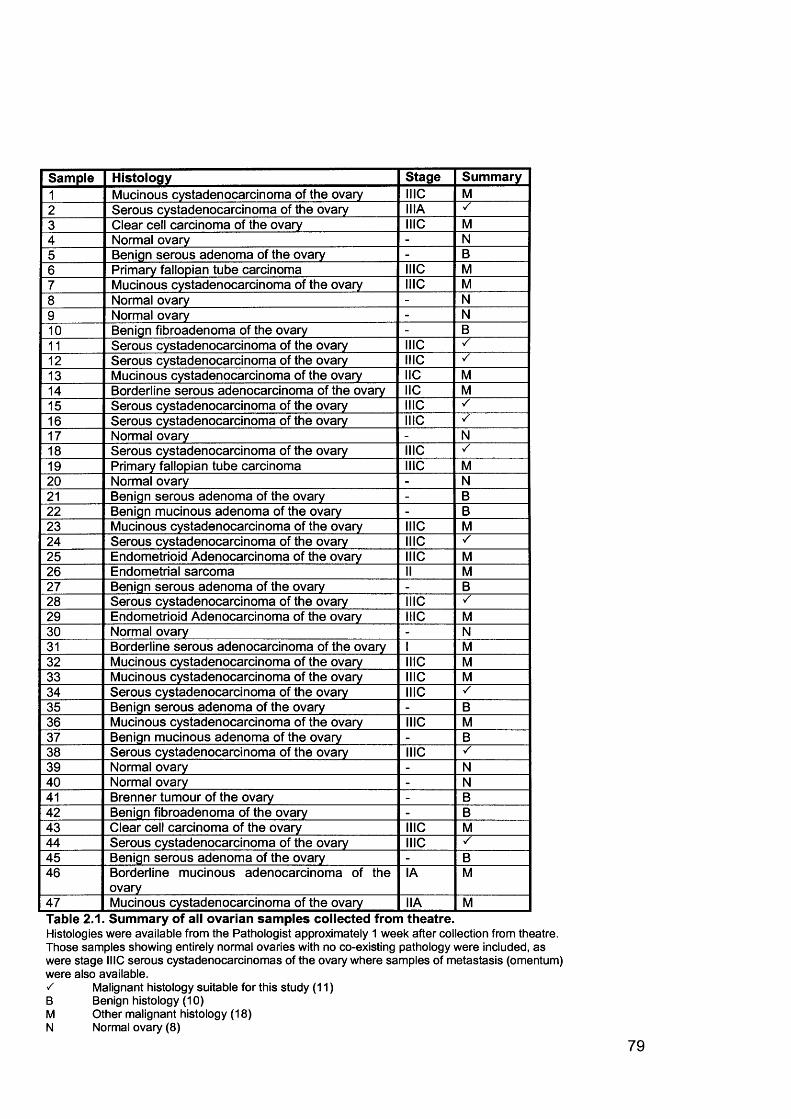
Sample Histology Stage Summary1 Mucinous cystadenocarcinoma of the ovary NIC M2 Serous cystadenocarcinoma of the ovary IMA3 Clear cell carcinoma of the ovary NIC M4 Normal ovary - N5 Benign serous adenoma of the ovary - B6 Primary fallopian tube carcinoma INC M7 Mucinous cystadenocarcinoma of the ovary NIC M8 Normal ovary - N9 Normal ovary - N10 Benign fibroadenoma of the ovary - B11 Serous cystadenocarcinoma of the ovary NIC ✓12 Serous cystadenocarcinoma of the ovary INC ✓13 Mucinous cystadenocarcinoma of the ovary IIC M14 Borderline serous adenocarcinoma of the ovary IIC M15 Serous cystadenocarcinoma of the ovary NIC ✓16 Serous cystadenocarcinoma of the ovary NIC ✓17 Normal ovary - N18 Serous cystadenocarcinoma of the ovary NIC ✓19 Primary fallopian tube carcinoma MIC M20 Normal ovary - N21 Benign serous adenoma of the ovary - B22 Benign mucinous adenoma of the ovary - B23 Mucinous cystadenocarcinoma of the ovary NIC M24 Serous cystadenocarcinoma of the ovary NIC ✓25 Endometrioid Adenocarcinoma of the ovary NIC M26 Endometrial sarcoma II M27 Benign serous adenoma of the ovary - B28 Serous cystadenocarcinoma of the ovary NIC /29 Endometrioid Adenocarcinoma of the ovary NIC M30 Normal ovary - N31 Borderline serous adenocarcinoma of the ovary I M32 Mucinous cystadenocarcinoma of the ovary NIC M33 Mucinous cystadenocarcinoma of the ovary NIC M34 Serous cystadenocarcinoma of the ovary NIC ✓35 Benign serous adenoma of the ovary - B36 Mucinous cystadenocarcinoma of the ovary NIC M37 Benign mucinous adenoma of the ovary - B38 Serous cystadenocarcinoma of the ovary NIC ✓39 Normal ovary - N40 Normal ovary - N41 Brenner tumour of the ovary - B42 Benign fibroadenoma of the ovary - B43 Clear cell carcinoma of the ovary NIC M44 Serous cystadenocarcinoma of the ovary NIC S45 Benign serous adenoma of the ovary - B46 Borderline mucinous adenocarcinoma of the
ovaryIA M
47 Mucinous cystadenocarcinoma of the ovary IIA MTable 2.1. Summary of all ovarian samples collected from theatre.Histologies were available from the Pathologist approximately 1 week after collection from theatre. Those samples showing entirely normal ovaries with no co-existing pathology were included, as were stage MIC serous cystadenocarcinomas of the ovary where samples of metastasis (omentum) were also available.s Malignant histology suitable for this study (11)B Benign histology (10)M Other malignant histology (18)N Normal ovary (8)
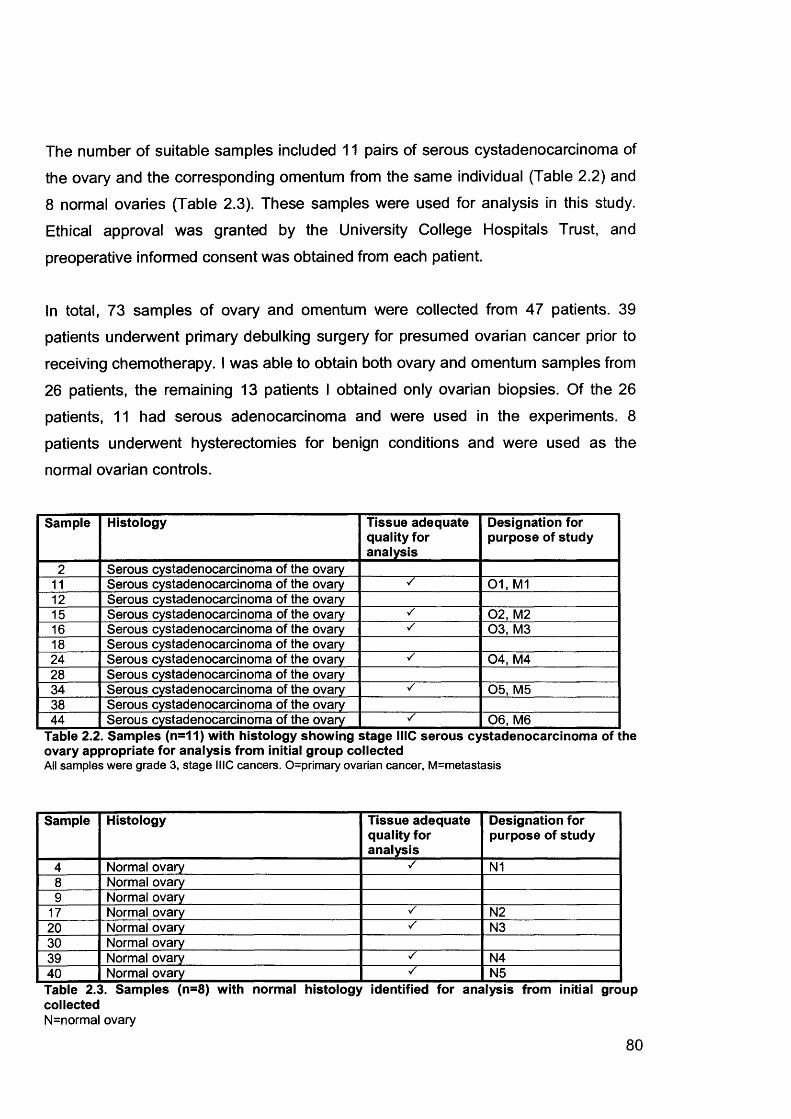
The number of suitable samples included 11 pairs of serous cystadenocarcinoma of
the ovary and the corresponding omentum from the same individual (Table 2.2) and
8 normal ovaries (Table 2.3). These samples were used for analysis in this study. Ethical approval was granted by the University College Hospitals Trust, and
preoperative informed consent was obtained from each patient.
In total, 73 samples of ovary and omentum were collected from 47 patients. 39 patients underwent primary debulking surgery for presumed ovarian cancer prior to
receiving chemotherapy. I was able to obtain both ovary and omentum samples from
26 patients, the remaining 13 patients I obtained only ovarian biopsies. Of the 26
patients, 11 had serous adenocarcinoma and were used in the experiments. 8
patients underwent hysterectomies for benign conditions and were used as the
normal ovarian controls.
Sample Histology Tissue adequate quality for analysis
Designation for purpose of study
2 Serous cystadenocarcinoma of the ovary11 Serous cystadenocarcinoma of the ovary 01, M112 Serous cystadenocarcinoma of the ovary15 Serous cystadenocarcinoma of the ovary 02, M216 Serous cystadenocarcinoma of the ovary 03, M318 Serous cystadenocarcinoma of the ovary24 Serous cystadenocarcinoma of the ovary ✓ 04, M428 Serous cystadenocarcinoma of the ovary34 Serous cystadenocarcinoma of the ovary 05, M538 Serous cystadenocarcinoma of the ovary44 Serous cystadenocarcinoma of the ovary 06, M6
Table 2.2. Samples (n=11) with histology showing stage MIC serous cystadenocarcinoma of the ovary appropriate for analysis from initial group collectedAll samples were grade 3, stage MIC cancers. 0=primary ovarian cancer, M=metastasis
Sample Histology Tissue adequate quality for analysis
Designation for purpose of study
4 Normal ovary ✓ N18 Normal ovary9 Normal ovary
17 Normal ovary ✓ N220 Normal ovary ✓ N330 Normal ovary39 Normal ovary s N440 Normal ovary N5Table 2.3. Samples (n=8) with normal histology identified for analysis from initial group collectedN=normal ovary
80
2.1.2 Histopathological Verification
Each piece of tissue used for subsequent microarray analysis was embedded in 10%
buffered formalin and 4pm thick paraffin sections were cut using a microtome in the laboratory of Dr. Ming Du. These sections were stained with haematoxylin and eosin
(H&E) stain as below. H&E-stained sections were initially examined and verified
histopathologically to be stage ill serous adenocarcinomas of the ovary, then
reviewed by the Pathologist Dr. Flanagan at the MDT meeting and the histology
confirmed. The percentage of tumour cells in each tissue block was estimated; all
samples comprised at least 70% tumour, except one omental sample which had 5%
tumour content. The normal ovarian samples were verified to be free of any
pathology, including benign cysts.
2.1.2.1 Haematoxylin and Eosin Staining Protocol
1. Sections were dewaxed and re-hydrated.
2. They were then placed in haematoxylin solution for 5-10 minutes.
3. Sections were washed in running H2 O.
4. Sections were differentiated in 1 % acid-alcohol and then washed well in H2 O.
5. Sections were rinsed ('blued') in ammonia H2 O for 1 minute.6. Then briefly rinsed in distilled H2 O.
7. Counterstaining was performed with eosin for 2-5 minutes.
8. Sections were washed well in H2 O.
9. Finally, sections were dehydrated, cleared and mounted in neutral mounting medium.
2.1.3 Microdissection
Frozen tissue was taken and mounted in Tissue-Tek® O.C.T. compound embedding
medium (Electron Microscopy Sciences, Washington, USA). Consecutive sections
6pm thick of frozen tissue were cut in a cryomicrotome at -20°C. The first and final
sections were stained with H&E as described above and were used to identify the
location of target cells. Microdissection of neoplastic cells was carried out using
81

sterile needles under a dissecting microscope. Target cells were recovered from a
minimum of 10 consecutive sections. The microdissected cells were transferred into a sterile microtube containing RNAIater® which immediately inactivates RNases and stabilizes RNA within tissues or cells. RNA is stable for 1 day at 37°C, 1 week at
25°C, 1 month at 4°C or indefinitely at -20°C.The cells were then either used the
same day for RNA extraction, or frozen at -20°C for later use.
82
2.2 RNA Sample Preparation
2.2.1 RNA Extraction
30mg of tissue was sharply dissected from the tissue mass, placed in 600pl RNeasy lysis buffer (buffer RLT, Qiagen, UK) and allowed to thaw on ice. It was then
disrupted and homogenised using a rotor-stator homogeniser for up to 1 minute at 20
second bursts, and further homogenised by passing the lysate through a
QIAshredder column by centrifugation (14,000g for 2 minutes). Total RNA was
extracted from this tissue using the RNeasy Mini protocol (Qiagen, UK). The lysate was further centrifuged at 14,000g for 3 minutes, and the supernatant transferred into
a new microcentrifuge tube and the pellet discarded. 600pl of 70% ethanol was
added and the solution immediately mixed. 700pl of the sample at a time was applied
to an RNeasy mini spin column placed in a 2ml collection tube and centrifuged at
14,000g for 15 seconds. After each centrifugation step the flow-through was discarded. The column was washed once with 700pl buffer RW1 and then twice with
500pl buffer RPE. The first 2 washes were centrifuged at 14,000g for 15 seconds, and the final wash for 2 minutes in order to dry the RNeasy silica-gel membrane.
Total RNA was eluted by applying 50pl diethylene pyrocarbonate (DEPC)-treated
distilled water (add 0.1% DEPC (v/v), shake, incubate at 37°C for 16 hours, then
autoclave), and centrifuging at 14,000g for 1 minute.
2.2.2 RNA Quantification Using the Agilent 2100 Bioanalyzer
The concentration and purity/integrity of the RNA was checked using the Agilent
2100 Bioanalyzer (Agilent Technologies, CA, USA) and RNA 6000 LabChip® kit
(Caliper Technologies Corp., CA, USA). The Bioanalyzer is shown in Figure 2.1. The
traditional methods for analysing the quality of total RNA preparations is by agarose
gel electrophoresis using ethidium bromide staining; the concentration of the purified RNA is calculated from the UV absorbance at 260nm using a UV spectrophotometer
and the purity of RNA measured by the ratio of the absorbencies at 260nm and
280nm, taking an absorbance of 1cm'1 to be equivalent to 40pg/ml RNA. The main
disadvantage of these techniques is that significant amounts of sample are required,
83
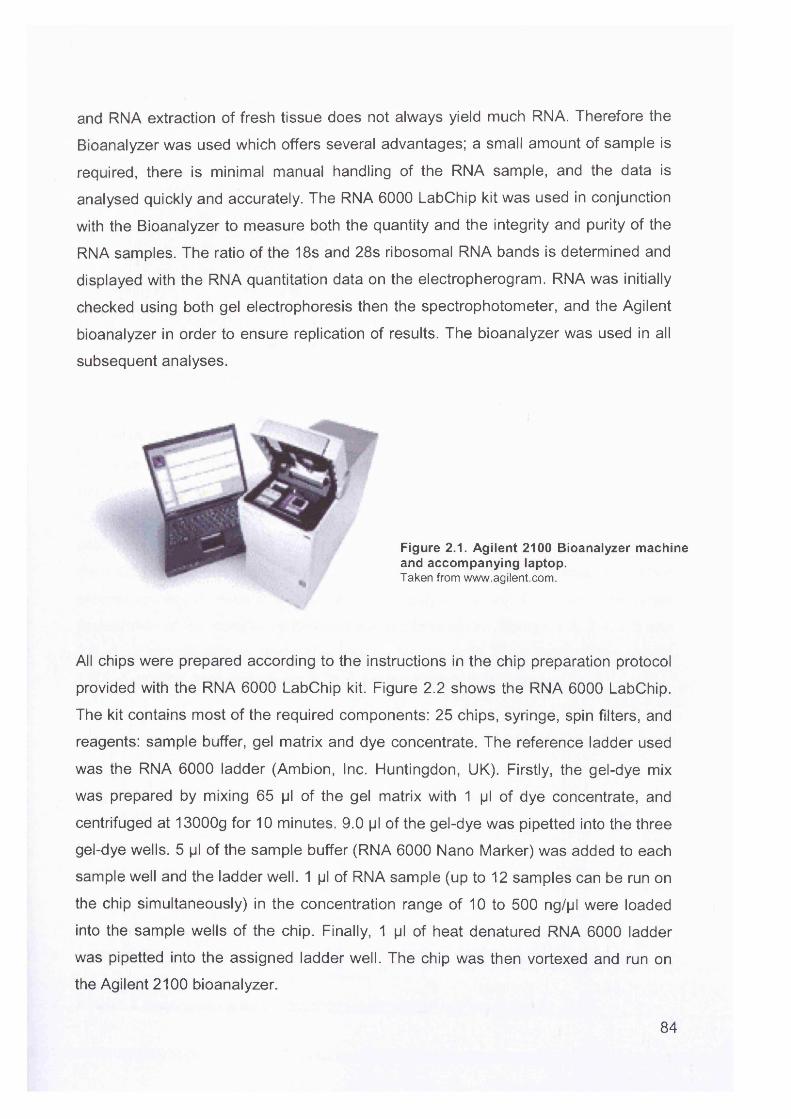
and RNA extraction of fresh tissue does not always yield much RNA. Therefore the
Bioanalyzer was used which offers several advantages; a small amount of sample is
required, there is minimal manual handling of the RNA sample, and the data is
analysed quickly and accurately. The RNA 6000 LabChip kit was used in conjunction
with the Bioanalyzer to measure both the quantity and the integrity and purity of the
RNA samples. The ratio of the 18s and 28s ribosomal RNA bands is determined and
displayed with the RNA quantitation data on the electropherogram. RNA was initially
checked using both gel electrophoresis then the spectrophotometer, and the Agilent
bioanalyzer in order to ensure replication of results. The bioanalyzer was used in all
subsequent analyses.
Figure 2.1. Agilent 2100 Bioanalyzer machine and accompanying laptop.Taken from www.agilent.com.
All chips were prepared according to the instructions in the chip preparation protocol
provided with the RNA 6000 LabChip kit. Figure 2.2 shows the RNA 6000 LabChip.
The kit contains most of the required components: 25 chips, syringe, spin filters, and
reagents: sample buffer, gel matrix and dye concentrate. The reference ladder used
was the RNA 6000 ladder (Ambion, Inc. Huntingdon, UK). Firstly, the gel-dye mix
was prepared by mixing 65 pi of the gel matrix with 1 pi of dye concentrate, and
centrifuged at 13000g for 10 minutes. 9.0 pi of the gel-dye was pipetted into the three
gel-dye wells. 5 pi of the sample buffer (RNA 6000 Nano Marker) was added to each
sample well and the ladder well. 1 pi of RNA sample (up to 12 samples can be run on
the chip simultaneously) in the concentration range of 10 to 500 ng/pl were loaded
into the sample wells of the chip. Finally, 1 pi of heat denatured RNA 6000 ladder
was pipetted into the assigned ladder well. The chip was then vortexed and run on
the Agilent 2100 bioanalyzer.
84
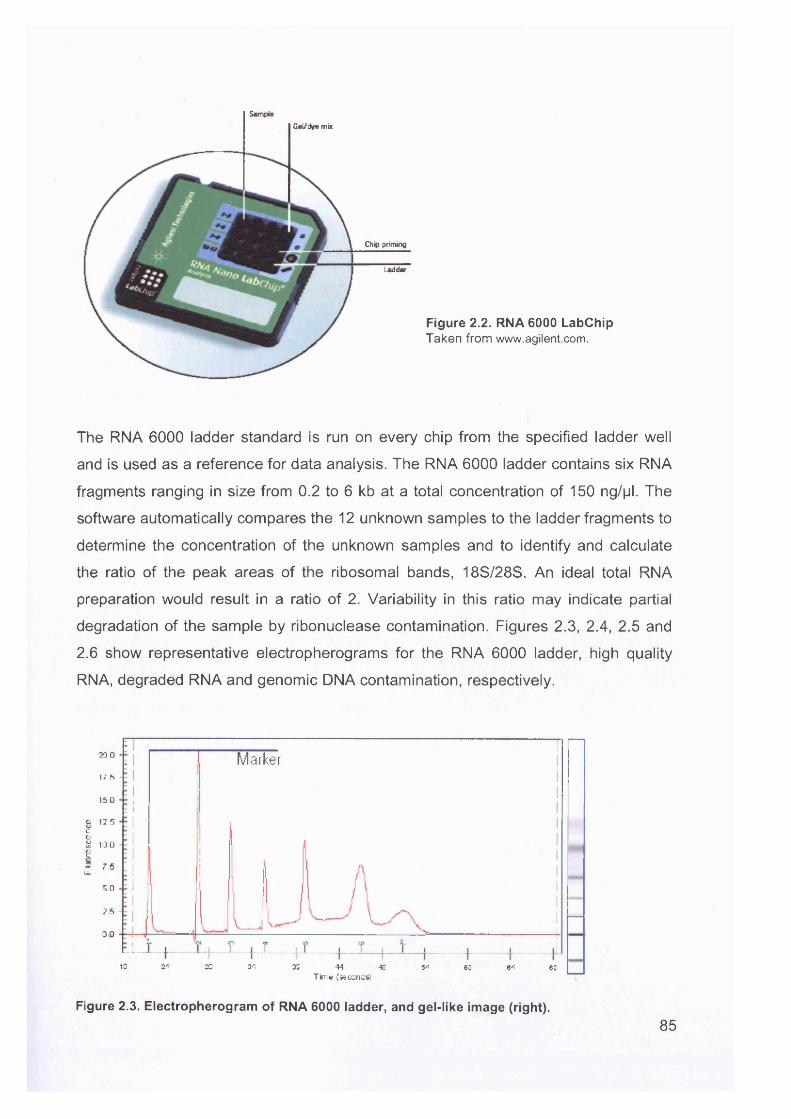
SampleGel/dye mix
Chip priming
Ladder
Figure 2.2. RNA 6000 LabChipTaken from www.agilent.com.
The RNA 6000 ladder standard is run on every chip from the specified ladder well
and is used as a reference for data analysis. The RNA 6000 ladder contains six RNA
fragments ranging in size from 0.2 to 6 kb at a total concentration of 150 ng/pl. The
software automatically compares the 12 unknown samples to the ladder fragments to
determine the concentration of the unknown samples and to identify and calculate
the ratio of the peak areas of the ribosomal bands, 18S/28S. An ideal total RNA
preparation would result in a ratio of 2. Variability in this ratio may indicate partial
degradation of the sample by ribonuclease contamination. Figures 2.3, 2.4, 2.5 and
2.6 show representative electropherograms for the RNA 6000 ladder, high quality
RNA, degraded RNA and genomic DNA contamination, respectively.
200
17 S
ISO
£ 12 5cgjs too &- 7 5IL
5 0
2 5
0 0
Figure 2.3. Electropherogram of RNA 6000 ladder, and gel-like image (right).
:----------------: I Marker
IS 24 23 33 35 44 49 64 68 64 6DTime (seconds!
85
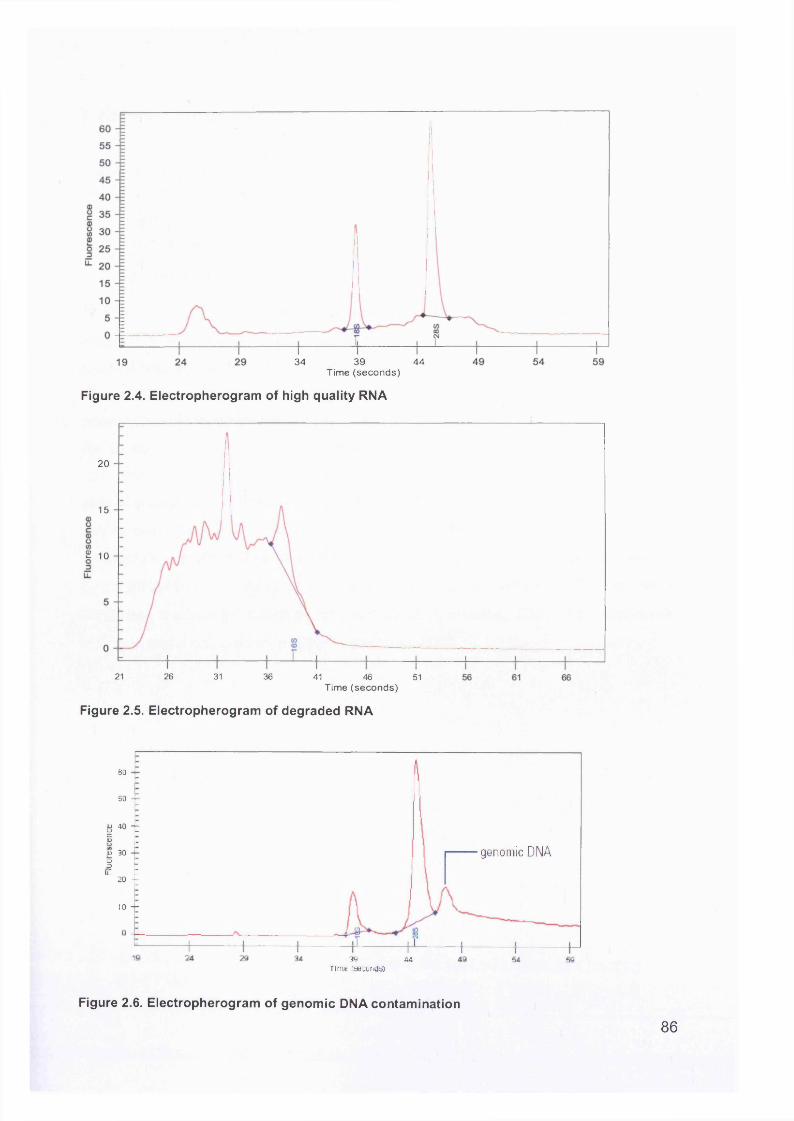
34 39 44Time (seconds)
Figure 2.4. Electropherogram of high quality RNA
genomic DNA
20
15
£ 10
Figure 2.6. Electropherogram of genomic DNA contamination
21 26 31 36 41 46 51Time (seconds)
Figure 2.5. Electropherogram of degraded RNA
so
50
8 40 TaOL) „
u 30 —o3 r u: :
20 —
io —
36 44Time [seconds)
86
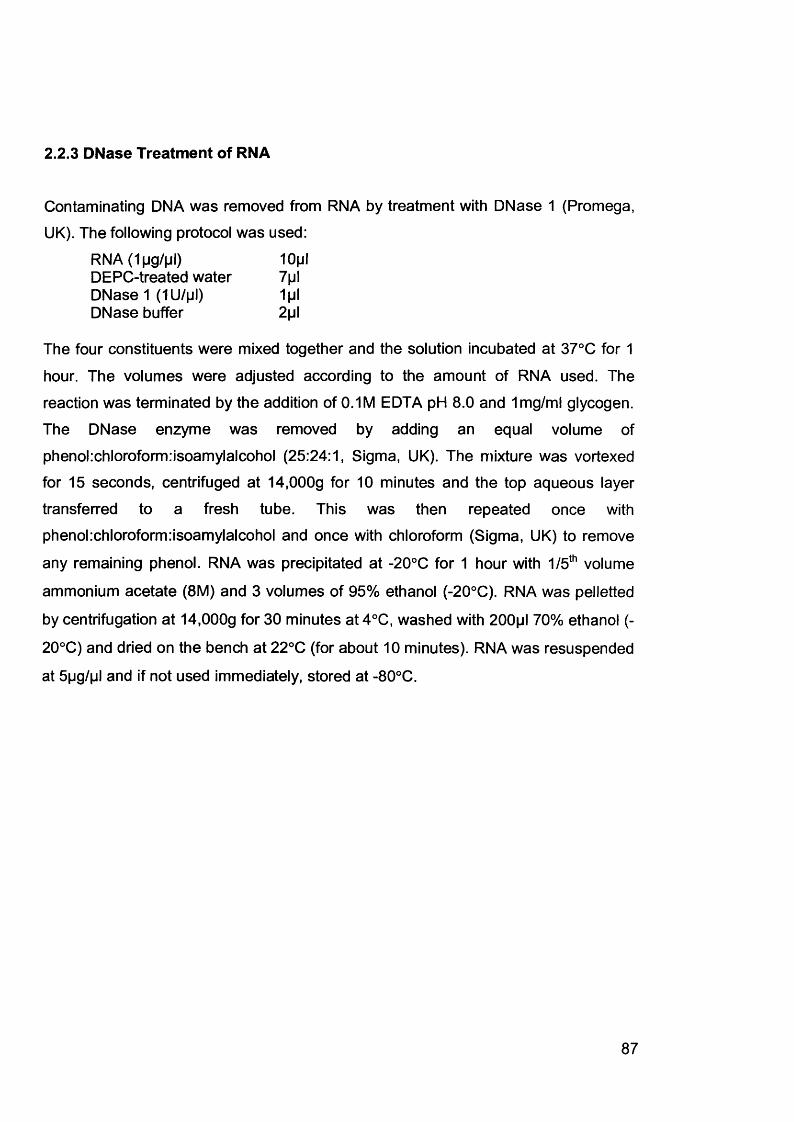
2.2.3 DNase Treatment of RNA
Contaminating DNA was removed from RNA by treatment with DNase 1 (Promega,
UK). The following protocol was used:
RNA (1 Mg/pl) 10plDEPC-treated water 7plDNase 1 (1U/pl) 1plDNase buffer 2pl
The four constituents were mixed together and the solution incubated at 37°C for 1
hour. The volumes were adjusted according to the amount of RNA used. The
reaction was terminated by the addition of 0.1 M EDTA pH 8.0 and 1 mg/ml glycogen.
The DNase enzyme was removed by adding an equal volume of
phenol:chloroform:isoamylalcohol (25:24:1, Sigma, UK). The mixture was vortexed for 15 seconds, centrifuged at 14,000g for 10 minutes and the top aqueous layer
transferred to a fresh tube. This was then repeated once with phenol:chloroform:isoamylalcohol and once with chloroform (Sigma, UK) to remove
any remaining phenol. RNA was precipitated at -20°C for 1 hour with 1/5th volume
ammonium acetate (8M) and 3 volumes of 95% ethanol (-20°C). RNA was pelletted
by centrifugation at 14,000g for 30 minutes at 4°C, washed with 200pl 70% ethanol (-
20°C) and dried on the bench at 22°C (for about 10 minutes). RNA was resuspended
at 5pg/pl and if not used immediately, stored at -80°C.
87
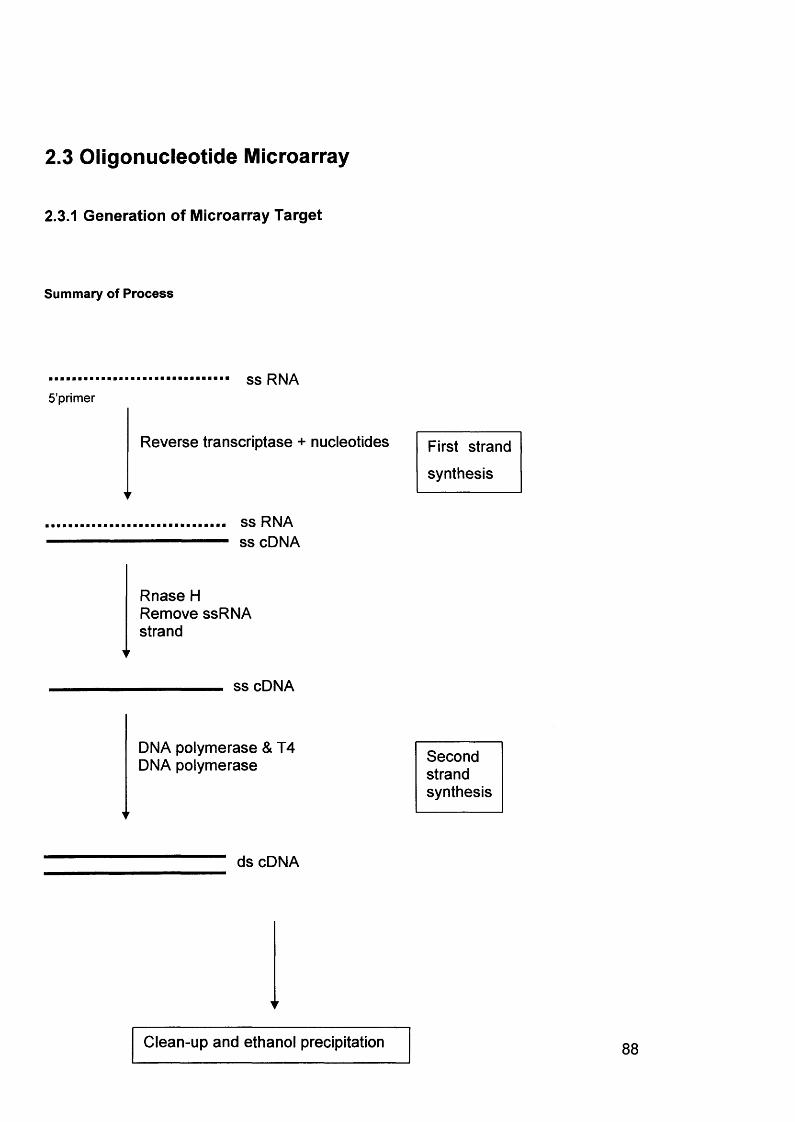
2.3 Oligonucleotide Microarray
2.3.1 Generation of Microarray Target
Summary of Process
ss RNA5’primer
Reverse transcriptase + nucleotides
ss RNA ss cDNA
Rnase H Remove ssRNA strand
ss cDNA
First strand
synthesis
DNA polymerase & T4 DNA polymerase Second
strandsynthesis
ds cDNA
Clean-up and ethanol precipitation
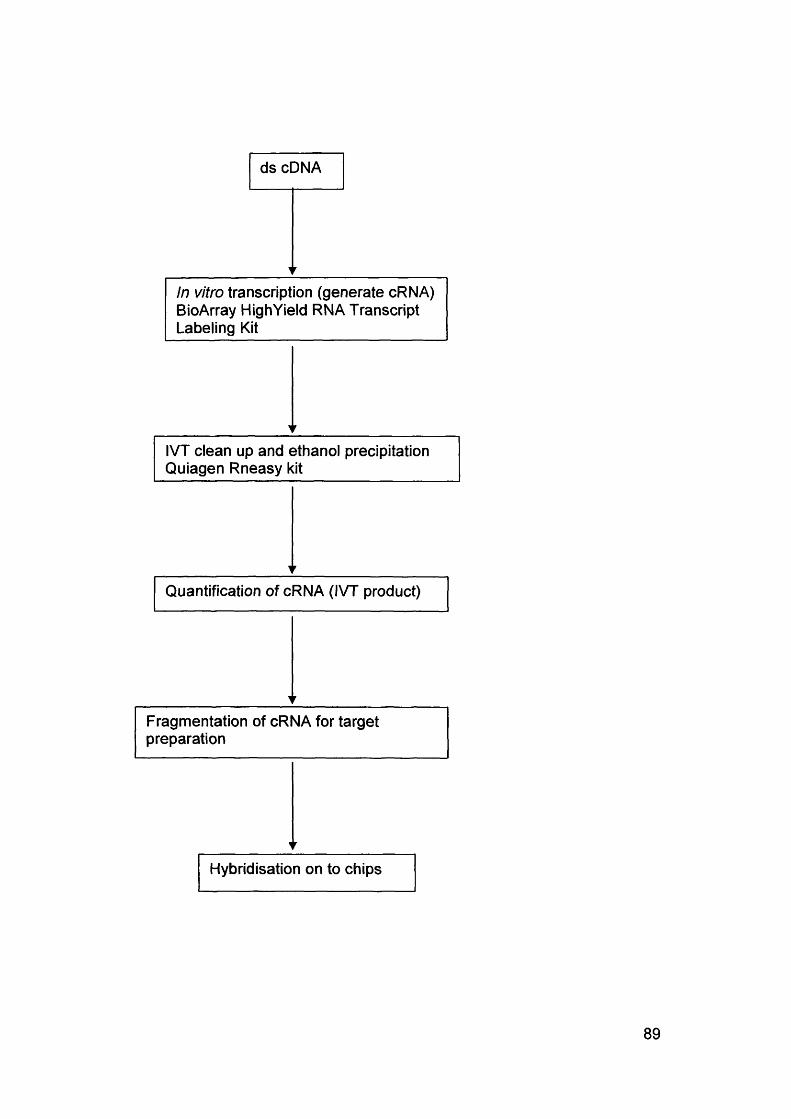
ds cDNA
Hybridisation on to chips
Quantification of cRNA (IVT product)
IVT clean up and ethanol precipitation Quiagen Rneasy kit
Fragmentation of cRNA for target preparation
In vitro transcription (generate cRNA) BioArray High Yield RNA Transcript Labeling Kit
89
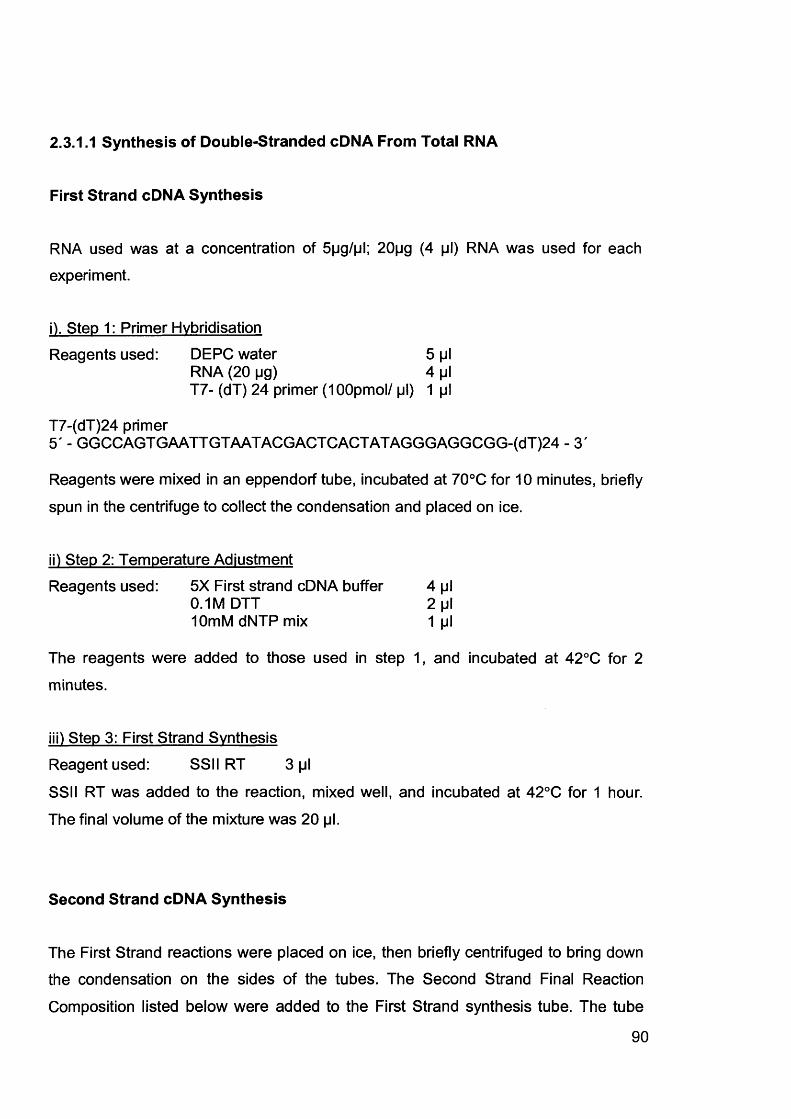
2.3.1.1 Synthesis of Double-Stranded cDNA From Total RNA
First Strand cDNA Synthesis
RNA used was at a concentration of 5pg/pl; 20|jg (4 jjI) RNA was used for each
experiment.
\). Step 1: Primer HybridisationReagents used: DEPC water 5 pi
RNA (20 pg) 4 piT7- (dT) 24 primer (lOOpmol/ pi) 1 pi
T7-(dT)24 primer5' - GGCCAGTGAATTGTAATACGACTCACTATAGGGAGGCGG-(dT)24 - 3'
Reagents were mixed in an eppendorf tube, incubated at 70°C for 10 minutes, briefly
spun in the centrifuge to collect the condensation and placed on ice.
ii) Step 2: Temperature AdjustmentReagents used: 5X First strand cDNA buffer 4 pi
0.1MDTT 2 pi10mMdNTPmix 1 pi
The reagents were added to those used in step 1, and incubated at 42°C for 2
minutes.
iii) Step 3: First Strand Synthesis
Reagent used: SSII RT 3 pi
SSI I RT was added to the reaction, mixed well, and incubated at 42°C for 1 hour.
The final volume of the mixture was 20 pi.
Second Strand cDNA Synthesis
The First Strand reactions were placed on ice, then briefly centrifuged to bring down
the condensation on the sides of the tubes. The Second Strand Final Reaction
Composition listed below were added to the First Strand synthesis tube. The tube
90
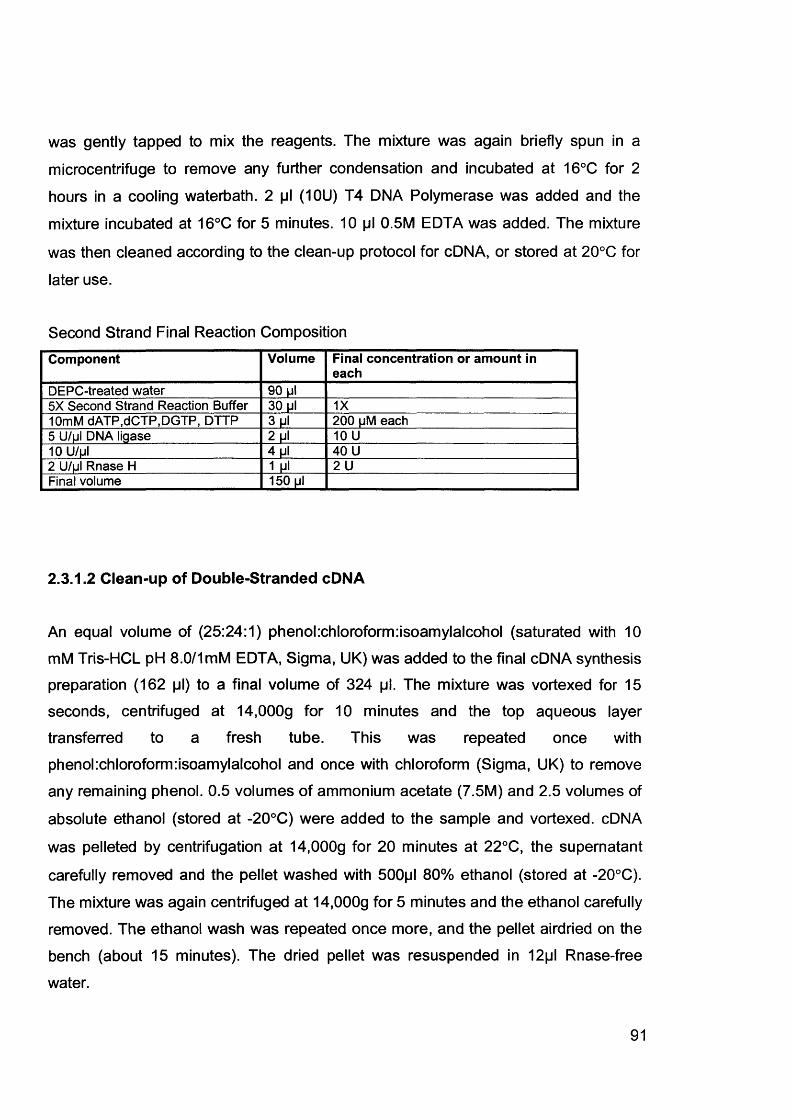
was gently tapped to mix the reagents. The mixture was again briefly spun in a
microcentrifuge to remove any further condensation and incubated at 16°C for 2
hours in a cooling waterbath. 2 pi (10U) T4 DNA Polymerase was added and the
mixture incubated at 16°C for 5 minutes. 10 pi 0.5M EDTA was added. The mixture
was then cleaned according to the clean-up protocol for cDNA, or stored at 20°C for
later use.
Second Strand Final Reaction CompositionComponent Volume Final concentration or amount in
eachDEPC-treated water 90 pi5X Second Strand Reaction Buffer 30 Ml 1X10mM dATP.dCTP.DGTP, DTTP 3 Ml 200 mM each5 U/|jl DNA ligase 2 Ml 10 U10 U/Ml 4 Ml 40 U2 U/|jl Rnase H 1 Ml 2 UFinal volume 150 Ml
2.3.1.2 Clean-up of Double-Stranded cDNA
An equal volume of (25:24:1) phenol:chloroform:isoamylalcohol (saturated with 10
mM Tris-HCL pH 8.0/1 mM EDTA, Sigma, UK) was added to the final cDNA synthesis preparation (162 pi) to a final volume of 324 pi. The mixture was vortexed for 15 seconds, centrifuged at 14,000g for 10 minutes and the top aqueous layer
transferred to a fresh tube. This was repeated once with
phenol:chloroform:isoamylalcohol and once with chloroform (Sigma, UK) to remove
any remaining phenol. 0.5 volumes of ammonium acetate (7.5M) and 2.5 volumes of
absolute ethanol (stored at -20°C) were added to the sample and vortexed. cDNA
was pelleted by centrifugation at 14,000g for 20 minutes at 22°C, the supernatant
carefully removed and the pellet washed with 500pl 80% ethanol (stored at -20°C).
The mixture was again centrifuged at 14,000g for 5 minutes and the ethanol carefully
removed. The ethanol wash was repeated once more, and the pellet airdried on the
bench (about 15 minutes). The dried pellet was resuspended in 12pl Rnase-free
water.
91
2.3.1.3 In Vitro Transcription
The ENZO BioArrayTM HlghYieldTM RNA Transcript Labelling Kit (T7) was used to
generate large amounts of hybridisable biotin-labelled RNA targets by in vitro
transcription from bacteriophage T7 RNA polymerase promoters. By using a T7 RNA polymerase and biotin-labelled nucleotides, large amounts of single stranded
nonradioactive RNA molecules can be produced in vitro.
The following reagents were added in the order indicated in the table below to the
cleaned-up final cDNA synthesis mixture at 22°C to avoid precipitation of DTT.
Reagent VolumeTemplate DNA 12 piDEPC-treated water 10 Ml10X HY Reaction buffer 4 Ml10X Biotin Labelled Ribonucleotides 4 Ml10X DTT 4 Ml10X Rnase Inhibitor Mix 4 Ml20X T7 RNA Polymerase 2 MlTotal Volume 40 Ml
The reagents were carefully mixed and the mixture collected at the bottom of the
eppendorf by brief centrifugation. The tube was immediately placed in a 37°C H20
bath for 5 hours. The contents of the tubes were carefully mixed every 30 minutes throughout the incubation. 5 hours is considered an optimum time for incubation; the
longer the time, the greater the yield, although if left for too long, the increased chance of degradation by RNases. The RNA was then purified, or if not immediately
used, was stored at -20°C.
2.3.1.4 Clean Up and Quantification of In Vitro Transcription Products
1 pi of unpurified IVT product was used for analysis using the bioanalyzer. The clean
up step was essentially performed in order to remove unincorporated dNTPs so that
the 260nm absorbance can determine the quantity of cRNA. One half of the IVT
reaction was purified at a time. This was done firstly in case the sample was lost
during purification and secondly because when IVT product yields are high, the
amount of RNA in the whole reaction may exceed the capacity of the device used for
92
purification, thereby resulting in better overall yields.
i) Clean Up
The clean up procedure was performed using the RNeasy protocol (Qiagen). The
reagent mixture was adjusted to 100 pi by the addition of DEPC-treated water. 350 pi Buffer RLT was added, then 250 pi 96% ethanol was added, and the reagents mixed
thoroughly by pipetting. The sample (700 pi) was then applied to an RNeasy mini
spin column placed in a 2ml collection tube. The sample was centrifuged at 14,000g
for 15 seconds, and the flow-through discarded. The column was washed twice with
500pl buffer RPE. The first wash was centrifuged at 14,000g for 15 seconds, and the
second wash for 2 minutes in order to dry the RNeasy silica-gel membrane. Total
RNA was eluted by applying 50pl diethylene pyrocarbonate (DEPC)-treated water, which is Rnase-free, and centrifuging at 14,000g for 1 minute.
ii) Ethanol Precipitation
0.5 volumes of 7.5M ammonium acetate and 2.5 volumes of 100% ethanol (stored at
-20°C) were added to the sample and vortexed for 15 seconds. The sample was
precipitated for 1 hour at -20°C, after which the tube was centrifuged at 14,000g for
30 minutes at 4°C. The pellet was washed twice with 80% ethanol (-20°C). The pellet
was airdried on the bench at room temperature before resuspension in 20pl DEPC- treated water.
iii) Quantification of the cRNA (IVT Product)
The concentration and purity of the RNA was checked using the Agilent 2100
Bioanalyzer (Agilent Technologies, CA, USA).
2.3.1.5 Fragmentation of the cRNA for Target Preparation
The following (Rnase-free) components were combined to a total volume of 20ml to
make the fragmentation buffer and passed through a 0.2pm vacuum filter unit.
93
4.0ml 1M Tris acetate pH 8.10.64g magnesium acetate0.98g potassium acetate DEPC-treated water made up to 20ml
2pl of 5X fragmentation buffer were used for every 8pl of RNA plus water. The
mixture was incubated at 94°C for 35 minutes, then put on ice. 1 pi of fragmentation
product was taken to check the concentration and purity using the Agilent
Bioanalyzer.
2.3.1.6 Preparation of the Hybridisation Target
Reagents for the hybridisation target for the single probe array were prepared as
shown below.
Component Standard array Final concentrationFragmented RNA I5pg 0.05ug/[jlControl oligonucleotide B2 5|J| 50pM20X Eukaryotic hybridisation controls 15pl 100pMHerring sperm DNA (10mg/ml) 3pl 0.1 mg/mlAcetylated BSA (50mg/ml) 3pl 0.5mg/ml2X Hybridisation buffer 150jjI 1XDEPC-treated water To final volume of 300|jIFinal volume 300pl
The reagents were mixed together, heated to 99°C for 5 minutes, then to 45°C for 5
minutes. The hybridisation cocktail was then centrifuged at 14,000g for 5 minutes to
remove any insoluble material. Meanwhile, the probe array cartridge was prepared
by filling it with 250pl 1X Hybridisation Buffer through one of the septa. The probe array was incubated at 45°C for 10 minutes with rotation. The buffer solution was
removed from the probe array cartridge and filled with 200pl of the clarified hybridisation cocktail avoiding any insoluble matter in the volume at the bottom of the
tube. The probe array was placed in a rotisserie box in a 45°C oven at 60rpm. The probes were hybridised to the probe array during a 16-hour incubation. Figure 2.7
shows the appearance of the Affymetrix probe array.
94
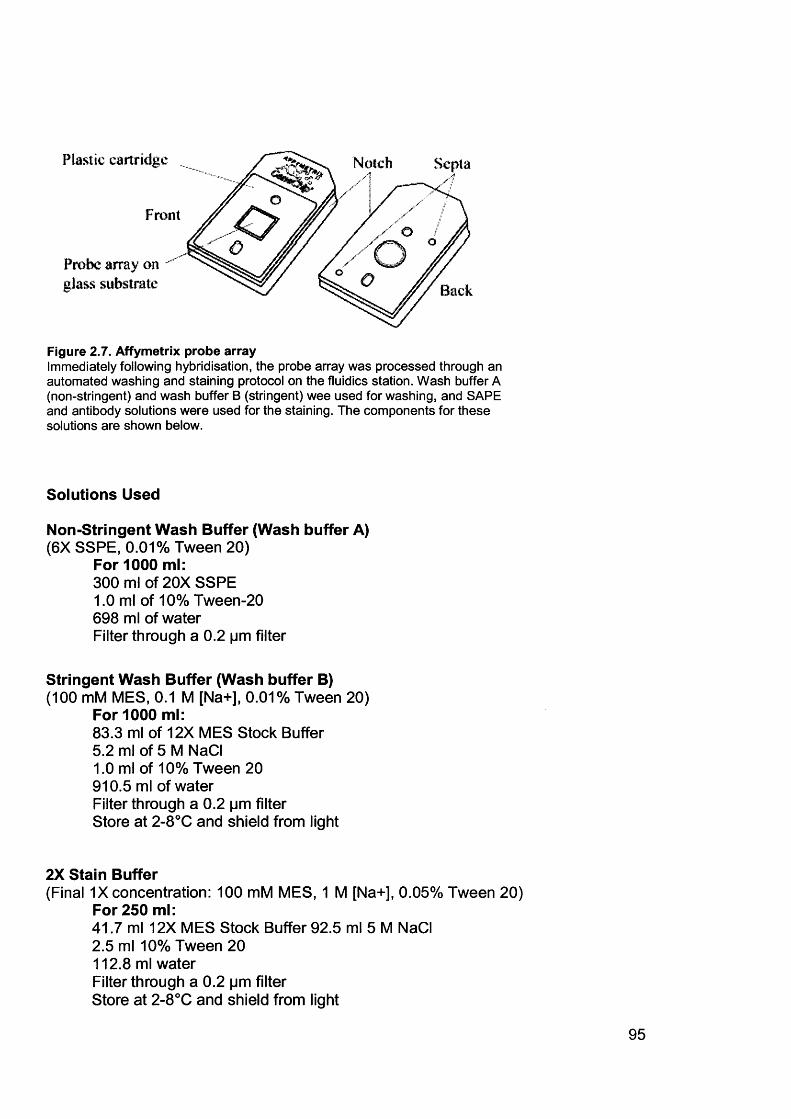
Plastic cartridge Notch
Front
Probe array on glass substrate Back
Figure 2.7. Affymetrix probe arrayImmediately following hybridisation, the probe array was processed through an automated washing and staining protocol on the fluidics station. Wash buffer A (non-stringent) and wash buffer B (stringent) wee used for washing, and SAPE and antibody solutions were used for the staining. The components for these solutions are shown below.
Solutions Used
Non-Stringent Wash Buffer (Wash buffer A)(6X SSPE, 0.01% Tween 20)
For 1000 ml:300 ml of 20X SSPE1.0 ml of 10% Tween-20 698 ml of waterFilter through a 0.2 pm filter
Stringent Wash Buffer (Wash buffer B)(100 mM MES, 0.1 M [Na+], 0.01% Tween 20)
For 1000 ml:83.3 ml of 12X MES Stock Buffer5.2 ml of 5 M NaCI1.0 ml of 10% Tween 20910.5 ml of waterFilter through a 0.2 pm filter Store at 2-8°C and shield from light
2X Stain Buffer(Final 1X concentration: 100 mM MES, 1 M [Na+], 0.05% Tween 20)
For 250 ml:41.7 ml 12X MES Stock Buffer 92.5 ml 5 M NaCI2.5 ml 10% Tween 20112.8 ml waterFilter through a 0.2 pm filterStore at 2-8°C and shield from light
95
Streptavidin Phycoerythrin (SAPE) Stain Solution(Total 1200|jl)
600 pi 2X MES stain buffer 540 |jl DEPC water48 Ml 50mg/ml acetylated BSA (final concentration 2 mq/mO 12 mI of 1 mg/ml SAPE (final concentration 10 Mg/ml)
Antibody Solution(Total 600mI)
300 Ml of 2X MES stain buffer266.4 Ml DEPC water24 Ml of 50mg/ml acetylated BSA (final concentration 2 Mg/m I)6.0 Ml of 10mg/ml normal goat IgG (final concentration 0.1 Mg/ml)3.6 Ml of 0.5 mg/ml biotinylated antibody (final concentration 3 Mg/ml)
Wash and Stain Protocol
Post Hyb 10 cycles of 2 mixes/cycle withWash #1 Wash Buffer A at 25°C
Post Hyb 4 cycles of 15 mixes/cycle withWash #2 Wash Buffer B at 50°C
Stain Stain the probe array for 10 minutesin SAPE solution at 25°C
Post Stain 10 cycles of 4 mixes/cycle withWash Wash Buffer A at 25°C
2nd Stain Stain the probe array for 10 minutesin antibody solution at 25°C
3rd Stain Stain the probe array for 10 minutesin SAPE solution at 25°C
Final Wash 15 cycles of 4 mixes/cycle withWash Buffer A at 30°C.The holding temperature is 25°C
• Wash Buffer A = non-stringent wash buffer• Wash Buffer B = stringent wash buffer
The hybridized probe array was stained with streptavidin phycoerythrin stain and
antibody solutions, and scanned by the GeneArray® Scanner at the excitation
96

wavelength of 488 nm. The amount of light emitted at 570 nm is proportional to the
bound target at each location on the probe array. Each probe array was scanned twice in order to improve the assay sensitivity and reduce background noise. The software calculates an average of the two images, defines the probe cells and
computes an intensity for each cell. Each complete probe array image was stored in
a separate data file and was saved with a data image file (.dat) extension.
97
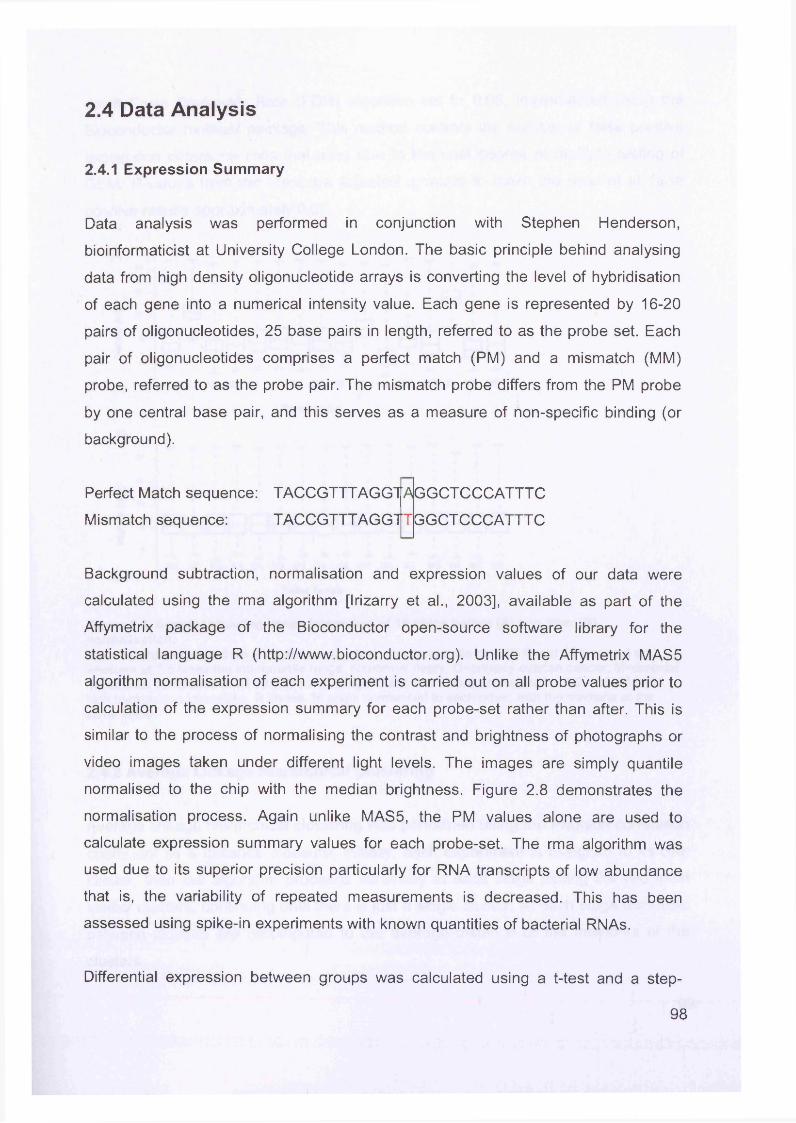
2.4 Data Analysis
2.4.1 Expression Summary
Data analysis was performed in conjunction with Stephen Henderson,
bioinformaticist at University College London. The basic principle behind analysing
data from high density oligonucleotide arrays is converting the level of hybridisation
of each gene into a numerical intensity value. Each gene is represented by 16-20
pairs of oligonucleotides, 25 base pairs in length, referred to as the probe set. Each
pair of oligonucleotides comprises a perfect match (PM) and a mismatch (MM)
probe, referred to as the probe pair. The mismatch probe differs from the PM probe
by one central base pair, and this serves as a measure of non-specific binding (or
background).
Perfect Match sequence: TACCGTTTAGGTA
Mismatch sequence: TACCGTTTAGGTT
GGCT CCCATTT C
GGCT CCCATTT C
Background subtraction, normalisation and expression values of our data were
calculated using the rma algorithm [Irizarry et al., 2003], available as part of the
Affymetrix package of the Bioconductor open-source software library for the
statistical language R (http://www.bioconductor.org). Unlike the Affymetrix MAS5
algorithm normalisation of each experiment is carried out on all probe values prior to
calculation of the expression summary for each probe-set rather than after. This is
similar to the process of normalising the contrast and brightness of photographs or
video images taken under different light levels. The images are simply quantile
normalised to the chip with the median brightness. Figure 2.8 demonstrates the
normalisation process. Again unlike MAS5, the PM values alone are used to
calculate expression summary values for each probe-set. The rma algorithm was
used due to its superior precision particularly for RNA transcripts of low abundance
that is, the variability of repeated measurements is decreased. This has been
assessed using spike-in experiments with known quantities of bacterial RNAs.
Differential expression between groups was calculated using a t-test and a step-
98
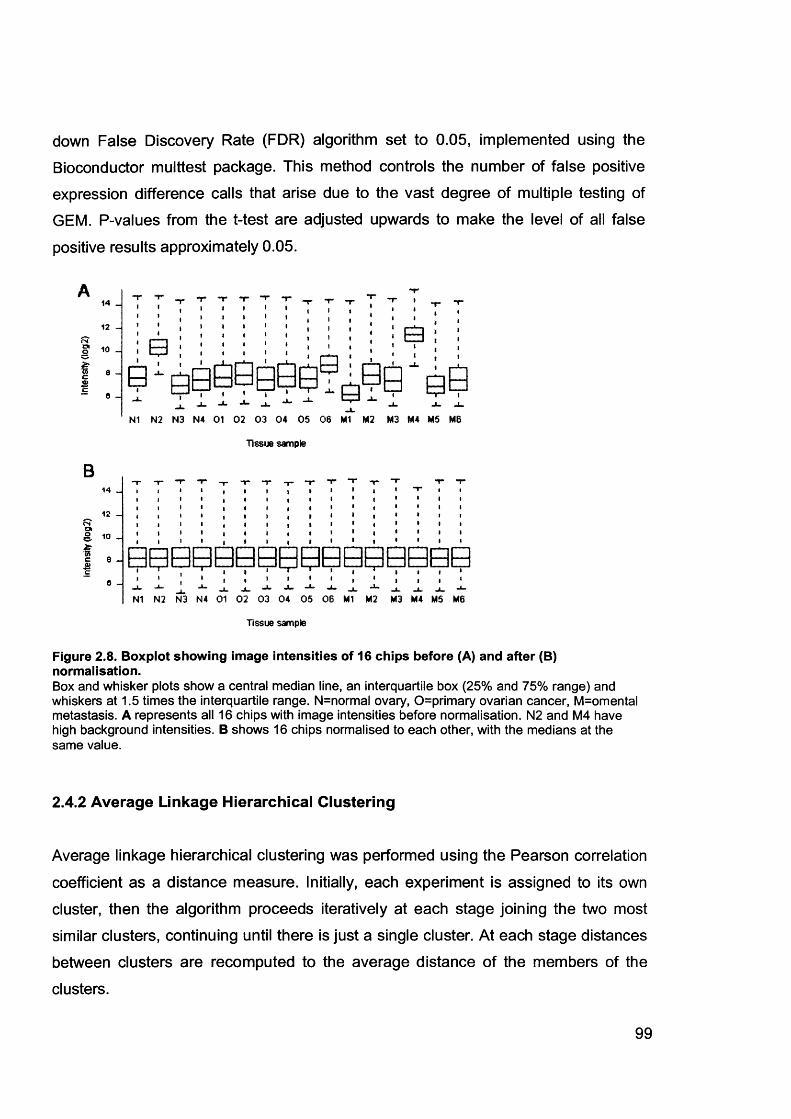
down False Discovery Rate (FDR) algorithm set to 0.05, implemented using the Bioconductor multtest package. This method controls the number of false positive
expression difference calls that arise due to the vast degree of multiple testing of GEM. P-values from the t-test are adjusted upwards to make the level of all false
positive results approximately 0.05.
OS
14
12
10
e6
B14
12
<2 10
c 8
c0
* I— -I J l .
N1 N2 N3 N4 01 02 03 04 05 06 M1 M2 M3 M4 M5 MB
Tissue sample
N1 N2 N3 N4 01 02 03 04 05 06 Ml M2 M3 M4 M5 MB
Tissue sample
Figure 2.8. Boxplot showing image intensities of 16 chips before (A) and after (B) normalisation.Box and whisker plots show a central median line, an interquartile box (25% and 75% range) and whiskers at 1.5 times the interquartile range. N=normal ovary, 0=primary ovarian cancer, M=omental metastasis. A represents all 16 chips with image intensities before normalisation. N2 and M4 have high background intensities. B shows 16 chips normalised to each other, with the medians at the same value.
2.4.2 Average Linkage Hierarchical Clustering
Average linkage hierarchical clustering was performed using the Pearson correlation
coefficient as a distance measure. Initially, each experiment is assigned to its own
cluster, then the algorithm proceeds iteratively at each stage joining the two most
similar clusters, continuing until there is just a single cluster. At each stage distances between clusters are recomputed to the average distance of the members of the
clusters.
99
2.4.3 Comparative GEM Data
Publicly available GEM data from normal epithelial rich tissues and whole blood were
obtained in CEL format from the Genomics Institute of the Novartis Foundation
expression atlas (http://expression.gnf.org). Prostate and lung adenocarcinoma data were obtained in CEL format from the Whitehead Institute Centre for Genomic
Research (http://www-genome.wi.mit.edu/cgi- bin/cancer/datasets.cgi). This was all analysed with our own data using rma (see section 2.4.1).
100
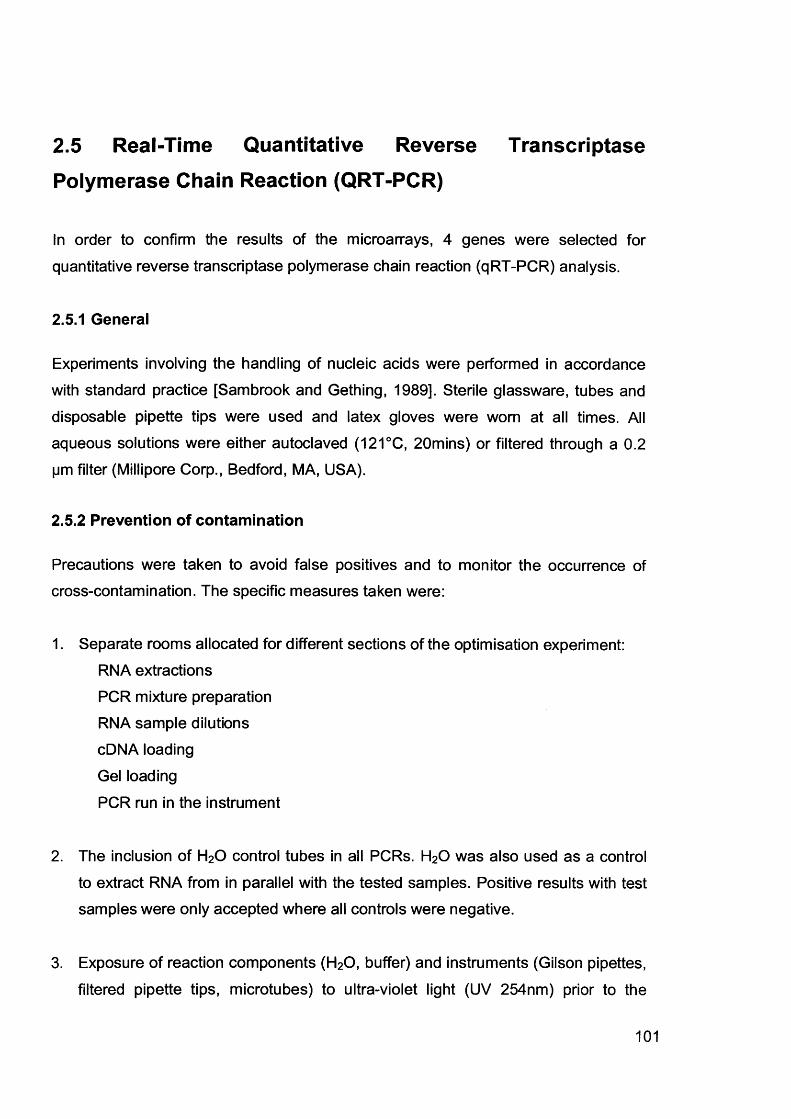
2.5 Real-Time Quantitative Reverse Transcriptase
Polymerase Chain Reaction (QRT-PCR)
In order to confirm the results of the microarrays, 4 genes were selected for
quantitative reverse transcriptase polymerase chain reaction (qRT-PCR) analysis.
2.5.1 General
Experiments involving the handling of nucleic acids were performed in accordance with standard practice [Sambrook and Gething, 1989]. Sterile glassware, tubes and
disposable pipette tips were used and latex gloves were worn at all times. All
aqueous solutions were either autoclaved (121°C, 20mins) or filtered through a 0.2 pm filter (Millipore Corp., Bedford, MA, USA).
2.5.2 Prevention of contamination
Precautions were taken to avoid false positives and to monitor the occurrence of cross-contamination. The specific measures taken were:
1. Separate rooms allocated for different sections of the optimisation experiment:RNA extractions PCR mixture preparation RNA sample dilutions cDNA loading Gel loading
PCR run in the instrument
2. The inclusion of H20 control tubes in all PCRs. H20 was also used as a control
to extract RNA from in parallel with the tested samples. Positive results with test samples were only accepted where all controls were negative.
3. Exposure of reaction components (H20, buffer) and instruments (Gilson pipettes,
filtered pipette tips, microtubes) to ultra-violet light (UV 254nm) prior to the
101
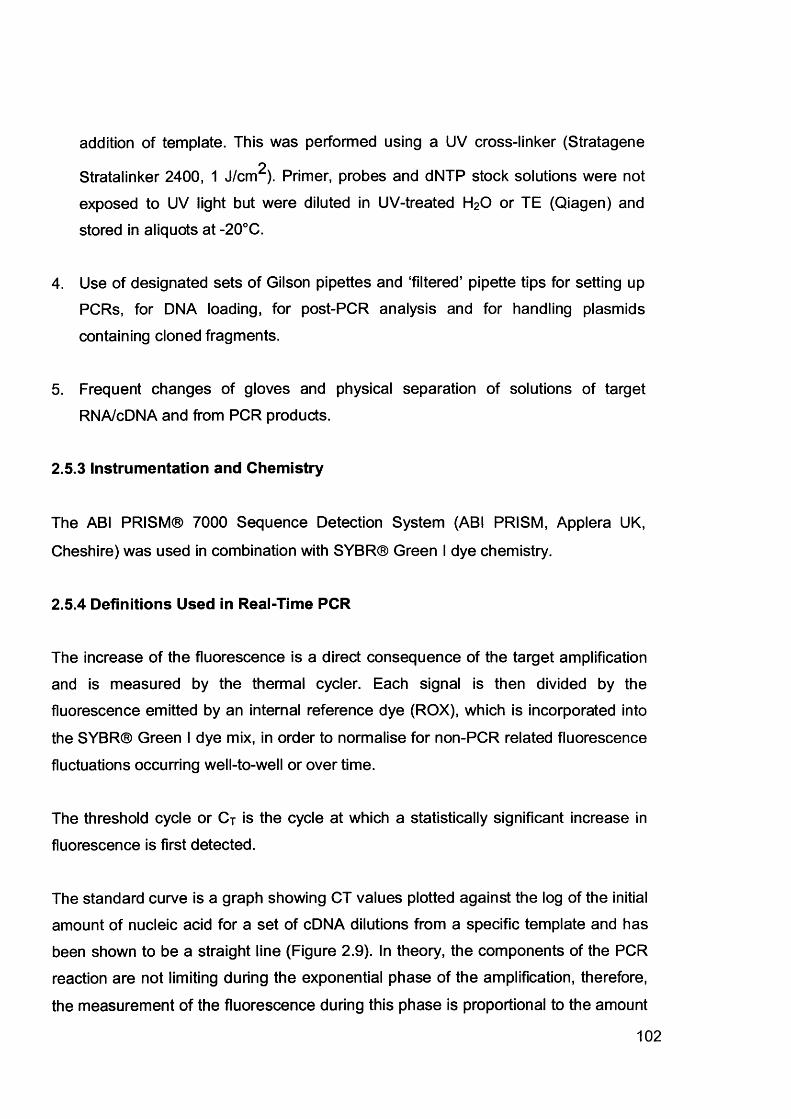
addition of template. This was performed using a UV cross-linker (Stratagene2
Stratalinker 2400, 1 J/cm ). Primer, probes and dNTP stock solutions were not
exposed to UV light but were diluted in UV-treated H20 or TE (Qiagen) and
stored in aliquots at -20°C.
4. Use of designated sets of Gilson pipettes and ‘filtered’ pipette tips for setting up PCRs, for DNA loading, for post-PCR analysis and for handling plasmids
containing cloned fragments.
5. Frequent changes of gloves and physical separation of solutions of target
RNA/cDNA and from PCR products.
2.5.3 Instrumentation and Chemistry
The ABI PRISM® 7000 Sequence Detection System (ABI PRISM, Applera UK,
Cheshire) was used in combination with SYBR® Green I dye chemistry.
2.5.4 Definitions Used in Real-Time PCR
The increase of the fluorescence is a direct consequence of the target amplification
and is measured by the thermal cycler. Each signal is then divided by the fluorescence emitted by an internal reference dye (ROX), which is incorporated into
the SYBR® Green I dye mix, in order to normalise for non-PCR related fluorescence
fluctuations occurring well-to-well or over time.
The threshold cycle or C j is the cycle at which a statistically significant increase in
fluorescence is first detected.
The standard curve is a graph showing CT values plotted against the log of the initial
amount of nucleic acid for a set of cDNA dilutions from a specific template and has been shown to be a straight line (Figure 2.9). In theory, the components of the PCR
reaction are not limiting during the exponential phase of the amplification, therefore,
the measurement of the fluorescence during this phase is proportional to the amount
102
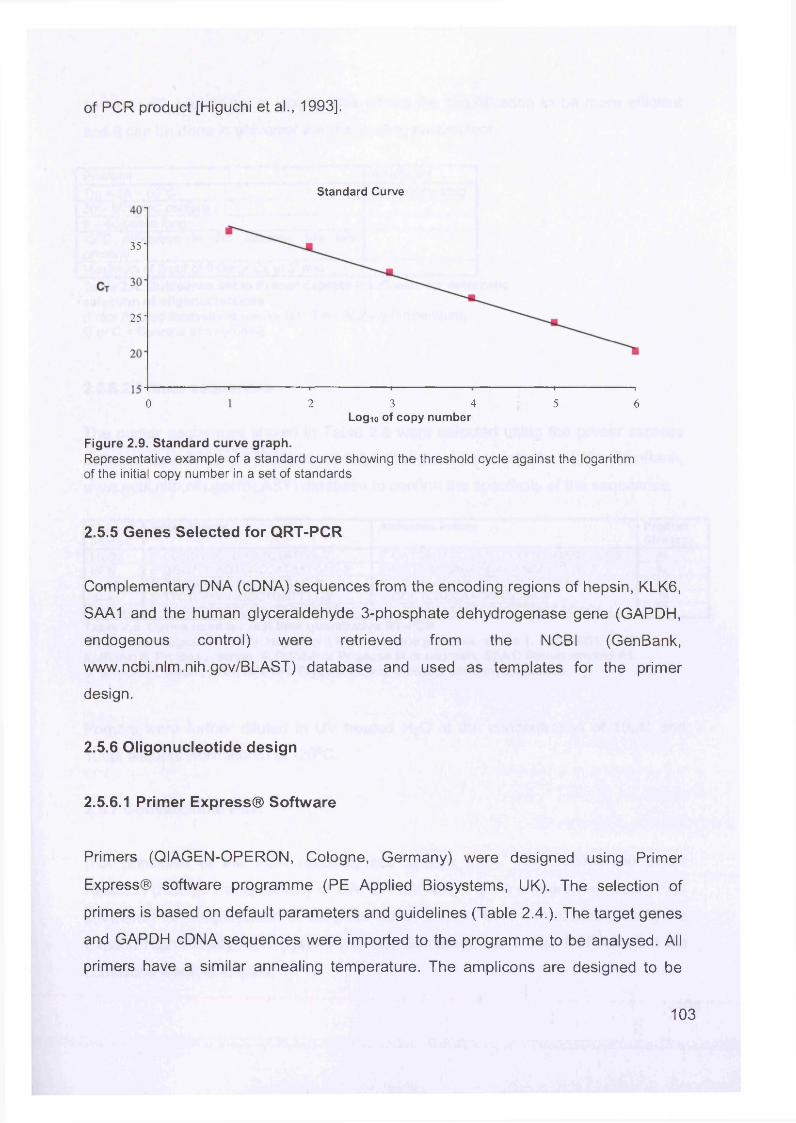
of PCR product [Higuchi et al., 1993].
Standard Curve
35-
25-
2 3 4 50 6Log™ of copy number
Figure 2.9. Standard curve graph.Representative example of a standard curve showing the threshold cycle against the logarithm of the initial copy number in a set of standards
2.5.5 Genes Selected for QRT-PCR
Complementary DNA (cDNA) sequences from the encoding regions of hepsin, KLK6,
SAA1 and the human glyceraldehyde 3-phosphate dehydrogenase gene (GAPDH,
endogenous control) were retrieved from the NCBI (GenBank,
www.ncbi.nlm.nih.gov/BLAST) database and used as templates for the primer
design.
2.5.6 Oligonucleotide design
2.5.6.1 Primer Express® Software
Primers (QIAGEN-OPERON, Cologne, Germany) were designed using Primer
Express® software programme (PE Applied Biosystems, UK). The selection of
primers is based on default parameters and guidelines (Table 2.4.). The target genes
and GAPDH cDNA sequences were imported to the programme to be analysed. All
primers have a similar annealing temperature. The amplicons are designed to be
103
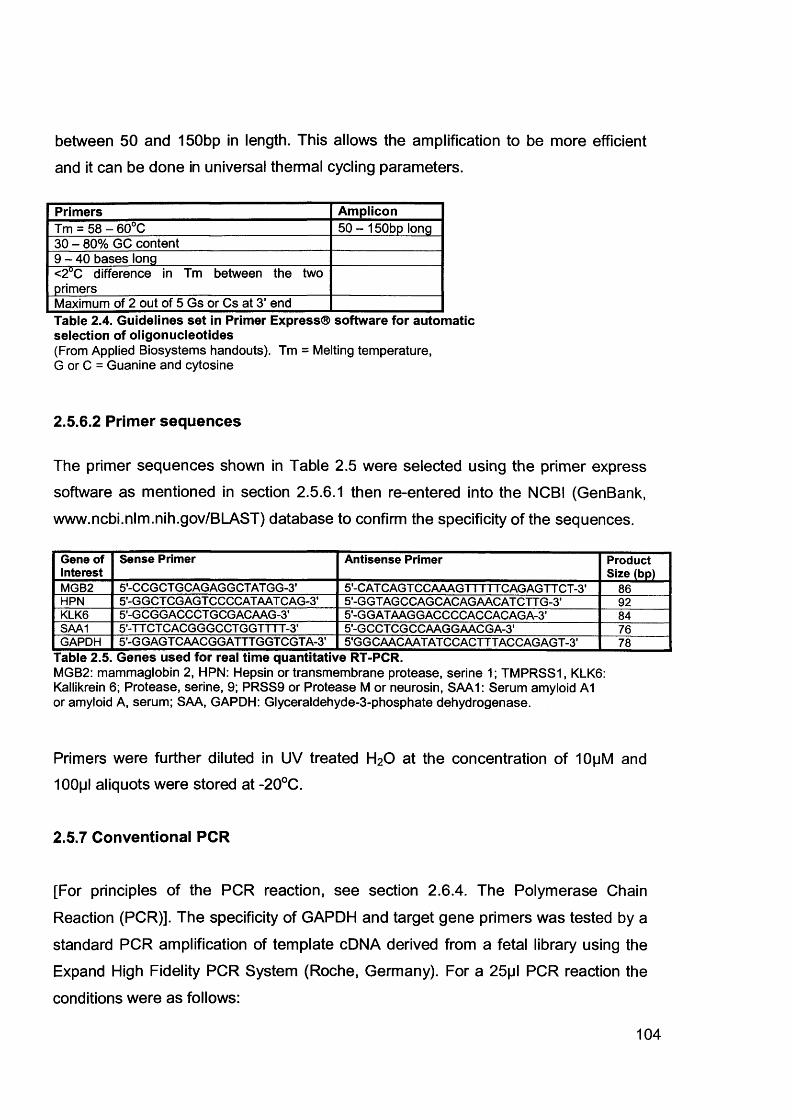
between 50 and 150bp in length. This allows the amplification to be more efficient
and it can be done in universal thermal cycling parameters.
Primers AmpliconTm = 58 - 60°C 50 - 150bp long30 - 80% GC content9 - 4 0 bases long<2°C difference in Tm between the two primersMaximum of 2 out of 5 Gs or Cs at 3’ endTable 2.4. Guidelines set in Primer Express® software for automatic selection of oligonucleotides(From Applied Biosystems handouts). Tm = Melting temperature,G or C = Guanine and cytosine
2.5.6.2 Primer sequences
The primer sequences shown in Table 2.5 were selected using the primer express
software as mentioned in section 2.5.6.1 then re-entered into the NCBI (GenBank,
www.ncbi.nlm.nih.gov/BLAST) database to confirm the specificity of the sequences.
Gene of Interest
Sense Primer Antisense Primer Product Size (bp)
MGB2 S'-CCGCTGCAGAGGCTATGG-S’ 5-CAT CAGT CCAAAGTTTTT CAG AGTT CT -3’ 86HPN 5'-GGCTCGAGTCCCCATAATCAG-3' 5-G GT AGCCAGCACAGAACAT CTT G-3' 92KLK6 5'-GCGGACCCTGCGACAAG-3' 5'-GGATAAGGACCCCACCACAGA-3' 84SAA1 S'-TTCTCACGGGCCTGGTTTT-S’ 5-GCCT CGCCAAGGAACGA-3' 76GAPDH 5'-GGAGTCAACGGATTTGGTCGTA-3' 5'GGCAACAATATCCACTTTACCAGAGT-3' 78
Table 2.5. Genes used for real time quantitative RT-PCR.MGB2: mammaglobin 2, HPN: Hepsin or transmembrane protease, serine 1; TMPRSS1, KLK6: Kallikrein 6; Protease, serine, 9; PRSS9 or Protease M or neurosin, SAA1: Serum amyloid A1 or amyloid A, serum; SAA, GAPDH: Glyceraldehyde-3-phosphate dehydrogenase.
Primers were further diluted in UV treated H20 at the concentration of 10pM and 100pl aliquots were stored at -20°C.
2.5.7 Conventional PCR
[For principles of the PCR reaction, see section 2.6.4. The Polymerase Chain
Reaction (PCR)]. The specificity of GAPDH and target gene primers was tested by a
standard PCR amplification of template cDNA derived from a fetal library using the
Expand High Fidelity PCR System (Roche, Germany). For a 25pl PCR reaction the
conditions were as follows:
104
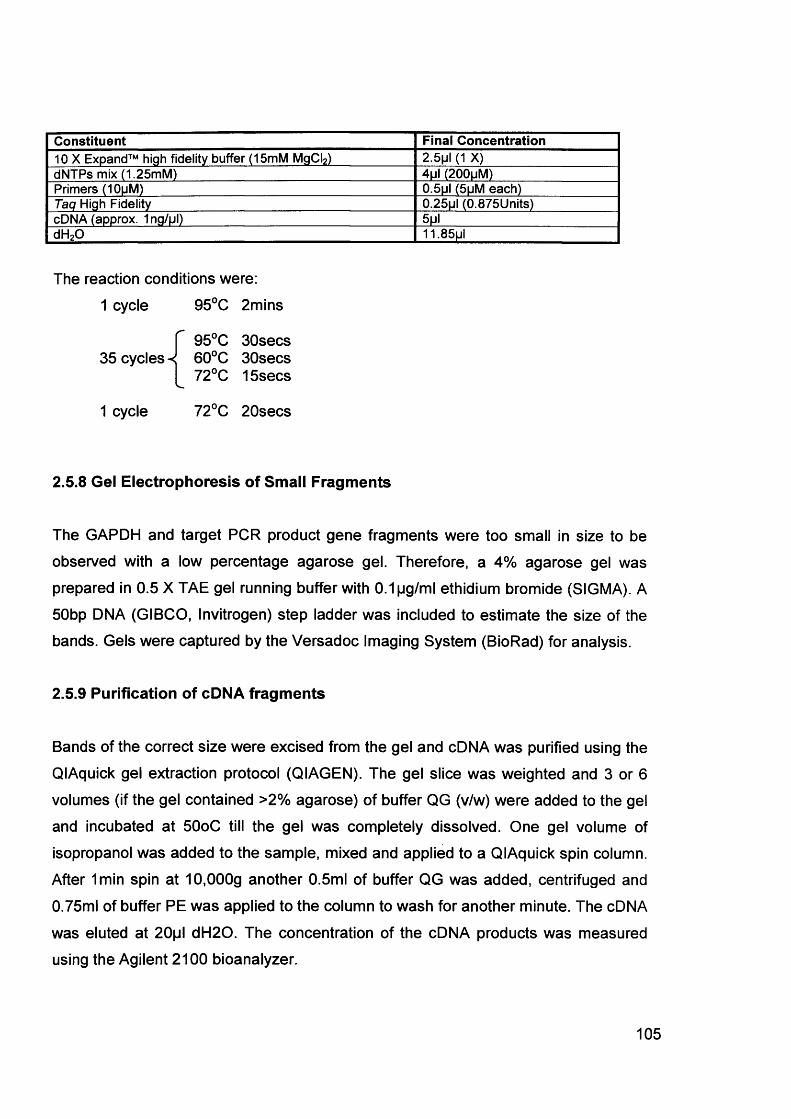
Constituent Final Concentration10 X Expand™ high fidelity buffer (15mM MgCI2) 2.5pl (1 X)dNTPs mix (1.25mM) 4ul (200uM)Primers (10pM) 0.5pl (5pM each)Taq High Fidelity 0.25|jl (0.875Units)cDNA (approx. 1ng/pl) 5pldH20 11.85ul
The reaction conditions were:1 cycle 95°C 2mins
95°C 30secs35 cycles -< 60°C 30secs
72°C 15secs
1 cycle 72°C 20secs
2.5.8 Gel Electrophoresis of Small Fragments
The GAPDH and target PCR product gene fragments were too small in size to be
observed with a low percentage agarose gel. Therefore, a 4% agarose gel was
prepared in 0.5 X TAE gel running buffer with 0.1pg/ml ethidium bromide (SIGMA). A
50bp DNA (GIBCO, Invitrogen) step ladder was included to estimate the size of the bands. Gels were captured by the Versadoc Imaging System (BioRad) for analysis.
2.5.9 Purification of cDNA fragments
Bands of the correct size were excised from the gel and cDNA was purified using the
QIAquick gel extraction protocol (QIAGEN). The gel slice was weighted and 3 or 6 volumes (if the gel contained >2% agarose) of buffer QG (v/w) were added to the gel
and incubated at 50oC till the gel was completely dissolved. One gel volume of isopropanol was added to the sample, mixed and applied to a QIAquick spin column.
After 1min spin at 10,000g another 0.5ml of buffer QG was added, centrifuged and
0.75ml of buffer PE was applied to the column to wash for another minute. The cDNA
was eluted at 20pl dH20. The concentration of the cDNA products was measured
using the Agilent 2100 bioanalyzer.
105
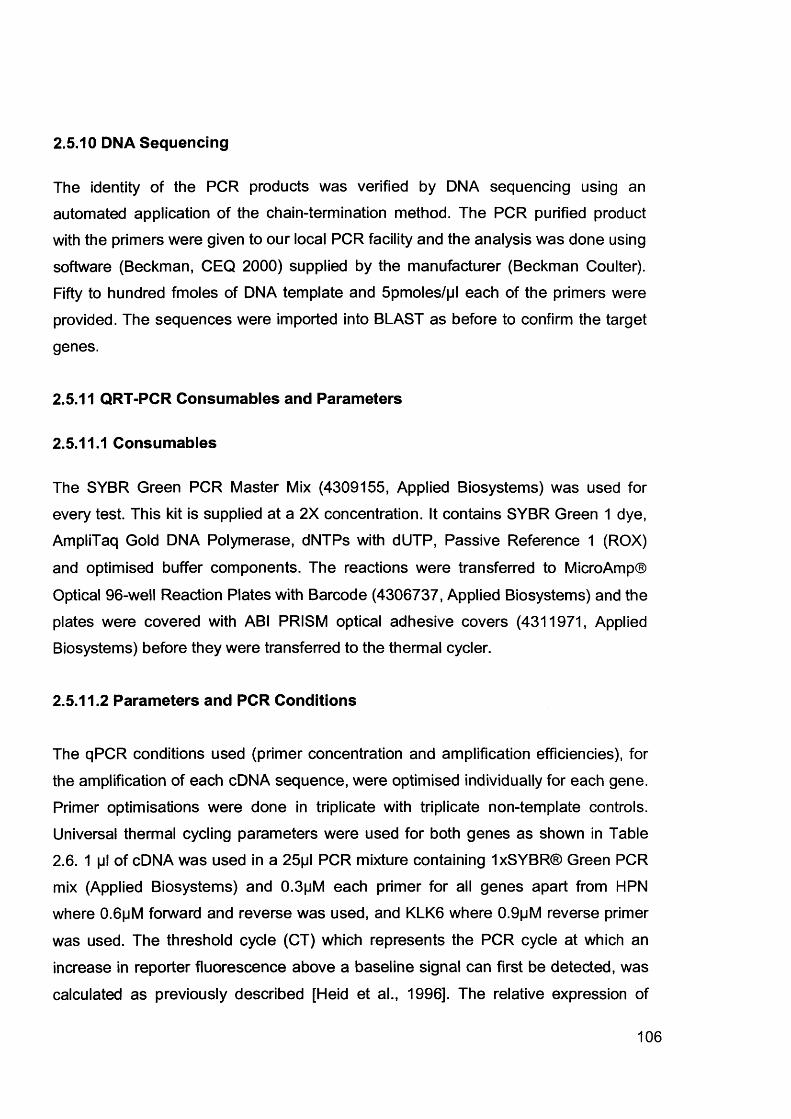
2.5.10 DNA Sequencing
The identity of the PCR products was verified by DNA sequencing using an automated application of the chain-termination method. The PCR purified product with the primers were given to our local PCR facility and the analysis was done using
software (Beckman, CEQ 2000) supplied by the manufacturer (Beckman Coulter).
Fifty to hundred fmoles of DNA template and 5pmoles/pl each of the primers were
provided. The sequences were imported into BLAST as before to confirm the target
genes.
2.5.11 QRT-PCR Consumables and Parameters
2.5.11.1 Consumables
The SYBR Green PCR Master Mix (4309155, Applied Biosystems) was used for
every test. This kit is supplied at a 2X concentration. It contains SYBR Green 1 dye, AmpliTaq Gold DNA Polymerase, dNTPs with dUTP, Passive Reference 1 (ROX)
and optimised buffer components. The reactions were transferred to MicroAmp®
Optical 96-well Reaction Plates with Barcode (4306737, Applied Biosystems) and the
plates were covered with ABI PRISM optical adhesive covers (4311971, Applied Biosystems) before they were transferred to the thermal cycler.
2.5.11.2 Parameters and PCR Conditions
The qPCR conditions used (primer concentration and amplification efficiencies), for
the amplification of each cDNA sequence, were optimised individually for each gene. Primer optimisations were done in triplicate with triplicate non-template controls.
Universal thermal cycling parameters were used for both genes as shown in Table
2.6. 1 pi of cDNA was used in a 25pl PCR mixture containing IxSYBR® Green PCR mix (Applied Biosystems) and 0.3pM each primer for all genes apart from HPN
where 0.6pM forward and reverse was used, and KLK6 where 0.9pM reverse primer
was used. The threshold cycle (CT) which represents the PCR cycle at which an
increase in reporter fluorescence above a baseline signal can first be detected, was
calculated as previously described [Heid et al., 1996]. The relative expression of
106
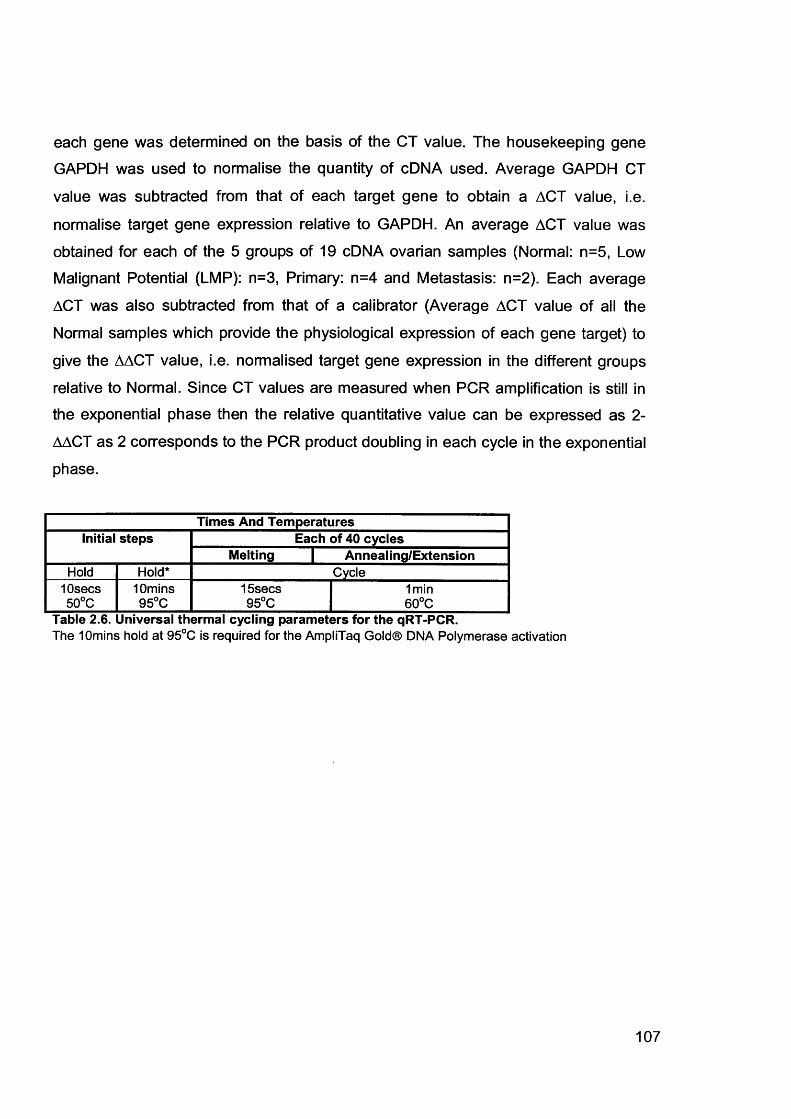
each gene was determined on the basis of the CT value. The housekeeping gene
GAPDH was used to normalise the quantity of cDNA used. Average GAPDH CT
value was subtracted from that of each target gene to obtain a ACT value, i.e.
normalise target gene expression relative to GAPDH. An average ACT value was
obtained for each of the 5 groups of 19 cDNA ovarian samples (Normal: n=5, Low
Malignant Potential (LMP): n=3, Primary: n=4 and Metastasis: n=2). Each average
ACT was also subtracted from that of a calibrator (Average ACT value of all the
Normal samples which provide the physiological expression of each gene target) to
give the AACT value, i.e. normalised target gene expression in the different groups
relative to Normal. Since CT values are measured when PCR amplification is still in
the exponential phase then the relative quantitative value can be expressed as 2-
AACT as 2 corresponds to the PCR product doubling in each cycle in the exponential
phase.
Times And TemperaturesInitial steps Each of 40 cycles
Melting | Annealing/ExtensionHold Hold* Cycle
10secs 10mins 15secs 1min50°C 95°C 95°C 60°C
Table 2.6. Universal thermal cycling parameters for the qRT-PCR.The 10mins hold at 95°C is required for the AmpliTaq Gold® DNA Polymerase activation
107
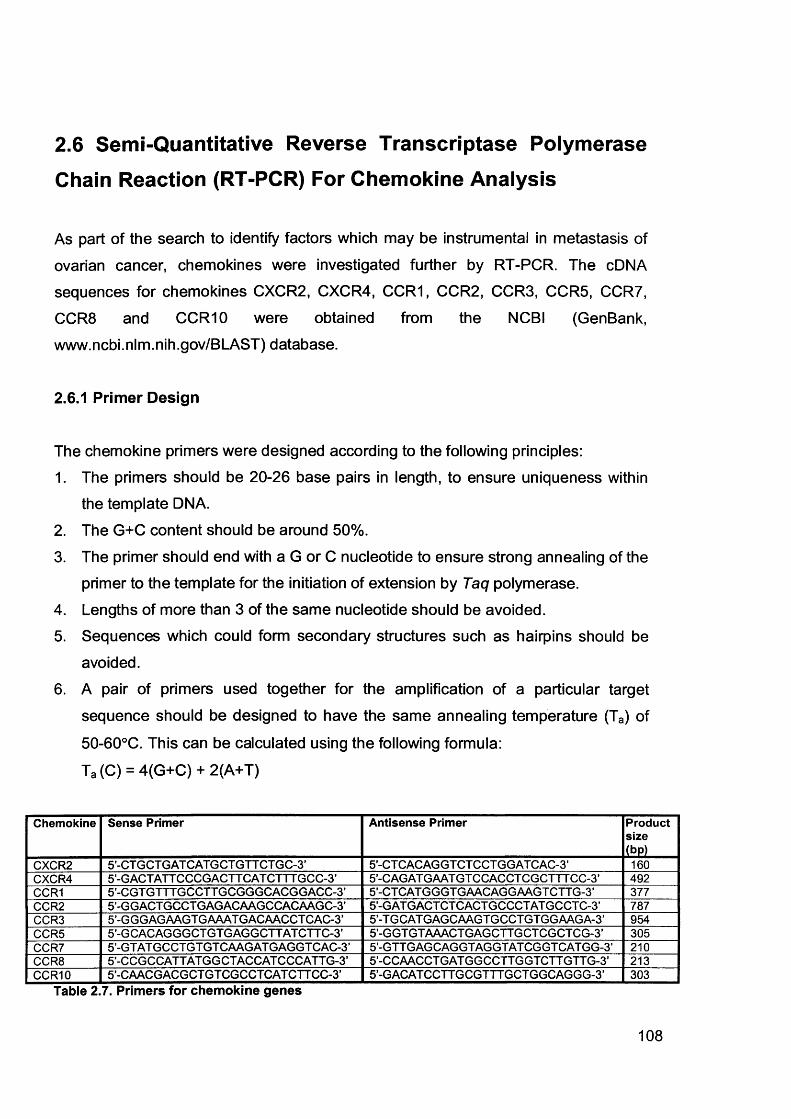
2.6 Semi-Quantitative Reverse Transcriptase Polymerase
Chain Reaction (RT-PCR) For Chemokine Analysis
As part of the search to identify factors which may be instrumental in metastasis of
ovarian cancer, chemokines were investigated further by RT-PCR. The cDNA
sequences for chemokines CXCR2, CXCR4, CCR1, CCR2, CCR3, CCR5, CCR7,
CCR8 and CCR10 were obtained from the NCBI (GenBank, www.ncbi.nlm.nih.gov/BI_AST) database.
2.6.1 Primer Design
The chemokine primers were designed according to the following principles:1. The primers should be 20-26 base pairs in length, to ensure uniqueness within
the template DNA.
2. The G+C content should be around 50%.
3. The primer should end with a G or C nucleotide to ensure strong annealing of theprimer to the template for the initiation of extension by Taq polymerase.
4. Lengths of more than 3 of the same nucleotide should be avoided.5. Sequences which could form secondary structures such as hairpins should be
avoided.
6. A pair of primers used together for the amplification of a particular target
sequence should be designed to have the same annealing temperature (Ta) of
50-60°C. This can be calculated using the following formula:
Ta (C) = 4(G+C) + 2(A+T)
Chemokine Sense Primer Antisense Primer Productsize(bp)
CXCR2 5’-CT GCT GAT CATG CTGTT CTGC-3’ 5’-CT CACAG GT CT CCT GG AT CAC-3’ 160CXCR4 5’-GACTATTCCCGACTT CAT CTTT GCC-3’ 5-CAGAT GAAT GT CCACCT CGCTTT CC-3’ 492CCR1 5’-CGT GTTTGCCTT GCGGGCACGGACC-3’ 5’-CT CAT GGGT GAACAGGAAGT CTTG-3’ 377CCR2 5’-GGACT GCCT GAGACAAGCCACAAGC-3’ 5-GAT G ACT CT CACT GCCCT AT GCCT C-3’ 787CCR3 5’-G GG AG AAGT G AAAT G ACAACCT CAC-3’ 5-TGCAT GAGCAAGTGCCT GT GGAAGA-3’ 954CCR5 5’-GCACAGGGCTGTGAGGCTTATCTTC-3’ 5-G GT GT AAACT GAGCTTGCT CGCT CG-3’ 305CCR7 5’-GTAT GCCT GT GT CAAGAT GAGGT CAC-3’ 5-G TT GAGCAGGT AGGT AT CGGT CAT GG-3’ 210CCR8 5’-CCGCCATTATGGCTACCATCCCATTG-3’ 5-CCAACCT GAT GGCCTTGGTCTT GTT G-3’ 213CCR10 5’-CAACG ACGCT GT CGCCT CAT CTT CC-3’ 5-GACATCCTTGCGTTTGCTGGCAGGG-3’ 303
Table 2.7. Primers for chemokine genes
108
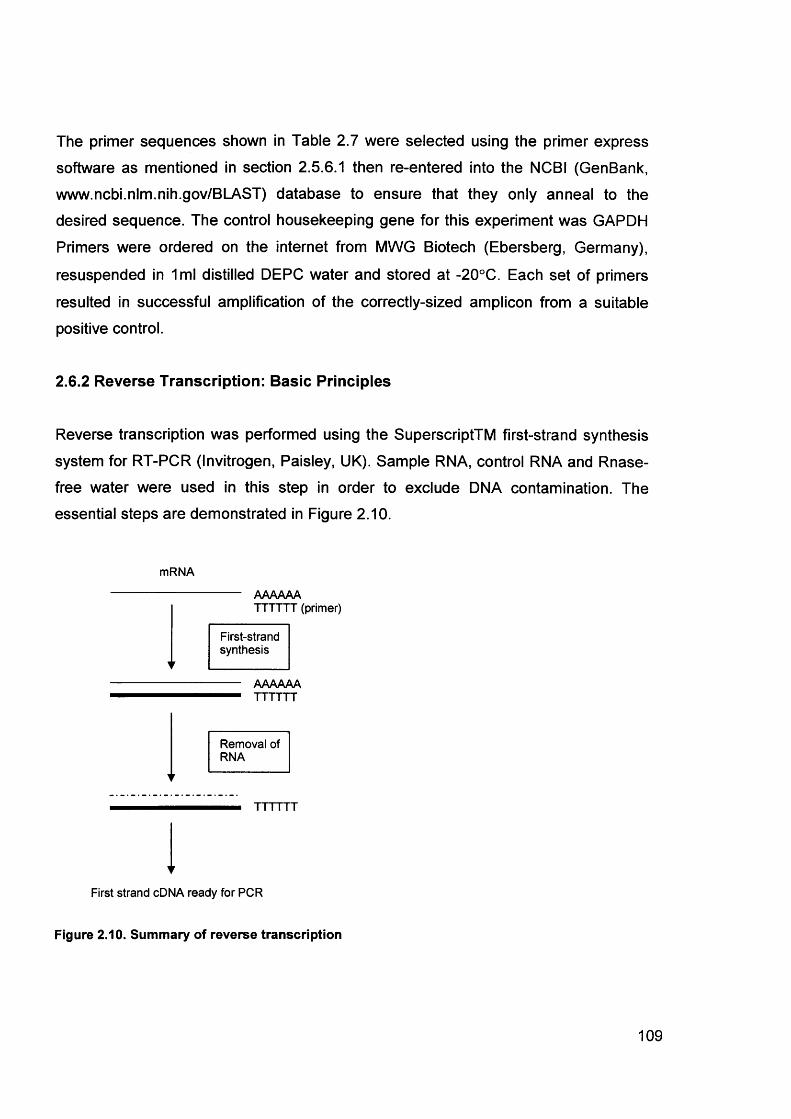
The primer sequences shown in Table 2.7 were selected using the primer express
software as mentioned in section 2.5.6.1 then re-entered into the NCBI (GenBank, www.ncbi.nlm.nih.gov/BLAST) database to ensure that they only anneal to the desired sequence. The control housekeeping gene for this experiment was GAPDH
Primers were ordered on the internet from MWG Biotech (Ebersberg, Germany),
resuspended in 1ml distilled DEPC water and stored at -20°C. Each set of primers
resulted in successful amplification of the correctly-sized amplicon from a suitable positive control.
2.6.2 Reverse Transcription: Basic Principles
Reverse transcription was performed using the SuperscriptTM first-strand synthesis
system for RT-PCR (Invitrogen, Paisley, UK). Sample RNA, control RNA and Rnase- free water were used in this step in order to exclude DNA contamination. The essential steps are demonstrated in Figure 2.10.
mRNA
AAAAAATTTTTT (primer)
V
First-strandsynthesis
AAAAAATTTTTT
Removal of RNA
TTTTTT
First strand cDNA ready for PCR
Figure 2.10. Summary of reverse transcription
109
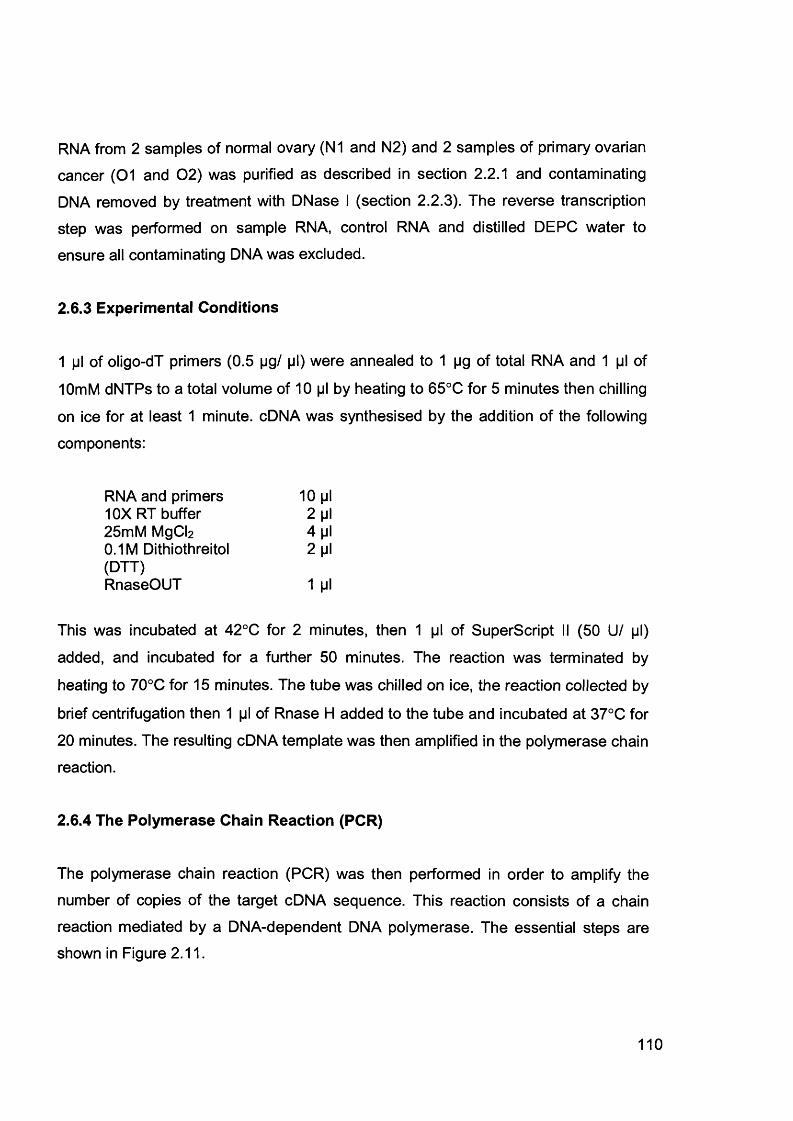
RNA from 2 samples of normal ovary (N1 and N2) and 2 samples of primary ovarian
cancer (01 and 02) was purified as described in section 2.2.1 and contaminating
DNA removed by treatment with DNase I (section 2.2.3). The reverse transcription
step was performed on sample RNA, control RNA and distilled DEPC water to
ensure all contaminating DNA was excluded.
2.6.3 Experimental Conditions
1 pi of oligo-dT primers (0.5 pg/ pi) were annealed to 1 pg of total RNA and 1 pi of
10mM dNTPs to a total volume of 10 pi by heating to 65°C for 5 minutes then chilling
on ice for at least 1 minute. cDNA was synthesised by the addition of the following
components:
RNA and primers 10 pi10X RT buffer 2 pi25mM MgCb 4 pi0.1M Dithiothreitol 2 pi(DTT)RnaseOUT 1 pi
This was incubated at 42°C for 2 minutes, then 1 pi of Superscript II (50 U/ pi)
added, and incubated for a further 50 minutes. The reaction was terminated by
heating to 70°C for 15 minutes. The tube was chilled on ice, the reaction collected by
brief centrifugation then 1 pi of Rnase H added to the tube and incubated at 37°C for
20 minutes. The resulting cDNA template was then amplified in the polymerase chain reaction.
2.6.4 The Polymerase Chain Reaction (PCR)
The polymerase chain reaction (PCR) was then performed in order to amplify the
number of copies of the target cDNA sequence. This reaction consists of a chain
reaction mediated by a DNA-dependent DNA polymerase. The essential steps are shown in Figure 2.11.
110
Template DNA
1§t cycle
Gene of interest
4tt cycle
2“ cycle
<
<cycle
<< Exponential
amplification
<
C
<2 copies 4 copies copies 16 copies
Figure 2.11. Basic steps of a PCR reaction.
2.6.5 Prevention of Contamination
PCR is used to amplify specific DNA sequences. Hence, it is susceptible to
contamination by foreign DNA, from other objects or the atmosphere, resulting in the
amplification of this DNA, rather than the experimental DNA. Therefore, the following
strict precautions were taken to minimise this risk:
1. The use of a designated “PCR room” where no DNA is permitted. All
components of the reaction mixture were added here; the target DNA was then
added afterwards in a separate room.
2. All equipment and surfaces were cleaned with 100% ethanol prior to use.
3. A clean laboratory coat was worn, which remained in the PCR room at all times.
4. A clean, ultraviolet (UV)-irradiated containment hood with filtered air.
5. The use of autoclaved, double-distilled water.
6. The use of filter pipette tips to avoid aerosol contamination.
111
7. UV irradiation of all reaction tubes and water before setting up the PCR reaction.
8. Not touching anything with the pipette tip, except the inside of the reagent and
reaction tubes.9. Opening the reaction tubes for as short a time as possible to permit the addition
of each reagent whilst preventing the entry of contaminants.
10. The use of small batches of samples so that any contamination affects only a
small number of reactions.11. The inclusion of negative controls containing water instead of DNA between
every 3-4 samples.12. The storage of reagents and pipette tips separately to other users.
2.6.6 Basic Principles
The components of a PCR reaction include the target sequence to be amplified, in this case, cDNA, oligonucleotide primers which are specific for the sequences flanking the target DNA fragment, buffer solution which contains salts to facilitate the polymerisation, DNA polymerase and dNTPs (deoxynucleotide triphosphates). Taq
polymerase has been used in this study because it can resist temperatures above
96°C without becoming denatured, thereby being able to withstand the thermal
cycling necessary to continuously denature and re-anneal the strands of synthesised
DNA. A standard thermal cycling program consists of 30 cycles of amplification, and this typically results in the production of 230 copies of target DNA.
The PCR reaction works at different temperatures, depending upon the optimum
temperature of each reaction. The first step is a denaturing step to break any double
stranded DNA to single strands. Next, the temperature is lowered (50-60°C) so the
primers can anneal to their complementary sites on the single-stranded genomic
DNA. The temperature is then held at a short time for the Taq polymerase to work
optimally (72°C), allowing the extension of the DNA chain from the annealed primers.
The single-stranded DNA acts as a template on which the polymerase builds the complementary strand using the dNTP molecules. Once this extension step is
completed, the temperature is raised to 96°C in order to denature the newly-formed
double-stranded DNA, then the process repeats itself. This cyclical procedure results
112
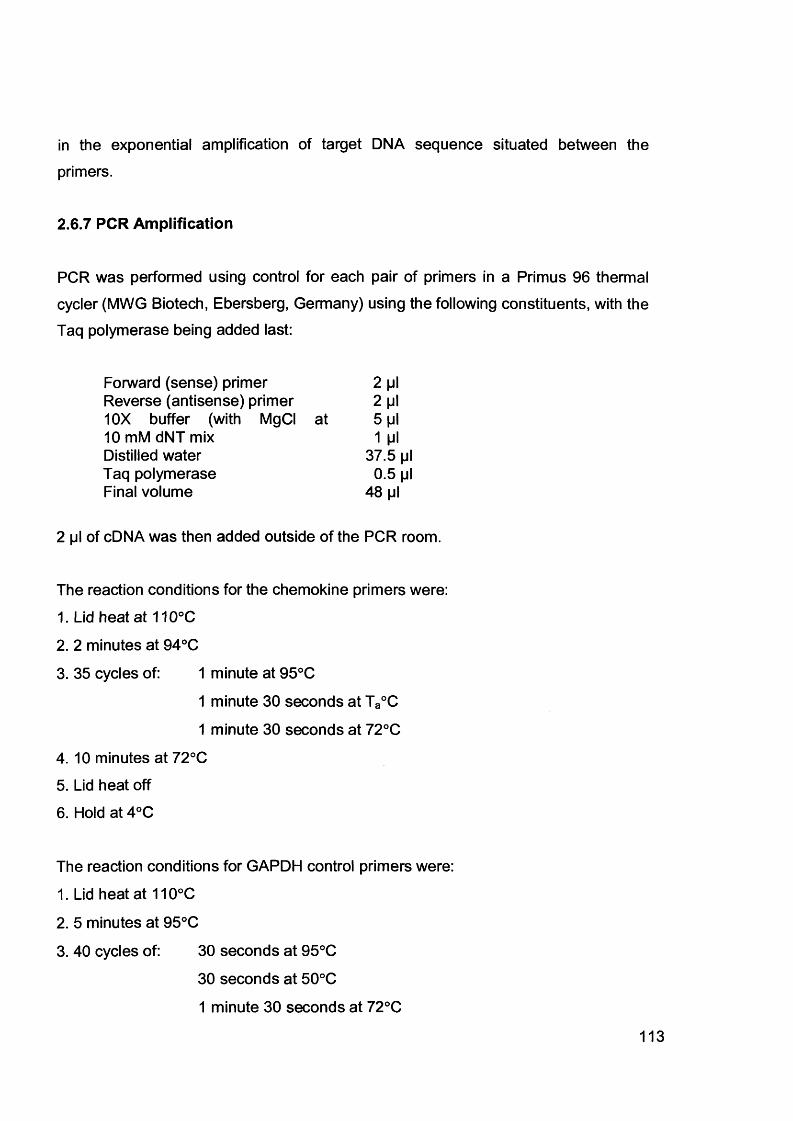
in the exponential amplification of target DNA sequence situated between the
primers.
2.6.7 PCR Amplification
PCR was performed using control for each pair of primers in a Primus 96 thermal
cycler (MWG Biotech, Ebersberg, Germany) using the following constituents, with the Taq polymerase being added last:
Forward (sense) primer 2 piReverse (antisense) primer 2 pi10X buffer (with MgCI at 5 pi10 mM dNT mix 1 piDistilled water 37.5 piTaq polymerase 0.5 piFinal volume 48 pi
2 pi of cDNA was then added outside of the PCR room.
The reaction conditions for the chemokine primers were:
1. Lid heat at 110°C
2. 2 minutes at 94°C
3. 35 cycles of: 1 minute at 95°C
1 minute 30 seconds at Ta°C
1 minute 30 seconds at 72°C
4. 10 minutes at 72°C
5. Lid heat off
6. Hold at 4°C
The reaction conditions for GAPDH control primers were:
1. Lid heat at 110°C
2. 5 minutes at 95°C
3. 40 cycles of: 30 seconds at 95°C
30 seconds at 50°C
1 minute 30 seconds at 72°C
113
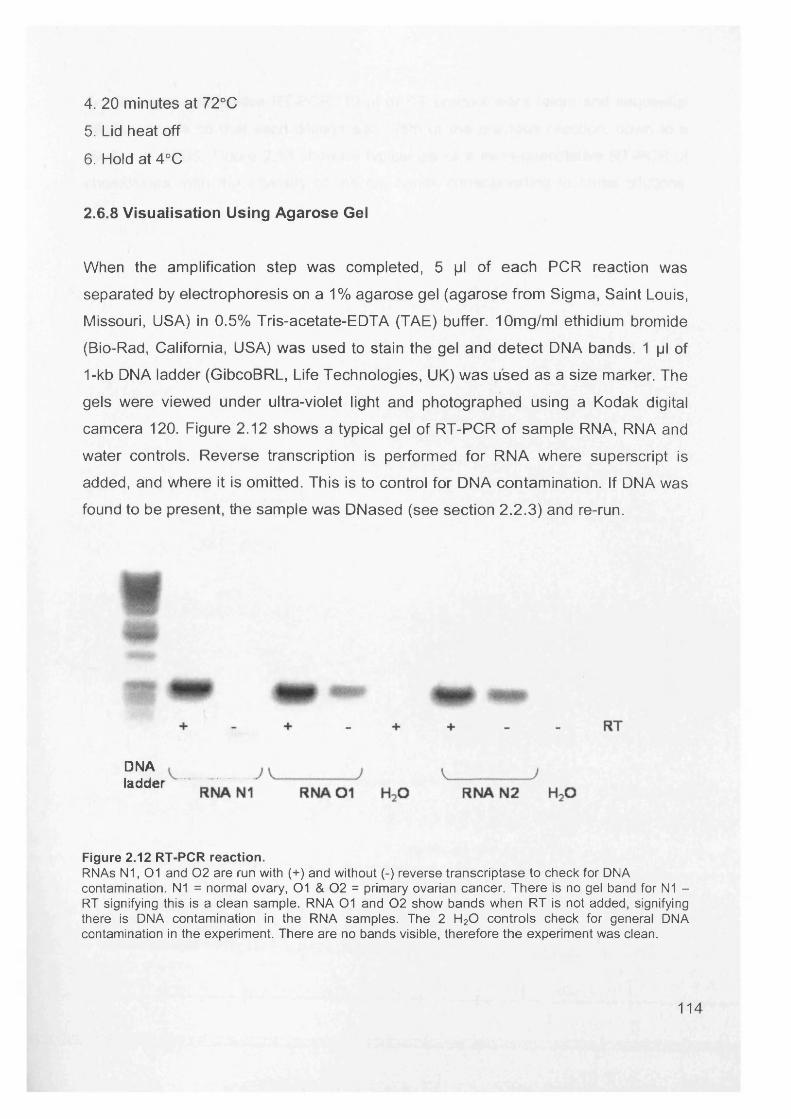
4. 20 minutes at 72°C
5. Lid heat off
6. Hold at 4°C
2.6.8 Visualisation Using Agarose Gel
When the amplification step was completed, 5 pi of each PCR reaction was
separated by electrophoresis on a 1% agarose gel (agarose from Sigma, Saint Louis,
Missouri, USA) in 0.5% Tris-acetate-EDTA (TAE) buffer. 10mg/ml ethidium bromide
(Bio-Rad, California, USA) was used to stain the gel and detect DNA bands. 1 pi of
1-kb DNA ladder (GibcoBRL, Life Technologies, UK) was used as a size marker. The
gels were viewed under ultra-violet light and photographed using a Kodak digital
camcera 120. Figure 2.12 shows a typical gel of RT-PCR of sample RNA, RNA and
water controls. Reverse transcription is performed for RNA where superscript is
added, and where it is omitted. This is to control for DNA contamination. If DNA was
found to be present, the sample was DNased (see section 2.2.3) and re-run.
DNAladder
Figure 2.12 RT-PCR reaction.RNAs N1, 01 and 0 2 are run with (+) and without (-) reverse transcriptase to check for DNA contamination. N1 = normal ovary, 01 & 0 2 = primary ovarian cancer. There is no gel band for N1 - RT signifying this is a clean sample. RNA 01 and 0 2 show bands when RT is not added, signifying there is DNA contamination in the RNA samples. The 2 H20 controls check for general DNA contamination in the experiment. There are no bands visible, therefore the experiment was clean.
114

For the semi-quantitative RT-PCR, 10 |jl of RT product were taken and sequential
dilutions made so that each dilution was 1/5th of the previous reaction, down to a
dilution of 1/625. Figure 2.13 shows a typical gel of a semi-quantitative RT-PCR of chemokines, with the intensity of the gel bands corresponding to serial dilutions.
115
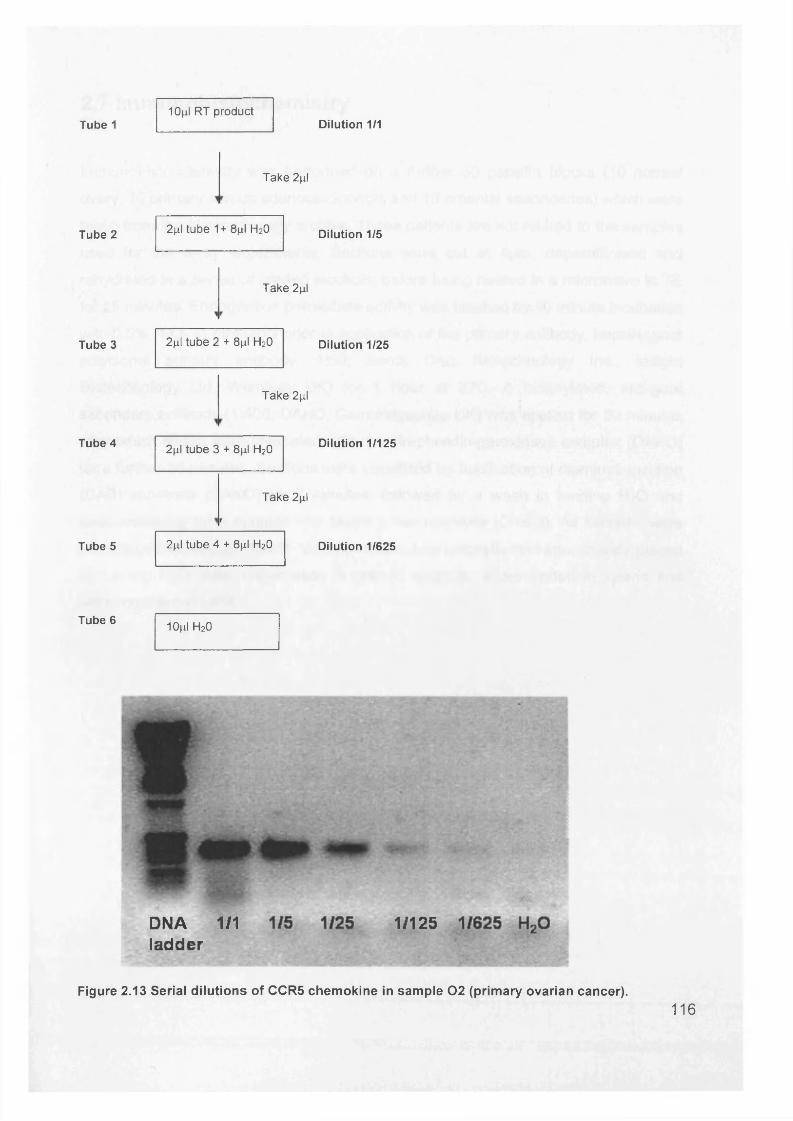
Tube 110fil RT product
Dilution 1/1
Take 2|il
Tube 2 2|il tube 1+ 8pl H20 Dilution 1/5
Take 2pl
Tube 3 2pl tube 2 + 8|il H20 Dilution 1/25
Take 2|il
Tube 4
Tube 5
2pl tube 3 + 8pl H20 Dilution 1/125
Take 2pl
r
2[i\ tube 4 + 8pl H20 Dilution 1/625
Tube 6 10jxl h2o
f&r -
DNA 1/1 ladder
1/125
Figure 2.13 Serial dilutions of CCR5 chemokine in sample 0 2 (primary ovarian cancer).116
2.7 Immunohistochemistry
Immunohistochemistry was performed on a further 30 paraffin blocks (10 normal ovary, 10 primary serous adenocarcinomas and 10 omental secondaries) which were
taken from the histopathology archive. These patients are not related to the samples
used for the array experiments. Sections were cut at 4pm, deparaffinised and rehydrated in a series of graded alcohols, before being heated in a microwave in TE
for 25 minutes. Endogenous peroxidase activity was blocked by 10 minute incubation
with 0.5% H2 O2 in methanol prior to application of the primary antibody, hepsin (goat
polyclonal primary antibody, 1:50; Santa Cruz Biotechnology Inc., Insight
Biotechnology Ltd, Wembley UK) for 1 hour at 22C. A biotinylated, anti-goat
secondary antibody (1:400; DAKO, Cambridgeshire UK) was applied for 30 minutes after which slides were incubated with the streptavidin-peroxidase complex (DAKO)
for a further 30 minutes. Sections were visualized by application of diaminobenzidine (DAB) substrate (DAKO) for 7 minutes, followed by a wash in running H20 and counterstaining for 2 minutes with Mayer’s haematoxylin (DAKO). All sections were then dipped in acid alcohol to remove excess haematoxylin and immediately placed
in running H20. After dehydration in graded alcohols, slides ended in xylene and were mounted in DPX.
117
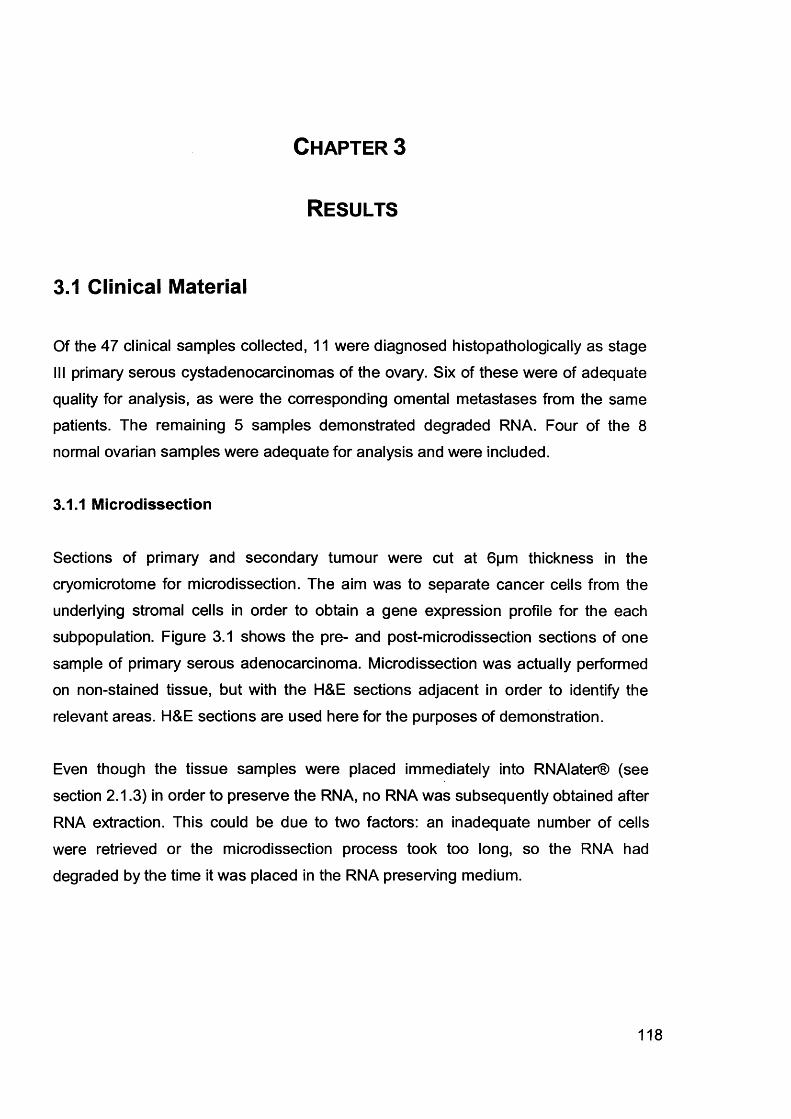
Chapter 3
Results
3.1 Clinical Material
Of the 47 clinical samples collected, 11 were diagnosed histopathologically as stage III primary serous cystadenocarcinomas of the ovary. Six of these were of adequate
quality for analysis, as were the corresponding omental metastases from the same patients. The remaining 5 samples demonstrated degraded RNA. Four of the 8
normal ovarian samples were adequate for analysis and were included.
3.1.1 Microdissection
Sections of primary and secondary tumour were cut at 6pm thickness in the cryomicrotome for microdissection. The aim was to separate cancer cells from the underlying stromal cells in order to obtain a gene expression profile for the each subpopulation. Figure 3.1 shows the pre- and post-microdissection sections of one
sample of primary serous adenocarcinoma. Microdissection was actually performed on non-stained tissue, but with the H&E sections adjacent in order to identify the
relevant areas. H&E sections are used here for the purposes of demonstration.
Even though the tissue samples were placed immediately into RNAIater® (see
section 2.1.3) in order to preserve the RNA, no RNA was subsequently obtained after
RNA extraction. This could be due to two factors: an inadequate number of cells were retrieved or the microdissection process took too long, so the RNA had
degraded by the time it was placed in the RNA preserving medium.
118
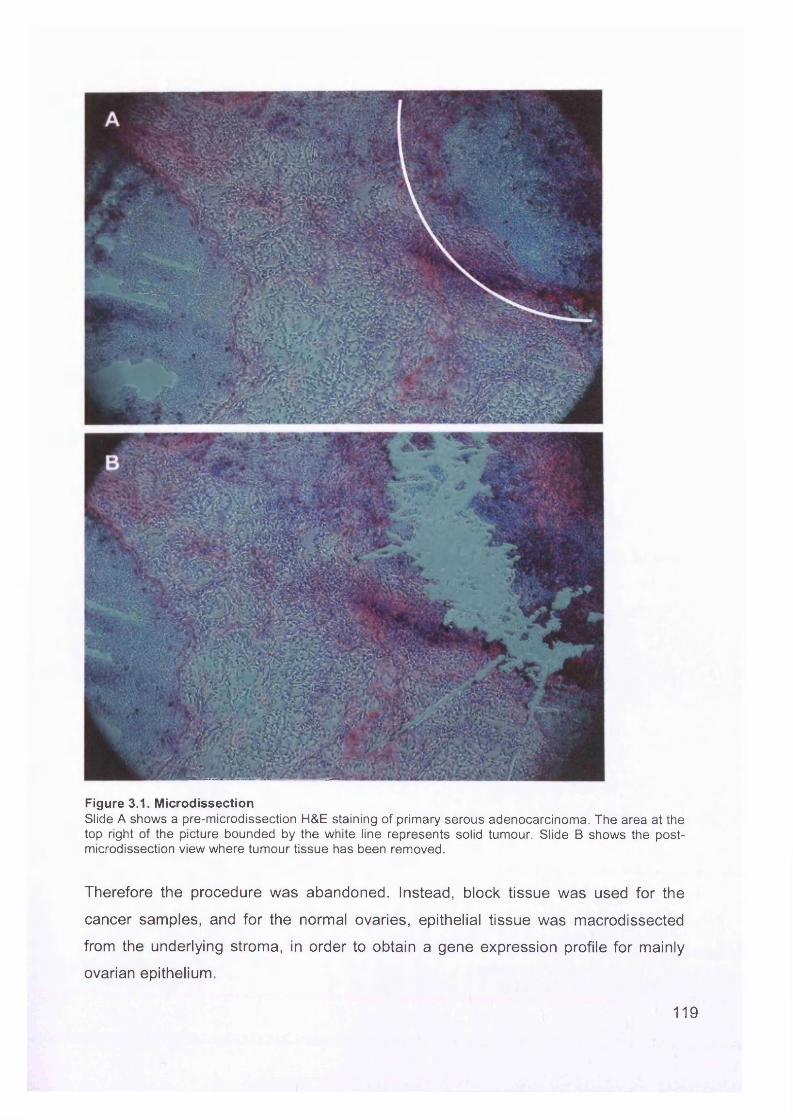
Figure 3.1. MicrodissectionSlide A shows a pre-microdissection H&E staining of primary serous adenocarcinoma. The area at the top right of the picture bounded by the white line represents solid tumour. Slide B shows the postmicrodissection view where tumour tissue has been removed.
Therefore the procedure was abandoned. Instead, block tissue was used for the
cancer samples, and for the normal ovaries, epithelial tissue was macrodissected
from the underlying stroma, in order to obtain a gene expression profile for mainly
ovarian epithelium.
119
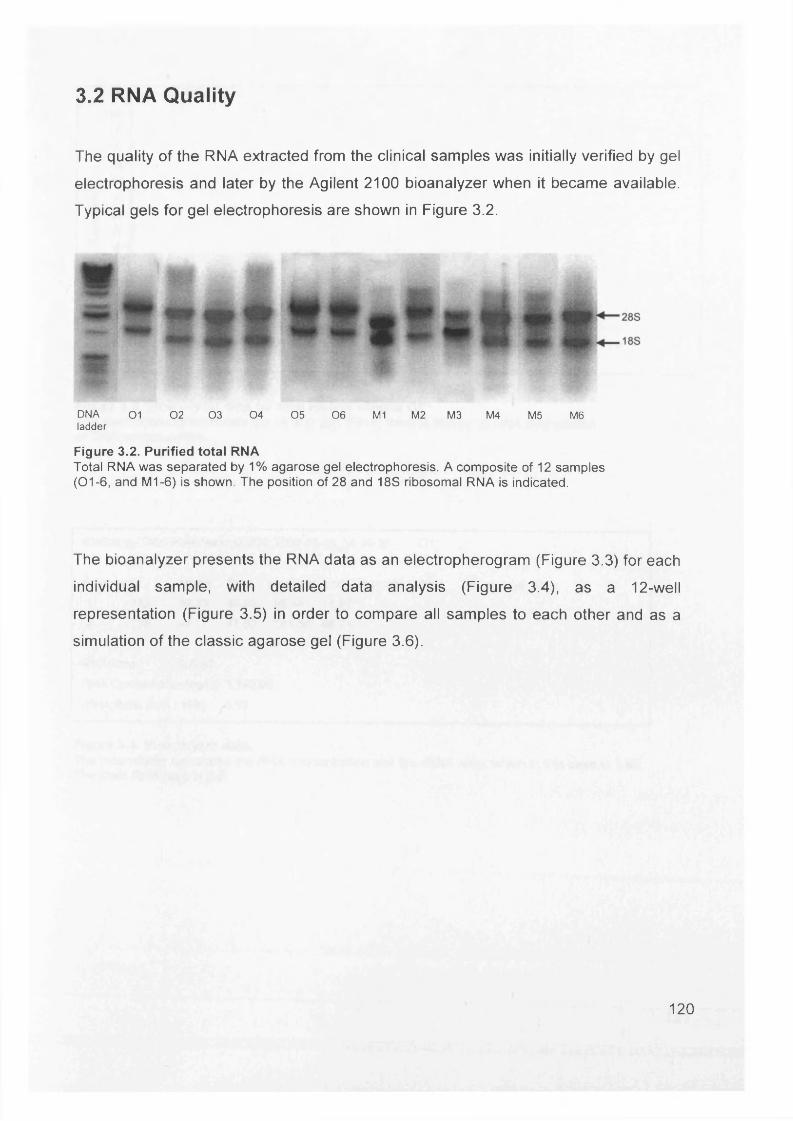
3.2 RNA Quality
The quality of the RNA extracted from the clinical samples was initially verified by gel
electrophoresis and later by the Agilent 2100 bioanalyzer when it became available.
Typical gels for gel electrophoresis are shown in Figure 3.2.
DNA 0 1 0 2 0 3 0 4 0 5 0 6 M1 M2 M 3 M4 M5 M6ladder
Figure 3.2. Purified total RNATotal RNA was separated by 1% agarose gel electrophoresis. A composite of 12 samples (01-6, and M1-6) is shown. The position of 28 and 18S ribosomal RNA is indicated.
The bioanalyzer presents the RNA data as an electropherogram (Figure 3.3) for each
individual sample, with detailed data analysis (Figure 3.4), as a 12-well
representation (Figure 3.5) in order to compare all samples to each other and as a
simulation of the classic agarose gel (Figure 3.6).
120
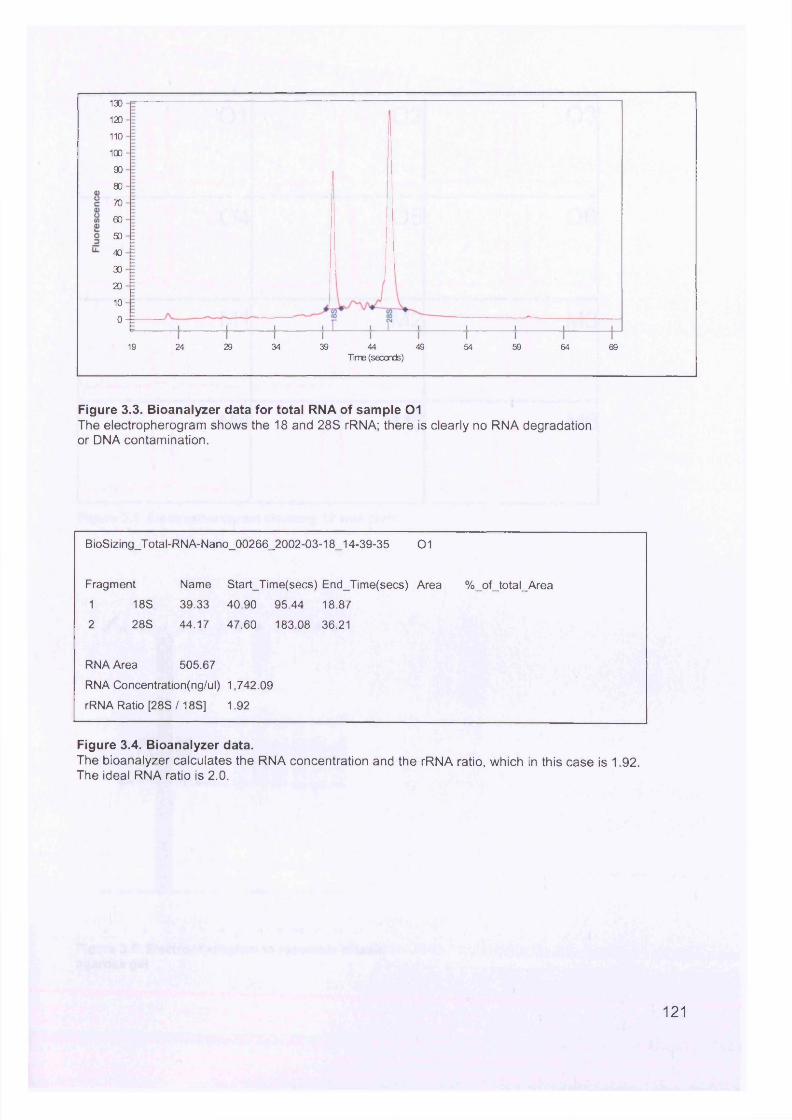
130
120
110
100
90
80
70
60
50
40
30
20
10
0
19 24 29 34 39 44 49 5954 64 69Time (seconds)
Figure 3.3. Bioanalyzer data for total RNA of sample 01The electropherogram shows the 18 and 28S rRNA; there is clearly no RNA degradation or DNA contamination.
BioSizing_Total-RNA-Nano_00266_2002-03-18_14-39-35 01
Fragment Name Start_Time(secs) End_Time(secs) Area %_of_total_Area
1 18S 39.33 40.90 95.44 18.87
2 28S 44.17 47.60 183.08 36.21
RNA Area 505.67
RNA Concentration(ng/ul) 1,742.09
rRNA Ratio [28S/18S] 1.92
Figure 3.4. Bioanalyzer data.The bioanalyzer calculates the RNA concentration and the rRNA ratio, which in this case is 1.92. The ideal RNA ratio is 2.0.
121
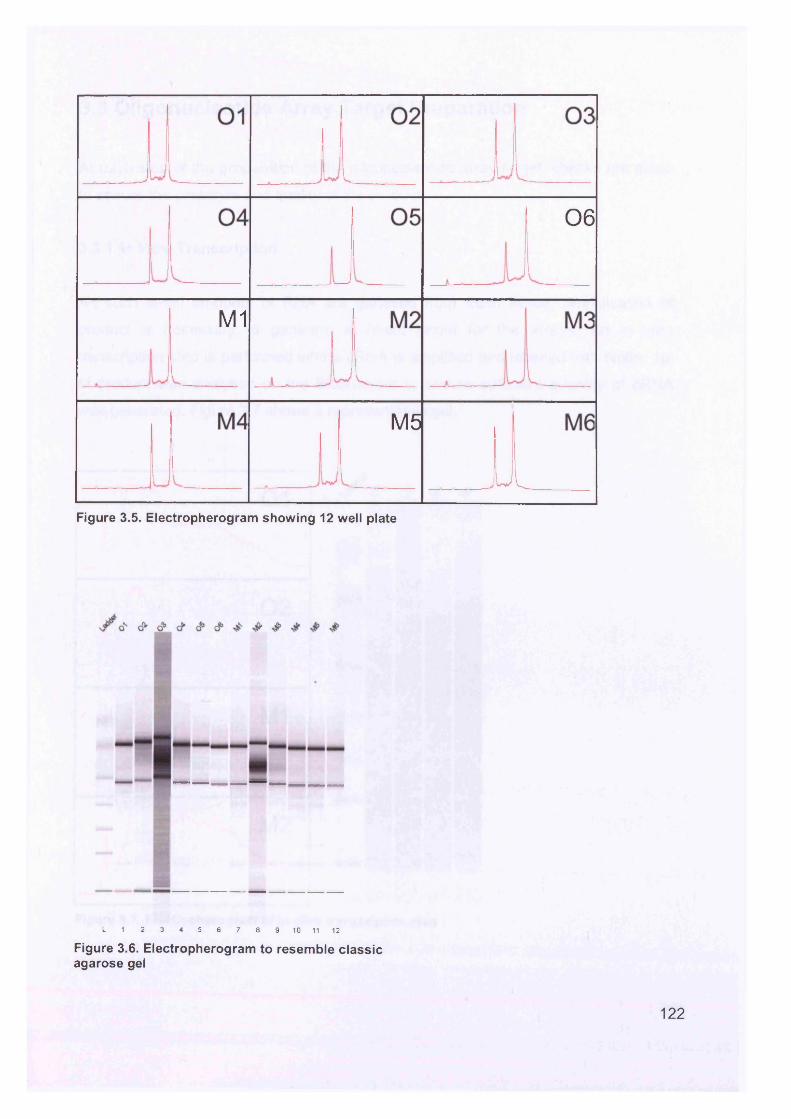
06
M1
M5
ULFigure 3.5. Electropherogram showing 12 well plate
L 1 2 3 4 5 6 7 8 9 10 11 12
Figure 3.6. Electropherogram to resemble classic agarose gel
122
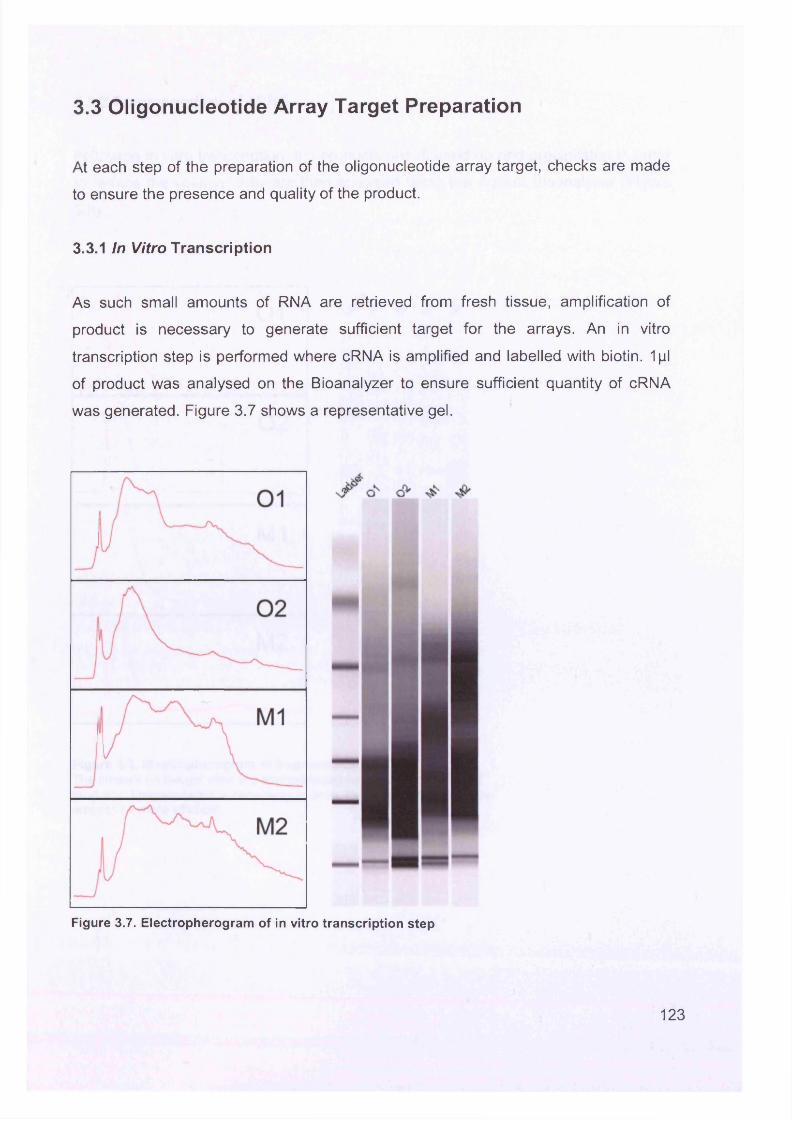
3.3 Oligonucleotide Array Target Preparation
At each step of the preparation of the oligonucleotide array target, checks are made
to ensure the presence and quality of the product.
3.3.1 In Vitro Transcription
As such small amounts of RNA are retrieved from fresh tissue, amplification of
product is necessary to generate sufficient target for the arrays. An in vitro
transcription step is performed where cRNA is amplified and labelled with biotin. 1pl
of product was analysed on the Bioanalyzer to ensure sufficient quantity of cRNA
was generated. Figure 3.7 shows a representative gel.
Figure 3.7. Electropherogram of in vitro transcription step
123
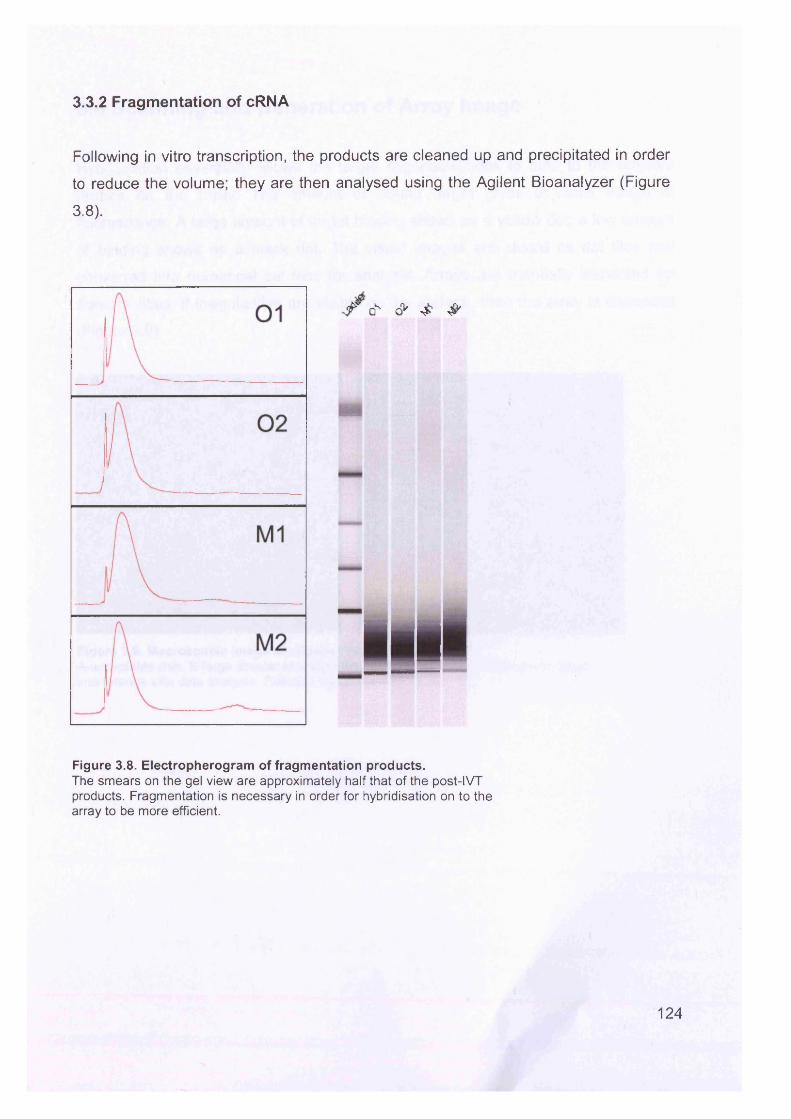
3.3.2 Fragmentation of cRNA
Following in vitro transcription, the products are cleaned up and precipitated in order
to reduce the volume; they are then analysed using the Agilent Bioanalyzer (Figure
3.8).
/ o ' - & J &
■allFigure 3.8. Electropherogram of fragmentation products.The smears on the gel view are approximately half that of the post-IVT products. Fragmentation is necessary in order for hybridisation on to the array to be more efficient.
124
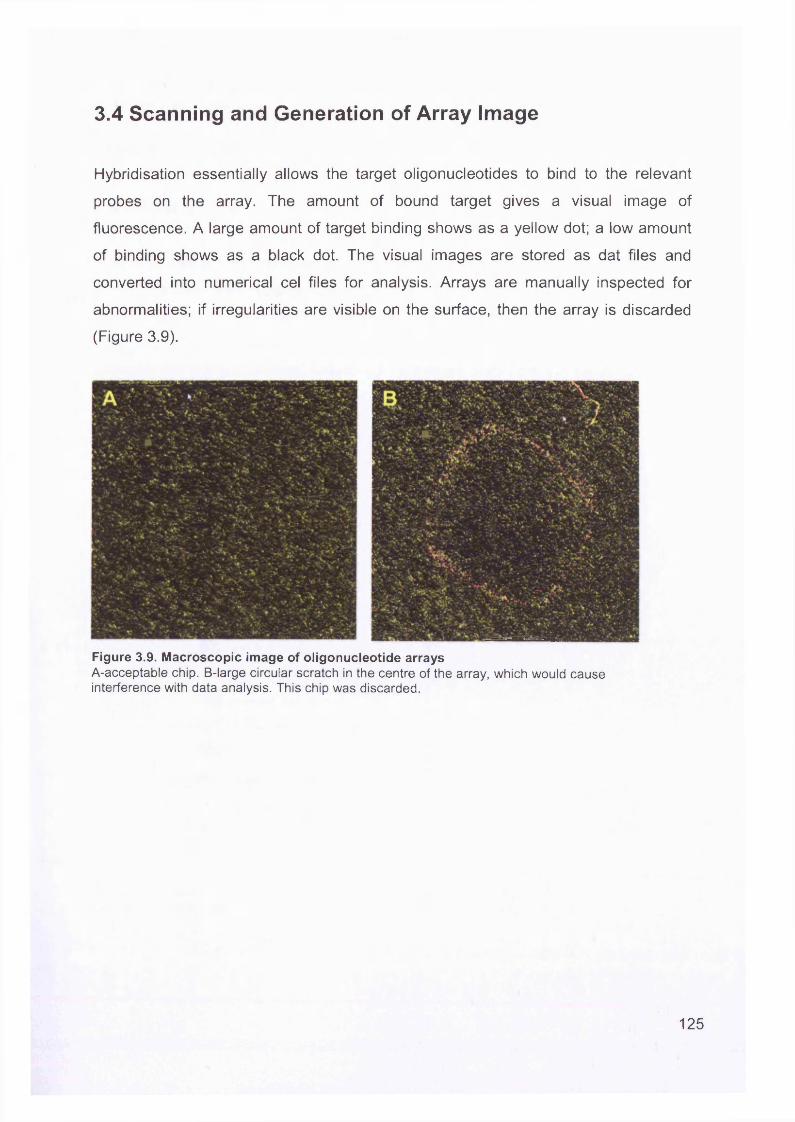
3.4 Scanning and Generation of Array Image
Hybridisation essentially allows the target oligonucleotides to bind to the relevant
probes on the array. The amount of bound target gives a visual image of
fluorescence. A large amount of target binding shows as a yellow dot; a low amount
of binding shows as a black dot. The visual images are stored as dat files and
converted into numerical cel files for analysis. Arrays are manually inspected for
abnormalities; if irregularities are visible on the surface, then the array is discarded
(Figure 3.9).
Figure 3.9. Macroscopic image of oligonucleotide arraysA-acceptable chip. B-large circular scratch in the centre of the array, which would cause interference with data analysis. This chip was discarded.
125
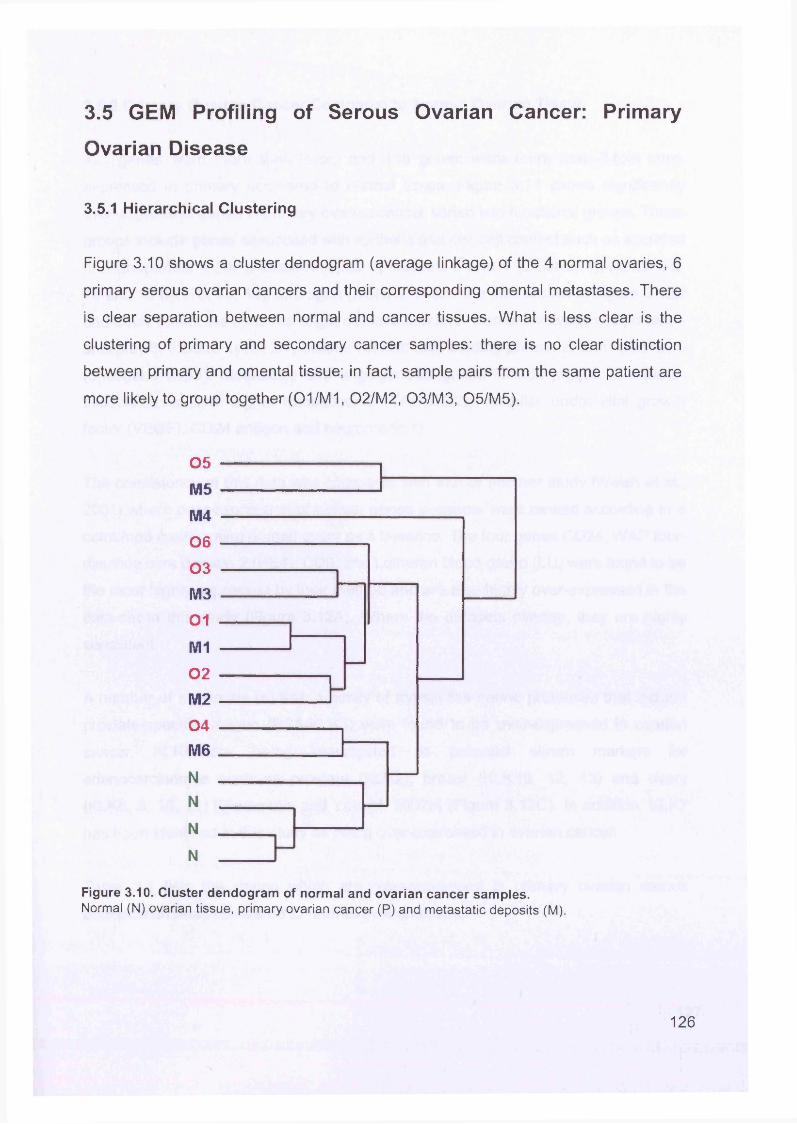
3.5 GEM Profiling of Serous Ovarian Cancer: Primary
Ovarian Disease
3.5.1 Hierarchical Clustering
Figure 3.10 shows a cluster dendogram (average linkage) of the 4 normal ovaries, 6
primary serous ovarian cancers and their corresponding omental metastases. There
is clear separation between normal and cancer tissues. What is less clear is the
clustering of primary and secondary cancer samples: there is no clear distinction
between primary and omental tissue; in fact, sample pairs from the same patient are
more likely to group together (01/M1, 02/M2, 03/M3, 05/M5).
05 ------------------------------ 1M5 ------------------------------M4 ----------------------------------------------06 ----------------------------03 ----------------------,M3 ---------------------- ---------01 --------------
M1 -------------02 ---- 1 ______________M2 ---------------------104 -----------------------M6 _____________N ________________ ___N ________ _
N ______ _______
N ______ I
Figure 3.10. Cluster dendogram of normal and ovarian cancer samples.Normal (N) ovarian tissue, primary ovarian cancer (P) and metastatic deposits (M).
126
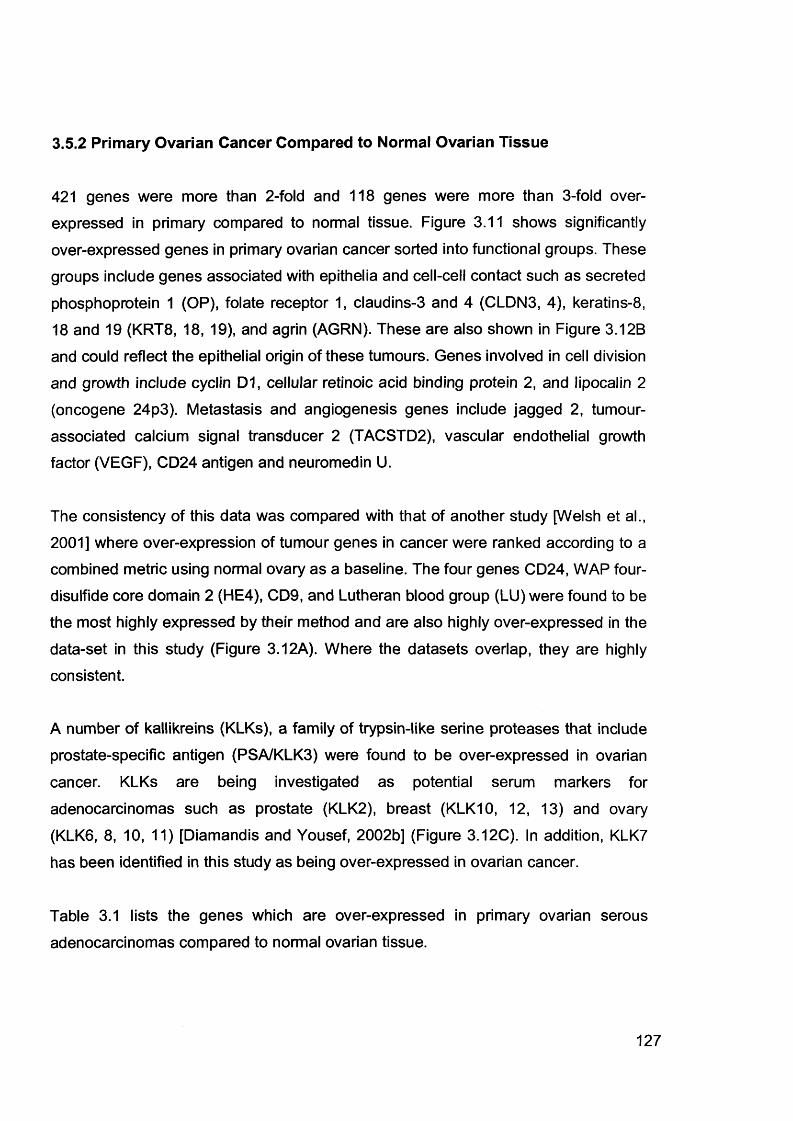
3.5.2 Primary Ovarian Cancer Compared to Normal Ovarian Tissue
421 genes were more than 2-fold and 118 genes were more than 3-fold overexpressed in primary compared to normal tissue. Figure 3.11 shows significantly
over-expressed genes in primary ovarian cancer sorted into functional groups. These
groups include genes associated with epithelia and cell-cell contact such as secreted
phosphoprotein 1 (OP), folate receptor 1, claudins-3 and 4 (CLDN3, 4), keratins-8, 18 and 19 (KRT8, 18, 19), and agrin (AGRN). These are also shown in Figure 3.12B
and could reflect the epithelial origin of these tumours. Genes involved in cell division
and growth include cyclin D1, cellular retinoic acid binding protein 2, and lipocalin 2 (oncogene 24p3). Metastasis and angiogenesis genes include jagged 2, tumour-
associated calcium signal transducer 2 (TACSTD2), vascular endothelial growth factor (VEGF), CD24 antigen and neuromedin U.
The consistency of this data was compared with that of another study [Welsh et al.,
2001] where over-expression of tumour genes in cancer were ranked according to a
combined metric using normal ovary as a baseline. The four genes CD24, WAP four-
disulfide core domain 2 (HE4), CD9, and Lutheran blood group (LU) were found to be the most highly expressed by their method and are also highly over-expressed in the
data-set in this study (Figure 3.12A). Where the datasets overlap, they are highly consistent.
A number of kallikreins (KLKs), a family of trypsin-like serine proteases that include
prostate-specific antigen (PSA/KLK3) were found to be over-expressed in ovarian
cancer. KLKs are being investigated as potential serum markers for
adenocarcinomas such as prostate (KLK2), breast (KLK10, 12, 13) and ovary
(KLK6, 8, 10, 11) [Diamandis and Yousef, 2002b] (Figure 3.12C). In addition, KLK7
has been identified in this study as being over-expressed in ovarian cancer.
Table 3.1 lists the genes which are over-expressed in primary ovarian serous
adenocarcinomas compared to normal ovarian tissue.
127
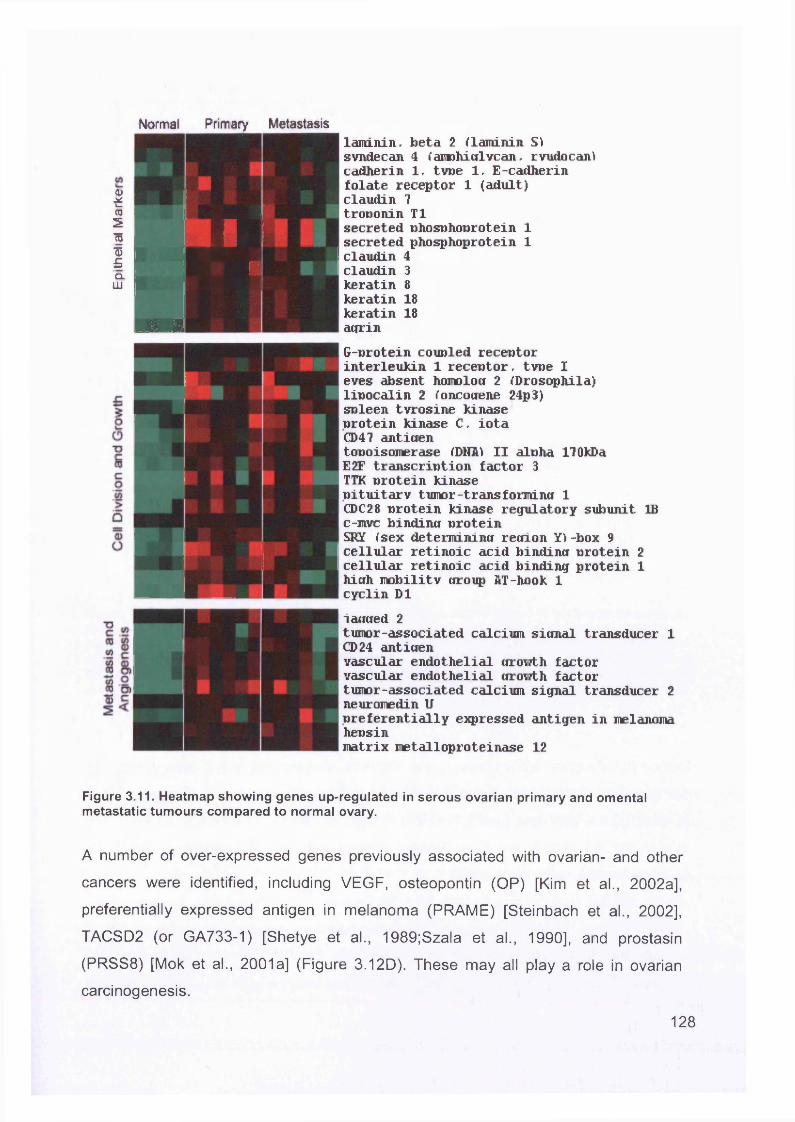
I0351I£CLLU
Normal Primary Metastasis
§ 2
3 M H
laminin. beta 2 {laminin S) svndecan 4 (aiiDhicflvcan, rvudocanl cadherin 1, type 1, E-cadherin folate receptor 1 (adult) claudin 7 troponin T1secreted phosphoprotein 1 secreted phosphoprotein 1 claudin 4
3 8 18 18
claudinkeratinkeratinkeratinagrinG-protein coupled receptor interleukin 1 receptor, tvoe I eves absent homolog 2 {Drosophila) lipocalin 2 {oncotrene 24p3) spleen tvrosine kinase protein kinase C, iota CD47 antigentopoisomerase {DNA1 II alpha 170kDaE2F transcription factor 3TTK protein kinasepituitary tumor-transformina 1CDC28 protein kinase regulatory subunit IBc-mvc bindincr proteinSHY {sex determining recfion Y\ -box 9cellular retinoic acid binding protein 2cellular retinoic acid binding protein 1hiuh mobility uroup AT-hook 1cyclin D1i aimed 2tumor-associated calcium sicmal transducer 1 CD 24 anticienvascular endothelial cirowth factor vascular endothelial cirowth factor tumor-associated calcium signal transducer 2 neuromedin Upreferentially expressed antigen in melanoma hensinmatrix metalloproteinase 12
Figure 3.11. Heatmap showing genes up-regulated in serous ovarian primary and omental metastatic tumours compared to normal ovary.
A number of over-expressed genes previously associated with ovarian- and other
cancers were identified, including VEGF, osteopontin (OP) [Kim et al., 2002a],
preferentially expressed antigen in melanoma (PRAME) [Steinbach et al., 2002],
TACSD2 (or GA733-1) [Shetye et al., 1989;Szala et al., 1990], and prostasin
(PRSS8) [Mok et al., 2001a] (Figure 3.12D). These may all play a role in ovarian
carcinogenesis.
128
H norm al
I- ! prim ary
Figure 3.12. Box and whisker plots show expression of selected genes in both normal (shaded, n=4) and primary tissues (unshaded, n=6).The selected genes are split into 5 categories (A-E) from left to right. (A) For comparison with previous ovarian cancer GEM studies, (B) Epithelial markers, (C) Kallikrein serine protease family, (D) A selection of previously described serous ovarian cancer markers and (E) Genes with loss of expression in primary tumours. Box and whisker plots show a central median line, an interquartile box, whiskers at 1.5 times the interquartile range, and outliers of these shown as circles.
172 genes were 3 fold down-regulated in primary ovarian cancer compared to normal ovary (Figure 3.13). Among these were putative tumour suppressors including the
p53 mediator paternally expressed gene-3 (PEG-3) [Deng and Wu, 2000;Relaix et
al., 1998], wnt-inducible signalling protein-2 (WISP-2) a member of the connective
tissue growth factor family [Pennica et al., 1998], and the Rho-associated
transcriptional coactivator four-and-a-half LIM domains 2 (FHL2) [Muller et al.,
2002]. However, the recently reported putative tumour suppressor in ovarian cancer, opioid-binding protein (OPCML) did not appear to have any significant loss of
expression in any of the samples studied here [Sellar et al., 2003] (Figure 3.12E).
129
X
a
co
£ z a CL. IU M n £! <=. 2 IT! SM
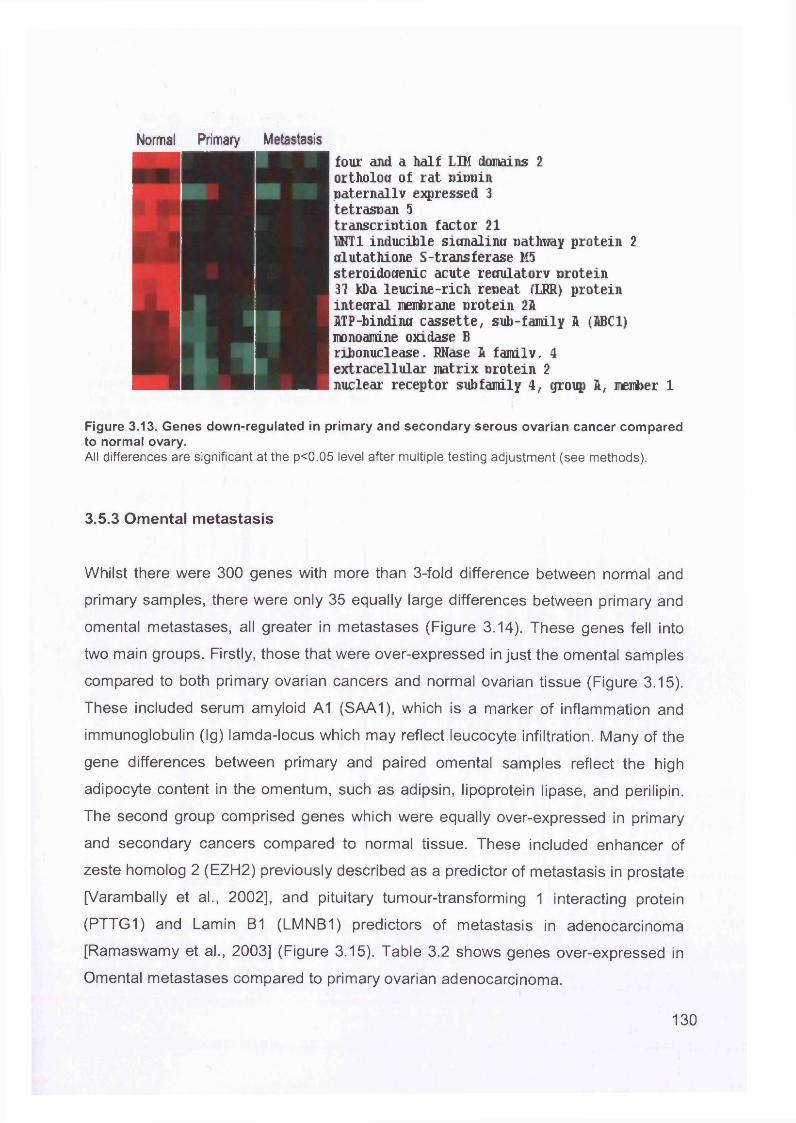
Norma! Primary Metastasis
■ four and a half LIM domains 2 ortholoK of rat oinoin paternally expressed 3 tetrasoan 5
transcription factor 21W T 1 inducible sitmalina pathway protein 2crlutathione S-transferase M5steroidooenic acute reciulatorv protein3? kDa leucine-rich repeat (LRR) proteininteoral membrane protein 2AITP-bindintt cassette, sub-family A (ABC1)monoamine oxidase Bribonuclease, RNase A familyr 4extracellular matrix protein 2nuclear receptor subfamily 4, group A, member 1
Figure 3.13. Genes down-regulated in primary and secondary serous ovarian cancer compared to normal ovary.All differences are significant at the p<0.05 level after multiple testing adjustment (see methods).
3.5.3 Omental metastasis
Whilst there were 300 genes with more than 3-fold difference between normal and
primary samples, there were only 35 equally large differences between primary and
omental metastases, all greater in metastases (Figure 3.14). These genes fell into
two main groups. Firstly, those that were over-expressed in just the omental samples
compared to both primary ovarian cancers and normal ovarian tissue (Figure 3.15).
These included serum amyloid A1 (SAA1), which is a marker of inflammation and
immunoglobulin (Ig) lamda-locus which may reflect leucocyte infiltration. Many of the
gene differences between primary and paired omental samples reflect the high
adipocyte content in the omentum, such as adipsin, lipoprotein lipase, and perilipin.
The second group comprised genes which were equally over-expressed in primary
and secondary cancers compared to normal tissue. These included enhancer of
zeste homolog 2 (EZH2) previously described as a predictor of metastasis in prostate
[Varambally et al., 2002], and pituitary tumour-transforming 1 interacting protein
(PTTG1) and Lamin B1 (LMNB1) predictors of metastasis in adenocarcinoma
[Ramaswamy et al., 2003] (Figure 3.15). Table 3.2 shows genes over-expressed in
Omental metastases compared to primary ovarian adenocarcinoma.
130
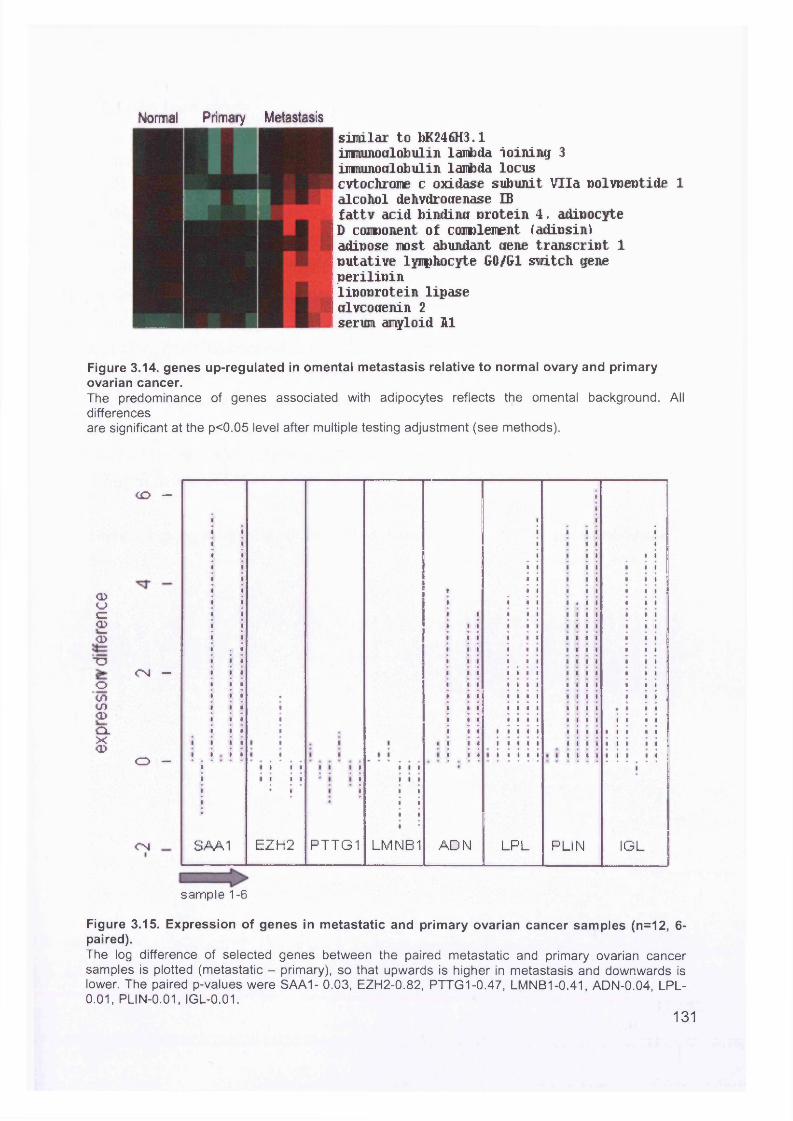
Norma! Primary Metastasissimilar to bK246H3.1immimoalobulin lambda ioining 3imrumoalobulin lambda locuscvtochrome c oxidase subunit Vila wolvoeotide 1alcohol dehvdrotfenase IBfattv acid bindina nrotein 4, adioocyteD component of cojiulenent fadinsintadipose most abundant dene transcript 1putative lymphocyte G0/G1 switch geneperilipinlipoprotein lipasedlvcodenin 2serum amyloid hi
Figure 3.14. genes up-regulated in omental metastasis relative to normal ovary and primary ovarian cancer.The predominance of genes associated with adipocytes reflects the omental background. All differencesare significant at the p<0.05 level after multiple testing adjustment (see methods).
<1>CJC=CD<5■OoCOCO<I>cLx<D
C O —
C N —
O —
C N SAA1 EZH2 PTTG1 LMNB1 ADN LPL PLIN IGL
sample 1-6
Figure 3.15. Expression of genes in metastatic and primary ovarian cancer samples (n=12, 6- paired).The log difference of selected genes between the paired metastatic and primary ovarian cancer samples is plotted (metastatic - primary), so that upwards is higher in metastasis and downwards is lower. The paired p-values were SAA1- 0.03, EZH2-0.82, PTTG1-0.47, LMNB1-0.41, ADN-0.04, LPL- 0.01, PLIN-0.01, IGL-0.01.
131
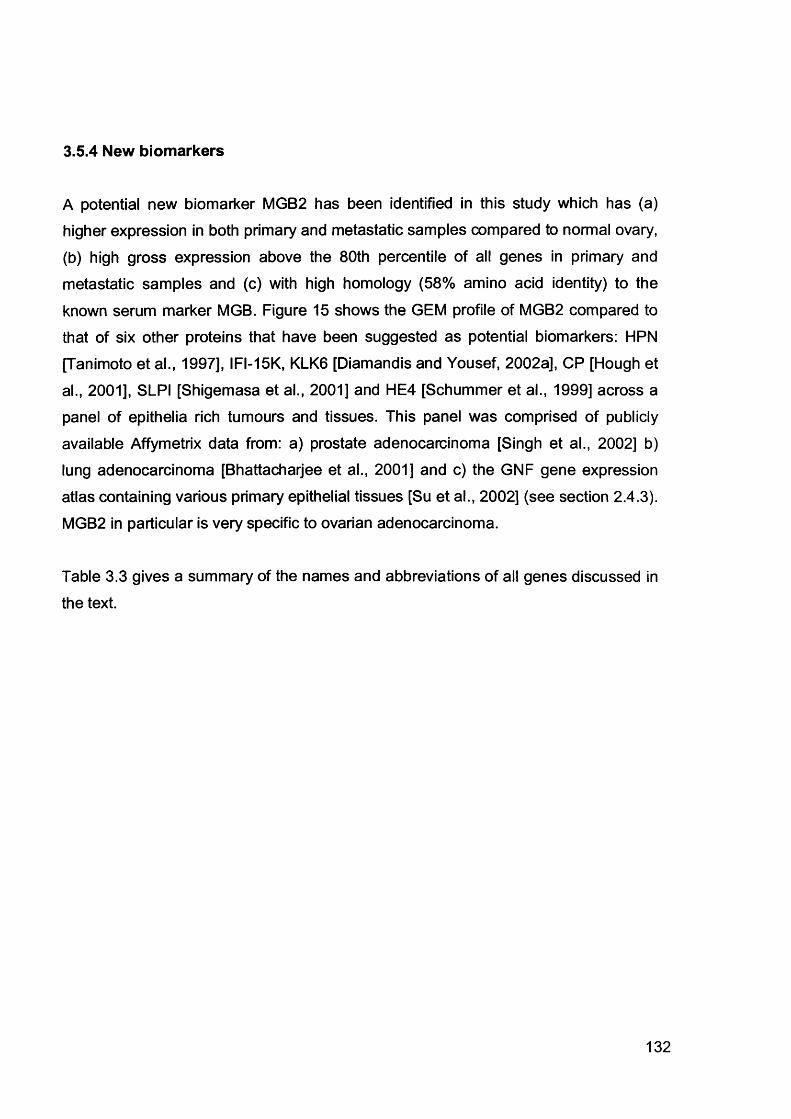
3.5.4 New biomarkers
A potential new biomarker MGB2 has been identified in this study which has (a) higher expression in both primary and metastatic samples compared to normal ovary,
(b) high gross expression above the 80th percentile of all genes in primary and
metastatic samples and (c) with high homology (58% amino acid identity) to the
known serum marker MGB. Figure 15 shows the GEM profile of MGB2 compared to
that of six other proteins that have been suggested as potential biomarkers: HPN
[Tanimoto et al., 1997], IFI-15K, KLK6 [Diamandis and Yousef, 2002a], CP [Hough et
al., 2001], SLPI [Shigemasa et al., 2001] and HE4 [Schummer et al., 1999] across a panel of epithelia rich tumours and tissues. This panel was comprised of publicly
available Affymetrix data from: a) prostate adenocarcinoma [Singh et al., 2002] b)
lung adenocarcinoma [Bhattacharjee et al., 2001] and c) the GNF gene expression
atlas containing various primary epithelial tissues [Su et al., 2002] (see section 2.4.3). MGB2 in particular is very specific to ovarian adenocarcinoma.
Table 3.3 gives a summary of the names and abbreviations of all genes discussed in
the text.
132
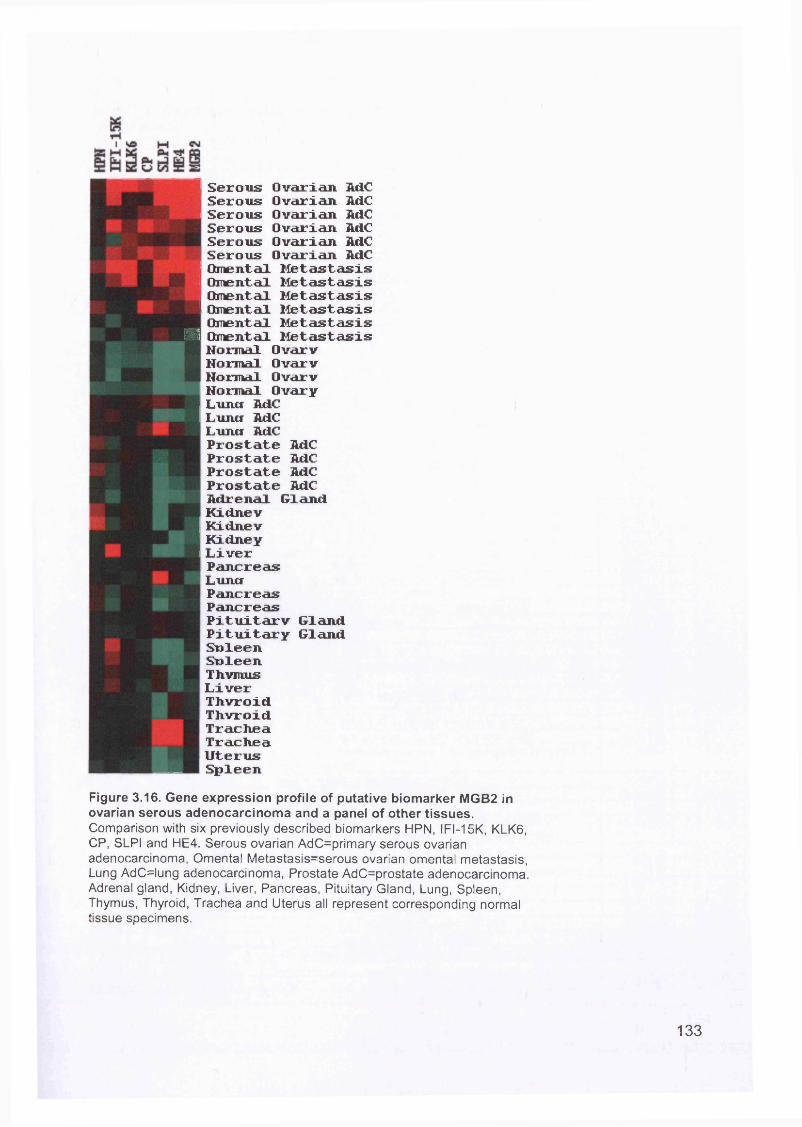
Serous Ovarian AdC Serous Ovarian M C Serous Ovarian M C Serous Ovarian M C Serous Ovarian M C Serous Ovarian AdC Omental Metastasis Omental Metastasis Omental Metastasis Omental Metastasis Omental Metastasis I Omental Metastasis Normal Ovarv Normal Ovarv Normal Ovarv Normal Ovary Lumcr AdC Luncf AdC Luncr AdC Prostate AdC Prostate AdC Prostate AdC Prostate AdC Adrenal Gland Kidnev Kidnev Kidney Liver Pancreas Luncr Pancreas Pancreas Pituitarv Gland Pituitary Gland Snleen Snleen Thvmus Liver Thvroid Thvroid Trachea Trachea Uterus SpleenFigure 3.16. Gene expression profile of putative biomarker MGB2 in ovarian serous adenocarcinoma and a panel of other tissues.Comparison with six previously described biomarkers HPN, IFI-15K, KLK6, CP, SLPI and HE4. Serous ovarian AdC=primary serous ovarian adenocarcinoma, Omental Metastasis=serous ovarian omental metastasis, Lung AdC=lung adenocarcinoma, Prostate AdC=prostate adenocarcinoma. Adrenal gland, Kidney, Liver, Pancreas, Pituitary Gland, Lung, Spleen, Thymus, Thyroid, Trachea and Uterus all represent corresponding normal tissue specimens.
133
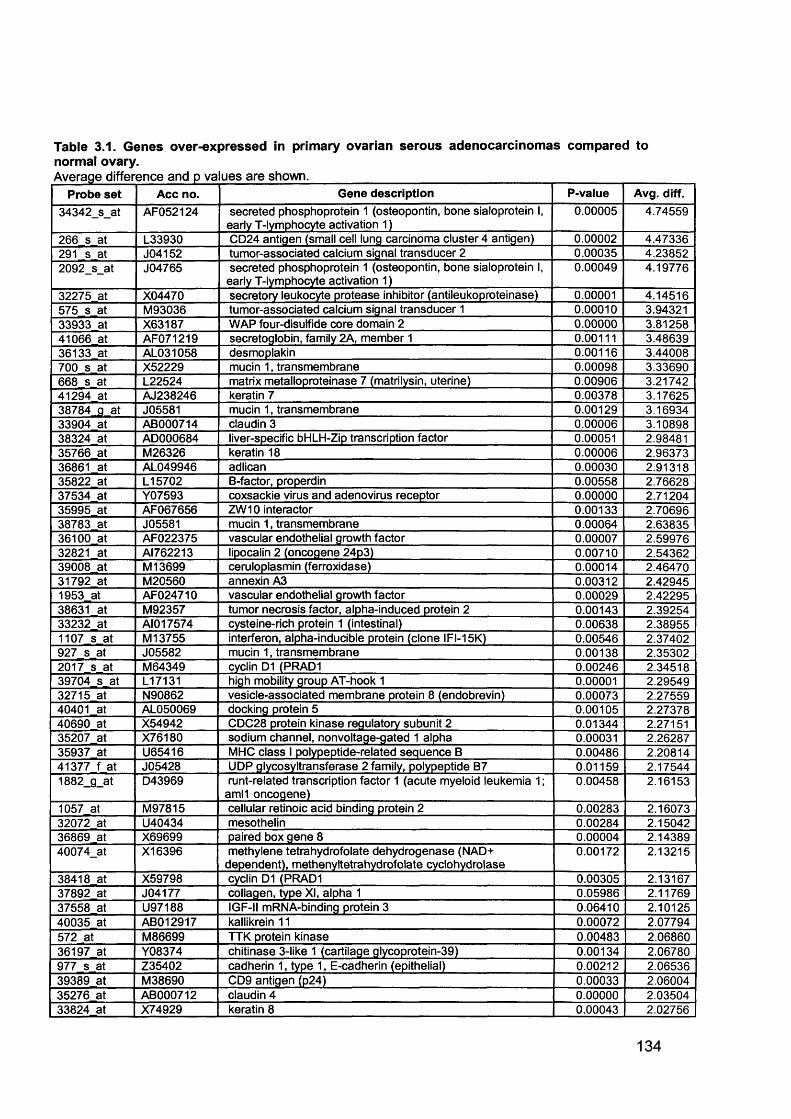
Table 3.1. Genes over-expressed in primary ovarian serous adenocarcinomas compared to normal ovary.Average difference and p values are shown.____________________________________ i___
Probe set Acc no. Gene description P-value Avg. diff.
34342_s_at AF052124 secreted phosphoprotein 1 (osteopontin, bone sialoprotein I, early T-lymphocyte activation 1)
0.00005 4.74559
266 s at L33930 CD24 antigen (small cell lung carcinoma cluster 4 antigen) 0.00002 4.47336291 s at J04152 tumor-associated calcium signal transducer 2 0.00035 4.238522092_s_at J04765 secreted phosphoprotein 1 (osteopontin, bone sialoprotein I,
early T-lymphocyte activation 1)0.00049 4.19776
32275 at X04470 secretory leukocyte protease inhibitor (antileukoproteinase) 0.00001 4.14516575 s at M93036 tumor-associated calcium signal transducer 1 0.00010 3.9432133933 at X63187 WAP four-disulfide core domain 2 0.00000 3.8125841066 at AF071219 secretoglobin, family 2A, member 1 0.00111 3.4863936133 at AL031058 desmoplakin 0.00116 3.44008700 s at X52229 mucin 1, transmembrane 0.00098 3.33690668 s at L22524 matrix metalloproteinase 7 (matrilysin, uterine) 0.00906 3.2174241294 at AJ238246 keratin 7 0.00378 3.1762538784 g at J05581 mucin 1, transmembrane 0.00129 3.1693433904 at AB000714 claudin 3 0.00006 3.1089838324 at AD000684 liver-specific bHLH-Zip transcription factor 0.00051 2.9848135766 at M26326 keratin 18 0.00006 2.9637336861 at AL049946 adlican 0.00030 2.9131835822 at L15702 B-factor, properdin 0.00558 2.7662837534 at Y07593 coxsackie virus and adenovirus receptor 0.00000 2.7120435995 at AF067656 ZW10 interactor 0.00133 2.7069638783 at J05581 mucin 1, transmembrane 0.00064 2.6383536100 at AF022375 vascular endothelial growth factor 0.00007 2.5997632821 at AI762213 lipocalin 2 (oncogene 24p3) 0.00710 2.5436239008 at M 13699 ceruloplasmin (ferroxidase) 0.00014 2.4647031792 at M20560 annexin A3 0.00312 2.429451953 at AF024710 vascular endothelial growth factor 0.00029 2.4229538631 at M92357 tumor necrosis factor, alpha-induced protein 2 0.00143 2.3925433232 at AI017574 cysteine-rich protein 1 (intestinal) 0.00638 2.389551107 s at M 13755 interferon, alpha-inducible protein (clone IFI-15K) 0.00546 2.37402927 s at J05582 mucin 1, transmembrane 0.00138 2.353022017 s at M64349 cyclin D1 (PRAD1 0.00246 2.3451839704 s at L17131 high mobility group AT-hook 1 0.00001 2.2954932715 at N90862 vesicle-associated membrane protein 8 (endobrevin) 0.00073 2.2755940401 at AL050069 docking protein 5 0.00105 2.2737840690 at X54942 CDC28 protein kinase regulatory subunit 2 0.01344 2.2715135207 at X76180 sodium channel, nonvoltage-gated 1 alpha 0.00031 2.2628735937 at U65416 MHC class I polypeptide-related sequence B 0.00486 2.2081441377 f at J05428 UDP glycosyltransferase 2 family, polypeptide B7 0.01159 2.175441882_g_at D43969 runt-related transcription factor 1 (acute myeloid leukemia 1;
amll oncogene)0.00458 2.16153
1057 at M97815 cellular retinoic acid binding protein 2 0.00283 2.1607332072 at U40434 mesothelin 0.00284 2.1504236869 at X69699 paired box gene 8 0.00004 2.1438940074_at X16396 methylene tetrahydrofolate dehydrogenase (NAD+
dependent), methenyltetrahydrofolate cyclohydrolase0.00172 2.13215
38418 at X59798 cyclin D1 (PRAD1 0.00305 2.1316737892 at J04177 collagen, type XI, alpha 1 0.05986 2.1176937558 at U97188 IGF-II mRNA-binding protein 3 0.06410 2.1012540035 at AB012917 kallikrein 11 0.00072 2.07794572 at M86699 TTK protein kinase 0.00483 2.0686036197 at Y08374 chitinase 3-like 1 (cartilage glycoprotein-39) 0.00134 2.06780977 s at Z35402 cadherin 1, type 1, E-cadherin (epithelial) 0.00212 2.0653639389 at M38690 CD9 antigen (p24) 0.00033 2.0600435276 at AB000712 claudin 4 0.00000 2.0350433824 at X74929 keratin 8 0.00043 2.02756
134
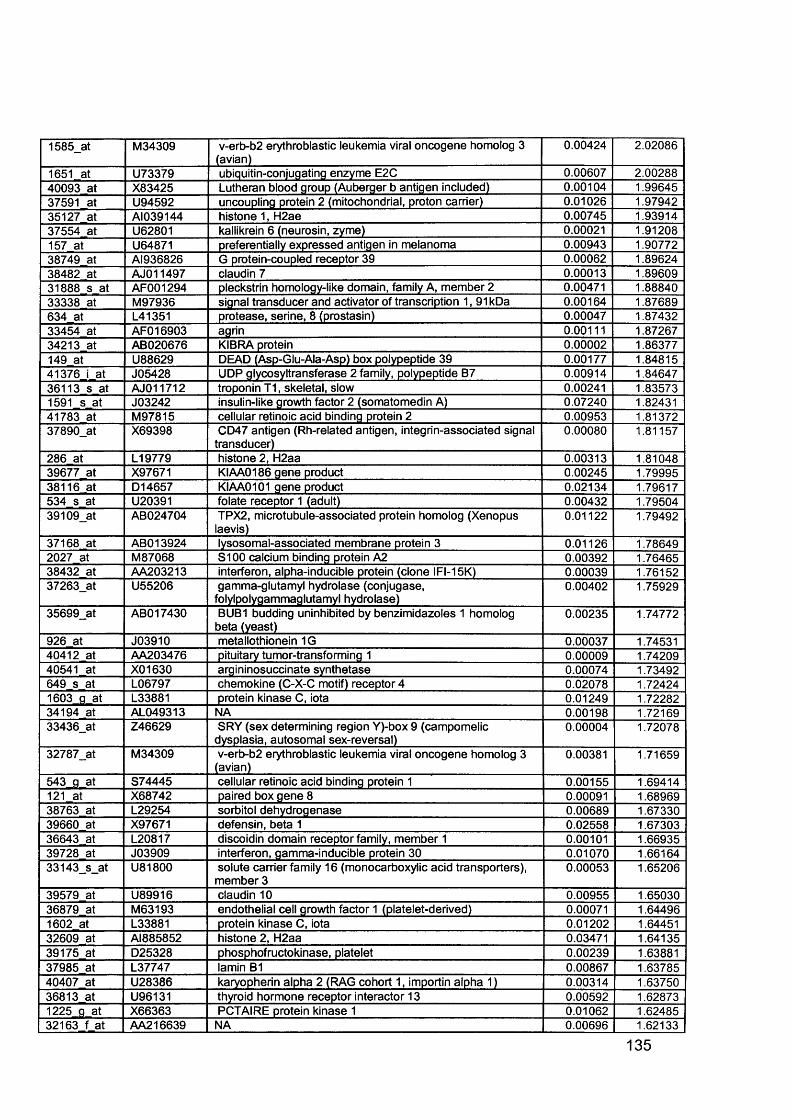
1585_at M34309 v-erb-b2 erythroblastic leukemia viral oncogene homolog 3 (avian)
0.00424 2.02086
1651 at U73379 ubiquitin-conjugating enzyme E2C 0.00607 2.0028840093 at X83425 Lutheran blood group (Auberger b antigen included) 0.00104 1.9964537591 at U94592 uncoupling protein 2 (mitochondrial, proton carrier) 0.01026 1.9794235127 at AI039144 histone 1, H2ae 0.00745 1.9391437554 at U62801 kallikrein 6 (neurosin, zyme) 0.00021 1.91208157 at U64871 preferentially expressed antigen in melanoma 0.00943 1.9077238749 at AI936826 G protein-coupled receptor 39 0.00062 1.8962438482 at AJO11497 claudin 7 0.00013 1.8960931888 s at AF001294 pleckstrin homology-like domain, family A, member 2 0.00471 1.8884033338 at M97936 signal transducer and activator of transcription 1, 91kDa 0.00164 1.87689634 at L41351 protease, serine, 8 (prostasin) 0.00047 1.8743233454 at AFO16903 agrin 0.00111 1.8726734213 at AB020676 KIBRA protein 0.00002 1.86377149 at U88629 DEAD (Asp-Glu-Ala-Asp) box polypeptide 39 0.00177 1.8481541376 i at J05428 UDP glycosyltransferase 2 family, polypeptide B7 0.00914 1.8464736113 s at AJ011712 troponin T1, skeletal, slow 0.00241 1.835731591 s at J03242 insulin-like growth factor 2 (somatomedin A) 0.07240 1.8243141783 at M97815 cellular retinoic acid binding protein 2 0.00953 1.8137237890_at X69398 CD47 antigen (Rh-related antigen, integrin-associated signal
transducer)0.00080 1.81157
286 at L19779 histone 2, H2aa 0.00313 1.8104839677 at X97671 KIAA0186 gene product 0.00245 1.7999538116 at D14657 KIAA0101 gene product 0.02134 1.79617534 s at U20391 folate receptor 1 (adult) 0.00432 1.7950439109_at AB024704 TPX2, microtubule-associated protein homolog (Xenopus
laevis)0.01122 1.79492
37168 at ABO13924 lysosomal-associated membrane protein 3 0.01126 1.786492027 at M87068 S100 calcium binding protein A2 0.00392 1.7646538432 at AA203213 interferon, alpha-inducible protein (clone IFI-15K) 0.00039 1.7615237263_at U55206 gamma-glutamyl hydrolase (conjugase,
folylpoiygammaglutamyl hydrolase)0.00402 1.75929
35699_at AB017430 BUB1 budding uninhibited by benzimidazoles 1 homolog beta (yeast)
0.00235 1.74772
926 at J03910 metallothionein 1G 0.00037 1.7453140412 at AA203476 pituitary tumor-transforming 1 0.00009 1.7420940541 at X01630 argininosuccinate synthetase 0.00074 1.73492649 s at L06797 chemokine (C-X-C motif) receptor 4 0.02078 1.724241603 fl at L33881 protein kinase C, iota 0.01249 1.7228234194 at AL049313 NA 0.00198 1.7216933436_at Z46629 SRY (sex determining region Y)-box 9 (campomelic
dysplasia, autosomal sex-reversal)0.00004 1.72078
32787_at M34309 v-erb-b2 erythroblastic leukemia viral oncogene homolog 3 (avian)
0.00381 1.71659
543 g at S74445 cellular retinoic acid binding protein 1 0.00155 1.69414121 at X68742 paired box gene 8 0.00091 1.6896938763 at L29254 sorbitol dehydrogenase 0.00689 1.6733039660 at X97671 defensin, beta 1 0.02558 1.6730336643 at L20817 discoidin domain receptor family, member 1 0.00101 1.6693539728 at J03909 interferon, gamma-inducible protein 30 0.01070 1.6616433143_s_at U81800 solute carrier family 16 (monocarboxylic acid transporters),
member 30.00053 1.65206
39579 at U89916 claudin 10 0.00955 1.6503036879 at M63193 endothelial cell growth factor 1 (platelet-derived) 0.00071 1.644961602 at L33881 protein kinase C, iota 0.01202 1.6445132609 at AI885852 histone 2, H2aa 0.03471 1.6413539175 at D25328 phosphofructokinase, platelet 0.00239 1.6388137985 at L37747 lamin B1 0.00867 1.6378540407 at U28386 karyopherin alpha 2 (RAG cohort 1, importin alpha 1) 0.00314 1.6375036813 at U96131 thyroid hormone receptor interactor 13 0.00592 1.628731225 fl at X66363 PCTAIRE protein kinase 1 0.01062 1.6248532163 f at AA216639 NA 0.00696 1.62133
135
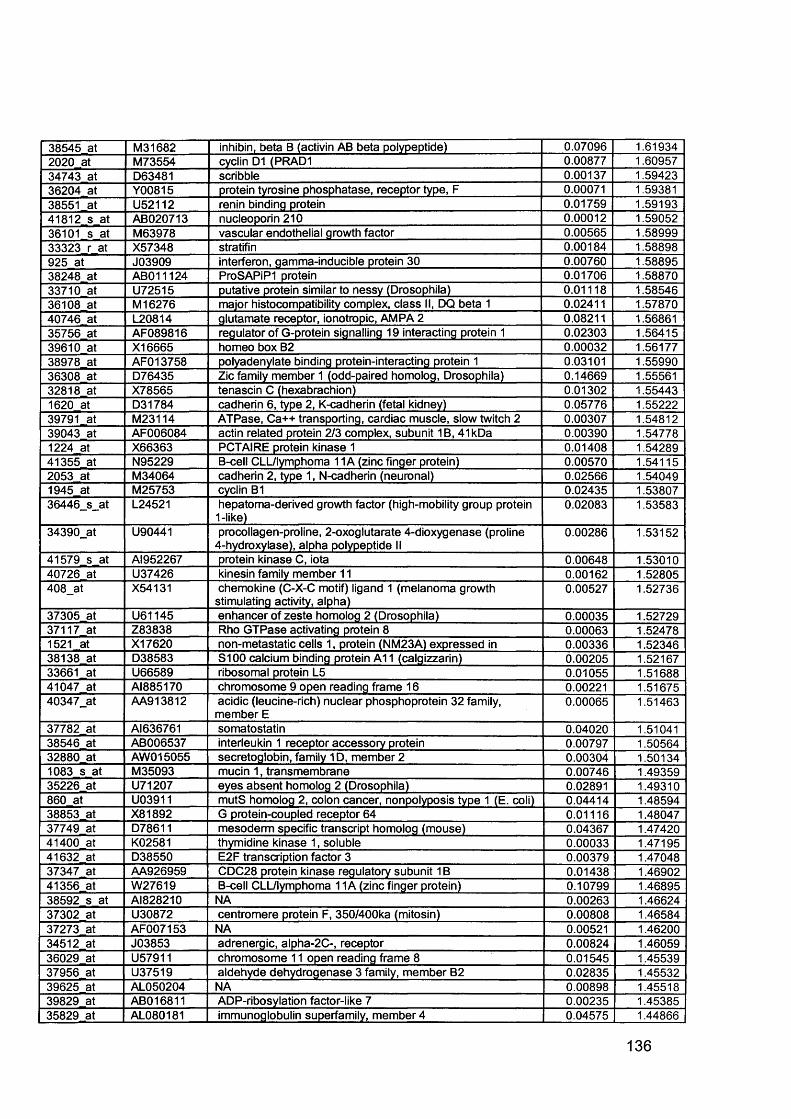
38545 at M31682 inhibin, beta B (activin AB beta polypeptide) 0.07096 1.619342020 at M73554 cyclin D1 (PRAD1 0.00877 1.6095734743 at D63481 scribble 0.00137 1.5942336204 at Y00815 protein tyrosine phosphatase, receptor type, F 0.00071 1.5938138551 at U52112 renin binding protein 0.01759 1.5919341812 s at AB020713 nucleoporin 210 0.00012 1.5905236101 s at M63978 vascular endothelial growth factor 0.00565 1.5899933323 r at X57348 stratifin 0.00184 1.58898925 at J03909 interferon, gamma-inducible protein 30 0.00760 1.5889538248 at AB011124 ProSAPiPI protein 0.01706 1.5887033710 at U72515 putative protein similar to nessy (Drosophila) 0.01118 1.5854636108 at M 16276 major histocompatibility complex, class II, DQ beta 1 0.02411 1.5787040746 at L20814 glutamate receptor, ionotropic, AMPA 2 0.08211 1.5686135756 at AF089816 regulator of G-protein signalling 19 interacting protein 1 0.02303 1.5641539610 at X16665 homeo box B2 0.00032 1.5617738978 at AFO13758 polyadenylate binding protein-interacting protein 1 0.03101 1.5599036308 at D76435 Zic family member 1 (odd-paired homolog, Drosophila) 0.14669 1.5556132818 at X78565 tenascin C (hexabrachion) 0.01302 1.554431620 at D31784 cadherin 6, type 2, K-cadherin (fetal kidney) 0.05776 1.5522239791 at M23114 ATPase, Ca++ transporting, cardiac muscle, slow twitch 2 0.00307 1.5481239043 at AF006084 actin related protein 2/3 complex, subunit 1B, 41kDa 0.00390 1.547781224 at X66363 PCTAIRE protein kinase 1 0.01408 1.5428941355 at N95229 B-cell CLL/lymphoma 11A (zinc finger protein) 0.00570 1.541152053 at M34064 cadherin 2, type 1, N-cadherin (neuronal) 0.02566 1.540491945 at M25753 cyclin B1 0.02435 1.5380736446_s_at L24521 hepatoma-derived growth factor (high-mobility group protein
1-like)0.02083 1.53583
34390_at U90441 procollagen-proline, 2-oxoglutarate 4-dioxygenase (proline 4-hydroxylase), alpha polypeptide II
0.00286 1.53152
41579 s at AI952267 protein kinase C, iota 0.00648 1.5301040726 at U37426 kinesin family member 11 0.00162 1.52805408_at X54131 chemokine (C-X-C motif) ligand 1 (melanoma growth
stimulating activity, alpha)0.00527 1.52736
37305 at U61145 enhancer of zeste homolog 2 (Drosophila) 0.00035 1.5272937117 at Z83838 Rho GTPase activating protein 8 0.00063 1.524781521 at X17620 non-metastatic cells 1, protein (NM23A) expressed in 0.00336 1.5234638138 at D38583 S100 calcium binding protein A11 (calgizzarin) 0.00205 1.5216733661 at U66589 ribosomal protein L5 0.01055 1.5168841047 at Al885170 chromosome 9 open reading frame 16 0.00221 1.5167540347_at AA913812 acidic (leucine-rich) nuclear phosphoprotein 32 family,
member E0.00065 1.51463
37782 at AI636761 somatostatin 0.04020 1.5104138546 at AB006537 interleukin 1 receptor accessory protein 0.00797 1.5056432880 at AW015055 secretoglobin, family 1D, member 2 0.00304 1.501341083 s at M35093 mucin 1, transmembrane 0.00746 1.4935935226 at U71207 eyes absent homolog 2 (Drosophila) 0.02891 1.49310860 at U03911 mutS homolog 2, colon cancer, nonpolyposis type 1 (E. coli) 0.04414 1.4859438853 at X81892 G protein-coupled receptor 64 0.01116 1.4804737749 at D78611 mesoderm specific transcript homolog (mouse) 0.04367 1.4742041400 at K02581 thymidine kinase 1, soluble 0.00033 1.4719541632 at D38550 E2F transcription factor 3 0.00379 1.4704837347 at AA926959 CDC28 protein kinase regulatory subunit 1B 0.01438 1.4690241356 at W27619 B-cell CLL/lymphoma 11A (zinc finger protein) 0.10799 1.4689538592 s at AI828210 NA 0.00263 1.4662437302 at U30872 centromere protein F, 350/400ka (mitosin) 0.00808 1.4658437273 at AF007153 NA 0.00521 1.4620034512 at J03853 adrenergic, alpha-2C-, receptor 0.00824 1.4605936029 at U57911 chromosome 11 open reading frame 8 0.01545 1.4553937956 at U37519 aldehyde dehydrogenase 3 family, member B2 0.02835 1.4553239625 at AL050204 NA 0.00898 1.4551839829 at AB016811 ADP-ribosylation factor-like 7 0.00235 1.4538535829 at AL080181 immunoglobulin superfamily, member 4 0.04575 1.44866
136
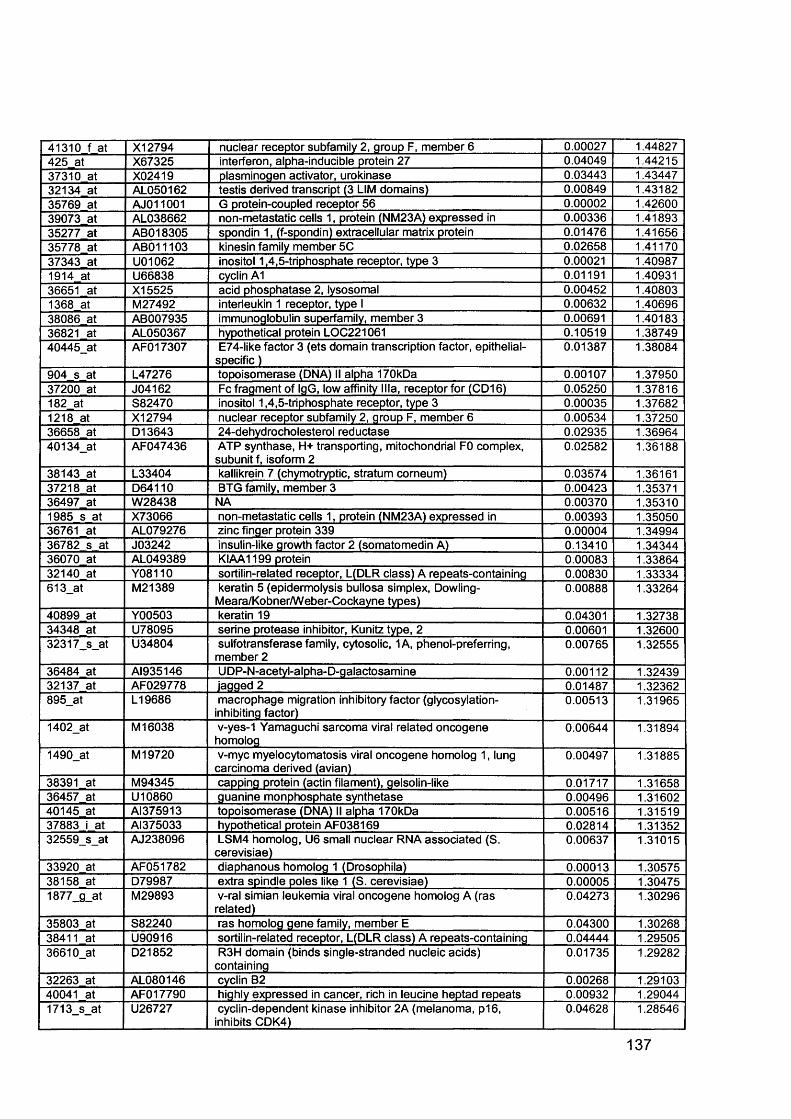
41310 f at X12794 nuclear receptor subfamily 2, group F, member 6 0.00027 1.44827425 at X67325 interferon, alpha-inducible protein 27 0.04049 1.4421537310 at X02419 plasminogen activator, urokinase 0.03443 1.4344732134 at AL050162 testis derived transcript (3 LIM domains) 0.00849 1.4318235769 at AJ011001 G protein-coupled receptor 56 0.00002 1.4260039073 at AL038662 non-metastatic cells 1, protein (NM23A) expressed in 0.00336 1.4189335277 at AB018305 spondin 1, (f-spondin) extracellular matrix protein 0.01476 1.4165635778 at AB011103 kinesin family member 5C 0.02658 1.4117037343 at U01062 inositol 1,4,5-triphosphate receptor, type 3 0.00021 1.409871914 at U66838 cyclin A1 0.01191 1.4093136651 at X15525 acid phosphatase 2, lysosomal 0.00452 1.408031368 at M27492 interleukin 1 receptor, type I 0.00632 1.4069638086 at AB007935 immunoglobulin superfamily, member 3 0.00691 1.4018336821 at AL050367 hypothetical protein LOC221061 0.10519 1.3874940445_at AFO17307 E74-like factor 3 (ets domain transcription factor, epithelial-
specific )0.01387 1.38084
904 s at L47276 topoisomerase (DNA) II alpha 170kDa 0.00107 1.3795037200 at J04162 Fc fragment of IgG, low affinity Ilia, receptor for (CD16) 0.05250 1.37816182 at S82470 inositol 1,4,5-triphosphate receptor, type 3 0.00035 1.376821218 at X12794 nuclear receptor subfamily 2, group F, member 6 0.00534 1.3725036658 at D13643 24-dehydrocholesterol reductase 0.02935 1.3696440134_at AF047436 ATP synthase, H+ transporting, mitochondrial F0 complex,
subunit f, isoform 20.02582 1.36188
38143 at L33404 kallikrein 7 (chymotryptic, stratum corneum) 0.03574 1.3616137218 at D64110 BTG family, member 3 0.00423 1.3537136497 at W28438 NA 0.00370 1.353101985 s at X73066 non-metastatic cells 1, protein (NM23A) expressed in 0.00393 1.3505036761 at AL079276 zinc finger protein 339 0.00004 1.3499436782 s at J03242 insulin-like growth factor 2 (somatomedin A) 0.13410 1.3434436070 at AL049389 KIAA1199 protein 0.00083 1.3386432140 at Y08110 sortilin-related receptor, L(DLR class) A repeats-containing 0.00830 1.33334613_at M21389 keratin 5 (epidermolysis bullosa simplex, Dowling-
Meara/Kobner/Weber-Cockayne types)0.00888 1.33264
40899 at Y00503 keratin 19 0.04301 1.3273834348 at U78095 serine protease inhibitor, Kunitz type, 2 0.00601 1.3260032317_s_at U34804 sulfotransferase family, cytosolic, 1A, phenol-preferring,
member 20.00765 1.32555
36484 at AI935146 UDP-N-acetyl-alpha-D-galactosamine 0.00112 1.3243932137 at AF029778 iagged 2 0.01487 1.32362895_at L19686 macrophage migration inhibitory factor (glycosylation-
inhibiting factor)0.00513 1.31965
1402_at M 16038 v-yes-1 Yamaguchi sarcoma viral related oncogene homolog
0.00644 1.31894
1490_at M 19720 v-myc myelocytomatosis viral oncogene homolog 1, lung carcinoma derived (avian)
0.00497 1.31885
38391 at M94345 capping protein (actin filament), gelsolin-like 0.01717 1.3165836457 at U10860 guanine monphosphate synthetase 0.00496 1.3160240145 at AI375913 topoisomerase (DNA) II alpha 170kDa 0.00516 1.3151937883 i at AI375033 hypothetical protein AF038169 0.02814 1.3135232559_s_at AJ238096 LSM4 homolog, U6 small nuclear RNA associated (S.
cerevisiae)0.00637 1.31015
33920 at AF051782 diaphanous homolog 1 (Drosophila) 0.00013 1.3057538158 at D79987 extra spindle poles like 1 (S. cerevisiae) 0.00005 1.304751877_g_at M29893 v-ral simian leukemia viral oncogene homolog A (ras
related)0.04273 1.30296
35803 at S82240 ras homolog gene family, member E 0.04300 1.3026838411 at U90916 sortilin-related receptor, L(DLR class) A repeats-containing 0.04444 1.2950536610_at D21852 R3H domain (binds single-stranded nucleic acids)
containing0.01735 1.29282
32263 at AL080146 cyclin B2 0.00268 1.2910340041 at AFO17790 highly expressed in cancer, rich in leucine heptad repeats 0.00932 1.290441713_s_at U26727 cyclin-dependent kinase inhibitor 2A (melanoma, p16,
inhibits CDK4)0.04628 1.28546
137
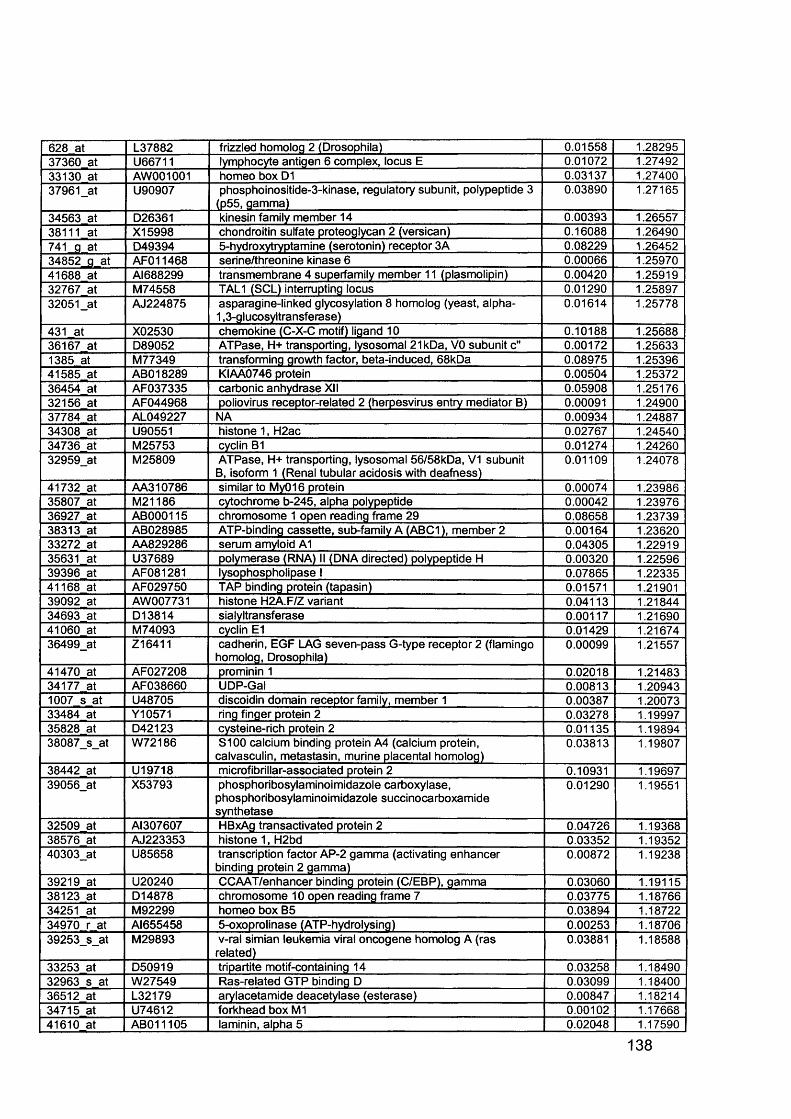
628 at L37882 frizzled homolog 2 (Drosophila) 0.01558 1.2829537360 at U66711 lymphocyte antigen 6 complex, locus E 0.01072 1.2749233130 at AW001001 homeo box D1 0.03137 1.2740037961_at U90907 phosphoinositide-3-kinase, regulatory subunit, polypeptide 3
(p55, gamma)0.03890 1.27165
34563 at D26361 kinesin family member 14 0.00393 1.2655738111 at X15998 chondroitin sulfate proteoglycan 2 (versican) 0.16088 1.26490741 g at D49394 5-hydroxytryptamine (serotonin) receptor 3A 0.08229 1.2645234852_g at AFO11468 serine/threonine kinase 6 0.00066 1.2597041688 at AI688299 transmembrane 4 superfamily member 11 (plasmolipin) 0.00420 1.2591932767 at M74558 TAL1 (SCL) interrupting locus 0.01290 1.2589732051_at AJ224875 asparagine-linked glycosylation 8 homolog (yeast, alpha-
1,3-glucosyltransferase)0.01614 1.25778
431 at X02530 chemokine (C-X-C motif) ligand 10 0.10188 1.2568836167 at D89052 ATPase, H+ transporting, lysosomal 21kDa, VO subunit c" 0.00172 1.256331385 at M77349 transforming growth factor, beta-induced, 68kDa 0.08975 1.2539641585 at ABO18289 KIAA0746 protein 0.00504 1.2537236454 at AF037335 carbonic anhydrase XII 0.05908 1.2517632156 at AF044968 poliovirus receptor-related 2 (herpesvirus entry mediator B) 0.00091 1.2490037784 at AL049227 NA 0.00934 1.2488734308 at U90551 histone 1, H2ac 0.02767 1.2454034736 at M25753 cyclin B1 0.01274 1.2426032959_at M25809 ATPase, H+ transporting, lysosomal 56/58kDa, V1 subunit
B, isoform 1 (Renal tubular acidosis with deafness)0.01109 1.24078
41732 at AA310786 similar to My016 protein 0.00074 1.2398635807 at M21186 cytochrome b-245, alpha polypeptide 0.00042 1.2397636927 at AB000115 chromosome 1 open reading frame 29 0.08658 1.2373938313 at AB028985 ATP-binding cassette, sub-family A (ABC1), member 2 0.00164 1.2362033272 at AA829286 serum amyloid A1 0.04305 1.2291935631 at U37689 polymerase (RNA) II (DNA directed) polypeptide H 0.00320 1.2259639396 at AF081281 lysophospholipase I 0.07865 1.2233541168 at AF029750 TAP binding protein (tapasin) 0.01571 1.2190139092 at AW007731 histone H2A.F/Z variant 0.04113 1.2184434693 at D13814 sialyltransferase 0.00117 1.2169041060 at M74093 cyclin E1 0.01429 1.2167436499_at Z16411 cadherin, EGF LAG seven-pass G-type receptor 2 (flamingo
homolog, Drosophila)0.00099 1.21557
41470 at AF027208 prominin 1 0.02018 1.2148334177 at AF038660 UDP-Gal 0.00813 1.209431007 s at U48705 discoidin domain receptor family, member 1 0.00387 1.2007333484 at Y10571 ring finger protein 2 0.03278 1.1999735828 at D42123 cysteine-rich protein 2 0.01135 1.1989438087_s_at W72186 S100 calcium binding protein A4 (calcium protein,
calvasculin, metastasin, murine placental homolog)0.03813 1.19807
38442 at U19718 microfibrillar-associated protein 2 0.10931 1.1969739056_at X53793 phosphoribosylaminoimidazole carboxylase,
phosphoribosylaminoimidazole succinocarboxamide synthetase
0.01290 1.19551
32509 at AI307607 HBxAg transactivated protein 2 0.04726 1.1936838576 at AJ223353 histone 1, H2bd 0.03352 1.1935240303_at U85658 transcription factor AP-2 gamma (activating enhancer
binding protein 2 gamma)0.00872 1.19238
39219 at U20240 CCAAT/enhancer binding protein (C/EBP), gamma 0.03060 1.1911538123 at D14878 chromosome 10 open reading frame 7 0.03775 1.1876634251 at M92299 homeo box B5 0.03894 1.1872234970 r at Al655458 5-oxoprolinase (ATP-hydrolysing) 0.00253 1.1870639253_s_at M29893 v-ral simian leukemia viral oncogene homolog A (ras
related)0.03881 1.18588
33253 at D50919 tripartite motif-containing 14 0.03258 1.1849032963 s at W27549 Ras-related GTP binding D 0.03099 1.1840036512 at L32179 arylacetamide deacetylase (esterase) 0.00847 1.1821434715 at U74612 forkhead box M1 0.00102 1.1766841610 at AB011105 laminin, alpha 5 0.02048 1.17590
138
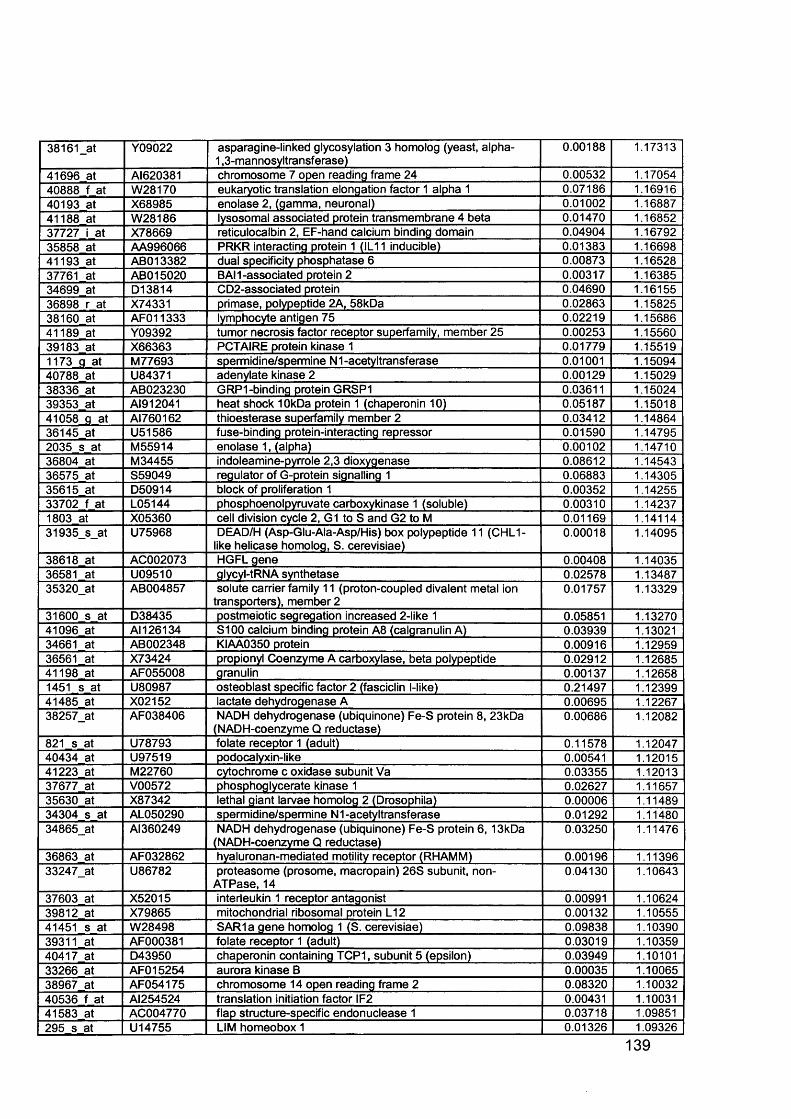
38161_at Y09022 asparagine-linked glycosylation 3 homolog (yeast, alpha- 1,3-mannosyltransferase)
0.00188 1.17313
41696 at AI620381 chromosome 7 open reading frame 24 0.00532 1.1705440888 f at W28170 eukaryotic translation elongation factor 1 alpha 1 0.07186 1.1691640193 at X68985 enolase 2, (gamma, neuronal) 0.01002 1.1688741188 at W28186 lysosomal associated protein transmembrane 4 beta 0.01470 1.1685237727 i at X78669 reticulocalbin 2, EF-hand calcium binding domain 0.04904 1.1679235858 at AA996066 PRKR interacting protein 1 (IL11 inducible) 0.01383 1.1669841193 at ABO13382 dual specificity phosphatase 6 0.00873 1.1652837761 at ABO15020 BAM-associated protein 2 0.00317 1.1638534699 at D13814 CD2-associated protein 0.04690 1.1615536898 r at X74331 primase, polypeptide 2A, 58kDa 0.02863 1.1582538160 at AFO11333 lymphocyte antigen 75 0.02219 1.1568641189 at Y09392 tumor necrosis factor receptor superfamily, member 25 0.00253 1.1556039183 at X66363 PCTAIRE protein kinase 1 0.01779 1.155191173 g at M77693 spermidine/spermine N1-acetyltransferase 0.01001 1.1509440788 at U84371 adenylate kinase 2 0.00129 1.1502938336 at AB023230 GRP1-binding protein GRSP1 0.03611 1.1502439353 at A I912041 heat shock 10kDa protein 1 (chaperonin 10) 0.05187 1.1501841058 g at AI760162 thioesterase superfamily member 2 0.03412 1.1486436145 at U51586 fuse-binding protein-interacting repressor 0.01590 1.147952035 s at M55914 enolase 1, (alpha) 0.00102 1.1471036804 at M34455 indoleamine-pyrrole 2,3 dioxygenase 0.08612 1.1454336575 at S59049 regulator of G-protein signalling 1 0.06883 1.1430535615 at D50914 block of proliferation 1 0.00352 1.1425533702 f at L05144 phosphoenolpyruvate carboxykinase 1 (soluble) 0.00310 1.142371803 at X05360 cell division cycle 2, G1 to S and G2 to M 0.01169 1.1411431935_s_at U75968 DEAD/H (Asp-Glu-Ala-Asp/His) box polypeptide 11 (CHL1-
like helicase homolog, S. cerevisiae)0.00018 1.14095
38618 at AC002073 HGFL gene 0.00408 1.1403536581 at U09510 glycyl-tRNA synthetase 0.02578 1.1348735320_at AB004857 solute carrier family 11 (proton-coupled divalent metal ion
transporters), member 20.01757 1.13329
31600 s at D38435 postmeiotic segregation increased 2-like 1 0.05851 1.1327041096 at AM 26134 S100 calcium binding protein A8 (calgranulin A) 0.03939 1.1302134661 at AB002348 KIAA0350 protein 0.00916 1.1295936561 at X73424 propionyl Coenzyme A carboxylase, beta polypeptide 0.02912 1.1268541198 at AF055008 granulin 0.00137 1.126581451 s at U80987 osteoblast specific factor 2 (fasciclin l-like) 0.21497 1.1239941485 at X02152 lactate dehydrogenase A 0.00695 1.1226738257_at AF038406 NADH dehydrogenase (ubiquinone) Fe-S protein 8, 23kDa
(NADH-coenzyme Q reductase)0.00686 1.12082
821 s at U78793 folate receptor 1 (adult) 0.11578 1.1204740434 at U97519 podocalyxin-like 0.00541 1.1201541223 at M22760 cytochrome c oxidase subunit Va 0.03355 1.1201337677 at V00572 phosphoglycerate kinase 1 0.02627 1.1165735630 at X87342 lethal giant larvae homolog 2 (Drosophila) 0.00006 1.1148934304 s at AL050290 spermidine/spermine N1 -acetyltransferase 0.01292 1.1148034865_at Al360249 NADH dehydrogenase (ubiquinone) Fe-S protein 6 , 13kDa
(NADH-coenzyme Q reductase)0.03250 1.11476
36863 at AF032862 hyaluronan-mediated motility receptor (RHAMM) 0.00196 1.1139633247_at U86782 proteasome (prosome, macropain) 26S subunit, non-
ATPase, 140.04130 1.10643
37603 at X52015 interleukin 1 receptor antagonist 0.00991 1.1062439812 at X79865 mitochondrial ribosomal protein L12 0.00132 1.1055541451 s at W28498 SAR1a gene homolog 1 (S. cerevisiae) 0.09838 1.1039039311 at AF000381 folate receptor 1 (adult) 0.03019 1.1035940417 at D43950 chaperonin containing TCP1, subunit 5 (epsilon) 0.03949 1.1010133266 at AFO15254 aurora kinase B 0.00035 1.1006538967 at AF054175 chromosome 14 open reading frame 2 0.08320 1.1003240536 f at AI254524 translation initiation factor IF2 0.00431 1.1003141583 at AC004770 flap structure-specific endonuclease 1 0.03718 1.09851295 s at U14755 LIM homeobox 1 0.01326 1.09326
139
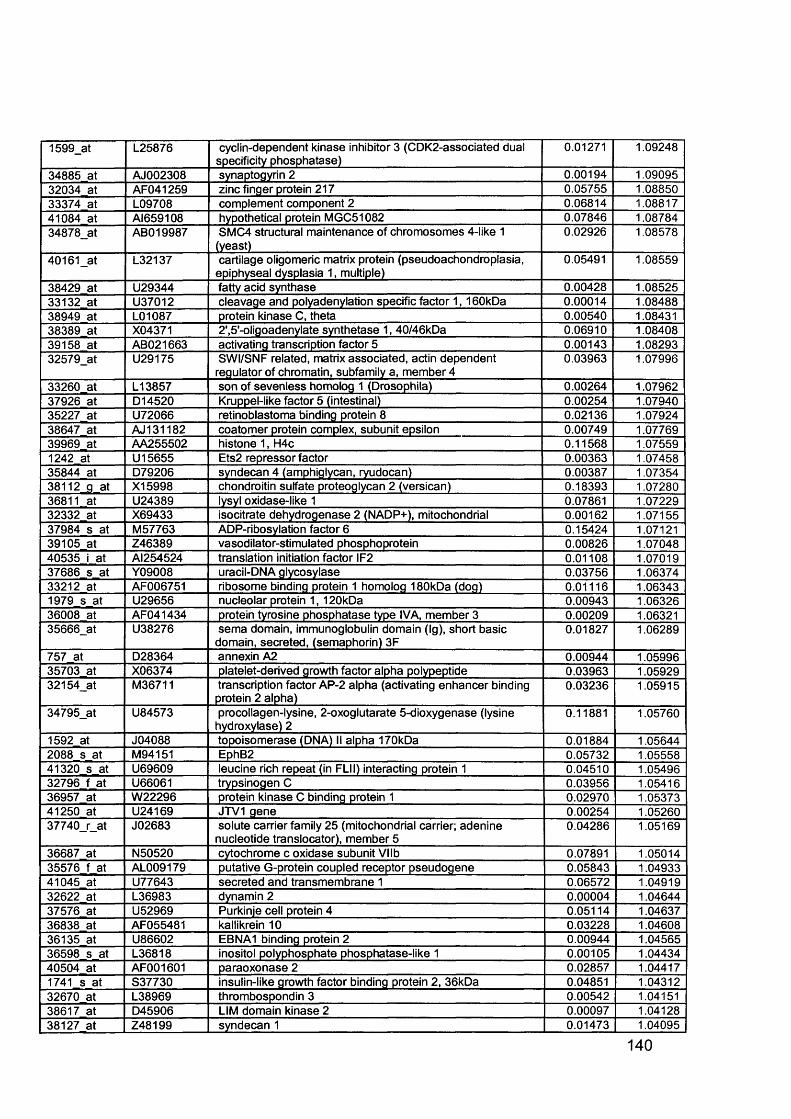
1599_at L25876 cyclin-dependent kinase inhibitor 3 (CDK2-associated dual specificity phosphatase)
0.01271 1.09248
34885 at AJ002308 synaptogyrin 2 0.00194 1.0909532034 at AF041259 zinc finger protein 217 0.05755 1.0885033374 at L09708 complement component 2 0.06814 1.0881741084 at AI659108 hypothetical protein MGC51082 0.07846 1.0878434878_at ABO19987 SMC4 structural maintenance of chromosomes 4-like 1
(yeast)0.02926 1.08578
40161_at L32137 cartilage oligomeric matrix protein (pseudoachondroplasia, epiphyseal dysplasia 1, multiple)
0.05491 1.08559
38429 at U29344 fatty acid synthase 0.00428 1.0852533132 at U37012 cleavage and polyadenylation specific factor 1 ,1 60kDa 0.00014 1.0848838949 at L01087 protein kinase C, theta 0.00540 1.0843138389 at X04371 2\5'-oligoadenylate synthetase 1, 40/46kDa 0.06910 1.0840839158 at AB021663 activating transcription factor 5 0.00143 1.0829332579_at U29175 SWI/SNF related, matrix associated, actin dependent
regulator of chromatin, subfamily a, member 40.03963 1.07996
33260 at L13857 son of sevenless homolog 1 (Drosophila) 0.00264 1.0796237926 at D14520 Kruppel-like factor 5 (intestinal) 0.00254 1.0794035227 at U72066 retinoblastoma binding protein 8 0.02136 1.0792438647 at AJ131182 coatomer protein complex, subunit epsilon 0.00749 1.0776939969 at AA255502 histone 1, H4c 0.11568 1.075591242 at U15655 Ets2 repressor factor 0.00363 1.0745835844 at D79206 syndecan 4 (amphiglycan, ryudocan) 0.00387 1.0735438112 g at X15998 chondroitin sulfate proteoglycan 2 (versican) 0.18393 1.0728036811 at U24389 lysyl oxidase-like 1 0.07861 1.0722932332 at X69433 isocitrate dehydrogenase 2 (NADP+), mitochondrial 0.00162 1.0715537984 s at M57763 ADP-ribosylation factor 6 0.15424 1.0712139105 at Z46389 vasodilator-stimulated phosphoprotein 0.00826 1.0704840535 i at AI254524 translation initiation factor IF2 0.01108 1.0701937686 s at Y09008 uracil-DNA glycosylase 0.03756 1.0637433212 at AF006751 ribosome binding protein 1 homolog 180kDa (dog) 0.01116 1.063431979 s at U29656 nucleolar protein 1, 120kDa 0.00943 1.0632636008 at AF041434 protein tyrosine phosphatase type IVA, member 3 0.00209 1.0632135666_at U38276 sema domain, immunoglobulin domain (Ig), short basic
domain, secreted, (semaphorin) 3F0.01827 1.06289
757 at D28364 annexin A2 0.00944 1.0599635703 at X06374 platelet-derived growth factor alpha polypeptide 0.03963 1.0592932154_at M36711 transcription factor AP-2 alpha (activating enhancer binding
protein 2 alpha)0.03236 1.05915
34795_at U84573 procollagen-lysine, 2-oxoglutarate 5-dioxygenase (lysine hydroxylase) 2
0.11881 1.05760
1592 at J04088 topoisomerase (DNA) II alpha 170kDa 0.01884 1.056442088 s at M94151 EphB2 0.05732 1.0555841320 s at U69609 leucine rich repeat (in FLII) interacting protein 1 0.04510 1.0549632796 f at U66061 trypsinogen C 0.03956 1.0541636957 at W22296 protein kinase C binding protein 1 0.02970 1.0537341250 at U24169 JTV1 gene 0.00254 1.0526037740_r_at J02683 solute carrier family 25 (mitochondrial carrier; adenine
nucleotide translocator), member 50.04286 1.05169
36687 at N50520 cytochrome c oxidase subunit Vllb 0.07891 1.0501435576 f at AL009179 putative G-protein coupled receptor pseudogene 0.05843 1.0493341045 at U77643 secreted and transmembrane 1 0.06572 1.0491932622 at L36983 dynamin 2 0.00004 1.0464437576 at U52969 Purkinje cell protein 4 0.05114 1.0463736838 at AF055481 kallikrein 10 0.03228 1.0460836135 at U86602 EBNA1 binding protein 2 0.00944 1.0456536598 s at L36818 inositol polyphosphate phosphatase-like 1 0.00105 1.0443440504 at AF001601 paraoxonase 2 0.02857 1.044171741 s at S37730 insulin-like growth factor binding protein 2, 36kDa 0.04851 1.0431232670 at L38969 thrombospondin 3 0.00542 1.0415138617 at D45906 LIM domain kinase 2 0.00097 1.0412838127 at Z48199 syndecan 1 0.01473 1.04095
140
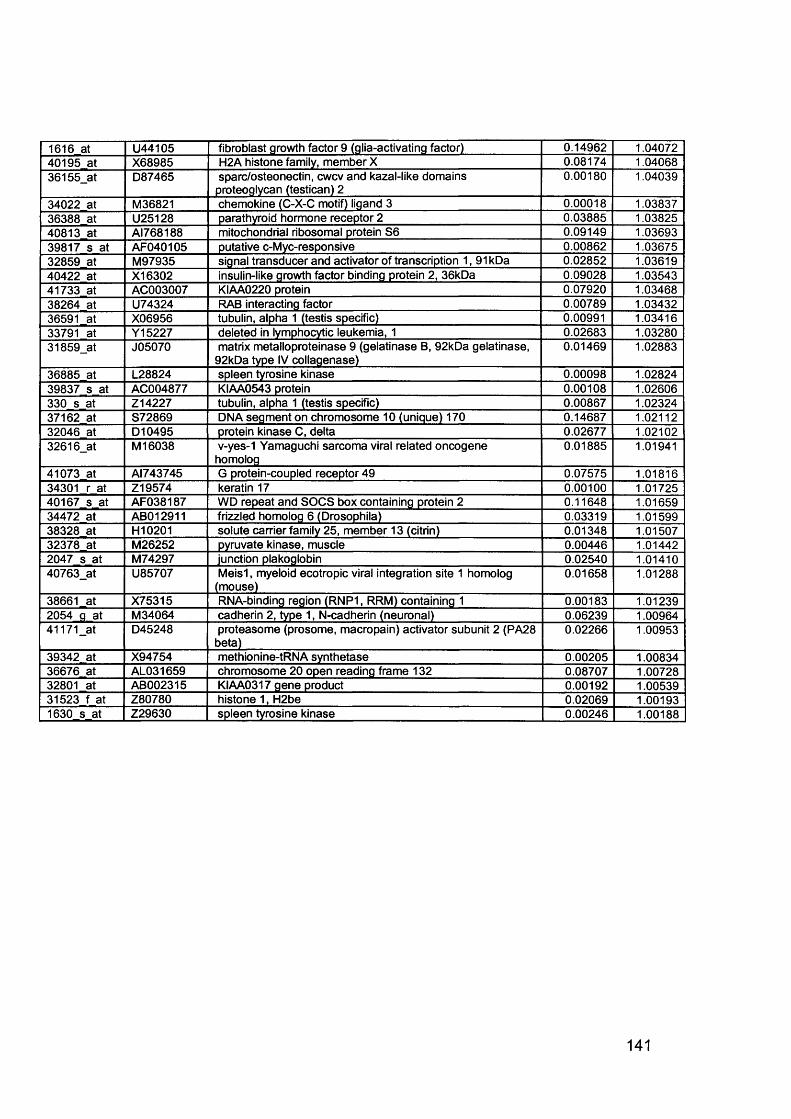
1616 at U44105 fibroblast growth factor 9 (glia-activating factor) 0.14962 1.0407240195 at X68985 H2A histone family, member X 0.08174 1.0406836155_at D87465 sparc/osteonectin, cwcv and kazal-like domains
proteoglycan (testican) 20.00180 1.04039
34022 at M36821 chemokine (C-X-C motif) ligand 3 0.00018 1.0383736388 at U25128 parathyroid hormone receptor 2 0.03885 1.0382540813 at AI768188 mitochondrial ribosomal protein S6 0.09149 1.0369339817 s at AF040105 putative c-Myc-responsive 0.00862 1.0367532859 at M97935 signal transducer and activator of transcription 1,91 kDa 0.02852 1.0361940422 at X16302 insulin-like growth factor binding protein 2, 36kDa 0.09028 1.0354341733 at AC003007 KIAA0220 protein 0.07920 1.0346838264 at U74324 RAB interacting factor 0.00789 1.0343236591 at X06956 tubulin, alpha 1 (testis specific) 0.00991 1.0341633791 at Y15227 deleted in lymphocytic leukemia, 1 0.02683 1.0328031859_at J05070 matrix metalloproteinase 9 (gelatinase B, 92kDa gelatinase,
92kDa type IV collagenase)0.01469 1.02883
36885 at L28824 spleen tyrosine kinase 0.00098 1.0282439837 s at AC004877 KIAA0543 protein 0.00108 1.02606330 s at Z14227 tubulin, alpha 1 (testis specific) 0.00867 1.0232437162 at S72869 DNA segment on chromosome 10 (unique) 170 0.14687 1.0211232046 at D10495 protein kinase C, delta 0.02677 1.0210232616_at M 16038 v-yes-1 Yamaguchi sarcoma viral related oncogene
homolog0.01885 1.01941
41073 at AI743745 G protein-coupled receptor 49 0.07575 1.0181634301 r at Z19574 keratin 17 0.00100 1.0172540167 s at AF038187 WD repeat and SOCS box containing protein 2 0.11648 1.0165934472 at AB012911 frizzled homolog 6 (Drosophila) 0.03319 1.0159938328 at H10201 solute carrier family 25, member 13 (citrin) 0.01348 1.0150732378 at M26252 pyruvate kinase, muscle 0.00446 1.014422047 s at M74297 junction plakoglobin 0.02540 1.0141040763_at U85707 M eisl, myeloid ecotropic viral integration site 1 homolog
(mouse)0.01658 1.01288
38661 at X75315 RNA-binding region (RNP1, RRM) containing 1 0.00183 1.012392054 g at M34064 cadherin 2, type 1, N-cadherin (neuronal) 0.06239 1.0096441171_at D45248 proteasome (prosome, macropain) activator subunit 2 (PA28
beta)0.02266 1.00953
39342 at X94754 methionine-tRNA synthetase 0.00205 1.0083436676 at AL031659 chromosome 20 open reading frame 132 0.08707 1.0072832801 at AB002315 KIAA0317 gene product 0.00192 1.0053931523 f at Z80780 histone 1, H2be 0.02069 1.001931630 s at Z29630 spleen tyrosine kinase 0.00246 1.00188
141
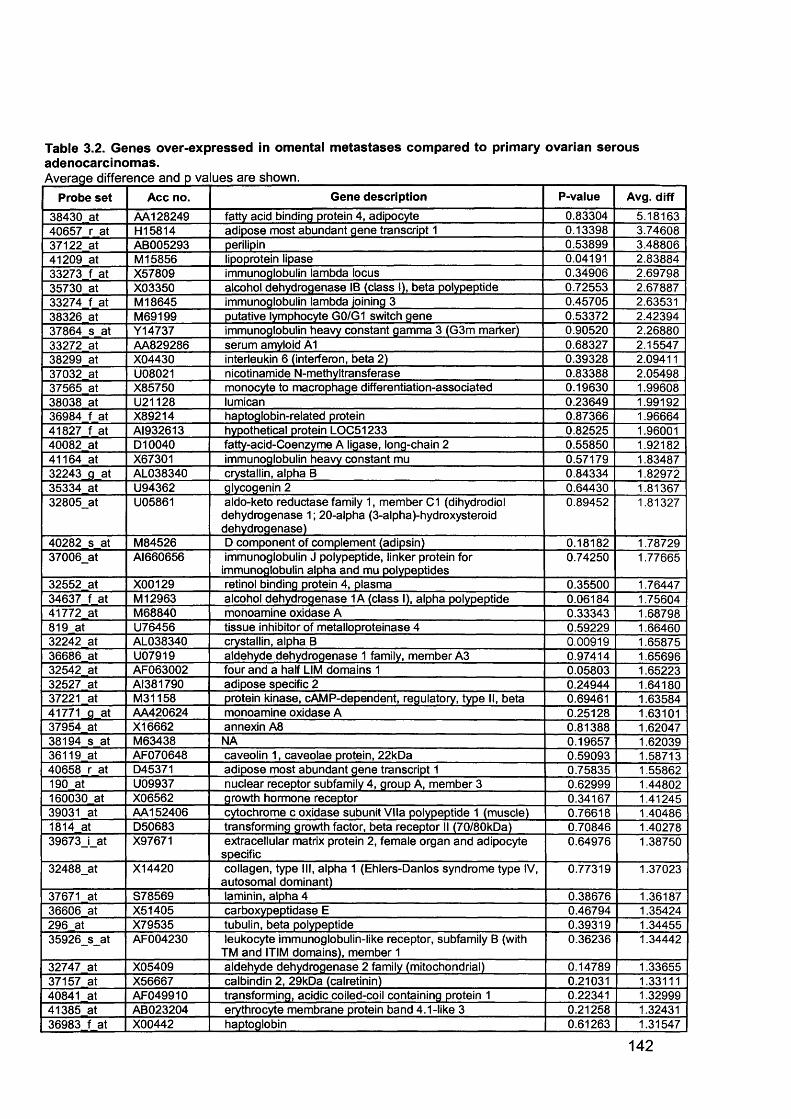
Table 3.2. Genes over-expressed in omental metastases compared to primary ovarian serous adenocarcinomas.Average difference and p values are shown._________________________________________ _________________
Probe set Acc no. Gene description P-value Avg. diff
38430 at AA128249 fatty acid binding protein 4, adipocyte 0.83304 5.1816340657 r at H15814 adipose most abundant gene transcript 1 0.13398 3.7460837122 at AB005293 perilipin 0.53899 3.4880641209 at M 15856 lipoprotein lipase 0.04191 2.8388433273 f at X57809 immunoglobulin lambda locus 0.34906 2.6979835730 at X03350 alcohol dehydrogenase IB (class I), beta polypeptide 0.72553 2.6788733274 f at M 18645 immunoglobulin lambda joining 3 0.45705 2.6353138326 at M69199 putative lymphocyte G0/G1 switch gene 0.53372 2.4239437864 s at Y14737 immunoglobulin heavy constant gamma 3 (G3m marker) 0.90520 2.2688033272 at AA829286 serum amyloid A1 0.68327 2.1554738299 at X04430 interleukin 6 (interferon, beta 2) 0.39328 2.0941137032 at U08021 nicotinamide N-methyltransferase 0.83388 2.0549837565 at X85750 monocyte to macrophage differentiation-associated 0.19630 1.9960838038 at U21128 lumican 0.23649 1.9919236984 f at X89214 haptoglobin-related protein 0.87366 1.9666441827 f at AI932613 hypothetical protein LOC51233 0.82525 1.9600140082 at D10040 fatty-acid-Coenzyme A ligase, long-chain 2 0.55850 1.9218241164 at X67301 immunoglobulin heavy constant mu 0.57179 1.8348732243_g at AL038340 crystallin, alpha B 0.84334 1.8297235334 at U94362 glycogenin 2 0.64430 1.8136732805_at U05861 aldo-keto reductase family 1, member C1 (dihydrodiol
dehydrogenase 1; 20-alpha (3-alpha)-hydroxysteroid dehydrogenase)
0.89452 1.81327
40282 s at M84526 D component of complement (adipsin) 0.18182 1.7872937006_at Al660656 immunoglobulin J polypeptide, linker protein for
immunoglobulin alpha and mu polypeptides0.74250 1.77665
32552 at X00129 retinol binding protein 4, plasma 0.35500 1.7644734637 f at M 12963 alcohol dehydrogenase 1A (class I), alpha polypeptide 0.06184 1.7560441772 at M68840 monoamine oxidase A 0.33343 1.68798819 at U76456 tissue inhibitor of metalloproteinase 4 0.59229 1.6646032242 at AL038340 crystallin, alpha B 0.00919 1.6587536686 at U07919 aldehyde dehydrogenase 1 family, member A3 0.97414 1.6569632542 at AF063002 four and a half LIM domains 1 0.05803 1.6522332527 at AI381790 adipose specific 2 0.24944 1.6418037221 at M31158 protein kinase, cAMP-dependent, regulatory, type II, beta 0.69461 1.6358441771_g at AA420624 monoamine oxidase A 0.25128 1.6310137954 at X16662 annexin A8 0.81388 1.6204738194 s at M63438 NA 0.19657 1.6203936119 at AF070648 caveolin 1, caveolae protein, 22kDa 0.59093 1.5871340658 r at D45371 adipose most abundant gene transcript 1 0.75835 1.55862190 at U09937 nuclear receptor subfamily 4, group A, member 3 0.62999 1.44802160030 at X06562 growth hormone receptor 0.34167 1.4124539031 at AA152406 cytochrome c oxidase subunit Vila polypeptide 1 (muscle) 0.76618 1.404861814 at D50683 transforming growth factor, beta receptor II (70/80kDa) 0.70846 1.4027839673_i_at X97671 extracellular matrix protein 2, female organ and adipocyte
specific0.64976 1.38750
32488_at X14420 collagen, type III, alpha 1 (Ehlers-Danlos syndrome type IV, autosomal dominant)
0.77319 1.37023
37671 at S78569 laminin, alpha 4 0.38676 1.3618736606 at X51405 carboxypeptidase E 0.46794 1.35424296 at X79535 tubulin, beta polypeptide 0.39319 1.3445535926_s_at AF004230 leukocyte immunoglobulin-like receptor, subfamily B (with
TM and HIM domains), member 10.36236 1.34442
32747 at X05409 aldehyde dehydrogenase 2 family (mitochondrial) 0.14789 1.3365537157 at X56667 calbindin 2, 29kDa (calretinin) 0.21031 1.3311140841 at AF049910 transforming, acidic coiled-coil containing protein 1 0.22341 1.3299941385 at AB023204 erythrocyte membrane protein band 4.1-like 3 0.21258 1.3243136983 f at X00442 haptoglobin 0.61263 1.31547
142
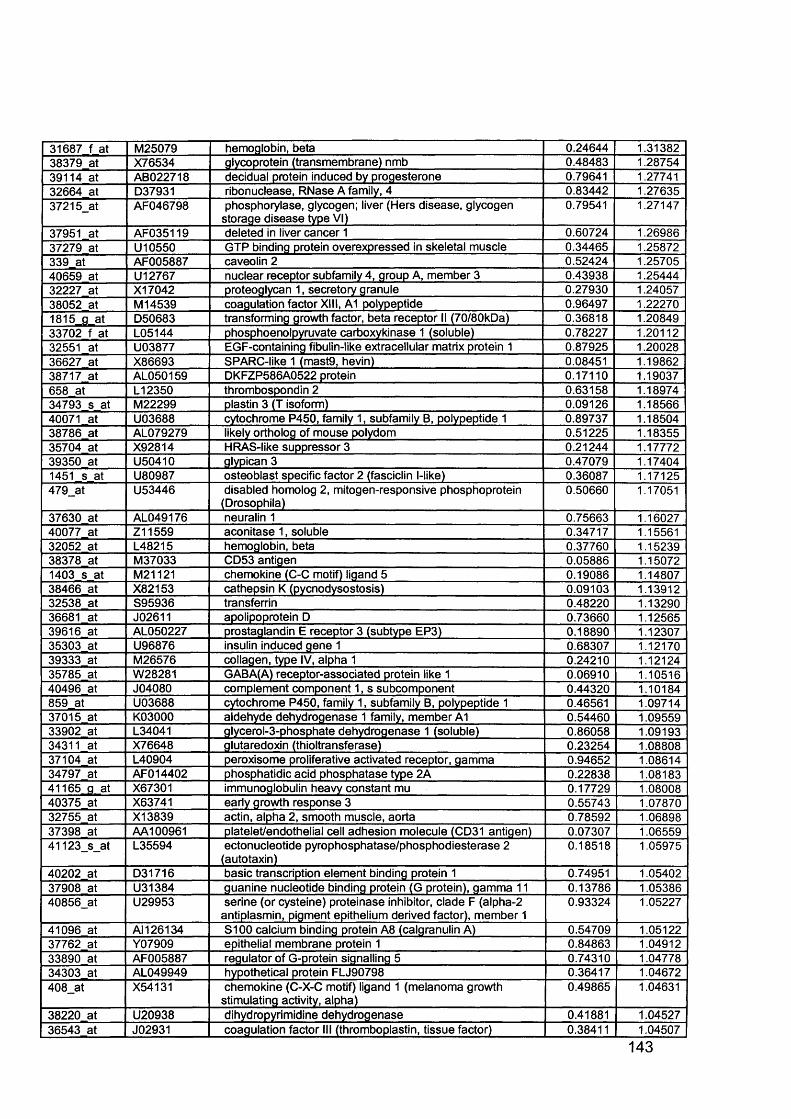
31687 f at M25079 hemoglobin, beta 0.24644 1.3138238379 at X76534 glycoprotein (transmembrane) nmb 0.48483 1.2875439114 at AB022718 decidual protein induced by progesterone 0.79641 1.2774132664 at D37931 ribonuclease, RNase A family, 4 0.83442 1.2763537215_at AF046798 phosphorylase, glycogen; liver (Hers disease, glycogen
storage disease type VI)0.79541 1.27147
37951 at AF035119 deleted in liver cancer 1 0.60724 1.2698637279 at U10550 GTP binding protein overexpressed in skeletal muscle 0.34465 1.25872339 at AF005887 caveolin 2 0.52424 1.2570540659 at U12767 nuclear receptor subfamily 4, group A, member 3 0.43938 1.2544432227 at X17042 proteoglycan 1, secretory granule 0.27930 1.2405738052 at M 14539 coagulation factor XIII, A1 polypeptide 0.96497 1.222701815 a at D50683 transforming growth factor, beta receptor II (70/80kDa) 0.36818 1.2084933702 f at L05144 phosphoenolpyruvate carboxykinase 1 (soluble) 0.78227 1.2011232551 at U03877 EGF-containing fibulin-like extracellular matrix protein 1 0.87925 1.2002836627 at X86693 SPARC-like 1 (mast9, hevin) 0.08451 1.1986238717 at AL050159 DKFZP586A0522 protein 0.17110 1.19037658 at L12350 thrombospondin 2 0.63158 1.1897434793 s at M22299 plastin 3 (T isoform) 0.09126 1.1856640071 at U03688 cytochrome P450, family 1, subfamily B, polypeptide 1 0.89737 1.1850438786 at AL079279 likely ortholog of mouse polydom 0.51225 1.1835535704 at X92814 HRAS-like suppressor 3 0.21244 1.1777239350 at U50410 glypican 3 0.47079 1.174041451 s at U80987 osteoblast specific factor 2 (fasciclin l-like) 0.36087 1.17125479_at U53446 disabled homolog 2, mitogen-responsive phosphoprotein
(Drosophila)0.50660 1.17051
37630 at AL049176 neuralin 1 0.75663 1.1602740077 at Z11559 aconitase 1, soluble 0.34717 1.1556132052 at L48215 hemoglobin, beta 0.37760 1.1523938378 at M37033 CD53 antigen 0.05886 1.150721403 s at M21121 chemokine (C-C motif) ligand 5 0.19086 1.1480738466 at X82153 cathepsin K (pycnodysostosis) 0.09103 1.1391232538 at S95936 transferrin 0.48220 1.1329036681 at J02611 apolipoprotein D 0.73660 1.1256539616 at AL050227 prostaglandin E receptor 3 (subtype EP3) 0.18890 1.1230735303 at U96876 insulin induced gene 1 0.68307 1.1217039333 at M26576 collagen, type IV, alpha 1 0.24210 1.1212435785 at W28281 GABA(A) receptor-associated protein like 1 0.06910 1.1051640496 at J04080 complement component 1, s subcomponent 0.44320 1.10184859 at U03688 cytochrome P450, family 1, subfamily B, polypeptide 1 0.46561 1.0971437015 at K03000 aldehyde dehydrogenase 1 family, member A1 0.54460 1.0955933902 at L34041 glycerol-3-phosphate dehydrogenase 1 (soluble) 0.86058 1.0919334311 at X76648 glutaredoxin (thioltransferase) 0.23254 1.0880837104 at L40904 peroxisome proliferative activated receptor, gamma 0.94652 1.0861434797 at AFO14402 phosphatidic acid phosphatase type 2A 0.22838 1.0818341165 g at X67301 immunoglobulin heavy constant mu 0.17729 1.0800840375 at X63741 early growth response 3 0.55743 1.0787032755 at X13839 actin, alpha 2, smooth muscle, aorta 0.78592 1.0689837398 at AA100961 platelet/endothelial cell adhesion molecule (CD31 antigen) 0.07307 1.0655941123_s_at L35594 ectonucleotide pyrophosphatase/phosphodiesterase 2
(autotaxin)0.18518 1.05975
40202 at D31716 basic transcription element binding protein 1 0.74951 1.0540237908 at U31384 guanine nucleotide binding protein (G protein), gamma 11 0.13786 1.0538640856_at U29953 serine (or cysteine) proteinase inhibitor, clade F (alpha-2
antiplasmin, pigment epithelium derived factor), member 10.93324 1.05227
41096 at AM 26134 S100 calcium binding protein A8 (calgranulin A) 0.54709 1.0512237762 at Y07909 epithelial membrane protein 1 0.84863 1.0491233890 at AF005887 regulator of G-protein signalling 5 0.74310 1.0477834303 at AL049949 hypothetical protein FLJ90798 0.36417 1.04672408_at X54131 chemokine (C-X-C motif) ligand 1 (melanoma growth
stimulating activity, alpha)0.49865 1.04631
38220 at U20938 dihydropyrimidine dehydrogenase 0.41881 1.0452736543 at J02931 coagulation factor III (thromboplastin, tissue factor) 0.38411 1.04507
143
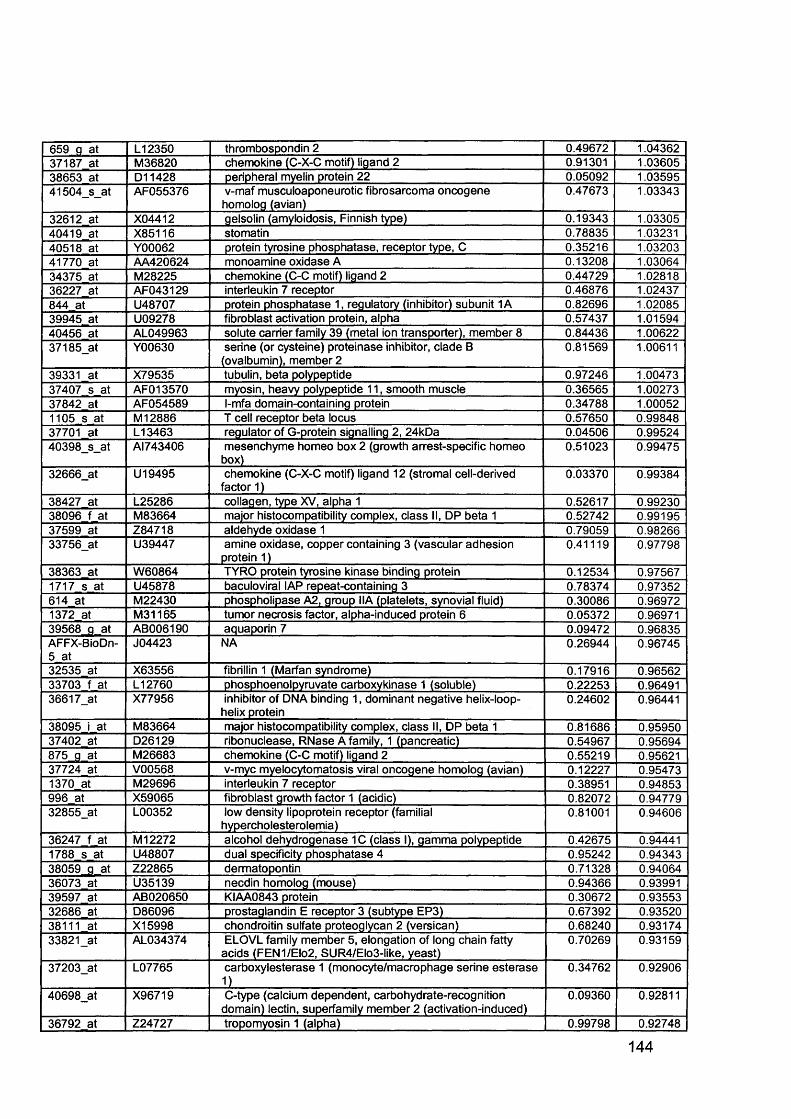
659 g at L12350 thrombospondin 2 0.49672 1.0436237187 at M36820 chemokine (C-X-C motif) ligand 2 0.91301 1.0360538653 at D11428 peripheral myelin protein 22 0.05092 1.0359541504_s_at AF055376 v-maf musculoaponeurotic fibrosarcoma oncogene
homolog (avian)0.47673 1.03343
32612 at X04412 gelsolin (amyloidosis, Finnish type) 0.19343 1.0330540419 at X85116 stomatin 0.78835 1.0323140518 at Y00062 protein tyrosine phosphatase, receptor type, C 0.35216 1.0320341770 at AA420624 monoamine oxidase A 0.13208 1.0306434375 at M28225 chemokine (C-C motif) ligand 2 0.44729 1.0281836227 at AF043129 interleukin 7 receptor 0.46876 1.02437844 at U48707 protein phosphatase 1, regulatory (inhibitor) subunit 1A 0.82696 1.0208539945 at U09278 fibroblast activation protein, alpha 0.57437 1.0159440456 at AL049963 solute carrier family 39 (metal ion transporter), member 8 0.84436 1.0062237185_at Y00630 serine (or cysteine) proteinase inhibitor, clade B
(ovalbumin), member 20.81569 1.00611
39331 at X79535 tubulin, beta polypeptide 0.97246 1.0047337407 s at AFO13570 myosin, heavy polypeptide 11, smooth muscle 0.36565 1.0027337842 at AF054589 l-mfa domain-containing protein 0.34788 1.000521105 s at M 12886 T cell receptor beta locus 0.57650 0.9984837701 at L13463 regulator of G-protein signalling 2, 24kOa 0.04506 0.9952440398_s_at AI743406 mesenchyme homeo box 2 (growth arrest-specific homeo
box)0.51023 0.99475
32666_at U19495 chemokine (C-X-C motif) ligand 12 (stromal cell-derived factor 1)
0.03370 0.99384
38427 at L25286 collagen, type XV, alpha 1 0.52617 0.9923038096 f at M83664 major histocompatibility complex, class II, DP beta 1 0.52742 0.9919537599 at Z84718 aldehyde oxidase 1 0.79059 0.9826633756_at U39447 amine oxidase, copper containing 3 (vascular adhesion
protein 1)0.41119 0.97798
38363 at W60864 TYRO protein tyrosine kinase binding protein 0.12534 0.975671717 s at U45878 baculoviral IAP repeat-containing 3 0.78374 0.97352614 at M22430 phospholipase A2, group IIA (platelets, synovial fluid) 0.30086 0.969721372 at M31165 tumor necrosis factor, alpha-induced protein 6 0.05372 0.9697139568_g at AB006190 aquaporin 7 0.09472 0.96835AFFX-BioDn- 5 at
J04423 NA 0.26944 0.96745
32535 at X63556 fibrillin 1 (Marfan syndrome) 0.17916 0.9656233703 f at L12760 phosphoenolpyruvate carboxykinase 1 (soluble) 0.22253 0.9649136617_at X77956 inhibitor of DNA binding 1, dominant negative helix-loop-
helix protein0.24602 0.96441
38095 i at M83664 major histocompatibility complex, class II, DP beta 1 0.81686 0.9595037402 at D26129 ribonuclease, RNase A family, 1 (pancreatic) 0.54967 0.95694875 g at M26683 chemokine (C-C motif) ligand 2 0.55219 0.9562137724 at V00568 v-myc myelocytomatosis viral oncogene homolog (avian) 0.12227 0.954731370 at M29696 interleukin 7 receptor 0.38951 0.94853996 at X59065 fibroblast growth factor 1 (acidic) 0.82072 0.9477932855_at L00352 low density lipoprotein receptor (familial
hypercholesterolemia)0.81001 0.94606
36247 f at M 12272 alcohol dehydrogenase 1C (class I), gamma polypeptide 0.42675 0.944411788 s at U48807 dual specificity phosphatase 4 0.95242 0.9434338059 _g at Z22865 dermatopontin 0.71328 0.9406436073 at U35139 necdin homolog (mouse) 0.94366 0.9399139597 at AB020650 KIAA0843 protein 0.30672 0.9355332686 at D86096 prostaglandin E receptor 3 (subtype EP3) 0.67392 0.9352038111 at X15998 chondroitin sulfate proteoglycan 2 (versican) 0.68240 0.9317433821_at AL034374 ELOVL family member 5, elongation of long chain fatty
acids (FEN1/Elo2, SUR4/Elo3-like, yeast)0.70269 0.93159
37203_at L07765 carboxylesterase 1 (monocyte/macrophage serine esteraseD
0.34762 0.92906
40698_at X96719 C-type (calcium dependent, carbohydrate-recognition domain) lectin, superfamily member 2 (activation-induced)
0.09360 0.92811
36792 at Z24727 tropomyosin 1 (alpha) 0.99798 | 0.92748
144
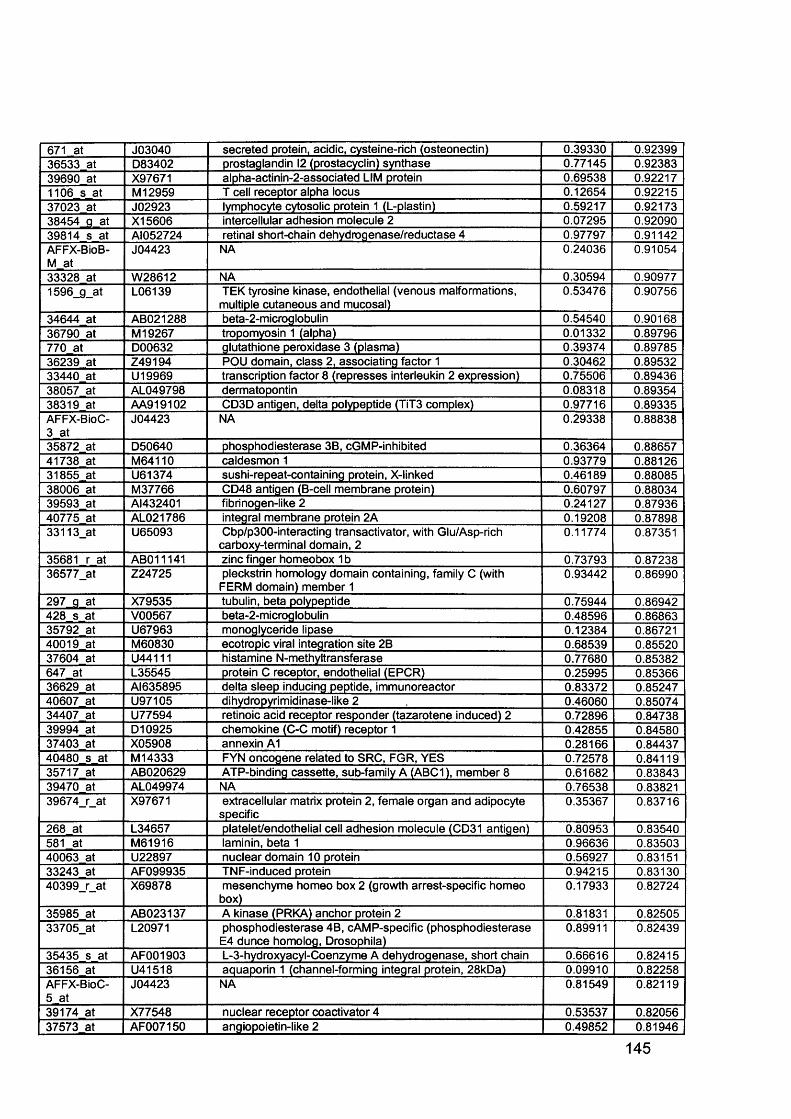
671 at J03040 secreted protein, acidic, cysteine-rich (osteonectin) 0.39330 0.9239936533 at D83402 prostaglandin 12 (prostacyclin) synthase 0.77145 0.9238339690 at X97671 alpha-actinin-2-associated LIM protein 0.69538 0.922171106 s at M 12959 T cell receptor alpha locus 0.12654 0.9221537023 at J02923 lymphocyte cytosolic protein 1 (L-plastin) 0.59217 0.9217338454 g at X15606 intercellular adhesion molecule 2 0.07295 0.9209039814 s at AI052724 retinal short-chain dehydrogenase/reductase 4 0.97797 0.91142AFFX-BioB- M at
J04423 NA 0.24036 0.91054
33328 at W28612 NA 0.30594 0.909771596_g_at L06139 TEK tyrosine kinase, endothelial (venous malformations,
multiple cutaneous and mucosal)0.53476 0.90756
34644 at AB021288 beta-2-microglobulin 0.54540 0.9016836790 at M 19267 tropomyosin 1 (alpha) 0.01332 0.89796770 at D00632 glutathione peroxidase 3 (plasma) 0.39374 0.8978536239 at Z49194 POU domain, class 2, associating factor 1 0.30462 0.8953233440 at U19969 transcription factor 8 (represses interleukin 2 expression) 0.75506 0.8943638057 at AL049798 dermatopontin 0.08318 0.8935438319 at AA919102 CD3D antigen, delta polypeptide (TiT3 complex) 0.97716 0.89335AFFX-BioC- 3 at
J04423 NA 0.29338 0.88838
35872 at D50640 phosphodiesterase 3B, cGMP-inhibited 0.36364 0.8865741738 at M64110 caldesmon 1 0.93779 0.8812631855 at U61374 sushi-repeat-containing protein, X-linked 0.46189 0.8808538006 at M37766 CD48 antigen (B-cell membrane protein) 0.60797 0.8803439593 at AI432401 fibrinogen-like 2 0.24127 0.8793640775 at AL021786 integral membrane protein 2A 0.19208 0.8789833113_at U65093 Cbp/p300-interacting transactivator, with Glu/Asp-rich
carboxy-terminal domain, 20.11774 0.87351
35681 r at AB011141 zinc finger homeobox 1 b 0.73793 0.8723836577_at Z24725 pleckstrin homology domain containing, family C (with
FERM domain) member 10.93442 0.86990
297 g at X79535 tubulin, beta polypeptide 0.75944 0.86942428 s at V00567 beta-2-microglobulin 0.48596 0.8686335792 at U67963 monoglyceride lipase 0.12384 0.8672140019 at M60830 ecotropic viral integration site 2B 0.68539 0.8552037604 at U44111 histamine N-methyltransferase 0.77680 0.85382647 at L35545 protein C receptor, endothelial (EPCR) 0.25995 0.8536636629 at AI635895 delta sleep inducing peptide, immunoreactor 0.83372 0.8524740607 at U97105 dihydropyrimidinase-like 2 0.46060 0.8507434407 at U77594 retinoic acid receptor responder (tazarotene induced) 2 0.72896 0.8473839994 at D10925 chemokine (C-C motif) receptor 1 0.42855 0.8458037403 at X05908 annexin A1 0.28166 0.8443740480 s at M 14333 FYN oncogene related to SRC, FGR, YES 0.72578 0.8411935717 at AB020629 ATP-binding cassette, sub-family A (ABC1), member 8 0.61682 0.8384339470 at AL049974 NA 0.76538 0.8382139674_r_at X97671 extracellular matrix protein 2, female organ and adipocyte
specific0.35367 0.83716
268 at L34657 platelet/endothelial cell adhesion molecule (CD31 antigen) 0.80953 0.83540581 at M61916 laminin, beta 1 0.96636 0.8350340063 at U22897 nuclear domain 10 protein 0.56927 0.8315133243 at AF099935 TNF-induced protein 0.94215 0.8313040399_r_at X69878 mesenchyme homeo box 2 (growth arrest-specific homeo
box)0.17933 0.82724
35985 at AB023137 A kinase (PRKA) anchor protein 2 0.81831 0.8250533705_at L20971 phosphodiesterase 4B, cAMP-specific (phosphodiesterase
E4 dunce homolog, Drosophila)0.89911 0.82439
35435 s at AF001903 L-3-hydroxyacyl-Coenzyme A dehydrogenase, short chain 0.66616 0.8241536156 at U41518 aquaporin 1 (channel-forming integral protein, 28kDa) 0.09910 0.82258AFFX-BioC- 5 at
J04423 NA 0.81549 0.82119
39174 at X77548 nuclear receptor coactivator 4 0.53537 0.8205637573 at AF007150 angiopoietin-like 2 0.49852 | 0.81946
145
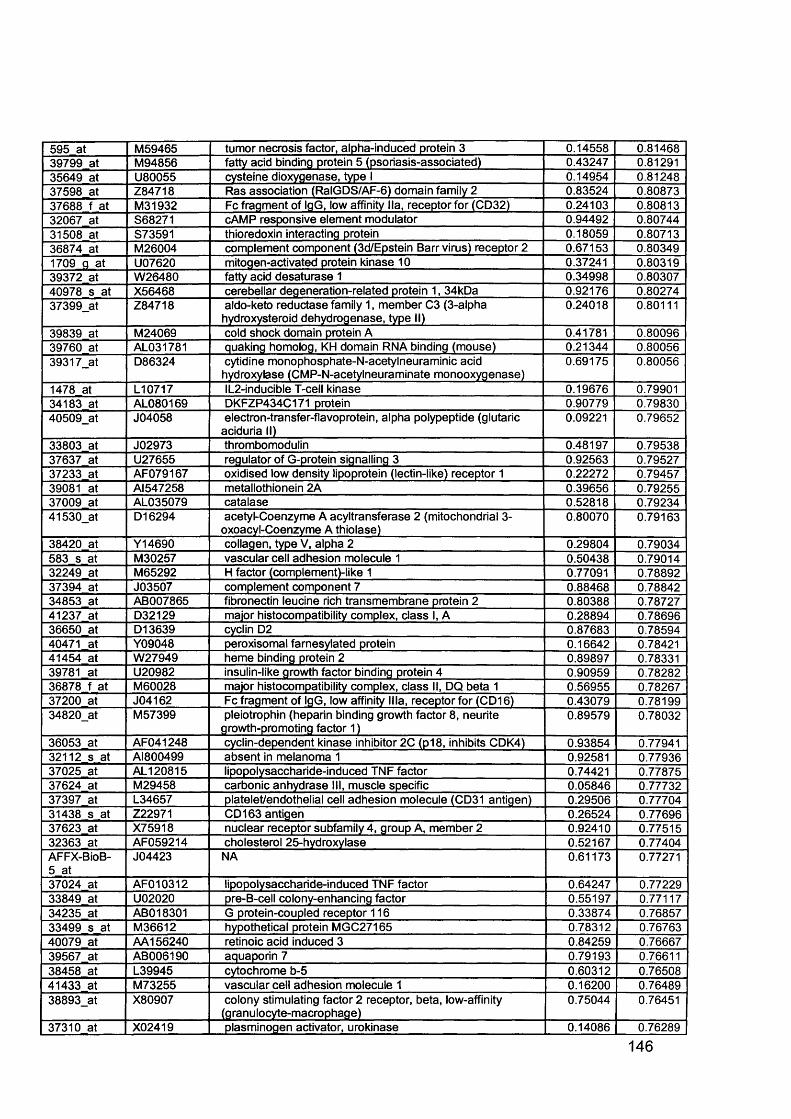
595 at M59465 tumor necrosis factor, alpha-induced protein 3 0.14558 0.8146839799 at M94856 fatty acid binding protein 5 (psoriasis-associated) 0.43247 0.8129135649 at U80055 cysteine dioxygenase, type I 0.14954 0.8124837598 at Z84718 Ras association (RalGDS/AF-6) domain family 2 0.83524 0.8087337688 f at M31932 Fc fragment of IgG, low affinity lla, receptor for (CD32) 0.24103 0.8081332067 at S68271 cAMP responsive element modulator 0.94492 0.8074431508 at S73591 thioredoxin interacting protein 0.18059 0.8071336874 at M26004 complement component (3d/Epstein Barr virus) receptor 2 0.67153 0.803491709 g at U07620 mitogen-activated protein kinase 10 0.37241 0.8031939372 at W26480 fatty acid desaturase 1 0.34998 0.8030740978 s at X56468 cerebellar degeneration-related protein 1, 34kDa 0.92176 0.8027437399_at Z84718 aldo-keto reductase family 1, member C3 (3-alpha
hydroxysteroid dehydrogenase, type II)0.24018 0.80111
39839 at M24069 cold shock domain protein A 0.41781 0.8009639760 at AL031781 quaking homolog, KH domain RNA binding (mouse) 0.21344 0.8005639317_at D86324 cytidine monophosphate-N-acetylneuraminic acid
hydroxylase (CMP-N-acetylneuraminate monooxygenase)0.69175 0.80056
1478 at L10717 IL2-inducible T-cell kinase 0.19676 0.7990134183 at AL080169 DKFZP434C171 protein 0.90779 0.7983040509_at J04058 electron-transfer-flavoprotein, alpha polypeptide (glutaric
aciduria II)0.09221 0.79652
33803 at J02973 thrombomodulin 0.48197 0.7953837637 at U27655 regulator of G-protein signalling 3 0.92563 0.7952737233 at AF079167 oxidised low density lipoprotein (lectin-like) receptor 1 0.22272 0.7945739081 at AI547258 metallothionein 2A 0.39656 0.7925537009 at AL035079 catalase 0.52818 0.7923441530_at D16294 acetyl-Coenzyme A acyltransferase 2 (mitochondrial 3-
oxoacyl-Coenzyme A thiolase)0.80070 0.79163
38420 at Y14690 collagen, type V, alpha 2 0.29804 0.79034583 s at M30257 vascular cell adhesion molecule 1 0.50438 0.7901432249 at M65292 H factor (complement)-like 1 0.77091 0.7889237394 at J03507 complement component 7 0.88468 0.7884234853 at AB007865 fibronectin leucine rich transmembrane protein 2 0.80388 0.7872741237 at D32129 major histocompatibility complex, class I, A 0.28894 0.7869636650 at D13639 cyclin D2 0.87683 0.7859440471 at Y09048 peroxisomal farnesylated protein 0.16642 0.7842141454 at W27949 heme binding protein 2 0.89897 0.7833139781 at U20982 insulin-like growth factor binding protein 4 0.90959 0.7828236878 f at M60028 major histocompatibility complex, class II, DQ beta 1 0.56955 0.7826737200 at J04162 Fc fragment of IgG, low affinity Ilia, receptor for (CD16) 0.43079 0.7819934820_at M57399 pleiotrophin (heparin binding growth factor 8, neurite
growth-promoting factor 1)0.89579 0.78032
36053 at AF041248 cyclin-dependent kinase inhibitor 2C (p18, inhibits CDK4) 0.93854 0.7794132112 s at AI800499 absent in melanoma 1 0.92581 0.7793637025 at AL120815 lipopolysaccharide-induced TNF factor 0.74421 0.7787537624 at M29458 carbonic anhydrase III, muscle specific 0.05846 0.7773237397 at L34657 platelet/endothelial cell adhesion molecule (CD31 antigen) 0.29506 0.7770431438 s at Z22971 CD 163 antigen 0.26524 0.7769637623 at X75918 nuclear receptor subfamily 4, group A, member 2 0.92410 0.7751532363 at AF059214 cholesterol 25-hydroxylase 0.52167 0.77404AFFX-BioB- 5 at
J04423 NA 0.61173 0.77271
37024 at AF010312 lipopolysaccharide-induced TNF factor 0.64247 0.7722933849 at U02020 pre-B-cell colony-enhancing factor 0.55197 0.7711734235 at AB018301 G protein-coupled receptor 116 0.33874 0.7685733499 s at M36612 hypothetical protein MGC27165 0.78312 0.7676340079 at AA156240 retinoic acid induced 3 0.84259 0.7666739567 at AB006190 aquaporin 7 0.79193 0.7661138458 at L39945 cytochrome b-5 0.60312 0.7650841433 at M73255 vascular cell adhesion molecule 1 0.16200 0.7648938893_at X80907 colony stimulating factor 2 receptor, beta, low-affinity
(granulocyte-macrophage)0.75044 0.76451
37310 at X02419 plasminogen activator, urokinase 0.14086 0.76289
146
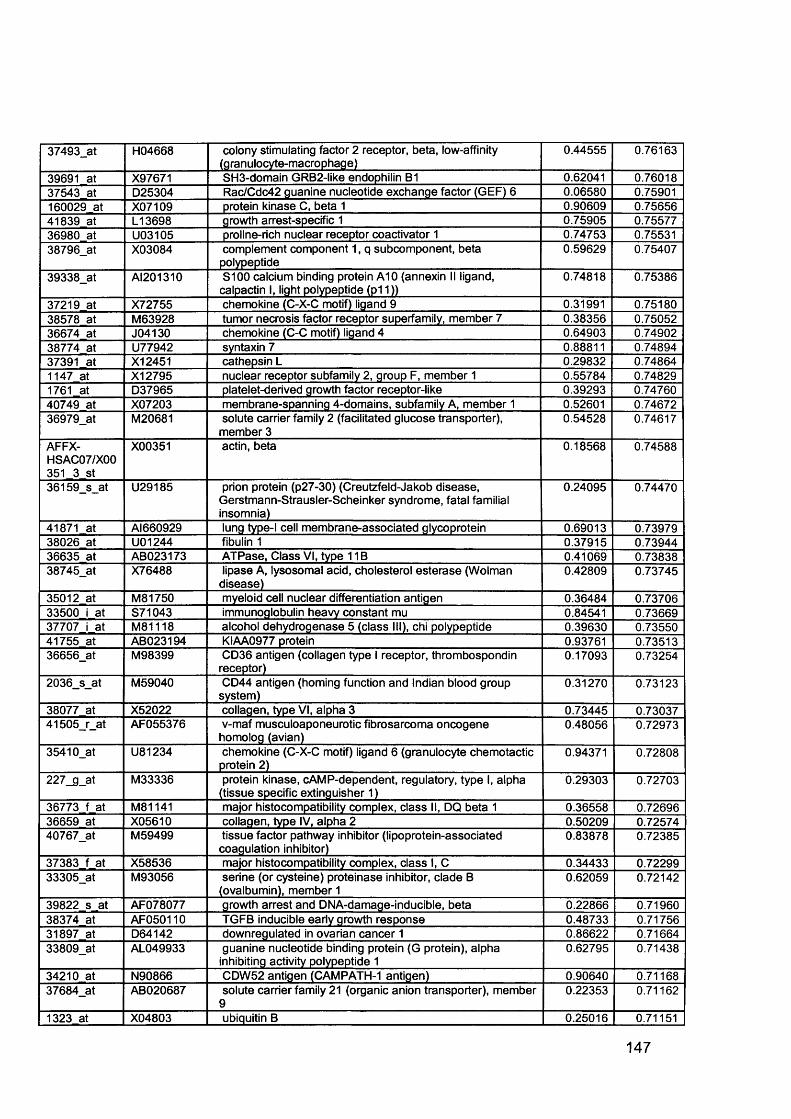
37493_at H04668 colony stimulating factor 2 receptor, beta, low-affinity (granulocyte-macrophage)
0.44555 0.76163
39691 at X97671 SH3-domain GRB2-like endophilin B1 0.62041 0.7601837543 at D25304 Rac/Cdc42 guanine nucleotide exchange factor (GEF) 6 0.06580 0.75901160029 at X07109 protein kinase C, beta 1 0.90609 0.7565641839 at L13698 growth arrest-specific 1 0.75905 0.7557736980 at U03105 proline-rich nuclear receptor coactivator 1 0.74753 0.7553138796_at X03084 complement component 1, q subcomponent, beta
polypeptide0.59629 0.75407
39338_at AI201310 S100 calcium binding protein A10 (annexin II ligand, calpactin I, light polypeptide (p11))
0.74818 0.75386
37219 at X72755 chemokine (C-X-C motif) ligand 9 0.31991 0.7518038578 at M63928 tumor necrosis factor receptor superfamily, member 7 0.38356 0.7505236674 at J04130 chemokine (C-C motif) ligand 4 0.64903 0.7490238774 at U77942 syntaxin 7 0.88811 0.7489437391 at X12451 cathepsin L 0.29832 0.748641147 at X12795 nuclear receptor subfamily 2, group F, member 1 0.55784 0.748291761 at D37965 platelet-derived growth factor receptor-like 0.39293 0.7476040749 at X07203 membrane-spanning 4-domains, subfamily A, member 1 0.52601 0.7467236979_at M20681 solute carrier family 2 (facilitated glucose transporter),
member 30.54528 0.74617
AFFX-HSAC07/X00 351 3 st
X00351 actin, beta 0.18568 0.74588
36159_s_at U29185 prion protein (p27-30) (Creutzfeld-Jakob disease, Gerstmann-Strausler-Scheinker syndrome, fatal familial insomnia)
0.24095 0.74470
41871 at Al660929 lung type-l cell membrane-associated glycoprotein 0.69013 0.7397938026 at U01244 fibulin 1 0.37915 0.7394436635 at AB023173 ATPase, Class VI, type 11B 0.41069 0.7383838745_at X76488 lipase A, lysosomal acid, cholesterol esterase (Wolman
disease)0.42809 0.73745
35012 at M81750 myeloid cell nuclear differentiation antigen 0.36484 0.7370633500 i at S71043 immunoglobulin heavy constant mu 0.84541 0.7366937707 i at M81118 alcohol dehydrogenase 5 (class III), chi polypeptide 0.39630 0.7355041755 at AB023194 KIAA0977 protein 0.93761 0.7351336656_at M98399 CD36 antigen (collagen type I receptor, thrombospondin
receptor)0.17093 0.73254
2036_s_at M59040 CD44 antigen (homing function and Indian blood group system)
0.31270 0.73123
38077 at X52022 collagen, type VI, alpha 3 0.73445 0.7303741505_r_at AF055376 v-maf musculoaponeurotic fibrosarcoma oncogene
homolog (avian)0.48056 0.72973
35410_at U81234 chemokine (C-X-C motif) ligand 6 (granulocyte chemotactic protein 2)
0.94371 0.72808
227_g_at M33336 protein kinase, cAMP-dependent, regulatory, type I, alpha (tissue specific extinguisher 1)
0.29303 0.72703
36773 f at M81141 major histocompatibility complex, class II, DQ beta 1 0.36558 0.7269636659 at X05610 collagen, type IV, alpha 2 0.50209 0.7257440767_at M59499 tissue factor pathway inhibitor (lipoprotein-associated
coagulation inhibitor)0.83878 0.72385
37383 f at X58536 major histocompatibility complex, class I, C 0.34433 0.7229933305_at M93056 serine (or cysteine) proteinase inhibitor, clade B
(ovalbumin), member 10.62059 0.72142
39822 s at AF078077 growth arrest and DNA-damage-inducible, beta 0.22866 0.7196038374 at AF050110 TGFB inducible early growth response 0.48733 0.7175631897 at D64142 downregulated in ovarian cancer 1 0.86622 0.7166433809_at AL049933 guanine nucleotide binding protein (G protein), alpha
inhibiting activity polypeptide 10.62795 0.71438
34210 at N90866 CDW52 antigen (CAMPATH-1 antigen) 0.90640 0.7116837684_at AB020687 solute carrier family 21 (organic anion transporter), member
90.22353 0.71162
1323 at X04803 ubiquitin B 0.25016 0.71151
147
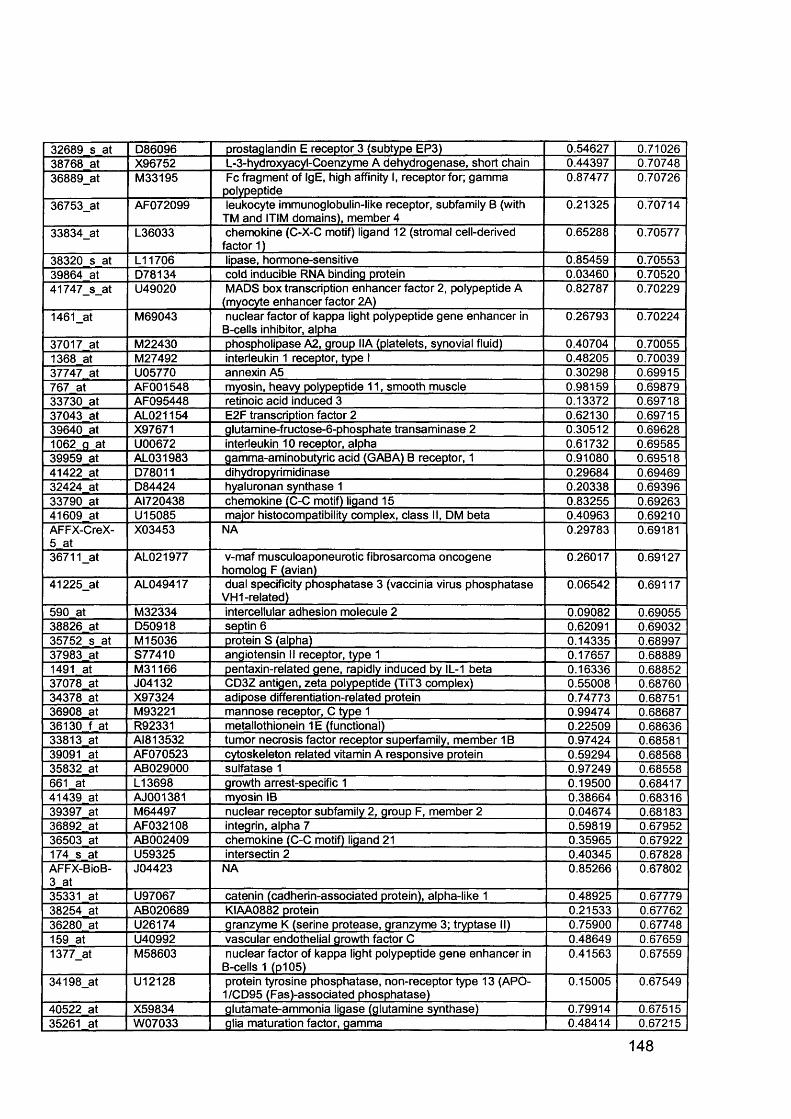
32689 s at D86096 prostaglandin E receptor 3 (subtype EP3) 0.54627 0.7102638768 at X96752 L-3-hydroxyacyl-Coenzyme A dehydrogenase, short chain 0.44397 0.7074836889_at M33195 Fc fragment of IgE, high affinity I, receptor for; gamma
polypeptide0.87477 0.70726
36753_at AF072099 leukocyte immunoglobulin-like receptor, subfamily B (with TM and ITIM domains), member 4
0.21325 0.70714
33834_at L36033 chemokine (C-X-C motif) ligand 12 (stromal cell-derived factor 1)
0.65288 0.70577
38320 s at L11706 lipase, hormone-sensitive 0.85459 0.7055339864 at D78134 cold inducible RNA binding protein 0.03460 0.7052041747_s_at U49020 MADS box transcription enhancer factor 2, polypeptide A
(myocyte enhancer factor 2A)0.82787 0.70229
1461_at M69043 nuclear factor of kappa light polypeptide gene enhancer in B-cells inhibitor, alpha
0.26793 0.70224
37017 at M22430 phospholipase A2, group IIA (platelets, synovial fluid) 0.40704 0.700551368 at M27492 interleukin 1 receptor, type I 0.48205 0.7003937747 at U05770 annexin A5 0.30298 0.69915767 at AF001548 myosin, heavy polypeptide 11, smooth muscle 0.98159 0.6987933730 at AF095448 retinoic acid induced 3 0.13372 0.6971837043 at AL021154 E2F transcription factor 2 0.62130 0.6971539640 at X97671 glutamine-fructose-6-phosphate transaminase 2 0.30512 0.696281062 a at U00672 interleukin 10 receptor, alpha 0.61732 0.6958539959 at AL031983 gamma-aminobutyric acid (GABA) B receptor, 1 0.91080 0.6951841422 at D78011 dihydropyrimidinase 0.29684 0.6946932424 at D84424 hyaluronan synthase 1 0.20338 0.6939633790 at AI720438 chemokine (C-C motif) ligand 15 0.83255 0.6926341609 at U15085 major histocompatibility complex, class II, DM beta 0.40963 0.69210AFFX-CreX- 5 at
X03453 NA 0.29783 0.69181
36711_at AL021977 v-maf musculoaponeurotic fibrosarcoma oncogene homolog F (avian)
0.26017 0.69127
41225_at AL049417 dual specificity phosphatase 3 (vaccinia virus phosphatase VH1-related)
0.06542 0.69117
590 at M32334 intercellular adhesion molecule 2 0.09082 0.6905538826 at D50918 septin 6 0.62091 0.6903235752 s at M 15036 protein S (alpha) 0.14335 0.6899737983 at S77410 angiotensin II receptor, type 1 0.17657 0.688891491 at M31166 pentaxin-related gene, rapidly induced by IL-1 beta 0.16336 0.6885237078 at J04132 CD3Z antigen, zeta polypeptide (TiT3 complex) 0.55008 0.6876034378 at X97324 adipose differentiation-related protein 0.74773 0.6875136908 at M93221 mannose receptor, C type 1 0.99474 0.6868736130 f at R92331 metallothionein 1E (functional) 0.22509 0.6863633813 at AI813532 tumor necrosis factor receptor superfamily, member 1B 0.97424 0.6858139091 at AF070523 cytoskeleton related vitamin A responsive protein 0.59294 0.6856835832 at AB029000 sulfatase 1 0.97249 0.68558661 at L13698 growth arrest-specific 1 0.19500 0.6841741439 at AJ001381 myosin IB 0.38664 0.6831639397 at M64497 nuclear receptor subfamily 2, group F, member 2 0.04674 0.6818336892 at AF032108 integrin, alpha 7 0.59819 0.6795236503 at AB002409 chemokine (C-C motif) ligand 21 0.35965 0.67922174 s at U59325 intersectin 2 0.40345 0.67828AFFX-BioB- 3 at
J04423 NA 0.85266 0.67802
35331 at U97067 catenin (cadherin-associated protein), alpha-like 1 0.48925 0.6777938254 at AB020689 KIAA0882 protein 0.21533 0.6776236280 at U26174 granzyme K (serine protease, granzyme 3; tryptase II) 0.75900 0.67748159 at U40992 vascular endothelial growth factor C 0.48649 0.676591377_at M58603 nuclear factor of kappa light polypeptide gene enhancer in
B-cells 1 (p105)0.41563 0.67559
34198_at U12128 protein tyrosine phosphatase, non-receptor type 13 (APO- 1/CD95 (Fas)-associated phosphatase)
0.15005 0.67549
40522 at X59834 glutamate-ammonia ligase (glutamine synthase) 0.79914 0.6751535261 at W07033 glia maturation factor, gamma 0.48414 0.67215
148
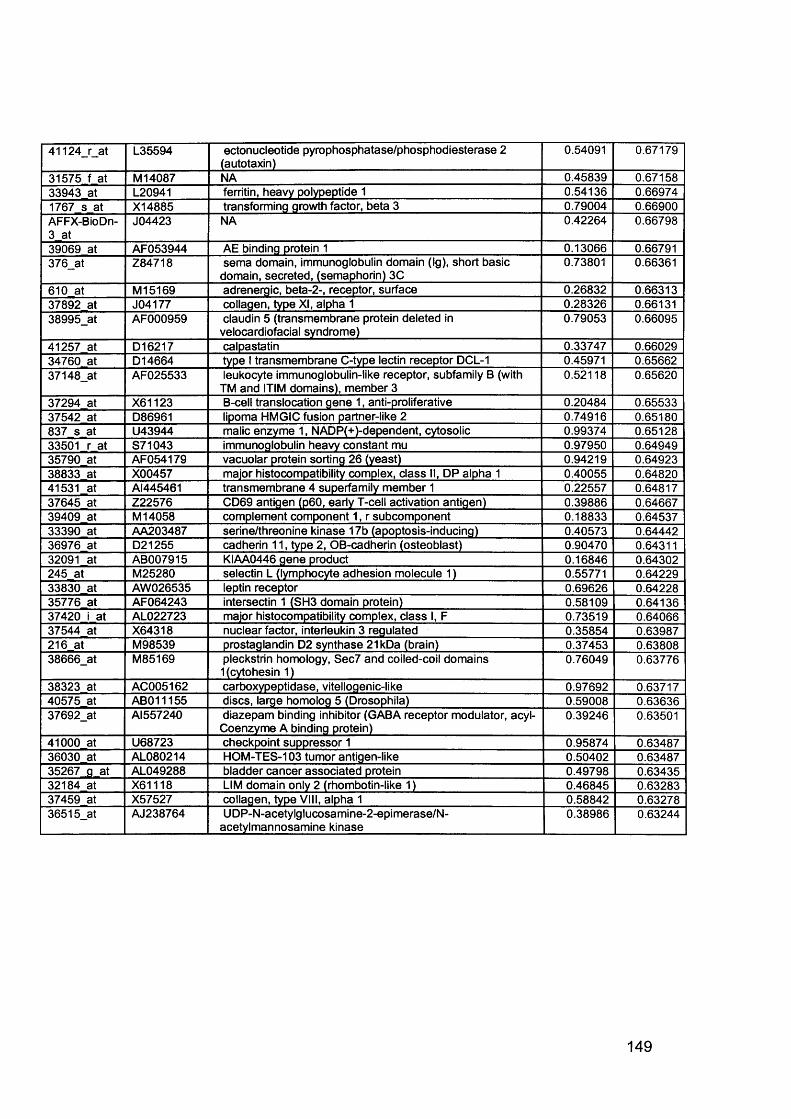
41124_r_at L35594 ectonucleotide pyrophosphatase/phosphodiesterase 2 (autotaxin)
0.54091 0.67179
31575 f at M 14087 NA 0.45839 0.6715833943 at L20941 ferritin, heavy polypeptide 1 0.54136 0.669741767 s at X14885 transforming growth factor, beta 3 0.79004 0.66900AFFX-BioDn- 3 at
J04423 NA 0.42264 0.66798
39069 at AF053944 AE binding protein 1 0.13066 0.66791376_at Z84718 sema domain, immunoglobulin domain (Ig), short basic
domain, secreted, (semaphorin) 3C0.73801 0.66361
610 at M15169 adrenergic, beta-2-, receptor, surface 0.26832 0.6631337892 at J04177 collagen, type XI, alpha 1 0.28326 0.6613138995_at AF000959 claudin 5 (transmembrane protein deleted in
velocardiofacial syndrome)0.79053 0.66095
41257 at D16217 calpastatin 0.33747 0.6602934760 at D14664 type I transmembrane C-type lectin receptor DCL-1 0.45971 0.6566237148_at AF025533 leukocyte immunoglobulin-like receptor, subfamily B (with
TM and ITIM domains), member 30.52118 0.65620
37294 at X61123 B-cell translocation gene 1, anti-proliferative 0.20484 0.6553337542 at D86961 lipoma HMGIC fusion partner-like 2 0.74916 0.65180837 s at U43944 malic enzyme 1, NADP(+)-dependent, cytosolic 0.99374 0.6512833501 r at S71043 immunoglobulin heavy constant mu 0.97950 0.6494935790 at AF054179 vacuolar protein sorting 26 (yeast) 0.94219 0.6492338833 at X00457 major histocompatibility complex, class II, DP alpha 1 0.40055 0.6482041531 at AI445461 transmembrane 4 superfamily member 1 0.22557 0.6481737645 at Z22576 CD69 antigen (p60, early T-cell activation antigen) 0.39886 0.6466739409 at M 14058 complement component 1, r subcomponent 0.18833 0.6453733390 at AA203487 serine/threonine kinase 17b (apoptosis-inducing) 0.40573 0.6444236976 at D21255 cadherin 11, type 2, OB-cadherin (osteoblast) 0.90470 0.6431132091 at AB007915 KIAA0446 gene product 0.16846 0.64302245 at M25280 selectin L (lymphocyte adhesion molecule 1) 0.55771 0.6422933830 at AW026535 leptin receptor 0.69626 0.6422835776 at AF064243 intersectin 1 (SH3 domain protein) 0.58109 0.6413637420 i at AL022723 major histocompatibility complex, class I, F 0.73519 0.6406637544 at X64318 nuclear factor, interleukin 3 regulated 0.35854 0.63987216 at M98539 prostaglandin D2 synthase 21kDa (brain) 0.37453 0.6380838666_at M85169 pleckstrin homology, Sec7 and coiled-coil domains
1 (cytohesin 1)0.76049 0.63776
38323 at AC005162 carboxypeptidase, vitellogenic-like 0.97692 0.6371740575 at AB011155 discs, large homolog 5 (Drosophila) 0.59008 0.6363637692_at Al557240 diazepam binding inhibitor (GABA receptor modulator, acyl-
Coenzyme A binding protein)0.39246 0.63501
41000 at U68723 checkpoint suppressor 1 0.95874 0.6348736030 at AL080214 HOM-TES-103 tumor antigen-like 0.50402 0.6348735267 g at AL049288 bladder cancer associated protein 0.49798 0.6343532184 at X61118 LIM domain only 2 (rhombotin-like 1) 0.46845 0.6328337459 at X57527 collagen, type VIII, alpha 1 0.58842 0.6327836515_at AJ238764 UDP-N-acetylglucosamine-2-epimerase/N-
acetylmannosamine kinase0.38986 0.63244
149
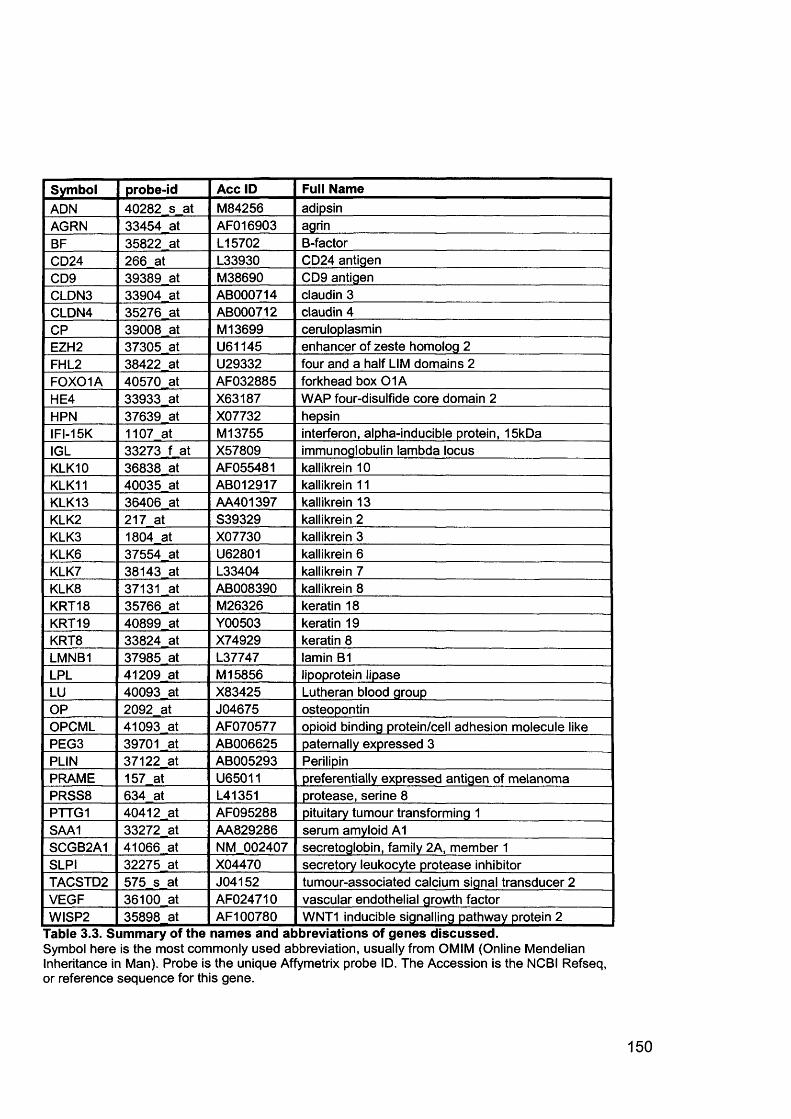
Symbol probe-id Acc ID Full NameADN 40282 s at M84256 adipsinAGRN 33454 at AF016903 agrinBF 35822 at L15702 B-factorCD24 266 at L33930 CD24 antigenCD9 39389 at M38690 CD9 antigenCLDN3 33904 at AB000714 claudin 3CLDN4 35276 at AB000712 claudin 4CP 39008 at M13699 ceruloplasminEZH2 37305 at U61145 enhancer of zeste homolog 2FHL2 38422 at U29332 four and a half LIM domains 2FOXOIA 40570 at AF032885 forkhead box 0 1 AHE4 33933 at X63187 WAP four-disulfide core domain 2HPN 37639 at X07732 hepsinIFI-15K 1107 at M13755 interferon, alpha-inducible protein, 15kDaIGL 33273 f at X57809 immunoglobulin lambda locusKLK10 36838 at AF055481 kallikrein 10KLK11 40035 at AB012917 kallikrein 11KLK13 36406 at AA401397 kallikrein 13KLK2 217 at S39329 kallikrein 2KLK3 1804 at X07730 kallikrein 3KLK6 37554 at U62801 kallikrein 6KLK7 38143 at L33404 kallikrein 7KLK8 37131 at AB008390 kallikrein 8KRT18 35766 at M26326 keratin 18KRT19 40899 at Y00503 keratin 19KRT8 33824 at X74929 keratin 8LMNB1 37985 at L37747 lamin B1LPL 41209 at M 15856 lipoprotein lipaseLU 40093 at X83425 Lutheran blood groupOP 2092 at J04675 osteopontinOPCML 41093 at AF070577 opioid binding protein/cell adhesion molecule likePEG3 39701 at AB006625 paternally expressed 3PLIN 37122 at AB005293 PerilipinPRAME 157 at U65011 preferentially expressed antigen of melanomaPRSS8 634 at L41351 protease, serine 8PTTG1 40412 at AF095288 pituitary tumour transforming 1SAA1 33272 at AA829286 serum amyloid A1SCGB2A1 41066 at NM 002407 secretoglobin, family 2A, member 1SLPI 32275 at X04470 secretory leukocyte protease inhibitorTACSTD2 575 s at J04152 tumour-associated calcium signal transducer 2VEGF 36100 at AF024710 vascular endothelial growth factorWISP2 35898 at AF100780 WNT1 inducible signalling pathway protein 2
Table 3.3. Summary of the names and abbreviations of genes discussed.Symbol here is the most commonly used abbreviation, usually from OMIM (Online Mendelian Inheritance in Man). Probe is the unique Affymetrix probe ID. The Accession is the NCBI Refseq, or reference sequence for this gene.
150
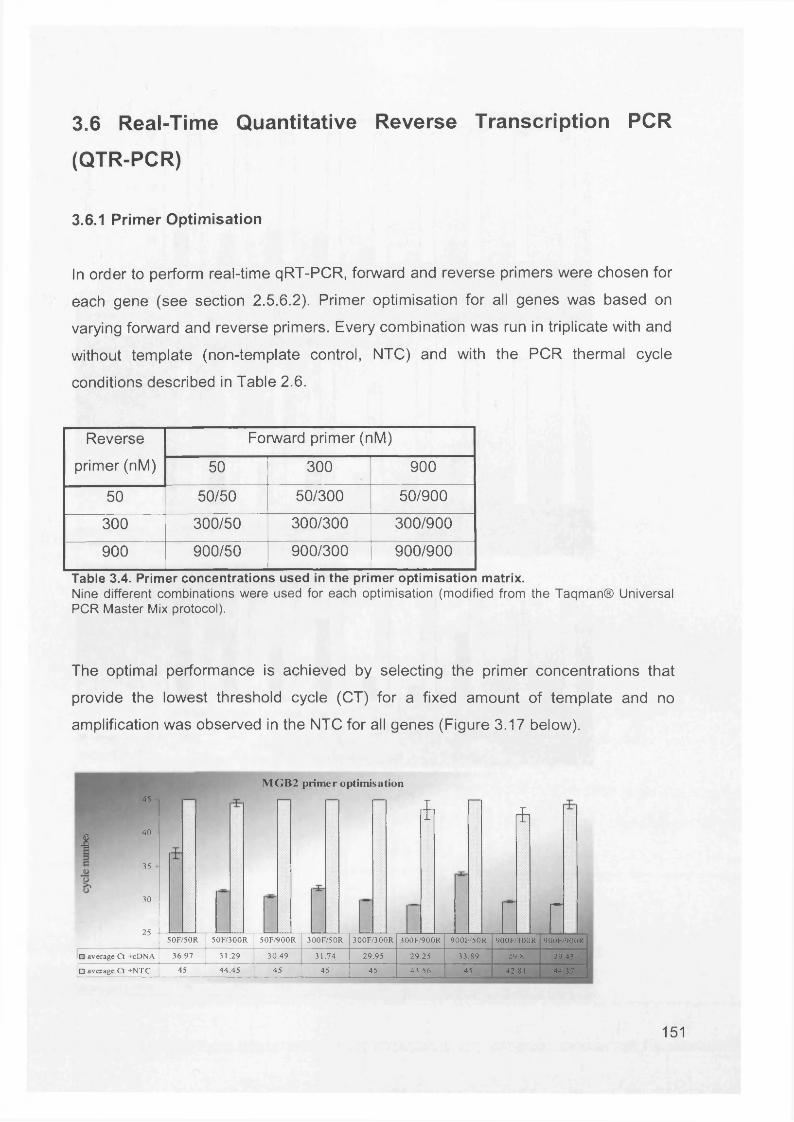
3.6 Real-Time Quantitative Reverse Transcription PCR
(QTR-PCR)
3.6.1 Primer Optimisation
In order to perform real-time qRT-PCR, forward and reverse primers were chosen for
each gene (see section 2.5.6.2). Primer optimisation for all genes was based on
varying forward and reverse primers. Every combination was run in triplicate with and
without template (non-template control, NTC) and with the PCR thermal cycle
conditions described in Table 2.6.
Reverse
primer (nM)
Forward primer (nM)
50 300 900
50 50/50 50/300 50/900
300 300/50 300/300 300/900
900 900/50 900/300 900/900
Table 3.4. Primer concentrations used in the primer optimisation matrix.Nine different combinations were used for each optimisation (modified from the Taqman® Universal PCR Master Mix protocol).
The optimal performance is achieved by selecting the primer concentrations that
provide the lowest threshold cycle (CT) for a fixed amount of template and no
amplification was observed in the NTC for all genes (Figure 3.17 below).
I
45
40 -
35
30 -
MGB2 primer optimisation
ifl *
I25 -5 0F/5 OR 50F/300R 50F/900R 300F/50R 300F/300R 300F/900R 900F/50R 900F/300R 900F/900R
□ average Ct +cDNA 36.97 31.29 30.49 31.74 29.95 29.25 33.89 29.8 29.43
□ average Ct +NTC 45 44.45 45 45 45 43.56 45 42.81 44.37
151
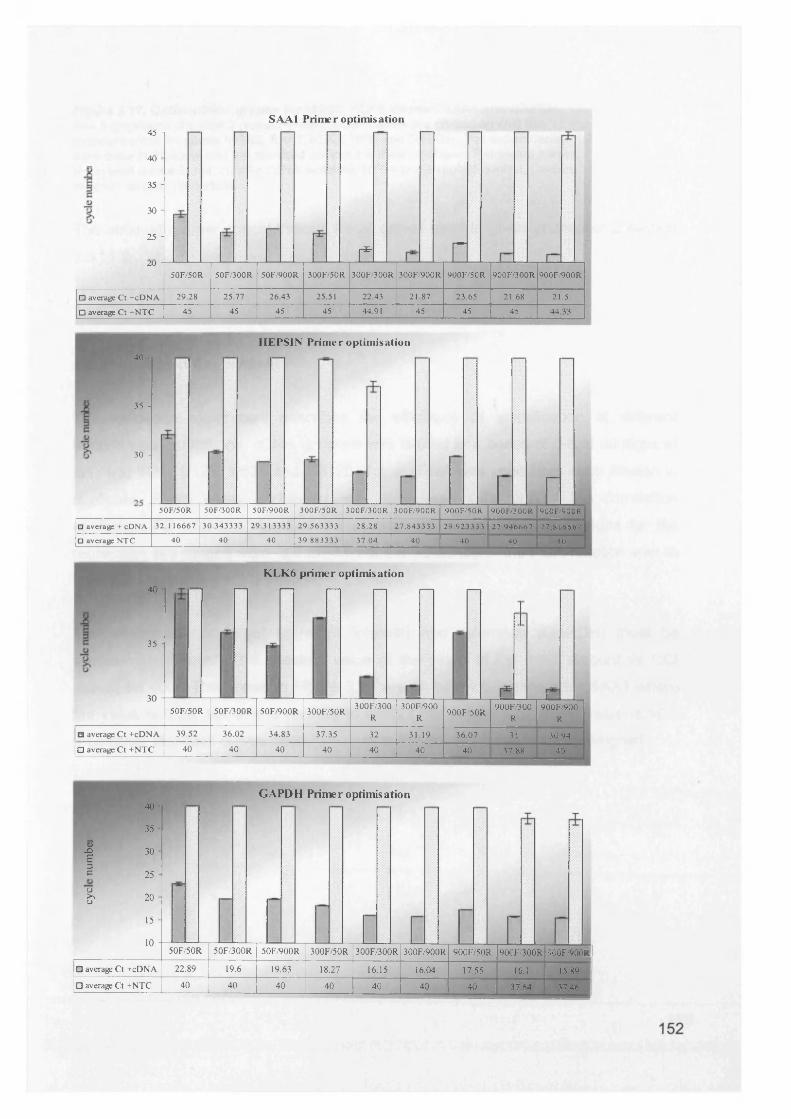
SAA1 Primer optimisation45 -|
40
35 H
30
25 H
£ nzu -50F/50R 50F/300R 50F/900R 300F/50R 300F/300R 300F/900R 900F/50R 900F/300R 900F/900R
□ average Ct +cDNA 29.28 25.77 26.43 25.51 22.43 21.87 23.65 21.68 21.5
□ average Ct +NTC 45 45 45 45 44.91 45 45 45 44.33
H EPSIN Prim er optim isation40
35 -
30 -
E-50F/50R 50F/300R 5 0F/900R 300F/50R 300F/300R 300F/900R 900F/50R 900F/300R 900F/900R
□ average + cDNA 32.116667 30.343333 29.313333 29.563333 28.28 27.843333 29.923333 27.946667 27.816667
□ average NTC 40 40 40 39.883333 37.04 40 40 40 40
KLK6 primer optimisation40
35 -
30 -50F/50R 50F/300R 50F/900R 300F/50R
300F/3 00 R
300F/900R
900F/50R900F/300
R
L _900F/900
R
□ average Ct +cDNA 39.52 36.02 34.83 37.35 32 31.19 36.07 31 30.94| □ average Ct +N TC 40 40 40 40 40 40 40 37.88 40
<DXI13eo>,u
40
35
30
25
20
15
GAPDH Primer optimisation
10 -50F/50R 50F/300R 50F/900R 300F/50R 300F/300R 300F/900R 900F/50R 900F/300R 900F/900R
□ average Ct +cDNA 22.89 19.6 19.63 18.27 16.15 16.04 17.55 16.1 15.89□ average Ct +NTC 40 40 40 40 40 40 40 37.64 37.46
Figure 3.17. Optimisation graphs for MGB2, KLK6, hepsin, SAA1 and GAPDH.See 5 graphs on previous 2 pages.Primer concentrations are plotted against the threshold cycle for genes MGB2, SAA1, KLK6, HPN and GAPDH. The experiments were done in triplicate and the standard error of the mean is shown. F=forward primer,R=reverse primer in nM. cDNA= cDNA template, NTC= non-template control, Ct=time at which amplification starts.
The optimum primer concentrations for all genes used is given in chapter 2 section
2.5.11.2.
3.6.2 Validation Experiment
The validation experiment describes the efficiency of amplification at different
template concentrations. cDNA template was diluted in a series of 5-fold dilutions at 1/1, 1/5, 1/25, 1/125, 1/625 and 1/3125. 1pl of cDNA was used from each dilution in duplicate. Every assay performed was considered valid only if the correlation
coefficient R2 , for the standard curves was >0.98 and the slope values for the
regression line ranged from -3.3 to -3.9 i.e. the efficiency of the PCR reaction was at least 80% (efficiency = 10(-1/slope) - 1 x 100).
The efficiencies of target (gene of interest) and reference (GAPDH) must be
approximately equal. The absolute value of the slope of log input amount vs DCt should be <0.2. The genes in Figure 3.18 are all below 0.2 except for SAA1 where
the value is 0.28, but this is unlikely to disrupt the experiment. If the value is >0.2
then either standard curves need to be run or the primers need to be redesigned.
153
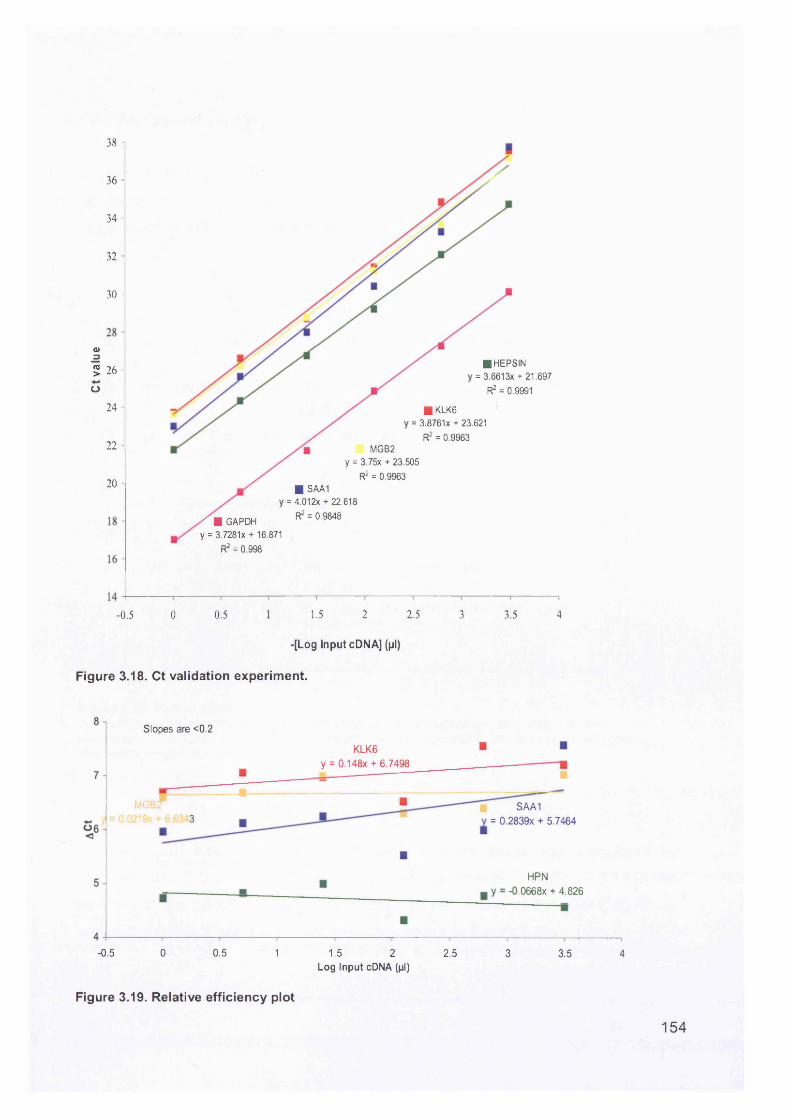
38 -i
36 -
34 -
32 -
30 -
o35 26 -
■ HEPSIN = 3.6613x + 21.697
R2 = 0.9991O24 - ■ KLK6
= 3.8761X + 23.621
R2 = 0.996322 - MGB2
y = 3.75x + 23.505
R2 = 0.996320 - ■ SAA1
= 4.012x + 22.618
R2 = 0.9848/ ■ GAPDH y = 3.7281 x + 16.871
R2 = 0.998
2 2.50.5 1.5 3 3.50 4-0.5
-[Log Input cDNA] (pi)
Figure 3.18. Ct validation experiment.
Slopes are <0.2
KLK6 y = 0.148x + 6.7498
M G B Z
3SAA1
= 0.2839X + 5.7464
HPN ,0668x + 4.826
-0.5 0 0.5 1 1.5 2 2.5 3 3.5 4Log Input cDNA (pi)
Figure 3.19. Relative efficiency plot
154
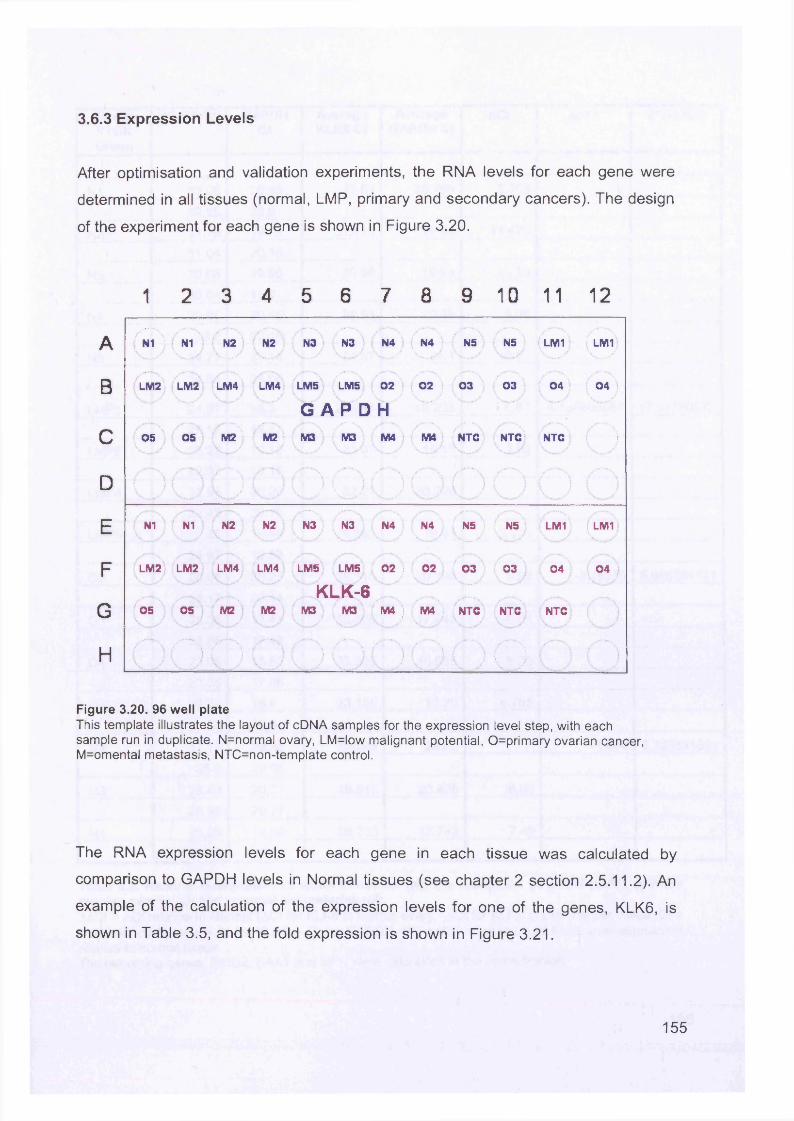
3.6.3 Expression Levels
After optimisation and validation experiments, the RNA levels for each gene were
determined in all tissues (normal, LMP, primary and secondary cancers). The design
of the experiment for each gene is shown in Figure 3.20.
1 2 3 4 5 6 7 8 9 10 11 12
A (mi ) N1 N2 N2 N3 N3 N4 N4 NS NS LM1 { LM1
B LM2 LM2 LM4 LM4 LMS LM5 02 02 03 03 i 04 ( 04 i
S \ M2 I
G A P D HC OS OS M2 j M3 M3 M4 ! M4 NTC NTC NTC )
D/-- \ \ / \ .«
\ / \ /■
E N1 N1 N2 N2 N3 N3 N4 N4 NS NS ; LM1 I LM1
F LM2 LM2 LM4 LM4 LMS LM5 02 i 02 03 03 04 04 )
G 05 OS M2 M2KLK-6
M3 M3 M4 ) M4 ) NTC NTC NTC
H i ‘" \ / N \ / V i
( ) i/
Figure 3.20. 96 w ell p lateThis template illustrates the layout of cDNA samples for the expression level step, with each sample run in duplicate. N=normal ovary, LM=low m alignant potential, 0=prim ary ovarian cancer, M=omental metastasis, NTC=non-template control.
The RNA expression levels for each gene in each tissue was calculated by
comparison to GAPDH levels in Normal tissues (see chapter 2 section 2.5.11.2). An
example of the calculation of the expression levels for one of the genes, KLK6, is
shown in Table 3.5, and the fold expression is shown in Figure 3.21.
155
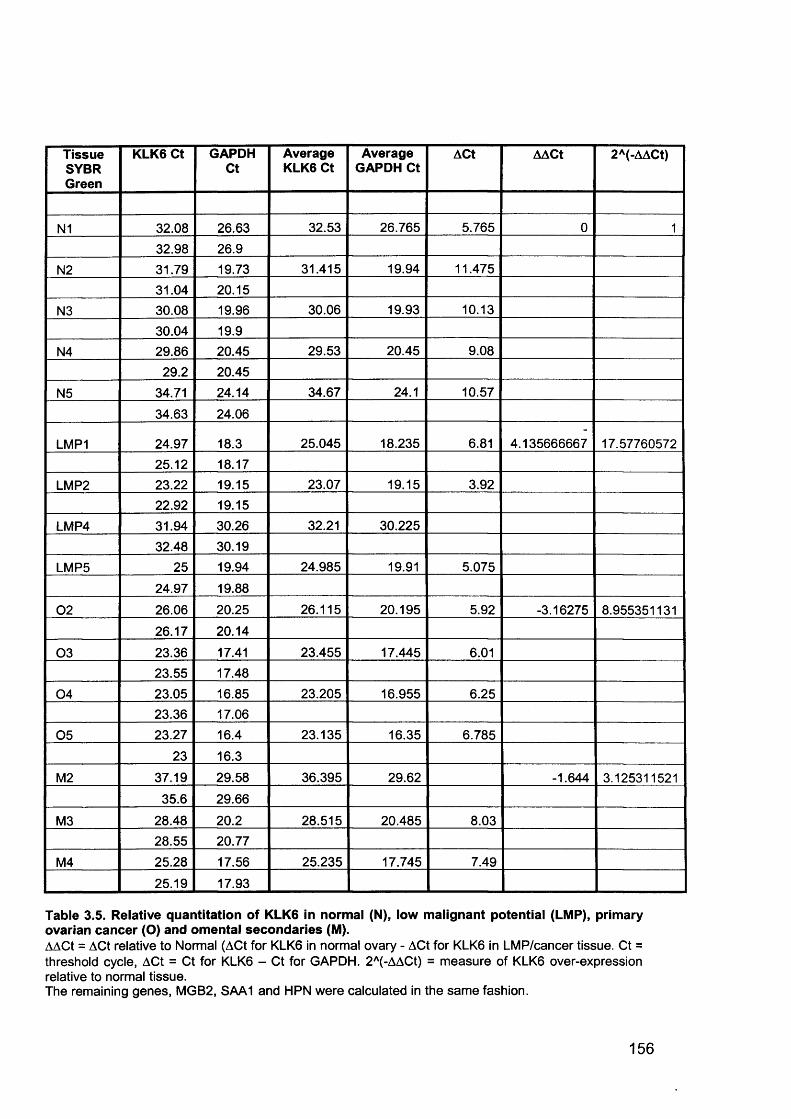
TissueSYBRGreen
KLK6 Ct GAPDHCt
Average KLK6 Ct
Average GAPDH Ct
ACt AACt 2A(-AACt)
N1 32.08 26.63 32.53 26.765 5.765 0 1
32.98 26.9
N2 31.79 19.73 31.415 19.94 11.475
31.04 20.15
N3 30.08 19.96 30.06 19.93 10.13
30.04 19.9
N4 29.86 20.45 29.53 20.45 9.08
29.2 20.45
N5 34.71 24.14 34.67 24.1 10.57
34.63 24.06
LMP1 24.97 18.3 25.045 18.235 6.81 4.135666667 17.5776057225.12 18.17
LMP2 23.22 19.15 23.07 19.15 3.9222.92 19.15
LMP4 31.94 30.26 32.21 30.225
32.48 30.19
LMP5 25 19.94 24.985 19.91 5.075
24.97 19.88
02 26.06 20.25 26.115 20.195 5.92 -3.16275 8.955351131
26.17 20.14
03 23.36 17.41 23.455 17.445 6.0123.55 17.48
04 23.05 16.85 23.205 16.955 6.2523.36 17.06
05 23.27 16.4 23.135 16.35 6.785
23 16.3
M2 37.19 29.58 36.395 29.62 -1.644 3.125311521
35.6 29.66
M3 28.48 20.2 28.515 20.485 8.0328.55 20.77
M4 25.28 17.56 25.235 17.745 7.49
25.19 17.93
Table 3.5. Relative quantitation of KLK6 in normal (N), low malignant potential (LMP), primary ovarian cancer (O) and omental secondaries (M).AACt = ACt relative to Normal (ACt for KLK6 in normal ovary - ACt for KLK6 in LMP/cancer tissue. Ct = threshold cycle, ACt = Ct for KLK6 - Ct for GAPDH. 2A(-AACt) = measure of KLK6 over-expression relative to normal tissue.The remaining genes, MGB2, SAA1 and HPN were calculated in the same fashion.
156
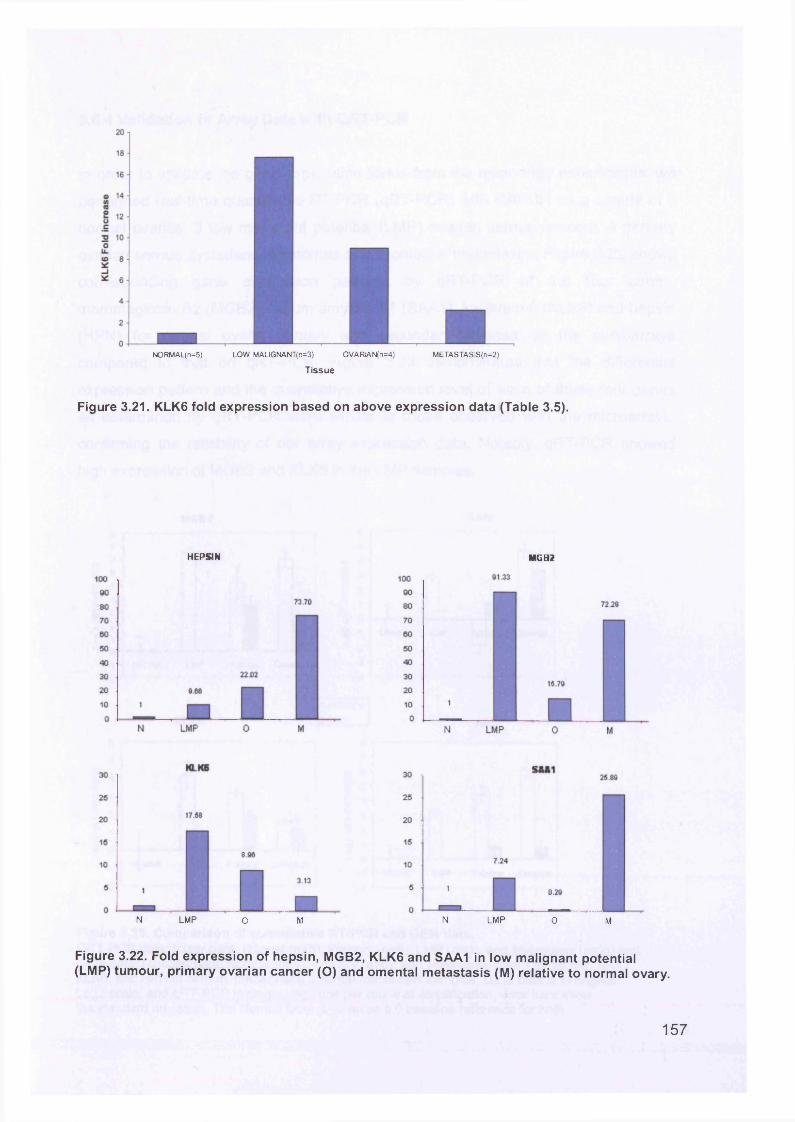
NORMAL(n=5) LOW MALIGNANT(n=3) OVARlAN(n=4) METASTASIS(n=2)
Tissue
Figure 3.21. KLK6 fold expression based on above expression data (Table 3.5).
HEPSIN MGB2
N LMP o M N LMP 0 M
Figure 3.22. Fold expression of hepsin, MGB2, KLK6 and SAA1 in low malignant potential (LMP) tumour, primary ovarian cancer (O) and omental metastasis (M) relative to normal ovary.
157
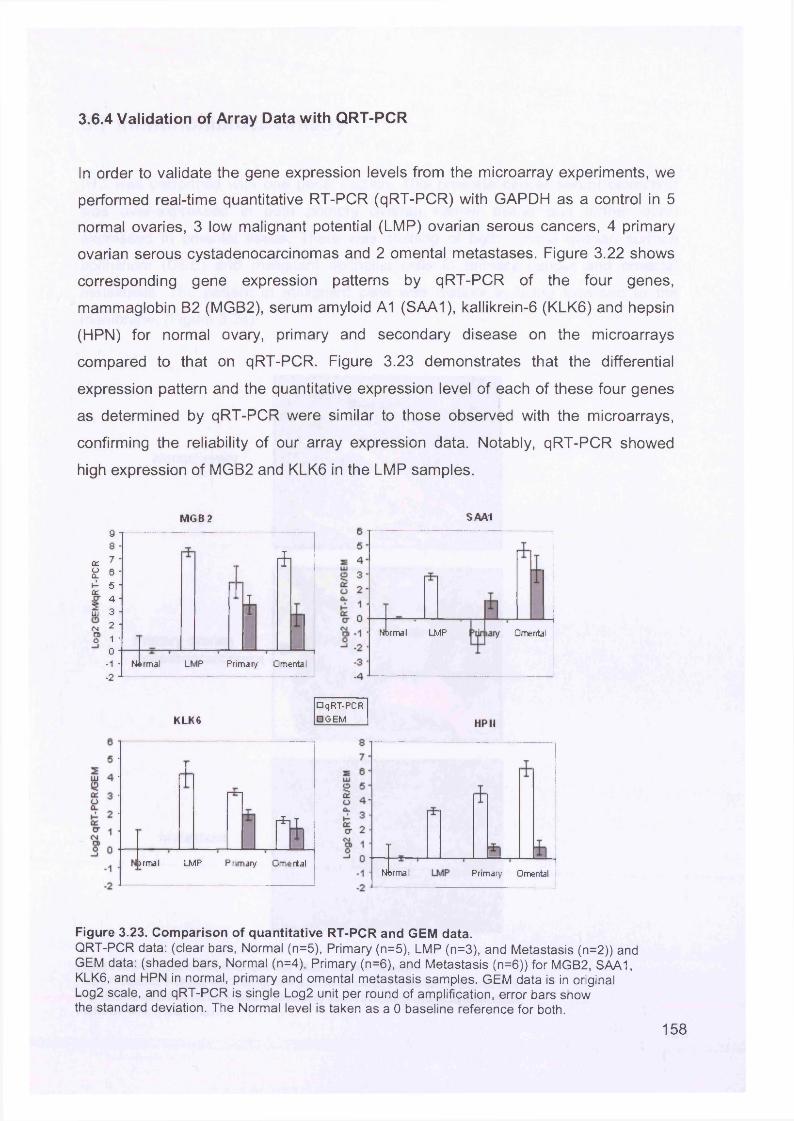
3.6.4 Validation of Array Data with QRT-PCR
In order to validate the gene expression levels from the microarray experiments, we
performed real-time quantitative RT-PCR (qRT-PCR) with GAPDH as a control in 5
normal ovaries, 3 low malignant potential (LMP) ovarian serous cancers, 4 primary
ovarian serous cystadenocarcinomas and 2 omental metastases. Figure 3.22 shows
corresponding gene expression patterns by qRT-PCR of the four genes,
mammaglobin B2 (MGB2), serum amyloid A1 (SAA1), kallikrein-6 (KLK6) and hepsin
(HPN) for normal ovary, primary and secondary disease on the microarrays
compared to that on qRT-PCR. Figure 3.23 demonstrates that the differential
expression pattern and the quantitative expression level of each of these four genes
as determined by qRT-PCR were similar to those observed with the microarrays,
confirming the reliability of our array expression data. Notably, qRT-PCR showed
high expression of MGB2 and KLK6 in the LMP samples.
M G B 2y8 •
ct 7 -oCL 6 *1- 5 -ccCT 4 *?Li i 3 -<N 2. -a>o 1 '
0 -
-1 ■-2 J
*
ifi
Normal LMP Primary Omental
SAA1
Normal LMP Omental
K LK6□ qRT-PCR□ OEM HP II
1jrmal LMP Primary Omertal
Nbrmal Primary Omental
Figure 3.23. Comparison of quantitative RT-PCR and GEM data.QRT-PCR data: (clear bars, Normal (n=5), Primary (n=5), LMP (n=3), and Metastasis (n=2)) and GEM data: (shaded bars, Normal (n=4), Primary (n=6), and Metastasis (n=6)) for MGB2, SAA1, KLK6, and HPN in normal, primary and omental metastasis samples. GEM data is in original Log2 scale, and qRT-PCR is single Log2 unit per round of amplification, error bars show the standard deviation. The Normal level is taken as a 0 baseline reference for both.
158
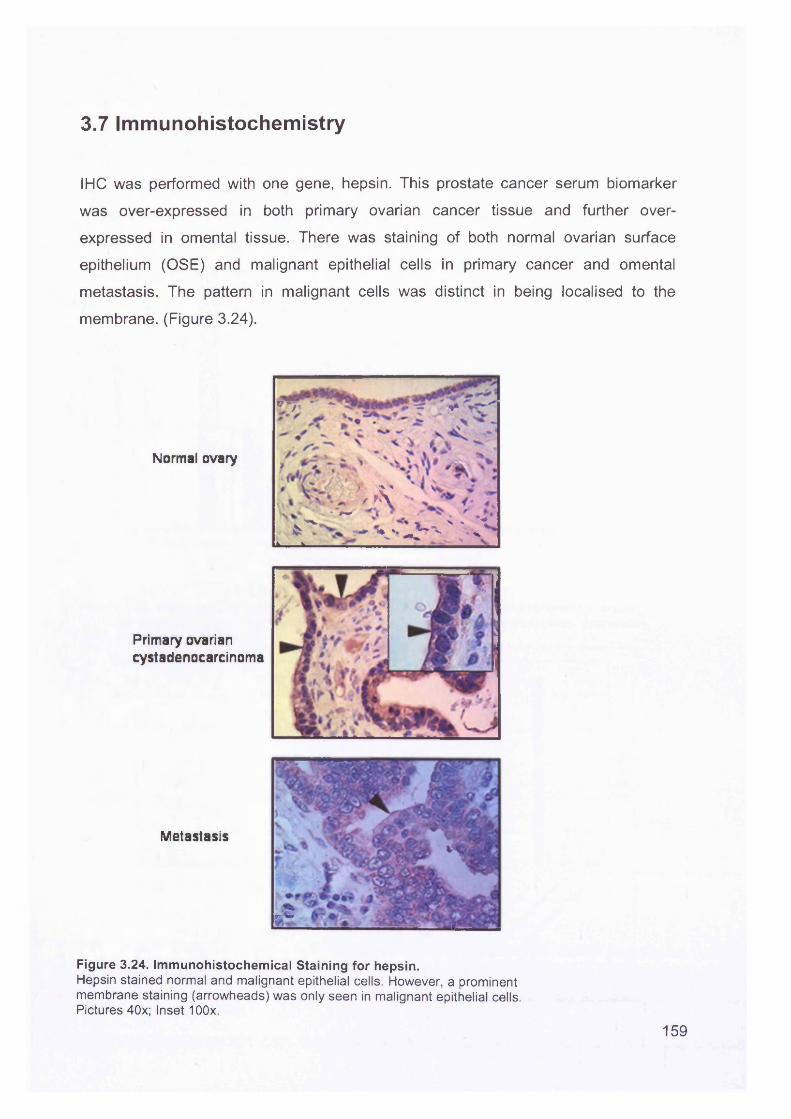
3.7 Immunohistochemistry
IHC was performed with one gene, hepsin. This prostate cancer serum biomarker
was over-expressed in both primary ovarian cancer tissue and further over
expressed in omental tissue. There was staining of both normal ovarian surface
epithelium (OSE) and malignant epithelial cells in primary cancer and omental
metastasis. The pattern in malignant cells was distinct in being localised to the
membrane. (Figure 3.24).
Normal ovary
Primary ovarian cystadenocarcinoma
Metastasis
v V ' * ~ s ' +
\ x‘VA. t X . ^
4s •* r ' - h ' '» ^
rC
Figure 3.24. Immunohistochemical Staining for hepsin.Hepsin stained normal and malignant epithelial cells. However, a prominent membrane staining (arrowheads) was only seen in malignant epithelial cells. Pictures 40x; Inset 100x.
159
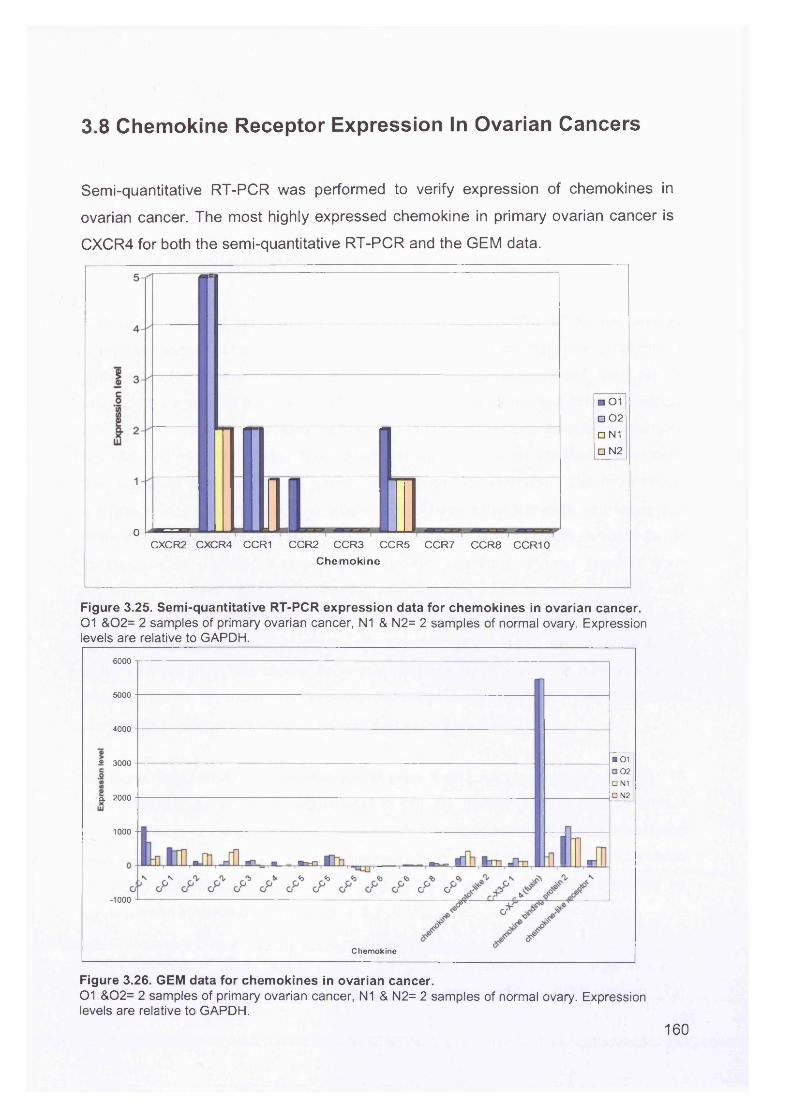
3.8 Chemokine Receptor Expression In Ovarian Cancers
Semi-quantitative RT-PCR was performed to verify expression of chemokines in
ovarian cancer. The most highly expressed chemokine in primary ovarian cancer is
CXCR4 for both the semi-quantitative RT-PCR and the GEM data.
□ 01□ 02
□ N1
□ N2
0 4C X C R 2 C X C R 4 CC R 1 C C R 2 C C R 3 C C R 5 C C R 7 C C R 8 C C R 1 0
Chem okine
Figure 3.25. Semi-quantitative RT-PCR expression data for chemokines in ovarian cancer.01 &02= 2 samples of primary ovarian cancer, N1 & N2= 2 samples of normal ovary. Expression levels are relative to GAPDH.
6000
5000
4000
■ 01 □ 02□ N1□ N2
-2 3000
a 2000
1000
-1000
Chemokine
Figure 3.26. GEM data for chemokines in ovarian cancer.01 &02= 2 samples of primary ovarian cancer, N1 & N2= 2 samples of normal ovary. Expression levels are relative to GAPDH.
160
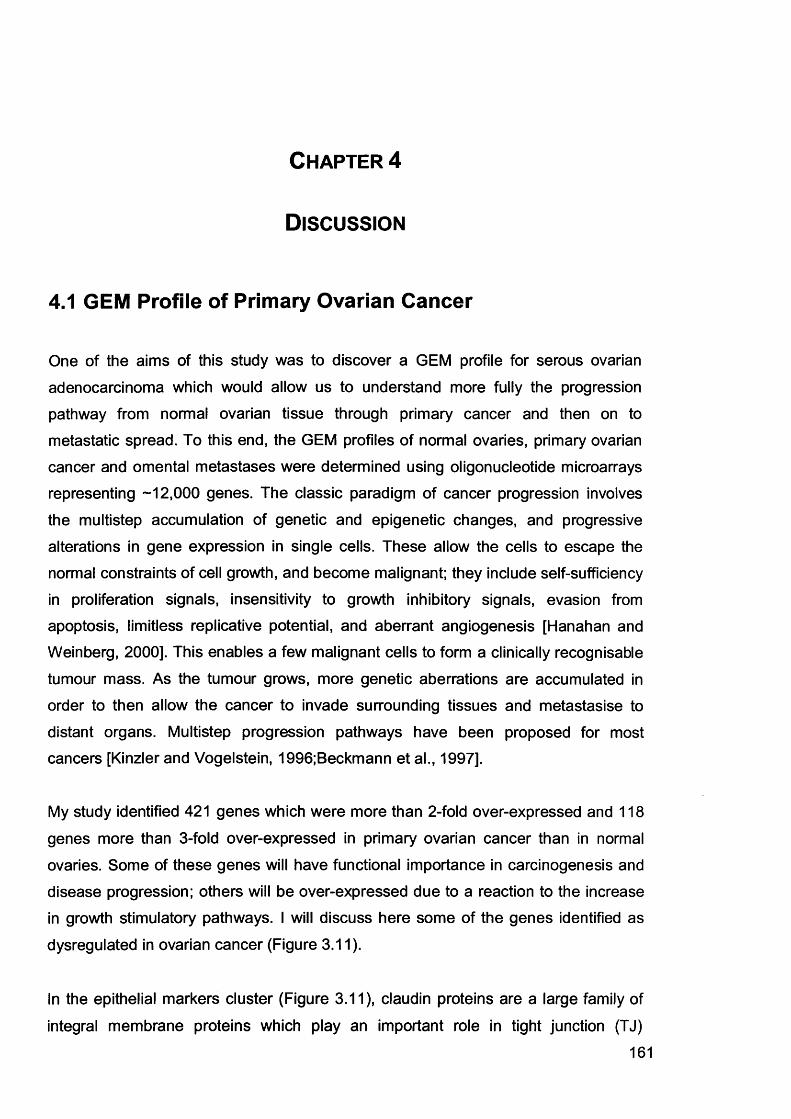
Chapter 4
D iscussion
4.1 GEM Profile of Primary Ovarian Cancer
One of the aims of this study was to discover a GEM profile for serous ovarian
adenocarcinoma which would allow us to understand more fully the progression
pathway from normal ovarian tissue through primary cancer and then on to
metastatic spread. To this end, the GEM profiles of normal ovaries, primary ovarian
cancer and omental metastases were determined using oligonucleotide microarrays representing -12,000 genes. The classic paradigm of cancer progression involves
the multistep accumulation of genetic and epigenetic changes, and progressive
alterations in gene expression in single cells. These allow the cells to escape the
normal constraints of cell growth, and become malignant; they include self-sufficiency in proliferation signals, insensitivity to growth inhibitory signals, evasion from
apoptosis, limitless replicative potential, and aberrant angiogenesis [Hanahan and Weinberg, 2000]. This enables a few malignant cells to form a clinically recognisable
tumour mass. As the tumour grows, more genetic aberrations are accumulated in order to then allow the cancer to invade surrounding tissues and metastasise to
distant organs. Multistep progression pathways have been proposed for most cancers [Kinzler and Vogelstein, 1996;Beckmann et al., 1997].
My study identified 421 genes which were more than 2-fold over-expressed and 118
genes more than 3-fold over-expressed in primary ovarian cancer than in normal
ovaries. Some of these genes will have functional importance in carcinogenesis and disease progression; others will be over-expressed due to a reaction to the increase in growth stimulatory pathways. I will discuss here some of the genes identified as
dysregulated in ovarian cancer (Figure 3.11).
In the epithelial markers cluster (Figure 3.11), claudin proteins are a large family of
integral membrane proteins which play an important role in tight junction (TJ)
161
formation and function. Claudins-3 and -4 have been shown to be up-regulated in
ovarian cancers and have been suggested as possible biomarkers and targets for
therapy [Hough et al., 2001;Rangel et al., 2003]. Ovarian adenocarcinomas are characterized by initial local growth followed by spread into the peritoneal cavity at
later stages of tumour progression. The cell-adhesion molecule E-cadherin (E-cad)
plays an important role in maintaining tissue integrity. E-cadherin expression is rare
in normal ovarian tissue but increases in benign and neoplastic ovarian epithelial tumours [Maines-Bandiera and Auersperg, 1997;Sundfeldt et al., 1997]. Secreted
phosphoprotein 1 (SPP1), the gene encoding osteopontin (OP), is over-expressed in
many human carcinomas [Agrawal et al., 2002;Hotte et al., 2002;Korkola et al.,
2003]. OP is an integrin-binding protein and is involved in carcinogenesis and tumour
spread.
In the cell division and growth cluster (Figure 3.11), cyclin D1 is over-expressed; this
has previously been shown to be over-expressed in ovarian cancers and is related to prognosis [Diebold et al., 2000]. C-myc oncogene codes for a DNA binding protein which plays an important role in the regulation of cell growth. When over-expressed
in tumours, it is involved in metastatic progression, and there is evidence that it is associated with poor prognosis in ovarian cancer [Wu et al., 2003], as well as
cancers of the breast [Naidu et al., 2002] and prostate [Sato et al., 1999]. Lipocalin 2
and E2F transcription factor 3 have not previously been associated with ovarian cancer.
CD24 antigen (Figure 3.11) has been shown to be over-expressed in ovarian cancer
and may have potential as a marker of poor prognosis [Kristiansen et al., 2002]. Hepsin is a serine protease and is present in the plasma membranes of most tissues,
with highest expression in liver. Tanimoto et al noted increased expression in LMP
and invasive ovarian tumours and concluded that hepsin is associated with the invasive process [Tanimoto et al., 1997]. Hepsin is also over-expressed in prostate
cancers [Stephan et al., 2004;Dhanasekaran et al., 2001].
GEM profiling studies have reported several genes which are up- and down-
regulated in ovarian cancers compared to normal ovaries. Table 4.1 lists a series of
162
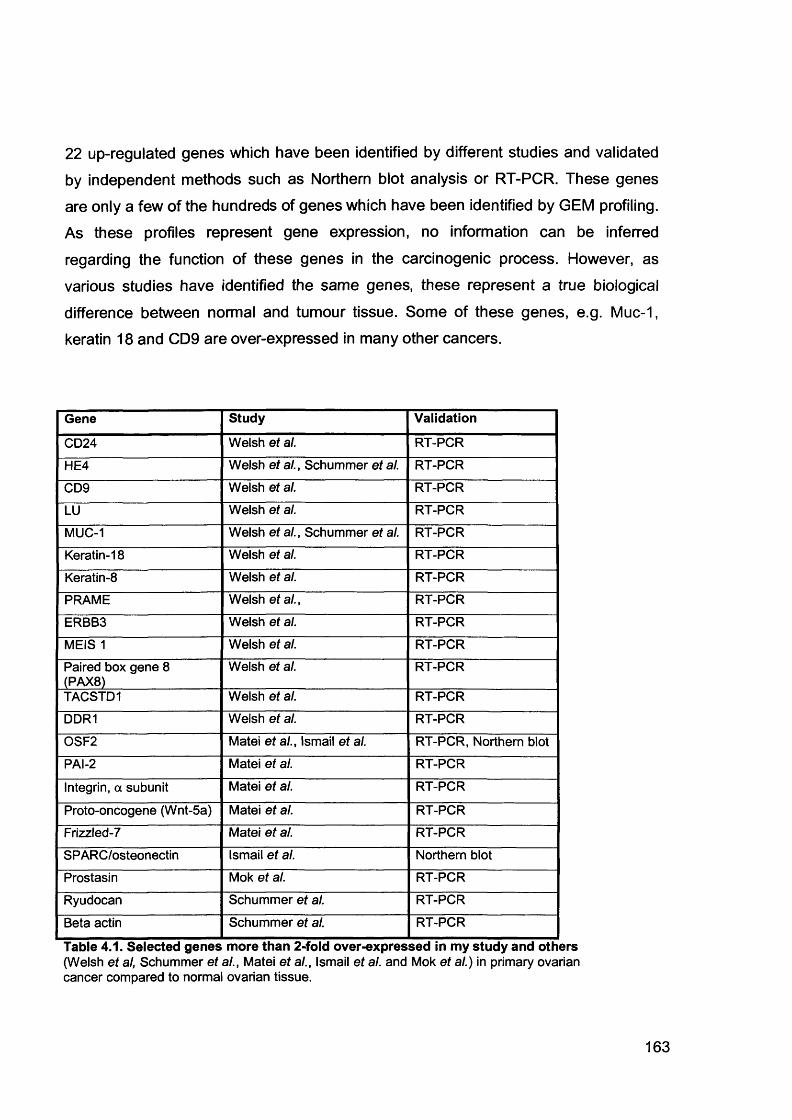
22 up-regulated genes which have been identified by different studies and validated
by independent methods such as Northern blot analysis or RT-PCR. These genes are only a few of the hundreds of genes which have been identified by GEM profiling. As these profiles represent gene expression, no information can be inferred
regarding the function of these genes in the carcinogenic process. However, as
various studies have identified the same genes, these represent a true biological
difference between normal and tumour tissue. Some of these genes, e.g. Muc-1, keratin 18 and CD9 are over-expressed in many other cancers.
Gene Study Validation
CD24 Welsh et al. RT-PCR
HE4 Welsh et al., Schummer et al. RT-PCR
CD9 Welsh et al. RT-PCR
LU Welsh et al. RT-PCR
MUC-1 Welsh et al., Schummer et al. RT-PCR
Keratin-18 Welsh et al. RT-PCR
Keratin-8 Welsh et al. RT-PCR
PRAME Welsh et al., RT-PCR
ERBB3 Welsh et al. RT-PCR
MEIS 1 Welsh et al. RT-PCR
Paired box gene 8 (PAX8)
Welsh et al. RT-PCR
TACSTD1 Welsh et al. RT-PCR
DDR1 Welsh et al. RT-PCR
OSF2 Matei et al., Ismail et al. RT-PCR, Northern blot
PAI-2 Matei et al. RT-PCR
Integrin, a subunit Matei et al. RT-PCR
Proto-oncogene (Wnt-5a) Matei et al. RT-PCR
Frizzled-7 Matei et al. RT-PCR
SPARC/osteonectin Ismail et al. Northern blot
Prostasin Mok et al. RT-PCR
Ryudocan Schummer et al. RT-PCR
Beta actin Schummer et al. RT-PCR
Table 4.1. Selected genes more than 2-fold over-expressed in my study and others(Welsh et al, Schummer et al., Matei et al., Ismail et al. and Mok et al.) in primary ovarian cancer compared to normal ovarian tissue.
163
4.2 GEM Profile of Primary and Secondary Ovarian Serous
Adenocarcinoma
My study found that the GEM profile of normal ovarian tissue was markedly different from that of the cancers studied. It was expected that the primary tumour would
contain a gene expression profile consistent with growth and differentiation, and the
secondary deposits to contain genes expressed consistent with metastasis. The
gene signature of primary tissue was, however, very similar to that of the secondary
spread. This is contrary to the classic model of carcinogenesis. If the metastatic signature is already present in primary cancers, this implies they have the ability to metastasise from the outset. This is now becoming the prevailing view of
carcinogenesis. Bernards and Weinberg suggest that a few cells in the initial tumour
mass have the molecular signature which confer the ability both for growth and, later,
metastasis [Bernards and Weinberg, 2002]. Figure 4.1 demonstrates the two models of metastasis; the emerging view is of a genetic alteration occurring early in
carcinogenesis which confers the ability to the tumour to metastasise even at an early stage, so both primary and metastatic tumours have the same GEM profile. The
traditional view is that the tumour grows and only later when the tumour is
established are the genes necessary for metastasis expressed, so the primary and secondary tumours have different GEM profiles. There are three consequences of
this theory: firstly, the mutations necessary for metastasis are already present in the early stages of tumorigenesis; secondly, metastasis-specific genes do not exist; and
thirdly, because the metastatic ability is present at the outset, even small tumours can metastasise early. Evidence supporting this view is accumulating:
1. The first comes from the fact that a major risk factor for developing recurrence with
solid tumours is the presence of lymph node metastases. Antibodies against epithelial differentiation antigens such as cytokeratins have been developed to detect
micrometastases in lymph nodes. Studies have shown that apparently localised (Stage 1) tumours which are found to have occult spread have a worse prognosis; in
breast cancer [McGuckin et al., 1996], prostate cancer [Freeman et al., 1995], colon
cancer [Greenson et al., 1994] and melanoma [Carlson et al., 2003].
164
2. Microarray data on breast cancer has been used to subdivide locally advanced tumours into 2 groups, according to their gene profiles, and correlate this to the
clinical outcome [Sorlie et al., 2001]. The basal-like and ERBB2+ subtypes had the
worst prognoses. This study has demonstrated that the GEM profiles of Stage 1
tumours can be used to predict which tumours will metastasise and that the
metastatic signature is already present when the cancer is locally confined. This could have implications for treatment of early stage disease.
3. Further evidence comes from studies showing that metastatic signatures within
primary tumours can predict subsequent metastasis. Ramaswamy et al
[Ramaswamy et al., 2003] examined the GEM profiles of primary adenocarcinomas
of multiple tumour types and compared these to unmatched adenocarcinoma metastases in order to identify differences in GEM profiles between primary tumours
and metastases. A distinct profile for each was established, although the GEM profile
of metastases was also found in a subset of primary tumours. These tumours were
associated with a significantly worse prognosis. Seventeen critical genes were
identified to be predictive of spread, some up-regulated, others down-regulated. These same genes were present irrespective of the tumour type, supporting the notion that adenocarcinomas from different sites have similar pathways to metastasis.
My study has found that within the stage III primary serous ovarian adenocarcinomas
a number of metastatic predictive genes including EZH2 [Varambally et al., 2002], PTTN and Lamin-B [Ramaswamy et al., 2003] are over-expressed in primary tissue
at least as highly as in omental metastases (Figure 3.15). This supports the notion that most tumour cells in advanced primary ovarian lesions have acquired the genetic signature enabling invasion and metastasis. A GEM study comparing stage
la with stages II, III and IV might identify genes that infer the propensity of ovarian
tumour cells to metastasise, although it would be challenging to obtain sufficient
material.
165
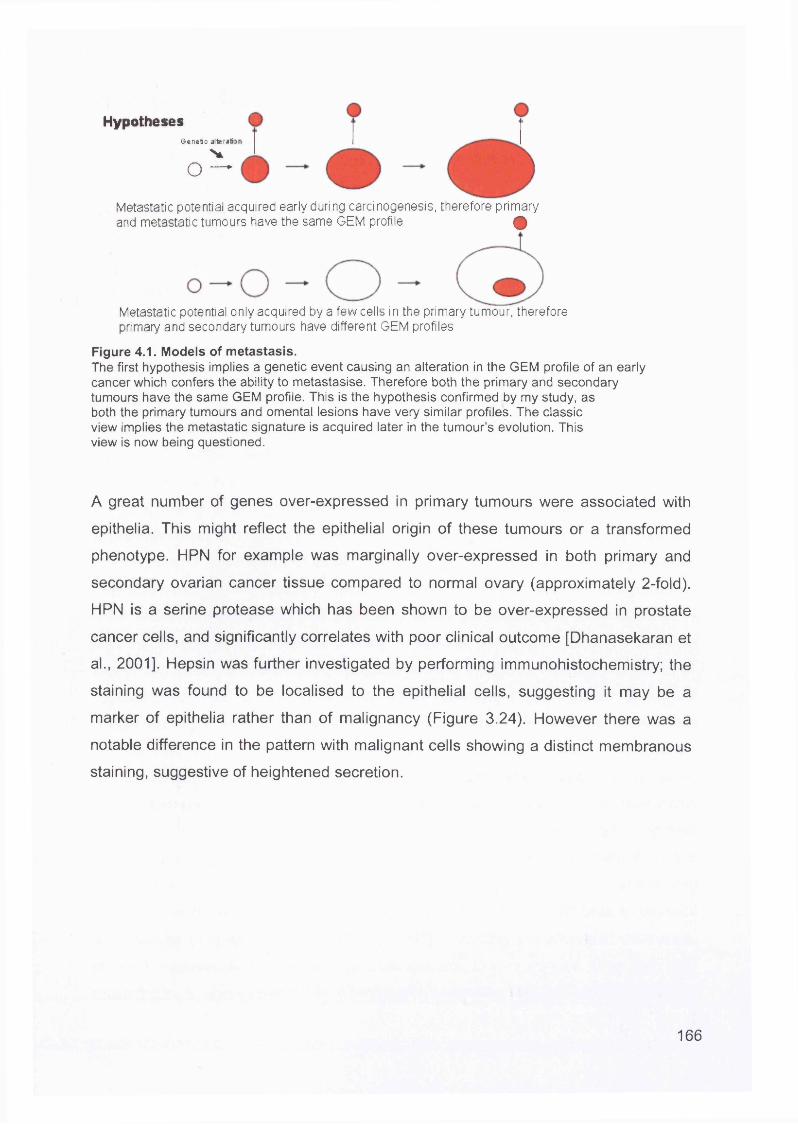
HypothesesGenetic alteratii
Vo —
Metastatic potential acquired early during carcinogenesis, therefore primary and metastatic tumours have the same GEM profile Q
Metastatic potential only acquired by a few cells in the primary tumour, therefore primary and secondary tumours have different GEM profiles
Figure 4.1. Models of metastasis.The first hypothesis implies a genetic event causing an alteration in the GEM profile of an early cancer which confers the ability to metastasise. Therefore both the primary and secondary tumours have the same GEM profile. This is the hypothesis confirmed by my study, as both the primary tumours and omental lesions have very similar profiles. The classic view implies the metastatic signature is acquired later in the tumour’s evolution. This view is now being questioned.
A great number of genes over-expressed in primary tumours were associated with
epithelia. This might reflect the epithelial origin of these tumours or a transformed
phenotype. HPN for example was marginally over-expressed in both primary and
secondary ovarian cancer tissue compared to normal ovary (approximately 2-fold).
HPN is a serine protease which has been shown to be over-expressed in prostate
cancer cells, and significantly correlates with poor clinical outcome [Dhanasekaran et
al., 2001]. Hepsin was further investigated by performing immunohistochemistry; the
staining was found to be localised to the epithelial cells, suggesting it may be a
marker of epithelia rather than of malignancy (Figure 3.24). However there was a
notable difference in the pattern with malignant cells showing a distinct membranous
staining, suggestive of heightened secretion.
166
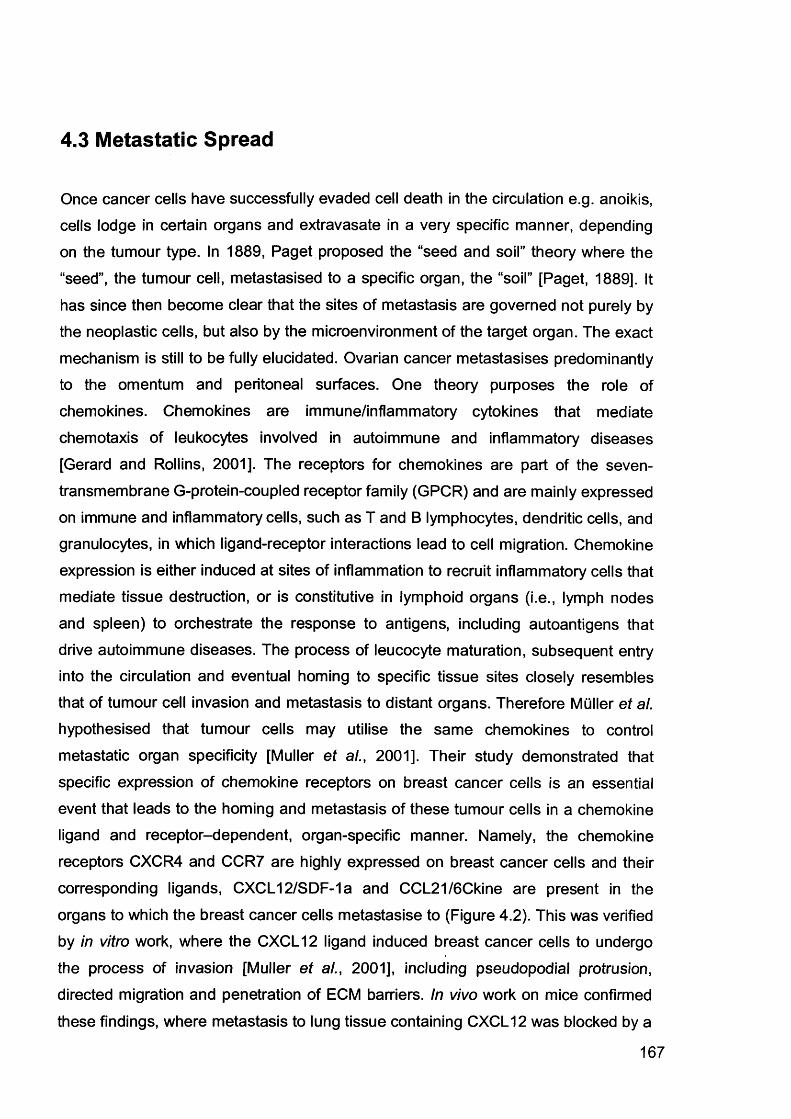
4.3 Metastatic Spread
Once cancer cells have successfully evaded cell death in the circulation e.g. anoikis, cells lodge in certain organs and extravasate in a very specific manner, depending
on the tumour type. In 1889, Paget proposed the “seed and soil” theory where the
“seed”, the tumour cell, metastasised to a specific organ, the “soil” [Paget, 1889]. It
has since then become clear that the sites of metastasis are governed not purely by the neoplastic cells, but also by the microenvironment of the target organ. The exact
mechanism is still to be fully elucidated. Ovarian cancer metastasises predominantly
to the omentum and peritoneal surfaces. One theory purposes the role of chemokines. Chemokines are immune/inflammatory cytokines that mediate
chemotaxis of leukocytes involved in autoimmune and inflammatory diseases [Gerard and Rollins, 2001]. The receptors for chemokines are part of the seven-
transmembrane G-protein-coupled receptor family (GPCR) and are mainly expressed
on immune and inflammatory cells, such as T and B lymphocytes, dendritic cells, and granulocytes, in which ligand-receptor interactions lead to cell migration. Chemokine
expression is either induced at sites of inflammation to recruit inflammatory cells that mediate tissue destruction, or is constitutive in lymphoid organs (i.e., lymph nodes
and spleen) to orchestrate the response to antigens, including autoantigens that
drive autoimmune diseases. The process of leucocyte maturation, subsequent entry into the circulation and eventual homing to specific tissue sites closely resembles that of tumour cell invasion and metastasis to distant organs. Therefore Muller et al.
hypothesised that tumour cells may utilise the same chemokines to control
metastatic organ specificity [Muller et al., 2001]. Their study demonstrated that
specific expression of chemokine receptors on breast cancer cells is an essential
event that leads to the homing and metastasis of these tumour cells in a chemokine ligand and receptor-dependent, organ-specific manner. Namely, the chemokine receptors CXCR4 and CCR7 are highly expressed on breast cancer cells and their
corresponding ligands, CXCL12/SDF-1a and CCL21/6Ckine are present in the
organs to which the breast cancer cells metastasise to (Figure 4.2). This was verified by in vitro work, where the CXCL12 ligand induced breast cancer cells to undergo
the process of invasion [Muller et al., 2001], including pseudopodial protrusion, directed migration and penetration of ECM barriers. In vivo work on mice confirmed
these findings, where metastasis to lung tissue containing CXCL12 was blocked by a
167
neutralising CXCR4 monoclonal antibody.
matrix
m Metastasis
O Chemokine
M Receptor
Extracellular
Liver
Kidney
Bone
Malignant breast cells
Normal breast cells
Figure 4.2. Mechanism of chemokine-mediated metastasis of breast cancer.Figure taken from Muller et al., (2001).
Scotton et al researched a panel of chemokines in primary ovarian cancers, and
ascites samples, and found that only CXCR4 was reliably expressed on cancer cells
[Scotton et al., 2001]. Other chemokines, such as CCR1 were also expressed
although only on leucocytes. The ligand for CXCR4, CXCL12, was found in ascites
from 63 patients. An in vitro migration assay demonstrated ovarian cancer cell
movement towards CXCL12. They therefore suggested that a chemokine gradient
exists which enables ovarian cancer cells to migrate from the primary tumour mass
into the peritoneum. In addition, when ovarian cancer cell lines were treated with
CXCL12, (3i integrin expression on the cell surface was greatly increased, affecting
168
peritoneal adhesion of cells. This could be a mechanism by which ovarian cancer
cells spread to the peritoneal cavity.
My study has shown very similar results (see section 3.8) in that CXCR4 was the
most highly expressed chemokine in ovarian cancers. Figures 3.25 and 3.26 show
that chemokine expression levels by both semi-quantitative qRT-PCR and microarray analysis are highly concordant.
Chemokines also regulate angiogenesis, both positively and negatively.
Angiogenesis is essential for growth, survival, invasion and metastasis of tumours.
There is also evidence that chemokines activate tumour cells to secrete enzymes such as MMPs and serine proteases in order to allow migration through the ECM,
penetration of the basement membrane and entry into the circulation. CXCL8
induces expression of MMP-2 and MMP-9 in malignant melanoma and prostate cancer cells, respectively [Luca etal., 1997;lnoue eta!., 2000].
169
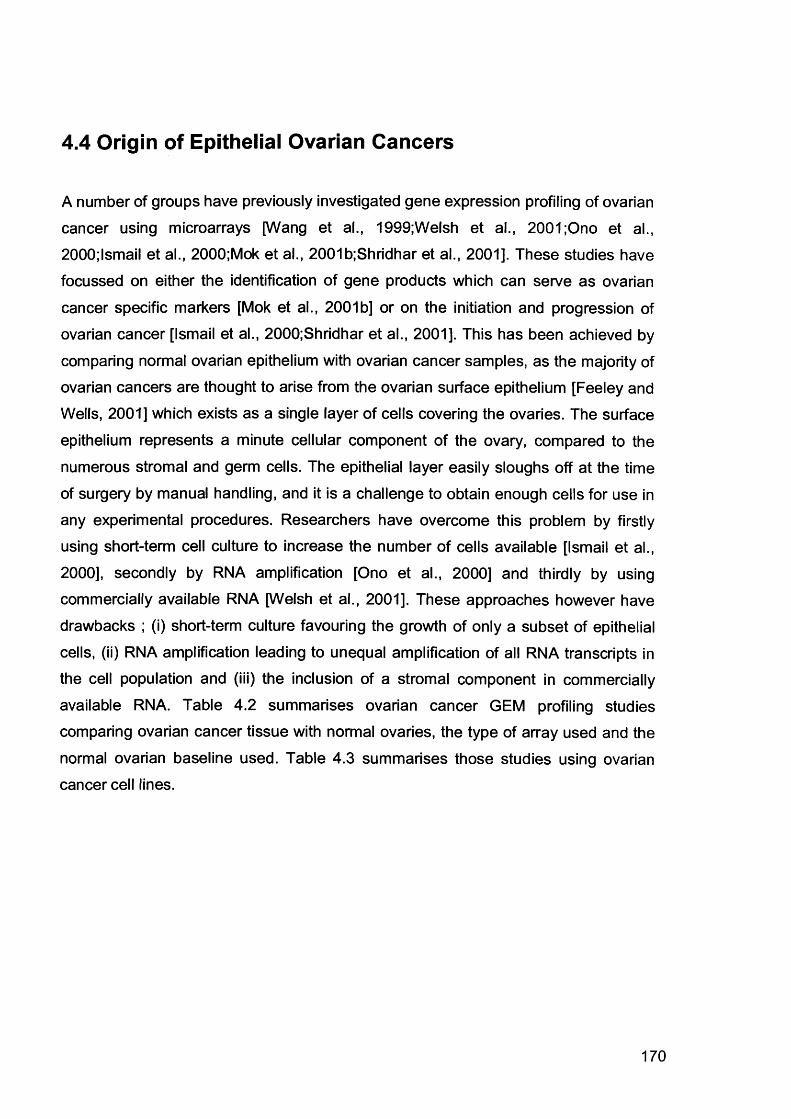
4.4 Origin of Epithelial Ovarian Cancers
A number of groups have previously investigated gene expression profiling of ovarian
cancer using microarrays [Wang et al., 1999;Welsh et al., 2001 ;Ono et al.,
2000;lsmail et al., 2000;Mok et al., 2001b;Shridhar et al., 2001]. These studies have focussed on either the identification of gene products which can serve as ovarian
cancer specific markers [Mok et al., 2001b] or on the initiation and progression of ovarian cancer [Ismail et al., 2000;Shridhar et al., 2001]. This has been achieved by
comparing normal ovarian epithelium with ovarian cancer samples, as the majority of ovarian cancers are thought to arise from the ovarian surface epithelium [Feeley and
Wells, 2001] which exists as a single layer of cells covering the ovaries. The surface
epithelium represents a minute cellular component of the ovary, compared to the
numerous stromal and germ cells. The epithelial layer easily sloughs off at the time
of surgery by manual handling, and it is a challenge to obtain enough cells for use in
any experimental procedures. Researchers have overcome this problem by firstly using short-term cell culture to increase the number of cells available [Ismail et al.,
2000], secondly by RNA amplification [Ono et al., 2000] and thirdly by using
commercially available RNA [Welsh et al., 2001]. These approaches however have drawbacks ; (i) short-term culture favouring the growth of only a subset of epithelial
cells, (ii) RNA amplification leading to unequal amplification of all RNA transcripts in the cell population and (iii) the inclusion of a stromal component in commercially
available RNA. Table 4.2 summarises ovarian cancer GEM profiling studies comparing ovarian cancer tissue with normal ovaries, the type of array used and the
normal ovarian baseline used. Table 4.3 summarises those studies using ovarian cancer cell lines.
170
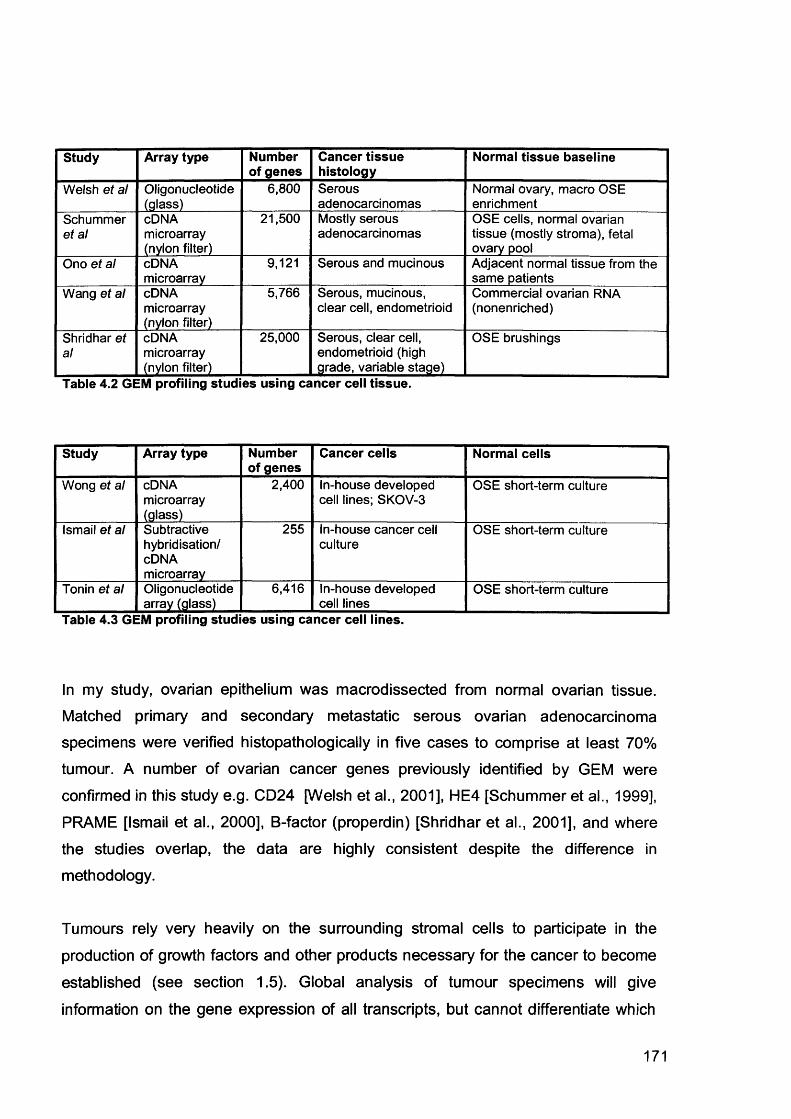
Study Array type Number of genes
Cancer tissue histology
Normal tissue baseline
Welsh et al Oligonucleotide(glass)
6,800 Serousadenocarcinomas
Normal ovary, macro OSE enrichment
Schummer et al
cDNA microarray (nylon filter)
21,500 Mostly serous adenocarcinomas
OSE cells, normal ovarian tissue (mostly stroma), fetal ovary pool
Ono et al cDNAmicroarray
9,121 Serous and mucinous Adjacent normal tissue from the same patients
Wang et al cDNA microarray (nylon filter)
5,766 Serous, mucinous, clear cell, endometrioid
Commercial ovarian RNA (nonenriched)
Shridhar et al
cDNA microarray (nylon filter)
25,000 Serous, clear cell, endometrioid (high grade, variable stage)
OSE brushings
Table 4.2 GEM profiling studies using cancer cell tissue.
Study Array type Number of genes
Cancer cells Normal cells
Wong et al cDNAmicroarray(glass)
2,400 In-house developed cell lines; SKOV-3
OSE short-term culture
Ismail et al Subtractivehybridisation/cDNAmicroarray
255 In-house cancer cell culture
OSE short-term culture
Tonin et al Oligonucleotide array (glass)
6,416 In-house developed cell lines
OSE short-term culture
Table 4.3 GEM profiling studies using cancer cell lines.
In my study, ovarian epithelium was macrodissected from normal ovarian tissue.
Matched primary and secondary metastatic serous ovarian adenocarcinoma specimens were verified histopathologically in five cases to comprise at least 70%
tumour. A number of ovarian cancer genes previously identified by GEM were
confirmed in this study e.g. CD24 [Welsh et al., 2001], HE4 [Schummer et al., 1999],
PRAME [Ismail et al., 2000], B-factor (properdin) [Shridhar et al., 2001], and where the studies overlap, the data are highly consistent despite the difference in
methodology.
Tumours rely very heavily on the surrounding stromal cells to participate in the
production of growth factors and other products necessary for the cancer to become
established (see section 1.5). Global analysis of tumour specimens will give
information on the gene expression of all transcripts, but cannot differentiate which
171
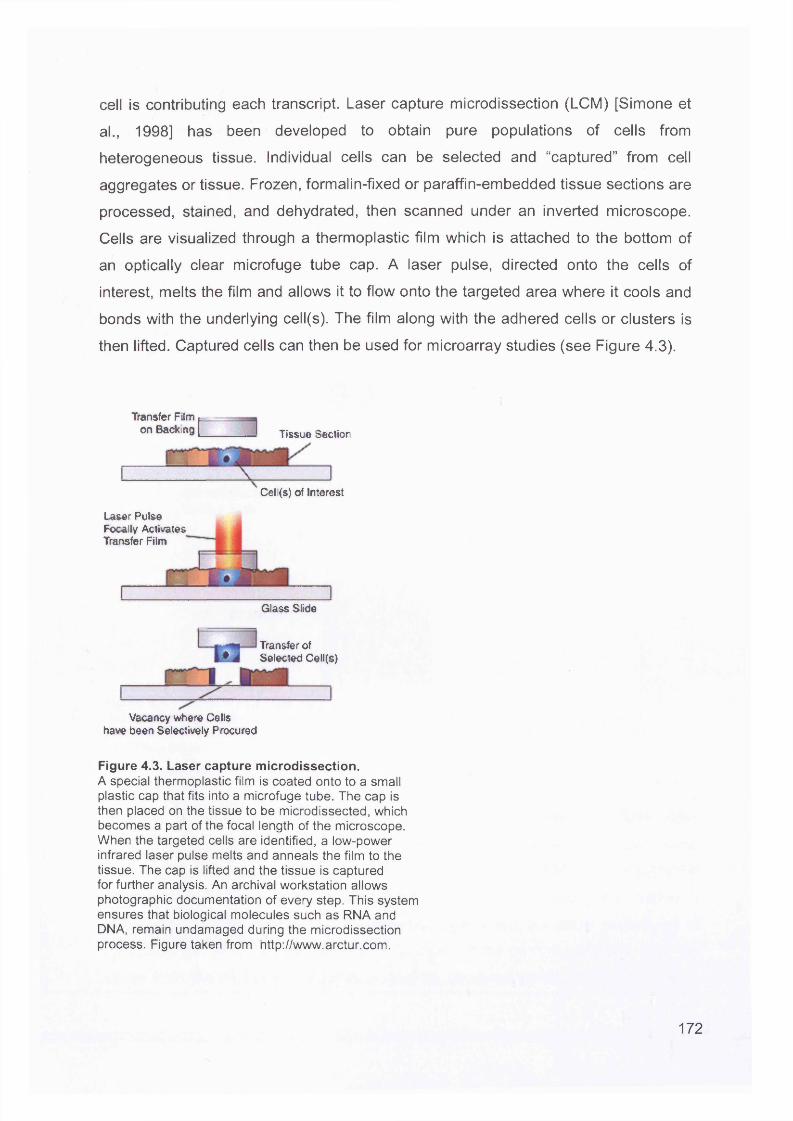
cell is contributing each transcript. Laser capture microdissection (LCM) [Simone et
al., 1998] has been developed to obtain pure populations of cells from
heterogeneous tissue. Individual cells can be selected and “captured” from cell
aggregates or tissue. Frozen, formalin-fixed or paraffin-embedded tissue sections are
processed, stained, and dehydrated, then scanned under an inverted microscope.
Cells are visualized through a thermoplastic film which is attached to the bottom of
an optically clear microfuge tube cap. A laser pulse, directed onto the cells of
interest, melts the film and allows it to flow onto the targeted area where it cools and
bonds with the underlying cell(s). The film along with the adhered cells or clusters is
then lifted. Captured cells can then be used for microarray studies (see Figure 4.3).
Transfer Film p------on Backing (____ Tissue Section
Laser Pulse Focally Activates Transfer Film
Cell{s) of Interest
Glass Slide
Transfer of • J Selected Cell(s)
Vacancy where Cells have been Selectively Procured
Figure 4.3. Laser capture microdissection.A special thermoplastic film is coated onto to a small plastic cap that fits into a microfuge tube. The cap is then placed on the tissue to be microdissected, which becomes a part of the focal length of the microscope. When the targeted cells are identified, a low-power infrared laser pulse melts and anneals the film to the tissue. The cap is lifted and the tissue is captured for further analysis. An archival workstation allows photographic documentation of every step. This system ensures that biological molecules such as RNA and DNA, remain undamaged during the microdissection process. Figure taken from http://www.arctur.com.
172
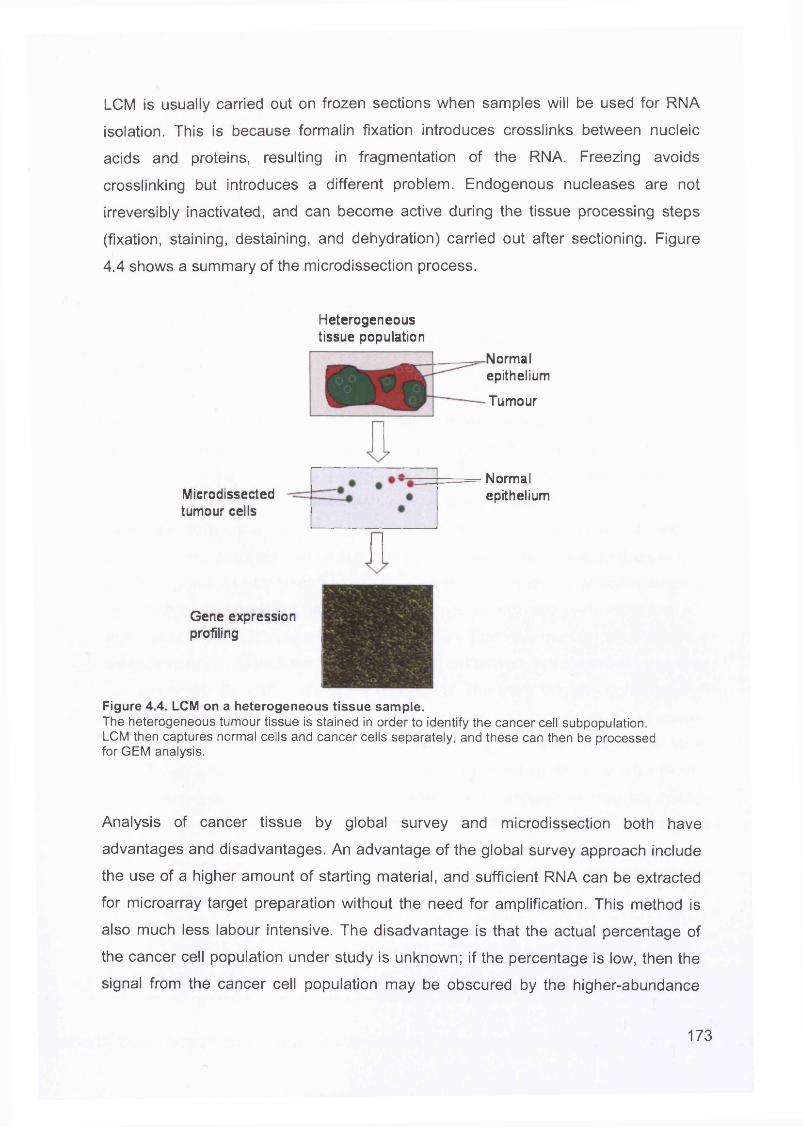
LCM is usually carried out on frozen sections when samples will be used for RNA
isolation. This is because formalin fixation introduces crosslinks between nucleic
acids and proteins, resulting in fragmentation of the RNA. Freezing avoids
crosslinking but introduces a different problem. Endogenous nucleases are not
irreversibly inactivated, and can become active during the tissue processing steps
(fixation, staining, destaining, and dehydration) carried out after sectioning. Figure
4.4 shows a summary of the microdissection process.
Heterogeneoustissue population
ormalepithelium
Tumour
Microdissected tumour cells
Normalepithelium
Gene expression profiling
Figure 4.4. LCM on a heterogeneous tissue sample.The heterogeneous tumour tissue is stained in order to identify the cancer cell subpopulation. LCM then captures normal cells and cancer cells separately, and these can then be processed for GEM analysis.
Analysis of cancer tissue by global survey and microdissection both have
advantages and disadvantages. An advantage of the global survey approach include
the use of a higher amount of starting material, and sufficient RNA can be extracted
for microarray target preparation without the need for amplification. This method is
also much less labour intensive. The disadvantage is that the actual percentage of
the cancer cell population under study is unknown; if the percentage is low, then the
signal from the cancer cell population may be obscured by the higher-abundance
173
normal cell subpopulation. The advantage of microdissection is that clearly defined
subpopulations can be directly compared. However, the disadvantages are due to
the high level of expertise and resources that are required. Specialised training is
required to use the LCM apparatus, and a trained pathologist must identify the cells
to be extracted. Even though pure cell populations are obtained, only single cells are extracted so RNA invariably must be amplified. This technique is excellent for
separating out normal, carcinoma in situ and invasive cancer cells from the same
tissue. Sgroi et al [Sgroi et al., 1999] used LCM to isolate normal and invasive metastatic breast cancer cells from a single patient, and compared their gene
expression profiles. Kitahara et al [Kitahara et al., 2001] also isolated normal and colorectal tumour populations and compared their expression profiles.
Applying this technique to ovarian cancer is more challenging. Although ovarian
cancer can arise from any of the cell types found in the ovary, around 90% are
derived from the ovarian surface epithelium. This epithelium covers the entire ovarian surface, and varies morphologically from simple squamous to cuboidal to low pseudostratified columnar. Although the ovarian surface is generally smooth early in
life, the ovary becomes convoluted with age. Invaginations of the epithelium form crypts or gland-like structures that can become pinched off to form epithelial inclusion
cysts within the underlying stroma. The incidence of inclusion cysts increases with
age and are common in postmenopausal women. Epithelial ovarian cancers have a similar incidence. It has been hypothesised, but not proven, that these inclusion cysts
are a potential origin of many epithelial cancers. The more frequent appearance of epithelial invaginations and inclusion cysts in women with hereditary risk of ovarian
cancer has strengthened this hypothesis [Salazar et al., 1996]. In addition, some microscopic borderline and malignant tumours have been observed to arise directly
within these sites, and they are often associated with dysplasia in inclusion cysts in the same or contralateral ovary [Deligdisch and Gil, 1989;Scully, 1995]. LCM studies would be invaluable in identifying GEM alterations in the cells from these structures.
174
4.5 Ovarian Cancer Biomarkers
The early detection of ovarian cancer is vital for its ultimate control and prevention.
The effectiveness of conventional therapeutics is limited once metastasis has
occurred. Late-stage diagnosis of ovarian cancer can be attributed to the fact that the disease is relatively “asymptomatic” in its early stages, and that the symptoms of late
stage disease, such as abdominal discomfort, weight loss, diarrhoea or constipation,
vaginal bleeding and shortness of breath, are non-specific complaints. Consequently
the overall 5 year survival is around 25%. To be effective, a clinically useful
biomarker should be detectable in accessible body fluids such as blood, urine or
saliva.
Molecular biomarkers are essential tools for detecting and monitoring cancer. The
marker most extensively used in ovarian cancer is CA125, a high molecular weight
glycoprotein which is expressed by tissues derived from the coelomic epithelium. The secreted levels are proportional to the tumour volume; hence only 50% of stage I
tumours have elevated levels of CA125, which reduces its effectiveness as a screening marker [Jacobs and Bast, Jr., 1989]. An algorithm has been calculated
[Skates et al., 1995] which takes into account sequential changes in CA125 levels over time, rather than a single reading. Other markers for ovarian cancer detection
have been investigated, including Lysophosphatidic acid (LPA) [Xu et al., 1998], macrophage colony-stimulating factor (MCS-F) [Suzuki et al., 1995], ovarian
carcinoma-associated antigen (OCA) [Knauf and Urbach, 1978] and tumour-
associated trypsin inhibitor (TATI) [Medl et al., 1995]. However, none of these markers has proved superior to CA125.
This study has identified a potential new biomarker MGB2 which is significantly over
expressed in primary and metastatic ovarian cancer compared to normal ovarian
tissue. MGB2 is also increased in LMP and will therefore not be useful on its own as a tumour marker, but might still be helpful in combination with other markers. MGB2
has not previously been described in ovarian cancer. This gene, located on
chromosome 11 q13 is part of the uteroglobin family and was first sequenced by a
group screening a human genomic library [Becker et al., 1998]. It has high sequence
homology to mammaglobin 1 (MGB1) which is present in normal breast epithelia and
175
frequently up-regulated in breast cancers [Watson and Fleming, 1996;Watson et al.,
1998]. MGB2 has been detected in axillary lymph node micrometastases of breast cancer patients [Ooka et al., 2000] and is over-expressed in endometrioid
endometrial carcinomas compared to nonendometrioid cancers by cDNA microarray
analysis [Moreno-Bueno et al., 2003]. Both endometrioid and breast cancers are
oestrogen-dependent, and may explain a mechanism for the over-expression of MGB2. The link between ovarian cancer and oestrogen is less clear. The women’s
health initiative (WHI) trial [Anderson et al., 2003;0oka et al., 2000] reported a non
significant excess of ovarian cancer in women taking combined oestrogen and
progesterone hormone replacement therapy compared to non-users. The belief is generally not held that ovarian cancer is directly influenced by oestrogen, indicating that MGB2 may be operating in a different manner in these cancers.
The qRT-PCR analysis of MGB2 confirmed the over-expression of MGB2 in primary
and metastatic ovarian cancer in this study and showed that it also demonstrated high expression in LMP samples. LMP tumours are a distinct subtype of ovarian neoplasm which generally run a benign course with only 0.7% conversion to invasive
disease. No biomarker to date is sufficiently specific for screening and monitoring disease progression in LMP tumours. Further studies are needed to test MGB2 as a biomarker for this cancer subgroup.
The only widely used ovarian cancer marker CA125 lacks specificity (CA125 or
MUC16 is not present on the U95Av2 array). Within the panel of data available on other cancers, MGB2 appears to be a specific biomarker for ovarian tumours with
low expression in most normal epithelial tissues and prostate and lung tumours. This survey was far from exhaustive relying on available published GEM data. The screening and selection of other candidates for serological study will benefit from more publicly available data, in particular, data on breast cancer. A combination of
MGB2 and other biomarkers may give a more specific signature for epithelial ovarian
carcinoma. This study demonstrates that GEM studies are a practical and
economical prelude to streamline candidate genes for larger serological studies.
176

4.6 The Future
I have investigated gene expression differences between normal ovary, primary and
corresponding secondary omental serous adenocarcinoma in six patients. Although my findings have been replicated by other authors, ideally I would like to use more
samples to make the work more substantive. Using more samples would enable me
to correlate outcome with specific gene expression profiles. However, clearly,
oligonucleotide arrays and the array experiments are costly which is why my study was limited. Any possible future work I describe here is meant if finances were not an
issue.
Another way to take this work forwards is to compare the paired samples O and M
used in this thesis to identify whether similarities exist between tumours which would
contribute to the understanding of the pathogenesis of serous ovarian adenocarcinoma.
MGB2 is raised in both invasive cancers but also in LMP tumours. Investigating a larger series of both LMP and invasive cancers may identify whether MGB2 is raised in all LMP tumours or only in the small subset which become invasive.
Finally, I would like to test a panel of markers on serum samples from patients with ovarian cancer, benign gynaecological conditions, and other cancers and identify whether it is possible to define a fingerprint for serous ovarian cancer.
177
Co nclusio n
Ovarian cancer has the highest mortality rate of all the gynaecological malignancies.
The lack of specific signs and symptoms of early disease means more than 70% of
women present at a late stage, where cytoreductive surgery and conventional chemotherapies have limited effect. Around 60% of women die of their disease. The
current marker CA125 is not sufficiently sensitive to use as a mass screening tool in
the general population, even when coupled with ultrasound scanning. There is an
urgent need to discover a new strategy for ovarian cancer screening.
This study has used high density oligonucleotide arrays to compare the gene expression profiles of normal ovarian epithelium with primary serous
adenocarcinoma and serous omental metastases from the same patients. The aims were to firstly identify genes involved in ovarian cancer progression and secondly identify new biomarkers which may be used as screening tools.
The main findings were the GEM profiles of primary and secondary cancers were more similar than dissimilar. Unlike Vogelstein’s model for colon cancer, no definite
progression pathway was identified for ovarian cancer. This may imply that ovarian
tumours, at an early stage, have the metastatic profile which will predestine them to metastasise even when the tumour is localised. There was a definite difference in GEM profiles between normal and cancer samples. The other main finding was one gene, not yet described in epithelial ovarian cancer, mammaglobin 2 (MGB2) was
significantly over-expressed in primary and secondary disease compared to normal
ovary. This gene meets the criteria for biomarkers, that is, it is secreted and is not
expressed in other normal or cancer tissues at significant levels. Serum studies would show whether this marker has clinical usefulness, either alone, or as part of a
panel of biomarkers.
178
References
't Veer LJ, Dai H, van de Vijver MJ, He YD, Hart AA, Mao M, Peterse HL, van der KK, Marton MJ, Witteveen AT, Schreiber GJ, Kerkhoven RM, Roberts C, Linsley PS, Bernards R, Friend SH (2002) Gene expression profiling predicts clinical outcome of breast cancer. Nature 415: 530-536
Aarnio M, Mecklin JP, Aaltonen LA, Nystrom-Lahti M, Jarvinen HJ (1995) Life-time risk of different cancers in hereditary non-polyposis colorectal cancer (HNPCC) syndrome. Int J Cancer 64: 430-433
Achen MG, Jeltsch M, Kukk E, Makinen T, Vitali A, Wilks AF, Alitalo K, Stacker SA (1998) Vascular endothelial growth factor D (VEGF-D) is a ligand for the tyrosine kinases VEGF receptor 2 (Flk1) and VEGF receptor 3 (Flt4). Proc Natl Acad Sci U S A 95: 548-553
Adams MD, Kelley JM, Gocayne JD, Dubnick M, Polymeropoulos MH, Xiao H, Merril CR, Wu A, Olde B, Moreno RF, . (1991) Complementary DNA sequencing: expressed sequence tags and human genome project. Science 252: 1651-1656
Afzal S, Lalani e, Foulkes WD, Boyce B, Tickle S, Cardillo MR, Baker T, Pignatelli M, Stamp GW (1996) Matrix metalloproteinase-2 and tissue inhibitor of metalloproteinase-2 expression and synthetic matrix metalloproteinase-2 inhibitor binding in ovarian carcinomas and tumor cell lines. Lab Invest 74: 406-421
Agrawal D, Chen T, Irby R, Quackenbush J, Chambers AF, Szabo M, Cantor A, Coppola D, Yeatman TJ (2002) Osteopontin identified as lead marker of colon cancer progression, using pooled sample expression profiling. J Natl Cancer Inst 94: 513-521
Alizadeh AA, Eisen MB, Davis RE, Ma C, Lossos IS, Rosenwald A, Boldrick JC, Sabet H, Tran T, Yu X, Powell Jl, Yang L, Marti GE, Moore T, Hudson J, Jr., Lu L, Lewis DB, Tibshirani R, Sherlock G, Chan WC, Greiner TC, Weisenburger DD, Armitage JO, Warnke R, Levy R, Wilson W, Grever MR, Byrd JC, Botstein D, Brown PO, Staudt LM (2000) Distinct types of diffuse large B-cell lymphoma identified by gene expression profiling. Nature 403: 503-511
Alwine JC, Kemp DJ, Stark GR (1977) Method for detection of specific RNAs in agarose gels by transfer to diazobenzyloxymethyl-paper and hybridization with DNA probes. Proc Natl Acad Sci U S A 74: 5350-5354
Anderson GL, Judd HL, Kaunitz AM, Barad DH, Beresford SA, PettingerM, Liu J, McNeeley SG, Lopez AM (2003) Effects of estrogen plus progestin on gynecologic cancers and associated diagnostic procedures: the Women's Health Initiative randomized trial. JAMA 290: 1739-1748
Anttila M, Kosma VM, Ji H, Wei-Ling X, Puolakka J, Juhola M, Saarikoski S,Syrjanen K (1998) Clinical significance of alpha-catenin, collagen IV, and Ki-67 expression in epithelial ovarian cancer. J Clin Oncol 16: 2591-2600
Baker W , Borst MP, Dixon D, Hatch KD, Shingleton HM, Miller D (1990) c-myc
179

amplification in ovarian cancer. Gynecol Oncol 38: 340-342
Barreca A, Minuto F (1989) Somatomedins: chemical and functional characteristics of the different molecular forms. J Endocrinol Invest 12: 279-293
Bartlett JM, Rabiasz GJ, Scott WN, Langdon SP, Smyth JF, Miller WR (1992) Transforming growth factor-beta mRNA expression and growth control of human ovarian carcinoma cells. BrJ Cancer 65: 655-660
Bast RC, Jr., Klug TL, St John E, Jenison E, Niloff JM, Lazarus H, Berkowitz RS, Leavitt T, Griffiths CT, Parker L, Zurawski VR, Jr., Knapp RC (1983) A radioimmunoassay using a monoclonal antibody to monitor the course of epithelial ovarian cancer. N Engl J Med 309: 883-887
Battaglia F, Scambia G, Benedetti PP, Baiocchi G, Perrone L, lacobelli S, Mancuso S (1989) Epidermal growth factor receptor expression in gynecological malignancies. Gynecol Obstet Invest 27: 42-44
Bauknecht T, Angel P, Kohler M, Kommoss F, Birmelin G, Pfleiderer A, Wagner E(1993) Gene structure and expression analysis of the epidermal growth factor receptor, transforming growth factor-alpha, myc, jun, and metallothionein in human ovarian carcinomas. Classification of malignant phenotypes. Cancer 71: 419-429
Bauknecht T, Runge M, Schwall M, Pfleiderer A (1988) Occurrence of epidermal growth factor receptors in human adnexal tumors and their prognostic value in advanced ovarian carcinomas. Gynecol Oncol 29: 147-157
Beck EP, Russo P, Gliozzo B, Jaeger W, Papa V, Wildt L, Pezzino V, Lang N (1994) Identification of insulin and insulin-like growth factor I (IGF I) receptors in ovarian cancer tissue. Gynecol Oncol 53: 196-201
Becker RM, Darrow C, Zimonjic DB, Popescu NC, Watson MA, Fleming TP (1998) Identification of mammaglobin B, a novel member of the uteroglobin gene family. Genomics 54: 70-78
Beckmann MW, Niederacher D, Schnurch HG, Gusterson BA, Bender HG (1997) Multistep carcinogenesis of breast cancer and tumour heterogeneity. J Mol Med 75: 429-439
Bellacosa A, de Feo D, Godwin AK, Bell DW, Cheng JQ, Altomare DA, Wan M, Dubeau L, Scambia G, Masciullo V , . (1995) Molecular alterations of the AKT2 oncogene in ovarian and breast carcinomas. Int J Cancer 64: 280-285
Berchuck A (1995) Biomarkers in the ovary. J Cell Biochem Suppl 23: 223-226
Berchuck A, Heron KA, Carney ME, Lancaster JM, Fraser EG, Vinson VL, Deffenbaugh AM, Miron A, Marks JR, Futreal PA, Frank TS (1998) Frequency of germline and somatic BRCA1 mutations in ovarian cancer. Clin Cancer Res 4: 2433- 2437
Berchuck A, Iversen ES, Lancaster JM, Pittman J, Luo J, Lee P, Murphy S, Dressman HK, Febbo PG, West M, Nevins JR, Marks JR (2005) Patterns of gene expression that characterize long-term survival in advanced stage serous ovarian
cancers. Clin Cancer Res 11: 3686-3696
Berchuck A, Kohler MF, Marks JR, Wiseman R, Boyd J, Bast RC, Jr. (1994) The p53 tumor suppressor gene frequently is altered in gynecologic cancers. Am J Obstet Gynecol MO: 246-252
Berchuck A, Olt GJ, Everitt L, Soisson AP, Bast RC, Jr., Boyer CM (1990) The role of peptide growth factors in epithelial ovarian cancer. Obstet Gynecol 75: 255-262
Berchuck A, Rodriguez GC, Kamel A, Dodge RK, Soper JT, Clarke-Pearson DL,Bast RC, Jr. (1991) Epidermal growth factor receptor expression in normal ovarian epithelium and ovarian cancer. I. Correlation of receptor expression with prognostic factors in patients with ovarian cancer. Am J Obstet Gynecol 164: 669-674
Berk AJ, Sharp PA (1977) Sizing and mapping of early adenovirus mRNAs by gel electrophoresis of S1 endonuclease-digested hybrids. Cell 12: 721-732
Bernards R, Weinberg RA (2002) Metastasis genes: A progression puzzle. Nature 418: 823
Bhattacharjee A, Richards WG, Staunton J, Li C, Monti S, Vasa P, Ladd C, Beheshti J, Bueno R, Gillette M, Loda M, Weber G, Mark EJ, Lander ES, Wong W, Johnson BE, Golub TR, Sugarbaker DJ, Meyerson M (2001) Classification of human lung carcinomas by mRNA expression profiling reveals distinct adenocarcinoma subclasses. Proc Natl Acad Sci U S A 98: 13790-13795
Bicher A, Ault K, Kimmelman A, Gershenson D, Reed E, Liang B (1997) Loss of heterozygosity in human ovarian cancer on chromosome 19q. Gynecol Oncol 66: 36- 40
Blaakaer J, Micic S, Morris ID, Hording U, Bennett P, Toftager-Larsen K, Djursing H, Bock JE (1993) Immunoreactive inhibin-production in post-menopausal women with malignant epithelial ovarian tumors. EurJ Obstet Gynecol Reprod Biol 52: 105-110
Brown E, Stewart M, Rye T, Al-Nafussi A, Williams AR, Bradburn M, Smyth J, Gabra H (2004) Carcinosarcoma of the ovary: 19 years of prospective data from a single center. Cancer 100: 2148-2153
Brown MP, Grundy WN, Lin D, Cristianini N, Sugnet CW, Furey TS, Ares M, Jr., Haussler D (2000) Knowledge-based analysis of microarray gene expression data by using support vector machines. Proc Natl Acad Sci U S A 97: 262-267
Brown TJ, Shaw PA, Karp X, Huynh MH, Begley H, Ringuette MJ (1999) Activation of SPARC expression in reactive stroma associated with human epithelial ovarian cancer. Gynecol Oncol 75: 25-33
Burghardt E, Girardi F, Lahousen M, Tamussino K, Stettner H (1991) Patterns of pelvic and paraaortic lymph node involvement in ovarian cancer. Gynecol Oncol 40: 103-106
But I, Gorisek B (2000) DNA-ploidy as an independent prognostic factor in patients with serous ovarian carcinoma. Int J Gynaecol Obstet 71: 259-262
181

Cancer Research UK. Scientific Yearbook 2001-2. 2002.Ref Type: Generic
Carlson GW, Murray DR, Lyles RH, Staley CA, Hestley A, Cohen C (2003) The amount of metastatic melanoma in a sentinel lymph node: does it have prognostic significance? Ann Surg Oncol 10: 575-581
Carraway KL, III, Cantley LC (1994) A neu acquaintance for erbB3 and erbB4: a role for receptor heterodimerization in growth signaling. Cell 78: 5-8
Casey G, Lopez ME, Ramos JC, Plummer SJ, Arboleda MJ, Shaughnessy M, Karlan B, Slamon DJ (1996) DNA sequence analysis of exons 2 through 11 and immunohistochemical staining are required to detect all known p53 alterations in human malignancies. Oncogene 13: 1971-1981
Chambers SK, Gertz RE, Jr., Ivins CM, Kacinski BM (1995) The significance of urokinase- type plasminogen activator, its inhibitors, and its receptor in ascites of patients with epithelial ovarian cancer. Cancer 75: 1627-1633
Chang BD, Swift ME, Shen M, Fang J, Broude EV, Roninson IB (2002) Molecular determinants of terminal growth arrest induced in tumor cells by a chemotherapeutic agent. Proc Natl Acad Sci U S A 99: 389-394
Chenevix-Trench G, Leary J, Kerr J, Michel J, Kefford R, Hurst T, Parsons PG, Friedlander M, Khoo SK (1992) Frequent loss of heterozygosity on chromosome 18 in ovarian adenocarcinoma which does not always include the DCC locus. Oncogene 7: 1059-1065
Cheng JQ, Godwin AK, Bellacosa A, Taguchi T, Franke TF, Hamilton TC, Tsichlis PN, Testa JR (1992) AKT2, a putative oncogene encoding a member of a subfamily of protein-serine/threonine kinases, is amplified in human ovarian carcinomas. Proc Natl Acad Sci U S A 89: 9267-9271
Cheng P, Schmutte C, Cofer KF, Felix JC, Yu MC, Dubeau L (1997) Alterations in DNA methylation are early, but not initial, events in ovarian tumorigenesis. BrJ Cancer 75: 396-402
Chien CH, Huang CC, Lin YH, Shen J, Chow SN (1997) Detection of serum transforming growth factor-alpha in patients of primary epithelial ovarian cancers by enzyme immunoassay. Gynecol Oncol 66: 405-410
Choi C, Cho S, Horikawa I, Berchuck A, Wang N, Cedrone E, Jhung SW, Lee JB,Kerr J, Chenevix-Trench G, Kim S, Barrett JC, Koi M (1997) Loss of heterozygosity at chromosome segment Xq25-26.1 in advanced human ovarian carcinomas. Genes Chromosomes Cancer 20: 234-242
Cirisano FD, Karlan BY (1996) The role of the HER-2/neu oncogene in gynecologic cancers. J Soc Gynecol Investlg 3: 99-105
Clark EA, Golub TR, Lander ES, Hynes RO (2000) Genomic analysis of metastasis reveals an essential role for RhoC. Nature 406: 532-535
Claus EB, Schildkraut JM, Thompson WD, Risch NJ (1996) The genetic attributable182

risk of breast and ovarian cancer. Cancer 77: 2318-2324
Colitti CV, Rodabaugh KJ, Welch WR, Berkowitz RS, Mok SC (1998) A novel 4 cM minimal deletion unit on chromosome 6q25.1-q25.2 associated with high grade invasive epithelial ovarian carcinomas. Oncogene 16: 555-559
Cooke I, O'Brien M, Chamock FM, Groome N, Ganesan TS (1995) Inhibin as a marker for ovarian cancer. BrJ Cancer 71: 1046-1050
Couch FJ, Farid LM, DeShano ML, Tavtigian SV, Calzone K, Campeau L, Peng Y, Bogden B, Chen Q, Neuhausen S, Shattuck-Eidens D, Godwin AK, Daly M, Radford DM, Sedlacek S, Rommens J, Simard J, Garber J, Merajver S, Weber BL (1996) BRCA2 germline mutations in male breast cancer cases and breast cancer families. Nat Genet 13: 123-125
Cramer DW, Welch WR (1983) Determinants of ovarian cancer risk. II. Inferences regarding pathogenesis. J Natl Cancer Inst 71: 717-721
Cramer DW, Welch WR, Scully RE, Wojciechowski CA (1982) Ovarian cancer and talc: a case-control study. Cancer 50: 372-376
Cramer DW, Xu H (1995) Epidemiologic evidence for uterine growth factors in the pathogenesis of ovarian cancer. Ann Epidemiol 5: 310-314
Crickard K, Gross JL, Crickard U, Yoonessi M, Lele S, Herblin WF, Eidsvoog K (1994) Basic fibroblast growth factor and receptor expression in human ovarian cancer. Gynecol Oncol 55: 277-284
Dang CV, Resar LM, Emison E, Kim S, Li Q, Prescott JE, Wonsey D, Zeller K (1999) Function of the c-Myc oncogenic transcription factor. Exp Cell Res 253: 63-77
Davies BR, Worsley SD, Ponder BA (1998) Expression of E-cadherin, alpha-catenin and beta-catenin in normal ovarian surface epithelium and epithelial ovarian cancers. Histopathology 32: 69-80
De CL, Marchionni L, Gariboldi M, Reid JF, Lagonigro MS, Caramuta S, Ferrario C, Bussani E, Mezzanzanica D, Turatti F, Delia D, Daidone MG, Oggionni M, Bertuletti N, Ditto A, Raspagliesi F, Pilotti S, Pierotti MA, Canevari S, Schneider C (2004)Gene expression profiling of advanced ovarian cancer: characterization of a molecular signature involving fibroblast growth factor 2. Oncogene 23: 8171-8183
Deligdisch L, Gil J (1989) Characterization of ovarian dysplasia by interactive morphometry. Cancer 63: 748-755
Demopoulos Rl, Bigelow B, Blaustein A, Chait J, Gutman E, Dubin N (1984) Characterization and survival of patients with serous cystadenocarcinoma of the ovaries. Obstet Gynecol 64: 557-563
Deng Y, Wu X (2000) Peg3/Pw1 promotes p53-mediated apoptosis by inducing Bax translocation from cytosol to mitochondria. Proc Natl Acad Sci U S A 97: 12050- 12055
DePriest PD, van NJ, Jr., Gallion HH, Shenson D, Hunter JE, Andrews SJ, Powell183
DE, Pavlik EJ (1993) Ovarian cancer screening in asymptomatic postmenopausal women. Gynecol Oncol 51: 205-209
Devlin J, Elder PA, Gabra H, Steel CM, Knowles MA (1996) High frequency of chromosome 9 deletion in ovarian cancer evidence for three tumour-suppressor loci. BrJ Cancer 73: 420-423
Dhanasekaran SM, Barrette TR, Ghosh D, Shah R, Varambally S, Kurachi K, Pienta KJ, Rubin MA, Chinnaiyan AM (2001) Delineation of prognostic biomarkers in prostate cancer. Nature 412: 822-826
Di Cristofano A, Pandolfi PP (2000) The multiple roles of PTEN in tumor suppression. Cell 100: 387-390
Diamandis EP, Yousef GM (2002a) Human tissue kallikreins: a family of new cancer biomarkers. Clin Chem 48: 1198-1205
Diamandis EP, Yousef GM (2002b) Human tissue kallikreins: a family of new cancer biomarkers. Clin Chem4S: 1198-1205
Diebold J, Mosinger K, Peiro G, Pannekamp U, Kaltz C, Baretton GB, Meier W,Lohrs U (2000) 20q13 and cyclin D1 in ovarian carcinomas. Analysis by fluorescence in situ hybridization. J Pathol 190: 564-571
Dimitroulakos J, Marhin WH, Tokunaga J, Irish J, Gullane P, Penn LZ, Kamel-Reid S (2002) Microarray and biochemical analysis of lovastatin-induced apoptosis of squamous cell carcinomas. Neoplasia 4: 337-346
Dodson MK, Cliby WA, Xu HJ, DeLacey KA, Hu SX, Keeney GL, Li J, Podratz KC, Jenkins RB, Benedict WF (1994) Evidence of functional RB protein in epithelial ovarian carcinomas despite loss of heterozygosity at the RB locus. Cancer Res 54: 610-613
Dodson MK, Hartmann LC, Cliby WA, DeLacey KA, Keeney GL, Ritland SR, Su JQ, Podratz KC, Jenkins RB (1993) Comparison of loss of heterozygosity patterns in invasive low-grade and high-grade epithelial ovarian carcinomas. Cancer Res 53: 4456-4460
Donninger H, Bonome T, Radonovich M, Pise-Masison CA, Brady J, Shih JH, Barrett JC, Birrer MJ (2004) Whole genome expression profiling of advance stage papillary serous ovarian cancer reveals activated pathways. Oncogene 23: 8065-8077
Downward J (1998) Ras signalling and apoptosis. CurrOpin Genet Dev 8: 49-54
Doyle P, Maconochie N, Beral V, Swerdlow AJ, Tan SL (2002) Cancer incidence following treatment for infertility at a clinic in the UK. Hum Reprod 17: 2209-2213
Duggan BD, Wan M, Yu MC, Roman LD, Muderspach LI, Delgadillo E, Li WZ, Martin SE, Dubeau L (1998) Detection of ovarian cancer cells: comparison of a telomerase assay and cytologic examination. J Natl Cancer Inst 90: 238-242
Einhorn N, Sjovall K, Knapp RC, Hall P, Scully RE, Bast RC, Jr., Zurawski VR, Jr.(1992) Prospective evaluation of serum CA 125 levels for early detection of ovarian
184
cancer. Obstet Gynecol 80: 14-18
Eisen MB, Spellman PT, Brown PO, Botstein D (1998) Cluster analysis and display of genome-wide expression patterns. Proc Natl Acad Sci U S A 95: 14863-14868
Eissa S, Khalifa A, Laban M, Elian A, Bolton WE (1998) Comparison of flow cytometric DNA content analysis in fresh and paraffin-embedded ovarian neoplasms: a prospective study. BrJ Cancer 77: 421-425
Englefield P, Foulkes WD, Campbell IG (1994) Loss of heterozygosity on chromosome 22 in ovarian carcinoma is distal to and is not accompanied by mutations in NF2 at 22q12. BrJ Cancer 70: 905-907
Enomoto T, Inoue M, Perantoni AO, Terakawa N, Tanizawa O, Rice JM (1990) K-ras activation in neoplasms of the human female reproductive tract. Cancer Res 50: 6139-6145
Espey LL (1994) Current status of the hypothesis that mammalian ovulation is comparable to an inflammatory reaction. Biol Reprod 50: 233-238
Fathalla MF (1971) Incessant ovulation--a factor in ovarian neoplasia? Lancet 2: 163
Feeley KM, Wells M (2001) Precursor lesions of ovarian epithelial malignancy. Histopathology 38: 87-95
Feldkamper M, Enderle-Schmitt U, Hackenberg R, Schulz KD (1994) Urinary excretion of growth factors in patients with ovarian cancer. Eur J Cancer 30A: 1851- 1858
Flyvbjerg A, Mogensen O, Mogensen B, Nielsen OS (1997) Elevated serum insulinlike growth factor-binding protein 2 (IGFBP-2) and decreased IGFBP-3 in epithelial ovarian cancer: correlation with cancer antigen 125 and tumor-associated trypsin inhibitor. J Clin Endocrinol Metab 82: 2308-2313
Folkman J (1971) Tumor angiogenesis: therapeutic implications. N Engl J Med 285: 1182-1186
Ford D, Easton DF, Bishop DT, Narod SA, Goldgar DE (1994) Risks of cancer in BRCA1-mutation carriers. Breast Cancer Linkage Consortium. Lancet 343: 692-695
Ford D, Easton DF, Peto J (1995) Estimates of the gene frequency of BRCA1 and its contribution to breast and ovarian cancer incidence. Am J Hum Genet 57: 1457-1462
Ford D, Easton DF, Stratton M, Narod S, Goldgar D, Devilee P, Bishop DT, Weber B, Lenoir G, Chang-Claude J, Sobol H, Teare MD, Struewing J, Arason A, Schemeck S, Peto J, RebbeckTR, Tonin P, Neuhausen S, Barkardottir R, Eyfjord J, Lynch H, Ponder BA, Gayther SA, Zelada-Hedman M, . (1998) Genetic heterogeneity and penetrance analysis of the BRCA1 and BRCA2 genes in breast cancer families. The Breast Cancer Linkage Consortium. Am J Hum Genet 62: 676-689
Foulkes WD, Black DM, Stamp GW, Solomon E, Trowsdale J (1993) Very frequent loss of heterozygosity throughout chromosome 17 in sporadic ovarian carcinoma. Int
185
J Cancer 54: 220-225
Freeman JA, Esrig D, Grossfeld GD, Stein JP, Chen SC, Young LL, Taylor CR, Skinner DG, Lieskovsky G, Cote RJ (1995) Incidence of occult lymph node metastases in pathological stage C (pT3N0) prostate cancer. J Urol 154: 474-478
Frevert EU, Kahn BB (1997) Differential effects of constitutively active phosphatidylinositol 3-kinase on glucose transport, glycogen synthase activity, and DNA synthesis in 3T3-L1 adipocytes. Mol Cell Biol 17: 190-198
Fujioka T, Takebayashi Y, Kihana T, Kusanagi Y, Hamada K, Ochi H, Uchida T, Fukumoto M, Ito M (2001) Expression of E-cadherin and beta-catenin in primary and peritoneal metastatic ovarian carcinoma. Oncol Rep 8: 249-255
Galani E, Sgouros J, Petropoulou C, Janinis J, Aravantinos G, Dionysiou-Asteriou D, Skarlos D, Gonos E (2002) Correlation of MDR-1, nm23-H1 and H Serna E gene expression with histopathological findings and clinical outcome in ovarian and breast cancer patients. Anticancer Res 22: 2275-2280
Gamallo C, Palacios J, Moreno G, Calvo dM, Suarez A, Armas A (1999) beta-catenin expression pattern in stage I and II ovarian carcinomas : relationship with beta- catenin gene mutations, clinicopathological features, and clinical outcome. Am J Pathol 155: 527-536
Garg PP, Kerlikowske K, Subak L, Grady D (1998) Hormone replacement therapy and the risk of epithelial ovarian carcinoma: a meta-analysis. Obstet Gynecol 92: 472-479
Gerard C, Rollins BJ (2001) Chemokines and disease. Nat Immunol 2: 108-115
Gerhold D, Lu M, Xu J, Austin C, Caskey CT, Rushmore T (2001) Monitoring expression of genes involved in drug metabolism and toxicology using DNA microarrays. Physiol Genomics 5: 161-170
Gillett CE, Barnes DM (1998) Demystified ... cell cycle. Mol Pathol 51: 310-316
Golub TR, Slonim DK, Tamayo P, Huard C, Gaasenbeek M, Mesirov JP, Coller H, Loh ML, Downing JR, Caligiuri MA, Bloomfield CD, Lander ES (1999) Molecular classification of cancer: class discovery and class prediction by gene expression monitoring. Science 286: 531-537
Green A, Purdie D, Bain C, Siskind V, Russell P, Quinn M, Ward B (1997) Tubal sterilisation, hysterectomy and decreased risk of ovarian cancer. Survey of Women's Health Study Group. IntJ Cancer 71: 948-951
Greenson JK, Isenhart CE, Rice R, Mojzisik C, Houchens D, Martin EW, Jr. (1994) Identification of occult micrometastases in pericolic lymph nodes of Duke's B colorectal cancer patients using monoclonal antibodies against cytokeratin and CC49. Correlation with long-term survival. Cancer 73: 563-569
Gu J, Tamura M, Pankov R, Danen EH, Takino T, Matsumoto K, Yamada KM (1999) She and FAK differentially regulate cell motility and directionality modulated by
186
PTEN. J Cell Biol 146: 389-403
Gubbay O, Guo W, Rae MT, Niven D, Langdon SP, Hillier SG (2005) Inflammation- associated gene expression is altered between normal human ovarian surface epithelial cells and cell lines derived from ovarian adenocarcinomas. BrJ Cancer 92: 1927-1933
Guidozzi F, Szumel RC, Ball JH, Johnston DA, Katz RL, Kidd L (1996) Image analysis of cellular DNA content in peritoneal fluid of patients with ovarian tumors of low malignant potential and invasive epithelial ovarian cancer. Gynecol Oncol 61: 204-209
Hahn SA, Greenhalf B, Ellis I, Sina-Frey M, Rieder H, Korte B, Gerdes B, Kress R, Ziegler A, Raeburn JA, Campra D, Grutzmann R, Rehder H, Rothmund M,Schmiegel W, Neoptolemos JP, Bartsch DK (2003) BRCA2 germline mutations in familial pancreatic carcinoma. J Natl Cancer Inst 95: 214-221
Hanahan D, Weinberg RA (2000) The hallmarks of cancer. Cell 100: 57-70
Harris RE, Beebe-Donk J, Doss H, Burr DD (2005) Aspirin, ibuprofen, and other nonsteroidal anti-inflammatory drugs in cancer prevention: a critical review of non- selective COX-2 blockade (review). Oncol Rep 13: 559-583
Hartenbach EM, Olson TA, Goswitz JJ, Mohanraj D, Twiggs LB, Carson LF, Ramakrishnan S (1997) Vascular endothelial growth factor (VEGF) expression and survival in human epithelial ovarian carcinomas. Cancer Lett 121: 169-175
Hartmann LC, Podratz KC, Keeney GL, Kamel NA, Edmonson JH, Grill JP, Su JQ, Katzmann JA, Roche PC (1994) Prognostic significance of p53 immunostaining in epithelial ovarian cancer. J Clin Oncol 12: 64-69
Hatta Y, Takeuchi S, Yokota J, Koeffler HP (1997) Ovarian cancer has frequent loss of heterozygosity at chromosome 12p12.3-13.1 (region of TEL and Kip1 loci) and chromosome 12q23-ter: evidence for two new tumour-suppressor genes. BrJ Cancer 75: 1256-1262
Havrilesky LJ, Hurteau JA, Whitaker RS, Elbendary A, Wu S, Rodriguez GC, Bast RC, Jr., Berchuck A (1995) Regulation of apoptosis in normal and malignant ovarian epithelial cells by transforming growth factor beta. Cancer Res 55: 944-948
Heaps JM, Nieberg RK, Berek JS (1990) Malignant neoplasms arising in endometriosis. Obstet Gynecol 75: 1023-1028
Heid CA, Stevens J, Livak KJ, Williams PM (1996) Real time quantitative PCR. Genome Res 6: 986-994
Heller DS, Gordon RE, Westhoff C, Gerber S (1996a) Asbestos exposure and ovarian fiber burden. Am J Ind Med 29: 435-439
Heller DS, Westhoff C, Gordon RE, Katz N (1996b) The relationship between perineal cosmetic talc usage and ovarian talc particle burden. Am J Obstet Gynecol 174: 1507-1510
187
Hellstrom I, Goodman G, Pullman J, Yang Y, Hellstrom KE (2001) Overexpression of HER-2 in ovarian carcinomas. Cancer Res 61: 2420-2423
Helzlsouer KJ, Alberg AJ, Gordon GB, Longcope C, Bush TL, Hoffman SC,Comstock GW (1995) Serum gonadotropins and steroid hormones and the development of ovarian cancer. JAMA 274: 1926-1930
Henriksen R, Funa K, Wilander E, Backstrom T, Ridderheim M, Oberg K (1993) Expression and prognostic significance of platelet-derived growth factor and its receptors in epithelial ovarian neoplasms. Cancer Res 53: 4550-4554
Henriksen R, Wilander E, Oberg K (1995) Expression and prognostic significance of Bcl-2 in ovarian tumours. BrJ Cancer 72: 1324-1329
Henzen-Logmans SC, Bems EM, Klijn JG, van der Burg ME, Foekens JA (1992) Epidermal growth factor receptor in ovarian tumours: correlation of immunohistochemistry with ligand binding assay. BrJ Cancer 66: 1015-1021
Herod JJ, Eliopoulos AG, Warwick J, Niedobitek G, Young LS, Kerr DJ (1996) The prognostic significance of Bcl-2 and p53 expression in ovarian carcinoma. Cancer Res 56: 2178-2184
Herrera CA, Xu L, Bucana CD, Silva e, V, Hess KR, Gershenson DM, Fidler IJ(2002) Expression of metastasis-related genes in human epithelial ovarian tumors.Int J Oncol 20: 5-13
Higuchi R, Fockler C, Dollinger G, Watson R (1993) Kinetic PCR analysis: real-time monitoring of DNA amplification reactions. Biotechnology (7V YJ 11: 1026-1030
Hofmann J, Wegmann B, Hackenberg R, Kunzmann R, Schulz KD, Havemann K (1994) Production of insulin-like growth factor binding proteins by human ovarian carcinoma cells. J Cancer Res Clin Oncol 120: 137-142
Hoggard N, Brintnell B, Howell A, Weissenbach J, Variey J (1995) Allelic imbalance on chromosome 1 in human breast cancer. II. Microsatellite repeat analysis. Genes Chromosomes Cancer 12: 24-31
Hotte SJ, Winquist EW, Stitt L, Wilson SM, Chambers AF (2002) Plasma osteopontin: associations with survival and metastasis to bone in men with hormone- refractory prostate carcinoma. Cancer 95: 506-512
Hough CD, Cho KR, Zonderman AB, Schwartz DR, Morin PJ (2001) Coordinately up- regulated genes in ovarian cancer. Cancer Res 61: 3869-3876
Huddleston HG, Wong KK, Welch WR, Berkowitz RS, Mok SC (2005) Clinical applications of microarray technology: creatine kinase B is an up-regulated gene in epithelial ovarian cancer and shows promise as a serum marker. Gynecol Oncol 96: 77-83
Hughes-Davies L, Huntsman D, Ruas M, Fuks F, Bye J, Chin SF, Milner J, Brown LA, Hsu F, Gilks B, Nielsen T, Schulzer M, Chia S, Ragaz J, Cahn A, Linger L,Ozdag H, Cattaneo E, Jordanova ES, Schuuring E, Yu DS, Venkitaraman A, Ponder B, Doherty A, Aparicio S, Bentley D, Theillet C, Ponting CP, Caldas C, Kouzarides T
188
(2003) EMSY links the BRCA2 pathway to sporadic breast and ovarian cancer. Cell 115:523-535
Hurteau J, Rodriguez GC, Whitaker RS, Shah S, Mills G, Bast RC, Berchuck A(1994) Transforming growth factor-beta inhibits proliferation of human ovarian cancer cells obtained from ascites. Cancer 74: 93-99
Ichikawa Y, Yoshida S, Koyama Y, Hirai M, Ishikawa T, Nishida M, Tsunoda H, Kubo T, Miwa M, Uchida K (1996) Inactivation of p16/CDKN2 and p15/MTS2 genes in different histological types and clinical stages of primary ovarian tumors. IntJ Cancer 69: 466-470
Inoue K, Slaton JW, Eve BY, Kim SJ, Perrotte P, Balbay MD, Yano S, Bar-Eli M, Radinsky R, Pettaway CA, Dinney CP (2000) Interleukin 8 expression regulates tumorigenicity and metastases in androgen-independent prostate cancer. Clin Cancer Res 6:2104-2119
Irizarry RA, Bolstad BM, Collin F, Cope LM, Hobbs B, Speed TP (2003) Summaries of Affymetrix GeneChip probe level data. Nucleic Acids Res 31: e15
Ismail RS, Baldwin RL, Fang J, Browning D, Karlan BY, Gasson JC, Chang DD (2000) Differential gene expression between normal and tumor-derived ovarian epithelial cells. Cancer Res 60: 6744-6749
Iwabuchi H, Sakamoto M, Sakunaga H, Ma YY, Carcangiu ML, Pinkel D, Yang-Feng TL, Gray JW (1995) Genetic analysis of benign, low-grade, and high-grade ovarian tumors. Cancer Res 55: 6172-6180
Jacobs I, Bast RC, Jr. (1989) The CA 125 tumour-associated antigen: a review of the literature. Hum Reprod 4: 1-12
Jacobs I, Davies AP, Bridges J, Stabile I, Fay T, Lower A, Grudzinskas JG, Oram D(1993) Prevalence screening for ovarian cancer in postmenopausal women by CA 125 measurement and ultrasonography. BMJ 306: 1030-1034
Jacobs IJ, Kohler MF, Wiseman RW, Marks JR, Whitaker R, Kerns BA, Humphrey P, Berchuck A, Ponder BA, Bast RC, Jr. (1992) Clonal origin of epithelial ovarian carcinoma: analysis by loss of heterozygosity, p53 mutation, and X-chromosome inactivation. J Natl Cancer Inst 84: 1793-1798
Jacobs IJ, Skates SJ, MacDonald N, Menon U, Rosenthal AN, Davies AP, Woolas R, Jeyarajah AR, Sibley K, Lowe DG, Oram DH (1999) Screening for ovarian cancer: a pilot randomised controlled trial. Lancet 353: 1207-1210
Jazaeri AA, Lu K, Schmandt R, Harris CP, Rao PH, Sotiriou C, Chandramouli GV, Gershenson DM, Liu ET (2003) Molecular determinants of tumor differentiation in papillary serous ovarian carcinoma. Mol Carcinog 36: 53-59
Jemal A, Murray T, Samuels A, Ghafoor A, Ward E, Thun MJ (2003) Cancer statistics, 2003. CA Cancer J Clin 53: 5-26
Jimenez C, Jones DR, Rodriguez-Viciana P, Gonzalez-Garcia A, Leonardo E, Wennstrom S, von Kobbe C, Toran JL, Borlado L, Calvo V, Copin SG, Albar JP,
189

Gaspar ML, Diez E, Marcos MA, Downward J, Martinez A, Merida I, Carrera AC (1998) Identification and characterization of a new oncogene derived from the regulatory subunit of phosphoinositide 3-kinase. EMBO J 17: 743-753
Joly DJ, Lilienfeld AM, Diamond EL, Bross ID (1974) An epidemiologic study of the relationship of reproductive experience to cancer of the ovary. Am J Epidemiol 99: 190-209
Jones C, Foschini MP, Chaggar R, Lu YJ, Wells D, Shipley JM, Eusebi V, Lakhani SR (2000) Comparative genomic hybridization analysis of myoepithelial carcinoma of the breast. Lab Invest 80: 831-836
Jones C, Nonni AV, Fulford L, Merrett S, Chaggar R, Eusebi V, Lakhani SR (2001) CGH analysis of ductal carcinoma of the breast with basaloid/myoepithelial cell differentiation. BrJ Cancer 85: 422-427
Jones PA, Buckley JD, Henderson BE, Ross RK, Pike MC (1991) From gene to carcinogen: a rapidly evolving field in molecular epidemiology. Cancer Res 51: 3617- 3620
Joukov V, Pajusola K, Kaipainen A, Chilov D, Lahtinen I, Kukk E, Saksela O, Kalkkinen N, Alitalo K (1996) A novel vascular endothelial growth factor, VEGF-C, is a ligand for the Flt4 (VEGFR-3) and KDR (VEGFR-2) receptor tyrosine kinases. EMBO J 15: 290-298
Jozan S, Guerrin M, Mazars P, Dutaur M, Monsarrat B, Cheutin F, Bugat R, Martel P, Valette A (1992) Transforming growth factor beta 1 (TGF-beta 1) inhibits growth of a human ovarian carcinoma cell line (OVCCR1) and is expressed in human ovarian tumors. IntJ Cancer 52: 766-770
Kaipainen A, Korhonen J, Mustonen T, van Hinsbergh VW, Fang GH, Dumont D, Breitman M, Alitalo K (1995) Expression of the fms-like tyrosine kinase 4 gene becomes restricted to lymphatic endothelium during development. Proc Natl Acad Sci U S A 92: 3566-3570
Karasik A, Menczer J, Pariente C, Kanety H (1994) Insulin-like growth factor-l (IGF-I) and IGF-binding protein-2 are increased in cyst fluids of epithelial ovarian cancer. J Clin Endocrinol Metab 78: 271-276
Katsaros D, Theillet C, Zola P, Louason G, Sanfilippo B, Isaia E, Arisio R, Giardina G, Sismondi P (1995) Concurrent abnormal expression of erbB-2, myc and ras genes is associated with poor outcome of ovarian cancer patients. Anticancer Res 15: 1501-1510
KEAL EE (1960) Asbestosis and abdominal neoplasms. Lancet 2: 1211-1216
Kennedy SG, Wagner AJ, Conzen SD, Jordan J, Bellacosa A, Tsichlis PN, Hay N(1997) The PI 3-kinase/Akt signaling pathway delivers an anti-apoptotic signal.Genes Dev 11: 701-713
Kerr JF, Wyllie AH, Currie AR (1972) Apoptosis: a basic biological phenomenon with wide-ranging implications in tissue kinetics. BrJ Cancer 26: 239-257
190

Khwaja A, Rodriguez-Viciana P, Wennstrom S, Warne PH, Downward J (1997)Matrix adhesion and Ras transformation both activate a phosphoinositide 3-OH kinase and protein kinase B/Akt cellular survival pathway. EMBO J 16: 2783-2793
Kim JH, Skates SJ, Uede T, Wong Kk KK, Schorge JO, Feltmate CM, Berkowitz RS, Cramer DW, Mok SC (2002a) Osteopontin as a potential diagnostic biomarker for ovarian cancer. JAMA 287: 1671-1679
Kim JH, Skates SJ, Uede T, Wong KK, Schorge JO, Feltmate CM, Berkowitz RS, Cramer DW, Mok SC (2002b) Osteopontin as a potential diagnostic biomarker for ovarian cancer. JAMA 287: 1671-1679
Kim TM, Benedict WF, Xu HJ, Hu SX, Gosewehr J, Velicescu M, Yin E, Zheng J, DAblaing G, Dubeau L (1994) Loss of heterozygosity on chromosome 13 is common only in the biologically more aggressive subtypes of ovarian epithelial tumors and is associated with normal retinoblastoma gene expression. Cancer Res 54: 605-609
Kinzler KW, Vogelstein B (1996) Lessons from hereditary colorectal cancer. Cell 87: 159-170
Kitahara O, Furukawa Y, Tanaka T, Kihara C, Ono K, Yanagawa R, Nita ME, Takagi T, Nakamura Y, Tsunoda T (2001) Alterations of gene expression during colorectal carcinogenesis revealed by cDNA microarrays after laser-capture microdissection of tumor tissues and normal epithelia. Cancer Res 61: 3544-3549
Kliewer EV, Smith KR (1995) Ovarian cancer mortality among immigrants in Australia and Canada. Cancer Epidemiol Biomarkers Prev 4: 453-458
Klippel A, Escobedo MA, Wachowicz MS, Apell G, Brown TW, Giedlin MA, Kavanaugh WM, Williams LT (1998) Activation of phosphatidylinositol 3-kinase is sufficient for cell cycle entry and promotes cellular changes characteristic of oncogenic transformation. Mol Cell Biol 18: 5699-5711
Knauf S, Urbach Gl (1978) The development of a double-antibody radioimmunoassay for detecting ovarian tumor-associated antigen fraction OCA in plasma. Am J Obstet Gynecol 131: 780-787
Knudson AG (1997) Hereditary predisposition to cancer. Ann N Y Acad Sci 833: 58- 67
Kohler M, Bauknecht T, Grimm M, Birmelin G, Kommoss F, Wagner E (1992) Epidermal growth factor receptor and transforming growth factor alpha expression in human ovarian carcinomas. EurJ Cancer 28A: 1432-1437
Kommoss F, Wintzer HO, Von Kleist S, Kohler M, Walker R, Langton B, Van Tran K, Pfleiderer A, Bauknecht T (1990) In situ distribution of transforming growth factor alpha in normal human tissues and in malignant tumours of the ovary. J Pathol 162: 223-230
Konecny G, Untch M, Pihan A, Kimmig R, Gropp M, Stieber P, Hepp H, Slamon D, Pegram M (2001) Association of urokinase-type plasminogen activator and its inhibitor with disease progression and prognosis in ovarian cancer. Clin Cancer Res
191

7: 1743-1749
Korkola JE, DeVries S, Fridlyand J, Hwang ES, Estep AL, Chen YY, Chew KL, Dairkee SH, Jensen RM, Waldman FM (2003) Differentiation of lobular versus ductal breast carcinomas by expression microarray analysis. Cancer Res 63: 7167-7175
Kristiansen G, Denkert C, Schluns K, Dahl E, Pilarsky C, Hauptmann S (2002) CD24 is expressed in ovarian cancer and is a new independent prognostic marker of patient survival. Am J Pathol 161: 1215-1221
Kudoh K, Ichikawa Y, Yoshida S, Hirai M, Kikuchi Y, Nagata I, Miwa M, Uchida K (2002) Inactivation of p16/CDKN2 and p15/MTS2 is associated with prognosis and response to chemotherapy in ovarian cancer. Int J Cancer 99: 579-582
Kuhn W, Kaufmann M, FeichterGE, Rummel HH, Schmid H, Heberling D (1989) DNA flow cytometry, clinical and morphological parameters as prognostic factors for advanced malignant and borderline ovarian tumors. Gynecol Oncol 33: 360-367
Kuhn W, Schmalfeldt B, Reuning U, Pache L, Berger U, Ulm K, Harbeck N, Spathe K, Dettmar P, Hofler H, Janicke F, Schmitt M, Graeff H (1999) Prognostic significance of urokinase (uPA) and its inhibitor PAI-1 for survival in advanced ovarian carcinoma stage FIGO lllc. BrJ Cancer 79: 1746-1751
Kurose K, Zhou XP, Araki T, Cannistra SA, Maher ER, Eng C (2001) Frequent loss of PTEN expression is linked to elevated phosphorylated Akt levels, but not associated with p27 and cyclin D1 expression, in primary epithelial ovarian carcinomas. Am J Pathol 158: 2097-2106
Lacey JV, Jr., Mink PJ, Lubin JH, Sherman ME, Troisi R, Hartge P, Schatzkin A, Schairer C (2002) Menopausal hormone replacement therapy and risk of ovarian cancer. JAMA 288: 334-341
Lancaster JM, Dressman HK, Whitaker RS, Havrilesky L, Gray J, Marks JR, Nevins JR, Berchuck A (2004) Gene expression patterns that characterize advanced stage serous ovarian cancers. J Soc Gynecol Investig 11: 51-59
Lane DP (1992) Cancer. p53, guardian of the genome. Nature 358: 15-16
Launonen V, Stenback F, Puistola U, Bloigu R, Huusko P, Kytola S, Kauppila A, Winqvist R (1998) Chromosome 11q22.3-q25 LOH in ovarian cancer: association with a more aggressive disease course and involved subregions. Gynecol Oncol 71: 299-304
Li C, Hung WW (2001) Model-based analysis of oligonucleotide arrays: model validation, design issues and standard error application. Genome Biol 2: RESEARCH0032
Li S, Han H, Resnik E, Carcangiu ML, Schwartz PE, Yang-Feng TL (1993) Advanced ovarian carcinoma: molecular evidence of unifocal origin. Gynecol Oncol 51: 21-25
Li SB, Schwartz PE, Lee WH, Yang-Feng TL (1991) Allele loss at the retinoblastoma locus in human ovarian cancer. J Natl Cancer Inst 83: 637-640
192
Liang P, Pardee AB (1992) Differential display of eukaryotic messenger RNA by means of the polymerase chain reaction. Science 257: 967-971
Liotta LA (1992) Cancer cell invasion and metastasis. Sci Am 266: 54-3
Liu JR, Fletcher B, Page C, Hu C, Nunez G, Baker V (1998) Bcl-xL is expressed in ovarian carcinoma and modulates chemotherapy-induced apoptosis. Gynecol Oncol 70: 398-403
Loft A, Lidegaard O, Tabor A (1997) Incidence of ovarian cancer after hysterectomy: a nationwide controlled follow up. BrJ Obstet Gynaecol 104: 1296-1301
Lombardi D, Lacombe ML, Paggi MG (2000) nm23: unraveling its biological function in cell differentiation. J Cell Physiol 182: 144-149
Lounis H, Mes-Masson AM, Dion F, Bradley WE, Seymour RJ, Provencher D, Tonin PN (1998) Mapping of chromosome 3p deletions in human epithelial ovarian tumors. Oncogene 17: 2359-2365
Loupart ML, Armour J, Walker R, Adams S, BrammarW, Varley J (1995) Allelic imbalance on chromosome 1 in human breast cancer. I. Minisatellite and RFLP analysis. Genes Chromosomes Cancer 12: 16-23
Lu KH, Weitzel JN, Kodali S, Welch WR, Berkowitz RS, Mok SC (1997) A novel 4-cM minimally deleted region on chromosome 11 p15.1 associated with high grade nonmucinous epithelial ovarian carcinomas. Cancer Res 57: 387-390
Luca M, Huang S, Gershenwald JE, Singh RK, Reich R, Bar-Eli M (1997) Expression of interleukin-8 by human melanoma cells up-regulates MMP-2 activity and increases tumor growth and metastasis. Am J Pathol 151: 1105-1113
Lynch HT, Smyrk T (1996) Hereditary nonpolyposis colorectal cancer (Lynch syndrome). An updated review. Cancer 78: 1149-1167
MacDonald TJ, Brown KM, LaFleur B, Peterson K, Lawlor C, Chen Y, Packer RJ, Cogen P, Stephan DA (2001) Expression profiling of medulloblastoma: PDGFRA and the RAS/MAPK pathway as therapeutic targets for metastatic disease. Nat Genet 29: 143-152
Maehama T, Dixon JE (1998) The tumor suppressor, PTEN/MMAC1, dephosphorylates the lipid second messenger, phosphatidylinositol 3,4,5- trisphosphate. J Biol Chem 273: 13375-13378
Maines-Bandiera SL, Auersperg N (1997) Increased E-cadherin expression in ovarian surface epithelium: an early step in metaplasia and dysplasia? Int J Gynecol Pathol 16: 250-255
Makinen T, Jussila L, Veikkola T, Karpanen T, Kettunen Ml, Pulkkanen KJ, Kauppinen R, Jackson DG, Kubo H, Nishikawa S, Yla-Herttuala S, Alitalo K (2001) Inhibition of lymphangiogenesis with resulting lymphedema in transgenic mice expressing soluble VEGF receptor-3. Nat Med 7: 199-205
Mandai M, Konishi I, Koshiyama M, Mori T, Arao S, Tashiro H, Okamura H, Nomura
193
H, Hiai H, Fukumoto M (1994) Expression of metastasis-related nm23-H1 and nm23- H2 genes in ovarian carcinomas: correlation with clinicopathology, EGFR, c-erbB-2, and c-erbB-3 genes, and sex steroid receptor expression. Cancer Res 54: 1825- 1830
Mark HF, Afify AM, Werness BA, Das S, Mark S, Sarny M (1999) Trisomy 8 in stage I and stage III ovarian cancer detected by fluorescence in situ hybridization. Exp Mol Pathol 66: 76-81
Marks JR, Davidoff AM, Kerns BJ, Humphrey PA, Pence JC, Dodge RK, Clarke- Pearson DL, Iglehart JD, Bast RC, Jr., Berchuck A (1991) Overexpression and mutation of p53 in epithelial ovarian cancer. Cancer Res 51: 2979-2984
Marth C, Lang T, Cronauer MV, Doppler W, Zeimet AG, Bachmair F, Ullrich A, Daxenbichler G (1992) Epidermal growth factor reduces HER-2 protein level in human ovarian carcinoma cells. Int J Cancer 52: 311-316
Matei D, Graeber TG, Baldwin RL, Karlan BY, Rao J, Chang DD (2002) Gene expression in epithelial ovarian carcinoma. Oncogene 21: 6289-6298
McGuckin MA, Cummings MC, Walsh MD, Hohn BG, Bennett IC, Wright RG (1996) Occult axillary node metastases in breast cancer: their detection and prognostic significance. BrJ Cancer 73: 88-95
McKenzie SJ, DeSombre KA, Bast BS, Hollis DR, Whitaker RS, Berchuck A, Boyer CM, Bast RC, Jr. (1993) Serum levels of HER-2 neu (C-erbB-2) correlate with overexpression of p185neu in human ovarian cancer. Cancer 71: 3942-3946
Medl M, Ogris E, Peters-Engl C, Leodolter S (1995) TATI (tumour-associated trypsin inhibitor) as a marker of ovarian cancer. BrJ Cancer 71: 1051-1054
Meili R, Cron P, Hemmings BA, Ballmer-Hofer K (1998) Protein kinase B/Akt is activated by polyomavirus middle-T antigen via a phosphatidylinositol 3-kinase- dependent mechanism. Oncogene 16: 903-907
Meinhold-Heerlein I, Bauerschlag D, Hilpert F, Dimitrov P, Sapinoso LM, Orlowska- Volk M, Bauknecht T, Park TW, Jonat W, Jacobsen A, Sehouli J, Luttges J,Krajewski M, Krajewski S, Reed JC, Arnold N, Hampton GM (2005) Molecular and prognostic distinction between serous ovarian carcinomas of varying grade and malignant potential. Oncogene 24: 1053-1065
Mok CH, Tsao SW, Knapp RC, Fishbaugh PM, Lau CC (1992) Unifocal origin of advanced human epithelial ovarian cancers. Cancer Res 52: 5119-5122
Mok SC, Chao J, Skates S, Wong K, Yiu GK, Muto MG, Berkowitz RS, Cramer DW (2001b) Prostasin, a potential serum marker for ovarian cancer: identification through microarray technology. J Natl Cancer Inst 93: 1458-1464
Mok SC, Chao J, Skates S, Wong K, Yiu GK, Muto MG, Berkowitz RS, Cramer DW (2001a) Prostasin, a potential serum marker for ovarian cancer: identification through microarray technology. J Natl Cancer Inst 93: 1458-1464
Mor G, Visintin I, Lai Y, Zhao H, Schwartz P, Rutherford T, Yue L, Bray-Ward P,194

Ward DC (2005) Serum protein markers for early detection of ovarian cancer. Proc Natl Acad Sci U S A 102: 7677-7682
Moreno-Bueno G, Sanchez-Estevez C, Cassia R, Rodriguez-Perales S, Diaz-Uriarte R, Dominguez O, Hardisson D, Andujar M, Prat J, Matias-Guiu X, Cigudosa JC, Palacios J (2003) Differential gene expression profile in endometrioid and nonendometrioid endometrial carcinoma: STK15 is frequently overexpressed and amplified in nonendometrioid carcinomas. Cancer Res 63: 5697-5702
Morishige K, Kurachi H, Amemiya K, Fujita Y, Yamamoto T, Miyake A, Tanizawa O (1991) Evidence for the involvement of transforming growth factor alpha and epidermal growth factor receptor autocrine growth mechanism in primary human ovarian cancers in vitro. Cancer Res 51: 5322-5328
Moser TL, Young TN, Rodriguez GC, Pizzo SV, Bast RC, Jr., Stack MS (1994) Secretion of extracellular matrix-degrading proteinases is increased in epithelial ovarian carcinoma. Int J Cancer 56: 552-559
Muller A, Homey B, Soto H, Ge N, Catron D, Buchanan ME, McClanahan T, Murphy E, Yuan W, Wagner SN, Barrera JL, Mohar A, Verastegui E, Zlotnik A (2001) Involvement of chemokine receptors in breast cancer metastasis. Nature 410: 50-56
Muller JM, Metzger E, Greschik H, Bosserhoff AK, Mercep L, Buettner R, Schule R (2002) The transcriptional coactivator FHL2 transmits Rho signals from the cell membrane into the nucleus. EMBOJ2V. 736-748
Murdoch WJ, Townsend RS, McDonnel AC (2001) Ovulation-induced DNA damage in ovarian surface epithelial cells of ewes: prospective regulatory mechanisms of repair/survival and apoptosis. Biol Reprod 65: 1417-1424
Myers MP, Stolarov JP, Eng C, Li J, Wang SI, Wigler MH, Parsons R, Tonks NK(1997) P-TEN, the tumor suppressor from human chromosome 10q23, is a dualspecificity phosphatase. Proc Natl Acad Sci U S A 94: 9052-9057
Naidu R, Wahab NA, Yadav M, Kutty MK (2002) Protein expression and molecular analysis of c-myc gene in primary breast carcinomas using immunohistochemistry and differential polymerase chain reaction. Int J Mol Med 9: 189-196
Narod S, Ford D, Devilee P, Barkardottir RB, Eyfjord J, Lenoir G, Serova O, Easton D, Goldgar D (1995a) Genetic heterogeneity of breast-ovarian cancer revisited.Breast Cancer Linkage Consortium. Am J Hum Genet 57: 957-958
Narod SA, Ford D, Devilee P, Barkardottir RB, Lynch HT, Smith SA, Ponder BA,Weber BL, Garber JE, Birch JM ,. (1995b) An evaluation of genetic heterogeneity in 145 breast-ovarian cancer families. Breast Cancer Linkage Consortium. Am J Hum Genet 56: 254-264
Negus RP, Stamp GW, Relf MG, Burke F, Malik ST, Bernasconi S, Allavena P,Sozzani S, Mantovani A, Balkwill FR (1995) The detection and localization of monocyte chemoattractant protein-1 (MCP-1) in human ovarian cancer. J Clin Invest 95: 2391-2396
Nelson AR, Fingleton B, Rothenberg ML, Matrisian LM (2000) Matrix195
metalloproteinases: biologic activity and clinical implications. J Clin Oncol 18: 1135- 1149
Newhouse ML, Pearson RM, Fullerton JM, Boesen EA, Shannon HS (1977) A case control study of carcinoma of the ovary. Br J Prev Soc Med 31: 148-153
Niederacher D, Yan HY, An HX, Bender HG, Beckmann MW (1999) CDKN2A gene inactivation in epithelial sporadic ovarian cancer. BrJ Cancer SO: 1920-1926
Obata K, Hoshiai H (2000) Common genetic changes between endometriosis and ovarian cancer. Gynecol Obstet Invest 50 Suppl 1: 39-43
Okubo K, Hori N, Matoba R, Niiyama T, Fukushima A, Kojima Y, Matsubara K (1992) Large scale cDNA sequencing for analysis of quantitative and qualitative aspects of gene expression. Nat Genet 2: 173-179
Ono K, Tanaka T, Tsunoda T, Kitahara O, Kihara C, Okamoto A, Ochiai K, Takagi T, Nakamura Y (2000) Identification by cDNA microarray of genes involved in ovarian carcinogenesis. Cancer Res 60: 5007-5011
Ooka M, Sakita I, Fujiwara Y, Tamaki Y, Yamamoto H, Aihara T, Miyazaki M, Kadota M, Masuda N, Sugita Y, Iwao K, Monden M (2000) Selection of mRNA markers for detection of lymph node micrometastases in breast cancer patients. Oncol Rep 7: 561-566
Owens OJ, Stewart C, Brown I, Leake RE (1991a) Epidermal growth factor receptors (EGFR) in human ovarian cancer. BrJ Cancer 64: 907-910
Owens OJ, Stewart C, Leake RE (1991b) Growth factors in ovarian cancer. BrJ Cancer 64: 1177-1181
Owens OJ, Stewart C, Leake RE, McNicol AM (1992) A comparison of biochemical and immunohistochemical assessment of EGFR expression in ovarian cancer. Anticancer Res 12: 1455-1458
Ozalp S, Yalcin OT, Gulbas Z, Tanir HM, Minsin T (2001) Effect of cellular DNA content on the prognosis of epithelial ovarian cancers. Gynecol Obstet Invest 52: 93- 97
Paget S (1889) The distribution of secondary growths in cancer of the breast. Lancet 1: 99-101
Paley PJ, Staskus KA, Gebhard K, Mohanraj D, Twiggs LB, Carson LF, Ramakrishnan S (1997) Vascular endothelial growth factor expression in early stage ovarian carcinoma. Cancer 80: 98-106
Parazzini F, Franceschi S, La Vecchia C, Fasoli M (1991) The epidemiology of ovarian cancer. Gynecol Oncol 43: 9-23
Patton SE, Martin ML, Nelsen LL, Fang X, Mills GB, Bast RC, Jr., Ostrowski MC(1998) Activation of the ras-mitogen-activated protein kinase pathway and phosphorylation of ets-2 at position threonine 72 in human ovarian cancer cell lines.
196

Cancer Res 58: 2253-2259
Pennica D, Swanson TA, Welsh JW, Roy MA, Lawrence DA, Lee J, Brush J,Taneyhill LA, Deuel B, Lew M, Watanabe C, Cohen RL, Melhem MF, Finley GG,Quirke P, Goddard AD, Hillan KJ, Gurney AL, Botstein D, Levine AJ (1998) WISP genes are members of the connective tissue growth factor family that are up- regulated in wnt-1-transformed cells and aberrantly expressed in human colon tumors. Proc Natl Acad Sci U S A 95: 14717-14722
Perou CM, Jeffrey SS, van de RM, Rees CA, Eisen MB, Ross DT, Pergamenschikov A, Williams CF, Zhu SX, Lee JC, Lashkari D, Shalon D, Brown PO, Botstein D (1999) Distinctive gene expression patterns in human mammary epithelial cells and breast cancers. Proc Natl Acad Sci U S A 96: 9212-9217
Purdie DM, Bain CJ, Siskind V, Russell P, Hacker NF, Ward BG, Quinn MA, Green AC (1999) Hormone replacement therapy and risk of epithelial ovarian cancer. BrJ Cancer 81: 559-563
Ramaswamy S, Ross KN, Lander ES, Golub TR (2003) A molecular signature of metastasis in primary solid tumors. Nat Genet 33: 49-54
Ramaswamy S, Tamayo P, Rifkin R, Mukherjee S, Yeang CH, Angelo M, Ladd C,Reich M, Latulippe E, Mesirov JP, Poggio T, Gerald W, Loda M, Lander ES, Golub TR (2001) Multiclass cancer diagnosis using tumor gene expression signatures. Proc Natl Acad Sci U S A 98: 15149-15154
Rangel LB, Agarwal R, D'Souza T, Pizer ES, Alo PL, Lancaster WD, Gregoire L, Schwartz DR, Cho KR, Morin PJ (2003) Tight junction proteins claudin-3 and claudin- 4 are frequently overexpressed in ovarian cancer but not in ovarian cystadenomas.Clin Cancer Res 9: 2567-2575
Relaix F, Wei XJ, Wu X, Sassoon DA (1998) Peg3/Pw1 is an imprinted gene involved in the TNF-NFkappaB signal transduction pathway. Nat Genet 18: 287-291
Reles A, Wen WH, Schmider A, Gee C, Runnebaum IB, Kilian U, Jones LA, el Naggar A, Minguillon C, Schonborn I, Reich O, Kreienberg R, Lichtenegger W, Press MF (2001) Correlation of p53 mutations with resistance to platinum-based chemotherapy and shortened survival in ovarian cancer. Clin Cancer Res 7: 2984- 2997
Resnicoff M, Ambrose D, Coppola D, Rubin R (1993) Insulin-like growth factor-1 and its receptor mediate the autocrine proliferation of human ovarian carcinoma cell lines. Lab Invest 69: 756-760
Riman T, Dickman PW, Nilsson S, Correia N, Nordlinder H, Magnusson CM, Weiderpass E, Persson IR (2002) Hormone replacement therapy and the risk of invasive epithelial ovarian cancer in Swedish women. J Natl Cancer Inst 94: 497-504
Risch HA, Howe GR (1995) Pelvic inflammatory disease and the risk of epithelial ovarian cancer. Cancer Epidemiol Biomarkers Prev 4: 447-451
Risch HA, McLaughlin JR, Cole DE, Rosen B, Bradley L, Kwan E, Jack E, Vesprini DJ, Kuperstein G, Abrahamson JL, Fan I, Wong B, Narod SA (2001) Prevalence and
197
penetrance of germline BRCA1 and BRCA2 mutations in a population series of 649 women with ovarian cancer. Am J Hum Genet 68: 700-710
Risinger Jl, Berchuck A, Kohler MF, Boyd J (1994) Mutations of the E-cadherin gene in human gynecologic cancers. Nat Genet 7: 98-102
Rosenblatt KA, Thomas DB (1996) Reduced risk of ovarian cancer in women with a tubal ligation or hysterectomy. The World Health Organization Collaborative Study of Neoplasia and Steroid Contraceptives. Cancer Epidemiol Biomarkers Prev 5: 933- 935
Ross DT, Scherf U, Eisen MB, Perou CM, Rees C, Spellman P, Iyer V, Jeffrey SS, van de RM, Waltham M, Pergamenschikov A, Lee JC, Lashkari D, Shalon D, Myers TG, Weinstein JN, Botstein D, Brown PO (2000) Systematic variation in gene expression patterns in human cancer cell lines. Nat Genet 24: 227-235
Rossing MA, Daling JR, Weiss NS, Moore DE, Self SG (1994) Ovarian tumors in a cohort of infertile women. N Engl J Med 331: 771-776
Rubin SC, Finstad CL, Wong GY, Almadrones L, Plante M, Lloyd KO (1993) Prognostic significance of HER-2/neu expression in advanced epithelial ovarian cancer: a multivariate analysis. Am J Obstet Gynecol 168: 162-169
Ryan A, Al Jehani RM, Mulligan KT, Jacobs IJ (1998) No evidence exists for methylation inactivation of the p16 tumor suppressor gene in ovarian carcinogenesis. Gynecol Oncol 68: 14-17
Salazar H, Godwin AK, Daly MB, Laub PB, Hogan WM, Rosenblum N, Boente MP, Lynch HT, Hamilton TC (1996) Microscopic benign and invasive malignant neoplasms and a cancer-prone phenotype in prophylactic oophorectomies. J Natl Cancer Inst 88: 1810-1820
Sambrook J, Gething MJ (1989) Protein structure. Chaperones, paperones. Nature 342: 224-225
Santin AD, Zhan F, Bellone S, Palmieri M, Cane S, Bignotti E, Anfossi S, Gokden M, Dunn D, Roman JJ, O'Brien TJ, Tian E, Cannon MJ, Shaughnessy J, Jr., Pecorelli S(2004) Gene expression profiles in primary ovarian serous papillary tumors and normal ovarian epithelium: identification of candidate molecular markers for ovarian cancer diagnosis and therapy. Int J Cancer 112: 14-25
Saretzki G, Hoffmann U, Rohlke P, Psille R, Gaigal T, Keller G, Hofler H, Loning T, Petersen I, Dietel M (1997) Identification of allelic losses in benign, borderline, and invasive epithelial ovarian tumors and correlation with clinical outcome. Cancer 80: 1241-1249
Sato K, Qian J, Slezak JM, Lieber MM, Bostwick DG, Bergstralh EJ, Jenkins RB(1999) Clinical significance of alterations of chromosome 8 in high-grade, advanced, nonmetastatic prostate carcinoma. J Natl Cancer Inst 91: 1574-1580
Sawiris GP, Sherman-Baust CA, Becker KG, Cheadle C, Teichberg D, Morin PJ(2002) Development of a highly specialized cDNA array for the study and diagnosis
198

of epithelial ovarian cancer. Cancer Res 62: 2923-2928
Scherf U, Ross DTt Waltham M, Smith LH, Lee JK, Tanabe L, Kohn KW, Reinhold WC, Myers TG, Andrews DT, Scudiero DA, Eisen MB, Sausville EA, Pommier Y, Botstein D, Brown PO, Weinstein JN (2000) A gene expression database for the molecular pharmacology of cancer. Nat Genet 24: 236-244
Schildkraut JM, Bastos E, Berchuck A (1997) Relationship between lifetime ovulatory cycles and overexpression of mutant p53 in epithelial ovarian cancer. J Natl Cancer Inst 89: 932-938
Schueler JA, Trimbos JB, vd BM, Cornelisse CJ, Hermans J, Fleuren GJ (1996) DNA index reflects the biological behavior of ovarian carcinoma stage l-lla. Gynecol Oncol 62: 59-66
Schummer M, Ng WV, Bumgarner RE, Nelson PS, Schummer B, Bednarski DW, Hassell L, Baldwin RL, Karlan BY, Hood L (1999) Comparative hybridization of an array of 21,500 ovarian cDNAs for the discovery of genes overexpressed in ovarian carcinomas. Gene 238: 375-385
Schwab M, Amler LC (1990) Amplification of cellular oncogenes: a predictor of clinical outcome in human cancer. Genes Chromosomes Cancer 1: 181-193
Scotton CJ, Wilson JL, Milliken D, Stamp G, Balkwill FR (2001) Epithelial cancer cell migration: a role for chemokine receptors? Cancer Res 61: 4961-4965
Scully RE (1995) Early de novo ovarian cancer and cancer developing in benign ovarian lesions. IntJ Gynaecol Obstet 49 Suppl: S9-15
Sellar GC, Watt KP, Rabiasz GJ, Stronach EA, Li L, Miller EP, Massie CE, Miller J, Contreras-Moreira B, Scott D, Brown I, Williams AR, Bates PA, Smyth JF, Gabra H(2003) OPCML at 11q25 is epigenetically inactivated and has tumor-suppressor function in epithelial ovarian cancer. Nat Genet 34: 337-343
Session DR, Lee GS, Choi J, Wolgemuth DJ (1999) Expression of cyclin E in gynecologic malignancies. Gynecol Oncol 72: 32-37
Sgroi DC, Teng S, Robinson G, LeVangie R, Hudson JR, Jr., Elkahloun AG (1999) In vivo gene expression profile analysis of human breast cancer progression. Cancer Res 59: 5656-5661
Shay JW (1998)Telomerase in cancer: diagnostic, prognostic, and therapeutic implications. Cancer J Sci Am 4 Suppl 1: S26-S34
Shayesteh L, Lu Y, Kuo WL, Baldocchi R, Godfrey T, Collins C, Pinkel D, Powell B, Mills GB, Gray JW (1999) PIK3CA is implicated as an oncogene in ovarian cancer. Nat Genet 21: 99-102
Shen N, Weiderpass E, Antilla A, Goldberg MS, Vasama-Neuvonen KM, Boffetta P, Vainio HU, Partanen TJ (1998) Epidemiology of occupational and environmental risk factors related to ovarian cancer. Scand J Work Environ Health 24: 175-182
Shetye J, Christensson B, Rubio C, Rodensjo M, Biberfeld P, Mellstedt H (1989) The
199

tumor-associated antigens BR55-2, GA73-3 and GICA 19-9 in normal and corresponding neoplastic human tissues, especially gastrointestinal tissues.Anticancer Res 9: 395-404
Shigemasa K, Tanimoto H, Underwood LJ, ParmleyTH, Arihiro K, Ohama K, O'Brien TJ (2001) Expression of the protease inhibitor antileukoprotease and the serine protease stratum corneum chymotryptic enzyme (SCCE) is coordinated in ovarian tumors. Int J Gynecol Cancer 11: 454-461
Shridhar V, Lee J, Pandita A, Iturria S, Avula R, Staub J, Morrissey M, Calhoun E,Sen A, Kalli K, Keeney G, Roche P, Cliby W, Lu K, Schmandt R, Mills GB, Bast RC,Jr., James CD, Couch FJ, Hartmann LC, Lillie J, Smith D! (2001) Genetic analysis of early- versus late-stage ovarian tumors. Cancer Res 61: 5895-5904
Shu XO, Brinton LA, Gao YT, Yuan JM (1989) Population-based case-control study of ovarian cancer in Shanghai. Cancer Res 49: 3670-3674
Shvartsman HS, Lu KH, Lee J, Lillie J, Deavers MT, Clifford S, Wolf JK, Mills GB,Bast RC, Jr., Gershenson DM, Schmandt R (2003) Overexpression of kallikrein 10 in epithelial ovarian carcinomas. Gynecol Oncol 90: 44-50
Simone G, Falco G, Caponio MA, Campobasso C, De Frenza M, Petroni S, Wiesel S, Leone A (2001) nm23 expression in malignant ascitic effusions of serous ovarian adenocarcinoma. Int J Oncol 19: 885-890
Simone NL, Bonner RF, Gillespie JW, Emmert-Buck MR, Liotta LA (1998) Laser- capture microdissection: opening the microscopic frontier to molecular analysis.Trends Genet 14: 272-276
Singh D, Febbo PG, Ross K, Jackson DG, Manola J, Ladd C, Tamayo P, Renshaw AA, D'Amico AV, Richie JP, Lander ES, Loda M, Kantoff PW, Golub TR, Sellers WR (2002) Gene expression correlates of clinical prostate cancer behavior. Cancer Cell 1: 203-209
Skates SJ, Xu FJ, Yu YH, Sjovall K, Einhorn N, Chang Y, Bast RC, Jr., Knapp RC(1995) Toward an optimal algorithm for ovarian cancer screening with longitudinal tumor markers. Cancer 76: 2004-2010
Skirnisdottir I, Sorbe B, Karlsson M, Seidal T (2001) Prognostic importance of DNA ploidy and p53 in early stages of epithelial ovarian carcinoma. Int J Oncol 19: 1295- 1302
Sorlie T, Perou CM, Tibshirani R, Aas T, Geisler S, Johnsen H, Hastie T, Eisen MB, van de RM, Jeffrey SS, Thorsen T, Quist H, Matese JC, Brown PO, Botstein D,Eystein LP, Borresen-Dale AL (2001) Gene expression patterns of breast carcinomas distinguish tumor subclasses with clinical implications. Proc Natl Acad Sci U S A 98: 10869-10874
Stacker SA, Caesar C, Baldwin ME, Thornton GE, Williams RA, Prevo R, Jackson DG, Nishikawa S, Kubo H, Achen MG (2001) VEGF-D promotes the metastatic spread of tumor cells via the lymphatics. Nat Med 7: 186-191
Steichen-Gersdorf E, Gallion HH, Ford D, Girodet C, Easton DF, DiCioccio RA,200

Evans G, Ponder MA, Pye C, Mazoyer S ,. (1994) Familial site-specific ovarian cancer is linked to BRCA1 on 17q12-21. Am J Hum Genet 55: 870-875
Steinbach D, Hermann J, Viehmann S, Zintl F, Gruhn B (2002) Clinical implications of PRAME gene expression in childhood acute myeloid leukemia. Cancer Genet Cytogenet 133: 118-123
Stephan C, Yousef GM, Scorilas A, Jung K, Jung M, Kristiansen G, Hauptmann S, Kishi T, Nakamura T, Loening SA, Diamandis EP (2004) Hepsin is highly over expressed in and a new candidate for a prognostic indicator in prostate cancer. J UrolMV. 187-191
Stratton JF, Thompson D, Bobrow L, Dalai N, Gore M, Bishop DT, Scott I, Evans G, Daly P, Easton DF, Ponder BA (1999) The genetic epidemiology of early-onset epithelial ovarian cancer a population-based study. Am J Hum Genet 65: 1725-1732
Stromberg K, Johnson GR, O'Connor DM, Sorensen CM, Gullick WJ, Kannan B(1994) Frequent immunohistochemical detection of EGF supergene family members in ovarian carcinogenesis. Int J Gynecol Pathol 13: 342-347
Struewing JP, Hartge P, Wacholder S, Baker SM, Berlin M, McAdams M,Timmerman MM, Brody LC, Tucker MA (1997) The risk of cancer associated with specific mutations of BRCA1 and BRCA2 among Ashkenazi Jews. N Engl J Med 336: 1401-1408
Su Al, Cooke MP, Ching KA, Hakak Y, Walker JR, Wiltshire T, Orth AP, Vega RG, Sapinoso LM, Moqrich A, Patapoutian A, Hampton GM, Schultz PG, Hogenesch JB (2002) Large-scale analysis of the human and mouse transcriptomes. Proc Natl Acad SciUSA 99: 4465-4470
Su Al, Welsh JB, Sapinoso LM, Kern SG, Dimitrov P, Lapp H, Schultz PG, Powell SM, Moskaluk CA, Frierson HF, Jr., Hampton GM (2001) Molecular classification of human carcinomas by use of gene expression signatures. Cancer Res 61: 7388- 7393
Sundfeldt K, Piontkewitz Y, Ivarsson K, Nilsson O, Hellberg P, Brannstrom M,Janson PO, Enerback S, Hedin L (1997) E-cadherin expression in human epithelial ovarian cancer and normal ovary. Int J Cancer 74: 275-280
Suzuki M, Ohwada M, Sato I, Nagatomo M (1995) Serum level of macrophage colony-stimulating factor as a marker for gynecologic malignancies. Oncology 52: 128-133
Szala S, Froehlich M, Scollon M, Kasai Y, Steplewski Z, Koprowski H, Linnenbach AJ (1990) Molecular cloning of cDNAfor the carcinoma-associated antigen GA733-2. Proc Natl Acad Sci U S A 87: 3542-3546
Tai YT, Lee S, Niloff E, Weisman C, Strobel T, Cannistra SA (1998) BAX protein expression and clinical outcome in epithelial ovarian cancer. J Clin Oncol 16: 2583- 2590
Tamayo P, Slonim D, Mesirov J, Zhu Q, Kitareewan S, Dmitrovsky E, Lander ES,Golub TR (1999) Interpreting patterns of gene expression with self-organizing maps:
201
methods and application to hematopoietic differentiation. Proc Natl Acad Sci USA 96: 2907-2912
Tamura M, Gu J, Takino T, Yamada KM (1999a) Tumor suppressor PTEN inhibition of cell invasion, migration, and growth: differential involvement of focal adhesion kinase and p130Cas. Cancer Res 59: 442-449
Tamura M, Gu J, Tran H, Yamada KM (1999b) PTEN gene and integrin signaling in cancer. J Natl Cancer Inst 91: 1820-1828
Tanimoto H, Yan Y, Clarke J, Korourian S, Shigemasa K, Parmley TH, Parham GP, O'Brien TJ (1997) Hepsin, a cell surface serine protease identified in hepatoma cells, is overexpressed in ovarian cancer. Cancer Res 57: 2884-2887
Tapper J, Kettunen E, El Rifai W, Seppala M, Andersson LC, Knuutila S (2001) Changes in gene expression during progression of ovarian carcinoma. Cancer Genet Cytogenet 128: 1-6
Tas F, Tuzlali S, Aydiner A, Saip P, Salihoglu Y, Iplikci A, Topuz E (2002) Prognostic role of nm23 gene expression in patients with ovarian cancer. Am J Clin Oncol 25: 164-167
Tavassoli M, Steingrimsdottir H, Pierce E, Jiang X, Alagoz M, Farzaneh F, Campbell IG (1996) Loss of heterozygosity on chromosome 5q in ovarian cancer is frequently accompanied by TP53 mutation and identifies a tumour suppressor gene locus at 5q13.1-21. BrJ Cancer 74: 115-119
Tavazoie S, Hughes JD, Campbell MJ, Cho RJ, Church GM (1999) Systematic determination of genetic network architecture. Nat Genet 22: 281-285
Tonin PN, Hudson TJ, Rodier F, Bossolasco M, Lee PD, Novak J, Manderson EN, Provencher D, Mes-Masson AM (2001) Microarray analysis of gene expression mirrors the biology of an ovarian cancer model. Oncogene 20: 6617-6626
Tsuda H, Takarabe T, Hasegawa F, Fukutomi T, Hirohashi S (2000) Large, central acellular zones indicating myoepithelial tumor differentiation in high-grade invasive ductal carcinomas as markers of predisposition to lung and brain metastases. Am J Surg Pathol 24: 197-202
Tung KH, Wilkens LR, Wu AH, McDuffie K, Nomura AM, Kolonel LN, Terada KY, Goodman MT (2005) Effect of anovulation factors on pre- and postmenopausal ovarian cancer risk: revisiting the incessant ovulation hypothesis. Am J Epidemiol 161: 321-329
Ueda M, Terai Y, Kumagai K, Ueki K, Yamaguchi H, Akise D, Ueki M (2001)Vascular endothelial growth factor C gene expression is closely related to invasion phenotype in gynecological tumor cells. Gynecol Oncol 82: 162-166
van Dam PA, Vergote IB, Lowe DG, Watson JV, van Damme P, van der Auwera JC, Shepherd JH (1994) Expression of c-erbB-2, c-myc, and c-ras oncoproteins, insulinlike growth factor receptor I, and epidermal growth factor receptor in ovarian carcinoma. J Clin Pathol 47: 914-919
202
van der Burg ME, Henzen-Logmans SC, Berns EM, van Putten WL, Klijn JG, Foekens JA (1996) Expression of urokinase-type plasminogen activator (uPA) and its inhibitor PAI-1 in benign, borderline, malignant primary and metastatic ovarian tumors. Int J Cancer 69: 475-479
van NJ, Jr., DePriest PD, Puls LE, Donaldson ES, Gallion HH, Pavlik EJ, Powell DE, Kryscio RJ (1991) Ovarian cancer screening in asymptomatic postmenopausal women by transvaginal sonography. Cancer 68: 458-462
van NJ, Jr., DePriest PD, Reedy MB, Gallion HH, Ueland FR, Pavlik EJ, Kryscio RJ(2000) The efficacy of transvaginal sonographic screening in asymptomatic women at risk for ovarian cancer. Gynecol Oncol 77: 350-356
van NJ, Jr., Higgins RV, Donaldson ES, Gallion HH, Powell DE, Pavlik EJ, Woods CH, Thompson EA (1990) Transvaginal sonography as a screening method for ovarian cancer. A report of the first 1000 cases screened. Cancer 65: 573-577
Varambally S, Dhanasekaran SM, Zhou M, Barrette TR, Kumar-Sinha C, Sanda MG, Ghosh D, Pienta KJ, Sewalt RG, Otte AP, Rubin MA, Chinnaiyan AM (2002) The polycomb group protein EZH2 is involved in progression of prostate cancer. Nature 419: 624-629
Velculescu VE, Zhang L, Vogelstein B, Kinzler KW (1995) Serial analysis of gene expression. Science 270: 484-487
Venn A, Watson L, Bruinsma F, Giles G, Healy D (1999) Risk of cancer after use of fertility drugs with in-vitro fertilisation. Lancet 354: 1586-1590
Venter PF (1981) Ovarian epithelial cancer and chemical carcinogenesis. Gynecol Oncol 12: 281-285
Verschraegen CF, Hu W, Du Y, Mendoza J, Early J, Deavers M, Freedman RS, Bast RC, Jr., Kudelka AP, Kavanagh JJ, Giovanella BC (2003) Establishment and characterization of cancer cell cultures and xenografts derived from primary or metastatic Mullerian cancers. Clin Cancer Res 9: 845-852
Versnel MA, Haarbrink M, Langerak AW, de Laat PA, Hagemeijer A, van der Kwast TH, van den Berg-Bakker LA, Schrier PI (1994) Human ovarian tumors of epithelial origin express PDGF in vitro and in vivo. Cancer Genet Cytogenet 73: 60-64
Vessey MP, Painter R (1995) Endometrial and ovarian cancer and oral contraceptives-findings in a large cohort study. BrJ Cancer 71: 1340-1342
Wan M, Li WZ, Duggan BD, Felix JC, Zhao Y, Dubeau L (1997)Telomerase activity in benign and malignant epithelial ovarian tumors. J Natl Cancer Inst 89: 437-441
Wang J, Mes-Masson AM, Tonin PN, Provencher D, Eydoux P (2000) Trisomy of chromosome 10 in two cases of ovarian carcinoma. Cancer Genet Cytogenet 118: 65-68
Wang K, Gan L, Jeffery E, Gayle M, Gown AM, Skelly M, Nelson PS, Ng WV, Schummer M, Hood L, Mulligan J (1999) Monitoring gene expression profile changes
203
in ovarian carcinomas using cDNA microarray. Gene 229: 101-108
Watson MA, Darrow C, Zimonjic DB, Popescu NC, Fleming TP (1998) Structure and transcriptional regulation of the human mammaglobin gene, a breast cancer associated member of the uteroglobin gene family localized to chromosome 11 q13. Oncogene 16: 817-824
Watson MA, Fleming TP (1996) Mammaglobin, a mammary-specific member of the uteroglobin gene family, is overexpressed in human breast cancer. Cancer Res 56: 860-865
Webb PM, Green A, Cummings MC, Purdie DM, Walsh MD, Chenevix-Trench G(1998) Relationship between number of ovulatory cycles and accumulation of mutant p53 in epithelial ovarian cancer. J Natl Cancer Inst 90: 1729-1734
Wehner AP (2002) Cosmetic talc should not be listed as a carcinogen: comments on NTP's deliberations to list talc as a carcinogen. Regul Toxicol Pharmacol 36: 40-50
Weigang B, Nap M, Bittl A, Jaeger W (1994) Immunohistochemical localization of insulin-like growth factor 1 receptors in benign and malignant tissues of the female genital tract. Tumour Biol 15: 236-246
Welsh JB, Zarrinkar PP, Sapinoso LM, Kern SG, Behling CA, Monk BJ, Lockhart DJ, Burger RA, Hampton GM (2001) Analysis of gene expression profiles in normal and neoplastic ovarian tissue samples identifies candidate molecular markers of epithelial ovarian cancer. Proc Natl Acad Sci U S A 98: 1176-1181
Wen X, Fuhrman S, Michaels GS, Carr DB, Smith S, Barker JL, Somogyi R (1998) Large-scale temporal gene expression mapping of central nervous system development. Proc Natl Acad Sci U S A 95: 334-339
Whittemore AS, Gong G, Itnyre J (1997) Prevalence and contribution of BRCA1 mutations in breast cancer and ovarian cancer: results from three U.S. population- based case-control studies of ovarian cancer. Am J Hum Genet 60: 496-504
Whittemore AS, Harris R, Itnyre J (1992) Characteristics relating to ovarian cancer risk: collaborative analysis of 12 US case-control studies. II. Invasive epithelial ovarian cancers in white women. Collaborative Ovarian Cancer Group. Am J Epidemiol 136: 1184-1203
Whittemore AS, Wu ML, Paffenbarger RS, Jr., Sarles DL, Kampert JB, Grosser S, Jung DL, Ballon S, Hendrickson M, Mohle-Boetani J (1989) Epithelial ovarian cancer and the ability to conceive. Cancer Res 49: 4047-4052
Wong C, Hempling RE, Piver MS, Natarajan N, Mettlin CJ (1999) Perineal talc exposure and subsequent epithelial ovarian cancer: a case-control study. Obstet Gynecol 93: 372-376
Wright K, Wilson P, Morland S, Campbell I, Walsh M, Hurst T, Ward B, Cummings M, Chenevix-Trench G (1999) beta-catenin mutation and expression analysis in ovarian cancer: exon 3 mutations and nuclear translocation in 16% of endometrioid tumours. Int J Cancer 82: 625-629
204
Wu R, Lin L, Beer DG, Ellenson LH, Lamb BJ, Rouillard JM, Kuick R, Hanash S, Schwartz DR, Fearon ER, Cho KR (2003) Amplification and overexpression of the L- MYC proto-oncogene in ovarian carcinomas. Am J Pathol 162: 1603-1610
Wyllie AH, Kerr JF, Currie AR (1980) Cell death: the significance of apoptosis. Int Rev Cytol 68: 251-306
Xu F, Yu Y, Le XF, Boyer C, Mills GB, Bast RC, Jr. (1999) The outcome of heregulin- induced activation of ovarian cancer cells depends on the relative levels of HER-2 and HER-3 expression. Clin Cancer Res 5: 3653-3660
Xu FJ, Stack S, Boyer C, O'Briant K, Whitaker R, Mills GB, Yu YH, Bast RC, Jr.(1997) Heregulin and agonistic anti-p185(c-erbB2) antibodies inhibit proliferation but increase invasiveness of breast cancer cells that overexpress p185(c-erbB2): increased invasiveness may contribute to poor prognosis. Clin Cancer Res 3: 1629- 1634
Xu Y, Shen Z, Wiper DW, Wu M, Morton RE, Elson P, Kennedy AW, Belinson J, Markman M, Casey G (1998) Lysophosphatidic acid as a potential biomarker for ovarian and other gynecologic cancers. JAMA 280: 719-723
Yang-Feng TL, Li S, Han H, Schwartz PE (1992) Frequent loss of heterozygosity on chromosomes Xp and 13q in human ovarian cancer. Int J Cancer 52: 575-580
Yiu GK, Chan WY, Ng SW, Chan PS, Cheung KK, Berkowitz RS, Mok SC (2001) SPARC (secreted protein acidic and rich in cysteine) induces apoptosis in ovarian cancer cells. Am J Pathol 159: 609-622
Yokoyama Y, Charnock-Jones DS, Licence D, Yanaihara A, Hastings JM, Holland CM, Emoto M, Umemoto M, Sakamoto T, Sato S, Mizunuma H, Smith SK (2003) Vascular endothelial growth factor-D is an independent prognostic factor in epithelial ovarian carcinoma. BrJ Cancer 88: 237-244
Young TN, Rodriguez GC, Rinehart AR, Bast RC, Jr., Pizzo SV, Stack MS (1996) Characterization of gelatinases linked to extracellular matrix invasion in ovarian adenocarcinoma: purification of matrix metalloproteinase 2. Gynecol Oncol 62: 89-99
Yu D, Wolf JK, Scanlon M, Price JE, Hung MC (1993) Enhanced c-erbB-2/neu expression in human ovarian cancer cells correlates with more severe malignancy that can be suppressed by E1A. Cancer Res 53: 891-898
Yu Y, Xu F, Peng H, Fang X, Zhao S, Li Y, Cuevas B, Kuo WL, Gray JW, Siciliano M, Mills GB, Bast RC, Jr. (1999) NOEY2 (ARHI), an imprinted putative tumor suppressor gene in ovarian and breast carcinomas. Proc Natl Acad Sci U S A 96: 214-219
Zembutsu H, Ohnishi Y, Tsunoda T, Furukawa Y, Katagiri T, Ueyama Y, Tamaoki N, Nomura T, Kitahara O, Yanagawa R, Hirata K, Nakamura Y (2002) Genome-wide cDNA microarray screening to correlate gene expression profiles with sensitivity of 85 human cancer xenografts to anticancer drugs. Cancer Res 62: 518-527
Zenklusen JC, Weitzel JN, Ball HG, Conti CJ (1995) Allelic loss at 7q31.1 in human primary ovarian carcinomas suggests the existence of a tumor suppressor gene.
205

Oncogene 11: 359-363
Zhou Y, Gwadry FG, Reinhold WC, Miller LD, Smith LH, Scherf U, Liu ET, Kohn KW, Pommier Y, Weinstein JN (2002) Transcriptional regulation of mitotic genes by camptothecin-induced DNA damage: microarray analysis of dose- and time- dependent effects. Cancer Res 62: 1688-1695
Zurawski VR, Jr., Orjaseter H, Andersen A, Jellum E (1988) Elevated serum CA 125 levels prior to diagnosis of ovarian neoplasia: relevance for early detection of ovarian cancer. Int J Cancer 42: 677-680
Related Documents