BioMed Central Page 1 of 15 (page number not for citation purposes) BMC Genomics Open Access Research article Gene expression profiling of human mesenchymal stem cells derived from bone marrow during expansion and osteoblast differentiation Birgit Kulterer 1 , Gerald Friedl 2 , Anita Jandrositz 3 , Fatima Sanchez-Cabo 1 , Andreas Prokesch 1 , Christine Paar 1 , Marcel Scheideler 1 , Reinhard Windhager 2 , Karl-Heinz Preisegger 3 and Zlatko Trajanoski* 1 Address: 1 Institute for Genomics and Bioinformatics and Christian-Doppler Laboratory for Genomics and Bioinformatics, Graz University of Technology, Graz, Austria, 2 Department of Orthopaedics, Medical University of Graz, Graz, Austria and 3 Eccocell Biotechnology Inc., Graz, Austria Email: Birgit Kulterer - [email protected]; Gerald Friedl - [email protected]; Anita Jandrositz - [email protected]; Fatima Sanchez-Cabo - [email protected]; Andreas Prokesch - [email protected]; Christine Paar - [email protected]; Marcel Scheideler - [email protected]; Reinhard Windhager - [email protected]; Karl-Heinz Preisegger - karl- [email protected]; Zlatko Trajanoski* - [email protected] * Corresponding author Abstract Background: Human mesenchymal stem cells (MSC) with the capacity to differentiate into osteoblasts provide potential for the development of novel treatment strategies, such as improved healing of large bone defects. However, their low frequency in bone marrow necessitate ex vivo expansion for further clinical application. In this study we asked if MSC are developing in an aberrant or unwanted way during ex vivo long-term cultivation and if artificial cultivation conditions exert any influence on their stem cell maintenance. To address this question we first developed human oligonucleotide microarrays with 30.000 elements and then performed large-scale expression profiling of long-term expanded MSC and MSC during differentiation into osteoblasts. Results: The results showed that MSC did not alter their osteogenic differentiation capacity, surface marker profile, and the expression profiles of MSC during expansion. Microarray analysis of MSC during osteogenic differentiation identified three candidate genes for further examination and functional analysis: ID4, CRYAB, and SORT1. Additionally, we were able to reconstruct the three developmental phases during osteoblast differentiation: proliferation, matrix maturation, and mineralization, and illustrate the activation of the SMAD signaling pathways by TGF-β2 and BMPs. Conclusion: With a variety of assays we could show that MSC represent a cell population which can be expanded for therapeutic applications. Background In recent years mesenchymal stem cells (MSC) have gen- erated a great deal of interest as a potential source for cell- based therapeutic strategies. Human MSC are easy to iso- late from small aspirate of bone marrow via their adher- ence ability. These cells readily generate single-cell- derived colonies that can be highly expanded and differ- entiated into a variety of cell types, such as osteoblasts Published: 12 March 2007 BMC Genomics 2007, 8:70 doi:10.1186/1471-2164-8-70 Received: 1 August 2006 Accepted: 12 March 2007 This article is available from: http://www.biomedcentral.com/1471-2164/8/70 © 2007 Kulterer et al; licensee BioMed Central Ltd. This is an Open Access article distributed under the terms of the Creative Commons Attribution License (http://creativecommons.org/licenses/by/2.0 ), which permits unrestricted use, distribution, and reproduction in any medium, provided the original work is properly cited.

Welcome message from author
This document is posted to help you gain knowledge. Please leave a comment to let me know what you think about it! Share it to your friends and learn new things together.
Transcript
BioMed CentralBMC Genomics
ss
Open AcceResearch articleGene expression profiling of human mesenchymal stem cells derived from bone marrow during expansion and osteoblast differentiationBirgit Kulterer1, Gerald Friedl2, Anita Jandrositz3, Fatima Sanchez-Cabo1, Andreas Prokesch1, Christine Paar1, Marcel Scheideler1, Reinhard Windhager2, Karl-Heinz Preisegger3 and Zlatko Trajanoski*1Address: 1Institute for Genomics and Bioinformatics and Christian-Doppler Laboratory for Genomics and Bioinformatics, Graz University of Technology, Graz, Austria, 2Department of Orthopaedics, Medical University of Graz, Graz, Austria and 3Eccocell Biotechnology Inc., Graz, Austria
Email: Birgit Kulterer - [email protected]; Gerald Friedl - [email protected]; Anita Jandrositz - [email protected]; Fatima Sanchez-Cabo - [email protected]; Andreas Prokesch - [email protected]; Christine Paar - [email protected]; Marcel Scheideler - [email protected]; Reinhard Windhager - [email protected]; Karl-Heinz Preisegger - [email protected]; Zlatko Trajanoski* - [email protected]
* Corresponding author
AbstractBackground: Human mesenchymal stem cells (MSC) with the capacity to differentiate intoosteoblasts provide potential for the development of novel treatment strategies, such as improvedhealing of large bone defects. However, their low frequency in bone marrow necessitate ex vivoexpansion for further clinical application. In this study we asked if MSC are developing in anaberrant or unwanted way during ex vivo long-term cultivation and if artificial cultivation conditionsexert any influence on their stem cell maintenance. To address this question we first developedhuman oligonucleotide microarrays with 30.000 elements and then performed large-scaleexpression profiling of long-term expanded MSC and MSC during differentiation into osteoblasts.
Results: The results showed that MSC did not alter their osteogenic differentiation capacity,surface marker profile, and the expression profiles of MSC during expansion. Microarray analysisof MSC during osteogenic differentiation identified three candidate genes for further examinationand functional analysis: ID4, CRYAB, and SORT1. Additionally, we were able to reconstruct thethree developmental phases during osteoblast differentiation: proliferation, matrix maturation, andmineralization, and illustrate the activation of the SMAD signaling pathways by TGF-β2 and BMPs.
Conclusion: With a variety of assays we could show that MSC represent a cell population whichcan be expanded for therapeutic applications.
BackgroundIn recent years mesenchymal stem cells (MSC) have gen-erated a great deal of interest as a potential source for cell-based therapeutic strategies. Human MSC are easy to iso-
late from small aspirate of bone marrow via their adher-ence ability. These cells readily generate single-cell-derived colonies that can be highly expanded and differ-entiated into a variety of cell types, such as osteoblasts
Published: 12 March 2007
BMC Genomics 2007, 8:70 doi:10.1186/1471-2164-8-70
Received: 1 August 2006Accepted: 12 March 2007
This article is available from: http://www.biomedcentral.com/1471-2164/8/70
© 2007 Kulterer et al; licensee BioMed Central Ltd. This is an Open Access article distributed under the terms of the Creative Commons Attribution License (http://creativecommons.org/licenses/by/2.0), which permits unrestricted use, distribution, and reproduction in any medium, provided the original work is properly cited.
Page 1 of 15(page number not for citation purposes)
BMC Genomics 2007, 8:70 http://www.biomedcentral.com/1471-2164/8/70
[1,2], adipocytes [3], myocytes [4], astrocytes and neurons[5,6]. Further, human MSC can improve cardiac functionafter infarction [7,8] or symptoms of bone and cartilagedefects [9-13], as well as neurodegenerative diseases suchas Alzheimer's [14-16]. Their efficiency in multiple typesof cellular therapeutic strategies has been demonstrated,including applications in treating children with osteogene-sis imperfecta [17], hematopoietic recovery [18], and bonetissue regeneration [19,20]. Also first preclinical trails arein progress to test their capacity and toxicity in applica-tions for human treatment [21].
One great advantage of MSC is that these cells may bedirectly obtained from individual patients, thereby elimi-nating the complications associated with immune rejec-tion of allogenic tissue and infectious diseases. However,for cell therapies MSC have to be expanded and/or manip-ulated to obtain a sufficient amount of cells that can besubsequently used for treatment. Despite growing experi-ence and knowledge concerning human MSC and theiruse in cell-based strategies, the molecular mechanismsthat govern MSC self-renewal, expansion and multiline-age differentiation are not well understood and remain anactive area of investigation.
In this study we asked if human MSC are developing in anaberrant or unwanted way during ex vivo long-term culti-vation and if cultivation conditions exert any influence ontheir stem cell maintenance. To address this question sys-tematically and comprehensively we first developedhuman oligonucleotide microarrays with 30.000 ele-ments and then performed large-scale expression profil-ing of long-term expanded MSC isolated from clinicallyrelevant samples. We monitored these cells during theirexpansion ex vivo with respect to proliferation kinetics,surface marker profile and differentiation potential.Finally we analyzed the gene expression profiles of MSCduring osteogenic differentiation. Our results showed thatexpansion of MSC does not result in substantial geneticand morphological aberrations. We illustrated for the firsttime in a human model the three main stages of osteo-genic development, and we could show the diverse regu-lation of the SMAD pathways by TGF-β2 and BMPs.
ResultsHuman MSC maintain their undifferentiated phenotype during long-term expansionThe results of the ex vivo long-term expansion experimentsshowed that the undifferentiated phenotype of MSCs ismaintained with respect to differentiation potential, sur-face marker profile and gene expression profiles. At con-fluence of 75–85% the cultivated cells were detached andflow cytometry analysis were performed to verify thepurity of the cell population without any contaminations,such as haematopoietic cells. Following surface marker
profile were detected: CD44+, CD90+, CD73+, CD105+,CD166+, CD11b-, CD34-, CD45-, CD117-, HLA DR-. Forthe subsequent experiments MSCs were expanded untilthe end of the tenth passage. At the end of each passagethe cells were analyzed by flow cytometry and a cell aliq-uot was seeded out for testing their differentiation ability.
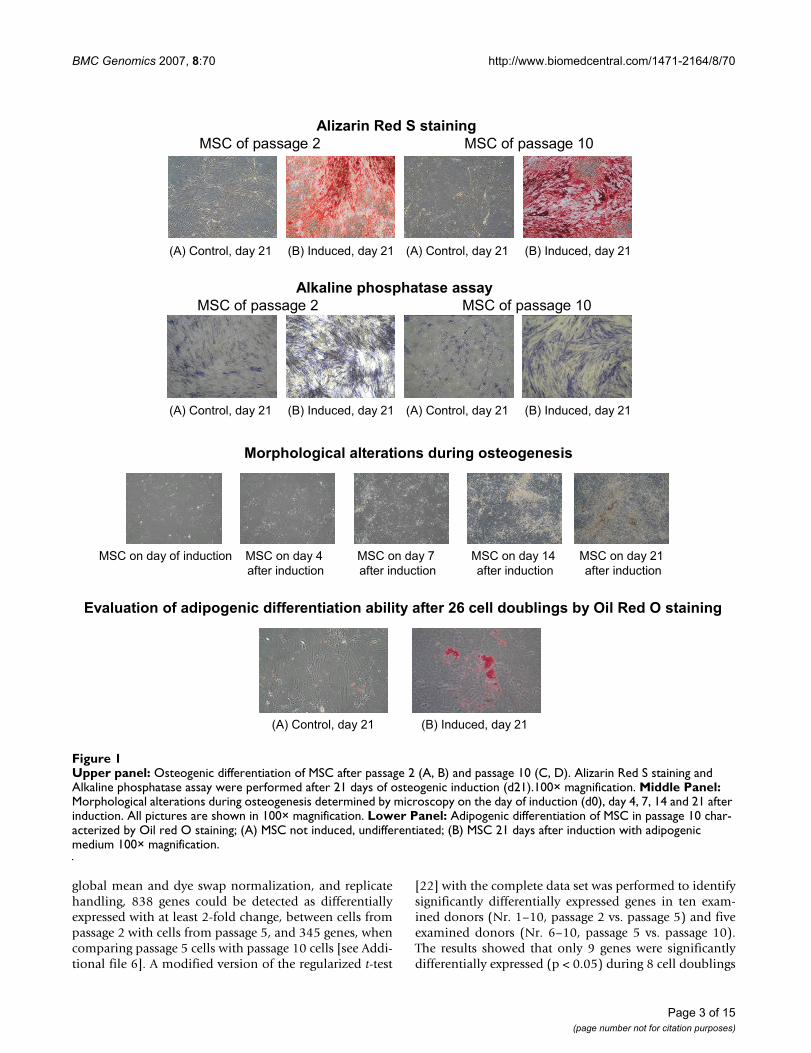
Proliferation kinetics and differentiation potentialThe growth kinetics of five donors was investigated fromthe primary culture through the tenth passage, corre-sponding to approximately 26 cell doublings. For recalcu-lating the starting number of MSC in the MNC fraction,CFU assays were performed and the MSC frequency wasdetermined. Primary cultures reached their first conflu-ence from around 80% in about 2 weeks and about 10 celldoublings. During the following passages the prolifera-tion rate slowed down. During the whole expansionperiod – starting with passage two until passage ten – inevery passage the osteogenic differentiation ability wastested. The osteogenic differentiation was confirmed byAlizarin Red S staining and Alkaline Phosphatase assay.Throughout this examination period differentiation abil-ity into osteoblasts was observed in low passages (passage2, after 12 cell doublings) as well as in a higher passage(passage 10, after 26 cell doublings), (Figure 1). MSCexpanded to approximately 26 cell doublings were able todifferentiate into adipocytes (Figure 1).
Surface marker profileAfter the cultivation of MSC from the mononuclear cellfraction (passage 0) and at the end of each individual pas-sage, the MSC were analyzed by flow cytometry to moni-tor the surface marker profile during their ex vivoexpansion. Each investigated passage depicted homoge-nous cell population demonstrating that MSC did notalter their physical and morphological properties duringhigh grade ex vivo expansion under the culture conditionstested [see Additional file 1]. In addition to the examina-tion of the surface marker profile, we also performed Real-time RT-PCR Sybr™ Green I assays for stem cell specificgenes. The examined stem cell markers, CD44, CD73,CD166, CD105, CD90 and STRO1 showed stable expres-sion level during the whole expansion period proving theresults obtained by FACS analyses. As expected, CD34,CD45 and TERT could not be detected on any examinedtime point [see Additional file 2].
Large-scale gene expression profiling of MSC during ex vivo expansionIn order to monitor the molecular events that govern theex vivo expansion of undifferentiated MSC we performedlarge-scale gene expression profiling using oligonucle-otide microarrays with 29952 elements (ArrayExpress,accession numbers A-MARS-2, E-MARS-5, and E-MARS-6,[see Additional file 3, 4, 5]). After background correction,
Page 2 of 15(page number not for citation purposes)
BMC Genomics 2007, 8:70 http://www.biomedcentral.com/1471-2164/8/70
global mean and dye swap normalization, and replicatehandling, 838 genes could be detected as differentiallyexpressed with at least 2-fold change, between cells frompassage 2 with cells from passage 5, and 345 genes, whencomparing passage 5 cells with passage 10 cells [see Addi-tional file 6]. A modified version of the regularized t-test
[22] with the complete data set was performed to identifysignificantly differentially expressed genes in ten exam-ined donors (Nr. 1–10, passage 2 vs. passage 5) and fiveexamined donors (Nr. 6–10, passage 5 vs. passage 10).The results showed that only 9 genes were significantlydifferentially expressed (p < 0.05) during 8 cell doublings
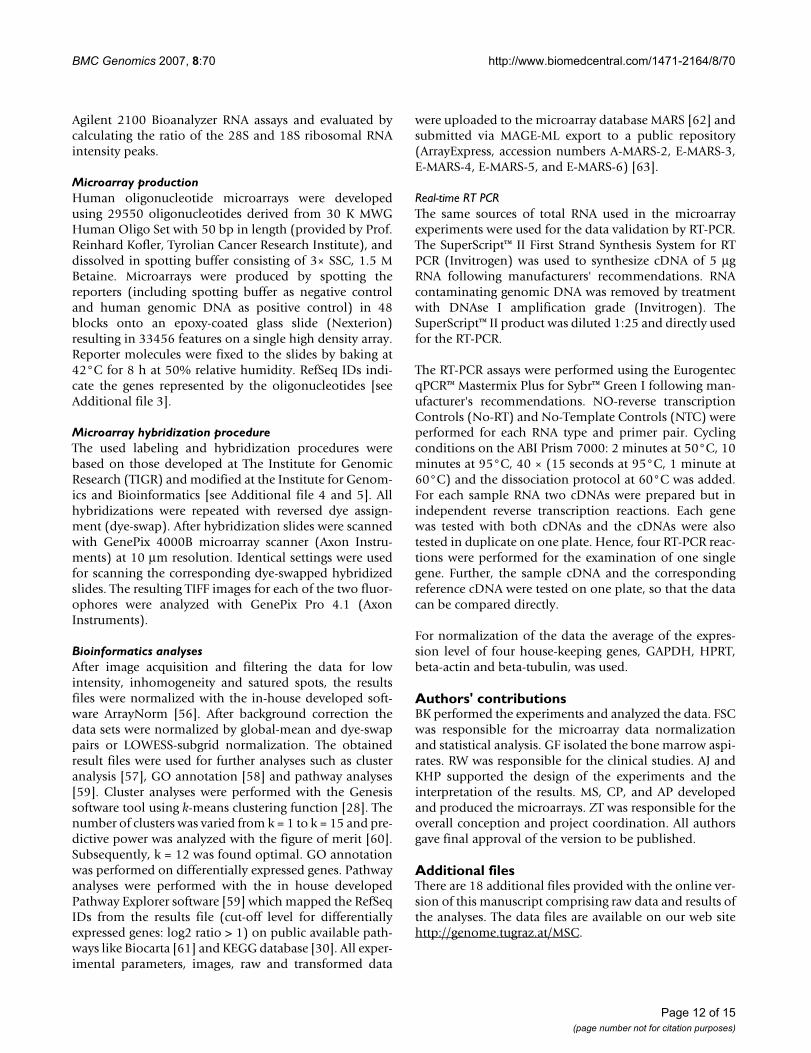
Upper panel: Osteogenic differentiation of MSC after passage 2 (A, B) and passage 10 (C, D)Figure 1Upper panel: Osteogenic differentiation of MSC after passage 2 (A, B) and passage 10 (C, D). Alizarin Red S staining and Alkaline phosphatase assay were performed after 21 days of osteogenic induction (d21).100× magnification. Middle Panel: Morphological alterations during osteogenesis determined by microscopy on the day of induction (d0), day 4, 7, 14 and 21 after induction. All pictures are shown in 100× magnification. Lower Panel: Adipogenic differentiation of MSC in passage 10 char-acterized by Oil red O staining; (A) MSC not induced, undifferentiated; (B) MSC 21 days after induction with adipogenic medium 100× magnification.
Alizarin Red S staining
MSC of passage 2 MSC of passage 10
Alkaline phosphatase assay
MSC of passage 2 MSC of passage 10
Morphological alterations during osteogenesis
Evaluation of adipogenic differentiation ability after 26 cell doublings by Oil Red O staining
MSC on day of induction MSC on day 4
after induction
MSC on day 7
after induction
MSC on day 14
after induction
MSC on day 21
after induction
(A) Control, day 21 (B) Induced, day 21
(A) Control, day 21 (B) Induced, day 21 (A) Control, day 21 (B) Induced, day 21
(A) Control, day 21 (B) Induced, day 21 (A) Control, day 21 (B) Induced, day 21
Page 3 of 15(page number not for citation purposes)
BMC Genomics 2007, 8:70 http://www.biomedcentral.com/1471-2164/8/70
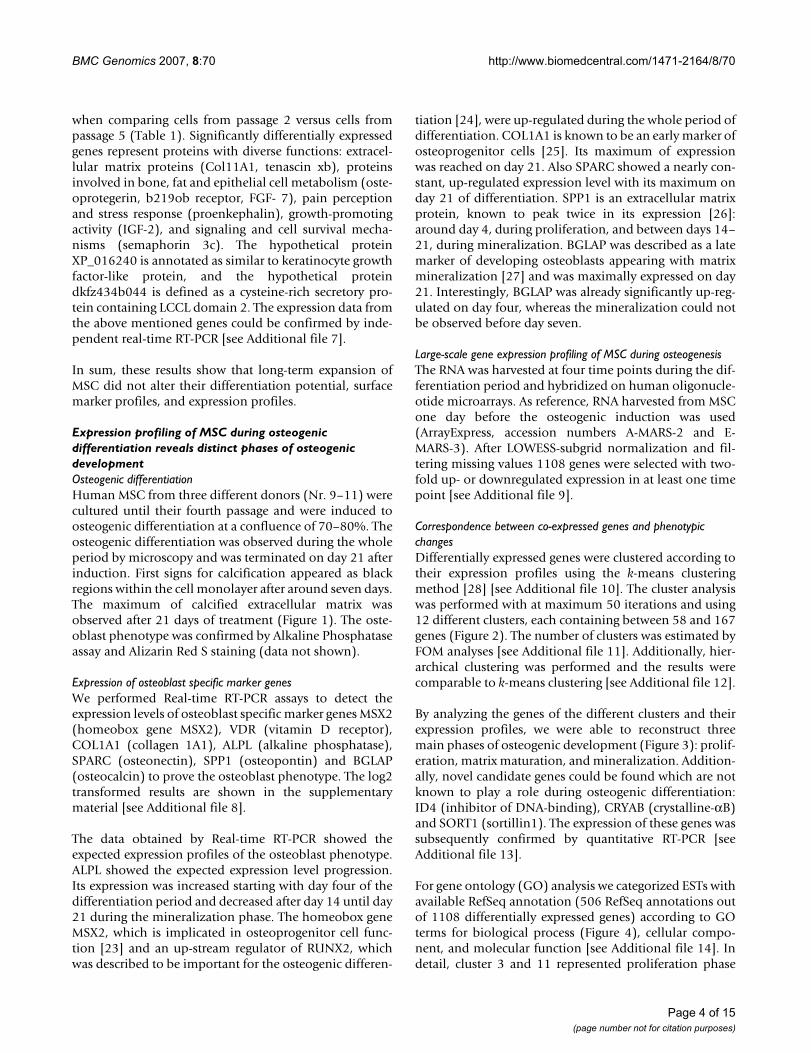
when comparing cells from passage 2 versus cells frompassage 5 (Table 1). Significantly differentially expressedgenes represent proteins with diverse functions: extracel-lular matrix proteins (Col11A1, tenascin xb), proteinsinvolved in bone, fat and epithelial cell metabolism (oste-oprotegerin, b219ob receptor, FGF- 7), pain perceptionand stress response (proenkephalin), growth-promotingactivity (IGF-2), and signaling and cell survival mecha-nisms (semaphorin 3c). The hypothetical proteinXP_016240 is annotated as similar to keratinocyte growthfactor-like protein, and the hypothetical proteindkfz434b044 is defined as a cysteine-rich secretory pro-tein containing LCCL domain 2. The expression data fromthe above mentioned genes could be confirmed by inde-pendent real-time RT-PCR [see Additional file 7].
In sum, these results show that long-term expansion ofMSC did not alter their differentiation potential, surfacemarker profiles, and expression profiles.
Expression profiling of MSC during osteogenic differentiation reveals distinct phases of osteogenic developmentOsteogenic differentiationHuman MSC from three different donors (Nr. 9–11) werecultured until their fourth passage and were induced toosteogenic differentiation at a confluence of 70–80%. Theosteogenic differentiation was observed during the wholeperiod by microscopy and was terminated on day 21 afterinduction. First signs for calcification appeared as blackregions within the cell monolayer after around seven days.The maximum of calcified extracellular matrix wasobserved after 21 days of treatment (Figure 1). The oste-oblast phenotype was confirmed by Alkaline Phosphataseassay and Alizarin Red S staining (data not shown).
Expression of osteoblast specific marker genesWe performed Real-time RT-PCR assays to detect theexpression levels of osteoblast specific marker genes MSX2(homeobox gene MSX2), VDR (vitamin D receptor),COL1A1 (collagen 1A1), ALPL (alkaline phosphatase),SPARC (osteonectin), SPP1 (osteopontin) and BGLAP(osteocalcin) to prove the osteoblast phenotype. The log2transformed results are shown in the supplementarymaterial [see Additional file 8].
The data obtained by Real-time RT-PCR showed theexpected expression profiles of the osteoblast phenotype.ALPL showed the expected expression level progression.Its expression was increased starting with day four of thedifferentiation period and decreased after day 14 until day21 during the mineralization phase. The homeobox geneMSX2, which is implicated in osteoprogenitor cell func-tion [23] and an up-stream regulator of RUNX2, whichwas described to be important for the osteogenic differen-
tiation [24], were up-regulated during the whole period ofdifferentiation. COL1A1 is known to be an early marker ofosteoprogenitor cells [25]. Its maximum of expressionwas reached on day 21. Also SPARC showed a nearly con-stant, up-regulated expression level with its maximum onday 21 of differentiation. SPP1 is an extracellular matrixprotein, known to peak twice in its expression [26]:around day 4, during proliferation, and between days 14–21, during mineralization. BGLAP was described as a latemarker of developing osteoblasts appearing with matrixmineralization [27] and was maximally expressed on day21. Interestingly, BGLAP was already significantly up-reg-ulated on day four, whereas the mineralization could notbe observed before day seven.
Large-scale gene expression profiling of MSC during osteogenesisThe RNA was harvested at four time points during the dif-ferentiation period and hybridized on human oligonucle-otide microarrays. As reference, RNA harvested from MSCone day before the osteogenic induction was used(ArrayExpress, accession numbers A-MARS-2 and E-MARS-3). After LOWESS-subgrid normalization and fil-tering missing values 1108 genes were selected with two-fold up- or downregulated expression in at least one timepoint [see Additional file 9].
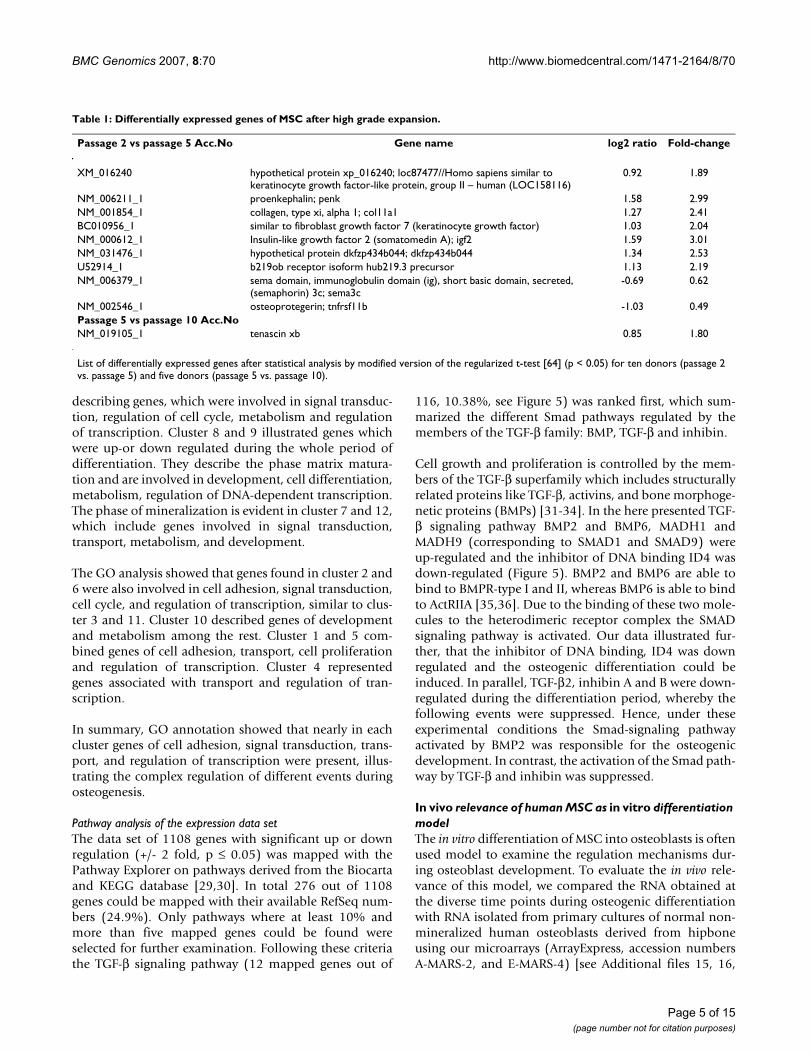
Correspondence between co-expressed genes and phenotypic changesDifferentially expressed genes were clustered according totheir expression profiles using the k-means clusteringmethod [28] [see Additional file 10]. The cluster analysiswas performed with at maximum 50 iterations and using12 different clusters, each containing between 58 and 167genes (Figure 2). The number of clusters was estimated byFOM analyses [see Additional file 11]. Additionally, hier-archical clustering was performed and the results werecomparable to k-means clustering [see Additional file 12].
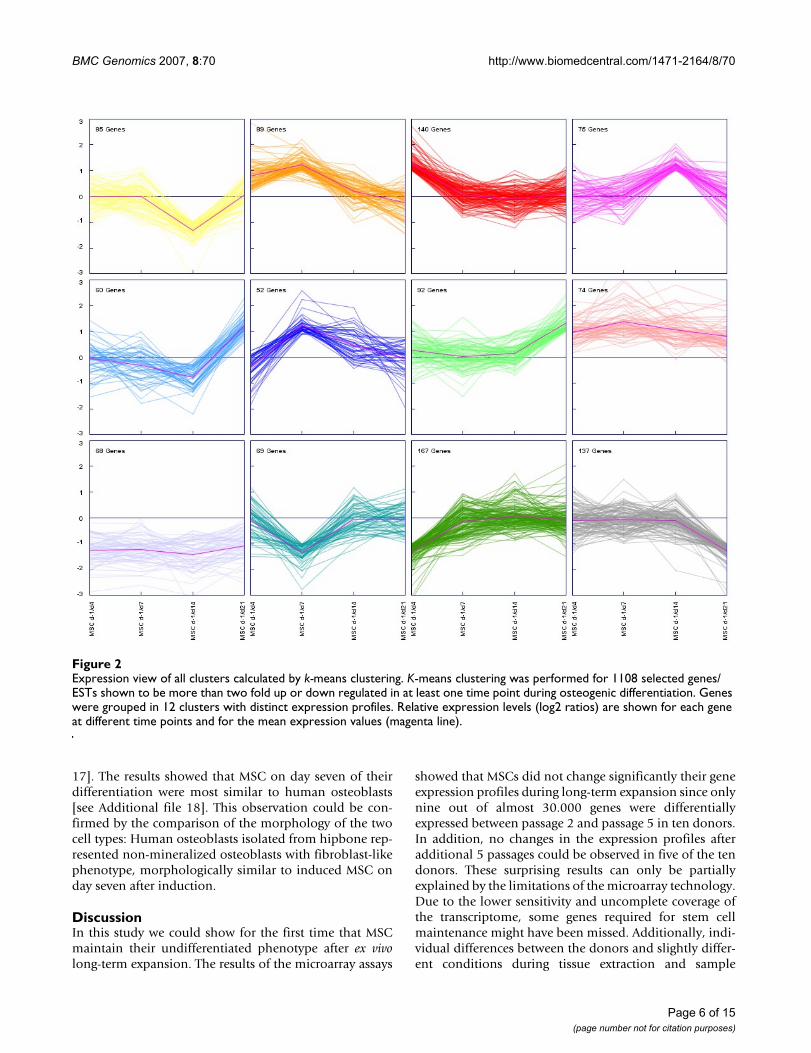
By analyzing the genes of the different clusters and theirexpression profiles, we were able to reconstruct threemain phases of osteogenic development (Figure 3): prolif-eration, matrix maturation, and mineralization. Addition-ally, novel candidate genes could be found which are notknown to play a role during osteogenic differentiation:ID4 (inhibitor of DNA-binding), CRYAB (crystalline-αB)and SORT1 (sortillin1). The expression of these genes wassubsequently confirmed by quantitative RT-PCR [seeAdditional file 13].
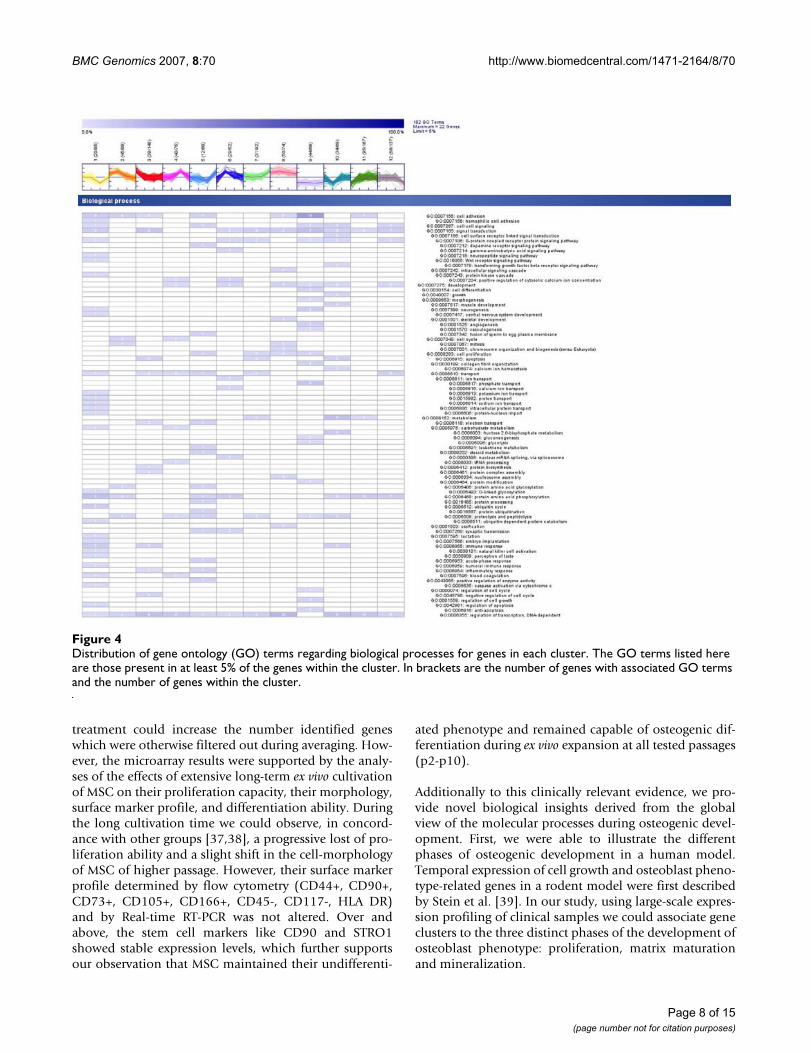
For gene ontology (GO) analysis we categorized ESTs withavailable RefSeq annotation (506 RefSeq annotations outof 1108 differentially expressed genes) according to GOterms for biological process (Figure 4), cellular compo-nent, and molecular function [see Additional file 14]. Indetail, cluster 3 and 11 represented proliferation phase
Page 4 of 15(page number not for citation purposes)
BMC Genomics 2007, 8:70 http://www.biomedcentral.com/1471-2164/8/70
describing genes, which were involved in signal transduc-tion, regulation of cell cycle, metabolism and regulationof transcription. Cluster 8 and 9 illustrated genes whichwere up-or down regulated during the whole period ofdifferentiation. They describe the phase matrix matura-tion and are involved in development, cell differentiation,metabolism, regulation of DNA-dependent transcription.The phase of mineralization is evident in cluster 7 and 12,which include genes involved in signal transduction,transport, metabolism, and development.
The GO analysis showed that genes found in cluster 2 and6 were also involved in cell adhesion, signal transduction,cell cycle, and regulation of transcription, similar to clus-ter 3 and 11. Cluster 10 described genes of developmentand metabolism among the rest. Cluster 1 and 5 com-bined genes of cell adhesion, transport, cell proliferationand regulation of transcription. Cluster 4 representedgenes associated with transport and regulation of tran-scription.
In summary, GO annotation showed that nearly in eachcluster genes of cell adhesion, signal transduction, trans-port, and regulation of transcription were present, illus-trating the complex regulation of different events duringosteogenesis.
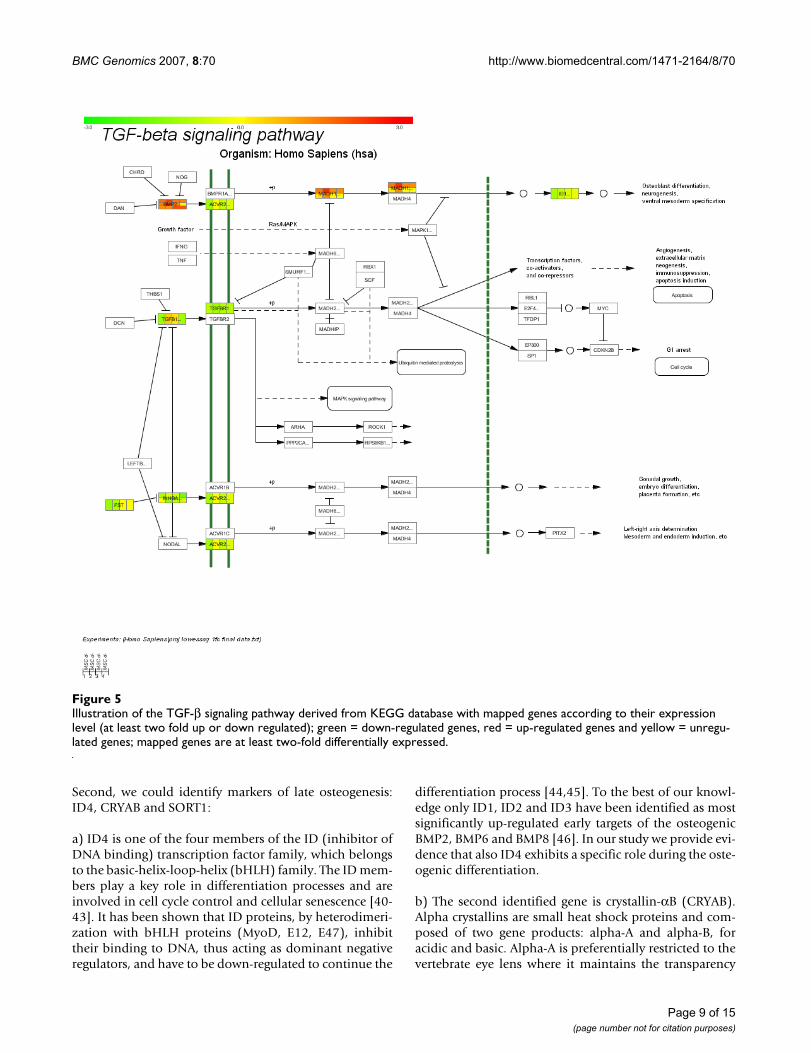
Pathway analysis of the expression data setThe data set of 1108 genes with significant up or downregulation (+/- 2 fold, p ≤ 0.05) was mapped with thePathway Explorer on pathways derived from the Biocartaand KEGG database [29,30]. In total 276 out of 1108genes could be mapped with their available RefSeq num-bers (24.9%). Only pathways where at least 10% andmore than five mapped genes could be found wereselected for further examination. Following these criteriathe TGF-β signaling pathway (12 mapped genes out of
116, 10.38%, see Figure 5) was ranked first, which sum-marized the different Smad pathways regulated by themembers of the TGF-β family: BMP, TGF-β and inhibin.
Cell growth and proliferation is controlled by the mem-bers of the TGF-β superfamily which includes structurallyrelated proteins like TGF-β, activins, and bone morphoge-netic proteins (BMPs) [31-34]. In the here presented TGF-β signaling pathway BMP2 and BMP6, MADH1 andMADH9 (corresponding to SMAD1 and SMAD9) wereup-regulated and the inhibitor of DNA binding ID4 wasdown-regulated (Figure 5). BMP2 and BMP6 are able tobind to BMPR-type I and II, whereas BMP6 is able to bindto ActRIIA [35,36]. Due to the binding of these two mole-cules to the heterodimeric receptor complex the SMADsignaling pathway is activated. Our data illustrated fur-ther, that the inhibitor of DNA binding, ID4 was downregulated and the osteogenic differentiation could beinduced. In parallel, TGF-β2, inhibin A and B were down-regulated during the differentiation period, whereby thefollowing events were suppressed. Hence, under theseexperimental conditions the Smad-signaling pathwayactivated by BMP2 was responsible for the osteogenicdevelopment. In contrast, the activation of the Smad path-way by TGF-β and inhibin was suppressed.
In vivo relevance of human MSC as in vitro differentiation modelThe in vitro differentiation of MSC into osteoblasts is oftenused model to examine the regulation mechanisms dur-ing osteoblast development. To evaluate the in vivo rele-vance of this model, we compared the RNA obtained atthe diverse time points during osteogenic differentiationwith RNA isolated from primary cultures of normal non-mineralized human osteoblasts derived from hipboneusing our microarrays (ArrayExpress, accession numbersA-MARS-2, and E-MARS-4) [see Additional files 15, 16,
Table 1: Differentially expressed genes of MSC after high grade expansion.
Passage 2 vs passage 5 Acc.No Gene name log2 ratio Fold-change
XM_016240 hypothetical protein xp_016240; loc87477//Homo sapiens similar to keratinocyte growth factor-like protein, group II – human (LOC158116)
0.92 1.89
NM_006211_1 proenkephalin; penk 1.58 2.99NM_001854_1 collagen, type xi, alpha 1; col11a1 1.27 2.41BC010956_1 similar to fibroblast growth factor 7 (keratinocyte growth factor) 1.03 2.04NM_000612_1 Insulin-like growth factor 2 (somatomedin A); igf2 1.59 3.01NM_031476_1 hypothetical protein dkfzp434b044; dkfzp434b044 1.34 2.53U52914_1 b219ob receptor isoform hub219.3 precursor 1.13 2.19NM_006379_1 sema domain, immunoglobulin domain (ig), short basic domain, secreted,
(semaphorin) 3c; sema3c-0.69 0.62
NM_002546_1 osteoprotegerin; tnfrsf11b -1.03 0.49Passage 5 vs passage 10 Acc.NoNM_019105_1 tenascin xb 0.85 1.80
List of differentially expressed genes after statistical analysis by modified version of the regularized t-test [64] (p < 0.05) for ten donors (passage 2 vs. passage 5) and five donors (passage 5 vs. passage 10).
Page 5 of 15(page number not for citation purposes)
BMC Genomics 2007, 8:70 http://www.biomedcentral.com/1471-2164/8/70
17]. The results showed that MSC on day seven of theirdifferentiation were most similar to human osteoblasts[see Additional file 18]. This observation could be con-firmed by the comparison of the morphology of the twocell types: Human osteoblasts isolated from hipbone rep-resented non-mineralized osteoblasts with fibroblast-likephenotype, morphologically similar to induced MSC onday seven after induction.
DiscussionIn this study we could show for the first time that MSCmaintain their undifferentiated phenotype after ex vivolong-term expansion. The results of the microarray assays
showed that MSCs did not change significantly their geneexpression profiles during long-term expansion since onlynine out of almost 30.000 genes were differentiallyexpressed between passage 2 and passage 5 in ten donors.In addition, no changes in the expression profiles afteradditional 5 passages could be observed in five of the tendonors. These surprising results can only be partiallyexplained by the limitations of the microarray technology.Due to the lower sensitivity and uncomplete coverage ofthe transcriptome, some genes required for stem cellmaintenance might have been missed. Additionally, indi-vidual differences between the donors and slightly differ-ent conditions during tissue extraction and sample
Expression view of all clusters calculated by k-means clusteringFigure 2Expression view of all clusters calculated by k-means clustering. K-means clustering was performed for 1108 selected genes/ESTs shown to be more than two fold up or down regulated in at least one time point during osteogenic differentiation. Genes were grouped in 12 clusters with distinct expression profiles. Relative expression levels (log2 ratios) are shown for each gene at different time points and for the mean expression values (magenta line).
Page 6 of 15(page number not for citation purposes)
BMC Genomics 2007, 8:70 http://www.biomedcentral.com/1471-2164/8/70
Page 7 of 15(page number not for citation purposes)
Summary of osteogenic development; a) Graphical summary of the 3 phases of osteogenic development merged with the time scale; b) Chosen clusters after k-means clustering describing each developmental phase merged with the expression matrix of distinct key regulatorsFigure 3Summary of osteogenic development; a) Graphical summary of the 3 phases of osteogenic development merged with the time scale; b) Chosen clusters after k-means clustering describing each developmental phase merged with the expression matrix of distinct key regulators.
A) Phenotypic changes during osteogenic development
day ofosteogenic induction
day 0 day 4 day 7 day 14 day 21 X X X X X
proliferationmatrix maturation
mineralization
B) Expression time-course of osteogenic regulator genes during distinct differentiation phases
3)
11)
8)
9)
7)
12)
BMC Genomics 2007, 8:70 http://www.biomedcentral.com/1471-2164/8/70
treatment could increase the number identified geneswhich were otherwise filtered out during averaging. How-ever, the microarray results were supported by the analy-ses of the effects of extensive long-term ex vivo cultivationof MSC on their proliferation capacity, their morphology,surface marker profile, and differentiation ability. Duringthe long cultivation time we could observe, in concord-ance with other groups [37,38], a progressive lost of pro-liferation ability and a slight shift in the cell-morphologyof MSC of higher passage. However, their surface markerprofile determined by flow cytometry (CD44+, CD90+,CD73+, CD105+, CD166+, CD45-, CD117-, HLA DR)and by Real-time RT-PCR was not altered. Over andabove, the stem cell markers like CD90 and STRO1showed stable expression levels, which further supportsour observation that MSC maintained their undifferenti-
ated phenotype and remained capable of osteogenic dif-ferentiation during ex vivo expansion at all tested passages(p2-p10).
Additionally to this clinically relevant evidence, we pro-vide novel biological insights derived from the globalview of the molecular processes during osteogenic devel-opment. First, we were able to illustrate the differentphases of osteogenic development in a human model.Temporal expression of cell growth and osteoblast pheno-type-related genes in a rodent model were first describedby Stein et al. [39]. In our study, using large-scale expres-sion profiling of clinical samples we could associate geneclusters to the three distinct phases of the development ofosteoblast phenotype: proliferation, matrix maturationand mineralization.
Distribution of gene ontology (GO) terms regarding biological processes for genes in each clusterFigure 4Distribution of gene ontology (GO) terms regarding biological processes for genes in each cluster. The GO terms listed here are those present in at least 5% of the genes within the cluster. In brackets are the number of genes with associated GO terms and the number of genes within the cluster.
Page 8 of 15(page number not for citation purposes)
BMC Genomics 2007, 8:70 http://www.biomedcentral.com/1471-2164/8/70
Second, we could identify markers of late osteogenesis:ID4, CRYAB and SORT1:
a) ID4 is one of the four members of the ID (inhibitor ofDNA binding) transcription factor family, which belongsto the basic-helix-loop-helix (bHLH) family. The ID mem-bers play a key role in differentiation processes and areinvolved in cell cycle control and cellular senescence [40-43]. It has been shown that ID proteins, by heterodimeri-zation with bHLH proteins (MyoD, E12, E47), inhibittheir binding to DNA, thus acting as dominant negativeregulators, and have to be down-regulated to continue the
differentiation process [44,45]. To the best of our knowl-edge only ID1, ID2 and ID3 have been identified as mostsignificantly up-regulated early targets of the osteogenicBMP2, BMP6 and BMP8 [46]. In our study we provide evi-dence that also ID4 exhibits a specific role during the oste-ogenic differentiation.
b) The second identified gene is crystallin-αB (CRYAB).Alpha crystallins are small heat shock proteins and com-posed of two gene products: alpha-A and alpha-B, foracidic and basic. Alpha-A is preferentially restricted to thevertebrate eye lens where it maintains the transparency
Illustration of the TGF-β signaling pathway derived from KEGG database with mapped genes according to their expression level (at least two fold up or down regulated); green = down-regulated genes, red = up-regulated genes and yellow = unregu-lated genes; mapped genes are at least two-fold differentially expressedFigure 5Illustration of the TGF-β signaling pathway derived from KEGG database with mapped genes according to their expression level (at least two fold up or down regulated); green = down-regulated genes, red = up-regulated genes and yellow = unregu-lated genes; mapped genes are at least two-fold differentially expressed.
Page 9 of 15(page number not for citation purposes)
BMC Genomics 2007, 8:70 http://www.biomedcentral.com/1471-2164/8/70
and refractive index of the lens, whereas alpha-B is widelyexpressed in many tissues and organs [47]. The hereobserved up-regulation of CRYAB suggests an involve-ment in osteogenic differentiation but its specific role isstill unknown. This involvement is supported byFurushima et al. [48], who performed a linkage study withknowledge-based candidate genes to detect genetic deter-minants associated with OPLL (ossification of the poste-rior longitudinal ligament of the spine), a predominantmyelopathy among Japanese. The candidate genes forexamination were obtained by cDNA microarray analysisof gene expression profiles during osteoblastic differenti-ation of MSC. Among the 24 genes identified in cDNAmicroarray analysis which could be associated with bonemetabolism, CRYAB was the only gene which showed sig-nificant evidence of linkage.
c) Further, we could show the role of sortilin1 during oste-ogenic differentiation. Sortilin 1 (SORT1) represents amulti-ligand type-1 receptor which binds a number ofunrelated ligands that participate in a wide range of cellu-lar processes. The expression of SORT1 was increasinguntil day seven and then slowly decreasing. Sortilin1, alsoknown as neurotensin receptor-3, is a glycoprotein origi-nally purified from human brain [49]. The expression ofsortilin1 is ubiquitous; it has been observed in heart,brain, placenta, lung, skeletal, muscle, pancreas, prostate,testis, small intestine, thyroid, and spinal cord, whereas itsexpression in bone marrow could not be detected [50].The function of srotilin1 in bone metabolism is poorlyunderstood. Maeda et al. [51] reported first differentialexpression during osteogenic differentiation and per-formed further experiments, which showed that sortilin 1is promoting extracellular matrix maturation. Our resultspresented here strengthen this hypothesis, since sortilin 1shows a similar expression progression as other wellknown osteogenic genes, such as ALPL or BMPs.
In summary, we have identified by expression profilingand confirmed by quantitative RT-PCR three markers oflate osteogenesis. Further studies are necessary to quantifythe expression of ID4, SORT-1 and CRYAB in primaryhuman osteoblasts and other cell types and to identify therole of these genes in osteogenesis.
Third, by mapping the obtained expression data oncurated biomolecular pathways, we were able to illustratethe distinct activation of the different Smad pathwaysinduced by BMPs, TGF-β and inhibin, which were sum-marized as TGF-β pathways. The mapping of the expres-sion data demonstrated that the fate of cell differentiationwas simultaneously controlled at three different points: 1)BMP2, BMP6 and BMP8 activated the Smad-signalingpathway, consisting of the main components Smad 1,Smad 5 and Smad 8 resulting in osteoblast differentiation;
2) TGF-β2, regulating Smad 2 and Smad 4, was down reg-ulated and the subsequent mechanisms were suppressed;and 3) inhibin was, like TGF-β2, down regulated. Thesefindings have been confirmed by recent reports describingthe diverse Smad-signaling pathways, but have never beenillustrated in a general overview before this study [52-55].
Finally, the comparison of in vitro differentiated osteob-lasts with in vivo developed osteoblasts on morphologicaland genetic level proved the usefulness of MSC as in vitromodel for the investigation of the osteogenic develop-ment.
ConclusionThe here presented results demonstrate that MSC repre-sent a cell population which can be expanded ex vivo anddifferentiated into osteoblasts. The genomic approachpresented here represents a powerful tool to systemati-cally and comprehensively investigate therapeuticapproaches and hence, facilitate translational research onstem cells. However, it should be pointed out that newquality and safety standards have to be developed to guar-antee risk free usage of ex vivo manipulated cell materialfor future therapeutic applications.
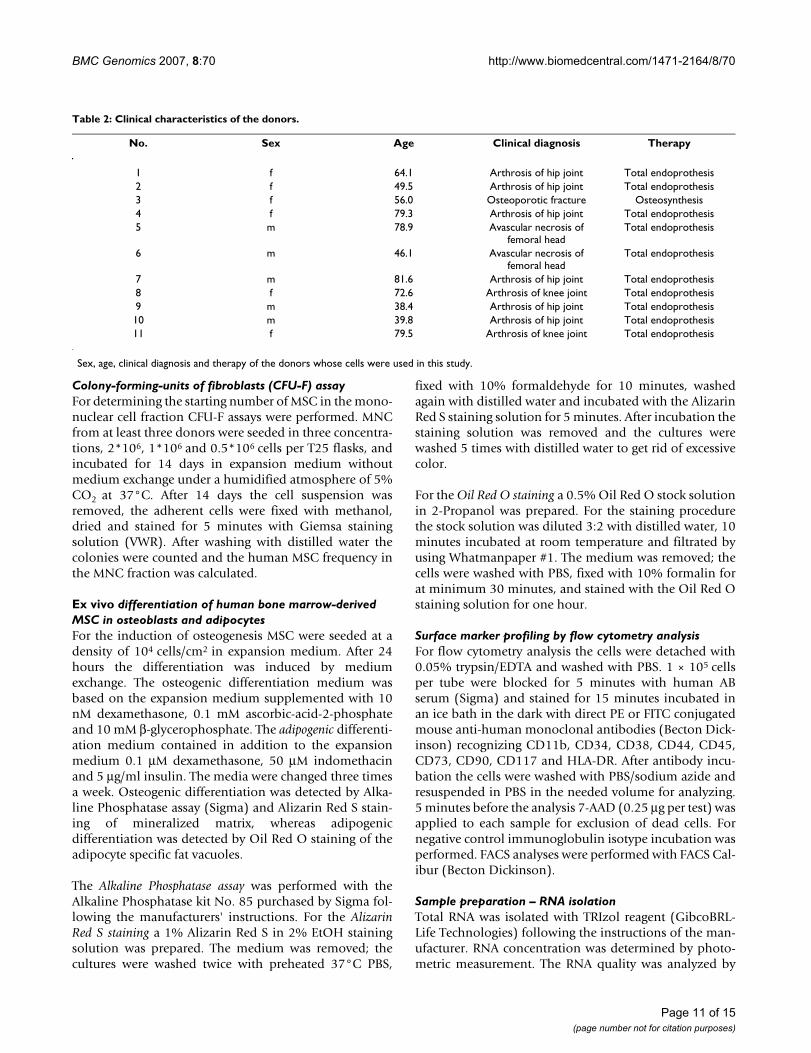
MethodsCultivation and ex vivo expansion of human bone marrow-derived MSC and normal human osteoblastsThe mononuclear cell fractions (MNC) were derived frombone marrow from eleven different donors (Table 2), whogave consent after full information and approval by thehospital ethical committee (No. 12–091). All MNC wereisolated from bone marrow aspirates at iliac crest duringsurgery. MNC were seeded at a density of 1 × 10⁵ per cm2
and cultured for 24 hours. After these 24 hours non-adherent cells were removed by medium exchange. Theadherent cells were cultured in expansion medium con-taining DMEM (Invitrogen), 10% FBS (selected lot, StemCell Technologies), 100 U/ml penicillin, 100 μg/ml strep-tomycin and 2 mM L-glutamine under a humidifiedatmosphere of 5% CO2 at 37°C. Medium was changedthree times a week. After reaching a confluence of 75–85%the cells were detached with 0.05% trypsin/1 mM EDTAand replated at density of 4 × 10³cells/cm2. The cells wereexpanded until the end of the tenth passage (correspond-ing to 26 cell doublings).
The cells for the cultivation of normal human osteoblastsderived from hipbone were obtained by PromoCell (Hei-delberg, Germany). The cryopreserved normal humanosteoblasts were thawed and cultivated until the end ofthe fourth passage following the protocols and media rec-ommended by PromoCell.
Page 10 of 15(page number not for citation purposes)
BMC Genomics 2007, 8:70 http://www.biomedcentral.com/1471-2164/8/70
Colony-forming-units of fibroblasts (CFU-F) assayFor determining the starting number of MSC in the mono-nuclear cell fraction CFU-F assays were performed. MNCfrom at least three donors were seeded in three concentra-tions, 2*106, 1*106 and 0.5*106 cells per T25 flasks, andincubated for 14 days in expansion medium withoutmedium exchange under a humidified atmosphere of 5%CO2 at 37°C. After 14 days the cell suspension wasremoved, the adherent cells were fixed with methanol,dried and stained for 5 minutes with Giemsa stainingsolution (VWR). After washing with distilled water thecolonies were counted and the human MSC frequency inthe MNC fraction was calculated.
Ex vivo differentiation of human bone marrow-derived MSC in osteoblasts and adipocytesFor the induction of osteogenesis MSC were seeded at adensity of 104 cells/cm2 in expansion medium. After 24hours the differentiation was induced by mediumexchange. The osteogenic differentiation medium wasbased on the expansion medium supplemented with 10nM dexamethasone, 0.1 mM ascorbic-acid-2-phosphateand 10 mM β-glycerophosphate. The adipogenic differenti-ation medium contained in addition to the expansionmedium 0.1 μM dexamethasone, 50 μM indomethacinand 5 μg/ml insulin. The media were changed three timesa week. Osteogenic differentiation was detected by Alka-line Phosphatase assay (Sigma) and Alizarin Red S stain-ing of mineralized matrix, whereas adipogenicdifferentiation was detected by Oil Red O staining of theadipocyte specific fat vacuoles.
The Alkaline Phosphatase assay was performed with theAlkaline Phosphatase kit No. 85 purchased by Sigma fol-lowing the manufacturers' instructions. For the AlizarinRed S staining a 1% Alizarin Red S in 2% EtOH stainingsolution was prepared. The medium was removed; thecultures were washed twice with preheated 37°C PBS,
fixed with 10% formaldehyde for 10 minutes, washedagain with distilled water and incubated with the AlizarinRed S staining solution for 5 minutes. After incubation thestaining solution was removed and the cultures werewashed 5 times with distilled water to get rid of excessivecolor.
For the Oil Red O staining a 0.5% Oil Red O stock solutionin 2-Propanol was prepared. For the staining procedurethe stock solution was diluted 3:2 with distilled water, 10minutes incubated at room temperature and filtrated byusing Whatmanpaper #1. The medium was removed; thecells were washed with PBS, fixed with 10% formalin forat minimum 30 minutes, and stained with the Oil Red Ostaining solution for one hour.
Surface marker profiling by flow cytometry analysisFor flow cytometry analysis the cells were detached with0.05% trypsin/EDTA and washed with PBS. 1 × 10⁵ cellsper tube were blocked for 5 minutes with human ABserum (Sigma) and stained for 15 minutes incubated inan ice bath in the dark with direct PE or FITC conjugatedmouse anti-human monoclonal antibodies (Becton Dick-inson) recognizing CD11b, CD34, CD38, CD44, CD45,CD73, CD90, CD117 and HLA-DR. After antibody incu-bation the cells were washed with PBS/sodium azide andresuspended in PBS in the needed volume for analyzing.5 minutes before the analysis 7-AAD (0.25 μg per test) wasapplied to each sample for exclusion of dead cells. Fornegative control immunoglobulin isotype incubation wasperformed. FACS analyses were performed with FACS Cal-ibur (Becton Dickinson).
Sample preparation – RNA isolationTotal RNA was isolated with TRIzol reagent (GibcoBRL-Life Technologies) following the instructions of the man-ufacturer. RNA concentration was determined by photo-metric measurement. The RNA quality was analyzed by
Table 2: Clinical characteristics of the donors.
No. Sex Age Clinical diagnosis Therapy
1 f 64.1 Arthrosis of hip joint Total endoprothesis2 f 49.5 Arthrosis of hip joint Total endoprothesis3 f 56.0 Osteoporotic fracture Osteosynthesis4 f 79.3 Arthrosis of hip joint Total endoprothesis5 m 78.9 Avascular necrosis of
femoral headTotal endoprothesis
6 m 46.1 Avascular necrosis of femoral head
Total endoprothesis
7 m 81.6 Arthrosis of hip joint Total endoprothesis8 f 72.6 Arthrosis of knee joint Total endoprothesis9 m 38.4 Arthrosis of hip joint Total endoprothesis10 m 39.8 Arthrosis of hip joint Total endoprothesis11 f 79.5 Arthrosis of knee joint Total endoprothesis
Sex, age, clinical diagnosis and therapy of the donors whose cells were used in this study.
Page 11 of 15(page number not for citation purposes)
BMC Genomics 2007, 8:70 http://www.biomedcentral.com/1471-2164/8/70
Agilent 2100 Bioanalyzer RNA assays and evaluated bycalculating the ratio of the 28S and 18S ribosomal RNAintensity peaks.
Microarray productionHuman oligonucleotide microarrays were developedusing 29550 oligonucleotides derived from 30 K MWGHuman Oligo Set with 50 bp in length (provided by Prof.Reinhard Kofler, Tyrolian Cancer Research Institute), anddissolved in spotting buffer consisting of 3× SSC, 1.5 MBetaine. Microarrays were produced by spotting thereporters (including spotting buffer as negative controland human genomic DNA as positive control) in 48blocks onto an epoxy-coated glass slide (Nexterion)resulting in 33456 features on a single high density array.Reporter molecules were fixed to the slides by baking at42°C for 8 h at 50% relative humidity. RefSeq IDs indi-cate the genes represented by the oligonucleotides [seeAdditional file 3].
Microarray hybridization procedureThe used labeling and hybridization procedures werebased on those developed at The Institute for GenomicResearch (TIGR) and modified at the Institute for Genom-ics and Bioinformatics [see Additional file 4 and 5]. Allhybridizations were repeated with reversed dye assign-ment (dye-swap). After hybridization slides were scannedwith GenePix 4000B microarray scanner (Axon Instru-ments) at 10 μm resolution. Identical settings were usedfor scanning the corresponding dye-swapped hybridizedslides. The resulting TIFF images for each of the two fluor-ophores were analyzed with GenePix Pro 4.1 (AxonInstruments).
Bioinformatics analysesAfter image acquisition and filtering the data for lowintensity, inhomogeneity and satured spots, the resultsfiles were normalized with the in-house developed soft-ware ArrayNorm [56]. After background correction thedata sets were normalized by global-mean and dye-swappairs or LOWESS-subgrid normalization. The obtainedresult files were used for further analyses such as clusteranalysis [57], GO annotation [58] and pathway analyses[59]. Cluster analyses were performed with the Genesissoftware tool using k-means clustering function [28]. Thenumber of clusters was varied from k = 1 to k = 15 and pre-dictive power was analyzed with the figure of merit [60].Subsequently, k = 12 was found optimal. GO annotationwas performed on differentially expressed genes. Pathwayanalyses were performed with the in house developedPathway Explorer software [59] which mapped the RefSeqIDs from the results file (cut-off level for differentiallyexpressed genes: log2 ratio > 1) on public available path-ways like Biocarta [61] and KEGG database [30]. All exper-imental parameters, images, raw and transformed data
were uploaded to the microarray database MARS [62] andsubmitted via MAGE-ML export to a public repository(ArrayExpress, accession numbers A-MARS-2, E-MARS-3,E-MARS-4, E-MARS-5, and E-MARS-6) [63].
Real-time RT PCRThe same sources of total RNA used in the microarrayexperiments were used for the data validation by RT-PCR.The SuperScript™ II First Strand Synthesis System for RTPCR (Invitrogen) was used to synthesize cDNA of 5 μgRNA following manufacturers' recommendations. RNAcontaminating genomic DNA was removed by treatmentwith DNAse I amplification grade (Invitrogen). TheSuperScript™ II product was diluted 1:25 and directly usedfor the RT-PCR.
The RT-PCR assays were performed using the EurogentecqPCR™ Mastermix Plus for Sybr™ Green I following man-ufacturer's recommendations. NO-reverse transcriptionControls (No-RT) and No-Template Controls (NTC) wereperformed for each RNA type and primer pair. Cyclingconditions on the ABI Prism 7000: 2 minutes at 50°C, 10minutes at 95°C, 40 × (15 seconds at 95°C, 1 minute at60°C) and the dissociation protocol at 60°C was added.For each sample RNA two cDNAs were prepared but inindependent reverse transcription reactions. Each genewas tested with both cDNAs and the cDNAs were alsotested in duplicate on one plate. Hence, four RT-PCR reac-tions were performed for the examination of one singlegene. Further, the sample cDNA and the correspondingreference cDNA were tested on one plate, so that the datacan be compared directly.
For normalization of the data the average of the expres-sion level of four house-keeping genes, GAPDH, HPRT,beta-actin and beta-tubulin, was used.
Authors' contributionsBK performed the experiments and analyzed the data. FSCwas responsible for the microarray data normalizationand statistical analysis. GF isolated the bone marrow aspi-rates. RW was responsible for the clinical studies. AJ andKHP supported the design of the experiments and theinterpretation of the results. MS, CP, and AP developedand produced the microarrays. ZT was responsible for theoverall conception and project coordination. All authorsgave final approval of the version to be published.
Additional filesThere are 18 additional files provided with the online ver-sion of this manuscript comprising raw data and results ofthe analyses. The data files are available on our web sitehttp://genome.tugraz.at/MSC.
Page 12 of 15(page number not for citation purposes)
BMC Genomics 2007, 8:70 http://www.biomedcentral.com/1471-2164/8/70
Additional material
Additional File 1FACS analysis. Surface profiles in different passages.Click here for file[http://www.biomedcentral.com/content/supplementary/1471-2164-8-70-S1.pdf]
Additional File 2Expression of stem cell specific marker genes evaluated by Realtime RT-PCR. Expression of stem cell specific marker genes evaluated by Realtime RT-PCR.Click here for file[http://www.biomedcentral.com/content/supplementary/1471-2164-8-70-S2.pdf]
Additional File 3Array Design. Information on the spotted oligos.Click here for file[http://www.biomedcentral.com/content/supplementary/1471-2164-8-70-S3.xls]
Additional File 4SOP AMINOALLYL LABELING OF RNA FOR HUMAN OLIGO CHIPS. Standard Operating Procedure for AMINOALLYL LABELING OF RNA FOR HUMAN OLIGO CHIPS.Click here for file[http://www.biomedcentral.com/content/supplementary/1471-2164-8-70-S4.pdf]
Additional File 5SOP HUMAN OLIGO CHIP PROBE HYBRIDIZATION. Standard Operating Procedure for microarray hybridization.Click here for file[http://www.biomedcentral.com/content/supplementary/1471-2164-8-70-S5.pdf]
Additional File 6Differentially expressed ESTs. Differentially expressed ESTs (>2-fold-change) when comparing p2/p5 and p5/p10 for following moderated t-testClick here for file[http://www.biomedcentral.com/content/supplementary/1471-2164-8-70-S6.xls]
Additional File 7Validation of microarray data by Realtime RT-PCR. Gene expression analysis of long-term cultivated MSC.Click here for file[http://www.biomedcentral.com/content/supplementary/1471-2164-8-70-S7.pdf]
Additional File 8Gene expression of osteoblast specific genes determined by Real-time RT-PCR. Gene expression of osteoblast specific genes determined by Real-time RT-PCR to prove the osteogenic phenotype.Click here for file[http://www.biomedcentral.com/content/supplementary/1471-2164-8-70-S8.pdf]
Additional File 9Selected ESTs for microarray analysis. 1108 selected ESTs for microarray analysis.Click here for file[http://www.biomedcentral.com/content/supplementary/1471-2164-8-70-S9.xls]
Additional File 10k-means clustering. k-means clustering of 1108 selected ESTs.Click here for file[http://www.biomedcentral.com/content/supplementary/1471-2164-8-70-S10.pdf]
Additional File 11Figure of merit analysis. Figure of merit analysis for validation of the k-value.Click here for file[http://www.biomedcentral.com/content/supplementary/1471-2164-8-70-S11.pdf]
Additional File 12Hierarchical clustering. Hierarchical clustering of 1108 selected ESTs.Click here for file[http://www.biomedcentral.com/content/supplementary/1471-2164-8-70-S12.png]
Additional File 13Validation of microarray data using real-time RT-PCR. Gene expression analysis of MSC during osteogenesis.Click here for file[http://www.biomedcentral.com/content/supplementary/1471-2164-8-70-S13.pdf]
Additional File 14Functional annotation. Distribution of gene ontology (GO) terms in each cluster.Click here for file[http://www.biomedcentral.com/content/supplementary/1471-2164-8-70-S14.png]
Additional File 15Expression matrix. Expression matrix of differentially expressed ESTs (>2-foldchange).Click here for file[http://www.biomedcentral.com/content/supplementary/1471-2164-8-70-S15.png]
Additional File 16Selected ESTs for microarray analysis. 659 selected ESTs for microarray analysis.Click here for file[http://www.biomedcentral.com/content/supplementary/1471-2164-8-70-S16.xls]
Additional File 17Validation of microarray data by real-time RT-PCR. Real-time RT-PCR data.Click here for file[http://www.biomedcentral.com/content/supplementary/1471-2164-8-70-S17.pdf]
Page 13 of 15(page number not for citation purposes)
BMC Genomics 2007, 8:70 http://www.biomedcentral.com/1471-2164/8/70
AcknowledgementsWe thank Hubert Hackl for assistance with the additional data files, Bern-hard Mlecnik for the pathway analyses, and Robert Molidor for the micro-array database support. This work was supported by the Christian-Doppler Laboratory for Genomics and Bioinformatics, and the GEN-AU projects Bioinformatics Integration Network (BIN) and Genomics of Lipid-Associ-ated Disorders (GOLD).
References1. Haynesworth SE, Goshima J, Goldberg VM, Caplan AI: Characteri-
zation of cells with osteogenic potential from human mar-row. Bone 1992, 13:81-88.
2. Bruder SP, Jaiswal N, Haynesworth SE: Growth kinetics, self-renewal, and the osteogenic potential of purified humanmesenchymal stem cells during extensive subcultivation andfollowing cryopreservation. J Cell Biochem 1997, 64:278-294.
3. Pittenger MF, Martin BJ: Mesenchymal stem cells and theirpotential as cardiac therapeutics. Circ Res 2004, 95:9-20.
4. Xu W, Zhang X, Qian H, Zhu W, Sun X, Hu J, Zhou H, Chen Y: Mes-enchymal stem cells from adult human bone marrow differ-entiate into a cardiomyocyte phenotype in vitro. Exp Biol Med(Maywood) 2004, 229:623-631.
5. Hofstetter CP, Schwarz EJ, Hess D, Widenfalk J, El M, Prockop DJ,Olson L: Marrow stromal cells form guiding strands in theinjured spinal cord and promote recovery. Proc Natl Acad Sci US A 2002, 99:2199-2204.
6. Sanchez-Ramos J, Song S, Cardozo-Pelaez F, Hazzi C, Stedeford T,Willing A, Freeman TB, Saporta S, Janssen W, Patel N, Cooper DR,Sanberg PR: Adult bone marrow stromal cells differentiateinto neural cells in vitro. Exp Neurol 2000, 164:247-256.
7. Hayflick L: Antecedents of cell aging research. Exp Gerontol1989, 24:355-365.
8. Shake JG, Gruber PJ, Baumgartner WA, Senechal G, Meyers J, Red-mond JM, Pittenger MF, Martin BJ: Mesenchymal stem cellimplantation in a swine myocardial infarct model: engraft-ment and functional effects. Ann Thorac Surg 2002, 73:1919-1925.
9. Bruder SP, Kraus KH, Goldberg VM, Kadiyala S: The effect ofimplants loaded with autologous mesenchymal stem cells onthe healing of canine segmental bone defects. J Bone Joint SurgAm 1998, 80:985-996.
10. Kon E, Muraglia A, Corsi A, Bianco P, Marcacci M, Martin I, Boyde A,Ruspantini I, Chistolini P, Rocca M, Giardino R, Cancedda R, QuartoR: Autologous bone marrow stromal cells loaded ontoporous hydroxyapatite ceramic accelerate bone repair incritical-size defects of sheep long bones. J Biomed Mater Res2000, 49:328-337.
11. Wakitani S, Goto T, Pineda SJ, Young RG, Mansour JM, Caplan AI,Goldberg VM: Mesenchymal cell-based repair of large, full-thickness defects of articular cartilage. J Bone Joint Surg Am1994, 76:579-592.
12. Bruder SP, Jaiswal N, Ricalton NS, Mosca JD, Kraus KH, Kadiyala S:Mesenchymal stem cells in osteobiology and applied boneregeneration. Clin Orthop Relat Res 1998:S247-S256.
13. Johnstone B, Hering TM, Caplan AI, Goldberg VM, Yoo JU: In vitrochondrogenesis of bone marrow-derived mesenchymal pro-genitor cells. Exp Cell Res 1998, 238:265-272.
14. Woodbury D, Schwarz EJ, Prockop DJ, Black IB: Adult rat andhuman bone marrow stromal cells differentiate into neu-rons. J Neurosci Res 2000, 61:364-370.
15. Terada N, Hamazaki T, Oka M, Hoki M, Mastalerz DM, Nakano Y,Meyer EM, Morel L, Petersen BE, Scott EW: Bone marrow cells
adopt the phenotype of other cells by spontaneous cellfusion. Nature 2002, 416:542-545.
16. Dezawa M, Takahashi I, Esaki M, Takano M, Sawada H: Sciatic nerveregeneration in rats induced by transplantation of in vitrodifferentiated bone-marrow stromal cells. Eur J Neurosci 2001,14:1771-1776.
17. Horwitz EM, Gordon PL, Koo WK, Marx JC, Neel MD, McNall RY,Muul L, Hofmann T: Isolated allogeneic bone marrow-derivedmesenchymal cells engraft and stimulate growth in childrenwith osteogenesis imperfecta: Implications for cell therapyof bone. Proc Natl Acad Sci U S A 2002, 99:8932-8937.
18. Koc ON, Gerson SL, Cooper BW, Dyhouse SM, Haynesworth SE,Caplan AI, Lazarus HM: Rapid hematopoietic recovery aftercoinfusion of autologous-blood stem cells and culture-expanded marrow mesenchymal stem cells in advancedbreast cancer patients receiving high-dose chemotherapy. JClin Oncol 2000, 18:307-316.
19. Quarto R, Mastrogiacomo M, Cancedda R, Kutepov SM, MukhachevV, Lavroukov A, Kon E, Marcacci M: Repair of large bone defectswith the use of autologous bone marrow stromal cells. N EnglJ Med 2001, 344:385-386.
20. Petite H, Viateau V, Bensaid W, Meunier A, de Pollak C, BourguignonM, Oudina K, Sedel L, Guillemin G: Tissue-engineered boneregeneration. Nat Biotechnol 2000, 18:959-963.
21. Lazarus HM, Haynesworth SE, Gerson SL, Rosenthal NS, Caplan AI:Ex vivo expansion and subsequent infusion of human bonemarrow-derived stromal progenitor cells (mesenchymalprogenitor cells): implications for therapeutic use. Bone Mar-row Transplant 1995, 16:557-564.
22. Baldi P, Long AD: A Bayesian framework for the analysis ofmicroarray expression data: regularized t -test and statisti-cal inferences of gene changes. Bioinformatics 2001, 17:509-519.
23. Cheng SL, Shao JS, Charlton-Kachigian N, Loewy AP, Towler DA:MSX2 promotes osteogenesis and suppresses adipogenic dif-ferentiation of multipotent mesenchymal progenitors. J BiolChem 2003, 278:45969-45977.
24. Satokata I, Ma L, Ohshima H, Bei M, Woo I, Nishizawa K, Maeda T,Takano Y, Uchiyama M, Heaney S, Peters H, Tang ZQ, Maxson R,Maas R: Msx2 deficiency in mice causes pleiotropic defects inbone growth and ectodermal organ formation. Nature Genet-ics 2000, 24:391-395.
25. Jikko A, Harris SE, Chen D, Mendrick DL, Damsky CH: Collagenintegrin receptors regulate early osteoblast differentiationinduced by BMP-2. Journal of Bone and Mineral Research 1999,14:1075-1083.
26. J.E. A: Regulation of osteoblast formation and function. RevEndocr Metab Disord 2001, 2:81-94.
27. Aubin JE: Bone stem cells. Journal of Cellular Biochemistry1998:73-82.
28. Hartigan JA: Clustering. Annu Rev Biophys Bioeng 1973, 2:81-101.29. Biocarta pathway database 2005 [http://www.biocarta.com/
genes/index.asp].30. Kanehisa M, Goto S, Kawashima S, Nakaya A: The KEGG data-
bases at GenomeNet. Nucleic Acids Res 2002, 30:42-46.31. Massague J: TGF-beta signal transduction. Annu Rev Biochem
1998, 67:753-791.32. Zwijsen A, Verschueren K, Huylebroeck D: New intracellular
components of bone morphogenetic protein/Smad signalingcascades. FEBS Lett 2003, 546:133-139.
33. Wan M, Cao X: BMP signaling in skeletal development. Bio-chem Biophys Res Commun 2005, 328:651-657.
34. Ducy P, Karsenty G: The family of bone morphogenetic pro-teins. Kidney Int 2000, 57:2207-2214.
35. Banfi A, Muraglia A, Dozin B, Mastrogiacomo M, Cancedda R, QuartoR: Proliferation kinetics and differentiation potential of exvivo expanded human bone marrow stromal cells: Implica-tions for their use in cell therapy. Exp Hematol 2000,28:707-715.
36. Bruder SP, Kurth AA, Shea M, Hayes WC, Jaiswal N, Kadiyala S: Boneregeneration by implantation of purified, culture-expandedhuman mesenchymal stem cells. J Orthop Res 1998, 16:155-162.
37. Stein GS, Lian JB: Molecular mechanisms mediating prolifera-tion/differentiation interrelationships during progressivedevelopment of the osteoblast phenotype. Endocr Rev 1993,14:424-442.
Additional File 18Evaluation of human MSC as in vitro differentiation model. Comparison of human osteoblasts with in vitro differentiated hMSC.Click here for file[http://www.biomedcentral.com/content/supplementary/1471-2164-8-70-S18.pdf]
Page 14 of 15(page number not for citation purposes)
http://www.ncbi.nlm.nih.gov/entrez/query.fcgi?cmd=Retrieve&db=PubMed&dopt=Abstract&list_uids=1581112
http://www.ncbi.nlm.nih.gov/entrez/query.fcgi?cmd=Retrieve&db=PubMed&dopt=Abstract&list_uids=1581112
http://www.ncbi.nlm.nih.gov/entrez/query.fcgi?cmd=Retrieve&db=PubMed&dopt=Abstract&list_uids=1581112
http://www.ncbi.nlm.nih.gov/entrez/query.fcgi?cmd=Retrieve&db=PubMed&dopt=Abstract&list_uids=9027588
http://www.ncbi.nlm.nih.gov/entrez/query.fcgi?cmd=Retrieve&db=PubMed&dopt=Abstract&list_uids=9027588
http://www.ncbi.nlm.nih.gov/entrez/query.fcgi?cmd=Retrieve&db=PubMed&dopt=Abstract&list_uids=9027588
http://www.ncbi.nlm.nih.gov/entrez/query.fcgi?cmd=Retrieve&db=PubMed&dopt=Abstract&list_uids=2698813
http://www.ncbi.nlm.nih.gov/entrez/query.fcgi?cmd=Retrieve&db=PubMed&dopt=Abstract&list_uids=9698003
http://www.ncbi.nlm.nih.gov/entrez/query.fcgi?cmd=Retrieve&db=PubMed&dopt=Abstract&list_uids=9698003
http://www.ncbi.nlm.nih.gov/entrez/query.fcgi?cmd=Retrieve&db=PubMed&dopt=Abstract&list_uids=9698003
http://www.ncbi.nlm.nih.gov/entrez/query.fcgi?cmd=Retrieve&db=PubMed&dopt=Abstract&list_uids=8150826
http://www.ncbi.nlm.nih.gov/entrez/query.fcgi?cmd=Retrieve&db=PubMed&dopt=Abstract&list_uids=8150826
http://www.ncbi.nlm.nih.gov/entrez/query.fcgi?cmd=Retrieve&db=PubMed&dopt=Abstract&list_uids=9917644
http://www.ncbi.nlm.nih.gov/entrez/query.fcgi?cmd=Retrieve&db=PubMed&dopt=Abstract&list_uids=9917644
http://www.ncbi.nlm.nih.gov/entrez/query.fcgi?cmd=Retrieve&db=PubMed&dopt=Abstract&list_uids=9917644
http://www.ncbi.nlm.nih.gov/entrez/query.fcgi?cmd=Retrieve&db=PubMed&dopt=Abstract&list_uids=9457080
http://www.ncbi.nlm.nih.gov/entrez/query.fcgi?cmd=Retrieve&db=PubMed&dopt=Abstract&list_uids=9457080
http://www.ncbi.nlm.nih.gov/entrez/query.fcgi?cmd=Retrieve&db=PubMed&dopt=Abstract&list_uids=9457080
http://www.ncbi.nlm.nih.gov/entrez/query.fcgi?cmd=Retrieve&db=PubMed&dopt=Abstract&list_uids=8528172
http://www.ncbi.nlm.nih.gov/entrez/query.fcgi?cmd=Retrieve&db=PubMed&dopt=Abstract&list_uids=8528172
http://www.ncbi.nlm.nih.gov/entrez/query.fcgi?cmd=Retrieve&db=PubMed&dopt=Abstract&list_uids=8528172
http://www.ncbi.nlm.nih.gov/entrez/query.fcgi?cmd=Retrieve&db=PubMed&dopt=Abstract&list_uids=9893258
http://www.ncbi.nlm.nih.gov/entrez/query.fcgi?cmd=Retrieve&db=PubMed&dopt=Abstract&list_uids=4583660
http://www.ncbi.nlm.nih.gov/entrez/query.fcgi?cmd=Retrieve&db=PubMed&dopt=Abstract&list_uids=9759503
http://www.ncbi.nlm.nih.gov/entrez/query.fcgi?cmd=Retrieve&db=PubMed&dopt=Abstract&list_uids=9621889
http://www.ncbi.nlm.nih.gov/entrez/query.fcgi?cmd=Retrieve&db=PubMed&dopt=Abstract&list_uids=9621889
http://www.ncbi.nlm.nih.gov/entrez/query.fcgi?cmd=Retrieve&db=PubMed&dopt=Abstract&list_uids=9621889
http://www.ncbi.nlm.nih.gov/entrez/query.fcgi?cmd=Retrieve&db=PubMed&dopt=Abstract&list_uids=8223340
BMC Genomics 2007, 8:70 http://www.biomedcentral.com/1471-2164/8/70
Publish with BioMed Central and every scientist can read your work free of charge
"BioMed Central will be the most significant development for disseminating the results of biomedical research in our lifetime."
Sir Paul Nurse, Cancer Research UK
Your research papers will be:
available free of charge to the entire biomedical community
peer reviewed and published immediately upon acceptance
cited in PubMed and archived on PubMed Central
yours — you keep the copyright
Submit your manuscript here:http://www.biomedcentral.com/info/publishing_adv.asp
BioMedcentral
38. Kreider BL, Benezra R, Rovera G, Kadesch T: Inhibition of myeloiddifferentiation by the helix-loop-helix protein Id. Science 1992,255:1700-1702.
39. Zebedee Z, Hara E: Id proteins in cell cycle control and cellularsenescence. Oncogene 2001, 20:8317-8325.
40. Ruzinova MB, Benezra R: Id proteins in development, cell cycleand cancer. Trends Cell Biol 2003, 13:410-418.
41. Norton JD: ID helix-loop-helix proteins in cell growth, differ-entiation and tumorigenesis. J Cell Sci 2000, 113 ( Pt22):3897-3905.
42. Benezra R, Davis RL, Lockshon D, Turner DL, Weintraub H: Theprotein Id: a negative regulator of helix-loop-helix DNAbinding proteins. Cell 1990, 61:49-59.
43. Pagliuca A, Cannada-Bartoli P, Lania L: A role for Sp and helix-loop-helix transcription factors in the regulation of thehuman Id4 gene promoter activity. J Biol Chem 1998,273:7668-7674.
44. Peng Y, Kang Q, Luo Q, Jiang W, Si W, Liu BA, Luu HH, Park JK, LiX, Luo J, Montag AG, Haydon RC, He TC: Inhibitor of DNA bind-ing/differentiation helix-loop-helix proteins mediate bonemorphogenetic protein-induced osteoblast differentiation ofmesenchymal stem cells. J Biol Chem 2004, 279:32941-32949.
45. Derham BK, Harding JJ: Alpha-crystallin as a molecular chaper-one. Prog Retin Eye Res 1999, 18:463-509.
46. Furushima K, Shimo-Onoda K, Maeda S, Nobukuni T, Ikari K, Koga H,Komiya S, Nakajima T, Harata S, Inoue I: Large-scale screening forcandidate genes of ossification of the posterior longitudinalligament of the spine. J Bone Miner Res 2002, 17:128-137.
47. Petersen CM, Nielsen MS, Nykjaer A, Jacobsen L, Tommerup N, Ras-mussen HH, Roigaard H, Gliemann J, Madsen P, Moestrup SK: Molec-ular identification of a novel candidate sorting receptorpurified from human brain by receptor-associated proteinaffinity chromatography. J Biol Chem 1997, 272:3599-3605.
48. Maeda S, Nobukuni T, Shimo-Onoda K, Hayashi K, Yone K, KomiyaS, Inoue I: Sortilin is upregulated during osteoblastic differen-tiation of mesenchymal stem cells and promotes extracellu-lar matrix mineralization. J Cell Physiol 2002, 193:73-79.
49. Nohe A, Hassel S, Ehrlich M, Neubauer F, Sebald W, Henis YI, KnausP: The mode of bone morphogenetic protein (BMP) receptoroligomerization determines different BMP-2 signaling path-ways. J Biol Chem 2002, 277:5330-5338.
50. Afzal F, Pratap J, Ito K, Ito Y, Stein JL, van Wijnen AJ, Stein GS, LianJB, Javed A: Smad function and intranuclear targeting share aRunx2 motif required for osteogenic lineage induction andBMP2 responsive transcription. J Cell Physiol 2005, 204:63-72.
51. ten Dijke P, Goumans MJ, Itoh F, Itoh S: Regulation of cell prolif-eration by Smad proteins. J Cell Physiol 2002, 191:1-16.
52. Pieler R, Sanchez-Cabo F, Hackl H, Thallinger GG, Trajanoski Z:ArrayNorm: comprehensive normalization and analysis ofmicroarray data. Bioinformatics 2004, 20:1971-1973.
53. Sturn A, Quackenbush J, Trajanoski Z: Genesis: cluster analysis ofmicroarray data. Bioinformatics 2002, 18:207-208.
54. Harris MA, Clark J, Ireland A, Lomax J, Ashburner M, Foulger R, Eil-beck K, Lewis S, Marshall B, Mungall C, Richter J, Rubin GM, Blake JA,Bult C, Dolan M, Drabkin H, Eppig JT, Hill DP, Ni L, Ringwald M,Balakrishnan R, Cherry JM, Christie KR, Costanzo MC, Dwight SS,Engel S, Fisk DG, Hirschman JE, Hong EL, Nash RS, Sethuraman A,Theesfeld CL, Botstein D, Dolinski K, Feierbach B, Berardini T, Mun-dodi S, Rhee SY, Apweiler R, Barrell D, Camon E, Dimmer E, Lee V,Chisholm R, Gaudet P, Kibbe W, Kishore R, Schwarz EM, SternbergP, Gwinn M, Hannick L, Wortman J, Berriman M, Wood V, de la CN,Tonellato P, Jaiswal P, Seigfried T, White R: The Gene Ontology(GO) database and informatics resource. Nucleic Acids Res2004, 32:D258-D261.
55. Mlecnik B, Scheideler M, Hackl H, Hartler J, Sanchez-Cabo F, Tra-janoski Z: PathwayExplorer: web service for visualizing high-throughput expression data on biological pathways. NucleicAcids Res 2005, 33:W633-W637.
56. Yeung KY, Haynor DR, Ruzzo WL: Validating clustering for geneexpression data. Bioinformatics 2001, 17:309-318.
57. Maurer M, Molidor R, Sturn A, Hartler J, Hackl H, Stocker G, Proke-sch A, Scheideler M, Trajanoski Z: MARS: microarray analysis,retrieval, and storage system. BMC Bioinformatics 2005,6:101-101.
58. Brazma A, Parkinson H, Sarkans U, Shojatalab M, Vilo J, Abeyguna-wardena N, Holloway E, Kapushesky M, Kemmeren P, Lara GG,
Oezcimen A, Rocca-Serra P, Sansone SA: ArrayExpress--a publicrepository for microarray gene expression data at the EBI.Nucleic Acids Res 2003, 31:68-71.
Page 15 of 15(page number not for citation purposes)
http://www.ncbi.nlm.nih.gov/entrez/query.fcgi?cmd=Retrieve&db=PubMed&dopt=Abstract&list_uids=1372755
http://www.ncbi.nlm.nih.gov/entrez/query.fcgi?cmd=Retrieve&db=PubMed&dopt=Abstract&list_uids=1372755
http://www.ncbi.nlm.nih.gov/entrez/query.fcgi?cmd=Retrieve&db=PubMed&dopt=Abstract&list_uids=2156629
http://www.ncbi.nlm.nih.gov/entrez/query.fcgi?cmd=Retrieve&db=PubMed&dopt=Abstract&list_uids=2156629
http://www.ncbi.nlm.nih.gov/entrez/query.fcgi?cmd=Retrieve&db=PubMed&dopt=Abstract&list_uids=2156629
http://www.ncbi.nlm.nih.gov/entrez/query.fcgi?cmd=Retrieve&db=PubMed&dopt=Abstract&list_uids=9516472
http://www.ncbi.nlm.nih.gov/entrez/query.fcgi?cmd=Retrieve&db=PubMed&dopt=Abstract&list_uids=9516472
http://www.ncbi.nlm.nih.gov/entrez/query.fcgi?cmd=Retrieve&db=PubMed&dopt=Abstract&list_uids=9516472
http://www.ncbi.nlm.nih.gov/entrez/query.fcgi?cmd=Retrieve&db=PubMed&dopt=Abstract&list_uids=9013611
http://www.ncbi.nlm.nih.gov/entrez/query.fcgi?cmd=Retrieve&db=PubMed&dopt=Abstract&list_uids=9013611
Related Documents