CLINICAL TRIAL Gene expression profiling and prediction of response to hormonal neoadjuvant treatment with anastrozole in surgically resectable breast cancer Maurizia Mello-Grand • Vijay Singh • Chiara Ghimenti • Maria Scatolini • Lea Regolo • Enrico Grosso • Alberto Zambelli • Gian Antonio Da Prada • Laura Villani • Vittorio Fregoni • Paola Baiardi • Silvia Marsoni • William R. Miller • Alberto Costa • Giovanna Chiorino Received: 2 March 2010 / Accepted: 1 April 2010 / Published online: 29 April 2010 Ó Springer Science+Business Media, LLC. 2010 Abstract Aromatase inhibition (AI) is the most effective endocrine treatment for breast cancer in post-menopausal patients, but a percentage of hormone receptor-positive cancers do not benefit from such therapy: for example, about 20% of patients treated with anastrozole do not respond and it is still impossible to accurately predict sensitivity. Our main goal was to identify a robust expression signature predictive of response to neoadjuvant treatment with anastrozole in patients with ER? breast cancer. At the same time, we addressed the question of delineating treatment effects and possible mechanisms of intrinsic resistance occurring in non-responder patients. We analyzed the transcriptome of 17 tru-cut biopsies before treatment and 13 matched surgical samples after 3 months treatment with anastrozole taken from ER? breast tumors. Molecular profiles were related to clinical response data. Treatment with anastrozole was associated with a decreased expression of genes relating to cell proliferation and an increased expression of genes relating to inflam- matory processes. There was also an enrichment of induc- tion of T-cell anergy, positive regulation of androgen signalling, synaptic transmission and vesicle trafficking in non-responders, and of cell cycle inhibition and induction of immune response in responders. We identified an expression signature of 77 probes (54 genes) that predicted response in 100% of our cases. Five of them were able to accurately predict response on an independent dataset (P = 0.0056) of 52 ER? breast cancers treated with letrozole. Ten fixed independent samples from the anas- trozole study were also used for RT-qPCR validations. This study suggests that a relative small number of genes ana- lysed in a pre-treatment biopsy may identify patients likely to respond to AI neoadjuvant treatment. This may have practical utility translatable to the clinics. Furthermore, it Maurizia Mello-Grand and Vijay Singh contributed equally to the work. Electronic supplementary material The online version of this article (doi:10.1007/s10549-010-0887-y) contains supplementary material, which is available to authorized users. M. Mello-Grand V. Singh C. Ghimenti M. Scatolini E. Grosso G. Chiorino (&) Cancer Genomics Laboratory, Fondazione ‘‘Edo ed Elvo Tempia Valenta’’, Via Malta 3, 13900 Biella, Italy e-mail: [email protected] L. Regolo A. Costa Unit of Senology, IRCCS Fondazione ‘‘Salvatore Maugeri’’, Pavia, Italy A. Zambelli G. A. Da Prada V. Fregoni Unit of Medical Oncology, IRCCS Fondazione ‘‘Salvatore Maugeri’’, Pavia, Italy L. Villani Unit of Pathology, IRCCS Fondazione ‘‘Salvatore Maugeri’’, Pavia, Italy P. Baiardi Consorzio per le valutazioni Biologiche e Farmacologiche (CVBF), Universita ` degli Studi di Pavia e IRCCS Fondazione ‘‘Salvatore Maugeri’’, Pavia, Italy S. Marsoni Southern Europe New Drug Organization, Milano, Italy W. R. Miller Breast Research Group, University of Edinburgh, Edinburgh, UK A. Costa Ente Ospedaliero Cantonale, Lugano, Switzerland 123 Breast Cancer Res Treat (2010) 121:399–411 DOI 10.1007/s10549-010-0887-y

Welcome message from author
This document is posted to help you gain knowledge. Please leave a comment to let me know what you think about it! Share it to your friends and learn new things together.
Transcript
CLINICAL TRIAL
Gene expression profiling and prediction of response to hormonalneoadjuvant treatment with anastrozole in surgically resectablebreast cancer
Maurizia Mello-Grand • Vijay Singh • Chiara Ghimenti • Maria Scatolini •
Lea Regolo • Enrico Grosso • Alberto Zambelli • Gian Antonio Da Prada •
Laura Villani • Vittorio Fregoni • Paola Baiardi • Silvia Marsoni •
William R. Miller • Alberto Costa • Giovanna Chiorino
Received: 2 March 2010 / Accepted: 1 April 2010 / Published online: 29 April 2010
� Springer Science+Business Media, LLC. 2010
Abstract Aromatase inhibition (AI) is the most effective
endocrine treatment for breast cancer in post-menopausal
patients, but a percentage of hormone receptor-positive
cancers do not benefit from such therapy: for example,
about 20% of patients treated with anastrozole do not
respond and it is still impossible to accurately predict
sensitivity. Our main goal was to identify a robust
expression signature predictive of response to neoadjuvant
treatment with anastrozole in patients with ER? breast
cancer. At the same time, we addressed the question of
delineating treatment effects and possible mechanisms of
intrinsic resistance occurring in non-responder patients. We
analyzed the transcriptome of 17 tru-cut biopsies before
treatment and 13 matched surgical samples after 3 months
treatment with anastrozole taken from ER? breast tumors.
Molecular profiles were related to clinical response
data. Treatment with anastrozole was associated with a
decreased expression of genes relating to cell proliferation
and an increased expression of genes relating to inflam-
matory processes. There was also an enrichment of induc-
tion of T-cell anergy, positive regulation of androgen
signalling, synaptic transmission and vesicle trafficking in
non-responders, and of cell cycle inhibition and induction
of immune response in responders. We identified an
expression signature of 77 probes (54 genes) that predicted
response in 100% of our cases. Five of them were able to
accurately predict response on an independent dataset
(P = 0.0056) of 52 ER? breast cancers treated with
letrozole. Ten fixed independent samples from the anas-
trozole study were also used for RT-qPCR validations. This
study suggests that a relative small number of genes ana-
lysed in a pre-treatment biopsy may identify patients likely
to respond to AI neoadjuvant treatment. This may have
practical utility translatable to the clinics. Furthermore, it
Maurizia Mello-Grand and Vijay Singh contributed equally to the
work.
Electronic supplementary material The online version of thisarticle (doi:10.1007/s10549-010-0887-y) contains supplementarymaterial, which is available to authorized users.
M. Mello-Grand � V. Singh � C. Ghimenti � M. Scatolini �E. Grosso � G. Chiorino (&)
Cancer Genomics Laboratory, Fondazione ‘‘Edo ed Elvo
Tempia Valenta’’, Via Malta 3, 13900 Biella, Italy
e-mail: [email protected]
L. Regolo � A. Costa
Unit of Senology, IRCCS Fondazione
‘‘Salvatore Maugeri’’, Pavia, Italy
A. Zambelli � G. A. Da Prada � V. Fregoni
Unit of Medical Oncology, IRCCS Fondazione
‘‘Salvatore Maugeri’’, Pavia, Italy
L. Villani
Unit of Pathology, IRCCS Fondazione
‘‘Salvatore Maugeri’’, Pavia, Italy
P. Baiardi
Consorzio per le valutazioni Biologiche e Farmacologiche
(CVBF), Universita degli Studi di Pavia e IRCCS Fondazione
‘‘Salvatore Maugeri’’, Pavia, Italy
S. Marsoni
Southern Europe New Drug Organization, Milano, Italy
W. R. Miller
Breast Research Group, University of Edinburgh,
Edinburgh, UK
A. Costa
Ente Ospedaliero Cantonale, Lugano, Switzerland
123
Breast Cancer Res Treat (2010) 121:399–411
DOI 10.1007/s10549-010-0887-y
delineates novel mechanisms of intrinsic resistance to AI
therapy that could be further investigated in order to
explore circumventing treatments.
Keywords Breast cancer � Aromatase inhibitors �Gene expression profiling � Neoadjuvant treatment �Response prediction � Intrinsic resistance
Introduction
Breast cancer represents the most widespread tumor in
Western women: incidence in Italy is more than 30,000 new
cases per year. Nearly 80% of human mammary carcinomas
express estrogen receptor (ER) at clinically significant levels
[1]. Estrogen-bound ER induces the expression of peptide
growth factors that are responsible for cancer cell proliferation.
In estrogen-dependent breast tumors, control of tumor
growth can be achieved by treatment with estrogen antago-
nists that block the binding of the hormone to ER: tamoxifen
has been the predominant treatment for the past two decades
[1, 2]. In postmenopausal women, aromatase inhibitors (AIs)
have shown to be more effective than tamoxifen as adjuvant
therapy [3–6]. Aromatase is the enzyme that synthesizes
estrogens by converting C19 androgens to aromatic C18
estrogenic steroids. Experimental results indicate that auto-
crine produced estrogen plays a more important role than
circulating extradiol in breast tumor promotion: aromatase is
expressed in breast tumor tissue (both cancer and sur-
rounding adipose stromal cells) probably at a higher level
than in normal breast tissue [7, 8]. In hormone dependent
breast cancer, neoadjuvant therapy with third generation AI
therapy (anastrozole, letrozole, exemestane) reduces prolif-
eration, causes cell death and produces tumor regression
[9, 10]. Although of proven clinical efficacy, such therapies
are still associated with non-response in about 20% of cases
[11]. Up to now, it is still impossible to accurately predict
who will respond to such treatments.
Furthermore, little is known of (i) the effects of anti-
aromatase treatment in vivo, (ii) how these effects vary
between tumors and (iii) whether the molecular changes
fully reflect and are responsible for the clinical response.
Preoperative treatment followed by surgical resection
provides an excellent opportunity to correlate baseline
molecular markers measured in a diagnostic needle biopsy
with subsequent response to treatment, and to delineate
molecular changes induced by the treatment itself.
A pivotal study on anastrozole treatment in 12 patients
identified 298 genes differentially expressed between par-
tial response and progressive disease [12]. Signatures cor-
related to response to neoadjuvant treatment have been also
identified for exemestane, although on a very small patient
cohort, and letrozole [13, 14].
Our goals were to (i) examine changes in gene expres-
sion with anastrozole therapy and (ii) identify genetic
signatures that might distinguish between ER? post-men-
opausal breast cancers benefiting from treatment and those
not. To elucidate mode of action, we compared the tran-
scriptional profile before and after three months of anas-
trozole treatment in 13 patients. In order to derive a
predictive signature, we analysed global gene expression
profiles of 17 ER? breast cancers before neoadjuvant
therapy and associated them to response values. Genes
predictive of response were then tested on a publicly
available independent dataset [14] and on an independent
cohort of fixed tissues.
Methods
Patients
All tumor samples and clinical data were collected with the
Fondazione S. Maugeri ethical committee’s approval and
patients’ informed consent. The 17 patients, enrolled into
this study between July 2004 to November 2007, were
post-menopausal and had breast cancer stage T2 or T3,
greater than 2.5 centimeters, any lymph node status and no
distant metastasis. All the tumors were HER2/neu- and
ER?/PgR?, except 2 that were ER?/PgR- (Table 1).
They received neoadjuvant therapy with Anastrozole
(ArimidexTM, Astra Zeneca) 1 mg po/die for three months.
Clinical response was evaluated by serial tumor clinical
examination and mammary ultrasound bidimensional
measurements, performed by single operator (LR) before,
during and after treatment. Patients with decrease in tumor
volume greater than or equal to 30%, according to RECIST
criteria [15], were classified as responders.
Microarray hybridization and data processing
Samples were removed by tru-cut biopsy or surgical
resection and stored in RNAlater (Ambion Inc., Austin,
TX) for processing. Tissues were homogenized and total
RNA was isolated using TriReagent (Sigma-Aldrich,
St. Louis, MO) and RNeasy Mini Kit (Qiagen, Dusseldorf,
Germany). mRNA amplification and labeling, quality
control and microarray hybridization were carried out as
previously described [16]. Two oligonucleotide glass
arrays (Human Whole Genome Oligo Microarray 1x44K or
4x44K, Agilent Technologies, Palo Alto, CA) were utilized
for each sample, using the Human Universal Reference
Total RNA (Clontech, Palo Alto, CA) as baseline and dye-
swap duplication.
Slides were scanned with the Agilent G2505B scanner
and the TIFF images loaded into the Feature Extraction
400 Breast Cancer Res Treat (2010) 121:399–411
123
software (Agilent Technologies). Raw data were processed
using the statistical computing software ‘‘R’’ and packages
from Bioconductor (www.bioconductor.org); ‘‘limma’’ was
used for preprocessing and differential expression analysis.
Raw intensities were first background corrected (‘‘nor-
mexp’’ method, with an offset value of 50 added to red and
green intensities so that log-ratios are shrunk towards zero
at lower intensities). In order to set log-ratios average to
zero within each array and to have similar log-ratio dis-
tributions across all arrays, ‘‘loess’’ and ‘‘Aquantile’’ nor-
malization were performed [17].
Gene ontology analysis was accomplished with GOEAST
(http://omicslab.genetics.ac.cn/GOEAST/) and pathway anal-
ysis with ‘‘MetaCore 5.0’’ (GeneGO, St. Joseph, MI).
Signature extraction and evaluation
Genes differentially expressed by the treatment were
obtained as previously described [18]. The difference matrix
was defined as the difference between post and pre treatment
expression matrices. To derive a predictive signature, we
first calculated the Pearson correlation coefficient between
tru-cut expression and response data, used as continuous
variable. Then the two sample modified t-test available in
the ‘‘limma’’ package was performed, using response data as
a binary variable. The best predictors from the two lists were
selected using the rank product method.
For sample classification, leave-one-out cross validation
procedure was applied. Briefly, for each list of predictors,
the following procedure was carried out: one sample was
leaved out and two centroids, one representing responders
and the other non-responders, were derived by kmeans
clustering and response status was assigned based on
majority rule. Then the sample initially leaved out was
assigned a class based on Euclidean distance from the two
centroids. The procedure was repeated 17 times leaving out
each time one sample from centroid calculation and the
number of correct prediction reflects the performance of
the signature.
To validate the procedure, radical leave-one-out cross
validation was performed, where the whole process of
signature derivation was repeated leaving each time one
sample out of the analysis and the derived signature was
used to classify the sample initially leaved out.
The standalone JAVA-based Signature Evaluation Tool
(http://microarray.ym.edu.tw) was used to predict respon-
siveness on test samples in radical leave-one-out cross
validation and on the independent dataset (GSE5462).
RT-qPCR
Total RNA was extracted from an independent cohort of 10
formalin-fixed, paraffin-embedded breast cancer pre-treat-
ment biopsies using Recover All Nucleic Acid Isolation kit
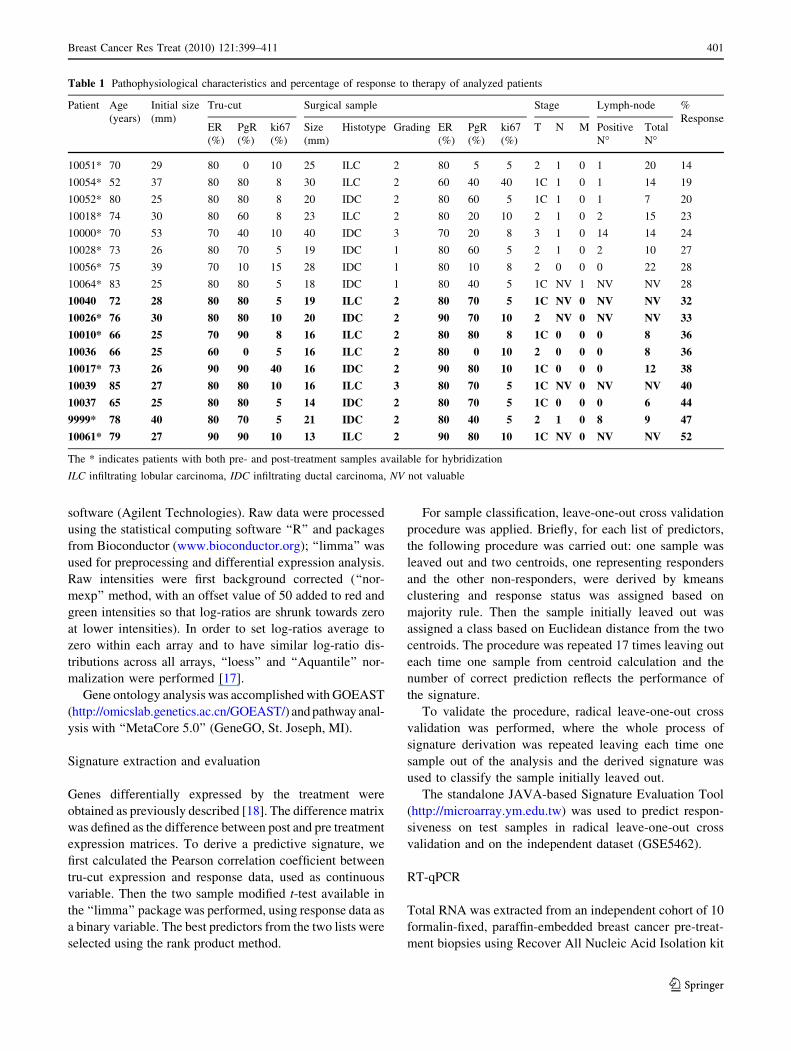
Table 1 Pathophysiological characteristics and percentage of response to therapy of analyzed patients
Patient Age
(years)
Initial size
(mm)
Tru-cut Surgical sample Stage Lymph-node %
ResponseER
(%)
PgR
(%)
ki67
(%)
Size
(mm)
Histotype Grading ER
(%)
PgR
(%)
ki67
(%)
T N M Positive
N�Total
N�
10051* 70 29 80 0 10 25 ILC 2 80 5 5 2 1 0 1 20 14
10054* 52 37 80 80 8 30 ILC 2 60 40 40 1C 1 0 1 14 19
10052* 80 25 80 80 8 20 IDC 2 80 60 5 1C 1 0 1 7 20
10018* 74 30 80 60 8 23 ILC 2 80 20 10 2 1 0 2 15 23
10000* 70 53 70 40 10 40 IDC 3 70 20 8 3 1 0 14 14 24
10028* 73 26 80 70 5 19 IDC 1 80 60 5 2 1 0 2 10 27
10056* 75 39 70 10 15 28 IDC 1 80 10 8 2 0 0 0 22 28
10064* 83 25 80 80 5 18 IDC 1 80 40 5 1C NV 1 NV NV 28
10040 72 28 80 80 5 19 ILC 2 80 70 5 1C NV 0 NV NV 32
10026* 76 30 80 80 10 20 IDC 2 90 70 10 2 NV 0 NV NV 33
10010* 66 25 70 90 8 16 ILC 2 80 80 8 1C 0 0 0 8 36
10036 66 25 60 0 5 16 ILC 2 80 0 10 2 0 0 0 8 36
10017* 73 26 90 90 40 16 IDC 2 90 80 10 1C 0 0 0 12 38
10039 85 27 80 80 10 16 ILC 3 80 70 5 1C NV 0 NV NV 40
10037 65 25 80 80 5 14 IDC 2 80 70 5 1C 0 0 0 6 44
9999* 78 40 80 70 5 21 IDC 2 80 40 5 2 1 0 8 9 47
10061* 79 27 90 90 10 13 ILC 2 90 80 10 1C NV 0 NV NV 52
The * indicates patients with both pre- and post-treatment samples available for hybridization
ILC infiltrating lobular carcinoma, IDC infiltrating ductal carcinoma, NV not valuable
Breast Cancer Res Treat (2010) 121:399–411 401
123
(Ambion Inc., Austin, TX), according to manufacturer
instructions.
Reverse Transcriptase quantitative Polymerase Chain
Reaction (RT-qPCR) was performed as previously descri-
bed [19] to validate a subset of differently expressed
transcripts (CXCL3, GSS, FBXL18 and DUSP1) identified
by microarray analysis on fresh samples. Primers sequen-
ces are available in Supplementary Table 1. First strand
cDNA synthesis was performed using 200 ng of total RNA.
The relative abundance of transcripts was established using
the mean expression of TBP and RPLP0 for normalization
of input cDNA.
Results
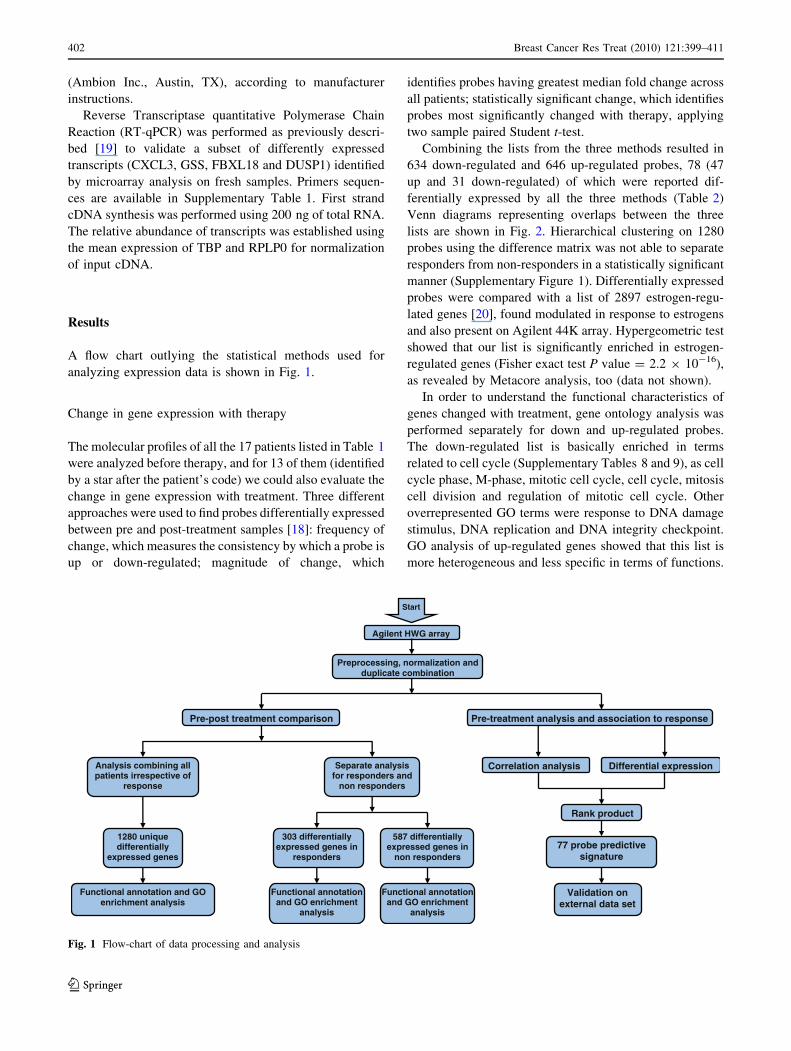
A flow chart outlying the statistical methods used for
analyzing expression data is shown in Fig. 1.
Change in gene expression with therapy
The molecular profiles of all the 17 patients listed in Table 1
were analyzed before therapy, and for 13 of them (identified
by a star after the patient’s code) we could also evaluate the
change in gene expression with treatment. Three different
approaches were used to find probes differentially expressed
between pre and post-treatment samples [18]: frequency of
change, which measures the consistency by which a probe is
up or down-regulated; magnitude of change, which
identifies probes having greatest median fold change across
all patients; statistically significant change, which identifies
probes most significantly changed with therapy, applying
two sample paired Student t-test.
Combining the lists from the three methods resulted in
634 down-regulated and 646 up-regulated probes, 78 (47
up and 31 down-regulated) of which were reported dif-
ferentially expressed by all the three methods (Table 2)
Venn diagrams representing overlaps between the three
lists are shown in Fig. 2. Hierarchical clustering on 1280
probes using the difference matrix was not able to separate
responders from non-responders in a statistically significant
manner (Supplementary Figure 1). Differentially expressed
probes were compared with a list of 2897 estrogen-regu-
lated genes [20], found modulated in response to estrogens
and also present on Agilent 44K array. Hypergeometric test
showed that our list is significantly enriched in estrogen-
regulated genes (Fisher exact test P value = 2.2 9 10-16),
as revealed by Metacore analysis, too (data not shown).
In order to understand the functional characteristics of
genes changed with treatment, gene ontology analysis was
performed separately for down and up-regulated probes.
The down-regulated list is basically enriched in terms
related to cell cycle (Supplementary Tables 8 and 9), as cell
cycle phase, M-phase, mitotic cell cycle, cell cycle, mitosis
cell division and regulation of mitotic cell cycle. Other
overrepresented GO terms were response to DNA damage
stimulus, DNA replication and DNA integrity checkpoint.
GO analysis of up-regulated genes showed that this list is
more heterogeneous and less specific in terms of functions.
Separate analysis for responders and
non responders
303 differentially expressed genes in
responders
Functional annotation and GO enrichment
analysis
587 differentially expressed genes in
non responders
Start
Agilent HWG array
Preprocessing, normalization and duplicate combination
Pre-post treatment comparison Pre-treatment analysis and association to response
Correlation analysis Differential expression
Validation onexternal data set
Rank product
77 probe predictive signature
1280 unique differentially
expressed genes
Analysis combining all patients irrespective of
response
Functional annotation and GO enrichment
analysis
Functional annotation and GO enrichment analysis
Fig. 1 Flow-chart of data processing and analysis
402 Breast Cancer Res Treat (2010) 121:399–411
123
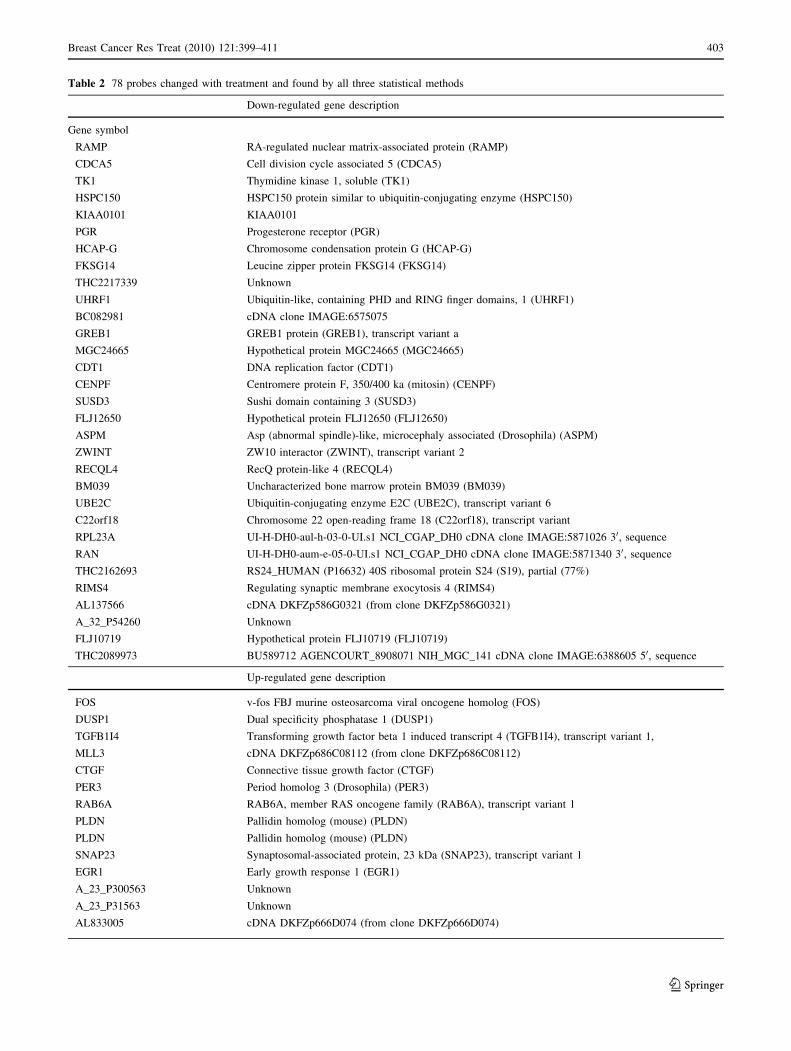
Table 2 78 probes changed with treatment and found by all three statistical methods
Down-regulated gene description
Gene symbol
RAMP RA-regulated nuclear matrix-associated protein (RAMP)
CDCA5 Cell division cycle associated 5 (CDCA5)
TK1 Thymidine kinase 1, soluble (TK1)
HSPC150 HSPC150 protein similar to ubiquitin-conjugating enzyme (HSPC150)
KIAA0101 KIAA0101
PGR Progesterone receptor (PGR)
HCAP-G Chromosome condensation protein G (HCAP-G)
FKSG14 Leucine zipper protein FKSG14 (FKSG14)
THC2217339 Unknown
UHRF1 Ubiquitin-like, containing PHD and RING finger domains, 1 (UHRF1)
BC082981 cDNA clone IMAGE:6575075
GREB1 GREB1 protein (GREB1), transcript variant a
MGC24665 Hypothetical protein MGC24665 (MGC24665)
CDT1 DNA replication factor (CDT1)
CENPF Centromere protein F, 350/400 ka (mitosin) (CENPF)
SUSD3 Sushi domain containing 3 (SUSD3)
FLJ12650 Hypothetical protein FLJ12650 (FLJ12650)
ASPM Asp (abnormal spindle)-like, microcephaly associated (Drosophila) (ASPM)
ZWINT ZW10 interactor (ZWINT), transcript variant 2
RECQL4 RecQ protein-like 4 (RECQL4)
BM039 Uncharacterized bone marrow protein BM039 (BM039)
UBE2C Ubiquitin-conjugating enzyme E2C (UBE2C), transcript variant 6
C22orf18 Chromosome 22 open-reading frame 18 (C22orf18), transcript variant
RPL23A UI-H-DH0-aul-h-03-0-UI.s1 NCI_CGAP_DH0 cDNA clone IMAGE:5871026 30, sequence
RAN UI-H-DH0-aum-e-05-0-UI.s1 NCI_CGAP_DH0 cDNA clone IMAGE:5871340 30, sequence
THC2162693 RS24_HUMAN (P16632) 40S ribosomal protein S24 (S19), partial (77%)
RIMS4 Regulating synaptic membrane exocytosis 4 (RIMS4)
AL137566 cDNA DKFZp586G0321 (from clone DKFZp586G0321)
A_32_P54260 Unknown
FLJ10719 Hypothetical protein FLJ10719 (FLJ10719)
THC2089973 BU589712 AGENCOURT_8908071 NIH_MGC_141 cDNA clone IMAGE:6388605 50, sequence
Up-regulated gene description
FOS v-fos FBJ murine osteosarcoma viral oncogene homolog (FOS)
DUSP1 Dual specificity phosphatase 1 (DUSP1)
TGFB1I4 Transforming growth factor beta 1 induced transcript 4 (TGFB1I4), transcript variant 1,
MLL3 cDNA DKFZp686C08112 (from clone DKFZp686C08112)
CTGF Connective tissue growth factor (CTGF)
PER3 Period homolog 3 (Drosophila) (PER3)
RAB6A RAB6A, member RAS oncogene family (RAB6A), transcript variant 1
PLDN Pallidin homolog (mouse) (PLDN)
PLDN Pallidin homolog (mouse) (PLDN)
SNAP23 Synaptosomal-associated protein, 23 kDa (SNAP23), transcript variant 1
EGR1 Early growth response 1 (EGR1)
A_23_P300563 Unknown
A_23_P31563 Unknown
AL833005 cDNA DKFZp666D074 (from clone DKFZp666D074)
Breast Cancer Res Treat (2010) 121:399–411 403
123
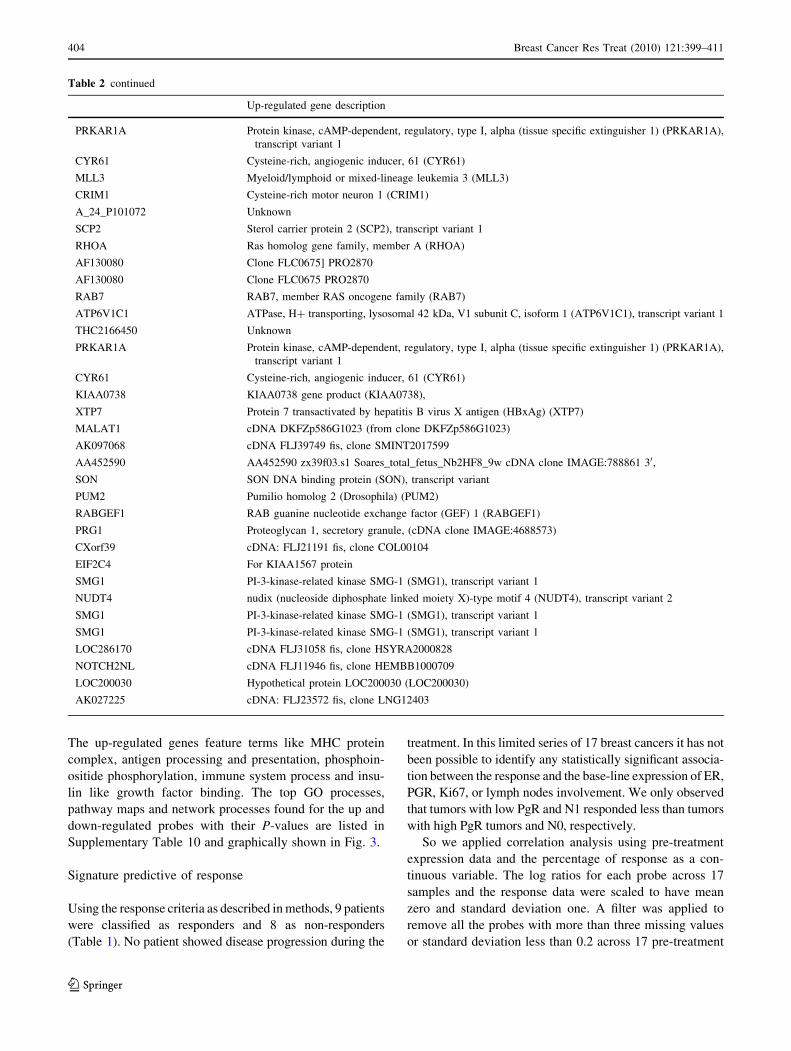
The up-regulated genes feature terms like MHC protein
complex, antigen processing and presentation, phosphoin-
ositide phosphorylation, immune system process and insu-
lin like growth factor binding. The top GO processes,
pathway maps and network processes found for the up and
down-regulated probes with their P-values are listed in
Supplementary Table 10 and graphically shown in Fig. 3.
Signature predictive of response
Using the response criteria as described in methods, 9 patients
were classified as responders and 8 as non-responders
(Table 1). No patient showed disease progression during the
treatment. In this limited series of 17 breast cancers it has not
been possible to identify any statistically significant associa-
tion between the response and the base-line expression of ER,
PGR, Ki67, or lymph nodes involvement. We only observed
that tumors with low PgR and N1 responded less than tumors
with high PgR tumors and N0, respectively.
So we applied correlation analysis using pre-treatment
expression data and the percentage of response as a con-
tinuous variable. The log ratios for each probe across 17
samples and the response data were scaled to have mean
zero and standard deviation one. A filter was applied to
remove all the probes with more than three missing values
or standard deviation less than 0.2 across 17 pre-treatment
Table 2 continued
Up-regulated gene description
PRKAR1A Protein kinase, cAMP-dependent, regulatory, type I, alpha (tissue specific extinguisher 1) (PRKAR1A),
transcript variant 1
CYR61 Cysteine-rich, angiogenic inducer, 61 (CYR61)
MLL3 Myeloid/lymphoid or mixed-lineage leukemia 3 (MLL3)
CRIM1 Cysteine-rich motor neuron 1 (CRIM1)
A_24_P101072 Unknown
SCP2 Sterol carrier protein 2 (SCP2), transcript variant 1
RHOA Ras homolog gene family, member A (RHOA)
AF130080 Clone FLC0675] PRO2870
AF130080 Clone FLC0675 PRO2870
RAB7 RAB7, member RAS oncogene family (RAB7)
ATP6V1C1 ATPase, H? transporting, lysosomal 42 kDa, V1 subunit C, isoform 1 (ATP6V1C1), transcript variant 1
THC2166450 Unknown
PRKAR1A Protein kinase, cAMP-dependent, regulatory, type I, alpha (tissue specific extinguisher 1) (PRKAR1A),
transcript variant 1
CYR61 Cysteine-rich, angiogenic inducer, 61 (CYR61)
KIAA0738 KIAA0738 gene product (KIAA0738),
XTP7 Protein 7 transactivated by hepatitis B virus X antigen (HBxAg) (XTP7)
MALAT1 cDNA DKFZp586G1023 (from clone DKFZp586G1023)
AK097068 cDNA FLJ39749 fis, clone SMINT2017599
AA452590 AA452590 zx39f03.s1 Soares_total_fetus_Nb2HF8_9w cDNA clone IMAGE:788861 30,
SON SON DNA binding protein (SON), transcript variant
PUM2 Pumilio homolog 2 (Drosophila) (PUM2)
RABGEF1 RAB guanine nucleotide exchange factor (GEF) 1 (RABGEF1)
PRG1 Proteoglycan 1, secretory granule, (cDNA clone IMAGE:4688573)
CXorf39 cDNA: FLJ21191 fis, clone COL00104
EIF2C4 For KIAA1567 protein
SMG1 PI-3-kinase-related kinase SMG-1 (SMG1), transcript variant 1
NUDT4 nudix (nucleoside diphosphate linked moiety X)-type motif 4 (NUDT4), transcript variant 2
SMG1 PI-3-kinase-related kinase SMG-1 (SMG1), transcript variant 1
SMG1 PI-3-kinase-related kinase SMG-1 (SMG1), transcript variant 1
LOC286170 cDNA FLJ31058 fis, clone HSYRA2000828
NOTCH2NL cDNA FLJ11946 fis, clone HEMBB1000709
LOC200030 Hypothetical protein LOC200030 (LOC200030)
AK027225 cDNA: FLJ23572 fis, clone LNG12403
404 Breast Cancer Res Treat (2010) 121:399–411
123
samples. After the filtering step, 35,181 probes were
selected for further analysis. 159 probes had correlation test
P-value less than 0.01. Out of these, 107 were positively
correlated and 52 negatively correlated with response.
Probes with their correlation and associated P-value are
listed in Supplementary Table 11. Hierarchical clustering
with Euclidean distance over 159 probes classifies patients
into 2 distinct groups (Fig. 4): the cluster on the left con-
tains only non-responders, while the one on the right
contains all the responders and two patients with response
DownR.fc
DownR.mc DownR.sc
22
46 486
31 17 23
9
UpR.fc
UpR.mc UpR.sc
25
169 260
47 18 113
14
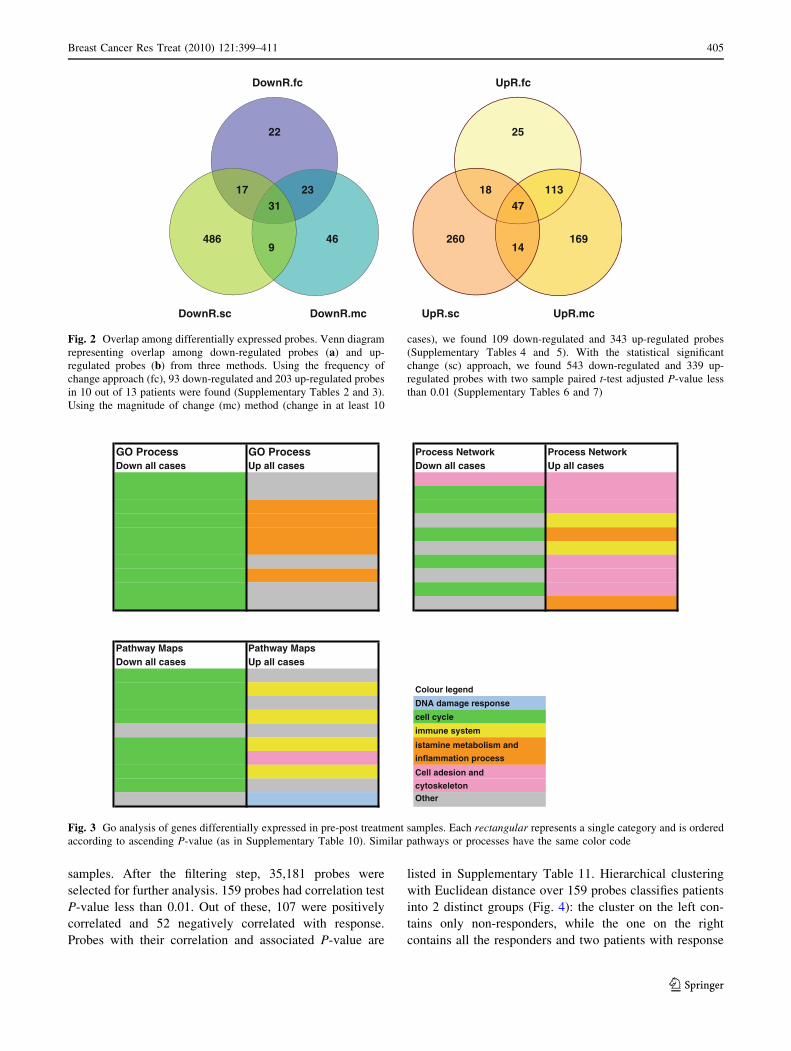
Fig. 2 Overlap among differentially expressed probes. Venn diagram
representing overlap among down-regulated probes (a) and up-
regulated probes (b) from three methods. Using the frequency of
change approach (fc), 93 down-regulated and 203 up-regulated probes
in 10 out of 13 patients were found (Supplementary Tables 2 and 3).
Using the magnitude of change (mc) method (change in at least 10
cases), we found 109 down-regulated and 343 up-regulated probes
(Supplementary Tables 4 and 5). With the statistical significant
change (sc) approach, we found 543 down-regulated and 339 up-
regulated probes with two sample paired t-test adjusted P-value less
than 0.01 (Supplementary Tables 6 and 7)
GO Process GO Process Process Network Process Networksesac lla pUsesac lla nwoDsesac lla pUsesac lla nwoD
Pathway Maps Pathway MapsDown all cases Up all cases
Colour legend
DNA damage response
cell cycle
immune system
istamine metabolism and
inflammation process
Cell adesion and
cytoskeletonOther
Fig. 3 Go analysis of genes differentially expressed in pre-post treatment samples. Each rectangular represents a single category and is ordered
according to ascending P-value (as in Supplementary Table 10). Similar pathways or processes have the same color code
Breast Cancer Res Treat (2010) 121:399–411 405
123
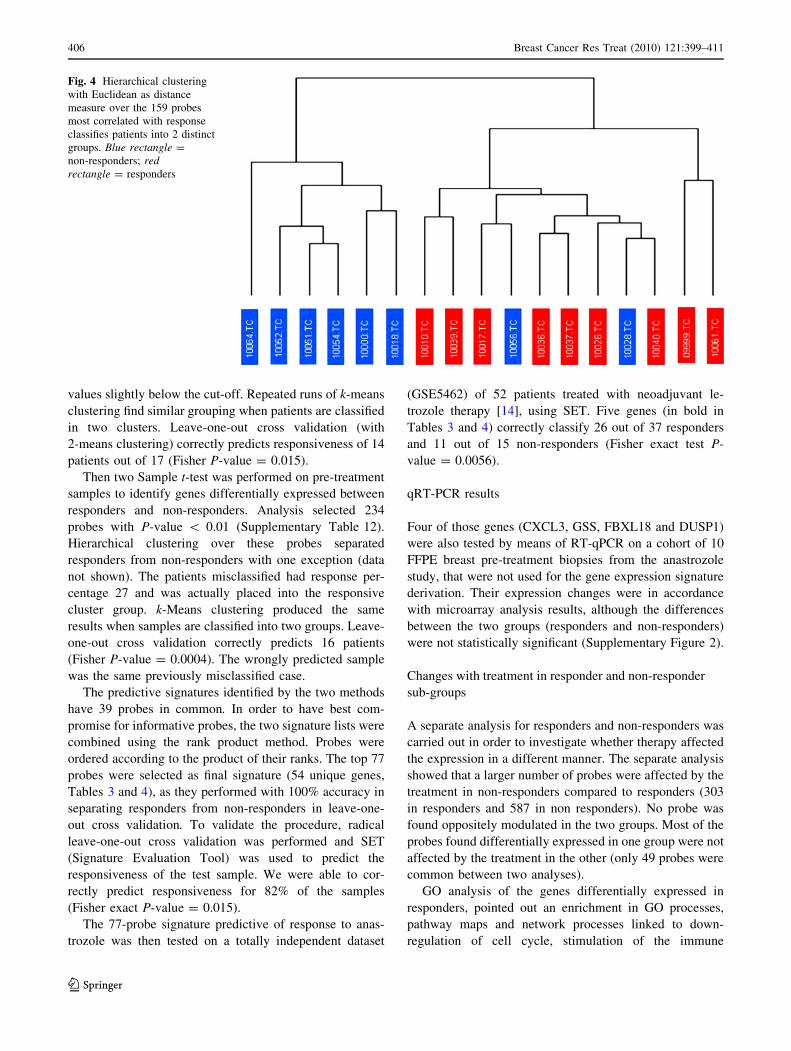
values slightly below the cut-off. Repeated runs of k-means
clustering find similar grouping when patients are classified
in two clusters. Leave-one-out cross validation (with
2-means clustering) correctly predicts responsiveness of 14
patients out of 17 (Fisher P-value = 0.015).
Then two Sample t-test was performed on pre-treatment
samples to identify genes differentially expressed between
responders and non-responders. Analysis selected 234
probes with P-value \ 0.01 (Supplementary Table 12).
Hierarchical clustering over these probes separated
responders from non-responders with one exception (data
not shown). The patients misclassified had response per-
centage 27 and was actually placed into the responsive
cluster group. k-Means clustering produced the same
results when samples are classified into two groups. Leave-
one-out cross validation correctly predicts 16 patients
(Fisher P-value = 0.0004). The wrongly predicted sample
was the same previously misclassified case.
The predictive signatures identified by the two methods
have 39 probes in common. In order to have best com-
promise for informative probes, the two signature lists were
combined using the rank product method. Probes were
ordered according to the product of their ranks. The top 77
probes were selected as final signature (54 unique genes,
Tables 3 and 4), as they performed with 100% accuracy in
separating responders from non-responders in leave-one-
out cross validation. To validate the procedure, radical
leave-one-out cross validation was performed and SET
(Signature Evaluation Tool) was used to predict the
responsiveness of the test sample. We were able to cor-
rectly predict responsiveness for 82% of the samples
(Fisher exact P-value = 0.015).
The 77-probe signature predictive of response to anas-
trozole was then tested on a totally independent dataset
(GSE5462) of 52 patients treated with neoadjuvant le-
trozole therapy [14], using SET. Five genes (in bold in
Tables 3 and 4) correctly classify 26 out of 37 responders
and 11 out of 15 non-responders (Fisher exact test P-
value = 0.0056).
qRT-PCR results
Four of those genes (CXCL3, GSS, FBXL18 and DUSP1)
were also tested by means of RT-qPCR on a cohort of 10
FFPE breast pre-treatment biopsies from the anastrozole
study, that were not used for the gene expression signature
derivation. Their expression changes were in accordance
with microarray analysis results, although the differences
between the two groups (responders and non-responders)
were not statistically significant (Supplementary Figure 2).
Changes with treatment in responder and non-responder
sub-groups
A separate analysis for responders and non-responders was
carried out in order to investigate whether therapy affected
the expression in a different manner. The separate analysis
showed that a larger number of probes were affected by the
treatment in non-responders compared to responders (303
in responders and 587 in non responders). No probe was
found oppositely modulated in the two groups. Most of the
probes found differentially expressed in one group were not
affected by the treatment in the other (only 49 probes were
common between two analyses).
GO analysis of the genes differentially expressed in
responders, pointed out an enrichment in GO processes,
pathway maps and network processes linked to down-
regulation of cell cycle, stimulation of the immune
Fig. 4 Hierarchical clustering
with Euclidean as distance
measure over the 159 probes
most correlated with response
classifies patients into 2 distinct
groups. Blue rectangle =
non-responders; redrectangle = responders
406 Breast Cancer Res Treat (2010) 121:399–411
123
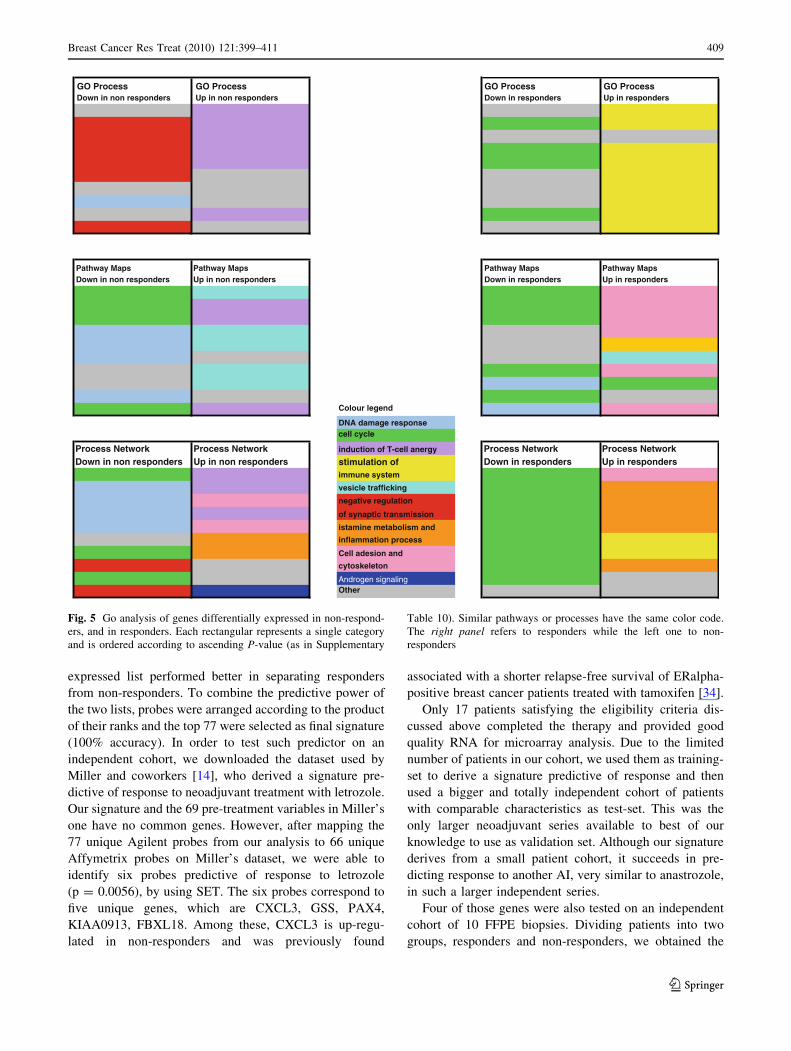
response, and cell adhesion and cytoskeleton (Fig. 5, right
panel, and Supplementary Table 10). On the contrary, non-
responders showed an increase in mechanisms of induction
of T-Cell energy by MHC antigen presentation without
IL-2 production, and were characterized by a positive
regulation of processes and pathways related to androgen
receptor nuclear signaling, vesicle trafficking and synap-
tic transmission (Fig. 5, left panel, and Supplementary
Table 10).
Discussion
Studies to investigate the effect of estrogen or endocrine
agents on gene expression have usually utilized in vitro
systems in which cells were cultured in presence of agents
for only hours or days before expression analysis [21].
Early responsive genes have been identified whose
expression may or may not remain modulated after a longer
period of exposure. Considering the complexity of breast
tumor, it is important to utilize different approaches to
investigate the effect of estrogen on tumor proliferation
[22–25]. In this respect, neoadjuvant treatment provides a
unique opportunity to study molecular/genetic changes
induced by therapy in breast cancer patients. However,
relative few studies have been published so far on phar-
macogenomic predictors of response [12–14, 18, 26, 27].
In the present study, we analyzed the molecular changes
induced by anastrozole in post-menopausal breast cancer
patients and looked for a signature predictive of response.
For this purpose, whole genome expression profiles of
biopsies collected before treatment were analyzed and
associated with clinical–pathological response to treatment.
Gene ontology analysis of differentially expressed genes
between pre and post-treatment samples showed that the
list of down-regulated genes mainly contains features
related to cell cycle progression, growth, DNA damage
stimulus and DNA integrity checkpoint. Proliferation pro-
moting genes are also differentially expressed between pre
and post-treatment samples. Gene network analysis also
showed that many genes transcriptionally activated by
ESR1 (estrogen receptor 1) were among the down-regu-
lated list. Similar results for down-regulated genes were
also obtained by Miller et al. [18] and Mackay et al. [27].
By contrast, among up-regulated genes we found the
overrepresentation of processes linked to immune system,
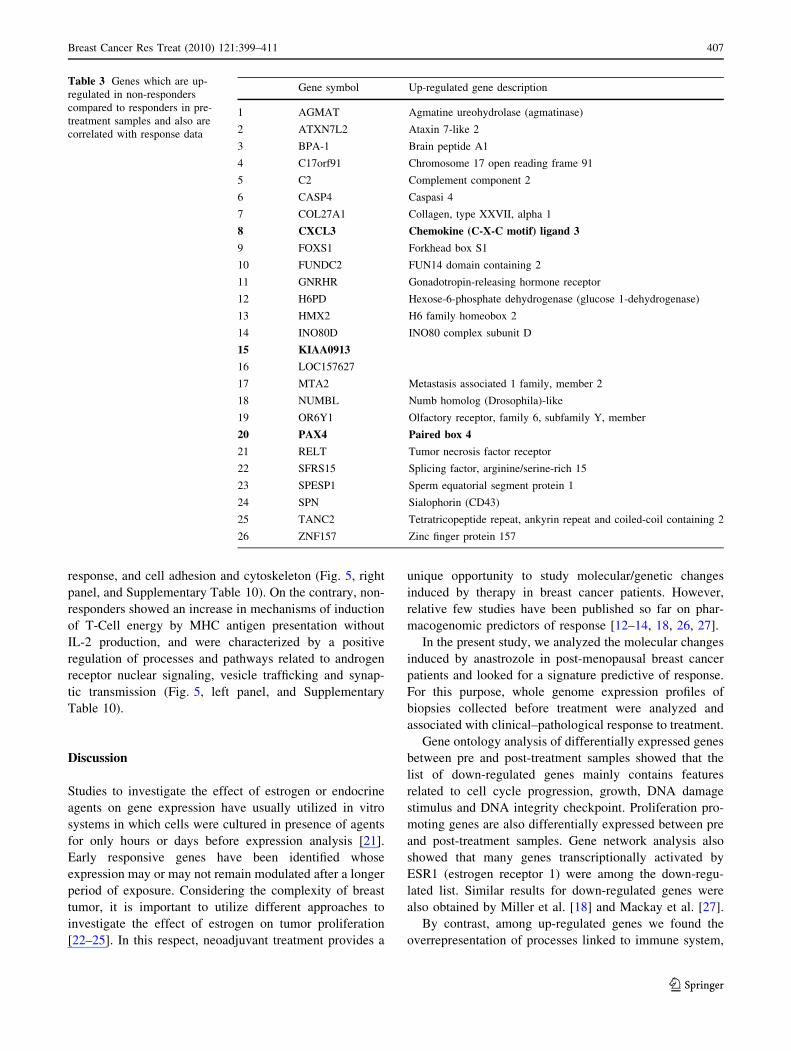
Table 3 Genes which are up-
regulated in non-responders
compared to responders in pre-
treatment samples and also are
correlated with response data
Gene symbol Up-regulated gene description
1 AGMAT Agmatine ureohydrolase (agmatinase)
2 ATXN7L2 Ataxin 7-like 2
3 BPA-1 Brain peptide A1
4 C17orf91 Chromosome 17 open reading frame 91
5 C2 Complement component 2
6 CASP4 Caspasi 4
7 COL27A1 Collagen, type XXVII, alpha 1
8 CXCL3 Chemokine (C-X-C motif) ligand 3
9 FOXS1 Forkhead box S1
10 FUNDC2 FUN14 domain containing 2
11 GNRHR Gonadotropin-releasing hormone receptor
12 H6PD Hexose-6-phosphate dehydrogenase (glucose 1-dehydrogenase)
13 HMX2 H6 family homeobox 2
14 INO80D INO80 complex subunit D
15 KIAA0913
16 LOC157627
17 MTA2 Metastasis associated 1 family, member 2
18 NUMBL Numb homolog (Drosophila)-like
19 OR6Y1 Olfactory receptor, family 6, subfamily Y, member
20 PAX4 Paired box 4
21 RELT Tumor necrosis factor receptor
22 SFRS15 Splicing factor, arginine/serine-rich 15
23 SPESP1 Sperm equatorial segment protein 1
24 SPN Sialophorin (CD43)
25 TANC2 Tetratricopeptide repeat, ankyrin repeat and coiled-coil containing 2
26 ZNF157 Zinc finger protein 157
Breast Cancer Res Treat (2010) 121:399–411 407
123
histamine metabolism and inflammation, cell adhesion and
cytoskeleton, whereas previous reports only pointed out
organ development and extracellular matrix turnover. In
support of our findings, Wang and coworkers [28] showed
that, in a rat model, anastrozole induced increased levels of
proinflammatory cytokines and suppressed the differentia-
tion of naive T cells to Treg cells: T-regs inhibit the
antitumor functions of tumor-specific T cells by direct cell-
to-cell contact.
In general, the comparison between our results on the
total cohort and Mackay’s gave an overlap of 47 down- and
84 up-regulated common genes, even if Mackay’s obser-
vations were after 14 days of treatment.
GO analysis of the genes differentially expressed in
responders only, revealed enrichment of processes linked to
down-regulation of cell cycle and to stimulation of the
immune response. On the other hand, non-responders
showed an increase in mechanisms of induction of T-cell
energy by MHC antigen presentation without IL-2 pro-
duction: these processes could reduce an immune response
versus the tumor cell induced by anastrozole treatment [28].
Furthermore, non-responder tumors showed an up-regula-
tion of network processes related to androgen receptor
nuclear signaling: this suggests that tumor resistant cells
could divert androgens to another cell proliferation signal to
escape from aromatase cell cycle inhibition [29]. Sikora
et al. [30] hypothesized that androgens and their metabo-
lites, independently of aromatase activity, may contribute to
breast cancer growth. Moreover, non-responders show a
down-regulation of negative regulation of synaptic trans-
mission, a mechanism that could be connected to cancer cell
proliferation [31] and an up-regulation of Rab-regulated
recycling pathways of vesicle: some elements of Rab pro-
tein family contribute to breast cancer progression [32, 33].
Our results are the first to demonstrate specific pathways
involved into response to AI, with a specific distinction
between tumors that respond and those that show intrinsic
resistance.
To find a signature predictive of response, probes having
maximum correlation with response variable or differen-
tially expressed between responders and non-responders
were selected in pre-treatment samples. The differentially
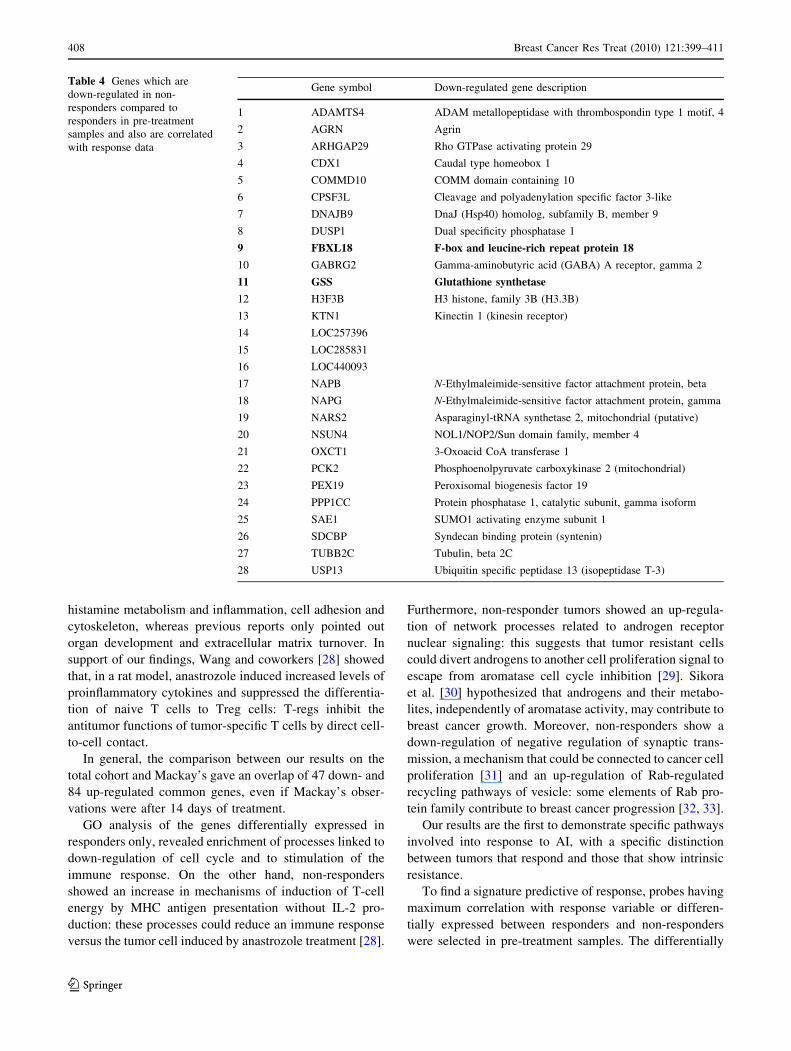
Table 4 Genes which are
down-regulated in non-
responders compared to
responders in pre-treatment
samples and also are correlated
with response data
Gene symbol Down-regulated gene description
1 ADAMTS4 ADAM metallopeptidase with thrombospondin type 1 motif, 4
2 AGRN Agrin
3 ARHGAP29 Rho GTPase activating protein 29
4 CDX1 Caudal type homeobox 1
5 COMMD10 COMM domain containing 10
6 CPSF3L Cleavage and polyadenylation specific factor 3-like
7 DNAJB9 DnaJ (Hsp40) homolog, subfamily B, member 9
8 DUSP1 Dual specificity phosphatase 1
9 FBXL18 F-box and leucine-rich repeat protein 18
10 GABRG2 Gamma-aminobutyric acid (GABA) A receptor, gamma 2
11 GSS Glutathione synthetase
12 H3F3B H3 histone, family 3B (H3.3B)
13 KTN1 Kinectin 1 (kinesin receptor)
14 LOC257396
15 LOC285831
16 LOC440093
17 NAPB N-Ethylmaleimide-sensitive factor attachment protein, beta
18 NAPG N-Ethylmaleimide-sensitive factor attachment protein, gamma
19 NARS2 Asparaginyl-tRNA synthetase 2, mitochondrial (putative)
20 NSUN4 NOL1/NOP2/Sun domain family, member 4
21 OXCT1 3-Oxoacid CoA transferase 1
22 PCK2 Phosphoenolpyruvate carboxykinase 2 (mitochondrial)
23 PEX19 Peroxisomal biogenesis factor 19
24 PPP1CC Protein phosphatase 1, catalytic subunit, gamma isoform
25 SAE1 SUMO1 activating enzyme subunit 1
26 SDCBP Syndecan binding protein (syntenin)
27 TUBB2C Tubulin, beta 2C
28 USP13 Ubiquitin specific peptidase 13 (isopeptidase T-3)
408 Breast Cancer Res Treat (2010) 121:399–411
123
expressed list performed better in separating responders
from non-responders. To combine the predictive power of
the two lists, probes were arranged according to the product
of their ranks and the top 77 were selected as final signature
(100% accuracy). In order to test such predictor on an
independent cohort, we downloaded the dataset used by
Miller and coworkers [14], who derived a signature pre-
dictive of response to neoadjuvant treatment with letrozole.
Our signature and the 69 pre-treatment variables in Miller’s
one have no common genes. However, after mapping the
77 unique Agilent probes from our analysis to 66 unique
Affymetrix probes on Miller’s dataset, we were able to
identify six probes predictive of response to letrozole
(p = 0.0056), by using SET. The six probes correspond to
five unique genes, which are CXCL3, GSS, PAX4,
KIAA0913, FBXL18. Among these, CXCL3 is up-regu-
lated in non-responders and was previously found
associated with a shorter relapse-free survival of ERalpha-
positive breast cancer patients treated with tamoxifen [34].
Only 17 patients satisfying the eligibility criteria dis-
cussed above completed the therapy and provided good
quality RNA for microarray analysis. Due to the limited
number of patients in our cohort, we used them as training-
set to derive a signature predictive of response and then
used a bigger and totally independent cohort of patients
with comparable characteristics as test-set. This was the
only larger neoadjuvant series available to best of our
knowledge to use as validation set. Although our signature
derives from a small patient cohort, it succeeds in pre-
dicting response to another AI, very similar to anastrozole,
in such a larger independent series.
Four of those genes were also tested on an independent
cohort of 10 FFPE biopsies. Dividing patients into two
groups, responders and non-responders, we obtained the
ssecorP OGssecorP OGssecorP OGssecorP OGsrednopser ni pUsrednopser ni nwoDsrednopser non ni pUsrednopser non ni nwoD
spaM yawhtaPspaM yawhtaPspaM yawhtaPspaM yawhtaPsrednopser ni pUsrednopser ni nwoDsrednopser non ni pUsrednopser non ni nwoD
Colour legend
DNA damage responsecell cycle
Process Network Process Network induction of T-cell anergy Process Network Process NetworkDown in non responders Up in non responders stimulation of Down in responders Up in responders
immune system
vesicle trafficking
negative regulation
of synaptic transmission
istamine metabolism and
inflammation process
Cell adesion and
cytoskeleton
Androgen signalingOther
Fig. 5 Go analysis of genes differentially expressed in non-respond-
ers, and in responders. Each rectangular represents a single category
and is ordered according to ascending P-value (as in Supplementary
Table 10). Similar pathways or processes have the same color code.
The right panel refers to responders while the left one to non-
responders
Breast Cancer Res Treat (2010) 121:399–411 409
123
same modulation trend as in the previous microarray
analysis.
To our knowledge, a limited number of papers have been
published on this subject, and none has results comparable
to ours. Kristensen et al. [12] used anastrozole too, but
analyzed few and heterogeneous (ER? and ER-) patients,
defining only a group of differentially expressed genes
between partial response and progressive disease. Harvell
et al. [13] used exemestane, alone or in combination with
tamoxifen, on 7 ER? breast cancers and individuated 50
genes associated with response; however, treatment of the 7
patients was not homogeneous: all responders were treated
with exemestane only, but among non responders, three
were treated with the two drugs in combination and one
received exemestane only. Miller and colleagues [14]
identified a combination of pre-treatment (biopsy before
therapy) and changed-by-treatment (biopsy after 14 days
therapy) genes able to predict response on a cohort of 52
samples treated by neoadjuvant letrozole therapy. However,
it has to be emphasized that none of the former studies
tested their signatures on independent datasets.
If our results will be further validated on a bigger fixed
cohort, AI neoadjuvant treatment could be focused on these
‘‘likely responder’’ patients, pointed out by gene expression
evaluation of few genes on RNA extracted from fixed biopsy.
On the other hand, patients showing a ‘‘non-responsive’’
signature will be operated immediately, reducing risks and
costs of an ineffective treatment. Molecular evaluation on
tru-cut biopsy only has the advantage of avoiding treatment
on patients predicted to be non-responders, without waiting
for 14 days and re-biopsing the tumor, as required to trans-
late previous results to a clinical setting.
Acknowledgements We thank Dr Annalisa Lanza, from Fonda-
zione Maugeri, for sample storing and delivery and Prof Paolo Pro-
vero (Molecular Biotechnology Centre, University of Torino) for his
supervision on data analysis. The study was partially supported by an
educational grant from Astra Zeneca, who had no role in study design,
data collection or interpretation, or manuscript submission, for which
the authors had full responsibility.
References
1. Hortobagyi GN (1998) Treatment of breast cancer. N Engl J Med
339:974–984
2. Early Breast Cancer Trialists’ Collaborative Group (1998)
Tamoxifen for early breast cancer: an overview of the random-
ised trials. Lancet 351:1451–1467
3. Mauriac L, Smith I (2003) Aromatase inhibitors in early breast
cancer treatment. Semin Oncol 4(Suppl 14):46–57
4. Mouridsen H, Gershanovich M, Sun Y, Perez-Carrion R, Boni C
et al (2001) Superior efficacy of letrozole versus tamoxifen as
first-line therapy for postmenopausal women with advanced
breast cancer: results of a phase III study of the International
Letrozole Breast Cancer Group. J Clin Oncol 19:2596–2606
5. Goss PE, Ingle JN, Martino S, Robert NJ, Muss HB et al (2003) A
randomized trial of letrozole in postmenopausal women after five
years of tamoxifen therapy for early-stage breast cancer. N Eng J
Med 349:1793–1802
6. Coombes RC, Hall E, Gibson LJ, Paridaens R, Jassem J et al
(2004) A randomized trial of exemestane after two to three years
of tamoxifen therapy in postmenopausal women with primary
breast cancer. N Engl J Med 350:1081–1092
7. Harada N (1997) Aberrant expression of aromatase in breast
cancer tissues. J Steroid Biochem Mol Biol 61:175–184
8. Sun XZ, Zhou D, Chen S (1997) Autocrine and paracrine actions
of breast tumor aromatase. A three-dimensional cell culture study
involving aromatase transfected MCF-7 and T-47D cells. J Ste-
roid Biochem Mol Biol 63:29–36
9. Miller WR, Dixon JM, Macfarlane L, Cameron D, Anderson TJ
(2003) Pathological features of breast cancer response following
neoadjuvant treatment with either letrozole or tamoxifen. Eur J
Cancer 39:462–468
10. Anderson TJ, Dixon JM, Stuart M, Sahmoud T, Miller WR
(2002) Effect of neoadjuvant treatment with Anastrozole on
tumour histology in postmenopausal women with large operable
breast cancer. Br J Cancer 87:334–338
11. Milla Santos A, Milla l, Calvo N, Portella J, Rallo L et al (2004)
Anastrozole as neoadjuvant therapy for patients with hormone-
dependent, locally-advanced breast cancer. Anticancer Res
24:1315–1318
12. Kristensen VN, Sørlie T, Geisler J, Yoshimura N, Linegjaerde
OC et al (2005) Effects of Anastrozole on the intratumoral gene
expression in locally advanced breast cancer. J Steroid Biochem
Mol Biol 95:105–111
13. Harvell DM, Richer JK, Singh M, Spoelstra N, Finlayson C et al
(2008) Estrogen regulated gene expression in response to neo-
adjuvant endocrine therapy of breast cancer: tamoxifene agonist
effects dominate in the presence of an aromatase inhibitor. Breast
Cancer Res Treat 112:489–501
14. Miller WR, Larionov A, Renshaw L, Anderson TJ, Walker JR
et al (2009) Gene expression profiles differentiating between
breast cancers clinically responsive or resistant to letrozole. J Clin
Oncol 27:1382–1387
15. Therasse P, Arbuck SG, Eisenhauer EA, Wanders J, Kaplan RS
et al (2000) New guidelines to evaluate the response to treatment
in solid tumors. European Organization for Research and Treat-
ment of Cancer, National Cancer Institute of the United States,
National Cancer Institute of Canada. J Natl Cancer Inst 92:
205–216
16. Deaglio S, Vaisitti T, Aydin S, Bergui L, D’Arena G et al (2007)
CD38 and ZAP-70 are functionally linked and mark CLL cells
with high migratory potential. Blood 110:4012–4021
17. Smyth GK (2004) Linear models and empirical bayes methods
for assessing differential expression in microarray experiments.
Stat Appl Genet Mol Biol 3: Article 3
18. Miller WR, Larionov A, Renshaw L, Anderson TJ, White S et al
(2007) Aromatase inhibitors-gene discovery. J Steroid Biochem
Mol Biol 106:130–142
19. Scatolini M, Mello Grand M, Grosso E, Venesio T, Pisacane A
et al (2010) Altered molecular pathways in melanocytic lesions.
Int J Cancer 126:1869–1881
20. Ochsner SA, Steffen DL, Hilsenbeck SG, Chen ES, Watkins C,
McKenna NJ (2009) GEMS (Gene Expression MetaSignatures), a
Web resource for querying meta-analysis of expression micro-
array datasets: 17beta-estradiol in MCF-7 cells. Cancer Res
69:23–26
21. Itoh T, Karlsberg K, Kijima I, Yuan YC, Smith D et al (2005)
Letrozole-, Anastrozole-, and tamoxifen-responsive genes in
MCF-7aro cells: a microarray approach. Mol Cancer Res 3:
203–218
410 Breast Cancer Res Treat (2010) 121:399–411
123
22. Hayashi S, Yamaguchi Y (2008) Estrogen signaling in cancer
microenvironment and prediction of response to hormonal ther-
apy. J Steroid Biochem Mol Biol 109:201–206
23. Williams C, Edvardsson K, Lewandowski SA, Strom A, Gu-
stafsson JA (2008) A genome-wide study of the repressive effects
of estrogen receptor beta on estrogen receptor alpha signaling in
breast cancer cells. Oncogene 27:1019–1032
24. Sismondi P, Biglia N, Ponzone R, Fuso L, Scafoglio C et al
(2007) Influence of estrogens and antiestrogens on the expression
of selected hormone-responsive genes. Maturitas 57:50–55
25. Wilson CL, Sims AH, Howell A, Miller CJ, Clarke RB (2006)
Effects of oestrogen on gene expression in epithelium and stroma
of normal human breast tissue. Endocr Relat Cancer 13:617–628
26. Cappelletti V, Gariboldi M, De Cecco L, Toffanin S, Reid JF et al
(2008) Patterns and changes in gene expression following neo-
adjuvant anti-estrogen treatment in estrogen receptor-positive
breast cancer. Endocr Relat Cancer 15:439–449
27. Mackay A, Urruticoechea A, Dixon JM, Dexter T, Fenwick K
et al (2007) Molecular response to aromatase inhibitor treatment
in primary breast cancer. Breast Cancer Res 9:R37
28. Wang J, Zhang Q, Jin S, Feng M, Kang X et al (2009) Immod-
erate inhibition of estrogen by anastrozole enhances the severity
of experimental polyarthritis. Exp Gerontol 44:398–405
29. Lin HY, Sun M, Lin C, Tang HY, London D et al (2009)
Androgen-induced human breast cancer cell proliferation is
mediated by discrete mechanisms in estrogen receptor-alpha-
positive and -negative breast cancer cells. J Steroid Biochem Mol
Biol 113:182–188
30. Sikora MJ, Cordero KE, Larios JM, Johnson MD, Lippman ME
et al (2009) The androgen metabolite 5alpha-androstane-3beta,
17beta-diol (3betaAdiol) induces breast cancer growth via
estrogen receptor: implications for aromatase inhibitor resistance.
Breast Cancer Res Treat 115:289–296
31. Espanol AJ, de la Torre E, Fiszman GL, Sales ME (2007) Role of
non-neuronal cholinergic system in breast cancer progression.
Life Sci 80:2281–2285
32. Jones MC, Caswell PT, Norman JC (2006) Endocytic recycling
pathways: emerging regulators of cell migration. Curr Opin Cell
Biol 18:549–557
33. Stein MP, Dong J, Wandinger-Ness A (2003) Rab proteins and
endocytic trafficking: potential targets for therapeutic interven-
tion. Adv Drug Deliv Rev 55:1421–1437
34. Bieche I, Chavey C, Andrieu C, Busson M, Vacher S et al (2007)
CXC chemokines located in the 4q21 region are up-regulated in
breast cancer. Endocr Relat Cancer 14:1039–1052
Breast Cancer Res Treat (2010) 121:399–411 411
123
Related Documents