Research report Gene expression profiles highlight adaptive brain mechanisms in corticotropin releasing factor overexpressing mice Pieter J. Peeters a , Frederik L.P. Fierens a, * , Ilse van den Wyngaert a , Hinrich W. Goehlmann a , Sigrid M. Swagemakers a , Stefan U. Kass a , Xavier Langlois a , Shirley Pullan a , Mary P. Stenzel-Poore b , Thomas Steckler a a Johnson and Johnson Pharmaceutical Research and Development, Turnhoutseweg 30, B-2340 Beerse, Belgium b Department of Molecular Microbiology and Immunology, Oregon Health Sciences University, Portland, OR, USA Accepted 12 June 2004 Available online 27 August 2004 Abstract Corticotropin-releasing factor (CRF) plays an important role in mediating central and peripheral responses to stress. Alterations in CRF system activity have been linked to a number of psychiatric disorders, including anxiety and depression. Aim of this study was to elucidate homeostatic mechanisms induced by lifelong elevated CRF levels in the brain. We therefore profiled gene expression in several brain areas of transgenic mice overexpressing CRF (CRF-OE), a model for chronic stress. Several genes showed altered expression levels in CRF-OE mice when compared to their wild type littermates and were confirmed by quantitative PCR. Differences in gene expression profiles revealed the presence of previously unrecognized homeostatic mechanisms in CRF-OE animals. These included changes in glucocorticoid signaling, as exemplified by changes in 11h-hydroxysteroid dehydrogenase type 1, FK506 binding protein 5 and serum/glucocorticoid kinase. Alterations in expression of genes involved in myelination (myelin, myelin- associated glycoprotein), cell proliferation and extracellular matrix formation (Edg2, Fgfr2, decorin, brevican) suggest changes in the dynamics of neurogenesis in CRF-OE. Pronounced changes in neurotensin (NT) receptors 1 and 2 mRNA were identified. Overall downregulation of NT receptors in CRF-OE animal was substantiated by receptor binding studies. Pronounced neurotensin receptor downregulation was observed for NT type 1 receptors in limbic brain areas, suggesting that NT could be implicated in some of the effects attributed to CRF overexpression. These data show that lifelong exposure to excessive CRF leads to adaptive changes in the brain which could play a role in some of the behavioral and physiological alterations seen in these animals. D 2004 Elsevier B.V. All rights reserved. Theme: Neurotransmitters, modulators, transporters, and receptors Topic: Signal transduction: gene expression Keywords: CRF; Transgenic; Glucocorticoid; Neurotensin; Spectral map analysis; Microarray; Receptor autoradiography; Quantitative PCR; R121919 0169-328X/$ - see front matter D 2004 Elsevier B.V. All rights reserved. doi:10.1016/j.molbrainres.2004.06.038 Abbreviations: ACTH, adrenocorticotropin hormone; Bdnf, brain-derived neurotrophic factor; CNS, central nervous system; CRF, corticotropin releasing factor; CRF-OE, CRF overexpressing mice; CRF 1 , CRF receptor subtype 1; CRF 2 , CRF receptor 2; Edg2, endothelial differentiation lysophosphatidic acid G- protein-coupled receptor 2; Fgfr2, fibroblast growth factor receptor 2; Gab1, growth factor receptor bound protein 2-associated protein 1; Hpcal1, hippocalcin like 1; Hsd11B1, 11h-hydroxysteroid dehydrogenase 1; Id2, Inhibitor of DNA binding 2; Klk, kallikrein; NT, Neurotensin; Ntsr1, neurotensin receptor 1; Ntsr2, neurotensin receptor 2; Ntsr3, neurotensin receptor 3; PVN, periventricular hypothalamic nuclei; R, treated with compound; SAM, significance analysis of microarray data; Sgk, serum/glucocorticoid regulated kinase; SPM, spectral map analysis; U, untreated; Ve, treated with vehicle only; WT, Wild-type * Corresponding author. Tel.: +32 14 60 78 60; fax: +32 14 60 37 53. E-mail address: [email protected] (F.L.P. Fierens). Molecular Brain Research 129 (2004) 135 – 150 www.elsevier.com/locate/molbrainres

Welcome message from author
This document is posted to help you gain knowledge. Please leave a comment to let me know what you think about it! Share it to your friends and learn new things together.
Transcript
www.elsevier.com/locate/molbrainres
Molecular Brain Research
Research report
Gene expression profiles highlight adaptive brain mechanisms in
corticotropin releasing factor overexpressing mice
Pieter J. Peetersa, Frederik L.P. Fierensa,*, Ilse van den Wyngaerta, Hinrich W. Goehlmanna,
Sigrid M. Swagemakersa, Stefan U. Kassa, Xavier Langloisa, Shirley Pullana,
Mary P. Stenzel-Pooreb, Thomas Stecklera
aJohnson and Johnson Pharmaceutical Research and Development, Turnhoutseweg 30, B-2340 Beerse, BelgiumbDepartment of Molecular Microbiology and Immunology, Oregon Health Sciences University, Portland, OR, USA
Accepted 12 June 2004
Available online 27 August 2004
Abstract
Corticotropin-releasing factor (CRF) plays an important role in mediating central and peripheral responses to stress. Alterations in CRF
system activity have been linked to a number of psychiatric disorders, including anxiety and depression. Aim of this study was to elucidate
homeostatic mechanisms induced by lifelong elevated CRF levels in the brain. We therefore profiled gene expression in several brain areas of
transgenic mice overexpressing CRF (CRF-OE), a model for chronic stress.
Several genes showed altered expression levels in CRF-OE mice when compared to their wild type littermates and were confirmed by
quantitative PCR. Differences in gene expression profiles revealed the presence of previously unrecognized homeostatic mechanisms in
CRF-OE animals. These included changes in glucocorticoid signaling, as exemplified by changes in 11h-hydroxysteroid dehydrogenase type1, FK506 binding protein 5 and serum/glucocorticoid kinase. Alterations in expression of genes involved in myelination (myelin, myelin-
associated glycoprotein), cell proliferation and extracellular matrix formation (Edg2, Fgfr2, decorin, brevican) suggest changes in the
dynamics of neurogenesis in CRF-OE. Pronounced changes in neurotensin (NT) receptors 1 and 2 mRNA were identified. Overall
downregulation of NT receptors in CRF-OE animal was substantiated by receptor binding studies. Pronounced neurotensin receptor
downregulation was observed for NT type 1 receptors in limbic brain areas, suggesting that NT could be implicated in some of the effects
attributed to CRF overexpression.
These data show that lifelong exposure to excessive CRF leads to adaptive changes in the brain which could play a role in some of the
behavioral and physiological alterations seen in these animals.
D 2004 Elsevier B.V. All rights reserved.
Theme: Neurotransmitters, modulators, transporters, and receptors
Topic: Signal transduction: gene expression
Keywords: CRF; Transgenic; Glucocorticoid; Neurotensin; Spectral map analysis; Microarray; Receptor autoradiography; Quantitative PCR; R121919
0169-328X/$ - s
doi:10.1016/j.m
Abbreviation
factor; CRF-OE
protein-coupled
like 1; Hsd11B1
Ntsr2, neurotens
of microarray da
* Correspon
E-mail addr
129 (2004) 135–150
ee front matter D 2004 Elsevier B.V. All rights reserved.
olbrainres.2004.06.038
s: ACTH, adrenocorticotropin hormone; Bdnf, brain-derived neurotrophic factor; CNS, central nervous system; CRF, corticotropin releasing
, CRF overexpressing mice; CRF1, CRF receptor subtype 1; CRF2, CRF receptor 2; Edg2, endothelial differentiation lysophosphatidic acid G-
receptor 2; Fgfr2, fibroblast growth factor receptor 2; Gab1, growth factor receptor bound protein 2-associated protein 1; Hpcal1, hippocalcin
, 11h-hydroxysteroid dehydrogenase 1; Id2, Inhibitor of DNA binding 2; Klk, kallikrein; NT, Neurotensin; Ntsr1, neurotensin receptor 1;
in receptor 2; Ntsr3, neurotensin receptor 3; PVN, periventricular hypothalamic nuclei; R, treated with compound; SAM, significance analysis
ta; Sgk, serum/glucocorticoid regulated kinase; SPM, spectral map analysis; U, untreated; Ve, treated with vehicle only; WT, Wild-type
ding author. Tel.: +32 14 60 78 60; fax: +32 14 60 37 53.
ess: [email protected] (F.L.P. Fierens).
P.J. Peeters et al. / Molecular Brain Research 129 (2004) 135–150136
1. Introduction
Corticotropin-releasing factor (CRF) plays an impor-
tant role in the mediation of the central and peripheral
responses to stress. Alterations in CRF system activity
have been linked to a number of psychiatric disorders,
including anxiety and depression [21]. In line with a role
of brain CRF in the mediation of endocrine, autonomic
and behavioral responses to stress, transgenic mice
overexpressing CRF (CRF-OE) have been reported to
show increased anxiety-related behaviour, cognitive
impairments and an increased HPA axis activity in
response to stress, at least part of which can be
attenuated by central administration of a CRF antagonist
[43,44,48,49].
Sustained exposure of an individual to stress or high
levels of CRF decrease CRF binding sites [3,11,14],
desensitize CRF-stimulated cyclic AMP accumulation,
and decrease ACTH release by corticotrophs [1,15].
Treatment of anterior pituitary cells or AtT20 cells with
CRF causes large reductions in CRF-stimulated ACTH
release resulting from downregulation of CRF receptors 1
(CRFR1) and desensitization of CRFR1 stimulated cAMP
stimulation [20,35]. Likewise, central administration of
CRF can induce a number of adaptive changes in the
brain, including changes in CRF receptor expression in
various brain areas [3].
One possibility to investigate the long-term effects of
alterations of CRF system activity on compensatory brain
mechanisms is the assessment of gene expression profiles
using microarray technology. Comparing the mRNA
expression patterns from the whole brains of mice lacking
a functional CRFR1 to that of mice that had received 40
mg/kg of the CRFR1 antagonist R121919 administered
orally for 0, 1 or 7 days, alterations in gene expression
seen in the knockout mice were reported to mimic sub-
chronic (7-day) treatment with the CRFR1 antagonist
[23].
More recently, we studied the effects of acute CRF
exposure and of blockade of the CRFR1 with R121919
in mouse pituitary AtT-20 cell cultures. Microarray
analysis of 7256 genes revealed altered gene expression
in about 90 genes that was attenuated by the antagonist.
Known targets of CRFR1 receptor signaling that were
altered included immediate early genes such as Jun/B,
Nurr1, and Nurr77. Moreover, several previously
unknown targets involved in this signaling cascade were
identified and subsequently confirmed by quantitative
PCR [57].
To investigate the long-term effects of CRF over-
activity and the adaptive mechanisms that may exist to
compensate for the life-long exposure to elevated levels
of CRF in vivo, the present study investigated the
gene expression profiles in different brain regions in
CRF overexpressing transgenic mice using microarray
technology.
2. Material and methods
2.1. Animal housing and treatment
Male transgenic CRF overexpressing C57BL/6J mice
(CRF-OE) and their wild-type littermates (WT) were
maintained in a specific pathogen-free facility that meets
all national and European requirements for animal care.
Transgenic animals were generated as previously described
by Stenzel-Poore et al. [43]. Experiments were approved by
the ethical committee on the use of transgenic animals.
Animals were housed individually 4 weeks before the start
of the experiment in a climate-controlled animal colony with
a 12-h light–dark cycle (lights on 7:00 EST) with food and
water ad libitum. Prior to treatment, 3-month-old mice were
randomized over three groups, each comprising 7 wild-type
and 7 transgenic animals. One group received no treatment
(U), a second group received subcutaneous vehicle injec-
tions over 5 days, 2 times per day (10% cyclodextrine) (Ve)
and a third group received 10 mg/kg of the specific CRFR1
receptor antagonist 3-[6-(dimethylamino)-4-methyl-pyrid-3-
yl]-2,5-dimethyl-N,N-dipropyl-pyrazol o[2,3-a]pyrimidin-7-
amine (R121919) (R) [17]. Sixteen hours after the last
treatment, animals were sacrificed by decapitation. Brains
from 4 animals of each group were dissected for RNA
isolation. The brains of the three remaining animals of each
group were further used for ex vivo radioligand binding
studies.
2.2. Hormonal assays
Trunk blood was collected in ice-cooled microtainer cups
containing K2EDTA (BD, Erembodegem-Aalst, Belgium).
Plasma was separated by centrifugation (3000 rpm for 10
min). Aliquots were stored at �80 8C (adrenocorticotropin
hormone (ACTH) in the presence of aprotinin) and at �20
8C (corticosterone) until assayed. Plasma ACTH and
corticosterone levels were measured in duplicate using
double antibody radioimmunoassays (ICN Biomedicals,
Asse, Belgium) following the manufacturers instructions.
2.3. RNA preparation
Brain tissue was homogenized in Trizol (Invitrogen Life
Technologies, Merelbeke, Belgium) using an Ultra-turrax
T25 grinder (IKA-Labortechnik, Staufen, Germany). Total
RNA was extracted according to the instructions of the
manufacturer. Total RNA was further purified using the
RNeasy kit (Qiagen/Westburg, Leusden, The Netherlands)
with DNAse I treatment on the column.
2.4. Microarray hybridization
cRNAwas prepared as follows: Reverse transcription was
performed on 10Ag of total RNA for 1 h at 42 8C using a T7-
oligo(dT)24-primer and SuperscriptII RT (Invitrogen Life
P.J. Peeters et al. / Molecular Brain Research 129 (2004) 135–150 137
Technologies). Second strand cDNA synthesis was done for
2 h at 16 8C using Escherichia coli DNA Polymerase I, DNA
ligase and RNAseH (Invitrogen Life Technologies). After
phenol–chloroform extraction using phase-lock gel (Eppen-
dorf, Hamburg, Germany), in vitro transcription was
performed for 6 h at 37 8C using the Bioarray high-yield
RNA transcript labeling kit with Biotin labeled ribonucleo-
tides (Enzo Diagnostics, Farmingdale, NY). cRNA samples
were purified on Qiagen RNeasy columns followed by
fragmentation for 35 min at 95 8C. cRNA yields were
between 50 and 100 Ag. Samples were processed on
GeneChips (Affymetrix, Santa Clara, CA). In order to check
the quality of each sample, 5 Ag of labeled cRNAwas run on
Test2-arrays. Actual experiments were performed on Murine
Genome U74Av2 arrays, containing probe sets interrogating
approximately 12,000 full-length mouse genes and
expressed sequence tag clusters from the UniGene database
(Build 74). Hybridization was performed using 15 Ag cRNAfor 16 h at 45 8C under continuous rotation. cRNA from
individual animals were processed on separate arrays. No
material was pooled. Arrays were stained in Affymetrix
Fluidics stations using Streptavidin/Phycoerythrin (SAPE)
followed by staining with anti-streptavidin antibody and a
second Streptavidin/Phycoerythrin staining. Subsequently,
fluorescent signal bound to the microarray was measured
with an HP-Laserscanner and data were analyzed with the
Microarray Suite Software (Affymetrix). No scaling or
normalization was performed at this stage.
2.5. Data analysis and selection of genes
2.5.1. Normalization
Genes which were called absent (non-reliable detection)
in all samples according to Affymetrix’ MAS 5.0 software
( p-value of N0.06) were removed from further analysis.
Raw fluorescence intensities from each array were log-
transformed and data were quantile normalized using the
method described by Amaratunga and Cabrera [2]. Follow-
ing the group-wise quantile normalization per treatment and
genotype, a second quantile normalization was carried out
across the data of all samples of a given brain area.
Basically, this alignment sets the average intensity range of
one array to the average measured across all arrays,
compensating for array-to-array variations in hybridization,
washing and staining, ultimately allowing a reasonable
comparison between arrays.
2.5.2. Spectral map analysis
Visual inspection of overall changes in gene expression
profile between different treatment groups was done using
spectral map analysis. Spectral map analysis [25] (or SPM)
is a special case of multivariate projection methods that
help to reduce the complexity (dimensions) of highly
dimensional data (n genes vs. p samples). This so-called
unsupervised method allows the reduction of the complex-
ity of large microarray datasets and provides means to
visually inspect and thereby identify clusters of genes and/
or subjects in the data. Typically, projected data are
displayed in a biplot combining genes and samples in the
same plot. Multivariate projection methods are based on a
derived space with k orthogonal axes. These k axes are
linear combinations of the p original measurements
(intensities) on the n genes. The axes are constructed in
such a way that the first axis lies in the direction (in the
multivariate data space) with the largest variability and the
last axis in the direction with the smallest variability. In
conventional principal component analysis the first axis
(principle component) that maximizes the variability is
often related to the size of the intensities. Clusters that can
be identified based on the first axis will simply differ in
absolute size of the intensities. In spectral map analysis of
log-transformed data, the distances between objects are
proportional to ratios of genes or samples.
In microarray data, we are mainly interested in contrasts
and not in simple high or low intensities. For that reason
SPM has the appropriate properties (double centering) that
remove the size component from the data. SPM will look for
contrasts in intensities between genes without the nuisance
effect of the absolute values of the intensities. Microarray
data tend to be more reliable with increasing intensity.
Therefore, re-introduction of the size component via
variable weighting proportional to the mean intensities of
genes and samples is required. A biplot [6] created by the
first two axis displays the maximal separation of both the
genes and the samples. Coinciding clusters of samples and
genes on the biplot indicate the genes (signatures) that are
responsible for the separation of the samples. Genes that are
located in the general direction of a sample on the biplot
should be looked at as potential signatures for the separation
of that sample vs. the others. Since, in micro-array data there
is a large difference in row- and column-dimension, an
asymmetric factor scaling is recommended in constructing
the biplot. This operation pulls the genes away from the
center of the biplot, while leaving the samples at their
original places [54]. The method was carried out in R
(version 1.6.1) using the functions described by Wouters et
al. [54] (http://users.pandora.be/luc.wouters/spm.htm). R is
an open source implementation of the statistical program-
ming language S (http://www.r-project.org).
2.5.3. Significance analysis
Individual genes with a different expression level
between groups were identified using significance analysis
of microarray (SAM) data [47]. SAM assigns a score to each
gene on the basis of change in gene expression relative to the
standard deviation of repeated measurements. For genes with
scores greater than an adjustable threshold, SAM uses
permutations of the repeated measurements to estimate the
percentage of genes identified by chance; i.e., the false
discovery rate (FDR). Thus, the FDR is the expected
proportion of false positives amongst the tests found to be
significant. An extension of this FDR is the so-called q-value
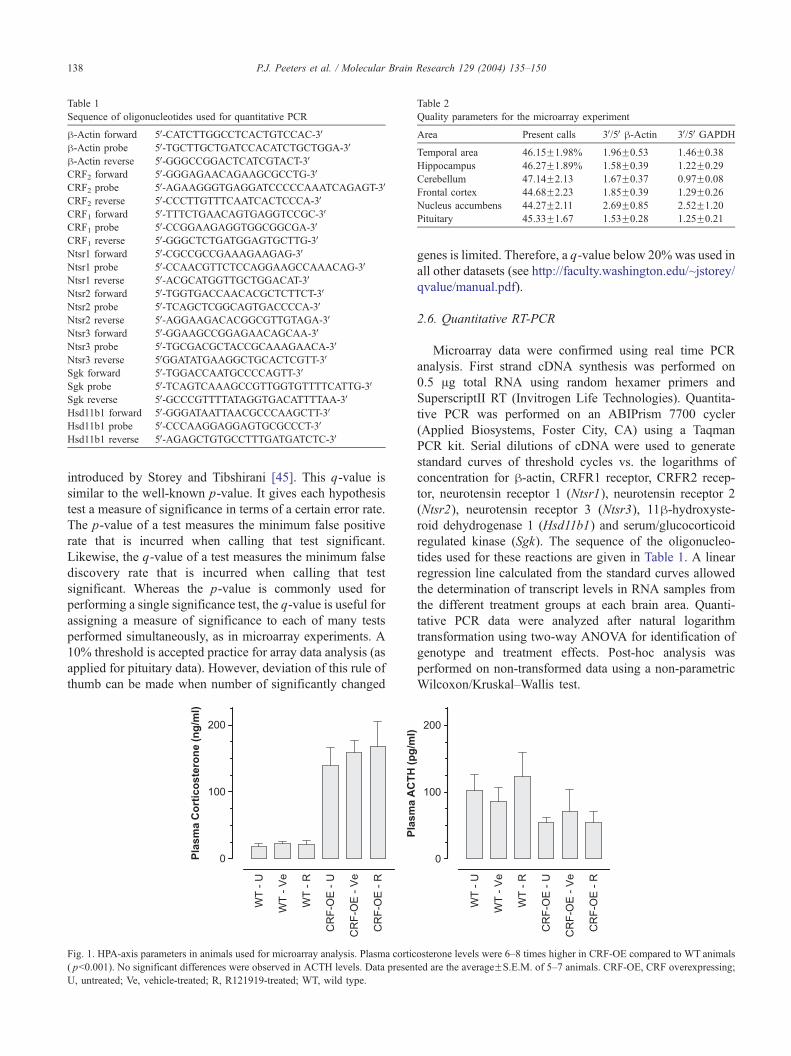
Table 2
Quality parameters for the microarray experiment
Area Present calls 3V/5Vh-Actin 3V/5VGAPDH
Temporal area 46.15F1.98% 1.96F0.53 1.46F0.38
Hippocampus 46.27F1.89% 1.58F0.39 1.22F0.29
Cerebellum 47.14F2.13 1.67F0.37 0.97F0.08
Frontal cortex 44.68F2.23 1.85F0.39 1.29F0.26
Nucleus accumbens 44.27F2.11 2.69F0.85 2.52F1.20
Pituitary 45.33F1.67 1.53F0.28 1.25F0.21
Table 1
Sequence of oligonucleotides used for quantitative PCR
h-Actin forward 5V-CATCTTGGCCTCACTGTCCAC-3Vh-Actin probe 5V-TGCTTGCTGATCCACATCTGCTGGA-3Vh-Actin reverse 5V-GGGCCGGACTCATCGTACT-3VCRF2 forward 5V-GGGAGAACAGAAGCGCCTG-3VCRF2 probe 5V-AGAAGGGTGAGGATCCCCCAAATCAGAGT-3VCRF2 reverse 5V-CCCTTGTTTCAATCACTCCCA-3VCRF1 forward 5V-TTTCTGAACAGTGAGGTCCGC-3VCRF1 probe 5V-CCGGAAGAGGTGGCGGCGA-3VCRF1 reverse 5V-GGGCTCTGATGGAGTGCTTG-3VNtsr1 forward 5V-CGCCGCCGAAAGAAGAG-3VNtsr1 probe 5V-CCAACGTTCTCCAGGAAGCCAAACAG-3VNtsr1 reverse 5V-ACGCATGGTTGCTGGACAT-3VNtsr2 forward 5V-TGGTGACCAACACGCTCTTCT-3VNtsr2 probe 5V-TCAGCTCGGCAGTGACCCCA-3VNtsr2 reverse 5V-AGGAAGACACGGCGTTGTAGA-3VNtsr3 forward 5V-GGAAGCCGGAGAACAGCAA-3VNtsr3 probe 5V-TGCGACGCTACCGCAAAGAACA-3VNtsr3 reverse 5VGGATATGAAGGCTGCACTCGTT-3VSgk forward 5V-TGGACCAATGCCCCAGTT-3VSgk probe 5V-TCAGTCAAAGCCGTTGGTGTTTTCATTG-3VSgk reverse 5V-GCCCGTTTTATAGGTGACATTTTAA-3VHsd11b1 forward 5V-GGGATAATTAACGCCCAAGCTT-3VHsd11b1 probe 5V-CCCAAGGAGGAGTGCGCCCT-3VHsd11b1 reverse 5V-AGAGCTGTGCCTTTGATGATCTC-3V
P.J. Peeters et al. / Molecular Brain Research 129 (2004) 135–150138
introduced by Storey and Tibshirani [45]. This q-value is
similar to the well-known p-value. It gives each hypothesis
test a measure of significance in terms of a certain error rate.
The p-value of a test measures the minimum false positive
rate that is incurred when calling that test significant.
Likewise, the q-value of a test measures the minimum false
discovery rate that is incurred when calling that test
significant. Whereas the p-value is commonly used for
performing a single significance test, the q-value is useful for
assigning a measure of significance to each of many tests
performed simultaneously, as in microarray experiments. A
10% threshold is accepted practice for array data analysis (as
applied for pituitary data). However, deviation of this rule of
thumb can be made when number of significantly changed
Fig. 1. HPA-axis parameters in animals used for microarray analysis. Plasma cortic
( pb0.001). No significant differences were observed in ACTH levels. Data presen
U, untreated; Ve, vehicle-treated; R, R121919-treated; WT, wild type.
genes is limited. Therefore, a q-value below 20% was used in
all other datasets (see http://faculty.washington.edu/~jstorey/
qvalue/manual.pdf).
2.6. Quantitative RT-PCR
Microarray data were confirmed using real time PCR
analysis. First strand cDNA synthesis was performed on
0.5 Ag total RNA using random hexamer primers and
SuperscriptII RT (Invitrogen Life Technologies). Quantita-
tive PCR was performed on an ABIPrism 7700 cycler
(Applied Biosystems, Foster City, CA) using a Taqman
PCR kit. Serial dilutions of cDNA were used to generate
standard curves of threshold cycles vs. the logarithms of
concentration for h-actin, CRFR1 receptor, CRFR2 recep-
tor, neurotensin receptor 1 (Ntsr1), neurotensin receptor 2
(Ntsr2), neurotensin receptor 3 (Ntsr3), 11h-hydroxyste-roid dehydrogenase 1 (Hsd11b1) and serum/glucocorticoid
regulated kinase (Sgk). The sequence of the oligonucleo-
tides used for these reactions are given in Table 1. A linear
regression line calculated from the standard curves allowed
the determination of transcript levels in RNA samples from
the different treatment groups at each brain area. Quanti-
tative PCR data were analyzed after natural logarithm
transformation using two-way ANOVA for identification of
genotype and treatment effects. Post-hoc analysis was
performed on non-transformed data using a non-parametric
Wilcoxon/Kruskal–Wallis test.
osterone levels were 6–8 times higher in CRF-OE compared to WT animals
ted are the averageFS.E.M. of 5–7 animals. CRF-OE, CRF overexpressing;
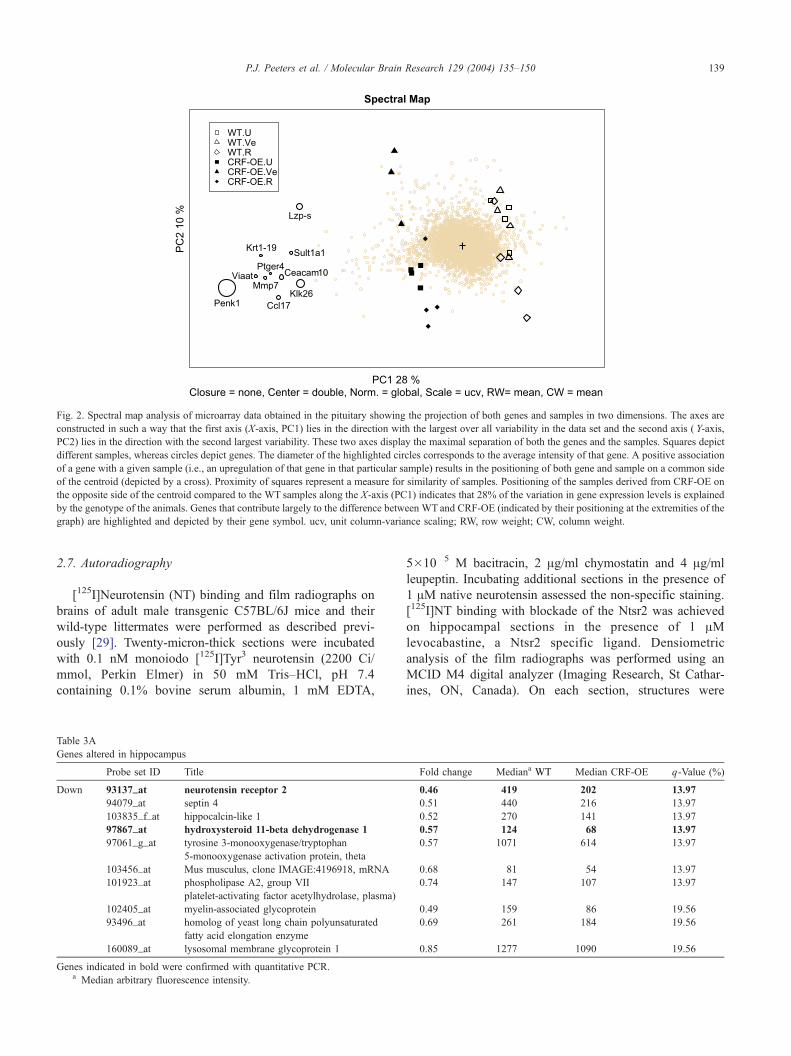
Fig. 2. Spectral map analysis of microarray data obtained in the pituitary showing the projection of both genes and samples in two dimensions. The axes are
constructed in such a way that the first axis (X-axis, PC1) lies in the direction with the largest over all variability in the data set and the second axis ( Y-axis,
PC2) lies in the direction with the second largest variability. These two axes display the maximal separation of both the genes and the samples. Squares depict
different samples, whereas circles depict genes. The diameter of the highlighted circles corresponds to the average intensity of that gene. A positive association
of a gene with a given sample (i.e., an upregulation of that gene in that particular sample) results in the positioning of both gene and sample on a common side
of the centroid (depicted by a cross). Proximity of squares represent a measure for similarity of samples. Positioning of the samples derived from CRF-OE on
the opposite side of the centroid compared to the WT samples along the X-axis (PC1) indicates that 28% of the variation in gene expression levels is explained
by the genotype of the animals. Genes that contribute largely to the difference between WT and CRF-OE (indicated by their positioning at the extremities of the
graph) are highlighted and depicted by their gene symbol. ucv, unit column-variance scaling; RW, row weight; CW, column weight.
P.J. Peeters et al. / Molecular Brain Research 129 (2004) 135–150 139
2.7. Autoradiography
[125I]Neurotensin (NT) binding and film radiographs on
brains of adult male transgenic C57BL/6J mice and their
wild-type littermates were performed as described previ-
ously [29]. Twenty-micron-thick sections were incubated
with 0.1 nM monoiodo [125I]Tyr3 neurotensin (2200 Ci/
mmol, Perkin Elmer) in 50 mM Tris–HCl, pH 7.4
containing 0.1% bovine serum albumin, 1 mM EDTA,
Table 3A
Genes altered in hippocampus
Probe set ID Title
Down 93137_at neurotensin receptor 2
94079_at septin 4
103835_f_at hippocalcin-like 1
97867_at hydroxysteroid 11-beta dehydrogenase 1
97061_g_at tyrosine 3-monooxygenase/tryptophan
5-monooxygenase activation protein, theta
103456_at Mus musculus, clone IMAGE:4196918, mRNA
101923_at phospholipase A2, group VII
platelet-activating factor acetylhydrolase, plasma)
102405_at myelin-associated glycoprotein
93496_at homolog of yeast long chain polyunsaturated
fatty acid elongation enzyme
160089_at lysosomal membrane glycoprotein 1
Genes indicated in bold were confirmed with quantitative PCR.a Median arbitrary fluorescence intensity.
5�10�5 M bacitracin, 2 Ag/ml chymostatin and 4 Ag/ml
leupeptin. Incubating additional sections in the presence of
1 AM native neurotensin assessed the non-specific staining.
[125I]NT binding with blockade of the Ntsr2 was achieved
on hippocampal sections in the presence of 1 AMlevocabastine, a Ntsr2 specific ligand. Densiometric
analysis of the film radiographs was performed using an
MCID M4 digital analyzer (Imaging Research, St Cathar-
ines, ON, Canada). On each section, structures were
Fold change Mediana WT Median CRF-OE q-Value (%)
0.46 419 202 13.97
0.51 440 216 13.97
0.52 270 141 13.97
0.57 124 68 13.97
0.57 1071 614 13.97
0.68 81 54 13.97
0.74 147 107 13.97
0.49 159 86 19.56
0.69 261 184 19.56
0.85 1277 1090 19.56
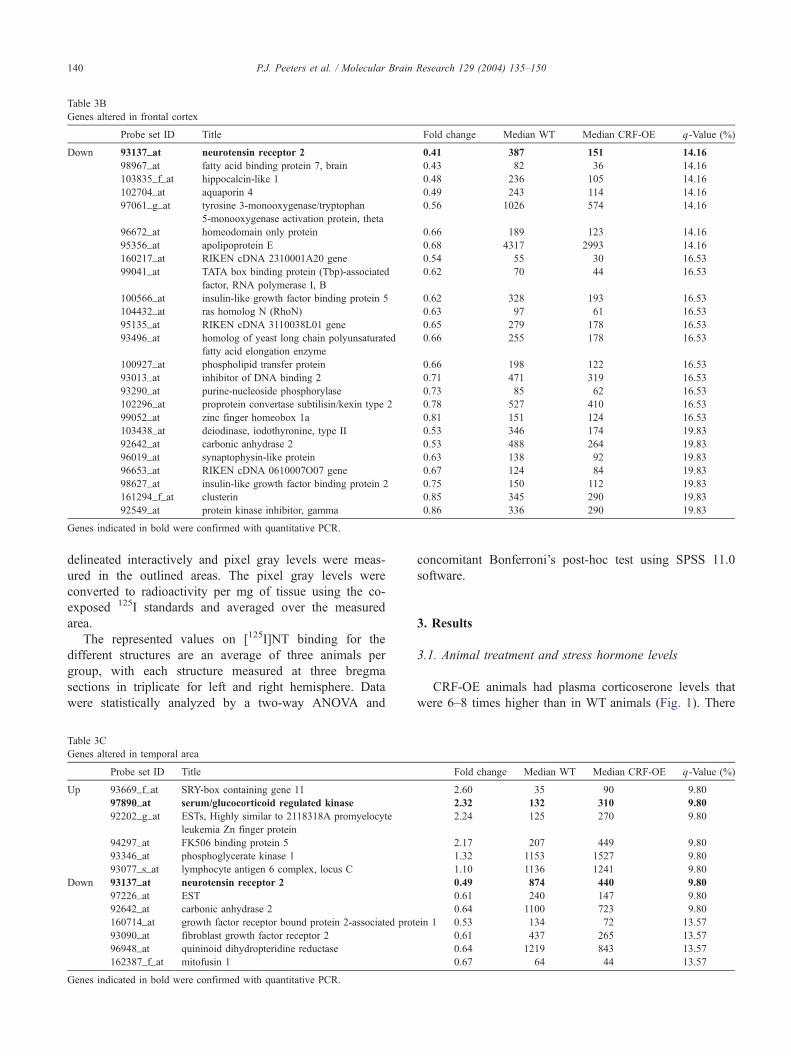
Table 3B
Genes altered in frontal cortex
Probe set ID Title Fold change Median WT Median CRF-OE q-Value (%)
Down 93137_at neurotensin receptor 2 0.41 387 151 14.16
98967_at fatty acid binding protein 7, brain 0.43 82 36 14.16
103835_f_at hippocalcin-like 1 0.48 236 105 14.16
102704_at aquaporin 4 0.49 243 114 14.16
97061_g_at tyrosine 3-monooxygenase/tryptophan
5-monooxygenase activation protein, theta
0.56 1026 574 14.16
96672_at homeodomain only protein 0.66 189 123 14.16
95356_at apolipoprotein E 0.68 4317 2993 14.16
160217_at RIKEN cDNA 2310001A20 gene 0.54 55 30 16.53
99041_at TATA box binding protein (Tbp)-associated
factor, RNA polymerase I, B
0.62 70 44 16.53
100566_at insulin-like growth factor binding protein 5 0.62 328 193 16.53
104432_at ras homolog N (RhoN) 0.63 97 61 16.53
95135_at RIKEN cDNA 3110038L01 gene 0.65 279 178 16.53
93496_at homolog of yeast long chain polyunsaturated
fatty acid elongation enzyme
0.66 255 178 16.53
100927_at phospholipid transfer protein 0.66 198 122 16.53
93013_at inhibitor of DNA binding 2 0.71 471 319 16.53
93290_at purine-nucleoside phosphorylase 0.73 85 62 16.53
102296_at proprotein convertase subtilisin/kexin type 2 0.78 527 410 16.53
99052_at zinc finger homeobox 1a 0.81 151 124 16.53
103438_at deiodinase, iodothyronine, type II 0.53 346 174 19.83
92642_at carbonic anhydrase 2 0.53 488 264 19.83
96019_at synaptophysin-like protein 0.63 138 92 19.83
96653_at RIKEN cDNA 0610007O07 gene 0.67 124 84 19.83
98627_at insulin-like growth factor binding protein 2 0.75 150 112 19.83
161294_f_at clusterin 0.85 345 290 19.83
92549_at protein kinase inhibitor, gamma 0.86 336 290 19.83
Genes indicated in bold were confirmed with quantitative PCR.
P.J. Peeters et al. / Molecular Brain Research 129 (2004) 135–150140
delineated interactively and pixel gray levels were meas-
ured in the outlined areas. The pixel gray levels were
converted to radioactivity per mg of tissue using the co-
exposed 125I standards and averaged over the measured
area.
The represented values on [125I]NT binding for the
different structures are an average of three animals per
group, with each structure measured at three bregma
sections in triplicate for left and right hemisphere. Data
were statistically analyzed by a two-way ANOVA and
Table 3C
Genes altered in temporal area
Probe set ID Title
Up 93669_f_at SRY-box containing gene 11
97890_at serum/glucocorticoid regulated kinase
92202_g_at ESTs, Highly similar to 2118318A promyelocyte
leukemia Zn finger protein
94297_at FK506 binding protein 5
93346_at phosphoglycerate kinase 1
93077_s_at lymphocyte antigen 6 complex, locus C
Down 93137_at neurotensin receptor 2
97226_at EST
92642_at carbonic anhydrase 2
160714_at growth factor receptor bound protein 2-associated prot
93090_at fibroblast growth factor receptor 2
96948_at quininoid dihydropteridine reductase
162387_f_at mitofusin 1
Genes indicated in bold were confirmed with quantitative PCR.
concomitant Bonferroni’s post-hoc test using SPSS 11.0
software.
3. Results
3.1. Animal treatment and stress hormone levels
CRF-OE animals had plasma corticoserone levels that
were 6–8 times higher than in WT animals (Fig. 1). There
Fold change Median WT Median CRF-OE q-Value (%)
2.60 35 90 9.80
2.32 132 310 9.80
2.24 125 270 9.80
2.17 207 449 9.80
1.32 1153 1527 9.80
1.10 1136 1241 9.80
0.49 874 440 9.80
0.61 240 147 9.80
0.64 1100 723 9.80
ein 1 0.53 134 72 13.57
0.61 437 265 13.57
0.64 1219 843 13.57
0.67 64 44 13.57
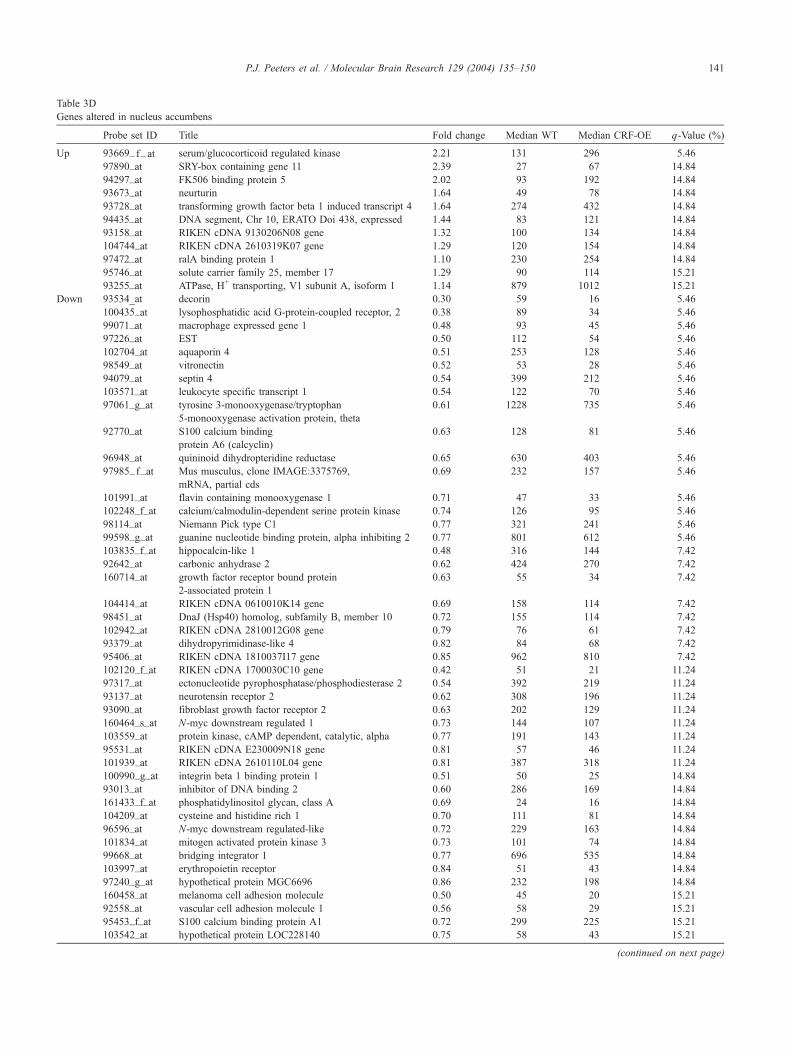
Table 3D
Genes altered in nucleus accumbens
Probe set ID Title Fold change Median WT Median CRF-OE q-Value (%)
Up 93669_ f_at serum/glucocorticoid regulated kinase 2.21 131 296 5.46
97890_at SRY-box containing gene 11 2.39 27 67 14.84
94297_at FK506 binding protein 5 2.02 93 192 14.84
93673_at neurturin 1.64 49 78 14.84
93728_at transforming growth factor beta 1 induced transcript 4 1.64 274 432 14.84
94435_at DNA segment, Chr 10, ERATO Doi 438, expressed 1.44 83 121 14.84
93158_at RIKEN cDNA 9130206N08 gene 1.32 100 134 14.84
104744_at RIKEN cDNA 2610319K07 gene 1.29 120 154 14.84
97472_at ralA binding protein 1 1.10 230 254 14.84
95746_at solute carrier family 25, member 17 1.29 90 114 15.21
93255_at ATPase, H+ transporting, V1 subunit A, isoform 1 1.14 879 1012 15.21
Down 93534_at decorin 0.30 59 16 5.46
100435_at lysophosphatidic acid G-protein-coupled receptor, 2 0.38 89 34 5.46
99071_at macrophage expressed gene 1 0.48 93 45 5.46
97226_at EST 0.50 112 54 5.46
102704_at aquaporin 4 0.51 253 128 5.46
98549_at vitronectin 0.52 53 28 5.46
94079_at septin 4 0.54 399 212 5.46
103571_at leukocyte specific transcript 1 0.54 122 70 5.46
97061_g_at tyrosine 3-monooxygenase/tryptophan
5-monooxygenase activation protein, theta
0.61 1228 735 5.46
92770_at S100 calcium binding
protein A6 (calcyclin)
0.63 128 81 5.46
96948_at quininoid dihydropteridine reductase 0.65 630 403 5.46
97985_ f_at Mus musculus, clone IMAGE:3375769,
mRNA, partial cds
0.69 232 157 5.46
101991_at flavin containing monooxygenase 1 0.71 47 33 5.46
102248_f_at calcium/calmodulin-dependent serine protein kinase 0.74 126 95 5.46
98114_at Niemann Pick type C1 0.77 321 241 5.46
99598_g_at guanine nucleotide binding protein, alpha inhibiting 2 0.77 801 612 5.46
103835_f_at hippocalcin-like 1 0.48 316 144 7.42
92642_at carbonic anhydrase 2 0.62 424 270 7.42
160714_at growth factor receptor bound protein
2-associated protein 1
0.63 55 34 7.42
104414_at RIKEN cDNA 0610010K14 gene 0.69 158 114 7.42
98451_at DnaJ (Hsp40) homolog, subfamily B, member 10 0.72 155 114 7.42
102942_at RIKEN cDNA 2810012G08 gene 0.79 76 61 7.42
93379_at dihydropyrimidinase-like 4 0.82 84 68 7.42
95406_at RIKEN cDNA 1810037I17 gene 0.85 962 810 7.42
102120_f_at RIKEN cDNA 1700030C10 gene 0.42 51 21 11.24
97317_at ectonucleotide pyrophosphatase/phosphodiesterase 2 0.54 392 219 11.24
93137_at neurotensin receptor 2 0.62 308 196 11.24
93090_at fibroblast growth factor receptor 2 0.63 202 129 11.24
160464_s_at N-myc downstream regulated 1 0.73 144 107 11.24
103559_at protein kinase, cAMP dependent, catalytic, alpha 0.77 191 143 11.24
95531_at RIKEN cDNA E230009N18 gene 0.81 57 46 11.24
101939_at RIKEN cDNA 2610110L04 gene 0.81 387 318 11.24
100990_g_at integrin beta 1 binding protein 1 0.51 50 25 14.84
93013_at inhibitor of DNA binding 2 0.60 286 169 14.84
161433_f_at phosphatidylinositol glycan, class A 0.69 24 16 14.84
104209_at cysteine and histidine rich 1 0.70 111 81 14.84
96596_at N-myc downstream regulated-like 0.72 229 163 14.84
101834_at mitogen activated protein kinase 3 0.73 101 74 14.84
99668_at bridging integrator 1 0.77 696 535 14.84
103997_at erythropoietin receptor 0.84 51 43 14.84
97240_g_at hypothetical protein MGC6696 0.86 232 198 14.84
160458_at melanoma cell adhesion molecule 0.50 45 20 15.21
92558_at vascular cell adhesion molecule 1 0.56 58 29 15.21
95453_f_at S100 calcium binding protein A1 0.72 299 225 15.21
103542_at hypothetical protein LOC228140 0.75 58 43 15.21
(continued on next page)
P.J. Peeters et al. / Molecular Brain Research 129 (2004) 135–150 141
Table 3D (continued)
Probe set ID Title Fold change Median WT Median CRF-OE q-Value (%)
102960_at recombination activating gene 1 gene activation 0.75 126 94 15.21
100005_at Tnf receptor associated factor 4 0.76 51 40 15.21
95502_at sirtuin 2 (silent mating type information
regulation 2, homolog) 2 (S. cerevisiae)
0.77 205 158 15.21
160568_at enolase 1, alpha non-neuron 0.84 1086 897 15.21
97273_at arsenate resistance protein 2 0.87 191 170 15.21
P.J. Peeters et al. / Molecular Brain Research 129 (2004) 135–150142
was a tendency for ACTH levels being lower in CRF-OE
animals but this did not reach significance ( p=0.08). A 5-
days treatment with R121919 (last treatment 16 h before
sacrifice) did not result in a significant effect on glucocorti-
coid and ACTH plasma levels.
3.2. Array hybridizations
RNA was isolated from the different brain regions under
investigation. These included pituitary, nucleus accumbens,
frontal cortex, temporal area, hippocampus and cerebellum.
Expression of CRFR1 and CRFR2 was measured in these
brain areas using quantitative PCR (data not shown).
Although CRFR1 was readily detectable, no reliable
measurements could be obtained for CRFR2 in these brain
areas. RNA isolated from different animals was processed
separately per individual animal and per brain region on
Affymetrix murine U74 arrays containing 12,000 murine
expressed sequence tags. Average percentages of present
calls and 3V/5Vratios for h-actin and GAPDH obtained in the
different areas are given in Table 2. Samples with low yields
of RNA or low percentages present calls (number of reliably
detectable probe sets/genes) or deviating 3V/5V ratios were
omitted from subsequent analysis, leaving 3–4 animals per
genotype and treatment.
3.3. Expression profile analysis
After normalization of the data, first pass examination
was performed using spectral map analysis (SPM). This
method allows an overall graphical interpretation of gene
expression responses in relation to the treatment group and
genotype. SPM indicated no gross changes in expression
between treatment groups for all areas except pituitary. In the
SPM biplot shown in Fig. 2, the two axes represent the first
two principle components explaining together 38% of the
variance observed in the pituitary dataset. At the level of the
pituitary a clear difference in overall gene expression pattern
was observed between CRF-OE and WT animals. This is
illustrated by the clustering at opposite sites in the spectral
map of the CRF-OE and WTsamples (depicted by squares in
Fig. 2). Genes (depicted as circles) that do not contribute to
difference between the samples end up around the centroid
(depicted as +) of the biplot. Genes at the periphery of the
biplot on the contrary, contribute significantly to the differ-
ences in expression profiles between samples. This is
exemplified by genes such as kallikreins (Klk9, Klk13,
Klk16 and Klk26) and preproenkphalin A, that clustered
together at the same side of the plot as the CRF-OE samples.
This is an indication for the expression levels of these genes
to be different (i.e., upregulated) in CRF-OE compared to
WT animals. Treatment with the CRFR1 antagonist
R121919 nor vehicle treatment did induce gross changes in
expression profile and did not normalize expression patterns
in CRF-OE relative to those observed in WT animals, as
illustrated by the pituitary SPM (Fig. 2).
In order to identify genes that were significantly
changed, the Significance analysis of microarray (SAM)
data algorithm was applied. In agreement with the SPM,
only a limited number of genes were significantly altered in
most brain areas with only 10 genes being downregulated in
the hippocampus. In the nucleus accumbens, 50 genes were
downregulated, whereas 11 genes were upregulated. Sig-
nificant changes per brain area are summarized in Tables
3A–3E. Recurring changes in expression patterns in several
brain areas can be clustered into a few pathways. These
pathways include glucocorticoid signaling (downregulation
of 11h-hydroxysteroid dehydrogenases type 1 and upregu-
lation of the immunophilin Fkbp5), intracellular calcium
signaling/sensing (alterations in hippocalcin like 1 and
calcyclin), myelination (myelin, myelin-associated glyco-
protein), cell proliferation and extracellular matrix formation
(lysophosphatidic acid receptor (Edg2), growth factor
receptor bound protein 2-associated protein 1 (Gab1),
Inhibitor of DNA binding 2 (Id2), fibroblast growth factor
receptor 2 (Fgfr2), decorin and brevican). Examples of
individual gene expression profiles in different brain areas
and their confirmation by quantitative PCR are shown in
Figs. 3 and 4, respectively.
At the level of the pituitary, 114 genes differed
significantly in their expression between untreated WT
and CRF-OE animals and were more than 2 times up- or
downregulated (see Table 3E). When comparing WT to
CRF-OE animals, 102 genes had a q-value below 10% and
were more than 1.5-fold downregulated in CRF-OE.
Similarly, 180 genes had a q-value below 10% and were
more than 1.5-fold upregulated in CRF-OE. In agreement
with SPM, SAM identified kallikrein genes Klk9, Klk13,
Klk16 and Klk26, but in addition also identified Klk5 and
Klk8 to be significantly upregulated in CRF-OE. The
highest change in expression was observed in the endoge-
nous opioid peptide gene preproenkephalin A (10 times
higher in CRF-OE vs. WT). To a lesser extent also
prodynorphin was affected (2 times higher in CRF-OE vs.
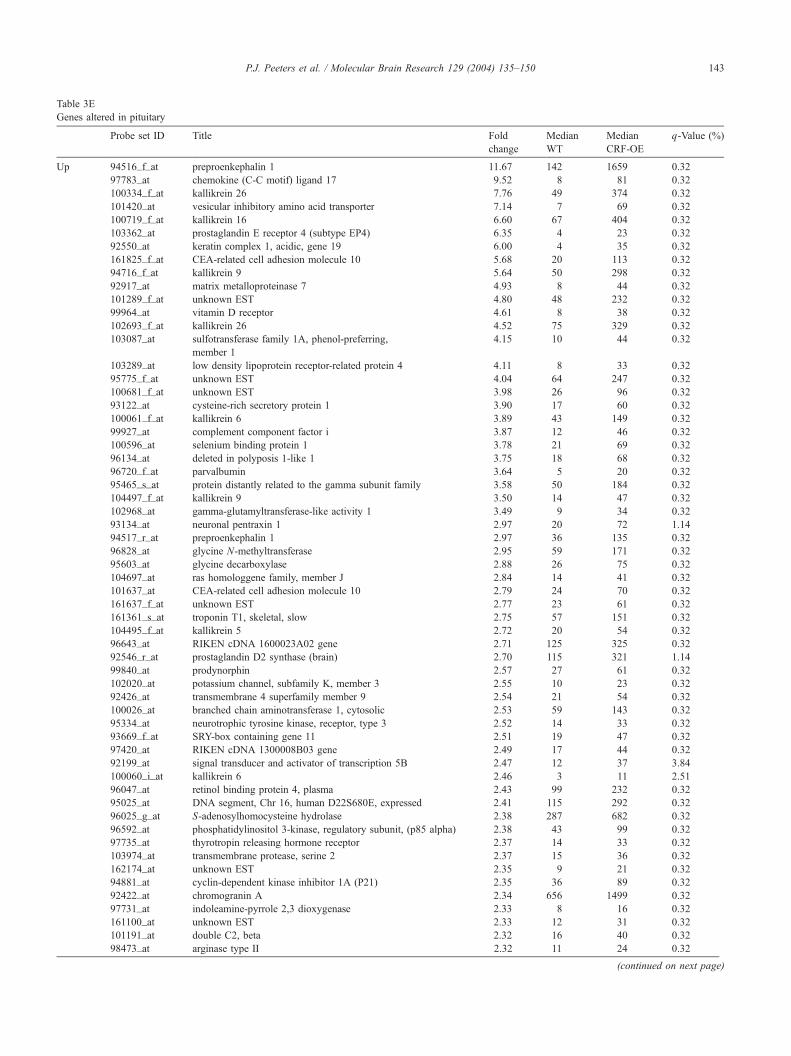
Table 3E
Genes altered in pituitary
Probe set ID Title Fold
change
Median
WT
Median
CRF-OE
q-Value (%)
Up 94516_f_at preproenkephalin 1 11.67 142 1659 0.32
97783_at chemokine (C-C motif) ligand 17 9.52 8 81 0.32
100334_f_at kallikrein 26 7.76 49 374 0.32
101420_at vesicular inhibitory amino acid transporter 7.14 7 69 0.32
100719_f_at kallikrein 16 6.60 67 404 0.32
103362_at prostaglandin E receptor 4 (subtype EP4) 6.35 4 23 0.32
92550_at keratin complex 1, acidic, gene 19 6.00 4 35 0.32
161825_f_at CEA-related cell adhesion molecule 10 5.68 20 113 0.32
94716_f_at kallikrein 9 5.64 50 298 0.32
92917_at matrix metalloproteinase 7 4.93 8 44 0.32
101289_f_at unknown EST 4.80 48 232 0.32
99964_at vitamin D receptor 4.61 8 38 0.32
102693_f_at kallikrein 26 4.52 75 329 0.32
103087_at sulfotransferase family 1A, phenol-preferring,
member 1
4.15 10 44 0.32
103289_at low density lipoprotein receptor-related protein 4 4.11 8 33 0.32
95775_f_at unknown EST 4.04 64 247 0.32
100681_f_at unknown EST 3.98 26 96 0.32
93122_at cysteine-rich secretory protein 1 3.90 17 60 0.32
100061_f_at kallikrein 6 3.89 43 149 0.32
99927_at complement component factor i 3.87 12 46 0.32
100596_at selenium binding protein 1 3.78 21 69 0.32
96134_at deleted in polyposis 1-like 1 3.75 18 68 0.32
96720_f_at parvalbumin 3.64 5 20 0.32
95465_s_at protein distantly related to the gamma subunit family 3.58 50 184 0.32
104497_f_at kallikrein 9 3.50 14 47 0.32
102968_at gamma-glutamyltransferase-like activity 1 3.49 9 34 0.32
93134_at neuronal pentraxin 1 2.97 20 72 1.14
94517_r_at preproenkephalin 1 2.97 36 135 0.32
96828_at glycine N-methyltransferase 2.95 59 171 0.32
95603_at glycine decarboxylase 2.88 26 75 0.32
104697_at ras homologgene family, member J 2.84 14 41 0.32
101637_at CEA-related cell adhesion molecule 10 2.79 24 70 0.32
161637_f_at unknown EST 2.77 23 61 0.32
161361_s_at troponin T1, skeletal, slow 2.75 57 151 0.32
104495_f_at kallikrein 5 2.72 20 54 0.32
96643_at RIKEN cDNA 1600023A02 gene 2.71 125 325 0.32
92546_r_at prostaglandin D2 synthase (brain) 2.70 115 321 1.14
99840_at prodynorphin 2.57 27 61 0.32
102020_at potassium channel, subfamily K, member 3 2.55 10 23 0.32
92426_at transmembrane 4 superfamily member 9 2.54 21 54 0.32
100026_at branched chain aminotransferase 1, cytosolic 2.53 59 143 0.32
95334_at neurotrophic tyrosine kinase, receptor, type 3 2.52 14 33 0.32
93669_f_at SRY-box containing gene 11 2.51 19 47 0.32
97420_at RIKEN cDNA 1300008B03 gene 2.49 17 44 0.32
92199_at signal transducer and activator of transcription 5B 2.47 12 37 3.84
100060_i_at kallikrein 6 2.46 3 11 2.51
96047_at retinol binding protein 4, plasma 2.43 99 232 0.32
95025_at DNA segment, Chr 16, human D22S680E, expressed 2.41 115 292 0.32
96025_g_at S-adenosylhomocysteine hydrolase 2.38 287 682 0.32
96592_at phosphatidylinositol 3-kinase, regulatory subunit, (p85 alpha) 2.38 43 99 0.32
97735_at thyrotropin releasing hormone receptor 2.37 14 33 0.32
103974_at transmembrane protease, serine 2 2.37 15 36 0.32
162174_at unknown EST 2.35 9 21 0.32
94881_at cyclin-dependent kinase inhibitor 1A (P21) 2.35 36 89 0.32
92422_at chromogranin A 2.34 656 1499 0.32
97731_at indoleamine-pyrrole 2,3 dioxygenase 2.33 8 16 0.32
161100_at unknown EST 2.33 12 31 0.32
101191_at double C2, beta 2.32 16 40 0.32
98473_at arginase type II 2.32 11 24 0.32
(continued on next page)
P.J. Peeters et al. / Molecular Brain Research 129 (2004) 135–150 143
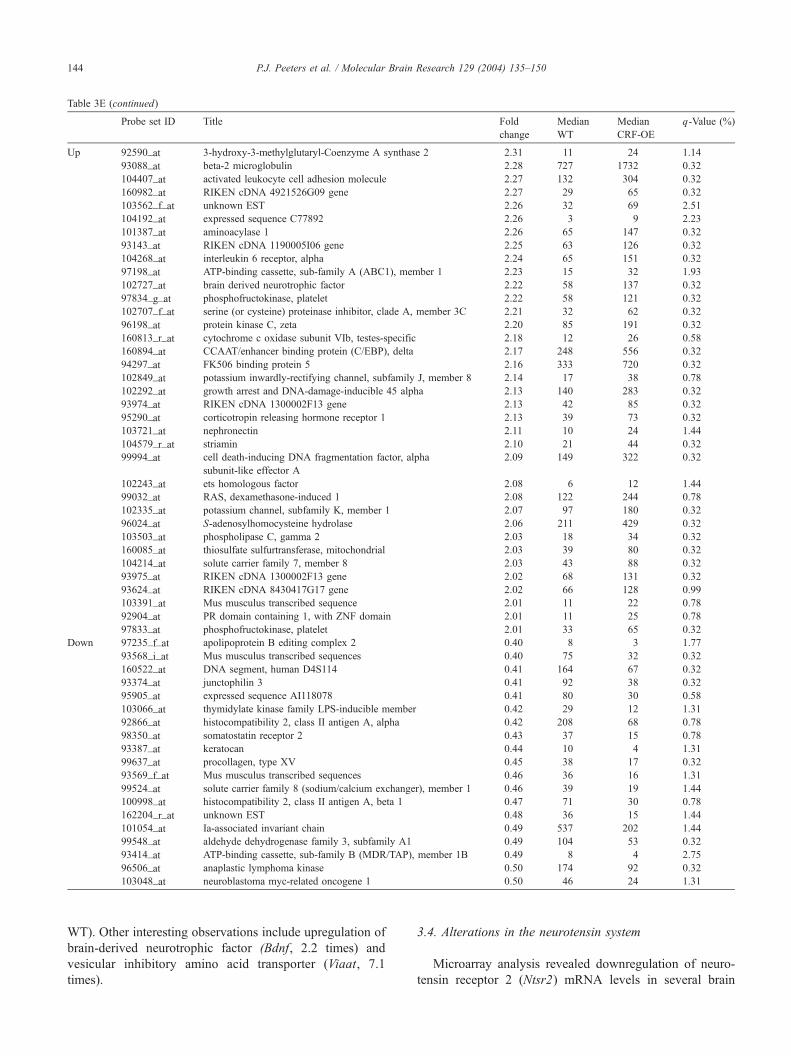
Table 3E (continued)
Probe set ID Title Fold
change
Median
WT
Median
CRF-OE
q-Value (%
Up 92590_at 3-hydroxy-3-methylglutaryl-Coenzyme A synthase 2 2.31 11 24 1.14
93088_at beta-2 microglobulin 2.28 727 1732 0.32
104407_at activated leukocyte cell adhesion molecule 2.27 132 304 0.32
160982_at RIKEN cDNA 4921526G09 gene 2.27 29 65 0.32
103562_f_at unknown EST 2.26 32 69 2.51
104192_at expressed sequence C77892 2.26 3 9 2.23
101387_at aminoacylase 1 2.26 65 147 0.32
93143_at RIKEN cDNA 1190005I06 gene 2.25 63 126 0.32
104268_at interleukin 6 receptor, alpha 2.24 65 151 0.32
97198_at ATP-binding cassette, sub-family A (ABC1), member 1 2.23 15 32 1.93
102727_at brain derived neurotrophic factor 2.22 58 137 0.32
97834_g_at phosphofructokinase, platelet 2.22 58 121 0.32
102707_f_at serine (or cysteine) proteinase inhibitor, clade A, member 3C 2.21 32 62 0.32
96198_at protein kinase C, zeta 2.20 85 191 0.32
160813_r_at cytochrome c oxidase subunit VIb, testes-specific 2.18 12 26 0.58
160894_at CCAAT/enhancer binding protein (C/EBP), delta 2.17 248 556 0.32
94297_at FK506 binding protein 5 2.16 333 720 0.32
102849_at potassium inwardly-rectifying channel, subfamily J, member 8 2.14 17 38 0.78
102292_at growth arrest and DNA-damage-inducible 45 alpha 2.13 140 283 0.32
93974_at RIKEN cDNA 1300002F13 gene 2.13 42 85 0.32
95290_at corticotropin releasing hormone receptor 1 2.13 39 73 0.32
103721_at nephronectin 2.11 10 24 1.44
104579_r_at striamin 2.10 21 44 0.32
99994_at cell death-inducing DNA fragmentation factor, alpha
subunit-like effector A
2.09 149 322 0.32
102243_at ets homologous factor 2.08 6 12 1.44
99032_at RAS, dexamethasone-induced 1 2.08 122 244 0.78
102335_at potassium channel, subfamily K, member 1 2.07 97 180 0.32
96024_at S-adenosylhomocysteine hydrolase 2.06 211 429 0.32
103503_at phospholipase C, gamma 2 2.03 18 34 0.32
160085_at thiosulfate sulfurtransferase, mitochondrial 2.03 39 80 0.32
104214_at solute carrier family 7, member 8 2.03 43 88 0.32
93975_at RIKEN cDNA 1300002F13 gene 2.02 68 131 0.32
93624_at RIKEN cDNA 8430417G17 gene 2.02 66 128 0.99
103391_at Mus musculus transcribed sequence 2.01 11 22 0.78
92904_at PR domain containing 1, with ZNF domain 2.01 11 25 0.78
97833_at phosphofructokinase, platelet 2.01 33 65 0.32
Down 97235_f_at apolipoprotein B editing complex 2 0.40 8 3 1.77
93568_i_at Mus musculus transcribed sequences 0.40 75 32 0.32
160522_at DNA segment, human D4S114 0.41 164 67 0.32
93374_at junctophilin 3 0.41 92 38 0.32
95905_at expressed sequence AI118078 0.41 80 30 0.58
103066_at thymidylate kinase family LPS-inducible member 0.42 29 12 1.31
92866_at histocompatibility 2, class II antigen A, alpha 0.42 208 68 0.78
98350_at somatostatin receptor 2 0.43 37 15 0.78
93387_at keratocan 0.44 10 4 1.31
99637_at procollagen, type XV 0.45 38 17 0.32
93569_f_at Mus musculus transcribed sequences 0.46 36 16 1.31
99524_at solute carrier family 8 (sodium/calcium exchanger), member 1 0.46 39 19 1.44
100998_at histocompatibility 2, class II antigen A, beta 1 0.47 71 30 0.78
162204_r_at unknown EST 0.48 36 15 1.44
101054_at Ia-associated invariant chain 0.49 537 202 1.44
99548_at aldehyde dehydrogenase family 3, subfamily A1 0.49 104 53 0.32
93414_at ATP-binding cassette, sub-family B (MDR/TAP), member 1B 0.49 8 4 2.75
96506_at anaplastic lymphoma kinase 0.50 174 92 0.32
103048_at neuroblastoma myc-related oncogene 1 0.50 46 24 1.31
P.J. Peeters et al. / Molecular Brain Research 129 (2004) 135–150144
WT). Other interesting observations include upregulation of
brain-derived neurotrophic factor (Bdnf, 2.2 times) and
vesicular inhibitory amino acid transporter (Viaat, 7.1
times).
)
3.4. Alterations in the neurotensin system
Microarray analysis revealed downregulation of neuro-
tensin receptor 2 (Ntsr2) mRNA levels in several brain
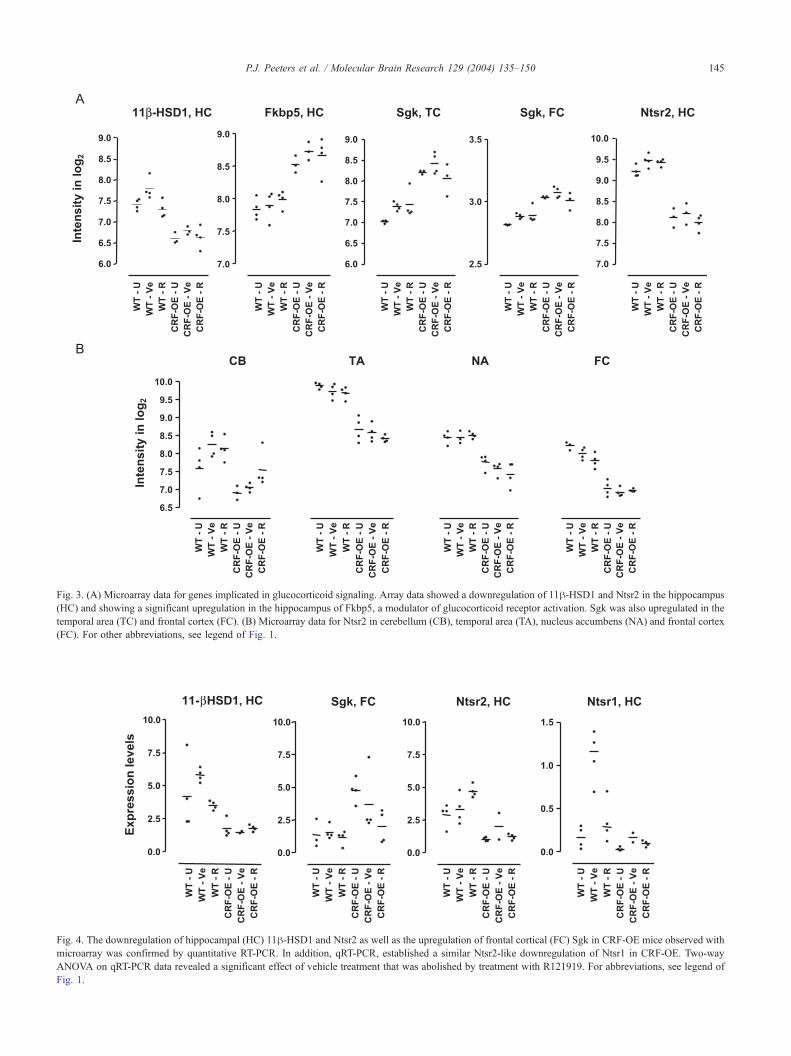
Fig. 3. (A) Microarray data for genes implicated in glucocorticoid signaling. Array data showed a downregulation of 11h-HSD1 and Ntsr2 in the hippocampus
(HC) and showing a significant upregulation in the hippocampus of Fkbp5, a modulator of glucocorticoid receptor activation. Sgk was also upregulated in the
temporal area (TC) and frontal cortex (FC). (B) Microarray data for Ntsr2 in cerebellum (CB), temporal area (TA), nucleus accumbens (NA) and frontal cortex
(FC). For other abbreviations, see legend of Fig. 1.
Fig. 4. The downregulation of hippocampal (HC) 11h-HSD1 and Ntsr2 as well as the upregulation of frontal cortical (FC) Sgk in CRF-OE mice observed with
microarray was confirmed by quantitative RT-PCR. In addition, qRT-PCR, established a similar Ntsr2-like downregulation of Ntsr1 in CRF-OE. Two-way
ANOVA on qRT-PCR data revealed a significant effect of vehicle treatment that was abolished by treatment with R121919. For abbreviations, see legend of
Fig. 1.
P.J. Peeters et al. / Molecular Brain Research 129 (2004) 135–150 145
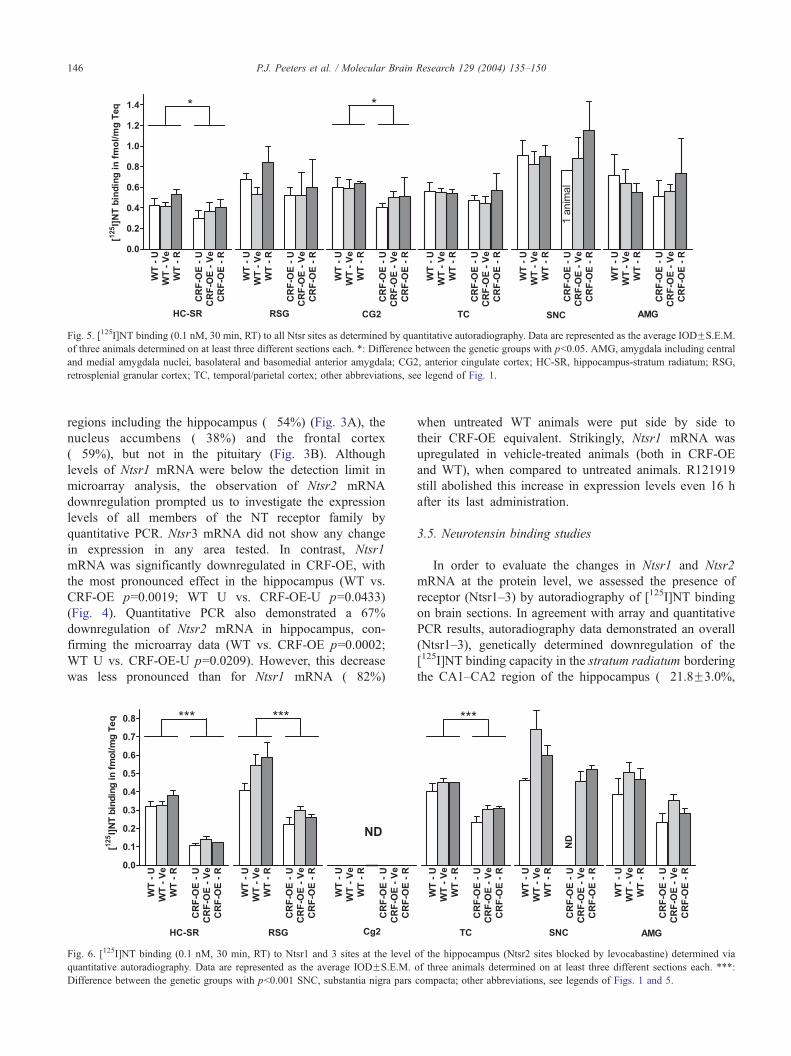
Fig. 5. [125I]NT binding (0.1 nM, 30 min, RT) to all Ntsr sites as determined by quantitative autoradiography. Data are represented as the average IODFS.E.M.
of three animals determined on at least three different sections each. *: Difference between the genetic groups with pb0.05. AMG, amygdala including central
and medial amygdala nuclei, basolateral and basomedial anterior amygdala; CG2, anterior cingulate cortex; HC-SR, hippocampus-stratum radiatum; RSG,
retrosplenial granular cortex; TC, temporal/parietal cortex; other abbreviations, see legend of Fig. 1.
P.J. Peeters et al. / Molecular Brain Research 129 (2004) 135–150146
regions including the hippocampus (�54%) (Fig. 3A), the
nucleus accumbens (�38%) and the frontal cortex
(�59%), but not in the pituitary (Fig. 3B). Although
levels of Ntsr1 mRNA were below the detection limit in
microarray analysis, the observation of Ntsr2 mRNA
downregulation prompted us to investigate the expression
levels of all members of the NT receptor family by
quantitative PCR. Ntsr3 mRNA did not show any change
in expression in any area tested. In contrast, Ntsr1
mRNA was significantly downregulated in CRF-OE, with
the most pronounced effect in the hippocampus (WT vs.
CRF-OE p=0.0019; WT U vs. CRF-OE-U p=0.0433)
(Fig. 4). Quantitative PCR also demonstrated a 67%
downregulation of Ntsr2 mRNA in hippocampus, con-
firming the microarray data (WT vs. CRF-OE p=0.0002;
WT U vs. CRF-OE-U p=0.0209). However, this decrease
was less pronounced than for Ntsr1 mRNA (�82%)
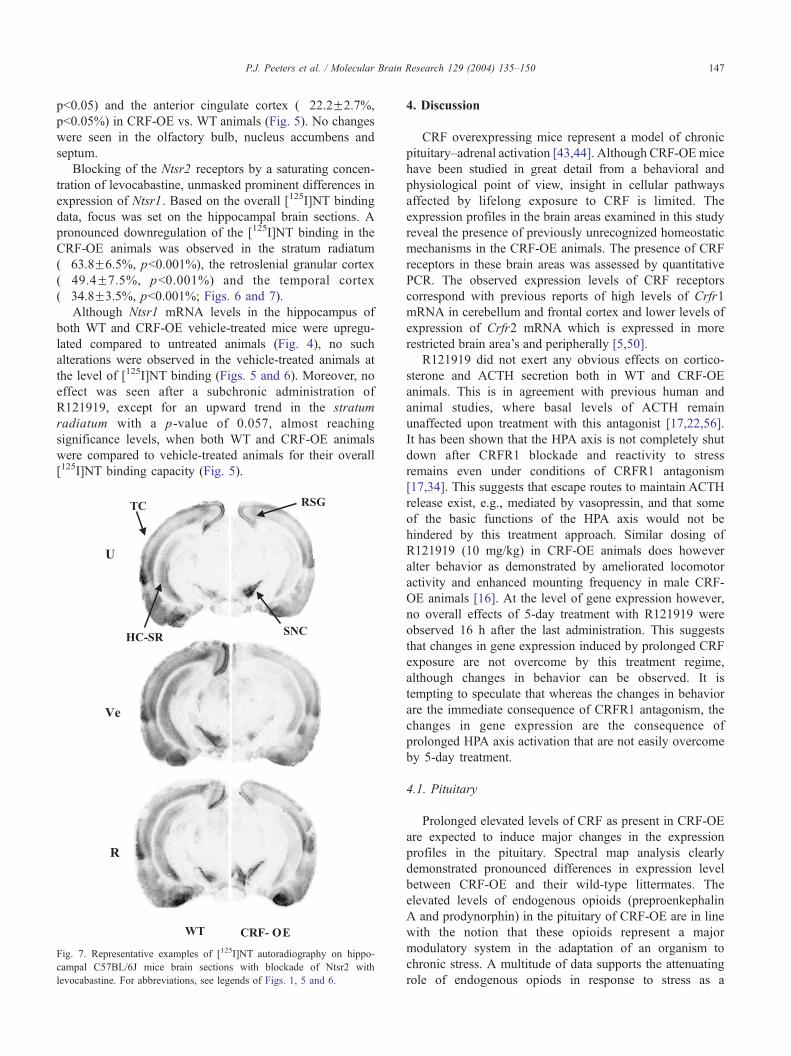
Fig. 6. [125I]NT binding (0.1 nM, 30 min, RT) to Ntsr1 and 3 sites at the level
quantitative autoradiography. Data are represented as the average IODFS.E.M.
Difference between the genetic groups with pb0.001 SNC, substantia nigra pars
when untreated WT animals were put side by side to
their CRF-OE equivalent. Strikingly, Ntsr1 mRNA was
upregulated in vehicle-treated animals (both in CRF-OE
and WT), when compared to untreated animals. R121919
still abolished this increase in expression levels even 16 h
after its last administration.
3.5. Neurotensin binding studies
In order to evaluate the changes in Ntsr1 and Ntsr2
mRNA at the protein level, we assessed the presence of
receptor (Ntsr1–3) by autoradiography of [125I]NT binding
on brain sections. In agreement with array and quantitative
PCR results, autoradiography data demonstrated an overall
(Ntsr1–3), genetically determined downregulation of the
[125I]NT binding capacity in the stratum radiatum bordering
the CA1–CA2 region of the hippocampus (�21.8F3.0%,
of the hippocampus (Ntsr2 sites blocked by levocabastine) determined via
of three animals determined on at least three different sections each. ***:
compacta; other abbreviations, see legends of Figs. 1 and 5.
P.J. Peeters et al. / Molecular Brain Research 129 (2004) 135–150 147
pb0.05) and the anterior cingulate cortex (�22.2F2.7%,
pb0.05%) in CRF-OE vs. WT animals (Fig. 5). No changes
were seen in the olfactory bulb, nucleus accumbens and
septum.
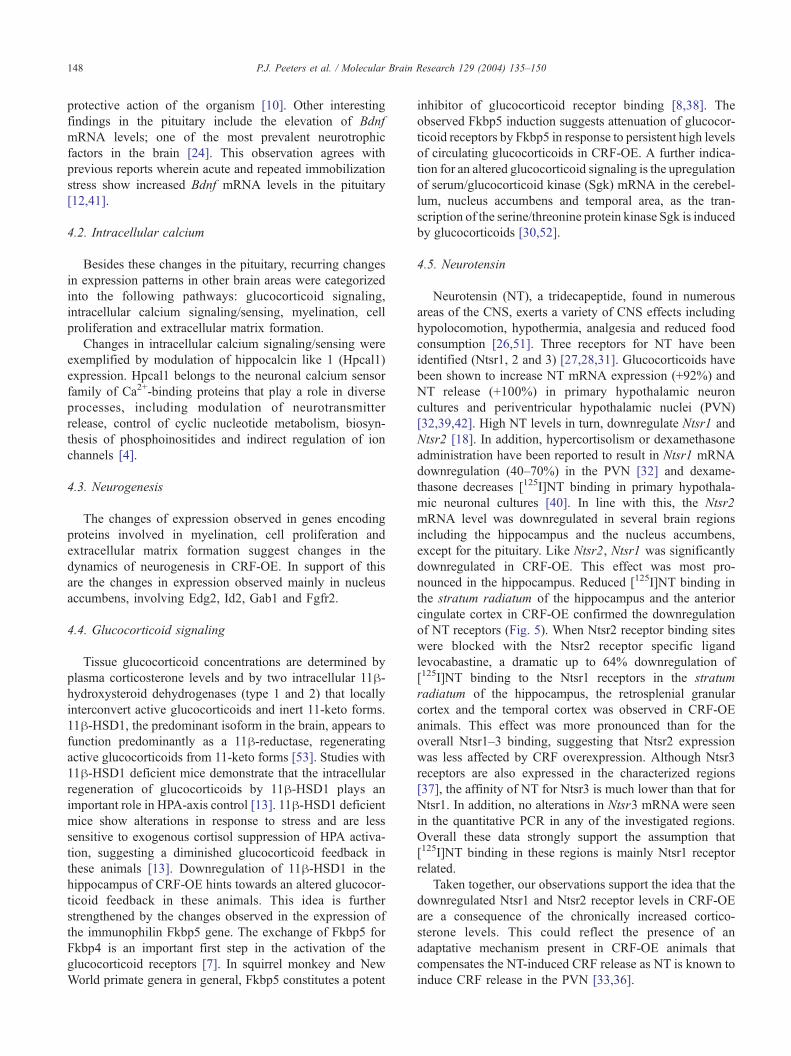
Blocking of the Ntsr2 receptors by a saturating concen-
tration of levocabastine, unmasked prominent differences in
expression of Ntsr1. Based on the overall [125I]NT binding
data, focus was set on the hippocampal brain sections. A
pronounced downregulation of the [125I]NT binding in the
CRF-OE animals was observed in the stratum radiatum
(�63.8F6.5%, pb0.001%), the retroslenial granular cortex
(�49.4F7.5%, pb0.001%) and the temporal cortex
(�34.8F3.5%, pb0.001%; Figs. 6 and 7).
Although Ntsr1 mRNA levels in the hippocampus of
both WT and CRF-OE vehicle-treated mice were upregu-
lated compared to untreated animals (Fig. 4), no such
alterations were observed in the vehicle-treated animals at
the level of [125I]NT binding (Figs. 5 and 6). Moreover, no
effect was seen after a subchronic administration of
R121919, except for an upward trend in the stratum
radiatum with a p-value of 0.057, almost reaching
significance levels, when both WT and CRF-OE animals
were compared to vehicle-treated animals for their overall
[125I]NT binding capacity (Fig. 5).
Fig. 7. Representative examples of [125I]NT autoradiography on hippo-
campal C57BL/6J mice brain sections with blockade of Ntsr2 with
levocabastine. For abbreviations, see legends of Figs. 1, 5 and 6.
4. Discussion
CRF overexpressing mice represent a model of chronic
pituitary–adrenal activation [43,44]. Although CRF-OEmice
have been studied in great detail from a behavioral and
physiological point of view, insight in cellular pathways
affected by lifelong exposure to CRF is limited. The
expression profiles in the brain areas examined in this study
reveal the presence of previously unrecognized homeostatic
mechanisms in the CRF-OE animals. The presence of CRF
receptors in these brain areas was assessed by quantitative
PCR. The observed expression levels of CRF receptors
correspond with previous reports of high levels of Crfr1
mRNA in cerebellum and frontal cortex and lower levels of
expression of Crfr2 mRNA which is expressed in more
restricted brain area’s and peripherally [5,50].
R121919 did not exert any obvious effects on cortico-
sterone and ACTH secretion both in WT and CRF-OE
animals. This is in agreement with previous human and
animal studies, where basal levels of ACTH remain
unaffected upon treatment with this antagonist [17,22,56].
It has been shown that the HPA axis is not completely shut
down after CRFR1 blockade and reactivity to stress
remains even under conditions of CRFR1 antagonism
[17,34]. This suggests that escape routes to maintain ACTH
release exist, e.g., mediated by vasopressin, and that some
of the basic functions of the HPA axis would not be
hindered by this treatment approach. Similar dosing of
R121919 (10 mg/kg) in CRF-OE animals does however
alter behavior as demonstrated by ameliorated locomotor
activity and enhanced mounting frequency in male CRF-
OE animals [16]. At the level of gene expression however,
no overall effects of 5-day treatment with R121919 were
observed 16 h after the last administration. This suggests
that changes in gene expression induced by prolonged CRF
exposure are not overcome by this treatment regime,
although changes in behavior can be observed. It is
tempting to speculate that whereas the changes in behavior
are the immediate consequence of CRFR1 antagonism, the
changes in gene expression are the consequence of
prolonged HPA axis activation that are not easily overcome
by 5-day treatment.
4.1. Pituitary
Prolonged elevated levels of CRF as present in CRF-OE
are expected to induce major changes in the expression
profiles in the pituitary. Spectral map analysis clearly
demonstrated pronounced differences in expression level
between CRF-OE and their wild-type littermates. The
elevated levels of endogenous opioids (preproenkephalin
A and prodynorphin) in the pituitary of CRF-OE are in line
with the notion that these opioids represent a major
modulatory system in the adaptation of an organism to
chronic stress. A multitude of data supports the attenuating
role of endogenous opiods in response to stress as a
P.J. Peeters et al. / Molecular Brain Research 129 (2004) 135–150148
protective action of the organism [10]. Other interesting
findings in the pituitary include the elevation of Bdnf
mRNA levels; one of the most prevalent neurotrophic
factors in the brain [24]. This observation agrees with
previous reports wherein acute and repeated immobilization
stress show increased Bdnf mRNA levels in the pituitary
[12,41].
4.2. Intracellular calcium
Besides these changes in the pituitary, recurring changes
in expression patterns in other brain areas were categorized
into the following pathways: glucocorticoid signaling,
intracellular calcium signaling/sensing, myelination, cell
proliferation and extracellular matrix formation.
Changes in intracellular calcium signaling/sensing were
exemplified by modulation of hippocalcin like 1 (Hpcal1)
expression. Hpcal1 belongs to the neuronal calcium sensor
family of Ca2+-binding proteins that play a role in diverse
processes, including modulation of neurotransmitter
release, control of cyclic nucleotide metabolism, biosyn-
thesis of phosphoinositides and indirect regulation of ion
channels [4].
4.3. Neurogenesis
The changes of expression observed in genes encoding
proteins involved in myelination, cell proliferation and
extracellular matrix formation suggest changes in the
dynamics of neurogenesis in CRF-OE. In support of this
are the changes in expression observed mainly in nucleus
accumbens, involving Edg2, Id2, Gab1 and Fgfr2.
4.4. Glucocorticoid signaling
Tissue glucocorticoid concentrations are determined by
plasma corticosterone levels and by two intracellular 11h-hydroxysteroid dehydrogenases (type 1 and 2) that locally
interconvert active glucocorticoids and inert 11-keto forms.
11h-HSD1, the predominant isoform in the brain, appears to
function predominantly as a 11h-reductase, regenerating
active glucocorticoids from 11-keto forms [53]. Studies with
11h-HSD1 deficient mice demonstrate that the intracellular
regeneration of glucocorticoids by 11h-HSD1 plays an
important role in HPA-axis control [13]. 11h-HSD1 deficientmice show alterations in response to stress and are less
sensitive to exogenous cortisol suppression of HPA activa-
tion, suggesting a diminished glucocorticoid feedback in
these animals [13]. Downregulation of 11h-HSD1 in the
hippocampus of CRF-OE hints towards an altered glucocor-
ticoid feedback in these animals. This idea is further
strengthened by the changes observed in the expression of
the immunophilin Fkbp5 gene. The exchange of Fkbp5 for
Fkbp4 is an important first step in the activation of the
glucocorticoid receptors [7]. In squirrel monkey and New
World primate genera in general, Fkbp5 constitutes a potent
inhibitor of glucocorticoid receptor binding [8,38]. The
observed Fkbp5 induction suggests attenuation of glucocor-
ticoid receptors by Fkbp5 in response to persistent high levels
of circulating glucocorticoids in CRF-OE. A further indica-
tion for an altered glucocorticoid signaling is the upregulation
of serum/glucocorticoid kinase (Sgk) mRNA in the cerebel-
lum, nucleus accumbens and temporal area, as the tran-
scription of the serine/threonine protein kinase Sgk is induced
by glucocorticoids [30,52].
4.5. Neurotensin
Neurotensin (NT), a tridecapeptide, found in numerous
areas of the CNS, exerts a variety of CNS effects including
hypolocomotion, hypothermia, analgesia and reduced food
consumption [26,51]. Three receptors for NT have been
identified (Ntsr1, 2 and 3) [27,28,31]. Glucocorticoids have
been shown to increase NT mRNA expression (+92%) and
NT release (+100%) in primary hypothalamic neuron
cultures and periventricular hypothalamic nuclei (PVN)
[32,39,42]. High NT levels in turn, downregulate Ntsr1 and
Ntsr2 [18]. In addition, hypercortisolism or dexamethasone
administration have been reported to result in Ntsr1 mRNA
downregulation (40–70%) in the PVN [32] and dexame-
thasone decreases [125I]NT binding in primary hypothala-
mic neuronal cultures [40]. In line with this, the Ntsr2
mRNA level was downregulated in several brain regions
including the hippocampus and the nucleus accumbens,
except for the pituitary. Like Ntsr2, Ntsr1 was significantly
downregulated in CRF-OE. This effect was most pro-
nounced in the hippocampus. Reduced [125I]NT binding in
the stratum radiatum of the hippocampus and the anterior
cingulate cortex in CRF-OE confirmed the downregulation
of NT receptors (Fig. 5). When Ntsr2 receptor binding sites
were blocked with the Ntsr2 receptor specific ligand
levocabastine, a dramatic up to 64% downregulation of
[125I]NT binding to the Ntsr1 receptors in the stratum
radiatum of the hippocampus, the retrosplenial granular
cortex and the temporal cortex was observed in CRF-OE
animals. This effect was more pronounced than for the
overall Ntsr1–3 binding, suggesting that Ntsr2 expression
was less affected by CRF overexpression. Although Ntsr3
receptors are also expressed in the characterized regions
[37], the affinity of NT for Ntsr3 is much lower than that for
Ntsr1. In addition, no alterations in Ntsr3 mRNAwere seen
in the quantitative PCR in any of the investigated regions.
Overall these data strongly support the assumption that
[125I]NT binding in these regions is mainly Ntsr1 receptor
related.
Taken together, our observations support the idea that the
downregulated Ntsr1 and Ntsr2 receptor levels in CRF-OE
are a consequence of the chronically increased cortico-
sterone levels. This could reflect the presence of an
adaptative mechanism present in CRF-OE animals that
compensates the NT-induced CRF release as NT is known to
induce CRF release in the PVN [33,36].
P.J. Peeters et al. / Molecular Brain Research 129 (2004) 135–150 149
Strikingly, Ntsr1 mRNA expression was upregulated
(N5 times) in vehicle-treated CRF-OE and WT animals.
This mRNA increase might be induced by repeated
injection stress and was counteracted by subchronic
administration of the CRFR1 antagonist R121919. Yet,
this was not translated at the receptor level as [125I]NT
displayed equal binding to Ntsr1 receptors in the hippo-
campus of untreated and vehicle-treated WT and CRF-OE
mice (Figs. 5 and 6). However, it has been suggested that,
once internalized, Ntsr1 receptors are degraded instead of
being recycled to the cell surface [9,19,46,55]. In line with
this it is tempting to speculate that a transient increase in
NT release following injection stress in vehicle-treated
animals induces Ntsr1 receptor degradation, counteracting
increased Ntsr1 expression at the protein level due to
higher mRNA levels.
5. Conclusion
In conclusion, gene expression profiling of several brain
areas of CRF-OE mice identified consistent changes in
expression patterns related to glucocorticoid signaling,
intracellular calcium signaling/sensing, myelination, cell
proliferation and extracellular matrix formation. Adaptation
to chronically increased corticosterone levels was further
reflected in downregulation of Ntsr1 and Ntsr2 receptors.
These molecular data suggest that lifelong exposure to
excessive CRF leads to adaptive changes in the brain which
could play a role in some of the behavioral and
physiological alterations seen in this animal model for
chronic stress.
Acknowledgments
The authors like to thank Luc Bijnens and Jos Prickaerts
for their suggestions on the statistical data analysis and
anatomical interpretation. We also thank Ilse Lenaerts, Ilse
Goris, Gie Daneels, Jean-Marc Taymans and Paula te Riele
for their aid during the experiments.
References
[1] G. Aguilera, C. Rabadan-Diehl, M. Nikodemova, Regulation of
pituitary corticotropin releasing hormone receptors, Peptides 22
(2001) 769–774.
[2] D. Amaratunga, J. Cabrera, Analysis of data from viral DNA
microchips, J. Am. Stat. Assoc. 96 (2001) 1161–1170.
[3] K.L. Brunson, D.E. Grigoriadis, M.T. Lorang, T.Z. Baram, Cortico-
tropin-releasing hormone (CRH) downregulates the function of its
receptor (CRF1) and induces CRF1 expression in hippocampal and
cortical regions of the immature rat brain, Exp. Neurol. 176 (2002)
75–86.
[4] R.D. Burgoyne, J.L. Weiss, The neuronal calcium sensor family of
Ca2+-binding proteins, Biochem. J. 353 (2001) 1–12.
[5] D.T. Chalmers, T.W. Lovenberg, E.B. De Souza, Localization of novel
corticotropin-releasing factor receptor (CRF2) mRNA expression to
specific subcortical nuclei in rat brain: comparison with CRF1 receptor
mRNA expression, J. Neurosci. 15 (1995) 6340–6350.
[6] S. Chapman, P. Schenk,K. Kazan, J.Manners, Using biplots to interpret
gene expression patterns in plants, Bioinformatics 18 (2002) 202–204.
[7] T.H. Davies, Y.M. Ning, E.R. Sanchez, A new first step in activation
of steroid receptors: hormone-induced switching of FKBP51 and
FKBP52 immunophilins, J. Biol. Chem. 277 (2002) 4597–4600.
[8] W.B. Denny, D.L. Valentine, P.D. Reynolds, D.F. Smith, J.G.
Scammell, Squirrel monkey immunophilin FKBP51 is a potent
inhibitor of glucocorticoid receptor binding, Endocrinology 141
(2000) 4107–4113.
[9] E. Donato di Paola, B. Cusack, M. Yamada, E. Richelson,
Desensitization and down-regulation of neurotensin receptors in
murine neuroblastoma clone N1E–115 by [d-Lys8] neurotensin(8–
13), J. Pharmacol. Exp. Ther. 264 (1993) 1–5.
[10] G. Drolet, E.C. Dumont, I. Gosselin, R. Kinkead, S. Laforest, J.F.
Trottier, Role of endogenous opioid system in the regulation of the
stress response, Prog. Neuro-Psychopharmacol. Biol. Psychiatry 25
(2001) 729–741.
[11] E. Fuchs, G. Flugge, Modulation of binding sites for corticotropin-
releasing hormone by chronic psychosocial stress, Psychoneuroen-
docrinology 20 (1995) 33–51.
[12] L. Givalois, F. Marmigere, F. Rage, G. Ixart, S. Arancibia, L. Tapia-
Arancibia, Immobilization stress rapidly and differentially modulates
BDNF and TrkB mRNA expression in the pituitary gland of adult
male rats, Neuroendocrinology 74 (2001) 148–159.
[13] H.J. Harris, Y. Kotelevtsev, J.J. Mullins, J.R. Seckl, M.C. Holmes,
Intracellular regeneration of glucocorticoids by 11beta-hydroxysteroid
dehydrogenase (11beta-HSD)-1 plays a key role in regulation of the
hypothalamic–pituitary–adrenal axis: analysis of 11beta-HSD-1-defi-
cient mice, Endocrinology 142 (2001) 114–120.
[14] R.L. Hauger, G. Aguilera, Regulation of pituitary corticotropin
releasing hormone (CRH) receptors by CRH: interaction with vaso-
pressin, Endocrinology 133 (1993) 1708–1714.
[15] R.L. Hauger, R.D. Smith, S. Braun, F.M. Dautzenberg, K.J. Catt,
Rapid agonist-induced phosphorylation of the human CRF receptor,
type 1: a potential mechanism for homologous desensitization,
Biochem. Biophys. Res. Commun. 268 (2000) 572–576.
[16] S.C. Heinrichs, Behavioral consequences of altered corticotropin-
releasing factor activation in brain: a functionalist view of affective
neuroscience, in: T. Steckler, N. Kalin, J.M. Reul (Eds.), Handbook on
Stress and the Brain, Elsevier, Amsterdam, 2004.
[17] S.C. Heinrichs, E.B. De Souza, G. Schulteis, J.L. Lapsansky, D.E.
Grigoriadis, Brain penetrance, receptor occupancy and antistress in
vivo efficacy of a small molecule corticotropin releasing factor type I
receptor selective antagonist, Neuropsychopharmacology 27 (2002)
194–202.
[18] E. Hermans, J.M. Maloteaux, Mechanisms of regulation of neuro-
tensin receptors, Pharmacol. Ther. 79 (1998) 89–104.
[19] E. Hermans, M.A. Vanisberg, M. Geurts, J.M. Maloteaux, Down-
regulation of neurotensin receptors after ligand-induced internalization
in rat primary cultured neurons, Neurochem. Int. 31 (1997) 291–299.
[20] A.R. Hoffman, G. Ceda, T.D. Reisine, Corticotropin-releasing factor
desensitization of adrenocorticotropic hormone release is augmented
by arginine vasopressin, J. Neurosci. 5 (1985) 234–242.
[21] A. Holmes, M. Heilig, N.M. Rupniak, T. Steckler, G. Griebel,
Neuropeptide systems as novel therapeutic targets for depression and
anxiety disorders, Trends Pharmacol. Sci. 24 (2003) 580–588.
[22] H.E. Kunzel, A.W. Zobel, T. Nickel, N. Ackl, M. Uhr, A. Sonntag, M.
Ising, F. Holsboer, Treatment of depression with the CRH-1-receptor
antagonist R121919: endocrine changes and side effects, J. Psychiatr.
Res. 37 (2003) 525–533.
[23] J. Landgrebe, W. Wurst, G. Welzl, Permutation-validated principal
components analysis of microarray data, Genome Biol. 3 (2002)
R1–R19.
P.J. Peeters et al. / Molecular Brain Research 129 (2004) 135–150150
[24] J. Leibrock, F. Lottspeich, A. Hohn, M. Hofer, B. Hengerer, P.
Masiakowski, H. Thoenen, Y.A. Barde, Molecular cloning and
expression of brain-derived neurotrophic factor, Nature 314 (1989)
149–152.
[25] P.J. Lewi, Spectral mapping, a technique for classifying biological
activity profiles of chemical compounds, Arzneim.-Forsch. 26 (1976)
1295–1300.
[26] J.K. Mai, J. Triepel, J. Metz, Neurotensin in the human brain,
Neuroscience 22 (1987) 499–524.
[27] J. Mazella, J.M. Botto, E. Guillemare, T. Coppola, P. Sarret, J.P.
Vincent, Structure, functional expression, and cerebral localization of
the levocabastine-sensitive neurotensin/neuromedin N receptor from
mouse brain, J. Neurosci. 16 (1996) 5613–5620.
[28] J. Mazella, N. Zsurger, V. Navarro, J. Chabry, M. Kaghad, D. Caput,
P. Ferrara, N. Vita, D. Gully, J.P. Maffrand, J.P. Vincent, The 100-
kDa neurotensin receptor is gp95/sortilin, a non-G-protein-coupled
receptor, J. Biol. Chem. 273 (1998) 26273–26276.
[29] E. Moyse, W. Rostene, M. Vial, K. Leonard, J. Mazella, P. Kitabgi,
J.P. Vincent, A. Beaudet, Distribution of neurotensin binding sites in
rat brain: a light microscopic radioautographic study using monoiodo
[125I]Tyr3-neurotensin, Neuroscience 22 (1987) 525–536.
[30] A. Naray-Fejes-Toth, G. Fejes-Toth, K.A. Volk, J.B. Stokes, SGK is a
primary glucocorticoid-induced gene in the human, J. Steroid
Biochem. Mol. Biol. 75 (2000) 51–56.
[31] V. Navarro, S. Martin, P. Sarret, M.S. Nielsen, C.M. Petersen, J.
Vincent, J. Mazella, Pharmacological properties of the mouse
neurotensin receptor 3. Maintenance of cell surface receptor during
internalization of neurotensin, FEBS Lett. 495 (2001) 100–105.
[32] A. Nicot, W. Rostene, A. Berod, Hypercorticism induces neurotensin
mRNA in rat periventricular hypothalamus, NeuroReport 6 (1995)
2158–2160.
[33] A. Nicot, W.B. Rowe, E.R. de Kloet, C. Betancur, D.S. Jessop, S.L.
Lightman, R. Quirion, W. Rostene, A. Berod, Endogenous neuro-
tensin regulates hypothalamic–pituitary–adrenal axis activity and
peptidergic neurons in the rat hypothalamic paraventricular nucleus,
J. Neuroendocrinol. 9 (1997) 263–269.
[34] H. Ohata, K. Arai, T. Shibasaki, Effect of chronic administration
of a CRF(1) receptor antagonist, CRA1000, on locomotor activity
and endocrine responses to stress, Eur. J. Pharmacol. 457 (2002)
201–206.
[35] T. Reisine, A. Hoffman, Desensitization of corticotropin-releasing
factor receptors, Biochem. Biophys. Res. Commun. 111 (1983)
919–925.
[36] W. Rowe, V. Viau, M.J. Meaney, R. Quirion, Stimulation of CRH-
mediated ACTH secretion by central administration of neurotensin:
evidence for the participation of the paraventricular nucleus, J. Neuro-
endocrinol. 7 (1995) 109–117.
[37] P. Sarret, P. Krzywkowski, L. Segal, M.S. Nielsen, C.M. Petersen, J.
Mazella, T. Stroh, A. Beaudet, Distribution of NTS3 receptor/sortilin
mRNA and protein in the rat central nervous system, J. Comp. Neurol.
461 (2003) 483–505.
[38] J.G. Scammell, W.B. Denny, D.L. Valentine, D.F. Smith, Over-
expression of the FK506-binding immunophilin FKBP51 is the
common cause of glucocorticoid resistance in three New World
primates, Gen. Comp. Endocrinol. 124 (2001) 152–165.
[39] V. Scarceriaux, D. Pelaprat, P. Forgez, A.M. Lhiaubet, W.
Rostene, Effects of dexamethasone and forskolin on neurotensin
production in rat hypothalamic cultures, Endocrinology 136 (1995)
2554–2560.
[40] V. Scarceriaux, F. Souaze, C.M. Bachelet, P. Forgez, E. Bourdel, J.
Martinez, W. Rostene, D. Pelaprat, Neurotensin receptor down-
regulation induced by dexamethasone and forskolin in rat hypothala-
mic cultures is mediated by endogenous neurotensin, J. Neuro-
endocrinol. 8 (1996) 587–593.
[41] M.A. Smith, S. Makino, S.Y. Kim, R. Kvetnansky, Stress increases
brain-derived neurotropic factor messenger ribonucleic acid in the
hypothalamus and pituitary, Endocrinology 136 (1995) 3743–3750.
[42] F. Souaze, W. Rostene, P. Forgez, Neurotensin agonist induces
differential regulation of neurotensin receptor mRNA. Identification
of distinct transcriptional and post-transcriptional mechanisms, J. Biol.
Chem. 272 (1997) 10087–10094.
[43] M.P. Stenzel-Poore, V.A. Camferon, J. Vaughan, P.E. Sawchenko, W.
Vale, Development of Cushing’s syndrome in corticotropin-releasing
factor transgenic mice, Endocrinology 130 (1992) 3378–3386.
[44] M.P. Stenzel-Poore, S.C. Heinrichs, S. Rivest, G.F. Koob, W.W.
Vale, Overproduction of corticotropin-releasing factor in transgenic
mice: a genetic model of anxiogenic behavior, J. Neurosci. 14 (1994)
2579–2584.
[45] J.D. Storey, R. Tibshirani, Statistical significance for genomewide
studies, Proc. Natl. Acad. Sci. U. S. A. 100 (2003) 9440–9445.
[46] J.T. Turner, M.R. James-Kracke, J.M. Camden, Regulation of the
neurotensin receptor and intracellular calcium mobilization in HT29
cells, J. Pharmacol. Exp. Ther. 253 (1990) 1049–1056.
[47] V.G. Tusher, R. Tibshirani, G. Chu, Significance analysis of micro-
arrays applied to the ionizing radiation response, Proc. Natl. Acad.
Sci. U. S. A. 98 (2001) 5116–5121.
[48] M.M. van Gaalen, M.P. Stenzel-Poore, F. Holsboer, T. Steckler,
Effects of transgenic overproduction of CRH on anxiety-like
behaviour, Eur. J. Neurosci. 15 (2002) 2007–2015.
[49] M.M. van Gaalen, M. Stenzel-Poore, F. Holsboer, T. Steckler,
Reduced attention in mice overproducing corticotropin-releasing
hormone, Behav. Brain Res. 142 (2003) 69–79.
[50] K. Van Pett, V. Viau, J.C. Bittencourt, R.K. Chan, H.Y. Li, C. Arias,
G.S. Prins, M. Perrin, W. Vale, P.E. Sawchenko, Distribution of
mRNAs encoding CRF receptors in brain and pituitary of rat and
mouse, J. Comp. Neurol. 428 (2000) 191–212.
[51] J.P. Vincent, J. Mazella, P. Kitabgi, Neurotensin and neurotensin
receptors, Trends Pharmacol. Sci. 20 (1999) 302–309.
[52] M.K. Webster, L. Goya, Y. Ge, A.C. Maiyar, G.L. Firestone,
Characterization of sgk, a novel member of the serine/threonine
protein kinase gene family which is transcriptionally induced by
glucocorticoids and serum, Mol. Cell. Biol. 13 (1993) 2031–2040.
[53] P.C. White, T. Mune, A.K. Agarwal, 11 beta-Hydroxysteroid
dehydrogenase and the syndrome of apparent mineralocorticoid
excess, Endocr. Rev. 18 (1997) 135–156.
[54] L. Wouters, H.W. Gohlmann, L. Bijnens, S.U. Kass, G. Molenberghs,
P.J. Lewi, Graphical exploration of gene expression data: a com-
parative study of three multivariate methods, Biometrics 59 (2003)
1131–1139.
[55] M. Yamada, M. Yamada, E. Richelson, Further characterization of
neurotensin receptor desensitization and down-regulation in clone
N1E–115 neuroblastoma cells, Biochem. Pharmacol. 45 (1993)
2149–2154.
[56] A.W. Zobel, T. Nickel, H.E. Kunzel, N. Ackl, A. Sonntag, M. Ising, F.
Holsboer, Effects of the high-affinity corticotropin-releasing hormone
receptor 1 antagonist R121919 in major depression: the first 20
patients treated, J. Psychiatr. Res. 34 (2000) 171–181.
[57] P.J. Peeters, H.W. Gohlmann, I. Van Den Wyngaert, S.M. Swage-
makers, L. Bijnens, S.U. Kass, T. Steckler, Transcriptional response to
corticotropin-releasing factor in AtT-20 cells, Mol. Pharmacol. (2004)
(in press).
Related Documents