Aquatic Toxicology 77 (2006) 372–385 Gene expression patterns in rainbow trout, Oncorhynchus mykiss, exposed to a suite of model toxicants Sharon E. Hook a,∗ , Ann D. Skillman a , Jack A. Small b , Irvin R. Schultz a a Battelle, Marine Research Operations, Sequim, WA, United States b Pacific Northwest National Laboratory, Richland, WA, United States Received 30 September 2005; received in revised form 9 January 2006; accepted 11 January 2006 Abstract The increased availability and use of DNA microarrays has allowed the characterization of gene expression patterns associated with exposure to different toxicants. An important question is whether toxicant induced changes in gene expression in fish are sufficiently diverse to allow for identification of specific modes of action and/or specific contaminants. In theory, each class of toxicant may generate a gene expression profile unique to its mode of toxic action. In this study, isogenic (cloned) rainbow trout Oncorhynchus mykiss were exposed to sublethal levels of a series of model toxicants with varying modes of action, including ethynylestradiol (xeno-estrogen), 2,2,4,4 -tetrabromodiphenyl ether (BDE-47, thyroid active), diquat (oxidant stressor), chromium VI, and benzo[a]pyrene (BaP) for a period of 1–3 weeks. An additional experiment measured trenbolone (anabolic steroid; model androgen) induced gene expression changes in sexually mature female trout. Following exposure, fish were euthanized, livers removed and RNA extracted. Fluorescently labeled cDNA were generated and hybridized against a commercially available Atlantic Salmon/Trout array (GRASP project, University of Victoria) spotted with 16,000 cDNA’s. The slides were scanned to measure abundance of a given transcript in each sample relative to controls. Data were analyzed via Genespring (Silicon Genetics) to identify a list of up- and downregulated genes, as well as to determine gene clustering patterns that can be used as “expression signatures”. The results indicate each toxicant exposure caused between 64 and 222 genes to be significantly altered in expression. Most genes exhibiting altered expression responded to only one of the toxicants and relatively few were co-expressed in multiple treatments. For example, BaP and Diquat, both of which exert toxicity via oxidative stress, upregulated 28 of the same genes, of over 100 genes altered by either treatment. Other genes associated with steroidogenesis, p450 and estrogen responsive genes appear to be useful for selectively identifying toxicant mode of action in fish, suggesting a link between gene expression profile and mode of toxicity. Our array results showed good agreement with quantitative real time polymerase chain reaction (qRT PCR), which demonstrates that the arrays are an accurate measure of gene expression. The specificity of the gene expression profile in response to a model toxicant, the link between genes with altered expression and mode of toxic action, and the consistency between array and qRT PCR results all suggest that cDNA microarrays have the potential to screen environmental contaminants for biomarkers and mode of toxic action. © 2006 Elsevier B.V. All rights reserved. Keywords: Rainbow trout; Oncorhynchus mykiss; Xeno-estrogen; Gene expression; Microarrays; Genomics 1. Introduction The last decade has seen rapid advances in genomic analysis. Among the developments are microarray technologies, typically cDNA or DNA oligos spotted onto glass slides or nylon mem- branes (Waters and Fostel, 2004). Microarrays allow for the simultaneous measurement of 1000’s of expressed genes, poten- tially allowing the monitoring of the entire transcriptome of an organism (Schena et al., 1996; Bartosiewicz et al., 2000). Their ∗ Corresponding author. Tel.: +1 360 681 3626; fax: +1 360 681 3699. E-mail address: [email protected] (S.E. Hook). use has revolutionized oncology and pharmacology (vanDelft et al., 2004) and a similar impact is beginning to occur in toxicol- ogy (Hamadeh et al., 2001; Aardema and MacGregor, 2002). An important advantage of genomic analysis with regard to toxicological investigations is that gene expression changes are likely to be an initial response compared to more traditional toxicological endpoints. This would allow for increased sen- sitivity, earlier detection and measurement of toxicant effects at more environmentally relevant concentrations (Aardema and MacGregor, 2002; Waters and Fostel, 2004). Recent studies in rodents also suggest genomic analysis may offer improved anal- ysis of the effects of complex mixtures (Hamadeh et al., 2001; Amin et al., 2002; Aardema and MacGregor, 2002). 0166-445X/$ – see front matter © 2006 Elsevier B.V. All rights reserved. doi:10.1016/j.aquatox.2006.01.007

Welcome message from author
This document is posted to help you gain knowledge. Please leave a comment to let me know what you think about it! Share it to your friends and learn new things together.
Transcript
Aquatic Toxicology 77 (2006) 372–385
Gene expression patterns in rainbow trout, Oncorhynchus mykiss,exposed to a suite of model toxicants
Sharon E. Hook a,∗, Ann D. Skillman a, Jack A. Small b, Irvin R. Schultz a
a Battelle, Marine Research Operations, Sequim, WA, United Statesb Pacific Northwest National Laboratory, Richland, WA, United States
Received 30 September 2005; received in revised form 9 January 2006; accepted 11 January 2006
Abstract
The increased availability and use of DNA microarrays has allowed the characterization of gene expression patterns associated with exposureto different toxicants. An important question is whether toxicant induced changes in gene expression in fish are sufficiently diverse to allow foridentification of specific modes of action and/or specific contaminants. In theory, each class of toxicant may generate a gene expression profileunique to its mode of toxic action. In this study, isogenic (cloned) rainbow trout Oncorhynchus mykiss were exposed to sublethal levels of aseries of model toxicants with varying modes of action, including ethynylestradiol (xeno-estrogen), 2,2,4,4′-tetrabromodiphenyl ether (BDE-47,tteAodttvpePtr©
K
1
Acbsto
0d
hyroid active), diquat (oxidant stressor), chromium VI, and benzo[a]pyrene (BaP) for a period of 1–3 weeks. An additional experiment measuredrenbolone (anabolic steroid; model androgen) induced gene expression changes in sexually mature female trout. Following exposure, fish wereuthanized, livers removed and RNA extracted. Fluorescently labeled cDNA were generated and hybridized against a commercially availabletlantic Salmon/Trout array (GRASP project, University of Victoria) spotted with 16,000 cDNA’s. The slides were scanned to measure abundancef a given transcript in each sample relative to controls. Data were analyzed via Genespring (Silicon Genetics) to identify a list of up- andownregulated genes, as well as to determine gene clustering patterns that can be used as “expression signatures”. The results indicate eachoxicant exposure caused between 64 and 222 genes to be significantly altered in expression. Most genes exhibiting altered expression respondedo only one of the toxicants and relatively few were co-expressed in multiple treatments. For example, BaP and Diquat, both of which exert toxicityia oxidative stress, upregulated 28 of the same genes, of over 100 genes altered by either treatment. Other genes associated with steroidogenesis,450 and estrogen responsive genes appear to be useful for selectively identifying toxicant mode of action in fish, suggesting a link between genexpression profile and mode of toxicity. Our array results showed good agreement with quantitative real time polymerase chain reaction (qRTCR), which demonstrates that the arrays are an accurate measure of gene expression. The specificity of the gene expression profile in response
o a model toxicant, the link between genes with altered expression and mode of toxic action, and the consistency between array and qRT PCResults all suggest that cDNA microarrays have the potential to screen environmental contaminants for biomarkers and mode of toxic action.
2006 Elsevier B.V. All rights reserved.
eywords: Rainbow trout; Oncorhynchus mykiss; Xeno-estrogen; Gene expression; Microarrays; Genomics
. Introduction
The last decade has seen rapid advances in genomic analysis.mong the developments are microarray technologies, typically
DNA or DNA oligos spotted onto glass slides or nylon mem-ranes (Waters and Fostel, 2004). Microarrays allow for theimultaneous measurement of 1000’s of expressed genes, poten-ially allowing the monitoring of the entire transcriptome of anrganism (Schena et al., 1996; Bartosiewicz et al., 2000). Their
∗ Corresponding author. Tel.: +1 360 681 3626; fax: +1 360 681 3699.E-mail address: [email protected] (S.E. Hook).
use has revolutionized oncology and pharmacology (vanDelft etal., 2004) and a similar impact is beginning to occur in toxicol-ogy (Hamadeh et al., 2001; Aardema and MacGregor, 2002).
An important advantage of genomic analysis with regard totoxicological investigations is that gene expression changes arelikely to be an initial response compared to more traditionaltoxicological endpoints. This would allow for increased sen-sitivity, earlier detection and measurement of toxicant effectsat more environmentally relevant concentrations (Aardema andMacGregor, 2002; Waters and Fostel, 2004). Recent studies inrodents also suggest genomic analysis may offer improved anal-ysis of the effects of complex mixtures (Hamadeh et al., 2001;Amin et al., 2002; Aardema and MacGregor, 2002).
166-445X/$ – see front matter © 2006 Elsevier B.V. All rights reserved.oi:10.1016/j.aquatox.2006.01.007
S.E. Hook et al. / Aquatic Toxicology 77 (2006) 372–385 373
The application of genomic analysis in toxicology offers thepotential for improved assessment of toxicant mode of action.The response to contaminant exposure may involve a cascade ofgene interactions, rather than a change in a single gene or a fewgenes (Aardema and MacGregor, 2002). Metabolic pathways areoften controlled by master genes or “nodes” and changes in thesemaster genes could have pleiotrophic outcomes which couldbe monitored by genomic approaches (Neumann and Galvez,2002). Recent work suggests that diverse toxicants produce adistinctive gene expression signature (Bartosiewicz et al., 2001;Amin et al., 2002; Hamadeh et al., 2002b). For instance, geno-toxic and nongenotoxic carcinogens produce distinctly differentpatterns of gene expression (vanDelft et al., 2004). Becauseexpression profiles are more closely linked to the toxic mecha-nism of action as opposed to chemical structure, modes of toxicaction for unknown compounds can be discovered (Bartosiewiczet al., 2001; Hamadeh et al., 2001). For example, distinct pat-terns of gene expression were obtained from mice exposed totwo different classes of hepatotoxins: peroxisome proliferatorsand phenobaritol-like enzyme inducers (Hamadeh et al., 2002b).Hepatotoxins of unknown function were classified as to modeof toxic action according to expression fingerprints (Hamadehet al., 2002a). This experimental approach has applications inecotoxicology where increasingly, emphasis is being placed onunderstanding the mechanism of toxic action of environmentalcontaminants (Snape et al., 2004).
c(tfiDttefiawitls
tmsoparb(cscai
2. Materials and methods
2.1. Fish
All fish were maintained according to the guidelines estab-lished by the Institutional Animal Care and Use Committee(IACUC) of Battelle. All experiments except for the Trb expo-sures used male isogenic rainbow trout of the OSU × Swansoncross (Young et al., 1996). These fish were transferred to theBattelle Marine Research Operations Sequim, WA laboratoryat 530 degree days in age. Throughout the study, all fish weremaintained in single pass flow through tanks under natural pho-toperiod conditions and fed Bio-Oregon® soft moist pellets ofvarious sizes based on fish size. At the time of the exposures,the isogenic trout ranged in age from 1800 to 2460 degree days(5–7 months) and averaged 0.01–0.03 kg in weight.
For the Trb exposures, sexually mature female trout (0.71–0.95 kg) were obtained from a local hatchery (Nisqually TroutFarm, Lacey WA, USA) and acclimated for a minimum of 2weeks prior to exposure. These trout were initially group housedin 1400 l circular tanks and then individually housed in 370 l cir-cular tanks. Other conditions were as described above. Through-out the study, various water quality parameters were routinelymeasured in holding and treatment tanks and averaged 12 ◦C,>9 mg/l dissolved oxygen, pH 7.9, total alkalinity 200 mg/l (asCaCo ), ammonia <0.05 mg/l, and nitrate–nitrite <0.01mg/l.
2
fooc
2
eimueemsmvwaimo
vsw
Despite the potential of gene expression profiling in ecotoxi-ology, relatively few studies have utilized this technique in fishKoskinen et al., 2004). Some preliminary work using arrayso identify contaminant exposure in field collected fish and insh exposed to effluents has been done (Williams et al., 2003;enslow et al., 2004). Estrogenic compounds have been shown
o cause measurable increases in genes involved in female game-ogenesis (Larkin et al., 2002, 2003a), but this work has not beenxtended to other classes of toxicants. If gene expression pro-ling is to have the same impact on environmental assessmentss it has in human health, more exhaustive “proof of concept”ork must be done to demonstrate that transcriptomic responses
n lower vertebrates, such as fish, are sufficiently diverse to dis-inguish between classes of toxicants. Importantly, a strongerinkage between a specific mode of toxic action and gene expres-ion profile needs to be demonstrated.
A primary aim of this study is to demonstrate that struc-urally diverse contaminants exhibiting a variety of toxic
odes of action will generate unique patterns of gene expres-ion. We exposed rainbow trout (Oncorhynchus mykiss) tone of six different model toxicants: ethinylestradiol (EE2; aotent synthetic estrogen), trenbolone (Trb; a potent syntheticndrogen), 2,2,4,4′-tetrabromodiphenyl ether (BDE-47; a flameetardant suspected of having thyroid disrupting properties),enzo[α]pyrene (BaP, a carcinogen and genotoxicant), DiquatDiq, an aquatic herbicide and potent oxidative stressor), andhromium VI (Cr, a metal and oxidative stressor). Followingeparate, short-term exposures to each toxicant, the liver wasollected and RNA extracted for gene expression profiling usinghigh density cDNA microarray and subsequent qRT PCR val-
dation of array results.
3
.2. Chemicals
The study contaminants were >99% purity and were obtainedrom the following sources: EE2, Trb, BaP, and Cr-VI werebtained from Sigma (Colombia MO); BDE-47 and Diq werebtained from Chem Service (West Chester, PA). All otherhemicals used were of reagent grade.
.3. Exposures
Different routes of exposure were selected based on pastxperience and perceived environmental relevance and/or exper-mental necessity. For the EE2, Trb and BaP exposures, a mini-
um of three fish were exposed for 7 days to each contaminantsing a flow-through exposure system. Nominal exposure lev-ls of 50 ng/l EE2, 1 �g/l Trb and 1 �g/l BaP was used. Forach exposure, a concentrated stock solution was prepared inethanol and slowly added to the exposure tanks using a peri-
taltic pump at a flow rate of 0.10 ml/min (equals 0.0005%ethanol in tanks). Control tanks had only methanol added (sol-
ent control). The exposure tanks were allowed to equilibrateith each contaminant dosing system for 2–3 days prior to the
ddition of the trout. The EE2 and Trb concentrations were mon-tored before and after the exposure by GC–MS using analytical
ethods previously described in Schultz et al. (2001). The meanf the measured exposure levels is shown in Table 1.
For BDE-47, an oral exposure route was used. Five indi-idually housed trout were fed for 21 days live adult Artemiap. (purchased from Northeast Brine Shrimp, Oak Hill, FL),hich were used to bioencapsulate BDE-47 prior to feeding. For
374 S.E. Hook et al. / Aquatic Toxicology 77 (2006) 372–385
Table 1Chemical exposures and resultant tissue concentrations
Contaminant Exposure method Nominal level Measured level Tissue concentrationa
Ethynyl estradiol Dissolved (methanol carrier) 50 ng/l 37 �g/l n.m.Trenbolone Dissolved (methanol carrier) 1 �g/l 0.939 �g/l 13.6 ± 1.7 �g/g (L)Brominated diphenyl ether-47 Artemia food n.m. 500 �g/kg 8.7 ± 2.0 �g/ml (P), 8.8 ± 6.1 �g/g (L)Benzo[α]pyrene Dissolved 1 �g/l n.m. n.m.Chromium(VI) Intraperitoniel injection 25 �g/kg n.m. n.m.Diquat Intraperitoniel injection 500 �g/kg n.m. n.m.
a L = liver, P = plasma.
this procedure, adult Artemia (approximately 100–150) wereplaced in a 0.04 l flat bottomed, Pyrex tube previously coatedwith 660 �g of BDE-47 and filled with sterile filtered, SequimBay seawater. The adult Artemia were incubated in the tubeovernight with light aeration. The following morning (approx-imately 18–24 h incubation), the live Artemia were removedusing a fine mesh net, rinsed with filtered seawater and thenimmediately fed to the trout. Additional details on the bioen-capsulation of BDE-47 can be found in Muirhead et al. (2006).Subsequent to this feeding, trout were fed the normal pelleteddiet twice each day. A separate group of control trout were main-tained and fed live adult Artemia which were not exposed toBDE-47. These latter trout were used as appropriate vehicle con-trols in subsequent microarray hybridization experiments. TheBDE-47 content in the Artemia and also the plasma, liver andcarcass of the exposed trout were measured using GC-ECD asdescribed in Muirhead et al. (2006). A summary of these valuesare shown in Table 1. For the Cr-VI and Diq exposures, five troutwere administered an interperitaneal (i.p.) injection of (25 and500 �g/kg, respectively) each contaminant dissolved in 0.9%(w/v) NaCl. A separate group of three trout were administeredan i.p. injection of only 0.9% NaCl dosing vehicle. After 24 h,the fish were euthanized as described below.
2.4. Sampling and RNA extractions
(psac(RgaCgvia
2
c
These arrays have 16,000 cDNA and EST’s from either AtlanticSalmon (Salmo salar) or rainbow trout (Oncorhynchus mykiss).The array has 6998 unknown EST’s; the remainder of thespots have a putative identity available on the GRASP web-site http://web.uvic.ca/cbr/grasp/. The methods for obtainingthe cDNAs for the array, developing the arrays and validat-ing the arrays themselves are described in detail in Rise et al.(2004a). Sequence homology between the two species is suffi-ciently high, allowing for the cross species use of the array (Riseet al., 2004a). Array hybridizations were performed in a 3 × 3replicate design; with three animal replicates and three techni-cal replicates. RNA was transcribed into cDNA and indirectlylabeled via an aminoallyl technique (Invitrogen’s SuperscriptcDNA Indirect Labelling kit). Control cDNA was labeled withCy3 (Amersham), and exposed cDNA was labeled with Cy5. Asplit control experiment (where control RNA is put into two sep-arate tubes, labeled with Cy3 or Cy5, then recombined for arrayhybridization) was also performed to examine genes selectedas significant due to differences in dye incorporation (Draghici,2003). Exposed and control samples were paired according tocDNA yield and label incorporation, combined, and reduced involume to 32 �l in a vacuum concentrator. Samples were mixedwith 20 �g tRNA and 20 �g Herring Sperm DNA to preventnon specific hybridization, then mixed with 35 �l of modified“Genisphere” hybridization buffer (50% formamide, 40% 20×SSC, 9% Denhardtz solution, 1% SDS). This mixture was thenaabospbs
2
(gdmwnt(
Fish were euthanized with a lethal overdose of MS 222250 mg/l). Blood was collected from the caudal vein and thelasma obtained by centrifugation (3000 × g for 5 min) andtored at −80 ◦C for chemical analysis. The liver was immedi-tely removed and subsectioned. One subsection was frozen forhemical analysis and the remaining pieces placed in RNAlaterQiagen) and stored following the manufacturer’s protocols.NA was extracted using a standard TRIzol procedure (Invitro-en) and purified either via a mRNA cleanup kit (Qiagen) (BDEnd BaP) or via the TURBO DNAfree kit (Ambion) (EE2, Trb,r, Diq). Total RNA was quantified via fluorometry using ribo-reen reagent (Molecular Probes) and RNA quality was verifiedia gel electrophoresis. After processing, SUPRNasin (RNasenhbitor, Ambion) was added to help maintain sample integritynd RNA was stored at −80 ◦C.
.5. Microarray methods
Salmonid cDNA microarrays were obtained from the GRASPonsortium (Dr. Ben Koop, University of Victoria, Canada).
pplied to the arrays and allowed to hybridize overnight (16 h)t 45 ◦C. After hybridization, arrays were washed in SSC/SDSuffers with descending stringency to remove any unhybridizedr weakly (nonspecifically) hybridized cDNA’s. Arrays werecanned using a Perkin-Elmer ScanArray Express, with laserower and PMT gain varied to equalize fluorescence intensityetween channels and to prevent over saturation of signal inten-ity.
.6. Microarray data analysis
Data were extracted using ScanArray Express softwarePerkin-Elmer). The median fluorescence intensity with back-round subtracted was imported into a MIAME compliantatabase (Brazma et al., 2001). Genespring (Silicon Genetics)icroarray analysis software was used for further analysis. Dataere LOWESS normalized (Draghici, 2003), and spots that didot meet minimum signal intensity were removed. The resul-ant signal information was analyzed using one way ANOVAp = 0.05) with a Benjamani–Hochberg correction for multiple
S.E. Hook et al. / Aquatic Toxicology 77 (2006) 372–385 375
comparisons (GeneSpring). A list of differentially expressedgenes was prepared comprised of those genes that demonstrateda statistically significant change in expression for each toxicanttreatment (Draghici, 2003). The identity of genes with alteredexpression was verified by submitting the sequences to BLAST(NCBI) (Altschul et al., 1990). Gene ontology (GO) termswere taken from the information available on the GRASP web-site http://web.uvic.ca/cbr/grasp/. These terms were assigned bymembers of the GRASP consortium as described on the website(von Schalburg et al., 2005a).
Gene expression data were further analyzed via Hierarchi-cal Cluster Analysis. Gene trees were created to group similargenes and allow for better visualization of the data (Butte,2002). Genes that were found to be significantly different inexpression in at least one treatment were used to create agene tree in GeneSpring. Different treatments were clusteredusing Genespring’s Condition Tree function. Trees were cre-ated using a Pearson’s correlation (Claverie, 1999) as a similaritymeasure, and branches that were more than 95% similar weremerged.
2.7. Quantiative real time PCR
RNA for quantitative real time PCR (qRT PCR) was col-lected, purified, quantified and stored as described in Section2Bmoegvdirutod
from three replicates for each treatment. All samples and stan-dards were compared to a no reverse transcriptase control (toeliminate the possibility that signal resulted from DNA con-tamination), and each plate contained no template controls toserve as blanks. Data were normalized to expression levels ofbeta actin. Significance was determined via a Student’s t-test(p < 0.05).
3. Results
3.1. Exposure results
A summary of the measured and nominal exposure levels areshown in Table 1. Selected internal dose metrics are also shownfor specific contaminants in Table 1. There were no unscheduledmortalities during any of the exposures. At time of sampling,gross necropsy did not indicate any signs of necrosis or overtpathology in the livers of control or exposed fish. For fish receiv-ing an i.p. injection, there were mild signs of inflammation, butthis was localized to the site of injection.
3.2. Microarray results
Results obtained from the microarray analysis appear to accu-rately reflect the transcriptomic changes. In our split controleece(ifiStsPc2t
TP
G e
A TGCAA GCAA CACGB CCCC CGAD CCCE CAACG CAGCH CCAGP AGATP GCATT GTGCV CTGGV CTGC
A fluo
.4. All qRT PCR analyses were performed using Appliediosystems 7300 Real time system and the one step RT PCRaster mix reagents (Applied Biosystems). Standards for each
f the specific genes to be validated via qRT PCR were madeither from the cDNA clones used to print the array (a kindift from Dr. Ben Koop, University of Victoria) or from pre-iously isolated rainbow trout genes (J.A. Small, unpublishedata). Plasmids of genes to be used as standards were transcribedn vitro (Riboprobe system, Promega) and quantified via fluo-ometry (Ribogreen quantitation kit, Molecular Probes). Primerssed for q RT PCR are given in Table 2. Transcription levels inreated and untreated fish were compared to a dilution seriesf the above standards. All measurements (samples and stan-ards) were made in triplicate, and measurements were taken
able 2rimers used for q RT PCR
ene Forward Revers
ndrogen receptor AGCGCCAACTGGTCGAA CACApolipoprotein A2 ACCTGAGCCATGTACTCCATCAT CCCATpolipoprotein CII GCAGGATGCCAGCGTAAGTC AGGCeta actin ACGGCCAGAGGCGTACAG TTCAAytochrome p4501a3 CCCCTTCCGCCATATTGTC CGGCelta-6-dehydrogenase GGGAAGTCCATGTTTCTCACACA CATGCstrogen receptor GCAGGACCAAACTCCGTAGTG TGGCADPH TGACCGTCCGTCTGGAGAA TCGGaptoglobin CACGGCACAGGACTTATCGA CAGTolyubiquitin GGCCATCTTCCAGCTGCTT GCCArocathpsin B CTTTCCCCAGCCCAGGAT ACCAoxin-1 GCATTGCAGCGGTTCTGAT GGCTitellogenin CTTGTGAACCCTGAGATC GCAGitelline envelope GCCGGTTCCTCCTCCAAAT TCCG
ll primers are listed from 5′ to 3′. Fluorescently labeled primers have a 6-FAM
xperiment, no genes were found to be significantly altered inxpression (data not shown). However, in each of the chemi-al exposures there were a subset of genes, between 64 (Trbxposure) and 222 (BDE exposure), that were significantlyANOVA, p < 0.05) altered in expression. Complete lists of thedentities of these genes, their fold change and associated con-dence, and their closest homolog in a BLAST are available asupplementary material. To summarize the data, histograms of
he contaminant induced changes in gene expression are pre-ented in Fig. 1, along with identities for a few chosen genes.lots of changes in gene function (determined using the asso-iated GO terms) are also presented in Figs. 2–7. Typically5–50% of the genes with altered expression had unknown func-ion. The GO category with an identifiable function exhibiting
Fluorescently labeled
GATTCCGAAAACC TGGTCAAGTGGGCCAAAGGCATGGGCTGATGCT CTACCTTCACATGCTCCAGCTGAGAAATGTCCTCAGT TCGCTGCCACGGTGGTGTTGCCATGT ACAACACGGCCTGGATGGCCA
AGCACATTCC TATCGGTGGCCAACGTCATCTGGTCATAACTACCA AGCACGGACCAGAGGAGCCACCAGCGAGGTA TACCCAGAGGCAAAGTCGCTGCAGAAGCCTTAACAA CCTGCCAGCTATGATGCCATCAAGAAGGACCCCAAAGAC ACAGGATCCCTGCAGCATACACTCTCCAGGACAAGGA AGCCTCTGCTGGTCTGGCGGGGTGACTGGACAGAT TTGATGGCATGACCCCCCAGTAGGCTGGAGTT CAGCACTTCCAGCCTGTTCGAGAGCGACGAAAGG TTGAGTACAGTGGTGTGTGGCCCAAAGACCAGTCTGA CTGATATAGCTCCTGGGCCCCTCATAGTTG
r on the 5′ end and a TAMRA fluor on the 3′ end.
376 S.E. Hook et al. / Aquatic Toxicology 77 (2006) 372–385
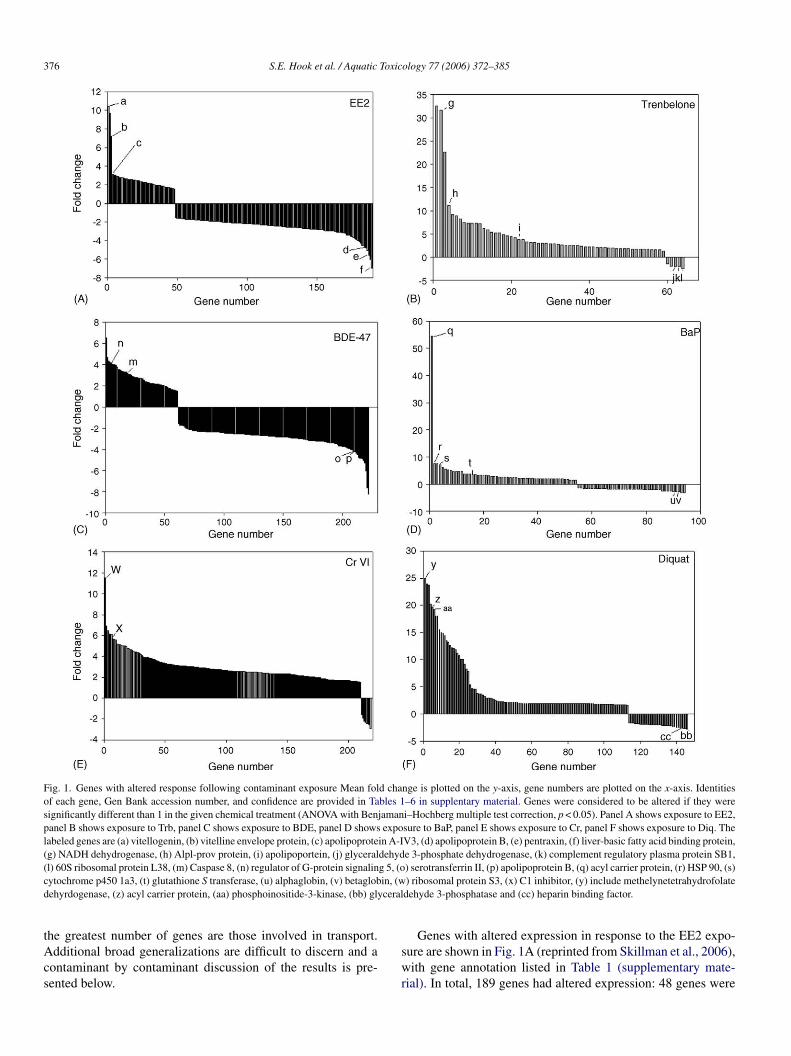
Fig. 1. Genes with altered response following contaminant exposure Mean fold change is plotted on the y-axis, gene numbers are plotted on the x-axis. Identitiesof each gene, Gen Bank accession number, and confidence are provided in Tables 1–6 in supplentary material. Genes were considered to be altered if they weresignificantly different than 1 in the given chemical treatment (ANOVA with Benjamani–Hochberg multiple test correction, p < 0.05). Panel A shows exposure to EE2,panel B shows exposure to Trb, panel C shows exposure to BDE, panel D shows exposure to BaP, panel E shows exposure to Cr, panel F shows exposure to Diq. Thelabeled genes are (a) vitellogenin, (b) vitelline envelope protein, (c) apolipoprotein A-IV3, (d) apolipoprotein B, (e) pentraxin, (f) liver-basic fatty acid binding protein,(g) NADH dehydrogenase, (h) Alpl-prov protein, (i) apolipoportein, (j) glyceraldehyde 3-phosphate dehydrogenase, (k) complement regulatory plasma protein SB1,(l) 60S ribosomal protein L38, (m) Caspase 8, (n) regulator of G-protein signaling 5, (o) serotransferrin II, (p) apolipoprotein B, (q) acyl carrier protein, (r) HSP 90, (s)cytochrome p450 1a3, (t) glutathione S transferase, (u) alphaglobin, (v) betaglobin, (w) ribosomal protein S3, (x) C1 inhibitor, (y) include methelynetetrahydrofolatedehyrdogenase, (z) acyl carrier protein, (aa) phosphoinositide-3-kinase, (bb) glyceraldehyde 3-phosphatase and (cc) heparin binding factor.
the greatest number of genes are those involved in transport.Additional broad generalizations are difficult to discern and acontaminant by contaminant discussion of the results is pre-sented below.
Genes with altered expression in response to the EE2 expo-sure are shown in Fig. 1A (reprinted from Skillman et al., 2006),with gene annotation listed in Table 1 (supplementary mate-rial). In total, 189 genes had altered expression: 48 genes were
S.E. Hook et al. / Aquatic Toxicology 77 (2006) 372–385 377
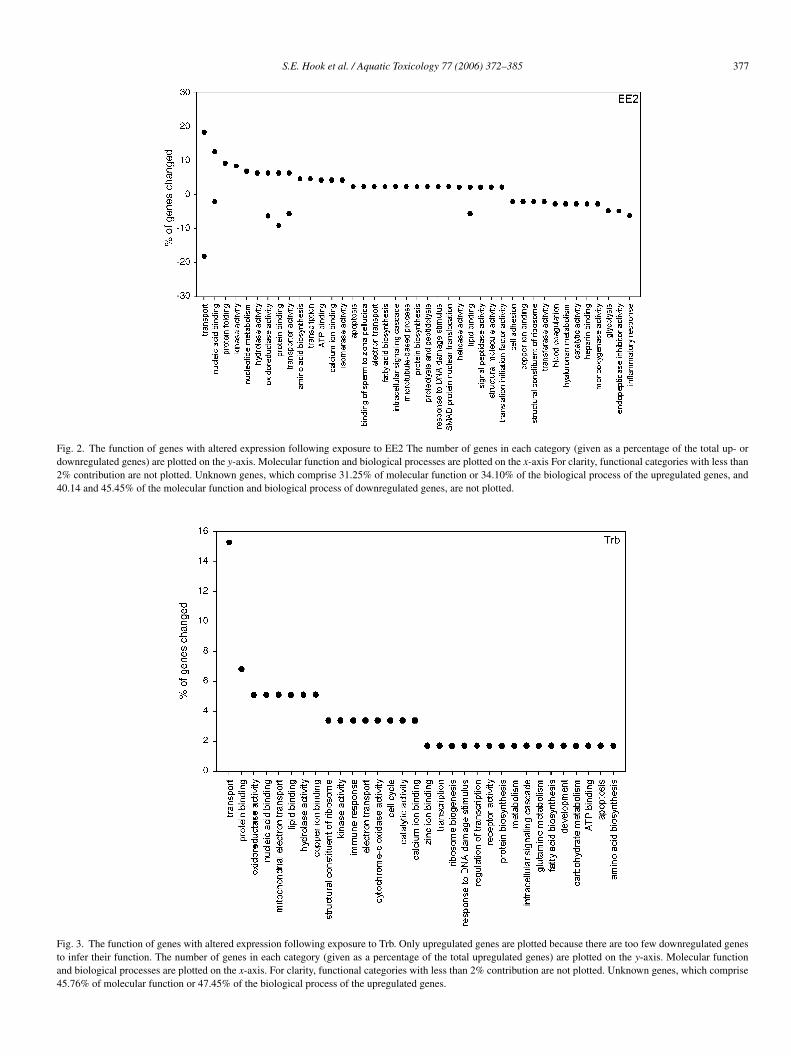
Fig. 2. The function of genes with altered expression following exposure to EE2 The number of genes in each category (given as a percentage of the total up- ordownregulated genes) are plotted on the y-axis. Molecular function and biological processes are plotted on the x-axis For clarity, functional categories with less than2% contribution are not plotted. Unknown genes, which comprise 31.25% of molecular function or 34.10% of the biological process of the upregulated genes, and40.14 and 45.45% of the molecular function and biological process of downregulated genes, are not plotted.
Fig. 3. The function of genes with altered expression following exposure to Trb. Only upregulated genes are plotted because there are too few downregulated genesto infer their function. The number of genes in each category (given as a percentage of the total upregulated genes) are plotted on the y-axis. Molecular functionand biological processes are plotted on the x-axis. For clarity, functional categories with less than 2% contribution are not plotted. Unknown genes, which comprise45.76% of molecular function or 47.45% of the biological process of the upregulated genes.
378 S.E. Hook et al. / Aquatic Toxicology 77 (2006) 372–385
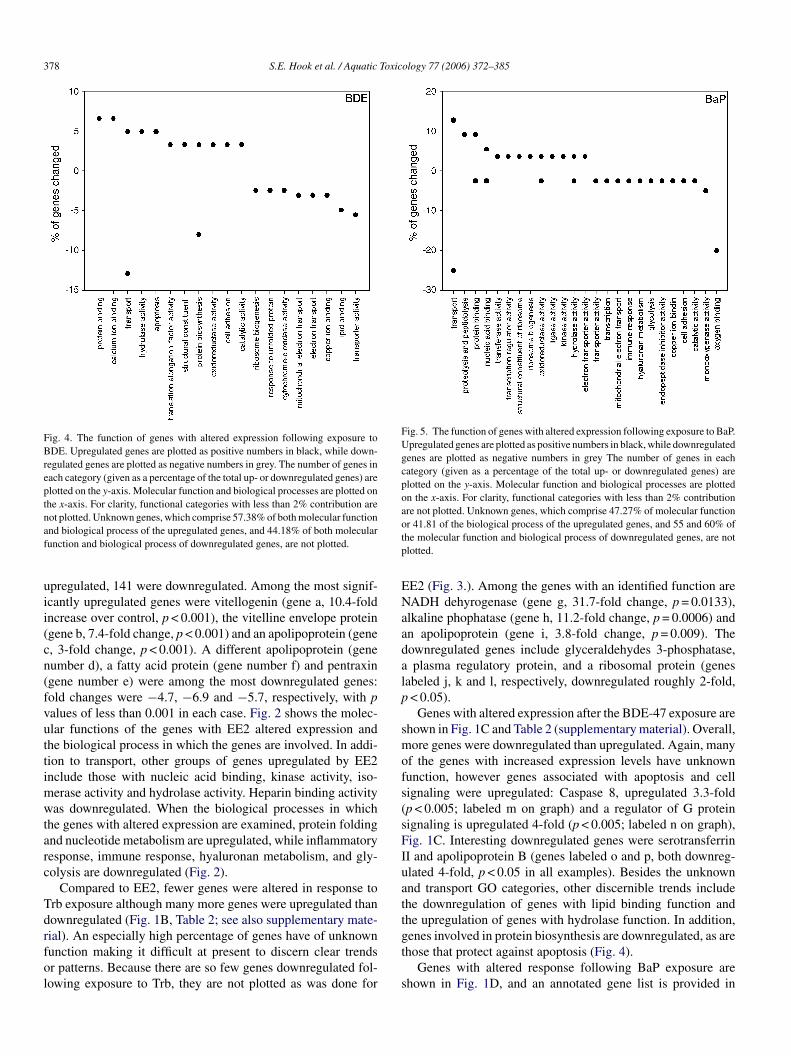
Fig. 4. The function of genes with altered expression following exposure toBDE. Upregulated genes are plotted as positive numbers in black, while down-regulated genes are plotted as negative numbers in grey. The number of genes ineach category (given as a percentage of the total up- or downregulated genes) areplotted on the y-axis. Molecular function and biological processes are plotted onthe x-axis. For clarity, functional categories with less than 2% contribution arenot plotted. Unknown genes, which comprise 57.38% of both molecular functionand biological process of the upregulated genes, and 44.18% of both molecularfunction and biological process of downregulated genes, are not plotted.
upregulated, 141 were downregulated. Among the most signif-icantly upregulated genes were vitellogenin (gene a, 10.4-foldincrease over control, p < 0.001), the vitelline envelope protein(gene b, 7.4-fold change, p < 0.001) and an apolipoprotein (genec, 3-fold change, p < 0.001). A different apolipoprotein (genenumber d), a fatty acid protein (gene number f) and pentraxin(gene number e) were among the most downregulated genes:fold changes were −4.7, −6.9 and −5.7, respectively, with pvalues of less than 0.001 in each case. Fig. 2 shows the molec-ular functions of the genes with EE2 altered expression andthe biological process in which the genes are involved. In addi-tion to transport, other groups of genes upregulated by EE2include those with nucleic acid binding, kinase activity, iso-merase activity and hydrolase activity. Heparin binding activitywas downregulated. When the biological processes in whichthe genes with altered expression are examined, protein foldingand nucleotide metabolism are upregulated, while inflammatoryresponse, immune response, hyaluronan metabolism, and gly-colysis are downregulated (Fig. 2).
Compared to EE2, fewer genes were altered in response toTrb exposure although many more genes were upregulated thandownregulated (Fig. 1B, Table 2; see also supplementary mate-rial). An especially high percentage of genes have of unknownfunction making it difficult at present to discern clear trendsor patterns. Because there are so few genes downregulated fol-lowing exposure to Trb, they are not plotted as was done for
Fig. 5. The function of genes with altered expression following exposure to BaP.Upregulated genes are plotted as positive numbers in black, while downregulatedgenes are plotted as negative numbers in grey The number of genes in eachcategory (given as a percentage of the total up- or downregulated genes) areplotted on the y-axis. Molecular function and biological processes are plottedon the x-axis. For clarity, functional categories with less than 2% contributionare not plotted. Unknown genes, which comprise 47.27% of molecular functionor 41.81 of the biological process of the upregulated genes, and 55 and 60% ofthe molecular function and biological process of downregulated genes, are notplotted.
EE2 (Fig. 3.). Among the genes with an identified function areNADH dehyrogenase (gene g, 31.7-fold change, p = 0.0133),alkaline phophatase (gene h, 11.2-fold change, p = 0.0006) andan apolipoprotein (gene i, 3.8-fold change, p = 0.009). Thedownregulated genes include glyceraldehydes 3-phosphatase,a plasma regulatory protein, and a ribosomal protein (geneslabeled j, k and l, respectively, downregulated roughly 2-fold,p < 0.05).
Genes with altered expression after the BDE-47 exposure areshown in Fig. 1C and Table 2 (supplementary material). Overall,more genes were downregulated than upregulated. Again, manyof the genes with increased expression levels have unknownfunction, however genes associated with apoptosis and cellsignaling were upregulated: Caspase 8, upregulated 3.3-fold(p < 0.005; labeled m on graph) and a regulator of G proteinsignaling is upregulated 4-fold (p < 0.005; labeled n on graph),Fig. 1C. Interesting downregulated genes were serotransferrinII and apolipoprotein B (genes labeled o and p, both downreg-ulated 4-fold, p < 0.05 in all examples). Besides the unknownand transport GO categories, other discernible trends includethe downregulation of genes with lipid binding function andthe upregulation of genes with hydrolase function. In addition,genes involved in protein biosynthesis are downregulated, as arethose that protect against apoptosis (Fig. 4).
Genes with altered response following BaP exposure areshown in Fig. 1D, and an annotated gene list is provided in
S.E. Hook et al. / Aquatic Toxicology 77 (2006) 372–385 379
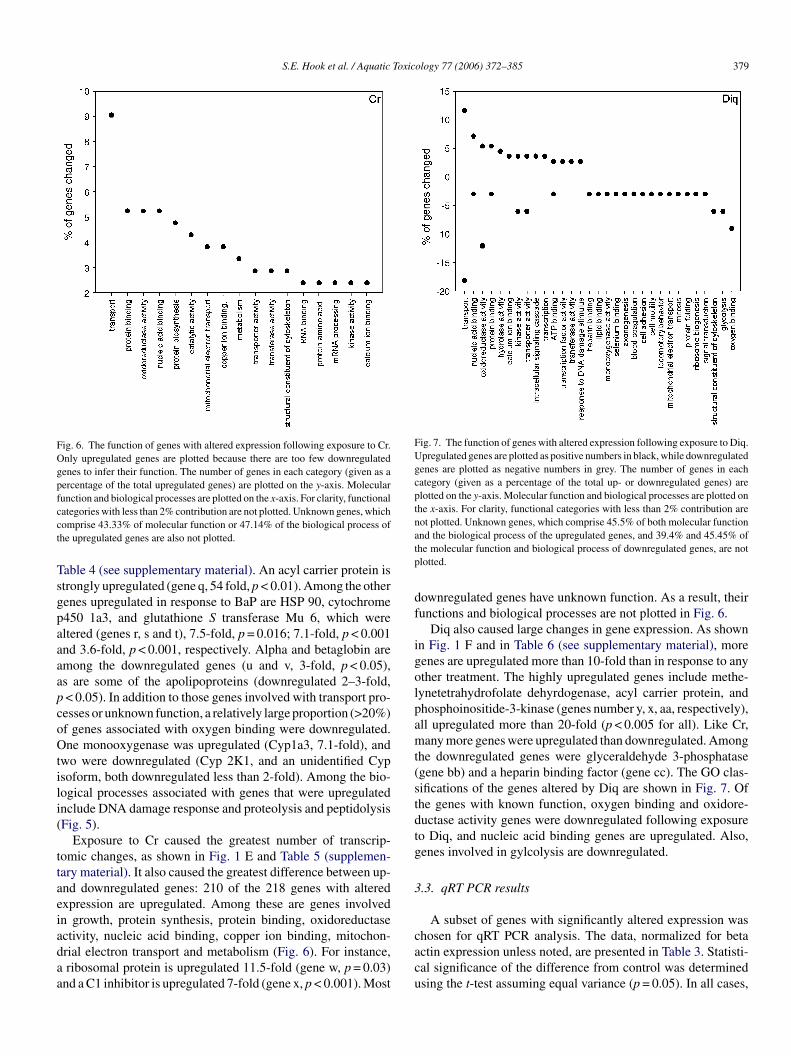
Fig. 6. The function of genes with altered expression following exposure to Cr.Only upregulated genes are plotted because there are too few downregulatedgenes to infer their function. The number of genes in each category (given as apercentage of the total upregulated genes) are plotted on the y-axis. Molecularfunction and biological processes are plotted on the x-axis. For clarity, functionalcategories with less than 2% contribution are not plotted. Unknown genes, whichcomprise 43.33% of molecular function or 47.14% of the biological process ofthe upregulated genes are also not plotted.
Table 4 (see supplementary material). An acyl carrier protein isstrongly upregulated (gene q, 54 fold, p < 0.01). Among the othergenes upregulated in response to BaP are HSP 90, cytochromep450 1a3, and glutathione S transferase Mu 6, which werealtered (genes r, s and t), 7.5-fold, p = 0.016; 7.1-fold, p < 0.001and 3.6-fold, p < 0.001, respectively. Alpha and betaglobin areamong the downregulated genes (u and v, 3-fold, p < 0.05),as are some of the apolipoproteins (downregulated 2–3-fold,p < 0.05). In addition to those genes involved with transport pro-cesses or unknown function, a relatively large proportion (>20%)of genes associated with oxygen binding were downregulated.One monooxygenase was upregulated (Cyp1a3, 7.1-fold), andtwo were downregulated (Cyp 2K1, and an unidentified Cypisoform, both downregulated less than 2-fold). Among the bio-logical processes associated with genes that were upregulatedinclude DNA damage response and proteolysis and peptidolysis(Fig. 5).
Exposure to Cr caused the greatest number of transcrip-tomic changes, as shown in Fig. 1 E and Table 5 (supplemen-tary material). It also caused the greatest difference between up-and downregulated genes: 210 of the 218 genes with alteredexpression are upregulated. Among these are genes involvedin growth, protein synthesis, protein binding, oxidoreductaseactivity, nucleic acid binding, copper ion binding, mitochon-drial electron transport and metabolism (Fig. 6). For instance,a ribosomal protein is upregulated 11.5-fold (gene w, p = 0.03)a
Fig. 7. The function of genes with altered expression following exposure to Diq.Upregulated genes are plotted as positive numbers in black, while downregulatedgenes are plotted as negative numbers in grey. The number of genes in eachcategory (given as a percentage of the total up- or downregulated genes) areplotted on the y-axis. Molecular function and biological processes are plotted onthe x-axis. For clarity, functional categories with less than 2% contribution arenot plotted. Unknown genes, which comprise 45.5% of both molecular functionand the biological process of the upregulated genes, and 39.4% and 45.45% ofthe molecular function and biological process of downregulated genes, are notplotted.
downregulated genes have unknown function. As a result, theirfunctions and biological processes are not plotted in Fig. 6.
Diq also caused large changes in gene expression. As shownin Fig. 1 F and in Table 6 (see supplementary material), moregenes are upregulated more than 10-fold than in response to anyother treatment. The highly upregulated genes include methe-lynetetrahydrofolate dehyrdogenase, acyl carrier protein, andphosphoinositide-3-kinase (genes number y, x, aa, respectively),all upregulated more than 20-fold (p < 0.005 for all). Like Cr,many more genes were upregulated than downregulated. Amongthe downregulated genes were glyceraldehyde 3-phosphatase(gene bb) and a heparin binding factor (gene cc). The GO clas-sifications of the genes altered by Diq are shown in Fig. 7. Ofthe genes with known function, oxygen binding and oxidore-ductase activity genes were downregulated following exposureto Diq, and nucleic acid binding genes are upregulated. Also,genes involved in gylcolysis are downregulated.
3.3. qRT PCR results
A subset of genes with significantly altered expression waschosen for qRT PCR analysis. The data, normalized for betaactin expression unless noted, are presented in Table 3. Statisti-cal significance of the difference from control was determinedusing the t-test assuming equal variance (p = 0.05). In all cases,
nd a C1 inhibitor is upregulated 7-fold (gene x, p < 0.001). Most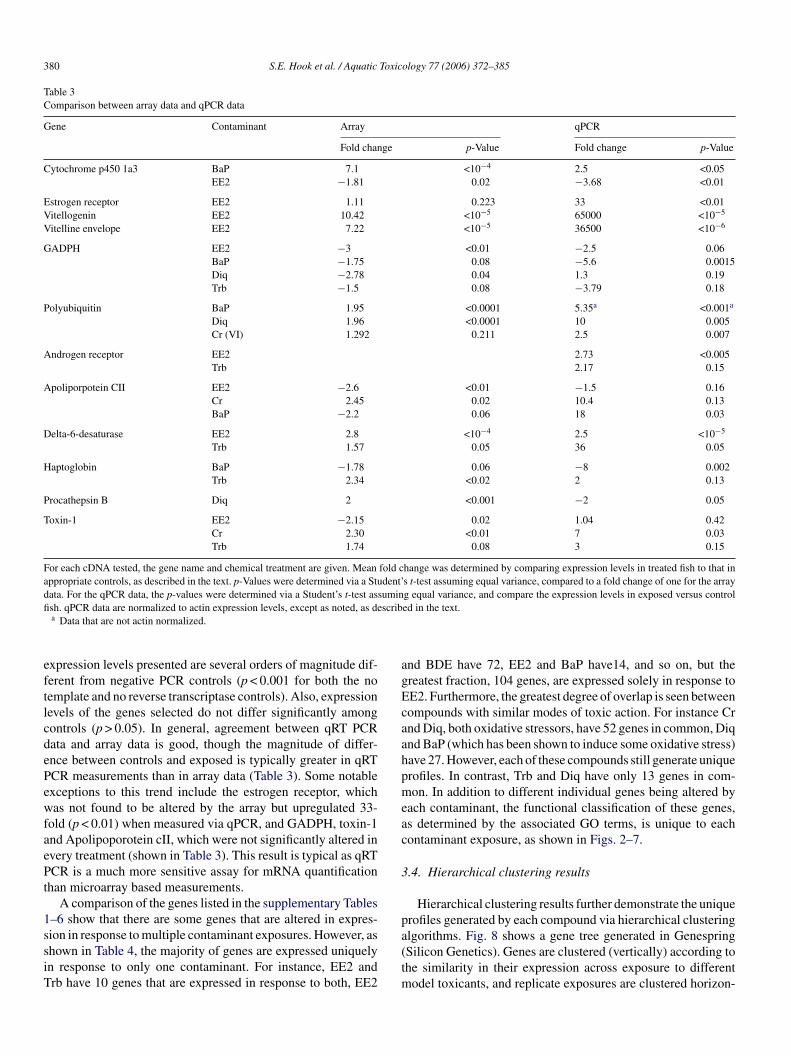
380 S.E. Hook et al. / Aquatic Toxicology 77 (2006) 372–385
Table 3Comparison between array data and qPCR data
Gene Contaminant Array qPCR
Fold change p-Value Fold change p-Value
Cytochrome p450 1a3 BaP 7.1 <10−4 2.5 <0.05EE2 −1.81 0.02 −3.68 <0.01
Estrogen receptor EE2 1.11 0.223 33 <0.01Vitellogenin EE2 10.42 <10−5 65000 <10−5
Vitelline envelope EE2 7.22 <10−5 36500 <10−6
GADPH EE2 −3 <0.01 −2.5 0.06BaP −1.75 0.08 −5.6 0.0015Diq −2.78 0.04 1.3 0.19Trb −1.5 0.08 −3.79 0.18
Polyubiquitin BaP 1.95 <0.0001 5.35a <0.001a
Diq 1.96 <0.0001 10 0.005Cr (VI) 1.292 0.211 2.5 0.007
Androgen receptor EE2 2.73 <0.005Trb 2.17 0.15
Apoliporpotein CII EE2 −2.6 <0.01 −1.5 0.16Cr 2.45 0.02 10.4 0.13BaP −2.2 0.06 18 0.03
Delta-6-desaturase EE2 2.8 <10−4 2.5 <10−5
Trb 1.57 0.05 36 0.05
Haptoglobin BaP −1.78 0.06 −8 0.002Trb 2.34 <0.02 2 0.13
Procathepsin B Diq 2 <0.001 −2 0.05
Toxin-1 EE2 −2.15 0.02 1.04 0.42Cr 2.30 <0.01 7 0.03Trb 1.74 0.08 3 0.15
For each cDNA tested, the gene name and chemical treatment are given. Mean fold change was determined by comparing expression levels in treated fish to that inappropriate controls, as described in the text. p-Values were determined via a Student’s t-test assuming equal variance, compared to a fold change of one for the arraydata. For the qPCR data, the p-values were determined via a Student’s t-test assuming equal variance, and compare the expression levels in exposed versus controlfish. qPCR data are normalized to actin expression levels, except as noted, as described in the text.
a Data that are not actin normalized.
expression levels presented are several orders of magnitude dif-ferent from negative PCR controls (p < 0.001 for both the notemplate and no reverse transcriptase controls). Also, expressionlevels of the genes selected do not differ significantly amongcontrols (p > 0.05). In general, agreement between qRT PCRdata and array data is good, though the magnitude of differ-ence between controls and exposed is typically greater in qRTPCR measurements than in array data (Table 3). Some notableexceptions to this trend include the estrogen receptor, whichwas not found to be altered by the array but upregulated 33-fold (p < 0.01) when measured via qPCR, and GADPH, toxin-1and Apolipoporotein cII, which were not significantly altered inevery treatment (shown in Table 3). This result is typical as qRTPCR is a much more sensitive assay for mRNA quantificationthan microarray based measurements.
A comparison of the genes listed in the supplementary Tables1–6 show that there are some genes that are altered in expres-sion in response to multiple contaminant exposures. However, asshown in Table 4, the majority of genes are expressed uniquelyin response to only one contaminant. For instance, EE2 andTrb have 10 genes that are expressed in response to both, EE2
and BDE have 72, EE2 and BaP have14, and so on, but thegreatest fraction, 104 genes, are expressed solely in response toEE2. Furthermore, the greatest degree of overlap is seen betweencompounds with similar modes of toxic action. For instance Crand Diq, both oxidative stressors, have 52 genes in common, Diqand BaP (which has been shown to induce some oxidative stress)have 27. However, each of these compounds still generate uniqueprofiles. In contrast, Trb and Diq have only 13 genes in com-mon. In addition to different individual genes being altered byeach contaminant, the functional classification of these genes,as determined by the associated GO terms, is unique to eachcontaminant exposure, as shown in Figs. 2–7.
3.4. Hierarchical clustering results
Hierarchical clustering results further demonstrate the uniqueprofiles generated by each compound via hierarchical clusteringalgorithms. Fig. 8 shows a gene tree generated in Genespring(Silicon Genetics). Genes are clustered (vertically) according tothe similarity in their expression across exposure to differentmodel toxicants, and replicate exposures are clustered horizon-
S.E. Hook et al. / Aquatic Toxicology 77 (2006) 372–385 381
Table 4Specificity of the gene expression profiles
BaP (94 total) BDE (223 total) Cr-VI (218 total) Diq (146 total) EE2 (190 total) Trb (65 total)
BaP (94 total) 44 unique 29 1 27 14 14BDE (223 total) 29 148 unique 7 24 72 15Cr-VI (218 total) 1 7 137 unique 52 2 8Diq (146 total) 27 24 52 33 unique 13 14EE2 (190 total) 14 72 2 13 104 unique 10Trb (65 total) 14 15 10 13 10 38 unique
In each grid, the number of genes with significantly altered expression for the corresponding chemical treatment are given.
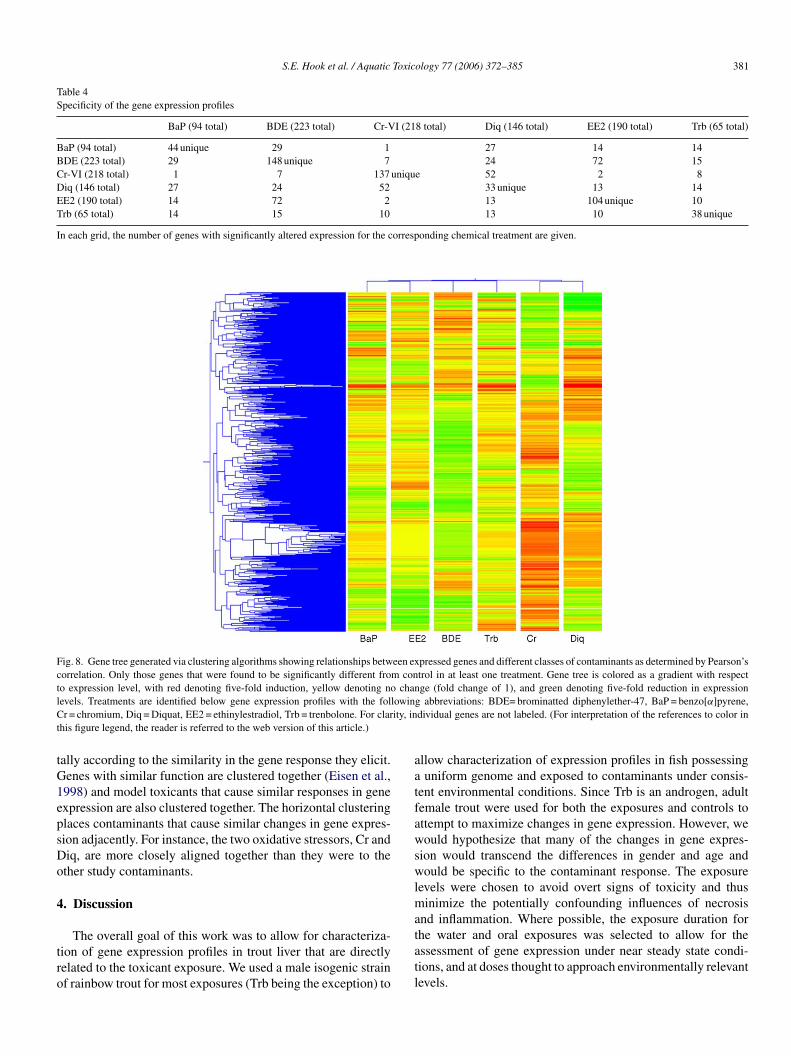
Fig. 8. Gene tree generated via clustering algorithms showing relationships between expressed genes and different classes of contaminants as determined by Pearson’scorrelation. Only those genes that were found to be significantly different from control in at least one treatment. Gene tree is colored as a gradient with respectto expression level, with red denoting five-fold induction, yellow denoting no change (fold change of 1), and green denoting five-fold reduction in expressionlevels. Treatments are identified below gene expression profiles with the following abbreviations: BDE= brominatted diphenylether-47, BaP = benzo[α]pyrene,Cr = chromium, Diq = Diquat, EE2 = ethinylestradiol, Trb = trenbolone. For clarity, individual genes are not labeled. (For interpretation of the references to color inthis figure legend, the reader is referred to the web version of this article.)
tally according to the similarity in the gene response they elicit.Genes with similar function are clustered together (Eisen et al.,1998) and model toxicants that cause similar responses in geneexpression are also clustered together. The horizontal clusteringplaces contaminants that cause similar changes in gene expres-sion adjacently. For instance, the two oxidative stressors, Cr andDiq, are more closely aligned together than they were to theother study contaminants.
4. Discussion
The overall goal of this work was to allow for characteriza-tion of gene expression profiles in trout liver that are directlyrelated to the toxicant exposure. We used a male isogenic strainof rainbow trout for most exposures (Trb being the exception) to
allow characterization of expression profiles in fish possessinga uniform genome and exposed to contaminants under consis-tent environmental conditions. Since Trb is an androgen, adultfemale trout were used for both the exposures and controls toattempt to maximize changes in gene expression. However, wewould hypothesize that many of the changes in gene expres-sion would transcend the differences in gender and age andwould be specific to the contaminant response. The exposurelevels were chosen to avoid overt signs of toxicity and thusminimize the potentially confounding influences of necrosisand inflammation. Where possible, the exposure duration forthe water and oral exposures was selected to allow for theassessment of gene expression under near steady state condi-tions, and at doses thought to approach environmentally relevantlevels.
382 S.E. Hook et al. / Aquatic Toxicology 77 (2006) 372–385
The design of this experiment and the analysis of the resultingdata aim to reduce experimental “noise” and yet maximize theexperimental “signal”. Although cloned fish were used to reduceto inter-individual variability, this component of the variationmay still be greater than array-to-array variability. The genespresented as significantly altered were chosen on the basis ofstatistical significance rather than an arbitrary fold change. Adrawback of selecting genes based on fold change is that thismethod may select for large changes in genes that fluctuate irre-gardless of toxicant exposure above smaller changes in moretightly regulated genes which may be more biologically signif-icant (Draghici, 2003). The z score was not used because it willalways choose a set fraction of genes as being altered in responseregardless of the number that actually changes in response to agiven chemical treatment (Draghici, 2003).
The qRT PCR data and array data are in general agreementas to the direction of gene change, although the data often donot agree as to scale. Other studies with the GRASP arrays havealso found agreement between the array data and PCR validation(Rise et al., 2004b; von Schalburg et al., 2005b). The differencein scale may be due in part to the semi-quantitative nature ofarrays, which were found to be similar to northern blots in pre-vious studies (Bartosiewicz et al., 2000). Also, there is someindication that spotted glass arrays such as the GRASP arraysare more prone to saturation of the response as compared tomembrane-type arrays (Lopez et al., 2004). This would explaintvslootTmTmsa(dhgSiubeitt2r2
gr
of the study contaminants caused changes in the expression ofactin when measured via qRT PCR. In these cases, the qRTPCR data are presented without actin normalization to avoidconfounding the data.
The contaminants used in this study with the best establishedtoxic mode of action are EE2, Trb and Diq. Both EE2 andTrb are synthetic steroids and established to be strong estro-gen and androgen agonists, respectively, in fish (Schultz etal., 2001; Skillman et al., 2006; Ankley et al., 2003; Wilsonet al., 2004). Diq is a bipyrdillium aquatic herbicide that isselectively accumulated in the fish liver where it readily under-goes redox cycling causing formation of superoxide (Schultz etal., 1992, 1995). The latter when formed in excess, can over-whelm cellular defenses and lead to oxidative stress. As for theother test compounds, BDE-71, BaP and Cr-VI, some inferenceabout mode of action can be made (e.g. thyroid active, oxida-tive stress) but it is also likely that multiple or mixed modesof action may be occurring. As might be expected, correlationof the gene expression signatures with the established mecha-nism of toxic action varies among the study contaminants. Forinstance, the most commonly used biomarker genes for exposureto estrogenic compounds, vitellogenin and the vitelline enve-lope protein (Arukwe et al., 2001) were upregulated in responseto EE2. Cathepsin D, which processes vitellogenin (Patino andSullivan, 2002) was also upregulated. Cytochrome p450 1A, acommonly used biomarker for exposure to BaP (Stegeman et al.,1otrg2stsgt2fps(lr
sdatttasu(bh
he large differences in scale for some cDNA sequences such asitellogenin, which can be induced over a 1000-fold by xenoe-trogen treatments. Typically, the qRT PCR results are mostikely to agree with the array results if there is a high degreef confidence (i.e. low p value). Our results with expressionf vitellogenin best support this argument. The estrogen recep-or results differed sharply between the array and qRT PCR.he reason for this difference may be that the two forms wereeasuring two different isoforms of the trout estrogen receptor.he sequence on the array aligns most closely to Oncorhynchusykiss GRE gene encoding estrogen receptor (Z16149 acces-
ion number, 6e–77e value). The sequence used for qRT PCRligns most closely to estrogen receptor (Oncorhynchus mykiss)CAB45140 accession number, 4e–75e value). The two may beifferent isoforms of the receptor, which have been shown toave different levels of expression following exposure to estro-enic compounds in fishes (Pakdel et al., 2000; Thomas, 2000;abo-Atwood et al., 2004). The same gene has two isoforms
n trout and their transcription depends on which promoter issed. One gene is basally transcribed and the other is inducedy estrogen and presumably by estrogenic compounds (Pakdelt al., 2000). Although the alpha and gamma isoforms werenduced in female Largemouth Bass at the onset of reproduc-ion, the expression levels of the beta receptor were not showno change during the reproductive cycle (Sabo-Atwood et al.,004). The degree to which different isoforms of the estrogeneceptor are induced also varies depending on tissue (Thomas,000).
qRT PCR data is typically normalized to a housekeepingene, such as beta-actin, to ensure that RNA samples are cor-ectly diluted and quantified (Rees et al., 2003). However, several
988), was significantly induced in fish exposed to BaP. Previ-us in vitro studies using mammalian cell cultures have shownhat many genes are potentially involved in the oxidative stressesponse, and that different oxidative stressors generate uniqueene expression profiles (Weigel et al., 2002; Thorpe et al.,004). We also found a high number of genes with altered expres-ion following exposure to Diq and Cr-VI (Figs. 6 and 7), and thathe expression signatures generated by these two oxidative stres-ors are different. Other studies have noted that many ribosomalenes and heat shock proteins were altered in response to oxida-ive stressors, which is consistent with our findings (Thorpe et al.,004; Afonso et al., 2003). Recent studies using human cell linesound that the signal transduction genes map kinase–kinase andhosphoinositide-3-kinase were downregulated following expo-ure to H2O2, 4-hydroxynoneal and tert-butylhodroperoxideWeigel et al., 2002). Phosphoinositide-3-kinase was upregu-ated in response to BaP and both genes were upregulated inesponse to Diq in this study.
For Trb and BDE-47, obvious links between genes expres-ion changes and mode of action were less apparent. This isue in part to the large number of genes with unknown functionltered in response to each contaminant, and perhaps to the facthat the hepatic gene expression patterns associated with theseoxic modes of action is not as well understood as the responseo estrogenic compounds and oxidative stressors. Interestingly,lterations in UDPGT or in deiodoinases following BDE expo-ure were not apparent, as has been suggested in other studiessing embryonic rats and other BDE congeners (BDE 71,79, 83)Zhou et al., 2001, 2002). The liver may also have not been theest tissue to select for array analysis. Different responses mayave been observed if a different tissue had been chosen such as
S.E. Hook et al. / Aquatic Toxicology 77 (2006) 372–385 383
the brain or the gonad, as the transcriptomic response has beenshown to vary with tissue sampled (Volz et al., 2005).
When the GO terms are examined to determine the functionof genes with altered patterns of expression, the most strikingfinding is the high proportion of altered genes with uncharacter-ized function. This is in part a consequence of the trout genomebeing less characterized in comparison to other fishes such as thezebrafish (Danio rerio) and Japanese medaka (Oryzias latipes),although a fully sequenced genome is not necessarily a pre-requisite for understanding biological function. For example inhumans, much of the sequenced genome codes for genes withunknown function (Collins et al., 2003). Another interestingresult from the GO analysis is the high number of genes involvedin transport. This may be a consequence of broad generalizationssometimes used in assigning GO terms. In order to meaningfullyreduce the complexity of the data, GO terms were selected atthe broadest category of differentiation. In this case, “transport”likely represents many types of cellular transport processes andas a result, may compile genes with dissimilar cellular func-tion. An additional limitation of organizing genes via their GOfunctions is when the functional group mono-oxygenases areexamined following exposure to BaP, there is one upregulatedand two downregulated. Since the one upregulated gene (Cyp1a) is upregulated roughly seven-fold and the two downregulatedgenes are downregulated less than two-fold, the 1:2 representa-tion may be misleading. However, despite these caveats, the GOtiititeafcbmyDr
boolweetudpes1c
et al., 2003). These genes were altered following exposure to BaP(cyp 1A), EE2 (elongation factors and complement componentC3) in this study. Suppressive subtractive hybridization was usedto identify genes expressed by male largemouth bass exposedto dihydrotestosterone and 11-ketotestosterone in another study(Blum et al., 2004). These genes were then used to constructa cDNA macroarray. Like our results with Trb, the authorsfound relatively few genes with altered expression. Few of thesame genes were altered in both studies, possibly because wewere studying sexually mature females in the Trb exposures asopposed to immature males. Differential display was used toidentify genes expressed in fish exposed to trivalent chromium(Maples and Bain, 2004). Eukaryotic initiation factors werefound to be upregulated in both that study and the present studyusing Cr-VI (Fig. 6). In a similar study with Cr-VI, serine pro-teinase inhibitors, a carboxypeptidase, and elongation factorswere among the genes with altered expression following Cr-VI(Chapman et al., 2004). These results are consistent with thefindings in the present study (Fig. 6).
Our results demonstrate that the overall patterns of geneexpression are unique to each model toxicant, as shown in Fig. 8.Furthermore, as shown in Figs. 2–7, the functions of genes withaltered expression also has a unique pattern for each of the con-taminants tested. While each toxicant signal is unique, the degreeof overlap correlates with function. For instance, the Diq geneexpression profile are more closely aligned to those expressed inrptno2eptdeitfigsettfepdpidcSrge
erms may be helpful in interpreting the array data. For instance,t could be speculated that the increase in protein folding genesn the liver has utility in packaging vitellogenin for transporto the ovary and ultimately the oocyte. The downregulation ofmmune function genes following EE2 exposure suggest thathere may be increased susceptibility of organisms chronicallyxposed to EE2 to pathogens. Furthermore, the increase inpoptosis and the decrease in antiapoptosis genes (only notedollowing exposure to BDE) suggest that increased programmedell death may occur following exposure to BDE. It could alsoe hypothesized that the downregulation of oxygen bindingolecules, oxidoreductase activity, and the increase in proteol-
sis and petidolysis, protein biosynthesis following exposure toiq, Cr-VI and BaP may be characteristic of an oxidative stress
esponse.In general, our results are comparable to the limited num-
er of studies measuring gene expression in laboratory exposedr field collected fish. Previous studies focusing on the effectsf estrogens have observed that many genes including vitel-ogenin and the vitelline envelope proteins were upregulatedhile others, notably transferrin was downregulated (Larkin
t al., 2002, 2003a,b). Our studies reveal similar changes inxpression of these genes and others following exposure to EE2,hough vitellogenin and the vitelline envelope protein were notpregulated to the same degree in our work. European floun-er (Platichthys flesus) collected from rivers known to heavilyolluted with PAHs among other industrial contaminants werexamined for toxic stress response. Few genes were found to beignificantly different due to inter-individual variation, but CypA was upregulated, while elongation factors and complementomponent C3 were among the downregulated genes (Williams
esponse other oxidative stressors, and the endocrine active com-ounds have more similar expression patterns to each other thano the other contaminant classes. Hierarchical clustering orga-izes gene expression data such that genes with similar patternsf expression are grouped together (Eisen et al., 1998; Butte,002). Our clustering results (given in Fig. 8) show that uniquexpression profiles are generated for each compound, that theserofiles are non-random, and that compounds with similar func-ion are more tightly grouped together than compounds withisparate function. Although EE2 and Trb are both consideredndocrine disruptors, their modes of action are antagonistic (Trbs an androgen and EE2 is an estrogen), and as a consequence,heir gene expression profiles do not resemble each other. Thisnding that expression of genes with similar function can berouped together into clusters likely arises because genes withimilar function are often co-expressed (Eisen et al., 1998; Heyert al., 1999; Wu, 2001). Gene expression data from animalsreated with the same compound group together when subjectedo principle component analysis, and transcriptomic responsesrom animals treated with similar compounds also cluster (Amint al., 2002). Other studies in trout have also found that alteredatterns of gene expression generated from array results can beisplayed in hierarchical clusters (Koskinen et al., 2004). Thisrevious study also examined alterations in gene expressionn rainbow trout exposed to different model toxicants at threeifferent doses. They also found that their expression profileslustered according to the contaminant at low and medium doses.urprisingly, the transcriptomic patterns did not form exposureelated clusters as well at high doses, which the authors sug-ested may arise from non-specific stress responses (Koskinent al., 2004).
384 S.E. Hook et al. / Aquatic Toxicology 77 (2006) 372–385
In conclusion, we exposed rainbow trout to six differentmodel toxicants and compared the resultant gene expressionpatterns using cDNA microarrays. Our work demonstrates thateach compound generates a unique gene expression signature,and that these patterns can be verified via qRT PCR. While thisinitial study demonstrates the specificity of gene expression pro-files to individual chemical contaminants, it does not addresshow these patterns vary with contaminant dose or duration ofexposure. We also frequently encountered a current limitationof cDNA microarray based gene expression analysis in thatmany of the genes with altered expression have no known ordocumented function. This situation is likely to improve in thefuture, due to the rapid expansion of genomic studies in fishand trout specifically. Overall, this study bolsters the promise ofthe application of toxicogenomics towards ecotoxicology. Thegene expression signatures generated by a compound are unique,even when compared to compounds with similar modes of toxicaction. Consequently, arrays may be a means to identify highlyspecific biomarkers for each toxicant, or at least each class oftoxicant. Since many cellular functions are conserved acrosstaxa (Ballatori and Villalobos, 2002), findings of studies usingmicroarray technology may have implications for species otherthan the organism tested. Furthermore, because some genes withaltered expression could be correlated to mode of toxic action,microarray data could be used to determine the potential impactof novel compounds and environmental toxicants (Miracle andA
A
GwAmiU1
A
i
R
A
A
A
A
Ankley, G.T., Jensen, K.M., Makynen, E.A., Kahl, M.D., Korte, J.J., Hor-nung, M.W., Henry, T.R., Denny, J.S., Leino, R.L., Wilson, V.S., Cardon,M.C., Hartig, P.C., Gray, L.E., 2003. Effects of the androgenic growthpromoter 17-beta-trenbolone on fecundity and reproductive endocrinol-ogy of the fathead minnow. Environ. Toxicol. Chem. 22 (6), 1350–1360.
Arukwe, A., Kullman, S.W., Hinton, D.E., 2001. Differential biomarker andprotein expressions in nonylphenol and estradiol-17� treated rainbow trout(Oncorhynchus mykiss). Comp. Biochem. Physiol. Part C 129, 1–10.
Ballatori, N., Villalobos, A.R., 2002. Defining the molecular and cellularbasis of toxicity using comparative models. Toxicol. Appl. Pharmacol.183, 207–220.
Bartosiewicz, M., Penn, S., Buckpitt, A., 2001. Applications of gene arrays inenvironmental toxicology, fingerprints of gene regulation associated withcadmium chloride, benzo(a)pyrene and trichloroethylene. Environ. HealthPerspect. 109, 71–74.
Bartosiewicz, M., Trounstine, M., Barker, D., Johnston, R., Buckpitt, A.,2000. Development of a toxicological gene array and quantitative assess-ment of this technology. Arch. Biochem. Biophys. 376, 66–73.
Blum, J.L., Knoebl, I., Larkin, P., Kroll, K.J., Denslow, N.D., 2004. Useof suppressive subtractive hybdrization and cDNA arrays to discoverpatterns of altered gene expression in the liver of dihydrotestosteroneand 11-ketotestosterone exposed adult male largemouth bass (Micropterussalmonides). Mar. Environ. Res. 58, 565–569.
Brazma, A., Hingamp, P., Quackenbush, J., Sherlock, G., Spellman, P.,Stoeckert, C., Aach, J., Ansorge, W., Ball, C.A., Causton, H.C., Gaaster-land, T., Glenisson, P., Holstege, F.C.P., Kim, I.F., Markowitz, V., Matese,J.C., Parkinson, H., Robinson, A., Sarkans, U., Schulze-Kremer, S., Stew-art, J., Taylor, R., Vilo, J., Vingron, M., 2001. Minimum informationabout a microarray experiment (MIAME)—toward standards for microar-ray data. Nat. Genet. 29, 365–371.
B
C
C
C
D
D
E
H
H
H
H
K
nkley, 2005).
cknowledgements
The arrays used in this study were purchased from theRASP consortium http://web.uvic.ca/cbr/grasp/. The authorsould like to thank G. Cooper for technical assistance and. Miracle for a critical review of an earlier version of thisanuscript. The comments of two anonymous reviewers also
mproved this manuscript. This research was supported by the.S. Department of Energy under contract DE-AC06-76RLO830 and NIEHS grant 5R01ES012446-03.
ppendix A. Supplementary data
Supplementary data associated with this article can be found,n the online version, at doi:10.1016/j.aquatox.2006.01.007.
eferences
ardema, M.J., MacGregor, J.T., 2002. Toxicology and genetic toxicologyin the new era of “toxicognomics”—impact of “-omics” technologies.Mutat. Res. 499, 13–25.
fonso, L.O.B., Basu, N., Devlin, R.H., Iwama, G.K., 2003. Sex-related dif-ferences in the organismal and cellular stress response in juvenile salmonexposed to treated bleached kraft mill effluent. Fish Physiol. Biochem.29, 173–179.
ltschul, S.F., Gish, W., Miller, W., Myers, E.W., Lipman, D.J., 1990. Basiclocal alignment search tool. J. Mol. Biol. 215, 403–410.
min, R.P., Hamadeh, H.K., Bushel, P.R., Bennett, L., Afshari, C.A., Paules,R.S., 2002. Genomic interrogation of mechanism(s) underlyng cellularresponses to toxicants. Toxicology 181/182, 555–563.
utte, A., 2002. The use and analysis of microarray data. Nat. Drug Disc1,951–960.
hapman, L.M., Roling, J.A., Bingham, L.K., Herald, M.R., Baldwin, W.S.,2004. Construction of a subtractive library from hexavalent chromiumtreated winter flounder (Pseduopleuronectes americanus) reveals alter-ations in non-selenium glutathione peroxidases. Aquat. Toxicol. 67,181–194.
laverie, J.-M., 1999. Computational methods for the identification of differ-ential and co-ordinated gene expression. Mol. Genet. 8, 1821–1832.
ollins, F.S., Green, E.D., Guttmacher, A.E., Guyer, M.S., 2003. A visionfor the future of genomics research. Nature 422, 835–847.
enslow, N.D., Kochera, J., Sepulveda, M.S., Gross, T., Holm, S.E., 2004.Gene expression fingerprints of largemouth bass (Micropterus salmoides)exposed to pulp and paper mill effluents. Mutat. Res. 552, 19–34.
raghici, S., 2003. Data analysis tools for DNA microarrays. Chapman &Hall/CRC Press, p. 443g.
isen, M.B., Spellman, P.T., Brown, P.O., Botstein, D., 1998. Cluster analysisand display of genome-wide expression patterns. Proc. Natl. Acad. Sci.U.S.A. 95, 14863–14868.
amadeh, H.K., Bushel, P., Paules, R.S., Afshari, C.A., 2001. Discovery intoxicology, mediation by gene expression array technology. J. Biochem.Mol. Toxicol. 15, 231–242.
amadeh, H.K., Bushel, P.R., Jaydev, S., DiSorbo, O., Bennett, L., li, L.,Tennant, R., Stoll, R., Barrett, J.C., Paules, R.S., Blanchard, K., Afshari,C.A., 2002a. Prediction of compound signature using high density geneexpression profilling. Toxicol. Sci. 67, 219–231.
amadeh, H.K., Bushel, P.R., Jaydev, S., Martin, K., DiSorbo, O., Siber, S.,Bennett, L., Tennant, R., Stoll, R., Barrett, J.C., Blanchard, K., Paules,R.S., Afshari, C.A., 2002b. Gene expression analysis reveals chemicalspecific profiles. Toxicol. Sci. 67, 219–231.
eyer, L.J., Krugylak, S., Yooseph, S., 1999. Exploring expression data,identification and analysis of coexpressed genes. Genome Res. 9, 1106–1115.
oskinen, H., Pehkonen, P., Vehniainen, E., Krasnov, A., Rexroad, C.,Afanasyev, S., Molsa, H., Oikari, A., 2004. Response of rainbow trouttranscriptome to model chemical contaminants. Biochem. Biophys. Com-mun. 320, 745–753.
S.E. Hook et al. / Aquatic Toxicology 77 (2006) 372–385 385
Larkin, P., Folmar, L.C., Hemmer, M.J., Poston, A.J., Lee, H.S., Denslow,N.D., 2002. Array technology as a tool to monitor exposure to fish xenoe-strogens. Mar. Environ. Res. 54, 395–399.
Larkin, P., Sabo-Attwood, T., Kelso, J., Denslow, N.D., 2003a. Analysis ofgene expression profiles in largemouth bass exposed to 17-B-estradiol andto anthroprogenic contaminants that behave as estrogens. Ecotoxicology12, 463–468.
Larkin, P., Folmar, L.C., Hemmer, M.C., Poston, A.J., Denslow, N.D., 2003b.Expression profiling of estrogenic compounds using a sheepshead minnowcDNA Macroarray. Environ. Health Perspect. 111, 839–846.
Lopez, F., Rougemont, J., Loriod, B., Bourgeois, A., Loi, L., Bertucci, F.,Hingamp, P., Houlgatte, R., Granjeaud, S., 2004. Feature extraction andsignal processing for nylon DNA microarrays. BMC Genomics 5, 38.
Maples, N.L., Bain, L.J., 2004. Trivalent chromium alters gene expression inthe mummmichog (Fundulus herteroclitus). Environ. Toxicol. Chem. 23,626–631.
Miracle, A.L., Ankley, G.T., 2005. Ecotoxicogenomics, linkages betweenexposure and effects in assessing risks of aquatic contaminants to fish.Reprod. Toxicol. 19, 321–326.
Muirhead, E., Skillman, A.D., Hook, S.E., Schultz, I.R., 2006. Oral exposureof PBDE-47 in fish: toxicokinetics and reproductive effects in JapaneseMedaka (Oryzias latipes) and Fathead Minnows (Pimephales promelas).Environ Sci Technol.
Neumann, N.F., Galvez, G., 2002. DNA microarrays and toxicogenomics,applications for ecotoxicology? Biotechnol. Adv. 20, 391–419.
Pakdel, F., Metivier, R., Flouriot, G., Valotaire, Y., 2000. Two differentestrogen receptor (ER) isoforms with different estrogen dependencies aregenerated from the trout ER gene. Endocinology 141, 571–580.
Patino, R., Sullivan, C.V., 2002. Ovarian Follicale growth, maturation andovulation in teleost fish. Fish Physiol. Biochem. 26, 57–70.
Rees, C.B., McCormick, S.D., Vanden Heuvel, J.P., Li, W., 2003. Quantitative
R
R
S
S
S
S
S
intravascular administration of 17alpha-ethynylestradiol. Aquat. Toxicol.51, 305–318.
Skillman, A.S., Nagler, J.J., Hook, S. and Schultz, I.R., 2006. Dynamicsof ethynylestradiol exposure in rainbow trout (Oncorhynchus mykiss):absorption, tissue distribution and gene expression patterns. Environ Tox-icol. Chem., in press.
Snape, J.R., Maund, S.J., Pickford, D.B., Hutchinson, T.H., 2004. Ecotox-icogenomics, the challenge of integrating genomics into aquatic andterrestrial ecotoxicology. Aquat. Toxicol. 67, 143–154.
Stegeman, J.J., Woodin, B.R., Goksoyr, A., 1988. Apparent cytochrome P-450 induction as an indication of exposure to environmental chemical lsin the flounder Platichthys flesus. Mar. Ecol. Prog. Ser. 46, 55–60.
Thomas, P., 2000. Chemical intereference with genomic and nongenomicactions of steroids in fishes, role of receptor binding. Mar. Environ. Res.50, 127–134.
Thorpe, G.W., Fong, C.S., Alic, N., Higgins, V.J., Dawes, I.W., 2004. Cellshave distinct mechanisms to maintain protection against different reactiveoxygen species. Oxidative stress response genes. Proc. Natl. Acad. Sci.101, 6564–6569.
vanDelft, J.H.M., van Agen, E., van Breda, S.G.J., Herwijnen, M.H., Stall,Y.C.M., Kleinjans, J.C.S., 2004. Discrimination of genotoxic from non-genotoxic carcinogens by gene expression profilining. Carcinogenesis 25,1265–1276.
Volz, D.C., Bencic, D.C., Hinton, D.E., McHugh Law, J., Kullman, S.W.,2005. 2,3,7,8-Tetrachlorodibenzo-p-dioxin (TCDD) induces organ-specificdifferential gene expression in Male Japanese Medaka (Oryzias latipes).Toxicol. Sci. 85, 572–584.
von Schalburg, K.R., Rise, M.L., Cooper, G.A., Brown, G.D., Gibbs, R.A.,Davidson, W.S., Koop, B.F., 2005a. Fish and chips, various methodolo-gies demonstrate the utility of a 16,006-gene salmonid microarray. BMCGenomics.
v
W
W
W
W
W
Y
Z
Z
PCR analysis of CYP1A induction in Atlantic salmon (Salmo salar).Aquat. Toxicol. 62, 67–78.
ise, M.L., von Schalburg, K.R., Brown, G.D., Mawer, M.A., Devlin, R.H.,Kuipers, N., Busby, M., Beetz-Sargent, M., Alberto, R., Gibbs, A.R.,Hunt, P., Shukin, R., Zeznik, J.A., Nelson, C., Jones, S.R.M., Smailus,D.E., Jones, S.J.M., Schein, J.E., Marra, M.A., Butterfield, Y.S.N., Stott,J.M., Ng, S.H.S., Davidson, W.S., Koop, B.F., 2004a. Development andapplication of a Salmonind EST database and cDNA microarray, datamining and interspecific hybridization characteristics. Genome Res. 14,478–490.
ise, M.L., Jones, S.R.M., Brown, G.D., von Schalburg, K.R., Davidson,W.S., Koop, B.F., 2004b. Microarray analyses identify molecular biomark-ers of Atlantic salmon macrophage and hematopoietic kidney response toPiscirickettsia salmonis infection. Physiol. Genomics 20, 31–35.
abo-Atwood, T., Kroll, K.J., Denslow, N.D., 2004. Differential expressionof largemouth bass (Micropterus salmoides) estrogen receptor isotypes byalpha, beta and gamma by estradiol. Mol. Cell Endocrin. 218, 107–118.
chena, M., Shalon, D., Heller, R., Chai, A., Brown, P.O., Davis, R.W., 1996.Parallel human genome analysis, microarray-based expression monitoringof 1000 genes. Proc. Natl. Acad. Sci. 93, 10614–10619.
chultz, I.R., Ogata, T., Hayton, W.L., Berliner, J.L., 1992. Diquat inducedsuperoxide production in rainbow trout microsomes. Toxicologist, 12.
chultz, I.R., Hayton, W.L., Kemmenoe, B.H., 1995. Disposition and toxi-cokinetics of diquat in channel catfish. Aquat. Toxicol. 33, 297–310.
chultz, I.R., Orner, G., Merdenik, J.L., Skillman, A., 2001. Dose-responserelationships and pharmacokinetics of vitellogenin in rainbow trout after
on Schalburg, K.R., Rise, M.L., Brown, G.D., Davidson, W.S., Koop, B.F.,2005b. A comprehensive survey of the genes involved in maturation anddevelopment of the rainbow trout ovary. Biol. Reprod. 72, 687–699.
aters, M.D., Fostel, J.M., 2004. Toxicgenomics and systems toxicology,aims and prospects. Nat. Genet. 5, 936–948.
eigel, A.L., Handa, J.T., Hjemeland, L.M., 2002. Microarray analysis ofH2O2-HNE- or tBH-treated ARPE—19 cells. Free Radic. Biol. Med. 33,1419–1422.
illiams, T.D., Gensberg, K., Minchin, S.D., Chipman, J.K., 2003. A DNAexpression array to detect toxic stress response in European flounder(Platichtys flesus). Aquat. Toxicol. 65, 141–157.
ilson, V.S., Cardon, M.C., Thornton, J., et al., 2004. Cloning and in vitroexpression and characterization of the androgen receptor and isolation ofestrogen receptor alpha from the fathead minnow (Pimephales promelas).Environ. Sci. Technol. 38 (23), 6314–6321.
u, T.D., 2001. Analysing gene expression data from DNA microarrays toidentify candidate genes. J. Pathol. 195, 53–65.
oung, W.P., Wheeler, P.A., Fields, R.D., Thorgaard, G.H., 1996. DNA fin-gerprinting confirms isogenicity of androgenetically-derived rainbow troutlines. J. Hered. 87, 77–81.
hou, T., Ross, D.G., DeVito, M.J., Crofton, K.M., 2001. Effects of short-term in vivo polybrominated diphenyl ethers on Thyriod hormones andhepatic enzyme activities in weanling rats. Toxicol. Sci. 61, 76–82.
hou, T., Ross, D.G., DeVito, M.J., Crofton, K.M., 2002. Developmentalexposure to brominated diphenyl ethers results in thyroid hormone dis-ruption. Toxicol. Sci. 66, 105–116.
Related Documents