Genetics and Molecular Biology, 44, 2, e20190373 (2021) Copyright © Sociedade Brasileira de Genética. DOI: https://doi.org/10.1590/1678-4685-GMB-2019-0373 Research Article Human and Medical Genetics Send correspondence to Silvana de Almeida. Universidade Federal de Ciências da Saúde de Porto Alegre, Programa de Pós-graduação em Biociências, Rua Sarmento Leite, 245, Prédio 1, sala 309, 90050-170 Porto Alegre, RS, Brazil. E-mail: [email protected]. Gene expression evaluation of antioxidant enzymes in patients with hepatocellular carcinoma: RT-qPCR and bioinformatic analyses Andressa de Freitas Alves 1 , Ana Carolina de Moura 1 , Huander Felipe Andreolla 2 , Ana Beatriz Gorini da Veiga 1 , Marilu Fiegenbaum 1 , Márcia Giovenardi 1 and Silvana Almeida 1 1 Universidade Federal de Ciências da Saúde de Porto Alegre, Programa de Pós-graduação em Biociências, Porto Alegre, RS, Brazil. 2 Universidade Franciscana, Santa Maria, RS, Brazil. Abstract Any condition leading to chronic liver disease is a potential oncogenic agent for hepatocellular carcinoma (HCC). Alterations in the expression of antioxidant enzymes could alter the redox balance. Our aim was to evaluate the expression of the genes GPX1, GPX4, SEP15, SELENOP, SOD1, SOD2, GSR, CAT, and NFE2L2 in patients with HCC. Differential gene expression analysis was performed using RNA-Seq data from the TCGA and GTEx databases, and RT-qPCR data from HCC patient samples. Bioinformatic analysis revealed significant differential expression in most genes. GPX4 expression was significantly increased (p=0.02), while SOD2 expression was significantly decreased (p=0.04) in experimental data. In TCGA samples, alpha-fetoprotein levels (mg/dL) were negatively correlated with the expression of SEP15 (p<0.001), SELENOP (p<0.001), SOD1 (p<0.001), SOD2 (p<0.001), CAT (p<0.001), and NFE2L2 (p=0.004). Alpha-fetoprotein levels were positively correlated with the expression of GPX4 (p=0.02) and SELENOP (p=0.01) in the experimental data. Low expression of GPX1 (p=0.006), GPX4 (p=0.01), SELENOP (p=0.006), SOD1 (p=0.007), CAT (p<0.001), and NFE2L2 (p<0.001), and higher levels of GSR, were associated with low overall survival at 12 months. These results suggest a significant role for these antioxidant enzymes in HCC pathogenesis and severity. Keywords: Hepatocellular carcinoma, selenoproteins, antioxidant enzymes, oxidative stress, gene expression. Received: November 26, 2019; Accepted: February 10, 2021. Introduction Hepatocellular carcinoma (HCC) has a high mortality rate, and ranks as the third leading cause of cancer deaths worldwide (Ozakyol, 2017; Forner et al., 2018). Major risk factors for HCC include infection with hepatitis B and C viruses, alcohol intake, and fatty liver disease (Ozakyol, 2017; Yang et al., 2019). Prognosis and treatment options vary according to tumor stage and liver function. The percentage of patients eligible for curative treatment varies between high and low-resource countries (Ozakyol, 2017; Yang et al., 2019), but generally fluctuates between 20-30% of patients. The median survival of patients with untreated disease is nine months (Klungboonkrong et al., 2017; Forner et al., 2018). New markers or therapeutic targets are required for early diagnosis, and the development of novel treatment strategies for HCC (Klungboonkrong et al., 2017). Oxidative stress is associated with cancer, and has a dual role in disease development, due to the effects of reactive oxygen species (ROS) on cellular processes. Increased ROS levels are associated with oncogenic effects because of their ability to cause damage to biological macromolecules, such as DNA, lipids, and proteins (Reuter et al., 2010; Moloney and Cotter, 2018). High concentrations of ROS have been associated with activation of p53, oxidative lipid peroxidation, consumption of antioxidants, and can ultimately lead to cell death (Wang et al., 2016b; Sajadimajd and Khazaei, 2017). Oxidative stress can play different roles: promoting carcinogenesis or cell apoptosis, or by providing sufficient components to promote cancer cell survival. The physiological functions of ROS include regulation of the expression and activity of several signaling regulators that are involved in key processes, such as proliferation and apoptosis (Gill et al., 2016). Cancer cells, in turn, seem to maintain advantageously elevated levels of ROS to guarantee their survival, by adapting the content and regulation of their antioxidant machinery (Sajadimajd and Khazaei, 2017; Moloney and Cotter, 2018). Cellular antioxidant defense systems include a series of antioxidant enzymes that maintain homeostasis by restricting ROS production or neutralizing ROS (Gill et al., 2016). This group of enzymes includes major components such as superoxide dismutase (SOD), catalase (CAT), and glutathione reductase (GSR), and selenoproteins, including glutathione peroxidase 1 (GPX1), glutathione peroxidase 4 (GPX4), 15- kDa selenoprotein (SEP15), and selenoprotein P (SelP). All of these enzymes act in pathways of chain-breaking ROS molecules, or have other important functions, including detoxification of hydrogen peroxide (H 2 O 2 ), inhibition of lipid peroxidation, quality control of protein folding, and transport of selenium to peripheral tissues (Gupta et al., 2014; Labunskyy et al., 2014; Zoidis et al., 2018). Altered expression of these enzymes could be a useful resource for cancer cells. Hyperactivation of nuclear factor erythroid 2-related

Welcome message from author
This document is posted to help you gain knowledge. Please leave a comment to let me know what you think about it! Share it to your friends and learn new things together.
Transcript

Genetics and Molecular Biology, 44, 2, e20190373 (2021) Copyright © Sociedade Brasileira de Genética.DOI: https://doi.org/10.1590/1678-4685-GMB-2019-0373
Research ArticleHuman and Medical Genetics
Send correspondence to Silvana de Almeida. Universidade Federal de Ciências da Saúde de Porto Alegre, Programa de Pós-graduação em Biociências, Rua Sarmento Leite, 245, Prédio 1, sala 309, 90050-170 Porto Alegre, RS, Brazil. E-mail: [email protected].
Gene expression evaluation of antioxidant enzymes in patients with hepatocellular carcinoma: RT-qPCR and bioinformatic analyses
Andressa de Freitas Alves1, Ana Carolina de Moura1, Huander Felipe Andreolla2, Ana Beatriz Gorini da Veiga1 , Marilu Fiegenbaum1 , Márcia Giovenardi1 and Silvana Almeida1
1Universidade Federal de Ciências da Saúde de Porto Alegre, Programa de Pós-graduação em Biociências, Porto Alegre, RS, Brazil.2Universidade Franciscana, Santa Maria, RS, Brazil.
Abstract
Any condition leading to chronic liver disease is a potential oncogenic agent for hepatocellular carcinoma (HCC). Alterations in the expression of antioxidant enzymes could alter the redox balance. Our aim was to evaluate the expression of the genes GPX1, GPX4, SEP15, SELENOP, SOD1, SOD2, GSR, CAT, and NFE2L2 in patients with HCC. Differential gene expression analysis was performed using RNA-Seq data from the TCGA and GTEx databases, and RT-qPCR data from HCC patient samples. Bioinformatic analysis revealed significant differential expression in most genes. GPX4 expression was significantly increased (p=0.02), while SOD2 expression was significantly decreased (p=0.04) in experimental data. In TCGA samples, alpha-fetoprotein levels (mg/dL) were negatively correlated with the expression of SEP15 (p<0.001), SELENOP (p<0.001), SOD1 (p<0.001), SOD2 (p<0.001), CAT (p<0.001), and NFE2L2 (p=0.004). Alpha-fetoprotein levels were positively correlated with the expression of GPX4 (p=0.02) and SELENOP (p=0.01) in the experimental data. Low expression of GPX1 (p=0.006), GPX4 (p=0.01), SELENOP (p=0.006), SOD1 (p=0.007), CAT (p<0.001), and NFE2L2 (p<0.001), and higher levels of GSR, were associated with low overall survival at 12 months. These results suggest a significant role for these antioxidant enzymes in HCC pathogenesis and severity.
Keywords: Hepatocellular carcinoma, selenoproteins, antioxidant enzymes, oxidative stress, gene expression.
Received: November 26, 2019; Accepted: February 10, 2021.
IntroductionHepatocellular carcinoma (HCC) has a high mortality
rate, and ranks as the third leading cause of cancer deaths worldwide (Ozakyol, 2017; Forner et al., 2018). Major risk factors for HCC include infection with hepatitis B and C viruses, alcohol intake, and fatty liver disease (Ozakyol, 2017; Yang et al., 2019). Prognosis and treatment options vary according to tumor stage and liver function. The percentage of patients eligible for curative treatment varies between high and low-resource countries (Ozakyol, 2017; Yang et al., 2019), but generally fluctuates between 20-30% of patients. The median survival of patients with untreated disease is nine months (Klungboonkrong et al., 2017; Forner et al., 2018). New markers or therapeutic targets are required for early diagnosis, and the development of novel treatment strategies for HCC (Klungboonkrong et al., 2017).
Oxidative stress is associated with cancer, and has a dual role in disease development, due to the effects of reactive oxygen species (ROS) on cellular processes. Increased ROS levels are associated with oncogenic effects because of their ability to cause damage to biological macromolecules, such as DNA, lipids, and proteins (Reuter et al., 2010; Moloney and Cotter, 2018). High concentrations of ROS have been
associated with activation of p53, oxidative lipid peroxidation, consumption of antioxidants, and can ultimately lead to cell death (Wang et al., 2016b; Sajadimajd and Khazaei, 2017). Oxidative stress can play different roles: promoting carcinogenesis or cell apoptosis, or by providing sufficient components to promote cancer cell survival. The physiological functions of ROS include regulation of the expression and activity of several signaling regulators that are involved in key processes, such as proliferation and apoptosis (Gill et al., 2016). Cancer cells, in turn, seem to maintain advantageously elevated levels of ROS to guarantee their survival, by adapting the content and regulation of their antioxidant machinery (Sajadimajd and Khazaei, 2017; Moloney and Cotter, 2018).
Cellular antioxidant defense systems include a series of antioxidant enzymes that maintain homeostasis by restricting ROS production or neutralizing ROS (Gill et al., 2016). This group of enzymes includes major components such as superoxide dismutase (SOD), catalase (CAT), and glutathione reductase (GSR), and selenoproteins, including glutathione peroxidase 1 (GPX1), glutathione peroxidase 4 (GPX4), 15-kDa selenoprotein (SEP15), and selenoprotein P (SelP). All of these enzymes act in pathways of chain-breaking ROS molecules, or have other important functions, including detoxification of hydrogen peroxide (H2O2), inhibition of lipid peroxidation, quality control of protein folding, and transport of selenium to peripheral tissues (Gupta et al., 2014; Labunskyy et al., 2014; Zoidis et al., 2018). Altered expression of these enzymes could be a useful resource for cancer cells. Hyperactivation of nuclear factor erythroid 2-related
Alves et al.2
factor 2 (Nrf2), a transcription factor that regulates the expression of several genes, including antioxidant enzymes, has been associated with a variety of cancers as well as with HCC (Cheng et al., 2015; Menegon et al., 2016; Ma-on et al., 2017; Sajadimajd and Khazaei, 2017).
Previous studies have demonstrated an association between aberrant expression of antioxidant enzymes and cancer (Table 1). Abnormal expression of the GPX1, GPX4, SEP15, and selenoprotein P (SELENOP) genes has been detected in a variety of cancers, including gastric cancer (Lan et al., 2017), colon carcinoma (Yagublu et al., 2011), colorectal cancer (Hughes et al., 2018), clear cell renal cell carcinomas (Rudenko et al., 2015; Cheng et al., 2019), laryngeal squamous cell carcinoma (Zhang Q et al., 2018), breast cancer (Król et al., 2018), MCF-7 adenocarcinoma cells (Rusolo et al., 2017), lung cancer (Gresner et al., 2009), and HepG2 liver cancer cells (Guariniello et al., 2015; Zhao et al., 2015). The SOD1, SOD2, glutathione-disulfide reductase (GSR), catalase (CAT), and nuclear factor erythroid 2-related factor 2 (NFE2L2) genes are deregulated in bladder cancer (Wieczorek et al., 2017), oral squamous cell carcinoma (Pedro et al., 2018), breast cancer (Wolf et al., 2016), lung cancer (Zhang Y et al., 2016), MCF-7 cells (Shi et al., 2017), and HCC (Cheng et al., 2015; Guerriero et al., 2015; Wang et al., 2016a).
In the present study, we produced new data on the gene expression levels of the antioxidant enzyme genes GPX1, GPX4, SEP15, SELENOP, SOD1, SOD2, GSR, CAT, and NFE2L2 in human HCC tissues. Bioinformatic analyses using databases and RT-qPCR analysis of the original data were performed to investigate whether changes in the expression of these genes might be associated with severity and overall survival in HCC, and to explore possible relationships between the genes.
Material and Methods
Datasets and bioinformatic analyses of differentially expressed genes
Bioinformatic analyses were performed using two different experimental designs: transversal and case-control studies. For the transversal study, publicly available RNA-Seq data from the liver hepatocellular carcinoma (LIHC) project were downloaded directly from The Cancer Genome Atlas (TCGA) portal. These data included HTSeq-Counts of matched samples from 48 tumoral tissues and 48 normal solid tissues. The results published here are in whole or part based upon data generated by the TCGA Research Network: https://www.cancer.gov/tcga. For the case-control study, RNA-Seq by Expectation-Maximization expected count data of 292 TCGA-LIHC tumoral samples (case) and 115 Genotype-Tissue Expression (GTEx) normal liver samples (control) were downloaded from “Figshare Data Record 1”, made available by Wang et al. (2018). Since TCGA and GTEx are studies from different sources, reprocessing of data and batch effect removal were necessary for adequate comparison. Therefore, in the present study, normalized datasets provided by Wang et al. (2018) were used. Publicly available clinical data were also collected from both datasets.
Differential expression analyses for both studies (tumoral × normal and case × control) were performed using the DESeq2 (Love et al., 2014) package in the R language with padj<0.05. The Edge R (Robinson et al., 2009) package was also used for trimmed mean of M values (TMM) normalization and generation of logarithmic counts per million (logCPM) data for further statistical analyses.
Tissue samples and clinical data collection
Hepatic fresh tissue specimens (tumoral and adjacent peritumoral tissues) were collected from 14 cirrhotic patients with HCC who underwent liver transplantation between 2013 and 2015 at the Division of Gastroenterology of Irmandade Santa Casa de Misericórdia de Porto Alegre (ISCMPA), Brazil. Clinical data, such as age, sex, etiology, and metabolic panel, were collected from medical records. Informed consent was obtained from all patients. The study protocol was approved by the ISCMPA and Universidade Federal de Ciências da Saúde de Porto Alegre (UFCSPA) Ethics Committees (no. 2.400.119).
RNA extraction and quantitative real-time PCR analysis
Tissue samples from ISCMPA were collected from explanted liver and immediately dipped in RNAlater solution Ambion® (Thermo Fisher Scientific, USA). The stabilized tissue samples were frozen at −80 °C until RNA isolation. Total RNA was extracted from the samples shortly after collection, using TRIzol™ reagent (Invitrogen, USA) according to the manufacturer’s specifications. RNA purity and concentration were evaluated by spectrometry using a Biospec-Nano device (Shimadzu, Japan). RNA integrity was evaluated by agarose gel electrophoresis of total RNA (Figure S1). Total RNA was reverse transcribed using the GoScript™ Reverse Transcription System (Promega, USA) according to the manufacturer’s instructions, in a PCR thermal cycler (Applied Biosystems, USA). Total RNA not used for RT-PCR was frozen at −80 °C in case any additional experiments were necessary.
Quantitative polymerase chain reaction (qPCR) assays were performed on a StepOnePlus™ system (Applied Biosystems, USA), using SYBR™ Select Master Mix (Applied Biosystems, USA) and specific primers (Invitrogen, USA). The primer sequences are shown in Table S1. Actin beta (ACTB), glyceraldehyde 3-phosphate dehydrogenase (GAPDH), and 18S genes were tested for stability using the protocol described by Moura et al. (2014). The ACTB gene displayed higher stability, and was used as an endogenous control.
Gene expression was normalized to the ACTB housekeeping gene. The difference in gene expression between tumoral and peritumoral tissues (used as the calibrator) was calculated using the 2−ΔΔCt method (Livak and Schmittgen, 2001; Schmittgen and Livak, 2008), where ΔΔCt= ΔCt(tumor)-ΔCt(peritumor) for tumoral tissue and ΔΔCt=ΔCt(peritumor)-ΔCt(peritumor) for peritumoral tissue. Fold-change calculations were conducted as previously described (Schmittgen and Livak, 2008).

Antioxidant enzymes in HCC 3
Tabl
e 1
– C
ompa
rison
of g
ene
expr
essi
on in
the
pres
ent s
tudy
and
lite
ratu
re.
Type
of c
ance
rG
PX1
GPX
4SE
P15
SELE
NO
PSO
D1
SOD
2G
SRC
ATN
FE2L
2
Col
on c
arci
nom
a (Y
agub
lu e
t al.,
201
1)↑
↑–
––
––
––
Col
orec
tal c
ance
r (H
ughe
s et a
l., 2
018)
↑N
S–
↓–
↑–
––
Bla
dder
can
cer (
Wie
czor
ek e
t al.,
201
7)↑
––
––
NS
–N
S–
Lary
ngea
l squ
amou
s cel
l car
cino
ma
(Zha
ng e
t al.,
201
8)↑
––
––
––
––
Gas
tric
Can
cer (
Lan
et a
l., 2
017)
↓↓
↓–
––
––
–
Cle
ar c
ell r
enal
cel
l car
cino
mas
(Rud
enko
et a
l., 2
015)
↓↓
––
––
––
–
Cle
ar c
ell r
enal
cel
l car
cino
mas
(Che
ng e
t al.,
201
9)↑
NS
––
––
––
–
Bre
ast C
ance
r (K
ról e
t al.,
201
8)↓
––
––
––
––
Bre
ast C
ance
r (W
olf e
t al.,
201
6)–
––
––
––
–↓
MC
F 7
cells
(Rus
olo
et a
l., 2
017)
↓↓
––
––
––
–
MC
F 7
cells
(Shi
et a
l., 2
017)
––
––
–↑
––
–
Non
-sm
all c
ell l
ung
canc
er (G
resn
er e
t al.,
200
9)–
–N
S↓
––
––
–
Lung
squa
mou
s cel
l car
cino
ma
(Zha
ng e
t al.,
201
6)–
––
––
––
–↑
Ora
l squ
amou
s cel
l car
cino
ma
(Ped
ro e
t al.,
201
8)–
––
–↓
↑↓
↓–
Hep
atoc
ellu
lar c
arci
nom
a (W
ang
et a
l., 2
016)
––
––
–↓
––
–
Hep
atoc
ellu
lar c
arci
nom
a (G
uerr
iero
et a
l., 2
015)
–↑
––
––
––
–
Hep
atoc
ellu
lar c
arci
nom
a (C
heng
et a
l., 2
015)
––
––
––
––
↑
Hep
G2
cell
line
(Zha
o et
al.,
201
5)↑
↑–
↑–
––
––
Hep
G2
and
Huh
7 ce
ll lin
es (
Gua
rinie
llo e
t al.,
201
5)–
↑↑
––
––
––
TCG
A (T
umor
x n
orm
al a
djac
ent t
issu
e)↑
NS
NS
↓↓
↓N
S↓
↓
TCG
A x
GTE
x (C
ase
x co
ntro
l)↑
↑↑
↑N
S↓
↑↓
↑
ISC
MPA
(Tum
or x
per
itum
or)
NS
↑N
SN
SN
S↑
NS
NS
NS
Abb
revi
atio
ns: ↑
=hig
her e
xpre
ssio
n in
tum
oral
com
pare
d to
nor
mal
/per
itum
oral
tiss
ue (o
r non
-tum
oral
cell
line)
; ↓=
low
er ex
pres
sion
in tu
mor
al co
mpa
red
to n
orm
al/p
eritu
mor
al ti
ssue
(or n
on-tu
mor
al ce
ll lin
e); N
S =
not
sign
ifica
nt; -
= n
ot a
naly
zed;
TC
GA
= Th
e C
ance
r Gen
ome A
tlas;
GTE
x =
Gen
otyp
e-Ti
ssue
Exp
ress
ion;
ISC
MPA
= Ir
man
dade
San
ta C
asa
de M
iser
icór
dia
de P
orto
Ale
gre.
Eac
h lin
e co
rres
pond
s to
one
stud
y fo
r bet
ter
unde
rsta
ndin
g. M
CF
7 ce
lls c
onst
itute
a ty
pe o
f bre
ast c
ance
r cel
l lin
e, a
nd H
epG
2 an
d H
uh7
cells
con
stitu
te ty
pes o
f HC
C a
nd li
ver c
ance
r cel
l lin
e.

Alves et al.4
Figure 1 – Gene expression profiles. (A) Gene expression levels in the TCGA-LIHC dataset for tumoral and normal adjacent tissues. (B) Gene expression levels in case (TCGA) versus control (GTEx) analysis. (C) and (D) Significant differentially expressed genes in ISCMPA’s sample (tumoral versus peritumoral tissues). *p<0.05, **p<0.001.
Protein-protein interaction (PPI) network analysis
PPI network visualization and analysis were performed using Cytoscape 3.8 software (Shannon, 2003). PPI network construction was carried out using the Search Tool for the Retrieval of Interacting Genes (STRING) database v.11 (Szklarczyk et al., 2019), using STRINGapp from Cytoscape 3.8. A confidence score of 0.4 was set as the cut-off criterion.
Gene ontology (GO) and pathway enrichment analyses
To analyze the genes and biological characteristics, bioinformatic enrichment analysis of GO and pathways was performed using the STRINGapp plugin from Cytoscape 3.8. This plugin has a feature that performs enrichment retrieval from databases. GO (Ashburner et al., 2000; Carbon et al., 2019), the Kyoto Encyclopedia of Genes and Genomes (KEGG) Pathway (Kanehisa, 2000; Kanehisa et al., 2019) and REACTOME Pathway (Jassal et al., 2020) were the databases selected for retrieval by the STRINGapp plugin. Two groups of genes were examined separately: upregulated and downregulated. All genes were analyzed with “Homo sapiens” as background species. The statistical criterion was a corrected p-value <0.05.
Statistical analyses
Continuous data are shown as mean ± standard deviation or median (interquartile range). Categorical values are shown as absolute frequency (relative frequency). Shapiro-Wilks or Kolmogorov-Smirnov tests were used to test the normality of variables. Comparison of mRNA levels between tumoral and peritumoral tissues was performed using Wilcoxon signed-rank tests. Correlations were made using Spearman’s tests, and are presented as p-values and r coefficients. Survival analysis was performed using Kaplan–Meier log-rank tests and Cox regression. Evaluate Cutpoints (Ogłuszka et al., 2019) software was used to choose the optimal cut-off point for the dichotomization of continuous variables. SPSS 20.0 (SPSS Inc., USA) and R software version 4.0.0 were used for statistical analysis. The significance level was set at p<0.05.
Results
Differential gene expression of antioxidant enzymes in HCC
Comparison of matched tumoral and adjacent normal tissues from TCGA patients revealed significantly differential expression of six genes (Figure 1A). One gene (GPX1) was
Antioxidant enzymes in HCC 5
upregulated and five (SELENOP, SOD1, SOD2, CAT, and NFE2L2) were downregulated. All genes except SOD1 showed significant differential expression in TCGA (case) and GTEx (control) comparisons (Figure 1B). Six genes (GPX1, GPX4, SEP15, SELENOP, GSR, and NFE2L2) were upregulated, and two genes (SOD2 and CAT) were downregulated. Detailed data from these analyses are provided in Table S2.
In RT-qPCR analysis of 28 fresh frozen matched samples of HCC patients from ISCMPA, two genes displayed significantly higher expression in tumoral tissue than in peritumoral tissue (Figure 1C, D). GPX4 displayed a 2.70-fold
increase (p=0.02), and SOD2 a 2.59-fold increase (p=0.04). In contrast, the GPX1, SEP15, SELENOP, SOD1, GSR, CAT, and NFE2L2 genes were not significantly differentially expressed when comparing tumoral and peritumoral tissues (data not shown).
Correlation analysis
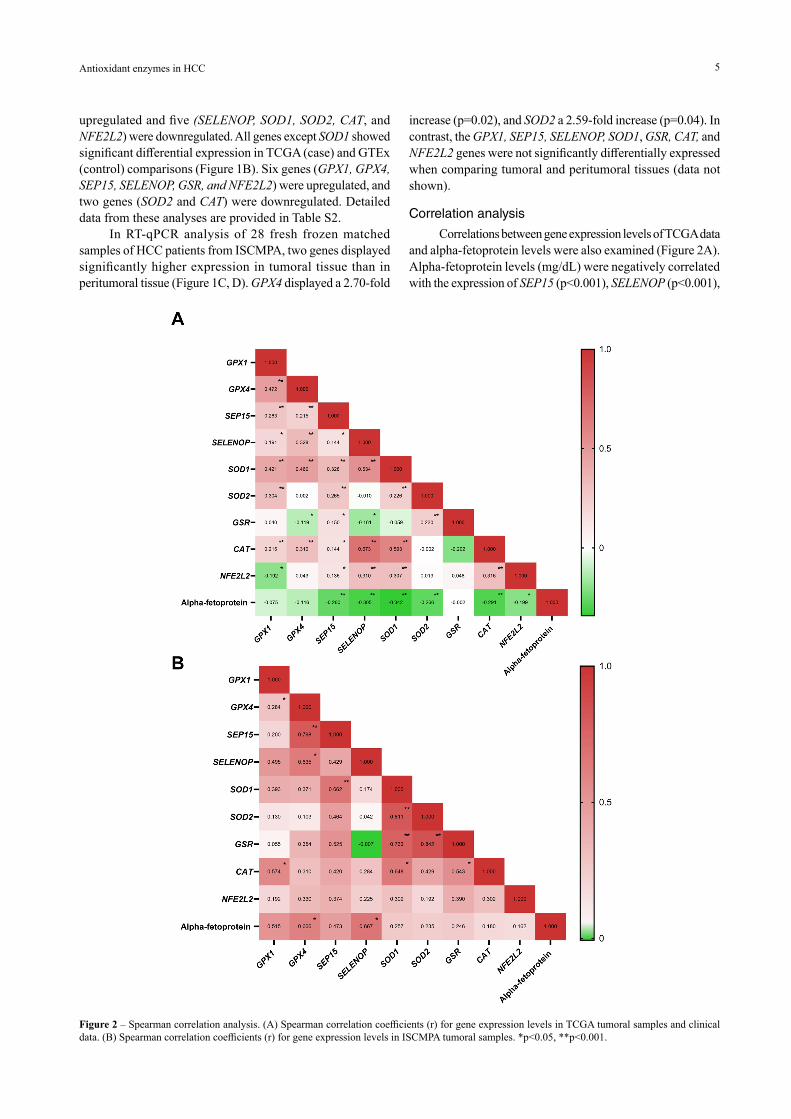
Correlations between gene expression levels of TCGA data and alpha-fetoprotein levels were also examined (Figure 2A). Alpha-fetoprotein levels (mg/dL) were negatively correlated with the expression of SEP15 (p<0.001), SELENOP (p<0.001),
Figure 2 – Spearman correlation analysis. (A) Spearman correlation coefficients (r) for gene expression levels in TCGA tumoral samples and clinical data. (B) Spearman correlation coefficients (r) for gene expression levels in ISCMPA tumoral samples. *p<0.05, **p<0.001.

Alves et al.6
SOD1 (p<0.001), SOD2 (p<0.001), CAT (p<0.001), and NFE2L2 (p=0.004). In contrast, analysis of relative mRNA expression (2−ΔΔCt) in tumoral tissue revealed that patients from ISCMPA, alpha-fetoprotein (mg/dL) levels were positively correlated with GPX4 (p=0.02) and SELENOP (p=0.01) expression levels (Figure 2B).
Survival analysis
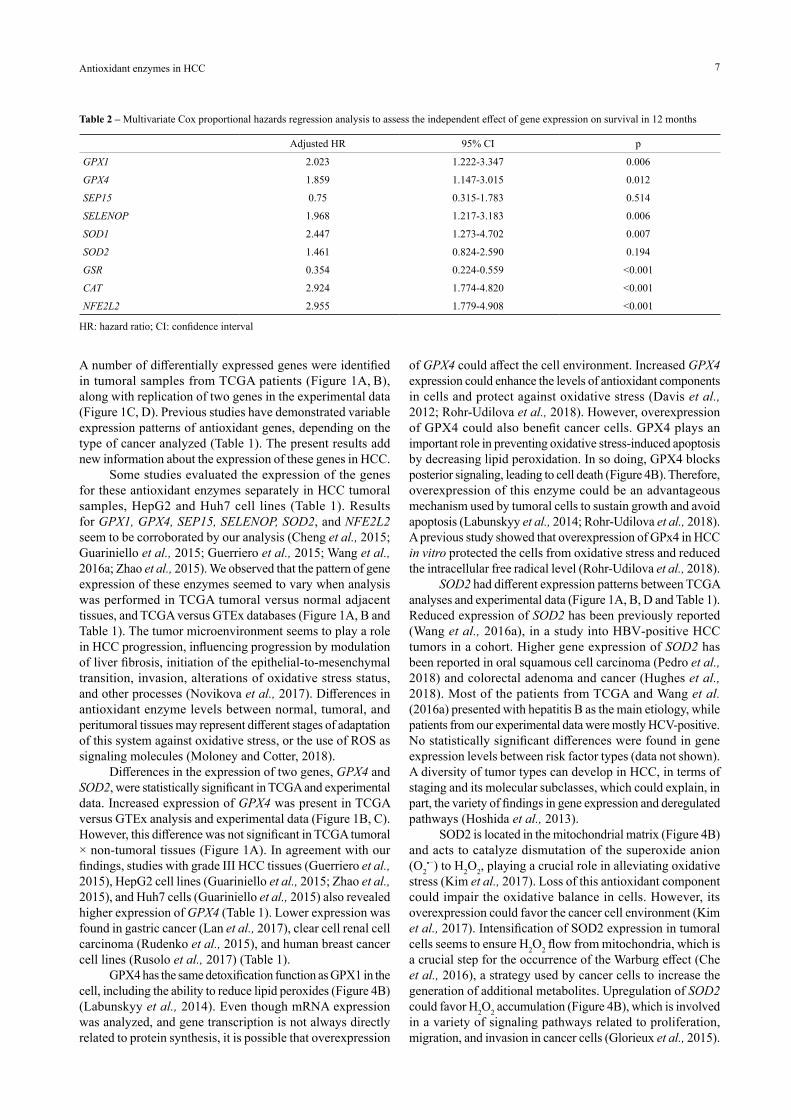
In TCGA samples, patients were divided into two groups according to gene expression (high or low), using the optimal cut-off point generated by the Evaluate Cutpoints (Ogłuszka et al., 2019) software. Kaplan–Meier and Cox multivariate regression were used to generate overall survival data (Figure 3 and Table 2). The final models used for multivariate analysis are presented in Table S3. Low overall survival at 12 months was correlated with low expression of GPX1 (p=0.006), GPX4 (p=0.01), SELENOP (p=0.006), SOD1 (p=0.007), CAT (p<0.001), and NFE2L2 (p<0.001). Higher levels of GSR (p<0.001) were associated with low overall survival in the same period. Complete sample data from patients from ISCMPA were not available for survival analysis.
PPI network analysis
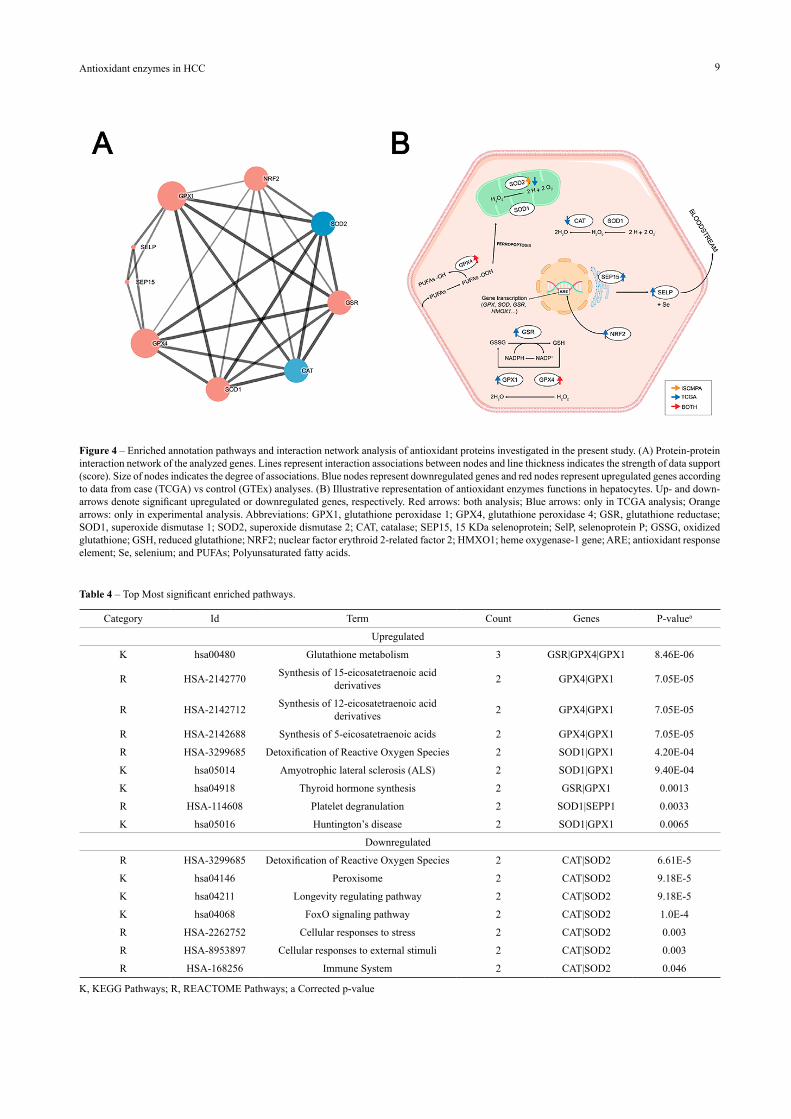
Since correlation analyses revealed several significant correlations (Figure 2) between gene expression in both TCGA and ISCMPA samples, a PPI network analysis was performed. The PPI network contained nine nodes and 25 edges (Figure 4A), with an average node degree of 5.55 and PPI enrichment p-value < 1.0e–16. GPX1 and GPX4 had the highest degree and betweenness centrality values, of 8 and 0.166, respectively. Proteins SELP and SEP15 had the lowest degree value, interacting with only three other proteins in this analysis: GPX1, GPX4, and each other.
GO and pathway enrichment analyses
Gene enrichment analysis using the enrichment tool STRINGapp returned a series of sets. GO terms are divided into three groups: biological process (BP), molecular function (MF), and cellular component (CC). The most significant results are presented in Table 3.
Upregulated genes were mainly enriched in the biological processes of cellular detoxification, response to oxidative stress, and cellular response to toxic substances. With respect to GO molecular function, antioxidant activity and glutathione peroxidase activity were implicated. According to GO cellular component, genes was mainly enriched in the intracellular organelle lumen. Downregulated genes were mainly enriched in biological processes of response to ROS, protein homotetramerization, and aging. GO molecular functions returned antioxidant activity and oxidoreductase activity as the main enriched terms.
KEGG pathways and REACTOME Pathways analyses revealed that genes were enriched in several pathways. The most significant results are presented in Table 4. Upregulated genes were mainly enriched in pathways involving glutathione metabolism, synthesis of eicosatetraenoic acids, detoxification of ROS, and diseases that included amyotrophic lateral sclerosis and Huntington’s disease. Downregulated genes were also enriched in pathways of detoxification of ROS, as well as pathways involving peroxisomes, longevity regulation, FoxO signaling, and the immune system.
DiscussionWe performed bioinformatic and experimental analyses
to evaluate the expression patterns of eight antioxidant enzymes, including four selenoproteins, and one important transcription factor, to assess their association with HCC pathogenesis.
Figure 3 – Survival analysis. Cumulative survival plot of dichotomized gene expression levels of TCGA tumoral tissues.
Antioxidant enzymes in HCC 7
Adjusted HR 95% CI p
GPX1 2.023 1.222-3.347 0.006
GPX4 1.859 1.147-3.015 0.012
SEP15 0.75 0.315-1.783 0.514
SELENOP 1.968 1.217-3.183 0.006
SOD1 2.447 1.273-4.702 0.007
SOD2 1.461 0.824-2.590 0.194
GSR 0.354 0.224-0.559 <0.001
CAT 2.924 1.774-4.820 <0.001
NFE2L2 2.955 1.779-4.908 <0.001
HR: hazard ratio; CI: confidence interval
Table 2 – Multivariate Cox proportional hazards regression analysis to assess the independent effect of gene expression on survival in 12 months
A number of differentially expressed genes were identified in tumoral samples from TCGA patients (Figure 1A, B), along with replication of two genes in the experimental data (Figure 1C, D). Previous studies have demonstrated variable expression patterns of antioxidant genes, depending on the type of cancer analyzed (Table 1). The present results add new information about the expression of these genes in HCC.
Some studies evaluated the expression of the genes for these antioxidant enzymes separately in HCC tumoral samples, HepG2 and Huh7 cell lines (Table 1). Results for GPX1, GPX4, SEP15, SELENOP, SOD2, and NFE2L2 seem to be corroborated by our analysis (Cheng et al., 2015; Guariniello et al., 2015; Guerriero et al., 2015; Wang et al., 2016a; Zhao et al., 2015). We observed that the pattern of gene expression of these enzymes seemed to vary when analysis was performed in TCGA tumoral versus normal adjacent tissues, and TCGA versus GTEx databases (Figure 1A, B and Table 1). The tumor microenvironment seems to play a role in HCC progression, influencing progression by modulation of liver fibrosis, initiation of the epithelial-to-mesenchymal transition, invasion, alterations of oxidative stress status, and other processes (Novikova et al., 2017). Differences in antioxidant enzyme levels between normal, tumoral, and peritumoral tissues may represent different stages of adaptation of this system against oxidative stress, or the use of ROS as signaling molecules (Moloney and Cotter, 2018).
Differences in the expression of two genes, GPX4 and SOD2, were statistically significant in TCGA and experimental data. Increased expression of GPX4 was present in TCGA versus GTEx analysis and experimental data (Figure 1B, C). However, this difference was not significant in TCGA tumoral × non-tumoral tissues (Figure 1A). In agreement with our findings, studies with grade III HCC tissues (Guerriero et al., 2015), HepG2 cell lines (Guariniello et al., 2015; Zhao et al., 2015), and Huh7 cells (Guariniello et al., 2015) also revealed higher expression of GPX4 (Table 1). Lower expression was found in gastric cancer (Lan et al., 2017), clear cell renal cell carcinoma (Rudenko et al., 2015), and human breast cancer cell lines (Rusolo et al., 2017) (Table 1).
GPX4 has the same detoxification function as GPX1 in the cell, including the ability to reduce lipid peroxides (Figure 4B) (Labunskyy et al., 2014). Even though mRNA expression was analyzed, and gene transcription is not always directly related to protein synthesis, it is possible that overexpression
of GPX4 could affect the cell environment. Increased GPX4 expression could enhance the levels of antioxidant components in cells and protect against oxidative stress (Davis et al., 2012; Rohr-Udilova et al., 2018). However, overexpression of GPX4 could also benefit cancer cells. GPX4 plays an important role in preventing oxidative stress-induced apoptosis by decreasing lipid peroxidation. In so doing, GPX4 blocks posterior signaling, leading to cell death (Figure 4B). Therefore, overexpression of this enzyme could be an advantageous mechanism used by tumoral cells to sustain growth and avoid apoptosis (Labunskyy et al., 2014; Rohr-Udilova et al., 2018). A previous study showed that overexpression of GPx4 in HCC in vitro protected the cells from oxidative stress and reduced the intracellular free radical level (Rohr-Udilova et al., 2018).
SOD2 had different expression patterns between TCGA analyses and experimental data (Figure 1A, B, D and Table 1). Reduced expression of SOD2 has been previously reported (Wang et al., 2016a), in a study into HBV‐positive HCC tumors in a cohort. Higher gene expression of SOD2 has been reported in oral squamous cell carcinoma (Pedro et al., 2018) and colorectal adenoma and cancer (Hughes et al., 2018). Most of the patients from TCGA and Wang et al. (2016a) presented with hepatitis B as the main etiology, while patients from our experimental data were mostly HCV-positive. No statistically significant differences were found in gene expression levels between risk factor types (data not shown). A diversity of tumor types can develop in HCC, in terms of staging and its molecular subclasses, which could explain, in part, the variety of findings in gene expression and deregulated pathways (Hoshida et al., 2013).
SOD2 is located in the mitochondrial matrix (Figure 4B) and acts to catalyze dismutation of the superoxide anion (O2
•−) to H2O2, playing a crucial role in alleviating oxidative stress (Kim et al., 2017). Loss of this antioxidant component could impair the oxidative balance in cells. However, its overexpression could favor the cancer cell environment (Kim et al., 2017). Intensification of SOD2 expression in tumoral cells seems to ensure H2O2 flow from mitochondria, which is a crucial step for the occurrence of the Warburg effect (Che et al., 2016), a strategy used by cancer cells to increase the generation of additional metabolites. Upregulation of SOD2 could favor H2O2 accumulation (Figure 4B), which is involved in a variety of signaling pathways related to proliferation, migration, and invasion in cancer cells (Glorieux et al., 2015).

Alves et al.8
Tabl
e 3
– To
p M
ost s
igni
fican
t enr
iche
d ge
ne o
ntol
ogy
(GO
) ter
ms.
Cat
egor
yId
Term
Cou
ntG
enes
P-va
luea
Upr
egul
ated
BP
GO
.009
8754
Det
oxifi
catio
n5
GSR
|SO
D1|
GPX
4|N
FE2L
2|G
PX1
5.92
E-08
BP
GO
.000
6979
Res
pons
e to
oxi
dativ
e st
ress
6G
SR|S
OD
1|G
PX4|
NFE
2L2|
GPX
1|SE
LEN
OP
1.50
E-07
BP
GO
.009
7237
Cel
lula
r res
pons
e to
toxi
c su
bsta
nce
5G
SR|S
OD
1|G
PX4|
NFE
2L2|
GPX
16.
26E-
07
BP
GO
.009
8869
Cel
lula
r oxi
dant
det
oxifi
catio
n4
GSR
|SO
D1|
GPX
4|G
PX1
3.10
E-06
BP
GO
.190
2175
Reg
ulat
ion
of o
xida
tive
stre
ss-in
duce
d in
trins
ic a
popt
otic
si
gnal
ing
path
way
3SO
D1|
NFE
2L2|
GPX
12.
18E-
05
BP
GO
.003
4599
Cel
lula
r res
pons
e to
oxi
dativ
e st
ress
4G
SR|S
OD
1|N
FE2L
2|G
PX1
6.32
E-05
BP
GO
.000
6749
Glu
tath
ione
met
abol
ic p
roce
ss3
GSR
|SO
D1|
GPX
16.
95E-
05
BP
GO
.004
5454
Cel
l red
ox h
omeo
stas
is3
GSR
|NFE
2L2|
GPX
11.
20E-
04
BP
GO
.004
2542
Res
pons
e to
hyd
roge
n pe
roxi
de3
SOD
1|N
FE2L
2|G
PX1
4.20
E-04
BP
GO
.001
9372
Lipo
xyge
nase
pat
hway
2G
PX4|
GPX
17.
50E-
04
MF
GO
.001
6209
Ant
ioxi
dant
act
ivity
4G
SR|S
OD
1|G
PX4|
GPX
17.
40E-
07
MF
GO
.000
4602
Glu
tath
ione
per
oxid
ase
activ
ity2
GPX
4|G
PX1
8.10
E-04
MF
GO
.001
6491
Oxi
dore
duct
ase
activ
ity4
GSR
|SO
D1|
GPX
4|G
PX1
0.00
14
CC
GO
.007
0013
Intra
cellu
lar o
rgan
elle
lum
en7
GSR
|SO
D1|
SEP1
5|G
PX4|
NFE
2L2|
GPX
1|SE
PP1
0.00
67
CC
GO
.000
5759
Mito
chon
dria
l mat
rix3
GSR
|SO
D1|
GPX
10.
0082
CC
GO
.000
5739
Mito
chon
drio
n4
GSR
|SO
D1|
GPX
4|G
PX1
0.01
63
Dow
nreg
ulat
ed
BP
GO
.000
0302
Res
pons
e to
reac
tive
oxyg
en sp
ecie
s2
CAT
|SO
D2
0.00
57
BP
GO
.003
4599
Cel
lula
r res
pons
e to
oxi
dativ
e st
ress
2C
AT|S
OD
20.
0057
BP
GO
.005
1289
Prot
ein
hom
otet
ram
eriz
atio
n2
CAT
|SO
D2
0.00
57
BP
GO
.007
2593
Rea
ctiv
e ox
ygen
spec
ies m
etab
olic
pro
cess
2C
AT|S
OD
20.
0057
BP
GO
.009
8869
Cel
lula
r oxi
dant
det
oxifi
catio
n2
CAT
|SO
D2
0.00
57
BP
GO
.000
7568
Agi
ng2
CAT
|SO
D2
0.00
6
BP
GO
.001
0035
Res
pons
e to
inor
gani
c su
bsta
nce
2C
AT|S
OD
20.
0157
BP
GO
.004
3066
Neg
ativ
e re
gula
tion
of a
popt
otic
pro
cess
2C
AT|S
OD
20.
0419
BP
GO
.005
5114
Oxi
datio
n-re
duct
ion
proc
ess
2C
AT|S
OD
20.
043
MF
GO
.001
6209
Ant
ioxi
dant
act
ivity
2C
AT|S
OD
25.
8E-4
MF
GO
.001
6491
Oxi
dore
duct
ase
activ
ity2
CAT
|SO
D2
0.02
29
GO
, gen
e on
tolo
gy; B
P, b
iolo
gica
l pro
cess
; MF,
mol
ecul
ar fu
nctio
n; C
C, c
ellu
lar c
ompo
nent
; a Cor
rect
ed p
-val
ue
Antioxidant enzymes in HCC 9
Figure 4 – Enriched annotation pathways and interaction network analysis of antioxidant proteins investigated in the present study. (A) Protein-protein interaction network of the analyzed genes. Lines represent interaction associations between nodes and line thickness indicates the strength of data support (score). Size of nodes indicates the degree of associations. Blue nodes represent downregulated genes and red nodes represent upregulated genes according to data from case (TCGA) vs control (GTEx) analyses. (B) Illustrative representation of antioxidant enzymes functions in hepatocytes. Up- and down-arrows denote significant upregulated or downregulated genes, respectively. Red arrows: both analysis; Blue arrows: only in TCGA analysis; Orange arrows: only in experimental analysis. Abbreviations: GPX1, glutathione peroxidase 1; GPX4, glutathione peroxidase 4; GSR, glutathione reductase; SOD1, superoxide dismutase 1; SOD2, superoxide dismutase 2; CAT, catalase; SEP15, 15 KDa selenoprotein; SelP, selenoprotein P; GSSG, oxidized glutathione; GSH, reduced glutathione; NRF2; nuclear factor erythroid 2-related factor 2; HMXO1; heme oxygenase-1 gene; ARE; antioxidant response element; Se, selenium; and PUFAs; Polyunsaturated fatty acids.
Table 4 – Top Most significant enriched pathways.
Category Id Term Count Genes P-valuea
Upregulated
K hsa00480 Glutathione metabolism 3 GSR|GPX4|GPX1 8.46E-06
R HSA-2142770 Synthesis of 15-eicosatetraenoic acid derivatives 2 GPX4|GPX1 7.05E-05
R HSA-2142712 Synthesis of 12-eicosatetraenoic acid derivatives 2 GPX4|GPX1 7.05E-05
R HSA-2142688 Synthesis of 5-eicosatetraenoic acids 2 GPX4|GPX1 7.05E-05
R HSA-3299685 Detoxification of Reactive Oxygen Species 2 SOD1|GPX1 4.20E-04
K hsa05014 Amyotrophic lateral sclerosis (ALS) 2 SOD1|GPX1 9.40E-04
K hsa04918 Thyroid hormone synthesis 2 GSR|GPX1 0.0013
R HSA-114608 Platelet degranulation 2 SOD1|SEPP1 0.0033
K hsa05016 Huntington’s disease 2 SOD1|GPX1 0.0065
Downregulated
R HSA-3299685 Detoxification of Reactive Oxygen Species 2 CAT|SOD2 6.61E-5
K hsa04146 Peroxisome 2 CAT|SOD2 9.18E-5
K hsa04211 Longevity regulating pathway 2 CAT|SOD2 9.18E-5
K hsa04068 FoxO signaling pathway 2 CAT|SOD2 1.0E-4
R HSA-2262752 Cellular responses to stress 2 CAT|SOD2 0.003
R HSA-8953897 Cellular responses to external stimuli 2 CAT|SOD2 0.003
R HSA-168256 Immune System 2 CAT|SOD2 0.046
K, KEGG Pathways; R, REACTOME Pathways; a Corrected p-value
Alves et al.10
Survival analysis of patients from TCGA revealed an interesting aspect of gene expression patterns in HCC. Although higher expression of antioxidant enzymes was present in HCC patients, patients with lower gene expression also displayed lower overall survival, except for GSR expression (Figure 3). As previously discussed, ROS act as a two-edged sword in cancer, with beneficial and detrimental roles in cells, and are tightly regulated by cancer cells (Moloney and Cotter, 2018). On the one hand, higher expression of antioxidant enzymes could not only control ROS accumulation, preventing cell death being triggered by them, but could also perpetuate tumoral cells. On the other hand, lower expression could cause apoptosis and kill tumoral cells. However, regarding the level of expression, tumors could also be favored due to the accumulation of ROS used as signaling factors (Sajadimajd and Khazaei, 2017; Moloney and Cotter, 2018). This mechanism and the extent to which the levels of these antioxidant enzymes vary in each stage of hepatocarcinogenesis should be explored in depth in further studies.
Correlation (Figure 2), PPI network (Figure 4A), and GO (Tables 3 and 4) analyses highlighted possible relationships between the antioxidant enzymes investigated and their interactions in different pathways (Table 4). NFR2, which is encoded by NFE2L2, seems to be important because of its interaction with Antioxidant Responsive Element (ARE) (Figure 4B), an interaction that increases the expression of several genes, including genes that encode glutathione peroxidases and SODs (Raghunath et al., 2018). Further analysis at the protein level should be performed to clarify the knowledge about this protein network, especially in the context of carcinogenesis.
None of the other genes in the experimental data had significantly altered expression, even though there was a tendency towards underexpression or overexpression of some genes. The limitations of our study, such as the difficulty in acquiring fresh liver tissue for mRNA analysis, resulted in a small sample size, which could be one of the explanations for the lack of statistical significance. To improve our analysis, we also investigated data from larger databases, such as TCGA and GTEx, which provided us with a better understanding of the results. In addition, peritumoral tissue, due to its proximity to the tumor, could already contain alterations, and could complicate the examination of gene expression differences. However, the availability of fresh, healthy liver tissue was also limited. Peritumoral tissue was collected with a safety margin and, in this case, allowed us to perform a paired analysis. These data permitted an evaluation of differences in gene expression in the tumoral and adjacent peritumoral tissues of the same patient. To verify the presence of differences between tissue types, we performed bioinformatic analyses between matched samples, as well as between case and control samples.
We present preliminary findings of the gene expression patterns of antioxidant enzymes in HCC. The findings highlight the importance of further evaluation of these components in the pathology of cancer studies with larger sample sizes. We were able to replicate data from TCGA analysis for at least two genes. The present study is one of few investigations to investigate a diversity of antioxidant enzyme genes in the context of cancer. We were also able to examine clinical
parameters and survival data for different gene expression levels in TCGA patients. Our study highlights the need for further studies to better understand the role of these enzymes in HCC.
AcknowledgmentsWe thank CNPq for financial support and Pâmela
Victoria Von Burg, Grasiela Agnes, and Marília Zandoná for exceptional technical assistance. This study was supported by Conselho Nacional de Desenvolvimento Científico e Tecnológico (CNPq), 408864/2016-8.
Conflict of interestThe authors have no conflict of interest to disclose.
Authors ContributionsAFA conceived and designed the study, conducted all the
analysis and wrote the manuscript; ACM conducted laboratory experiments; HFA and ABGV collected samples and clinical data from patients; MG, MF and SA revised the manuscript, helped in statistical analysis, provided financial support and administered the project. All authors read and approved the final version.
ReferencesAshburner M, Ball CA, Blake JA, Botstein D, Butler H, Cherry
JM, Davis AP, Dolinski K, Dwight SS, Eppig JT et al. (2000) Gene Ontology: tool for the unification of biology. Nat Genet 25:25–29.
Carbon S, Douglass E, Dunn N, Good B, Harris NL, Lewis SE, Mungall CJ, Basu S, Chisholm RL, Dodson RJ et al. (2019) The Gene Ontology resource: 20 years and still GOing strong. Nucleic Acids Res 47:D330–D338.
Che M, Wang R, Li X, Wang H and Zheng XFS (2016) Expanding roles of superoxide dismutases in cell regulation and cancer. Drug Discov Today 21:143–149.
Cheng ML, Lu YF, Chen H, Shen ZY and Liu J (2015) Liver expression of Nrf2-related genes in different liver diseases. Hepatobiliary Pancreat Dis Int 14:485–491.
Cheng Y, Xu T, Li S and Ruan H (2019) GPX1, a biomarker for the diagnosis and prognosis of kidney cancer, promotes the progression of kidney cancer. Aging (Albany NY) 11:12165–12176.
Davis CD, Tsuji PA and Milner JA (2012) Selenoproteins and cancer prevention. Annu Rev Nutr 32:73–95.
Forner A, Reig M and Bruix J (2018) Hepatocellular carcinoma. Lancet 391:1301–1314.
Gill JG, Piskounova E and Morrison SJ (2016) Cancer, oxidative stress, and metastasis. Cold Spring Harb Symp Quant Biol 81:163–175.
Glorieux C, Zamocky M, Sandoval JM, Verrax J and Calderon PB (2015) Regulation of catalase expression in healthy and cancerous cells. Free Radic Biol Med 87:84–97.
Gresner P, Gromadzinska J, Jablonska E, Kaczmarski J and Wasowicz W (2009) Expression of selenoprotein-coding genes SEPP1, SEP15 and hGPX1 in non-small cell lung cancer. Lung Cancer 65:34–40.
Guariniello S, Di Bernardo G, Colonna G, Cammarota M, Castello G and Costantini S (2015) Evaluation of the selenotranscriptome expression in two hepatocellular carcinoma cell lines. Anal Cell Pathol (Amst) 2015:419561.
Guerriero E, Capone F, Accardo M, Sorice A, Costantini M, Colonna G, Castello G and Costantini S (2015) GPX4 and GPX7 over-

Antioxidant enzymes in HCC 11
expression in human hepatocellular carcinoma tissues. Eur J Histochem 59:5–10.
Gupta RK, Patel AK, Shah N, Chaudhary AK, Jha UK, Yadav UC, Gupta PK and Pakuwal U (2014) Oxidative stress and antioxidants in disease and cancer: a review. Asian Pac J Cancer Prev 15:4405–9.
Hoshida Y, Nijman SMB, Kobayashi M, Chan JA, Brunet J, Chiang DY, Villanueva A, Newell P, Hashimoto M, Watanabe G et al. (2013) Integrative transcriptome analysis reveals common molecular subclasses of human hepatocellular carcinoma. Cancer Res. 69:7385–7392.
Hughes DJ, Kunická T, Schomburg L, Liška V, Swan N and Souček P (2018) Expression of selenoprotein genes and association with selenium status in colorectal adenoma and colorectal cancer. Nutrients 10:1812.
Jassal B, Matthews L, Viteri G, Gong C, Lorente P, Fabregat A, Sidiropoulos K, Cook J, Gillespie M, Haw R et al. (2020) The reactome pathway knowledgebase. Nucleic Acids Res 48:D498–D503.
Kanehisa M (2000) KEGG: Kyoto Encyclopedia of Genes and Genomes. Nucleic Acids Res 28:27–30.
Kanehisa M, Sato Y, Furumichi M, Morishima K and Tanabe M (2019) New approach for understanding genome variations in KEGG. Nucleic Acids Res 47:D590–D595.
Kim Y, Gupta Vallur P, Phaëton R, Mythreye K and Hempel N (2017) Insights into the dichotomous regulation of SOD2 in cancer. Antioxidants 6:86.
Klungboonkrong V, Das D and McLennan G (2017) Molecular mechanisms and targets of therapy for hepatocellular carcinoma. J Vasc Interv Radiol 28:949–955.
Król MB, Galicki M, Grešner P, Wieczorek E, Jablonska E, Reszka E, Morawiec Z, Wasowicz W and Gromadzinska J (2018) The ESR1 and GPX1 gene expression level in human malignant and non-malignant breast tissues. Acta Biochim Pol 65:51–57.
Labunskyy VM, Hatfield DL and Gladyshev VN (2014) Selenoproteins: molecular pathways and physiological roles. Physiol Rev 94:739–777.
Lan X, Xing J, Gao H, Li S, Quan L, Jiang Y, Ding S and Xue Y (2017) Decreased expression of selenoproteins as a poor prognosticator of gastric cancer in humans. Biol Trace Elem Res 178:22–28.
Livak KJ and Schmittgen TD (2001) Analysis of relative gene expression data using real-time quantitative PCR and the 2-ΔΔCT method. Methods 25:402–408.
Love MI, Huber W and Anders S (2014) Moderated estimation of fold change and dispersion for RNA-seq data with DESeq2. Genome Biol 15:1–21.
Ma-on C, Sanpavat A, Whongsiri P, Suwannasin S, Hirankarn N, Tangkijvanich P and Boonla C (2017) Oxidative stress indicated by elevated expression of Nrf2 and 8-OHdG promotes hepatocellular carcinoma progression. Med Oncol. 34:57.
Menegon S, Columbano A and Giordano S (2016) The dual roles of NRF2 in cancer. Trends Mol Med 22:578–593.
Moloney JN and Cotter TG (2018) ROS signalling in the biology of cancer. Semin Cell Dev Biol 80:50–64.
Moura AC, Lazzari VM, Agnes G, Almeida S, Giovenardi M and Veiga ABG (2014) Transcriptional expression study in the central nervous system of rats: what gene should be used as internal control? Einstein (São Paulo) 12:336–341.
Novikova MV, Khromova NV and Kopnin PB (2017) Components of the hepatocellular carcinoma microenvironment and their role in tumor progression. Biochemistry 82:861–873.
Ogłuszka M, Orzechowska M, Jędroszka D, Witas P and Bednarek AK (2019) Evaluate Cutpoints: Adaptable continuous data distribution system for determining survival in Kaplan-Meier estimator. Comput Methods Programs Biomed 177:133–139.
Ozakyol A (2017) Global epidemiology of hepatocellular carcinoma (HCC Epidemiology). J Gastrointest Cancer 48:238–240.
Pedro NF, Biselli JM, Maniglia JV, Santi-Neto D, Pavarino ÉC, Goloni-Bertollo EM and Biselli-Chicote PM (2018) Candidate biomarkers for oral squamous cell carcinoma: differential expression of oxidative stress-related genes. Asian Pacific J Cancer Prev 19:1343–1349.
Raghunath A, Sundarraj K, Arfuso F, Sethi G and Perumal E (2018) Dysregulation of Nrf2 in hepatocellular carcinoma: Role in cancer progression and chemoresistance. Cancers (Basel) 10:1–29.
Reuter S, Gupta SC, Chaturvedi MM and Aggarwal BB (2010) Oxidative stress, inflammation, and cancer: How are they linked? Free Radic Biol Med 49:1603–1616.
Robinson MD, McCarthy DJ and Smyth GK (2009) edgeR: A Bioconductor package for differential expression analysis of digital gene expression data. Bioinformatics 26:139–140.
Rohr-Udilova N, Bauer E, Timelthaler G, Eferl R, Stolze K, Pinter M, Seif M, Hayden H, Reiberger T, Schulte-Hermann R et al. (2018) Impact of glutathione peroxidase 4 on cell proliferation, angiogenesis and cytokine production in hepatocellular carcinoma. Oncotarget 9:10054–10068.
Rudenko E, Kondratov O, Gerashchenko G, Lapska Y, Kravchenko S, Koliada O, Vozianov S, Zgonnyk Y and Kashuba V (2015) Aberrant expression of selenium-containing glutathione peroxidases in clear cell renal cell carcinomas. Exp Oncol 37:105–110.
Rusolo F, Capone F, Pasquale R, Angiolillo A, Colonna G, Castello G, Costantini M and Costantini S (2017) Comparison of the seleno-transcriptome expression between human non-cancerous mammary epithelial cells and two human breast cancer cell lines. Oncol Lett 13:2411–2417.
Sajadimajd S and Khazaei M (2017) Oxidative stress and cancer: The role of Nrf2. Curr Cancer Drug Targets 18:538–557.
Schmittgen TD and Livak KJ (2008) Analyzing real-time PCR data by the comparative C(T) method. Nat Protoc 3:1101–8.
Shannon P (2003) Cytoscape: A software environment for integrated models of biomolecular interaction networks. Genome Res 13:2498–2504.
Shi Y, Ye P and Long X (2017) Differential expression profiles of the transcriptome in breast cancer cell lines revealed by next generation sequencing. Cell Physiol Biochem 44:804–816.
Szklarczyk D, Gable AL, Lyon D, Junge A, Wyder S, Huerta-Cepas J, Simonovic M, Doncheva NT, Morris JH, Bork P et al. (2019) STRING v11: Protein-protein association networks with increased coverage, supporting functional discovery in genome-wide experimental datasets. Nucleic Acids Res 47:D607–D613.
Wang Q, Armenia J, Zhang C, Penson A V, Reznik E, Zhang L, Minet T, Ochoa A, Gross BE, Iacobuzio-Donahue CA et al. (2018) Data Descriptor: Unifying cancer and normal RNA sequencing data from different sources. Sci Data 5:1–8.
Wang R, Yin C, Li X-X, Yang X-Z, Yang Y, Zhang M-Y, Wang H-Y and Zheng XF (2016a) Reduced SOD2 expression is associated with mortality of hepatocellular carcinoma patients in a mutant p53-dependent manner. Aging (Albany NY) 8:1184–1200.
Wang Z, Li Z, Ye Y, Xie L and Li W (2016b) Oxidative stress and liver cancer: Etiology and therapeutic targets. Oxid Med Cell Longev 2016:7891574.
Wieczorek E, Jablonowski Z, Tomasik B, Gromadzinska J, Jablonska E, Konecki T, Fendler W, Sosnowski M, Wasowicz W and Reszka E (2017) Different gene expression and activity pattern of antioxidant enzymes in bladder cancer. Anticancer Res 37:841–848.

Alves et al.12
Wolf B, Goebel G, Hackl H and Fiegl H (2016) Reduced mRNA expression levels of NFE2L2 are associated with poor outcome in breast cancer patients. BMC Cancer 16:1–14.
Yagublu V, Arthur JR, Babayeva SN, Nicol F, Post S and Keese M (2011) Expression of selenium-containing proteins in human colon carcinoma tissue. Anticancer Res 31:2693–2698.
Yang JD, Hainaut P, Gores GJ, Amadou A, Plymoth A and Roberts LR (2019) A global view of hepatocellular carcinoma: trends, risk, prevention and management. Nat Rev Gastroenterol Hepatol 16:589–604.
Zhang Q, Xu H, You Y, Zhang J and Chen R (2018) High Gpx1 expression predicts poor survival in laryngeal squamous cell carcinoma. Auris Nasus Larynx 45:170–174.
Zhang Y, Fan H, Fang S, Wang L, Chen L, Jin Y, Jiang W, Lin Z, Shi Y, Zhan C et al. (2016) Mutations and expression of the NFE2L2/KEAP1/CUL3 pathway in Chinese patients with lung squamous cell carcinoma. J Thorac Dis 8:1639–1644.
Zhao H, Tang J, Xu J, Cao L, Jia G, Long D, Liu G, Chen X and Wang K (2015) Selenoprotein genes exhibit differential expression patterns between hepatoma HepG2 and normal hepatocytes LO2 cell lines. Biol Trace Elem Res 167:236–241.
Zoidis E, Seremelis I, Kontopoulos N and Danezis GP (2018) Selenium-dependent antioxidant enzymes: Actions and properties of selenoproteins. Antioxidants 7:1–26.
Internet Resources The Cancer Genome Atlas – Liver Hepatocellular Carcinoma (TCGA-
LIHC), https://portal.gdc.cancer.gov/projects/TCGA-LIHC (accessed 01 June 2020).
Genotype-Tissue Expression database (GTEx), https://gtexportal.org/home/eqtls/tissue?tissueName=Liver (accessed 05 June 2020).
Wang Q, Gao J and Nikolaus S. Figshare Data Record 1, https://doi.org/10.6084/m9.figshare.5330539 (accessed 20 June 2020).
DESeq2, https://bioconductor.org/packages/release/bioc/html/DESeq2.html (accessed 25 June 2020).
Edge R, https://bioconductor.org/packages/release/bioc/html/edgeR.html (accessed 04 July 2020).
Evaluate Cutpoints, http://wnbikp.umed.lodz.pl/Evaluate-Cutpoints/ (accessed 15 July 2020).
Cytoscape 3, https://cytoscape.org/ (accessed 28 July 2020).STRINGapp, http://apps.cytoscape.org/apps/stringapp (accessed
30 July 2020).
Supplementary materialThe following online material is available for this article:Table S1 – Sequences of primer pairs.Table S2 – Detailed results of gene expression analysis using RNA-Seq data.Table S3 – Final models of multivariate Cox regression analysis.Figure S1 – Sample of agarose gel electrophoresis of total RNA.
Associate Editor: Carlos F. M. Menck.
License information: This is an open-access article distributed under the terms of the Creative Commons Attribution License (type CC-BY), which permits unrestricted use, distribution and reproduction in any medium, provided the original article is properly cited.
Related Documents