Gene-Drug Interactions and the Evolution of Antibiotic Resistance Citation Palmer, Adam Christopher. 2012. Gene-Drug Interactions and the Evolution of Antibiotic Resistance. Doctoral dissertation, Harvard University. Permanent link http://nrs.harvard.edu/urn-3:HUL.InstRepos:10436292 Terms of Use This article was downloaded from Harvard University’s DASH repository, and is made available under the terms and conditions applicable to Other Posted Material, as set forth at http:// nrs.harvard.edu/urn-3:HUL.InstRepos:dash.current.terms-of-use#LAA Share Your Story The Harvard community has made this article openly available. Please share how this access benefits you. Submit a story . Accessibility

Welcome message from author
This document is posted to help you gain knowledge. Please leave a comment to let me know what you think about it! Share it to your friends and learn new things together.
Transcript
Gene-Drug Interactions and the Evolution of Antibiotic Resistance
CitationPalmer, Adam Christopher. 2012. Gene-Drug Interactions and the Evolution of Antibiotic Resistance. Doctoral dissertation, Harvard University.
Permanent linkhttp://nrs.harvard.edu/urn-3:HUL.InstRepos:10436292
Terms of UseThis article was downloaded from Harvard University’s DASH repository, and is made available under the terms and conditions applicable to Other Posted Material, as set forth at http://nrs.harvard.edu/urn-3:HUL.InstRepos:dash.current.terms-of-use#LAA
Share Your StoryThe Harvard community has made this article openly available.Please share how this access benefits you. Submit a story .
Accessibility

© - Adam Christopher Palmer
All rights reserved.

Professor Roy Kishony Adam Christopher Palmer
iii
Gene-drug interactions and the evolution of antibiotic resistance
Abstract
The evolution of antibiotic resistance is shaped by interactions between genes,
the chemical environment, and an antibiotic's mechanism of action. This thesis explores these
interactions with experiments, theory, and analysis, seeking a mechanistic understanding of
how different interactions between genes and drugs can enhance or constrain the evolution of
antibiotic resistance.
Chapter 1 investigates the effects of the chemical decay of an antibiotic. Tetracycline
resistant and sensitive bacteria were grown competitively in the presence of tetracycline and
its decay products. Antibiotic decay did not only remove selection for resistance, but long-
lived decay products favored tetracycline sensitivity by inducing costly drug efflux pumps in
the resistant strain. Selection against resistance by antibiotic-related compounds may
contribute to the coexistence of drug-sensitive and resistant bacteria in nature.
Chapter 2 investigates how genetic interactions can favor particular combinations of
resistance-conferring mutations. All possible combinations of a set of trimethoprim
resistance-conferring mutations in the drug's target gene were constructed and phenotyped.
Incompatibilities between mutations arose in a high-order, not pairwise, manner. One
mutation was found to induce this ruggedness and create a multi-peaked adaptive landscape.
Professor Roy Kishony Adam Christopher Palmer
iv
Chapters 1 and 2 observed that non-optimal expression of a drug resistance gene or a
drug's target could compromise antibiotic resistance. Chapter 3 broadly characterizes non-
optimal gene expression under antibiotic treatment, using a functional genetic screen to
identify over one hundred pathways to antibiotic resistance through positive and negative
changes in gene expression. Genes with the potential to confer antibiotic resistance were
found to often go unused during antibiotic stress. The optimization of gene expression for
drug-free growth was found to cause non-optimal expression under drug treatment, creating
a situation where regulatory mutations can confer resistance by correcting errors in gene
expression.
Chapter 4 investigates whether it is beneficial to up-regulate the genes encoding
antibiotic targets when they are inhibited. Drug target genes were quantitatively over-
expressed, and drug resistance was found to not always increase, but alternatively to remain
unchanged or even decrease. These diverse effects were explained by simple models that
consider toxicity arising from gene over-expression, and mechanisms of drug action in which
drugs induce harmful enzymatic reactions.
v
Table of contents
Chapter 1.
Chemical decay of an antibiotic inverts selection for resistance ......................................... 1
Methods ....................................................................................................................................... 15
References .................................................................................................................................... 19
Chapter 2.
A multi-peaked adaptive landscape arising from high-order genetic interactions ....... 22
Methods ....................................................................................................................................... 44
References .................................................................................................................................... 48
Chapter 3.
Diverse pathways to drug resistance by changes in gene expression ............................... 50
Methods ....................................................................................................................................... 79
References .................................................................................................................................... 86
Chapter 4.
The dependence of antibiotic resistance on target expression .......................................... 89
Methods ..................................................................................................................................... 103
References .................................................................................................................................. 107
Supplementary Material.
Chapter 1 ................................................................................................................................... 110
Chapter 2 ................................................................................................................................... 128
Chapter 3 ................................................................................................................................... 130
Chapter 4 ................................................................................................................................... 154
References .................................................................................................................................. 177

vi
A cell can regulate some genes perfectly all of the time, and all genes perfectly some of the time,
but a cell can not regulate all genes perfectly all of the time.
-with apologies to Abraham Lincoln

1
Chapter 1.
Chemical decay of an antibiotic inverts selection for resistance
Adam C. Palmer1, Elaine Angelino1, Roy Kishony1,2
1Department of Systems Biology, Harvard Medical School, 200 Longwood Ave, Boston, MA 02115.
2School of Engineering and Applied Sciences, Harvard University, Cambridge, MA 02138.
Antibiotics are often unstable, decaying into a range of compounds with potential biological
activities. We found that as tetracycline degrades, the competitive advantage conferred to
bacteria by resistance to it not only diminishes, but reverses to become a prolonged
disadvantage due to the activities of more stable degradation products. Tetracycline decay
can therefore lead to net selection against resistance, which may help explain the puzzling
coexistence of sensitive and resistant strains in natural environments.
2
More than half of all known antibiotics are secreted by soil bacteria (Kieser et al., 2000),
mediating communication (Fajardo and Martinez, 2008; Linares et al., 2006; Yim et al., 2007),
metabolism (Dantas et al., 2008; Price-Whelan et al., 2006) and warfare (Walsh, 2003). While
resistance to these naturally-occurring antibiotics is prevalent in the soil environment, the
genes conferring resistance do not seem to take over and fixate in these natural populations;
instead resistant and sensitive bacterial strains coexist (D'Costa et al., 2006). It is therefore
likely that while antibiotics select for resistant strains, other natural mechanisms might exist
which select against resistance. Indeed, several natural chemicals are known to specifically
inhibit growth of strains resistant to certain antibiotics (Bochner et al., 1980; Halling-
Sorensen et al., 2002). The ability of any compound to select for or against resistance depends
not only on the selective pressure it exerts, but also on the duration of its activity, determined
by its chemical stability. Many antibiotics are short-lived in the natural environment; they
decay to an assortment of chemical species which may be more stable than the precursor
drug, and may therefore have significant ecological impacts. Thus, competition between
antibiotic resistant and sensitive strains may be influenced both by the short-term effect of an
antibiotic and by the potential long-term effects of its degradation products (Figure 1.1a).
Here we ask how the chemical decay of tetracycline influences selection for resistant strains.
Tetracycline is widely used clinically (Chopra et al., 1992) and agriculturally(Sarmah et al.,
2006), its major degradation pathway is well characterized (Yuen and Sokoloski, 1977), and
its decay products are found in soil, wastewater, and market tetracyclines (Jia et al., 2009;
Sarmah et al., 2006; Walton et al., 1970). One of its decay products, anhydrotetracycline, is
known to preferentially inhibit the growth of bacteria carrying the Tn10 tetracycline
3
resistance determinant, by binding the tetR regulator to induce expression of the costly tetA
efflux pump (Eckert and Beck, 1989; Lederer et al., 1996; Moyed et al., 1983; Nguyen et al.,
1989). We investigated the selective advantage/disadvantage of resistance throughout the
degradation process, by directly competing fluorescently labeled tetracycline resistant and
sensitive strains of Escherichia coli.
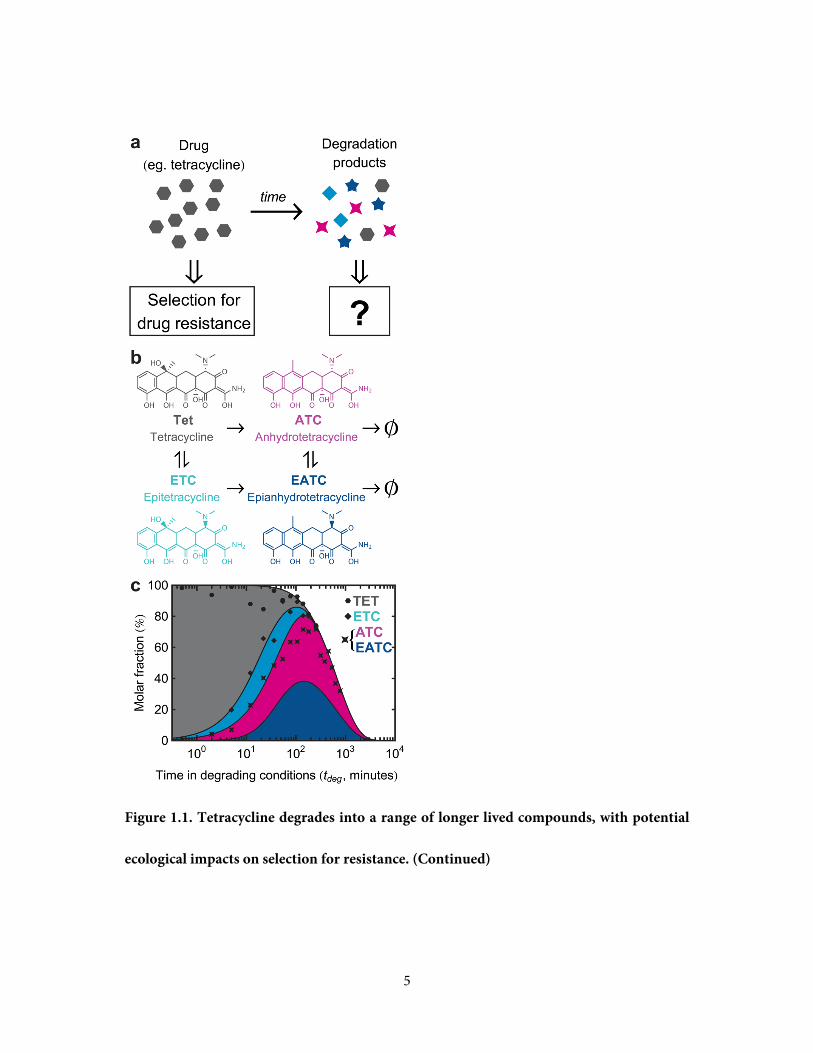
Tetracycline (Tet) undergoes reversible epimerization to epitetracycline (ETC) and also
irreversible dehydration to anhydrotetracycline (ATC), with both epimerization and
dehydration yielding epianhydrotetracycline (EATC) (Yuen and Sokoloski, 1977) (Figure
1.1b). To accelerate the degradation process to convenient timescales we exposed tetracycline
to phosphoric acid and high temperatures (Yuen and Sokoloski, 1977); Methods). At different
time-points of exposure to these degrading conditions (tdeg), samples of the chemical reaction
were taken and the reaction was stopped by shifting to neutral pH and freezing. To track the
abundance of tetracycline and its degradation products over time, we measured the
absorbance spectrum of each sample and compared it to the spectra of the individual
compounds (Supplementary Figure 1.1). A previously established kinetic model (Yuen and
Sokoloski, 1977), extended to account for the loss of the degradation products at very long
timescales, was fully consistent with the spectral data (Figure 1.1c; Methods and
Supplementary Figs. 1.2-1.4).
4
Figure 1.1. Tetracycline degrades into a range of longer lived compounds, with potential
ecological impacts on selection for resistance. a, While an antibiotic selects for strains
resistant to it, it is not clear what selective pressure is imposed by its soup of degradation
products. b, Tetracycline degrades into a range of bioactive compounds, which themselves
slowly decay further. c, Tetracycline decay products have different concentration profiles
through time. Degradation is accelerated by pH of 1.5 and temperature of 75°C (Yuen and
Sokoloski, 1977). Shaded areas in this stacked plot represent the kinetic model of (Yuen and
Sokoloski, 1977) with a correction for long-term decay (Methods). Points are estimated
fractions of Tet and its degradation products, obtained by fitting the spectra of pure
compounds to a spectrum of the degraded Tet solution at each individual timepoint
(Methods). ATC and EATC are not well distinguished spectrally, and so are plotted as their
sum. These fitted points confirm the consistency of our samples with the kinetic model of
(Yuen and Sokoloski, 1977).
5
Figure 1.1. Tetracycline degrades into a range of longer lived compounds, with potential
ecological impacts on selection for resistance. (Continued)

6
To measure the selective pressure for tetracycline resistance imposed by samples of Tet that
had been exposed to degrading conditions for different times, we used a fluorescence-based
competition assay between resistant and sensitive E. coli (Chait et al., 2007; Hegreness et al.,
2006). Matching Tet resistant (TetR) and sensitive (TetS) strains were generated by supplying
MG1655 with a plasmid carrying the tetR-tetA genes from the Tn10 transposon, or with the
non-resistant parental plasmid, respectively (Lenski et al., 1994). These TetS and TetR strains
were differentially labeled with chromosomally encoded cyan and yellow fluorescent proteins;
pairs of strains were constructed in both dye permutations. Direct competition between the
strains, as well as high-resolution measurements of their individual growth rates (Kishony
and Leibler, 2003; Yeh et al., 2006), showed equal fitness of the TetS and TetR strains in the
absence of Tet (Supplementary Figure 1.5). To measure selection for or against resistance,
TetS and TetR strains were mixed 1:1 in fresh media, a sample of untreated or degraded Tet
was added, and the cultures were grown overnight to stationary phase; the final ratio of
sensitive cell count (NTetS) to resistant cell count (NTet
R) was then measured by flow cytometry
(Figure 1.2a).
While Tet strongly selects in favor of resistance, we found that its cocktail of degradation
products actually shows selection in favor of sensitivity (Figure 1.2c,d, trajectory 1). Solutions
of Tet with little or no exposure to degrading conditions (tdeg < ~50 min), applied at high
concentrations (1000 ng/mL), strongly favored the growth of resistant bacteria. However,
following substantial degradation (tdeg > ~50 min), not only did the loss of Tet abolish
selection for resistance, but the accumulation of its degradation products caused strong
7
selection against resistance (Figure 1.2c,d, change from red to green along trajectory 1; similar
results are seen with chromosomally-integrated tetracycline resistance, in the presence of the
naturally occurring compound fusaric acid, Supplementary Figure 1.6). Importantly, while
the initial selection in favor of resistance was short lived, the subsequent selection in favor of
sensitivity lasted for much longer times, and had not weakened much even at the latest time
point of tdeg~450 min.
We consider the full ecological impact of an antibiotic as the selective pressure of the
antibiotic and its degradation products integrated over time. This integrated selective
pressure is represented by the area between the curve of the fold changes in log(NTetS / NTet
R)
and the line log(NTetS / NTet
R) =0 (no selection) (Figure 1.2d). When degradation is the primary
means of loss (trajectory 1), the initial selection for resistance by Tet is greatly outweighed by
the subsequent longer selection against resistance by more stable degradation products
(Figure 1.1c).
In a natural scenario, an initial drug dosage may not only be lost due to degradation, but also
due to dilution, or diffusion (Figure 1.2b). To account for dilution in addition to degradation,
we applied our TetR-TetS competition assay across a 2D gradient created by serial dilution of
each of the time samples of the degradation reaction (Figure 1.2c). Dilution of the drug and
its degradation products can profoundly affect the overall selection pressure: if Tet loss is
dominated by dilution, degradation products do not appear at substantial concentration and
so the selective pressure of the initial compound, Tet, is dominant, favoring resistance (Figure
8
1.2c,d, trajectory 3). In these conditions the net selection is in favor of resistance,
demonstrating that dilution can eliminate the ability of degradation products to invert the
selective pressure. Tet clearance in the clinical setting and in treatment of farm animals is
dominated by dilution rather than degradation (Kelly and Buyske, 1960), consistent with the
selective advantage of resistance in these settings (Levy et al., 1976).
More generally, we envision that in the environment a drug may be lost simultaneously by
both degradation and dilution. An environment initially containing a fixed dose of Tet will
then move through different chemical environments along a linear trajectory across Figure
1.2c, with a slope defined by the ratio between the dilution rate and the degradation rate
(-λdil/λdeg, where λdil, λdeg are the reciprocals of the drug’s half-life due to dilution and
degradation, respectively). We find that when both degradation and dilution are active,
selective pressure can vary over time in a complex non-monotonic manner. For example, in
trajectory 2 (Figure 1.2c,d), the initial selection in favor of resistance is followed by selection
against resistance, but then at low concentrations of degradation products weak selection in
favor of resistance returns. Since degradation products select in opposing directions
depending upon their concentration, net selection depends non-trivially upon both the
means of loss and the initial concentration of antibiotic (Supplementary Figure 1.7).
We next asked to what extent these complex trajectories of selective effects, exerted
throughout Tet decay, can be rationalized in terms of the individual selective pressures
exerted by the drug and each of its degradation products. We measured the effect on the TetS-
9
TetR competition imposed by Tet, ETC, ATC and EATC as a function of concentration
(Supplementary Figure 1.8). We found that each of the degradation products has a different
selective impact and that selection against resistance is mediated by ATC. This observation is
consistent with the known action of ATC as a strong inducer of the costly tet operon (Eckert
and Beck, 1989; Lederer et al., 1996) and adds to the growing evidence of signaling roles for
antibiotics (Goh et al., 2002; Linares et al., 2006; Yim et al., 2007). In principle, ‘non-additive’
interactions may be present in drug combinations, producing effects not explainable by the
sum of individual drug effects. We adopt the Bliss definition of additivity, where the effect of
drugs in combination is equal to the multiplication of their individual effects (Bliss, 1939). To
test for non-additive drug interactions, we measured selective pressures across a 2D gradient
of Tet vs. a 1:1 mixture of ATC and EATC, chosen to approximately represent the chemical
environments encountered following Tet decay (the epimerization is a relatively fast reaction
leading to nearly equal amounts of ATC and EATC at late times, Figure 1.1c). We found that
Bliss additivity reproduced all features of the measured 2D gradient, with quantitative
deviations only at high drug concentrations, suggesting that interactions amongst Tet and the
decay products ATC and EATC are primarily additive (Supplementary Figure 1.9).
An additive model of the selective pressures throughout Tet degradation and dilution was
then constructed from the kinetic model of chemical composition (Figure 1.1c,
Supplementary Figure 1.3) and the selective effects of each of the individual compounds
(Supplementary Figure 1.8). This additive model shows very good qualitative and quantitative
agreement with the measured selective pressures along trajectories 1, 2 and 3 (Figure 1.2d,

10
compare dashed line with filled area). Selection by Tet and its degradation products can
therefore be understood as the additive sum of the effects of each of the compounds.

11
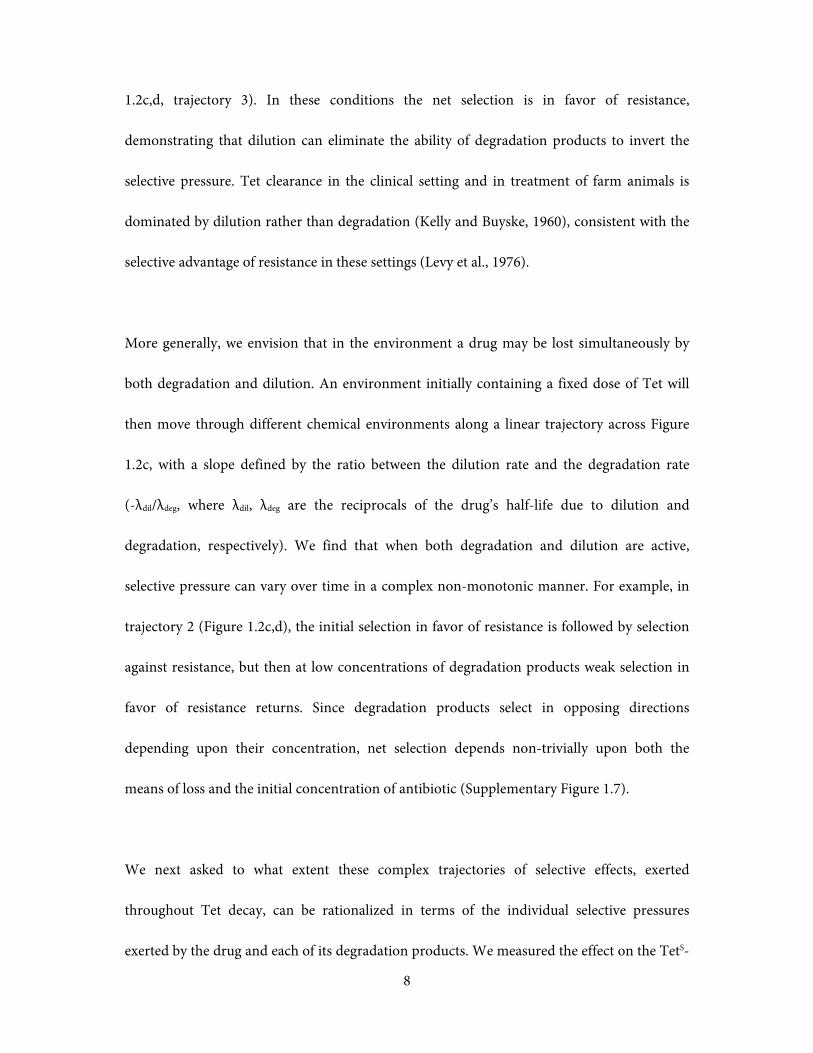
Figure 1.2. Tetracycline degradation inverts the overall selective advantage of resistant
strains. a, To measure selection for/against resistance by degraded tetracycline solution, a
sample of the degradation reaction is taken at timepoint tdeg and is added to a 1:1 mixture of
resistant (TetR) and sensitive (TetS) cells inoculated into fresh media. Fluorescent labels (YFP
or CFP) allow changes in the ratio NTetS / NTet
R to be measured by flow cytometry, after
overnight competition. b, Loss of the initial drug can occur by either degradation to alternate
compounds (across x-axis), or by dilution (down y-axis). c, Selective pressure in favor (red) or
against (green) resistance as a function of the degradation time tdeg and dilution (axes
definitions match panel b). Black points mark measurements, between which the color map is
interpolated. Numbered black lines are trajectories representing Tet loss by degradation alone
(1), dilution alone (3), or a combination of both with respective rates λdeg and λdil (2). d,
Selective pressure changes over time as Tet is lost along the three trajectories of panel c.
Shaded areas represent the integrated selective pressure in favor (red) or against (green)
resistance. The time axis is normalized by net rate of Tet loss (λdeg + λdil). Dotted black lines
are an additive model of selective pressure, constructed by summing the changes in log(NTetS /
NTetR) produced by each of the individual compounds (Supplementary Figure 1.8), given their
concentrations from the kinetic model of Tet decay (Figure 1.1c).
12
Figure 1.2. Tetracycline degradation inverts the overall selective advantage of resistant
strains. (Continued)
13
In the natural environment, antibiotics are not static - a single drug can decay into a range of
compounds, each accumulating and degrading with different kinetics and displaying different
selective effects. The simple additive sum of the effects of each of the degradation products
can lead to complex, non-monotonic, patterns of selections for and against resistance.
Consequently, the net evolutionary impact of a drug depends upon the manner of its eventual
loss from the environment. When Tet loss is dominated by degradation, the initial selection
for resistance by tetracycline can be substantially outbalanced by the prolonged selection
against resistance imposed by its longer lived degradation products. While these results were
demonstrated for accelerated degradation of tetracycline, they depend on relative, rather than
absolute, stabilities of the drug and its degradation products, and therefore may be of
relevance also to the natural environment. Interestingly, ATC is a biosynthetic precursor to
Tet in the drug producing microbes (McCormick et al., 1968), and induces Tet efflux pump
expression prior to the imminent production of the drug. This provides an evolutionary
rationale for non-toxic drug derivatives to be potent inducers of resistant genes. It will be
interesting to test the selective effect of decay of other drugs on various resistance
mechanisms and via multiple decay pathways; different decay pathways will produce different
metabolites, which could be affected by the environment and even by other surrounding
microbes (Dantas et al., 2008). Selection against resistance by antibiotic decay may help
explain the puzzling coexistence of antibiotic resistant and sensitive microbial strains in the
natural soil environment.
14
Acknowledgements
We thank R. Lenski for gift of plasmids, R. Chait, D. Kahne for helpful insights and R. Ward
and M. Elowitz for comments on the manuscript. This work was supported in part by the Bill
and Melinda Gates Foundation through the Grand Challenges Exploration Initiative, US
National Institutes of Health grant R01 GM081617 (to R.K.) and a George Murray
Scholarship (to A.C.P.)
Author Contributions
A.C.P., E.A. and R.K. designed research; A.C.P. performed research and analyzed data; A.C.P.
and R.K. wrote the manuscript.
15
Methods
Strains and Media
Fluorescently labeled strains MC4100-YFP and MC4100-CFP, described
previously(Hegreness et al., 2006), were transformed with plasmid pBT107-6A to create a Tet
resistant strain, or with the parent plasmid pACYC177 to create a Tet sensitive strain.
pBT107-6A carries the Tn10 tetracycline resistance determinant, with a tetA promoter down-
mutation which has been demonstrated to provide higher fitness in the presence of
10 μg.mL−1 Tet than either stronger or weaker promoters(Daniels and Bertrand, 1985; Lenski
et al., 1994).
All fitness measurements were performed in M63 minimal medium (2 g.L–1 (NH4)2SO4,
13.6 g.L–1 KH2PO4, 0.5 mg.L–1 FeSO4•7H2O) supplemented with 0.2% glucose, 0.1% casamino
acids, 1mM MgSO4 and 1.5 μM thiamine, and also 100 μg.mL–1 ampicillin and 50 μg.mL–1
kanamycin for the maintenance of pACYC177 based plasmids. Drug solutions were made
from powder stocks (Sigma, Vetranal analytical standard: tetracycline hydrochloride, #3174;
epitetracycline hydrochloride, #37918; anhydrotetracycline hydrochloride, #37919;
epianhydrotetracycline hydrochloride, #37921) dissolved in ethanol, with drug gradients
made by serial dilution in M63 medium.
16
Tetracycline degradation
Powdered tetracycline was dissolved in 1M phosphoric acid, pH 1.5, at 400μg/mL. Aliquots
were incubated at 75°C and transferred to ice at various time points. These frozen samples
were diluted 40× into M63 media for fitness assay, or into water for spectroscopy.
Spectroscopy and determination of chemical composition from spectra
All spectra were recorded at 10 μg/mL in aqueous solution, on a Cary 300 spectrophotometer
(Varian). The kinetic model of (Yuen and Sokoloski, 1977), modified to include a reaction for
the slow further decay of Tet degradation products with rate constant kloss, successfully fitted
the time series of spectra (Supplementary Figs. 2, 3) using all other rate constants as
previously measured by HPLC (Yuen and Sokoloski, 1977). Allowing all rate constants to be
simultaneously fitted to all spectra produces only a 2% reduction in the sum of square errors;
the previously measured parameters have values that minimize errors in the spectral
alignment, for all parameters for which a well defined minimum exists (Supplementary
Figure 1.4, Supplementary Table 1.1). Species concentrations were estimated from spectra at
individual timepoints (points in Figure 1.1c) by numerically searching for the local minimum
in alignment error over the characteristic wavelength ranges 250-290nm and 325-400nm,
starting from the composition predicted by the kinetic model; numerical minimization was
performed by the FindMinimum function of Mathematica 7.0 (Wolfram).

17
Competitive fitness assay
Selection between resistant and sensitive cells by a particular chemical environment was
measured by mixing stationary phase cultures of resistant and sensitive strains at 1:1 ratio,
and further diluting 1:100 into fresh media containing the chemical environment of interest.
Competitive growth occurred throughout 24 hours of growth with shaking at 30°C in clear,
flat bottomed 96-well plates (Corning #3595), sealed with adhesive lids (Perkin Elmer
#6005185). Sensitive and resistant cells were differentially labeled with a chromosomally
integrated YFP or CFP gene driven by the Plac promoter, which is constitutive in the lacI
strains used here. To obtain stronger fluorescence signals, the stationary phase cultures
obtained after 24 hours of competition were subcultured 1:100 into fresh drug-free media,
and grown as before for between 90 and 180 minutes, before the ratio of yellow to cyan
fluorescent cells was counted by flow cytometry (Becton Dickinson LSRII; CFP excited at
405nm, emission detected through 505LP and 525/550nm filters; YFP excited at 488nm,
emission also detected through 505LP and 525/550nm filters). Plating and colony counting of
selected wells confirmed that the final subculturing and brief growth did not alter the ratio
NTetS / NTet
R, within the margin of error of counting 200 - 500 colonies per plate. The selective
pressures presented in Figure 1.2c and Supplementary Figure 1.8 are the average of two
experiments, one where fluorescent labels were swapped between TetS and TetR strains. No
substantial difference was detected between dye-swaps, indicating that the use of differential
dyes does not influence NTetS / NTet
R ratio (Supplementary Figure 1.10). At least 16 wells per
plate were drug-free, for precise measurement of NTetS / NTet
R ratio in non-selective conditions.
18
The mean ratio NTetS / NTet
R (mean determined on log scale) in these drug-free wells provided
the reference point, determined separately for each plate, for the fold change in NTetS / NTet
R.
For Supplementary Figure 1.6, fusaric acid was applied uniformly across the plate, including
reference wells, such that any selection (changes in NTetS / NTet
R) due solely to fusaric acid is
removed in the normalization to reference wells. Thus, the selective effects seen in
Supplementary Figure 1.6 are due to tetracycline and its degradation products, or drug-drug
interactions between these compounds and fusaric acid. Sample flow cytometry data from
three points in Figure 1.2c are presented in Supplementary Figure 1.11, demonstrating
selection for, against, and neutral with respect to resistance.
Growth rate assay
TetS and TetR strains were transformed with a plasmid-borne, constitutively expressed
bacterial bioluminescence operon(Kishony and Leibler, 2003). Photon counting of growing
bioluminescent cultures allows precise measurements of cell densities over many orders of
magnitudes (e.g. Supplementary Figure 1.5). Cultured were grown in black 96-well plates
(Corning #3792) sealed with clear adhesive lids (Perkin Elmer #6005185). Readings were
made by a Perkin Elmer TopCount NXT Microplate Scintillation and Luminescence Counter,
stored in a 30°C room at 70% humidity, with duplicate 1 second readings per well. Wells
contained 100μL of media inoculated with approximately 10 to 100 cells from fresh -80°C
frozen cultures. Growth rate is the slope of the logarithm of photon counts per second (c.p.s.),
and is taken from the line of best fit spanning the fastest 5 doublings.
19
References
Bliss, C.I. (1939). The toxicity of poisons applied jointly. Ann Appl Biol 26, 585-615.
Bochner, B.R., Huang, H.C., Schieven, G.L., and Ames, B.N. (1980). Positive selection for loss of tetracycline resistance. J Bacteriol 143, 926-933.
Chait, R., Craney, A., and Kishony, R. (2007). Antibiotic interactions that select against resistance. Nature 446, 668--671.
Chopra, I., Hawkey, P.M., and Hinton, M. (1992). Tetracyclines, molecular and clinical aspects. J Antimicrob Chemother 29, 245-277.
D'Costa, V.M., McGrann, K.M., Hughes, D.W., and Wright, G.D. (2006). Sampling the antibiotic resistome. Science 311, 374--377.
Daniels, D.W., and Bertrand, K.P. (1985). Promoter mutations affecting divergent transcription in the Tn10 tetracycline resistance determinant. J Mol Biol 184, 599--610.
Dantas, G., Sommer, M.O., Oluwasegun, R.D., and Church, G.M. (2008). Bacteria subsisting on antibiotics. Science 320, 100-103.
Eckert, B., and Beck, C.F. (1989). Overproduction of transposon Tn10-encoded tetracycline resistance protein results in cell death and loss of membrane potential. J Bacteriol 171, 3557--3559.
Fajardo, A., and Martinez, J.L. (2008). Antibiotics as signals that trigger specific bacterial responses. Curr Opin Microbiol 11, 161-167.
Goh, E.B., Yim, G., Tsui, W., McClure, J., Surette, M.G., and Davies, J. (2002). Transcriptional modulation of bacterial gene expression by subinhibitory concentrations of antibiotics. Proc Natl Acad Sci U S A 99, 17025-17030.
Halling-Sorensen, B., Sengelov, G., and Tjornelund, J. (2002). Toxicity of tetracyclines and tetracycline degradation products to environmentally relevant bacteria, including selected tetracycline-resistant bacteria. Arch Environ Contam Toxicol 42, 263-271.
Hegreness, M., Shoresh, N., Hartl, D., and Kishony, R. (2006). An equivalence principle for the incorporation of favorable mutations in asexual populations. Science 311, 1615--1617.
20
Jia, A., Xiao, Y., Hu, J., Asami, M., and Kunikane, S. (2009). Simultaneous determination of tetracyclines and their degradation products in environmental waters by liquid chromatography-electrospray tandem mass spectrometry. J Chromatogr A 1216, 4655-4662.
Kelly, R.G., and Buyske, D.A. (1960). Metabolism of tetracycline in the rat and the dog. J Pharmacol Exp Ther 130, 144-149.
Kieser, T., Bibb, M.J., Buttner, M.J., Chater, K.F., and Hopwood, D.A. (2000). Practical Streptomyces Genetics, 1st edn (John Innes Foundation, Norwich, UK).
Kishony, R., and Leibler, S. (2003). Environmental stresses can alleviate the average deleterious effect of mutations. J Biol 2, 14.
Lederer, T., Kintrup, M., Takahashi, M., Sum, P.E., Ellestad, G.A., and Hillen, W. (1996). Tetracycline analogs affecting binding to Tn10-Encoded Tet repressor trigger the same mechanism of induction. Biochemistry 35, 7439--7446.
Lenski, R.E., Souza, V., Duong, L.P., Phan, Q.G., Nguyen, T.N., and Bertrand, K.P. (1994). Epistatic effects of promoter and repressor functions of the Tn10 tetracycline-resistance operon of the fitness of Escherichia coli. Mol Ecol 3, 127--135.
Levy, S.B., FitzGerald, G.B., and Macone, A.B. (1976). Changes in intestinal flora of farm personnel after introduction of a tetracycline-supplemented feed on a farm. N Engl J Med 295, 583--588.
Linares, J.F., Gustafsson, I., Baquero, F., and Martinez, J.L. (2006). Antibiotics as intermicrobial signaling agents instead of weapons. Proc Natl Acad Sci U S A 103, 19484-19489.
McCormick, J.R., Jensen, E.R., Johnson, S., and Sjolander, N.O. (1968). Biosynthesis of the tetracyclines. IX. 4-Aminodedimethylaminoanhydrodemethylchlortetracycline from a mutant of Streptomyces aureofaciens. J Am Chem Soc 90, 2201-2202.
Moyed, H.S., Nguyen, T.T., and Bertrand, K.P. (1983). Multicopy Tn10 tet plasmids confer sensitivity to induction of tet gene expression. J Bacteriol 155, 549--556.
Nguyen, T.N., Phan, Q.G., Duong, L.P., Bertrand, K.P., and Lenski, R.E. (1989). Effects of carriage and expression of the Tn10 tetracycline-resistance operon on the fitness of Escherichia coli K12. Mol Biol Evol 6, 213--225.
Price-Whelan, A., Dietrich, L.E., and Newman, D.K. (2006). Rethinking 'secondary' metabolism: physiological roles for phenazine antibiotics. Nat Chem Biol 2, 71-78.
21
Sarmah, A.K., Meyer, M.T., and Boxall, A.B. (2006). A global perspective on the use, sales, exposure pathways, occurrence, fate and effects of veterinary antibiotics (VAs) in the environment. Chemosphere 65, 725-759.
Walsh, C. (2003). Antibiotics : actions, origins, resistance (Washington, D.C.: ASM Press).
Walton, V.C., Howlett, M.R., and Selzer, G.B. (1970). Anhydrotetracycline and 4-epianhydrotetracycline in market tetracyclines and aged tetracycline products. J Pharm Sci 59, 1160-1164.
Yeh, P., Tschumi, A.I., and Kishony, R. (2006). Functional classification of drugs by properties of their pairwise interactions. Nat Genet 38, 489--494.
Yim, G., Wang, H.H., and Davies, J. (2007). Antibiotics as signalling molecules. Philos Trans R Soc Lond B Biol Sci 362, 1195-1200.
Yuen, P.H., and Sokoloski, T.D. (1977). Kinetics of concomitant degradation of tetracycline to epitetracycline, anhydrotetracycline, and epianhydrotetracycline in acid phosphate solution. J Pharm Sci 66, 1648--1650.
22
Chapter 2.
A multi-peaked adaptive landscape arising from high-order genetic
interactions
Adam C. Palmer1,¶, Erdal Toprak1, 2, ¶, Seungsoo Kim3, Adrian Veres3, Shimon Bershtein4,
Roy Kishony1,5
1Department of Systems Biology, Harvard Medical School, 200 Longwood Ave, Boston, MA 02115.
2Faculty of Engineering and Natural Sciences, Sabanci University, Istanbul, Turkey
3Faculty of Arts and Sciences, Harvard University, Cambridge, MA 02138.
4Department of Chemistry and Chemical Biology, Harvard University, Cambridge, MA 02138.
5School of Engineering and Applied Sciences, Harvard University, Cambridge, MA 02138.
¶These authors contributed equally to this work.
Multiple sets of mutations can arise under antibiotic selection, all producing strongly drug-
resistant genotypes. We investigated the genetic interactions that separate adaptive peaks, by
constructing and characterizing all combinatorial sets of trimethoprim resistance-conferring
mutations in the DHFR gene, drawn from the results of parallel evolution experiments. The
resulting adaptive landscape is almost maximally rugged, with direct and indirect
evolutionary trajectories leading to multiple distinct peaks. Pairwise interactions could not
explain the existence of multiple peaks, but rather, high-order genetic interactions were
23
responsible for a rugged and multi-peaked adaptive landscape. One mutation could
profoundly influence the course of evolution: its presence or absence strongly altered the
ruggedness or smoothness of the adaptive landscape. High-order genetic interactions
constrain but do not confound the evolution of antibiotic resistance: evolution can always
find a way to a highly drug-resistant genotype.
24
Antibiotic resistance can evolve through the sequential accumulation of multiple resistance-
conferring mutations in a single gene (Lozovsky et al., 2009; Toprak et al., 2012; Weinreich et
al., 2006). These evolutionary pathways have been studied by examining the feasibility of all
possible genotypic transitions leading from the ancestor to the evolved drug resistant
genotype. Across different experimental systems, these studies have observed that only a
limited number of pathways lead to a single adaptive genotype (Lozovsky et al., 2009;
Weinreich et al., 2006). However, since these studies examined sets of mutations drawn from
a single adaptive genotype, it is known a priori that it is ultimately beneficial to acquire all
mutations, even though the sequence of acquisition may be constrained. However, in a recent
laboratory evolution experiment where five isogenic, drug-sensitive Escherichia coli
populations were evolved in parallel under dynamically sustained trimethoprim selection,
multiple distinct genotypes that shared similar drug resistant phenotypes were observed
(Toprak et al., 2012). Across all replicate experiments a total of six types of mutations were
observed in the dihydrofolate reductase (DHFR) gene (five amino acids were mutated and
the DHFR promoter was mutated), but each evolving population accumulated a total of four
of these mutations. Furthermore, the evolutionary trajectories had significant similarities: of
five drug-adapted cultures, there were two pairs of genotypes that contained the same set of
mutated residues. This observation suggests that some combinations of mutations were
superior to others, and yet the different final adaptive genotypes reached remarkably similar
levels of trimethoprim resistance. We sought to understand the nature of the genotypic
landscape that produces multiple adaptive genotypes sharing a common drug-resistant
phenotype.
25
To map genotype to phenotype, we constructed and characterized all combinatorial sets of
the six types of trimethoprim resistance-conferring mutations previously observed in DHFR
(Toprak et al., 2012). We studied the effects of one promoter mutation (-35C>T, position
indicated relative to the transcription start site) and five mutated amino acids; one site had
been observed to have two different amino acid changes in different adaptive genotypes,
making for six mutations in total: P21L, A26T, L28R, W30G, W30R, and I94L (Figure 2.1a).
All combinations amounted to 96 possible variants of DHFR (25×31), which were synthesized
and recombined into the E.coli chomosome in place of the wildtype DHFR gene (Methods)
(Bershtein et al., 2012; Datsenko and Wanner, 2000). We were unable to generate 6 mutant
strains out of 96 despite repeated attempts; we hypothesize that these particular combinations
of mutations in an essential gene may be unviable (Supplementary Figure 2.1). The
trimethoprim resistance of the mutant strains was quantified by measuring all strains’ growth
rates across a gradient of trimethoprim concentrations (Figure 2.1b and Supplementary
Figure 2.1). Each mutant strain was characterized by two parameters derived from these
measurements: r0 is the growth rate in the absence of drug, and IC50 is the trimethoprim
concentration that inhibits growth to 50% of the uninhibited wildtype growth rate (r0WT/2)
(Figure 2.1c). From this network of genotypes and their associated growth rates in
trimethoprim we assembled the adaptive landscape of trimethoprim resistance (Figure 2.1d).
Amongst each set of genotypes with the same overall number of mutations, a wide
distribution in trimethoprim resistance was observed. Although each mutation conferred
significantly increased trimethoprim resistance when acquired on a wildtype background,
many combinations of two to five mutations generated approximately wildtype susceptibility

26
to trimethoprim. This indicates the presence of strong genetic interactions, in particular 'sign
epistasis', where a mutation that is beneficial when it arises on one genetic background is
deleterious when acquired on a different genetic background.
27
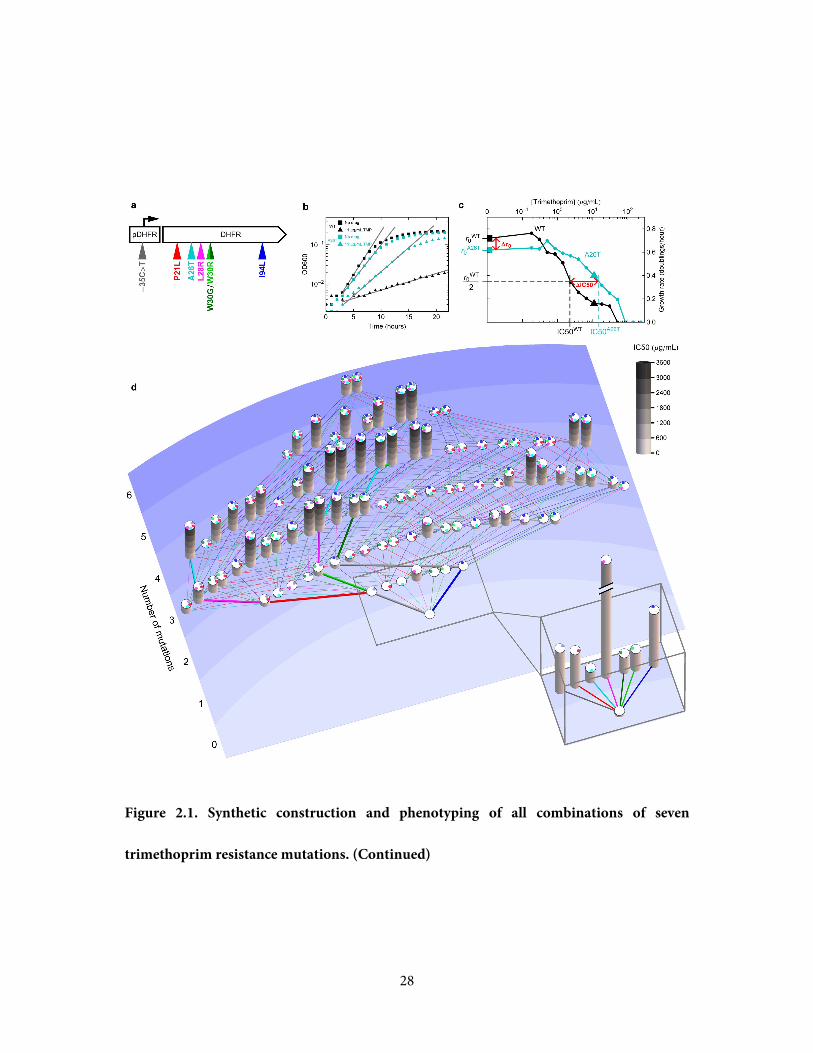
Figure 2.1. Synthetic construction and phenotyping of all combinations of seven
trimethoprim resistance mutations. a, Trimethoprim resistance can be conferred by any of
seven different mutations in the target of trimethoprim, DHFR. Each combination of these
mutations was synthesized and recombined into the E.coli DHFR gene. b, The growth rate of
each mutant strain was measured in liquid cultures spanning a range of trimethoprim (TMP)
concentrations. Growth rate is the slope of a linear fit to log(OD600) over time (gray lines). c,
Fitness costs of mutations are measured by the growth rate in the absence of trimethoprim
(r0). The trimethoprim concentration that inhibits growth to 50% of the wildtype growth rate
(IC50) is the intersection of the inhibition curve with the horizontal line where growth
rate = r0WT / 2. The growth rates marked by squares (no drug) and triangles (11 μg/mL TMP)
are derived from the growing cultures shown in Figure 2.1b. d, Mutant strains are distributed
in rows sorted by number of mutations. Each mutant's genotype is represented by colored
circles atop a column (see colors in Figure 2.1a) whose height is proportional to the
trimethoprim resistance (IC50) of that genotype. Each gain of mutation throughout the
network of genotypes is shown as a line colored by the mutation gained; the series of thick
lines starting at wildtype are adaptive trajectories observed in a long-term evolution
experiment (Toprak et al., 2012). The trimethoprim resistance of the wildtype strain and each
single mutant is shown in a vertically enlarged box for contrast.
28
Figure 2.1. Synthetic construction and phenotyping of all combinations of seven
trimethoprim resistance mutations. (Continued)

29
We investigated the prevalence of fitness costs in the evolution of trimethoprim resistance by
determining the correlation between growth rates in the absence of drug (r0) and either the
number of mutations, or the level of trimethoprim resistance (IC50) (Figure 2.2). While the
fitness r0 declined with an increasing number of mutations (r = −0.41, P<10−4), there was no
correlation between fitness and IC50 (r = −0.02 against log(IC50), P = 0.8). Indeed, many
combinations of mutations produced high trimethoprim resistance with no significant fitness
cost, and some other combinations of mutations were not particularly resistant but did incur
large costs to fitness. Thus, while drug resistance mutations may compromise native protein
function and incur fitness costs, such fitness costs are not an inevitable consequence of drug
resistance, because selected combinations of mutations can ameliorate one another's
deleterious effects and compensate for fitness costs. These observations in E.coli are
consistent with a previous study of the evolution of pyrimethamine resistance through
multiple mutations in the dihydrofolate reductase gene of Plasmodium falciparum (Brown et
al., 2010).

30
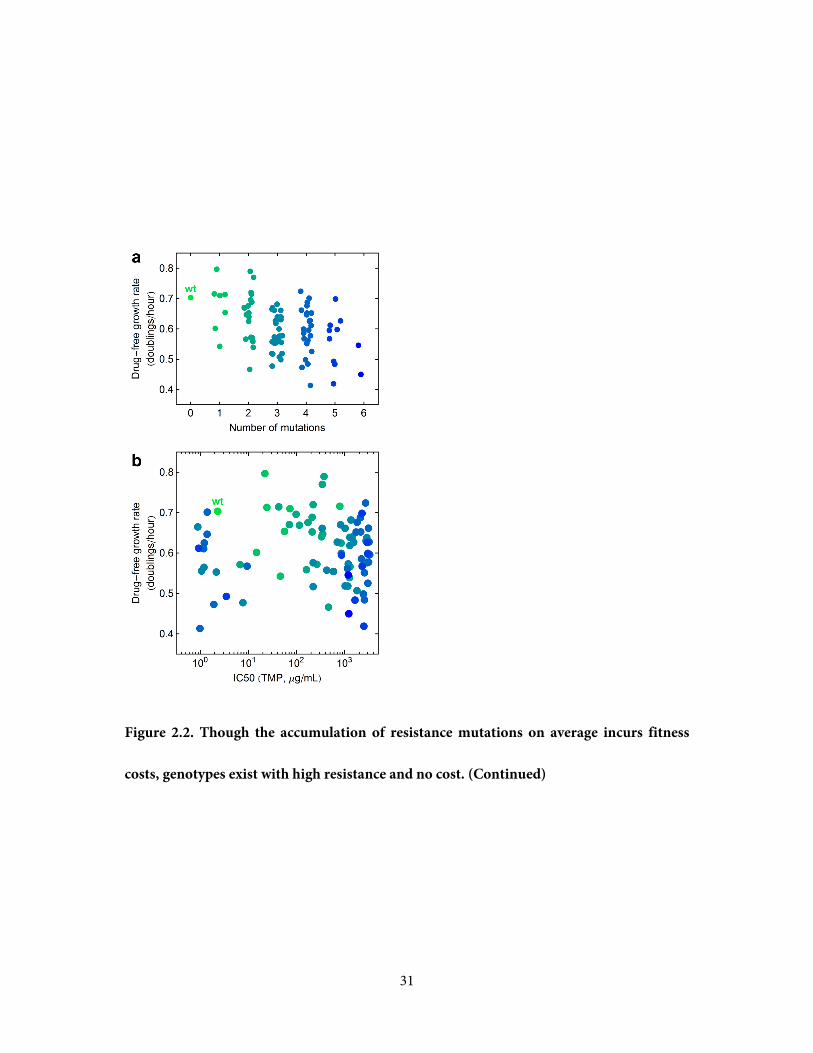
Figure 2.2. Though the accumulation of resistance mutations on average incurs fitness
costs, genotypes exist with high resistance and no cost. a, Fitness costs of mutations are
assessed by the growth rate in the absence of trimethoprim, and are seen to gradually accrue
with increasing numbers of mutations. Each point is a genotype positioned by its number of
mutations and drug-free growth rate; points are color coded green to blue by the number of
mutations, and a small horizontal scatter is added to improve the visibility of overlapping
data. b, Each point is a genotype positioned by its trimethoprim resistance (IC50) and drug-
free growth rate (no added scatter), color coded by the same scheme as Figure 2.2a. Because
of the existence of highly resistant genotypes with no fitness cost, and also weakly resistant
genotypes with significant fitness costs, IC50 does not correlate negatively or positively with
growth rate in the absence of trimethoprim.
31
Figure 2.2. Though the accumulation of resistance mutations on average incurs fitness
costs, genotypes exist with high resistance and no cost. (Continued)
32
We examined how evolving populations might move through this landscape by evaluating all
possible adaptive trajectories. We find 423 possible trajectories along which new mutations
may be gained, previously acquired mutations may be lost, or an existing mutation can
convert to a different (non-ancestral) mutation at the same locus; this latter option is possible
at W30 where two different drug resistance alleles were observed in evolutionary experiments
(Toprak et al., 2012). Every step in these 423 trajectories continuously improves IC50; neither
drift nor transient decreases in resistance are permitted, and so they terminate at locally
adaptive peaks. Examining the mutations that are acquired, and possibly lost, along these
trajectories, we find that only the promoter mutation (−35C>T) is always acquired, and all
but one of the amino acid changing mutations has some probability of being acquired and
subsequently lost or converted in the process of adaption to trimethoprim (Figure 2.3a).
These instances of mutational reversions must arise from sign epistasis, and demonstrate that
strong negative genetic interactions produce a landscape on which both direct and indirect
paths can be taken to adaptive peaks. These observations are supported by the observation of
indirect adaptive trajectories in the experimental evolution studies that identified this set of
mutations (Toprak et al., 2012), and are consistent with the fitness landscape of the TEM-1
β-lactamase which also produces indirect adaptive trajectories (DePristo et al., 2007).
It is unclear whether evolutionary trajectories in a rugged, multi-peaked adaptive landscape
are guaranteed to find a path to a highly adaptive peak, or whether evolution might be
trapped at local optima (Poelwijk et al., 2007). The rugged and multi-peaked landscape of
trimethoprim resistance through mutations in DHFR allows us to address this question. For
33
each genotype we asked what is the most advantageous step (best change in IC50) accessible
from that genotype? Genotypes have neighbours that are accessible by gaining, losing, or
converting a mutation; for example, a genotype with four mutations (Figure 2.3b, pillar at
center) can make seven possible genetic changes, including two gains of mutation, four losses
of mutation, and possibly a conversion of a mutation. In the example in Figure 2.3b, only two
changes can improve trimethoprim resistance: either loss of P21L or conversion of W30G to
W30R, with the latter being the most advantageous step. The best possible improvement in
IC50 from each genotype is plotted as a function of that genotype's initial IC50 (Figure 2.3c,
black points), and when the best step is not to gain a mutation, we also show what the best
step would be if only the gain of mutations was permitted (Figure 2.3c, orange points show
best possible gain when this is an inferior option to a loss or conversion). We found that the
best possible steps starting from low resistance were very large, and with increasing levels of
initial resistance, the best possible steps became smaller in proportion to the reduced
difference between the initial IC50 and the largest observed IC50. Any genotype where the
best possible step is negative is a local optima within this set of mutations, since no further
change in genotype can improve resistance - it is these points that may reveal the existence of
'evolutionary dead-ends'. This landscape contained seven adaptive peaks, all carrying 4
mutations, where no further gain, loss or conversion of mutations could improve resistance
(Figure 2.3c, blue points). These genotypes can be thought of as three truly distinct peaks: two
genotypes that are not neighbours of any other peaks (Figure 2.3d, two genotypes to far
right), and a set of five genotypes that are connected by almost neutral drift through two
other genotypes that carry 5 mutations (Figure 2.3d, connected set of genotypes). At many
34
genotypes the best possible gain of a new mutation confers less improvement in resistance
than is possible by loss or conversion of a previously held mutation. In particular, many of
these genotypes would be a local optimum if there were not advantageous steps out of these
states through the loss or conversion of mutations. Thus, this adaptive landscape would be
difficult to navigate by only gaining mutations: evolutionary trajectories could be trapped by
many local optima, but these evolutionary 'dead-ends' are escaped by beneficial losses or
conversions of mutations. Strong genetic interactions are thus the antidote to their own
poison: sign epistasis can give rise to genotypes where the further gain of usually beneficial
mutations is instead deleterious, but sign epistasis also acts upon previously acquired and
previously beneficial mutations to make their loss or conversion a beneficial step facilitating
continued adaptation.
35
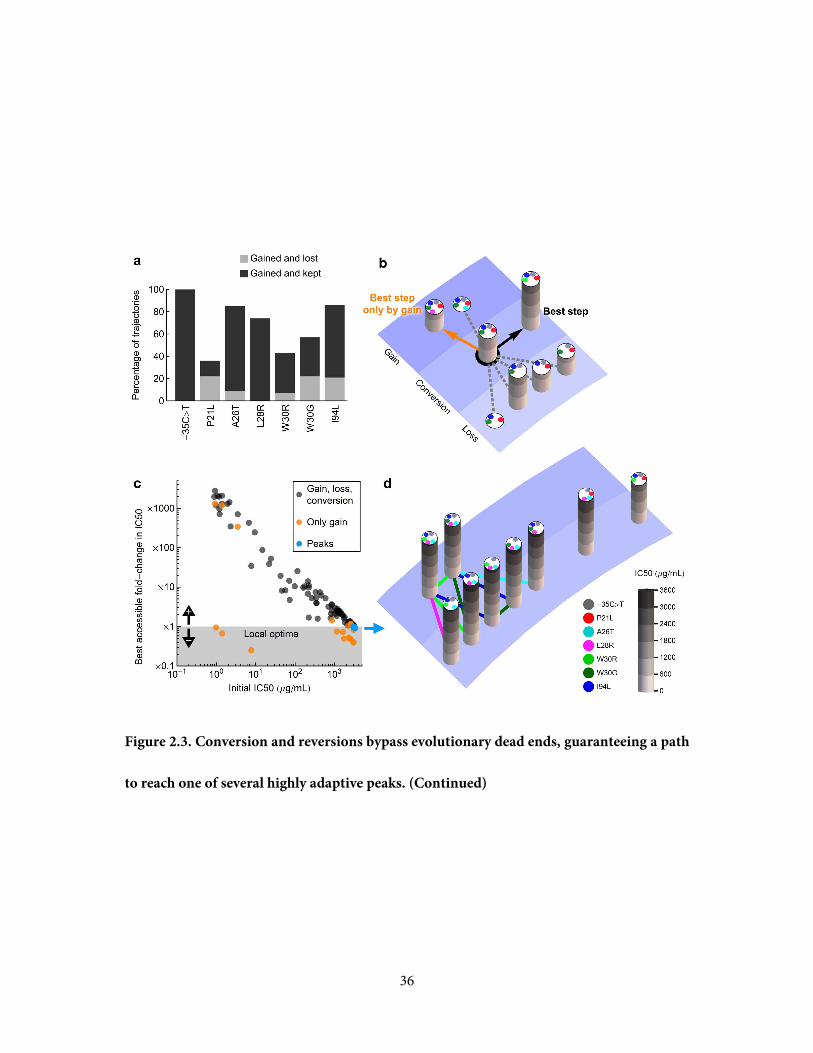
Figure 2.3. Conversion and reversions bypass evolutionary dead ends, guaranteeing a path
to reach one of several highly adaptive peaks. a, Simulated evolutionary trajectories over the
adaptive landscape of DHFR (Figure 2.1d) show that when evolving trimethoprim resistance,
it can be advantageous to lose a previously acquired 'resistance' mutation. b, Genotypes can
change by the gain, loss, or conversion of mutations. Starting from the genotype encircled in
black, the best possible improvement in IC50 is shown as a black arrow. Alternatively, one
can evaluate the accessibility of the landscape if only the gain of new mutations is permitted;
the best gain of mutation is shown as an orange arrow, which in this example lowers
resistance. c, Determining the best possible improvement in IC50 shows that significant steps
towards the maximum trimethoprim resistance are possible from all genotypes, provided that
gain, loss, or conversion of mutations are permitted (black points). For genotypes where the
best step is a loss or conversion of a mutation, the inferior option presented by only gaining
new mutations is shown in orange. Orange points within the gray zone (below '×1' change in
IC50) would be local optima, where an evolving population could be trapped at intermediate
trimethoprim resistance, if it were not for escape by the loss or conversion of mutations. True
peaks (blue points) are genotypes where no further gain, loss, or conversion of mutations can
improve IC50. d, Seven genotypes each with 4 mutations are adaptive peaks. Five of these can
be conceived of as a single 'adaptive plateau' (genotypes on left side) since they are connected
through almost neutral transitions to two genotypes with 5 mutations (colored lines indicate
the mutations gained or lost in these transitions). No pair of mutated sites is intrinsically
incompatible - every possible pair co-exists in an adaptive peak.
36
Figure 2.3. Conversion and reversions bypass evolutionary dead ends, guaranteeing a path
to reach one of several highly adaptive peaks. (Continued)
37
We next investigated the genetic interactions that produce distinct adaptive peaks. It can be
proven mathematically that an adaptive landscape can only contain multiple peaks in the
presence of peak-separating 'reciprocal sign epistasis', where two mutations (e.g. A → a and
B → b) each change the sign of their effect when applied together; i.e. the transition AB → aB
has an opposite effect to Ab → ab, and AB → Ab also has an opposite effect to aB → ab. This
scenario is necessary to create losses of fitness along all genetic paths between two adaptive
peaks, without which there would only be a single adaptive peak (Poelwijk et al., 2011). The
separation of adaptive peaks by reciprocal sign epistasis has been previous observed as arising
from pairwise incompatibility between two mutations; i.e. mutations a and b are individually
beneficial, but deleterious when applied in combination. This interaction creates two separate
evolutionary lineages, one with a and one with b, leading to separate adaptive peaks (Kvitek
and Sherlock, 2011; Salverda et al., 2011). However, simple pairwise incompatibility cannot
explain the multiple adaptive peaks observed in this landscape, because each possible pair of
mutations is found to co-occur in an adaptive peak (Figure 2.3c). Since there are no
intrinsically incompatible pairs of mutations, the genetic interactions that separate adaptive
peaks must be more complex in nature.
Inspecting the genetic interactions between pairs of mutations revealed high-order genetic
interactions where a given pair of mutations could display a variety of qualitatively different
interactions with each other, depending upon the presence of yet other mutations (Figure
2.4a). 'Ruggedness' is the propensity for genetic interactions to change the sign of a mutation's

38
phenotypic effect (from advantageous to deleterious or vice versa); to understand the
ruggedness of this adaptive landscape we investigated higher-order interactions by
quantifying how each mutation affects the interactions amongst all other mutations. We
defined a metric for ruggedness where each mutation i is assigned an information entropy Hi,
calculated from the probability that acquiring the mutation has a beneficial (p+) or deleterious
(p−) effect, over all possible genotypes on which it could be acquired: Hi = −p+.ln(p+)
−p−.ln(p−). The overall ruggedness is the sum of each mutation's information entropy (∑i Hi).
When the IC50s of two neighboring genotypes are within experimental error (Methods), we
regard this as a neutral transition that does not contribute to the calculation of ruggedness.
This definition permits that even if some mutations are beneficial and some are deleterious,
the ruggedness is 0 provided each mutation is always beneficial or neutral, or always
deleterious or neutral. Ruggedness is maximized when every mutation has equal chance of
being beneficial or deleterious. Strikingly, by this metric the adaptive landscape as a whole
(Figure 2.1d) is 83% as rugged as the theoretical maximum. For each mutation, ruggedness
was calculated for the subset of the adaptive landscape lacking that mutation, and over the
subset of the landscape always possessing that mutation (Figure 2.4b). For four mutations
(−35C>T, A26T, W30R, I94L) their presence or absence had no effect on ruggedness, two
mutations (L28R, W30G) modestly increased ruggedness when present, and one mutation,
P21L, was the largest contributor: its presence nearly doubled ruggedness (49% vs. 90% of the
theoretical maximum). Importantly, P21L is not simply incompatible with other mutations;
P21L exists together with every other type of mutation in adaptive peaks, whose resistance
would (by definition) decrease if P21L reverted to wildtype (Figure 2.3d). Rather, the presence

39
of P21L dramatically increases the likelihood that acquiring other commonly beneficial
mutations will instead be deleterious (Figure 2.4b). We viewed the relation between IC50 and
number of mutations, with or without P21L, to investigate how this ruggedness-inducing
mutation affects the evolutionary process. Without P21L the maximum possible resistance
increases rapidly at first before reaching a peak at certain combinations of 4 mutations, and
including all 5 mutations besides P21L is approximately equal in resistance to the peak
(Figure 2.4c, Figure 2.3d). This 'diminishing returns' epistasis is consistent with other studies
of interactions between advantageous mutations, and may be a general property of adaptive
evolution (Chou et al., 2011; Khan et al., 2011). However, in the presence of P21L the
continued accrual of 'trimethoprim-resistance' mutations generates worse than diminishing
returns: after resistance reaches a maximum at a combination of 4 mutations, the resistance
of any set of 5 or 6 mutations is lower (Figure 2.4c). Similarly, many combinations of 3 to 5
mutations that include P21L produce lower trimethoprim resistance than is found with any
single mutation.

40
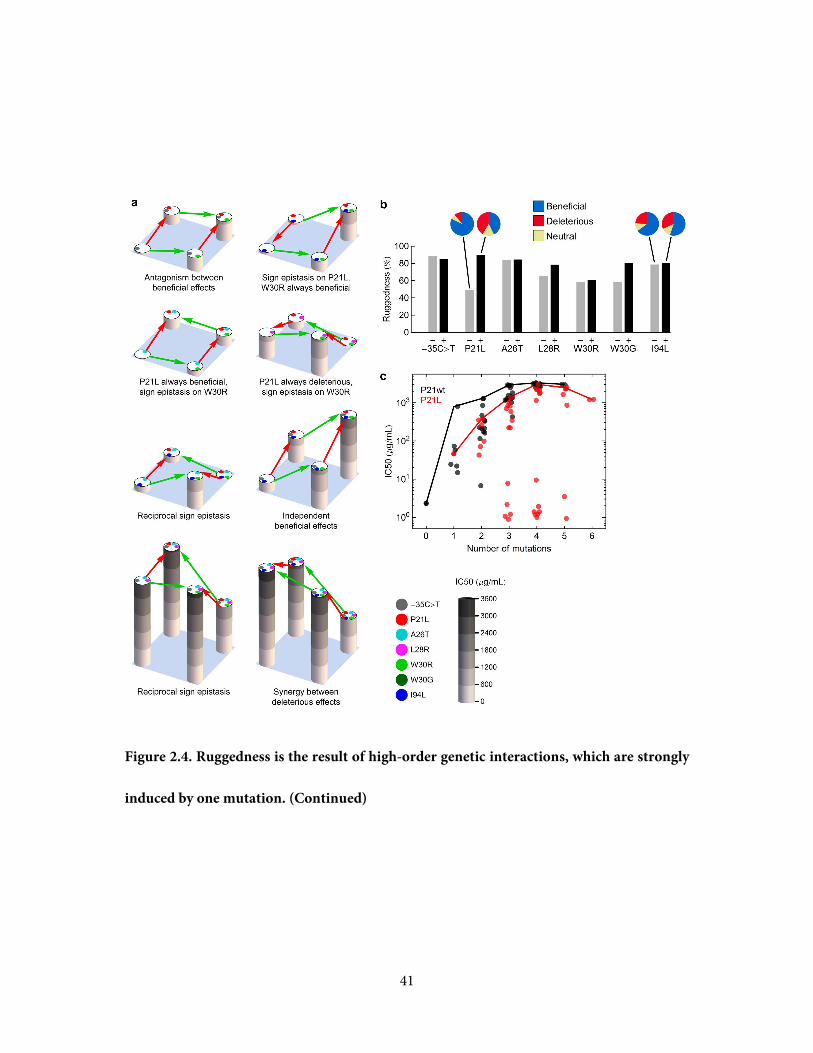
Figure 2.4. Ruggedness is the result of high-order genetic interactions, which are strongly
induced by one mutation. a, P21L (red) and W30R (green) possess widely varying genetic
interactions with one another when acquired on different genetic backgrounds. Mutations are
indicated by colored dots and column height represents trimethoprim resistance (IC50). Red
and green arrows point in the favorable direction for gaining or losing the P21L or W30R
mutations, respectively. b, Ruggedness is calculated from the information entropy of
mutations' effects: zero when each mutation's effect has a consistent sign, and maximised
when each mutation has equal chance of being beneficial or deleterious. Calculating
ruggedness from subsets of the adaptive landscape that excluding or including each mutation
reveals that P21L is most responsible for ruggedness; when absent, other mutations are rarely
deleterious, but when present, beneficial or deleterious effects are equally probable (pie charts
over P21L). In contrast the presence or absence of I94L, for example, does not substantially
alter the probability that other mutations are beneficial or deleterious (pie charts over I94L).
c, Without P21L, trimethoprim resistance evolves with diminishing returns: fold-increases in
IC50 become progressively smaller, until the addition of further 'resistance' mutations makes
no significant change to resistance. Adaptation in the presence of P21L is much more rugged:
acquiring fifth or sixth 'resistance' mutations lowers resistance from the peak, and many
genotypes of 3 to 5 mutations are almost equally or even more susceptible to trimethoprim
than wildtype. Solid red and black lines show the maximum level of trimethoprim resistance
obtained with a given number of mutations (with or without P21L respectively). Points are
shown with a small horizontal scatter to improve the visibility of overlapping data.
41
Figure 2.4. Ruggedness is the result of high-order genetic interactions, which are strongly
induced by one mutation. (Continued)

42
The evolution of trimethoprim resistance through mutations in the drug's target DHFR is
characterized by erratic genetic interactions. Adaptive pathways can take indirect paths,
gaining, losing, or converting mutations along the way to any of several adaptive peaks. These
multiple adaptive peaks are separated not by consistent pairwise incompatibilities between
mutations, but by high-order genetic interactions where the genetic interaction between a
pair of mutations widely varies depending on other mutations in the background genotype.
One mutation has the ability to induce a level of ruggedness that is close to the theoretical
maximum, giving rise to 'worse than diminishing' returns that prevent the continued gain of
otherwise advantageous mutations. Despite these effects, indirect mutational paths can
circumvent dips in fitness and thereby guarantee evolving populations a path to a highly
drug-resistant genotype.
43
Acknowledgements
We thank Nathan D. Lord for gift of a strain, and Ilan Wapinksi and Dirk Landgraf for
technical assistance. This work was supported in part by grants from the US National
Institutes of Health (GM081617), The New England Regional Center of Excellence for
Biodefense and Emerging Infectious Diseases (AI057159), and the Novartis Institutes for
BioMedical Research.
Author Contributions
E.T., S.K., A.V. and S.B. performed experiments; A.C.P., E.T. and R.K. analyzed data and
wrote the manuscript.
44
Methods
Strains and media
All DHFR mutant strains were constructed in MG1655 attTn7::pRNA1-tdCherry (gift from
N.D. Lord). Growth rate measurements were performed in M9 minimal medium (6 g.L–1
Na2HPO4, 3 g.L–1 KH2PO4, 1 g.L–1 NH4Cl, 0.5 g.L–1 NaCl, 3 mg.L–1 CaCl2) supplemented with
0.4% glucose, 0.2% casamino acids, and 1mM MgSO4. Drug solutions were made from
powder stock (Sigma Aldrich: chloramphenicol, C0378; kanamycin, K1876; trimethoprim,
T7883).
Chromosomal Integration
Mutant DHFR strains were constructed by replacing the endogenous (coding and noncoding
regions) of the DHFR gene with chemically synthesized mutant DHFR sequences, following
the method of (Datsenko and Wanner, 2000) specifically adapted for DHFR (Bershtein et al.,
2012). Briefly, mutant DHFR genes, including the native DHFR promoter, were synthesized
and cloned into a plasmid with flanking kanamycin and chloramphenicol resistance genes.
The integration cassette was PCR-amplified with primers possessing 60 nucleotide homology
to the genes immediately upstream (kefC) and downstream (apaH) of DHFR in the E.coli
chromosome. PCR products were DpnI digested (New England Biolabs, R0176) and
45
electroporated into strains carrying the lambda Red recombinase expression plasmid pKD46
(Datsenko and Wanner, 2000). Integrants were selected on Lysogeny Broth (LB) agar with 30
mg.L–1 kanamycin and 25 mg.L–1 chloramphenicol. Colony purification at 42°C removed the
pKD46 plasmid, which was confirmed by a failure to grow on LB agar with 100 mg.L–1
ampicillin. Single colonies were Sanger sequenced to verify the sequence of the mutated
DHFR locus. Mutated DHFR genes were transduced by phage P1 into naive MG1655
attTn7::pRNA1-tdCherry, transductants were selected on LB agar with kanamycin and
chlorampenicol, and single transductant colonies were sequenced to again confirm the
mutated DHFR sequence. Gene synthesis services were provided by GenScript, and DNA
sequencing services were provided by GENEWIZ.
Phenotyping assay
Frozen stocks of all mutant strains were prepared in one master 96-well plate (LB with 15%
glycerol). Approximately 0.3μL of each frozen stock was transferred by a pin replicator (V&P
Scientific, VP408) to the corresponding wells of a range of 96-well plates, with 150μL of M9
minimal media per well. Each of these plates possessed one trimethoprim concentration out
of a 23-point range from 0.2 to 3000 μg.mL–1, plus duplicate cultures with no trimethoprim.
Plates were incubated with shaking at 30°C and 70% humidity in an environmental room,
and each well’s optical density at 600nm (OD600) was measured every 60 minutes. To more
precisely measure growth rate in the absence of drug, the assay was repeated with fewer plates
(duplicate cultures with no trimethoprim) and more frequent measurements (every 15
46
minutes); additionally growth was measured at 3600 μg.mL–1 trimethoprim to verify that this
concentration inhibited the growth of all mutant strains.
Growth rate and IC50 determination
A background optical density of 0.03 units was subtracted from each OD600 measurement,
based upon the optical density of a control empty well present in all assays. Along the
experimentally measured functions of log(OD600) over time, linear fits were made to each
series of four data points (four hours of growth). A time series of growth rates was
constructed from the slopes of these linear fits, which was then smoothed by a median filter
(median of 3 consecutive growth rates). The most rapid growth rate of this median-smoothed
series was taken as the growth rate of that culture at that trimethoprim concentration. For the
more frequently measured cultures with no trimethoprim, the same protocol was applied
except that linear fits were made to every 7 consecutive log(OD600) measurements, and the
median filter was taken over 5 consecutive growth rates.
The trimethoprim resistance of each strain was quantified by the IC50, as calculated from the
function of growth rate versis trimethoprim concentrations. Specifically, linear interpolations
of growth vs log([trimethoprim]) were constructed, and IC50 was calculated as the largest
trimethoprim concentration at which this linear interpolation of growth rate was equal to half
of the uninhibited wildtype growth rate (half of 0.7 doublings/hour = 0.35 doublings/hour).
47
To quantify the experimental error in IC50 measurements, a distribution of IC50 estimates
was acquired by performing the above protocol on an ensemble of 1000 functions of growth
rate versus trimethoprim, where for every member of the ensemble each growth rate
measurement is multiplied by a number drawn from a normal distribution with a mean of 1
and a standard deviation of 0.07; chosen such that the artificially 'noisy' data set has a Z-score
that is twice the Z-score of the duplicate experimental measurements with no trimethoprim.
From this ensemble, a standard deviation was calculated for each genotype's IC50; this
standard deviation was small when growth is inhibited over a narrow range of trimethoprim
concentrations, and large when growth gradually declines over a wide range of trimethoprim
concentrations. When simulating evolutionary trajectories (Figure 2.3a) and calculating
landscape ruggedness (Figure 2.4b), we required 99% confidence that the IC50 values of
neighboring genotypes were not equal, or else they were considered to be connected by
neutral drift. Drift transitions between genotypes were not permitted in simulated
evolutionary trajectories, and drift transitions did not contribute to the calculation of
ruggedness, where information entropy was calculated only from confidently beneficial or
confidently deleterious transitions.
48
References
Bershtein, S., Mu, W., and Shakhnovich, E.I. (2012). Soluble oligomerization provides a beneficial fitness effect on destabilizing mutations. Proceedings of the National Academy of Sciences of the United States of America 109, 4857-4862.
Brown, K.M., Costanzo, M.S., Xu, W., Roy, S., Lozovsky, E.R., and Hartl, D.L. (2010). Compensatory mutations restore fitness during the evolution of dihydrofolate reductase. Mol Biol Evol 27, 2682-2690.
Chou, H.H., Chiu, H.C., Delaney, N.F., Segre, D., and Marx, C.J. (2011). Diminishing returns epistasis among beneficial mutations decelerates adaptation. Science 332, 1190-1192.
Datsenko, K.A., and Wanner, B.L. (2000). One-step inactivation of chromosomal genes in Escherichia coli K-12 using PCR products. Proceedings of the National Academy of Sciences of the United States of America 97, 6640-6645.
DePristo, M.A., Hartl, D.L., and Weinreich, D.M. (2007). Mutational reversions during adaptive protein evolution. Molecular biology and evolution 24, 1608-1610.
Khan, A.I., Dinh, D.M., Schneider, D., Lenski, R.E., and Cooper, T.F. (2011). Negative epistasis between beneficial mutations in an evolving bacterial population. Science 332, 1193-1196.
Kvitek, D.J., and Sherlock, G. (2011). Reciprocal sign epistasis between frequently experimentally evolved adaptive mutations causes a rugged fitness landscape. PLoS genetics 7, e1002056.
Lozovsky, E.R., Chookajorn, T., Brown, K.M., Imwong, M., Shaw, P.J., Kamchonwongpaisan, S., Neafsey, D.E., Weinreich, D.M., and Hartl, D.L. (2009). Stepwise acquisition of pyrimethamine resistance in the malaria parasite. Proc Natl Acad Sci U S A 106, 12025-12030.
Poelwijk, F.J., Kiviet, D.J., Weinreich, D.M., and Tans, S.J. (2007). Empirical fitness landscapes reveal accessible evolutionary paths. Nature 445, 383-386.
Poelwijk, F.J., Tanase-Nicola, S., Kiviet, D.J., and Tans, S.J. (2011). Reciprocal sign epistasis is a necessary condition for multi-peaked fitness landscapes. Journal of theoretical biology 272, 141-144.
Salverda, M.L., Dellus, E., Gorter, F.A., Debets, A.J., van der Oost, J., Hoekstra, R.F., Tawfik, D.S., and de Visser, J.A. (2011). Initial mutations direct alternative pathways of protein evolution. PLoS Genet 7, e1001321.

49
Toprak, E., Veres, A., Michel, J.B., Chait, R., Hartl, D.L., and Kishony, R. (2012). Evolutionary paths to antibiotic resistance under dynamically sustained drug selection. Nat Genet 44, 101-105.
Weinreich, D.M., Delaney, N.F., Depristo, M.A., and Hartl, D.L. (2006). Darwinian evolution can follow only very few mutational paths to fitter proteins. Science 312, 111-114.

50
Chapter 3.
Diverse pathways to drug resistance by changes in gene expression
Adam C. Palmer1, Remy Chait1,2, Roy Kishony1,3
1Department of Systems Biology, Harvard Medical School, 200 Longwood Ave, Boston, MA 02115.
2Institute of Science and Technology - Austria, Am Campus 1, A-3400, Klosterneuburg, Austria.
3School of Engineering and Applied Sciences, Harvard University, Cambridge, MA 02138.
The effects of antibiotics are mediated by their direct or indirect interactions with individual
proteins in the cell, as well as by the abundance of those proteins. Hence, antibiotic resistance
can evolve not only by mutations that change the amino acid sequences of proteins, but also
by mutations that change the expression level of proteins. To explore the potential of changes
in gene expression to confer antibiotic resistance, we implemented a pooled diffusion-based
assay to screen all viable gene over-expression and gene deletion mutants of Escherichia coli
against a broadly representative panel of 31 antibiotics. We found 136 positive or negative
changes in gene expression that confer drug-specific or multi-drug resistance. These genes
span a diverse range of functions and most were not previously associated with antibiotic
resistance; only 4 are drug targets. By quantitatively adjusting gene expression and measuring
resistance, we find that intrinsic antibiotic defense systems, and also 'protoresistance' genes
that hold enormous potential for resistance, are often regulated so as to actually confer little
resistance to the wildtype strain. We rationalize the abundance and diversity of hits by

51
viewing gene-regulation as an optimization problem: because antibiotic treatment results in
the non-optimal expression of some genes, there exist many possibilities for the evolution of
drug resistance through regulatory mutations that deploy latent defense capabilities or correct
other errors in gene expression.
52
Mutations can confer antibiotic resistance by changing the amino acid sequence of a protein
(coding mutations) or by altering the expression level of proteins in a cell (non-coding,
regulatory mutations). Resistance mutations have been identified in regulatory sequences in
antibiotic resistant isolates from the clinic and from laboratory evolution experiments. These
mutations have been found to confer antibiotic resistance by mechanisms such as over-
expression of a drug’s target, over-expression of drug defense systems, and the down-
regulation or deletion of genes required for drug entry or enzymatic activation of a pro-drug.
Examples include: trimethoprim resistance acquired by over-expression of its target enzyme
dihydrofolate reductase (Flensburg and Skold, 1987); penicillin resistance acquired by the
over-expression of drug degrading beta-lactamases (Bergstrom and Normark, 1979); and
cephalosporin resistance acquired by loss of porins through which the drug enters the cell
(Curtis et al., 1985). However, these and other examples have generally been identified
individually, and because regulatory mutations can act in trans it remains challenging to
systematically identify regulatory pathways to drug resistance by genotypic approaches
(Courvalin, 2005). This limitation can be overcome through the use of genome-wide libraries
of strains where each has a defined change in gene expression, e.g. deletion or over-
expression. Genome-wide screens with such libraries have identified gene deletions which
confer antibiotic hypersensitivity (Girgis et al., 2009; Tamae et al., 2008), and gene
duplications which confer stress resistance; although the latter study utilized a competitive
growth method that only identified 1 to 3 genes per stress (Soo et al., 2011). The most
comprehensive such studies screened all viable homozygous and heterozygous gene deletions
in diploid S. cerevisiae or all viable gene deletions in E. coli against hundreds of chemical
53
stresses (Hillenmeyer et al., 2008; Nichols et al., 2011). However, as both of these studies
aimed to measure phenotypic signatures for each gene, stresses were applied only at sub-
inhibitory levels, and so gene deletions that confer survival at normally lethal stress levels
were not identified. Thus, a systematic and sensitive screen for positive and negative changes
in gene expression that confer antibiotic resistance is absent.
In this study, we perform functional genetic screens in E. coli for drug-specific and multi-
drug resistance conferred by increasing or decreasing gene expression levels, using a panel of
antibiotics representing most classes effective against gram-negative bacteria. To accomplish
this, we developed a robust genome-wide screen to identify gene expression changes
conferring drug resistance. We employ two E.coli strain libraries: the 'KEIO' collection of
strains containing each viable gene deletion (Baba et al., 2006), and the 'ASKA' collection
wherein each gene is individually expressed from an IPTG-inducible promoter on a plasmid
(Kitagawa et al., 2005). The ASKA collection of plasmids was transformed from its host
cloning strain to the 'wildtype' MG1655 ΔlacIZYA for healthy growth; additionally the
lacIZYA deletion allows IPTG to exclusively induce plasmid-based expression without fitness
effects from induction of the lac operon. Screening large strain collections for drug-resistant
mutants typically requires exploring a range of discrete, finely-tuned drug concentrations
using high-throughput laboratory automation. We have addressed these challenges with a
simple two-step pooled diffusion-based screen on agar (Figure 3.1a): (1) a strain library
(deletion or over-expression) is pooled and seeded as a lawn on agar. An aliquot of
concentrated drug solution is spotted in the center of the plate, as in a classical disc-diffusion

54
assay, and diffuses through the media to form a continuous spatial gradient of drug
concentrations. Typically, following incubation, the wild type strain will grow into a dense
lawn across the plate, except in a zone of clearing surrounding the drug source, where drug
concentrations are high enough to preclude growth. Strains with enhanced resistance to the
drug can grow in the higher drug concentrations closer to the center, and are thus visible as
individual colonies inside the zone of inhibition; (2) Drug resistant colonies are picked and
identified by Sanger sequencing of the expression plasmid or of the chromosome adjacent to
the site of a gene deletion (Supplementary Methods). Because the diffusion gradient samples
a continuum of drug concentration space, this rapid and inexpensive assay is robust with
respect to drug concentrations and sensitively detects improvements in drug resistance.
We employed our assay on 31 antibiotics, representing all major classes of antibiotics effective
against gram-negative bacteria (Table 3.1). The gene deletion collection represents the
extreme case of down-regulation, and utilizing the IPTG-inducible promoter driving the gene
over-expression collection, we screened against both weak and strong up-regulation (using
15μM and 150μM IPTG, respectively). 48 colonies were picked and sequenced for each of
three expression conditions per drug (deletion, weak over-expression, strong over-
expression). Inspection of the assay plates reveals discrete colonies within the high drug
concentration zones of clearing, showing that both gene deletion and gene over-expression
can confer drug resistance. The presence and abundance of drug-resistant gene expression
mutants is highly variable across drugs, with very strongly resistant mutants appearing on
some drugs (e.g. penicillin G, trimethoprim) while some drugs permitted no resistant
55
mutants (e.g. colistin) (Figure 3.1b). In contrast, the ‘wildtype’ reference plates rarely show
colonies in the zone of inhibition, representing infrequent spontaneous drug resistance
mutations. To avoid false identifications from the occurrence of spontaneous resistance
mutations, we required two or more observations of each specific gene-drug interaction (false
discovery rate ≤ 1%). We also noted a few interactions where a change in gene expression that
had been repeatedly observed to resist one drug (satisfying the previous criteria) was also
observed once with a second drug of the same mode of action (false discovery rate ≤ 5%).
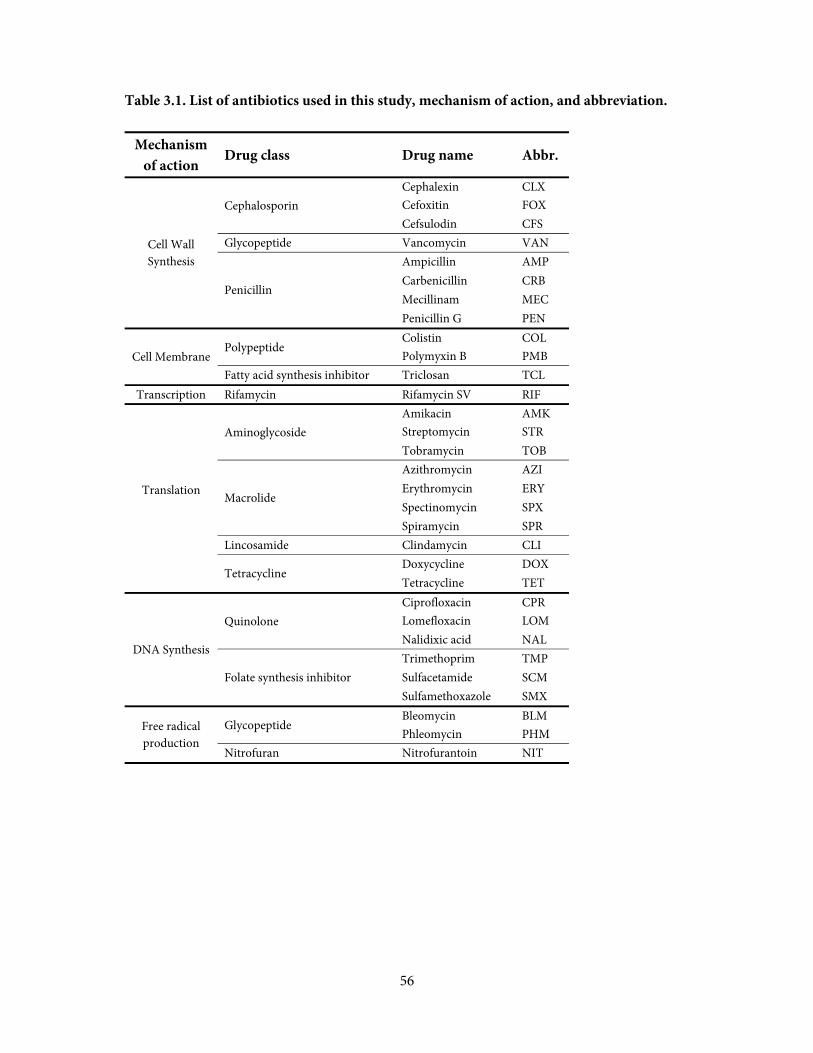
56
Table 3.1. List of antibiotics used in this study, mechanism of action, and abbreviation.
Mechanism of action
Drug class Drug name Abbr.
Cell Wall Synthesis
Cephalosporin Cephalexin CLX Cefoxitin FOX Cefsulodin CFS
Glycopeptide Vancomycin VAN
Penicillin
Ampicillin AMP Carbenicillin CRB Mecillinam MEC Penicillin G PEN
Cell Membrane Polypeptide
Colistin COL Polymyxin B PMB
Fatty acid synthesis inhibitor Triclosan TCL Transcription Rifamycin Rifamycin SV RIF
Translation
Aminoglycoside Amikacin AMK Streptomycin STR Tobramycin TOB
Macrolide
Azithromycin AZI Erythromycin ERY Spectinomycin SPX Spiramycin SPR
Lincosamide Clindamycin CLI
Tetracycline Doxycycline DOX Tetracycline TET
DNA Synthesis
Quinolone Ciprofloxacin CPR Lomefloxacin LOM Nalidixic acid NAL
Folate synthesis inhibitor Trimethoprim TMP Sulfacetamide SCM Sulfamethoxazole SMX
Free radical production
Glycopeptide Bleomycin BLM Phleomycin PHM
Nitrofuran Nitrofurantoin NIT

57
Figure 3.1. A genome-wide screen identifies changes in gene expression that confer
antibiotic resistance. a, A library of E.coli strains with genes deleted or overexpressed is
pooled and plated as a lawn on agar. A drug spot is applied which creates a zone of growth
inhibition. Members of the strain library with increased drug resistance grow inside the zone
of inhibition (yellow colonies), and are picked and identified by DNA sequencing. b,
Photographs of assay plates for five example drugs (out of 31 drugs in total) illustrate that
both gene deletion and over-expression can confer drug resistance, and the possible levels of
resistance range from none at all (e.g. colistin), to modest (e.g. clindamycin, vancomycin), to
very strong (e.g. penicillin, trimethoprim). Plate images of all drugs are shown in
Supplementary Figure 3.1.
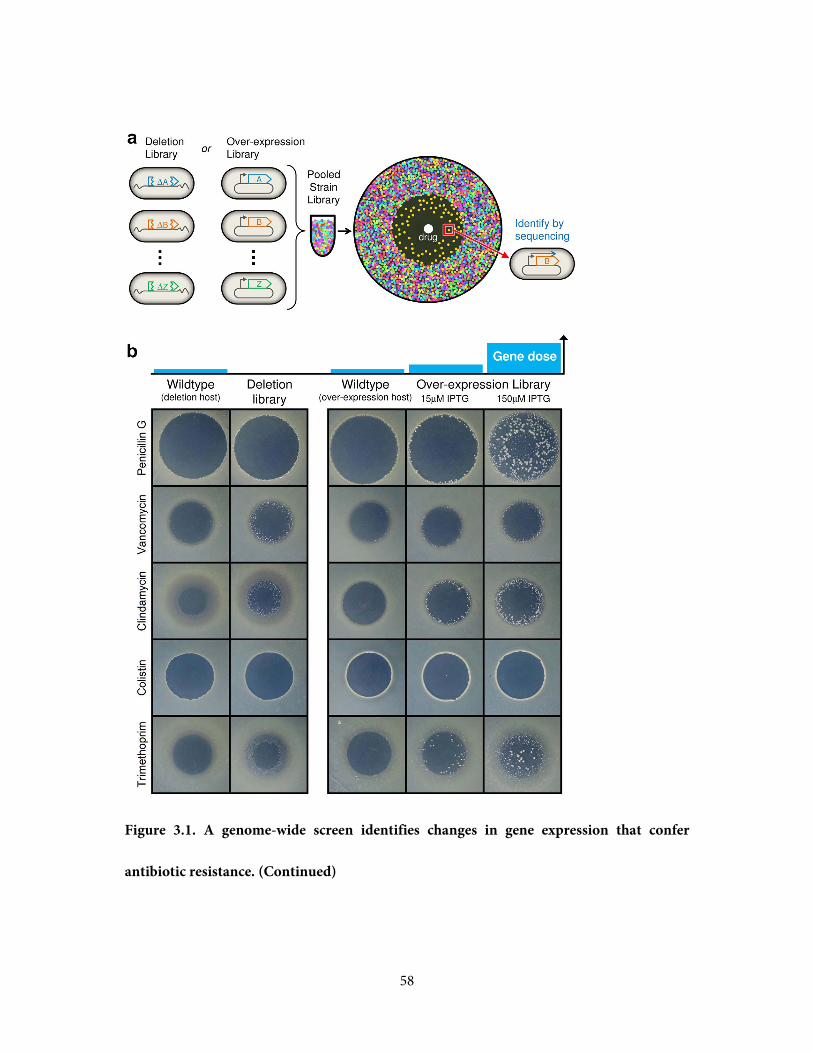
58
Figure 3.1. A genome-wide screen identifies changes in gene expression that confer
antibiotic resistance. (Continued)
59
We sequenced over 2400 drug resistant colonies and identified over 200 gene-drug
interactions where a change in gene expression was repeatedly observed to increase resistance
to an antibiotic. These changes in gene expression consisted of a mixture of over-expression
and deletion (59% and 41% of genes, respectively) (Figure 3.2). For only 4 of 31 drugs did we
not identify any changes in individual gene expression that confer resistance, and 2 of these
were the membrane-disrupting drugs colistin and polymyxin B where it is unclear how an
internal change in gene expression might improve resistance. The majority of expression
changes were observed to increase resistance to drugs only within a single mechanistic class
(93% of genes), and have not been previously associated with drug resistance (83% of genes).
Amongst those genes known to be associated with antibiotic resistance, we have reproduced
several drug-specific and multi-drug resistant regulatory mutations previously identified in
clinical isolates or experiments (Supplementary Table 3.1). These results demonstrate that for
most antibiotics there are many regulatory mutations with the potential to increase resistance.
60
Figure 3.2. Many positive and negative changes in gene expression can confer drug
resistance. Drugs (black hexagons) are grouped by mechanism of action (see Table 3.1 for
abbreviations). E. coli genes are marked by red circles when deletion confers drug resistance
and blue circles when over-expression confers drug resistance; known drug targets whose
over-expression confers resistance are outlined in dark blue. Changes in gene expression that
resist only one mechanism of drug action are grouped around the drugs of that mechanism,
while those that resist multiple classes of drug are shown in the center. Pale colored links
denote changes in gene expression that were identified only once as resisting a particular
drug, that are included because they were repeatedly observed to resist another drug of the
same mechanism of action. Supplementary Table 3.1 lists all gene-drug interactions

61
Figure 3.2. Many positive and negative changes in gene expression can confer drug
resistance. (Continued)
62
A multitude of drug-specific pathways to resistance were observed. Amongst those genes with
annotated functions, a diverse range of possible resistance mechanisms are demonstrated or
suggested. Resistance mechanisms suggested by functional annotations include modification
of the cellular process affected by a drug, increased flux through a drug-inhibited pathway,
modification of cell permeability, chemical modification of a drug, and the activation of drug
efflux and acid resistance systems (Table 3.2). Additionally, resistance to various antibiotics
resulted from changes in the expression levels of numerous genes involved in the metabolism
or transport of lipopolysaccharide, enterobactin, polyamines, and ubiquinone. These cases
where a resistance mechanism can be inferred, or at least a particular metabolic process is
implicated, represent only one third of the changes in gene expression that increase antibiotic
resistance, while the remaining two thirds act by yet unclear mechanisms.

63
Table 3.2. Mechanisms of drug resistance mediated by changes in gene expression. See Supplementary Table 3.1 for all gene-drug interactions and functional annotations. Genetic change Putative resistance mechanism
Modification of a cellular process affected by drug sbmC Inhibits DNA Gyrase and confers resistance to DNA damage by phleomycinΔdacA Alters the peptidoglycan moiety bound by vancomycinΔrodZ Loss of a binding partner of the target of mecillinam confers mecillinam resistance
ΔdksA Loss of an RNA Polymerase binding protein increases resistance to the RNA Polymerase inhibitor rifamycin SV
hflX Over-expression of ribosome component increases resistance to the translation inhibitors clindamycin and erythromycin
ΔrpmG Loss of ribosome component increases clindamycin resistance Alteration of cell permeability
ΔompF, ΔompR, ΔasmA Loss of the porins through which cephalosporins enter the cell ΔsbmA Loss of a transporter through which antimicrobial peptides enter the cell amiA Increased expression of a peptidoglycan amidase bssR Increased expression of a biofilm regulator
Increased flux through drug-inhibited pathway nudB Increased rate of first reaction in folic acid synthesis pathway
ΔfolM, ΔfolX Increased flux through folic acid synthesis pathway by preventing substrate use for tetrahydromonapterin synthesis
folM Drug-insensitive replacement for a drug-inhibited enzyme folA, mrcB, mrdA, fabI Increased expression of a drug-inhibited enzyme
Drug modification ΔnfsA Loss of enzyme that catalyzes pro-drug activation ampC Expression of enzyme that inactivates drug
Drug resistance / drug efflux systems marA, soxS Transcriptional activation of multidrug resistance systems Δlon, ΔrsxC Loss of enzyme required for inactivation of mar or sox systems, respectively ycjR Component of SdsRQP efflux pumpbaeR Increased transcription of MdtABC efflux pump
Acid resistance systems cadA, cadB Activation of Lysine-dependent acid resistance systemgadE, gadW, ydeO Activation of Glutamic acid decarboxylase acid resistance system
Lipopolysaccharide metabolism ΔlpcA, ΔrfaC, ΔrfaD Defects in lipopolysaccharide synthesis and modificationeptB Increased phosphoethanolamine modification of lipopolysaccharide
Enterobactin transport and modification ΔfepB, ΔfepC, ΔfepG Loss of ferric enterobactin ABC transporterΔfes Loss of ferric enterobactin hydrolysisentS Increased expression of enterobactin transporter
Polyamine metabolism and transport puuP Increased expression of putrescine transporterrpmH Decreased polyamine synthesis, but increased intracellular polyamines ΔspeA, ΔspeB Loss of putrescine biosynthesis
Ubiquinone metabolism ΔubiF, ΔubiG, ΔubiH Loss of ubiquinone biosynthesis nuoI Increased expression of NADH:ubiquinone oxidoreductase
64
We also identified 9 genes whose over-expression increases resistance against multiple
mechanisms of drug action (e.g. both cell wall synthesis drugs and DNA synthesis drugs),
including the known multi-drug resistance genes marA and soxS, and 7 novel multi-drug
resistance genes of varied functions. gadW is a transcriptional regulator of acid resistance;
bssR regulates biofilm formation and may confer multidrug resistance through altered
permeability; and ddpF is a putative component of an ABC transporter. The functional
annotations of the remaining 4 multi-drug resistance genes (hemD, yhbT, gmr, and rbsR; see
Supplementary Table 3.1) do not suggest potential mechanisms of resistance.
Regulatory mutations in the specific targets of drugs are of particular interest. While many
antibiotics are not inhibitors of a single protein (instead inhibiting a large complex, a family
of related enzymes, or damaging a non-protein target such as the cell membrane), 10 of the 31
antibiotics in our screen specifically bind to one or two enzymes. If an antibiotic acts by
disrupting the activity of its target, a higher concentration of the target might be able to
restore its activity. Strikingly, only 4 of these 10 antibiotics were resisted by over-expression of
their target gene, and 2 of these only when over-expressed weakly, not strongly (Figure 3.2,
Table 3.3). Thus, a drug's direct target can be absent from the set of regulatory mutations that
confer drug resistance.
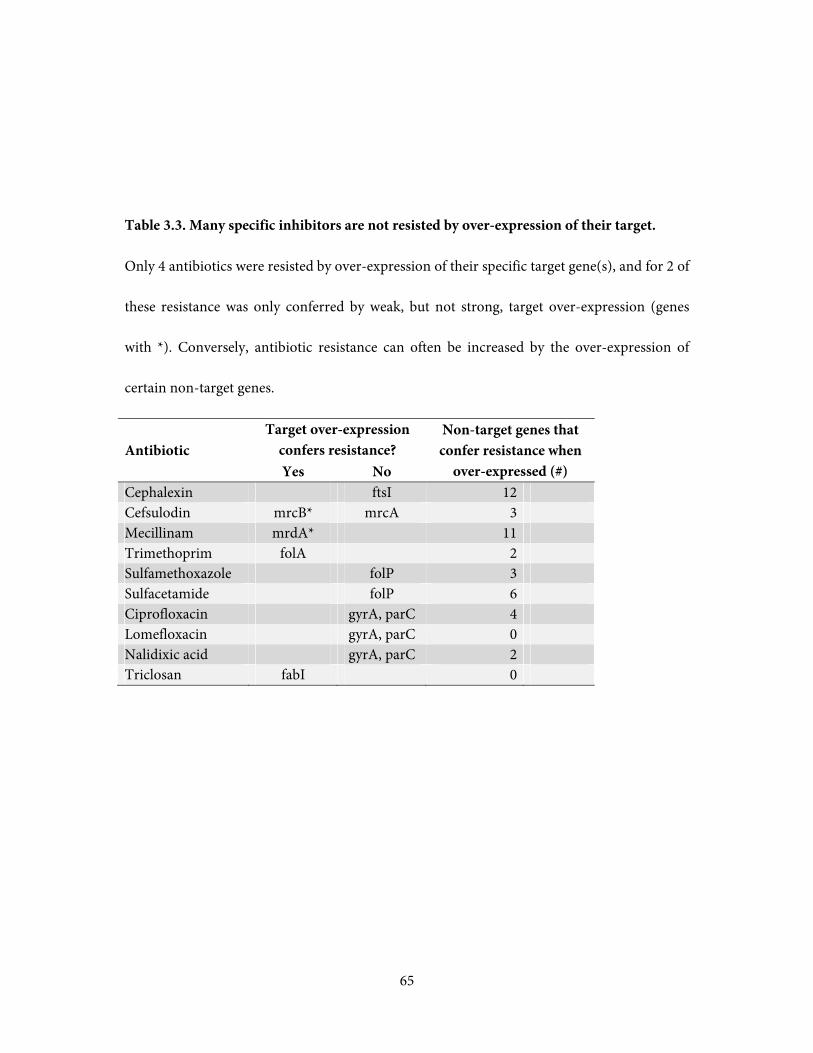
65
Table 3.3. Many specific inhibitors are not resisted by over-expression of their target.
Only 4 antibiotics were resisted by over-expression of their specific target gene(s), and for 2 of
these resistance was only conferred by weak, but not strong, target over-expression (genes
with *). Conversely, antibiotic resistance can often be increased by the over-expression of
certain non-target genes.
Antibiotic Target over-expression
confers resistance? Non-target genes that confer resistance when
over-expressed (#) Yes No Cephalexin ftsI 12Cefsulodin mrcB* mrcA 3Mecillinam mrdA* 11Trimethoprim folA 2Sulfamethoxazole folP 3Sulfacetamide folP 6Ciprofloxacin gyrA, parC 4Lomefloxacin gyrA, parC 0Nalidixic acid gyrA, parC 2Triclosan fabI 0

66
These gene-drug interactions identify genes for which a change in expression improves
survival, and therefore are not optimally regulated under antibiotic stress in the wildtype cell.
For these genes the response of a wildtype cell to antibiotic treatment produces less than, or
perhaps even none, of its maximal potential for antibiotic resistance that could be achieved
with an optimal regulatory response. We investigated what fraction of the maximum
potential resistance is realized by E. coli for the 2 most broadly protective multi-drug
resistance genes, marA and soxS, and for 2 strong drug-specific resistance genes, ampC and
sbmC. To answer this question it is necessary to remove the native transcriptional regulation
mechanisms and obtain full experimental control over these genes’ expression. We achieve
this by constructing hybrid ‘gene deletion - gene expression’ strains in which a plasmid
bearing IPTG-regulated gene expression is transformed into a strain where the matching gene
is deleted from the chromosome (Figure 3.3a). Two-dimensional gradients of drug dose and
IPTG-controlled gene dose were constructed across microtiter plates and bacterial growth
rates were measured using a bioluminescence assay with sensitivity far exceeding optical
density techniques (Kishony and Leibler, 2003). These experiments assessed how drug
resistance depends on gene expression and how the maximal possible drug resistance
compares to the resistance of the wildtype strain and a strain lacking the gene.
MarA and SoxS are global regulatory transcription factors with partially overlapping sets of
target genes whose activation confers resistance to multiple antibiotics, organic solvents, and
oxidative stresses through mechanisms such as upregulation of efflux pumps and
downregulation of porins (Alekshun and Levy, 1999; Martin and Rosner, 2002). The growth
67
of strains with regulated expression of either marA or soxS were examined in concentration
gradients of 9 antibiotics representing the 4 modes of action that were observed to interact
with marA and soxS. We find that marA and soxS have the potential to boost resistance to
ampicillin, mecillinam, clindamycin, doxycycline, ciprofloxacin and trimethoprim (Figure
3.3b). However, this potential for resistance is only well used by the wildtype strain in the case
of clindamycin (marA and soxS) and trimethoprim (soxS only), and then only under strong
growth inhibition, and not at moderate growth inhibition. (Figure 3.3c, Supplementary
Figure 3.3a). Thus, many antibiotics could potentially be resisted by intrinsic stress response
systems, but remain effective because of a regulatory failure to fully utilize those defenses.
This phenomenon underlies the clinical observation of mutations that activate the mar or sox
operons in multi-drug resistant E. coli isolates (Koutsolioutsou et al., 2005; Maneewannakul
and Levy, 1996).
68
Figure 3.3. Multi-drug resistance systems are often poorly utilized. a, The optimality of a
gene's response to antibiotic treatment was investigated by comparing the drug susceptibility
of three E. coli strains: one lacking the gene (black), one with wildtype gene regulation
(green), and one where susceptibility can be measured over a range of experimentally
controlled gene expression levels (red). b, The optimality of the responses of the multi-drug
resistance factors marA and soxS were studied in 9 antibiotics. Drug concentrations are
normalized by the IC50 (concentration for 50% inhibition) of the strain lacking the gene of
interest. For regulated gene over-expression, the growth rate shown is the highest over all
expression levels. For those drugs where gene expression (red) increased resistance relative to
gene deletion (black), the wildtype strain (green) frequently used only a fraction of the
potential for drug resistance. c, On an empirical fitness landscape (growth rate vs drug dose
and gene expression) the gene expression response that maximizes growth at each drug dose
(red line) can be compared with the wildtype response (green), which is inferred by matching
the wildtype growth rate to the level of controlled gene expression producing the same
growth rate. In ampicillin and ciprofloxacin, a sub-optimal use of marA is observed. In
clindamycin the wildtype cell does not use marA for drug resistance until growth inhibition is
greater than 50%, after which marA use becomes optimal.
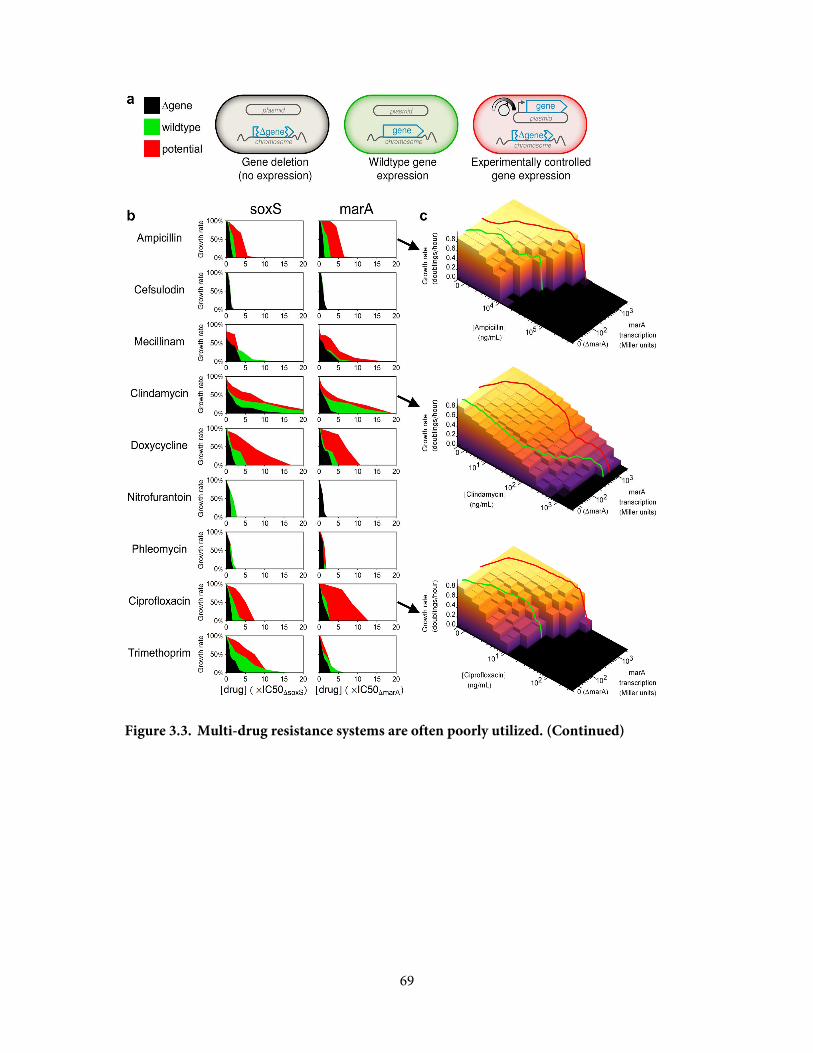
69
Figure 3.3. Multi-drug resistance systems are often poorly utilized. (Continued)

70
AmpC is both a beta-lactamase and a peptidoglycan hydrolase required for normal cell
morphology (Bishop and Weiner, 1993; Henderson et al., 1997). Regulatory mutations that
increase ampC expression have been observed in clinical and experimental isolates and confer
strong penicillin and cephalosporin resistance (Bergstrom and Normark, 1979). Under
treatment by either a penicillin or a cephalosporin, we observe that wildtype ampC expression
levels provide negligible resistance relative to a ΔampC strain, despite the potential to confer
100-fold resistance when over-expressed (Figure 3.4a, Supplementary Figure 3.3b). The lack
of ampC-mediated resistance in wildtype E. coli suggests that rather than being a drug
resistance gene, ampC is a 'protoresistance' gene (Morar and Wright, 2010); the primary role
of ampC is in cell morphology, but it has the capacity to evolve into a beta-lactam resistance
gene through mutations that increase its expression level.
SbmC is a DNA gyrase inhibitory protein that acts as an antitoxin to DNA gyrase-specific
protein toxins such as microcin B17, and is induced by the SOS response to DNA damage
(Baquero et al., 1995; Chatterji and Nagaraja, 2002; Nakanishi et al., 1998; Oh et al., 2001).
Here we observed that sbmC over-expression confers resistance to phleomycin, a
glycopeptide that generates free radicals leading to DNA cleavage. Comparing the
phleomycin susceptibility of ΔsbmC, wildtype, and sbmC over-expressing strains we found
that, despite the SOS-inducibility of sbmC, only a small fraction of the potential sbmC-
mediated phleomycin resistance was used by a wildtype strain (Figure 3.4b, Supplementary
71
Figure 3.3b). Thus even a specific stress-inducible toxin resistance gene can be inadequately
utilized against toxins that it can resist.
72
Figure 3.4. Proto-resistance genes hold unrealized potential for strong drug resistance.
The use of ampC and sbmC under antibiotic treatment was examined by comparing the drug
resistance of E. coli strains lacking the gene of interest (black), wildtype strains (green), and
strains with experimentally controlled gene expression that demonstrate the potential for
drug resistance (red) (see Figure 3.3a). a, ampC encodes a potent beta-lactamase: over-
expression can confer 100-fold resistance to penicillins or cephalosporins. However, with
wildtype expression regulation of ampC (green) almost none of this potential resistance (red)
is used. b, sbmC encodes a DNA gyrase inhibitor whose over-expression confers resistance to
the DNA-damaging drug phleomycin. However, a wildtype strain (green) treated with
phleomycin uses very little of the potential resistance offered by sbmC (red).
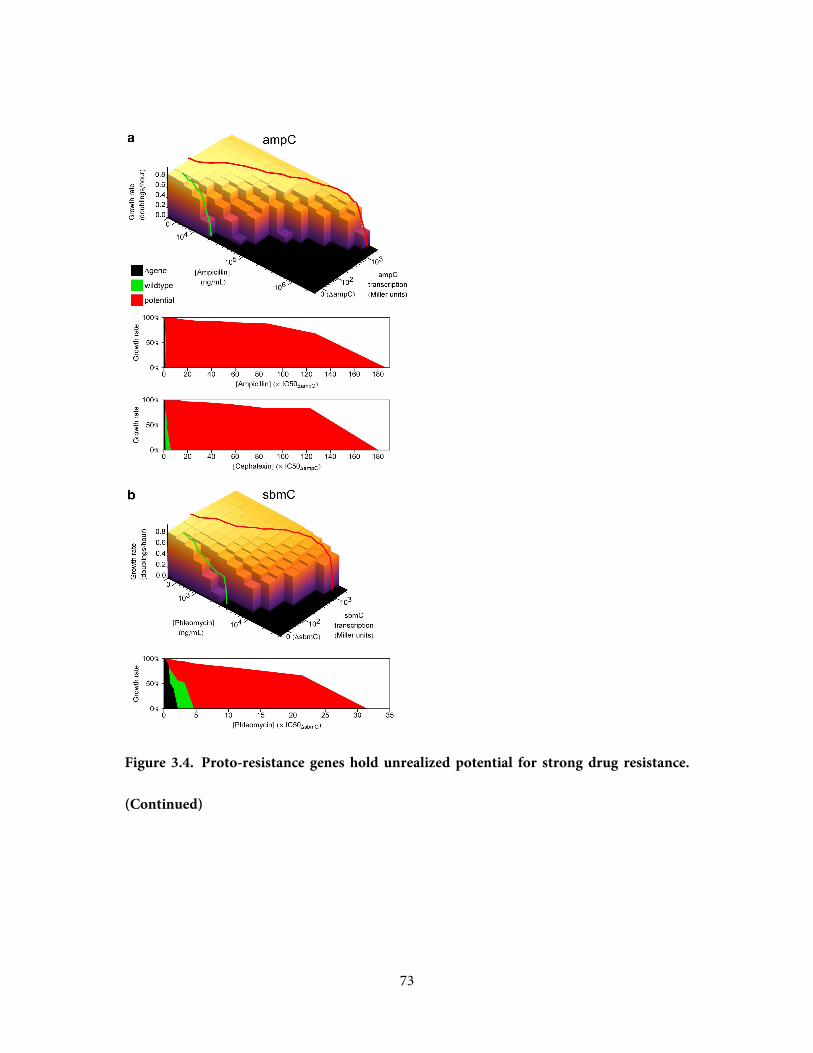
73
Figure 3.4. Proto-resistance genes hold unrealized potential for strong drug resistance.
(Continued)
74
In principle, a mutation can only produce a beneficial effect by changing a gene's expression
level if that gene's expression was initially sub-optimal, i.e. fitness would be larger at either
higher or lower expression. Therefore, all non-coding mutations that are beneficial only
under antibiotic treatment are made possible by a non-optimality in gene expression in the
presence of the drug. To illustrate this phenomenon, we measured growth rate as a function
of gene expression for nfsA under nitrofurantoin treatment, and ampC under ampicillin
treatment. As expected from the previous theoretical arguments, the optimum nfsA
expression level is lowered by increasing doses of nitrofurantoin, until the expression level
that is optimal for growth without the drug is lethally sub-optimal in its presence (Figure 3.5).
In scenarios such as this, mutations that lower or abolish gene expression will confer drug
resistance. Conversely, the optimum ampC expression level increases with increasing doses of
ampicillin (Figure 3.5). If actual ampC expression is maintained at the level that optimizes
growth without drug, the strain will die at drug doses that could have been resisted with
greater ampC expression; in this type of scenario, gene over-expression will confer drug
resistance. These two examples illustrate a universal phenomenon: non-optimal gene
expression is the pre-condition for a change in gene expression to be beneficial. The simplest
situation that may give rise to non-optimal gene expression under antibiotic treatment is if a
gene's expression is optimized for growth in the absence of drug and is not differentially
regulated in response to drug treatment. There are also examples of more elaborate reasons
for sub-optimal gene expression: a drug or drug mixture may induce serious physiological
imbalances between cellular components, outside the usual range of their global regulation
75
(Bollenbach et al., 2009) or may even induce a harmful regulatory response in drug resistance
systems (Palmer et al., 2010).
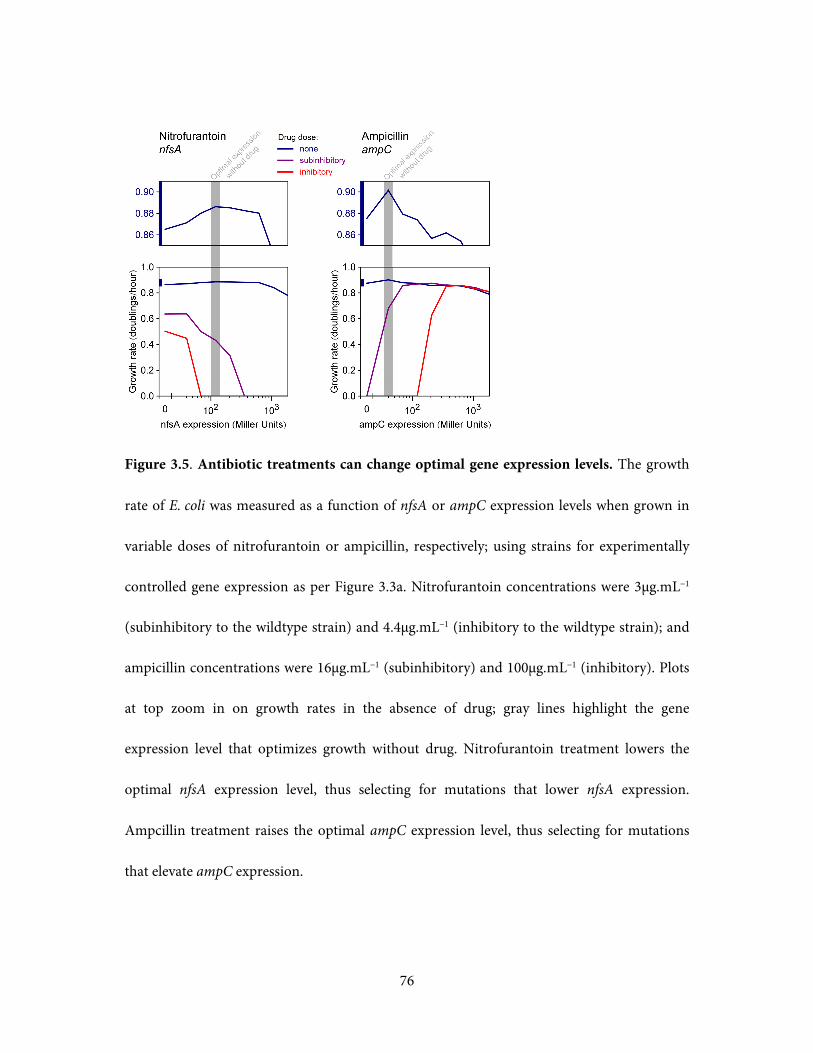
76
Figure 3.5. Antibiotic treatments can change optimal gene expression levels. The growth
rate of E. coli was measured as a function of nfsA or ampC expression levels when grown in
variable doses of nitrofurantoin or ampicillin, respectively; using strains for experimentally
controlled gene expression as per Figure 3.3a. Nitrofurantoin concentrations were 3μg.mL−1
(subinhibitory to the wildtype strain) and 4.4μg.mL−1 (inhibitory to the wildtype strain); and
ampicillin concentrations were 16μg.mL−1 (subinhibitory) and 100μg.mL−1 (inhibitory). Plots
at top zoom in on growth rates in the absence of drug; gray lines highlight the gene
expression level that optimizes growth without drug. Nitrofurantoin treatment lowers the
optimal nfsA expression level, thus selecting for mutations that lower nfsA expression.
Ampcillin treatment raises the optimal ampC expression level, thus selecting for mutations
that elevate ampC expression.
77
Antibiotics inhibit or damage essential processes at micromolar to nanomolar concentrations
and come in diverse structural forms; the task of detecting and responding to these
compounds must be a challenge, at which drug-sensitive bacteria succeed partially at best.
Fitness is an environment-dependent function of gene expression (Dekel and Alon, 2005),
and antibiotic treatment changes the optimal expression level of many genes that can
influence drug susceptibility. For each and every such gene, if there is a failure to
appropriately respond to drug treatment, then regulatory mutations can exist that change
gene expression, correct this non-optimality, and thereby improve drug resistance. We have
identified an abundance of functionally diverse pathways to antibiotic resistance by such
changes in gene expression. While many of these changes have modest drug-specific effects,
even potent drug resistance genes and multi-drug resistance systems are subject to mutations
that change gene expression, due to their inadequate or complete lack of usage against many
antibiotics. Thus, while bacteria can achieve antibiotic resistance by acquiring functional
mutations and specific resistance mechanisms, we find that they can also draw on an
unappreciatedly vast pool of mutations that correct gene-regulatory failures and activate
latent defense mechanisms.
78
Acknowledgements
We thank the NBRP (NIG, Japan):E. coli for the KEIO and ASKA collections, and K.
Shearwin for gift of strains. We are grateful to Michael Baym, Jeremy Jenkins, Tami
Lieberman, Zhizhong Yao, and members of the Kishony lab for helpful discussions. This
work was supported by the Novartis Institutes for Biomedical Research, US National
Institutes of Health grant R01-GM081617, and a George Murray Scholarship (to A.C.P.)
Author Contributions
A.C.P., R.C. and R.K. designed research; A.C.P. performed research and analyzed data;
A.C.P., R.C. and R.K. wrote the manuscript.
79
Methods
Strains and Media
All selection experiments and growth rate assays were performed in M63 minimal medium
(2g.L–1 (NH4)2SO4, 13.6g.L–1 KH2PO4, 0.5mg.L–1 FeSO4•7H2O, adjusted to pH 7.0 with KOH)
supplemented with 0.2% glucose, 0.1% casamino acids, 1mM MgSO4 and 0.5mg.L–1 thiamine.
Escherichia coli strain BW25113 is the host for the KEIO gene deletion library (Baba et al.,
2006; Datsenko and Wanner, 2000). The strains of the KEIO gene deletion library (Baba et al.,
2006) were grown individually in 384-well plates with 80μL of Lysogeny Broth (LB) per well,
with incubation at 37°C and shaking at 900rpm for 24 hours. All cultures were then collected
in a single beaker and mixed, passed through 5 micron cellulose acetate filters to disrupt cell
clumps, and frozen in aliquots at −80°C in 10% glycerol. As the ASKA Open Reading Frame
(ORF) library of plasmids was supplied in the AG1 cloning strain (Kitagawa et al., 2005), the
plasmids were purified and transformed in pools into the ‘wildtype’ strain MG1655 rph+
ΔlacIZYA (gift from K.E. Shearwin; constructed from BW30270 (CGSC7925) by precise
deletion of lacIZYA (EcoCyc MG1655: 360527-366797) by recombineering) to minimize
artifacts arising from the poor health of the cloning strain; additionally the lacIZYA deletion
allows the use of IPTG to exclusively induce plasmid-based expression without additional
fitness effects due to induction of the lac operon. No such alterations were required for the
deletion library as BW25113 has only minor perturbations relative to wildtype MG1655, and
IPTG was not required to induce a change in gene expression. The AG1 strains of the ASKA
80
library were grown by the same protocol as described for the KEIO library, and the
chloramphenicol resistance and ORF-encoding pCA24N plasmids were isolated as a pooled
mixture from each 384-well plate by a QIAGEN Spin Miniprep kit. Plasmid pools were
transformed into MG1655 rph+ ΔlacIZYA by the one-step protocol of (Chung et al., 1989). To
enrich for plasmid transformed cells, liquid cultures of transformed E. coli (~109 c.f.u) were
inoculated into 10mL of M63 minimal medium with 30μg.mL–1 chloramphenicol and were
incubated overnight at 37°C with shaking at 300rpm. All transformant pools were added to a
single flask, mixed, and frozen in aliquots at −80°C in 10% glycerol. A wildtype reference for
the ASKA library was constructed by transforming MG1655 rph+ ΔlacIZYA with a pCA24N
plasmid encoding yellow fluorescent protein (yfp), but with the promoter deleted (pCA24N-
ΔpT5lac-yfp).
In growth rate assays (Figures 3.3 and 3.4), 'wildtype' refers to BW25113, 'gene deletion' refers
to the member of the KEIO deletion library lacking the gene of interest (BW25113 -
gene::KanR), where the Kanamycin resistance cassette was been excised by FLP recombinase
from a temperature-sensitive helper plasmid, yielding a strain BW25113 gene::FRT (Datsenko
and Wanner, 2000). Excision of kanamycin resistance and loss of the helper plasmid, by
colony purification at 43°C, was verified by testing for loss of antibiotic resistances.
Controlled gene expression was produced by complementing a gene deletion strain with a
pCA24N plasmid with isopropyl β-D-1-thiogalactopyranoside (IPTG)-inducible expression
of the deleted gene; these plasmids were obtained from the ASKA library and the Open
81
Reading Frames were sequenced to confirm gene identity (Kitagawa et al., 2005). As lacIZYA
is deleted in BW25113, IPTG does not incur fitness costs for lac operon production (Stoebel
et al., 2008), and graded induction is possible without the LacY permease, that would
otherwise cause all-or-none induction of LacI-regulated promoters (Choi et al., 2008; Novick
and Weiner, 1957). For consistency both 'wildtype' and 'gene deletion' strains were
transformed with pCA24N-ΔpT5lac-yfp. All strains were then transformed with plasmid
pCSλ which encodes a constitutively expressed bacterial bioluminescence operon (Kishony
and Leibler, 2003).
Drug solutions were made from powder stocks (from Sigma Aldrich unless specified
otherwise: amikacin, A1774; ampicillin, A9518; azithromycin, Tocris 3771; bleomycin, Selleck
S1214; carbenicillin, C1613; cephalexin, C4895; cefoxitin, C4786; cefsulodin, C8145;
ciprofloxacin, 17850; chloramphenicol, C0378; clindamycin, Indofine C0117; colistin, C4461;
doxycycline, D9891; erythromycin, Fluka 45673; isopropyl β-D-1-thiogalactopyranoside,
Omega Bio-Tek AC121; kanamycin, K1876; lomefloxacin, L2906; mecillinam, 33447;
nalidixic acid,N3143; nitrofurantoin, N7878; ortho-nitrophenyl-β-galactoside, N1127;
penicillin G, Fluka 13750; phleomycin, P9564; polymyxin-B, P0972; rifamycin SV,
Biochemika 83909; spectinomycin, S9007; spiramycin, S9132; streptomycin, S6501;
sulfacetamide, S8627; sulfamethoxazole, S7507; tetracycline, 87128; tobramycin,T4014;
triclosan, TCI America T1872; trimethoprim, T7883; vancomycin,V8138). Drug and IPTG
gradients were made by serial dilution in M63 medium.
82
Pooled-library drug diffusion assay
Frozen aliquots of BW25113 (deletion library host), pooled deletion library, MG1655 rph+
ΔlacIZYA pCA24N-ΔpT5lac-yfp (over-expression library host), or pooled over-expression
library were thawed, and 107 cells were spread by glass beads on wet 10cm petri dishes
containing 25mL of 1.5% agar M63 minimal media; with 15μM or 150μM IPTG only when
plating the pooled over-expression library. Plates were briefly dried in a biosafety cabinet
before an aliquot of antibiotic was pipetted in the center of the plate. Plates were incubated at
37°C for 48 hours before being photographed by a custom plate imager (Chait et al., 2010).
Plates treated with sulfacetamide and sulfamethoxazole were instead incubated for 1 week
due to the slow growth of drug resistant colonies; in all other drugs, resistant colonies either
appeared within 48 hours or were not apparent even after 1 week. Up to 48 drug resistant
colonies per plate (not including wildtype reference plates) were viewed in a Nikon SMZ-
745T stereomicroscope, picked by a flame-sterilized 0.25mm nichrome wire, and struck on
selective agar: 50 μg.mL–1 kanamycin for the gene deletion library and 30 μg.mL–1
chloramphenicol for the gene over-expression library. Streak plates were incubated at room
temperature for several days, a single colony from each plate was inoculated into a liquid
culture of selective LB in a 96-well microtiter plate. Microtiter plates were incubated
overnight at 37°C with shaking at 900 rpm, and glycerol was added to each well to a final
concentration of 15%. Microtiter plates were stored frozen at -80°C. The genes that confer
drug resistance to selected members of the gene over-expression library were identified by
sending bacterial cultures to GENEWIZ to Sanger sequencing the Open Reading Frame
(ORF) of the pCA24N plasmid using the primer ASKAseqLF (CACCATCACCATCACCAT
83
ACG). The gene deletions that confer drug resistance to selected members of the KEIO
library were identified by Sanger sequencing the products of a 2-step hemi-nested PCR
reaction that amplified a portion of chromosome adjacent to the Kanamycin resistance
cassette that replaces each deleted gene. Both PCR steps used 20μL reactions with 2 units of
OneTaq DNA Polymerase (New England Biolabs M0480), 200nM of each primer (Integrated
DNA Technologies), and 200μM of each dNTP (New England Biolabs N0447). The first PCR
reaction was inoculated with 1μL of liquid bacterial culture, and used the three primers
KEIOseq1 (TGAAGTTCCTATTCCGAAGTTCCTATTCTC), CEKG2C (GGCCACGCGTC
GACTAGTACNNNNNNNNNNGATAT), and CEKG2D (GGCCACGCGTCGACTAGTAC
NNNNNNNNNNACGC) in the following reaction cycle: first 5’ at 95°C; 6 cycles of 30'' at
95°C, 30’’ at 42°C (lowering by 1°C per cycle), 3’ at 68°C; then 24 cycles of 30’’ at 95°C, 30’’ at
45°C, 3’ at 68°C; and finally 5’ at 68°C. The second PCR reaction was inoculated with 0.5μL
per well of the completed first PCR reaction, and used the primers KEIOseq3 (TCGAAGCAG
CTCCAGCCTAC) and CEKG4 (GGCCACGCGTCGACTAGTAC) in the following reaction
cycle: 30 cycles of 30'' at 95°C, 30’’ at 56°C, 3’ at 68°C; and finally 5’ at 68°C. Products of this
final PCR reaction were sent to GENEWIZ for sequencing by the KEIOseq3 primer.
Sequences were aligned with blastn to the E. coli MG1655 genome (NC_000913.2) to
determine gene identity (Altschul et al., 1990; Blattner et al., 1997). Alignments that started
more than 100 nucleotides from the expected start of alignment were discarded: gene over-
expression sequences should align shortly after the start codon of an ORF; gene deletion
sequences should align shortly after the stop codon of an ORF.
84
Growth rate assay
pCSλ confers constitutive bioluminescence that enables cell densities in growing cultures to
be precisely measured over many orders of magnitude by photon counting (Kishony and
Leibler, 2003). Cultures were grown in black 96-well plates with white wells (Perkin Elmer
6005039) sealed with clear adhesive lids (Perkin Elmer 6005185). Wells contained 200μL of
media inoculated with approximately 100 to 300 cells from freshly thawed -80°C frozen
cultures. Plates were incubated in a 30°C room at 70% humidity, and growth was assayed by a
Perkin Elmer TopCount NXT Microplate Scintillation and Luminescence Counter that
measured each well for 1 second. Experiments of 10 to 20 plates allowed each plate to be
measured every 30 to 60 minutes. Plate stacks were ventilated by fans to eliminate spatial
temperature gradients and ensure uniform growth conditions across each plate. In each
experiment, distributed throughout the plate stack were 3 control plates of uniform media
conditions to verify the absence of growth rate gradients within plates or across the plate
stack. Growth rate is the slope of the logarithm of photon counts per second (c.p.s.), and is
taken from the fastest growing line of best fit observed in any 6 hour timespan; this time
corresponds to 5 doublings of a healthy culture. The slope of the logarithm of c.p.s. is
unaffected by changes in luminescence per cell, such as might result from antibiotic
treatments or changes in gene expression (Kishony and Leibler, 2003).
85
Beta-galactosidase assay
The transcription rates of genes encoded in the pCA24N plasmid at different IPTG
concentrations were measured by kinetic beta-galactosidase (LacZ) assays of pCA24N-lacZ,
using a method adapted from (Dodd et al., 2001). Liquid cultures of BW25113 pCA24N-lacZ
were prepared in a 96-well plate in the same manner as for growth rate assays. The plate was
incubated at 30ºC with shaking until the plate average OD600 equalled 0.1 (mid log phase), as
measured by a Perkin Elmer Victor plate reader. 20μL of each well was promptly transferred
to the corresponding well of a microtiter plate pre-warmed to 30ºC, in which each well
contained 30μL of sterile media and 190μL of lysis / assay buffer, consisting of 100mM Tris-
HCl pH 8.0, 1mM MgSO4, 10mM KCl, 10g.L–1 β-mercaptoethanol, 100mg.L–1 polymyxin B,
and 850mg.L–1 ortho-nitrophenyl-β-galactoside. The lysis / assay plate was transferred to a
Tecan Sunrise plate reader in a 30°C room at 70% humidity, and OD410 was measured every
minute for 2 hours, with 20 seconds of shaking between each reading. For each well,
promoter activity in Miller Units was calculated from the slope of OD410 versus time,
multiplied by 200,000, divided by the OD600 of the culture that was transferred to that well,
and divided by the volume (in μL) of the culture assayed (here 20μL) (Supplementary Figure
3.2).
86
References
Alekshun, M.N., and Levy, S.B. (1999). The mar regulon: multiple resistance to antibiotics and other toxic chemicals. Trends Microbiol 7, 410-413.
Altschul, S.F., Gish, W., Miller, W., Myers, E.W., and Lipman, D.J. (1990). Basic local alignment search tool. J Mol Biol 215, 403-410.
Baba, T., Ara, T., Hasegawa, M., Takai, Y., Okumura, Y., Baba, M., Datsenko, K.A., Tomita, M., Wanner, B.L., and Mori, H. (2006). Construction of Escherichia coli K-12 in-frame, single-gene knockout mutants: the Keio collection. Mol Syst Biol 2, 2006 0008.
Baquero, M.R., Bouzon, M., Varea, J., and Moreno, F. (1995). sbmC, a stationary-phase induced SOS Escherichia coli gene, whose product protects cells from the DNA replication inhibitor microcin B17. Mol Microbiol 18, 301-311.
Bergstrom, S., and Normark, S. (1979). Beta-lactam resistance in clinical isolates of Escherichia coli caused by elevated production of the ampC-mediated chromosomal beta-lactamase. Antimicrob Agents Chemother 16, 427-433.
Bishop, R.E., and Weiner, J.H. (1993). Complementation of growth defect in an ampC deletion mutant of Escherichia coli. FEMS Microbiol Lett 114, 349-354.
Blattner, F.R., Plunkett, G., 3rd, Bloch, C.A., Perna, N.T., Burland, V., Riley, M., Collado-Vides, J., Glasner, J.D., Rode, C.K., Mayhew, G.F., et al. (1997). The complete genome sequence of Escherichia coli K-12. Science 277, 1453-1462.
Bollenbach, T., Quan, S., Chait, R., and Kishony, R. (2009). Nonoptimal microbial response to antibiotics underlies suppressive drug interactions. Cell 139, 707-718.
Chait, R., Shrestha, S., Shah, A.K., Michel, J.B., and Kishony, R. (2010). A differential drug screen for compounds that select against antibiotic resistance. PLoS One 5, e15179.
Chatterji, M., and Nagaraja, V. (2002). GyrI: a counter-defensive strategy against proteinaceous inhibitors of DNA gyrase. EMBO reports 3, 261-267.
Choi, P.J., Cai, L., Frieda, K., and Xie, X.S. (2008). A stochastic single-molecule event triggers phenotype switching of a bacterial cell. Science 322, 442-446.
87
Chung, C.T., Niemela, S.L., and Miller, R.H. (1989). One-step preparation of competent Escherichia coli: transformation and storage of bacterial cells in the same solution. Proc Natl Acad Sci U S A 86, 2172-2175.
Courvalin, P. (2005). Antimicrobial Drug Resistance: "Prediction Is Very Difficult, Especially about the Future". Emerg Infect Dis 11, 1503-1506.
Curtis, N.A., Eisenstadt, R.L., Turner, K.A., and White, A.J. (1985). Porin-mediated cephalosporin resistance in Escherichia coli K-12. J Antimicrob Chemother 15, 642-644.
Datsenko, K.A., and Wanner, B.L. (2000). One-step inactivation of chromosomal genes in Escherichia coli K-12 using PCR products. Proc Natl Acad Sci U S A 97, 6640-6645.
Dekel, E., and Alon, U. (2005). Optimality and evolutionary tuning of the expression level of a protein. Nature 436, 588-592.
Dodd, I.B., Perkins, A.J., Tsemitsidis, D., and Egan, J.B. (2001). Octamerization of lambda CI repressor is needed for effective repression of P(RM) and efficient switching from lysogeny. Genes & development 15, 3013-3022.
Flensburg, J., and Skold, O. (1987). Massive overproduction of dihydrofolate reductase in bacteria as a response to the use of trimethoprim. European journal of biochemistry / FEBS 162, 473-476.
Girgis, H.S., Hottes, A.K., and Tavazoie, S. (2009). Genetic architecture of intrinsic antibiotic susceptibility. PLoS One 4, e5629.
Henderson, T.A., Young, K.D., Denome, S.A., and Elf, P.K. (1997). AmpC and AmpH, proteins related to the class C beta-lactamases, bind penicillin and contribute to the normal morphology of Escherichia coli. J Bacteriol 179, 6112-6121.
Hillenmeyer, M.E., Fung, E., Wildenhain, J., Pierce, S.E., Hoon, S., Lee, W., Proctor, M., St Onge, R.P., Tyers, M., Koller, D., et al. (2008). The chemical genomic portrait of yeast: uncovering a phenotype for all genes. Science 320, 362-365.
Kishony, R., and Leibler, S. (2003). Environmental stresses can alleviate the average deleterious effect of mutations. J Biol 2, 14.
Kitagawa, M., Ara, T., Arifuzzaman, M., Ioka-Nakamichi, T., Inamoto, E., Toyonaga, H., and Mori, H. (2005). Complete set of ORF clones of Escherichia coli ASKA library (a complete set of E. coli K-12 ORF archive): unique resources for biological research. DNA Res 12, 291-299.
88
Koutsolioutsou, A., Pena-Llopis, S., and Demple, B. (2005). Constitutive soxR mutations contribute to multiple-antibiotic resistance in clinical Escherichia coli isolates. Antimicrob Agents Chemother 49, 2746-2752.
Maneewannakul, K., and Levy, S.B. (1996). Identification for mar mutants among quinolone-resistant clinical isolates of Escherichia coli. Antimicrob Agents Chemother 40, 1695-1698.
Martin, R.G., and Rosner, J.L. (2002). Genomics of the marA/soxS/rob regulon of Escherichia coli: identification of directly activated promoters by application of molecular genetics and informatics to microarray data. Mol Microbiol 44, 1611-1624.
Morar, M., and Wright, G.D. (2010). The genomic enzymology of antibiotic resistance. Annual review of genetics 44, 25-51.
Nakanishi, A., Oshida, T., Matsushita, T., Imajoh-Ohmi, S., and Ohnuki, T. (1998). Identification of DNA gyrase inhibitor (GyrI) in Escherichia coli. The Journal of biological chemistry 273, 1933-1938.
Nichols, R.J., Sen, S., Choo, Y.J., Beltrao, P., Zietek, M., Chaba, R., Lee, S., Kazmierczak, K.M., Lee, K.J., Wong, A., et al. (2011). Phenotypic landscape of a bacterial cell. Cell 144, 143-156.
Novick, A., and Weiner, M. (1957). Enzyme Induction as an All-or-None Phenomenon. Proc Natl Acad Sci U S A 43, 553-566.
Oh, T.J., Jung, I.L., and Kim, I.G. (2001). The Escherichia coli SOS gene sbmC is regulated by H-NS and RpoS during the SOS induction and stationary growth phase. Biochemical and biophysical research communications 288, 1052-1058.
Palmer, A.C., Angelino, E., and Kishony, R. (2010). Chemical decay of an antibiotic inverts selection for resistance. Nat Chem Biol 6, 105-107.
Soo, V.W., Hanson-Manful, P., and Patrick, W.M. (2011). Artificial gene amplification reveals an abundance of promiscuous resistance determinants in Escherichia coli. Proc Natl Acad Sci U S A 108, 1484-1489.
Stoebel, D.M., Dean, A.M., and Dykhuizen, D.E. (2008). The cost of expression of Escherichia coli lac operon proteins is in the process, not in the products. Genetics 178, 1653-1660.
Tamae, C., Liu, A., Kim, K., Sitz, D., Hong, J., Becket, E., Bui, A., Solaimani, P., Tran, K.P., Yang, H., et al. (2008). Determination of antibiotic hypersensitivity among 4,000 single-gene-knockout mutants of Escherichia coli. J Bacteriol 190, 5981-5988.

89
Chapter 4.
The dependence of antibiotic resistance on target expression
Adam C. Palmer1 & Roy Kishony1,2
1Department of Systems Biology, Harvard Medical School, 200 Longwood Ave, Boston, MA 02115.
2School of Engineering and Applied Sciences, Harvard University, Cambridge, MA 02138.
Increased expression of a drug's target gene sometimes confers drug resistance; this can
facilitate the evolution of drug resistance in bacteria, protozoa, and cancer, and can be used to
identify drugs' molecular targets. However, it is unclear why this phenomena occurs with
some drugs but not others. Here we quantitatively over-expressed Escherichia coli genes
encoding antibiotic targets and observed that drug resistance does not only increase: it can
remain unchanged, decrease, or first increase and then decrease. We explain these effects with
simple models of drug action that consider toxicity from gene over-expression, and drugs that
do not inhibit an enzyme but instead induce harmful enzyme-catalyzed reactions. The
relation between drug resistance and target expression may reveal unexpectedly complex
mechanisms of drug action.

90
Many drugs that inhibit an enzyme’s function can be resisted by over-expression of the gene
encoding their target protein. For drugs where this is true, this principle has two important
effects. Firstly, disease-causing organisms from bacteria to tumor cells can evolve strong drug
resistance by gene amplification or over-expression of the drug’s target (Chen et al., 2009;
Coderre et al., 1983; Flensburg and Skold, 1987; Schimke et al., 1978; Then, 1982). Secondly,
the molecular target of the drug can be identified by a genetic screen for over-expression
mutants that are drug resistant (Banerjee et al., 1994; Belanger et al., 1996; Luesch et al., 2005;
Payne et al., 2004; Rine et al., 1983; Tokunaga et al., 1983). Resistance by target over-
expression is common but not universal, and despite its importance in the evolution of drug
resistance and as a tool in drug discovery, it remains unclear why this property applies to
some drugs but not others. Here we use antibiotics of known mechanisms in Escherichia coli
as a case study to understand the general factors that enable or prevent the acquisition of drug
resistance by target over-expression.
The principle of resistance through target over-expression is most relevant for drugs with a
single protein target. There are three broad mechanisms of action in which a drug does not
act on a single protein target: (1) drugs may target multi-protein complexes (e.g. ribosome,
RNA polymerase, or proteasome inhibitors), (2) a drug’s efficacy may rely upon
polypharmacology (e.g. many beta-lactams and kinase inhibitors), and (3) drugs may act
primarily upon non-protein targets (e.g. polymyxins, nitrofurans, vancomycin, DNA
intercalators, artemisinin). It is easy to understand that for these mechanisms, resistance
cannot result from over-expression of 'the target gene' for the simple reason that no such gene
91
can be defined. We therefore focused on drugs that primarily target a single protein and
investigated how drug resistance changes when the target gene is over-expressed.
We selected six antibiotics that primarily target a single protein, spanning a variety of
essential targets (Table 1; for two drugs we investigated both the primary and a secondary
target). For each drug we constructed a strain expressing the target gene from an IPTG-
inducible promoter (Figure 4.1a) (Kitagawa et al., 2005). This target over-expression strain
was grown in liquid cultures spanning two dimensional gradients of drug-dose and IPTG-
induced gene expression; the latter was quantified by beta-galactosidase assays of a strain
expressing lacZ in place of a drug target (Supplementary Figure 4.1). A sensitive
bioluminescence-based assay was used to measure bacterial growth rates and thereby to
determine how drug susceptibility is altered as a function of target gene expression.
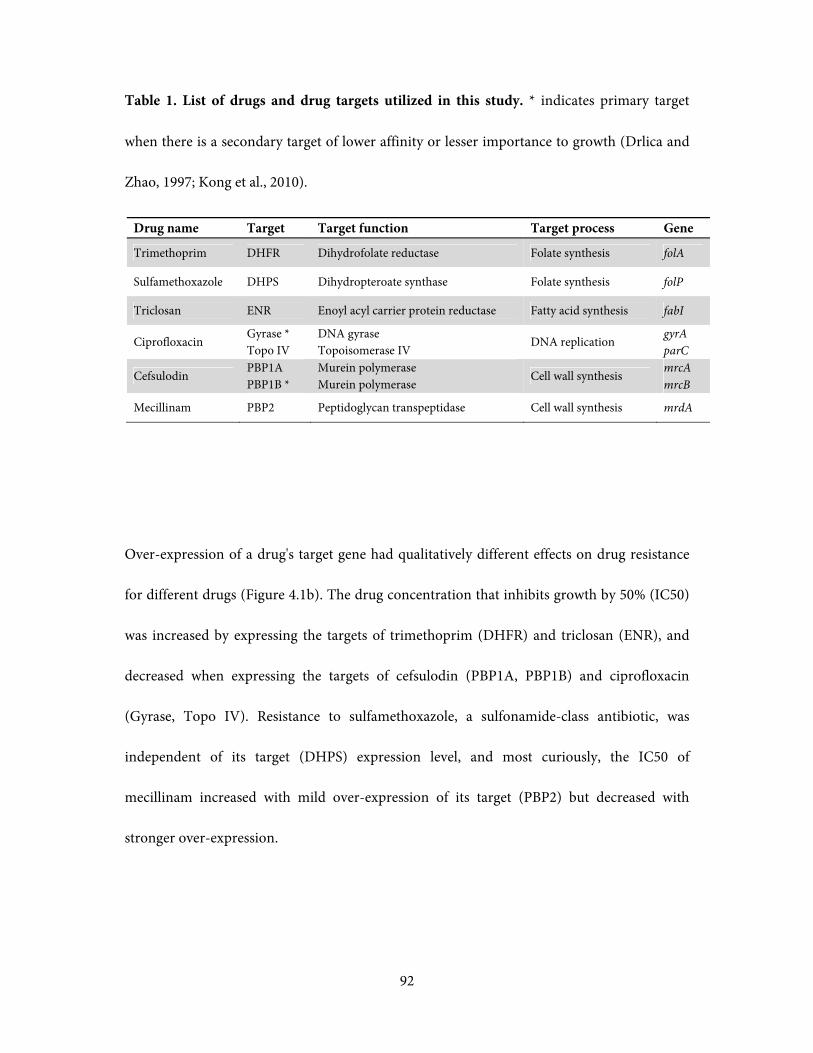
92
Table 1. List of drugs and drug targets utilized in this study. * indicates primary target
when there is a secondary target of lower affinity or lesser importance to growth (Drlica and
Zhao, 1997; Kong et al., 2010).
Over-expression of a drug's target gene had qualitatively different effects on drug resistance
for different drugs (Figure 4.1b). The drug concentration that inhibits growth by 50% (IC50)
was increased by expressing the targets of trimethoprim (DHFR) and triclosan (ENR), and
decreased when expressing the targets of cefsulodin (PBP1A, PBP1B) and ciprofloxacin
(Gyrase, Topo IV). Resistance to sulfamethoxazole, a sulfonamide-class antibiotic, was
independent of its target (DHPS) expression level, and most curiously, the IC50 of
mecillinam increased with mild over-expression of its target (PBP2) but decreased with
stronger over-expression.
Drug name Target Target function Target process Gene
Trimethoprim DHFR Dihydrofolate reductase Folate synthesis folA
Sulfamethoxazole DHPS Dihydropteroate synthase Folate synthesis folP
Triclosan ENR Enoyl acyl carrier protein reductase Fatty acid synthesis fabI
Ciprofloxacin Gyrase * Topo IV
DNA gyrase Topoisomerase IV
DNA replication gyrA parC
Cefsulodin PBP1A PBP1B *
Murein polymerase Murein polymerase
Cell wall synthesis mrcA mrcB
Mecillinam PBP2 Peptidoglycan transpeptidase Cell wall synthesis mrdA

93
Figure 4.1. Over-expression of a drug’s target gene can increase, decrease, or have no
effect on drug resistance. (a) E. coli strains were constructed with IPTG adjustable over-
expression of drug target genes. (b) For each drug-gene pair, bacterial growth rates were
measured over gradients of drug dose (vertical axis) and IPTG-induced gene dose (horizontal
axis). Additional target expression is quantified in Miller Units (MU) from kinetic beta-
galactosidase assays of a matching plasmid encoding lacZ (Supplementary Figure 4.1).
Heatmap color indicates growth rate, from uninhibited growth (yellow) to no growth (black).
WT denotes a strain without any additional drug target expression, since its plasmid contains
neither a promoter nor a drug target gene. At each level of gene expression, the drug
concentration that inhibits growth to 50% of the uninhibited wildtype growth (IC50) is
overlaid in white.

94
Figure 4.1. Over-expression of a drug’s target gene can increase, decrease, or have no
effect on drug resistance. (Continued)
95
There was no trend within target pathways as to which target genes conferred drug resistance
upon over-expression; for example both DHPS and DHFR are enzymes in the folate
biosynthesis pathway, but only DHFR confers resistance to its inhibitor when over-expressed.
These observations are consistent with clinical isolates of drug resistant bacteria:
trimethoprim resistant mutants have been reported with promoter mutations and elevated
DHFR expression (Flensburg and Skold, 1987; Then, 1982), but DHPS regulatory mutations
have not been reported in sulfonamide resistant mutants, despite characterization of many
resistant mutants (Skold, 2000). Similar supportive results have also been observed for
triclosan where resistant mutants have been found with elevated ENR expression (Chen et al.,
2009), and for ciprofloxacin where, while amino acid changes in Gyrase and Topoisomerase
IV are associated with resistance, no regulatory mutations have been reported (Ruiz, 2003).
We sought to understand the relation between drug resistance and drug target expression
levels using simple mathematical models of the fitness costs of gene expression and enzyme
inhibition. We define the target enzyme concentration as the sum of a wildtype level of
enzyme (Ewt) and an additional amount (Eadditional). We built mass action models of
competitive and non-competitive inhibition and calculated drug susceptibility under the
simplifying assumption that 50% growth inhibition (IC50) occurs when the net flux through
an essential enzyme is 50% inhibited. Both the competitive and non-competitive inhibition
models yield a linear dependence of IC50 on the fold over-production of the enzyme:
IC50/IC50wt = 2×(Ewt+Eadditional) / Ewt −1 (Figure 4.2a, h–; Supplementary Figure 4.2a,b). For
example, if the enzyme is over-expressed 100-fold then 99.5% of the enzyme will have to be

96
inhibited in order to have half of the flux of the wild-type, which will require 200 times more
drug. We observed that many drug targets incurred small to lethal fitness costs when over-
expressed, even in the absence of drug (Figure 4.1b). When the models include the fitness cost
of over-expression as an independent mechanism of toxicity (treated as a second drug that is
'Bliss additive' with the actual drug(Bliss, 1939)), we find that
IC50/IC50wt = 2×(Ewt+Eadditional) / Ewt × (1 - cost(Eadditional) −1 (Figure 4.2a, h–c+; Supplementary
Figure 4.2a,b). This simple model quantitatively explains the increase in resistance from over-
expressing the targets of both trimethoprim (DHFR) and triclosan (ENR) (Figure 4.2b, h–c–),
as well as the increase and subsequent decrease in IC50 resulting from over-expression of
mecillinam's target (PBP2) (Figure 4.2b, h–c+). Thus, drug target over-expression can confer
resistance by compensating for inhibited target genes, but the potential for resistance may be
limited if target gene over-expression is costly. Additionally, the level of resistance depends
on the magnitude of Ewt, which can explain the differences between trimethoprim and
triclosan (Supplementary Figure 4.3).
If drug target over-expression induces large fitness costs before there is a significant fold-
increase in expression, then there might be no expression level that increases drug resistance.
This alone might explain the lack of resistance from over-expressing the targets of
ciprofloxacin and cefsulodin, but it cannot explain the absence of sulfamethoxazole
resistance, whose target DHPS incurs no significant fitness cost upon over-expression.
Sulfonamide antibiotics inhibit the synthesis of dihydropteroate from pteridine diphosphate
97
and para-aminobenzoic acid (PABA) by competing with PABA for binding to the enzyme
DHPS(Brown, 1962). Interestingly, sulfonamides do not simply inhibit DHPS, but are
covalently attached to pteridine diphosphate in place of PABA, yielding a dihydropterin-
sulfonamide product (Bock et al., 1974; Roland et al., 1979) (Supplementary Figure 4.4).
While dihydropterin-sulfonamide is not toxic to E. coli (Roland et al., 1979), this reaction is
harmful to growth by depleting the essential metabolite pteridine diphosphate. We modeled
this system treating pteridine diphosphate as being synthesized at a constant rate by the
upstream folate synthesis enzymes, and consumed by DHPS-catalyzed condensation to
dihydropteroate or dihydropterin-sulfonamide. Strikingly, this model shows that when a drug
induces a harmful enzyme-catalyzed reaction with a rate-limiting substrate, pathway
inhibition is independent of the enzyme concentration (Figure 4.2a, h+; Supplementary Figure
4.2c). Taking sulfonamides as an example, the fraction of pteridine diphosphate that is
converted to the correct product dihydropteroate is defined not by the abundance of
uninhibited enzyme, but only by the ratio of sulfonamide to PABA. This result is consistent
with the observation that increased PABA synthesis confers sulfonamide resistance (Landy et
al., 1943) and explains why, in contrast, increased expression of DHPS confers no protection
against a sulfonamide (Figure 4.2b, h+c–). Sulfonamides may thus be more accurately
described as poisons that deplete pteridine diphosphate, rather than inhibitors of DHPS.
While this modeling framework is not appropriate to describe the DNA damage that results
from the binding of ciprofloxacin to Gyrase or Topo IV near the DNA replication fork, it
nonetheless illustrates a principle that applies to ciprofloxacin and other drugs: drugs that
98
only inhibit an enzyme's catalytic activity may be resisted by additional enzyme production,
while drugs that induce an enzyme to catalyze harmful reactions will not be resisted by an
excess of that enzyme; to this category belongs antibiotics such as aminoglycosides (Davis,
1987), fluoroquinolones (Pan et al., 2001), and sulfonamides. Indeed, the over-expression of a
drug target that does not confer resistance but does incur fitness costs will only decrease drug
resistance (Figure 4.2b, h+c+).
99
Figure 4.2. Over-expression of drug target genes can confer both resistance and fitness
costs, resulting in diverse changes in drug resistance. a, Mass-action models of enzyme
inhibition quantified the relation between drug concentration, growth inhibition, and enzyme
expression (wildtype enzyme abundance = Ewt, additional enzyme = Eadditional). Drug-induced
growth inhibition and fitness costs due to gene over-expression are treated as independent
mechanisms of toxicity. Changes in the drug concentration that inhibits growth by 50%
(IC50) are found to depend upon two factors: whether drug binding only inhibits the enzyme
(h–) or also induces harmful reactions when bound (h+), and the degree of fitness costs from
additional drug target expression; for example lethal, partial, or no fitness costs (c+ lethal
/ c+partial / c–). Mechanistic models demonstrate that drug target over-expression protects
against enzyme inhibitors (h–), but not against drugs that damage an enzyme's substrate (h+)
(Supplementary Figure 4.2). b, The theory presented in (a) results in diverse changes in drug
resistance as drug targets are over-expressed. Possible changes in drug resistance upon drug
target over-expression include an increase, decrease, first increase then decrease, or no
change; differences in Ewt influence the level of resistance that may be achieved. This theory
rationalizes the diverse experimentally observed behaviors (IC50 lines from Figure 4.1b).
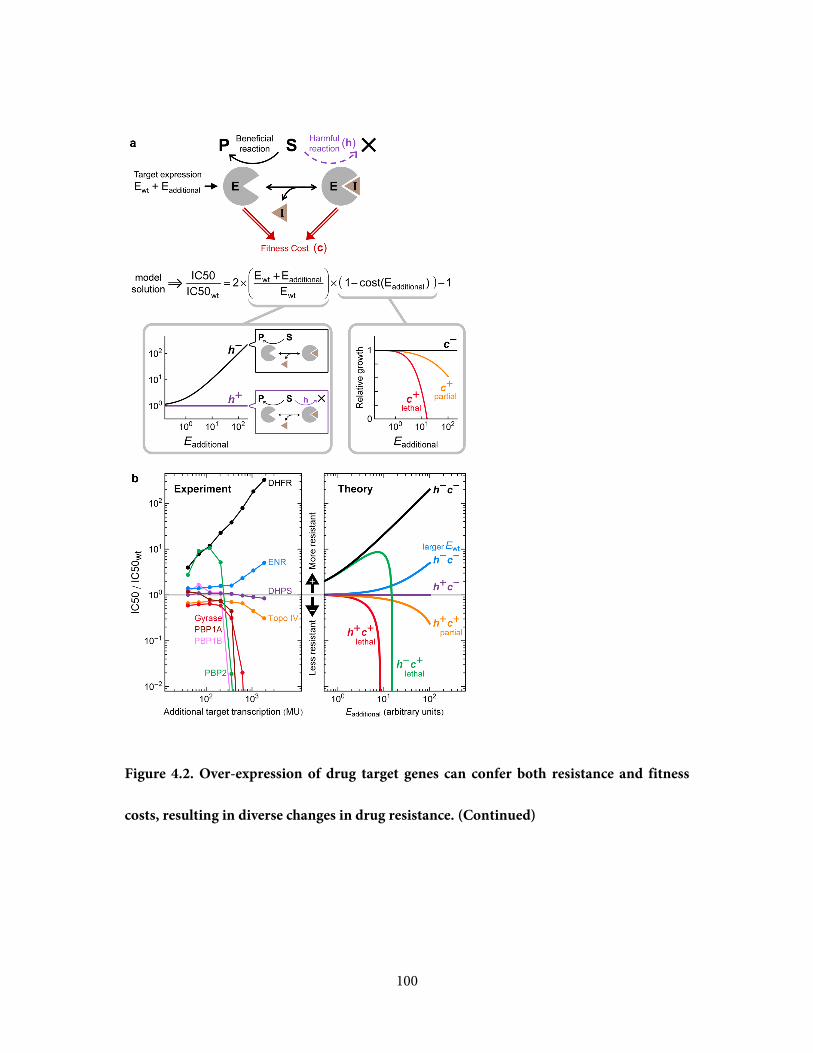
100
Figure 4.2. Over-expression of drug target genes can confer both resistance and fitness
costs, resulting in diverse changes in drug resistance. (Continued)
101
This study shows that increasing the expression of drug’s target gene can have a wide range of
effects on resistance to that drug; the simple expectation that resistance will monotonically
increase is one of several possibilities. These diverse effects can be understood as the result of
two factors: firstly whether a drug solely inhibits a beneficial reaction or induces a harmful
reaction; and secondly whether drug target over-expression incurs fitness costs. These results
suggest that efforts to identify the molecular targets of compounds by searching for drug
resistance via target over-expression will, for better or worse, yield predictably biased results.
This approach will succeed in identifying the targets of compounds that are strictly an
inhibitor of a single non-costly gene, but may fail for compounds that inhibit costly genes,
that act upon multiple targets, or that induce harmful reactions such as damaging a substrate.
However, unexpectedly complex mechanisms of drug action can be revealed if the over-
expression of a known drug target fails to confer resistance. Finally, these results suggest that
the development of compounds that inhibit costly genes, or that inhibit a pathway by
damaging pathway-essential metabolites, will produce drugs less prone to the evolution of
resistance through target over-expression.

102
Acknowledgements
We are grateful to Michael Baym, Remy Chait, Jeremy Gunawardena, Jeremy Jenkins, Laura
Stone, Tami Lieberman, and Zhizhong Yao for helpful discussions. We thank the NBRP
(NIG, Japan):E. coli for the ASKA collection. This work was supported by the Novartis
Institutes for Biomedical Research and US National Institutes of Health grant R01-
GM081617.
Author Contributions
A.C.P and R.K. designed research; A.C.P. performed research, analyzed data, and built
mathematical models; A.C.P. and R.K. wrote the manuscript.
103
Methods
Strains and Media
E. coli strain BW25113 was the host for all studies(Datsenko and Wanner, 2000). As lacZYA is
deleted in BW25113, IPTG does not incur fitness costs for lacZYA production(Stoebel et al.,
2008), and graded induction is possible without the LacY permease, that would otherwise
cause all-or-none induction of LacI-regulated promoters(Choi et al., 2008; Novick and
Weiner, 1957). BW25113 was transformed with plasmid pCSλ, encoding a constitutively
expressed bacterial bioluminescence operon(Kishony and Leibler, 2003). Plasmids encoding
each target gene (in a pCA24N backbone) were obtained from the ASKA E. coli Open
Reading Frame collection(Kitagawa et al., 2005), sequenced to confirm gene identity, and
were transformed into BW25113 pCSλ. The cefsulodin target gene PBP1B (mrcB) was not
found at the expected position in the ASKA collection, and was instead isolated by plating a
pooled mixture of the entire ASKA collection on 1.5% agar plates of Luria Bertani broth with
a range of isopropyl β-D-1-thiogalactopyranoside (IPTG) concentrations, and screening for
colonies resistant to a 100μg point source of cefsulodin. At 15μM IPTG, many mildly resistant
colonies were isolated that carried pCA24N plasmids encoding PBP1B, according to
sequencing. This IPTG concentration corresponds to the point in Figure 4.1B where PBP1B
over-expression confers modest cefsulodin resistance. Wildtype drug susceptibilities were
determined using a matching strain with no additional drug target gene expression; BW25113
pCSλ pCA24N-Δpromoter-yfp; where the IPTG-inducible promoter in pCA24N had been
deleted, and yellow fluorescent protein was encoded in place of a drug target gene. All
104
experiments were performed in M63 minimal medium (2g.L–1 (NH4)2SO4, 13.6g.L–1 KH2PO4,
0.5mg.L–1 FeSO4•7H2O, adjusted to pH 7.0 with KOH) supplemented with 0.2% glucose,
0.01% casamino acids, 1mM MgSO4 and 0.5mg.L–1 thiamine, and also 10mg.L–1
chlorampenicol and 25mg.L–1 kanamycin for the maintenance of the pCA24N and pCSλ
plasmids, respectively. Drug solutions were made from powder stocks (from Sigma Aldrich
unless otherwise specified: cefsulodin, C8145; chloramphenicol, C0378; ciprofloxacin, 17850;
isopropyl β-D-1-thiogalactopyranoside (IPTG), Omega Bio-Tek AC121; kanamycin, K1876;
mecillinam, 33447; ortho-nitrophenyl-β-galactoside, N1127; polymyxin-B, P0972;
sulfamethoxazole, S7507; triclosan, TCI America T1872; trimethoprim, T7883). Drug and
IPTG gradients were made by serial dilution in M63 medium.
Growth rate assay
The constitutive bioluminescence that results from pCSλ enables cell densities in growing
cultures to be precisely measured over many orders of magnitude by photon
counting(Kishony and Leibler, 2003). Cultures were grown in black 96-well plates with white
wells (Perkin Elmer 6005039) sealed with clear adhesive lids (Perkin Elmer 6005185). Wells
contained 200μL of media inoculated with approximately 100 to 300 cells from freshly thawed
-80°C frozen cultures. Plates were grown in a 30°C room at 70% humidity, and growth was
assayed by a Perkin Elmer TopCount NXT Microplate Scintillation and Luminescence
Counter that measured each well for 1 second. Experiments of 10 to 16 plates allowed each
plate to be measured every 30 to 50 minutes. Plate stacks were ventilated by fans to eliminate
spatial temperature gradients and ensure uniform growth conditions across each plate. In

105
each experiment, distributed throughout the plate stack were 3 control plates of uniform
media conditions to verify the absence of growth rate gradients within plates or across the
plate stack. Growth rate is the slope of the logarithm of photon counts per second (c.p.s.), and
is taken from the fastest growing line of best fit observed in any 6 hour timespan; this time
corresponds to 5 doublings of a healthy culture. The slope of the logarithm of c.p.s. is
unaffected by changes in luminescence per cell, such as might result from antibiotic
treatments or changes in gene expression(Kishony and Leibler, 2003).
Beta-galactosidase assay
The transcription rates of genes encoded in the pCA24N plasmid at different IPTG
concentrations were measured by kinetic beta-galactosidase (LacZ) assays of pCA24N-lacZ,
using a method adapted from (Dodd et al., 2001). Liquid cultures of BW25113 pCA24N-lacZ
were prepared in a 96-well plate in the same manner as for growth rate assays. The plate was
incubated at 30ºC with shaking until the plate average OD600 equalled 0.1 (mid log phase), as
measured by a Perkin Elmer Victor plate reader. 20μL of each well was promptly transferred
to the corresponding well of a microtiter plate pre-warmed to 30ºC, in which each well
contained 30μL of sterile media and 190μL of lysis / assay buffer, consisting of 100mM Tris-
HCl pH 8.0, 1mM MgSO4, 10mM KCl, 10g.L–1 β-mercaptoethanol, 100mg.L–1 polymyxin B,
and 850mg.L–1 ortho-nitrophenyl-β-galactoside. The lysis / assay plate was transferred to a
Tecan Sunrise plate reader in a 30°C room at 70% humidity, and OD410 was measured every
minute for 2 hours, with 20 seconds of shaking between each reading. For each well,
106
promoter activity in Miller Units was calculated from the slope of OD410 versus time,
multiplied by 200,000, divided by the OD600 of the culture that was transferred to that well,
and divided by the volume (in μL) of the culture assayed (here 20μL) (Supplementary Figure
4.1).

107
References
Banerjee, A., Dubnau, E., Quemard, A., Balasubramanian, V., Um, K.S., Wilson, T., Collins, D., de Lisle, G., and Jacobs, W.R., Jr. (1994). inhA, a gene encoding a target for isoniazid and ethionamide in Mycobacterium tuberculosis. Science 263, 227-230.
Belanger, A.E., Besra, G.S., Ford, M.E., Mikusova, K., Belisle, J.T., Brennan, P.J., and Inamine, J.M. (1996). The embAB genes of Mycobacterium avium encode an arabinosyl transferase involved in cell wall arabinan biosynthesis that is the target for the antimycobacterial drug ethambutol. Proceedings of the National Academy of Sciences of the United States of America 93, 11919-11924.
Bliss, C.I. (1939). The toxicity of poisons applied jointly. Ann Appl Biol 26, 585-615.
Bock, L., Miller, G.H., Schaper, K.J., and Seydel, J.K. (1974). Sulfonamide structure-activity relationships in a cell-free system. 2. Proof for the formation of a sulfonamide-containing folate analog. Journal of medicinal chemistry 17, 23-28.
Brown, G.M. (1962). The biosynthesis of folic acid. II. Inhibition by sulfonamides. The Journal of biological chemistry 237, 536-540.
Chen, Y., Pi, B., Zhou, H., Yu, Y., and Li, L. (2009). Triclosan resistance in clinical isolates of Acinetobacter baumannii. Journal of medical microbiology 58, 1086-1091.
Choi, P.J., Cai, L., Frieda, K., and Xie, X.S. (2008). A stochastic single-molecule event triggers phenotype switching of a bacterial cell. Science 322, 442-446.
Coderre, J.A., Beverley, S.M., Schimke, R.T., and Santi, D.V. (1983). Overproduction of a bifunctional thymidylate synthetase-dihydrofolate reductase and DNA amplification in methotrexate-resistant Leishmania tropica. Proceedings of the National Academy of Sciences of the United States of America 80, 2132-2136.
Datsenko, K.A., and Wanner, B.L. (2000). One-step inactivation of chromosomal genes in Escherichia coli K-12 using PCR products. Proceedings of the National Academy of Sciences of the United States of America 97, 6640-6645.
Davis, B.D. (1987). Mechanism of bactericidal action of aminoglycosides. Microbiological reviews 51, 341-350.
108
Dodd, I.B., Perkins, A.J., Tsemitsidis, D., and Egan, J.B. (2001). Octamerization of lambda CI repressor is needed for effective repression of P(RM) and efficient switching from lysogeny. Genes & development 15, 3013-3022.
Drlica, K., and Zhao, X. (1997). DNA gyrase, topoisomerase IV, and the 4-quinolones. Microbiology and molecular biology reviews : MMBR 61, 377-392.
Flensburg, J., and Skold, O. (1987). Massive overproduction of dihydrofolate reductase in bacteria as a response to the use of trimethoprim. European journal of biochemistry / FEBS 162, 473-476.
Kishony, R., and Leibler, S. (2003). Environmental stresses can alleviate the average deleterious effect of mutations. Journal of biology 2, 14.
Kitagawa, M., Ara, T., Arifuzzaman, M., Ioka-Nakamichi, T., Inamoto, E., Toyonaga, H., and Mori, H. (2005). Complete set of ORF clones of Escherichia coli ASKA library (a complete set of E. coli K-12 ORF archive): unique resources for biological research. DNA research : an international journal for rapid publication of reports on genes and genomes 12, 291-299.
Kong, K.F., Schneper, L., and Mathee, K. (2010). Beta-lactam antibiotics: from antibiosis to resistance and bacteriology. APMIS : acta pathologica, microbiologica, et immunologica Scandinavica 118, 1-36.
Landy, M., Larkum, N.W., Oswald, E.J., and Streightoff, F. (1943). Increased synthesis of p-aminobenzoic acid associated with the development of sulfonamide resistance in staphylococcus aureus. Science 97, 265-267.
Luesch, H., Wu, T.Y., Ren, P., Gray, N.S., Schultz, P.G., and Supek, F. (2005). A genome-wide overexpression screen in yeast for small-molecule target identification. Chemistry & biology 12, 55-63.
Novick, A., and Weiner, M. (1957). Enzyme Induction as an All-or-None Phenomenon. Proceedings of the National Academy of Sciences of the United States of America 43, 553-566.
Pan, X.S., Yague, G., and Fisher, L.M. (2001). Quinolone resistance mutations in Streptococcus pneumoniae GyrA and ParC proteins: mechanistic insights into quinolone action from enzymatic analysis, intracellular levels, and phenotypes of wild-type and mutant proteins. Antimicrobial agents and chemotherapy 45, 3140-3147.
Payne, D.J., Gwynn, M.N., Holmes, D.J., and Rosenberg, M. (2004). Genomic approaches to antibacterial discovery. Methods Mol Biol 266, 231-259.

109
Rine, J., Hansen, W., Hardeman, E., and Davis, R.W. (1983). Targeted selection of recombinant clones through gene dosage effects. Proceedings of the National Academy of Sciences of the United States of America 80, 6750-6754.
Roland, S., Ferone, R., Harvey, R.J., Styles, V.L., and Morrison, R.W. (1979). The characteristics and significance of sulfonamides as substrates for Escherichia coli dihydropteroate synthase. The Journal of biological chemistry 254, 10337-10345.
Ruiz, J. (2003). Mechanisms of resistance to quinolones: target alterations, decreased accumulation and DNA gyrase protection. The Journal of antimicrobial chemotherapy 51, 1109-1117.
Schimke, R.T., Kaufman, R.J., Alt, F.W., and Kellems, R.F. (1978). Gene amplification and drug resistance in cultured murine cells. Science 202, 1051-1055.
Skold, O. (2000). Sulfonamide resistance: mechanisms and trends. Drug resistance updates : reviews and commentaries in antimicrobial and anticancer chemotherapy 3, 155-160.
Stoebel, D.M., Dean, A.M., and Dykhuizen, D.E. (2008). The cost of expression of Escherichia coli lac operon proteins is in the process, not in the products. Genetics 178, 1653-1660.
Then, R.L. (1982). Mechanisms of resistance to trimethoprim, the sulfonamides, and trimethoprim-sulfamethoxazole. Reviews of infectious diseases 4, 261-269.
Tokunaga, M., Loranger, J.M., and Wu, H.C. (1983). Isolation and characterization of an Escherichia coli clone overproducing prolipoprotein signal peptidase. The Journal of biological chemistry 258, 12102-12105.
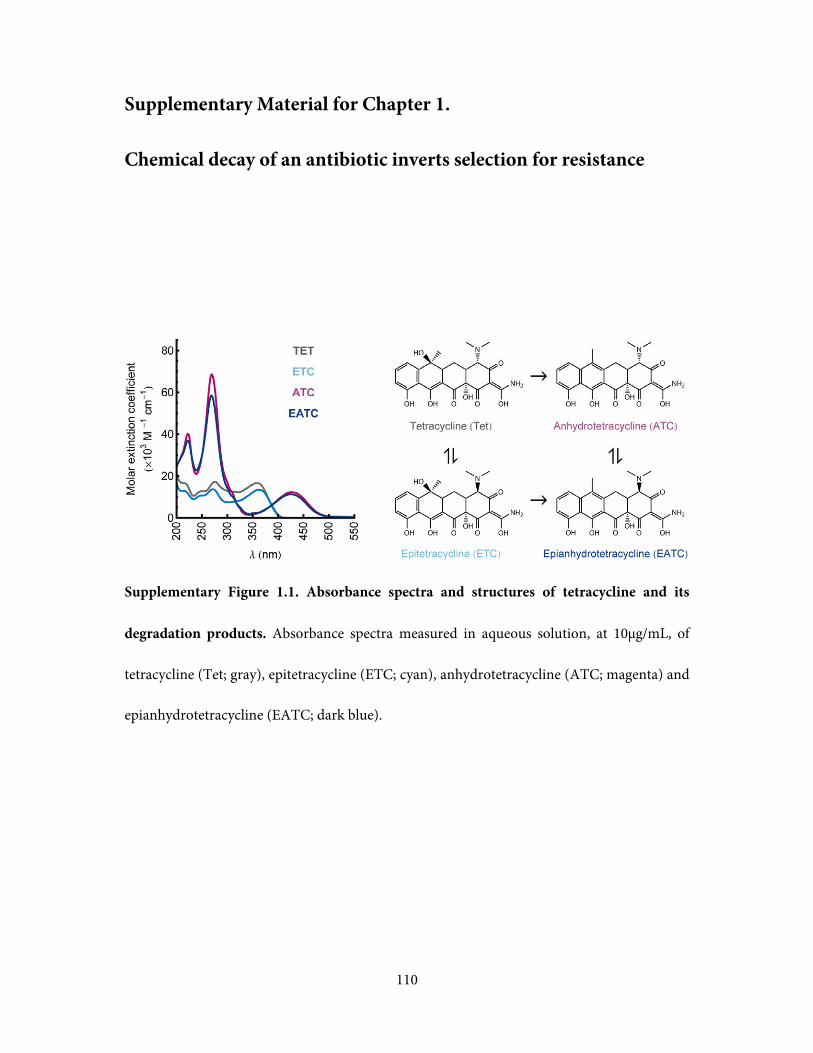
110
Supplementary Material for Chapter 1.
Chemical decay of an antibiotic inverts selection for resistance
Supplementary Figure 1.1. Absorbance spectra and structures of tetracycline and its
degradation products. Absorbance spectra measured in aqueous solution, at 10μg/mL, of
tetracycline (Tet; gray), epitetracycline (ETC; cyan), anhydrotetracycline (ATC; magenta) and
epianhydrotetracycline (EATC; dark blue).
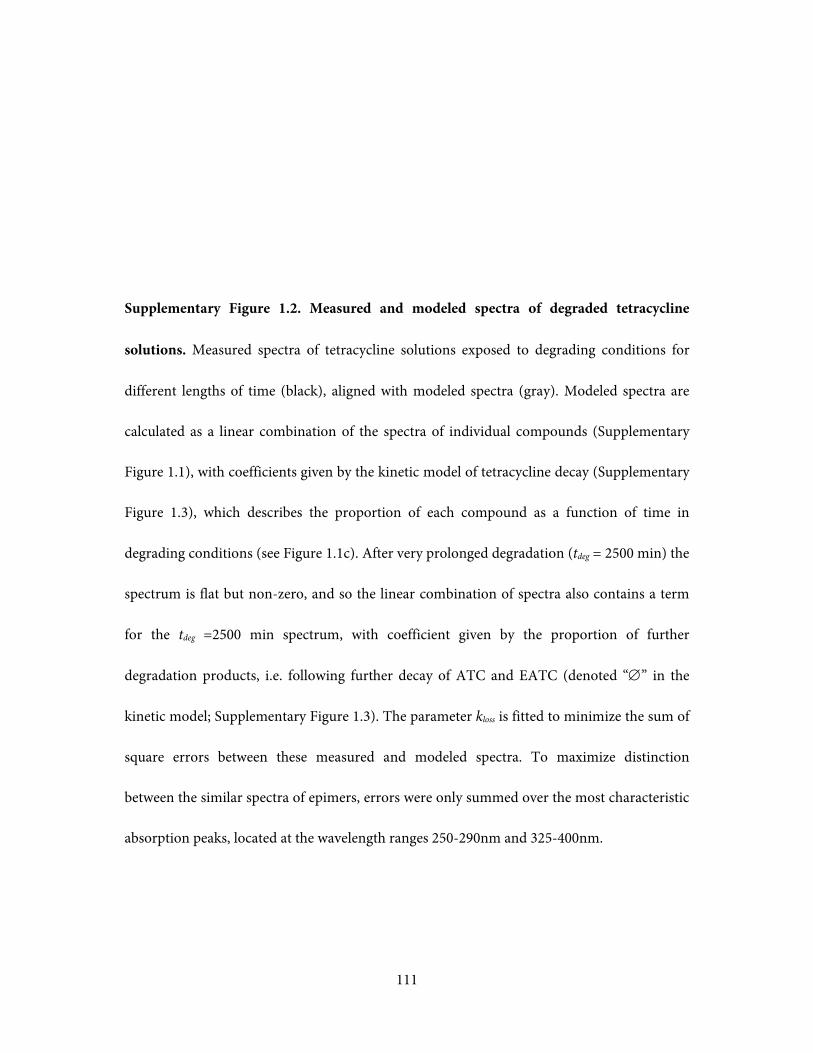
111
Supplementary Figure 1.2. Measured and modeled spectra of degraded tetracycline
solutions. Measured spectra of tetracycline solutions exposed to degrading conditions for
different lengths of time (black), aligned with modeled spectra (gray). Modeled spectra are
calculated as a linear combination of the spectra of individual compounds (Supplementary
Figure 1.1), with coefficients given by the kinetic model of tetracycline decay (Supplementary
Figure 1.3), which describes the proportion of each compound as a function of time in
degrading conditions (see Figure 1.1c). After very prolonged degradation (tdeg = 2500 min) the
spectrum is flat but non-zero, and so the linear combination of spectra also contains a term
for the tdeg =2500 min spectrum, with coefficient given by the proportion of further
degradation products, i.e. following further decay of ATC and EATC (denoted “∅” in the
kinetic model; Supplementary Figure 1.3). The parameter kloss is fitted to minimize the sum of
square errors between these measured and modeled spectra. To maximize distinction
between the similar spectra of epimers, errors were only summed over the most characteristic
absorption peaks, located at the wavelength ranges 250-290nm and 325-400nm.
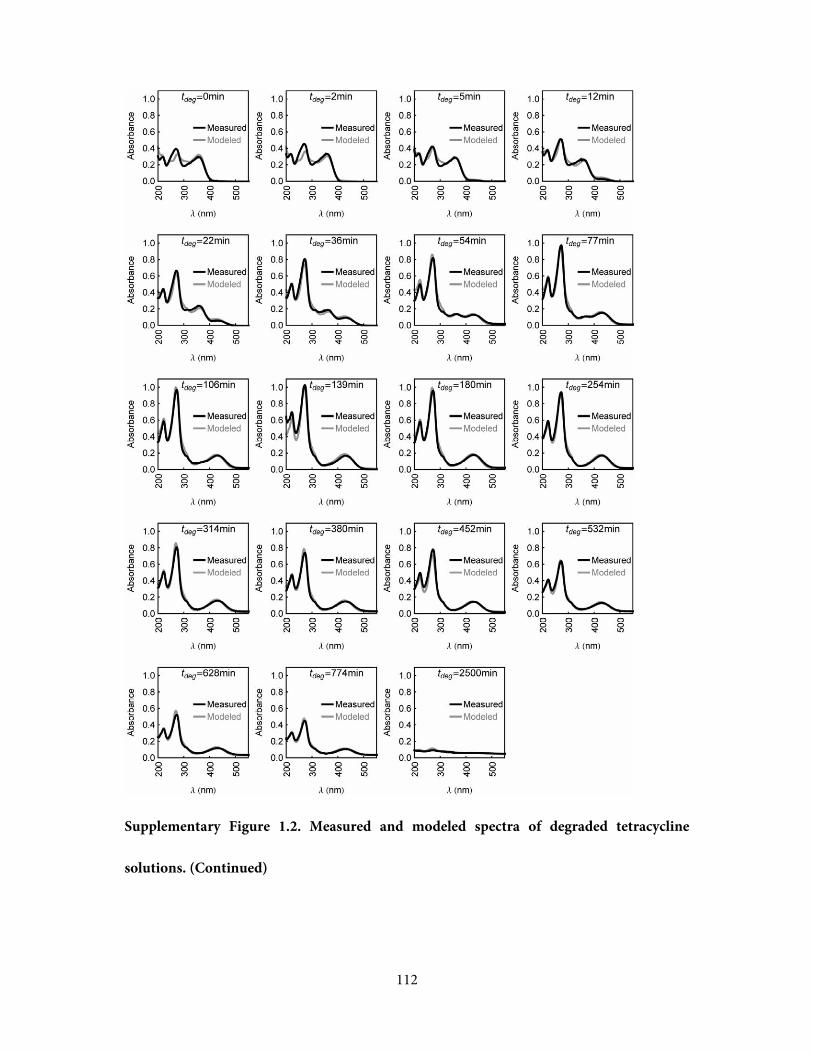
112
Supplementary Figure 1.2. Measured and modeled spectra of degraded tetracycline
solutions. (Continued)
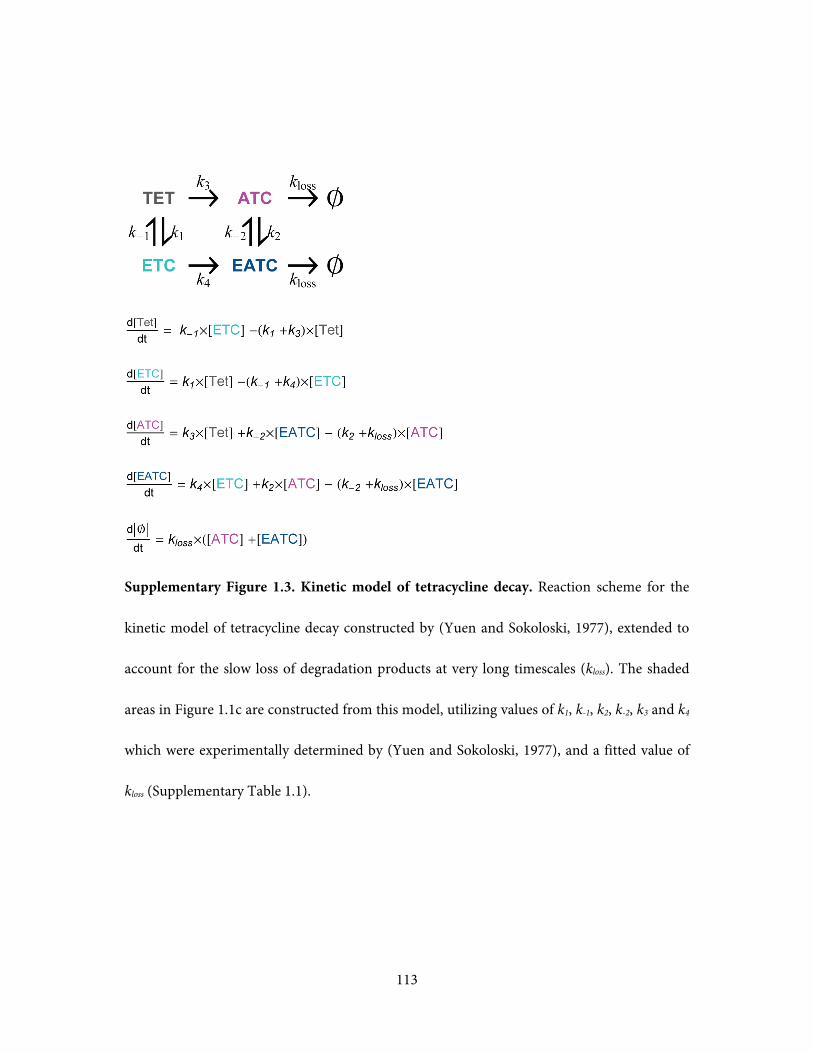
113
Supplementary Figure 1.3. Kinetic model of tetracycline decay. Reaction scheme for the
kinetic model of tetracycline decay constructed by (Yuen and Sokoloski, 1977), extended to
account for the slow loss of degradation products at very long timescales (kloss). The shaded
areas in Figure 1.1c are constructed from this model, utilizing values of k1, k-1, k2, k-2, k3 and k4
which were experimentally determined by (Yuen and Sokoloski, 1977), and a fitted value of
kloss (Supplementary Table 1.1).
114
Supplementary Figure 1.4. Parameter sensitivity of the kinetic model of tetracycline
decay. Plotting the error between measured and modeled spectra of degraded tetracycline
solutions (Supplementary Figure 1.2) demonstrates the consistency of the rate constants
measured by (Yuen and Sokoloski, 1977) with this study. Note that only the characteristic
wavelength ranges 250-290nm and 325-400nm were utilized. The parameter values used in
the kinetic model (Supplementary Table 1.1) are marked in red. kloss was absent from the
kinetic model of (Yuen and Sokoloski, 1977), and so was fitted to minimize the sum of square
errors.

115
Supplementary Figure 1.4. Parameter sensitivity of the kinetic model of tetracycline
decay. (Continued)

116
Supplementary Figure 1.5. TetS and TetR strains have equal growth rates in the absence of
tetracycline. Growth rates were measured with high resolution over the course of 15
doublings using bioluminescence based measurements of cell density (Kishony and Leibler,
2003; Yeh et al., 2006) (Methods). Six representative growth curves each are presented for the
TetS (green) and TetR (red) strains. Inset: Boxplot of growth rate measurements of the TetS
and TetR strains (n=36 each).

117
Supplementary Figure 1.6. Tetracycline degradation products and fusaric acid select
against chromosomally-integrated tetracycline resistance. The cost of expression of
tetracycline resistance is dependent upon the dosage of resistance genes(Lenski et al., 1994;
Moyed et al., 1983). We have observed that Tet degradation products select against resistance
(Fig 2c,d) when resistance is provided from a plasmid whose level of expression of the tetA
efflux pump maximizes fitness in 10μg/mL Tet (Daniels and Bertrand, 1985; Lenski et al.,
1994); Methods). When tetracycline resistance is supplied by a lower dosage of resistance
genes, the extent of selection against resistance will presumably be weaker, as the phenotype
approaches that of a fully sensitive strain. We therefore measured the effect Tet degradation
products on competition between sensitive and resistant strains, when the Tn10 tetracycline
resistance determinant was integrated in single-copy in the chromosome. In this scenario we
can reproduce the net selection against resistance seen in Figure 1.2c,d (trajectory 1) when
Tet degradation products (initial Tet concentration 2000 ng/mL) are supplied together with
40 μg/mL fusaric acid, a naturally-occurring compound which sensitizes bacteria to the
expression of the tetA efflux pump(Bochner et al., 1980). Fold change in NtetS / Ntet
R is
determined relative to wells lacking Tet or its degradation products, but containing fusaric
118
acid (Methods), and so excludes the selection imposed by fusaric acid alone, but reflects its
combined effect with Tet and Tet degradation products. Fusaric acid is produced by many
species of the Fusarium fungi (Bacon et al., 1996) and thus may be an ecologically relevant
factor contributing to selection against low-copy or high-copy tetracycline resistance. In poor
nutritional conditions and specific salt concentrations, fusaric acid can be made to select
against tetracycline resistance in Salmonella typhimurium and Escherichia coli (Bochner et al.,
1980; Maloy and Nunn, 1981). In these rich nutritional conditions, fusaric acid combined
with undegraded tetracycline continues to select for resistance, but as tetracycline degrades,
the combination of fusaric acid and decay products selects against resistance. This
demonstrates that degradation influences the interaction between an antibiotic and its decay
products (collectively) with other compounds which may conditionally select against
resistance.
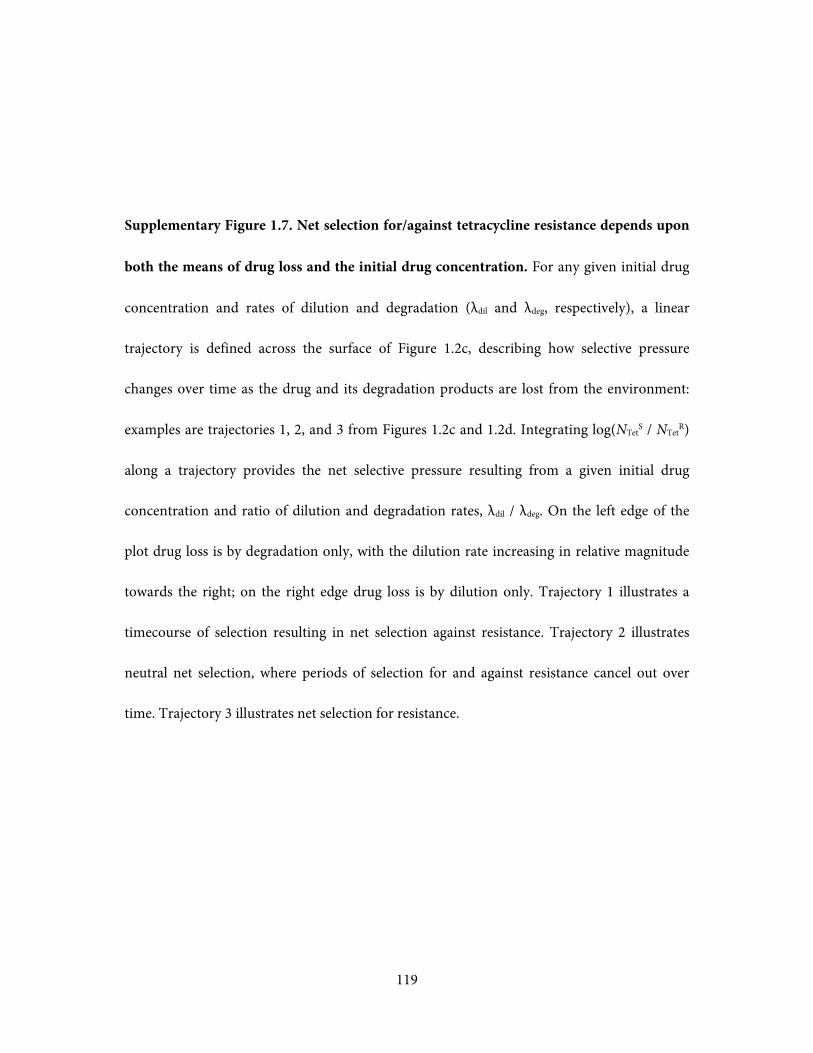
119
Supplementary Figure 1.7. Net selection for/against tetracycline resistance depends upon
both the means of drug loss and the initial drug concentration. For any given initial drug
concentration and rates of dilution and degradation (λdil and λdeg, respectively), a linear
trajectory is defined across the surface of Figure 1.2c, describing how selective pressure
changes over time as the drug and its degradation products are lost from the environment:
examples are trajectories 1, 2, and 3 from Figures 1.2c and 1.2d. Integrating log(NTetS / NTet
R)
along a trajectory provides the net selective pressure resulting from a given initial drug
concentration and ratio of dilution and degradation rates, λdil / λdeg. On the left edge of the
plot drug loss is by degradation only, with the dilution rate increasing in relative magnitude
towards the right; on the right edge drug loss is by dilution only. Trajectory 1 illustrates a
timecourse of selection resulting in net selection against resistance. Trajectory 2 illustrates
neutral net selection, where periods of selection for and against resistance cancel out over
time. Trajectory 3 illustrates net selection for resistance.
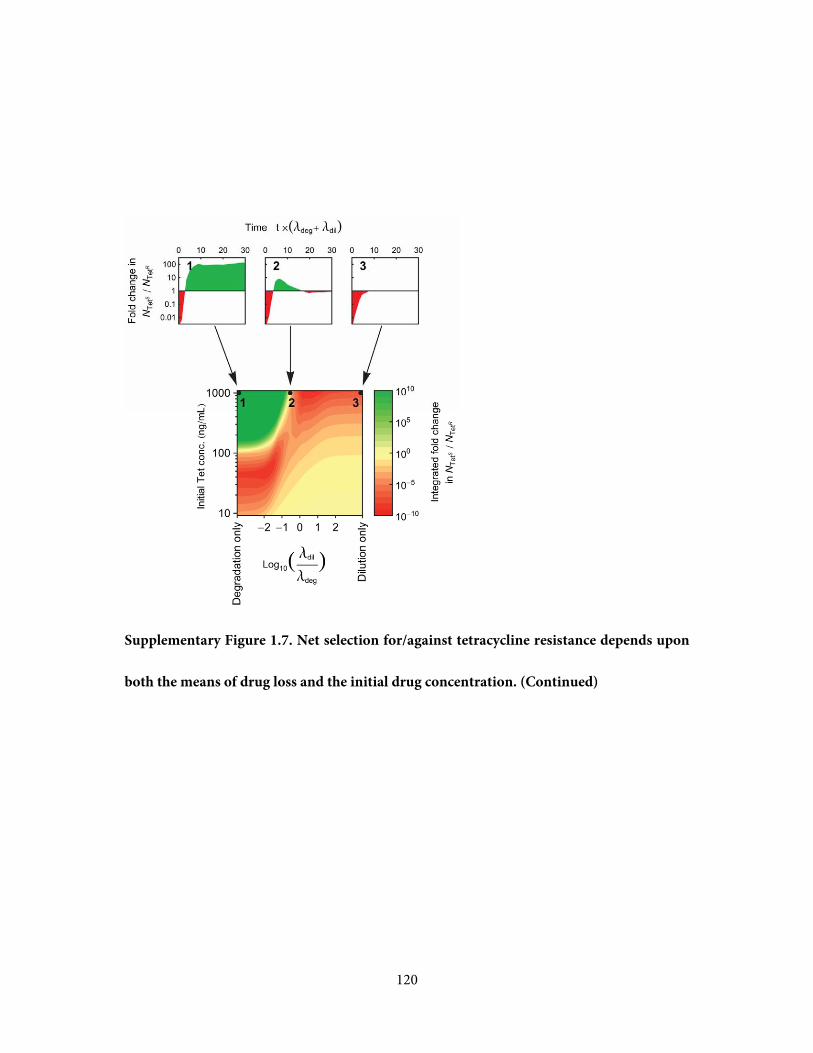
120
Supplementary Figure 1.7. Net selection for/against tetracycline resistance depends upon
both the means of drug loss and the initial drug concentration. (Continued)
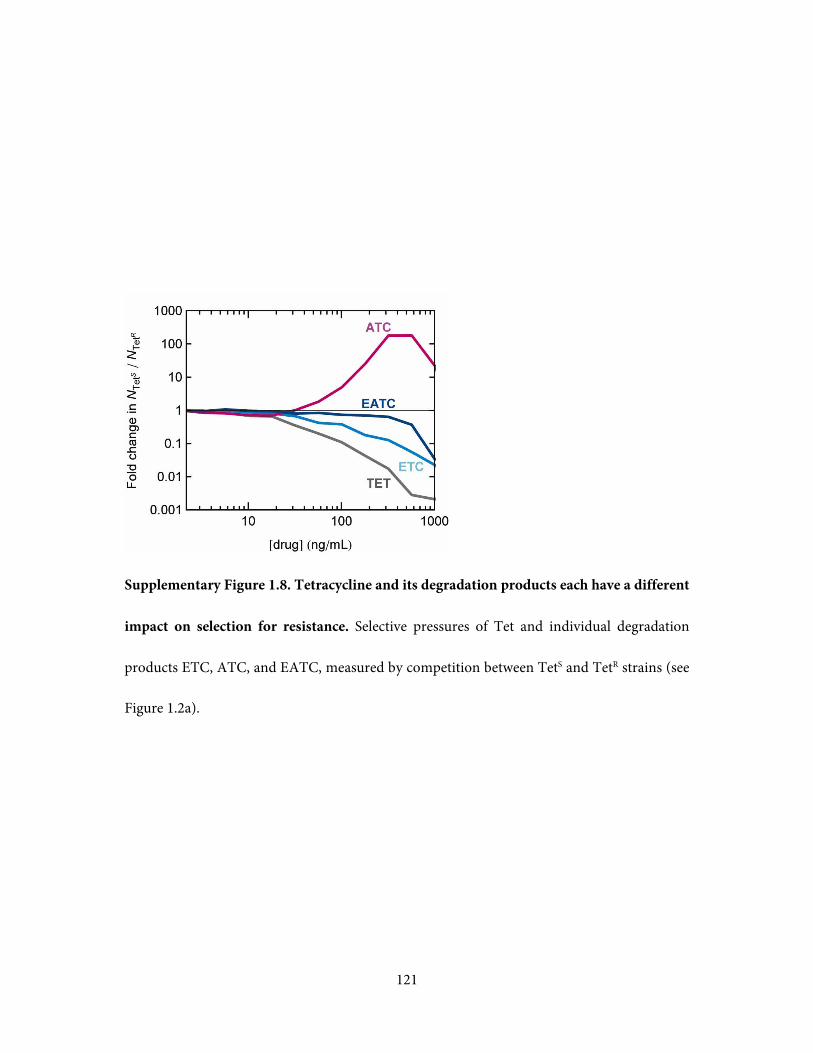
121
Supplementary Figure 1.8. Tetracycline and its degradation products each have a different
impact on selection for resistance. Selective pressures of Tet and individual degradation
products ETC, ATC, and EATC, measured by competition between TetS and TetR strains (see
Figure 1.2a).

122
Supplementary Figure 1.9. Combinations of tetracycline and its degradation products
produce selective pressures which are well predicted by Bliss additivity. Selective pressure
for (red) or against (green) resistance across a drug gradient of Tet and a 1:1 mixture of ATC
and EATC; on the left experimentally measured (as per Figure 1.2a) and on the right
(‘Additive Model’) calculated from the effects along the axes of the ‘Experimental’ panel,
assuming additive drug interactions, i.e. by summing the changes in log(NTetS / NTet
R).
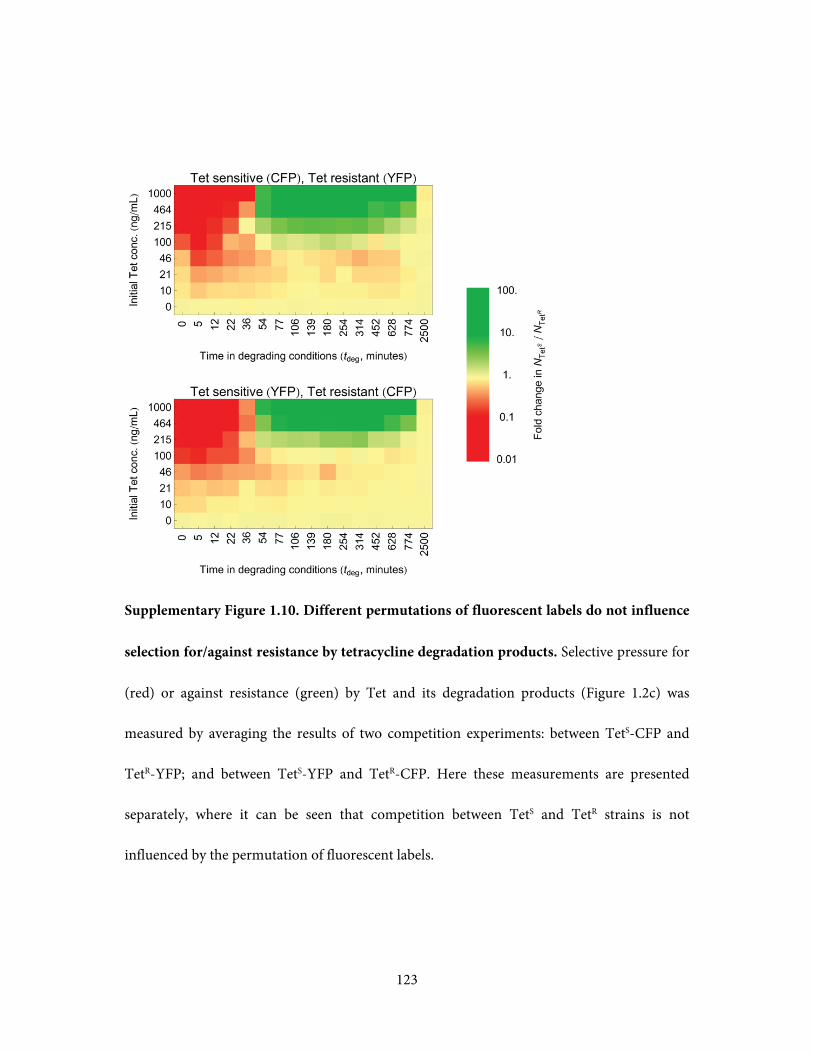
123
Supplementary Figure 1.10. Different permutations of fluorescent labels do not influence
selection for/against resistance by tetracycline degradation products. Selective pressure for
(red) or against resistance (green) by Tet and its degradation products (Figure 1.2c) was
measured by averaging the results of two competition experiments: between TetS-CFP and
TetR-YFP; and between TetS-YFP and TetR-CFP. Here these measurements are presented
separately, where it can be seen that competition between TetS and TetR strains is not
influenced by the permutation of fluorescent labels.
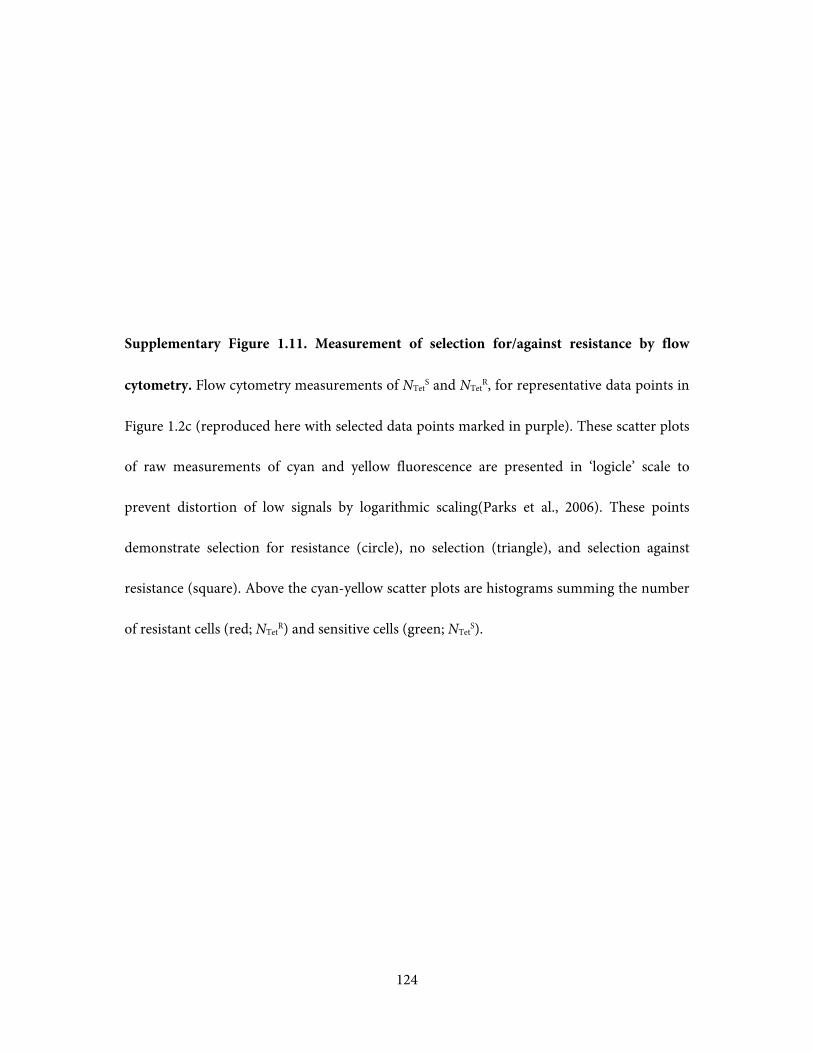
124
Supplementary Figure 1.11. Measurement of selection for/against resistance by flow
cytometry. Flow cytometry measurements of NTetS and NTet
R, for representative data points in
Figure 1.2c (reproduced here with selected data points marked in purple). These scatter plots
of raw measurements of cyan and yellow fluorescence are presented in ‘logicle’ scale to
prevent distortion of low signals by logarithmic scaling(Parks et al., 2006). These points
demonstrate selection for resistance (circle), no selection (triangle), and selection against
resistance (square). Above the cyan-yellow scatter plots are histograms summing the number
of resistant cells (red; NTetR) and sensitive cells (green; NTet
S).
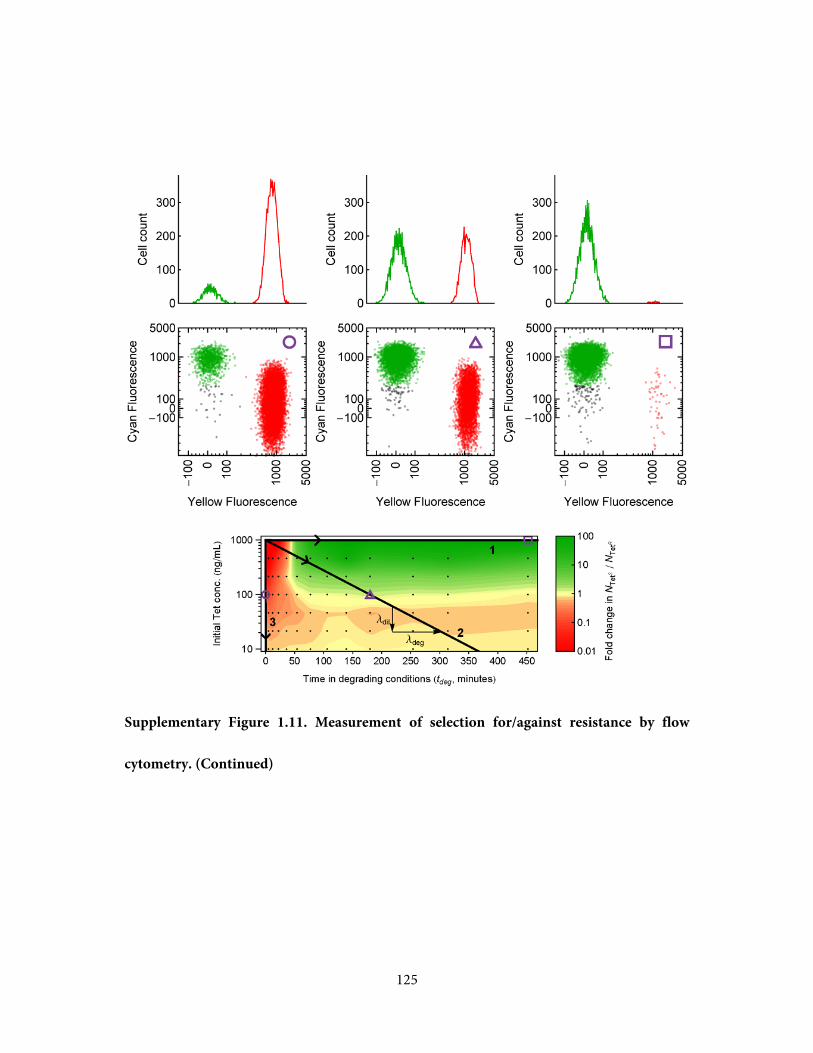
125
Supplementary Figure 1.11. Measurement of selection for/against resistance by flow
cytometry. (Continued)
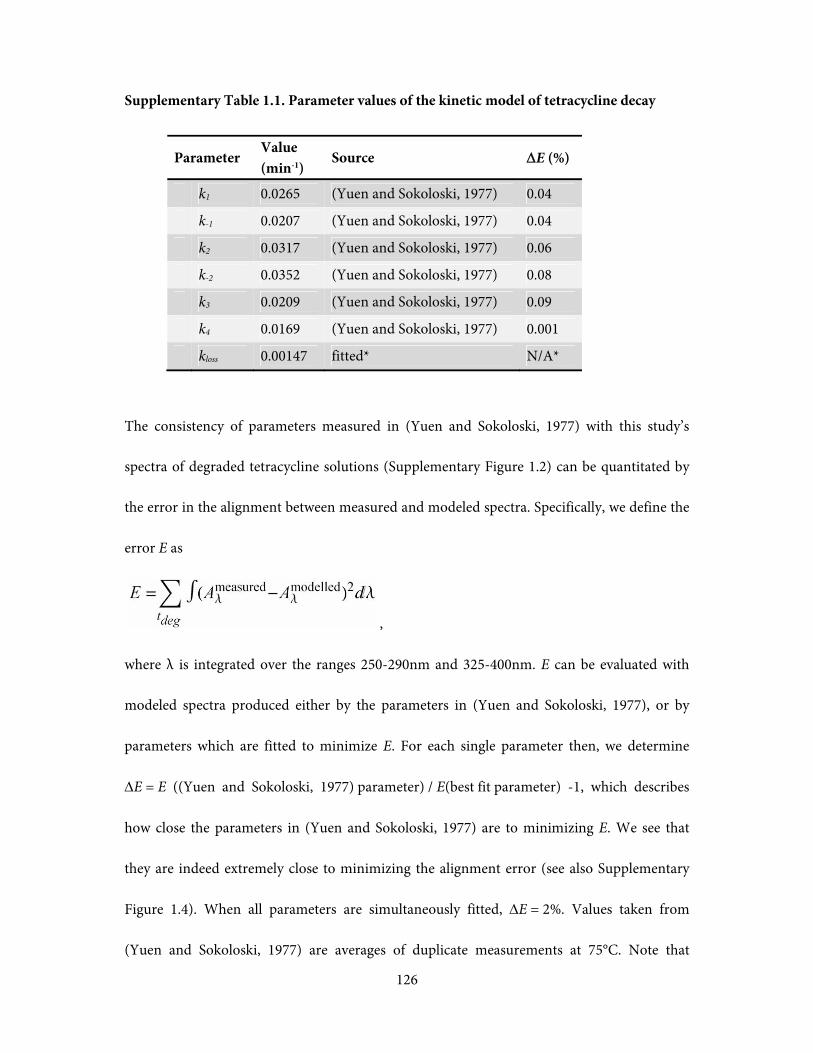
126
Supplementary Table 1.1. Parameter values of the kinetic model of tetracycline decay
The consistency of parameters measured in (Yuen and Sokoloski, 1977) with this study’s
spectra of degraded tetracycline solutions (Supplementary Figure 1.2) can be quantitated by
the error in the alignment between measured and modeled spectra. Specifically, we define the
error E as
,
where λ is integrated over the ranges 250-290nm and 325-400nm. E can be evaluated with
modeled spectra produced either by the parameters in (Yuen and Sokoloski, 1977), or by
parameters which are fitted to minimize E. For each single parameter then, we determine
ΔE = E ((Yuen and Sokoloski, 1977) parameter) / E(best fit parameter) -1, which describes
how close the parameters in (Yuen and Sokoloski, 1977) are to minimizing E. We see that
they are indeed extremely close to minimizing the alignment error (see also Supplementary
Figure 1.4). When all parameters are simultaneously fitted, ΔE = 2%. Values taken from
(Yuen and Sokoloski, 1977) are averages of duplicate measurements at 75°C. Note that
Parameter Value (min-1)
Source ΔE (%)
k1 0.0265 (Yuen and Sokoloski, 1977) 0.04
k-1 0.0207 (Yuen and Sokoloski, 1977) 0.04
k2 0.0317 (Yuen and Sokoloski, 1977) 0.06
k-2 0.0352 (Yuen and Sokoloski, 1977) 0.08
k3 0.0209 (Yuen and Sokoloski, 1977) 0.09
k4 0.0169 (Yuen and Sokoloski, 1977) 0.001
kloss 0.00147 fitted* N/A*
127
although Tet and ATC exert the strongest selective effects (Supplementary Figure 1.8), the
kinetic model cannot be accurately simplified to these two compounds alone. The
equilibrium constant for epimerization between Tet and ETC (k1/k-1 = 1.3) is different from
the equilibrium constant between ATC and EATC (k2/k-2 = 0.90). Consequently, even after
epimerization reactions have reached equilibrium, the dehydration reaction does not bring
about a net 1:1 conversion between Tet and ATC.
128
Supplementary Material for Chapter 2.
A multi-peaked adaptive landscape arising from high-order genetic
interactions
Supplementary Figure 2.1. Growth rates of E.coli strains with mutant DHFR genes as a
function of trimethoprim concentration. The growth rates of strains carrying all possible
combinations of seven trimethoprim resistance-conferring mutuations were measured across
a range of trimethoprim concentrations. Each column is one strain, whose mutations are
indicated in the color coded grid atop the plot. Mutant strains are sorted by the overall
number of mutations. A black to yellow heatmap indicates growth rate. Six columns that are
entirely black are genotypes that could not be successfully integrated into the chromosome of
E.coli despite repeated attempts.
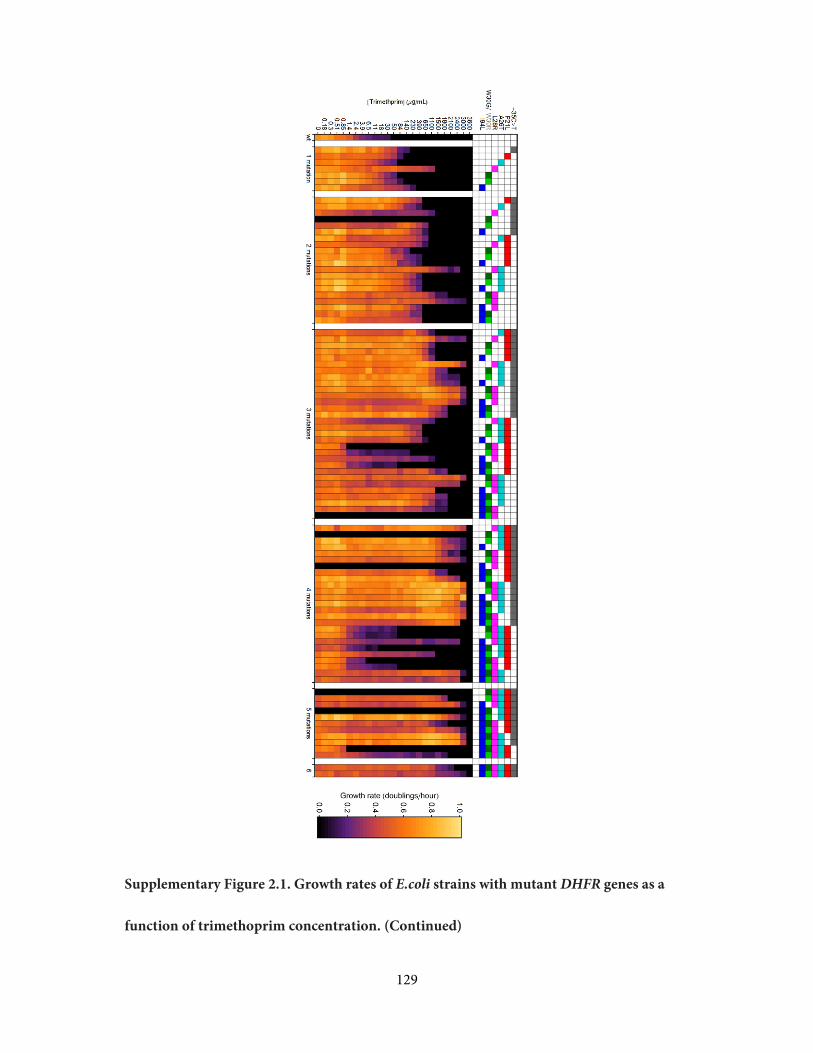
129
Supplementary Figure 2.1. Growth rates of E.coli strains with mutant DHFR genes as a
function of trimethoprim concentration. (Continued)
130
Supplementary Material for Chapter 3.
Diverse pathways to drug resistance by changes in gene expression
Supplementary Figure 3.1. Pooled diffusion-based selection for changes in gene
expression that confer antibiotic resistance. 107 colony forming units of a clonal wildtype
strain or a pooled library of gene deletion or gene over-expression mutants were plated on
M63 glucose minimal media agar. An aliquot of antibiotic was added to the center and plates
were incubated for 48 hours at 37°C before imaging. Images here show the presence of gene
expression mutants with resistance to antibiotics that act upon: a, cell wall synthesis; b, the
cell membrane; c, transcription; d, e, translation; f, DNA synthesis; g, free radical production.
Plates treated with sulfacetamide and sulfamethoxazole were incubated for 1 week before
imaging due to the slow growth of sulfonamide resistant colonies.
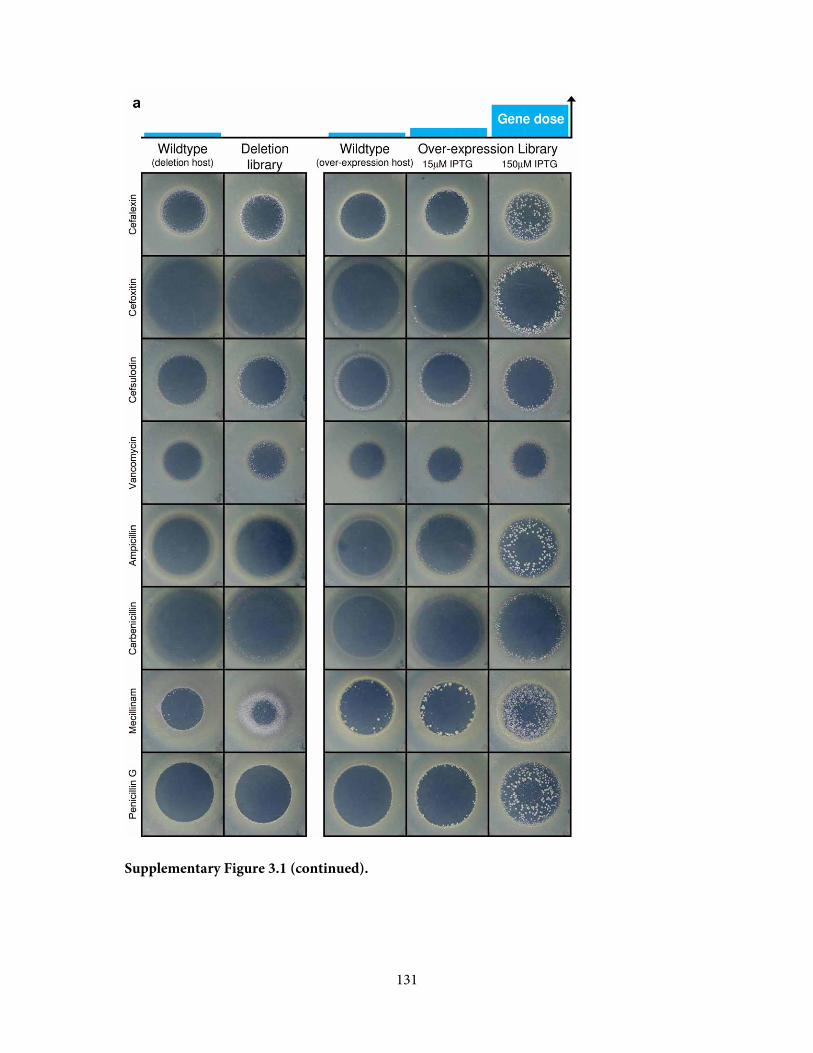
131
Supplementary Figure 3.1 (continued).

132
Supplementary Figure 3.1 (continued).
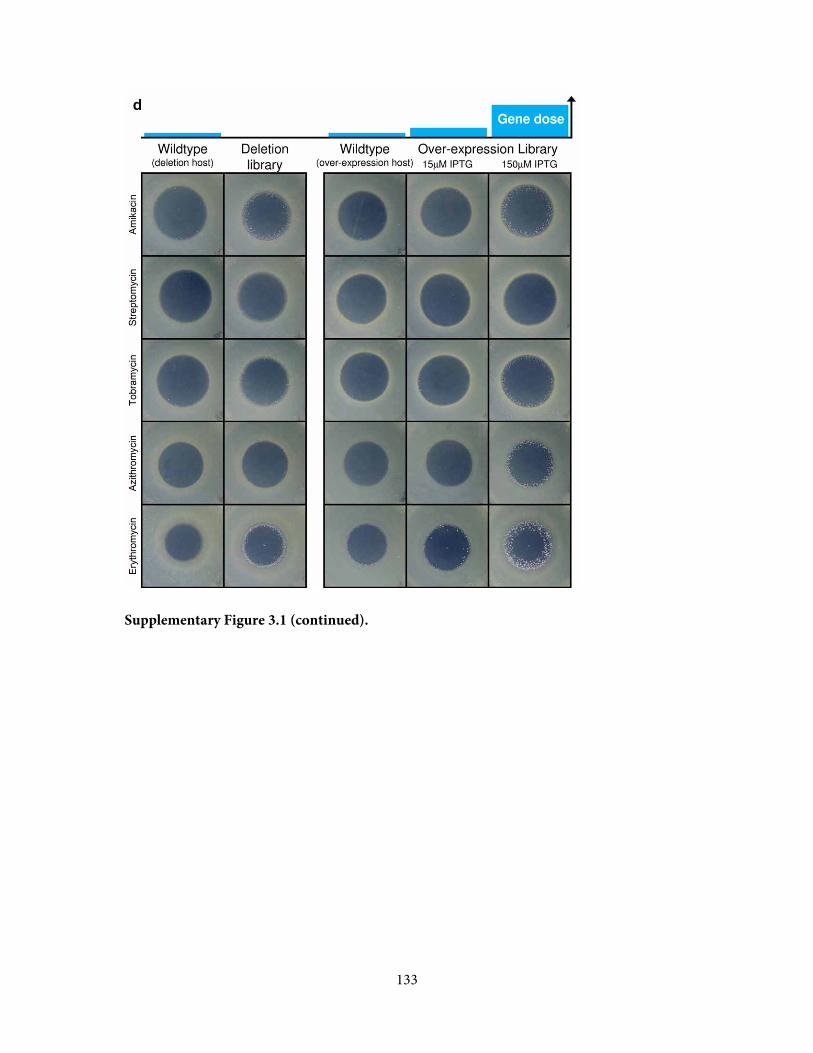
133
Supplementary Figure 3.1 (continued).
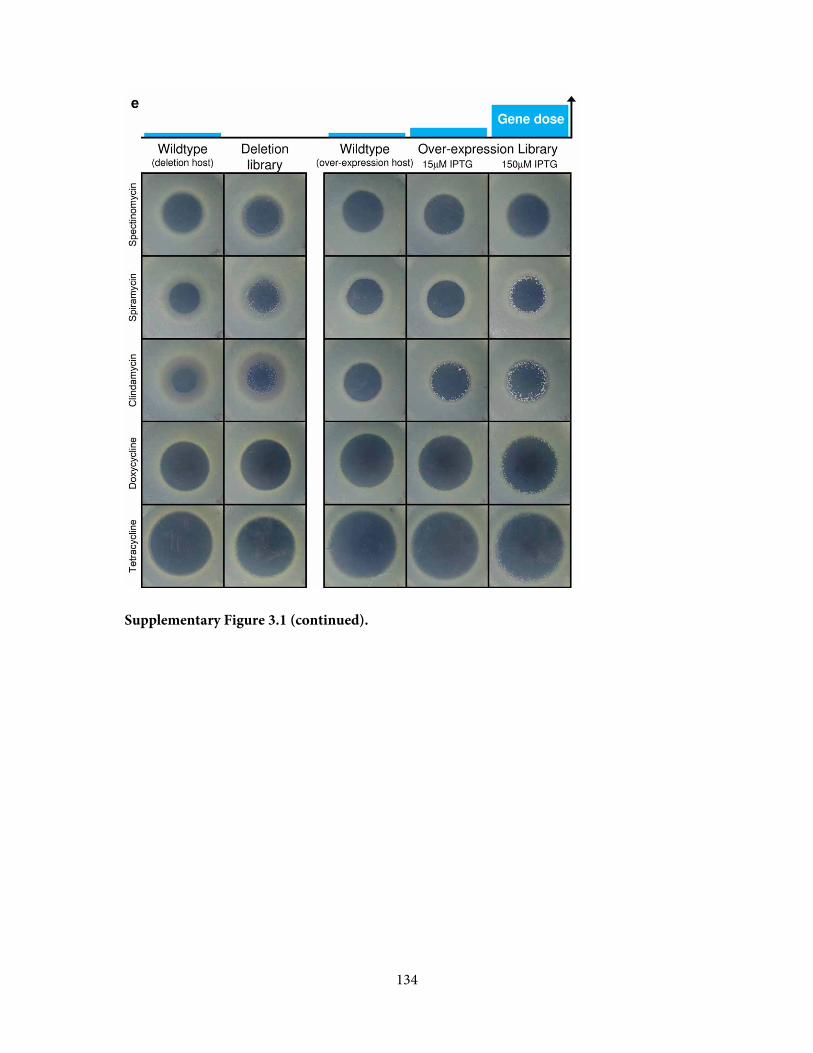
134
Supplementary Figure 3.1 (continued).
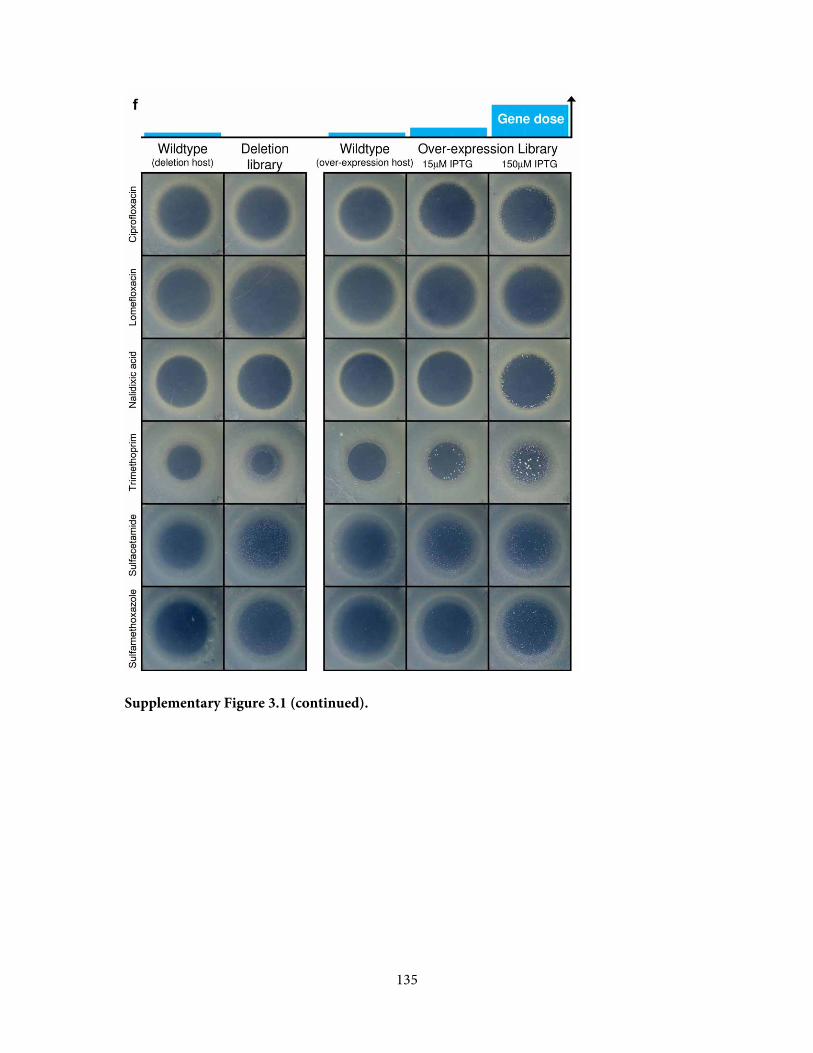
135
Supplementary Figure 3.1 (continued).
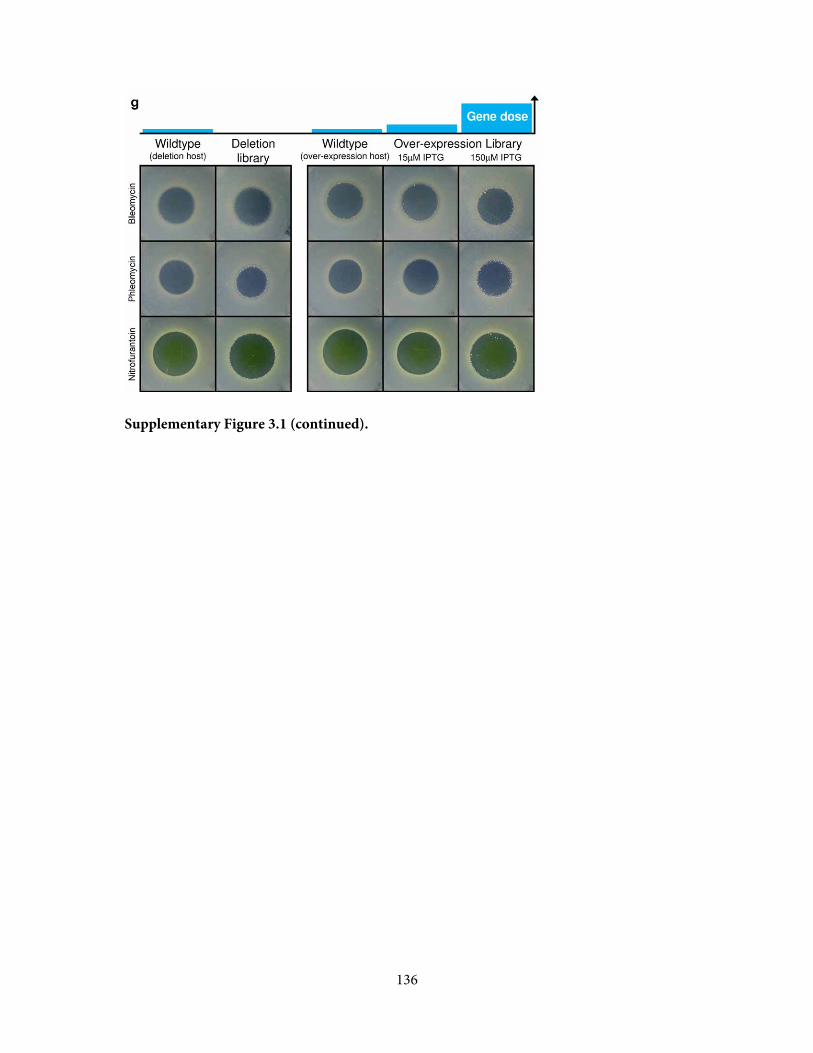
136
Supplementary Figure 3.1 (continued).
137
Supplementary Table 3.1. Changes in gene expression that increase antibiotic resistance.
Gene-drug interactions from Figure 3.2 are tabulated with gene functions curated from the
Ecocyc database (Keseler et al., 2011)

Supplementary Table 3.1. Changes in gene expression that increase antibiotic resistance. (continued)
138
Change in gene expression
Gene name
Drugs resisted Gene function
Previously associated with drug resistance?
Notes
Overexpression hemD AMK, MEC, PHM, TOB
uroporphyrinogen III synthase N
Overexpression yhbT AMK, PHM, TOB predicted lipid carrier protein N
Overexpression ampC AMP, CLX, CRB, FOX, PEN β-lactamase Y (Linstrom et al., 1970)
Overexpression marA
AMP, BLM, CLI, CLX, CPR, DOX, ERY, NAL, PEN, TET
MarA DNA-binding transcriptional dual regulator
Y (Cohen et al., 1993)
Overexpression nanA AMP N-acetylneuraminate lyase N nanA is the first enzyme in pathway for degradation of sialic acid (Vimr and Troy, 1985).
Overexpression soxS
AMP, AZI, BLM, CLI, CPR, DOX, ERY, FOX, NAL, PEN, SPR, TET, TMP
SoxS DNA-binding transcriptional dual regulator
Y (Amabile-Cuevas and Demple, 1991)
Overexpression yidF AMP, CLX, PEN predicted DNA-binding transcriptional regulator N
Overexpression gadW AZI, BLM GadW DNA-binding transcriptional dual regulator
N gadW is a regulator of Glutamic acid decarboxylase (GAD) acid resistance system (Tucker et al., 2003).
Overexpression rpmH AZI, ERY, SPR 50S ribosomal subunit protein L34 N Overexpression of rpmH decreases the production of polyamine (Panagiotidis et al., 1995).
Overexpression ydeO AZI YdeO DNA-binding transcriptional dual regulator N
ydeO activates transcription of acid resistance genes (Masuda and Church, 2003).
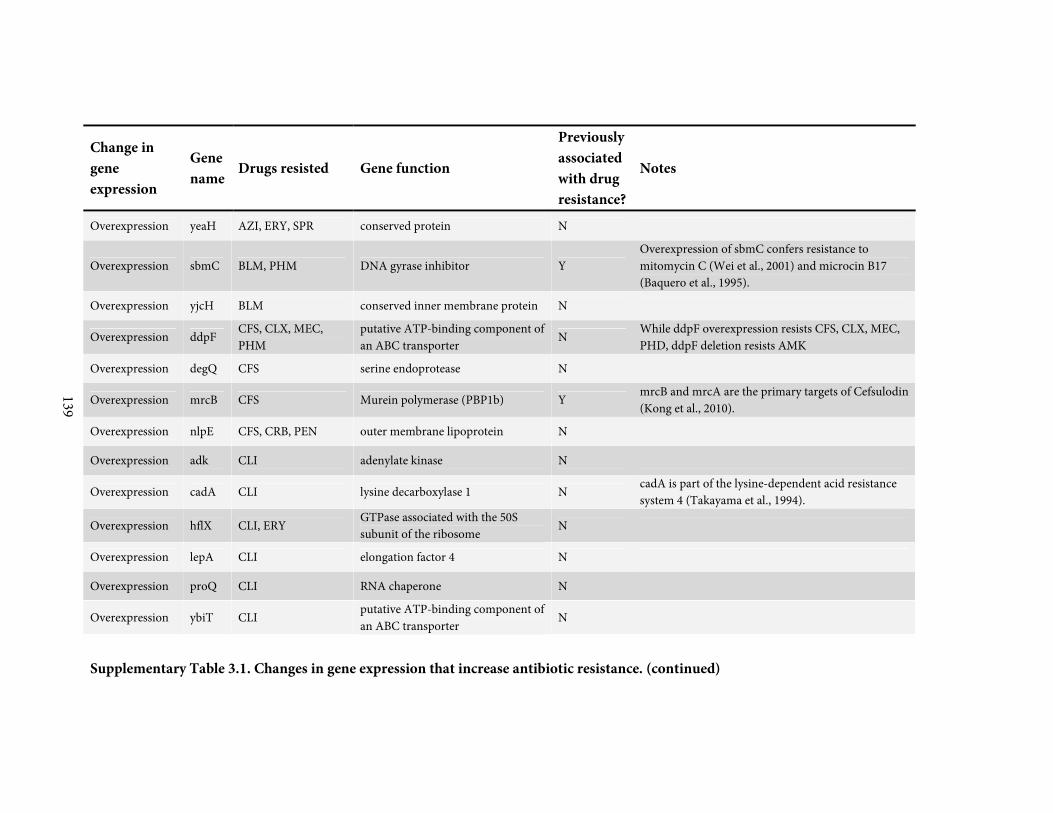
Supplementary Table 3.1. Changes in gene expression that increase antibiotic resistance. (continued)
139
Change in gene expression
Gene name
Drugs resisted Gene function
Previously associated with drug resistance?
Notes
Overexpression yeaH AZI, ERY, SPR conserved protein N
Overexpression sbmC BLM, PHM DNA gyrase inhibitor Y Overexpression of sbmC confers resistance to mitomycin C (Wei et al., 2001) and microcin B17 (Baquero et al., 1995).
Overexpression yjcH BLM conserved inner membrane protein N
Overexpression ddpF CFS, CLX, MEC, PHM
putative ATP-binding component of an ABC transporter
N While ddpF overexpression resists CFS, CLX, MEC, PHD, ddpF deletion resists AMK
Overexpression degQ CFS serine endoprotease N
Overexpression mrcB CFS Murein polymerase (PBP1b) Y mrcB and mrcA are the primary targets of Cefsulodin (Kong et al., 2010).
Overexpression nlpE CFS, CRB, PEN outer membrane lipoprotein N
Overexpression adk CLI adenylate kinase N
Overexpression cadA CLI lysine decarboxylase 1 N cadA is part of the lysine-dependent acid resistance system 4 (Takayama et al., 1994).
Overexpression hflX CLI, ERY GTPase associated with the 50S subunit of the ribosome N
Overexpression lepA CLI elongation factor 4 N
Overexpression proQ CLI RNA chaperone N
Overexpression ybiT CLI putative ATP-binding component of an ABC transporter
N
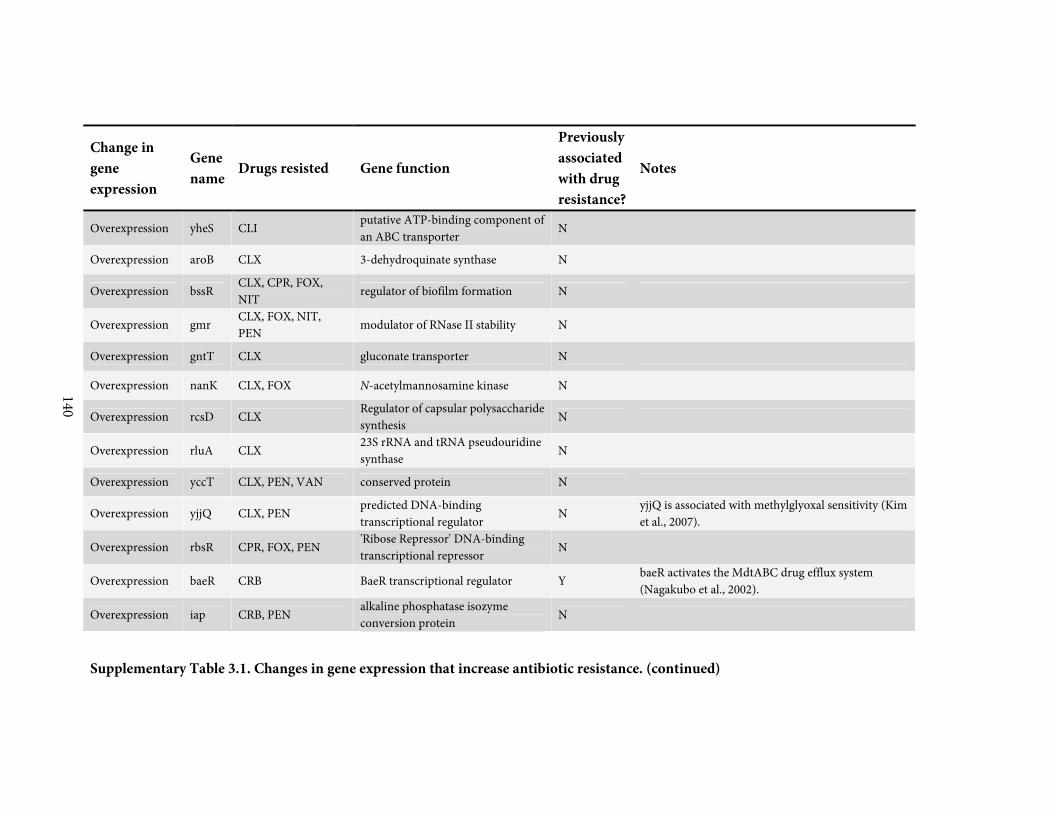
Supplementary Table 3.1. Changes in gene expression that increase antibiotic resistance. (continued)
140
Change in gene expression
Gene name
Drugs resisted Gene function
Previously associated with drug resistance?
Notes
Overexpression yheS CLI putative ATP-binding component of an ABC transporter
N
Overexpression aroB CLX 3-dehydroquinate synthase N
Overexpression bssR CLX, CPR, FOX, NIT regulator of biofilm formation N
Overexpression gmr CLX, FOX, NIT, PEN
modulator of RNase II stability N
Overexpression gntT CLX gluconate transporter N
Overexpression nanK CLX, FOX N-acetylmannosamine kinase N
Overexpression rcsD CLX Regulator of capsular polysaccharide synthesis
N
Overexpression rluA CLX 23S rRNA and tRNA pseudouridine synthase N
Overexpression yccT CLX, PEN, VAN conserved protein N
Overexpression yjjQ CLX, PEN predicted DNA-binding transcriptional regulator
N yjjQ is associated with methylglyoxal sensitivity (Kim et al., 2007).
Overexpression rbsR CPR, FOX, PEN 'Ribose Repressor' DNA-binding transcriptional repressor N
Overexpression baeR CRB BaeR transcriptional regulator Y baeR activates the MdtABC drug efflux system (Nagakubo et al., 2002).
Overexpression iap CRB, PEN alkaline phosphatase isozyme conversion protein N

Supplementary Table 3.1. Changes in gene expression that increase antibiotic resistance. (continued)
141
Change in gene expression
Gene name
Drugs resisted Gene function
Previously associated with drug resistance?
Notes
Overexpression amiA ERY, SPR N-acetylmuramoyl-L-alanine amidase 1
N
Overexpression appY ERY 'acid phosphatase' DNA-binding transcriptional activator
N
Overexpression rluE ERY, SPR 23S rRNA pseudouridine synthase N
Overexpression rng ERY ribonuclease G N
Overexpression btuE FOX thioredoxin/glutathione peroxidase N
Overexpression ycgZ FOX, PEN predicted protein N ycgZ is a member of the cold shock stimulon (Polissi et al., 2003).
Overexpression dxs MEC 1-deoxyxylulose-5-phosphate synthase N
Dxs is the first enzyme in the methylerythritol phosphate pathway of isoprenoid biosynthesis (Sprenger et al., 1997).
Overexpression gcvA MEC 'Glycine cleavage A' DNA-binding transcriptional dual regulator N
Overexpression glnB MEC nitrogen regulatory protein P-II 1 N
Overexpression glyQ MEC glycyl-tRNA synthetase, α subunit N
Overexpression mrdA MEC peptidoglycan synthetase (PBP2) Y mrdA is the primary target of Mecillinam (Kong et al., 2010).
Overexpression rplJ MEC 50S ribosomal subunit protein L10 N
Overexpression rutR MEC, PEN 'pyrimidine utilization, rut repressor' DNA-binding transcriptional dual regulator
N
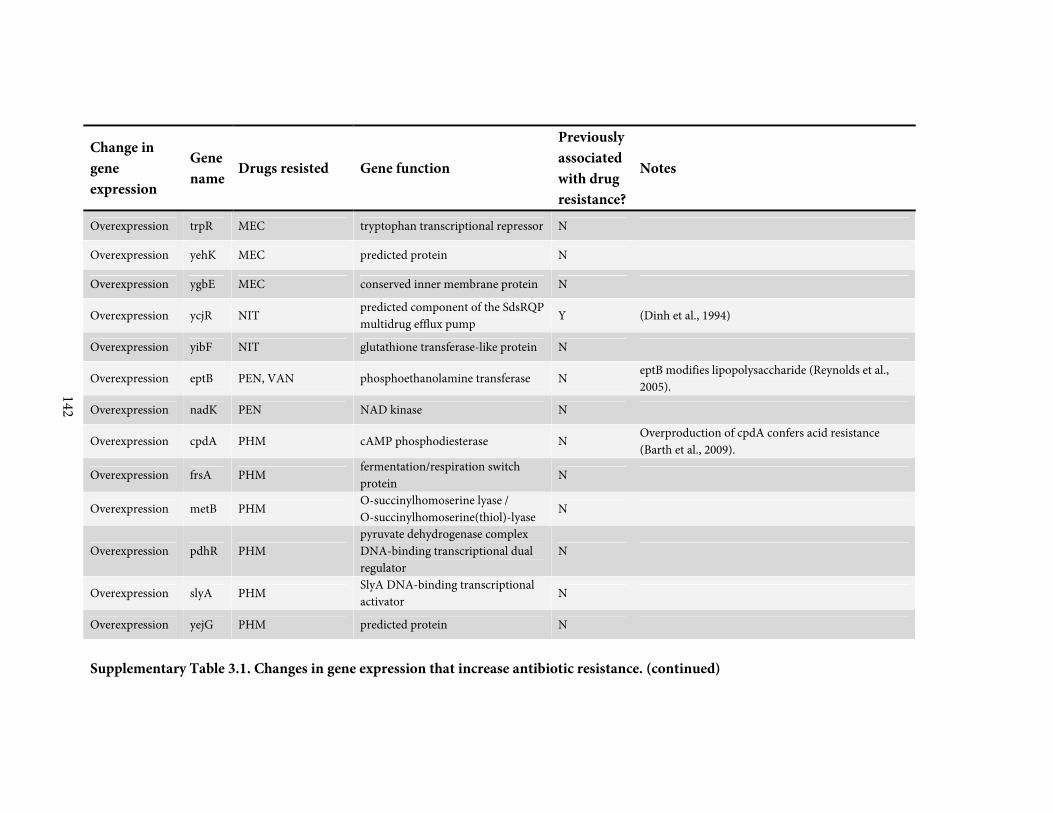
Supplementary Table 3.1. Changes in gene expression that increase antibiotic resistance. (continued)
142
Change in gene expression
Gene name
Drugs resisted Gene function
Previously associated with drug resistance?
Notes
Overexpression trpR MEC tryptophan transcriptional repressor N
Overexpression yehK MEC predicted protein N
Overexpression ygbE MEC conserved inner membrane protein N
Overexpression ycjR NIT predicted component of the SdsRQP multidrug efflux pump
Y (Dinh et al., 1994)
Overexpression yibF NIT glutathione transferase-like protein N
Overexpression eptB PEN, VAN phosphoethanolamine transferase N eptB modifies lipopolysaccharide (Reynolds et al., 2005).
Overexpression nadK PEN NAD kinase N
Overexpression cpdA PHM cAMP phosphodiesterase N Overproduction of cpdA confers acid resistance (Barth et al., 2009).
Overexpression frsA PHM fermentation/respiration switch protein
N
Overexpression metB PHM O-succinylhomoserine lyase / O-succinylhomoserine(thiol)-lyase
N
Overexpression pdhR PHM pyruvate dehydrogenase complex DNA-binding transcriptional dual regulator
N
Overexpression slyA PHM SlyA DNA-binding transcriptional activator N
Overexpression yejG PHM predicted protein N

Supplementary Table 3.1. Changes in gene expression that increase antibiotic resistance. (continued)
143
Change in gene expression
Gene name
Drugs resisted Gene function
Previously associated with drug resistance?
Notes
Overexpression ylcG PHM DLP12 prophage; small membrane protein
N
Overexpression yrbL PHM predicted protein N
Overexpression entS RIF enterobactin efflux transporter Y An entS insertion mutant has increased susceptibility to mitomycin C (Han et al., 2010).
Overexpression gadE RIF 'Glutamic acid decarboxylase' DNA-binding transcriptional activator
Y gadE activates the glutamic acid decarboxylase (GAD) acid resistance system, and multi-drug efflux genes (Tucker et al., 2003).
Overexpression gfcC RIF conserved protein N
Overexpression nuoI RIF NADH:ubiquinone oxidoreductase, chain I
N
Overexpression cynS SCM cyanase N cynS may function in detoxification of cyanate (Anderson et al., 1990).
Overexpression nudB SCM, SMX dihydroneopterin triphosphate pyrophosphohydrolase N
nudB catalyzes the first committed step in the synthesis of folate (Suzuki and Brown, 1974).
Overexpression pyrG SCM, SMX CTP synthetase N
Overexpression ydiZ SCM predicted protein N
Overexpression ykfF SCM predicted protein N
Overexpression ymgG SCM predicted protein N
Overexpression dksA SMX RNA polymerase-binding transcription factor
N While dksA overexpression resists SMX, dksA deletion resists RIF
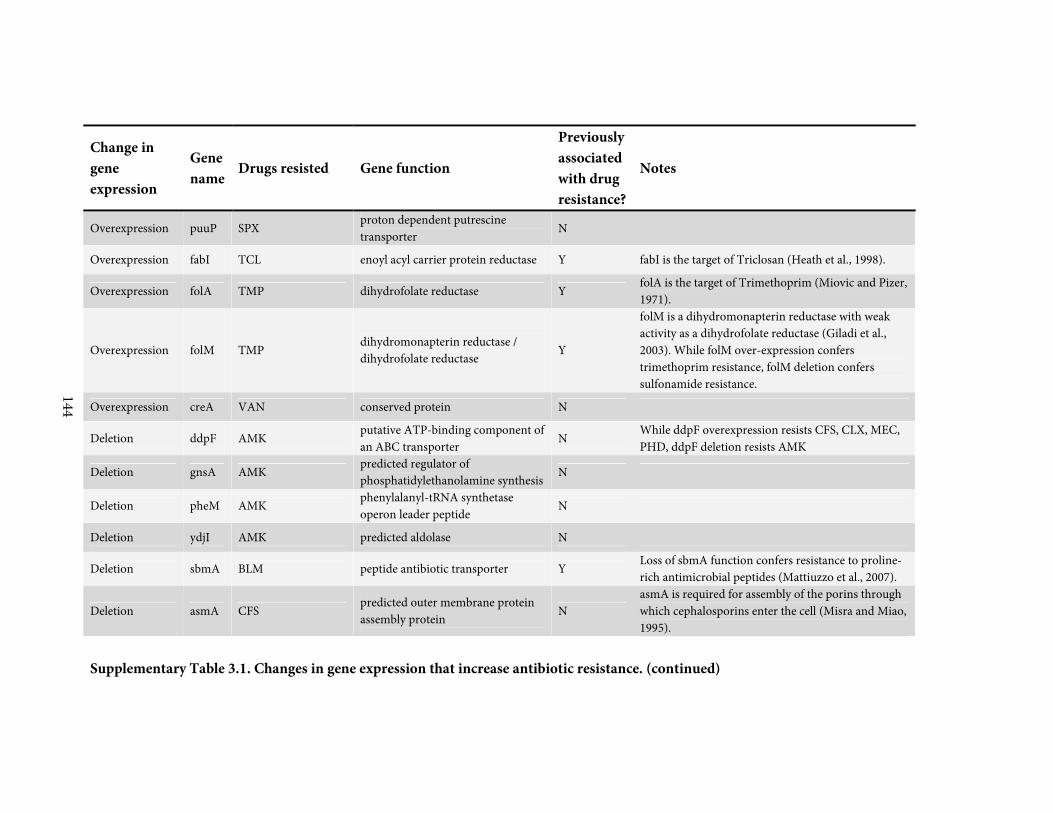
Supplementary Table 3.1. Changes in gene expression that increase antibiotic resistance. (continued)
144
Change in gene expression
Gene name
Drugs resisted Gene function
Previously associated with drug resistance?
Notes
Overexpression puuP SPX proton dependent putrescine transporter
N
Overexpression fabI TCL enoyl acyl carrier protein reductase Y fabI is the target of Triclosan (Heath et al., 1998).
Overexpression folA TMP dihydrofolate reductase Y folA is the target of Trimethoprim (Miovic and Pizer, 1971).
Overexpression folM TMP dihydromonapterin reductase / dihydrofolate reductase Y
folM is a dihydromonapterin reductase with weak activity as a dihydrofolate reductase (Giladi et al., 2003). While folM over-expression confers trimethoprim resistance, folM deletion confers sulfonamide resistance.
Overexpression creA VAN conserved protein N
Deletion ddpF AMK putative ATP-binding component of an ABC transporter
N While ddpF overexpression resists CFS, CLX, MEC, PHD, ddpF deletion resists AMK
Deletion gnsA AMK predicted regulator of phosphatidylethanolamine synthesis N
Deletion pheM AMK phenylalanyl-tRNA synthetase operon leader peptide
N
Deletion ydjI AMK predicted aldolase N
Deletion sbmA BLM peptide antibiotic transporter Y Loss of sbmA function confers resistance to proline-rich antimicrobial peptides (Mattiuzzo et al., 2007).
Deletion asmA CFS predicted outer membrane protein assembly protein N
asmA is required for assembly of the porins through which cephalosporins enter the cell (Misra and Miao, 1995).
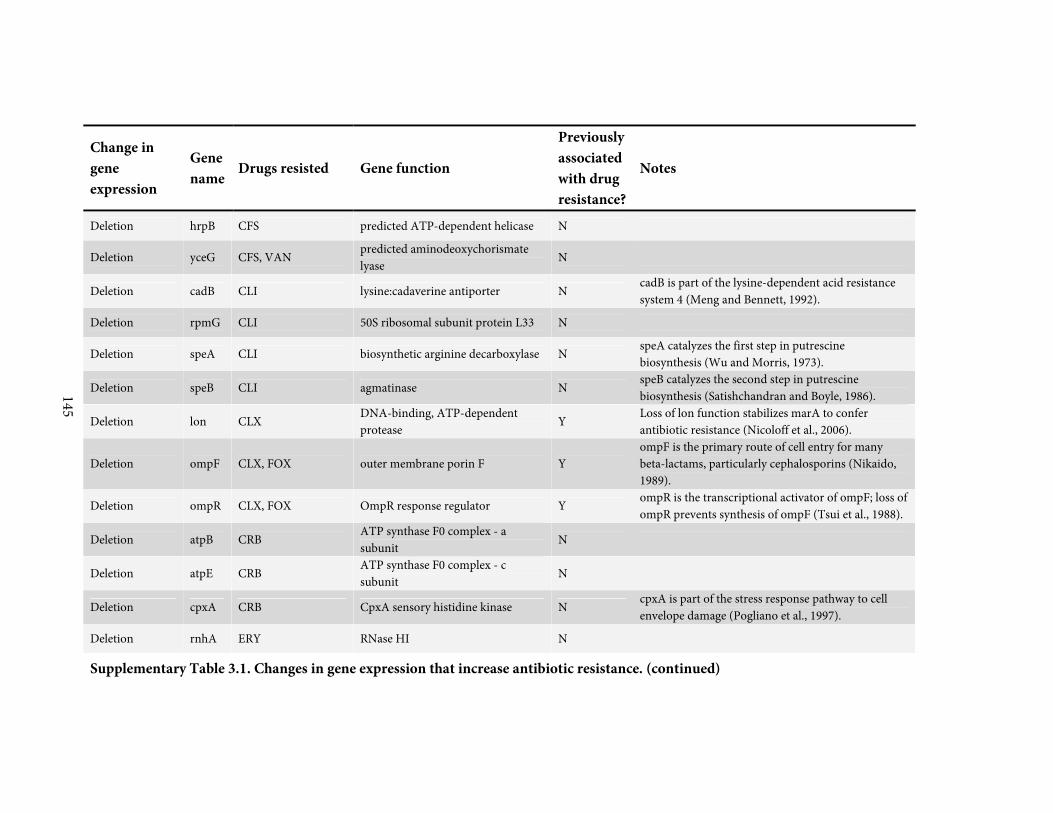
Supplementary Table 3.1. Changes in gene expression that increase antibiotic resistance. (continued)
145
Change in gene expression
Gene name
Drugs resisted Gene function
Previously associated with drug resistance?
Notes
Deletion hrpB CFS predicted ATP-dependent helicase N
Deletion yceG CFS, VAN predicted aminodeoxychorismate lyase
N
Deletion cadB CLI lysine:cadaverine antiporter N cadB is part of the lysine-dependent acid resistance system 4 (Meng and Bennett, 1992).
Deletion rpmG CLI 50S ribosomal subunit protein L33 N
Deletion speA CLI biosynthetic arginine decarboxylase N speA catalyzes the first step in putrescine biosynthesis (Wu and Morris, 1973).
Deletion speB CLI agmatinase N speB catalyzes the second step in putrescine biosynthesis (Satishchandran and Boyle, 1986).
Deletion lon CLX DNA-binding, ATP-dependent protease
Y Loss of lon function stabilizes marA to confer antibiotic resistance (Nicoloff et al., 2006).
Deletion ompF CLX, FOX outer membrane porin F Y ompF is the primary route of cell entry for many beta-lactams, particularly cephalosporins (Nikaido, 1989).
Deletion ompR CLX, FOX OmpR response regulator Y ompR is the transcriptional activator of ompF; loss of ompR prevents synthesis of ompF (Tsui et al., 1988).
Deletion atpB CRB ATP synthase F0 complex - a subunit
N
Deletion atpE CRB ATP synthase F0 complex - c subunit
N
Deletion cpxA CRB CpxA sensory histidine kinase N cpxA is part of the stress response pathway to cell envelope damage (Pogliano et al., 1997).
Deletion rnhA ERY RNase HI N

Supplementary Table 3.1. Changes in gene expression that increase antibiotic resistance. (continued)
146
Change in gene expression
Gene name
Drugs resisted Gene function
Previously associated with drug resistance?
Notes
Deletion sulA ERY SOS cell division inhibitor N
Deletion ycbZ ERY, SPR putative ATP-dependent protease N
Deletion fepB MEC ferric enterobactin ABC transporter N
Deletion fepC MEC ferric enterobactin ABC transporter N
Deletion fepG MEC ferric enterobactin ABC transporter N
Deletion fes MEC enterochelin esterase N fes hydrolyzes ferric enterobactin (Langman et al., 1972).
Deletion glnD MEC uridylyltransferase N
Deletion pdxA MEC 4-hydroxy-L-threonine phosphate dehydrogenase, NAD-dependent
N pdxA is required for pyridoxal phosphate synthesis (Lam et al., 1992).
Deletion rodZ MEC transmembrane component of cytoskeleton
N rodZ interacts with the target of mecillinam (mrdA) through the MreB cytoskeleton (Bendezu et al., 2009).
Deletion ybjI MEC FMN phosphatase N ybjI possesses phosphatase activity against pyridoxal phosphate (Kuznetsova et al., 2006).
Deletion dbpA NIT ATP-dependent RNA helicase, specific for 23S rRNA
N
Deletion lpcA NIT D-sedoheptulose 7-phosphate isomerase N
lpcA catalyzes the first step in the synthesis of a core component of lipopolysaccharide; lpcA deletion confers sensitivity to some antibiotics by increasing cell permeability (Tamaki et al., 1971).

Supplementary Table 3.1. Changes in gene expression that increase antibiotic resistance. (continued)
147
Change in gene expression
Gene name
Drugs resisted Gene function
Previously associated with drug resistance?
Notes
Deletion nfsA NIT NADPH nitroreductase Y nfsA is required to activate nitrofurantoin to toxic reactive species, and so nfsA deletion confers nitrofurantoin resistance (McCalla et al., 1978).
Deletion pstC NIT phosphate ABC transporter -membrane subunit
N
Deletion rfaC NIT ADP-heptose:LPS heptosyltransferase I N
rfaC transfers heptose onto lipopolysaccharide (Kadrmas and Raetz, 1998)
Deletion rfaD NIT ADP-L-glycero-D-mannoheptose-6-epimerase
N rfaD catalyzes a step in the synthesis of lipopolysaccharide (Kneidinger et al., 2002).
Deletion sspA NIT stringent starvation protein A N
Deletion ybjC NIT predicted inner membrane protein N ybjC is co-transcribed with nfsA (Paterson et al., 2002). Polar effects on nfsA are a likely mechanism of resistance to nitrofurantoin.
Deletion ratA PHM toxin of a predicted toxin-antitoxin pair
N
Deletion ubiF PHM 2-octaprenyl-3-methyl-6-methoxy-1,4-benzoquinone hydroxylase
Y uniF catalyzes a step in the ubiquinone biosynthesis pathway. Previously identified as a phleomycin resistant mutant (Collis and Grigg, 1989).
Deletion ubiG PHM
bifunctional 3-demethylubiquinone-8 3-O-methyltransferase and 2-octaprenyl-6-hydroxyphenol methylase
Y ubiG catalyzes a step in the ubiquinone biosynthesis pathway. ubiG deletion produces a similar defect to a Phleomycin-resistant mutation in ubiF
Deletion ubiH PHM 2-octaprenyl-6-methoxyphenol hydroxylase
Y ubiH catalyzes a step in the ubiquinone biosynthesis pathway. ubiH deletion produces a similar defect to a Phleomycin-resistant mutation in ubiF

Supplementary Table 3.1. Changes in gene expression that increase antibiotic resistance. (continued)
148
Change in gene expression
Gene name
Drugs resisted Gene function
Previously associated with drug resistance?
Notes
Deletion ycgB PHM conserved protein N
Deletion ymgG PHM predicted protein N
Deletion dksA RIF RNA polymerase-binding transcription factor DksA
N While dksA overexpression resists SMX, dksA deletion resists RIF
Deletion marC RIF predicted transporter N
Deletion ptsN RIF phosphotransferase system enzyme IIA, regulation of potassium transport
N
Deletion rlmL RIF fused dual 23S rRNA methyltransferase
N
Deletion yfgH RIF predicted outer membrane lipoprotein
N
Deletion ccmH SCM, SMX cytochrome c biogenesis protein N
Deletion folM SCM, SMX dihydromonapterin reductase / dihydrofolate reductase
Y
While folM over-expression confers trimethoprim resistance, folM deletion confers sulfonamide resistance. A folM deletion has been previously observed to confer sulfonamide resistance (Girgis et al., 2009).
Deletion folX SCM, SMX dihydroneopterin triphosphate 2'-epimerase
Y A folX deletion has been previously observed to confer sulfonamide resistance (Girgis et al., 2009).
Deletion ybiP SPR predicted hydrolase, inner membrane N

Supplementary Table 3.1. Changes in gene expression that increase antibiotic resistance. (continued)
149
Change in gene expression
Gene name
Drugs resisted Gene function
Previously associated with drug resistance?
Notes
Deletion ygeO SPR predicted protein N ygeO is involved in the production of Extracellular Death Factor (Kolodkin-Gal et al., 2007).
Deletion ymfJ SPR predicted protein N
Deletion rsxC TMP member of SoxR-reducing complex Y rsxC deletion produces constitutive transcription of sox operon (Koo et al., 2003).
Deletion dacA VAN D-alanyl-D-alanine carboxypeptidase IA (PBP5)
N
dacA is involved in production of the cellular target of vancomycin binding (D-alanyl-D-alanine). dacA deletion confers increased beta-lactam susceptibility (Sarkar et al., 2010).
Deletion ycgB PHM conserved protein N
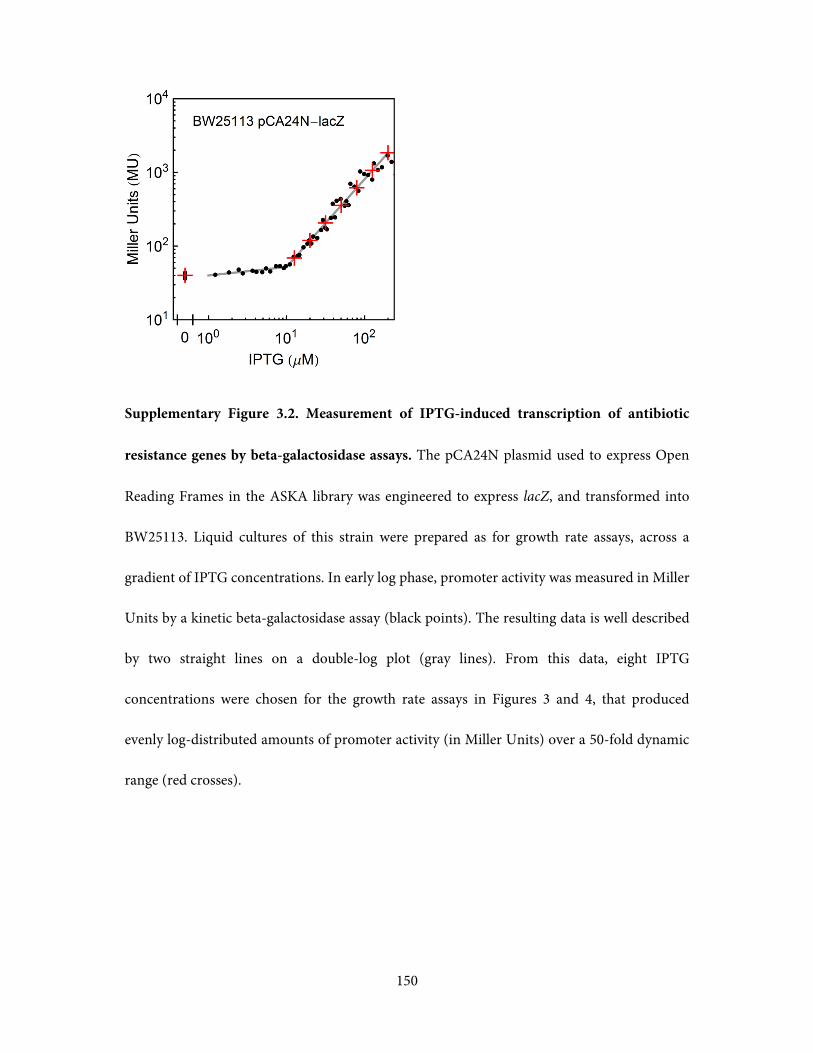
150
Supplementary Figure 3.2. Measurement of IPTG-induced transcription of antibiotic
resistance genes by beta-galactosidase assays. The pCA24N plasmid used to express Open
Reading Frames in the ASKA library was engineered to express lacZ, and transformed into
BW25113. Liquid cultures of this strain were prepared as for growth rate assays, across a
gradient of IPTG concentrations. In early log phase, promoter activity was measured in Miller
Units by a kinetic beta-galactosidase assay (black points). The resulting data is well described
by two straight lines on a double-log plot (gray lines). From this data, eight IPTG
concentrations were chosen for the growth rate assays in Figures 3 and 4, that produced
evenly log-distributed amounts of promoter activity (in Miller Units) over a 50-fold dynamic
range (red crosses).

151
Supplementary Figure 3.3. Non-optimal use of antibiotic resistance genes under antibiotic
stress. Microtiter plates containing 2-dimensional gradients of IPTG and antibiotic were
inoculated with either a wildtype strain (WT = BW25113 pCA24N-ΔpT5lac-yfp pCSλ), a
strain lacking a gene of interest (Δgene = BW25113 gene::FRT pCA24N-ΔpT5lac-yfp pCSλ),
or a strain with experimentally controlled expression of the gene of interest (BW25113
gene::FRT pCA24N-gene pCSλ). Plates were incubated at 30°C in a scintillation counter and
growth rates were measured based on bioluminescence, generated by the pCSλ plasmid
(Methods). a, The use of marA and soxS was measured in a panel of 9 antibiotics. b, The use
of ampC was measured in ampicillin and cephalexin, and the use of sbmC was measured in
phleomycin.
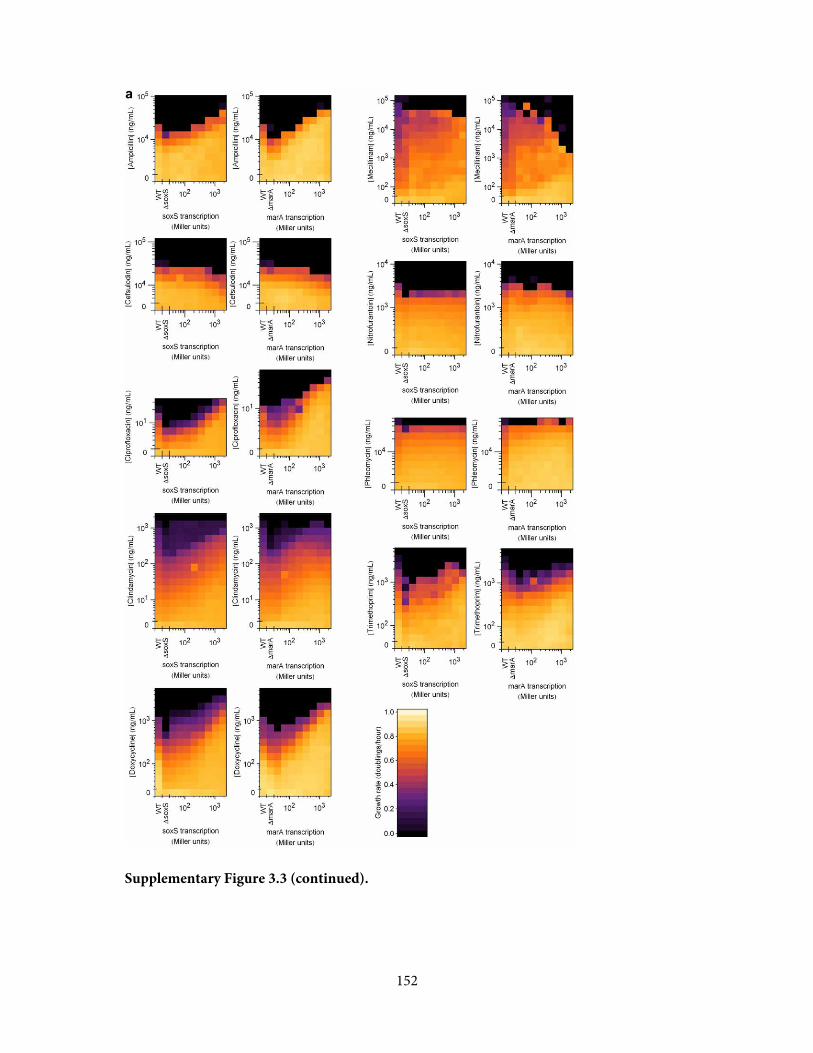
152
Supplementary Figure 3.3 (continued).
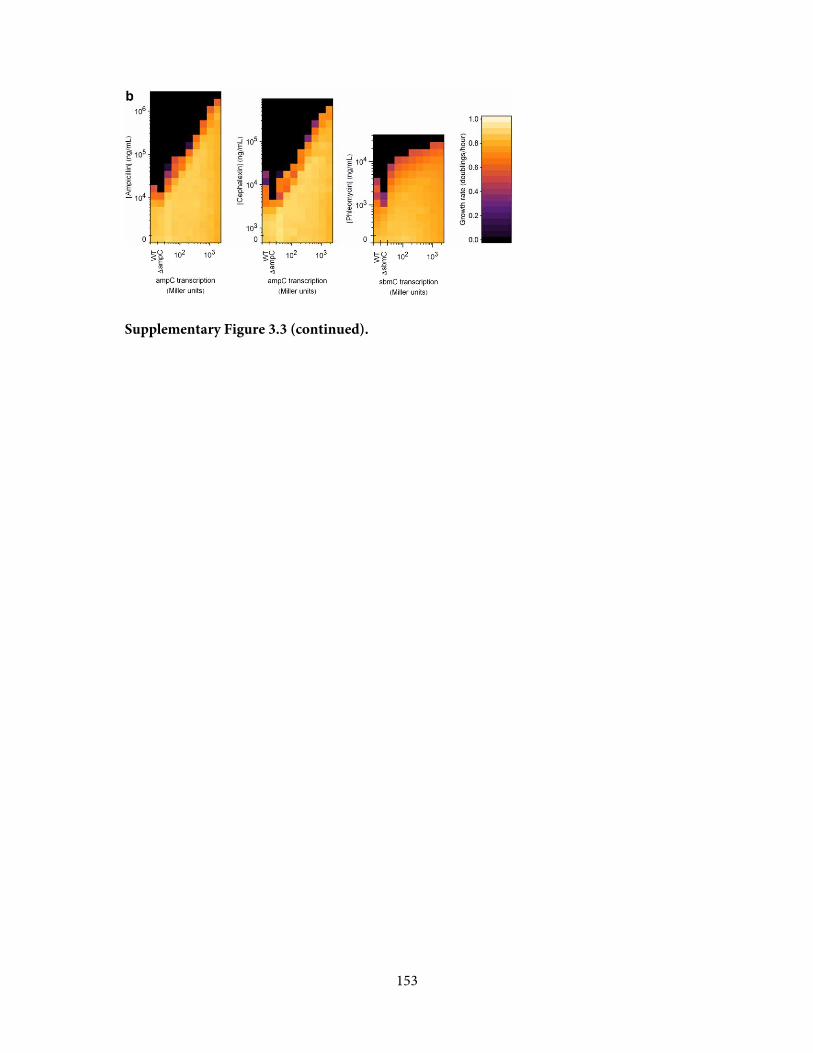
153
Supplementary Figure 3.3 (continued).
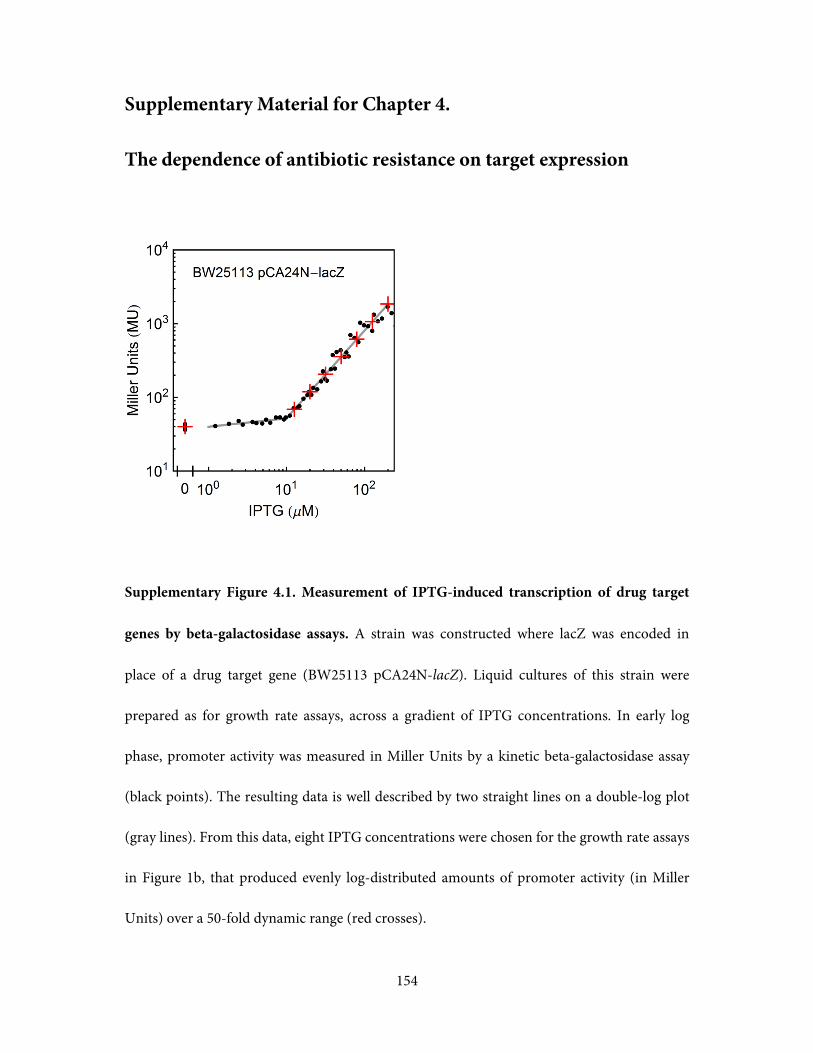
154
Supplementary Material for Chapter 4.
The dependence of antibiotic resistance on target expression
Supplementary Figure 4.1. Measurement of IPTG-induced transcription of drug target
genes by beta-galactosidase assays. A strain was constructed where lacZ was encoded in
place of a drug target gene (BW25113 pCA24N-lacZ). Liquid cultures of this strain were
prepared as for growth rate assays, across a gradient of IPTG concentrations. In early log
phase, promoter activity was measured in Miller Units by a kinetic beta-galactosidase assay
(black points). The resulting data is well described by two straight lines on a double-log plot
(gray lines). From this data, eight IPTG concentrations were chosen for the growth rate assays
in Figure 1b, that produced evenly log-distributed amounts of promoter activity (in Miller
Units) over a 50-fold dynamic range (red crosses).

155
Supplementary Figure 4.2. Mass-action kinetic models reveal the relations between
enzyme concentration and drug resistance.
In sections a and b we first derive the relation between drug target over-expression and drug
resistance for the simple model shown in Figure 4.2a. In sections c, d, e and f we show that
mass-action kinetic models of competitive and non-competitive inhibition produce identical
results to the initial simple models.
(a) Simple model of a drug that solely inhibits an enzyme
( )
[S]K[S]k
K[I]1[E]
[S]K[S]k[E]
dtd[P]
K[I]1[E][E]
K[I]1 [E]K
[E][I][E][EI][E][E]
[EI][E][I]
kkK
[EI]k[E][I]k
m
cat
i
total
m
cat
i
total
ii
total
Ion
Ioffi
IoffIon
++=
+=
+=
+=+=+=
==
=
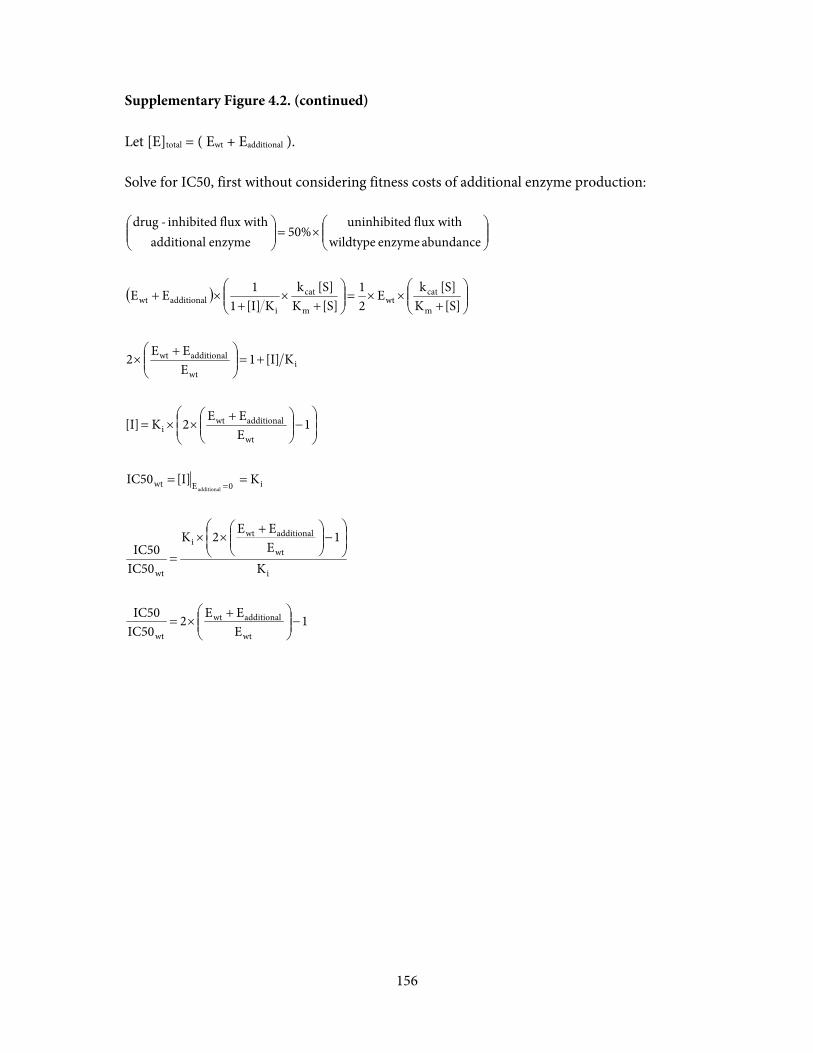
156
Supplementary Figure 4.2. (continued)
Let [E]total = ( Ewt + Eadditional ).
Solve for IC50, first without considering fitness costs of additional enzyme production:
( )
1EEE2
IC50IC50
K
1EEE2K
IC50IC50
K [I]IC50
1EEE2K[I]
K[I]1EEE2
[S]K[S] kE
21
[S]K[S] k
K[I]11EE
abundance enzyme wildtypeflux with duninhibite
50%enzyme additional
flux with inhibited-drug
wt
additionalwt
wt
i
wt
additionalwti
wt
i0Ewt
wt
additionalwti
iwt
additionalwt
m
catwt
m
cat
iadditionalwt
additional
−⎟⎟⎠
⎞⎜⎜⎝
⎛ +×=
⎟⎟⎠
⎞⎜⎜⎝
⎛−⎟⎟
⎠
⎞⎜⎜⎝
⎛ +××
=
==
⎟⎟⎠
⎞⎜⎜⎝
⎛−⎟⎟
⎠
⎞⎜⎜⎝
⎛ +××=
+=⎟⎟⎠
⎞⎜⎜⎝
⎛ +×
⎟⎟⎠
⎞⎜⎜⎝
⎛+
××=⎟⎟⎠
⎞⎜⎜⎝
⎛+
×+
×+
⎟⎟⎠
⎞⎜⎜⎝
⎛×=⎟⎟
⎠
⎞⎜⎜⎝
⎛
=
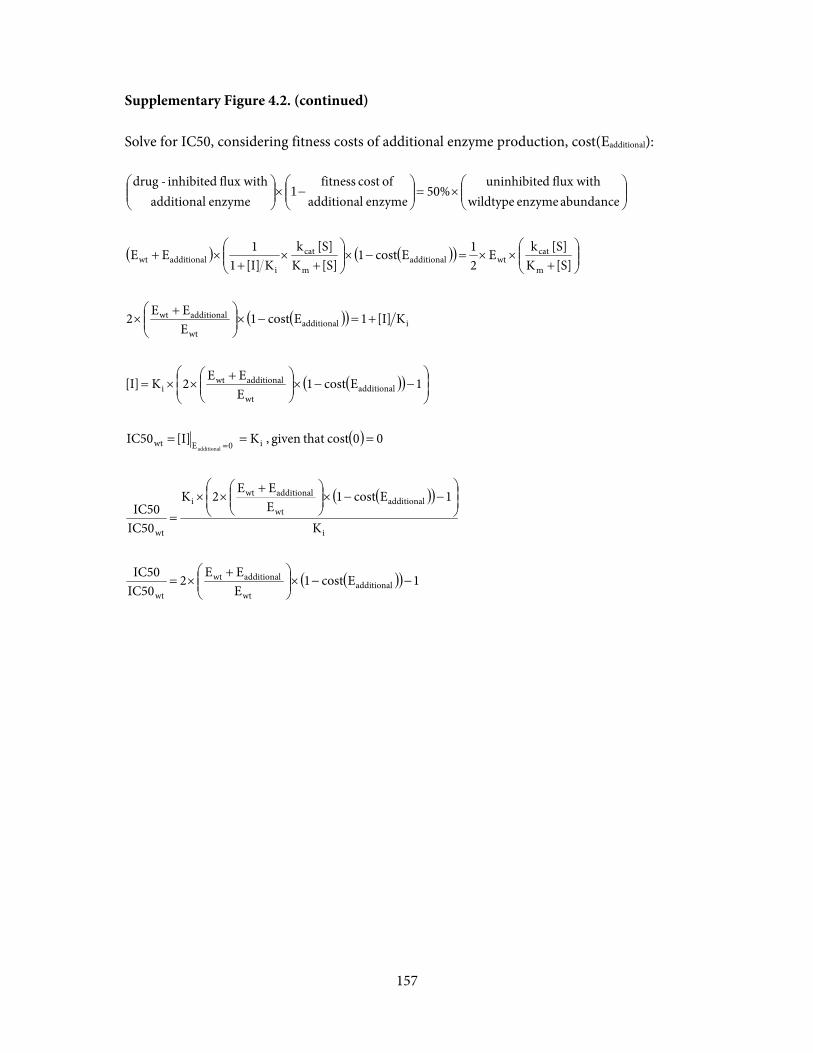
157
Supplementary Figure 4.2. (continued)
Solve for IC50, considering fitness costs of additional enzyme production, cost(Eadditional):
( ) ( )( )
( )( )
( )( )
( )
( )( )
( )( ) 1Ecost1EEE2
IC50IC50
K
1Ecost1EEE2K
IC50IC50
00cost that given , K [I]IC50
1Ecost1EEE2K[I]
K[I]1Ecost1EEE2
[S]K[S] kE
21Ecost1
[S]K[S] k
K[I]11EE
abundance enzyme wildtypeflux with duninhibite
50%enzyme additional
of cost fitnessenzyme additional
flux with inhibited-drug
additionalwt
additionalwt
wt
i
additionalwt
additionalwti
wt
i0Ewt
additionalwt
additionalwti
iadditionalwt
additionalwt
m
catwtadditional
m
cat
iadditionalwt
additional
−−×⎟⎟⎠
⎞⎜⎜⎝
⎛ +×=
⎟⎟⎠
⎞⎜⎜⎝
⎛−−×⎟⎟
⎠
⎞⎜⎜⎝
⎛ +××
=
===
⎟⎟⎠
⎞⎜⎜⎝
⎛−−×⎟⎟
⎠
⎞⎜⎜⎝
⎛ +××=
+=−×⎟⎟⎠
⎞⎜⎜⎝
⎛ +×
⎟⎟⎠
⎞⎜⎜⎝
⎛+
××=−×⎟⎟⎠
⎞⎜⎜⎝
⎛+
×+
×+
⎟⎟⎠
⎞⎜⎜⎝
⎛×=⎟⎟
⎠
⎞⎜⎜⎝
⎛−×⎟⎟
⎠
⎞⎜⎜⎝
⎛
=
1
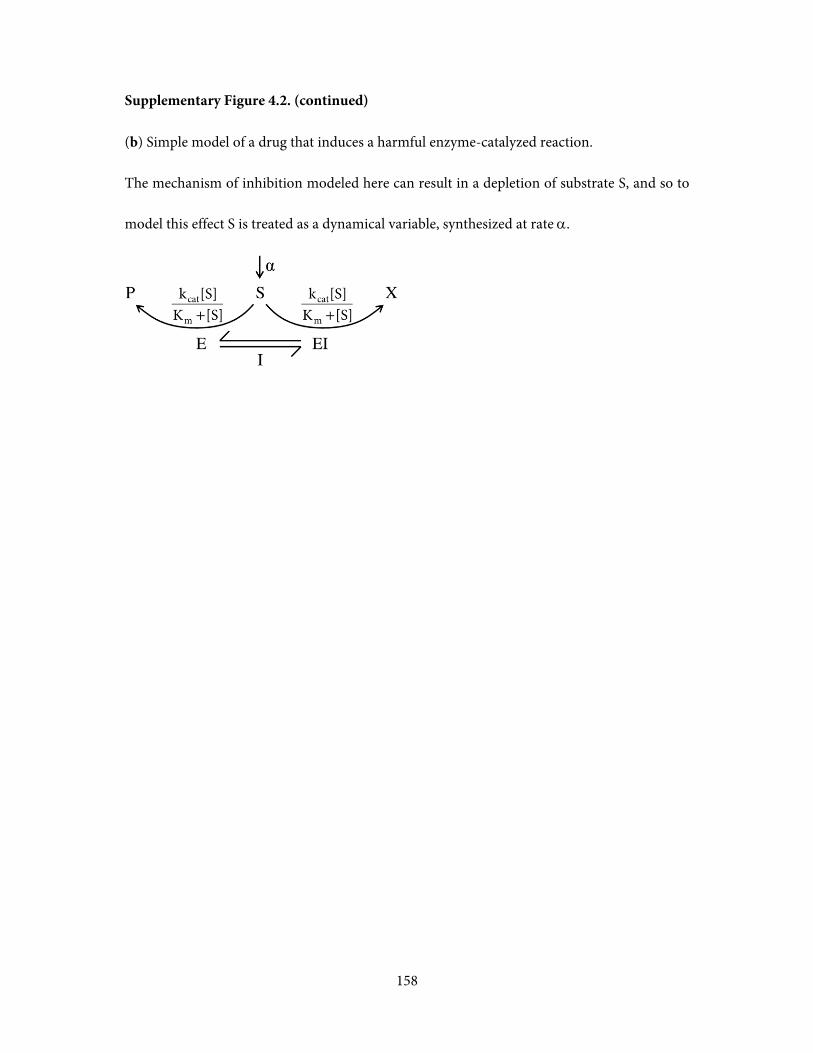
158
Supplementary Figure 4.2. (continued)
(b) Simple model of a drug that induces a harmful enzyme-catalyzed reaction.
The mechanism of inhibition modeled here can result in a depletion of substrate S, and so to
model this effect S is treated as a dynamical variable, synthesized at rate α.
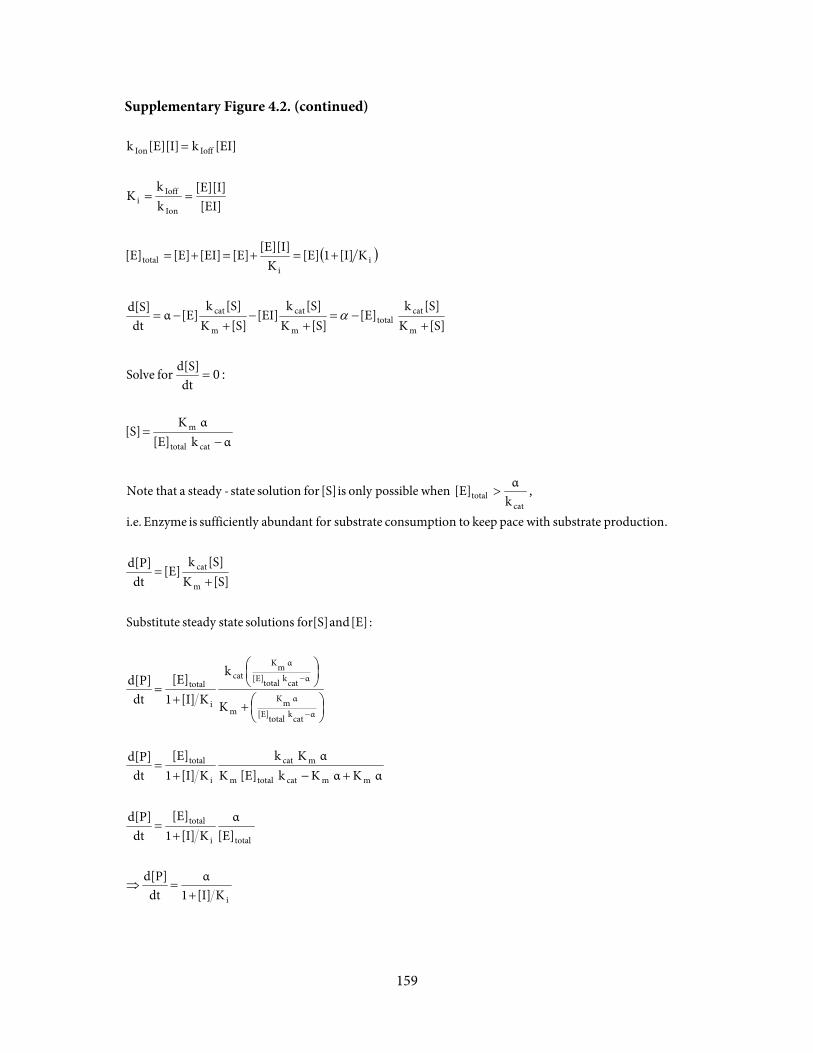
159
Supplementary Figure 4.2. (continued)
( )
i
totali
total
mmcattotalm
mcat
i
total
αcatk total[E]
α mKm
αcatk total[E]
α mKcat
i
total
m
cat
cattotal
cattotal
m
m
cattotal
m
cat
m
cat
ii
total
Ion
Ioffi
IoffIon
K[I]1α
dtd[P]
[E]α
K[I]1[E]
dtd[P]
α Kα Kk [E] Kα K k
K[I]1[E]
dtd[P]
K
k
K[I]1[E]
dtd[P]
:[E] and for[S] solutions state steady Substitute
[S]K[S]k
[E]dt
d[P]
.production substrate withpace keep to nconsumptio substratefor abundant lysufficient is Enzyme i.e.k
α[E] whenpossible only is [S]for solution state-steadya that Note
αk [E]α K
[S]
dtd[S]for Solve
[S]K[S]k
[E][S]K
[S]k[EI]
[S]K[S]k
[E]αdt
d[S]
K[I]1 [E]K
[E][I][E][EI][E][E]
[EI][E][I]
kk
K
[EI]k[E][I]k
+=⇒
+=
+−+=
⎟⎠⎞
⎜⎝⎛+
⎟⎠⎞
⎜⎝⎛
+=
+=
>
−=
=
+−=
+−
+−=
+=+=+=
==
=
−
−
,
:0
α

160
Supplementary Figure 4.2. (continued)
Let [E]total = ( Ewt + Eadditional ). Note that in contrast to the model of enzyme inhibition in
Supplementary Figure 4.2a, this substitution now has no effect on reaction rate.
Solve for IC50, first without considering fitness costs of additional enzyme production:
1
1
==
==
+=
×=⎟⎟⎠
⎞⎜⎜⎝
⎛+
⎟⎟⎠
⎞⎜⎜⎝
⎛×=⎟⎟
⎠
⎞⎜⎜⎝
⎛
=
i
i
wt
i0Ewt
i
i
KK
IC50IC50
K [I]IC50
K[I]2
α21
K[I]1α
abundance enzyme wildtypeflux with duninhibite
50%enzyme additional
flux with inhibited-drug
additional
Solve for IC50, considering fitness costs of additional enzyme production, cost(Eadditional):

161
Supplementary Figure 4.2. (continued)
( )( )
( )( )
( )( )( )
( )
( )( )( )
( )( ) 1Ecost12IC50IC50
K1Ecost12K
IC50IC50
00cost that given , K [I]IC50
1Ecost12K[I]
K[I]1Ecost12
α21Ecost1
K[I]1α
abundance enzyme wildtypeflux with duninhibite
50%enzyme additional
of cost fitnessenzyme additional
flux with inhibited-drug
additionalwt
i
additionali
wt
i0Ewt
additionali
iadditional
additionali
additional
−−×=
−−××=
===
−−××=
+=−×
×=−×⎟⎟⎠
⎞⎜⎜⎝
⎛+
⎟⎟⎠
⎞⎜⎜⎝
⎛×=⎟⎟
⎠
⎞⎜⎜⎝
⎛−×⎟⎟
⎠
⎞⎜⎜⎝
⎛
=
1
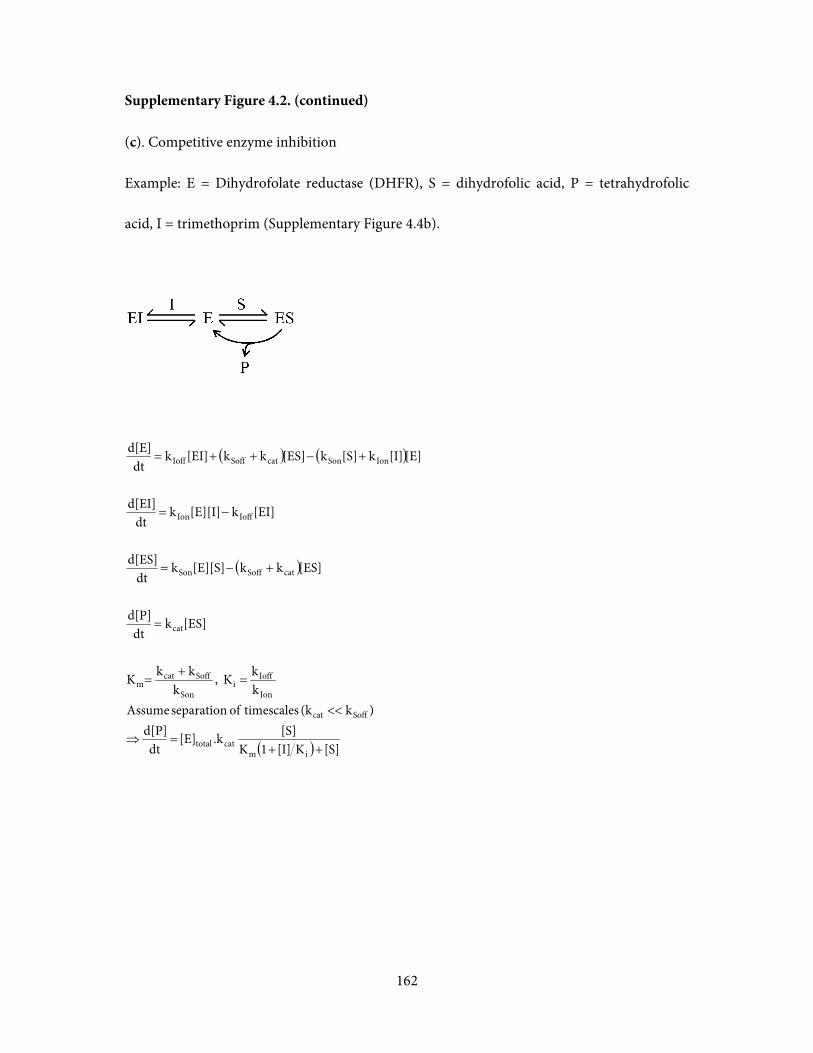
162
Supplementary Figure 4.2. (continued)
(c). Competitive enzyme inhibition
Example: E = Dihydrofolate reductase (DHFR), S = dihydrofolic acid, P = tetrahydrofolic
acid, I = trimethoprim (Supplementary Figure 4.4b).
( ) ( )
( )
( ) [S]K[I]1K[S].k[E]
dtd[P]
)k(k timescales of separation AssumekkK ,
kkkK
[ES]kdt
d[P]
[ES]kk[E][S]kdt
d[ES]
[EI]k[E][I]kdt
d[EI]
[E][I]k[S]k[ES]kk[EI]kdt
d[E]
imcattotal
Soffcat
Ion
Ioffi
Son
Soffcatm
cat
catSoffSon
IoffIon
IonSoncatSoffIoff
++=⇒
<<
=+
=
=
+−=
−=
+−++=
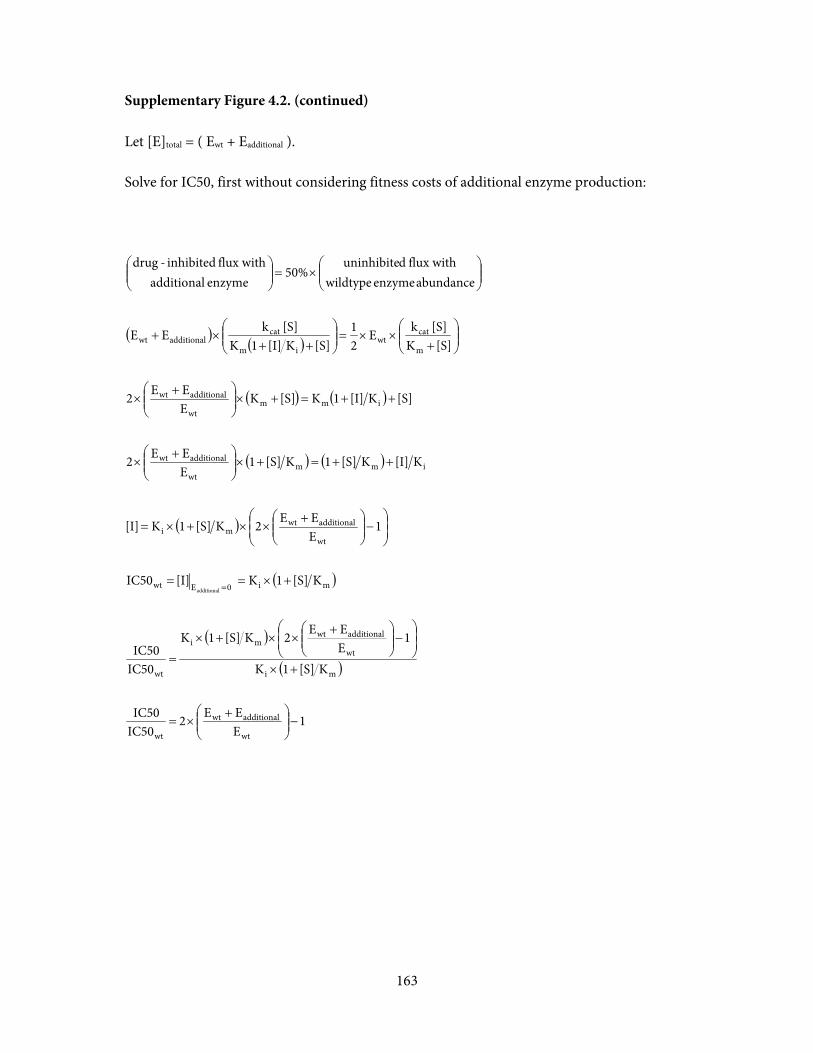
163
Supplementary Figure 4.2. (continued)
Let [E]total = ( Ewt + Eadditional ).
Solve for IC50, first without considering fitness costs of additional enzyme production:
( ) ( )
( ) ( )
( ) ( )
( )
( )
( )
( )
1EEE2
IC50IC50
K[S]1K
1EEE2K[S]1K
IC50IC50
K[S]1K [I]IC50
1EEE2K[S]1K[I]
K[I]K[S]1K[S]1EEE2
[S]K[I]1K[S]KEEE2
[S]K[S] kE
21
[S]K[I]1K[S] kEE
abundance enzyme wildtypeflux with duninhibite
50%enzyme additional
flux with inhibited-drug
wt
additionalwt
wt
mi
wt
additionalwtmi
wt
mi0Ewt
wt
additionalwtmi
immwt
additionalwt
immwt
additionalwt
m
catwt
im
catadditionalwt
additional
−⎟⎟⎠
⎞⎜⎜⎝
⎛ +×=
+×
⎟⎟⎠
⎞⎜⎜⎝
⎛−⎟⎟
⎠
⎞⎜⎜⎝
⎛ +××+×
=
+×==
⎟⎟⎠
⎞⎜⎜⎝
⎛−⎟⎟
⎠
⎞⎜⎜⎝
⎛ +××+×=
++=+×⎟⎟⎠
⎞⎜⎜⎝
⎛ +×
++=+×⎟⎟⎠
⎞⎜⎜⎝
⎛ +×
⎟⎟⎠
⎞⎜⎜⎝
⎛+
××=⎟⎟⎠
⎞⎜⎜⎝
⎛++
×+
⎟⎟⎠
⎞⎜⎜⎝
⎛×=⎟⎟
⎠
⎞⎜⎜⎝
⎛
=

164
Supplementary Figure 4.2. (continued)
Let [E]total = ( Ewt + Eadditional ).
Solve for IC50, considering fitness costs of additional enzyme production, cost(Eadditional):
( ) ( ) ( )( )
( )( ) ( ) ( )
( )( ) ( ) ( )
( ) ( )( )
( ) ( )
( ) ( )( )
( )
( )( ) 1Ecost1EEE2
IC50IC50
K[S]1K
1Ecost1EEE2K[S]1K
IC50IC50
00cost that given , K[S]1K [I]IC50
1Ecost1EEE2K[S]1K[I]
K[I]K[S]1K[S]1Ecost1EEE2
[S]K[I]1K[S]KEcost1EEE2
[S]K[S] kE
21Ecost1
[S]K[I]1K[S] kEE
abundance enzyme wildtypeflux with duninhibite
50%enzyme additional
of cost fitnessenzyme additional
flux with inhibited-drug
additionalwt
additionalwt
wt
mi
additionalwt
additionalwtmi
wt
mi0Ewt
additionalwt
additionalwtmi
immadditionalwt
additionalwt
immadditionalwt
additionalwt
m
catwtadditional
im
catadditionalwt
additional
−−×⎟⎟⎠
⎞⎜⎜⎝
⎛ +×=
+×
⎟⎟⎠
⎞⎜⎜⎝
⎛−−×⎟⎟
⎠
⎞⎜⎜⎝
⎛ +××+×
=
=+×==
⎟⎟⎠
⎞⎜⎜⎝
⎛−−×⎟⎟
⎠
⎞⎜⎜⎝
⎛ +××+×=
++=+×−×⎟⎟⎠
⎞⎜⎜⎝
⎛ +×
++=+×−×⎟⎟⎠
⎞⎜⎜⎝
⎛ +×
⎟⎟⎠
⎞⎜⎜⎝
⎛+
××=−×⎟⎟⎠
⎞⎜⎜⎝
⎛++
×+
⎟⎟⎠
⎞⎜⎜⎝
⎛×=⎟⎟
⎠
⎞⎜⎜⎝
⎛−×⎟⎟
⎠
⎞⎜⎜⎝
⎛
=
1
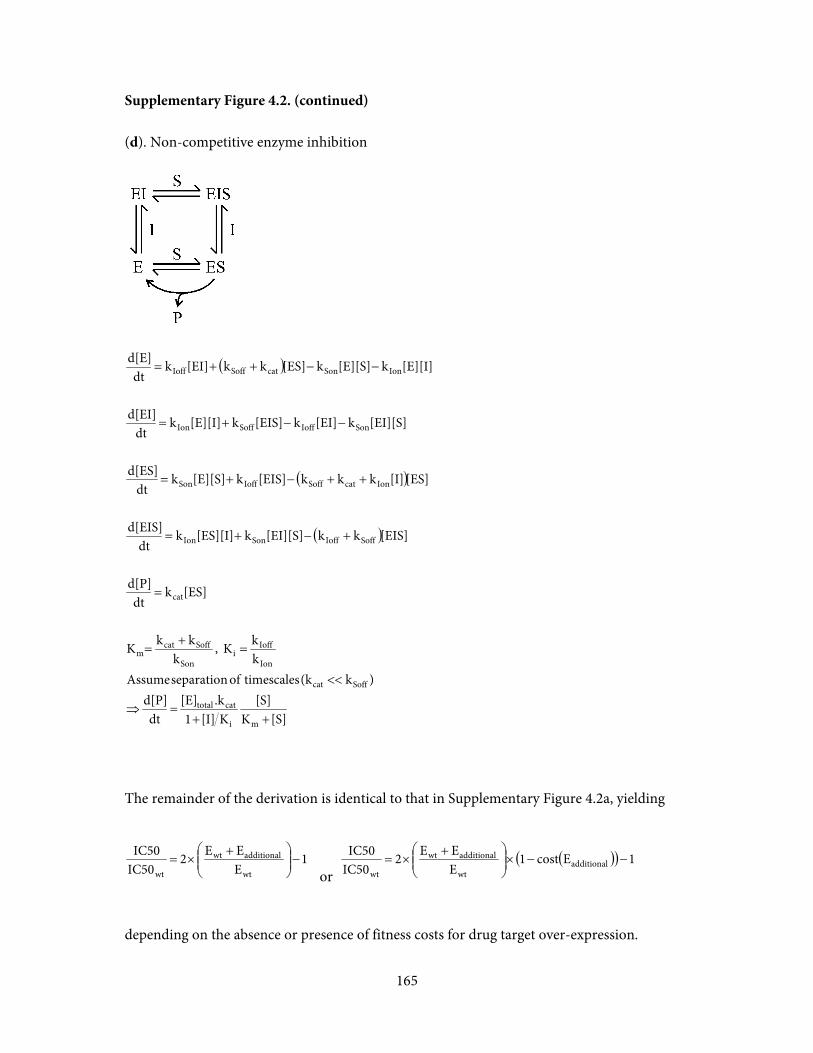
165
Supplementary Figure 4.2. (continued)
(d). Non-competitive enzyme inhibition
( )
( )
( )
[S]K[S]
K[I]1.k[E]
dtd[P]
)k(k timescales of separation AssumekkK ,
kkkK
[ES]kdt
d[P]
[EIS]kk[EI][S]k[ES][I]kdt
d[EIS]
[ES][I]kkk[EIS]k[E][S]kdt
d[ES]
[EI][S]k[EI]k[EIS]k[E][I]kdt
d[EI]
[E][I]k[E][S]k[ES]kk[EI]kdt
d[E]
mi
cattotal
Soffcat
Ion
Ioffi
Son
Soffcatm
cat
SoffIoffSonIon
IoncatSoffIoffSon
SonIoffSoffIon
IonSoncatSoffIoff
++=⇒
<<
=+
=
=
+−+=
++−+=
−−+=
−−++=
The remainder of the derivation is identical to that in Supplementary Figure 4.2a, yielding
1EEE2
IC50IC50
wt
additionalwt
wt−⎟⎟
⎠
⎞⎜⎜⎝
⎛ +×=
or ( )( ) 1Ecost1
EEE2
IC50IC50
additionalwt
additionalwt
wt−−×⎟⎟
⎠
⎞⎜⎜⎝
⎛ +×=
depending on the absence or presence of fitness costs for drug target over-expression.

166
Supplementary Figure 4.2. (continued)
(e). Competitive substrate damage
The mechanism of inhibition modeled here can result in a depletion of substrate S2, and so to
model this effect S2 is treated as a dynamical variable, synthesized at rate α; while S1 is treated
as a constant.
Example: E = Dihydropteroate synthase (DHPS), S1 = para-aminobenzoic acid (PABA), S2 =
pteridine diphosphate, P = dihydropteroate, I = sulfamethoxazole, I-S2 = dihydropterin-
sulfamethoxazole (Supplementary Figure 4.4a).
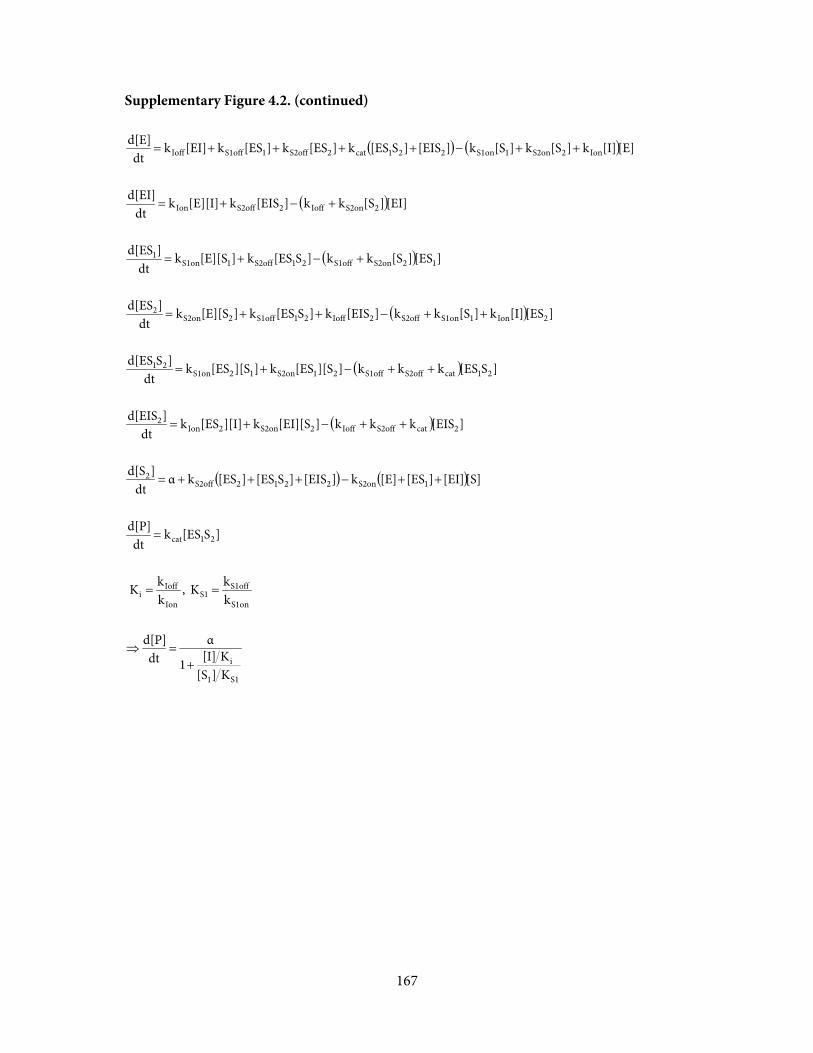
167
Supplementary Figure 4.2. (continued)
( ) ( )
( )
( )
( )
( )
( )
( ) ( )
S11
i
S1on
S1offS1
Ion
Ioffi
21cat
1S2on2212S2off2
2catS2offIoff2S2on2Ion2
21catS2offS1off21S2on12S1on21
2Ion1S1onS2off2Ioff21S1off2S2on2
12S2onS1off21S2off1S1on1
2S2onIoff2S2offIon
Ion2S2on1S1on221cat2S2off1S1offIoff
K][SK[I]1
αdt
d[P]
kkK ,
kkK
]S[ESkdt
d[P]
[S][EI]][ES[E]k][EIS]S[ES][ESkαdt
]d[S
][EISkkk][EI][Sk][I][ESkdt
]d[EIS
]S[ESkkk]][S[ESk]][S[ESkdt
]Sd[ES
][ES[I]k][Skk][EISk]S[ESk][E][Skdt
]d[ES
][ES][Skk]S[ESk][E][Skdt
]d[ES
[EI]][Skk][EISk[E][I]kdt
d[EI]
[E][I]k][Sk][Sk][EIS]S[ESk][ESk][ESk[EI]kdt
d[E]
+=⇒
==
=
++−+++=
++−+=
++−+=
++−++=
+−+=
+−+=
++−++++=
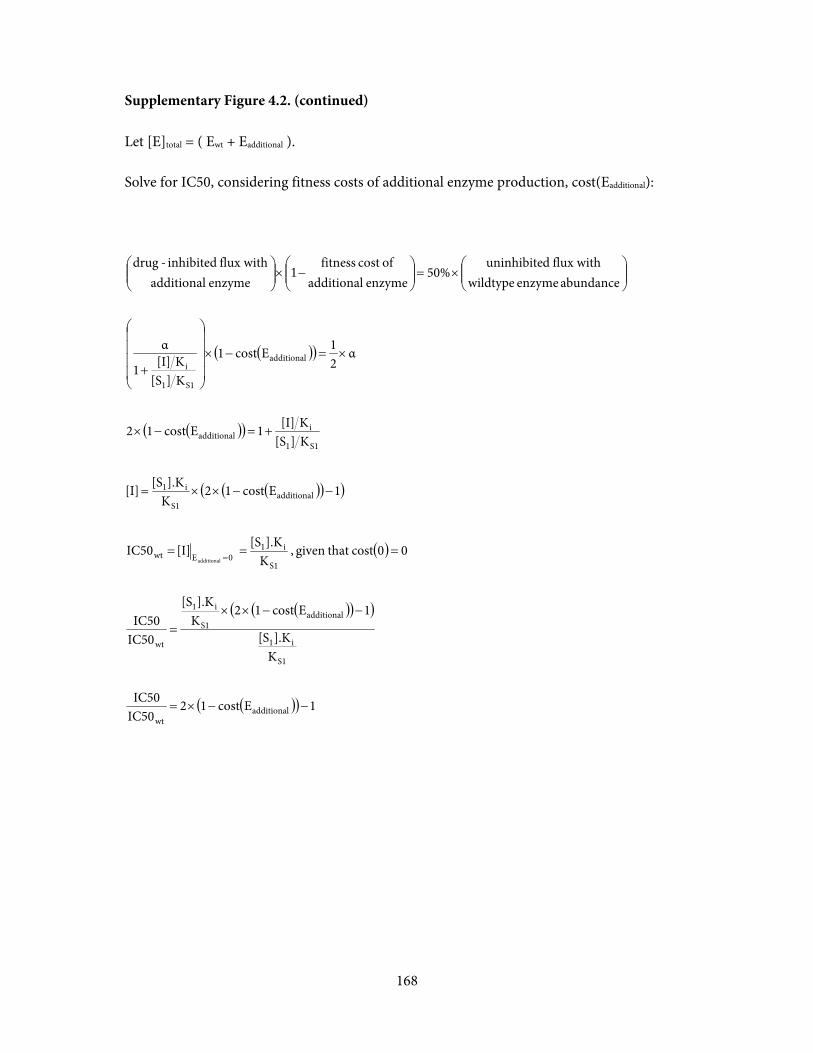
168
Supplementary Figure 4.2. (continued)
Let [E]total = ( Ewt + Eadditional ).
Solve for IC50, considering fitness costs of additional enzyme production, cost(Eadditional):
( )( )
( )( )
( )( )( )
( )
( )( )( )
( )( ) 1Ecost12IC50IC50
K].K[S
1Ecost12K].K[S
IC50IC50
00cost that given , K].K[S [I]IC50
1Ecost12K].K[S[I]
K][SK[I]1Ecost12
α21Ecost1
K][SK[I]1
α
abundance enzyme wildtypeflux with duninhibite
50%enzyme additional
of cost fitnessenzyme additional
flux with inhibited-drug
additionalwt
S1
i1
additionalS1
i1
wt
S1
i10Ewt
additionalS1
i1
S11
iadditional
additional
S11
i
additional
−−×=
−−××=
===
−−××=
+=−×
×=−×
⎟⎟⎟⎟
⎠
⎞
⎜⎜⎜⎜
⎝
⎛
+
⎟⎟⎠
⎞⎜⎜⎝
⎛×=⎟⎟
⎠
⎞⎜⎜⎝
⎛−×⎟⎟
⎠
⎞⎜⎜⎝
⎛
=
1
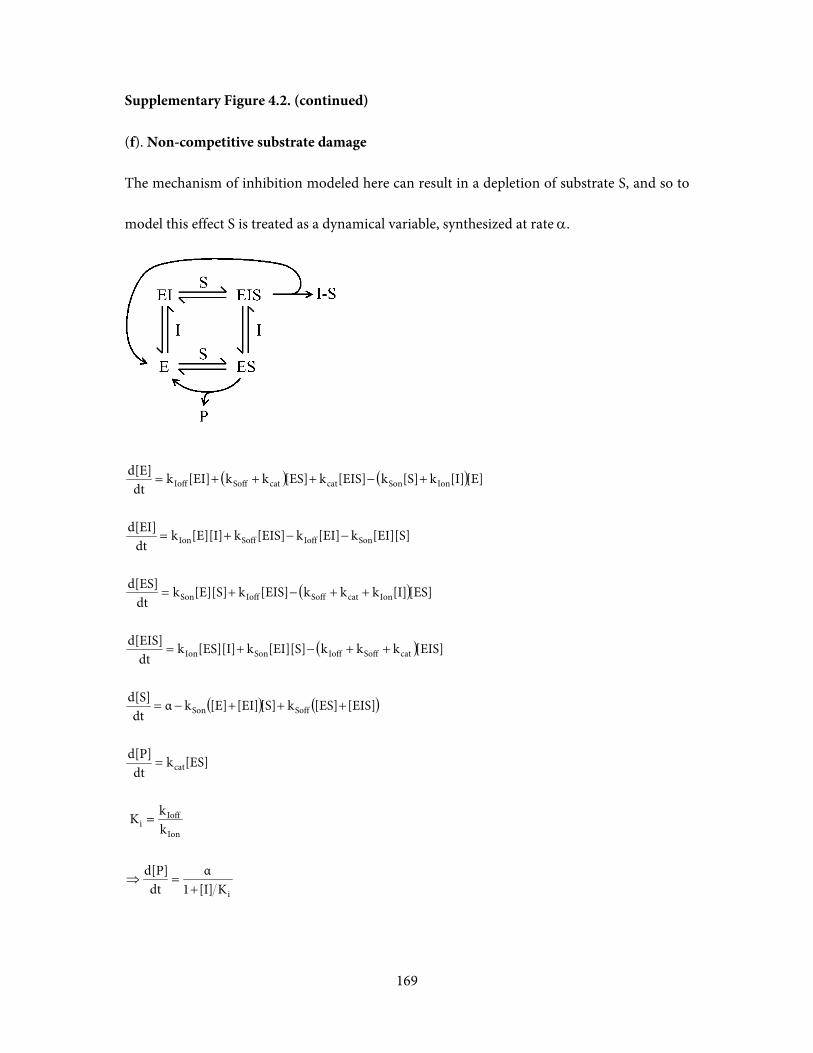
169
Supplementary Figure 4.2. (continued)
(f). Non-competitive substrate damage
The mechanism of inhibition modeled here can result in a depletion of substrate S, and so to
model this effect S is treated as a dynamical variable, synthesized at rate α.
( ) ( )
( )
( )
( ) ( )
i
Ion
Ioffi
cat
SoffSon
catSoffIoffSonIon
IoncatSoffIoffSon
SonIoffSoffIon
IonSoncatcatSoffIoff
K[I]1α
dtd[P]
kkK
[ES]kdt
d[P]
[EIS][ES]k[S][EI][E]kαdt
d[S]
[EIS]kkk[EI][S]k[ES][I]kdt
d[EIS]
[ES][I]kkk[EIS]k[E][S]kdt
d[ES]
[EI][S]k[EI]k[EIS]k[E][I]kdt
d[EI]
[E][I]k[S]k[EIS]k[ES]kk[EI]kdt
d[E]
+=⇒
=
=
+++−=
++−+=
++−+=
−−+=
+−+++=

170
Supplementary Figure 4.2. (continued)
The remainder of the derivation is identical to that in Supplementary Figure 4.2b, yielding
1IC50
IC50wt
=
or ( )( ) 1Ecost12IC50
IC50additional
wt−−×=
depending on the absence or presence of fitness costs for drug target over-expression.
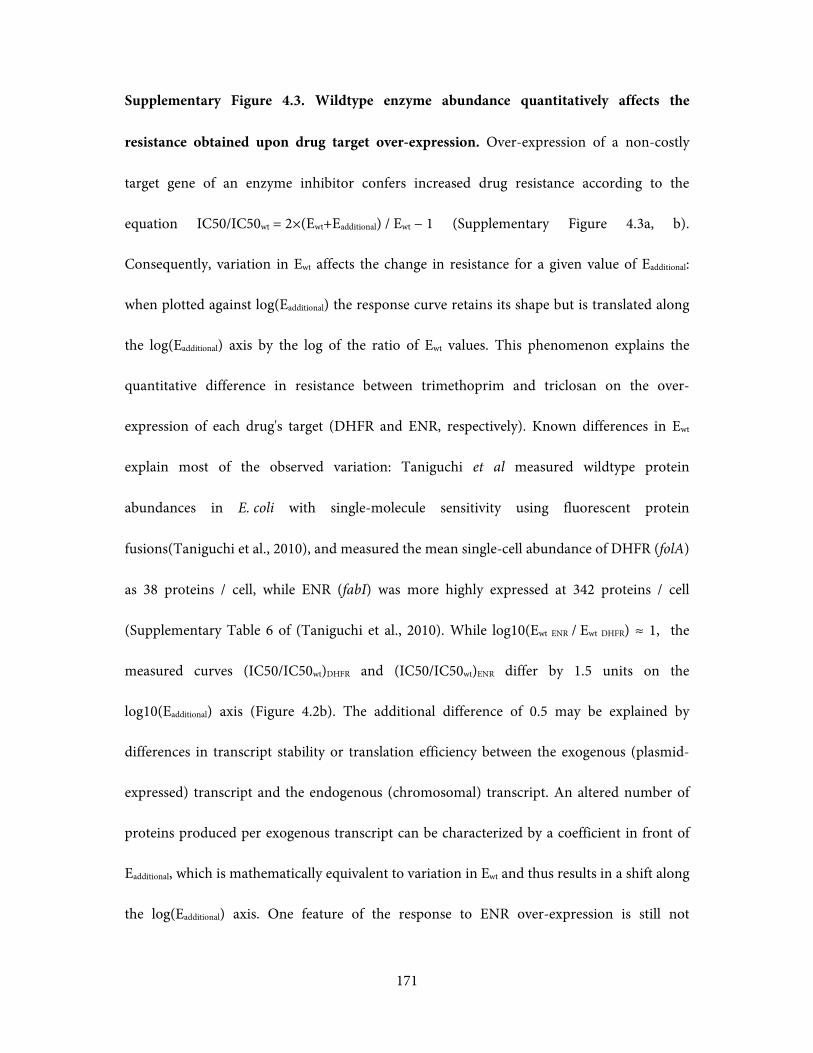
171
Supplementary Figure 4.3. Wildtype enzyme abundance quantitatively affects the
resistance obtained upon drug target over-expression. Over-expression of a non-costly
target gene of an enzyme inhibitor confers increased drug resistance according to the
equation IC50/IC50wt = 2×(Ewt+Eadditional) / Ewt − 1 (Supplementary Figure 4.3a, b).
Consequently, variation in Ewt affects the change in resistance for a given value of Eadditional:
when plotted against log(Eadditional) the response curve retains its shape but is translated along
the log(Eadditional) axis by the log of the ratio of Ewt values. This phenomenon explains the
quantitative difference in resistance between trimethoprim and triclosan on the over-
expression of each drug's target (DHFR and ENR, respectively). Known differences in Ewt
explain most of the observed variation: Taniguchi et al measured wildtype protein
abundances in E. coli with single-molecule sensitivity using fluorescent protein
fusions(Taniguchi et al., 2010), and measured the mean single-cell abundance of DHFR (folA)
as 38 proteins / cell, while ENR (fabI) was more highly expressed at 342 proteins / cell
(Supplementary Table 6 of (Taniguchi et al., 2010). While log10(Ewt ENR / Ewt DHFR) ≈ 1, the
measured curves (IC50/IC50wt)DHFR and (IC50/IC50wt)ENR differ by 1.5 units on the
log10(Eadditional) axis (Figure 4.2b). The additional difference of 0.5 may be explained by
differences in transcript stability or translation efficiency between the exogenous (plasmid-
expressed) transcript and the endogenous (chromosomal) transcript. An altered number of
proteins produced per exogenous transcript can be characterized by a coefficient in front of
Eadditional, which is mathematically equivalent to variation in Ewt and thus results in a shift along
the log(Eadditional) axis. One feature of the response to ENR over-expression is still not
172
explained by this theory: an elevated baseline level of resistance, conferred by carriage of the
ENR-expressing plasmid even without IPTG (Figure 4.1b). This effect, and a similar effect for
DNA Gyrase and Topo IV (reduced baseline resistance), can be explained by an elevated
baseline transcription of these genes from weak internal promoters (Supplementary Figure
4.5).
Supplementary Figure 4.3. Wildtype enzyme abundance quantitatively affects the
resistance obtained upon drug target over-expression. (Continued)
173
Supplementary Figure 4.4. Sulfonamides and trimethoprim inhibit their targets by
different molecular mechanisms. (a) Sulfonamide class antibiotics, such as
sulfamethoxazole, compete with para-aminobenzoic acid for binding to Dihydropteroate
synthase (DHPS). When sulfonamides bind to DHPS they do not inhibit catalysis, but are
covalently linked by DHPS to the substrate pteridine diphosphate. This substrate-diverting
reaction constitutes a distinction from competitive inhibition that profoundly changes the
relation between enzyme concentration and drug resistance (Supplementary Figure 4.2) (b)
Trimethoprim competes with dihydrofolic acid for binding to Dihydrofolate reductase
(DHFR), and exemplifies the traditional concept of a competitive enzyme inhibitor: DHFR
has no catalytic activity when bound by trimethoprim.

174
Supplementary Figure 4.4. Sulfonamides and trimethoprim inhibit their targets by
different molecular mechanisms. (Continued)
175
Supplementary Figure 4.5. Small differences in baseline drug resistance can be explained
by weak internal promoters in drug target genes. Plasmids encoding the drug target genes
ENR, Gyrase, and Topo IV induce small changes in resistance that do do not appear to be
caused by basal IPTG-regulated transcription (Supplementary Figure 4.1), since this baseline
change in resistance does not change further until a greater than 5-fold increase in IPTG-
induced transcription (Figure 4.1b). These effects may be explained by weak internal
promoters in these drug target genes, that will induce a baseline level of additional
transcription that is not IPTG-responsive. This figure demonstrates the theoretical responses
to ENR (h–c–), Gyrase (h+c+ lethal) and Topo IV (h+c+ partial) in the presence of a weak
internal promoter. Small amounts of additional drug target production have the effect of
inducing small changes in drug resistance; positive for h–c– and negative for h+c+; that persist
even as IPTG-regulated Eadditional approaches zero. In the examples shown here, the h–c– gene
(compare to ENR, Figure 4.1b) contains an internal promoter of 0.5% of the wildtype
promoter strength. As this gene is encoded on a plasmid with, conservatively, 50 copies per
cell(Kitagawa et al., 2005; Lutz and Bujard, 1997), this 0.5% activity per gene copy leads to a
baseline synthesis of 25% of Ewt, and consequently a measurable increase in baseline IC50.
This quantitative calibration (internal promoter = 0.5% of Ewt) is made possible by the relative
increase in drug resistance; such an estimation is not possible for genes that only incur costs,
not protection (e.g. Gyrase and Topo IV).
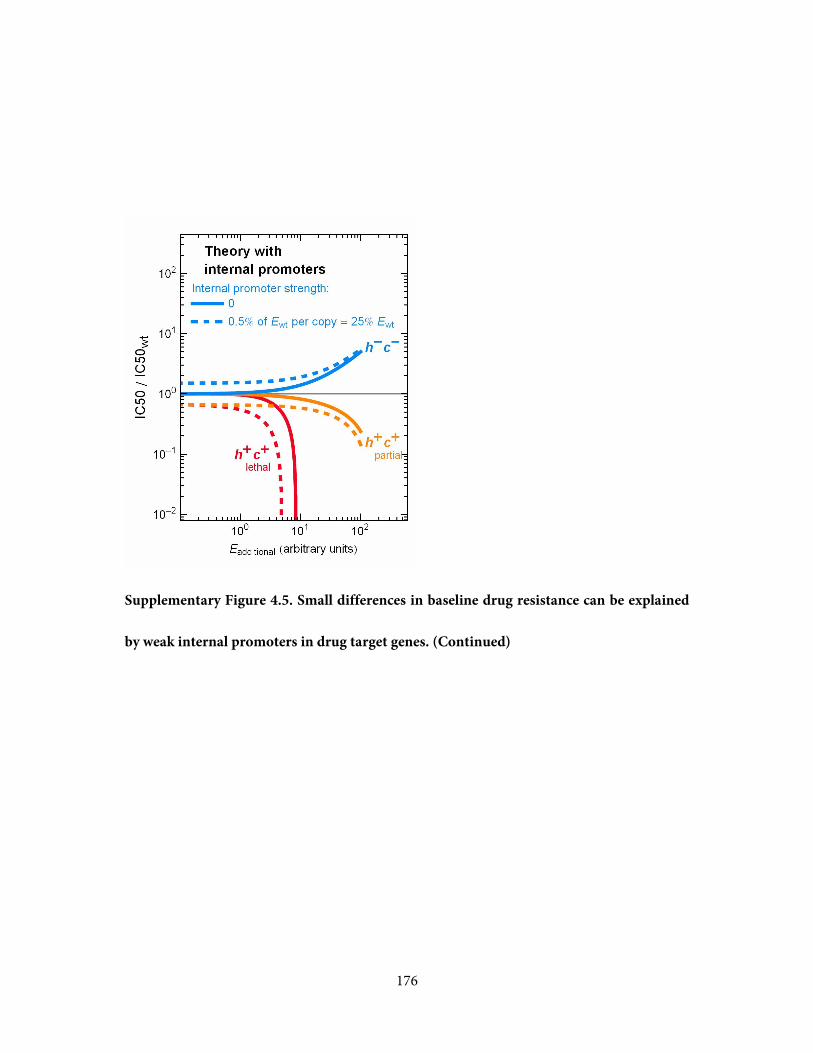
176
Supplementary Figure 4.5. Small differences in baseline drug resistance can be explained
by weak internal promoters in drug target genes. (Continued)
177
References
Amabile-Cuevas, C.F., and Demple, B. (1991). Molecular characterization of the soxRS genes of Escherichia coli: two genes control a superoxide stress regulon. Nucleic acids research 19, 4479-4484.
Anderson, P.M., Sung, Y.C., and Fuchs, J.A. (1990). The cyanase operon and cyanate metabolism. FEMS microbiology reviews 7, 247-252.
Bacon, C.W., Porter, J.K., Norred, W.P., and Leslie, J.F. (1996). Production of fusaric acid by Fusarium species. Appl Environ Microbiol 62, 4039-4043.
Baquero, M.R., Bouzon, M., Varea, J., and Moreno, F. (1995). sbmC, a stationary-phase induced SOS Escherichia coli gene, whose product protects cells from the DNA replication inhibitor microcin B17. Mol Microbiol 18, 301-311.
Barth, E., Gora, K.V., Gebendorfer, K.M., Settele, F., Jakob, U., and Winter, J. (2009). Interplay of cellular cAMP levels, {sigma}S activity and oxidative stress resistance in Escherichia coli. Microbiology 155, 1680-1689.
Bendezu, F.O., Hale, C.A., Bernhardt, T.G., and de Boer, P.A. (2009). RodZ (YfgA) is required for proper assembly of the MreB actin cytoskeleton and cell shape in E. coli. The EMBO journal 28, 193-204.
Bochner, B.R., Huang, H.C., Schieven, G.L., and Ames, B.N. (1980). Positive selection for loss of tetracycline resistance. J Bacteriol 143, 926-933.
Cohen, S.P., Hachler, H., and Levy, S.B. (1993). Genetic and functional analysis of the multiple antibiotic resistance (mar) locus in Escherichia coli. J Bacteriol 175, 1484-1492.
Collis, C.M., and Grigg, G.W. (1989). An Escherichia coli mutant resistant to phleomycin, bleomycin, and heat inactivation is defective in ubiquinone synthesis. J Bacteriol 171, 4792-4798.
Daniels, D.W., and Bertrand, K.P. (1985). Promoter mutations affecting divergent transcription in the Tn10 tetracycline resistance determinant. J Mol Biol 184, 599--610.
Dinh, T., Paulsen, I.T., and Saier, M.H., Jr. (1994). A family of extracytoplasmic proteins that allow transport of large molecules across the outer membranes of gram-negative bacteria. J Bacteriol 176, 3825-3831.
178
Giladi, M., Altman-Price, N., Levin, I., Levy, L., and Mevarech, M. (2003). FolM, a new chromosomally encoded dihydrofolate reductase in Escherichia coli. J Bacteriol 185, 7015-7018.
Girgis, H.S., Hottes, A.K., and Tavazoie, S. (2009). Genetic architecture of intrinsic antibiotic susceptibility. PLoS One 4, e5629.
Han, X., Dorsey-Oresto, A., Malik, M., Wang, J.Y., Drlica, K., Zhao, X., and Lu, T. (2010). Escherichia coli genes that reduce the lethal effects of stress. BMC microbiology 10, 35.
Heath, R.J., Yu, Y.T., Shapiro, M.A., Olson, E., and Rock, C.O. (1998). Broad spectrum antimicrobial biocides target the FabI component of fatty acid synthesis. The Journal of biological chemistry 273, 30316-30320.
Kadrmas, J.L., and Raetz, C.R. (1998). Enzymatic synthesis of lipopolysaccharide in Escherichia coli. Purification and properties of heptosyltransferase i. The Journal of biological chemistry 273, 2799-2807.
Keseler, I.M., Collado-Vides, J., Santos-Zavaleta, A., Peralta-Gil, M., Gama-Castro, S., Muniz-Rascado, L., Bonavides-Martinez, C., Paley, S., Krummenacker, M., Altman, T., et al. (2011). EcoCyc: a comprehensive database of Escherichia coli biology. Nucleic acids research 39, D583-590.
Kim, I., Kim, J., Min, B., Lee, C., and Park, C. (2007). Screening of genes related to methylglyoxal susceptibility. J Microbiol 45, 339-343.
Kishony, R., and Leibler, S. (2003). Environmental stresses can alleviate the average deleterious effect of mutations. J Biol 2, 14.
Kitagawa, M., Ara, T., Arifuzzaman, M., Ioka-Nakamichi, T., Inamoto, E., Toyonaga, H., and Mori, H. (2005). Complete set of ORF clones of Escherichia coli ASKA library (a complete set of E. coli K-12 ORF archive): unique resources for biological research. DNA research : an international journal for rapid publication of reports on genes and genomes 12, 291-299.
Kneidinger, B., Marolda, C., Graninger, M., Zamyatina, A., McArthur, F., Kosma, P., Valvano, M.A., and Messner, P. (2002). Biosynthesis pathway of ADP-L-glycero-beta-D-manno-heptose in Escherichia coli. J Bacteriol 184, 363-369.
Kolodkin-Gal, I., Hazan, R., Gaathon, A., Carmeli, S., and Engelberg-Kulka, H. (2007). A linear pentapeptide is a quorum-sensing factor required for mazEF-mediated cell death in Escherichia coli. Science 318, 652-655.

179
Kong, K.F., Schneper, L., and Mathee, K. (2010). Beta-lactam antibiotics: from antibiosis to resistance and bacteriology. APMIS : acta pathologica, microbiologica, et immunologica Scandinavica 118, 1-36.
Koo, M.S., Lee, J.H., Rah, S.Y., Yeo, W.S., Lee, J.W., Lee, K.L., Koh, Y.S., Kang, S.O., and Roe, J.H. (2003). A reducing system of the superoxide sensor SoxR in Escherichia coli. The EMBO journal 22, 2614-2622.
Kuznetsova, E., Proudfoot, M., Gonzalez, C.F., Brown, G., Omelchenko, M.V., Borozan, I., Carmel, L., Wolf, Y.I., Mori, H., Savchenko, A.V., et al. (2006). Genome-wide analysis of substrate specificities of the Escherichia coli haloacid dehalogenase-like phosphatase family. The Journal of biological chemistry 281, 36149-36161.
Lam, H.M., Tancula, E., Dempsey, W.B., and Winkler, M.E. (1992). Suppression of insertions in the complex pdxJ operon of Escherichia coli K-12 by lon and other mutations. J Bacteriol 174, 1554-1567.
Langman, L., Young, I.G., Frost, G.E., Rosenberg, H., and Gibson, F. (1972). Enterochelin system of iron transport in Escherichia coli: mutations affecting ferric-enterochelin esterase. J Bacteriol 112, 1142-1149.
Lenski, R.E., Souza, V., Duong, L.P., Phan, Q.G., Nguyen, T.N., and Bertrand, K.P. (1994). Epistatic effects of promoter and repressor functions of the Tn10 tetracycline-resistance operon of the fitness of Escherichia coli. Mol Ecol 3, 127--135.
Linstrom, E.B., Boman, H.G., and Steele, B.B. (1970). Resistance of Escherichia coli to penicillins. VI. Purification and characterization of the chromosomally mediated penicillinase present in ampA-containing strains. J Bacteriol 101, 218-231.
Lutz, R., and Bujard, H. (1997). Independent and tight regulation of transcriptional units in Escherichia coli via the LacR/O, the TetR/O and AraC/I1-I2 regulatory elements. Nucleic Acids Res 25, 1203-1210.
Maloy, S.R., and Nunn, W.D. (1981). Selection for loss of tetracycline resistance by Escherichia coli. J Bacteriol 145, 1110-1111.
Masuda, N., and Church, G.M. (2003). Regulatory network of acid resistance genes in Escherichia coli. Mol Microbiol 48, 699-712.
Mattiuzzo, M., Bandiera, A., Gennaro, R., Benincasa, M., Pacor, S., Antcheva, N., and Scocchi, M. (2007). Role of the Escherichia coli SbmA in the antimicrobial activity of proline-rich peptides. Mol Microbiol 66, 151-163.
180
McCalla, D.R., Kaiser, C., and Green, M.H. (1978). Genetics of nitrofurazone resistance in Escherichia coli. J Bacteriol 133, 10-16.
Meng, S.Y., and Bennett, G.N. (1992). Nucleotide sequence of the Escherichia coli cad operon: a system for neutralization of low extracellular pH. J Bacteriol 174, 2659-2669.
Miovic, M., and Pizer, L.I. (1971). Effect of trimethoprim on macromolecular synthesis in Escherichia coli. J Bacteriol 106, 856-862.
Misra, R., and Miao, Y. (1995). Molecular analysis of asmA, a locus identified as the suppressor of OmpF assembly mutants of Escherichia coli K-12. Mol Microbiol 16, 779-788.
Moyed, H.S., Nguyen, T.T., and Bertrand, K.P. (1983). Multicopy Tn10 tet plasmids confer sensitivity to induction of tet gene expression. J Bacteriol 155, 549--556.
Nagakubo, S., Nishino, K., Hirata, T., and Yamaguchi, A. (2002). The putative response regulator BaeR stimulates multidrug resistance of Escherichia coli via a novel multidrug exporter system, MdtABC. J Bacteriol 184, 4161-4167.
Nicoloff, H., Perreten, V., McMurry, L.M., and Levy, S.B. (2006). Role for tandem duplication and lon protease in AcrAB-TolC- dependent multiple antibiotic resistance (Mar) in an Escherichia coli mutant without mutations in marRAB or acrRAB. J Bacteriol 188, 4413-4423.
Nikaido, H. (1989). Outer membrane barrier as a mechanism of antimicrobial resistance. Antimicrob Agents Chemother 33, 1831-1836.
Panagiotidis, C.A., Huang, S.C., and Canellakis, E.S. (1995). Relationship of the expression of the S20 and L34 ribosomal proteins to polyamine biosynthesis in Escherichia coli. The international journal of biochemistry & cell biology 27, 157-168.
Parks, D.R., Roederer, M., and Moore, W.A. (2006). A new "Logicle" display method avoids deceptive effects of logarithmic scaling for low signals and compensated data. Cytometry A 69, 541-551.
Paterson, E.S., Boucher, S.E., and Lambert, I.B. (2002). Regulation of the nfsA Gene in Escherichia coli by SoxS. J Bacteriol 184, 51-58.
Pogliano, J., Lynch, A.S., Belin, D., Lin, E.C., and Beckwith, J. (1997). Regulation of Escherichia coli cell envelope proteins involved in protein folding and degradation by the Cpx two-component system. Genes & development 11, 1169-1182.
181
Polissi, A., De Laurentis, W., Zangrossi, S., Briani, F., Longhi, V., Pesole, G., and Deho, G. (2003). Changes in Escherichia coli transcriptome during acclimatization at low temperature. Research in microbiology 154, 573-580.
Reynolds, C.M., Kalb, S.R., Cotter, R.J., and Raetz, C.R. (2005). A phosphoethanolamine transferase specific for the outer 3-deoxy-D-manno-octulosonic acid residue of Escherichia coli lipopolysaccharide. Identification of the eptB gene and Ca2+ hypersensitivity of an eptB deletion mutant. The Journal of biological chemistry 280, 21202-21211.
Sarkar, S.K., Chowdhury, C., and Ghosh, A.S. (2010). Deletion of penicillin-binding protein 5 (PBP5) sensitises Escherichia coli cells to beta-lactam agents. International journal of antimicrobial agents 35, 244-249.
Satishchandran, C., and Boyle, S.M. (1986). Purification and properties of agmatine ureohydrolyase, a putrescine biosynthetic enzyme in Escherichia coli. J Bacteriol 165, 843-848.
Sprenger, G.A., Schorken, U., Wiegert, T., Grolle, S., de Graaf, A.A., Taylor, S.V., Begley, T.P., Bringer-Meyer, S., and Sahm, H. (1997). Identification of a thiamin-dependent synthase in Escherichia coli required for the formation of the 1-deoxy-D-xylulose 5-phosphate precursor to isoprenoids, thiamin, and pyridoxol. Proc Natl Acad Sci U S A 94, 12857-12862.
Suzuki, Y., and Brown, G.M. (1974). The biosynthesis of folic acid. XII. Purification and properties of dihydroneopterin triphosphate pyrophosphohydrolase. The Journal of biological chemistry 249, 2405-2410.
Takayama, M., Ohyama, T., Igarashi, K., and Kobayashi, H. (1994). Escherichia coli cad operon functions as a supplier of carbon dioxide. Mol Microbiol 11, 913-918.
Tamaki, S., Sato, T., and Matsuhashi, M. (1971). Role of lipopolysaccharides in antibiotic resistance and bacteriophage adsorption of Escherichia coli K-12. J Bacteriol 105, 968-975.
Taniguchi, Y., Choi, P.J., Li, G.W., Chen, H., Babu, M., Hearn, J., Emili, A., and Xie, X.S. (2010). Quantifying E. coli proteome and transcriptome with single-molecule sensitivity in single cells. Science 329, 533-538.
Tsui, P., Helu, V., and Freundlich, M. (1988). Altered osmoregulation of ompF in integration host factor mutants of Escherichia coli. J Bacteriol 170, 4950-4953.
Tucker, D.L., Tucker, N., Ma, Z., Foster, J.W., Miranda, R.L., Cohen, P.S., and Conway, T. (2003). Genes of the GadX-GadW regulon in Escherichia coli. J Bacteriol 185, 3190-3201.
182
Vimr, E.R., and Troy, F.A. (1985). Identification of an inducible catabolic system for sialic acids (nan) in Escherichia coli. J Bacteriol 164, 845-853.
Wei, Y., Vollmer, A.C., and LaRossa, R.A. (2001). In vivo titration of mitomycin C action by four Escherichia coli genomic regions on multicopy plasmids. J Bacteriol 183, 2259-2264.
Wu, W.H., and Morris, D.R. (1973). Biosynthetic arginine decarboxylase from Escherichia coli. Purification and properties. The Journal of biological chemistry 248, 1687-1695.
Yeh, P., Tschumi, A.I., and Kishony, R. (2006). Functional classification of drugs by properties of their pairwise interactions. Nat Genet 38, 489--494.
Yuen, P.H., and Sokoloski, T.D. (1977). Kinetics of concomitant degradation of tetracycline to epitetracycline, anhydrotetracycline, and epianhydrotetracycline in acid phosphate solution. J Pharm Sci 66, 1648--1650.
Related Documents


