Gender Sensitive Evaluation of the Goat Value Chain in the Lowveld of Swaziland Estefania Rodriguez [email protected] A FIELD PRACTICUM REPORT SUBMITTED IN PARTIAL FULFILLMENT OF THE REQUIREMENTS FOR A MASTER OF SUSTAINABLE DEVELOPMENT PRACTICE DEGREE AT THE UNIVERSITY OF FLORIDA Supervisory Committee: Dr. Sandra Russo, Chair Dr. Renata Serra, Member Dr. Muthusami Kumaran, Member

Welcome message from author
This document is posted to help you gain knowledge. Please leave a comment to let me know what you think about it! Share it to your friends and learn new things together.
Transcript

Gender Sensitive Evaluation of the Goat Value Chain in the Lowveld of Swaziland
Estefania Rodriguez [email protected]
A FIELD PRACTICUM REPORT SUBMITTED IN PARTIAL FULFILLMENT OF THE REQUIREMENTS FOR A MASTER OF SUSTAINABLE DEVELOPMENT PRACTICE DEGREE AT THE UNIVERSITY OF
FLORIDA
Supervisory Committee: Dr. Sandra Russo, Chair
Dr. Renata Serra, Member Dr. Muthusami Kumaran, Member

1 | P a g e
Table of Contents Acknowledgements ......................................................................................................................... 2
List of Tables .................................................................................................................................. 3
Acronyms ........................................................................................................................................ 3
Abstract ........................................................................................................................................... 3
Context and Background ................................................................................................................. 5
Swaziland .................................................................................................................................... 5
The Goat Sector of Swaziland ..................................................................................................... 8
Gender ......................................................................................................................................... 9 Gender and Livestock ................................................................................................................ 10
Gender and Value Chains .......................................................................................................... 11
Objectives ..................................................................................................................................... 12
Conceptual Framework ................................................................................................................. 13
Methods ......................................................................................................................................... 14
Surveys ...................................................................................................................................... 14
Focus Groups ............................................................................................................................. 17
Key Informant Interviews ......................................................................................................... 18
Study Results ................................................................................................................................ 19 Value Chain ............................................................................................................................... 19
Input Supply and Support Services ........................................................................................... 20
Farm Production ........................................................................................................................ 22
Marketing .................................................................................................................................. 27
Discussion ..................................................................................................................................... 30
Constraints and Opportunities ................................................................................................... 30
Conclusions ................................................................................................................................... 31
Recommendations ......................................................................................................................... 32 References ..................................................................................................................................... 34
Appendix 1 Individual Goat Owning Household Survey ............................................................. 37
Appendix 2 Focus Group Questionnaire ....................................................................................... 43
Appendix 3 Key Informant Questionnaire .................................................................................... 44
2 | P a g e
Acknowledgements
Deep gratitude and many thanks, especially to:
My organizational hosts: Samson Sithole, David Rendall, Steven Wright, Fumani Ntuli, Maxwell Tfwala, Andiswa Lukhele, and Zwelthu Dlamini;
My committee chair: Dr. Sandra Russo;
My committee members: Dr. Renata Serra and Dr. Muthusami Kumaran;
My program director: Dr. Glenn Galloway;
My program coordinator: Dr. Andy Noss;
My family
Self-Reflection
This field practicum was a wonderful way to put the theory of what we’ve learned in
class into real practice. Beyond classroom lessons, this practicum taught me how to be flexible
and adaptable, it taught me how to work with a variety of different people and most importantly
it taught me how to step up and be a leader. Working with my organization and in Swaziland had
its challenges but was overall a great experience. I am so appreciative that I got to work with and
interview so many wonderful people.

3 | P a g e
List of Figures
Figure 1. Map of Swaziland. ........................................................................................................... 5
Figure 2. Trends in Swaziland’s HDI component indices. (UNDP, 2016). .................................... 6
Figure 3. Sample Area. ................................................................................................................. 15
Figure 4. LUSIP 1 Dip Tank Representation. ............................................................................... 16
Figure 5. Respondents Who Received Goat Production Training. ............................................... 21
Figure 6. Goat Ownership. ............................................................................................................ 22
Figure 7. Objective of Goat Ownership. ....................................................................................... 23
Figure 8. Responsibilities of Goat Production. ............................................................................. 25
Figure 9. Income Control. ............................................................................................................. 26
Figure 10. Income Use. ................................................................................................................. 27
Figure 11. Respondents Who Sold Goats in the Past 5 Years. ..................................................... 28
List of Tables
Table 1 Livestock Numbers from 1997-2007, Swaziland. (AFTAR, 2011). ................................. 8
Table 2. Demographic information of household survey respondents, disaggregated by gender. 17
Table 3. List of Key Informants. ................................................................................................... 19
Acronyms
DVLS Department of Veterinary and Livestock Services
ILRI International Livestock Research Institute
KDDP Komati Downstream Development Project
LUSIP 1 Lower Usuthu Irrigation Project 1
LUSIP 2 Lower Usuthu Irrigation Project 2
SWADE Swaziland Water and Agricultural Development Enterprise
4 | P a g e
Abstract The role that women play in the livestock sector in Swaziland is not well researched.
Swaziland Water and Agricultural Development Enterprise (SWADE) is interested in
understanding women’s livelihoods with respect to livestock, specifically goats. The purpose of
this project is to evaluate the potential for commercializing goat production using a gender-
focused value chain approach and provide the results to SWADE. In order to determine the
usefulness of implementing development initiatives into the sector, including the inclusion of
goats in an abattoir, it is important to first understand the goat value chain and the role of men,
women and children in this chain. This study found that there is room for women’s roles in the
sector to increase and supporting this growth would help the sector as a whole move forward.
Additionally, there is a demand for goat meat in Swaziland that is not being met. The
introduction of goats into an abattoir would be an effective way to meet this demand.

5 | P a g e
Context and Background Swaziland The Kingdom of Swaziland (Swaziland) is a
landlocked country in Southern Africa located between
Mozambique and South Africa. The country covers an
area of 17,364 square miles, which amounts to slightly
less than the size of New Jersey and makes it one of the
smallest countries on the continent of Africa. Swaziland
has a population of 1,451,428 people as of 2017 (CIA,
2017). The population growth rate of the country is
1.1% per year. Swaziland has a young population, with
35.5% of the population being under the age of 14 and
22.19% of the population between the ages of 15-24 years. The official governmental language
of the country is English (CIA, 2017). Swaziland has four administrative districts: Hhohho,
Lubombo, Manzini, and Shiselweni. The administrative capital of the country is Mbabane while
the royal and legislative capital is Lobamba. The country is governed by an absolute monarchy.
The current king of Swaziland is King MSWATI III (CIA, 2017).
Swaziland is surrounded by South Africa except for a small border it shares with
Mozambique; because of this the country depends heavily on South Africa for its exports (60%)
and its imports (90%). Swaziland’s currency is the Swazi lilangeni and it is pegged to the South
African rand. With a gross domestic product (GDP) per capita of about $3,000, Swaziland is
classified as a lower middle-income country (World Bank, 2017). Swaziland’s economic growth
has been slowing since 2013 due to continued drought in the country and difficult external
factors, including low foreign investment. Income inequality is high within the country.
Figure 1. Map of Swaziland.

6 | P a g e
Swaziland has a Gini coefficient of 49.5 (World Bank, 2017). An estimated 20% of the
population controls 80% of the nation’s wealth (CIA, 2017). Additionally, the estimated
unemployment rate in Swaziland is high at 40%, but such figures are not shown to be very
accurate (CIA, 2017).
The Human Development Index (HDI) measures three dimensions of human
development including a long and healthy life, access to knowledge and a decent standard of
living. Swaziland’s HDI value for the year 2015 was 0.541 (UNDP, 2016). This puts Swaziland
in the low human development category with a ranking of 148 out of 188 countries (UNDP,
2016). Figure 2 shows the contribution of each component (life expectancy, education, GNI per
capita) to Swaziland’s HDI from the years 1990-2015.
Figure 2. Trends in Swaziland’s HDI component indices. (UNDP, 2016).
The low life expectancy contribution can be attributed to the country’s high rates of
HIV/AIDS. Swaziland suffers from one the world’s highest HIV/AIDS prevalence rates; 28.8%
of the adult population in Swaziland lives with HIV/AIDS (AVERT, 2016). Within the

7 | P a g e
population, 31% of all women are living with HIV/AIDS compared to 20% of men making
women disproportionately affected by the epidemic (AVERT, 2016). According to the Central
Intelligence Agency (CIA) website, “A weak and deteriorating economy, high unemployment,
rapid population growth, and an uneven distribution of resources all combine to worsen already
persistent poverty and food insecurity, especially in rural areas (CIA, 2017).” The HIV epidemic
has impacted the average life expectancy of the country, which is currently at an estimated 51.6
years (CIA, 2017).
The mean years of schooling in Swaziland is 6.8 years, with that for females at 6.4 years
and males at 7.2 years (UNDP, 2016). The adult literacy rate is at 87.5%, with no significant
difference between men and women (CIA, 2017). Swaziland is far from reaching the ‘Education
for All Goals” which is a global commitment to provide basic education for all children, youth
and adults. The movement was launched by UNESCO, UNDP, UNICEF, and the World Bank.
Poverty in the country has led to decreased demand for education as households cannot afford to
send children to school The HIV/AIDS pandemic negatively impacts the demand for education.
Additionally, the average distance between schools and households is very long in rural areas
and there is also a lack of teachers in the country (World Bank, 2006).
Swaziland is a predominantly rural country; the majority of the population (about 70%)
relies on agriculture for their livelihoods. Agriculture accounts for 5.8% of Swaziland’s GDP
while industry accounts for 44.5%, and services accounts for 49.7% (CIA, 2017). Swaziland’s
government has made efforts to increase investments in the country’s agricultural sector, but
these investments have produced limited results. The agricultural sector suffers from low
productivity, food production not keeping up with population demand and rising food insecurity
(World Bank, 2017).

8 | P a g e
According to a World Bank (2011) report, “Swaziland’s agriculture sector is highly
dualistic; it encompasses a traditional subsector and a commercial subsector. This dualism
reflects fundamental disparities in land ownership arrangements. The traditional subsector is
based on communal land tenure on Swazi Nation Land (SNL), and the commercial subsector is
based on Title Deed Land (TDL). SNL, which occupies 60 percent of the country’s land area, is
largely used for subsistence farming, while TDL, which occupies the remaining 40 percent, is
used mainly for commercial agriculture, characterized by relatively high capital intensive cash-
crop production (mostly sugar cane and citrus), irrigation, and corporate ownership.”
The Goat Sector of Swaziland A large percentage of households in Swaziland owns livestock (CIA, 2017). They play an
important economic and cultural role in the country. Table 1 shows that the number of livestock
in the country according to a 2015 census conducted by the DVLS. About 20% of the country’s
agricultural GDP can be attributed to livestock (CIA, 2017). This contribution is made up mostly
by cattle with a small percentage contributed by poultry. Although goats do not contribute
officially to the country’s export/import economy, they do contribute to the nutrition and cash
needs of rural households.
Table 1. Livestock Numbers from 2015 Census, Swaziland. (DVLS, 2015).
Among the majority of the rural population, the goat stands out as the most popular small
ruminant. They play a vital role in social, cultural and economic activities amongst goat owners.
Goats are sold to generate needed cash income for a family including school fees, buying clothes

9 | P a g e
and purchasing food (Lebbie, 1987). Goats are well suited for Swaziland’s climate because of
their adaptability, prolificacy and modest nutrient requirements (Lebbie & Mastapha, n.d).
However, despite their popularity, goats and small ruminants in general have made little
contribution to the export earnings of the country. Lebbie (1987) found that very little attention
has been given to small ruminant development at the national level. Diversifying the livestock
industry is imperative in a country like Swaziland that experiences persistent droughts. Goat’s
ability to tolerate dietary restrictions that may arise during a drought makes them an excellent fit
for Swaziland’s climatic systems. Additionally, goats have the advantage of being able to
reproduce quickly, about twice per year. Each birth has the potential of producing twins or even
triples (Lebbie & Mastapha, n.d). The impressive fertility of goats ensures that goats herds can
survive even if neglected by their owner.
Gender According to the International Livestock Research Institute (2013), “Gender refers to the
socially constructed roles, responsibilities and status of women, men, girls and boys….Gender is
thus not about women, but about the relationship between women and men. In addition, gender
relations, roles, responsibilities and the status of women change over time, sometimes to
women’s advantage.” Swaziland was ranked 137 out of 188 countries in the 2016 UNDP’s
Gender Inequality Index. In comparison, Swaziland’s bordering country of South Africa ranked
90 out of 188 countries for the same index. The Index measures inequality between men and
women in three areas: reproductive health, empowerment, and the labor market (UNDP, 2016).
As far as political participation, women in Swaziland occupy 14.7% of the share of seats
in parliament, compared to South Africa where women occupy 41.2% of the seats in parliament
(UNDP, 2016). In Swaziland, women and girls do not have legal protection from rape
10 | P a g e
committed by their husbands. Additionally, there are no laws criminalizing domestic violence,
forced marriage, or early marriage. Married women are denied legal status as adults meaning that
they cannot buy or sell property or land or sign legal contracts without their husband’s consent.
Husbands often control household resources (Amnesty Int., 2010).
Gender and Livestock As there is little information on the role women play in Swaziland’s agricultural sector,
this section focuses on general trends found in the literature pertaining to Africa. The livestock
sector in general has great economic potential as it is a source of wealth accumulation and
income and provides food security. This sector is an important place to promote gender equality
for multiple reasons. First, all household members are involved in livestock production, with
women providing much of the work. Second, livestock products are produced throughout the
year with no restrictions based on season. Third, livestock production systems have a high
opportunity to introduce gender-based projects (IFAD, 2010).
Despite women being an important source of labor in the agricultural sector, their
contributions seem to be undervalued and they are often excluded from discourse related to
livestock sector improvements. If women were given the same resources and opportunities as
their male counterparts, agricultural productivity would increase by 30% and the number of
people living in poverty would decrease by 17% (FAO, 2011). This is in no small part due to the
fact that women are more likely than men to spend their income on family and community
(FAO, 2011).
There is a gender gap in agriculture, and especially in the livestock sector, where women
generally have access to fewer resources and opportunities than their male counterparts.
According to the literature (ILRI, 2010), the barriers to productive participation in the livestock

11 | P a g e
sector that women face can be broken into three major problems. First, women lack access to
capital as well as other productive inputs such as land, equipment, credit etc., which constrains
their economic empowerment. Second, they have limited control over income generating
activities, as often women are not in control of the sale of livestock products or the financial
gains from sales. Third, projects such as agricultural extension often indirectly exclude women,
which limits their access to information.
Gender and Value Chains A value chain can be defined as all activities that are needed to bring a product or service
from conception up through the different phases of production and delivery to final consumers.
A value chain analysis is the process of documenting and analyzing the operation of a value
chain, which includes mapping chain actors and identifying value added along the chain. Gender
is an important aspect of value chain analysis. Analyzing the barriers to entry and opportunities
presented by a value chain can lead to understanding value chain interventions that lead to an
income or equity focused outcome for women. An International Livestock Research Institute
Report (ILRI), stated that, “in relation to women and value chains, empowerment is about
changing gender relations to enhance women’s ability to shape their lives. It is about addressing
the inequalities that women face as they participate in value chain activities with the goal of
increasing their visibility, voice and choice. From an empowerment perspective, differences in
how women and men are involved in (and benefit from) value chains are not by definition a
problem, because differences in preferences have to be distinguished from denials of choice
(ILRI, 2007).”
While customs and norms between countries vary, traditionally women are in charge of
both reproductive and productive roles, which means that they have limited time and mobility,

12 | P a g e
thus they tend to participate in value chain activities that are close to the household. Men on the
other hand, often participate in value chain activities away from the household, which can often
be more profitable. According to the same ILRI report,” The nodes in which men and women
actors tend to occupy vary. Men tend to dominate functions with relatively high barriers to entry
and correspondingly greater returns, and to control chain management functions while women
occupy the lower nodes due to lack of adequate income, limited skills, limited access to
education and training, limited access to markets and market information. Disproportionate
representation of women in low-value value chains and the lower nodes within these chains is an
established reality of value chains (ILRI, 2007).” Gender relations are an important aspect of
value chain analysis as they are affected and affect the functions of value chains. A study done in
Matsanjeni Swaziland that examined the socioeconomic constraints of goat farming found that
women owned smaller livestock like goats and chickens while men, in a larger percentage,
owned larger livestock such as cattle (Singwane & Salam, 2007).
Objectives Below are the three main objectives of this study;
• Generate information about the current goat value chain in the Lowveld of Swaziland to
identify areas of opportunities and constraints along the value chain.
• Provide a gender sensitive analysis of the goat value chain in order to identify each
actor’s role in the vale chain and how they are impacted by the value chain and to use this
information to identify the possible effectiveness of an abattoir that includes goats in
commercializing the goat sector.
• Propose recommendations to improve the functioning of the goat market between
communities and within supply chains in order to improve the potential that comes from
goat raising in the Lowveld of Swaziland.
13 | P a g e
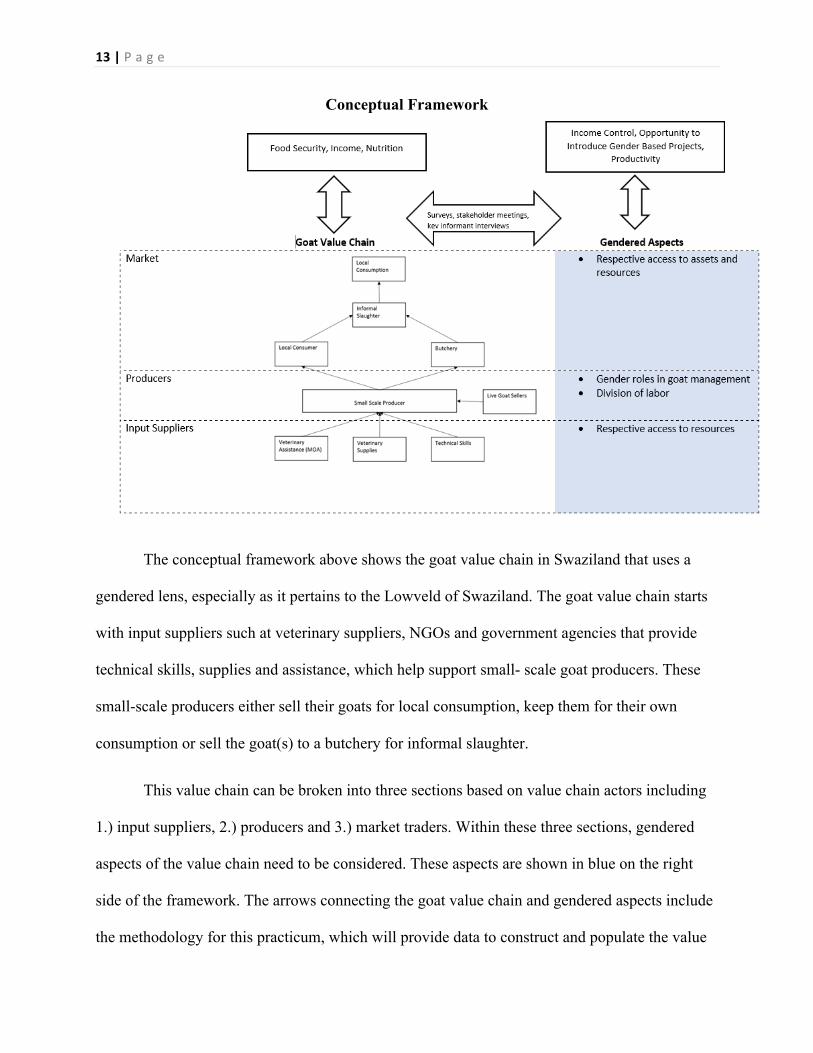
Conceptual Framework
The conceptual framework above shows the goat value chain in Swaziland that uses a
gendered lens, especially as it pertains to the Lowveld of Swaziland. The goat value chain starts
with input suppliers such at veterinary suppliers, NGOs and government agencies that provide
technical skills, supplies and assistance, which help support small- scale goat producers. These
small-scale producers either sell their goats for local consumption, keep them for their own
consumption or sell the goat(s) to a butchery for informal slaughter.
This value chain can be broken into three sections based on value chain actors including
1.) input suppliers, 2.) producers and 3.) market traders. Within these three sections, gendered
aspects of the value chain need to be considered. These aspects are shown in blue on the right
side of the framework. The arrows connecting the goat value chain and gendered aspects include
the methodology for this practicum, which will provide data to construct and populate the value
14 | P a g e
chain model. It is hoped that an understanding of the goat value chain will aid in the
identification of opportunities to enhance food security, augment income and improve nutrition
while understanding the gendered aspects can lead to greater income control by women,
expanded opportunity to introduce gender based projects, and increased productivity.
Methods As previously highlighted, understanding the goat value chain and the role each actor plays
in the chain is crucial before any programs can be implemented to expand the sector. Although
previous research has been conducted on certain aspects of the goat value chain, especially the
socio-economic importance of goat raising in Swaziland, none have included the disaggregation
of gender as a factor. As such, the primary research question for this study was, “Is there room
for commercialization of the goat value chain in the Lowveld of Swaziland given the current role
men, women and children play in the chain?” To answer this question, a thorough analysis of the
current value chain was conducted to ensure programs focused on commercializing the sector,
would not exclude or create barriers for certain groups. A mixed-methods approach was used to
collect both qualitative and quantitative information. This included surveys, focus groups and
key informant interviews highlighted below. All of the methodology instruments used were
approved by the University of Florida’s Internal Review Board.
Surveys An individual survey was prepared before arrival in Swaziland. The survey was created using
surveys developed by the International Livestock Research Institute and then adapted to fit the
goals of this project. The preliminary survey was piloted in the first two weeks of arrival in
Swaziland. The pilot survey provided the opportunity to test for challenges in wording and/or
timing. It also provided the opportunity for the survey to be more specifically tailored to

15 | P a g e
Swaziland’s goat sector. The survey used for this study can be found in Appendix 1. The surveys
were administered to goat owning farmers and were not limited to the head of household.
The surveys were conducted in 4 areas in the Lowveld of Swaziland including LUSIP 1,
LUSIP 2, Hlane and KDDP. This was done in order to have representative sample of the
Lowveld. In LUSIP 1, 77 surveys were conducted, 32 were conducted in LUSIP 2, 14 were
conducted in Hlane and 14 were conducted in KDDP for a total of 137 surveys. A visual
representation of the sample area for this study can be found in Figure 3.
Figure 3. Sample Area.
Surveys were also conducted, as much as possible, at dip tanks where livestock owners and
managers brought animals for dipping. The number of farmers for each dip tank was provided by
the Ministry of Agriculture, when possible, as well as the number of kraals and the number of
goats in each dip tank. Below is a map of the dip tanks present in LUSIP 1 developed with the
help of SWADE using data given by the Ministry of Agriculture.
LUSIP 1 56% LUSIP 2
24%
Hlane 10%
KDDP 10%
SAMPLE AREA

16 | P a g e
Figure 4. LUSIP 1 Dip Tank Representation.
Between weeks 3 and 7 of the study, 137 surveys were conducted at various sites. Survey
participants were found by going to homestead individually or by attending events in which
several farmers were present such as meetings or dip tank days. In some cases, we had the help
of a livestock officer or veterinary assistant, which made the process faster as they knew where
farmers would be. The surveys were written in English and translated verbally. Two translators
were used throughout the project. Since the surveys were written in English it was important to
limit the number of translators to avoid any differences in translations that might affect the
consistency of the data.

17 | P a g e
No preference was given for the gender of the participants to avoid surveyor bias, hence
participants were selected by availability of household members. 72 of respondents were women
while 65 were men. The mean age of survey respondents was 48.5 with a minimum age of 22
and a maximum age of 78. Education levels varied by gender. The marital status of each
participant was also surveyed, with most respondents being married. The demographic
information for all survey respondents, disaggregated by gender can be found below in Table 2.
Focus Groups
The purpose of the focus groups was to fill in any gaps in information from the surveys
as well as to clarify any possible misunderstandings. Focus groups questions were prepared using
a toolkit developed by ILRI and adapted to fit the context of the study. The questionnaire used as
a base for the focus groups can be found in Appendix 2, Focus groups were conducted out in the
field and participants were gathered using the health of veterinary assistants and SWADE
employees who had knowledge of the area and people.
One focus group was conducted in Hlane with farmers who did not own goats. The
purpose of this focus group was to identify barriers to entry in the goat value chain. Six women
Respondents Age (years) Education Level Marital Status
None
Primary School
High school
Further Education Married Widowed Divorced Separated Single
Gender n % Mean Min Max n(%) n(%) n(%) n(%) n(%) n(%) n(%) n(%) n(%)
Men 65 47 50 22 78 10(15) 19 (29) 35 (54) 1 (2) 50 (77) 7 (11) 2 (3) 0 (0) 6 (9)
Women 72 53 47 22 76 18(25) 30 (42) 24 (33) 0 (0) 42 (58) 17 (24) 1 (1) 2 (3) 10(14)
Total 137 100 48.5 22 78 28(20) 49 (36) 59 (43) 1 (1) 92 (67) 24 (18) 3 (2) 2 (1) 16(12)
Table 2. Demographic information of household survey respondents, disaggregated by gender.

18 | P a g e
participated in this focus group. A focus group was also conducted in Sekuyakhona Ngoni with
six women whose household owned goats.
One constraint to the study is the number of focus groups conducted. If given more time,
more focus groups would have been conducted as it seemed that the women were more willing to
participate in a group setting and they were able to bounce ideas off of each other. This led to
more detailed responses to questions.
Key Informant Interviews The purpose of the key informant interviews was to gain a better understanding of the
other aspects of the value chain including input supply, demand, and marketing. Key informant
interviews were conducted using a semi structured format with a key informant questionnaire
developed by ILRI used as a guide, which can be found in Appendix 3. Key informants were
chosen using information gathered from the surveys as well as guidance from SWADE. Key
informants interviewed can be found in Table 3 below.
Workers at 2 input supply facilities (SAS and Khuba Traders)
Animal Husbandry Officer at the MOA Swaziland
Red Meat Research Expert
Goat Buyer
Professor in Animal Sciences Department at the University of Swaziland
2 farmers interested and moving towards commercial goat production
Livestock Economist at the MOA Swaziland

19 | P a g e
Table 3. List of Key Informants.
Study Results Value Chain
Market
Production
Input Supply
Enabling Environment Genetic Potential of Local Animals, Economic/ Cultural Roles (household and community), Infrastructure, Legal Frameworks, Institutional Support,
Household Consumption

20 | P a g e
Above is a map of the value chain of the Lowveld of Swaziland. In the bottom, in grey, is
the enabling environment. Above that is the input supply portion of the map, which includes
veterinary assistance, veterinary supplies and technical skills. Next, is the production portion that
includes small scale producers. The top portion of the value chain includes the market portion.
As the chain shows, 56% of producers surveyed used their goats for their own consumption
wheareas 44% of respondents participated in the goat market. Of the 44% who participated, 41%
sold to local consumers including neighbors and 3% sold to butcheries and restaurants. Below is
a more comprehensive explanation of each value chain segment.
Input Supply and Support Services One major input of goat production was found to be veterinary supplies. Farmers receive
veterinary support through the Ministry of Agriculture’s veterinary assistants. Of all the farmers
interviewed, 10% had not used veterinary supplies on their goats at the time of the study. This
number includes farmers who had just started a herd and had not yet used veterinary supplies but
might in the future.
Supplies used by the goat farmers surveyed came from three major warehouses; Khuba
Traders, Swaziland Agricultural Supplies (SAS) and PLACEHOLDER. 98% of farmers who
used veterinary supplies stated that they received veterinary supplies for their goats at one of
these three warehouses. A key informant interview with an employee at SAS confirmed the fact
that because there is a lack of veterinarians, farmers go to these warehouses for veterinary advice
and to buy any medicine they may need and then go home and perform certain veterinary
practices themselves. The average amount spent on veterinary supplies was found to be 454
Emalangeni or $20.80 per year.
21 | P a g e
Others responded that if they used veterinary supplies they obtained them by trading or
buying from neighbors or family. A focus group interview found that the major constraint to
medication was cost. When faced with this constraint, households would let the goats pass and/
or ask for help from neighbors.
Another input of goat production studied was feed. Most respondent’s goats were fed by
browsing on natural shrubs with the occasional maize supplemented into their diet. Only four
respondents or 3% stated that they purchased animal feed specifically for their goats.
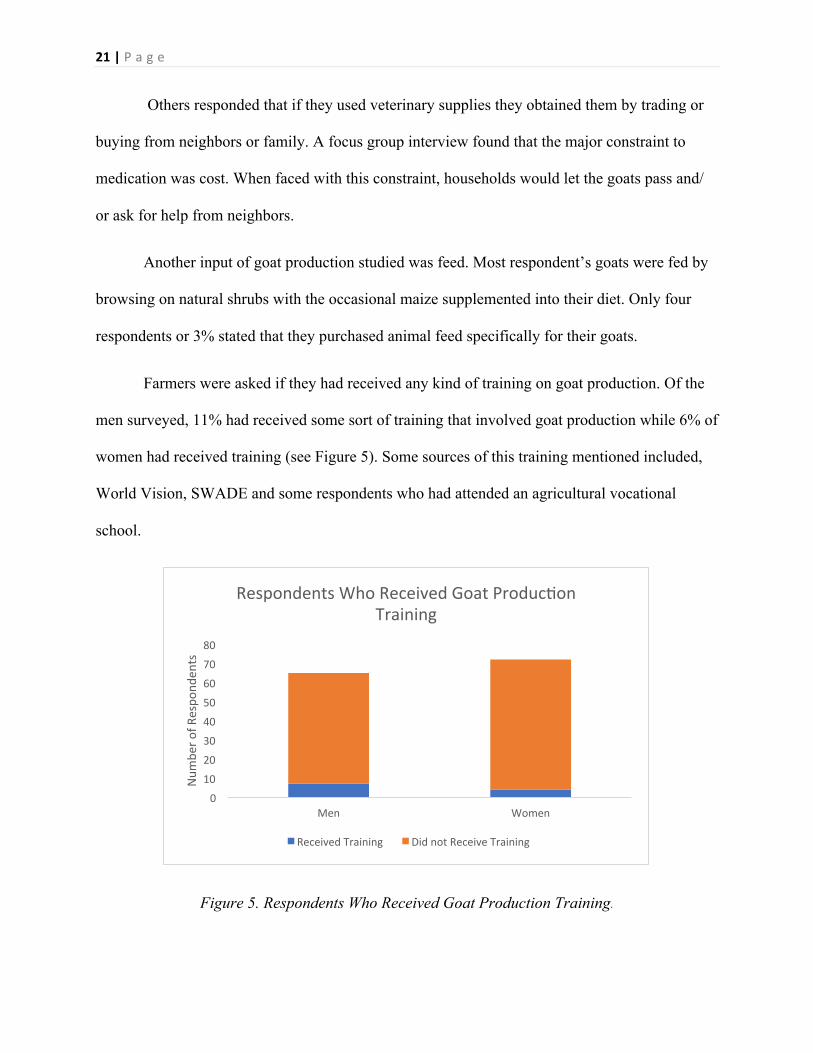
Farmers were asked if they had received any kind of training on goat production. Of the
men surveyed, 11% had received some sort of training that involved goat production while 6% of
women had received training (see Figure 5). Some sources of this training mentioned included,
World Vision, SWADE and some respondents who had attended an agricultural vocational
school.
Figure 5. Respondents Who Received Goat Production Training.
0
10
20
30
40
50
60
70
80
Men Women
Num
ber o
f Respo
nden
ts
Respondents Who Received Goat Produccon Training
Received Training Did not Receive Training

22 | P a g e
Farm Production The Lowveld of Swaziland’s goat sector is dominated by traditional production practices.
The following are some characteristics of farm production in the region.
Goat Ownership
An analysis of survey results found that goat ownership varied by gender where more
than double the amount of men surveyed owned goats than women. Goat ownership can be
found in Figure 6 below. Goat ownership was self-reported. It is important to note that children
below the age of 19 were never listed as goat owners although several farmers mentioned that
their children “owned goats”. These were usually gifts from the father or mother to the children.
Famers took goat ownership to mean the person who owned the kraal and handled most of the
decisions including when to buy and sell.
Figure 6. Goat Ownership.
Surveyed farmers were asked what the main objective of keeping goats was for them.
They were given four options selling, consumption, cultural purposes and other. Cultural
purposes include rites, ceremony and dowry purposes. Some gave more than one objective,
which is why the number of answers may be more than the number of respondents. It is
Men 64%
Women 27%
Both 9%
Goat Ownership
23 | P a g e
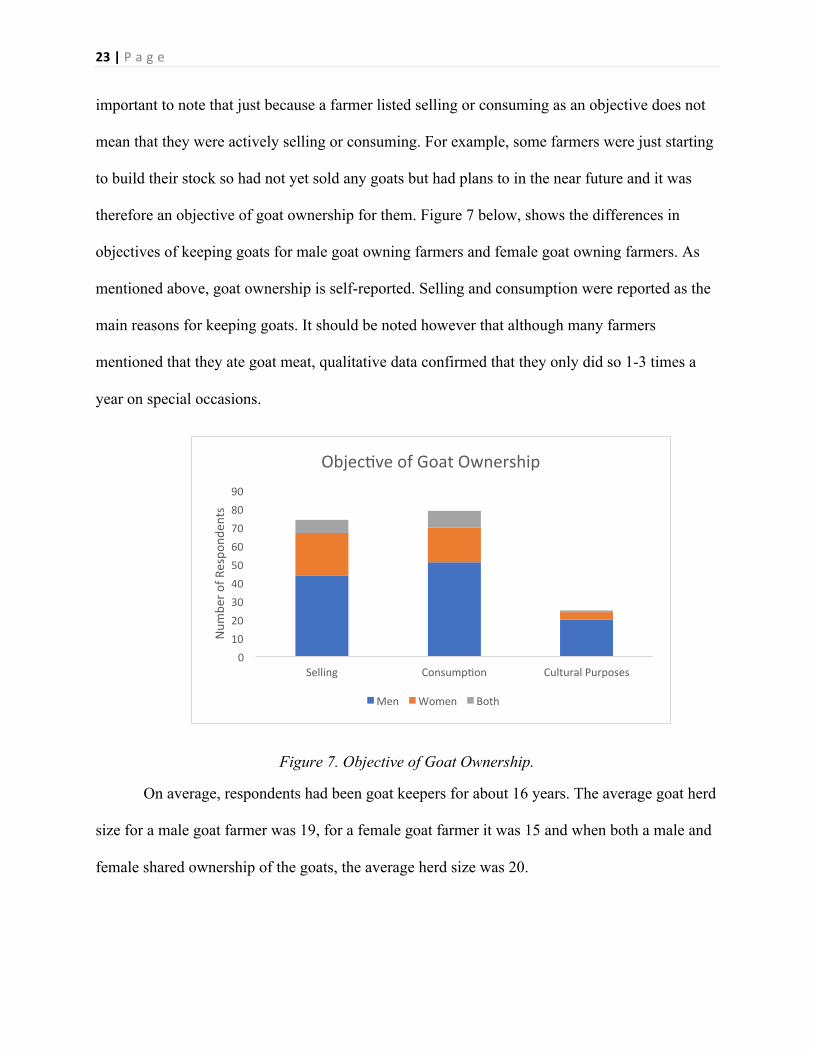
important to note that just because a farmer listed selling or consuming as an objective does not
mean that they were actively selling or consuming. For example, some farmers were just starting
to build their stock so had not yet sold any goats but had plans to in the near future and it was
therefore an objective of goat ownership for them. Figure 7 below, shows the differences in
objectives of keeping goats for male goat owning farmers and female goat owning farmers. As
mentioned above, goat ownership is self-reported. Selling and consumption were reported as the
main reasons for keeping goats. It should be noted however that although many farmers
mentioned that they ate goat meat, qualitative data confirmed that they only did so 1-3 times a
year on special occasions.
Figure 7. Objective of Goat Ownership.
On average, respondents had been goat keepers for about 16 years. The average goat herd
size for a male goat farmer was 19, for a female goat farmer it was 15 and when both a male and
female shared ownership of the goats, the average herd size was 20.
0 10 20 30 40 50 60 70 80 90
Selling Consumpcon Cultural Purposes
Num
ber o
f Respo
nden
ts
Objeccve of Goat Ownership
Men Women Both

24 | P a g e
Ownership can be a misleading term so it is therefore important to understand who in the
household makes decisions regarding goats and who benefits from their production, as will be
discussed in the following sections.
Responsibilities
Respondents surveyed were asked who was generally in charge of certain aspects of goat
production. Identifying who in the household is responsible for each aspect of goat production is
important to understand the concept of ownership as well as identify segments of production that
could cause barriers to entry. For the purposes of this study, five responsibilities were studied,
they are listed below;
1.) Purchasing; who in the household is in charge of purchasing goats when necessary?
2.) Housing; who in the household is in charge of purchasing housing equipment as well as
building housing for goats?
3.) Health; who in the household is in charge of keeping up with the goat’s health, buying
veterinary supplies and administering veterinary services?
4.) Watering/Grazing; who in the household is in charge of letting the goats out to eat and
drink?
5.) Slaughtering; who in the household is in charge of slaughtering goats?
It is important to note that responsibilities were self-reported. Additionally, not every survey
respondent participated in this question, if they didn’t know or couldn’t remember who in their
household was responsible for what, this section was left blank. The results of this question are
shown below in Figure 8. Men were reported to be overwhelmingly responsible for a majority of
the responsibilities related to goat production. Women participated more in watering/ grazing

25 | P a g e
and purchasing of goats. Youth participated more in slaughtering and housing. The other
category included hired help.
Figure 8. Responsibilities of Goat Production.
Income Control and Use
Respondents were asked who in the homestead was in charge of controlling the income
from goat sales. As shown in Figure 9 below, in 45% of cases men controlled the income from
selling goats, women in 37% of cases, and 18% of cases occurred where both the woman and
man were in charge of the income from selling goats. Data from focus groups found that women
are willing and interested in increasing their involvement in the management of goats in order to
increase their income.
0 20 40 60 80 100 120 140 160
Purchasing
Housing
Health
Watering/Grazing
Slaughtering
Number of People
Respon
sibility
Responsibilices of Goat Produccon
Men Women Youth (0-‐18) Adult and Youth Mixed Sex Other

26 | P a g e
Figure 9. Income Control.
A survey question also asked respondents what the income from selling goats was used
for. The answers to this question were disaggregated by sex based on who was reported to be in
charge of income from goat production, this can be found in Figure 10 below. Most of the
income from goat production was used for food. When women were in charge of the income
from goat production, more was spent on education and clothing. Both sexes spent evenly on
housing. The other category includes inputs for agricultural production.
Men 45%
Women 37%
Both 18%
Income Control

27 | P a g e
Figure 10. Income Use.
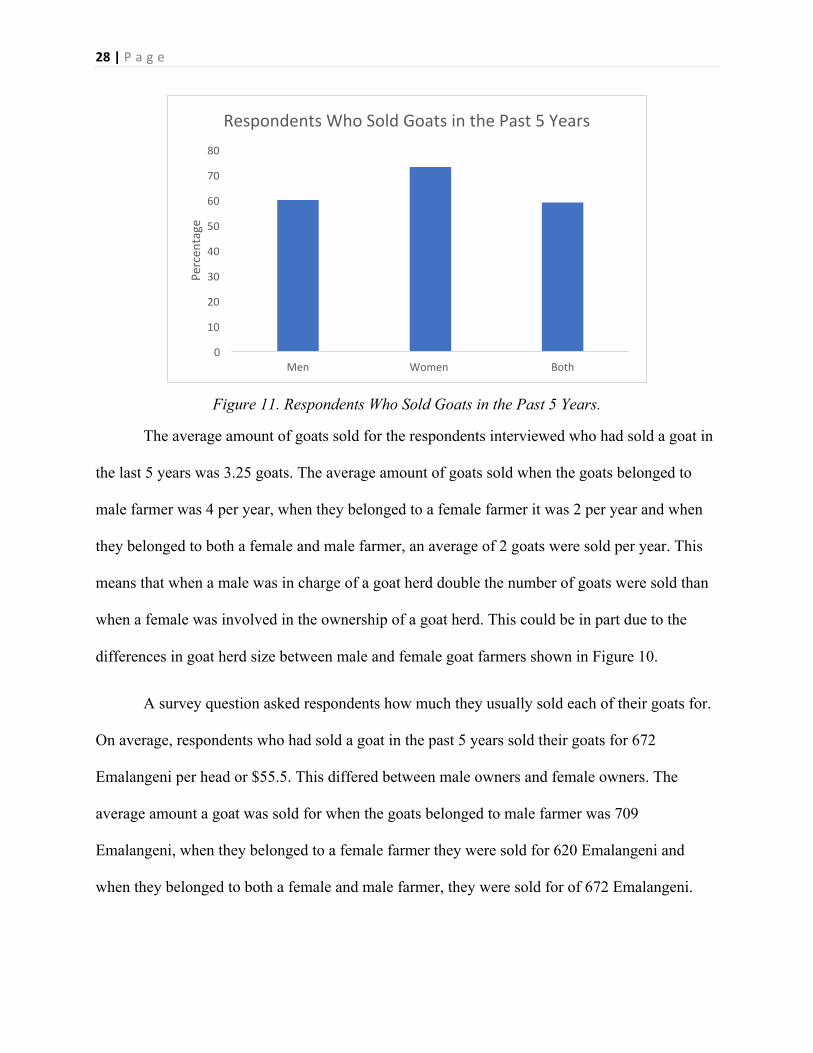
Marketing Respondents were asked if they had sold at least one goat in the past 5 years, 80
respondents or 58% of respondents answered yes. Figure 11 below shows the percentage of goat
farmers who responded that yes they had sold a goat in the past 5 years, disaggregated by gender
of the farmer who owns the goats in the homestead. The figure shows that 60% of male goat
farmers sold a goat in the past 5 years, 73% of female goat owners sold a goat in the past 5 years
and in cases where both the male and female owned they goat, 59% had sold at least one goat in
the past 5 years.
0
5
10
15
20
25
30
Food Educacon Human Health
Clothing Housing Other
Num
ber o
f Respo
nden
ts
Income Use
Men Women Both
28 | P a g e
Figure 11. Respondents Who Sold Goats in the Past 5 Years.
The average amount of goats sold for the respondents interviewed who had sold a goat in
the last 5 years was 3.25 goats. The average amount of goats sold when the goats belonged to
male farmer was 4 per year, when they belonged to a female farmer it was 2 per year and when
they belonged to both a female and male farmer, an average of 2 goats were sold per year. This
means that when a male was in charge of a goat herd double the number of goats were sold than
when a female was involved in the ownership of a goat herd. This could be in part due to the
differences in goat herd size between male and female goat farmers shown in Figure 10.
A survey question asked respondents how much they usually sold each of their goats for.
On average, respondents who had sold a goat in the past 5 years sold their goats for 672
Emalangeni per head or $55.5. This differed between male owners and female owners. The
average amount a goat was sold for when the goats belonged to male farmer was 709
Emalangeni, when they belonged to a female farmer they were sold for 620 Emalangeni and
when they belonged to both a female and male farmer, they were sold for of 672 Emalangeni.
0
10
20
30
40
50
60
70
80
Men Women Both
Percen
tage
Respondents Who Sold Goats in the Past 5 Years

29 | P a g e
This means that when a male was involved in the selling of a goat it usually sold for more. More
research is needed to identify reasons for this disparity.
In order to identify barriers to entering or taking full advantage of the goat market,
respondents were asked for their reason for not selling goats, if they hadn’t sold a goat in the past
5 years or their reason for not selling even more goats, if they had sold a goat in the past 5 years.
Respondents were given 5 options: 1. Cultural Purposes, 2. Not enough goats in the herd, 3. No
Market, 4. Market is too far and 5. Other. The responses are shown in Table 4 below,
disaggregated by sex. As shown in the table, when the responses of all respondents were taken
together the main reason for not selling goats was option 2; not enough goats in the herd, which
accounted for 59% of respondents. This was followed in order according to percentage by option
5; other, option 3; no market, option 1; cultural purposes and option 4; market is too far. This
order stayed the same when they data was disaggregated by sex.
Table 4. Reasons for Not Selling Goats
A focus group with women who did not own goats at the time of the study found that
67% of them believed that they gained no benefit from owning goats other than home
consumption. The other 33% believed that owning goats created too much conflict because
without adequate housing they would get into neighbor’s yards and eat their crops.
Reasons for Not Selling Goats n (%)
1 Cultural Purposes
2 Not Enough Goats in Herd
3 No Market
4 Market is too far
5 Other
Total Men 4 (6) 40 (54) 9 (12) 0 (0) 21 (28) 74 Women 0 (0) 25 (69) 4 (11) 1 (3) 6 (17) 36 Both 1 (8) 8 (62) 2 (15) 0 (0) 2 (15) 13 Total 5 (4) 73 (59) 15 (12) 1 (1) 29 (24) 123

30 | P a g e
Discussion The role of women in the agricultural sector, especially as keepers of small livestock such
as goats, greatly increases food security by improving the health and livelihood of individual
families. Goats are a valuable agricultural resource and provide food, fiber and income. The low
investment costs of goats make them ideal for limited resource families. Goats readily forage on
feed cuts, crop residues, food wastes and agricultural by-products. The ability of goats to thrive
in a wide variety of landscapes and the fact that they require a low investment and high
production potential makes them a good resource for women in the rural sector (Chen, Ketzis
and Sinn, 1999). In order to fully take advantage of this resource, specifically in the Lowveld of
Swaziland, it is important to understand the gender roles involved in goat production as well as
constraints and opportunities prevalent along the chain.
Constraints and Opportunities This study indicates that goat production has a high potential for development in the
Lowveld of Swaziland. With any value chain, it is important to discuss the opportunities and
constraints in order to improve on the chain and reduce any possible barriers to entry. Below is a
discussion of the major constraints and opportunities found in the goat value chain in Swaziland
based on research, survey results and focus group discussions.
No formal market
One of the largest constraints for the goat value chain was the absence of a formal
market. Farmers stated that without a formal market they had trouble finding people to sell to
and even when they did, without a set price structure, prices were too negotiable. Dr. T.S.
Sgwane, noted in a key informant interview that while the demand for goat is there, there is no
formal market. The primary goal of selling goats for most farmers was to cover emergencies and
household needs. However, a focus group discussion with women whose households were not

31 | P a g e
currently selling goats found that women are willing and wanting to keep goats for business. The
main constraint to entering the goat value chain listed by the women was that they would not
receive enough financial benefit because of the lack of market.
Technical and Business Skills
Farmers expressed an interest in learning more about goat production through training but
very few had actually received this. A key informant interview with Dr. T. S. Sgwane, Head of
the Animal Production and Health department of the University of Swaziland confirmed this. Dr.
Sgwane stated that farmers lack general management practices including hoof trimming,
cleaning and best breeding practices.
Gender Roles
Goat production offers women an opportunity to contribute significantly to family food
security. In terms of goat production, this study found that women own goats at about half the
rate that men do. Women were also in charge of less responsibilities related to goat production
over all. It is noted however that even when a respondent listed the males in the household as in
charge of a responsibility, that did not mean that the women did not participate in that
responsibility. In terms of market participation, when women owned goats they were more likely
to sell those goats but received less money. More research will be needed to pin point the reason
for this difference. However, possible reasons include differences in goats’ herd size and quality
due to differences in training and resources.
Conclusions • This study found that while the interest among farmers to produce and sell more
goats is there, organized marketing channels including services and facilities is
lacking. For example, a traceability system to keep track of goats and decrease
death is available for cattle but not for goats.
32 | P a g e
• There are differences in the roles men, women and children play in goat
production in the Lowveld. Women and children tend to be involved in more day
to day activities such as taking the goats out to water and graze while men tend to
be involved in more sporadic, income generating activities such as the
slaughtering and selling of goats. What we see in Swaziland’s goat value chain is
women and children playing more of an active role in the production of goats
while men take more of an active role in the marketing of goats.
• Women farmers expressed a desire to be more actively involved in the business of
selling goats but felt that they lacked the training to do so effectively. Targeting
women goat producers is impactful as women have expressed a desire to become
more active in the chain and they already have access to goats.
• There is room for growth in the goat sector of Swaziland. Goats are the second
most frequent livestock animal found in Swaziland, following cattle. However,
the potential of goats has not been adequately explored thus reducing the
economic contribution to farmers. Additionally, not enough research has been
done on the role that gender plays in the sector.
Recommendations SWADE can play a big role in strengthening the goat sector. Acknowledging and
strengthening the expertise and contribution of women in the goat value chain is essential
especially in the Lowveld of Swaziland where we see an opportunity for women to become more
involved in the chain. Below are recommendations for SWADE based on this study’s findings:
• Bridge the gap between goat buyer and goat seller. A key informant interview with a
cattle and goat buyer found that he was willing and able to buy 100 goats per month but

33 | P a g e
was currently only purchasing 60-70 goats a month. The demand was there but the supply
was lacking. The major constraint he listed was that farmers did not know he was buying
goats. SWADE can be instrumental in helping to facilitate a connection between goat
buyers and farmers who are willing to sell. Quality control mechanisms should be put in
place to ensure efficiency.
• Training activities that reach a wider population of the Lowveld would be beneficial.
Farmers were interested in attending workshops but were either unaware of workshops
going on or workshops were too far away for them to attend. Farmers should be informed
on best management practices, including nutrition and controlled breeding. Additionally,
trainings should include business skills as many farmers expressed an interest in learning
more about the goat market and how to better participate in it.
• Research on the goat sector and its potential should continue in the Lowveld of
Swaziland. A thorough documentation of the goat sector and how it changes including
how gender roles change can better inform development initiatives.
In conclusion, supporting the establishment of an abattoir that can accommodate goats as
well as cattle is beneficial as long as the above recommendations are met in order to avoid
barriers to increased opportunity and to ensure that the number of goats needed to keep the
abattoir running is met. A key informant interview with a red meat expert found that no goats are
legally slaughtered by any currently registered abattoirs. There is a demand for goat meat in
Swaziland that is not being met. Farmers are willing and wanting to sell. Additionally, they are
willing to learn how to improve the quality of their goats. Introducing goats into an abattoir will
move the goat sector forward and make it more productive, which is essential for providing both
men and women with increased economic opportunity.

34 | P a g e
References Agricultural and Rural Development Unit (AFTAR). (2011). The Livestock and Horticulture
Value Chains in Swaziland: Challenges and Opportunities. World Bank.
Averting HIV and AIDS (AVERT). (2016). HIV AIDS in Swaziland. Retrieved from
https://www.avert.org/professionals/hiv-around-world/sub-saharan-africa/swaziland.
Bhandari, D., Thomas, M., 2013. Goat Value Chain Toolkit: A Guideline for
Conducting Value Chain Analysis in the Goat Sub-sector. Joint publication of IGA,
IFAD and HI
Boogaard, B., Waithanji, E., Poole E.J., & Cadilhon J.J. (2015). Smallholder goat production
and marketing: a gendered baseline study from Inhassoro District Mozambique, In NJAS
– Wageningen Journal of Life Sciences, Volumes 74–75, 2015, Pages 51-63, ISSN 1573-
5214, https://doi.org/10.1016/j.njas.2015.09.002.
Central Intelligence Agency (CIA). (2017). Swaziland. The World Factbook. Retrieved from
https://www.cia.gov/library/publications/the-world- factbook/geos/et.html
Chen, T., Ketzis, J., & Sinn, R. (1999). The role of woman in the sheep and goat sector, In Small
Ruminant Research, Volume 34, Issue 3, 1999, Pages 259-269, ISSN 0921-4488,
https://doi.org/10.1016/S0921-4488(99)00078-4.
Coastal Services Center. (2009). Introduction to conducting focus groups. Science tools for
coastal programs.
Food and Agriculture Organization (FAO). (2011). Closing the gender gap in agriculture. The
State of Food and Agriculture Report. Rome: FAO.
International Fund for Agricultural Development (IFAD). (2010). Gender and
Livestock: Tools for Design. Rome: IFAD.

35 | P a g e
International Fund for Agricultural Development (IFAD). (2010). Value Chains, Linking
Producers to the Markets ,by Antonio Rota. Rome, Italy.
International Livestock Research Institute (ILRI). (2007). Toolkit for Gender Analysis of Crop
and Livestock Production, Technologies, and Service Provision, by Clare Bishop-
Sambrook and Ranjith Puskar.
International Livestock Research Institute (ILRI). (2013). Guidelines on Integrating Gender in
Livestock Projects and Programs, by Jemimah Njuki, Elizabeth Waithanji, Nabintu
Bagalwa and Juliet Kariuki. Nairobi, Kenya.
International Livestock Research Institute (ILRI). (2014). Review of Gender and Value Chain
Analysis, Development and Evaluation Toolkits, by Edna Mutua, Jemimah Njuki and
Elizabeth Waithanji. Nairobi, Kenya.
Lebbie, S.H.B. & Mastapha, P.R. (1985). Goat production in the Swaziland Middleveld. In:
Wilson, R.T. & Bourzat, D. (eds) Small ruminants in African agriculture. International
Livestock Centre for Africa: Addis ababa, Ethiopia. Pp. 224-234.
Lebbie, S.H.B (1987). Goat production systems in Swaziland. Progress Report Phase I. Animal
Production and Health Department, University of Swaziland: Luyengo, SwazilanLemlem
Aregu, Bishop-Sambrook C, Puskur R & Ephrem Tesema. (2010). Opportunities for
promoting gender equality in rural Ethiopia through the commercialization of
agriculture. IPMS (Improving Productivity and Market Success) of Ethiopian Farmers
Project Working Paper 18. Nairobi, Kenya: ILRI (International Livestock Research
Institute).

36 | P a g e
Rich, K. M., Ross, R. B., Baker, A. D., & Negassa, A. (2011). Quantifying value chain analysis
in the context of livestock systems in developing countries. Food Policy, 36(2), 214-222.
doi:10.1016/j.foodpol.2010.11.018
Singwane, S., & Salam, A. (2007). SocioEconomic Constraints on Goat Farming In the Lowveld
of Swaziland - A Case Study of Matsanjeni.
Sumner, A. & Tribe, M. (2010). Conducting Questionnaire Surveys in Chapter 8 in International
Development Studies: Theories and Methods in Research and Practice. Pp. 129-142.
Sumner, A. & Tribe, Ml. (2010). Semi Structured Interviews and Focus Groups in Chapter 6 in
International Development Studies: Theories and Methods in Research and Practice. Pp.
143-162.
Swaziland Water and Agricultural Development Enterprise (SWADE). (2017). Retrieved from
http://www.swade.co.sz/index.php
United Nations Industrial Development Organization (UNIDO). (2009). Agro Chain Analysis
and Development: The UNIDO Approach. Vienna:2009
United Nations Development Programme (UNDP). (2016). Human Development Report
Swaziland.
World Bank. (2006). Swaziland Achieving Education for All. Africa Region Human
Development Working Paper Series No. 109.
World Bank. (2017). Swaziland Overview. Retrieved from
http://www.worldbank.org/en/country/swaziland/overview
World Food Programme. (2010). Market Analysis Tool-How to Conduct a Food Commodity
Value Chain Analysis?

37 | P a g e
Appendix 1 Individual Goat Owning Household Survey Date:___________
Section A. Demographic Information Demographic Information SURVEYORS: PLEASE CIRCLE OR WRITE IN THE ANSWERS FROM PARTICIPANT. USE
BLANK SPACES TO WRITE IN ANY ADDITIONAL INFORMATION, AS NEEDED. 1. Name 2. Survey Number
3. Dip Tank Insert Dip Tank options depending on area.
4. Age of Participant 5. Sex of Participant Male or Female
6. Education Level 1. None 2. Primary School (unfinished) 3. Primary School (finished) 4. High School (unfinished) 5. High School (finished) 6. More than High School 7. Other ______________
7. Marital Status 1. Married 2. Civil Union 3. Widow 4. Divorced 5. Separated 6. Single 7. Other
8. Was interviewed alone or were others present?
1. Alone 2. With adult females present 3. With adult males present 4. With adult mixed present 5. With children present 6. With adult mixed sex and children present 7. Other
9. Number of people living in homestead
10. Age range of people living in homestead
11. 1st Occupation/major 1. Crop Production 2. Livestock 3. Business 4. Handicrafts 5. Agricultural Labor 6. None 7. Other ______
12. 2nd Occupation/minor 1. Crop Production 2. Livestock 3. Business 4. Handicrafts 5. Agricultural Labor 6. None 7. Other ______
Section B. Input Analysis Surveyor Statement: “Now I am going to ask you some questions about your goats and the work and materials involved in caring for them”
13. How many goats does

38 | P a g e
your homestead currently own? 14. Who owns these goats? 1. Self
2. Spouse 3. Other Female HH Member 4. Other Male HH Member 5. Other Female Non-HH Member 6. Other Male Non-HH Member 7. Joint females + self 8. Joint females – self 9. Joint mixed sex +self 10. Joint mixed – self 11. Other ___________
15. Who usually decides how many goats your homestead will own?
1. Self 2. Spouse 3. Other Female HH Member 4. Other Male HH Member 5. Other Female Non-HH Member 6. Other Male Non-HH Member 7. Joint females + self 8. Joint females – self 9. Joint mixed sex +self 10. Joint mixed – self 11. Other ___________
16. What types of goat breeds do you own? (circle all that apply)
1. Local Breed 2. Other_______
17. Who decides what breeds you will own?
1. Self 2. Spouse 3. Other Female HH Member 4. Other Male HH Member 5. Other Female Non-HH Member 6. Other Male Non-HH Member 7. Joint females + self 8. Joint females – self 9. Joint mixed sex +self 10. Joint mixed – self 11. Other ___________
18. How did you obtain your goats?
1. Buy 2. Breed 3. Gift (if so, from who?)______ 4. Trade 5. Mixed 6. Other_________
19. What is the main objective of keeping goats in the homestead?
1. Consumption 2. Selling 3. Cultural Purposes 4. Other _________
20. How many times a year do you use your goat products for:
1. Consumption ____ 2. Selling ______ 3. Cultural Purposes _______ 4. Other ________
21. In the past 5 years has your homestead sold a goat?
1. Yes (Why?___________________) 2. 2. No

39 | P a g e
22. Does you homestead buy goats or goat products for consumption?
1. Yes (How often?______________) 2. No
23. On average how often do you use veterinary services per year?
0. Never 1. 1xyear 2. 2xyear 3. 3xyear 4. More than 3x year
24. On average, how much do you spend on veterinary care per year?
25. Where do you obtain your veterinary services?
1. Public Veterinarian 2. Private Veterinarian 3. Government 4. Other __________
26. What are your goats fed? 1. Purchased Animal Feed 2. Home Grown Feed/browse on natural shrubs 3. Both 4. Other ________
(27). On average, how much animal feed is purchased per year?
(28). Where do you obtain your purchased animal feed, if applicable?
1. Market 2. Trade 3. Other ________
(29). How far is this from where you live?
(30). Who is usually in charge of obtaining the animal feed?
1. Self 2. Spouse 3. Other Female HH Member 4. Other Male HH Member 5. Other Female Non-HH Member 6. Other Male Non-HH Member 7. Joint females + self 8. Joint females – self 9. Joint mixed sex +self 10. Joint mixed – self 11. Other ___________
(31). Who was the last person in charge of obtaining animal feed?
1. Self 2. Spouse 3. Other Female HH Member 4. Other Male HH Member 5. Other Female Non-HH Member 6. Other Male Non-HH Member 7. Joint females + self 8. Joint females – self 9. Joint mixed sex +self 10. Joint mixed – self 11. Other ___________
32. Do you own any other livestock? How many of each?
1. Cattle_____ 2. Chickens____ 3. Other_________
33. Have you received any training on goat production?
1. Yes (from where?)__________ 2. No
34. How many years have

40 | P a g e
you been goat keeping? Section C. Market Analysis
SURVEYORS: ONLY COMPLETE THE QUESTIONS IF APPLICABLE. ONLY MOVE TO SECTION C.2 IF GOATS ARE SOLD. C.1. Surveyor Statement “I am now going to ask you how you use your goats”
45. What goat product do you consume? (circle all that apply)
1. Milk 2. Meat 3. Fiber 4. Cultural purposes 5. None 6. Other________
46. What is the reason that your homestead does not sell more goats or goat products?
1. Cultural Purposes 2. Not enough goats 3. No market 4. Market is too far (How far?_______) 5. Other _________
47. Who usually decides to sell or not sell your goat products?
1. Self 2. Spouse 3. Other Female HH Member 4. Other Male HH Member 5. Other Female Non-HH Member 6. Other Male Non-HH Member 7. Joint females + self 8. Joint females – self 9. Joint mixed sex +self 10. Joint mixed – self 11. Other ___________
C.2. Surveyor Statement: “I am now going to ask you about selling your goats”
48. What type of goat product do you sell? (circle all that apply)
1. Milk 2. Meat 3. Fiber 4. Live 5. Other ________
49. On average, how much
SU SURVEYORS: PLEASE PLACE A CHECK NEXT TO THE PERSON WHO IS IN CHARGE OF THE FOLLOWING GOAT nnnnnnnRELATED ACTIVITY. PLEASE DO NOT MARK ANY ACTIVITY THAT IS NOT APPLICABLE.
Activity
1. Men 2. Women 3. Youth (0-18) 4. Youth (18-24)
5. Other (explain)
35. Purchasing
36. Breeding 37. Housing 38. Health (medicating, taking to dip tank)
39. Watering 40. Grazing/browsing 41. Milking 42. Slaughtering 43. Processing

41 | P a g e
product does your homestead sell per year? 50. How much goat product did you sell last year?
51. Where do you sell your goat products?
1. Market (which one?) ______ 2. Friends/Family 3. Trader 4. Other _________
(52). On average, how often do you visit the market per year to sell your goat products?
(53). How many times did you visit the market last month to sell your goat products?
54. Who in the homestead is usually in charge of going out and selling the goat product?
1. Self 2. Spouse 3. Other Female HH Member 4. Other Male HH Member 5. Other Female Non-HH Member 6. Other Male Non-HH Member 7. Joint females + self 8. Joint females – self 9. Joint mixed sex +self 10. Joint mixed – self 11. Other ___________
55. Who was the last person in charge of going out and selling the goat product?
1. Self 2. Spouse 3. Other Female HH Member 4. Other Male HH Member 5. Other Female Non-HH Member 6. Other Male Non-HH Member 7. Joint females + self 8. Joint females – self 9. Joint mixed sex +self 10. Joint mixed – self 11. Other ___________
56. How far away is the market where you sell your goat products?
57. How do you transport your goat product to the market?
1. Motorcycle 2. Bicycle 3. Bus 4. Car 5. Other_________
58. On average how much do you typically sell your products for?
1. Milk ______ 2. Meat ______ 3. Fiber______ 4. Live _____ 5. Other________
59. How much did you sell your last goat product for?
1. Milk ______ 2. Meat ______ 3. Fiber _______ 4. Live_______ 5. Other________
60. Who usually decides on 1. Self

42 | P a g e
this price? 2. Spouse 3. Other Female HH Member 4. Other Male HH Member 5. Other Female Non-HH Member 6. Other Male Non-HH Member 7. Joint females + self 8. Joint females – self 9. Joint mixed sex +self 10. Joint mixed – self 11. Other ___________
61. What is the income from selling your goat product used for?
1. Savings 2. Food 3. Education 4. Human Health 5. Clothing 6. Housing 7. Other________
62. What was the last thing your income from selling your goat product used for?
1. Savings 2. Food 3. Education 4. Human Health 5. Clothing 6. Housing 7. Other________
63. Who usually controls the income from selling your product?
1. Self 2. Spouse 3. Other Female HH Member 4. Other Male HH Member 5. Other Female Non-HH Member 6. Other Male Non-HH Member 7. Joint females + self 8. Joint females – self 9. Joint mixed sex +self 10. Joint mixed – self 11. Other ___________
64. If you were to rank the importance of goats as a source of income for your homestead, where would you put it?
1 2 3 4 5 (not important at all) (incredibly important)
Section D. Open Ended Questions Surveyor Statement: “Thank you for getting this far, we are now at the last part of the survey. I will be asking you some follow up questions.”
SURVEYORS: RECORD THE RESPONSE OF PARTICIPANT IN AS MUCH DETAIL AS POSSIBLE. ONLY ASK FOR FOLLOW UPS AS NEEDED. 65. Do you face any problems in selling your goats products? If so, what are they? 66. What effects the price that you sell your goats for?

43 | P a g e
67. Do goat production responsibilities change seasonally? If so, How?
68. Is there anything you would like us to know or to add to the study?
Adapted from:
International Livestock Research Institute (ILRI). (2014). Review of Gender and Value Chain Analysis, Development and Evaluation Toolkits, by Edna Mutua, Jemimah Njuki and Elizabeth Waithanji. Nairobi, Kenya.
International Livestock Research Institute (ILRI). (2007). Toolkit for Gender Analysis of Crop and Livestock Production, Technologies, and Service Provision, by Clare Bishop- Sambrook and Ranjith Puskar.
Appendix 2 Focus Group Questionnaire 1. How does the community define ownership of goats? What characteristics of ownership
are identified by men and women? Which ones are similar and which ones are different? Why?
2. Who decides on different aspects of goat production? Why? 3. What activities are mainly done by men, women, boys or girls in the production of goats?
What determines the distribution of labor?

44 | P a g e
4. What are the main constraints faced by women and men in accessing inputs? What have been the coping strategies? Are these efficient in handling the constraints? What else needs to be done to deal efficiently with the constraints?
5. What are the main constraints faced by women and men in marketing? What have been the coping strategies? Are these efficient in handling the constraints? What else needs to be done to deal efficiently with the constraints?
Youth Specific Questions
1. Are youth involved in goat production? 2. Do they want to be? 3. What are the constraints they face in being more involved? 4. Adapted from:
International Livestock Research Institute (ILRI). (2014). Review of Gender and Value Chain Analysis, Development and Evaluation Toolkits, by Edna Mutua, Jemimah Njuki and Elizabeth Waithanji. Nairobi, Kenya.
Appendix 3 Key Informant Questionnaire General: About the actors and their business
Name:
Sex:
Type of enterprise:
Area of Operation:

45 | P a g e
1. What are your roles in the goat value chain? 2. How many women and men are involved in your business in this region? (or
approximately what proportion of men and what proportion of women)? 3. What are the constraints faced by women in this business?
Type of services offered and clients
1. What type of services do you offer? 2. Which clients you offer services to? Farmers/other traders etc. 3. What proportions of men and women farmers and other actors do you offer services to?
Why? 4. What constraints do you face when offering your services or trying to reach women and
men farmers and other actors with your services? What have been the coping strategies? Are these efficient in handling the constraints? What else needs to be done to deal efficiently with the constraints?
5. What constraints do women and men farmers and other actors face when accessing your services? What have been the coping strategies? Are these efficient in handling the constraints? What else needs to be done to deal efficiently with the constraints?
6. How do interactions with other actors besides farmers affect your enterprise e.g. upstream value chain actors, local governments, government policies etc.
Adapted from:
International Livestock Research Institute (ILRI). (2014). Review of Gender and Value Chain Analysis, Development and Evaluation Toolkits, by Edna Mutua, Jemimah Njuki and Elizabeth Waithanji. Nairobi, Kenya.
Related Documents