Gender Profile of Wakefield’s Labour Market Gender and Employment in Local Labour Markets Dr Lisa Buckner Dr Ning Tang Professor Sue Yeandle Centre for Social Inclusion

Welcome message from author
This document is posted to help you gain knowledge. Please leave a comment to let me know what you think about it! Share it to your friends and learn new things together.
Transcript
Gender Profile of Wakefield’s Labour Market
Centre for Social Inclusion Sheffield Hallam University Howard Street Sheffield S1 1WB Tel 0114 225 5786 Fax 0114 225 5706 E-mail [email protected] Web www.shu.ac.uk/research/csi
ISBN 1 843 87102 5 © Sheffield Hallam University 2004
Gender and Employment in Local Labour Markets
This information can be made available in other formats. Please contact us for further details.
Dr Lisa Buckner Dr Ning Tang Professor Sue Yeandle
Centre for Social Inclusion


Preface
Gender Equality: Gender and Employment in Local Labour Markets
Wakefield Council is delighted to be involved in the Gender and Employment in Local Labour Markets project with Sheffield Hallam University. The benefits that result from such a high profile, prestigious research project have been acknowledged from the outset and the outcomes of the research project will be used to inform policy and practice across the Council.
Additional benefits will arise from the case studies chosen for the Wakefield area, which are:
1 Part-time Work and Women Working Below Their Potential, which will examine the relationships between such issues as gender and equal pay. This case study will complement the work already under way on an equal pay review within the Authority.
2 Building Bridges to Work, which will focus on the transition from economic inactivity to employment and will be particularly advantageous to our initiatives around recruitment.
3 Women’s Career Development in Local Authorities, a case study, which will inform and assist the work of the Stepping Forward initiative.
The Regional Project Group for Wakefield, which supports the work of the research project, also provides an excellent forum for sharing ideas and good practice with partners from the public and private sectors in the local area, including Jobcentre Plus and Fujitsu.
The dissemination event will provide us with an extremely detailed series of statistical profiles of the labour market in the Wakefield District. The associated workshops will be used as a forum for policy debate and will provide a significant contribution to the development of Wakefield Council as an employer of choice.
John Foster
Chief Executive Wakefield Metropolitan District Council


Acknowledgements
This Gender Profile for Wakefield, one of eleven Gender Profiles being published in autumn 2004 as part of the national Gender and Employment in Local Labour Markets (GELLM) project, is the product of team work at the Centre for Social Inclusion, Sheffield Hallam University, carried out in close partnership with the eleven local authorities concerned1.
The GELLM team at the Centre for Social Inclusion is directed by Sue Yeandle, and includes the following staff, all of whom have played important roles in sustaining the project: Ian Chesters (administrator), and, in a variety of research roles, Lisa Buckner, Karen Escott, Pamela Fisher, Linda Grant; Anu Suokas, and Ning Tang. We are also grateful for the support of our Faculty's Deputy Dean, Professor Christine Booth and of Tim Strickland of the University's Enterprise Centre, and for the assistance of Ryan Powell, Lorna Hewish and Bernadette Stiell.
The authors of the Gender Profile would also like to thank the project's national partners, especially David Darton and David Perfect of the Equal Opportunities Commission, and Rebecca Gill and Richard Exell of the TUC, for their guidance and suggestions, as well as the project's academic advisers, Professors Ed Fieldhouse, Damian Grimshaw and Irene Hardill. We acknowledge with thanks the co-operation of our contacts at DWP, ONS, DfES and other government departments2, and of course the financial support of the European Social Fund, without which this project could not have been developed.
Publication of the Gender Profiles completes Phase 1 of the GELLM project, which in autumn 2004 moves into Phase 2, during which Local Research Studies will be completed in the participating local authorities, covering the following topics. The reports of these studies will be published in summer 2006.
1. Low Paid, Part Time Work - Why do Women Work Below their Potential?
2. Building Bridges to Work: Gender, Local Labour Markets and Neighbourhood Projects.
3. Enhancing Employment Opportunities for Women from Black and Minority Ethnic Groups.
4. Career Development in the Local Authority Sector in England: Opportunities and Constraints.
5. Women’s Poverty and Economic Disadvantage: the Impact of Regeneration Initiatives and Developments.
6. Local Challenges in Meeting Demand for Domiciliary Care.
Sue Yeandle
on behalf of the GELLM research team
Sheffield, September 2004
1 These authorities are: Wakefield City Council, East Staffordshire Borough Council, Leicester City Council, the
London Borough of Camden, Newcastle City Council, Sandwell Metropolitan Borough Council, Thurrock Council, Trafford Metropolitan Borough Council, Somerset County Council, Wakefield Metropolitan District Council, and West Sussex County Council. All the eleven local authorities are making match funding contributions to support the ESF grant funding the GELLM project, and we would like to take this opportunity to publicly thank these authorities for their engagement in and support of the project. 2 Crown Copyright material is reproduced with the permission of the Controller of HMSO.

Contents
1. Introduction and Executive Summary 2
2. The Local Setting 6
The City of Wakefield 6
The People of Wakefield 7
Households and Housing 9
3. Education and Skills 10
Educational Indicators in Wakefield 10
Educational Attainment: Ages 7-16 11
Destination of pupils after age 16 18
A/AS Level Attainment 19
Higher Education 21
Qualifications and Skills in the Working Age Population 21
Key Points 22
4. Trends and Patterns in Women's and Men's Employment 23
Structure of Employment Opportunities 23
People and Employment 27
Key Points 33
5. The Gender Pay Gap 34
Causes of the Gender Pay Gap 35
Pay In Wakefield 35
Key Points 37
6. Unemployment and Economic Inactivity 38
Unemployment 38
Economic Inactivity 41
Key Points 45
7. Women, Men and Diversity 46
The Employment Circumstances of People from Black and Minority Ethnic Groups 46
Wakefield's Pakistani Population 46
Wakefield's White Other Population 47
Wakefield's Indian Population 52
Wakefield's White Irish Population 53
Key Points 54
8. Work-Life Balance 55
Flexible Working Patterns 55
Barriers to Employment 56
Key Points 60
9. Looking Forward 61
Appendix A Glossary of Census Terms 63
Appendix B Examples of Occupations in each of the main 2001 Census Occupational Categories 65

2
1. Introduction and Executive Summary
This Gender Profile of Wakefield's Labour Market explores the relative situation and resources of women and men in Wakefield, compared with the Yorkshire and The Humber region and England as a whole. It focuses on how women and men in Wakefield experience the labour market, both in working within it and seeking to enter it. The profile draws attention to features which are particularly important in Wakefield as well as to features which are experienced in similar ways across the country.
In preparing the Profile, we have used the most up-to-date information available, and relied upon a wide range of official statistics. The 2001 Census has been used extensively, and we have commissioned special tables from it, since for many aspects of labour force behaviour this is the most reliable available source of information. It is also the only major data-set which can be used to examine labour force participation by the combined factors of gender, age and ethnicity at district level.
The Profile is organised in chapters which focus on specific topics relevant to women's and men's participation in the labour market, described in more detail below. It includes some data on those who are still in full-time education and therefore not yet in the labour market, because indicators of their performance are important in understanding the attributes of, and choices made by, labour market entrants. It also includes information about people of working age who are not currently in paid work or economically active. Again, this is because it is important to know more about the situation of the large numbers of working age men and women who are not employed or self-employed, and to consider whether they are encountering any barriers to employment or forms of discrimination which need to be addressed in employment or social policy.
The Gender Profile thus offers an extensive description and commentary on the position of Wakefield's men and women, and is being made available to employers, trade unions and policy-makers to enable them to make evidence based decisions about their policies and priorities. Although a very comprehensive document, the Gender Profile cannot provide absolutely exhaustive detail about all aspects of the labour market; in cases where we have selected examples (as in looking at selected subjects studied by pupils in schools, or in examining features of selected occupations), we hope the Profile will alert interested parties to the full scope of the available data, and encourage greater use of
gender-disaggregated statistics in analysis and decision-making.
It is widely recognised that participation in formal labour markets is highly gendered at all levels of analysis - international, national, regional and local. This means that women and men tend to predominate in different occupations and industries, and to have different working patterns. Some of this arises from personal choices, but it is also known that stereotyping, discrimination, recruitment practices and promotion arrangements can and do come into play. Where this happens, the result can be indefensible differences in men's and women's pay, a concentration of women in lower level jobs which do not make full use of their skills or potential, and difficulties for both men and women who wish to enter occupations not typical for their sex. We also know that most women and men aim to access employment which is local to where they live: for example, in England as a whole only 16 per cent of men and 9 per cent of women usually travel more than 20 kilometres each day to work.
Given these two factors - the gendered nature of labour force participation, and the local nature of most employment - it is perhaps remarkable that so little attention has been given in analysis of labour force participation and behaviour to gender-disaggregated data at the sub-regional level. The research team responsible for producing this Gender Profile of Wakefield (alongside comparable documents for ten other local authorities drawn from every one of the nine English regions) believe that it represents a major step forward in developing evidence-based policy in this field. Our work has been inspired by the challenge of 'gender mainstreaming'. This is a relatively new approach to tackling sex discrimination and gender inequality, which simply asks that, in whatever policy field, an accurate assessment of men's and women's situation is made, so that policy can be developed to address any unfairness and inequality which disadvantages either women or men, and that the circumstances, views and aspirations of both women and men are taken into account when decisions are made.
The remainder of this Gender Profile is organised in nine Chapters, which are briefly summarised here:
The Local Setting
The Wakefield District comprises a mix of rural areas, former mining communities and urban centres, with the City of Wakefield at its heart. With the decline of the mining industry in the south east, and decreasing numbers of full-time jobs in manufacturing across the district, the local labour market has undergone a period of significant change. Growing numbers of people in
3
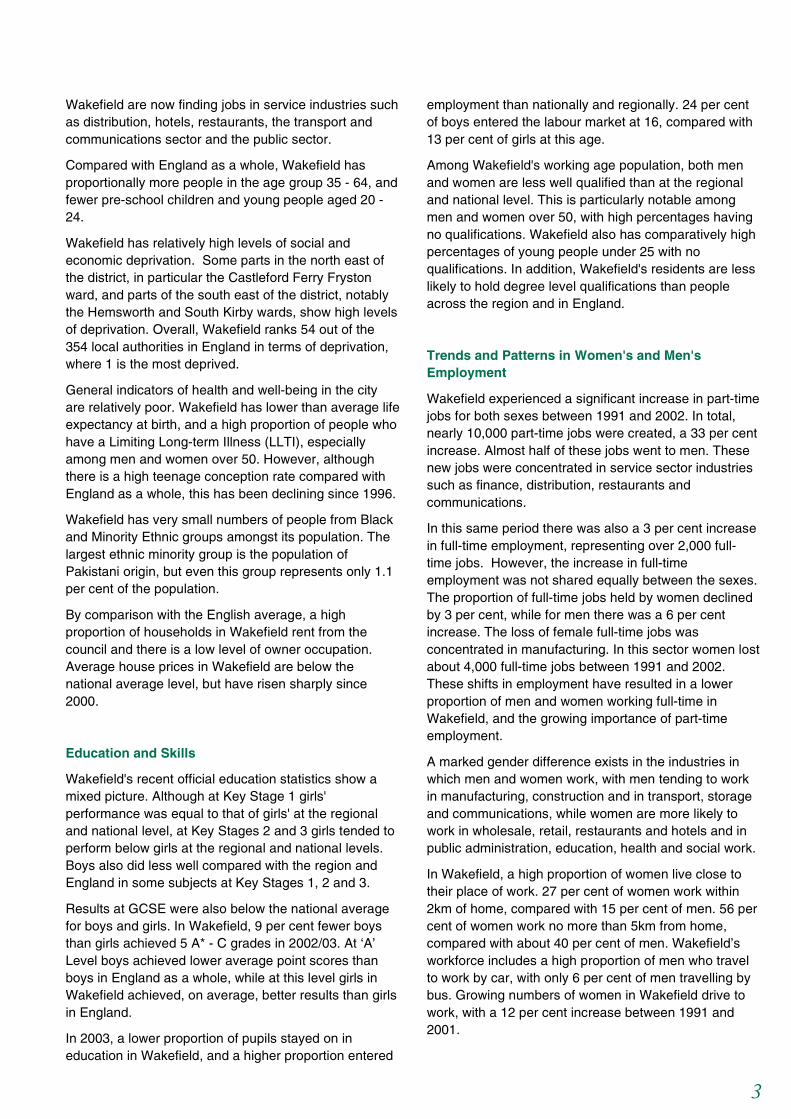
Wakefield are now finding jobs in service industries such as distribution, hotels, restaurants, the transport and communications sector and the public sector.
Compared with England as a whole, Wakefield has proportionally more people in the age group 35 - 64, and fewer pre-school children and young people aged 20 - 24.
Wakefield has relatively high levels of social and economic deprivation. Some parts in the north east of the district, in particular the Castleford Ferry Fryston ward, and parts of the south east of the district, notably the Hemsworth and South Kirby wards, show high levels of deprivation. Overall, Wakefield ranks 54 out of the 354 local authorities in England in terms of deprivation, where 1 is the most deprived.
General indicators of health and well-being in the city are relatively poor. Wakefield has lower than average life expectancy at birth, and a high proportion of people who have a Limiting Long-term Illness (LLTI), especially among men and women over 50. However, although there is a high teenage conception rate compared with England as a whole, this has been declining since 1996.
Wakefield has very small numbers of people from Black and Minority Ethnic groups amongst its population. The largest ethnic minority group is the population of Pakistani origin, but even this group represents only 1.1 per cent of the population.
By comparison with the English average, a high proportion of households in Wakefield rent from the council and there is a low level of owner occupation. Average house prices in Wakefield are below the national average level, but have risen sharply since 2000.
Education and Skills
Wakefield's recent official education statistics show a mixed picture. Although at Key Stage 1 girls' performance was equal to that of girls' at the regional and national level, at Key Stages 2 and 3 girls tended to perform below girls at the regional and national levels. Boys also did less well compared with the region and England in some subjects at Key Stages 1, 2 and 3.
Results at GCSE were also below the national average for boys and girls. In Wakefield, 9 per cent fewer boys than girls achieved 5 A* - C grades in 2002/03. At ‘A’ Level boys achieved lower average point scores than boys in England as a whole, while at this level girls in Wakefield achieved, on average, better results than girls in England.
In 2003, a lower proportion of pupils stayed on in education in Wakefield, and a higher proportion entered
employment than nationally and regionally. 24 per cent of boys entered the labour market at 16, compared with 13 per cent of girls at this age.
Among Wakefield's working age population, both men and women are less well qualified than at the regional and national level. This is particularly notable among men and women over 50, with high percentages having no qualifications. Wakefield also has comparatively high percentages of young people under 25 with no qualifications. In addition, Wakefield's residents are less likely to hold degree level qualifications than people across the region and in England.
Trends and Patterns in Women's and Men's Employment
Wakefield experienced a significant increase in part-time jobs for both sexes between 1991 and 2002. In total, nearly 10,000 part-time jobs were created, a 33 per cent increase. Almost half of these jobs went to men. These new jobs were concentrated in service sector industries such as finance, distribution, restaurants and communications.
In this same period there was also a 3 per cent increase in full-time employment, representing over 2,000 full-time jobs. However, the increase in full-time employment was not shared equally between the sexes. The proportion of full-time jobs held by women declined by 3 per cent, while for men there was a 6 per cent increase. The loss of female full-time jobs was concentrated in manufacturing. In this sector women lost about 4,000 full-time jobs between 1991 and 2002. These shifts in employment have resulted in a lower proportion of men and women working full-time in Wakefield, and the growing importance of part-time employment.
A marked gender difference exists in the industries in which men and women work, with men tending to work in manufacturing, construction and in transport, storage and communications, while women are more likely to work in wholesale, retail, restaurants and hotels and in public administration, education, health and social work.
In Wakefield, a high proportion of women live close to their place of work. 27 per cent of women work within 2km of home, compared with 15 per cent of men. 56 per cent of women work no more than 5km from home, compared with about 40 per cent of men. Wakefield’s workforce includes a high proportion of men who travel to work by car, with only 6 per cent of men travelling by bus. Growing numbers of women in Wakefield drive to work, with a 12 per cent increase between 1991 and 2001.

4
The Gender Pay Gap
In Wakefield, low pay is prevalent and a significant feature of the local economy for both men and women. 10 per cent of men and 34 per cent of women were earning less than £250 a week in 2003. Women working full-time in Wakefield earned on average £9.16 an hour, compared with £10.98 for men, both amounts lower than in the region and England as a whole.
There is a significant pay gap between men’s and women’s weekly pay in Wakefield. This pay gap is particularly marked in full-time managerial and senior professional jobs, where women earned only about two thirds as much as men.
Unemployment and Economic Inactivity
Across all age groups in Wakefield, the level of unemployment is similar to that in the region and nationally. However, there are differences from the national picture. There are higher levels of unemployment amongst young men and women aged 16-24 in Wakefield. Over 9 per cent of men and nearly 6% of women in this age group are unemployed.
Despite this, Wakefield has relatively low percentages of unemployed people of all ages who have never worked, and relatively low levels of long-term unemployment, compared with the region and England as a whole.
Wakefield’s economically inactive population includes higher percentages of men and women who are permanently sick or disabled than are found at the regional and national levels.
A relatively low proportion of women aged 50-59 in Wakefield are economically active (59 per cent) compared with similar women in the region (64 per cent) and England as a whole (65 per cent). Amongst men of this age, the economic activity rate in Wakefield is similar to that found in the region and in England.
Qualifications have a marked effect on employment status This has particular significance for women in Wakefield. The district's unqualified women are less likely to be employed than unqualified men, and more likely to be looking after their home or family full-time.
Wakefield has a relatively high percentage of households with dependent children where no adults are employed. 22 per cent of children under five in Wakefield are growing up in households where no-one has a job.
Rates of economic inactivity amongst lone parents are also slightly higher than those in the region and nationally, and there are significantly lower percentages of female lone parents working full-time than in England as a whole.
Women, Men and Diversity
Amongst the young (16-24) Pakistani population in Wakefield, a high percentage of men are students and a lower percentage are in full-time employment, compared with the young population of Wakefield as a whole.
Among those aged 25 to retirement age, Pakistani women are less likely to be in full-time or part-time employment than all women across the district. They are also more likely to be looking after their home or family full-time than women across the district.
Amongst Pakistani men aged 25 years to retirement age, rates of full-time self-employment are nearly three times higher than for all Wakefield’s men. Of those Pakistani men in employment, over 40 per cent work as process, plant or machine operatives, in one of the lower paid sectors of the local economy.
Work-Life Balance
Analysis of working time patterns in Wakefield shows that full-time and part-time women workers are significantly less likely than their regional and national counterparts to have a flexi-time arrangement in place. Amongst men in Wakefield, part-time workers are more likely than men in England and the region to have a flexi-time arrangement, but this does not apply to full-time male workers in Wakefield.
Term-time only contracts are held by 7 per cent of women employed full-time and part-time in Wakefield. For men, no term-time working arrangements were recorded in Wakefield, either for men working full-time or part-time.
In Wakefield, both women and men provide more hours of ‘unpaid’ care to family members, friends and neighbours than people in the region and nationally. Amongst the Pakistani population the tendency for men and women to provide unpaid care is particularly marked.
By national standards, Wakefield has a low level of childcare provision. There are fewer places available for children under 8 per 1000 of the population in all types of registered care than in the region or England. Large areas of the district have no day nursery provision.
5
Using the Gender Profile3
The Gender Profile has been designed as a resource for all those interested in Wakefield's men and women. It provides a detailed picture of how Wakefield's people, in all their diversity, are faring in relation to the district's labour market at the start of the 21st century. Recent labour market changes and trends, particularly in Wakefield's industries, occupations and patterns of employment are highlighted in the profile.
Uniquely in a document of this type, the Gender Profile also provides evidence relevant to the provision of other services provided in Wakefield - for example in education, transport, childcare, and care support - and offers insight into continuing difference between men's and women's participation in the labour market and in the experiences of men and women of different ages and from different Black and Minority Ethnic groups.
The Gender Profile has been produced using the full range of available official statistics, and includes presentations of data specially commissioned for this study. Almost all data of this type can be disaggregated by sex, although analysis of gender differences has only rarely been a feature of previous local labour market analysis. We hope that this profile (alongside the ten others being produced for other English local authorities in autumn 2004) will be a major resource for, and stimulus to, the gender mainstreaming of public policy. By demonstrating the range and scope of data available on women and men, we believe the Gender Profile can also ensure that, in future, the differences and similarities in women's and men's labour market circumstances will be the focus of documentation, policy development and decision-making at local, regional and national levels.
3 Every effort has been made to check the accuracy of the data
presented in this document, and to use the latest data available during its preparation (spring/summer 2004). The data from the 2001 Census will remain the latest source for much analysis at district level until the 2011 Census results are released. Other data is produced on an annual basis, and data users should consult the source agency concerned for relevant updates. The Centre for Social Inclusion's work in Wakefield on the Gender and Employment in Local Labour Markets project continues until summer 2006, and from autumn 2004 onwards will focus on the collection of new data through three new local research studies: "Low Paid, Part Time Work - Why do Women Work Below their Potential?", "Building Bridges to Work: Gender, Local Labour Markets and Neighbourhoods Projects" and "Career Development in the Local Authority Sector in England: Opportunities and Constraints". The Centre for Social Inclusion welcomes enquiries from organisations and individuals interested in commissioning future work of this type.
6
2. The Local Setting
The City of Wakefield4
Wakefield is a district with a proud heritage, covering some 350 square kilometres. It is home to 315,000 people in a diverse range of city, urban and rural communities. It brings together what were previously 14 different local authorities, with the City of Wakefield at the district's heart, and the focal point for shopping, markets, theatre and entertainment.
The north west of the district includes Horbury, Ossett, Wrenthorpe, Stanley and Altofts, while Normanton, Castleford, Pontefract, Knottingley, Featherstone and a host of smaller settlements make up the Five Towns. In the south east, there are the towns of Hemsworth, South Kirby and South Elmsall as well as other communities.
Some 70 per cent of the rural communities of the district is designated as Green Belt. Dotted about the rolling countryside are villages like Middlestown, Crigglestone, Crofton, Woolley and Ackworth.
4 Source: Wakefield Metropolitan District Council -
www.wakefield.gov.uk
Wakefield Council and its partner organisations are making great strides in bringing new life to the old mining communities of the south east. Significant achievements have already been made in reclaiming former colliery sites for both leisure and industrial use.
The district is also home to major tourist attractions such as the Yorkshire Sculpture Park, National Coalmining Museum, Sandal Castle and Pontefract Castle. It also has two museums and an art gallery, and the Council is developing a cultural strategy for the District.
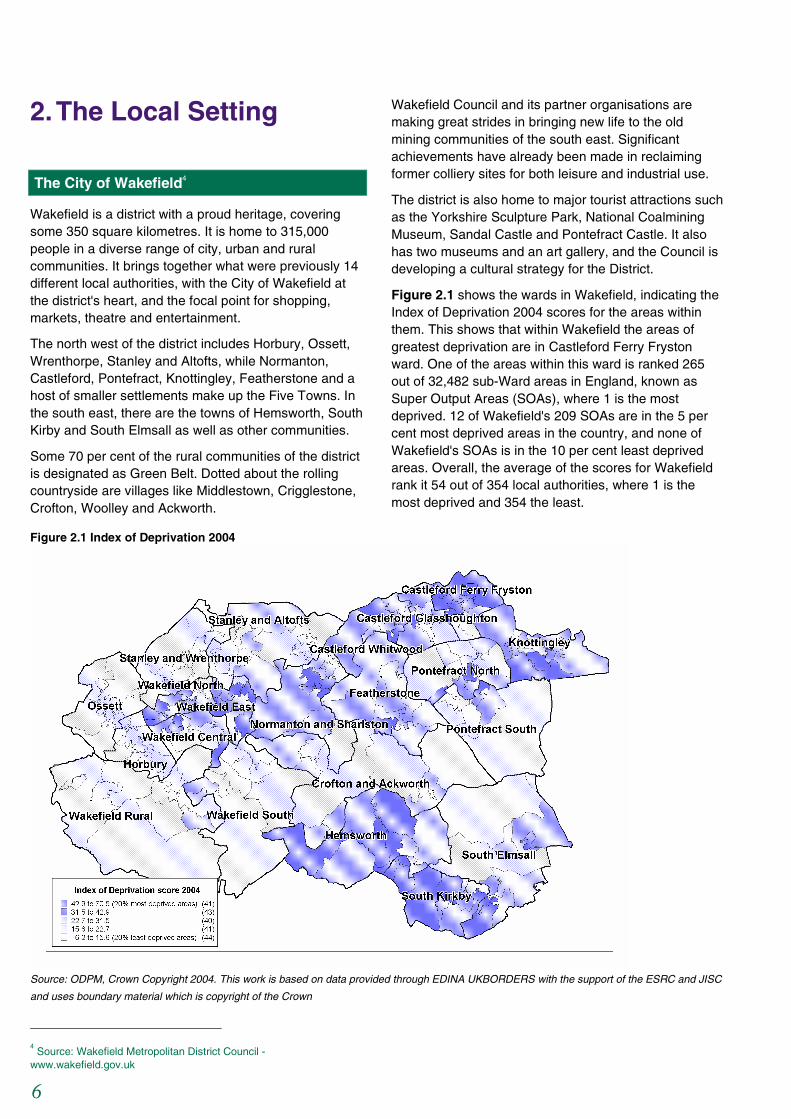
Figure 2.1 shows the wards in Wakefield, indicating the Index of Deprivation 2004 scores for the areas within them. This shows that within Wakefield the areas of greatest deprivation are in Castleford Ferry Fryston ward. One of the areas within this ward is ranked 265 out of 32,482 sub-Ward areas in England, known as Super Output Areas (SOAs), where 1 is the most deprived. 12 of Wakefield's 209 SOAs are in the 5 per cent most deprived areas in the country, and none of Wakefield's SOAs is in the 10 per cent least deprived areas. Overall, the average of the scores for Wakefield rank it 54 out of 354 local authorities, where 1 is the most deprived and 354 the least.
Figure 2.1 Index of Deprivation 2004
Source: ODPM, Crown Copyright 2004. This work is based on data provided through EDINA UKBORDERS with the support of the ESRC and JISC
and uses boundary material which is copyright of the Crown
7
Wakefield's Industrial Structure and Labour Market5
The Wakefield District is centrally located at the heart of the UK's communications network. Its position at the intersection of the A1, M1 and M62 motorways provides excellent access to all parts of the country by road, rail air or sea.
The District has emerged from over a century of reliance on coal mining to become a thriving manufacturing, shopping and distribution centre, taking full advantage of its place at the heart of the region's transport network.
Further information about the Industrial Structure and Labour Market in Wakefield is presented Chapter 4.
The People of Wakefield
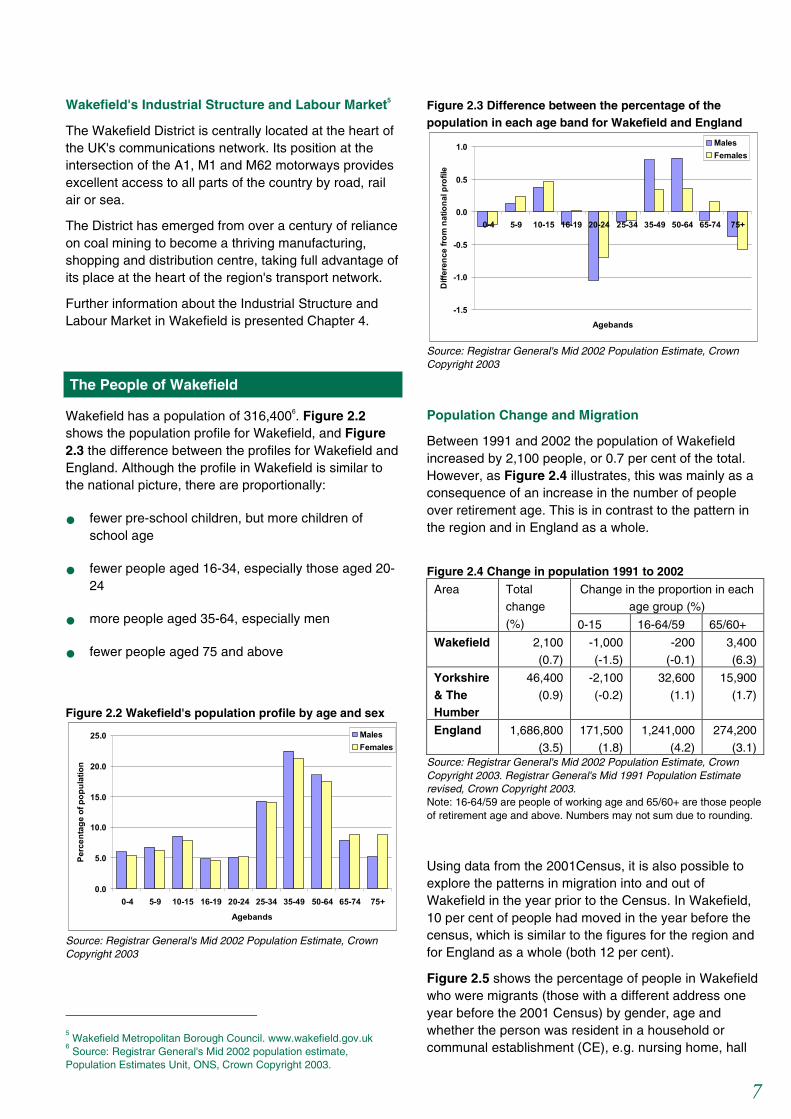
Wakefield has a population of 316,4006. Figure 2.2 shows the population profile for Wakefield, and Figure 2.3 the difference between the profiles for Wakefield and England. Although the profile in Wakefield is similar to the national picture, there are proportionally:
• fewer pre-school children, but more children of school age
• fewer people aged 16-34, especially those aged 20-24
• more people aged 35-64, especially men
• fewer people aged 75 and above
Figure 2.2 Wakefield's population profile by age and sex
0.0
5.0
10.0
15.0
20.0
25.0
0-4 5-9 10-15 16-19 20-24 25-34 35-49 50-64 65-74 75+
Agebands
Perc
enta
ge o
f pop
ulat
ion
MalesFemales
Source: Registrar General's Mid 2002 Population Estimate, Crown Copyright 2003
5 Wakefield Metropolitan Borough Council. www.wakefield.gov.uk
6 Source: Registrar General's Mid 2002 population estimate,
Population Estimates Unit, ONS, Crown Copyright 2003.
Figure 2.3 Difference between the percentage of the population in each age band for Wakefield and England
-1.5
-1.0
-0.5
0.0
0.5
1.0
0-4 5-9 10-15 16-19 20-24 25-34 35-49 50-64 65-74 75+
Agebands
Diff
eren
ce fr
om n
atio
nal p
rofil
e
MalesFemales
Source: Registrar General's Mid 2002 Population Estimate, Crown Copyright 2003
Population Change and Migration
Between 1991 and 2002 the population of Wakefield increased by 2,100 people, or 0.7 per cent of the total. However, as Figure 2.4 illustrates, this was mainly as a consequence of an increase in the number of people over retirement age. This is in contrast to the pattern in the region and in England as a whole.
Figure 2.4 Change in population 1991 to 2002
Change in the proportion in each age group (%)
Area Total change
(%) 0-15 16-64/59 65/60+
Wakefield
2,100
(0.7)
-1,000
(-1.5)
-200
(-0.1)
3,400
(6.3)
Yorkshire & The Humber
46,400
(0.9)
-2,100
(-0.2)
32,600
(1.1)
15,900
(1.7)
England 1,686,800
(3.5)
171,500
(1.8)
1,241,000
(4.2)
274,200
(3.1) Source: Registrar General's Mid 2002 Population Estimate, Crown Copyright 2003. Registrar General's Mid 1991 Population Estimate revised, Crown Copyright 2003. Note: 16-64/59 are people of working age and 65/60+ are those people of retirement age and above. Numbers may not sum due to rounding.
Using data from the 2001Census, it is also possible to explore the patterns in migration into and out of Wakefield in the year prior to the Census. In Wakefield, 10 per cent of people had moved in the year before the census, which is similar to the figures for the region and for England as a whole (both 12 per cent).
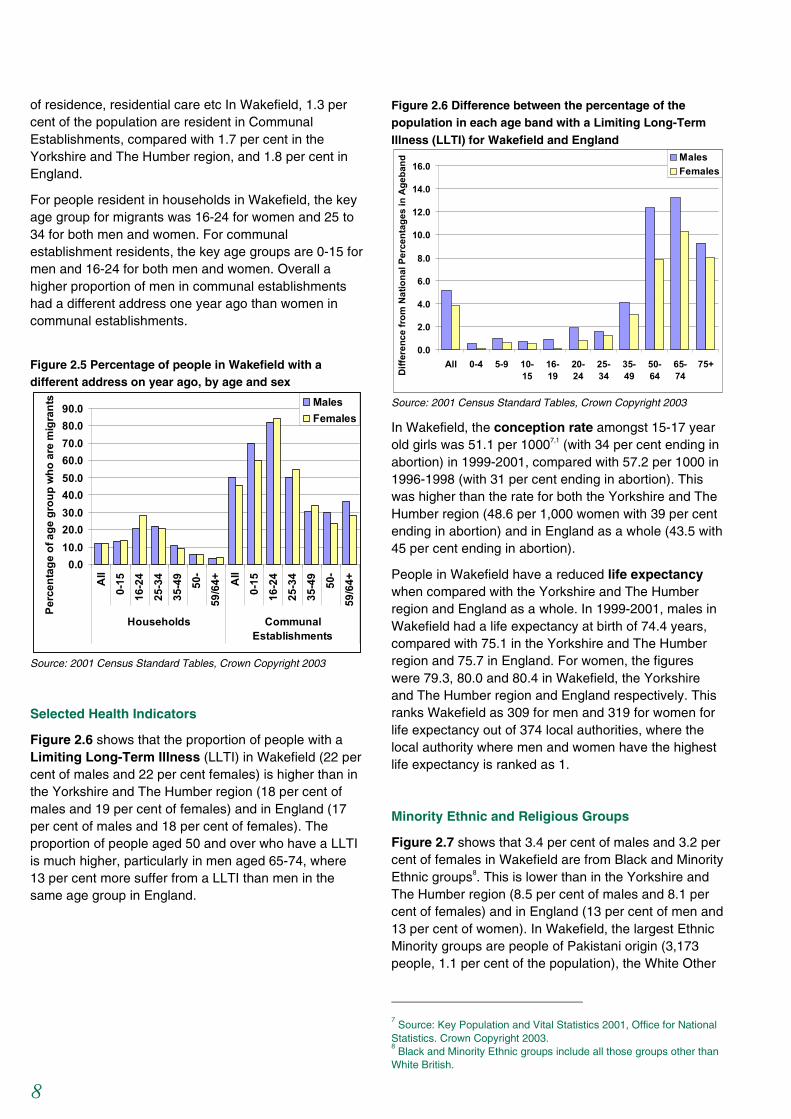
Figure 2.5 shows the percentage of people in Wakefield who were migrants (those with a different address one year before the 2001 Census) by gender, age and whether the person was resident in a household or communal establishment (CE), e.g. nursing home, hall
8
of residence, residential care etc In Wakefield, 1.3 per cent of the population are resident in Communal Establishments, compared with 1.7 per cent in the Yorkshire and The Humber region, and 1.8 per cent in England.
For people resident in households in Wakefield, the key age group for migrants was 16-24 for women and 25 to 34 for both men and women. For communal establishment residents, the key age groups are 0-15 for men and 16-24 for both men and women. Overall a higher proportion of men in communal establishments had a different address one year ago than women in communal establishments.
Figure 2.5 Percentage of people in Wakefield with a different address on year ago, by age and sex
0.010.020.030.040.050.060.070.080.090.0
All
0-15
16-2
425
-34
35-4
950
-59
/64+ A
ll0-
1516
-24
25-3
435
-49
50-
59/6
4+
Households CommunalEstablishments
Perc
enta
ge o
f age
gro
up w
ho a
re m
igra
nts Males
Females
Source: 2001 Census Standard Tables, Crown Copyright 2003
Selected Health Indicators
Figure 2.6 shows that the proportion of people with a Limiting Long-Term Illness (LLTI) in Wakefield (22 per cent of males and 22 per cent females) is higher than in the Yorkshire and The Humber region (18 per cent of males and 19 per cent of females) and in England (17 per cent of males and 18 per cent of females). The proportion of people aged 50 and over who have a LLTI is much higher, particularly in men aged 65-74, where 13 per cent more suffer from a LLTI than men in the same age group in England.
Figure 2.6 Difference between the percentage of the population in each age band with a Limiting Long-Term Illness (LLTI) for Wakefield and England
0.0
2.0
4.0
6.0
8.0
10.0
12.0
14.0
16.0
All 0-4 5-9 10-15
16-19
20-24
25-34
35-49
50-64
65-74
75+
Diff
eren
ce fr
om N
atio
nal P
erce
ntag
es in
Age
band Males
Females
Source: 2001 Census Standard Tables, Crown Copyright 2003
In Wakefield, the conception rate amongst 15-17 year old girls was 51.1 per 10007,1 (with 34 per cent ending in abortion) in 1999-2001, compared with 57.2 per 1000 in 1996-1998 (with 31 per cent ending in abortion). This was higher than the rate for both the Yorkshire and The Humber region (48.6 per 1,000 women with 39 per cent ending in abortion) and in England as a whole (43.5 with 45 per cent ending in abortion).
People in Wakefield have a reduced life expectancy when compared with the Yorkshire and The Humber region and England as a whole. In 1999-2001, males in Wakefield had a life expectancy at birth of 74.4 years, compared with 75.1 in the Yorkshire and The Humber region and 75.7 in England. For women, the figures were 79.3, 80.0 and 80.4 in Wakefield, the Yorkshire and The Humber region and England respectively. This ranks Wakefield as 309 for men and 319 for women for life expectancy out of 374 local authorities, where the local authority where men and women have the highest life expectancy is ranked as 1.
Minority Ethnic and Religious Groups
Figure 2.7 shows that 3.4 per cent of males and 3.2 per cent of females in Wakefield are from Black and Minority Ethnic groups8. This is lower than in the Yorkshire and The Humber region (8.5 per cent of males and 8.1 per cent of females) and in England (13 per cent of men and 13 per cent of women). In Wakefield, the largest Ethnic Minority groups are people of Pakistani origin (3,173 people, 1.1 per cent of the population), the White Other
7 Source: Key Population and Vital Statistics 2001, Office for National
Statistics. Crown Copyright 2003. 8 Black and Minority Ethnic groups include all those groups other than
White British.

9
population (2,052 people, 0.7), and the White Irish group (1,264 people, 0.4 per cent).
Figure 2.7 Percentage of the population from Black and Minority Ethnic groups by sex
0.4 0.4 0.7 0.7 1.2 1.30.7 0.71.1 1.2
2.5 2.8
0.5 0.40.9 0.9
1.3 1.3
1.5 1.3
4.6 4.3
4.8 4.40.7 0.7
2.2 2.4
0.4 0.4
0.8 0.9
0.10.2
0.2 0.3
0.0
2.0
4.0
6.0
8.0
10.0
12.0
14.0
Males Females Males Females Males Females
Wakefield Yorks & Humber England
Perc
enta
ge o
f the
pop
ulat
ion
White Irish White Other Mixed Ethnic Group
Asian or Asian British Black or Black British Chinese/Other Ethnic Group
Source: 2001 Census Standard Tables, Crown Copyright 2003
The 2001 Census also provides information about religious groups. The largest minority religious groups in Wakefield are Muslims (3,589 people or 1.1 per cent of the population) and Hindus (617 people or 0.2 per cent of the population). 76 per cent of males and 80 per cent of females state that they are Christians, which is higher than in the Yorkshire and The Humber region (70 per cent of males and 76 per cent of females) and England as a whole (69 per cent of males and 75 per cent of females). 14 per cent of men and 10 per cent of women said that they had no religion, and 9 per cent of men and 8 per cent of women did not state a religion.
Households and Housing
There are 132,213 households in Wakefield9, of which 28 per cent are single person households. This is lower than in the Yorkshire and The Humber region (30 per cent) and in England as a whole (30 per cent). Wakefield has a proportion of lone parent households with dependent children (7 per cent) that is similar that in Yorkshire and The Humber (7 per cent) and in England (6 per cent). The other main differences are:
• a higher proportion of married and cohabiting couple households (50 per cent) compared with the region (46 per cent) and England (45 per cent)
• fewer 'other' households which includes extended families and student households (4 per cent) compared with the Yorkshire and The Humber region (6 per cent) and England (7 per cent).
In Wakefield, 65 per cent of households are owner occupied, 28 per cent are rented from a social landlord (26 per cent rented from the council) and 6 per cent are privately rented. In the Yorkshire and The Humber region the figures are 67 per cent, 21 per cent (17 per cent rented from the council) and 9 per cent respectively and in England 68 per cent, 19 per cent (13 per cent rented from the council) and 10 per cent. Thus, Wakefield has:
• a low proportion of owner occupied households
• a high proportion of households that rent from the council
• low levels of private renting.
Data from the Land Registry for the last quarter of the years 2000 and 2003 show that house prices in Wakefield have risen substantially. The average house price rose from £63,800 to £101,700 (a 59 per cent increase), and 1 per cent more houses were sold in 2003 than in 2000. Over the same period, the average house price across England increased from £112,500 to £166,300 (an increase of 48 per cent), with 8 per cent more houses sold in the last quarter of 2003 than 2000.
9 Source: 2001 Census Standard Tables, Crown Copyright 2003.
10
3. Education and Skills
Educational Indicators in Wakefield10
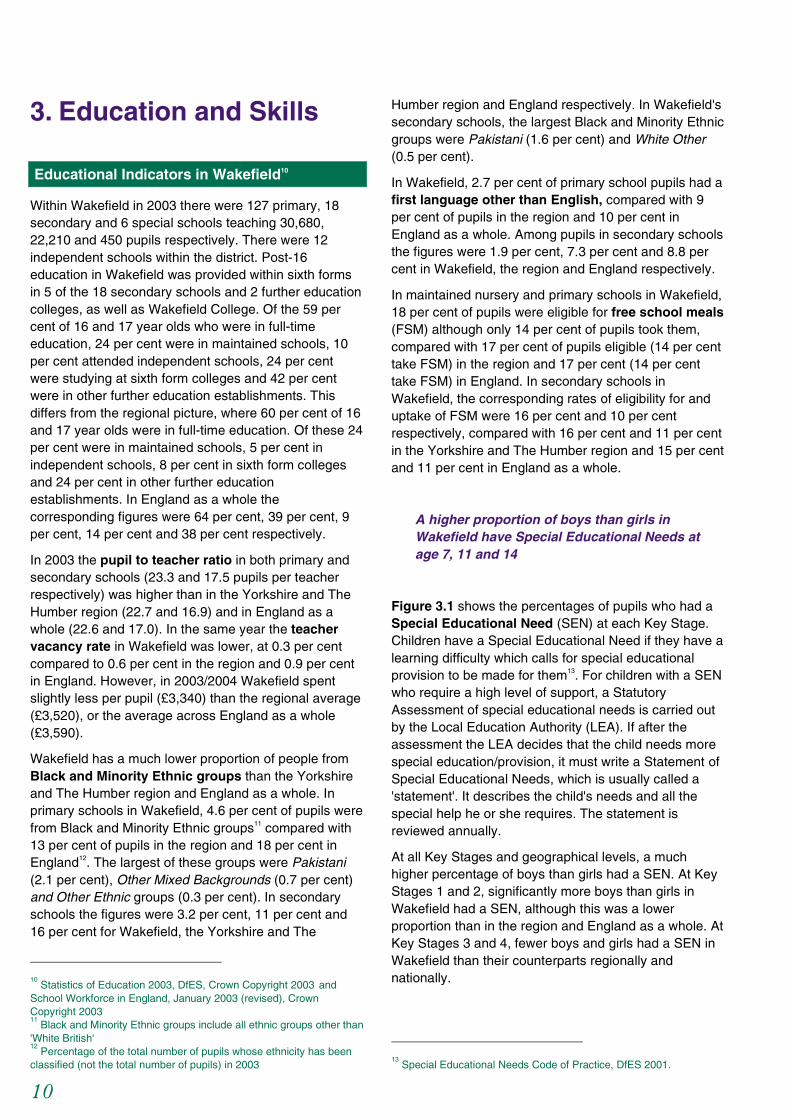
Within Wakefield in 2003 there were 127 primary, 18 secondary and 6 special schools teaching 30,680, 22,210 and 450 pupils respectively. There were 12 independent schools within the district. Post-16 education in Wakefield was provided within sixth forms in 5 of the 18 secondary schools and 2 further education colleges, as well as Wakefield College. Of the 59 per cent of 16 and 17 year olds who were in full-time education, 24 per cent were in maintained schools, 10 per cent attended independent schools, 24 per cent were studying at sixth form colleges and 42 per cent were in other further education establishments. This differs from the regional picture, where 60 per cent of 16 and 17 year olds were in full-time education. Of these 24 per cent were in maintained schools, 5 per cent in independent schools, 8 per cent in sixth form colleges and 24 per cent in other further education establishments. In England as a whole the corresponding figures were 64 per cent, 39 per cent, 9 per cent, 14 per cent and 38 per cent respectively.
In 2003 the pupil to teacher ratio in both primary and secondary schools (23.3 and 17.5 pupils per teacher respectively) was higher than in the Yorkshire and The Humber region (22.7 and 16.9) and in England as a whole (22.6 and 17.0). In the same year the teacher vacancy rate in Wakefield was lower, at 0.3 per cent compared to 0.6 per cent in the region and 0.9 per cent in England. However, in 2003/2004 Wakefield spent slightly less per pupil (£3,340) than the regional average (£3,520), or the average across England as a whole (£3,590).
Wakefield has a much lower proportion of people from Black and Minority Ethnic groups than the Yorkshire and The Humber region and England as a whole. In primary schools in Wakefield, 4.6 per cent of pupils were from Black and Minority Ethnic groups11 compared with 13 per cent of pupils in the region and 18 per cent in England12. The largest of these groups were Pakistani (2.1 per cent), Other Mixed Backgrounds (0.7 per cent) and Other Ethnic groups (0.3 per cent). In secondary schools the figures were 3.2 per cent, 11 per cent and 16 per cent for Wakefield, the Yorkshire and The
10
Statistics of Education 2003, DfES, Crown Copyright 2003 and School Workforce in England, January 2003 (revised), Crown Copyright 2003. 11
Black and Minority Ethnic groups include all ethnic groups other than 'White British' 12
Percentage of the total number of pupils whose ethnicity has been classified (not the total number of pupils) in 2003
Humber region and England respectively. In Wakefield's secondary schools, the largest Black and Minority Ethnic groups were Pakistani (1.6 per cent) and White Other (0.5 per cent).
In Wakefield, 2.7 per cent of primary school pupils had a first language other than English, compared with 9 per cent of pupils in the region and 10 per cent in England as a whole. Among pupils in secondary schools the figures were 1.9 per cent, 7.3 per cent and 8.8 per cent in Wakefield, the region and England respectively.
In maintained nursery and primary schools in Wakefield, 18 per cent of pupils were eligible for free school meals (FSM) although only 14 per cent of pupils took them, compared with 17 per cent of pupils eligible (14 per cent take FSM) in the region and 17 per cent (14 per cent take FSM) in England. In secondary schools in Wakefield, the corresponding rates of eligibility for and uptake of FSM were 16 per cent and 10 per cent respectively, compared with 16 per cent and 11 per cent in the Yorkshire and The Humber region and 15 per cent and 11 per cent in England as a whole.
A higher proportion of boys than girls in Wakefield have Special Educational Needs at age 7, 11 and 14
Figure 3.1 shows the percentages of pupils who had a Special Educational Need (SEN) at each Key Stage. Children have a Special Educational Need if they have a learning difficulty which calls for special educational provision to be made for them13. For children with a SEN who require a high level of support, a Statutory Assessment of special educational needs is carried out by the Local Education Authority (LEA). If after the assessment the LEA decides that the child needs more special education/provision, it must write a Statement of Special Educational Needs, which is usually called a 'statement'. It describes the child's needs and all the special help he or she requires. The statement is reviewed annually.
At all Key Stages and geographical levels, a much higher percentage of boys than girls had a SEN. At Key Stages 1 and 2, significantly more boys than girls in Wakefield had a SEN, although this was a lower proportion than in the region and England as a whole. At Key Stages 3 and 4, fewer boys and girls had a SEN in Wakefield than their counterparts regionally and nationally.
13
Special Educational Needs Code of Practice, DfES 2001.

11
Figure 3.1 Boys and girls with identified Special Educational Needs (SEN) and with a Statement of SEN, by Key Stage in 2003
0.0
5.0
10.0
15.0
20.0
25.0
Mal
es
Fem
ales
Mal
es
Fem
ales
Mal
es
Fem
ales
Mal
es
Fem
ales
Mal
es
Fem
ales
Mal
es
Fem
ales
Mal
es
Fem
ales
Mal
es
Fem
ales
Age 7 Age 11 Age 14 Age 15 Age 7 Age 11 Age 14 Age 15
SEN no statement SEN with statement
Perc
enta
ge o
f pup
ils
Wakefield Yorks & Humber England
Source: DfES, Crown Copyright 2004
Figure 3.2 shows that in Wakefield, at all Key Stages, children with a SEN were more likely to have a Statement of SEN than in the region and England, except at Key Stage 3. At all geographical levels and at all Key Stages, girls with a SEN were less likely than boys with a SEN to have a statement. The only exception was at Key Stage 4 when 40 per cent of both boys and girls with a SEN in Wakefield had a statement of SEN, compared with fewer than 30 per cent of their counterparts at the regional and national levels.
Figure 3.2 Boys and girls with Special Educational Needs (SEN) and a Statement of SEN, by Key Stage in 2003
0.0
5.0
10.0
15.0
20.0
25.0
30.0
35.0
40.0
45.0
Males Females Males Females Males Females Males Females
Age 7 Age 11 Age 14 Age 15
Perc
enta
ge o
f pup
ils w
ith S
EN th
at h
ave
a st
atem
ent
Wakefield Yorks & Humber England
Source: DfES, Crown Copyright 2004
Educational Attainment at Ages 7 - 16
Girls in Wakefield perform below the level of pupils nationally at Key Stages 2 and 3
Key Stage 1 Tests - Age 7
Figure 3.3 shows the achievement of pupils in Key Stage 1 tests (age 7) in reading, writing and mathematics in 2003. In Wakefield a similar proportion of girls reached the required standard, compared with girls in the region and nationally, in all the three subjects of reading, writing and mathematics. Boys performed slightly better in writing, 1 per cent more achieved the required standard than their counterparts in the region and England, but 1-2 per cent fewer in reading and mathematics. Whilst 87 per cent of boys achieved the expected standard in mathematics, fewer boys performed well in reading (79 per cent) and in writing (77 per cent). Girls in Wakefield performed better than boys in all three subjects, 88 per cent achieving at least level 2 in reading, 87 per cent in writing and 91 per cent in mathematics.
Figure 3.3 Boys and girls achieving level 2 or above at Key Stage 1 (age 7) in reading, writing and mathematics in 2003
0102030405060708090
100
Boys Girls Boys Girls Boys Girls
Reading Writing Mathematics
Perc
enta
ge o
f pup
ils a
chie
ving
leve
l 2 o
r abo
ve
Wakefield Yorks & Humber England
Source: DfES, Crown Copyright 2004
Figure 3.4 Difference from national levels of pupils achieving level 2 or above at Key Stage 1, in 2003
-3
-2
-1
0
1
2
Boys Girls Boys Girls Boys Girls
Reading Writing Maths
Diff
eren
ce fr
om th
e na
tiona
l per
cent
age
Wakefield Yorks & Humber
Source: DfES, Crown Copyright 2004
Note: England: Reading - Boys 80%, Girls 88%, Writing - Boys 76%, Girls 86%, Mathematics- Boys 89%, Girls 91%

12
Figure 3.4 shows how pupil's performance in Wakefield and the Yorkshire and The Humber region differed from the national percentage of pupils achieving the expected standard at Key Stage 1. Boys in Wakefield performed below the national level in reading and mathematics, whereas girls in Wakefield, and both boys and girls in the region, performed at a similar level to those across England as a whole in all the three subjects.
Data from previous years indicate that since 2000, proportionally fewer boys and girls in Wakefield have achieved the expected standard at Key Stage 1 in writing. This is similar to the pattern regionally and nationally, which shows a fall in the proportion of both boys and girls achieving the required level in writing in 2003. However the results for boys' and girls' achievements in reading and mathematics in Wakefield differ from the national trend. While there were no changes in reading for both boys and girls, and no change in girls' results in mathematics since 2000, the proportion of boys achieving the expected standard decreased in mathematics. This contrasts with the regional and national trends, which show a slight improvement in boys' performance in reading and mathematics.
Key Stage 2 - Age 11
Figure 3.5 shows the achievements of pupils at Key Stage 2 in the subjects of English, mathematics and science in 2003. Fewer pupils in Wakefield achieved the expected standard at Key Stage 2 than their equivalents in England. Whilst 86 per cent of both boys and girls achieved the required level in science, a much lower proportion of boys achieved this level in English (69 per cent) and in mathematics (74 per cent). Girls performed better than boys in English (77 per cent) and mathematics (71 per cent), but nevertheless did less well than girls across England.
Figure 3.5 Boys and girls achieving level 4 or above at Key Stage 2 (aged 11) in English, mathematics and science in 2003
0102030405060708090
100
Boys Girls Boys Girls Boys Girls
English Mathematics Science
Perc
enta
ge o
f pup
ils a
chie
ving
leve
l 4 o
r abo
ve
Wakefield Yorks & Humber England
Source: DfES, Crown Copyright 2004
Figure 3.6 Difference from national levels of pupils achieving level 4 or above at Key Stage 2, in 2003
-4
-3
-2
-1
0
1
2
Boys Girls Boys Girls Boys Girls
English Mathematics Science
Diff
eren
ce fr
om th
e na
tiona
l per
cent
age
Wakefield Yorks & Humber
Source: DfES, Crown Copyright 2004
Note: England: English - Boys 70%, Girls 80%, Mathematics - Boys 73%, Girls 72%, Science - Boys 86%, Girls 87%
Figure 3.6 demonstrates the difference from the national percentage of pupils achieving level 4 or higher at Key Stage 2. In Wakefield, girls' performance in English was 3 per cent below the national level and 2 per cent below the regional level. For boys, the difference was only 1 per cent below the national level, but 2 per cent above the regional level. Boys in Wakefield performed above the national and regional levels in mathematics and at the national level in science at age 7, whereas girls performed below the national standard in all the three subjects.
Since 2000, fewer girls in Wakefield have achieved level 4 or more at Key Stage 2 in English (down 2 per cent) and mathematics (down 1 per cent). Only 1 per cent more girls achieved the expected level in science in 2003 than in 2000. The picture for boys over this period is of no change in English, up 3 per cent in mathematics and up 2 per cent in science, which is similar to the national pattern for boys of a 1-2 per cent increase between 2000 and 2003.
Key Stage 3 - Age 14
Figure 3.7 shows pupils' achievements at Key Stage 3 in English, mathematics and science in 2003. Compared with their counterparts nationally, a lower percentage of both boys and girls in Wakefield achieved the expected level in mathematics (67 per cent of boys and 70 per cent of girls) and science (64 per cent of boys and 65 per cent of girls). Even fewer boys achieved the expected standard in English (62 per cent), although this was 1 per cent more than boys at the regional level, and similar to boys at the national level. Girls in Wakefield performed better in English (75 per cent) than in mathematics and science, similar to the regional average but still below the national level.

13
Figure 3.7 Boys and girls achieving level 5 or above at Key Stage 3 (aged 14) in English, mathematics and science in 2003
0102030405060708090
100
Boys Girls Boys Girls Boys Girls
English Maths SciencePerc
enta
ge o
f pup
ils a
chie
ving
leve
l 5 o
r abo
ve
Wakefield Yorks & Humber England
Source: DfES, Crown Copyright 2004
Figure 3.8 shows the difference from the national percentage of pupils achieving level 5 or above at Key Stage 3. While the regional level is below the national level for both boys' and girls' achievements in all the three subjects of English, mathematics and science, both boys and girls in Wakefield also performed below the national level in these three subjects, except for boys in English. The greatest difference is in boys' and girls' achievements in science, 4 per cent below the national percentage.
Figure 3.8 Difference from national levels of pupils achieving level 5 or above at Key Stage 3, in 2003
-5
-4
-3
-2
-1
0Boys Girls Boys Girls Boys Girls
English Maths Science
Diff
eren
ce fr
om th
e na
tiona
l per
cent
age
Wakefield Yorks & Humber
Source: DfES, Crown Copyright 2004
Note: England: English - Boys 62%, Girls 76%, Mathematics - Boys 70%, Girls 72%, Science - Boys 68%, Girls 69%
In Wakefield, significant improvements have been made in educational attainment at age 14 since 2000.
There is clear evidence of recent educational improvements in Wakefield. Since 2000, the proportion of both boys and girls in Wakefield who achieved the expected standard at Key Stage 3 has in most cases risen faster, especially in English, than improvements at the national level. In 2003, 14 per cent more boys achieved the expected level in English, 6 per cent more
in mathematics and 7 per cent more in science than in 2000 (up 7 per cent, 6 per cent and 7 per cent respectively in England). For girls in Wakefield the corresponding figures are 7 per cent, 9 per cent, and 11 per cent (3 per cent, 7 per cent and 11 per cent for England).
Diversity Indicators and Performance at Key Stages 1-3
It is possible to look at the outcomes for girls and boys at Key Stages 1, 2 and 3, taking into account other factors, such as ethnicity, whether or not a pupil’s first language is English, eligibility for free school meals and assessments of Special Educational Need.
Ethnicity
The 2003 educational statistics for Wakefield refer to the pupils indicated in Figure 3.9.
Figure 3.9 Wakefield pupils assessed at Key Stages 1, 2 and 3, by sex and ethnicity Numbers
Age 7 KS1
Age 11 KS2
Age 14 KS3
White British
1,841 2,036 2,065 Boys
Black and Minority Ethnic Groups
87 76 65
White British
1,793 2,035 1,972 Girls
Black and Minority Ethnic Groups
84 65 60
Source: DfES, Crown Copyright 2004
As Figure 3.9 shows, Wakefield has a very small number of pupils from Black and Minority Ethnic Groups. In Wakefield, these pupils are principally concentrated in Pakistani, Other Mixed Background, White other and Any Other Ethnic groups. Although the figures are small, they provide reliable data as they refer to the results of official tests taken by all pupils, and have not, for example, been generalised from a sample survey of pupils. The test results for 7, 11 and 14 year-old pupils showed:
At age 7
• Wakefield’s Black and Minority Ethnic girls did better than Wakefield’s Black and Minority Ethnic boys.
• Wakefield’s Black and Minority Ethnic boys and girls did less well than Wakefield’s White British boys and girls.
14
• Wakefield’s Black and Minority Ethnic boys performed below the level of similar boys nationally, 8 per cent fewer achieving the expected standard in reading, 9 per cent fewer in writing and 12 per cent fewer in mathematics.
• Wakefield’s Black and Minority Ethnic girls did less well than their counterparts nationally, with 10 per cent fewer achieving expected standards in all the three subjects.
At age 11
• Wakefield’s Black and Minority Ethnic boys did better than Wakefield’s Black and Minority Ethnic girls in all Key Stage 2 subjects.
• Wakefield’s Black and Minority Ethnic boys and girls did less well than Wakefield’s White British boys and girls in all subjects, except in mathematics where a similar proportion of Wakefield’s Black and Minority Ethnic boys achieved the required level as Wakefield’s White British boys.
• Wakefield’s Black and Minority Ethnic boys did better than Black and Minority Ethnic boys nationally by 2 per cent in mathematics. They reached the same standard as similar boys across England in English, but 2 per cent fewer of them achieved the desired standard in science.
• Wakefield’s Black and Minority Ethnic girls did less well than Black and Minority Ethnic girls nationally. In English, 12 per cent fewer achieved the expected standard; in mathematics, 16 per cent fewer; and in science, 17 per cent fewer.
At age 14
• Wakefield’s Black and Minority Ethnic boys did less well than Wakefield’s White British boys (8 per cent fewer achieving the expected standard in English, 13 per cent fewer in mathematics, and 26 per cent fewer in science).
• Wakefield’s Black and Minority Ethnic girls did less well than Wakefield’s White British girls (7 per cent fewer achieving expected standards in English, 8 per cent fewer in mathematics, and 23 per cent fewer in science).
• Wakefield’s pupils of both sexes and from all ethnic groups did less well than their national counterparts. Compared with similar boys and girls nationally, Wakefield’s Black and Minority Ethnic boys and girls achieving especially poor results in science, with 20
per cent fewer boys and 18 per cent fewer girls achieved the desired level.
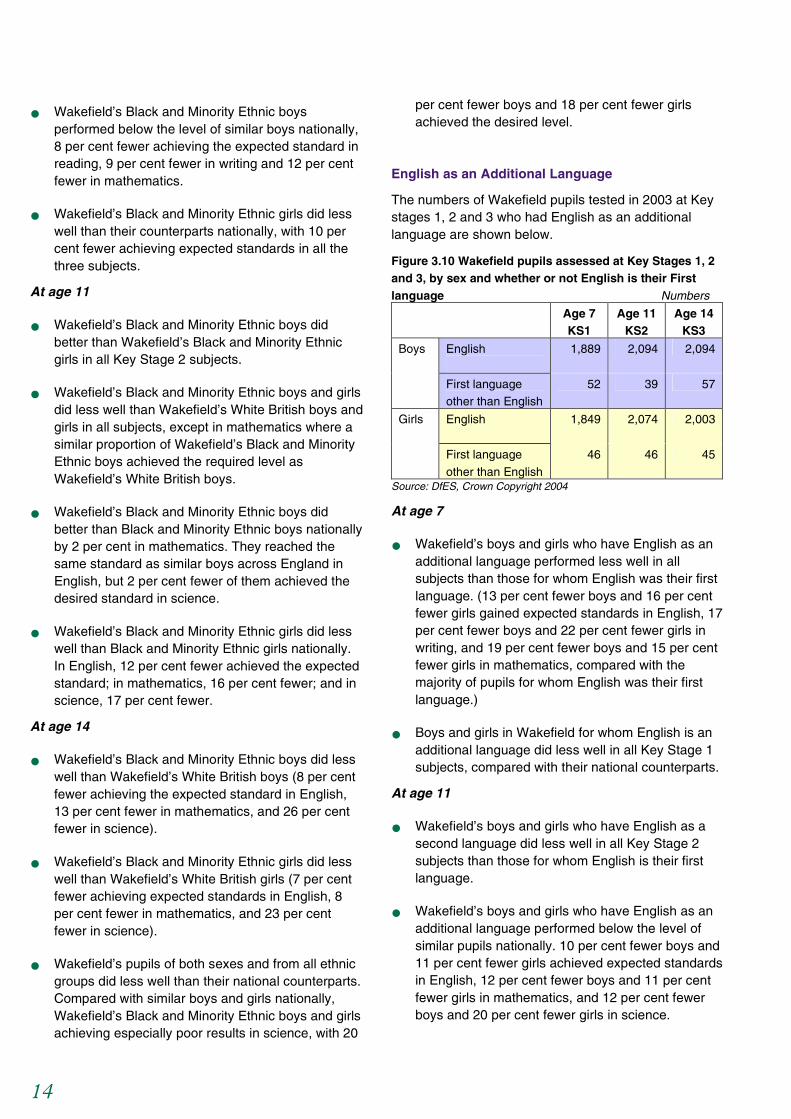
English as an Additional Language
The numbers of Wakefield pupils tested in 2003 at Key stages 1, 2 and 3 who had English as an additional language are shown below.
Figure 3.10 Wakefield pupils assessed at Key Stages 1, 2 and 3, by sex and whether or not English is their First language Numbers
Age 7 KS1
Age 11 KS2
Age 14 KS3
English
1,889 2,094 2,094 Boys
First language other than English
52 39 57
English
1,849 2,074 2,003 Girls
First language
other than English
46 46 45
Source: DfES, Crown Copyright 2004
At age 7
• Wakefield’s boys and girls who have English as an additional language performed less well in all subjects than those for whom English was their first language. (13 per cent fewer boys and 16 per cent fewer girls gained expected standards in English, 17 per cent fewer boys and 22 per cent fewer girls in writing, and 19 per cent fewer boys and 15 per cent fewer girls in mathematics, compared with the majority of pupils for whom English was their first language.)
• Boys and girls in Wakefield for whom English is an additional language did less well in all Key Stage 1 subjects, compared with their national counterparts.
At age 11
• Wakefield’s boys and girls who have English as a second language did less well in all Key Stage 2 subjects than those for whom English is their first language.
• Wakefield’s boys and girls who have English as an additional language performed below the level of similar pupils nationally. 10 per cent fewer boys and 11 per cent fewer girls achieved expected standards in English, 12 per cent fewer boys and 11 per cent fewer girls in mathematics, and 12 per cent fewer boys and 20 per cent fewer girls in science.

15
At age 14
• Wakefield boys' and girls for whom English is an additional language performed less well in all subjects than other Wakefield boys and girls at age 14. In science, 33 per cent fewer boys and 30 per cent fewer girls in this group achieved the expected standard, compared with boys and girls for whom English is their first language.
• Boys and girls in Wakefield with English as an additional language performed below the level of similar pupils nationally, with 6 per cent fewer boys and 5 per cent fewer girls achieving expected standards in English, 14 per cent fewer boys and 10 per cent fewer girls in mathematics, and 23 per cent fewer boys and 21 per cent fewer girls in science.
Free School Meals Eligibility
• In Wakefield, the Yorkshire and The Humber region, and nationally, pupils of both sexes who are eligible for free school meals performed less well than other pupils at Key Stages 1, 2 and 3.
• This was especially marked for older Wakefield boys and girls eligible for free school meals, with 30-32 per cent fewer achieving the expected standards in all subjects at age 14, and compared with other Wakefield girls, 38% fewer achieved this level in science.
Special Educational Needs
At age 7
• Wakefield boys who have a SEN achieved less well than their national counterparts in 2003. 10 per cent fewer achieved expected standards in reading, 9 per cent fewer in writing and 15 per cent fewer in mathematics.
• Wakefield girls who have a SEN also performed below the level of similar girls nationally, by 5 per cent in reading, 6 per cent in writing and 10 per cent in mathematics.
At age 11
• Among Wakefield pupils who have SEN but who do not have a statement of SEN, attainment was lower for both boys and girls than the national averages for similar pupils.
• In English, 8 per cent fewer boys and 13 per cent fewer girls achieved expected standards; in mathematics the figures were 1 per cent fewer boys and 5 per cent fewer girls, and in science 2 per cent fewer boys and 8 per cent fewer girls.
At age 14
• Wakefield boys who have a SEN performed below the level of similar boys nationally by 4 per cent in reading, 9 per cent in writing and 8 per cent in mathematics.
• Wakefield girls who have a SEN also performed below the level of similar girls nationally, by 7 per cent in reading, 2 per cent in writing and 3 per cent in mathematics.
Key Stage 4 GCSE/GNVQ - Age 16
In Wakefield proportionally fewer girls and boys achieved 5 or more passes in GCSE/GNVQ at A*-C grade compared with England
GCSE/GNVQ achievements by 16 year olds in maintained schools in 2002/03 are presented in Figure 3.11. In Wakefield, fewer boys and girls achieved 5 or more A*-C grades at GCSE/GNVQ level than at the national level, with boys performing less well than girls. 41 per cent of boys in Wakefield achieved 5 or more A*-C grades, compared with 50 per cent of girls.
In Wakefield, 5.4 per cent of boys did not achieve any GCSE/GNVQ passes. This was lower than in the region and England as a whole. The figure for girls was 4.7 per cent, similar to the regional figure, but slightly higher than the national one.
However, for boys, significant improvement has been made since 2000 at Key Stage 4, when only 36 per cent of male pupils in Wakefield reached this standard. Between 2000 and 2003 the proportion of boys achieving 5 or more A*-C grades at GCSE/GNVQ increased by 5 per cent. There was no change, however, in girls' achieving 5 or more A*-C grades at GCSE/GNVQ since 2000 in Wakefield. The comparable figures for the region were 4 per cent for both boys and girls, and in England as a whole were 6 per cent for both boys and girls. This suggests a need to focus on raising girls' attainment.
16
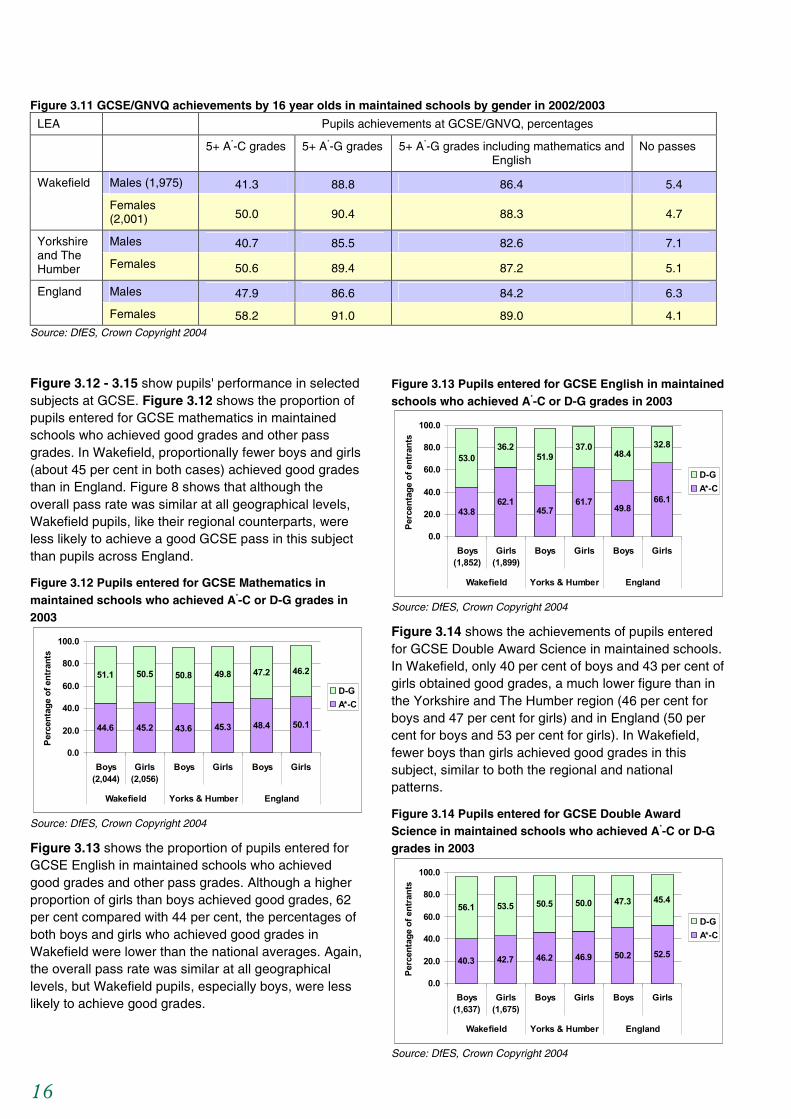
Figure 3.11 GCSE/GNVQ achievements by 16 year olds in maintained schools by gender in 2002/2003
LEA Pupils achievements at GCSE/GNVQ, percentages
5+ A*-C grades 5+ A*-G grades 5+ A*-G grades including mathematics and English
No passes
Males (1,975) 41.3 88.8 86.4 5.4 Wakefield
Females (2,001) 50.0 90.4 88.3 4.7
Males 40.7 85.5 82.6 7.1 Yorkshire and The Humber Females 50.6 89.4 87.2 5.1
Males 47.9 86.6 84.2 6.3 England
Females 58.2 91.0 89.0 4.1 Source: DfES, Crown Copyright 2004
Figure 3.12 - 3.15 show pupils' performance in selected subjects at GCSE. Figure 3.12 shows the proportion of pupils entered for GCSE mathematics in maintained schools who achieved good grades and other pass grades. In Wakefield, proportionally fewer boys and girls (about 45 per cent in both cases) achieved good grades than in England. Figure 8 shows that although the overall pass rate was similar at all geographical levels, Wakefield pupils, like their regional counterparts, were less likely to achieve a good GCSE pass in this subject than pupils across England.
Figure 3.12 Pupils entered for GCSE Mathematics in maintained schools who achieved A*-C or D-G grades in 2003
44.6 45.2 43.6 45.3 48.4 50.1
51.1 50.5 50.8 49.8 47.2 46.2
0.0
20.0
40.0
60.0
80.0
100.0
Boys(2,044)
Girls(2,056)
Boys Girls Boys Girls
Wakefield Yorks & Humber England
Perc
enta
ge o
f ent
rant
s
D-GA*-C
Source: DfES, Crown Copyright 2004
Figure 3.13 shows the proportion of pupils entered for GCSE English in maintained schools who achieved good grades and other pass grades. Although a higher proportion of girls than boys achieved good grades, 62 per cent compared with 44 per cent, the percentages of both boys and girls who achieved good grades in Wakefield were lower than the national averages. Again, the overall pass rate was similar at all geographical levels, but Wakefield pupils, especially boys, were less likely to achieve good grades.
Figure 3.13 Pupils entered for GCSE English in maintained schools who achieved A*-C or D-G grades in 2003
43.862.1
45.761.7
49.866.1
53.036.2
51.937.0
48.432.8
0.0
20.0
40.0
60.0
80.0
100.0
Boys(1,852)
Girls(1,899)
Boys Girls Boys Girls
Wakefield Yorks & Humber England
Perc
enta
ge o
f ent
rant
s
D-GA*-C
Source: DfES, Crown Copyright 2004
Figure 3.14 shows the achievements of pupils entered for GCSE Double Award Science in maintained schools. In Wakefield, only 40 per cent of boys and 43 per cent of girls obtained good grades, a much lower figure than in the Yorkshire and The Humber region (46 per cent for boys and 47 per cent for girls) and in England (50 per cent for boys and 53 per cent for girls). In Wakefield, fewer boys than girls achieved good grades in this subject, similar to both the regional and national patterns.
Figure 3.14 Pupils entered for GCSE Double Award Science in maintained schools who achieved A*-C or D-G grades in 2003
40.3 42.7 46.2 46.9 50.2 52.5
56.1 53.5 50.5 50.0 47.3 45.4
0.0
20.0
40.0
60.0
80.0
100.0
Boys(1,637)
Girls(1,675)
Boys Girls Boys Girls
Wakefield Yorks & Humber England
Perc
enta
ge o
f ent
rant
s
D-GA*-C
Source: DfES, Crown Copyright 2004

17
Figure 3.15 shows that in Wakefield a much lower percentage of pupils entered for GCSEs in a Modern Language achieved good grades than in the region and England as a whole. Girls (44 per cent) performed better than boys (29 per cent) in achieving good grades, but still performed below the regional and national averages of 48 per cent and 55 per cent respectively. The overall pass rate for boys in Wakefield was also below the national level.
Figure 3.15 Pupils entered for GCSE in a Modern Language in maintained schools who achieved A*-C or D-G grades in 2003
28.543.9
31.047.9 39.1
55.1
66.552.5
64.949.7 58.0
43.2
0.0
20.0
40.0
60.0
80.0
100.0
Boys(1,543)
Girls(1,752)
Boys Girls Boys Girls
Wakefield Yorks & Humber England
Perc
enta
ge o
f ent
rant
s
D-GA*-C
Source: DfES, Crown Copyright 2004
Note: 'Modern Language' includes those pupils who took French, German, Spanish, Italian or 'Other Modern Language'
The achievements of girls and boys at GCSE/GNVQ level can also be explored in the context of other factors, such as ethnicity, whether or not a pupil's first language is English, free school meal eligibility and SENs. Analysis of these results shows that:
Ethnicity
• In Wakefield, fewer Black and Minority Ethnic boys and girls achieved 5 or more A*- C grades at GCSE/GNVQ, compared with Wakefield's White British boys and girls.
• Fewer of Wakefield's Black and Minority Ethnic boys and girls achieved 5 or more A*- C grades at GCSE/GNVQ, compared with similar boys and girls nationally.
English as an additional language
• In Wakefield amongst those whose first language is not English, a lower proportion of boys (7 per cent fewer) and girls (13 per cent fewer) achieved 5 or more good GCSE/GNVQ grades, compared with Wakefield boys and girls whose first language is English.
• Wakefield boys and girls for whom English is an additional language performed less well than their national counterparts. 9 per cent fewer boys and, most notably, 18 per cent fewer girls achieved 5 or more good GCSE/GNVQ grades, compared with similar boys and girls nationally.
Free school meal eligibility
• In Wakefield, the region and nationally, girls and boys who were eligible for free school meals were far less likely to achieve 5 or more good GCSE/GNVQ passes and far more likely to achieve no GCSE/GNVQ passes, compared with pupils who were not eligible for free school meals.
• Mirroring the national pattern, girls who were eligible for free school meals were more likely than boys to achieve 5 or more good GCSE/GNVQ passes and less likely to achieve no passes.
• In Wakefield, boys and girls who were eligible for free school meals were less likely to achieve 5 or more good GCSE/GNVQ passes, 4 per cent fewer boys and 9 per cent fewer girls, compared with similar boys and girls nationally.
Special Educational Needs
• Wakefield's pupils with a SEN but no statement performed less well than their national counterparts, with 4 per cent fewer boys and girls achieving 5 or more GCSE/GNVQ passes at grades A*-C.
• In Wakefield, 4 per cent more boys and 10 per cent more girls with a SEN but without a statement did not achieve any GCSE/GNVQ passes compared with their counterparts nationally.

18
Destinations of pupils after age 16
In Wakefield, many boys who enter employment at 16 go into jobs in skilled trades.
Many girls in Wakefield who enter employment at 16 go into personal service occupations.
Figure 3.16 shows the situation of pupils after the end of compulsory education. It indicates that in 2003 fewer students stayed on in education in Wakefield than in the Yorkshire and The Humber region and across England. In 2003 in Wakefield, most 16 year olds continued in education or training, with more female students (69 per cent) than male students (56 per cent). Significantly more young men entered the labour market than young women, 24 per cent compared with 13 per cent. These are higher proportions than in the region (18 per cent and 10 per cent) and England (14 per cent and 8 per cent). Note that 13 per cent of young men and 11 per cent of young women in Wakefield were 'not settled', again higher figures than regionally and nationally.
Figure 3.16 Destination of pupils at the end of compulsory education in 2003
56
69
61
74
67
77
4
4
6
4
5
3
17
9
13
7
10
6
7
4
5
3
4
2
13
11
10
9
9
7
2
2
2
2
2
2
2
1
2
2
2
2
0% 20% 40% 60% 80% 100%
Males
Females
Males
Females
Males
Females
Wak
efie
ldYo
rks
&H
umbe
rEn
glan
d
Percentage of 16 year oldsEducation TrainingEmployment with training Employment without trainingNot Settled Out of contactNo response
Source: ConneXions 2004
Figure 3.1714 shows the first occupation of those who went into employment after leaving school at 16. In all areas, young men were more likely to be employed in skilled trades or elementary occupations, while young women were more likely to enter personal service or administrative and secretarial occupations. In Wakefield, 40 per cent of young men entered skilled trades, slightly fewer than in the region and England (43 per cent in both cases). 18 per cent entered elementary occupations, compared with the regional (19 per cent) and national figures (22 per cent). 15 per cent of young men who left school at 16 became process, plant or
14
Note than in Figure 3.17 the 'unknown' data for the region and England may affect the comparisons made in this section.
machine operatives, a much higher proportion than in the region (6 per cent) and England (4 per cent). 10 per cent of young men went into administrative and secretarial occupations, again a higher percentage than at the regional (6 per cent) and national (4 per cent) scales.
Nearly 40 per cent of young women in Wakefield who left school at 16 started work in personal service occupations. This was similar to the national average, but lower than the regional figure of 42 per cent. 18 per cent young women school leavers entered administrative and secretarial occupations, a lower proportion than their counterparts in the regional (20 per cent) but higher than for England as a whole (15 per cent). Young women school leavers in Wakefield were also:
• more likely to be employed as process, plant or machine operatives (14 per cent), than their young women in the region and England as a whole (2 per cent).
• less likely to enter sales and customer service occupations (12 per cent) than young women in the region (15 per cent) or in England (16 per cent).
• less likely to enter elementary occupations (12 per cent) than young women nationally (16 per cent).
Figure 3.17 Occupations of 16-17 year olds who left education and entered employment in 2003
4
1
3
1
3
1
10
18
6
20
4
15
40
3
43
1
43
4
8
39
10
42
9
39
5
12
6
15
7
16
15
14
6
2
4
2
18
12
19
12
22
16
0
0
7
7
8
8
0 20 40 60 80 100
Males (589)
Females (348)
Males
Females
Males
Females
Wak
efie
ldYo
rks
&H
umbe
rEn
glan
d
Percentage of those post 16 who are in employment
Managers & Professionals Admin. & SecretarialSkilled Trades Personal ServiceSales & Customer Service Process; Plant & Machine OperativesElementary Occupations Unknown
Source: ConneXions 2004 Note: Elementary occupations include farm workers, labourers, packers, postal workers, hospital porters, hotel porters, kitchen and catering assistants, waiters, waitresses, bar staff, window cleaners, road sweepers, cleaners, refuse and salvage occupations, security guards, traffic wardens, school crossing patrols, school mid-day assistants, car park attendants, shelf fillers.
19
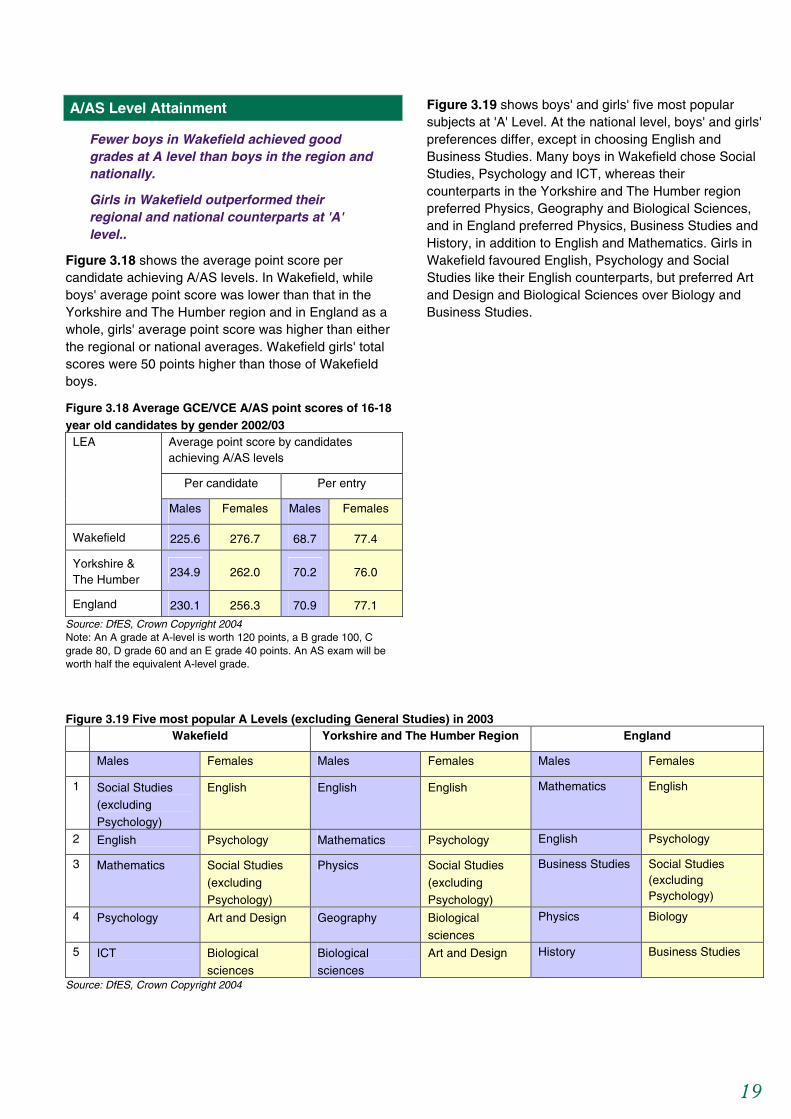
A/AS Level Attainment
Fewer boys in Wakefield achieved good grades at A level than boys in the region and nationally.
Girls in Wakefield outperformed their regional and national counterparts at 'A' level..
Figure 3.18 shows the average point score per candidate achieving A/AS levels. In Wakefield, while boys' average point score was lower than that in the Yorkshire and The Humber region and in England as a whole, girls' average point score was higher than either the regional or national averages. Wakefield girls' total scores were 50 points higher than those of Wakefield boys.
Figure 3.18 Average GCE/VCE A/AS point scores of 16-18 year old candidates by gender 2002/03
LEA Average point score by candidates achieving A/AS levels
Per candidate Per entry
Males Females Males Females
Wakefield 225.6 276.7 68.7 77.4
Yorkshire & The Humber
234.9 262.0 70.2 76.0
England 230.1 256.3 70.9 77.1
Source: DfES, Crown Copyright 2004
Note: An A grade at A-level is worth 120 points, a B grade 100, C grade 80, D grade 60 and an E grade 40 points. An AS exam will be worth half the equivalent A-level grade.
Figure 3.19 shows boys' and girls' five most popular subjects at 'A' Level. At the national level, boys' and girls' preferences differ, except in choosing English and Business Studies. Many boys in Wakefield chose Social Studies, Psychology and ICT, whereas their counterparts in the Yorkshire and The Humber region preferred Physics, Geography and Biological Sciences, and in England preferred Physics, Business Studies and History, in addition to English and Mathematics. Girls in Wakefield favoured English, Psychology and Social Studies like their English counterparts, but preferred Art and Design and Biological Sciences over Biology and Business Studies.
Figure 3.19 Five most popular A Levels (excluding General Studies) in 2003
Wakefield Yorkshire and The Humber Region England
Males Females Males Females Males Females
1 Social Studies (excluding Psychology)
English English English Mathematics English
2 English Psychology Mathematics Psychology English Psychology
3 Mathematics Social Studies
(excluding Psychology)
Physics Social Studies
(excluding Psychology)
Business Studies Social Studies (excluding Psychology)
4 Psychology Art and Design Geography Biological
sciences
Physics Biology
5 ICT Biological
sciences
Biological
sciences
Art and Design History Business Studies
Source: DfES, Crown Copyright 2004
20
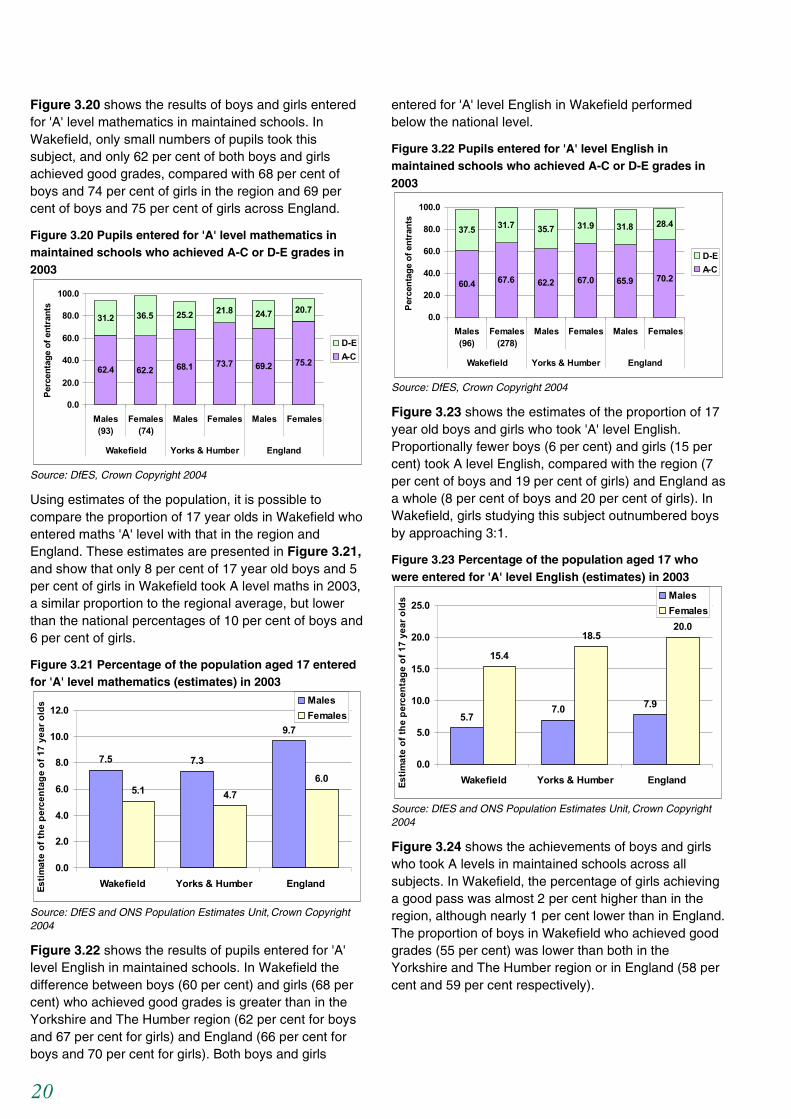
Figure 3.20 shows the results of boys and girls entered for 'A' level mathematics in maintained schools. In Wakefield, only small numbers of pupils took this subject, and only 62 per cent of both boys and girls achieved good grades, compared with 68 per cent of boys and 74 per cent of girls in the region and 69 per cent of boys and 75 per cent of girls across England.
Figure 3.20 Pupils entered for 'A' level mathematics in maintained schools who achieved A-C or D-E grades in 2003
62.4 62.2 68.1 73.7 69.2 75.2
31.2 36.5 25.2 21.8 24.7 20.7
0.0
20.0
40.0
60.0
80.0
100.0
Males(93)
Females(74)
Males Females Males Females
Wakefield Yorks & Humber England
Perc
enta
ge o
f ent
rant
s
D-EA-C
Source: DfES, Crown Copyright 2004
Using estimates of the population, it is possible to compare the proportion of 17 year olds in Wakefield who entered maths 'A' level with that in the region and England. These estimates are presented in Figure 3.21, and show that only 8 per cent of 17 year old boys and 5 per cent of girls in Wakefield took A level maths in 2003, a similar proportion to the regional average, but lower than the national percentages of 10 per cent of boys and 6 per cent of girls.
Figure 3.21 Percentage of the population aged 17 entered for 'A' level mathematics (estimates) in 2003
7.5 7.3
9.7
5.1 4.76.0
0.0
2.0
4.0
6.0
8.0
10.0
12.0
Wakefield Yorks & Humber EnglandEstim
ate
of th
e pe
rcen
tage
of 1
7 ye
ar o
lds Males
Females
Source: DfES and ONS Population Estimates Unit, Crown Copyright 2004
Figure 3.22 shows the results of pupils entered for 'A' level English in maintained schools. In Wakefield the difference between boys (60 per cent) and girls (68 per cent) who achieved good grades is greater than in the Yorkshire and The Humber region (62 per cent for boys and 67 per cent for girls) and England (66 per cent for boys and 70 per cent for girls). Both boys and girls
entered for 'A' level English in Wakefield performed below the national level.
Figure 3.22 Pupils entered for 'A' level English in maintained schools who achieved A-C or D-E grades in 2003
60.4 67.6 62.2 67.0 65.9 70.2
37.5 31.7 35.7 31.9 31.8 28.4
0.0
20.0
40.0
60.0
80.0
100.0
Males(96)
Females(278)
Males Females Males Females
Wakefield Yorks & Humber England
Perc
enta
ge o
f ent
rant
s
D-EA-C
Source: DfES, Crown Copyright 2004
Figure 3.23 shows the estimates of the proportion of 17 year old boys and girls who took 'A' level English. Proportionally fewer boys (6 per cent) and girls (15 per cent) took A level English, compared with the region (7 per cent of boys and 19 per cent of girls) and England as a whole (8 per cent of boys and 20 per cent of girls). In Wakefield, girls studying this subject outnumbered boys by approaching 3:1.
Figure 3.23 Percentage of the population aged 17 who were entered for 'A' level English (estimates) in 2003
5.77.0 7.9
15.4
18.520.0
0.0
5.0
10.0
15.0
20.0
25.0
Wakefield Yorks & Humber EnglandEstim
ate
of th
e pe
rcen
tage
of 1
7 ye
ar o
lds Males
Females
Source: DfES and ONS Population Estimates Unit, Crown Copyright 2004
Figure 3.24 shows the achievements of boys and girls who took A levels in maintained schools across all subjects. In Wakefield, the percentage of girls achieving a good pass was almost 2 per cent higher than in the region, although nearly 1 per cent lower than in England. The proportion of boys in Wakefield who achieved good grades (55 per cent) was lower than both in the Yorkshire and The Humber region or in England (58 per cent and 59 per cent respectively).
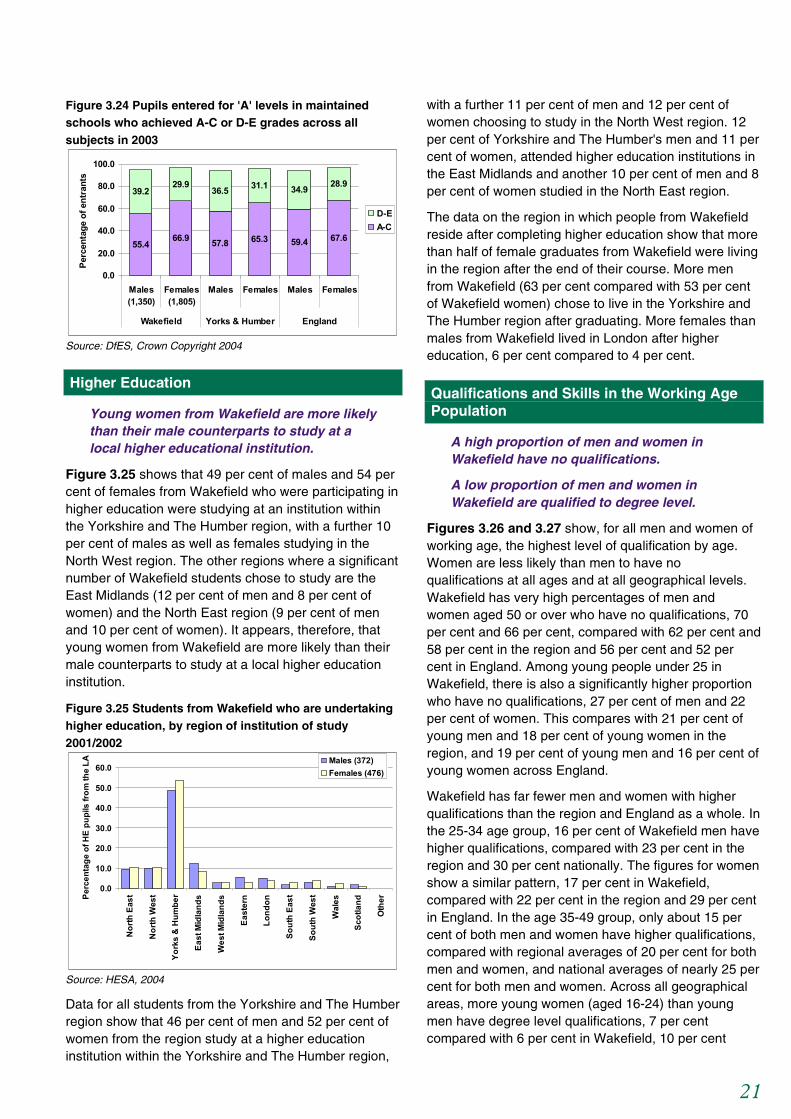
21
Figure 3.24 Pupils entered for 'A' levels in maintained schools who achieved A-C or D-E grades across all subjects in 2003
55.466.9 57.8 65.3 59.4 67.6
39.229.9
36.5 31.1 34.9 28.9
0.0
20.0
40.0
60.0
80.0
100.0
Males(1,350)
Females(1,805)
Males Females Males Females
Wakefield Yorks & Humber England
Perc
enta
ge o
f ent
rant
s
D-EA-C
Source: DfES, Crown Copyright 2004
Higher Education
Young women from Wakefield are more likely than their male counterparts to study at a local higher educational institution.
Figure 3.25 shows that 49 per cent of males and 54 per cent of females from Wakefield who were participating in higher education were studying at an institution within the Yorkshire and The Humber region, with a further 10 per cent of males as well as females studying in the North West region. The other regions where a significant number of Wakefield students chose to study are the East Midlands (12 per cent of men and 8 per cent of women) and the North East region (9 per cent of men and 10 per cent of women). It appears, therefore, that young women from Wakefield are more likely than their male counterparts to study at a local higher education institution.
Figure 3.25 Students from Wakefield who are undertaking higher education, by region of institution of study 2001/2002
0.0
10.0
20.0
30.0
40.0
50.0
60.0
Nor
th E
ast
Nor
th W
est
York
s &
Hum
ber
East
Mid
land
s
Wes
t Mid
land
s
East
ern
Lond
on
Sout
h Ea
st
Sout
h W
est
Wal
es
Scot
land
Oth
erPerc
enta
ge o
f HE
pupi
ls fr
om th
e LA Males (372)
Females (476)
Source: HESA, 2004
Data for all students from the Yorkshire and The Humber region show that 46 per cent of men and 52 per cent of women from the region study at a higher education institution within the Yorkshire and The Humber region,
with a further 11 per cent of men and 12 per cent of women choosing to study in the North West region. 12 per cent of Yorkshire and The Humber's men and 11 per cent of women, attended higher education institutions in the East Midlands and another 10 per cent of men and 8 per cent of women studied in the North East region.
The data on the region in which people from Wakefield reside after completing higher education show that more than half of female graduates from Wakefield were living in the region after the end of their course. More men from Wakefield (63 per cent compared with 53 per cent of Wakefield women) chose to live in the Yorkshire and The Humber region after graduating. More females than males from Wakefield lived in London after higher education, 6 per cent compared to 4 per cent.
Qualifications and Skills in the Working Age Population
A high proportion of men and women in Wakefield have no qualifications.
A low proportion of men and women in Wakefield are qualified to degree level.
Figures 3.26 and 3.27 show, for all men and women of working age, the highest level of qualification by age. Women are less likely than men to have no qualifications at all ages and at all geographical levels. Wakefield has very high percentages of men and women aged 50 or over who have no qualifications, 70 per cent and 66 per cent, compared with 62 per cent and 58 per cent in the region and 56 per cent and 52 per cent in England. Among young people under 25 in Wakefield, there is also a significantly higher proportion who have no qualifications, 27 per cent of men and 22 per cent of women. This compares with 21 per cent of young men and 18 per cent of young women in the region, and 19 per cent of young men and 16 per cent of young women across England.
Wakefield has far fewer men and women with higher qualifications than the region and England as a whole. In the 25-34 age group, 16 per cent of Wakefield men have higher qualifications, compared with 23 per cent in the region and 30 per cent nationally. The figures for women show a similar pattern, 17 per cent in Wakefield, compared with 22 per cent in the region and 29 per cent in England. In the age 35-49 group, only about 15 per cent of both men and women have higher qualifications, compared with regional averages of 20 per cent for both men and women, and national averages of nearly 25 per cent for both men and women. Across all geographical areas, more young women (aged 16-24) than young men have degree level qualifications, 7 per cent compared with 6 per cent in Wakefield, 10 per cent

22
compared with 9 per cent in the region and 13 per cent compared with 11 per cent in England.
Figure 3.26 The highest level of qualification for men by age
27.0 28.042.1
69.5
20.9 22.334.4
62.1
19.0 17.329.1
56.1
66.9 56.243.4
18.6
70.555.1
46.1
22.6
70.353.1
47.1
26.1
6.0 15.8 14.5 12.0 8.622.6 19.5 15.3 10.7
29.5 23.8 17.8
0.010.020.030.040.050.060.070.080.090.0
100.0
16-24
25-34
35-49
50-64
16-24
25-34
35-49
50-64
16-24
25-34
35-49
50-64
Wakefield Yorks & Humber England
Perc
enta
ge o
f men
in a
geba
nd
No qualifications Lower Higher
Source: 2001 Census Standard Tables, Crown Copyright 2003
Note: Lower level qualifications are equivalent to 'A' level and below and higher level to first degree and above
Figure 3.27 The highest level of qualification for women by age
21.8 24.238.7
66.4
18.0 19.631.2
57.8
16.0 14.526.3
52.0
70.9 59.246.1
21.7
72.058.1
48.5
26.7
71.656.6
50.8
30.8
7.3 16.6 15.2 11.9 10.022.3 20.2 15.5 12.5
28.9 23.0 17.2
0.010.020.030.040.050.060.070.080.090.0
100.0
16-24
25-34
35-49
50-59
16-24
25-34
35-49
50-59
16-24
25-34
35-49
50-59
Wakefield Yorks & Humber England
Perc
enta
ge o
f wom
en in
age
band
No qualifications Lower Higher
Source: 2001 Census Standard Tables, Crown Copyright 2003
Note: Lower level qualifications are equivalent to 'A' level and below and higher level to first degree and above
Key Points
• In Wakefield, at Key Stages 1 and 2 (ages 7 and 11) a significantly higher proportion of boys than girls have Special Educational Needs (SEN). At Key Stages 3 and 4 (ages 14 and 16) fewer boys and girls have a SEN in Wakefield than their counterparts at the regional and national levels.
• In reading and mathematics at age 7 achievement among boys in Wakefield was low in comparison with the Yorkshire and The Humber region and England as a whole.
• Wakefield girls' achievements in tests at ages 11 and 14 are low compared with the national level.
• At age 16, fewer boys (41 per cent) achieved 5 or more good grades than girls (50 per cent). This compares unfavourably with the national averages of 49 per cent for boys and 58 per cent for girls.
• Far fewer boys than girls gained good GCSE grades in English and modern languages, mirroring a national gender gap.
• Boys aged 16-18 achieved lower point scores at 'A' level than girls. Their performance was also worse than the regional and national averages.
• Boys and girls make strongly gendered choices of subject for A level study. In Wakefield's schools, fewer girls chose mathematics and fewer boys chose English, compared to their counterparts in England as a whole.
• In the 'A' level subjects for which they are entered, almost 67 per cent of girls achieved good grades (slightly lower than the natioanl average). Far fewer boys (55 per cent) reached this level of achievement, also a lower percentage compared with 59 per cent of boys across England.
• At the end of compulsory education, more than 1 in 10 boys and girls in Wakefield are listed as not settled, a higher proportion than at the regional and national levels.
• More boys than girls (24 per cent compared with 13 per cent) enter employment at age 16. Boys and girls in Wakefield are more likely to enter employment without training than their regional and national counterparts.
• In Wakefield in 2003, 589 boys and 348 girls left school and entered employment at 16. Most of these young people entered occupations which are typical for their sex. Most boys entered skilled trades or labouring and other elementary occupations. Most girls gained personal service or administrative and clerical jobs.
• Wakefield's men and women are less well qualified than men and women regionally and nationally. Although in part a historical legacy, especially visible amongst older women and men, levels of qualification are also low at younger ages, especially among young men.
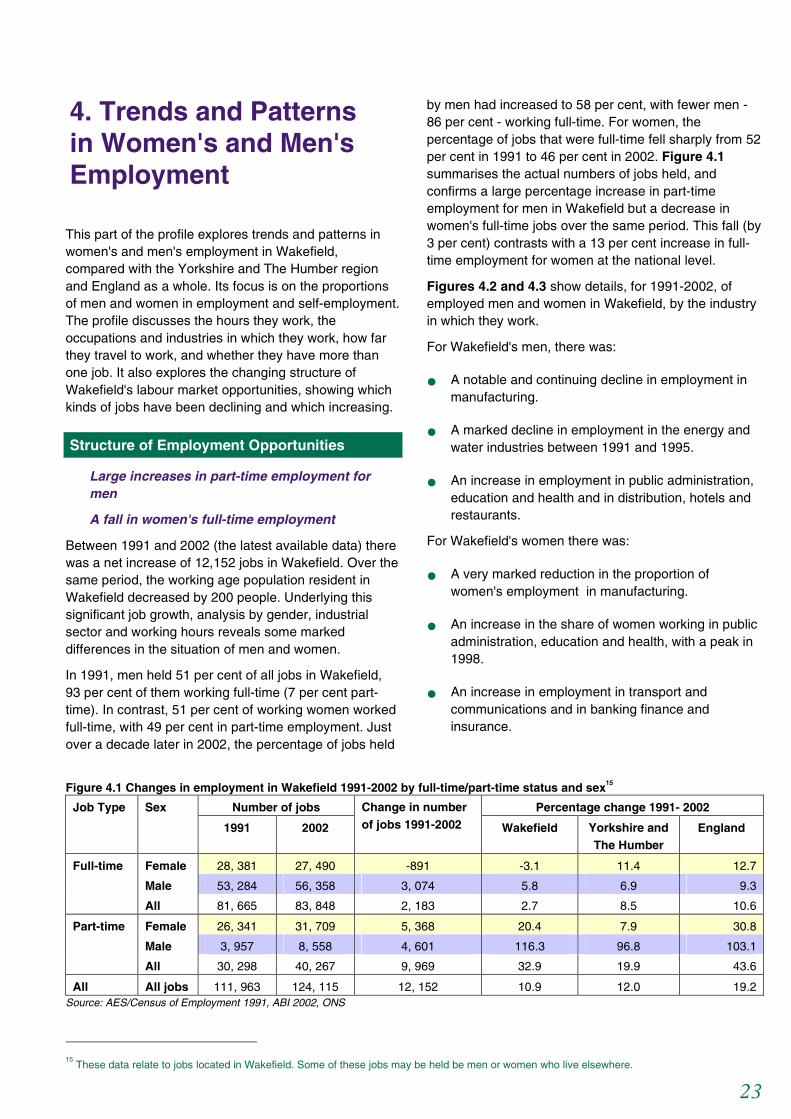
23
4. Trends and Patterns in Women's and Men's Employment
This part of the profile explores trends and patterns in women's and men's employment in Wakefield, compared with the Yorkshire and The Humber region and England as a whole. Its focus is on the proportions of men and women in employment and self-employment. The profile discusses the hours they work, the occupations and industries in which they work, how far they travel to work, and whether they have more than one job. It also explores the changing structure of Wakefield's labour market opportunities, showing which kinds of jobs have been declining and which increasing.
Structure of Employment Opportunities
Large increases in part-time employment for men
A fall in women's full-time employment
Between 1991 and 2002 (the latest available data) there was a net increase of 12,152 jobs in Wakefield. Over the same period, the working age population resident in Wakefield decreased by 200 people. Underlying this significant job growth, analysis by gender, industrial sector and working hours reveals some marked differences in the situation of men and women.
In 1991, men held 51 per cent of all jobs in Wakefield, 93 per cent of them working full-time (7 per cent part-time). In contrast, 51 per cent of working women worked full-time, with 49 per cent in part-time employment. Just over a decade later in 2002, the percentage of jobs held
by men had increased to 58 per cent, with fewer men - 86 per cent - working full-time. For women, the percentage of jobs that were full-time fell sharply from 52 per cent in 1991 to 46 per cent in 2002. Figure 4.1 summarises the actual numbers of jobs held, and confirms a large percentage increase in part-time employment for men in Wakefield but a decrease in women's full-time jobs over the same period. This fall (by 3 per cent) contrasts with a 13 per cent increase in full-time employment for women at the national level.
Figures 4.2 and 4.3 show details, for 1991-2002, of employed men and women in Wakefield, by the industry in which they work.
For Wakefield's men, there was:
• A notable and continuing decline in employment in manufacturing.
• A marked decline in employment in the energy and water industries between 1991 and 1995.
• An increase in employment in public administration, education and health and in distribution, hotels and restaurants.
For Wakefield's women there was:
• A very marked reduction in the proportion of women's employment in manufacturing.
• An increase in the share of women working in public administration, education and health, with a peak in 1998.
• An increase in employment in transport and communications and in banking finance and insurance.
Figure 4.1 Changes in employment in Wakefield 1991-2002 by full-time/part-time status and sex15
Number of jobs Percentage change 1991- 2002 Job Type Sex
1991 2002
Change in number of jobs 1991-2002 Wakefield Yorkshire and
The Humber England
Full-time Female 28, 381 27, 490 -891 -3.1 11.4 12.7
Male 53, 284 56, 358 3, 074 5.8 6.9 9.3
All 81, 665 83, 848 2, 183 2.7 8.5 10.6
Part-time Female 26, 341 31, 709 5, 368 20.4 7.9 30.8
Male 3, 957 8, 558 4, 601 116.3 96.8 103.1
All 30, 298 40, 267 9, 969 32.9 19.9 43.6
All All jobs 111, 963 124, 115 12, 152 10.9 12.0 19.2 Source: AES/Census of Employment 1991, ABI 2002, ONS
15
These data relate to jobs located in Wakefield. Some of these jobs may be held be men or women who live elsewhere.

24
Figure 4.2 Men of working age in employment by industry, Wakefield, 1991-2002
9.74.1 2.6 2.6 2.7 2.4 2.0 2.0 2.0 2.1
28.527.0 27.3 29.4 28.3 28.8 26.7 24.4 24.4 24.4
11.5
10.6 10.0 9.3 9.6 9.6 10.49.5 9.5 9.4
17.221.6 21.9 22.0 22.1 21.5 21.6
22.4 22.4 23.6
8.79.4 10.0 8.4 9.8 9.0 9.2 11.6 11.6 11.7
8.58.5 9.3 9.7 8.6 9.0 9.9 11.0 11.0 9.8
12.5 14.6 14.2 14.1 13.8 15.1 15.5 14.3 14.3 14.8
3.2 3.9 4.5 4.2 4.1 3.8 4.1 4.2 4.2 3.7
0.0
10.0
20.0
30.0
40.0
50.0
60.0
70.0
80.0
90.0
100.0
1991 1993 1995 1996 1997 1998 1999 2000 2001 2002
Per
cent
age
of m
ale
jobs
Agriculture, Forestry & Fishing Energy & Water ManufacturingConstruction Distribution, Hotels & Restaurants Transport & CommunicationsBanking, Finance & Insurance Public Admin., Education & Health Other Services
Source: Census of Employment, AES/ABI 1991, 1993, 1995, 1996-2002 Note: ‘Other’ includes sewage and refuse disposal, activities of membership organisations, recreational, cultural and sporting clubs, private households with employed persons, extra territorial organisations.
Figure 4.3 Women of working age in employment by industry, Wakefield, 1991-2002
17.9 16.2 14.9 14.8 13.9 12.1 11.4 10.5 10.2 8.2
6.33.2 3.9 1.7 1.7 2.1 1.6 1.1 1.3 1.4
28.229.4 29.7 31.4 30.2
26.8 29.0 30.0 30.3 30.0
1.62.1 2.2 2.1 2.3
2.6 2.5 4.3 4.1 4.7
9.18.2 9.9 12.2 11.2
8.8 10.4 13.0 10.3 11.0
31.4 35.4 34.4 32.6 35.642.4 40.0 35.8 38.3 39.7
4.6 5.0 4.6 4.8 4.3 4.5 4.7 4.9 5.1 4.5
0.0
10.0
20.0
30.0
40.0
50.0
60.0
70.0
80.0
90.0
100.0
1991 1993 1995 1996 1997 1998 1999 2000 2001 2002
Per
cent
age
of fe
mal
e jo
bs
Agriculture, Forestry & Fishing Energy & Water ManufacturingConstruction Distribution, Hotels & Restaurants Transport & CommunicationsBanking, Finance & Insurance Public Admin., Education & Health Other Services
Source: Census of Employment, AES/ABI 1991, 1993, 1995, 1996-2002 Note: ‘Other’ includes sewage and refuse disposal, activities of membership organisations, recreational, cultural and sporting clubs, private households with employed persons, extra territorial organisations.

25
Figure 4.4 Change in the number of jobs held between 1991 and 2002 by industry in Wakefield
-6000 -4000 -2000 0 2000 4000 6000 8000 10000
Agriculture, fishingEnergy & water
ManufacturingConstruction
Distribution, hotels, restaurantsTransport, communications
Banking, financePublic admin., education and health
OtherTotal
Agriculture, fishingEnergy & water
ManufacturingConstruction
Distribution, hotels, restaurantsTransport, communications
Banking, financePublic admin., education and health
OtherTotal
Mal
esFe
mal
es
Increase/decrease in the number of jobs held
Full-timePart-time
Source: Census of Employment, AES/ABI 1991, 2002
Figure 4.5 Percentage change in the number of jobs held between 1991 and 2002 by industry in Wakefield
-100 0 100 200 300 400
Agriculture, fishingEnergy & waterManufacturing
ConstructionDistribution, hotels, restaurants
Transport, communicationsBanking, finance
Public admin., education and healthOtherTotal
Agriculture, fishingEnergy & waterManufacturing
ConstructionDistribution, hotels, restaurants
Transport, communicationsBanking, finance
Public admin., education and healthOtherTotal
Mal
esFe
mal
es
Percentage change
Full-timePart-time
Source: Census of Employment, AES/ABI 1991, 2002

26
Data for the Yorkshire and The Humber region and for England as a whole over this period show a similar decline in male manufacturing jobs (from 30 per cent to 24 per cent in the region, 27 per cent to 20 per cent nationally) and an increase in men's employment in distribution, hotels and restaurants (18 per cent to 22 per cent in the region, 19 per cent to 23 per cent in England as a whole). There was also a significant increase in men employed in banking and finance (up from 8 per cent to 15 per cent in the region, and 15 per cent to 21 per cent nationally). In Wakefield, men's employment rose only slightly in this sector from 9 per cent to 10 per cent.
For women in the region and nationally the decline in manufacturing was more pronounced (from 12 per cent to 7 per cent in both the region and in England). Women too have experienced an increase in employment in distribution, hotels and restaurants (25 per cent to 27 per cent in both the Yorkshire and The Humber region and in England). Women's employment in banking and finance increased in Wakefield (9 per cent to 11 per cent), and in the region and England (both 17 per cent to 19 per cent).
Figure 4.4 shows the change in the number of full-time and part-time jobs in Wakefield between 1991 and 2002, by industry and by sex. (Due to the extremely small number of jobs in agriculture data for this industry are excluded from the analysis.) This shows:
• A very significant fall in full-time and part-time jobs in manufacturing for women and in full-time manufacturing jobs for men.
• A fall in construction jobs held by men, (almost all full-time) and women (almost all part-time).
• A strong increase in both full-time and part-time jobs, for men and women, in distribution, hotels and restaurants
• Among women, a significant growth in full-time and part-time jobs in public administration, health and social care, alongside a smaller increase in both full-time and part-time jobs for men in this sector.
Figure 4.5 presents the same data as in Figure 4.4, but this time shows the percentage change in the number of jobs. The large increase in jobs for women in transport and communication needs to be seen in the context of very small numbers at the start of the period. Nevertheless, these are very marked changes, suggesting a very dynamic situation in the Wakefield labour market.
Figures 4.6, 4.7 and 4.8 highlight changes in the numbers of jobs in selected industries in Wakefield in
more detail. There are marked differences in employment patterns between men and women. Figure 4.6 confirms that men working full-time still held the majority of jobs in manufacturing, although their number declined from 16,000 in 1991 to 14,000 in 2002. By 2002, only around 4,000 full-time manufacturing jobs were held by women, with about half of all full-time jobs held by women lost between 1991 and 2002, a loss of almost 4,000 posts.
Figure 4.6 Change in the number of jobs in manufacturing, by employment status and sex, 1991-2002
0
2,000
4,000
6,000
8,000
10,000
12,000
14,000
16,000
18,000
1991 1992 1993 1994 1995 1996 1997 1998 1999 2000 2001 2002
Num
ber o
f job
s
Male full-time Male part-time Female full-time Female part-time
Source: Census of Employment, AES 1991, 1993, 1995, 1996-2002
Figure 4.7 shows the continuous strong increase in men's full-time employment in transport and communications. Men's part-time opportunities also increased steadily, although men still held fewer than 1,000 part-time jobs in this sector by 2002. Both part-time and full-time jobs held by women in this area increased slightly over the same period.
Figure 4.7 Change in the number of jobs transport and communications, by employment status and sex, 1991-2002
0
1,000
2,000
3,000
4,000
5,000
6,000
7,000
8,000
1991 1992 1993 1994 1995 1996 1997 1998 1999 2000 2001 2002
Num
ber o
f job
s
Male full-time Male part-time Female full-time Female part-time
Source: Census of Employment, AES 1991, 1993, 1995, 1996-2002
Figure 4.8 shows the changes in employment in public administration, education and health. While women, both full-time and part-time, held the majority of jobs, full-time employment in this sector showed some volatility for both men and women. Note the particularly dynamic picture for part-time jobs held by women. Their number soared after 1997, reaching numbers above that of female full-timers, totalling some 12,000 female jobs by 2002.

27
Figure 4.8 Change in the number of jobs in public administration, education and health, by employment status and sex, 1991-2002
0
2,000
4,000
6,000
8,000
10,000
12,000
14,000
1991 1992 1993 1994 1995 1996 1997 1998 1999 2000 2001 2002
Num
ber o
f job
s
Male full-time Male part-time Female full-time Female part-time
Source: Census of Employment, AES 1991, 1993, 1995, 1996-2002
People and Employment
In Wakefield a high proportion of young men and women are economically active
The 2001 Census showed 100,060 men and 93,660 women of working age in Wakefield, of whom 79 per cent of men and 69 per cent of women were economically active (either in employment, economically active students or unemployed)16. Economic activity is lower for both sexes in Wakefield than in the region and England, and varies by age, as can be seen in Figure 4.9. Higher economic activity rates among 16-24 year olds, as in Wakefield, reflect low numbers of students, and should not necessarily be seen as a positive indicator.
Figure 4.9. Percentage of men and women of working age who are economically active
Economically active (%)
Age group Wakefield Yorks &
Humber
Englan
d
Men 16-24 74.8 67.5 68.3
25-34 90.9 90.5 91.0 35-49 87.6 89.5 90.2 50-64 61.9 69.7 72.8
Working age 79.1 80.3 81.9
Women 16-24 64.0 59.4 62.1
25-34 72.8 72.6 73.7 35-49 75.9 76.6 75.8 50-59 58.6 63.9 65.3
Working age 69.3 69.6 70.6
Source: 2001 Census Standard Tables, Crown copyright 2003
16
The data in this section, drawn from the Census, relate to the population resident in Wakefield, some of whom will work in other areas.
Employment Status
Many self-employed men in Wakefield have low or no qualifications
In Wakefield, 72,160 men and 59,545 women of working age were in employment in 2001. More men were full-time employees in Wakefield (59 per cent) than in the Yorkshire and The Humber region (57 per cent) or nationally (58 per cent). For women in Wakefield, 34 per cent worked full-time, a similar figure to that in the region but lower than in England as a whole (36 per cent). This is illustrated in Figure 4.10, which also shows that in Wakefield:
• despite the big increase in part-time jobs, few men of working age worked part-time (4 per cent compared with 5 per cent in the region and in England as a whole)
• more women were employed part-time in Wakefield than in the Yorkshire and The Humber region and in England as a whole
• fewer men and women were self-employed (10 per cent of men and 3 per cent of women) than in the Yorkshire and The Humber region (12 per cent and 4 per cent) and nationally (13 per cent and 5 per cent)
Figure 4.10. People of working age by employment status
59.3
33.6
56.9
33.2
57.8
36.4
8.5
1.9
10.2
2.4
11.5
2.6
3.2
26.6
3.6
25.7
3.4
22.9
1.4
1.51.2 1.7
2.31.9
0.0
10.0
20.0
30.0
40.0
50.0
60.0
70.0
80.0
Males Females Males Females Males Females
Wakefield Yorks & Humber England
Perc
enta
ge o
f peo
ple
of w
orki
ng a
ge
Employed full-time Self-employed full-time Employed part-time Self-employed part-time
Source: 2001 Census Standard Tables, Crown Copyright 2003
Figure 4.11 shows that the proportion of people who work part-time also varies significantly with age, with more young men (16-24) and older men (50 to retirement age) working part-time, and more women aged 35 to retirement age working part-time. In Wakefield, the highest proportion of part-time working is seen in women aged 50 to retirement age, which is the same as in the region and nationally.

28
Figure 4.11 Men and women in employment who work part-time, by age
0.0
10.0
20.0
30.0
40.0
50.0
60.0
16-2
4
25-3
4
35-4
9
50-R
A
WA
16-2
4
25-3
4
35-4
9
50-R
A
WA
16-2
4
25-3
4
35-4
9
50-R
A
WA
Wakefield Yorks & Humber EnglandPerc
enta
ge o
f em
ploy
ed p
eopl
e w
ho w
ork
part-
time
Males Females
Source: 2001 Census Standard Tables, Crown copyright 2003
Figure 4.12 refers to men and women who are self-employed. It shows that the majority of self-employed men, across all geographical levels, are self-employed full-time, without employees. The majority of self-employed women in the region and England are also self-employed without employees but many more work part-time. In Wakefield 31 per cent of self-employed women are self-employed full-time with employees.
Figure 4.12 Self-employed men and women by full and part-time working and employees
Percentage of all men and women who are self-employed
Self employed
with employees
Self employed
without employees
Area
Part-time
Full-time
Part-time
Full-time
Males 2.1 37.0 9.9 51.0 Wakefield
Females 14.2 30.8 27.6 27.4
Males 2.5 36.2 10.3 51.1 Yorkshire
& Humber Females 13.3 27.9 31.1 27.7
Males 2.2 33.6 10.6 53.5 England
Females 11.6 23.5 35.2 29.7 Source: 2001 Census Standard Tables, Crown Copyright 2003
The variation in self-employment by age is shown in Figure 4.13 In Wakefield the peak age for self-employment among men is 50 to retirement age, which is the same as in the region and England. A similar, but less pronounced, pattern is seen in self-employed women.
Figure 4.13 Men and women who are self-employed by age
0.0
2.0
4.0
6.0
8.0
10.0
12.0
14.0
16-24
25-34
35-49
50-RA
16-24
25-34
35-49
50-RA
16-24
25-34
35-49
50-RA
Wakefield Yorks & Humber EnglandPerc
enta
ge o
f sel
f-em
ploy
ed p
eopl
e in
age
band
Males Females
Source: 2001 Census Standard Tables, Crown Copyright 20031
Figure 4.14 shows the proportion of people of working age who work part-time by whether they are employees or self-employed. For both men and women, self-employed people are more likely to work part-time than employees, at the regional and national levels, although in Wakefield more women employees than self-employed women work part-time.
Figure 4.14 Employees and self-employed men and women of working age who work part-time
0.0
10.0
20.0
30.0
40.0
50.0
Males Females Males Females Males Females
Wakefield Yorks & Humber England
Perc
enta
ge o
f em
ploy
ees
and
self-
empl
oyed
peo
ple
Employee - Part-time Self-employed - Part-time
Source: 2001 Census Standard Tables, Crown Copyright 2003
The 2001 Census gives information about the level of qualification of employees and those who are self-employed. This is shown in Figure 4.15. In Wakefield, a very high proportion of self-employed men have no qualifications (47 per cent) compared with self-employed men in the region (41 per cent) and England as a whole (36 per cent). Few men and women employees, or self-employed men and women, in Wakefield are qualified to degree level and above.

29
Figure 4.15 Employees and self-employed men and women of working age by qualification level
0.0
10.0
20.0
30.0
40.0
50.0
60.0
Empl
oyee
Self-
empl
oyed
Empl
oyee
Self-
empl
oyed
Empl
oyee
Self-
empl
oyed
Empl
oyee
Self-
empl
oyed
Empl
oyee
Self-
empl
oyed
Empl
oyee
Self-
empl
oyed
Males Females Males Females Males Females
Wakefield Yorks & Humber England
Perc
enta
ge o
f peo
ple
in e
mpl
oym
ent
No qualifications Lower level Higher level
Source: 2001 Census Standard Tables, Crown Copyright 2003
Working Hours
Figure 4.16 illustrates the long working hours of men. Men of working age in Wakefield work very long hours, with 54 per cent working between 38-48 hours per week, a higher proportion than in both the Yorkshire and The Humber region (52 per cent) and in England (52 per cent). 23 per cent of Wakefield men work above the threshold of 48 hours, including 9 per cent who work over 60 hours per week, a figure similar to those for the region (10 per cent) and England (9 per cent).
Figure 4.16 People of working age in employment by hours worked and sex
0.0
10.0
20.0
30.0
40.0
50.0
60.0
Wakefield Yorks &Humber
England Wakefield Yorks &Humber
England
Males Females
Perc
enta
ge o
f em
ploy
ed p
eopl
e of
wor
king
age
1-5 hours 6-15 hours 16-30 hours 31-37 hours38-48 hours 49-59 hours 60+ hours
Source: 2001 Census Standard Tables, Crown copyright 2003
Women in Wakefield work shorter hours, with 12 per cent working fewer than 15 hours, and 32 per cent working 16 to 30 hours per week, a similar picture to that in the region and in England. Fewer women in Wakefield work over 48 hours (5 per cent) than in the Yorkshire and The Humber region (6 per cent) or England (7 per cent).
Young men in Wakefield work longer hours than in the region and nationally. Just 20 per cent of 16-24 year olds work 30 hours or less per week, compared with 22 per cent in the region and 23 per cent in England, and 10 per cent work over 48 hours (10 per cent in the region and 11 per cent in England).
Older men in Wakefield also work longer hours, with just 10 per cent of men aged 50 to 64 working less than 30 hours per week (11 per cent in both the region and in England) and 25 per cent working over 49 hours per week (25 per cent in the region and 26 per cent nationally).
Women in Wakefield work shorter hours than men. However young women aged under 25 work longer hours than older women. About 59 per cent of them work between 31-48 hours, compared with 46 per cent of women aged 35 to 49 and 42 per cent of women over 50. A similar pattern is seen in the region and nationally, although only 57 per cent of young women in the region (and 59 per cent nationally) work 31-48 hours per week. Fewer young women in Wakefield work 30 hours or less per week (38 per cent) compared with those in the region (41 per cent) and in England (38 per cent).
Comparing the data from the 1991 and 2001 Censuses17, it is possible to look at the change in working hours over that period. This is shown in Figure 4.17. There was a fall in the proportion of men working more than 31 hours per week (4 per cent in Wakefield,and about 5 per cent in the region and in England). For women, there was a drop in the proportions working more than 31 hours per week and working 1-15 hours per week. Both of these changes were greater in Wakefield than in the region and nationally, and consequently there was a significant rise (over 4 per cent) in the proportion of women in Wakefield working 16-30 hours per week compared with the region (nearly 4 per cent) and England as a whole (3 per cent).
Figure 4.17 Change in men's and women's weekly working hours 1991 to 2001
-6.0
-5.0
-4.0
-3.0
-2.0
-1.00.0
1.0
2.0
3.0
4.0
5.0
Males Females Males Females Males Females
Wakefield Yorks & Humber England
Cha
nge
in p
erce
ntag
e 19
91-2
001
1-15 hours16-30 hours31+ hours
Source: 1991Census LBS, Crown Copyright 1993, 2001 Census Standard Tables, Crown copyright 2003
17
Source: 1991 Census LBS, Crown Copyright 1993. 2001 Census Standard Tables, Crown Copyright 2003.

30
Travel to Work
In Wakefield a high proportion of men travel to work by car
A large minority of women walk to work
Figure 4.18 shows the mode of travel to work by men and women of working age. In Wakefield:
• Fewer men and women work at home, compared with the Yorkshire and The Humber region and England.
• More men drive to work, 67 per cent compared with 62 per cent in the Yorkshire and The Humber region and 59 per cent in England.
• Fewer men, but more women, walk to work (7 per cent of men and 16 per cent of women) compared with 8 per cent and 15 per cent in the region and 7 per cent and 13 per cent in England.
• Proportionally fewer men and women cycle to work
Figure 4.18 Men's and women's travel to work by method of travel
7.9 5.4 9.4 6.6 9.7 7.73.1 3.34.7 3.85.9 13.8 7.1 14.55.0 10.5
66.6 51.2 61.8 50.5 58.7 51.3
6.710.4
5.98.9
4.9 7.4
2.40.4
3.72.0
3.8 1.66.5 15.5 7.7 14.5 7.1 13.22.3 1.2 2.6 1.1 2.9 1.1
1.8 2.1 1.41.6
0.010.0
20.030.0
40.0
50.0
60.070.0
80.090.0
100.0
Males Females Males Females Males Females
Wakefield Yorks & Humber EnglandPerc
enta
ge o
f em
ploy
ed p
eopl
e of
wor
king
age
Home Underground/metro TrainBus Driving PassengerBicycle On foot Other
Source: 2001 Census Standard Tables, Crown copyright 2003
There are significant differences in the way men and women travel to work, and women continue to work closer to home. 14 per cent of women in Wakefield go to work by bus (compared with 6 per cent of men), 10 per cent of women travel as passengers in cars (compared with 7 per cent of men) and 16 per cent of women walk to work. Fewer women drive to work, 51 per cent compared with 67 per cent of men, although in Wakefield slightly more women travel to work by train 2.1 per cent (compared with 1.8 per cent of men).
Young people tend to travel to work by public transport. In Wakefield, 20 per cent of men and a third of women (33 per cent) aged under 25 travel by bus, train or underground. This compares with just 8 per cent of men,
and with 14 per cent of women aged 25-34, 4 per cent of men and 12.5 per cent of women aged 35-49, and 4 per cent of men and 14 per cent of women over 50. Young people are also the most likely to travel to work as passengers, 17 per cent of men and 16 per cent of women aged under 25, compared with 7 per cent of men and 9 per cent of women aged 25-34.
In Wakefield, only 12 per cent of young men and 15 per cent of young women walk to work, compared with much higher figures in the region (17 per cent and 18 per cent) and in England as a whole (15 per cent and 18 per cent).
71 per cent of men over 50 drive to work, compared with only 40 per cent of men under 25. This is considerably higher than the figures for older men in the region (66 per cent) and England (64 per cent).
Comparison of data from the 1991 and 2001 Censuses18 shows the change in method of travel to work by people of working age. In Wakefield, there was a big increase (12 per cent) in women driving to work, and a fall in travelling to work by train, bus, as a passenger in a car or on foot. By contrast, fewer men drove to work in 2001 (1 per cent fewer). More men and women, at all geographical levels, worked at home in 2001.
Figure 4.19 shows the estimated distance travelled to work. Men in Wakefield tend to travel longer distances to work, with 41 per cent working 5-20km away from home, compared with 35 per cent in the region and 34 per cent in England. 13 per cent of men work more than 20km away, compared with 14 per cent in the region and 16 per cent in England.
Women in Wakefield tend to work closer to home, 27 per cent of them working within 2km, compared with just 15 per cent of men. However, in Wakefield fewer women than men work at home (5 per cent compared with 8 per cent) and fewer women work at home than in the region (7 per cent) and in England (8 per cent). Fewer women in Wakefield travel over 20km to work (6 per cent) than in the Yorkshire and The Humber region (7 per cent) and England (9 per cent).
18
Source: 1991 Census LBS, Crown Copyright 1993. 2001 Census Standard Tables, Crown Copyright 2003.

31
Figure 4.19 Distance (km) travelled to work by people of working age, by sex
7.9
5.4
9.4
6.6
9.7
7.7
14.9
27.0
16.0
26.0
15.4
25.1
17.5
23.5
20.6
25.4
17.7
23.0
41.4
36.8
34.7
33.0
34.0
33.4
9.0
4.6
7.9
5.0
9.4
5.9
5.7
6.6
5.2
5.8
7.2
3.0
2.6
1.5
4.1
1.8
1.5
1.2
0.0 20.0 40.0 60.0 80.0 100.0
Males
Females
Males
Females
Males
Females
Wak
efie
ldYo
rks
&H
umbe
rEn
glan
d
Percentage of people of working age in employment
Home <2km 2-5km 5-20km 20-40km 40+km Other
Source: 2001 Census Standard Tables, Crown copyright 2003 Note: Distance travelled to work is estimated as a straight line between home and workplace postcodes
Men under 25 in Wakefield are more likely to work within 5km of home (43 per cent), compared with around 30 per cent of older men. This figure is much lower than for men under 25 in the Yorkshire and The Humber region (49 per cent) and in England (47 per cent).
Like young men in Wakefield, fewer young women work within 5km of home (49 per cent) compared with the region (55 per cent) and England (53 per cent).
In Wakefield the proportion of women aged 16-34 who work within 2km of home (around 22-24 per cent) is considerably lower than for women aged 35 to 49 (29 per cent). This differs a little from the patterns at regional and national levels.
Occupation and Industry
In Wakefield many men are employed in skilled trades, and as process, plant and machine operatives
A high proportion of women work in administrative and secretarial occupations and in elementary jobs
Figure 4.20 shows gendered occupational distribution. Men in Wakefield work mainly in skilled trades (21 per cent); process, plant and machine operations (18 per cent) and in elementary occupations (16 per cent). Whereas many women work in administration and secretarial (21 per cent); sales and customer service (14 per cent) and in elementary occupations (17 per cent).
Slightly more men work in elementary occupations in Wakefield (16 per cent) compared with the region (13 per cent) and England (12 per cent). In Wakefield fewer men are professionals, 8 per cent compared with 10 per cent in the region and 12 per cent in England.
About 35 per cent of women in Wakefield work in sales and customer services and administration and secretarial occupations, as in the region and in England as a whole. Fewer women in Wakefield work as managers, senior officials, professionals, associate professionals and in technical occupations, a total of 28 per cent compared with 32 per cent in the region and 36 per cent in England.
In Wakefield the proportion of men working in skilled trades fell from 28 per cent in 1991 to 21 per cent in 200119. There was also a small drop in the proportion of men employed as process, plant and machine operatives (19 per cent in 1991 to 18 per cent in 2001). Over the same period there was also a fall in the proportion of men working in the skilled trades in the region and in England as a whole (25 per cent to 21 per cent in the region and 25 per cent to 19 per cent in England).
19
Source: 1991 Census LBS, Crown Copyright 1993. 2001 Census Standard Tables, Crown Copyright 2003.
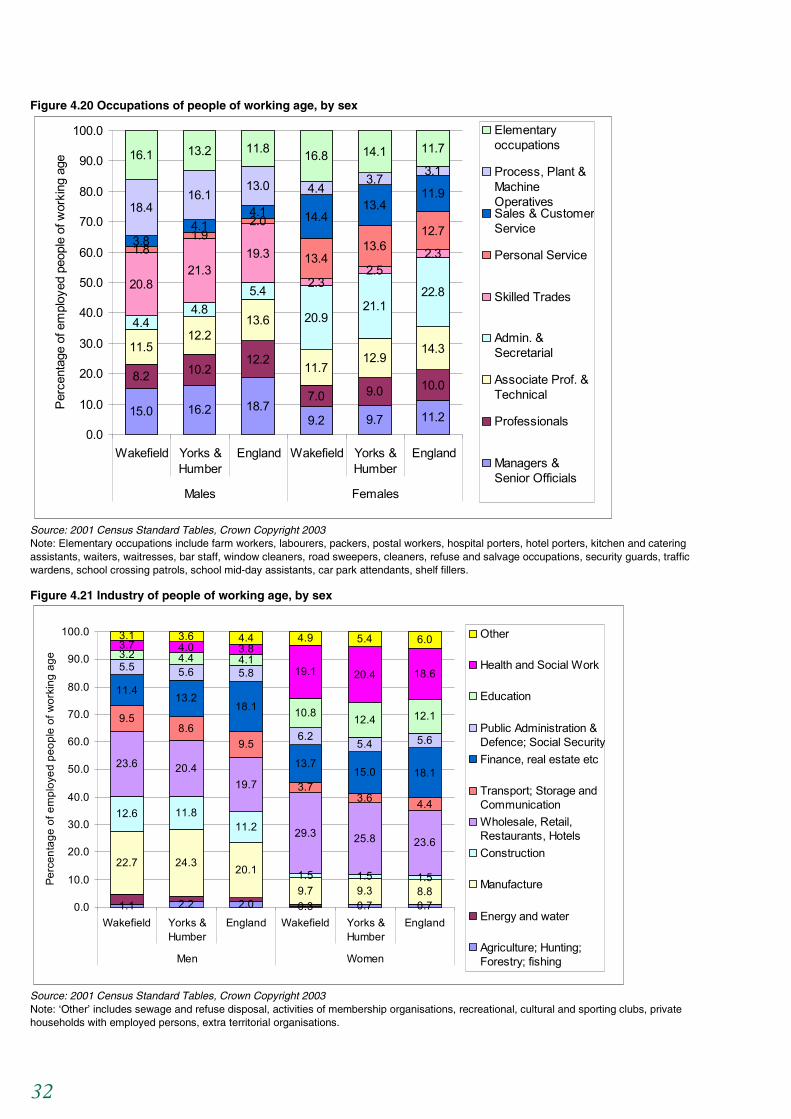
32
Figure 4.20 Occupations of people of working age, by sex
15.0 16.2 18.79.2 9.7 11.2
8.2 10.212.2
7.0 9.0 10.0
11.512.2
13.6
11.712.9
14.3
4.44.8
5.4
20.921.1
22.820.821.3
19.3
2.32.5
2.31.81.9
2.0
13.413.6
12.73.8
4.14.1 14.4
13.411.9
18.416.1
13.0 4.43.7 3.1
16.1 13.2 11.8 16.8 14.1 11.7
0.0
10.0
20.0
30.0
40.0
50.0
60.0
70.0
80.0
90.0
100.0
Wakefield Yorks &Humber
England Wakefield Yorks &Humber
England
Males Females
Perc
enta
ge o
f em
ploy
ed p
eopl
e of
wor
king
age
Elementaryoccupations
Process, Plant &MachineOperativesSales & CustomerService
Personal Service
Skilled Trades
Admin. &Secretarial
Associate Prof. &Technical
Professionals
Managers &Senior Officials
Source: 2001 Census Standard Tables, Crown Copyright 2003
Note: Elementary occupations include farm workers, labourers, packers, postal workers, hospital porters, hotel porters, kitchen and catering assistants, waiters, waitresses, bar staff, window cleaners, road sweepers, cleaners, refuse and salvage occupations, security guards, traffic wardens, school crossing patrols, school mid-day assistants, car park attendants, shelf fillers.
Figure 4.21 Industry of people of working age, by sex
1.1 2.2 2.0 0.3 0.7 0.7
22.7 24.3 20.1
9.7 9.3 8.8
12.6 11.811.2
1.5 1.5 1.5
23.6 20.419.7
29.3 25.8 23.6
9.58.6
9.5
3.73.6 4.4
11.413.2
18.1
13.715.0 18.1
5.5 5.6 5.8
6.25.4 5.6
3.2 4.4 4.1
10.8 12.4 12.1
3.7 4.0 3.8
19.1 20.4 18.6
3.1 3.6 4.4 4.9 5.4 6.0
0.0
10.0
20.0
30.0
40.0
50.0
60.0
70.0
80.0
90.0
100.0
Wakefield Yorks &Humber
England Wakefield Yorks &Humber
England
Men Women
Perc
enta
ge o
f em
ploy
ed p
eopl
e of
wor
king
age
Other
Health and Social Work
Education
Public Administration &Defence; Social SecurityFinance, real estate etc
Transport; Storage andCommunicationWholesale, Retail,Restaurants, HotelsConstruction
Manufacture
Energy and water
Agriculture; Hunting;Forestry; fishing
Source: 2001 Census Standard Tables, Crown Copyright 2003 Note: ‘Other’ includes sewage and refuse disposal, activities of membership organisations, recreational, cultural and sporting clubs, private households with employed persons, extra territorial organisations.

33
Over the same period, there was a fall in the proportion of women working in administrative and secretarial occupations (down from 24 per cent to 21 per cent in Wakefield, 25 per cent to 21 per cent in the region and 29 per cent to 23 per cent nationally).
Figure 4.21 shows the industry in which people worked in 2001, with again marked differences between men and women. In Wakefield, more men worked in construction (13 per cent) and in transport, storage and communication (10 per cent) than in the region or in England as a whole. A high proportion of women in Wakefield worked in wholesale, retail, hotels and restaurants (29 per cent compared with 26 per cent in the region and 24 per cent England).
Between 1991 and 200120 there was a fall in the proportion of men employed in manufacturing (from 26 per cent to 23 per cent in Wakefield, 26 per cent to 24 per cent in the region and 27 per cent to 20 per cent in England) and an increase in men working in wholesale, retail, hotels and restaurants (up from 18 per cent to 24 per cent in Wakefield). The proportion of men employed in finance and real estate went up from 6 per cent to 11 per cent in Wakefield, 10 per cent to 13 per cent in the region and 12 per cent to 18 per cent in England. The proportion of women in this sector also rose from 9 per cent to 14 per cent between 1991 and 2001, compared with from 10 per cent to 14 per cent in the region, and from 14 per cent to 18 per cent in England.
Second Jobs
The census data relates to the main job that men and women are employed in. A major limitation of this source is that it does not collect information about men and women who have more than one job. Estimates for the number of people with a second job can be obtained from the Labour Force Survey (LFS), a sample survey which is carried out annually. This shows that in Wakefield in 2002/2003, 3.1 per cent of people had a second job21. In Yorkshire and The Humber 2.9 per cent of men and 6.1 per cent of women had a second job and in England as a whole the figures were 3.1 per cent of men and 5.4 per cent of women.
20
Source: 1991 Census LBS, Crown Copyright 1993. 2001 Census Standard Tables, Crown Copyright 2003. 21
This figure cannot be disaggregated by sex at district level for some districts.
Key Points
• Between 1991 and 2002 there was a net increase of just over 12,150 jobs in Wakefield. This varied from a 6 per cent increase in male full-time jobs, a 116 per cent increase in male part-time jobs, a 3 per cent loss of female full-time jobs and a 20 per cent increase in female part-time jobs.
• Between 1991 and 2002 about 2,000 male jobs and nearly 5,000 female jobs in manufacturing were lost in Wakefield. There was also an 8 per cent decrease in jobs in energy and water.
• More than 8,000 new jobs were created in distribution, hotels and restaurants. More of the new full-time jobs went to men, and more of the part-time jobs to women.
• New jobs were also created in Wakefield in banking and finance and in transport and communications. Women mostly gained part-time jobs in these sectors, while the majority of new jobs taken by men were full-time.
• A relatively low proportion of women aged 50-59 in Wakefield and a high proportion of both men and women aged 16-24 are economically active.
• In Wakefield, comparatively high percentages of male and female employees and of self-employed men and women have no qualifications.
• Men in Wakefield work longer hours than their counterparts in the region and nationally.
• Between 1991 and 2001 there was a 1 per cent drop in the proportion of men driving to work in Wakefield, compared with a 12 per cent increase in the proportion of women travelling to work by car.

34
5. The Gender Pay Gap
In the last few years, renewed attention has been given to the continuing 'gender pay gap' in the UK, which has persisted despite the introduction of the Equal Pay Act 1970 (implemented from 1975 onwards), and which is still very wide by comparison with most other European countries. A number of major national reports have recently reviewed the evidence on this question, and have confirmed that there is an entrenched problem in the UK, which is damaging not only for the individual wage earners affected, but also for organisations and businesses, and for the country as a whole. The boxes alongside include quotations from three important reports which have recently been commissioned or supported by central government departments and bodies, highlighting key issues.
This part of the profile provides for the first time details about this question at district and regional level, indicating the extent to which this problem is of concern in Wakefield.
Women's Incomes over the Lifetime22
"About half of the gender earnings gap is explained by the fact that married, childless women work fewer hours over their lifetimes than comparable men; about half is due to the hourly pay gap between men and women. The size of the gender earnings gap also varies by educational level, with low- and mid-skilled women losing out most, but even highly-skilled women (graduates) experience a lifetime earnings gap of £143,000. In addition to the gender earnings gap, women who have children experience a ‘mother gap’ which represents the difference in lifetime earnings between equivalently educated women with and without children. For two children these figures are: low-skilled women, £285,000; mid-skilled women, £140,000; and high-skilled women, £19,000. High-skilled mothers forgo less income than low- or mid-skilled mothers as they tend to retain their place in the labour market. However, this does not recognise any childcare costs they may incur. Delaying childbirth has a significant, positive impact on lifetime earnings. It is estimated that a mid-skilled woman who starts her family at 24 and has two children forgoes more than twice as much as if she started her family at 30."
22
Rake, K. (2001) Women's Incomes over the Lifetime. London: The Stationary Office
The Kingsmill Review 200123
"The 18 per cent headline wage gap is an indicator of the extent to which businesses and organisations in the UK are mismanaging their human capital…. Clustering of women in lower status and lower paid jobs … suggests that businesses are failing to properly develop and utilise the skills and talents of women."
"Most organisations think there is no gender pay gap in their organisation, but they have no evidence to support this."
"When considering full-time employees, the worst industries were financial intermediation (65 per cent), the electricity, gas and water supply industry (69 per cent), and agriculture, hunting and forestry, etc. (73 per cent). Additionally, there were variations between the public and the private sector. The gender pay gap for full-time employees was smaller in the public sector than in the private sector, with the ratio of women’s earnings at 86 per cent in the public sector compared to 78 per cent in the private sector. However, when comparing the pay of male and female part-timers, the gap was wider in the public sector. Female part-timers earned 75 per cent of male counterparts in the public sector, compared with 99 per cent in the private sector."
NIESR Report 200124
"In spite of legislation aimed at securing equal pay and employment opportunities for women, the gender pay gap has persisted into the twenty-first century. .. The position of women who work full-time has improved compared with that of men, with the gender pay gap falling from 36 per cent of the full-time male wage in 1973 to 18 per cent in 2000."
23
Kingsmill, D. (2001), The Kingsmill Review of Women's Pay and Employment, London, DTI 24
Anderson, T., Forth, J., Metcalf, H. and Kirby, S. (2001) The Gender Pay Gap: final report to DfEE London, National Institute for Economic and Social Research.

35
Causes of the Gender Pay Gap
This part of the profile explores the patterns in the gross weekly and hourly pay of people in Wakefield, compared with the Yorkshire and The Humber region and England as a whole.
One of the causes of the gender pay gap is gender segregation in the labour market. Women and men tend to work in different occupations, or are concentrated at different levels within occupational hierarchies. Jobs in which men predominate tend to be better paid, and often offer bonuses and pay incentives which are less common in jobs where most employees are women. Data on the segregation of women and men by occupation and industrial structure were presented in Chapter 4, and for Wakefield showed significant differences.
The impact of women's family and care responsibilities and inadequacies in the supporting services available, especially in some localities, are also important. The gendered impact of these factors is discussed in Chapters 6 and 8 on 'Unemployment and Economic Inactivity' and on 'Work-Life Balance'. Not only do these factors influence women's choice of jobs/careers, they can also affect the number of hours they are able to work, and the distance they are prepared to travel to their place of work. The differences in the way men and women in Wakefield travel to work have already been discussed in Chapter 4.
Interrupted employment patterns and part-time working are also strongly linked to women's lower lifetime
earnings, as shown in the government's report, "Women's Earnings over the Lifetime", published by the Cabinet Office in 2000. Breaks in employment and changes of employer can also lead to women being placed lower on pay scales when returning to work following a period of childcare or caring.
Furthermore, much part-time work is low paid. Women often work part-time in mid-career while male part-time workers are often students or older men who are exiting the labour market. Rapid changes in the proportion of women returning to employment after maternity leave may affect this situation for today's younger women.
Pay systems can also contribute to the gender pay gap. Job grading practices, appraisal systems, reward schemes, individualised wage negotiation practices and retention measures have all been found to have an adverse effect on women's wages.
Pay in Wakefield
In Wakefield, hourly pay is lower for both men and women than in England as a whole
Figure 5.1 shows gross weekly and hourly pay for men and women in Wakefield, the Yorkshire and The Humber region, and England as a whole, together with the number of hours they work each week. While the average full-time male worker in England earned £13.10 per hour, and those in the Yorkshire and The Humber region earned £11.24 per hour, men in full- time employment in Wakefield earned only £10.98.
Figure 5.1. Gross weekly pay, hourly pay and the total hours worked for all workers and for those who work full-time
Area Gross Weekly Pay (£) Hourly pay including overtime (£)
Total hours worked weekly (hrs)
Males Females Males Females Males Females
Wakefield All 436.24 247.08 10.89 8.52 40.2 30.3
Full-time 459.79 340.14 10.98 9.16 41.9 37.1
Part-time ** 126.59 ** 6.82 ** 20.5
All 442.47 262.16 11.12 ** 40.2 29.7
Full-time 467.63 357.68 11.24 ** 41.5 37.4
Yorkshire and The Humber
Part-time ** 144.49 ** 7.33 19.5 20.0
England All 503.00 297.00 12.90 10.00 39.1 30.1
Full-time 535.00 402.00 13.10 10.70 40.9 37.4
Part-time 169.11 151.40 9.05 7.86 18.9 19.5 Source: New Earnings Survey 2003, Crown Copyright 2004
25
Note: ** Missing values are based on very small numbers of people and therefore cannot be included, as such data is not reliable in the statistical sense.
25
The New Earnings Survey is based on a 1% sample of employees in employment. These data relate to people who are resident in Wakefield.

36
Women at all geographical levels earned much less than their male counterparts, and women in full-time employment in Wakefield earned less than comparable women nationally, just £9.16 per hour. However, women employed part-time were paid even less, £6.82 per hour, compared with their counterparts in the region (£7.33 per hour) and in England (£7.86 per hour).
Average weekly pay is affected by the hours that men and women work. Normal basic hours of work across both full-time and part-time employment averaged 40.2 each week for men, and 30.3 per week for women in Wakefield. This is similar to men and women in the region (40.2 and 29.7 hours per week) and England as a whole (39.1 and 30.1 hours per week). Although the number of hours worked each week is similar at all geographical levels, low hourly pay in Wakefield contributes to lower gross weekly pay. This is shown in Figure 5.1. Men and women in Wakefield earned less than their counterparts in the region and England, with women earning less than men.
Figures 5.2 - 5.6 show women's weekly pay as a ratio of men's weekly pay in selected occupations. In these figures, equal pay exists if the bar is at 1.00. Bars below 1.00 indicate that in that occupation on average women's pay is only a proportion of that of men. Bars above 1.00 indicate that women are earning more than men.
Pay data for all occupations (Figure 5.2) show that patterns of pay in Wakefield vary only slightly from the regional and national pictures. In all categories of employment women earn less than men.
Figure 5.2 Gross weekly pay ratios - All occupations
0.000.100.200.300.400.500.600.700.800.901.00
Female/Male FFT/MFT FPT/MPT FPT/MFT
Wakefield Yorkshire & Humber England
Source: New Earnings Survey, 2003
The pay data for different occupations show that women and men come closest to equal pay in administrative and secretarial occupations, as shown in Figure 5.3. Men in this occupation tend to be paid low wages, like women. In this occupation, women earned more than men in Wakefield in part-time employment. This is also consistent with the regional and national pattern.
Figure 5.3 Gross weekly pay ratios - Administrative and secretarial occupations
0.00
0.20
0.40
0.60
0.80
1.00
1.20
1.40
Female/Male FFT/MFT FPT/MPT FPT/MFT
Wakefield Yorkshire & Humber England
Source: New Earnings Survey, 2003
Figure 5.4 Gross weekly pay ratios - Personal services
0.00
0.20
0.40
0.60
0.80
1.00
1.20
Female/Male FFT/MFT FPT/MPT FPT/MFT
Wakefield Yorkshire & Humber England
Source: New Earnings Survey, 2003
Note: Missing 'bars' occur where data are based on very small numbers of people and therefore cannot be included
Figure 5.5 Gross weekly pay ratios - Sales and customer service occupations
0.00
0.20
0.40
0.60
0.80
1.00
1.20
Female/Male FFT/MFT FPT/MPT FPT/MFT
Wakefield Yorkshire & Humber England
Source: New Earnings Survey, 2003
Note: Missing 'bars' occur where data are based on very small numbers of people and therefore cannot be included
In Wakefield the gender pay gap is larger than the national average among managers and senior professionals (Figure 5.6). Full-time women in Wakefield in this occupation earned less than 70 per cent of full-time men. In personal services (Figure 5.4) and in sales (Figure 5.5) it can be seen that, in Wakefield, women full-time employees earned only about 80 per cent as much as male full-time employees.
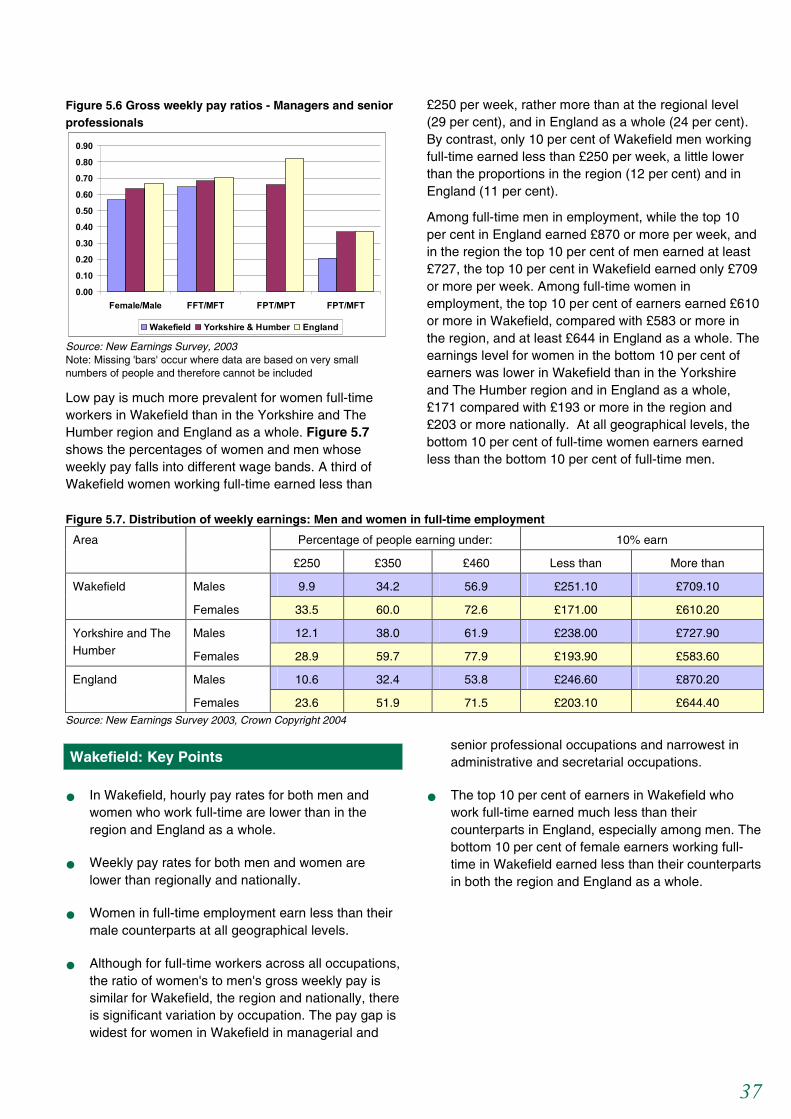
37
Figure 5.6 Gross weekly pay ratios - Managers and senior professionals
0.00
0.10
0.20
0.30
0.40
0.50
0.60
0.70
0.80
0.90
Female/Male FFT/MFT FPT/MPT FPT/MFT
Wakefield Yorkshire & Humber England
Source: New Earnings Survey, 2003
Note: Missing 'bars' occur where data are based on very small numbers of people and therefore cannot be included
Low pay is much more prevalent for women full-time workers in Wakefield than in the Yorkshire and The Humber region and England as a whole. Figure 5.7 shows the percentages of women and men whose weekly pay falls into different wage bands. A third of Wakefield women working full-time earned less than
£250 per week, rather more than at the regional level (29 per cent), and in England as a whole (24 per cent). By contrast, only 10 per cent of Wakefield men working full-time earned less than £250 per week, a little lower than the proportions in the region (12 per cent) and in England (11 per cent).
Among full-time men in employment, while the top 10 per cent in England earned £870 or more per week, and in the region the top 10 per cent of men earned at least £727, the top 10 per cent in Wakefield earned only £709 or more per week. Among full-time women in employment, the top 10 per cent of earners earned £610 or more in Wakefield, compared with £583 or more in the region, and at least £644 in England as a whole. The earnings level for women in the bottom 10 per cent of earners was lower in Wakefield than in the Yorkshire and The Humber region and in England as a whole, £171 compared with £193 or more in the region and £203 or more nationally. At all geographical levels, the bottom 10 per cent of full-time women earners earned less than the bottom 10 per cent of full-time men.
Figure 5.7. Distribution of weekly earnings: Men and women in full-time employment
Percentage of people earning under: 10% earn Area
£250 £350 £460 Less than More than
Wakefield Males 9.9 34.2 56.9 £251.10 £709.10
Females 33.5 60.0 72.6 £171.00 £610.20
Males 12.1 38.0 61.9 £238.00 £727.90 Yorkshire and The Humber Females 28.9 59.7 77.9 £193.90 £583.60
England Males 10.6 32.4 53.8 £246.60 £870.20
Females 23.6 51.9 71.5 £203.10 £644.40 Source: New Earnings Survey 2003, Crown Copyright 2004
Wakefield: Key Points
• In Wakefield, hourly pay rates for both men and women who work full-time are lower than in the region and England as a whole.
• Weekly pay rates for both men and women are lower than regionally and nationally.
• Women in full-time employment earn less than their male counterparts at all geographical levels.
• Although for full-time workers across all occupations, the ratio of women's to men's gross weekly pay is similar for Wakefield, the region and nationally, there is significant variation by occupation. The pay gap is widest for women in Wakefield in managerial and
senior professional occupations and narrowest in administrative and secretarial occupations.
• The top 10 per cent of earners in Wakefield who work full-time earned much less than their counterparts in England, especially among men. The bottom 10 per cent of female earners working full-time in Wakefield earned less than their counterparts in both the region and England as a whole.
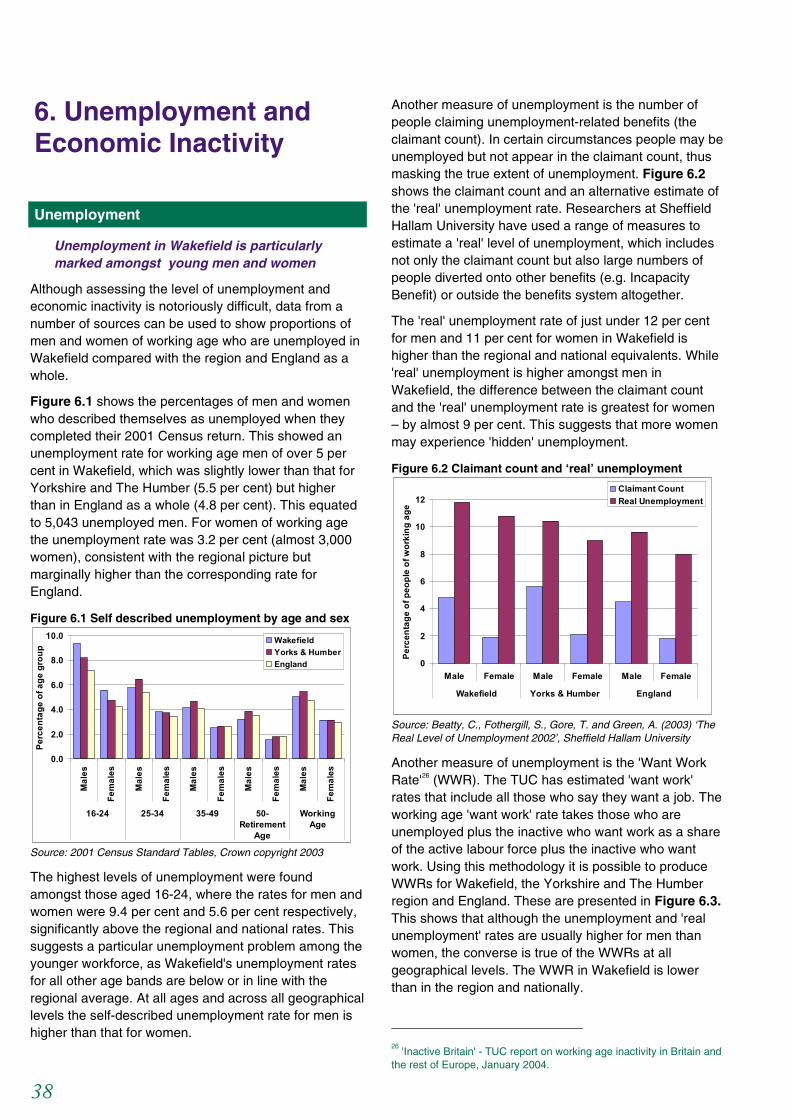
38
6. Unemployment and Economic Inactivity
Unemployment
Unemployment in Wakefield is particularly marked amongst young men and women
Although assessing the level of unemployment and economic inactivity is notoriously difficult, data from a number of sources can be used to show proportions of men and women of working age who are unemployed in Wakefield compared with the region and England as a whole.
Figure 6.1 shows the percentages of men and women who described themselves as unemployed when they completed their 2001 Census return. This showed an unemployment rate for working age men of over 5 per cent in Wakefield, which was slightly lower than that for Yorkshire and The Humber (5.5 per cent) but higher than in England as a whole (4.8 per cent). This equated to 5,043 unemployed men. For women of working age the unemployment rate was 3.2 per cent (almost 3,000 women), consistent with the regional picture but marginally higher than the corresponding rate for England.
Figure 6.1 Self described unemployment by age and sex
0.0
2.0
4.0
6.0
8.0
10.0
Mal
es
Fem
ales
Mal
es
Fem
ales
Mal
es
Fem
ales
Mal
es
Fem
ales
Mal
es
Fem
ales
16-24 25-34 35-49 50-Retirement
Age
WorkingAge
Perc
enta
ge o
f age
gro
up
WakefieldYorks & HumberEngland
Source: 2001 Census Standard Tables, Crown copyright 2003
The highest levels of unemployment were found amongst those aged 16-24, where the rates for men and women were 9.4 per cent and 5.6 per cent respectively, significantly above the regional and national rates. This suggests a particular unemployment problem among the younger workforce, as Wakefield's unemployment rates for all other age bands are below or in line with the regional average. At all ages and across all geographical levels the self-described unemployment rate for men is higher than that for women.
Another measure of unemployment is the number of people claiming unemployment-related benefits (the claimant count). In certain circumstances people may be unemployed but not appear in the claimant count, thus masking the true extent of unemployment. Figure 6.2 shows the claimant count and an alternative estimate of the 'real' unemployment rate. Researchers at Sheffield Hallam University have used a range of measures to estimate a 'real' level of unemployment, which includes not only the claimant count but also large numbers of people diverted onto other benefits (e.g. Incapacity Benefit) or outside the benefits system altogether.
The 'real' unemployment rate of just under 12 per cent for men and 11 per cent for women in Wakefield is higher than the regional and national equivalents. While 'real' unemployment is higher amongst men in Wakefield, the difference between the claimant count and the 'real' unemployment rate is greatest for women – by almost 9 per cent. This suggests that more women may experience 'hidden' unemployment.
Figure 6.2 Claimant count and ‘real’ unemployment
0
2
4
6
8
10
12
Male Female Male Female Male Female
Wakefield Yorks & Humber England
Perc
enta
ge o
f peo
ple
of w
orki
ng a
ge
Claimant CountReal Unemployment
Source: Beatty, C., Fothergill, S., Gore, T. and Green, A. (2003) ‘The Real Level of Unemployment 2002’, Sheffield Hallam University
Another measure of unemployment is the 'Want Work Rate'26 (WWR). The TUC has estimated 'want work' rates that include all those who say they want a job. The working age 'want work' rate takes those who are unemployed plus the inactive who want work as a share of the active labour force plus the inactive who want work. Using this methodology it is possible to produce WWRs for Wakefield, the Yorkshire and The Humber region and England. These are presented in Figure 6.3. This shows that although the unemployment and 'real unemployment' rates are usually higher for men than women, the converse is true of the WWRs at all geographical levels. The WWR in Wakefield is lower than in the region and nationally.
26
'Inactive Britain' - TUC report on working age inactivity in Britain and the rest of Europe, January 2004.
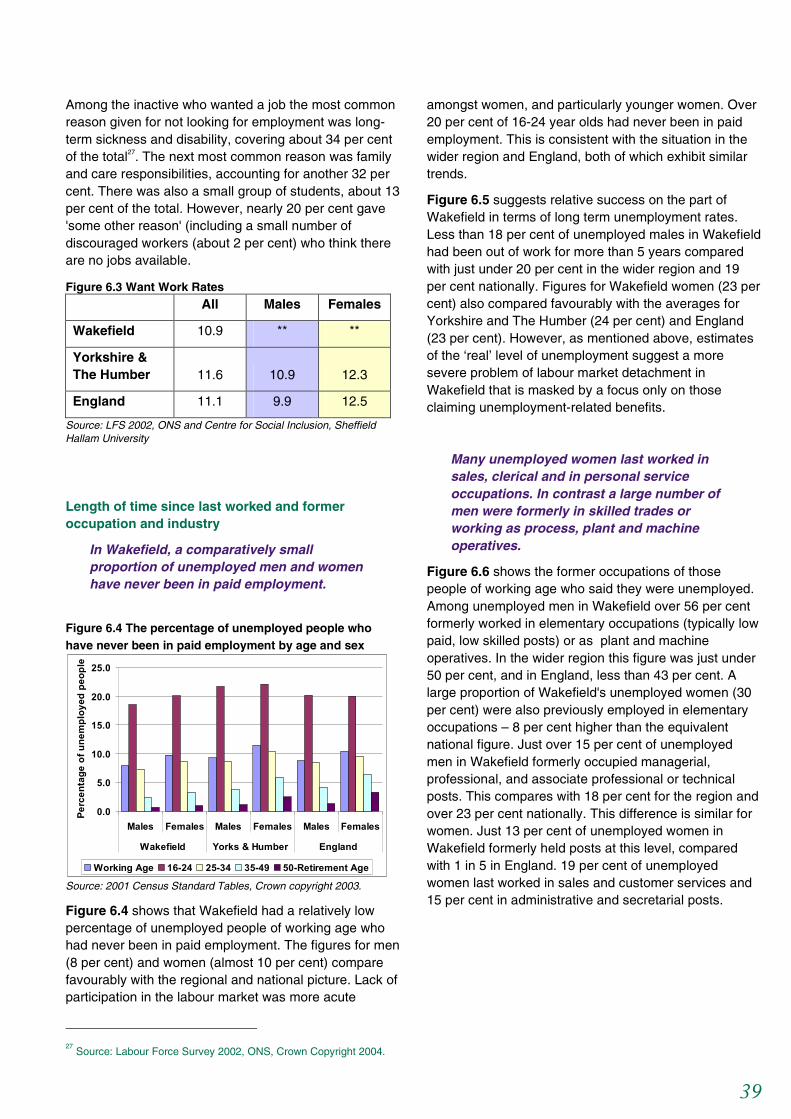
39
Among the inactive who wanted a job the most common reason given for not looking for employment was long-term sickness and disability, covering about 34 per cent of the total27. The next most common reason was family and care responsibilities, accounting for another 32 per cent. There was also a small group of students, about 13 per cent of the total. However, nearly 20 per cent gave 'some other reason' (including a small number of discouraged workers (about 2 per cent) who think there are no jobs available.
Figure 6.3 Want Work Rates All Males Females
Wakefield 10.9 ** **
Yorkshire & The Humber 11.6 10.9 12.3
England 11.1 9.9 12.5
Source: LFS 2002, ONS and Centre for Social Inclusion, Sheffield Hallam University
Length of time since last worked and former occupation and industry
In Wakefield, a comparatively small proportion of unemployed men and women have never been in paid employment.
Figure 6.4 The percentage of unemployed people who have never been in paid employment by age and sex
0.0
5.0
10.0
15.0
20.0
25.0
Males Females Males Females Males Females
Wakefield Yorks & Humber England
Perc
enta
ge o
f une
mpl
oyed
peo
ple
Working Age 16-24 25-34 35-49 50-Retirement Age
Source: 2001 Census Standard Tables, Crown copyright 2003.
Figure 6.4 shows that Wakefield had a relatively low percentage of unemployed people of working age who had never been in paid employment. The figures for men (8 per cent) and women (almost 10 per cent) compare favourably with the regional and national picture. Lack of participation in the labour market was more acute
27
Source: Labour Force Survey 2002, ONS, Crown Copyright 2004.
amongst women, and particularly younger women. Over 20 per cent of 16-24 year olds had never been in paid employment. This is consistent with the situation in the wider region and England, both of which exhibit similar trends.
Figure 6.5 suggests relative success on the part of Wakefield in terms of long term unemployment rates. Less than 18 per cent of unemployed males in Wakefield had been out of work for more than 5 years compared with just under 20 per cent in the wider region and 19 per cent nationally. Figures for Wakefield women (23 per cent) also compared favourably with the averages for Yorkshire and The Humber (24 per cent) and England (23 per cent). However, as mentioned above, estimates of the ‘real’ level of unemployment suggest a more severe problem of labour market detachment in Wakefield that is masked by a focus only on those claiming unemployment-related benefits.
Many unemployed women last worked in sales, clerical and in personal service occupations. In contrast a large number of men were formerly in skilled trades or working as process, plant and machine operatives.
Figure 6.6 shows the former occupations of those people of working age who said they were unemployed. Among unemployed men in Wakefield over 56 per cent formerly worked in elementary occupations (typically low paid, low skilled posts) or as plant and machine operatives. In the wider region this figure was just under 50 per cent, and in England, less than 43 per cent. A large proportion of Wakefield's unemployed women (30 per cent) were also previously employed in elementary occupations – 8 per cent higher than the equivalent national figure. Just over 15 per cent of unemployed men in Wakefield formerly occupied managerial, professional, and associate professional or technical posts. This compares with 18 per cent for the region and over 23 per cent nationally. This difference is similar for women. Just 13 per cent of unemployed women in Wakefield formerly held posts at this level, compared with 1 in 5 in England. 19 per cent of unemployed women last worked in sales and customer services and 15 per cent in administrative and secretarial posts.
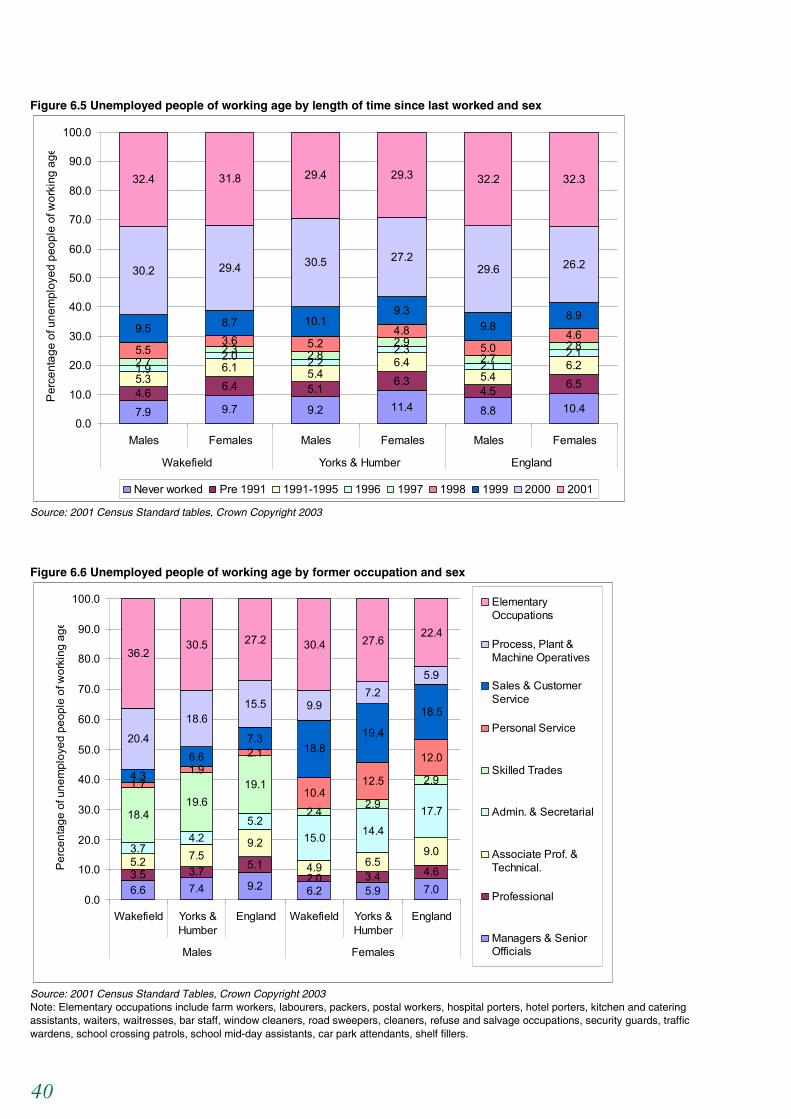
40
Figure 6.5 Unemployed people of working age by length of time since last worked and sex
7.9 9.7 9.2 11.4 8.8 10.44.6 6.4 5.1
6.34.5 6.55.3
6.1 5.46.4
5.46.21.9
2.0 2.22.3
2.12.1
2.72.3 2.8
2.92.7
2.85.53.6 5.2
4.85.0
4.69.5 8.7 10.19.3
9.88.9
30.2 29.4 30.5 27.229.6 26.2
32.4 31.8 29.4 29.3 32.2 32.3
0.0
10.0
20.0
30.0
40.0
50.0
60.0
70.0
80.0
90.0
100.0
Males Females Males Females Males Females
Wakefield Yorks & Humber England
Per
cent
age
of u
nem
ploy
ed p
eopl
e of
wor
king
age
Never worked Pre 1991 1991-1995 1996 1997 1998 1999 2000 2001
Source: 2001 Census Standard tables, Crown Copyright 2003
Figure 6.6 Unemployed people of working age by former occupation and sex
6.6 7.4 9.2 6.2 5.9 7.03.5 3.7 5.1
2.0 3.4 4.65.2 7.5
9.2
4.9 6.59.03.7
4.25.2
15.0 14.4
17.718.419.6
19.1
2.42.9
2.91.71.9
2.1
10.412.5
12.04.3
6.67.3
18.819.4
18.5
20.4
18.615.5 9.9
7.25.9
36.230.5 27.2 30.4 27.6
22.4
0.0
10.0
20.0
30.0
40.0
50.0
60.0
70.0
80.0
90.0
100.0
Wakefield Yorks &Humber
England Wakefield Yorks &Humber
England
Males Females
Perc
enta
ge o
f une
mpl
oyed
peo
ple
of w
orki
ng a
ge
ElementaryOccupations
Process, Plant &Machine Operatives
Sales & CustomerService
Personal Service
Skilled Trades
Admin. & Secretarial
Associate Prof. &Technical.
Professional
Managers & SeniorOfficials
Source: 2001 Census Standard Tables, Crown Copyright 2003
Note: Elementary occupations include farm workers, labourers, packers, postal workers, hospital porters, hotel porters, kitchen and catering assistants, waiters, waitresses, bar staff, window cleaners, road sweepers, cleaners, refuse and salvage occupations, security guards, traffic wardens, school crossing patrols, school mid-day assistants, car park attendants, shelf fillers.

41
Figure 6.7 Unemployed people of working age by former industry and sex
1.5 2.5 2.0 0.4 0.8 2.0
26.2 25.220.8
16.6 13.520.8
14.6 14.713.9
1.3 1.5
13.9
24.120.1
19.7
27.525.3
19.7
5.06.8
7.5
11.213.6
7.5
8.47.3
8.3
3.63.4
8.3
10.011.5
14.2
14.113.9
14.2
2.22.2 2.4
3.02.3
2.41.7 2.3 2.4
4.86.2
2.41.6 2.4 2.6
11.3 13.22.6
2.4 3.6 5.0 5.6 5.8 5.0
0.0
10.0
20.0
30.0
40.0
50.0
60.0
70.0
80.0
90.0
100.0
Wakefield Yorks &Humber
England Wakefield Yorks &Humber
England
Males Females
Per
cent
age
of u
nem
ploy
ed p
eopl
e of
wor
king
age
Other
Health & social work
Education
Public administrationetc Financial & RealEstate Transport storage &communications Hotels & restaurants
Wholesale & retail
Construction
Manufacture
Energy and Water
Agriculture, fishing etc
Source: 2001 Census Standard Tables, Crown Copyright 2003 Note: ‘Other’ includes sewage and refuse disposal, activities of membership organisations, recreational, cultural and sporting clubs, private households with employed persons, extra territorial organisations.
Figure 6.7 shows the former industry of unemployed people of working age. Almost a quarter of unemployed men in Wakefield were previously employed in the wholesale and retail sector, higher than the percentage for the region and England (both 20 per cent). 26 per cent of unemployed men formerly occupied positions in manufacturing industry, slightly more than the regional equivalent (25 per cent) but markedly higher than in England (21 per cent). The wholesale and retail sector also accounts for a large proportion of the former industries of Wakefield women, (28 per cent) compared with 25 per cent in the Yorkshire and The Humber region and 24 per cent in England. 17 per cent of unemployed women in Wakefield last worked in manufacturing and 14 per cent in finance and real estate.
Economic Inactivity
In Wakefield, students account for a comparatively small proportion of the economically inactive.
Wakefield's economically inactive population includes a relatively high proportion of people who are permanently sick or disabled.
Figure 6.8 shows the different categories found among men and women who are economically inactive. This shows that:
• Wakefield has a below average proportion of students, just 3.3 per cent of working age males and 4 per cent of females. This is significantly less than the regional average of 5.5 per cent for males and almost 6 per cent for females.
• 14 per cent of women of working age in Wakefield were looking after a home or family full-time, similar to the regional and national trends.
• 10 per cent of men and over 7 per cent of women of working age in Wakefield were inactive in the labour market because of sickness or disability. These figures are considerably higher than the corresponding regional and national figures.
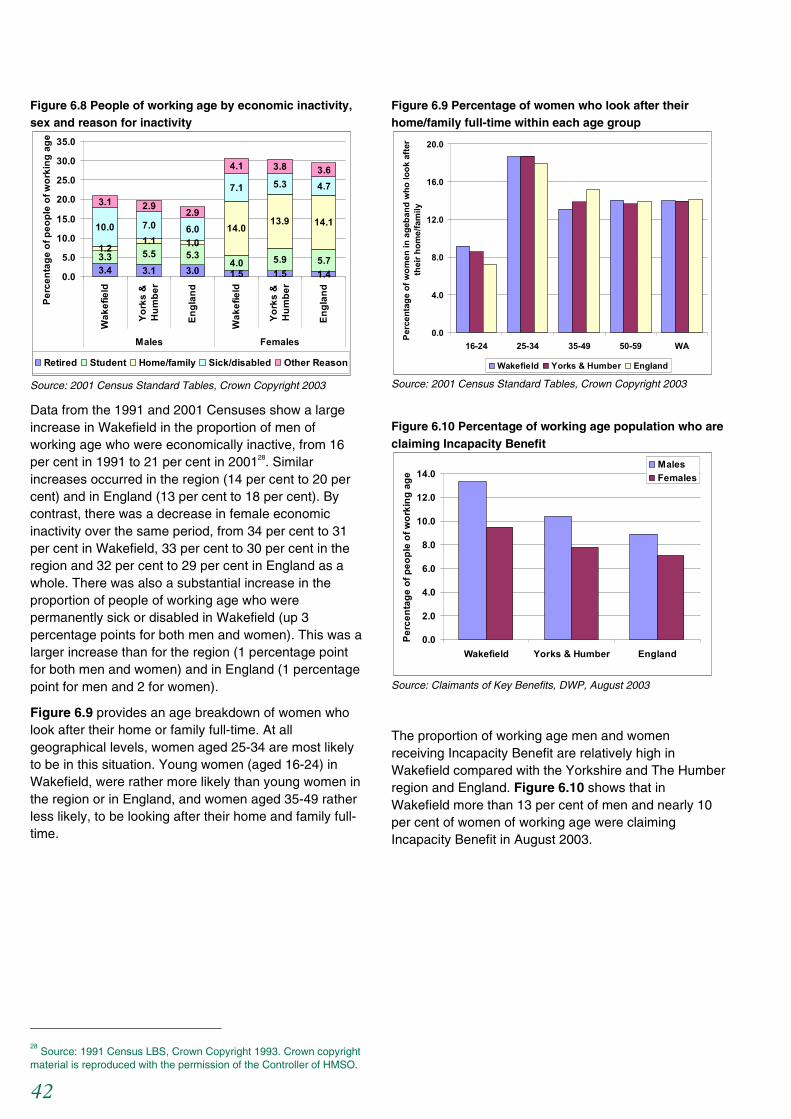
42
Figure 6.8 People of working age by economic inactivity, sex and reason for inactivity
3.4 3.1 3.0 1.5 1.5 1.4
3.3 5.5 5.34.0 5.9 5.7
1.21.1 1.0
14.013.9 14.110.0 7.0 6.0
7.1 5.3 4.73.1 2.9 2.9
4.1 3.8 3.6
0.0
5.0
10.0
15.0
20.0
25.0
30.0
35.0
Wak
efie
ld
York
s &
Hum
ber
Engl
and
Wak
efie
ld
York
s &
Hum
ber
Engl
and
Males Females
Perc
enta
ge o
f peo
ple
of w
orki
ng a
ge
Retired Student Home/family Sick/disabled Other Reason
Source: 2001 Census Standard Tables, Crown Copyright 2003
Data from the 1991 and 2001 Censuses show a large increase in Wakefield in the proportion of men of working age who were economically inactive, from 16 per cent in 1991 to 21 per cent in 200128. Similar increases occurred in the region (14 per cent to 20 per cent) and in England (13 per cent to 18 per cent). By contrast, there was a decrease in female economic inactivity over the same period, from 34 per cent to 31 per cent in Wakefield, 33 per cent to 30 per cent in the region and 32 per cent to 29 per cent in England as a whole. There was also a substantial increase in the proportion of people of working age who were permanently sick or disabled in Wakefield (up 3 percentage points for both men and women). This was a larger increase than for the region (1 percentage point for both men and women) and in England (1 percentage point for men and 2 for women).
Figure 6.9 provides an age breakdown of women who look after their home or family full-time. At all geographical levels, women aged 25-34 are most likely to be in this situation. Young women (aged 16-24) in Wakefield, were rather more likely than young women in the region or in England, and women aged 35-49 rather less likely, to be looking after their home and family full-time.
28
Source: 1991 Census LBS, Crown Copyright 1993. Crown copyright material is reproduced with the permission of the Controller of HMSO.
Figure 6.9 Percentage of women who look after their home/family full-time within each age group
0.0
4.0
8.0
12.0
16.0
20.0
16-24 25-34 35-49 50-59 WA
Perc
enta
ge o
f wom
en in
age
band
who
look
afte
r th
eir h
ome/
fam
ily
Wakefield Yorks & Humber England
Source: 2001 Census Standard Tables, Crown Copyright 2003
Figure 6.10 Percentage of working age population who are claiming Incapacity Benefit
0.0
2.0
4.0
6.0
8.0
10.0
12.0
14.0
Wakefield Yorks & Humber England
Perc
enta
ge o
f peo
ple
of w
orki
ng a
ge
MalesFemales
Source: Claimants of Key Benefits, DWP, August 2003
The proportion of working age men and women receiving Incapacity Benefit are relatively high in Wakefield compared with the Yorkshire and The Humber region and England. Figure 6.10 shows that in Wakefield more than 13 per cent of men and nearly 10 per cent of women of working age were claiming Incapacity Benefit in August 2003.

43
Qualifications and Economic Activity
Qualifications have a significant effect on employment status especially for women.
For women, a lack of qualifications is strongly linked to looking after a family or home.
Figures 6.11 and 6.12 show the difference qualifications make to employment status and highlight the difference in the positions of men and women holding the same level of qualification.
In Wakefield:
• only 50 per cent of women with no qualifications were in employment compared with almost 62 per cent of their male equivalents, and 83 per cent of women with a degree
• nearly 20 per cent of women with no qualifications were looking after their home and/or family full-time, compared with under 6 per cent of highly qualified women
• women and men with no qualifications were twice as likely to be unemployed as those with a degree
85 per cent of men holding a higher qualification, and 83 per cent of women, were in employment. A higher percentage of graduate women in Wakefield were in employment than at the regional or national level. However, this different was not evident among graduate men.
Level of qualification also varies by age. This was discussed fully in Chapter 3.
Figure 6.11 Men of working age and their level of qualification by economic activity
61.6
79.384.9
63.3
75.183.5
64.8
76.285.1
6.0
4.63.0
7.2
5.0
3.1
6.3
4.5
3.0
3.4
8.0 1.9
4.3
12.55.0
4.8
11.74.5
1.82.0 1.8
27.1
7.3 9.7
23.3
6.7 7.9
22.3
6.8 7.00.50.70.50.70.50.8
40.0
50.0
60.0
70.0
80.0
90.0
100.0
Non
e
Low
er
Hig
her
Non
e
Low
er
Hig
her
Non
e
Low
er
Hig
her
Wakefield Yorks & Humber England
Perc
enta
ge o
f men
of w
orki
ng a
ge
In Employment Unemployed Student Home/family Inactive Other
Source: 2001 Census Standard Tables, Crown copyright 2003
Note: Lower level qualifications are equivalent to ‘A’ level and below. Higher level qualifications are those equivalent to degree and above
Figure 6.12 Women of working age and their level of qualification by economic activity
50.1
68.9
82.9
49.0
65.9
80.4
49.6
65.8
79.0
3.5
3.3
1.5
3.7
3.2
1.9
3.5
3.0
2.2
4.0
9.7
2.8
4.9
13.5
5.3
5.5
12.5
5.1
19.9 21.8 21.2
22.6
6.4 7.3
20.6
5.8 6.0
20.2
5.9 5.5
8.1
12.9
6.411.65.511.7
40.0
50.0
60.0
70.0
80.0
90.0
100.0
Non
e
Low
er
Hig
her
Non
e
Low
er
Hig
her
Non
e
Low
er
Hig
her
Wakefield Yorks & Humber England
Perc
enta
ge o
f wom
en o
f wor
king
age
In Employment Unemployed Student Home/family Inactive Other
Source: 2001 Census Standard Tables, Crown copyright 2003
Note: Lower level qualifications are equivalent to ‘A’ level and below. Higher level qualifications are those equivalent to degree and above
Families and Economic Activity
Many children in Wakefield are growing up in workless households.
Lone parents in Wakefield are less likely to be in employment than their counterparts in the region and England.
Figure 6.13 Dependent children29 in households with no working adult and two or more working adults
0.0
10.0
20.0
30.0
40.0
50.0
All
depe
nden
tch
ildre
n
Dep
ende
ntch
ildre
nag
ed 0
-4
Dep
ende
ntch
ildre
nag
ed 5
-9
All
depe
nden
tch
ildre
n
Dep
ende
ntch
ildre
nag
ed 0
-4
Dep
ende
ntch
ildre
nag
ed 5
-9
No working adults 2 or more working adults
Perc
enta
ge o
f dep
ende
nt c
hild
ren
Wakefield Yorks & Humber England
Source: 2001 Census Standard Theme Table on Dependent Children, Crown copyright 2003
Figure 6.13 shows that 19 per cent of dependent children in Wakefield live in households with no working 29
A dependent child is a person in a household aged 0 to 15 (whether or not in a family) or a person aged 16 to 18 who is a full-time student in a family with parent(s).
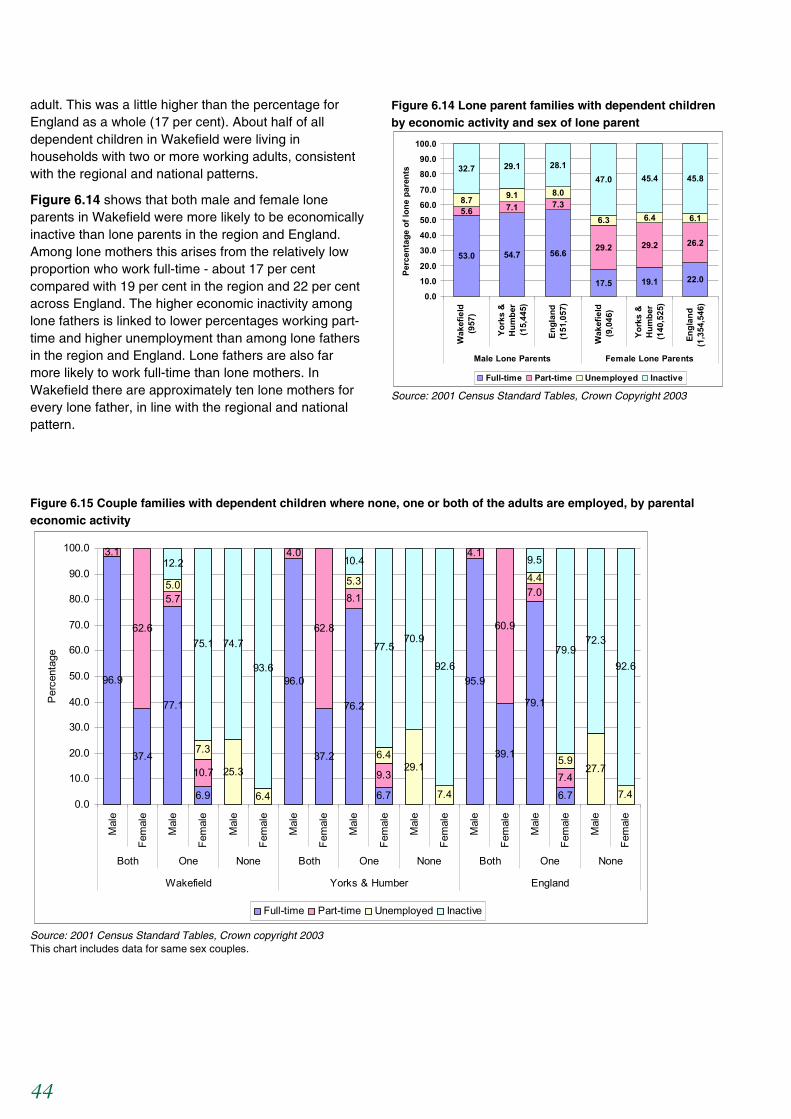
44
adult. This was a little higher than the percentage for England as a whole (17 per cent). About half of all dependent children in Wakefield were living in households with two or more working adults, consistent with the regional and national patterns.
Figure 6.14 shows that both male and female lone parents in Wakefield were more likely to be economically inactive than lone parents in the region and England. Among lone mothers this arises from the relatively low proportion who work full-time - about 17 per cent compared with 19 per cent in the region and 22 per cent across England. The higher economic inactivity among lone fathers is linked to lower percentages working part-time and higher unemployment than among lone fathers in the region and England. Lone fathers are also far more likely to work full-time than lone mothers. In Wakefield there are approximately ten lone mothers for every lone father, in line with the regional and national pattern.
Figure 6.14 Lone parent families with dependent children by economic activity and sex of lone parent
53.0 54.7 56.6
17.5 19.1 22.0
5.6 7.1 7.3
29.2 29.2 26.2
8.7 9.1 8.0
6.3 6.4 6.1
32.7 29.1 28.147.0 45.4 45.8
0.010.020.0
30.040.050.060.070.0
80.090.0
100.0
Wak
efie
ld(9
57)
York
s &
Hum
ber
(15,
445)
Engl
and
(151
,057
)
Wak
efie
ld(9
,046
)
York
s &
Hum
ber
(140
,525
)
Engl
and
(1,3
54,5
46)
Male Lone Parents Female Lone Parents
Perc
enta
ge o
f lon
e pa
rent
s
Full-time Part-time Unemployed Inactive
Source: 2001 Census Standard Tables, Crown Copyright 2003
Figure 6.15 Couple families with dependent children where none, one or both of the adults are employed, by parental economic activity
96.9
37.4
77.1
6.9
96.0
37.2
76.2
6.7
95.9
39.1
79.1
6.7
3.1
62.6
5.7
10.7
4.0
62.8
8.1
9.3
4.1
60.9
7.0
7.4
5.0
7.3
25.3
6.4
5.3
6.429.1
7.4
4.4
5.927.7
7.4
12.2
75.1 74.7
93.6
10.4
77.570.9
92.6
9.5
79.972.3
92.6
0.0
10.0
20.0
30.0
40.0
50.0
60.0
70.0
80.0
90.0
100.0
Mal
e
Fem
ale
Mal
e
Fem
ale
Mal
e
Fem
ale
Mal
e
Fem
ale
Mal
e
Fem
ale
Mal
e
Fem
ale
Mal
e
Fem
ale
Mal
e
Fem
ale
Mal
e
Fem
ale
Both One None Both One None Both One None
Wakefield Yorks & Humber England
Perc
enta
ge
Full-time Part-time Unemployed Inactive
Source: 2001 Census Standard Tables, Crown copyright 2003 This chart includes data for same sex couples.

45
Figure 6.15 shows the economic activity of adults in couple families with dependent children. In families where both parents worked, 96 per cent of fathers worked full-time and over 60 per cent of women were employed part-time. This pattern applied across all areas. In couple families in which only one adult worked, fewer women were economically inactive in Wakefield (75 per cent) than in the Yorkshire and The Humber region (78 per cent) and England (80 per cent). There were thus proportionally more employed females in couple families with only one working adult in Wakefield (18 per cent) than in the wider region (16 per cent) and England as a whole (14 per cent).
Key Points
• In Wakefield, a higher proportion of young men and women were unemployed than in the region or across England.
• Estimates of 'real' unemployment for both men and women in Wakefield suggest official unemployment data disguise the scale of labour market detachment. For women the estimate of 'real' unemployment was 9 per cent higher than the claimant count.
• Wakefield has a comparatively low proportion of unemployed men and women, across all ages, who have never been in paid employment.
• A high proportion of unemployed people of working age in Wakefield (36 per cent of men and 30 per cent of women) were previously employed in elementary occupations. There were marked differences in the previous occupations of women and men.
• Almost a quarter of unemployed men in Wakefield previously worked in the wholesale and retail sector and another 26 per cent in manufacturing industry. Over 27 per cent of unemployed women also formerly worked in wholesale and retail jobs with another 13 per cent previously employed in manufacturing.
• In 2001, only 3.3 per cent of men and 4 per cent of women of working age in Wakefield were students, significantly below the regional and national percentages.
• For 14 per cent of women of working age economic inactivity was associated with their family and household responsibilities.
• Permanent sickness or disability was the reason for not participating in the labour market for 10 per cent of men and over 7 per cent of women. Both these figures were higher than the national average.
• Qualifications have a marked effect on employment status. Wakefield's unqualified women were less likely to be employed than unqualified men and more likely to be at home full-time looking after the home or family. Almost 80 per cent of graduate women in Wakefield, compared with just 50 per cent of unqualified women, were in paid employment.
• In the 16-24 year old age group the percentage of women looking after their home or family full-time was higher in Wakefield than in the Yorkshire and The Humber region or England as a whole.
• Unemployment and economic inactivity have a severe impact on the household. 19 per cent of dependent children in Wakefield live in households with no working adult.
• Lone parents in Wakefield were less active in the labour market than their counterparts in England. About 58 per cent of lone fathers and 47 per cent of lone mothers with dependent children were in employment. This compared with national figures of 64 per cent and 48 per cent for men and women respectively.
46
7. Women, Men and Diversity
The Employment Circumstances of People from Black and Minority Ethnic Groups
Black and Minority Ethnic women and men in Wakefield have distinctly different patterns of employment and economic activity.
As described in Chapter 1, Wakefield has only a small population of its residents from Black and Minority Ethnic groups. Figures 7.1 and 7.2 show young men and women by ethnicity and economic activity status as recorded in the 2001 Census. Some of the ethnicity categories contain very small numbers, with the largest groups of young people found among the Pakistani (656 people), White Other (243 people) and Indian (129 people) population groups.
Among mature people of working age (25-59 for women, 25-64 for men), the same ethnic groups have the largest numbers after the majority White British category. Here the numbers are: Pakistani - 566 women and 646 men; White Other - 531 women and 536 men and Indian - 249 women and 314 men with the addition of White Irish - 301 women and 428 men.
The economic activity, occupations and industrial distribution of the above Black and Minority Ethnic groups are the focus of discussion in this section. Data for all Black and Minority Ethnic groups are shown in the figures presented.
Wakefield's Pakistani Population
Economic Activity: 16-24 year olds
Compared with other young men in Wakefield, the district's Pakistani population contains proportionately more students (44 per cent, compared with 31 per cent). However, among Wakefield's young Pakistani women the proportion who are students is just 32 per cent compared with 35 per cent of women in the district as a whole.
30 per cent of young Pakistani men are in full-time employment in Wakefield, and 19 per cent of young Pakistani women, compared with 50 per cent and 33 per cent in the district's overall 16-24 population. Full-time employment among Pakistani young people in Wakefield is higher than among this ethnic group in the Yorkshire and The Humber region (23 per cent for men and 12 per
cent for women) or in England as a whole (23 per cent and 13 per cent respectively).
A relatively high proportion of young Pakistani men and women in Wakefield were self-employed (9 per cent of men and 1.5 per cent of women) compared with young people across the district (2.2 per cent of men and 0.6 per cent of women), and with their counterparts in the region (3.2 per cent of men and 0.6 per cent of women) and nationally (3 per cent of men and 0.2 per cent of women).
Economic Activity 25 years - retirement age
Mature Pakistani men in Wakefield had higher rates of full-time employment than either their counterparts in the Yorkshire and The Humber region or in England (60 per cent for Pakistani men in Wakefield, 49 per cent for Pakistani men in the region and 54 per cent for England). However, this figure was lower than for the whole population in the district (71 per cent). Pakistani women were less likely than other women in Wakefield to be in full-time (9 per cent) or part-time (6 per cent) employment, and more likely to be looking after their home or family full-time (57 per cent) than women across the district (15 per cent) or than Pakistani women in the region (52 per cent) or nationally (48 per cent).
Full-time self-employment was more prevalent among Pakistani men in Wakefield than among other Wakefield residents. 27 per cent of Wakefield's Pakistani men were self-employed full-time, compared with 10 per cent of all Wakefield men, and with 16 per cent and 8 per cent of Pakistani men in the region and England respectively.
Occupations of the employed population
Wakefield's Pakistani population contains a higher proportion of men who work as process, plant or machine operatives (42 per cent compared with 18 per cent across the district, and with 30 per cent of Pakistani men in the region and 25 per cent nationally).
Consistent with this picture, Pakistani men in Wakefield were less likely than other residents, and than their counterparts at regional and national level, to occupy jobs in administrative and secretarial occupations or in professional, associate professional or technical jobs.
Pakistani women in Wakefield were more likely to work in administrative and secretarial occupations (28 per cent) than all women across the district (21 per cent) or than Pakistani women in the region (19 per cent) and England (20 per cent). In Wakefield, proportionally more Pakistani women were employed as managers, senior officials, professionals, associate professionals or technicians than women across the district (31 per cent compared with 28 per cent). This is in contrast to the picture in the region (29 per cent of Pakistani women compared with 32 per cent of all women) and nationally

47
(32 per cent of Pakistani women compared with 36 per cent of all women).
Wakefield's Pakistani women were less likely to have jobs as process, plant or machine operatives (1.4 per cent compared with 4.4 per cent of all Wakefield's women, and with 6 per cent of Pakistani women in both the region and England). Pakistani men and women in Wakefield were also less likely than men and women across the district, or than other men of their ethnic group regionally and nationally, to be in elementary occupations.
Industrial distribution of the employed population
By comparison with Pakistani men in England and in the Yorkshire and The Humber region, Wakefield's Pakistani men were less likely to work in wholesale, retail, restaurants and hotels sector or in public administration, education, health and social work, and more likely to work in the transport and construction sectors. Over a quarter of Pakistani men in the district worked in transport, storage and communications (compared with 10 per cent of all men in Wakefield and 18 per cent of all Pakistani men in both the region and in England), and 28 per cent worked in the wholesale, retail, hotels and restaurants sector.
Pakistani women in Wakefield were much more likely to work in the finance and real estate sector (22 per cent), compared with Pakistani women in the region (16 per cent), and in England (18 per cent). Their stronger concentration in this sector meant that they were less likely to work in other sectors where many Pakistani women are employed at the national level, such as in education (13 per cent in Wakefield, compared with 19 per cent in the Yorkshire and The Humber region and 14 per cent in England), or in manufacturing (4 per cent in Wakefield, compared with 9 per cent in both the region and in England).
Wakefield's White Other population
The White Other category includes Romany Gypsies, people from the former Yugoslavia, and other people of Eastern European origin as well as people from other European countries, the USA, Canada, Australia and New Zealand.
Economic Activity 16-24 year olds
Compared with other young people in Wakefield, the district's White Other population includes slightly more students - among men, 33 per cent, compared with 31 per cent; and among women 36 per cent, compared with
35 per cent. In 2001, there was low unemployment among White Other young men in Wakefield (5 per cent, compared with 9 per cent for all young men in the district). A low proportion of young women in this category were employed full-time (24 per cent, compared with 34 per cent of all women, and with 16 per cent and 28 per cent respectively of White Other young women in the region and England). Full-time employment among White Other young men in Wakefield (33 per cent) was higher than that found in this ethnic group in the Yorkshire and Humber region (19 per cent), or in England as a whole (28 per cent).
Economic Activity 25 years - retirement age
Among mature working age people, White Other men in Wakefield had higher rates of full-time employment (71 per cent) than their counterparts in the region (66 per cent), although this figure was the same as White Other men in England (71 per cent), and to all men across the district (71 per cent). White Other women were less likely than other Wakefield women to work as part-time employees (22 per cent, compared with 30 per cent). This also applied to White Other men in the district (4 per cent worked part-time compared with 3 per cent of all men in Wakefield). Among women, the figure for part-time employment was nevertheless higher than that found for their counterparts in the region or in England (19 per cent and 15 per cent respectively).
Among mature White Other people of working age in Wakefield a similar (very small) number were students (2 per cent of men and 3 per cent of women), compared with less than 1 per cent of all men and women of this age in the district, but with higher proportions of those of the White Other population in the region (9 per cent for both sexes) or nationally (6 per cent for both sexes).
Occupations of the employed population
By comparison with all working age people in the district, Wakefield's White Other population contained a higher proportion of men working as managers and senior officials, and in professional jobs, than was found in the district's general working age population. Among men, 19 per cent were managers and senior officials and 17 per cent are professionals. The comparable figures for Wakefield women of this ethnicity were 12 per cent and 21 per cent, compared with 9 per cent and 7 per cent respectively for all women in the district. White Other men in Wakefield were more likely than similar men at regional or national scales to work in skilled trades (15 per cent compared with 14 per cent and 12 per cent respectively). However this figure was lower than that for all men in Wakefield (21 per cent).

48
Figure 7.1 Economic Activity by ethnicity for men aged 16-24 in Wakefield
47.6 48.7
62.5
30.8 34.5
0.010.3
25.020.0 23.1
16.7
36.430.0
19.027.8
1.9 1.7
0.0
2.60.0
0.0
0.0
0.0 6.06.5
0.0
27.3
0.0
7.10.0
4.6 4.5
0.0
8.50.0
33.3 10.3
18.86.0
5.6
0.0
0.0
0.00.0
16.7
0.3 0.3
0.0
0.0
0.0 0.0
0.0
0.0
0.02.8
0.0
0.0
0.00.0
0.0
9.4 9.40.0
5.110.3
33.3
17.2
0.0
0.0
10.6
12.5
0.0
0.0 9.5
0.0
30.5 29.8 37.5
32.5
55.20.0
51.7
56.3
62.0
43.670.8
36.4
70.064.3
38.9
0.1 0.10.0
0.0
0.0
0.0
0.0
0.0
0.0 0.0
0.0 0.0 0.0 0.0
0.0
0.4 0.40.0
0.0
0.0
33.3
0.0
0.0
0.0 1.6
0.0 0.0 0.0 0.0
0.0
1.9 1.90.0
0.0
0.0 0.010.3
0.0
0.0 0.90.0 0.0 0.0 0.0
0.0
3.3 3.2 0.0
20.5
0.0 0.0 0.0 0.06.0 5.3
0.0 0.0 0.0 0.0
16.7
0.0
10.0
20.0
30.0
40.0
50.0
60.0
70.0
80.0
90.0
100.0
All
(15,
390)
Whi
te B
ritis
h (1
4,68
4)
Whi
te Ir
ish
(32)
Whi
te O
ther
(117
)
Mix
ed W
hite
& B
lack
Car
ibbe
an (2
9)
Mix
ed W
hite
& B
lack
Afri
can
(9)
Mix
ed W
hite
& A
sian
(29)
Oth
er M
ixed
(16)
Indi
an (5
0)
Pak
ista
ni (3
21)
Ban
glad
eshi
(0)
Oth
er A
sian
(24)
Bla
ck C
arib
bean
(11)
Bla
ck A
frica
n (1
0)
Oth
er B
lack
(0)
Chi
nese
(42)
Oth
er E
thni
c G
roup
(18)
Per
cent
age
of m
en a
ged
16-2
4
Employee - Full Time Self Employed - Full Time Employee - Part Time Self Employed - Part Time Unemployed Student Retired Looking after home/family Permanently sick or disabled Other
Source: 2001 Census Commissioned Tables, Crown Copyright 2004
Figure 7.2 Economic Activity by ethnicity for women aged 16-24 in Wakefield
33.4 34.1
20.0 21.410.7
40.0
17.912.5
20.3 18.530.0
38.950.0
0.0 0.0
22.532.0
0.4 0.3
0.02.4
0.0
0.0
0.00.0
3.80.0
0.0
0.0
0.0
0.0 0.0
0.0
0.0
10.5 10.8
0.0
11.1
10.7
0.0
7.7
0.0
3.84.8
0.0
0.0
0.0
0.0
33.30.0
20.00.2 0.2
0.0
0.0
0.0
0.0
0.0
0.0
3.8
1.5
0.0
0.0
0.0
0.0
0.0
0.0
0.05.6 5.6
0.0
4.8
0.0
20.0
10.3
12.5
0.05.7
30.0
0.0
0.0
0.0
0.0
0.0
12.0
34.7 34.3
66.735.7
53.6
0.0 48.7
50.0
59.5
31.9
40.0
44.4
0.0 100.0 33.3
77.5
24.0
0.1 0.1 0.0
0.0 0.0
0.0
0.0
0.0
0.0
0.0
0.0
0.0
0.0
0.0
0.0
0.0
0.09.2 9.00.0
11.9 10.7
20.0
0.012.5
0.0
22.4
0.0
16.7
0.0
0.0
33.3
0.0
12.01.2 1.2
0.05.6
0.00.0
0.0
12.50.0
0.0
0.0 0.0
0.0
0.0 0.0 0.0 0.04.7 4.4
13.37.1
14.320.0 15.4
0.08.9
15.2
0.0 0.0
50.0
0.0 0.0 0.0 0.0
0.0
10.0
20.0
30.0
40.0
50.0
60.0
70.0
80.0
90.0
100.0
All
(16,
016)
Whi
te B
ritis
h (1
5,22
6)
Whi
te Ir
ish
(30)
Whi
te O
ther
(126
)
Mix
ed W
hite
& B
lack
Car
ibbe
an (2
8)
Mix
ed W
hite
& B
lack
Afri
can
(15)
Mix
ed W
hite
& A
sian
(39)
Oth
er M
ixed
(24)
Indi
an (7
9)
Pak
ista
ni (3
35)
Ban
glad
eshi
(10)
Oth
er A
sian
(18)
Bla
ck C
arib
bean
(6)
Bla
ck A
frica
n (6
)
Oth
er B
lack
(9)
Chi
nese
(40)
Oth
er E
thni
c G
roup
(25)
Per
cent
age
of w
omen
age
d 16
-24
Employee - Full Time Self Employed - Full Time Employee - Part Time Self Employed - Part Time Unemployed Student Retired Looking after home/family Permanently sick or disabled Other
Source: 2001 Census Commissioned Tables, Crown Copyright 2004

49
Figure 7.3 Economic Activity by ethnicity for men aged 25-64 in Wakefield
61.4 61.951.4
58.250.7 46.7
58.753.8
44.633.1
50.0
35.9
51.063.5
30.836.0
49.2
9.7 9.4
12.1
12.3
8.5 16.7
9.5
5.830.6
26.50.0
19.4
13.5
6.8
0.0
40.8 12.3
3.0 2.9
4.7
3.9
5.6 0.0
6.3
5.8
4.8
7.0
0.0
2.9
7.3
9.5
23.1
2.4
0.0
1.3 1.21.4
1.1
0.010.0
0.0
0.0
5.7
7.0
0.0
1.9
0.0
0.0
23.1
2.4
0.0
4.2 4.24.4
4.9
7.0
10.0 4.8
0.0
1.6
7.3
0.0
9.7
6.3
4.10.0
2.4
10.8
0.6 0.50.7
2.2
4.2
0.0 4.8
0.0
0.00.6
0.0
6.80.0
6.8 23.12.4
4.6
3.9 4.05.1
2.44.2
0.0 0.0
3.8
3.8
1.1
50.0 1.0 0.0
0.0
0.0
4.8
4.61.4 1.3
1.62.1
4.2 0.0 0.0
5.8
0.0
2.5
0.0
2.9 0.0
0.0
0.0
2.4
0.0
11.5 11.612.9
7.8 8.50.0
6.3
9.6
4.57.6
0.0
12.65.2
4.1
0.02.4
7.7
3.0 2.9 5.6 5.0 7.016.7
9.515.4
4.5 7.40.0
6.816.7
5.40.0 4.0
10.8
0.0
10.0
20.0
30.0
40.0
50.0
60.0
70.0
80.0
90.0
100.0
All
(84,
676)
Whi
te B
ritis
h(8
2,05
7)
Whi
te Ir
ish
(428
)
Whi
te O
ther
(536
)
Mix
ed W
hite
& B
lack
Carib
bean
(71)
Mix
ed W
hite
& B
lack
Afri
can
(30)
Mix
ed W
hite
& A
sian
(63)
Oth
er M
ixed
(52)
Indi
an (3
14)
Paki
stan
i (64
6)
Ban
glad
eshi
(6)
Oth
er A
sian
(103
)
Bla
ck C
arib
bean
(96)
Blac
k A
frica
n (7
4)
Oth
er B
lack
(13)
Chi
nese
(125
)
Oth
er E
thni
c G
roup
(65)
Per
cent
age
of m
en a
ged
25-6
4
Employee - Full Time Self Employed - Full Time Employee - Part Time Self Employed - Part Time Unemployed Student Retired Looking after home/family Permanently sick or disabled Other
Source: 2001 Census Standard Tables, Crown Copyright 2003, and 2001 Census Commissioned Tables, Crown Copyright 2004
Figure 7.4 Economic Activity by ethnicity for women aged 25-59 in Wakefield
33.7 33.8 37.933.0 30.4
66.7
39.350.0
28.5
7.2
33.342.9
32.2
46.657.1
32.4
47.6
2.3 2.13.7
2.90.0
33.3
4.9
0.0
24.5
1.4
0.0
8.2
0.0
0.0
42.9
16.9
4.330.0 30.4 22.321.6
15.9
0.0
18.0 10.014.5
4.1
33.3
10.2
28.812.1
0.0
19.9 16.5
1.6 1.61.0
2.2
4.3
0.0
0.0 6.0
4.4
1.1
0.00.0 0.0
0.0
0.0
3.70.02.6 2.6
2.74.7
5.8
0.0
4.96.0
3.2
2.3
0.00.0
6.85.2
0.0
3.74.30.8 0.8
1.0 3.3
0.0
0.0
4.9 0.00.0
1.9
0.00.0
6.8 12.1
0.0
4.41.81.8 1.9
2.7 1.6
0.0
0.0
0.0 2.02.4
0.7
0.00.0
5.1 0.0
0.0
4.4
0.015.0 14.7
12.3 18.3
18.8
0.0
14.8 8.013.3
57.1
33.3
24.5
6.8 10.3
0.0
12.5
15.9
8.3 8.411.0 6.2
15.9
0.0
9.88.0
2.8
5.8
0.0
6.1 6.8 8.6
0.0 0.0
2.4
3.9 3.8 5.6 6.2 8.70.0 3.3
10.0 6.418.4
0.08.2 6.8 5.2
0.0 2.27.3
0.0
10.0
20.0
30.0
40.0
50.0
60.0
70.0
80.0
90.0
100.0
All
(77,
644)
Whi
te B
ritis
h(7
5,30
9)
Whi
te Ir
ish
(301
)
Whi
te O
ther
(551
)
Mix
ed W
hite
& B
lack
Car
ibbe
an (6
9)
Mix
ed W
hite
& B
lack
Afri
can
(9)
Mix
ed W
hite
& A
sian
(61)
Oth
er M
ixed
(50)
Indi
an (2
49)
Pak
ista
ni (5
66)
Ban
glad
eshi
(9)
Oth
er A
sian
(49)
Bla
ck C
arib
bean
(59)
Bla
ck A
frica
n (5
8)
Oth
er B
lack
(7)
Chi
nese
(136
)
Oth
er E
thni
c G
roup
(164
)
Per
cent
age
of w
omen
age
d 25
-64
Employee - Full Time Self Employed - Full Time Employee - Part Time Self Employed - Part Time Unemployed Student Retired Looking after home/family Permanently sick or disabled Other
Source: 2001 Census Standard Tables, Crown Copyright 2003, and 2001 Census Commissioned Tables, Crown Copyright 2004
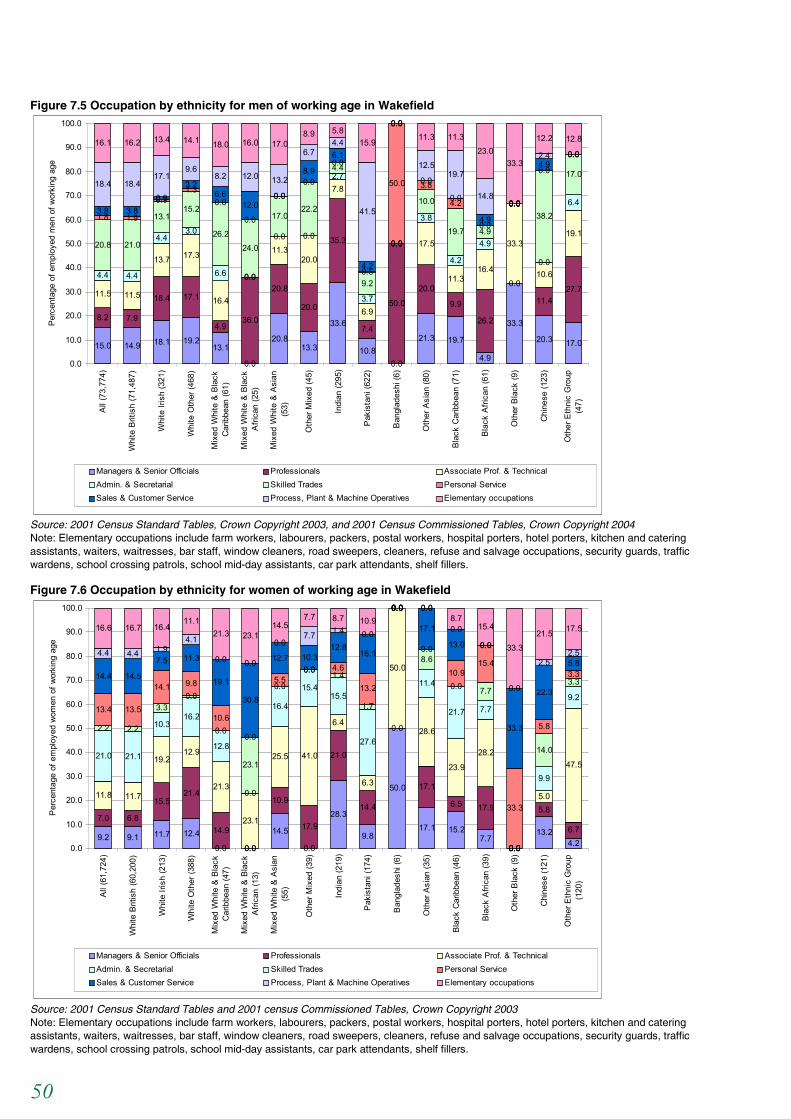
50
Figure 7.5 Occupation by ethnicity for men of working age in Wakefield
15.0 14.9 18.1 19.213.1
0.0
20.813.3
33.6
10.80.0
21.3 19.7
4.9
33.3
20.3 17.0
8.2 7.9
18.4 17.1
4.936.0
20.8
20.0
35.3
7.4
50.0
20.0
9.9
26.2
0.0
11.427.711.5 11.5
13.7 17.3
16.4
0.0
11.320.0
7.8
6.9
0.0 17.5
11.316.4
33.3
10.6
19.1
4.4 4.4
4.43.0
6.6 0.0
0.0 0.0
2.7
3.7
0.0
3.8
4.2
4.9
0.0
0.0
6.4
20.8 21.0
13.115.2
26.224.0
17.022.2
4.4
9.2
0.0
10.0
19.7 4.9
0.038.2
17.0
1.8 1.9
0.91.3
0.0
0.0
0.00.0
0.0
0.5
50.0 3.8
4.2
0.0
0.0
0.0
0.0
3.8 3.80.9
3.26.6
12.00.0
8.9
6.1
4.2
0.0
0.0
0.0
4.9
0.0
4.90.0
18.4 18.417.1
9.68.2 12.0 13.2
6.74.4
41.5
0.0
12.519.7
14.80.0
2.4 0.016.1 16.2 13.4 14.1 18.0 16.0 17.0
8.9 5.815.9
0.011.3 11.3
23.033.3
12.2 12.8
0.0
10.0
20.0
30.0
40.0
50.0
60.0
70.0
80.0
90.0
100.0
All
(73,
774)
Whi
te B
ritis
h (7
1,48
7)
Whi
te Ir
ish
(321
)
Whi
te O
ther
(468
)
Mix
ed W
hite
& B
lack
Car
ibbe
an (6
1)
Mix
ed W
hite
& B
lack
Afri
can
(25)
Mix
ed W
hite
& A
sian
(53)
Oth
er M
ixed
(45)
Indi
an (2
95)
Pak
ista
ni (6
22)
Ban
glad
eshi
(6)
Oth
er A
sian
(80)
Bla
ck C
arib
bean
(71)
Bla
ck A
frica
n (6
1)
Oth
er B
lack
(9)
Chi
nese
(123
)
Oth
er E
thni
c G
roup
(47)
Per
cent
age
of e
mpl
oyed
men
of w
orki
ng a
ge
Managers & Senior Officials Professionals Associate Prof. & TechnicalAdmin. & Secretarial Skilled Trades Personal ServiceSales & Customer Service Process, Plant & Machine Operatives Elementary occupations
Source: 2001 Census Standard Tables, Crown Copyright 2003, and 2001 Census Commissioned Tables, Crown Copyright 2004
Note: Elementary occupations include farm workers, labourers, packers, postal workers, hospital porters, hotel porters, kitchen and catering assistants, waiters, waitresses, bar staff, window cleaners, road sweepers, cleaners, refuse and salvage occupations, security guards, traffic wardens, school crossing patrols, school mid-day assistants, car park attendants, shelf fillers.
Figure 7.6 Occupation by ethnicity for women of working age in Wakefield
9.2 9.1 11.7 12.4
0.0 0.0
14.5
0.0
28.3
9.8
50.0
17.1 15.27.7
0.0
13.24.2
7.0 6.8
15.521.4
14.9
0.0
10.9
17.9
21.0
14.4
0.0
17.1
6.5 17.9
0.0
5.8
6.7
11.8 11.7
19.212.9
21.3
23.1
25.5 41.0
6.4
6.3
50.0
28.6
23.9
28.2
0.0
5.0
47.521.0 21.1
10.316.2
12.8
0.0
16.4
15.415.5
27.6
0.0
11.4
21.7 7.7
0.0
9.9
9.2
2.2 2.2
3.30.8
0.0
23.1
0.0
0.01.4
1.7
0.0
8.6
0.0 7.7
0.0
14.0
3.3
13.4 13.5
14.1 9.8
10.6
0.0
5.50.0 4.6
13.2
0.0
0.0
10.915.4
33.3
5.8
3.314.4 14.5
7.5 11.3
19.1
30.8
12.7 10.312.8
16.1
0.0
17.1
13.0 0.0
33.3
22.3
5.84.4 4.4 1.9
4.1
0.0 0.0
0.07.7 1.4 0.0
0.0 0.0
0.0
0.0
0.0
2.52.5
16.6 16.7 16.411.1
21.3 23.114.5
7.7 8.7 10.90.0 0.0
8.715.4
33.321.5 17.5
0.0
10.0
20.0
30.0
40.0
50.0
60.0
70.0
80.0
90.0
100.0
All
(61,
724)
Whi
te B
ritis
h (6
0,20
0)
Whi
te Ir
ish
(213
)
Whi
te O
ther
(388
)
Mix
ed W
hite
& B
lack
Car
ibbe
an (4
7)
Mix
ed W
hite
& B
lack
Afri
can
(13)
Mix
ed W
hite
& A
sian
(55)
Oth
er M
ixed
(39)
Indi
an (2
19)
Pak
ista
ni (1
74)
Ban
glad
eshi
(6)
Oth
er A
sian
(35)
Bla
ck C
arib
bean
(46)
Bla
ck A
frica
n (3
9)
Oth
er B
lack
(9)
Chi
nese
(121
)
Oth
er E
thni
c G
roup
(120
)
Per
cent
age
of e
mpl
oyed
wom
en o
f wor
king
age
Managers & Senior Officials Professionals Associate Prof. & TechnicalAdmin. & Secretarial Skilled Trades Personal ServiceSales & Customer Service Process, Plant & Machine Operatives Elementary occupations
Source: 2001 Census Standard Tables and 2001 census Commissioned Tables, Crown Copyright 2003
Note: Elementary occupations include farm workers, labourers, packers, postal workers, hospital porters, hotel porters, kitchen and catering assistants, waiters, waitresses, bar staff, window cleaners, road sweepers, cleaners, refuse and salvage occupations, security guards, traffic wardens, school crossing patrols, school mid-day assistants, car park attendants, shelf fillers.
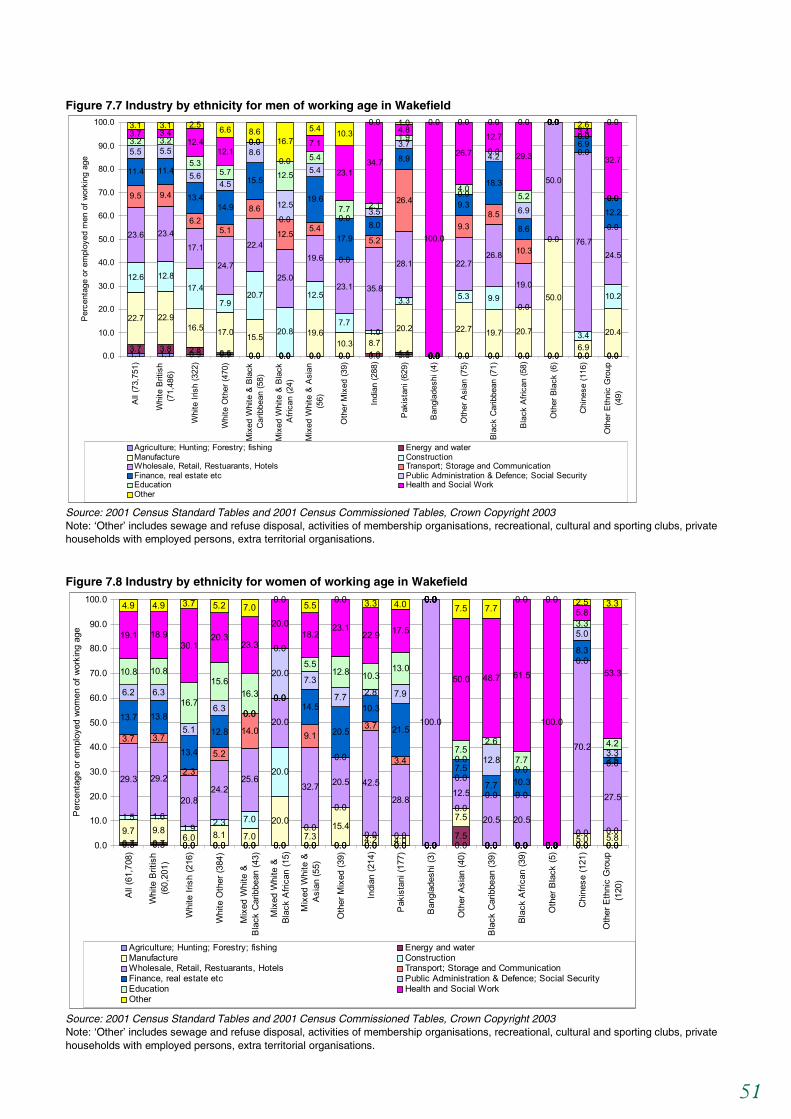
51
Figure 7.7 Industry by ethnicity for men of working age in Wakefield
1.1 1.1 0.9 0.9 0.0 0.0 0.0 0.0 0.0 0.6 0.0 0.0 0.0 0.0 0.0 0.0 0.03.7 3.8 2.8 0.6 0.0 0.0 0.0 0.0 1.0 1.1 0.0 0.0 0.0 0.0 0.0 0.0 0.0
22.7 22.916.5 17.0 15.5
0.0
19.610.3 8.7
20.2
0.0
22.7 19.7 20.7
50.0
6.9
20.4
12.6 12.817.4
7.920.7
20.8
12.5
7.71.0
3.3
0.0
5.3 9.90.0
0.0
3.4
10.2
23.6 23.417.1
24.7
22.4
25.0
19.6
23.1 35.8
28.1
0.0
22.726.8
19.0
50.0
76.724.5
9.5 9.4
6.25.1
8.6
12.55.4
0.0
5.2
26.4
0.0
9.38.5
10.3
0.0
0.0
0.0
11.4 11.4
13.414.9
15.5
0.0
19.6
17.98.0
8.9
0.0
9.3
18.3
8.6
0.0
6.9
12.2
5.5 5.5
5.64.5
8.6
12.5
5.4
0.03.5
3.7
0.0
0.0
4.2
6.9
0.00.0
0.0
3.2 3.2
5.35.7
0.0
12.5
5.4
7.7 2.1
1.9
0.0
4.0
0.0
5.2
0.00.0
0.0
3.7 3.412.4
12.10.0
0.0
7.1
23.134.7
4.8
100.0
26.7
12.7
29.3
0.03.4
32.7
3.1 3.1 2.5 6.6 8.616.7
5.4 10.30.0 1.0 0.0 0.0 0.0 0.0 0.0 2.6 0.0
0.0
10.0
20.0
30.0
40.0
50.0
60.0
70.0
80.0
90.0
100.0A
ll (7
3,75
1)
Whi
te B
ritis
h(7
1,48
6)
Whi
te Ir
ish
(322
)
Whi
te O
ther
(470
)
Mix
ed W
hite
& B
lack
Car
ibbe
an (5
8)
Mix
ed W
hite
& B
lack
Afri
can
(24)
Mix
ed W
hite
& A
sian
(56)
Oth
er M
ixed
(39)
Indi
an (2
88)
Pak
ista
ni (6
29)
Ban
glad
eshi
(4)
Oth
er A
sian
(75)
Bla
ck C
arib
bean
(71)
Bla
ck A
frica
n (5
8)
Oth
er B
lack
(6)
Chi
nese
(116
)
Oth
er E
thni
c G
roup
(49)
Per
cent
age
or e
mpl
oyed
men
of w
orki
ng a
ge
Agriculture; Hunting; Forestry; fishing Energy and waterManufacture ConstructionWholesale, Retail, Restuarants, Hotels Transport; Storage and CommunicationFinance, real estate etc Public Administration & Defence; Social SecurityEducation Health and Social WorkOther
Source: 2001 Census Standard Tables and 2001 Census Commissioned Tables, Crown Copyright 2003
Note: ‘Other’ includes sewage and refuse disposal, activities of membership organisations, recreational, cultural and sporting clubs, private households with employed persons, extra territorial organisations.
Figure 7.8 Industry by ethnicity for women of working age in Wakefield
0.3 0.3 0.0 0.0 0.0 0.0 0.0 0.0 0.0 0.0 0.0 0.0 0.0 0.0 0.0 0.0 0.00.7 0.7 0.0 0.0 0.0 0.0 0.0 0.0 0.0 0.0 0.07.5
0.0 0.0 0.0 0.0 0.09.7 9.8
6.0 8.1 7.0
20.0
7.315.4
4.2 4.0 0.0
7.5
0.0 0.0 0.05.0 5.8
1.5 1.61.9 2.3 7.0
20.0
0.0
0.0
0.0 0.00.0
0.0
0.0 0.0 0.00.0 0.0
29.3 29.2
20.824.2
25.6
20.0
32.7 20.5 42.5
28.8
100.0
12.5
20.5 20.5
0.0
70.2
27.5
3.7 3.7
2.3
5.2
14.0
0.0
9.1
0.0
3.7
3.4
0.0
0.0
0.0 0.0
0.0
0.0
0.0
13.7 13.8
13.4
12.8
0.0
0.014.5
20.5
10.3
21.5
0.0
7.5
7.7 10.3
0.0
8.3
2.5
6.2 6.3
5.1
6.3 0.0
20.07.3
7.7 2.8 7.9
0.0
0.0 12.80.0
0.0
5.0
3.3
10.8 10.8
16.7
15.616.3
0.0
5.512.8 10.3
13.0
0.0
7.52.6
7.7
0.0
3.3
4.2
19.1 18.930.1
20.323.3
20.018.2
23.122.9 17.5
0.0
50.0 48.7 61.5
100.0
5.8
53.3
4.9 4.9 3.7 5.2 7.00.0 5.5 0.0 3.3 4.0 0.0
7.5 7.70.0 0.0 2.5 3.3
0.0
10.0
20.0
30.0
40.0
50.0
60.0
70.0
80.0
90.0
100.0
All
(61,
708)
Whi
te B
ritis
h(6
0,20
1)
Whi
te Ir
ish
(216
)
Whi
te O
ther
(384
)
Mix
ed W
hite
&B
lack
Car
ibbe
an (4
3)
Mix
ed W
hite
&Bl
ack
Afri
can
(15)
Mix
ed W
hite
&A
sian
(55)
Oth
er M
ixed
(39)
Indi
an (2
14)
Pak
ista
ni (1
77)
Ban
glad
eshi
(3)
Oth
er A
sian
(40)
Bla
ck C
arib
bean
(39)
Blac
k A
frica
n (3
9)
Oth
er B
lack
(5)
Chi
nese
(121
)
Oth
er E
thni
c G
roup
(120
)
Per
cent
age
or e
mpl
oyed
wom
en o
f wor
king
age
Agriculture; Hunting; Forestry; fishing Energy and waterManufacture ConstructionWholesale, Retail, Restuarants, Hotels Transport; Storage and CommunicationFinance, real estate etc Public Administration & Defence; Social SecurityEducation Health and Social WorkOther
Source: 2001 Census Standard Tables and 2001 Census Commissioned Tables, Crown Copyright 2003
Note: ‘Other’ includes sewage and refuse disposal, activities of membership organisations, recreational, cultural and sporting clubs, private households with employed persons, extra territorial organisations.

52
White Other women in Wakefield were less likely than other residents, and than their counterparts at regional and national level, to occupy jobs in administrative and secretarial work. They were also less likely to have jobs in sales and customer service occupations, although more likely than their counterparts in the region or nationally to be in elementary occupations.
Industrial distribution of the employed population
By comparison with White Other men in England and the Yorkshire and The Humber region, Wakefield's White Other men were less likely to work in the education and transport sectors, and more likely to work in health and social work, manufacturing and construction. 17 per cent of men in the White Other group in Wakefield worked in construction (compared with 23 per cent of all men in the district), and 12 per cent were employed in health and social care (compared with 4 per cent of all men across the district). A quarter of White Other men in the district worked in the wholesale, retail, restaurants and hotels sector (compared with 24 per cent of all men in Wakefield and 23 per cent of all White Other men in England), and about one in five worked in manufacturing (compared with 23 per cent of all Wakefield's men and 16 per cent of White Other men in the region and 12 per cent in England).
Among White Other women in Wakefield, one in four worked in the wholesale, retail, restaurants and hotels sector; this was a higher concentration than found at the regional (20 per cent) and national (19 per cent) scale for White Other women, but lower than for all Wakefield's women (29 per cent). 20 per cent of White Other women in Wakefield worked in health and social work, a figure in line with that for White Other women in the region (20 per cent), but higher than for their counterparts nationally (15 per cent).
Wakefield's Indian population
Economic Activity 16-24 year olds
Compared with other young people in Wakefield, the district's Indian population contains proportionately more students - among men, 62 per cent, compared with 31 per cent; and among women, 60 per cent, compared with 35 per cent. There was virtually no unemployment among Indian young people of either sex in Wakefield. 26 per cent of young Indian men were in full-time employment in the district, and 24 per cent of young Indian women, compared with 50 per cent and 33 per cent in the district's overall 16-24 population. Full-time employment among Indian young people in Wakefield was higher than that found in this ethnic group in the
Yorkshire and The Humber region (19 per cent for men and 14 per cent for women) or in England as a whole (23 per cent and 21 per cent respectively).
Economic Activity 25 years - retirement age
Indian men and women in Wakefield had higher rates of full-time employment (75 per cent for Indian men, and 55 per cent for women) than either their counterparts in the Yorkshire and The Humber region or in England, or than the whole population in the district (71 per cent for men and 36 per cent for women). Indian women were less likely than other Wakefield residents to work as part-time employees (15 per cent of women, compared with 30 per cent, and 5 per cent of men, compared with 3 per cent). Among women, this figure was a little below those for their counterparts in the region or in England (16 per cent and 17 per cent respectively).
Full-time self-employment was more prevalent among Indian people in Wakefield than among other Wakefield residents, for both men and women. 31 per cent of Wakefield's Indian men were self-employed full-time, compared with 10 per cent of all Wakefield men, and with 20 per cent and 17 per cent of Indian men in the region and England respectively. 35 per cent of Wakefield's Indian women are self-employed full-time, compared with just 2 per cent of all women in the district, and with 8 per cent of Indian women in the region and 5 per cent nationally.
Occupations of the employed population
Wakefield's Indian population contains a higher proportion of both men and women who work in professional, associate professional or technical jobs than in the district's general working age population. Among men, 34 per cent were professionals and 35 per cent associate professionals, with the comparable figures for women 28 per cent and 21 per cent. This was also much higher than the figures for the Indian population at regional and national levels, for both women and men.
Consistent with this picture, Indian men in Wakefield were less likely than other residents, and than their counterparts at the regional and national levels, to hold jobs in skilled trades, administrative posts or as process, plant or machine operatives. Indian women in Wakefield were less likely to have jobs in sales and customer service occupations, although they were more likely to be in personal service positions, than Indian women in the region or in England as a whole. Indian men in Wakefield are less likely than other men in the district, or than men of their ethnic group nationally, to be in elementary occupations.

53
Industrial distribution of the employed population
By comparison with Indian men in England and the region, Wakefield's Indian men were less likely to work in the manufacturing, construction, transport and finance sectors, and more likely to work in the wholesale, retail, restaurants and hotels sector, in health and social work, and in public administration and education. Virtually no Indian men (or women) in the district were recorded as employed in either agriculture or construction. Over a third of Indian men in the district worked in health and social work (compared with 4 per cent of all men in Wakefield and 7 per cent of all Indian men in England), and 36 per cent worked in wholesale, retail, hotels and restaurants.
Indian women in Wakefield were much more likely to work in the wholesale, retail, hotels and restaurants sectors (43 per cent), compared with Indian women in the region (29 per cent), and in England (28 per cent). Their strong concentration in this sector means that they are less likely to work in other sectors where many Indian women are employed at national level, such as in education (10 per cent in Wakefield, compared with 15 per cent in the Yorkshire and The Humber region and with 20 per cent in England), or in manufacturing (4 per cent in Wakefield, compared with 12 per cent in the region and 13 per cent in England).
Wakefield's White Irish population
Economic Activity 16-24 year olds
The 2001 Census recorded just 32 White Irish men and 30 White Irish women in Wakefield in the 16-24 age group. Compared with other young people in Wakefield, the district's White Irish population contained proportionately more students - among men, 38 per cent, compared with 31 per cent; and among women, 67 per cent, compared with 35 per cent. 63 per cent of young White Irish men and 20 per cent of women in this group were in full-time employment in the district.
Economic Activity 25 years - retirement age
Mature White Irish women in Wakefield had similar rates of full-time employment (42 per cent) to their counterparts in the Yorkshire and The Humber region (41 per cent), a figure which is low by comparison with that for White Irish women in England (45 per cent), but higher than for all women in the district (36 per cent). However, women in this group were less likely than other Wakefield women to work as part-time employees (22 per cent, compared with 31 per cent). This figure compares with 26 per cent for similar women in the Yorkshire and The Humber region, and with 21 per cent in England.
White Irish men in Wakefield had lower rates of full-time employment (64 per cent) than either their counterparts at the regional (65 per cent) and English levels (69 per cent) or than all men in the district (71 per cent). 4 per cent of White Irish men in Wakefield were unemployed, compared with 4 per cent of all men in the district, and with 6 per cent of White Irish men in the region and 5 per cent nationally. White Irish men in Wakefield were more likely to be self employed (14 per cent) than men across the district (11 per cent) and they were also a little more likely than other Wakefield men to be permanently sick or disabled (13 per cent, compared with 12 per cent).
In contrast to Wakefield's White Irish men, White Irish women in the district were more likely than women across the district to be in full-time employment (42 per cent compared with 36 per cent). They were considerably less likely to be employed part-time (22 per cent compared with 30 per cent), but more likely to be permanently sick or disabled (11 per cent) than all women in the district (8 per cent) and than White Irish women the region (9 per cent) and England (8 per cent). 12 per cent of Wakefield's White Irish women were looking after their home and family full-time, compared with 15 per cent of all women in the district, and with 12 per cent of White Irish women in the Yorkshire and Humber region and 13 per cent in England.
Occupations of the employed population (employed and self-employed)
Wakefield's White Irish population contained a higher proportion of both men and women who worked as managers and senior officials (18 per cent of men and 12 per cent of women), in professional jobs (18 per cent of men and 15 per cent of women), or in associate professional and technical jobs (14 per cent of men, 20 per cent of women), than the district's general working age population. These figures are similar to those for White Irish men and women at the national scale.
White Irish men and women in Wakefield were less likely than other residents, and than their counterparts at the regional and national levels, to occupy jobs in sales and customer service (less than 1 per cent of men and 8 per cent of women). Women in this group were also less likely to work in administrative and secretarial jobs (10 per cent compared with 21 per cent of all Wakefield women), or in personal service positions (10 per cent compared with 13 per cent). White Irish men in Wakefield were also less likely than other men in the district to be in skilled trades (13 per cent compared with 21 per cent). This figure was also lower than for men of their ethnic group in the Yorkshire and The Humber region (16 per cent) or nationally (17 per cent).
54
Industrial distribution of the employed population (employed and self-employed)
By comparison with all White Irish men in England, Wakefield's White Irish men were less likely to work in the finance (13 per cent compared with 20 per cent) and construction (17 per cent compared with 20 per cent) sectors, and more likely to work in manufacturing (17 per cent compared with 13 per cent) and in health and social work (12 per cent compared with 5 per cent). However, when compared with all men in Wakefield, White Irish men in the district were under-represented in the manufacturing, transport and communications and wholesale, retail, restaurants and hotels sectors, and over-represented in the finance, education and health sectors.
White Irish women in Wakefield were more likely than White Irish women in the region or England as a whole to work in the wholesale, retail, restaurants and hotels sector (24 per cent, compared with 19 per cent in the Yorkshire and Humber region, and 17 per cent in England). Almost 1 in three White Irish women in Wakefield worked in health and social work, and one in six in education, sectors in which both other women in Wakefield and White Irish women at the regional (29 per cent in health and social work and 15 per cent in education) and national level (26 per cent and 13 per cent respectively) are similarly represented.
Key Points
• Wakefield has a small Black and Minority Ethnic population. Among people of working age, the Pakistani, White Other, Indian and White Irish populations are the largest.
• Economic activity indicators vary considerably between ethnic groups. For those aged 25+, 53 per cent of Indian women, were employed full-time, compared with 36 per cent of White British women, and with 9 per cent of Pakistani women. 11 per cent of men from Other Ethnic groups were unemployed, compared with 4 per cent and 3 per cent of men and women in the White British population.
• The occupational distribution of employed men and women in Wakefield also varies considerably by ethnicity as well as gender. 35 per cent of Indian men, and 21 per cent of Indian women, were in professional jobs, compared with 8 per cent of white British men and 7 per cent of White British women. 42 per cent of Pakistani men, but no Pakistani women, worked as plant, process or machine operatives, compared 18 per cent of White British men and with 4 per cent of White Irish and White British women.
• 23 per cent of White British men, and 10 per cent of White British women, worked in manufacturing industry in Wakefield, compared with 20 per cent of Pakistani men and 4 per cent of Pakistani women.
• Some industries in Wakefield have no people from certain ethnic groups within them. For example, within the district, none of the small resident populations of Chinese, Black Caribbean, Black African or Other Asian women worked in transport and communications, no Black African men worked in the construction industry, and no Chinese men worked in transport or public administration.

55
8. Work-Life Balance
This chapter explores a number of topics relevant to 'work-life balance', a concept which has received both policy and academic attention in recent years. Employers, trade unions, government and women and men themselves increasingly recognise that the ability to achieve an appropriate balance between paid work and other responsibilities and activities is important for all concerned.
In this chapter, we present the evidence on the availability and uptake of flexible employment options, consider new evidence on the prevalence and extent of caring responsibilities and present data on childcare provision.
Flexible Working Patterns
It is possible to use data from the Labour Force Survey to show the numbers of employees who stated that they had a regular flexible working arrangement allowing them to work flexi-time, annualised hours or term-time only. This is presented in Figure 8.1.
In Wakefield, fewer men had flexible working, compared with women. No men had 'term-time' only contracts compared with 5,591 women, over half of whom work part-time. Around 4,000 women and 4,000 men worked annualised hours. Among men, annualised hours contracts were only found among full-time workers, whereas for women almost a quarter of those with annualised hours worked part-time. Flexi-time was the most common form of flexible working, for women and men.
Comparison with the region and England shows that proportionally:
• more men in Wakefield who work part-time have flexi-time arrangements, but fewer men who work full-time have this arrangement
• the lack of men with part-time annualised hours contracts and 'term-time' working patterns in Wakefield contrasts with regional and national trends
• Wakefield's women who work part-time are less likely to have flexi-time, annualised hours or term-time only contracts than their regional or national counterparts
• among women working full-time women in Wakefield, more work annualised hours or hold term-time only contracts, but fewer have flexi-time arrangements, than at the regional or national levels.
Figure 8.1 Men and women in full-time and part-time employment in Wakefield with selected flexible working arrangements
Wakefield's employed men 77,781
Full-time Men 72,240
Part-time Men 5,631
Numbers % Numbers %
Flexitime 3, 292 4.6 723 12.8
Annualised Hours
3, 785 5.2 0 0
Term-time working
0 0 0 0
Wakefield's employed women 67,786
Full-time Women 32,658
Part-time Women 35,128
Numbers % Numbers %
Flexitime 2, 451 7.5 2, 354 6.7 Annualised Hours
3, 114 9.5 852 2.4
Term-time working
2, 356 7.2 3, 235 9.2
Comparative data
Employed men
Full-time Part-time
Yorks & The
Humber
England Yorks & The
Humber
England
Flexitime 7.1 8.1 5.8 6.2 Annualised Hours
3.3 3.6 2.2 2.0
Term-time working
1.3 0.9 3.1 3.2
Employed women
Full-time Part-time Yorks &
The Humber
England Yorks & The
Humber
England
Flexitime 13.0 12.6 9.3 9.0 Annualised Hours
4.6 4.6 3.4 3.8
Term-time working
6.1 4.9 10.9 10.7
Source: LFS, Autumn 2003, ONS
Figure 8.2 shows the percentages of men and women who had no flexibility in their working arrangements by whether they worked full-time or part-time. The pattern in

56
Wakefield was similar to that for the region and England as a whole, with the exception of women who work part-time in Wakefield, who experience a lesser degree of flexibility in their working arrangements than their counterparts in the region or nationally.
Figure 8.2 Percentage of men and women in employment with no flexibility in their working arrangements
0.0
10.0
20.0
30.0
40.0
50.0
60.0
70.0
80.0
90.0
100.0
Full-time Part-time Full-time Part-time
Males Females
Perc
enta
ge o
f peo
ple
in e
mpl
oym
ent
WakefieldYorks & HumberEngland
Source: LFS, Autumn 2003, ONS
Barriers to Employment
Labour market analysts recognise a range of factors which affect an individual's ability to access and enter employment. These include the existence of employment opportunities, infrastructural considerations such as public transport availability, and responsibilities or attributes which may act as barriers to employment in the absence of support systems. Childcare and caring responsibilities are commonly cited as barriers to employment, and this section therefore examines data relating to these important roles which are known to have a disproportionate impact on women.
Caring Responsibilities
In 2001, for the first time, the Census included a question asking people about any help or support which was not part of their paid employment which they gave to family members, friends, neighbours or others because of that person's long-term physical disability or mental ill-health, or disability or problems related to old age.
Figure 8.3 shows the number of hours of this 'unpaid care' provided by men and women of working age in Wakefield and its districts. At all geographical levels, women were more likely to provide unpaid care than men, and were also more likely to provide a high level of care (more than 50 hours per week). Both women and men in Wakefield provided more hours of 'unpaid' care than their counterparts regionally or nationally.
Figure 8.3 Provision of unpaid care by people of working age by sex
8.210.8
8.010.5
7.810.0
1.4
2.3
1.2
1.9
1.1
1.72.3
3.5
1.8
2.9
1.6
2.7
0.0
2.0
4.0
6.0
8.0
10.0
12.0
14.0
16.0
18.0
Males Females Males Females Males Females
Wakefield Yorks & Humber England
Perc
enta
ge o
f peo
ple
of w
orki
ng a
ge
1-19 hours 20-49 hours 50+ hours
Source: 2001 Census Standard Tables, Crown Copyright, 2003
There is considerable variation in the provision of unpaid care by people of different ethnicities. Figure 8.4 shows the proportion of unpaid care provided by men and women of working age for the main Black and Minority Ethnic groups in Wakefield. This shows differences in the proportion of people of working age who provide unpaid care across the different ethnic groups, but also that the local situation is different to that found at the regional level, which also differs from the national picture, with:
• a high proportion of Pakistani and White Irish men providing care in Wakefield, compared with the region and England as a whole
• a higher proportion of women and men from White Other backgrounds providing unpaid care in Wakefield
It is also possible to look at the amount of unpaid care that men and women provide by their economic activity. In Wakefield, 11 per cent of men and almost 16 per cent of women of working age in employment also provide unpaid care. This is greater than the regional and national picture. However, this again varies by ethnicity, as presented in Figure 8.5. This shows that in Wakefield:
• more Pakistani and White Irish men in Wakefield work and provide unpaid care than Pakistani and White Irish women, in contrast to the regional and national pictures
• proportionally more Pakistani and White Irish men are both in employment and providing 'unpaid' care than their national counterparts, while fewer Pakistani women than their counterparts nationally are in this situation.
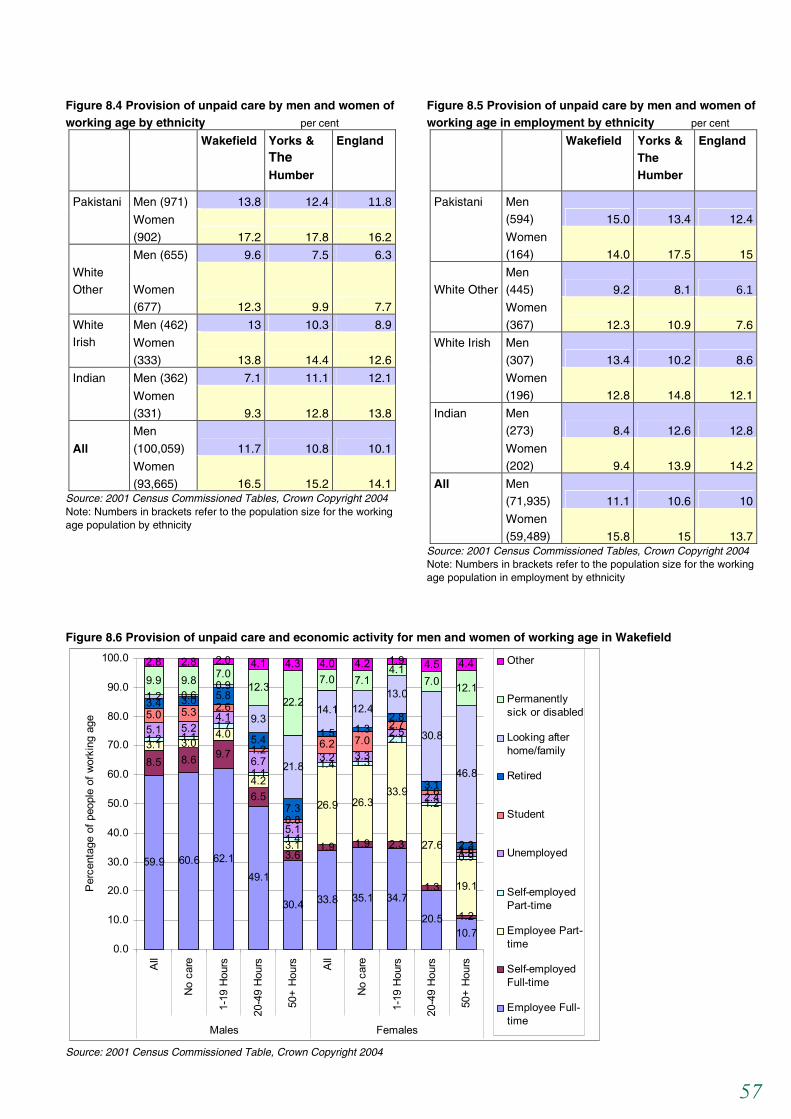
57
Figure 8.4 Provision of unpaid care by men and women of working age by ethnicity per cent Wakefield Yorks &
The Humber
England
Men (971) 13.8 12.4 11.8Pakistani
Women
(902) 17.2 17.8 16.2
Men (655) 9.6 7.5 6.3
White Other
Women (677) 12.3 9.9 7.7
Men (462) 13 10.3 8.9White Irish
Women
(333) 13.8 14.4 12.6
Men (362) 7.1 11.1 12.1Indian
Women (331) 9.3 12.8 13.8
Men
(100,059) 11.7 10.8 10.1All
Women
(93,665) 16.5 15.2 14.1Source: 2001 Census Commissioned Tables, Crown Copyright 2004 Note: Numbers in brackets refer to the population size for the working age population by ethnicity
Figure 8.5 Provision of unpaid care by men and women of working age in employment by ethnicity per cent Wakefield Yorks &
The Humber
England
Men (594) 15.0 13.4 12.4
Pakistani
Women (164) 14.0 17.5 15
Men (445) 9.2 8.1 6.1
White Other
Women
(367) 12.3 10.9 7.6
Men
(307) 13.4 10.2 8.6
White Irish
Women (196) 12.8 14.8 12.1
Men (273) 8.4 12.6 12.8
Indian
Women (202) 9.4 13.9 14.2
Men (71,935) 11.1 10.6 10
All
Women
(59,489) 15.8 15 13.7Source: 2001 Census Commissioned Tables, Crown Copyright 2004 Note: Numbers in brackets refer to the population size for the working age population in employment by ethnicity
Figure 8.6 Provision of unpaid care and economic activity for men and women of working age in Wakefield
59.9 60.6 62.149.1
30.4 33.8 35.1 34.7
20.510.7
8.5 8.6 9.7
6.5
3.61.9 1.9 2.3
1.3
1.2
3.1 3.04.0
4.2
3.1
26.9 26.333.9
27.6
19.1
1.2 1.11.7
1.1
1.4
1.4 1.3
2.1
1.2
0.9
5.1 5.24.1
6.7
5.1
3.2 3.3
2.5
2.4
1.5
5.0 5.3 2.6
1.2
0.8
6.2 7.02.7
1.6
1.0
3.4 3.0 5.8
5.4
7.3
1.5 1.32.8
3.1
2.3
1.2 0.60.9
9.3
21.8
14.1 12.413.0
30.8
46.8
9.9 9.8 7.012.3
22.2
7.0 7.14.1
7.0 12.1
2.8 2.8 2.0 4.1 4.3 4.0 4.2 1.9 4.5 4.4
0.0
10.0
20.0
30.0
40.0
50.0
60.0
70.0
80.0
90.0
100.0
All
No
care
1-19
Hou
rs
20-4
9 H
ours
50+
Hou
rs All
No
care
1-19
Hou
rs
20-4
9 H
ours
50+
Hou
rs
Males Females
Per
cent
age
of p
eopl
e of
wor
king
age
Other
Permanentlysick or disabled
Looking afterhome/family
Retired
Student
Unemployed
Self-employedPart-time
Employee Part-time
Self-employedFull-time
Employee Full-time
Source: 2001 Census Commissioned Table, Crown Copyright 2004

58
Figure 8.6 shows that there are more men working full-time and providing 50 or more hours of unpaid care (760) than women (386) in Wakefield. This is similar to the situation in the region and England. Also, as the amount of unpaid care people provide increases:
• men and women providing care are more likely to be permanently sick or disabled themselves, this is especially noticeable in working age men
• the proportion of people looking after their home and family increases.
• both men and women are less likely to be in paid work, especially full-time positions
Figure 6.8 in Chapter 6 showed that 14 per cent of women and 1.2 per cent of men of working age in Wakefield gave looking after their home or family as their reason for economic inactivity. This equates to 1,206 men and 13,096 women who look after their home and family full-time as their main activity. Women outnumbered men in this category by nearly 11 to 1. This response not only includes those women and men caring for a child, but also those caring for other family dependents. Figure 8.7 shows the amount of unpaid care that men and women who look after their home or family full-time provide. This shows a marked gender difference, with men in this role being much more likely to be carers of others who require support because of long-term ill-health or disability. In Wakefield, 40 per cent of men in this category are providing more than 50 hours or more care, compared with just 11 per cent of women.
Figure 8.7 Men and women of working age who look after their home and family and the provision of unpaid care
6.2 9.9 6.5 9.8 7.3 9.710.7 5.0 10.4 4.0 9.4 3.3
40.5
11.6
35.2
9.7
31.2
8.3
0.0
10.0
20.0
30.0
40.0
50.0
60.0
70.0
Men(1,202)
Women(13,099)
Men Women Males Females
Wakefield Yorks & Humber England
Perc
enta
ge o
f peo
ple
who
look
afte
r the
ir ho
me/
fam
ily 50+ hours20-49 hours1-19 hours
Source: 2001 Census Commissioned Table, Crown Copyright 2004
Childcare
Wakefield had fewer places available for children under 8 in all types of registered care than the region or England
Across the country, lack of available, affordable childcare is a significant barrier to women's employment. The combination of poor job and pay prospects and high childcare and associated transport costs, makes it uneconomic for many women to consider working before their children reach school age. Even for those with school age children, the multiple journeys involved in moving children between childcare providers, aggravated by a lack of flexible working options, may continue to exclude many women from taking up job opportunities.
Figure 8.8 shows places available for children under 8 in the following types of registered childcare:
• Childminders
• Full day care - including day nurseries, children's centres and family centres
• Sessional day care - day care for children under 8 for a session which is less than a continuous period of 4 hours per day
• Out-of-school care - day care for children under 8 which operates before or after school or during the school holidays
• Crèches - facilities that provide occasional care for children under 8
This figure shows the estimated number of places per 1,000 children for Wakefield, the Yorkshire and the Humber region and England. The data are published by Ofsted and relate to September 2003. In Wakefield, there were, overall, far fewer childcare places per 1,000 children than in the region and in England as a whole, in all the different types of provision.
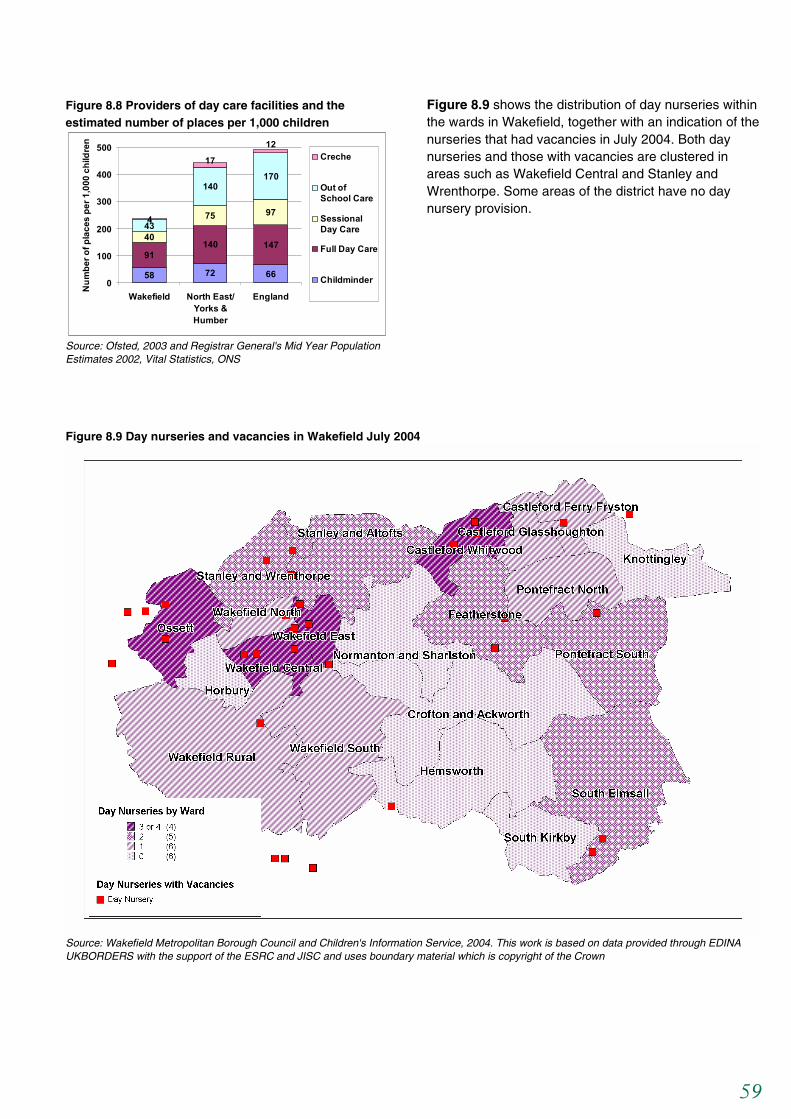
59
Figure 8.8 Providers of day care facilities and the estimated number of places per 1,000 children
58 72 66
91140 147
40
75 9743
140170
4
12
17
0
100
200
300
400
500
Wakefield North East/Yorks &Humber
England
Num
ber o
f pla
ces
per 1
,000
chi
ldre
n
Creche
Out ofSchool Care
SessionalDay Care
Full Day Care
Childminder
Source: Ofsted, 2003 and Registrar General's Mid Year Population Estimates 2002, Vital Statistics, ONS
Figure 8.9 shows the distribution of day nurseries within the wards in Wakefield, together with an indication of the nurseries that had vacancies in July 2004. Both day nurseries and those with vacancies are clustered in areas such as Wakefield Central and Stanley and Wrenthorpe. Some areas of the district have no day nursery provision.
Figure 8.9 Day nurseries and vacancies in Wakefield July 2004
Source: Wakefield Metropolitan Borough Council and Children's Information Service, 2004. This work is based on data provided through EDINA UKBORDERS with the support of the ESRC and JISC and uses boundary material which is copyright of the Crown
60
Key Points
• Men in Wakefield who work part-time are more likely to have flexitime arrangements, but fewer men who work full-time have this arrangement compared with their regional and national counterparts.
• There were no men recorded as having part-time annualised hours contracts and 'term-time' working patterns in Wakefield, in contrast with the regional and national pictures. Fewer women who work part-time have flexitime, annualised hours or 'term-time contracts.
• In Wakefield, a higher proportion of people from Pakistani, White Other and White Irish backgrounds provide unpaid care, compared with the picture in England as a whole.
• Pakistani and White Irish men in Wakefield are more likely to be in employment and provide unpaid care than Pakistani and White Irish women, in contrast to the regional and national pictures
• More men than women work full-time and provide 50 or more hours a week of unpaid care. Only 12 per cent of Wakefield women who provide 50 or more hours of unpaid care are also employed full-time. Many men who provide 50 or more hours a week of unpaid care are themselves permanently sick or disabled.
• Wakefield has fewer childcare places for the under 8s per 1,000 children than the region and England as a whole. Day nursery provision within Wakefield is concentrated in areas of high population, as are nurseries with vacancies. Large areas of Wakefield have no day nursery provision.

61
9. Looking Forward
Gender Profile of Wakefield's Labour Market
The Gender Profile of Wakefield will provide added value to Wakefield Metropolitan District Council because it will be used as an action-planning tool, which will inform Corporate Performance and Community engagement.
Fast Forward – The Wakefield District Community Strategy
The twenty five year vision for Wakefield which is set out in the Fast Forward Community Strategy will also be enriched by the findings of the gender profile and the subsequent work which is to be produced through the Gender and Employment in Local Labour Markets research project.
In 25 years time Wakefield district will be a place:
• Moving forward motivated by pride and its heritage
• Where our people look after themselves and each other so that they are safe and healthy, having the skills and confidence to take more control over their lives.
• With places that are attractive to live, learn, work and invest in and where our diverse towns and villages work together to promote the well being of the whole of the district
• Where together with the younger people of the District we will ensure that the work we do now will stand the test of time.
The Wakefield District Partnership which includes the Council, Police and Health Service and key stakeholders, including local people, voluntary organisations and businesses, will work together to achieve this vision.
Five key challenges for delivering the Fast Forward vision have been identified. We need to make sure that we:
• Are safe and feel safer
• Are healthy and look after ourselves
• Are part of a dynamic local economy
• Are skilful and confident by investing in our people
• Live in attractive environments by improving our places.
The findings of the Gender Profile will also be used by Corporate Human Resources and Services, within the Council, to ensure that we value and develop our employees in order to deliver modern, citizen-focused public services.
The information below indicates the ways in which the key findings of the profile links to existing Corporate work and Service Improvement plans.
Stepping Forward
Participation in the local labour market is highly gendered. This finding links to Stepping Forward initiative for women employees.
The aims of the Stepping Forward Initiative are:
• To assist the organisation in working towards the realisation of the economic potential and business benefits that women contribute to the workforce and our communities.
• To achieve proportionate representation of women across the profile of the organisation – representative of the people we are here to serve.
• To encourage and empower women to actively participate in public life.
• To enable women to develop their knowledge, confidence and experience in order to reach their full potential.
• To motivate change within the organisational culture and to promote flexibility, through initiatives such as work life balance, in order to eliminate discrimination, exclusion and injustice towards women.
• To influence local and national policies and strategies by articulating the issues and needs of women in areas such as health, education, social well-being, safety, terms and conditions of employment and equal pay.
• To develop effective networks, at local and national levels, sharing and disseminating good practice and learning from the experience of others.
• To invest in an environment which promotes creativity in pursuit of the Council’s aim to continuously improve service delivery.
The profile of the local labour market will also inform the Corporate HR strategy, workforce profiling and review, Corporate and Service Equality and Diversity Action Plans, Best Value Performance Indicators, Local
62
Government Equality Standards and external benchmarking work such as the annual Opportunity Now Benchmarking exercise.
As in the wider economy there are some significant pay gaps between men and women who are paid on a weekly basis. Working with Unions from the local district, the Council is undertaking an equal pay review. The outcomes of the review will help us to address this problem and produce a clear pay and reward strategy.
Informing Local Planning
Wakefield has fewer young people (age 20-24) than England as a whole. The lower rate of younger people in the district will have an impact on the current recruitment and selection review, succession planning, and apprenticeship schemes within the Authority. It will also inform the planning and strategic marketing of the annual Wakefield jobs fair.
Clearly there is work to be done in relation to raising the awareness of non-traditional forms of employment to our young people to tackle the gender segregation in the local labour market.
Wakefield has relatively high levels of social and economic deprivation. The information about areas of social and economic deprivation in Castleford Ferry Fryston, Hemsworth, and South Kirby will inform the Fast Forward Community Strategy, the work of the Community Cohesion Team and the Partnerships and Neighbourhoods Team and the Wakefield District Partnership.
A high proportion of people in Wakefield who have a limiting long-term illness. This will particularly impact on the work of Social Services and Health and our drive to improve Access to Services. Within the Council much is being done to improve the health of our employees with the support of The Occupational Health Unit and managers across the organisation and our sickness absence rate is continually reviewed.
There is a small Black and Minority Ethnic population in Wakefield. Whilst there is a small Black and Minority Ethnic population in Wakefield the Council recognises the need to engage with all communities of interest and create good relations with them. The Wakefield District Partnership has developed a Community Engagement Framework, as a means of achieving a joint approach to engaging with our citizens. Regular structured consultation has already been held
with the South Asian Community on education and cultural services matters. Engaging the Black and Minority Ethnic population in Wakefield will also be a key part of The Community Cohesion Plan, and The Corporate Equality and Diversity plan. This work of the Council will be assessed and reviewed through the Best Value Performance Indicators, Comprehensive Performance Assessment and Local Government Employment Standards benchmarking process.
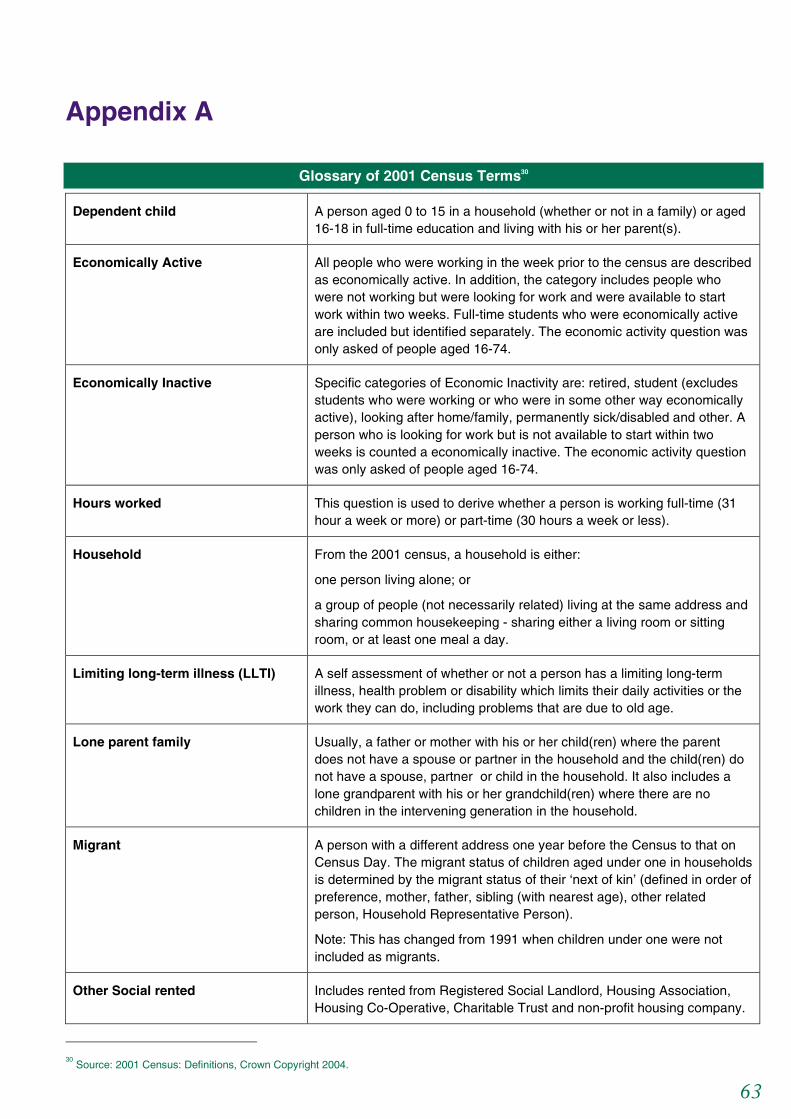
63
Appendix A
Glossary of 2001 Census Terms30
Dependent child A person aged 0 to 15 in a household (whether or not in a family) or aged 16-18 in full-time education and living with his or her parent(s).
Economically Active All people who were working in the week prior to the census are described as economically active. In addition, the category includes people who were not working but were looking for work and were available to start work within two weeks. Full-time students who were economically active are included but identified separately. The economic activity question was only asked of people aged 16-74.
Economically Inactive Specific categories of Economic Inactivity are: retired, student (excludes students who were working or who were in some other way economically active), looking after home/family, permanently sick/disabled and other. A person who is looking for work but is not available to start within two weeks is counted a economically inactive. The economic activity question was only asked of people aged 16-74.
Hours worked This question is used to derive whether a person is working full-time (31 hour a week or more) or part-time (30 hours a week or less).
Household From the 2001 census, a household is either:
one person living alone; or
a group of people (not necessarily related) living at the same address and sharing common housekeeping - sharing either a living room or sitting room, or at least one meal a day.
Limiting long-term illness (LLTI) A self assessment of whether or not a person has a limiting long-term illness, health problem or disability which limits their daily activities or the work they can do, including problems that are due to old age.
Lone parent family Usually, a father or mother with his or her child(ren) where the parent does not have a spouse or partner in the household and the child(ren) do not have a spouse, partner or child in the household. It also includes a lone grandparent with his or her grandchild(ren) where there are no children in the intervening generation in the household.
Migrant A person with a different address one year before the Census to that on Census Day. The migrant status of children aged under one in households is determined by the migrant status of their ‘next of kin’ (defined in order of preference, mother, father, sibling (with nearest age), other related person, Household Representative Person).
Note: This has changed from 1991 when children under one were not included as migrants.
Other Social rented Includes rented from Registered Social Landlord, Housing Association, Housing Co-Operative, Charitable Trust and non-profit housing company.
30
Source: 2001 Census: Definitions, Crown Copyright 2004.

64
Part-time working Working part-time is defined as working 30 hours a week or less.
Permanently sick/disabled A sub-category of ‘economically inactive’. There is no direct connection with limiting long-term illness.
Private rented This includes accommodation that is rented from a private landlord or letting agency, employer of a household member, relative or friend of a household member, or other non Social rented
Provision of unpaid care A person is a provider of unpaid care if they give help or support to family members, friends, neighbours or others because of long-term physical or mental health or disability, or problems related to old age. Note that there is no specific reference to whether this care is provided within the household or outside the household. Therefore, no explicit link can be created to infer than an individual providing care is providing it to a person within the household who has poor general health, or a LLTI, disability or health problem.
Unemployed A person is defined as unemployed if he or she is not in employment, is available to start work in the next two weeks and has either looked for work in the last 4 weeks or is waiting to start a new job. This is consistent with the International Labour Office (ILO) standard classification.
Working age Working age is defined as 16 to 64 for males and 16 to 59 for females.

65
Appendix B
Examples of Occupations in each of the main 2001 Census Occupational Categories31
Managers and Senior Officials
Senior officials in national and local government, directors and chief executives of major organisations
Managers in mining, energy and construction and production, works and maintenance managers
Marketing, sales, purchasing and financial managers and chartered secretaries, advertising and public relations managers
Personnel, training and industrial relations managers
Information and communication technology managers
Research and development, quality assurance, customer care managers
Financial institution, office managers
Transport, distribution, storage, warehouse, retail and wholesale managers
Officers in the Armed Forces, Police Inspectors and above, senior officers in fire, ambulance, prison and related services, security managers
Hospital, health service, pharmacy, healthcare practice managers, social services, residential and day care managers
Farm managers, managers in animal husbandry, forestry and fishing
Hotel and accommodation, conference and exhibition managers, restaurant and catering managers and publicans and managers of licences premises
Property, housing and land managers
Garage managers and proprietors
Hairdressers and beauty salon managers
Shopkeepers and wholesale/retail dealers
Recycling and refuse disposal managers
Professionals
Chemists, biological scientists, biochemists, physicists, geologists, meteorologists and engineers
31
Source: 2001 Census: Definitions, Crown Copyright 2004.
IT strategy and planning professionals, software professionals
Medical and dental practitioners, psychologists, pharmacists, pharmacologists, ophthalmic opticians, veterinarians
Higher, further, secondary, primary, nursery and special needs education teaching professionals
Education officers, school inspectors, registrars and senior administrators of educational establishments
Scientific and social science researchers
Solicitors, lawyers, judges and coroners
Chartered and certified accountants, management accountants and consultants, actuaries, economists and statisticians
Architects, town planners, quantity and chartered surveyors
Public service administrative professionals, social workers, probation officers, clergy, librarians, archivists and curators
Associate Professional and Technical Occupations
Science and engineering technicians
Draughtspersons and building inspectors, environmental health officers
Nurses, midwives, paramedics, medical and dental technicians, therapists, occupational hygienists
Youth and community workers, housing and welfare officers, careers advisers
NCOs and other ranks, police officers (sergeant and below), fire service officers (leading fire officer and below), prison service officers (below principal officer)
Artists, authors, writers, actors, dancers, musicians, graphic designers, journalists, sports players, sports coaches
Air traffic controllers, pilots, train drivers
Brokers, insurance underwriters, estate agents, auctioneers
Administrative and Secretarial Occupations
Civil service executive officers, administrative officers and assistants, local government clerical officers and assistants
Officers of non-governmental organisations

66
Credit controllers, accounts and wages clerks, book-keepers, other financial clerks, counter clerks
Filing and other records assistants, pensions, insurance and stock control clerks, transport and distribution clerks
Library assistants, database assistants, market research interviewers, telephonists, communication operators
Receptionists, typists and medical, legal, school, company and other secretaries and personal assistants
Skilled Trades
Farmers, horticultural trades, gardeners, groundsmen and groundswomen, agricultural and fishing trades
Smiths, forge workers, moulders, die casters, sheet metal and metal plate workers, shipwrights, riveters, welding trades, pipe fitters, tool and precision instruments makers and fitters
Motor mechanics and auto engineers, vehicle body builders and repairers, auto electricians, vehicle spray painters
Electricians, able jointers, TV, video and audio, computer, electrical/electronics engineers
Steel erectors, bricklayers, masons, roofers, slaters, plumbers, carpenters and glaziers, plasters, floorers, painters and decorators
Weavers, knitters, upholsterers, leather and related trades, tailors and dress makers
Printers, bookbinders, screen printers
Butchers, bakers, fishmongers, chefs, cooks
Glass and ceramics makers, furniture makers, musical instrument makers and tuners, goldsmiths, silversmiths, florists
Personal Service Occupations
Nursing auxiliaries and assistants, ambulance staff, dental nurses
Houseparents, residential wardens, care assistants and home carers
Nursery nurses, childminders, playgroup leaders, educational assistants
Veterinary nurses, animal care occupations
Sports and leisure assistants, travel agents and tour guides, air and rail travel assistants
Hairdressers, barbers, beauticians
Housekeepers, caretakers
Undertakers and mortuary assistants
Pest control officers
Sales and Customer Service Occupations
Sales and retail assistants, cashiers, checkout operators, telephone sale persons
Credit agents, debt, rent and other cash collectors
Market and street traders, merchandisers and window dressers
call centre agents/operators, customer care occupations
Process, Plant and Machines Operatives
Food, drink, tobacco, glass, ceramic, textile, chemical, rubber, plastics and metal making process operatives, electroplaters
Paper and wood machine operatives, coal mine, energy plant, water and sewage plant operatives
Assemblers, tyre, exhaust and windscreen fitters, sewing machinists
Scaffolders, road and rail construction and maintenance operatives
Heavy goods vehicle, van, bus, coach and taxi drivers, chauffeurs, driving instructors, seafarers and air transport operatives
Crane, fork-lift truck and agricultural machinery drivers
Elementary Occupations
Farm workers, labourers, packers
Postal workers
Hospital porters, hotel porters
Kitchen and catering assistants, waiters, waitresses, bar staff
Window cleaners, road sweepers, cleaners, refuse and salvage occupations
Security guards, traffic wardens, school crossing patrols, school mid-day assistants, car park attendance, shelf fillers.


Gender Profile of Wakefield’s Labour Market
Centre for Social Inclusion Sheffield Hallam University Howard Street Sheffield S1 1WB Tel 0114 225 5786 Fax 0114 225 5706 E-mail [email protected] Web www.shu.ac.uk/research/csi
ISBN 1 843 87102 5 © Sheffield Hallam University 2004
Gender and Employment in Local Labour Markets
This information can be made available in other formats. Please contact us for further details.
Dr Lisa Buckner Dr Ning Tang Professor Sue Yeandle
Centre for Social Inclusion
Related Documents