Final report Gender peer effects in the workplace A field experiment in call centres in India Deepshikha Batheja May 2020 When citing this paper, please use the title and the following reference number: F-18010-INC-1

Welcome message from author
This document is posted to help you gain knowledge. Please leave a comment to let me know what you think about it! Share it to your friends and learn new things together.
Transcript
Final report
Gender peer effects in the workplace
A field experiment in call centres in India
Deepshikha Batheja
May 2020
When citing this paper, please use the title and the followingreference number:F-18010-INC-1
Gender Peer Effects in the Workplace: A Field Experiment in
Indian Call Centers
Deepshikha Batheja*
JOB MARKET PAPER
May 28, 2020
Click here to access the latest version of the paper
Abstract
Several theories suggest that gender integration in the workplace may havenegative effects in gender-segregated societies. This paper presents the results of arandomized controlled trial on the effect of gender integration on work productivity.The study was implemented in call centers located in five Indian cities. A total of765 employees were randomized to either mixed gender teams (30-50% female peers)or control groups of same gender teams. I find precisely estimated zero effects onboth productivity (intensive margin) and share of days worked during the studyperiod (extensive margin) of being assigned to a mixed gender team. However,there is an overall increase in the secondary outcome of peer monitoring and teamsupport for women assigned to mixed gender teams relative to the control team. Formale employees, I find that conditional on being assigned to mixed gender teams,men with progressive gender attitudes have higher productivity than men withregressive gender attitude. There is an overall increase in the secondary outcomes ofknowledge sharing, dating and comfort with the opposite gender for male employeesin mixed gender teams, relative to all male teams.
*I am grateful for the invaluable guidance, immense support and unwavering encouragement overthe course of this project from my advisors, Anil Deolalikar, Sarojini Hirshleifer and Joseph Cummins.This paper has also benefitted from helpful comments from Steven Helfand, Michael Bates, CarolynSloane, Bree Lang, Matthew Lang, Gordon Dahl, Jonas Hjort and the faculty mentors as well as thefaculty mentors and selected workshop participants at the Ronald Coase Institute. I would like to thankthe International Growth Center (IGC), BLUM Initiative at UC Riverside and Graduate Division, UCRiverside (Dissertation Year Program Fellowship) for funding this project. I am grateful to the CEOsand center heads of partner call centers, Anil Sinha, Rajeev Jha and Sujit Sharma of Call-2-Connectand Kapil Sharma, Lakhan Joshi and Soham Ghosh of Five Splash for believing in the project andoffering their support. I appreciate the help of Ministry of Electronics and IT: Government of India,Software Technology Parks of India and Bihar Industries Association for introducing and recommendingthis project to call centers. Thanks also to Anil Kumar Vaishnav, Daizzy Sharma, Prabudh Rao Kaushal,Rajat Kumar and Priyanka Jadhav for their outstanding assistance in data collection. The RCT waspre-registered at the AEA registry with ID # AEARCTR-0003932.
Working Draft
1 Introduction
In the last two decades, the female labor force participation rates have been declining
in most South Asian countries, including India (ILO, 2017). This is in contradiction to
the female labor supply trend observed in the rest of the world during the same period.
Additionally, most occupations in South Asian countries (Duraisamy and Duraisamy,
2014) and the world (Goldin, 1994) are gender segregated with women sorting into lower
paying and lesser skill intensive jobs than their male counterparts. Removing the barriers
to entry in the workplace for women in these developing economies will be crucial in
boosting their labor supply (Goldin, 2014, 1994). However, adverse gender norms and
gender segregation practices in South Asia may further increase these entry barriers and
make firms skeptical of integrating women into the workplace (Chowdhury et al., 2018).1
Several theories suggest that gender integration in the workplace may have negative
effects in gender segregated societies. For many boys and girls in such traditional societies,
the very first prolonged interaction (as equals) with the opposite gender, outside of family
members happens in a workplace.2 Interaction among opposite genders is likely to lead
to psychic costs in the workplace in such a setting (Akerlof and Kranton, 2000; Bertrand
et al., 2015). This can have a negative impact on a firm's output if it comprises of a gender
diverse employee pool, especially of young workers. There can be negative externalities
of distraction in such a setting (Hamilton et al., 2012; Mas and Moretti, 2009). On
the other hand, gender diversity in the workplace can enhance competition, monitoring
and peer pressure among same gender peers if the workers want to impress the opposite
gender co-workers (Kandel and Lazear, 1992). The positive impacts can also be driven
by knowledge spillovers and mutual learning which can increase worker productivity in
diverse groups (Hamilton et al., 2012). Therefore, these competitive pressures could lead
to either positive or negative impacts on a worker’s performance in mixed gender work
environments. These impacts could be especially be negative for work performance of
female employees in such competitive settings (Niederle and Vesterlund, 2007).
The paper uses an individual level randomized controlled trial in Indian call centers
to study the effect of opposite gender co-workers in the workplace on work performance
of employees. I randomize employees in call centers in five cities in India into mixed
gender (30% to 50% females) and same gender teams. For male employees, I compare
1According to India Human Development Survey (IHDS), a nationally representative household sur-vey, over 58% of married women in India reported to be practicing purdah or seclusion of women frompublic observation. Around 52% of the respondents in my sample report that their mother or some otherfemale family member practices burkha/purdah.
2Even in coeducational schools, peer groups are institutionally determined by gender, by segregationof boys and girls in classrooms. In my sample, around 30% of people at baseline did not interact withthe opposite gender outside of their family, while in school. They either didn’t attend a co-educationalschool or if they did, boys and girls in these schools were not allowed to sit together.
1
Working Draft
the productivity of those assigned to mixed gender to those assigned to all male teams
(control group). For female employees, I compare productivity of those assigned to mixed
gender teams relative to those in all female teams. The study has a higher number of
male employees due to low proportion of female employees in the sample. This is because
the female labor force participation rate is low in India so there are fewer women in
the workplace relative to men. The randomization increased/intensified opposite gender
exposure for male employees in mixed teams and reduced it in the control group relative
to the status quo at baseline. A total of 765 employees (297 male employees in mixed
gender teams and 320 in all male teams and 67 female employees in mixed gender teams
and 81 in all female teams) were seated with their new teams for a median of 12 weeks.
Male and female co-workers in mixed gender teams were mapped to sit on alternate seats.
The daily level administrative data on productivity, which is internally collected by call
centers through automatic technology is used to study worker productivity. So, this paper
uses accurate, uniform and consistent measures of productivity for all workers.
A team is an important entity in call centers. In a typical call center, customer
support employees or agents are grouped to form teams and agents interact with their
team members on a daily basis in team meetings. As it is standard practice in call centers
for teams to be seated together, changing the gender composition of teams leads to change
in the gender composition of peers seated around a worker. Workers interact with agents
sitting next to them if they get stuck on a call and the team leader or manager is not
around.3 This interaction between nearby sitting agents takes place while waiting for calls
in the inbound processes. In the outbound processes, the agents typically take out time
between calls to talk to agents seated around them.4 The importance of peer effect in this
setting is supported by evidence from the economics literature that low-skilled or routine
tasks have significant and larger peer effects than high skill-intensive jobs (Cornelissen
et al., 2017; Ichino and Falk, 2005; Bandiera et al., 2010).
The daily level productivity data from both inbound and outbound businesses/processes
are aggregated to create a standardized index for productivity. The top three productiv-
ity variables are chosen for each of these kinds of processes after discussion and consensus
with the call center heads and the managers. After combining these three productivity
variables, the aggregate productivity is standardized within each process. The second
primary outcome used is share of days worked during the course of the study period.
3 Humanyze, a Boston based company uses sensors to analyze communication patterns among em-ployees in the workplace in retail, pharmaceutical and finance industries. In an interview with theWall Street Journal, the company’s CEO reveals their finding that immediate neighbors account for40% to 60% of everyday interactions for a worker, including face-to-face chats and email messages.There is as low as a 5% to 10% of average interaction per day with someone sitting two rows away.(https://www.wsj.com/articles/no-headline-available-1381261423 accessed in October, 2019)
4 66% of the respondents in the baseline survey agreed that they learnt something from the agentssitting next to them. When asked about whose help they seek when stuck on a call at the baseline, avast majority of agents responded that they took help from the team leader (67%) followed by agentsseated nearby (27%) and then others (6%).
2
Working Draft
This is an unconditional measure based on showing up to work so there are no selection
concerns.5
My main finding is that there is no effect on both productivity (intensive margin)
and share of days worked during study period (extensive margin) of being assigned to a
mixed gender team. Given that these are precisely estimated effects, these are important
findings as they provide supportive evidence for integrating women into the workplace.
It does not seem that hiring women will be costly for the firms, as there is no negative
impact on productivity or on share of days worked during study period if assigned a seat
next to an opposite gender employee. I also explore whether these findings are true for
all kinds of workers.
My second finding is that conditional on being assigned to mixed gender teams, women
with high autonomy have higher proportion of days worked in the study period than
women with low autonomy. Furthermore, women with higher autonomy had a higher
proportion of days worked of about 0.08 percentage points when assigned to mixed gender
teams. This result provides evidence that there is some peer effect on the extensive margin
of productivity for female employees, but only for those with relatively high empowerment
and decision making.
My third finding is that conditional on being assigned to mixed gender teams, male
employees with regressive gender attitudes have significantly lower productivity than
those with progressive gender attitudes. This indicates that interaction with women may
be costly for men with regressive gender attitudes. The significant positive impact of
gender integration on male employees with progressive gender attitudes on the other
hand, is useful evidence supporting gender interactions, especially for policy makers.
My final set of findings explore secondary outcomes using survey response at endline.
There is strong evidence of knowledge spillover and learning of 0.3σ (standard deviations)
for male employees assigned to mixed gender teams relative to control. The female
employees don’t exhibit any knowledge spillovers in the treatment. For female employees,
there is increase in peer monitoring and comfort for those assigned to mixed gender
teams. The female workers in mixed teams received 0.22σ (standard deviations) more peer
monitoring and support relative to the control group. This indicates that male employees
learn from female agents seated next to them, female employees feel comfortable around
these men and are willing to share their knowledge with them. The male employees
assigned to mixed gender teams are also significantly (around 16%) more comfortable
while receiving feedback infront of opposite gender coworkers in mixed gender teams,
than those in all male teams. I fail to find any treatment effects on gender attitude and
job satisfaction for both male and female employees.
There is also evidence of an overall increase in dating and socialization by 35% for male
employees assigned to mixed gender teams. In India, more than 90% of the marriages
5 A further assumption of monotonicity is made to avoid selection effects (Lee, 2002).
3
Working Draft
are arranged by the families (Centre for Monitoring Indian Economy, 2018). There is
high prevalence of caste-based segregation and intra-caste marriages, especially among
the poor. The increase in dating for men in mixed gender teams in the setting of small
town India (Patna, Udaipur and Hubli) is an important finding.
The study contributes to multiple threads of literature. To my knowledge, it is the
first individual-level randomized controlled trial to causally interpret the effect of gender
diversity of teams on employee performance.6 It builds on the literature on performance
of gender diverse business teams comprising of students. These studies change the gender
composition of group homework or project teams in undergraduate or graduate manage-
ment classes and look at group level outcomes of students (Hoogendoorn et al., 2013;
Hansen et al., 2006; Apesteguia et al., 2012). They find that equal or mixed gender
teams outperform male-dominated and female-dominated teams. An associated thread
in the literature studies gender diversity in boardrooms (Bertrand et al., 2018; Adams
and Ferreira, 2009; Ahern and Dittmar, 2012; Matsa and Miller, 2013). Their outcome
measures are firm’s value/profits and gender earnings gap. Some studies find a favorable
change in gender attitudes of males due to gender integration in the workplace in devel-
oped country work place settings (Dahl et al., 2018; Finseraas et al., 2016). However, this
RCT looks at individual level productivity measures as outcomes. Furthermore, all these
papers address this question in a developed country setting. This research question is
more relevant in the context of a developing country workplace, where gender is salient.
This paper also adds to the thread of experimental studies set in non-work settings in
India, which have shown how diversity has been successful in removing inter-group biases
(Rao, 2013; Beaman et al., 2009; Lowe, 2018).
Human resource allocation in the workplace such as seating and team alignments,
which maximize worker productivity are integral to the workplace and personnel man-
agement literature (Kaur et al., 2010). There is a broad literature of experimental studies
that test workplace heterogeneity and socialization in the workplace. This paper adds to
these studies that test the effect of diversity along ethnicity (Hjort, 2014) and national-
ity (Lyons, 2017) lines on employee performance. It also contributes to studies testing
the impact of social pressure, social incentives and social networks on worker productiv-
ity (Ichino and Falk, 2005; Mas and Moretti, 2009; Bandiera et al., 2010; Amodio and
Martinez-Carrasco, 2018; Park, 2019).
This study complements the large literature on impact of differential gender composi-
tion in classrooms on schooling outcomes of students. They find evidence of gender peer
effects on educational outcomes in kindergarten (Whitmore, 2005), elementary school
(Hoxby, 2000), middle school (Lee et al., 2014; Lu and Anderson, 2014; Black et al.,
2013; Gong et al., 2019), high school (Lavy and Schlosser, 2011; Jackson, 2012) and col-
6Randomization of team composition solves the endogeneity and selection problems associated withteam formation and also resolves Manski’s reflection problem (Manski, 1993)
4
Working Draft
lege level (Hill, 2017). There are some studies which find no effect of higher proportion
of opposite gender in classrooms on male student’s test scores or passing rates (Antecol
et al., 2016; Booth and Yamamura, 2016).
My findings have broad policy implications for integrating women into the workforce.
Even in the context of this study, some of the sample call centers receive financial subsidy
from the central government under India BPO Promotion Scheme (IBPS) to open up its
branches in smaller cities.7 The government of India is committed expanding BPOs to
smaller cities, with special provisions of incentive in IBPS for hiring women in order to
boost female labor force participation. Due to this scheme and the lower minimum wage
requirement in smaller towns, there are now many call centers opening up in smaller cities
in India. The evidence from this study can further add to the knowledge of the state and
firms and promote hiring of women in the smaller towns of India.
2 Call center setting
The field experiment took place in two Indian call center companies: Call-2-Connect
India Pvt. Ltd. and Five Splash Infotech Pvt. Ltd. Call2Connect India Pvt. Ltd. has
centers in the state of Bihar (Patna), Uttar Pradesh (Noida) and in a metropolitan city
in Maharashtra (Mumbai). Five Splash Infotech Pvt. Ltd. has centers in the state of
Rajasthan (Udaipur) and Karnataka (Hubli). All these five cities/locations were used in
this experiment.
Business Process Outsourcing companies perform certain contractual tasks or respon-
sibilities for other companies in order to help them to run smoothly. They provide both
voice and non-voice support to other companies. So, a call center usually has multiple
processes/tasks. The call centers in my study are domestic call centers, providing voice
support to local customers in different kinds of processes. The voice support processes
that they deal with are broadly divided into inbound and outbound processes. The
inbound processes provide customer support services to incoming calls. The inbound
processes in sample call centers provide help to all kinds of companies such as food de-
livery, financial technology, beauty retail etc. In outbound processes, calls are made to
customers to mostly make sales. In my sample, outbound calls are made during elections
by a political party as part of their campaign/advertisement. I have five inbound and
five outbound processes in the study.
2.1 Background on call center employees
The entry level BPO employees who make or receive calls are known as agents. Any
incoming agents/employees get hired for training on the recommendation of the human
7India BPO Promotion Scheme https://ibps.stpi.in/ (last accessed on 23rd September, 2019)
5
Working Draft
resource team after an interview. As the processes in the study are all dealing with
domestic customers, the entry-level worker requires local language spoken skills and some
basic computer training for the job. They are then trained usually for 5 to 10 days by the
training team, depending on the process requirement. They are taught the call script,
the call quality parameters such as courtesy on the phone, how to use the headsets and
computer software related to the process. After the training, they are required to take
a test to get certified to be an agent for a particular process. If they fail the test, they
have to leave. The training period is unpaid in many domestic call centers.
After an agent gets hired, they work 6 days a week with one day of the week as a
holiday (chosen by the agent). A regular workday for a full-time working agent involves
8 hours of logged-in time where the agent is active and available to take calls and one
hour of break. Each agent is allocated a computer system with the process information
software and a headset. In my sample, when an agent came to work (prior to the period
of the study), she had to look for a vacant seat in the assigned seating area for her team
and then login into the system with her unique identification number and password. The
incoming or outgoing calls are flashed on the computers of agents through a computerized
call queueing system. The agents cannot miss any calls if they are logged-in and idle.
When it is an agent's time for a break, they can log out of the system. Usually the entire
team cannot take lunch breaks together, especially in customer support services where a
certain number of agents are pre-decided to be logged-in at different times of day. This
is based on expected call volume during the day.
In a typical call center, agents work in teams helmed by the team leader/supervisor.
Team leaders supervise groups of 20 to 25 agents (team size), and provide those agents
with feedback about their performance using real-time information. The members of a
given team leader sit together, taking up 2-3 isles, making it easier for team leaders to
monitor agent performance and conduct on-floor team meetings. The agents are usually
allocated to the team leader but in many cases, the team leaders give their preference
of agents from a new batch of newly qualified workers. The team leaders in the chosen
centers are mostly male. The job role of the team leader also includes providing emotional
support and motivating the agents, incase of rude and difficult customer experience.
Assistant managers, also known as the operations manager, supervise the team leaders.
Agents are paid a fixed salary every month and rarely receive additional incentives. In
my sample, the agents are paid an approximate salary of $100-150 per month in smaller
cities and $150-220 per month in metropolitan cities with a rare scope of earning $15-20
extra per month depending on call volume. Based on performance, agents get eligible
to become team leaders after six months of experience and they get a salary hike of
anywhere between 30 to 50 % upon promotion.
6
Working Draft
2.2 Advantages of the call center setting
There are many advantages to choosing call centers to conduct this experiment about the
impact of gender composition of team members on employee performance. This industry
serves as an ideal setting for this study. First, despite most industries and occupations
in India being male dominated (Mondal, 2018) , the call centers or the Business Process
Outsourcing (BPO) sector employs large number of female employees at the agent level
(entry level jobs involving making calls as customer support representatives) due to their
comparative advantage in interpersonal skills (Jensen, 2012). About 50% of the BPO
employees are women in Tier-1 cities and about 20% to 40% in Tier-2 cities in India.8
Second reason for choosing this setting is that this is an entry level job and employs
young people with low prior exposure to opposite gender. The average age of an agent
is around 21 years in my sample. Since most employees are hired straight after high
school, they have low past exposure to the opposite gender. This is because even in co-
educational schools, peer groups are institutionally determined by gender, by segregation
of boys and girls in classrooms. In my sample, around 30% of people at baseline did not
interact with the opposite gender outside of their family, while in school. They either
didn’t attend a co-educational school or if they did, boys and girls in these schools were
not allowed to sit together. Domestic call center agents are used for this analysis as
it is expected that they have relatively lesser exposure to opposite gender compared to
English speaking call center agents catering to international clients.
A third reason is that there are productivity measurement advantages in this setting.
First, technology-based monitoring allows for consistent and exact measures of produc-
tivity. Second, all agents are aware of these top productivity variables and are provided
routine feedback on their individual performance on these variables. So, there is no kind
of information asymmetry about the productivity parameters, targets and performance
for some agents and not for the others. This is important to avoid any systematic bias in
effort of some agents due to lack of information. Third, agent’s incentive/pay is not tied
to her group performance. This helps in getting rid of any productivity measurement
concerns arising from free riding problems. Fourth, these productivity variables are im-
portant for the call center profitability so the results of this analysis are of interest and
are crucial to the successful operational management of these firms.
The final reason is that the features of this workplace resemble other workplace set-
tings across the world. Workers sit in cubicles next to each other and perform individually
assessed tasks. So, the results of this study have implications for other work settings be-
yond this specific industry. In the context of the call center industry setting, it is the
largest private sector employer in India, providing jobs to around 3.9 million people
(NASSCOM2017). The call centers in my study are located in both metropolitan and
8There is tier-wise classification of centers in India based on population into Metropolitan (Tier-1),urban and semi-urban centers center (Tier-2, Tier-3 and tier-4) and rural centers (Tier-5 and Tier-6)
7
Working Draft
small cities in India. The chosen call center partners had a similar management structure
to other call centers in India that were contacted in the course of this study. Some of these
call centers also receive a subsidy from the central government (India BPO Promotion
Scheme (IBPS)) for opening centers in Tier-2 and additional incentive for hiring female
employees. Therefore, the call centers are beginning to spread into small towns to avail
this subsidy and to cut costs.
3 Experimental Design
This RCT experimentally alters the gender composition of teams to study gender peer ef-
fects in the workplace. This section discusses the selection criteria of the the call centers,
randomization design, main outcomes and their data collection, empirical specification
and balance tests of randomization. The importance of teams in this setting is also dis-
cussed, along with the team bonding exercise which was carried out to increase knowledge
spillovers among new teammates.
3.1 Selection of study subjects
Agents from two BPO companies located in total five Indian cities were chosen for the
study. The study took place in 9 businesses/processes within these five centers. There
were several criteria for selection of these processes.
A challenge of the call center setting is that there is very high attrition - around
10-20% in smaller cities and as high as 30-40% in metropolitan cities. To circumvent this
problem, most of the call centers chosen are in small cities (Udaipur, Patna, Noida and
Hubli), so they experience lesser attrition. This also made it possible to study diversity
impacts on productivity across many states in India. In addition, the employees in small
towns are expected to have minimal opposite gender contact outside their family.
Another challenge is that most workplaces in India and these domestic call centers is
that they do not employ female employees in the evening shift. This is because labor laws
in India prohibit companies to employ women after 7 pm, unless special approval is taken
and sufficient security and conveyance is provided to the female employees. To cut costs
of arranging transport for female employees, the centers avoid hiring female employees in
evening shifts. So, full-time, morning shift agents are used for the analysis.
An important reason for choosing these particular centers was that there was gender
diversity in these centers and men and women were working together in the same shifts.
This allowed me to construct mixed gender teams. These centers had one or more pro-
cesses with atleast 60 agents (3 teams). In order to conduct this experiment, construction
of three teams (two mixed and one same gender team) was needed, which could be formed
with a process size of atleast 60 agents managed by three team leaders. In some ideal
8
Working Draft
cases, four teams could be formed and the gender composition of the process was almost
equal with similar numbers of men and women. The four teams that could be formed
were two mixed gender teams, one all-male team and one all-female team.
The processes that met these criteria were chosen to be in the study. Three processes
from a call center in Hubli (from the state of Karnataka), two processes from Noida (Uttar
Pradesh), two processes from Patna (Bihar), one process from Udaipur (Rajasthan) and
one from Mumbai (Maharashtra) were selected. Out of the chosen locations, Mumbai is
the most developed and is categorized as a metropolitan and Tier-1 city. Hubli, Noida
and Patna are less urbanized and are in the Tier-2 category. Udaipur in the state of
Rajasthan is in Tier-3 category. The North Indian states of Bihar, Rajasthan and Uttar
Pradesh in my study are known to perform poorly on the gender equality index than the
South Indian states of Maharashtra and Karnataka (SDG India Index Baseline report,
2018).9
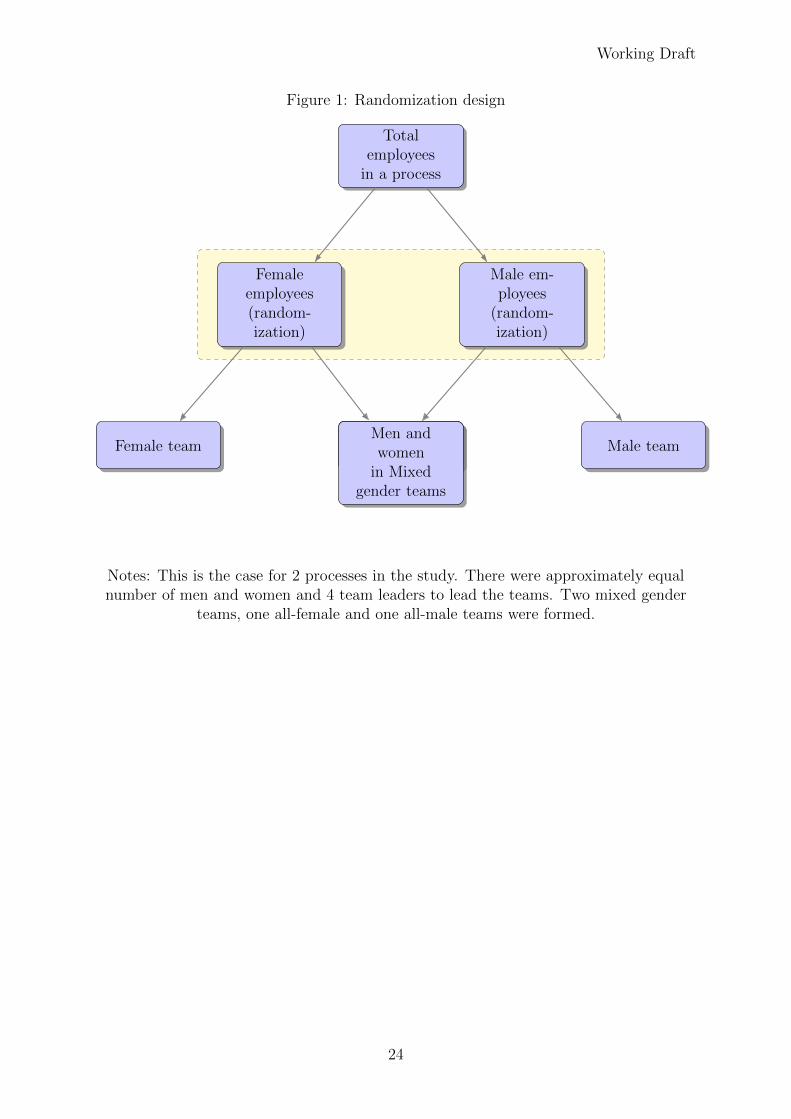
In processes with more than 60% males, two mixed-gender teams and one all male
team is constructed (See Figure 2). This is so that the total number of male employees
in the two mixed gender teams is approximately equal to the total number of male
employees in the same gender team. If the size of the process allowed for the formation of
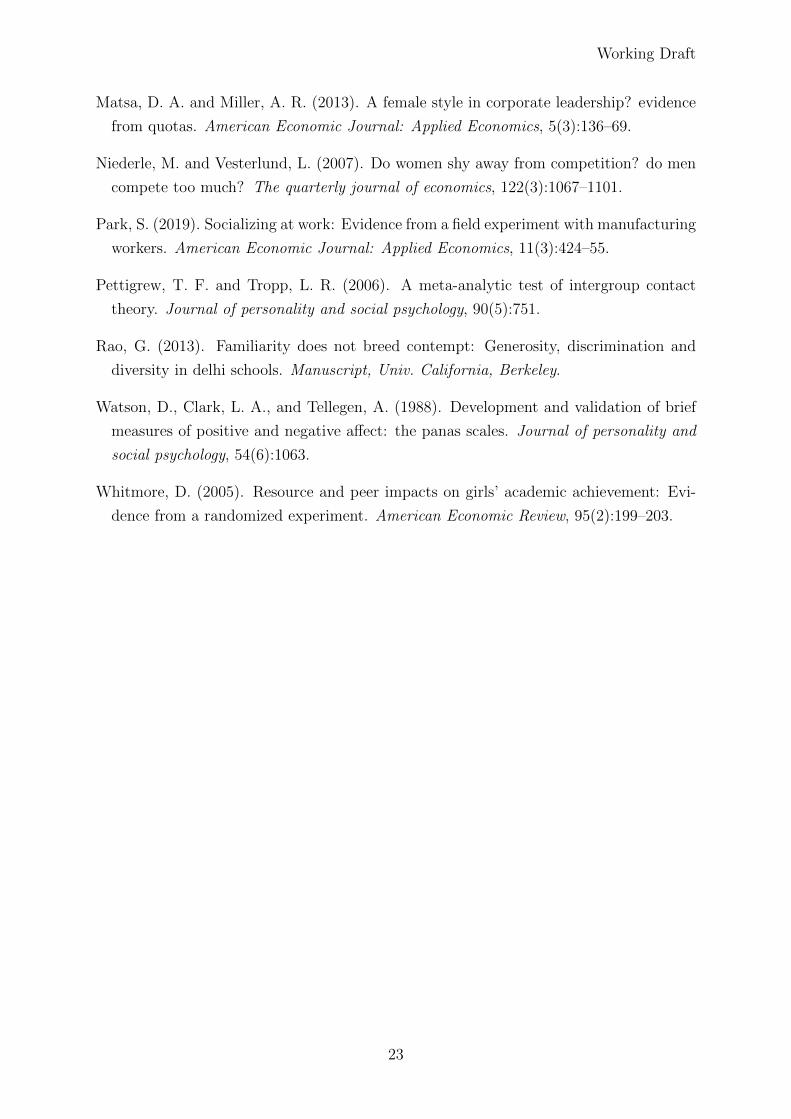
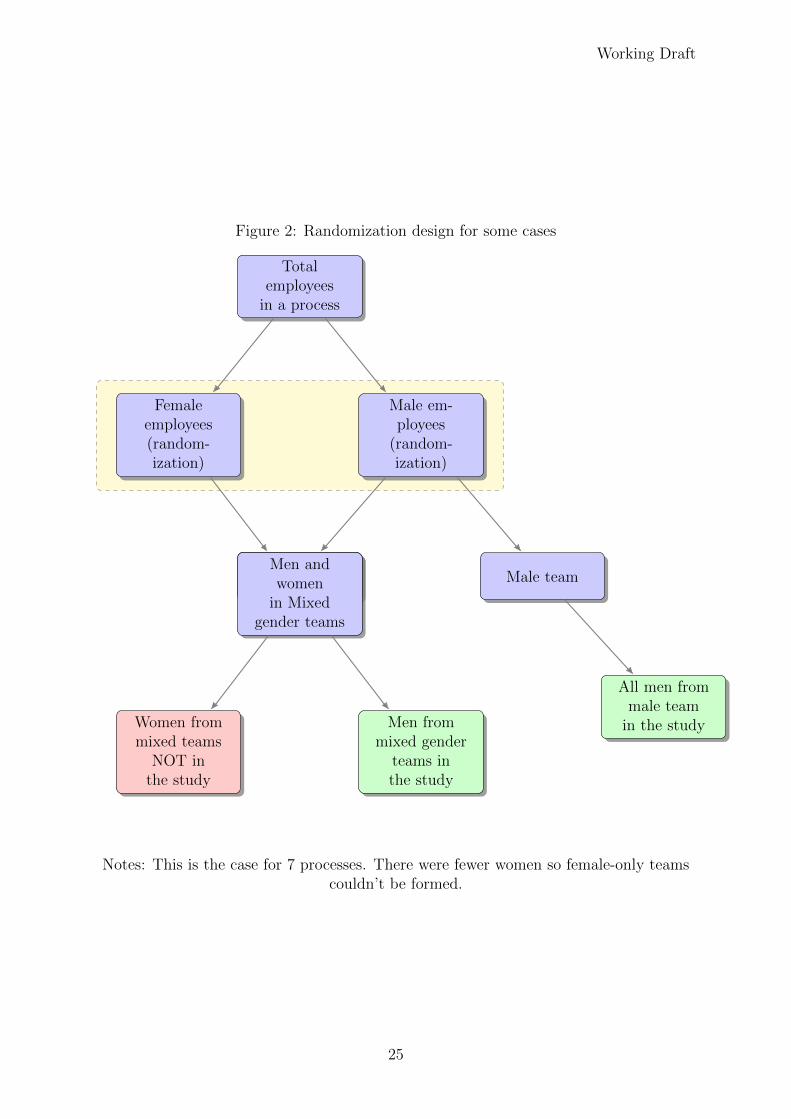
a fourth team, all female teams were constructed (See Figure 1). There is one morning-
shift process where there were greater number of female employees than male employees
(See Figure 3). In this process, two mixed gender and one all-female teams were formed.
There are three all female teams in the sample, with allocation in three different processes.
When the study began, the existing agents were aligned into teams for 6 to 14 weeks.
The new batches of employees that joined the processes in the course of the study were
also randomly assigned into teams.
3.2 Randomization
I use matched pair randomization method based on past productivity data to assign
individual agents into teams. Same gender agents belonging to a particular work-shift
are matched on their average performance. The average performance is calculated on
one of the chosen (by the company) productivity parameters from 3-4 weeks of pre-
study administrative data. These matched pairs of male agents are then assigned into
either treatment group (mixed gender team) or control group (male team) using random
number generator. The female employees are randomized into the various mixed groups
using random number generator. The same method of matched pair randomization is
9SDG Index developed by the United Nations and Niti Ayog, Government of India, for gender equalityincluded sex ratio at birth, average female to male wage gap, percentage of seats won by women in generalelections, percentage of ever married women who experienced intimate partner violence and percentageof women using modern methods of family planning. Bihar, Rajasthan, Delhi and Uttar Pradesh wereat the bottom ten and Karnataka and Maharashtra were in the top ten on this index.
9
Working Draft
followed in centers where female-only teams could be formed. The teams were made to
sit for 6 to 14 weeks based on status of the process.10
This batch of existing employees that was randomized on past productivity, will be
called the old batch. There were new batches of employees that joined during the course
of the study and in the absence of information of past productivity, random number
generators were used to assign them into teams. The team sizes and gender proportions
were maintained during these assignments. One of the processes in Patna was less than
a month old process so there was no information on past productivity available when the
team alignment took place. This process will also be called a new batch.
The same method of matched pair randomization is followed to assign team leaders
into treatment and control teams. The team leaders are first matched on the past per-
formance based on the average performance of the agents working in their team in the
pre-study period. One of each of the matched team leaders are assigned randomly to
either treatment or control group.
Prior to the study, flexible seating was followed in all the call centers. In the duration
of the study, seat was assigned wherever possible. In four inbound processes and one
outbound process, fixed seating assignments were followed. The seats were decided using
a random number generator. It was ensured that male and female employees in mixed
gender teams were assigned alternate seats. There were five outbound processes, where
fixed seating assignments could not be followed. However, even with flexible seating
followed within teams in these processes, it was ensured that male and female employees
in mixed gender teams sat on alternate seats. There was monitoring at the daily-level to
check if the seating plan was followed.
3.3 Teams in call centers
Team is an important entity in call centers. Even though it is individual-based work,
the industry promotes bonding among team members and encourages interaction among
opposite gender employees. This is crucial for mutual learning and potential knowledge
spillovers within teams. In the call centers in my sample, the job training involves train-
ers conducting interactive games among opposite gender trainees. They carry out these
interactive games to enhance communication and comfort among opposite gender em-
ployees on the work floor. The training teams also deploy various kinds of mixed-gender
seating plans in the training rooms for this purpose. However, usually the training period
is very short and not sufficient to break the gender barriers.
Once the agent comes to the floor, there are daily team meetings, usually in the
morning, in which team members receive feedback from their team leader on their previous
10The experiment went on for 12 to 14 weeks in most call centers -8 out of the 10 processes. One ofthe each process in Patna and Noida was shut down by the contracting company so the study could runfor 6 and 9 weeks respectively in these processes.
10
Working Draft
day’s performance. The interaction between nearby sitting agents also takes place while
waiting for calls in the inbound processes. In the outbound processes, the agents typically
take out time between calls to talk to agents seated around them, since they can’t move
around on the floor to socialize.
In order to further strengthen the bonding between the newly constructed teams, a
knowledge-sharing game was conducted.11 There are quality auditing teams within call
centers which listen to about 10-20% of randomly selected calls and give performance
scores to these calls based on a pre-decided metric. With the help of these quality
auditors and training teams, three calls recordings were selected - a call with excellent
quality score, a call with average score and a call with low score. As part of the study,
these three calls recordings were shared on the computer systems of agents using google
drives for one full workday. The agent were given a small notebook in which they had to
note down the strengths and shortcomings of the call, their suggestions for improvements
and any call-related issues they had faced in the past. They were given 5-7 most important
process-based quality criteria.12 Whenever the agents were waiting for calls, they would
listen to these call recordings and make notes.
Using a random number generator two members from a team were selected to be
‘buddies.’ From mixed gender teams, opposite gender employees were chosen to be bud-
dies. Team bonding exercises were played under the supervision of the research team
and the quality auditor in the conference room of the call center. Each set of buddies
were made to sit across from each other and asked to discuss and share their ideas on the
aforementioned points. The objective of the exercise was also to promote work-related
conversations.13
3.4 Main outcomes and data collection
The primary outcomes studied in this paper are work productivity and share of days
worked in the study period and the secondary measures are gender attitude, job satis-
faction, knowledge sharing, dating, peer monitoring and support and comfort with the
opposite gender. This study relies on various sources of data to study these outcomes:
(i) a baseline survey, (ii) administrative data from the firm, (iii) a follow-up survey at the
end of the study. The baseline data was collected before the randomization took place
through 30-40 minute long online survey of all agents within a process. The agents took
11A challenge was that all the team members could not leave the floor together at any given time inthe day and the call centers requested that the game be conducted in less than half an hour.
12The call recordings and quality parameters were chosen by the managers and quality auditors ofeach call center. The agents rated the calls on broadly these quality parameters 1) opening and closingsalutation/verbiage, 2) listening skills, 3) rapport building with the customer, 4) soft skills such ascourtesy and empathy, and 5) product and process knowledge.
13The learnings from this exercise about work related issues faced by the agents and the gaps intraining were shared with the management. They found it to be helpful in improving their training andoperations.
11
Working Draft
this online survey on their office computer systems in the presence of a member from the
survey team on-site. All agents within a team could not take the survey at once so team
members took the survey one at a time. The surveys took place usually in late afternoon
or evening, as there was lesser call volume during that time of the workday.
Baseline information was collected on family, education and employment background;
gender exposure and empowerment questions on past interaction with opposite gender,
autonomy and gender attitude, and potential mechanisms of stress, comfort in teams, self-
esteem, socialization etc. At the endline, right before the study ended, there was a short
15-20 minute online survey on the secondary outcome measures and the aforementioned
potential mechanisms. For processes in the first half of the study timeline, endline data
could not be collected for everyone in the sample as most of the agents had left by the end
of the study period. This was due to generally high attrition rates in this industry. For
the second half of the sample, the agents who had left the study midway were tracked and
requested for a survey response. So, the endline data is used only for the six processes in
the second half of the study.
For the main outcome of productivity, individual level daily performance data inter-
nally collected by the call centers is used. These measures of productivity are collected
automatically by the call center's technology-based monitoring system. The main out-
come measure will be the aggregate of the top three quantitative measures of agent
productivity, typically used by the call center to track performance. The exact measures
used depended on whether the agent worked in inbound or outbound processes.
The inbound processes provide customer support services to incoming callers, so their
main productivity measures are average call handling time (ACHT), number of calls and
net login hours. The firms gain profits if the agents receive a high number of calls, login
successfully for at least 8 hours and handle the calls in less amount of time. So, ACHT
is signed as negative in the data.
In outbound processes entailing sales calls, the primary productivity variables are
total sales made per day, total calls made per day and their ratio of total sales by calls
made per day. The firms gain profits if total sales made per day increases and if the
ratio of sales by calls also increases per day. So, the firms benefit if an agent has a high
sales conversion rate of calls i.e., she achieves daily sales targets by making fewer number
of calls. The total number of calls made per day in the outbound processes is therefore
signed as a negative.
Each individual productivity measure is standardized (with mean zero and a standard
deviation of one) relative to performance of members of the control group in a respective
process. These measures are aggregated for each process and then standardized again
using control group mean and variance. Thus, the outcome measure of productivity is
comparable across processes.
The second main outcome is share of days present in the study period. In the daily
12
Working Draft
level administrative productivity data, there is information on the productivity of all the
logged-in agents on any particular date. This gives information on who was present and
absent on each particular day of the study from the day of joining the study. Using this,
each agent is marked to be present on the days in the study for which their productivity
data is available and for other days, they are marked absent. Hence, share of days worked
during study period is calculated as:
Share of days worked during study period =Days present in the study period from joining
Number of days of the study(1)
The first secondary outcome measure of gender attitude is studied. A broad set of
questions are borrowed from the current literature on measuring women’s empowerment
and gender attitudes (Dhar et al., 2018; Glennerster et al., 2018). The broad topics
covered in these questions are education attitude, employment attitude, attitudes on
traditional gender roles and fertility attitudes. Each individual worker in the study is
surveyed on these questions prior to the start of the study (baseline) and towards the end
of the study (endline). A standardized index is formed each at the baseline and endline
using control group mean and standard deviation.
Another secondary outcome measure focused in the study is the job satisfaction level of
employees. It is collected at an individual level through baseline and endline surveys. To
determine job satisfaction, each employee is asked to evaluate her “emotional exhaustion”
using a standardized set of questions (Watson et al., 1988). The responses to these
questions standardized and are aggregated to form an index, using control group mean
and standard deviation.
Knowledge sharing within teams, peer monitoring and support, dating and comfort
while receiving feedback infront of opposite gender are other important secondary out-
comes studied. The individual employees were surveyed on these outcomes both at base-
line and endline. Only for the outcome, comfort while receiving feedback infront of op-
posite gender, baseline data was not collected. Mid-study qualitative survey of managers
about the expected impact of the study highlighted that male employees felt uncomfort-
able while receiving feedback from the team leaders infront of female employees, especially
if the feedback is negative. Therefore, this additional question was asked at the endline.
The exact questions asked for these variables is mentioned in the Appendix in the survey
questions section.
For all secondary outcomes, individual level survey responses collected at endline for
five of the nine processes in the study involving male employees is used for the analysis.
The endline data could not be collected for the entire sample for four processes due to
attrition during the study period. For the sample of five processes for which endline data
could be collected, workers were followed and surveyed even after they quit employment
13
Working Draft
at the call center in the study duration. For female employees, the endline responses
could be obtained for all the entire sample involving three processes.
3.5 Empirical Specification
To measure the average impact of treatment/gender exposure, I use intent-to-treat (ITT)
effects by regressing productivity and other outcomes on an indicator for mixed gender
team or gender integration treatment. All the outcomes have either multiple time-period
data or the same question was asked in both the baseline and follow-up surveys. The
main specification is the following ANCOVA specification to obtain β1:
Yigst = β0 + β1GenderIntegrationTreatmentigst + β2Yi,PRE
+ωs + υt + MissingBaselineDataigs + εigst(2)
Where Yigst is the given outcome variable measured post-treatment, and ‘i’ is agent, ‘g’
is team/group, ‘s’ is strata or the lowest unit of randomization (pair/shift/batch/process)
and ‘t’ is date. Gender-Integration-Treatmentigst is an indicator for the individual being
assigned to treatment arm. Yi,PRE is productivity of agent ‘i’ in strata ‘s’ at baseline.
For employees whose baseline productivity data is missing, the control mean value of 0
is assigned to them. Missing Baseline Dataigs is an indicator variable which takes the
value 1 if the employee was a new entrant and did not have any baseline productivity
information at the time of randomization, and it takes the value 0 if the employee had
baseline information. ωs is strata fixed effect, υt is date fixed effect and εist is the error
term. Standard errors are clustered at the team level to account for any correlated shocks
to productivity within teams.
This specification is run separately for male and female employees in the study. There
are 38 teams/clusters for male agents and 8 clusters for female employees. In cases where
an outcome variable was not collected at baseline, these same specifications is estimated
without the control for baseline outcome.
3.6 Randomization and Implementation Checks
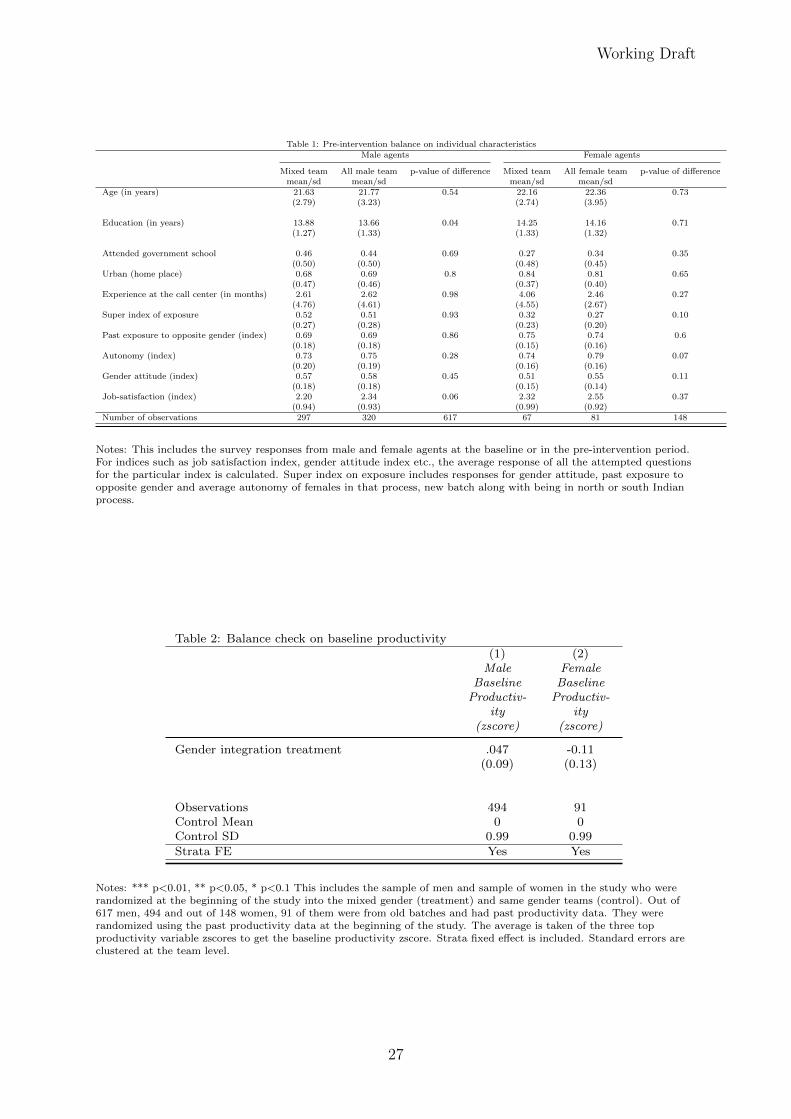
Balance checks in Tables 1and 2 show that the randomization was successful on baseline
productivity and other individual characteristics of the sample. These balance checks
are conducted after controlling for strata fixed effects (unit of randomization). The most
important variable for balance is baseline productivity and it passes the balance test by
failing to reject the null hypothesis that there is no difference between the treatment and
control groups. There were some employees who left the call center before the study
began. They were included in the initial randomization because the call centers provided
14
Working Draft
old employee lists or failed to remove the employees who had submitted their resignation
prior to the randomization. Therefore, a selective attrition test is also conducted on the
remaining sample of male employees after accounting for attrition. Appendix Table 1
shows that the treatment and controls arms were balanced on individual characteristics
after removing attriters.
4 Results
This section presents the results of the RCT on primary outcome measures. The evidence
on the extensive margins of productivity, share of days worked during the study period
is presented. On the intensive margin, impact on daily worker productivity is studied.
Heterogeneous effects of treatment is also highlighted in the second subsection followed
by the results on secondary outcomes.
4.1 Results on primary outcome measures
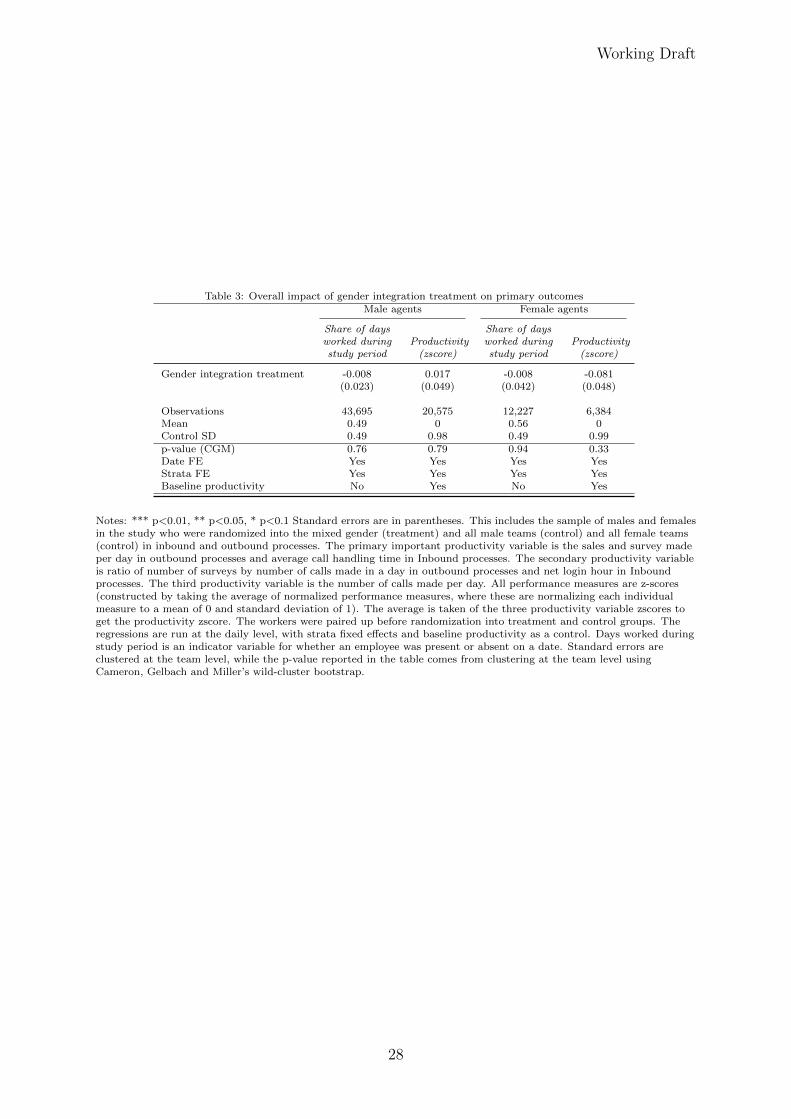
For both male and female employees, there is no overall impact of being assigned to
gender integration treatment on share of days worked during the study (Table 3). The
control mean for male employees is 0.49 or male employees in the control group worked
for around 50% of the days of the study. The effect of being assigned to a mixed gender
team meant a reduction of proportion of days worked by approximately 1.6% compared
to workers in all male teams (Table 3, column 1). The estimate is insignificant and is a
precisely estimated result with tight bounds around zero. The standard error is of 0.023
for male employees. The null value lies within 95% confidence interval [CI -0.037 to 0.053]
around the point estimate.
The female workers assigned to the control teams worked for a higher proportion of
days of about 56% in the study duration, than their male counterparts. The impact
of being assigned to mixed gender teams relative to same gender teams for females is
approximately 1.4% of lesser share of days worked during the study period (Table 3,
column 3). The standard errors for female employees at 0.042 is slightly larger than that
for male employees, because the sample size for females is smaller in the study. However,
the effect of gender integration treatment on share of days worked during study period
for female employees is also not distinguishable from zero [95% CI -0.074 to 0.09].
The overall effect of gender integration treatment on productivity is zero for both male
and female employees (Table 3). These effects are precisely estimated with tight bounds
around 0 at the 95% confidence interval. The impact of being assigned to mixed gender
teams on male productivity is 0.017σ (standard deviations) higher than the control mean
(Table 3, column 2). The standard error is 0.049 for male productivity and the null value
lies within the 95% confidence interval [CI -0.08 to 0.11].
15
Working Draft
For female workers, the overall impact of gender integration treatment on daily pro-
ductivity is -0.08σ (standard deviations) lesser than than the control group (Table 3,
column 4). With standard error 0.048, this is an insignificant result with the point es-
timate falling between the 95% confidence interval [CI -0.13 to 0.17]. These estimates
allow me to rule out gender peer effects on productivity that are fairly small.
4.2 Heterogeneous treatment effects on primary outcomes
I test for heterogeneity along baseline measures of low prior exposure to opposite gender
and regressive gender attitude for male employees on the primary outcomes of produc-
tivity and share of days worked during study period. An additional characteristic of
autonomy or decision making power for female employees is tested (Tables 4 and 5). The
survey responses on each of these characteristics are averaged for every respondent (See
Appendix section on survey questions) and then the median value of all the responses
based on gender is taken as cutoff to categorize same gender workers as high or low in
that particular characteristic. I do not find evidence for heterogeneity along these char-
acteristics on share of days worked during study period for male employees (Table 4,
columns 1 and 2).
I find that conditional on being assigned to mixed gender teams, women with high
autonomy have significantly higher share of days worked in the study than women with
low autonomy (Table 4, column 5). Women with higher autonomy had a significantly
higher proportion of days worked of about 0.08 percentage points when assigned to mixed
gender teams relative to the control group mean of 0.56 for all female teams. So, the
women with high baseline autonomy showed up to work approximately 14% more than
those assigned to control. For other characteristics for females, there is no evidence for
heterogeneity on this outcome measure (Table 4, columns 3 and 4). These results suggest
that there are no gender peer effects on the share of days worked during study period for
workers with low or high past exposure to opposite gender and workers with regressive
or progressive gender attitude.
While testing for heterogeneous treatment effect on daily level employee productivity,
I find that conditional of being assigned to treatment male employees with regressive
gender attitude have significantly lower productivity than those with progressive gender
attitude (Table 5, column 2). So, males with regressive gender attitudes show up to work
for the same proportion of days as men with regressive gender attitudes but have lower
daily productivity. I do not find any evidence for heterogeneity along past exposure to
opposite gender on productivity outcome, for either male or female employees (Table 5,
columns 1 and 3). For female employees there is no evidence on characteristics of attitude
and autonomy (Table 5, columns 4 and 5). This indicates that there is an overall zero
treatment effect on female productivity along the distribution of these individual charac-
16
Working Draft
teristics of opposite gender exposure, gender attitude and autonomy/ empowerment.
4.3 Results on secondary outcome measures
I explore secondary outcomes using survey response at endline for male employees and
find strong positive impacts on knowledge sharing, dating and comfort with opposite
gender (Table 6).14 There is a 0.3σ (standard deviations) increase in knowledge sharing,
which measures if the employee benefitted from agents sitting nearby on work related
issues (Table 6, column 3). This is a large treatment effect which provides evidence of
knowledge spillover and learning for male employees assigned to mixed gender teams.
This result is significant at the 5% level. It indicates that male employees learn from
female agents seated next to them.
There is an increase of 19 percentage points in dating for male employees in treatment
teams, higher than the mean dating of 0.54 in the all male teams (Table 6, column 4).
So, there was an increase of 35% in dating for male employees assigned to mixed gender
teams compared to the 54% dating in the control teams. This result is significant at the
5% level. However, the reporting is lower for this question as it was the last question
of the survey. A pre-intervention balance check was done on individual characteristics
for men who responded to the dating question and those who didn’t and the two groups
were found to be similar.
I also find a 0.05σ (standard deviations) increase in comfort while receiving feedback
infront of opposite gender employees for male employees, relative to the control group
mean of 0.32 (Table 6, column 6). This result is significant at the 5% level. The male
employees in mixed gender team were approximately 16% more comfortable with the
opposite gender than those in all male teams by the end of the study period.
For gender attitude of male employees, there is no evidence of any treatment affect.
There is a -0.19σ (standard deviations) decline in the gender attitude of male employees
assigned to mixed gender teams relative to the control group (Table 6, column 1). The
estimate is insignificant with a standard error of 0.2. It has bounds around zero at the
95% confidence interval [CI -0.58 to 0.19]. For other secondary outcome measures of
job satisfaction level and peer monitoring and support, I find similar precisely estimated
effects bounding zero. The treatment effect for job satisfaction is a small decrease of
-0.01σ (standard deviations) relative to the control group. This result is insignificant and
has a standard error of 0.17 [CI -0.18 to 0.16]. The treatment effect for peer monitoring
and support is 0.05σ (standard deviations) relative to the control group. This result is
not significant and has a standard error of 0.17 [CI -0.28 to 0.38].
For female employees, there is increase in peer monitoring and team comfort for those
14For male employees, the endline data is not available for the entire sample but for five of the nineprocesses. The result for these processes for which endline data is available is similar to the overall resultsfor main outcomes discussed in the previous sections (see Appendix table 2).
17
Working Draft
assigned to mixed gender teams (Table 7, column 5). The female workers in mixed teams
received 0.22σ (standard deviations) more peer monitoring and support relative to the
control group. This result is significant at the 1% level. So, even though female workers
don’t have a treatment effect on knowledge spillovers from their teammates or comfort
while receiving feedback from opposite gender, they seem to be receiving a lot of support
from their male peers if assigned to a mixed gender team. The results on knowledge
sharing and comfort with opposite gender are precisely estimated with bounds around
zero. There is a decline of 0.11σ (standard deviations) compared to the control group
mean on knowledge sharing (Table 7, column 3). This is not significant and with a
standard error of 0.14, the point estimate lies within a 95% confidence interval [CI -0.39,
0.17] which bounds zero.
Higher number of female employees reported to be comfortable with the opposite gen-
der (55%) compared to 32% of male employees in the control groups. Female employees
belonging to the same gender teams also have a higher incidence of dating than male
employees from all male teams by 8 percentage points. I find that the treatment effect
of being assigned to a mixed gender team on comfort with opposite gender while receiv-
ing feedback is 0.06σ (standard deviations) higher than the control (Table 7, column 6).
With a standard error of 0.13, the result is not significant and the point estimate lies
within the confidence interval bounding zero [-0.2 to 0.19].
The overall impact of treatment on dating among female employees is quite low at
0.1 percentage point or 1.6%. This is a precisely estimated zero effect with a standard
error of 0.16 falling within the 95% confidence interval [CI -0.31 to 0.32] around the point
estimate (Table 7, column 4). I find a large but insignificant impact of treatment on both
gender attitude and job satisfaction levels of female employees. The effect of treatment
on being assigned to mixed gender teams is 0.25σ (standard deviations) higher than the
control group with a standard error of 0.14 [95% CI 0.02 to 0.5] (Table 7, column 1). The
gender integration treatment effect on job satisfaction level is 0.27σ (standard deviations)
higher than the control with a standard error of 0.17 [95% CI 0.02 -0.06 to 0.6] (Table 7,
column 2).
5 Discussion and Conclusion
This study provides an experimental test of productivity impacts for employees with
mixed gender composition of peers in the workplace, against employees with same gender
peers. Competing forces of knowledge spillovers, dating and socialization, comfort and
peer monitoring are also studied. I find a precisely estimated overall zero effect on daily
productivity and share of days worked during study period for both males and females
assigned to mixed gender teams relative to control groups of same gender teams.
Research on productivity improvements in the high growth sector BPO industry is
18
Working Draft
crucial for sustainable job creation for many young workers, particularly women. Due
to growth and increases in employment opportunities, women who were previously doing
unpaid care work or informal work, are entering the formal labor market in regions like
Patna and Udaipur. These call centers also attract young workers from nearby villages
and small towns. The policy makers in India are interested in expanding this sector to
more of these smaller cities and even villages. Under the IBPS scheme, the government
gives incentives to firms to open up branches in these smaller places and also provides
additional incentive to call centers to hire female employees to boost their labor supply.
The paper provides supportive evidence to strengthen the objective of the policy makers.
It also informs firms skeptical of integrating women into the workplace that integration
of women into the workplace is not costly, as gender diversity and interactions in the
workplace do not impact the productivity of a worker negatively.
Even though this study has implications on all kinds of gender diverse workplaces,
there might be more positive effects on the intensive margin of productivity in places
with lesser gender discrimination and progressive gender attitudes for male employees.
Similarly, the treatment effects on extensive margins of share of days worked during study
period may be higher for women with higher autonomy. Increases in knowledge sharing,
peer monitoring and comfort of receiving feedback infront of opposite gender in mixed
gender teams is evidence that there is higher knowledge spillovers in gender integrated
settings. Therefore, the firms may benefit from policies of gender-integrated seating, such
as the one practiced in the study in mixed gender teams with alternate seating of opposite
gender employees in increasing knowledge spillovers and learning for male employees and
peer monitoring and comfort for female employees. This may prove a low cost way of
increasing learning among coworkers in firms.
In India, more than 90% of the marriages are arranged by the families (Centre for
Monitoring Indian Economy, 2018). There is high prevalence of caste-based segregation
and intra-caste marriages especially among the poor. The increase in dating for men in
mixed gender teams in the setting of mostly small town India, is an interesting finding.
19
Working Draft
References
Adams, R. B. and Ferreira, D. (2009). Women in the boardroom and their impact on
governance and performance. Journal of financial economics, 94(2):291–309.
Ahern, K. R. and Dittmar, A. K. (2012). The changing of the boards: The impact on
firm valuation of mandated female board representation. The Quarterly Journal of
Economics, 127(1):137–197.
Akerlof, G. A. and Kranton, R. E. (2000). Economics and identity. The Quarterly Journal
of Economics, 115(3):715–753.
Amodio, F. and Martinez-Carrasco, M. A. (2018). Input allocation, workforce man-
agement and productivity spillovers: Evidence from personnel data. The Review of
Economic Studies, 85(4):1937–1970.
Antecol, H., Eren, O., and Ozbeklik, S. (2016). Peer effects in disadvantaged pri-
mary schools evidence from a randomized experiment. Journal of Human Resources,
51(1):95–132.
Apesteguia, J., Azmat, G., and Iriberri, N. (2012). The impact of gender composition on
team performance and decision making: Evidence from the field. Management Science,
58(1):78–93.
Bandiera, O., Barankay, I., and Rasul, I. (2010). Social incentives in the workplace. The
review of economic studies, 77(2):417–458.
Beaman, L., Chattopadhyay, R., Duflo, E., Pande, R., and Topalova, P. (2009). Powerful
women: does exposure reduce bias? The Quarterly journal of economics, 124(4):1497–
1540.
Bertrand, M., Black, S. E., Jensen, S., and Lleras-Muney, A. (2018). Breaking the glass
ceiling? the effect of board quotas on female labour market outcomes in norway. The
Review of Economic Studies, 86(1):191–239.
Bertrand, M., Kamenica, E., and Pan, J. (2015). Gender identity and relative income
within households. The Quarterly Journal of Economics, 130(2):571–614.
Black, S. E., Devereux, P. J., and Salvanes, K. G. (2013). Under pressure? the effect of
peers on outcomes of young adults. Journal of Labor Economics, 31(1):119–153.
Booth, A. L. and Yamamura, E. (2016). Performance in mixed-sex and single-sex tour-
naments: What we can learn from speedboat races in japan.
20
Working Draft
Chowdhury, A. R., Areias, A. C., Imaizumi, S., Nomura, S., and Yamauchi, F. (2018).
Reflections of employers’ gender preferences in job ads in India: an analysis of online
job portal data. The World Bank.
Cornelissen, T., Dustmann, C., and Schonberg, U. (2017). Peer effects in the workplace.
American Economic Review, 107(2):425–56.
Dahl, G., Kotsadam, A., and Rooth, D.-O. (2018). Does integration change gender atti-
tudes? the effect of randomly assigning women to traditionally male teams. Technical
report, National Bureau of Economic Research.
Dhar, D., Jain, T., and Jayachandran, S. (2018). Reshaping adolescents’ gender attitudes:
Evidence from a school-based experiment in india. Technical report, National Bureau
of Economic Research.
Duraisamy, M. and Duraisamy, P. (2014). Occupational segregation, wage and job dis-
crimination against women across social groups in the indian labor market: 1983–2010.
Preliminary Draft. Accessed on, 11(08):2017.
Finseraas, H., Johnsen, A. A., Kotsadam, A., and Torsvik, G. (2016). Exposure to
female colleagues breaks the glass ceiling—evidence from a combined vignette and
field experiment. European Economic Review, 90:363–374.
Glennerster, R., Walsh, C., and Diaz-Martin, L. (2018). A practical guide to measuring
women’s and girls’ empowerment in impact evaluations. Gender Sector, Abdul Latif
Jameel Poverty Action Lab.
Goldin, C. (1994). The u-shaped female labor force function in economic development
and economic history. Technical report, National Bureau of Economic Research.
Goldin, C. (2014). A grand gender convergence: Its last chapter. American Economic
Review, 104(4):1091–1119.
Gong, J., Lu, Y., and Song, H. (2019). Gender peer effects on students’ academic and
noncognitive outcomes: Evidence and mechanisms. Journal of Human Resources, pages
0918–9736R2.
Hamilton, B. H., Nickerson, J. A., and Owan, H. (2012). Diversity and productivity in
production teams. In Advances in the Economic Analysis of participatory and Labor-
managed Firms, pages 99–138. Emerald Group Publishing Limited.
Hansen, Z., Owan, H., and Pan, J. (2006). The impact of group diversity on performance
and knowledge spillover–an experiment in a college classroom. Technical report, Na-
tional Bureau of Economic Research.
21
Working Draft
Hill, A. J. (2017). The positive influence of female college students on their male peers.
Labour Economics, 44:151–160.
Hjort, J. (2014). Ethnic divisions and production in firms. The Quarterly Journal of
Economics, 129(4):1899–1946.
Hoogendoorn, S., Oosterbeek, H., and Van Praag, M. (2013). The impact of gender
diversity on the performance of business teams: Evidence from a field experiment.
Management Science, 59(7):1514–1528.
Hoxby, C. (2000). Peer effects in the classroom: Learning from gender and race variation.
Technical report, National Bureau of Economic Research.
Ichino, A. and Falk, A. (2005). Clean evidence on peer effects. Journal of Labor Eco-
nomics, 24.
Jackson, C. K. (2012). Single-sex schools, student achievement, and course selection:
Evidence from rule-based student assignments in trinidad and tobago. Journal of
Public Economics, 96(1-2):173–187.
Kandel, E. and Lazear, E. P. (1992). Peer pressure and partnerships. Journal of political
Economy, 100(4):801–817.
Kaur, S., Kremer, M., and Mullainathan, S. (2010). Self-control and the development of
work arrangements. American Economic Review, 100(2):624–28.
Lavy, V. and Schlosser, A. (2011). Mechanisms and impacts of gender peer effects at
school. American Economic Journal: Applied Economics, 3(2):1–33.
Lee, S., Turner, L. J., Woo, S., and Kim, K. (2014). All or nothing? the impact of school
and classroom gender composition on effort and academic achievement. Technical
report, National Bureau of Economic Research.
Lowe, M. (2018). Unity in cricket: Integrated leagues and caste divisions.
Lu, F. and Anderson, M. L. (2014). Peer effects in microenvironments: The benefits of
homogeneous classroom groups. Journal of Labor Economics, 33(1):91–122.
Lyons, E. (2017). Team production in international labor markets: Experimental evidence
from the field. American Economic Journal: Applied Economics, 9(3):70–104.
Manski, C. F. (1993). Identification of endogenous social effects: The reflection problem.
The review of economic studies, 60(3):531–542.
Mas, A. and Moretti, E. (2009). Peers at work. American Economic Review, 99(1):112–45.
22
Working Draft
Matsa, D. A. and Miller, A. R. (2013). A female style in corporate leadership? evidence
from quotas. American Economic Journal: Applied Economics, 5(3):136–69.
Niederle, M. and Vesterlund, L. (2007). Do women shy away from competition? do men
compete too much? The quarterly journal of economics, 122(3):1067–1101.
Park, S. (2019). Socializing at work: Evidence from a field experiment with manufacturing
workers. American Economic Journal: Applied Economics, 11(3):424–55.
Pettigrew, T. F. and Tropp, L. R. (2006). A meta-analytic test of intergroup contact
theory. Journal of personality and social psychology, 90(5):751.
Rao, G. (2013). Familiarity does not breed contempt: Generosity, discrimination and
diversity in delhi schools. Manuscript, Univ. California, Berkeley.
Watson, D., Clark, L. A., and Tellegen, A. (1988). Development and validation of brief
measures of positive and negative affect: the panas scales. Journal of personality and
social psychology, 54(6):1063.
Whitmore, D. (2005). Resource and peer impacts on girls’ academic achievement: Evi-
dence from a randomized experiment. American Economic Review, 95(2):199–203.
23
Working Draft
Figure 1: Randomization design
Totalemployees
in a process
Male em-ployees
(random-ization)
Male teamMen in
mixed teams
Femaleemployees(random-ization)
Men andwomen
in Mixedgender teams
Female team
Notes: This is the case for 2 processes in the study. There were approximately equalnumber of men and women and 4 team leaders to lead the teams. Two mixed gender
teams, one all-female and one all-male teams were formed.
24
Working Draft
Figure 2: Randomization design for some cases
Totalemployees
in a process
Male em-ployees
(random-ization)
Male team
All men frommale team
in the study
Men inmixed teams
Femaleemployees(random-ization)
Men andwomen
in Mixedgender teams
Men frommixed gender
teams inthe study
Women frommixed teams
NOT inthe study
Notes: This is the case for 7 processes. There were fewer women so female-only teamscouldn’t be formed.
25
Working Draft
Figure 3: Randomization design for one case
Totalemployees
in a process
Male em-ployees
(random-ization)
Men inmixed teams
Femaleemployees(random-ization)
Men andwomen
in Mixedgender teams
Men frommixed genderteams NOTin the study
Women frommixed teamsin the study
Female team
All womenfrom female
team inthe study
Notes: This is the case for 1 morning shift process in Udaipur. There were fewer men somale-only teams couldn’t be formed.
26
Working Draft
Table 1: Pre-intervention balance on individual characteristicsMale agents Female agents
Mixed team All male team p-value of difference Mixed team All female team p-value of differencemean/sd mean/sd mean/sd mean/sd
Age (in years) 21.63 21.77 0.54 22.16 22.36 0.73(2.79) (3.23) (2.74) (3.95)
Education (in years) 13.88 13.66 0.04 14.25 14.16 0.71(1.27) (1.33) (1.33) (1.32)
Attended government school 0.46 0.44 0.69 0.27 0.34 0.35(0.50) (0.50) (0.48) (0.45)
Urban (home place) 0.68 0.69 0.8 0.84 0.81 0.65(0.47) (0.46) (0.37) (0.40)
Experience at the call center (in months) 2.61 2.62 0.98 4.06 2.46 0.27(4.76) (4.61) (4.55) (2.67)
Super index of exposure 0.52 0.51 0.93 0.32 0.27 0.10(0.27) (0.28) (0.23) (0.20)
Past exposure to opposite gender (index) 0.69 0.69 0.86 0.75 0.74 0.6(0.18) (0.18) (0.15) (0.16)
Autonomy (index) 0.73 0.75 0.28 0.74 0.79 0.07(0.20) (0.19) (0.16) (0.16)
Gender attitude (index) 0.57 0.58 0.45 0.51 0.55 0.11(0.18) (0.18) (0.15) (0.14)
Job-satisfaction (index) 2.20 2.34 0.06 2.32 2.55 0.37(0.94) (0.93) (0.99) (0.92)
Number of observations 297 320 617 67 81 148
Notes: This includes the survey responses from male and female agents at the baseline or in the pre-intervention period.For indices such as job satisfaction index, gender attitude index etc., the average response of all the attempted questionsfor the particular index is calculated. Super index on exposure includes responses for gender attitude, past exposure toopposite gender and average autonomy of females in that process, new batch along with being in north or south Indianprocess.
Table 2: Balance check on baseline productivity(1) (2)Male
BaselineProductiv-
ity(zscore)
FemaleBaselineProductiv-
ity(zscore)
Gender integration treatment .047 -0.11(0.09) (0.13)
Observations 494 91Control Mean 0 0Control SD 0.99 0.99Strata FE Yes Yes
Notes: *** p<0.01, ** p<0.05, * p<0.1 This includes the sample of men and sample of women in the study who wererandomized at the beginning of the study into the mixed gender (treatment) and same gender teams (control). Out of617 men, 494 and out of 148 women, 91 of them were from old batches and had past productivity data. They wererandomized using the past productivity data at the beginning of the study. The average is taken of the three topproductivity variable zscores to get the baseline productivity zscore. Strata fixed effect is included. Standard errors areclustered at the team level.
27
Working Draft
Table 3: Overall impact of gender integration treatment on primary outcomesMale agents Female agents
Share of daysworked duringstudy period
Productivity(zscore)
Share of daysworked duringstudy period
Productivity(zscore)
Gender integration treatment -0.008 0.017 -0.008 -0.081(0.023) (0.049) (0.042) (0.048)
Observations 43,695 20,575 12,227 6,384Mean 0.49 0 0.56 0Control SD 0.49 0.98 0.49 0.99p-value (CGM) 0.76 0.79 0.94 0.33Date FE Yes Yes Yes YesStrata FE Yes Yes Yes YesBaseline productivity No Yes No Yes
Notes: *** p<0.01, ** p<0.05, * p<0.1 Standard errors are in parentheses. This includes the sample of males and femalesin the study who were randomized into the mixed gender (treatment) and all male teams (control) and all female teams(control) in inbound and outbound processes. The primary important productivity variable is the sales and survey madeper day in outbound processes and average call handling time in Inbound processes. The secondary productivity variableis ratio of number of surveys by number of calls made in a day in outbound processes and net login hour in Inboundprocesses. The third productivity variable is the number of calls made per day. All performance measures are z-scores(constructed by taking the average of normalized performance measures, where these are normalizing each individualmeasure to a mean of 0 and standard deviation of 1). The average is taken of the three productivity variable zscores toget the productivity zscore. The workers were paired up before randomization into treatment and control groups. Theregressions are run at the daily level, with strata fixed effects and baseline productivity as a control. Days worked duringstudy period is an indicator variable for whether an employee was present or absent on a date. Standard errors areclustered at the team level, while the p-value reported in the table comes from clustering at the team level usingCameron, Gelbach and Miller’s wild-cluster bootstrap.
28
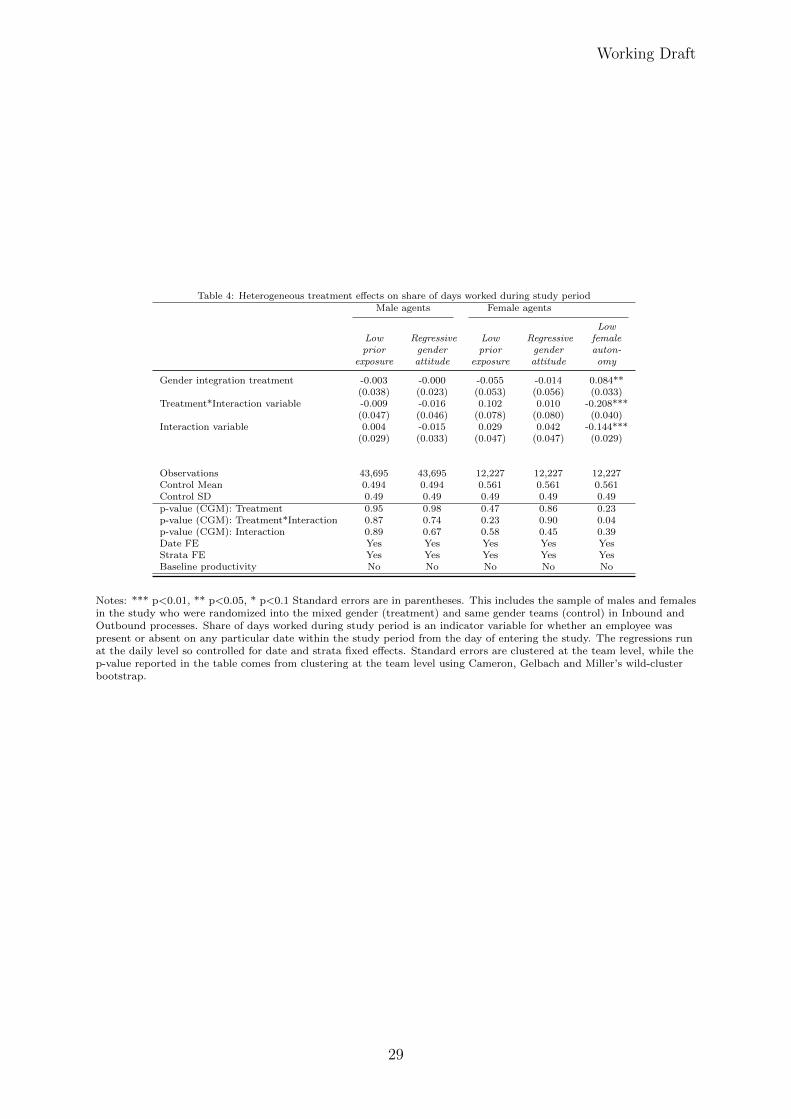
Working Draft
Table 4: Heterogeneous treatment effects on share of days worked during study periodMale agents Female agents
Lowprior
exposure
Regressivegenderattitude
Lowprior
exposure
Regressivegenderattitude
Lowfemaleauton-omy
Gender integration treatment -0.003 -0.000 -0.055 -0.014 0.084**(0.038) (0.023) (0.053) (0.056) (0.033)
Treatment*Interaction variable -0.009 -0.016 0.102 0.010 -0.208***(0.047) (0.046) (0.078) (0.080) (0.040)
Interaction variable 0.004 -0.015 0.029 0.042 -0.144***(0.029) (0.033) (0.047) (0.047) (0.029)
Observations 43,695 43,695 12,227 12,227 12,227Control Mean 0.494 0.494 0.561 0.561 0.561Control SD 0.49 0.49 0.49 0.49 0.49p-value (CGM): Treatment 0.95 0.98 0.47 0.86 0.23p-value (CGM): Treatment*Interaction 0.87 0.74 0.23 0.90 0.04p-value (CGM): Interaction 0.89 0.67 0.58 0.45 0.39Date FE Yes Yes Yes Yes YesStrata FE Yes Yes Yes Yes YesBaseline productivity No No No No No
Notes: *** p<0.01, ** p<0.05, * p<0.1 Standard errors are in parentheses. This includes the sample of males and femalesin the study who were randomized into the mixed gender (treatment) and same gender teams (control) in Inbound andOutbound processes. Share of days worked during study period is an indicator variable for whether an employee waspresent or absent on any particular date within the study period from the day of entering the study. The regressions runat the daily level so controlled for date and strata fixed effects. Standard errors are clustered at the team level, while thep-value reported in the table comes from clustering at the team level using Cameron, Gelbach and Miller’s wild-clusterbootstrap.
29
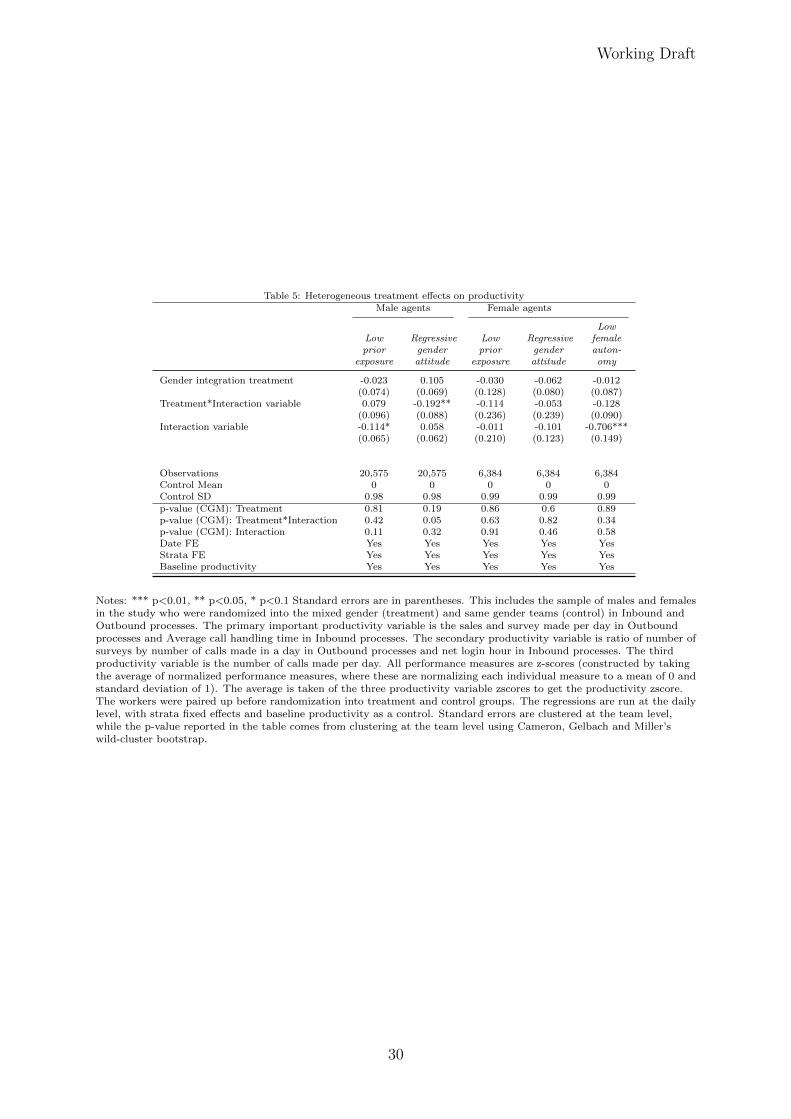
Working Draft
Table 5: Heterogeneous treatment effects on productivityMale agents Female agents
Lowprior
exposure
Regressivegenderattitude
Lowprior
exposure
Regressivegenderattitude
Lowfemaleauton-omy
Gender integration treatment -0.023 0.105 -0.030 -0.062 -0.012(0.074) (0.069) (0.128) (0.080) (0.087)
Treatment*Interaction variable 0.079 -0.192** -0.114 -0.053 -0.128(0.096) (0.088) (0.236) (0.239) (0.090)
Interaction variable -0.114* 0.058 -0.011 -0.101 -0.706***(0.065) (0.062) (0.210) (0.123) (0.149)
Observations 20,575 20,575 6,384 6,384 6,384Control Mean 0 0 0 0 0Control SD 0.98 0.98 0.99 0.99 0.99p-value (CGM): Treatment 0.81 0.19 0.86 0.6 0.89p-value (CGM): Treatment*Interaction 0.42 0.05 0.63 0.82 0.34p-value (CGM): Interaction 0.11 0.32 0.91 0.46 0.58Date FE Yes Yes Yes Yes YesStrata FE Yes Yes Yes Yes YesBaseline productivity Yes Yes Yes Yes Yes
Notes: *** p<0.01, ** p<0.05, * p<0.1 Standard errors are in parentheses. This includes the sample of males and femalesin the study who were randomized into the mixed gender (treatment) and same gender teams (control) in Inbound andOutbound processes. The primary important productivity variable is the sales and survey made per day in Outboundprocesses and Average call handling time in Inbound processes. The secondary productivity variable is ratio of number ofsurveys by number of calls made in a day in Outbound processes and net login hour in Inbound processes. The thirdproductivity variable is the number of calls made per day. All performance measures are z-scores (constructed by takingthe average of normalized performance measures, where these are normalizing each individual measure to a mean of 0 andstandard deviation of 1). The average is taken of the three productivity variable zscores to get the productivity zscore.The workers were paired up before randomization into treatment and control groups. The regressions are run at the dailylevel, with strata fixed effects and baseline productivity as a control. Standard errors are clustered at the team level,while the p-value reported in the table comes from clustering at the team level using Cameron, Gelbach and Miller’swild-cluster bootstrap.
30
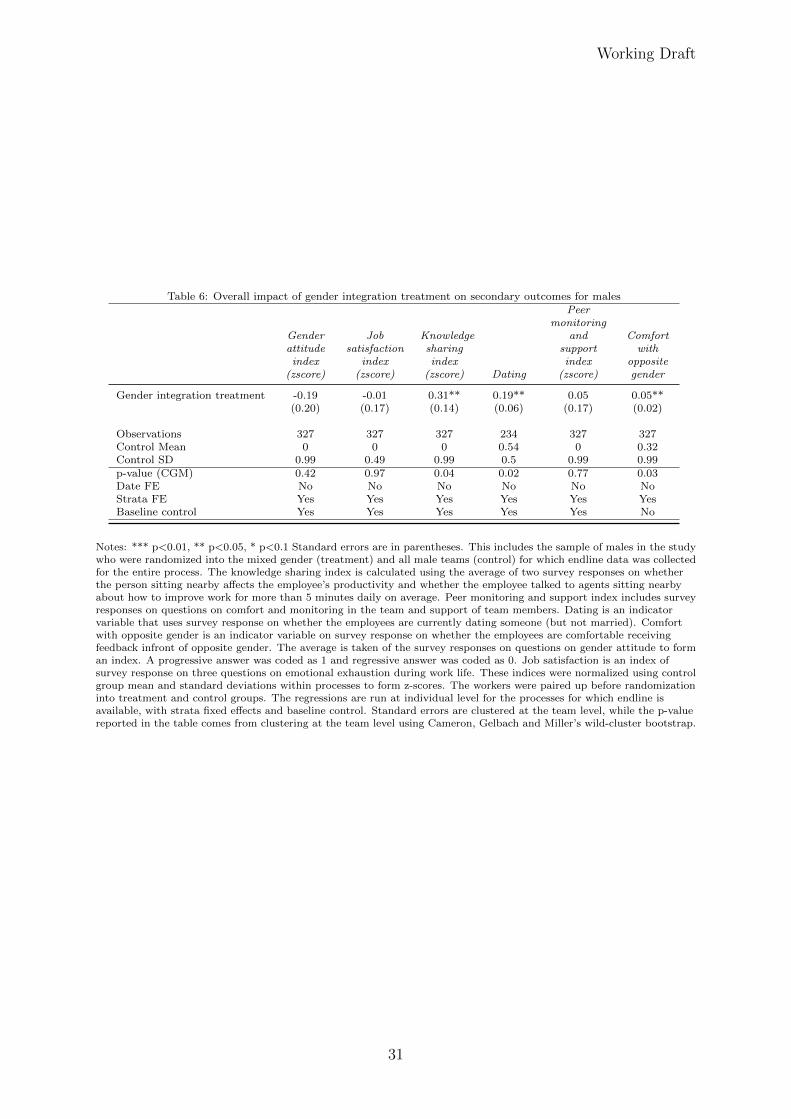
Working Draft
Table 6: Overall impact of gender integration treatment on secondary outcomes for males
Genderattitudeindex
(zscore)
Jobsatisfaction
index(zscore)
Knowledgesharingindex
(zscore) Dating
Peermonitoring
andsupportindex
(zscore)
Comfortwith
oppositegender
Gender integration treatment -0.19 -0.01 0.31** 0.19** 0.05 0.05**(0.20) (0.17) (0.14) (0.06) (0.17) (0.02)
Observations 327 327 327 234 327 327Control Mean 0 0 0 0.54 0 0.32Control SD 0.99 0.49 0.99 0.5 0.99 0.99p-value (CGM) 0.42 0.97 0.04 0.02 0.77 0.03Date FE No No No No No NoStrata FE Yes Yes Yes Yes Yes YesBaseline control Yes Yes Yes Yes Yes No
Notes: *** p<0.01, ** p<0.05, * p<0.1 Standard errors are in parentheses. This includes the sample of males in the studywho were randomized into the mixed gender (treatment) and all male teams (control) for which endline data was collectedfor the entire process. The knowledge sharing index is calculated using the average of two survey responses on whetherthe person sitting nearby affects the employee’s productivity and whether the employee talked to agents sitting nearbyabout how to improve work for more than 5 minutes daily on average. Peer monitoring and support index includes surveyresponses on questions on comfort and monitoring in the team and support of team members. Dating is an indicatorvariable that uses survey response on whether the employees are currently dating someone (but not married). Comfortwith opposite gender is an indicator variable on survey response on whether the employees are comfortable receivingfeedback infront of opposite gender. The average is taken of the survey responses on questions on gender attitude to forman index. A progressive answer was coded as 1 and regressive answer was coded as 0. Job satisfaction is an index ofsurvey response on three questions on emotional exhaustion during work life. These indices were normalized using controlgroup mean and standard deviations within processes to form z-scores. The workers were paired up before randomizationinto treatment and control groups. The regressions are run at individual level for the processes for which endline isavailable, with strata fixed effects and baseline control. Standard errors are clustered at the team level, while the p-valuereported in the table comes from clustering at the team level using Cameron, Gelbach and Miller’s wild-cluster bootstrap.
31
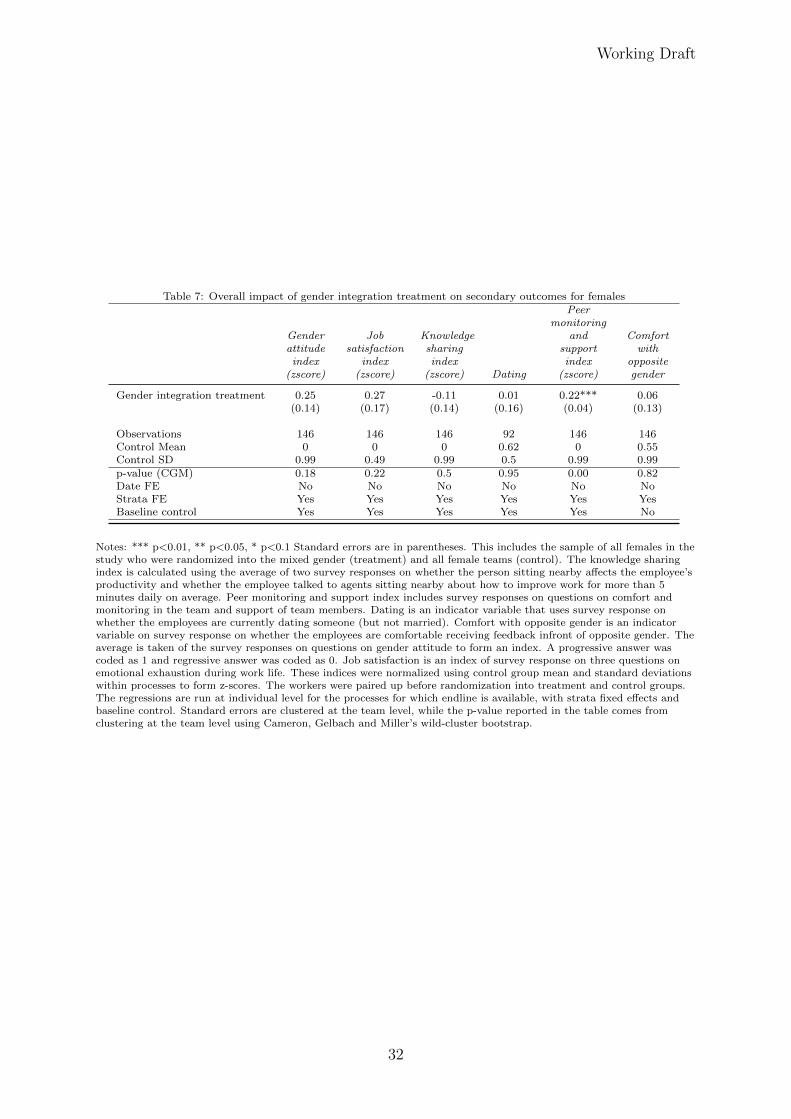
Working Draft
Table 7: Overall impact of gender integration treatment on secondary outcomes for females
Genderattitudeindex
(zscore)
Jobsatisfaction
index(zscore)
Knowledgesharingindex
(zscore) Dating
Peermonitoring
andsupportindex
(zscore)
Comfortwith
oppositegender
Gender integration treatment 0.25 0.27 -0.11 0.01 0.22*** 0.06(0.14) (0.17) (0.14) (0.16) (0.04) (0.13)
Observations 146 146 146 92 146 146Control Mean 0 0 0 0.62 0 0.55Control SD 0.99 0.49 0.99 0.5 0.99 0.99p-value (CGM) 0.18 0.22 0.5 0.95 0.00 0.82Date FE No No No No No NoStrata FE Yes Yes Yes Yes Yes YesBaseline control Yes Yes Yes Yes Yes No
Notes: *** p<0.01, ** p<0.05, * p<0.1 Standard errors are in parentheses. This includes the sample of all females in thestudy who were randomized into the mixed gender (treatment) and all female teams (control). The knowledge sharingindex is calculated using the average of two survey responses on whether the person sitting nearby affects the employee’sproductivity and whether the employee talked to agents sitting nearby about how to improve work for more than 5minutes daily on average. Peer monitoring and support index includes survey responses on questions on comfort andmonitoring in the team and support of team members. Dating is an indicator variable that uses survey response onwhether the employees are currently dating someone (but not married). Comfort with opposite gender is an indicatorvariable on survey response on whether the employees are comfortable receiving feedback infront of opposite gender. Theaverage is taken of the survey responses on questions on gender attitude to form an index. A progressive answer wascoded as 1 and regressive answer was coded as 0. Job satisfaction is an index of survey response on three questions onemotional exhaustion during work life. These indices were normalized using control group mean and standard deviationswithin processes to form z-scores. The workers were paired up before randomization into treatment and control groups.The regressions are run at individual level for the processes for which endline is available, with strata fixed effects andbaseline control. Standard errors are clustered at the team level, while the p-value reported in the table comes fromclustering at the team level using Cameron, Gelbach and Miller’s wild-cluster bootstrap.
32
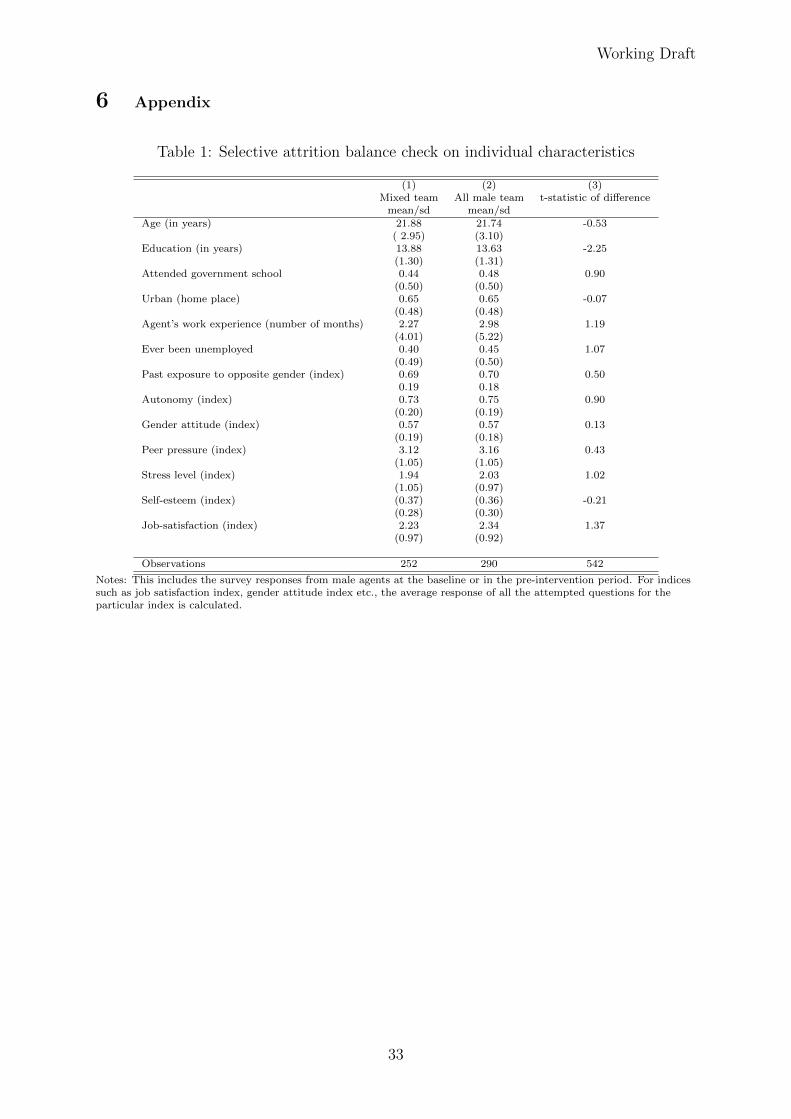
Working Draft
6 Appendix
Table 1: Selective attrition balance check on individual characteristics
(1) (2) (3)Mixed team All male team t-statistic of difference
mean/sd mean/sdAge (in years) 21.88 21.74 -0.53
( 2.95) (3.10)Education (in years) 13.88 13.63 -2.25
(1.30) (1.31)Attended government school 0.44 0.48 0.90
(0.50) (0.50)Urban (home place) 0.65 0.65 -0.07
(0.48) (0.48)Agent’s work experience (number of months) 2.27 2.98 1.19
(4.01) (5.22)Ever been unemployed 0.40 0.45 1.07
(0.49) (0.50)Past exposure to opposite gender (index) 0.69 0.70 0.50
0.19 0.18Autonomy (index) 0.73 0.75 0.90
(0.20) (0.19)Gender attitude (index) 0.57 0.57 0.13
(0.19) (0.18)Peer pressure (index) 3.12 3.16 0.43
(1.05) (1.05)Stress level (index) 1.94 2.03 1.02
(1.05) (0.97)Self-esteem (index) (0.37) (0.36) -0.21
(0.28) (0.30)Job-satisfaction (index) 2.23 2.34 1.37
(0.97) (0.92)
Observations 252 290 542
Notes: This includes the survey responses from male agents at the baseline or in the pre-intervention period. For indicessuch as job satisfaction index, gender attitude index etc., the average response of all the attempted questions for theparticular index is calculated.
33
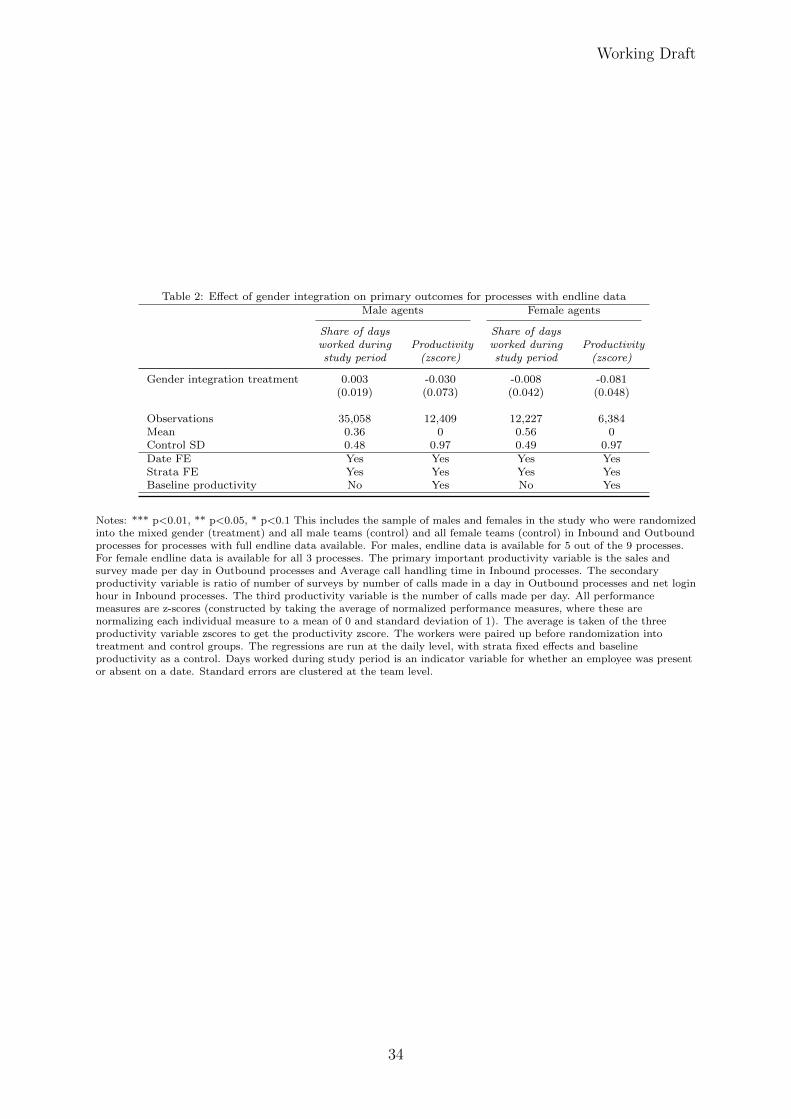
Working Draft
Table 2: Effect of gender integration on primary outcomes for processes with endline dataMale agents Female agents
Share of daysworked duringstudy period
Productivity(zscore)
Share of daysworked duringstudy period
Productivity(zscore)
Gender integration treatment 0.003 -0.030 -0.008 -0.081(0.019) (0.073) (0.042) (0.048)
Observations 35,058 12,409 12,227 6,384Mean 0.36 0 0.56 0Control SD 0.48 0.97 0.49 0.97Date FE Yes Yes Yes YesStrata FE Yes Yes Yes YesBaseline productivity No Yes No Yes
Notes: *** p<0.01, ** p<0.05, * p<0.1 This includes the sample of males and females in the study who were randomizedinto the mixed gender (treatment) and all male teams (control) and all female teams (control) in Inbound and Outboundprocesses for processes with full endline data available. For males, endline data is available for 5 out of the 9 processes.For female endline data is available for all 3 processes. The primary important productivity variable is the sales andsurvey made per day in Outbound processes and Average call handling time in Inbound processes. The secondaryproductivity variable is ratio of number of surveys by number of calls made in a day in Outbound processes and net loginhour in Inbound processes. The third productivity variable is the number of calls made per day. All performancemeasures are z-scores (constructed by taking the average of normalized performance measures, where these arenormalizing each individual measure to a mean of 0 and standard deviation of 1). The average is taken of the threeproductivity variable zscores to get the productivity zscore. The workers were paired up before randomization intotreatment and control groups. The regressions are run at the daily level, with strata fixed effects and baselineproductivity as a control. Days worked during study period is an indicator variable for whether an employee was presentor absent on a date. Standard errors are clustered at the team level.
34
Working Draft
Survey Questions
Past exposure to opposite gender index : It constitutes of answers from the following
Agree/Disagree questions
1) Did you go to a co-educational school?
2) If co-ed, did boys and girls sit together?
3) Do you have opposite gender siblings?
4) Did you grow up in a joint family with any opposite gender cousins?
5) Did you have a female teacher in school?
6) Did you have any friends from your neighborhood who were from the opposite gender?
7) Have you ever been in a relationship?
8) Have you ever had a team leader of opposite gender?
9) Does your mother or female family members practice ghoonghat/burqa?
10) Do you have lunch with opposite gender?
Job Satisfaction index – rank on a scale of 1 to 5
1) I feel used up at the end of the work day
2) I dread getting up in the morning and having to face another day on the job.
3) I feel I am working too hard on my job.
Gender attitudes index- The response for each of the following questions was aggregated
to form an index of gender attitude. Each response was coded as 1 if the respondent answered
“Strongly Agree” or “Agree” with a gender-progressive statement or “Strongly Disagree” or
“Disagree” with a gender-regressive statement, and 0 otherwise. The following questions are
based on gender attitude questions in Dhar et al., 2018, Glennerster et al. (2018) and some new
questions specific to the setting, designed by the author.
Express if you agree or disagree with the following statements:
Education attitudes
1) Wives should be less educated than their husbands
2) I want my spouse to be more educated than me
3) Boys should be allowed to get more opportunities and resources for education than girls
I. Employment attitudes
1) I wouldn’t let my sister work in a call center as it is not a suitable job for women from good
families.
2) I want my spouse/partner to earn more than me
3) A woman’s most important role is to take care of her home, feeding kids and cook for her
family
4) Men are better suited than women to work outside of the house
5) Marriage is more important for a woman than her job
35
Working Draft
7) Men are the best at leading at the highest level
8) Men should take care of the house if they earn less
9) I will not allow my sister to have a boyfriend before marriage
II. Women’s role attitudes
1) Nowadays men should participate in child rearing and household chores rather than leaving
it all to the women.
2) Brothers should monitor their sister’s friends and her phone as it is their responsibility
3) Sisters should monitor their brother’s friends and his phone as it is their responsibility
4) Daughters should have a similar right to inherited property as sons
5) Women should dress up according to what her husband or family allows for the sake of her
family honor
6) A man should have the final word about decisions in his home
7) A woman should tolerate violence in order to keep her family together
8) Parents should maintain stricter control over their daughters than their sons
9) A shy demeanour makes a girl a more suitable bride
10) A woman has to have a husband or sons or some other male kinsman to protect her.
11) I won’t allow my sister to go to college if it is in the city far away from home
12) Having a son is important to me because it will make my parents and in-laws satisfied.
III. Fertility attitudes – marked as gender regressive if answers to the first fertility question
is A and if the reply is answer C in question 1 and but answer B in question 2.
1) Suppose the first two children born to a husband and wife are both girls. Which of the
following should they do?
(A) have more children till they have a boy child
(B) no more children, as this is the perfect family size
(C) have one more child but no more
2) Suppose the first two children born to a husband and wife are both boys. Which of the
following should they do?
(A) have more children
(B) no more children
(C) have one more child but no more
Peer monitoring and support
1) Do your teammates monitor your work?
2) Do you feel that your teammates are interested in your performance?
3) Do your teammates offer suggestions for performance improvement?
4) Do you feel comfortable in the workplace?
5) Do you feel comfortable with your teammates?
36

Working Draft
Autonomy
Index of number of decisions that individual is the most important decision-maker for (they
answer respondent is most important) among following decisions:
1)Clothes for yourself
2) Whether you work outside the home
3) How money earned by you is spent
4) Time you spend socializing outside the house
5) What education/training pursuits you follow
6) Selection of a spouse for you
7) With whom do you travel to work
37
Designed by soapbox.co.uk
The International Growth Centre (IGC) aims to promote sustainable growth in developing countries by providing demand-led policy advice based on frontier research.
Find out more about our work on our website www.theigc.org
For media or communications enquiries, please contact [email protected]
Subscribe to our newsletter and topic updates www.theigc.org/newsletter -signup
Follow us on Twitter @the_igc
Contact us International Growth Centre, London School of Economic and Political Science, Houghton Street, London WC2A 2AE
Related Documents