G ENDER D IFFERENCES IN T IME U SE O VER THE L IFE C OURSE IN F RANCE ,I TALY , S WEDEN , AND THE US Dominique Anxo, Letizia Mencarini, Ariane Pailhe ´, Anne Solaz, Maria Letizia Tanturri, and Lennart Flood ABSTRACT This contribution analyzes how men and women in France, Italy, Sweden, and the United States use their time over the life cycle and the extent to which societal and institutional contexts influence the gender division of labor. In order to test the hypothesis that contextual factors play a crucial role in shaping time allocation, this study considers countries that diverge considerably in terms of welfare state regime, employment and paid working time systems, family policies, and social norms. Using national time-use surveys for the late 1990s and early 2000s and regression techniques, the study not only finds large gender discrepancies in time use in each country at all stages of life but also determines that institutional contexts, in particular the design of family policies and employment regimes, do shape gender roles in different ways, and that Sweden displays the lowest gender gap in time allocation across the life course. KEYWORDS Gender division of labor, life course, paid work, time budget surveys, time use, unpaid household work JEL Codes: J12, J16, J22 INTRODUCTION In many Western countries, the burden of housework and care remains mainly on women’s shoulders, in spite of their increasing participation in the labor market. Arlie Russell Hochschild (1989) used the term ‘‘stalled revolution’’ to describe this situation, in which a higher women’s employment rate is not followed by men’s increasing responsibility for domestic chores and care. Although this situation is practically universal in the developed West, the extent of gender differences in the division of labor varies across countries according to the welfare regime, family and employment policies, the tax and benefit system, and social norms. Feminist Economics 17(3), July 2011, 159–195 Feminist Economics ISSN 1354-5701 print/ISSN 1466-4372 online Ó 2011 IAFFE http://www.tandf.co.uk/journals DOI: 10.1080/13545701.2011.582822

Welcome message from author
This document is posted to help you gain knowledge. Please leave a comment to let me know what you think about it! Share it to your friends and learn new things together.
Transcript

GE N D E R DI F F E R E N C E S I N TI M E US E OV E R
T H E LI F E CO U R S E I N FR A N C E, IT A L Y ,SW E D E N, A N D T H E US
Dominique Anxo, Letizia Mencarini, Ariane Pailhe, Anne Solaz,Maria Letizia Tanturri, and Lennart Flood
ABSTRACT
This contribution analyzes how men and women in France, Italy, Sweden, andthe United States use their time over the life cycle and the extent to whichsocietal and institutional contexts influence the gender division of labor. Inorder to test the hypothesis that contextual factors play a crucial role in shapingtime allocation, this study considers countries that diverge considerably in termsof welfare state regime, employment and paid working time systems, familypolicies, and social norms. Using national time-use surveys for the late 1990s andearly 2000s and regression techniques, the study not only finds large genderdiscrepancies in time use in each country at all stages of life but also determinesthat institutional contexts, in particular the design of family policies andemployment regimes, do shape gender roles in different ways, and that Swedendisplays the lowest gender gap in time allocation across the life course.
KEYWORDS
Gender division of labor, life course, paid work, time budget surveys, time use,unpaid household work
JEL Codes: J12, J16, J22
INTRODUCTION
In many Western countries, the burden of housework and care remainsmainly on women’s shoulders, in spite of their increasing participation inthe labor market. Arlie Russell Hochschild (1989) used the term ‘‘stalledrevolution’’ to describe this situation, in which a higher women’semployment rate is not followed by men’s increasing responsibility fordomestic chores and care. Although this situation is practically universal inthe developed West, the extent of gender differences in the division oflabor varies across countries according to the welfare regime, family andemployment policies, the tax and benefit system, and social norms.
Feminist Economics 17(3), July 2011, 159–195
Feminist Economics ISSN 1354-5701 print/ISSN 1466-4372 online � 2011 IAFFEhttp://www.tandf.co.uk/journals
DOI: 10.1080/13545701.2011.582822
The aim of this contribution is to analyze how men and women in Italy,France, Sweden, and the United States use their time over the life cycle andthe extent to which the differing societal and institutional contextsinfluence the gender division of labor. In particular, we focus on genderdifferences in the allocation of time between market work, domestic work,and leisure, simulating various stages across the life course. We selectedthese countries to represent different institutional contexts that divergeconsiderably in terms of welfare state regime, employment and paid workingtime systems, family policy, and social norms that play an important role inthe time management of men and women during their lives.
Gender disparities in paid work vary remarkably along the life course.Several cross-country comparative studies have shown that men andwomen’s employment profiles over the life course exhibit pronouncednational differences (Patricia Apps and Ray Rees 2005; Dominique Anxo,Christine Erhel, and Joop Schippers 2007; Dominique Anxo, Colette Fagan,Inmaculada Cebrian, and Gloria Moreno 2007a).1 Strong differences intime use across countries are also related to the timing of key eventsover the life cycle. For example, the timing of leaving the parentalhome, which occurs later in Southern European countries, affects not onlyunion formation and childrearing by young adults but also the livingarrangements of parents as they age. In Northern European countries,relatively young parents are more often left behind in the so-called emptynest than in Southern ones.
Longer residence in the parental home often delays one of the mostimportant transitions in the life course: the entry into parenthood. Theexperience of parenthood often implies a crystallization of gender roles,with an increase in the time women devote to housework and childcare aswell as a decrease in leisure time, as Shelly Lundberg and Elaina Rose(1999) show using longitudinal data from the American Panel Study ofIncome Dynamics. Employed mothers’ active presence both at homeand in the labor market produces the so-called double burden. As is wellknown, combining paid employment and parenthood is more difficult formothers than for fathers, and often the strategies adopted are completelydifferent. Men typically increase the time they devote to paid work, whilewomen decrease their paid working time or even exit the labor market(Hans-Peter Blossfeld and Sonja Drobnic 2001; Anxo et al 2007a).2 Indeed,having children can seriously jeopardize women’s job opportunities andcareers. There is much evidence from the US (Jacob Mincer and SolomonPolachek [1974] on the 1967 National Longitudinal Survey of Work;Kathryn Shaw [1994] using the Panel Study of Income Dynamics data from1967 to 1987; Diane J. Macunovich [1996] reviewing different US results;Jacob Alex Klerman and Arleen Leibowitz [1999] using the NationalLongitudinal Survey of Youth and the Current Population Survey) and alsoin Europe (Siv Gustafsson [2001] on several European countries; Cecile
ARTICLE
160
Wetzels [2001] compared Germany, Great Britain, Sweden, and theNetherlands; Heather Joshi [2002] on British data). This situation can initself drive some women to reduce the number of children they have oreven induce them to forego parenthood altogether (Beverly J. Matthews1999; Anna Scisci and Marta Vinci 2002). It is not difficult to observe thatthe Western countries with very low fertility rates are those with a genderregime less equal than in countries where fertility rates are relatively higher,with a strong divide between Southern and Northern Europe (PeterMcDonald 2000).
The gender gap in time allocation may be dependent upon theinstitutional and societal context; in particular, on the characteristics ofparental leave systems, the availability and cost of childcare services, theprovision of care when older people become partially or fully dependent,and, more globally, on employment regimes and the design of tax andfamily policies (Jane Lewis 1992; Diane Sainsbury 1998, 1999). For instance,policies aimed at reducing the costs of balancing paid work and familycommitments can narrow gender differences in time use. Tax and benefitsystems can also reinforce gender differences in time use and discouragefemale labor force participation.
Likewise, prevalent social norms may affect gender differences acrosscountries. For instance, in environments where the traditional male-breadwinner model is still predominant, women and men, according to thehypothesis of ‘‘incompatibility of roles,’’ may perceive the problem ofbalancing paid work and family differently (Evelyn Lehrer and MarcNerlove 1986; Jonathan Gershuny 2000; Rosemary Crompton, MichaelaBrockmann, and Clare Lyonette 2005; Rosemary Crompton and ClareLyonette 2005). According to these prevalent social norms, work activitycan be seen for men as an instrument to exercise their role as providers andfor women as a means to fulfill their role as family caregivers. Thus, forwomen, time spent in paid work outside the family can conflict with unpaidtime spent in the home for the family.
This study – with respect to previous ones within the life-courseperspective – uniquely considers all the components of daily time use,while most previous studies focus on only one component: paid work (seefor example Anxo et al. [2007a]). To the best of our knowledge, Apps andRees (2005) – which includes three other countries: Germany, the UnitedKingdom, and Australia – is the only comparative study to use time-budgetdata to analyze the gender division of labor in a life-course perspective.Among the countries Apps and Rees analyze, two belong to the samewelfare state regime, according to Gosta Esping-Andersen’s classificationsystem (1999), discussed below. Our approach extends this analysis tocountries that belong to four distinct welfare state regimes.
In our study, we distinguish nine key life-cycle stages according to age andhousehold structure, reflecting major life events and life phases for a large
GENDER DIFFERENCES IN TIME USE
161

majority of individuals, such as the transition out of the parental home,union formation, parenthood,3 and transitions to retirement and old age.This approach makes it possible to identify and map the cross-countryvariations in the gender time allocation across the life cycle in the late 1990sand early 2000s and to relate these variations to the prevalent welfare stateregime, employment system, and social norms.
DIFFERENT INSTITUTIONAL CONTEXTS
The four countries selected have different welfare state regimes, labormarket regulations, and family and employment reconciliation policies.4
France occupies an often contradictory position in the classification ofWestern welfare systems, partly because of the variegated nature of itsfamily policy. As stressed by John C. Caldwell and Thomas Schindlmayr,‘‘France remains a problem for the model builders’’ (2003: 255). Underthe Esping-Andersen (1999) classification, France is a conservative welfarestate, characterized by policies geared toward preserving existing statusesand traditional family forms, where the provision of welfare is still mainly afamily responsibility. In contrast, feminist researchers, focusing on theimpact of social policies on female employment, classify France and Swedenin the same category, as countries where social policies help women remainin the labor force (Janet C. Gornick, Marcia K. Meyers, and Katherin E.Ross 1997; Gerda Neyer 2003). The employment rate of French adultwomen started to rise in the mid-1950s, but there is still a pronounced‘‘cohort effect’’ whereby younger generations of mothers have morecontinuous employment profiles across their paid working lives than theirpredecessors. This life-course employment pattern for French mothers issupported by the high coverage rate and lower cost of public childcare,but, in contrast to Sweden, provisions are less extensive, in particular forpreschool age children. However, unemployment has been high in Francesince the 1980s, and unemployment rates for women consistently exceedthose of men (even among the younger cohorts). Thus, while the gendergap in employment rates continues to decline, it remains more difficult forwomen to establish and pursue a continuous employment profile over thelife course; motherhood is still associated with withdrawal from the labormarket for some groups of women, especially low-skilled women (ArianePailhe and Anne Solaz 2006; Anxo et al. 2007a). The French leave policy isquite generous: the maternity leave regulation is 16 weeks for a first- orsecond-born child and 26 weeks for higher birth order; parental leaveallows one of the parents to devote themselves entirely to bringing up thenewborn child until its third birthday. There is also an allowance forparents who partially or totally stop working in the market to look aftertheir children, but it is conditional to past employment and very low – halfof the minimum wage; so less-educated women, who have insecure jobs,
ARTICLE
162
poor employment conditions, or unfavorable employment schedules aremore likely to leave the labor force after the birth of a child. Only 2percent of fathers use parental leave. In order to favor more genderequality within the family, a statutory paternal childcare leave was createdin 2002. This measure is rather timid (its maximum duration is 11 days),but it has been a success: right from the beginning, 60 percent of allfathers took this leave.
Italy shares common elements with the conservative welfare states butwith a stronger family bias, with limited public support, and a greaterreliance on family relations to provide social support. A high level of rigiditycharacterizes the Italian labor market, with strong protection for those inpermanent employment and very little protection for those in temporaryemployment. These rules severely restrict opportunities for labor marketentrants, a feature that has been claimed as the main reason for the highunemployment rates among women and young people (Daniela Del Boca,Rolf Aaberge, Ugo Colombino, John Ermisch, Marco Francesconi, SilviaPasqua, and Steinar Strøm 2005).
Young people leave the parental home late (with a median age at firstleaving of almost 30 for Italian men and 27 for Italian women, and morethan 70 percent of men and more than 53 percent of women still living intheir parental home in the 25–29 age group),5 owing to both culturalfactors and structural constraints, such as high unemployment, low entrysalaries, lack of state support, and barriers to entering the housing market(Marzio Barbagli, Maria Castiglioni, and Gianpiero Dalla Zuanna 2003).Women play a crucial role as caregivers for both young and old members ofthe household, barely supported by their partners or public services. Theemployment rate among mothers with children under three is only 54percent, one of the lowest in Europe (see Table 1). Due to paid workingtime rigidity, married women are often forced to choose between notworking or working full time in the market (Daniela Del Boca et al. 2005).In fact, flexible paid working hours and part-time paid work are rare: lessthan 30 percent of mothers with children under 6 work part time in themarket (see Table 1).
Balancing childrearing and market work is also made more difficult bythe limited supply of public childcare for children younger than 3, both interms of availability (29 percent of children attend formal childcare)6 andof the number of hours supplied on a day-to-day basis (see Table 2).Conversely, maternity-leave duration (21 weeks) is quite long comparedwith that of the other countries and paid at 80 percent of previous earnings,but it is not compulsory for self-employed workers. As gender roles are stillshaped in a traditional way, paternity leave has never been enacted; butsince 2000, both fathers and mothers can take parental leave for a totalperiod of 36 weeks at only 30 percent of previous earnings (Law of 8 March2000 [Gazzetta Ufficiale 2000]). A further month is given if the father takes
GENDER DIFFERENCES IN TIME USE
163

at least 3 months of paternal leave. In 2004, the take-up rate of eligiblemothers was 75 percent and 7 percent for eligible fathers (DominiqueAnxo, Colette Fagan, Marie-Therese Letablier, Corinne Peraudin, andMarc Smith 2007b).
Often presented as the ideal type of the so-called Nordic socialdemocratic regime, the Swedish welfare state emphasizes the principle
Table 1 Employment indicators (average 1999–2004)
France Italy Sweden US
Male employment rate Age 25–54 87.3 85.6 85.5 87.5Female employment rate Age 25–54 71.2 53.3 81.6 73.0Male employment rate Age 55–64 40.9 41.5 69.6 65.9Female employment rate Age 55–64 32.3 17.0 64.7 52.4Employment ratea Women with child53 66.2 54.4 72.9 56.6Part-time employment ratea Women with child56 23.0 29.0 41.0 29.0Men’s average effective age of exit from the labor
force58.7 60.4 63.8 64.6
Women’s average effective age of exit from the laborforce
58.8 59.8 62.1 63.3
Official age of retirementb 60c 57d 65 65.8
Notes: aData available for 2005 only. bThe official age corresponds to the age at which a pension canbe received irrespective of whether an employee has a long insurance record of years ofcontributions. cIndividuals can retire at age 60 with 40 years of contributions. dIndividuals can retireat age 57 (56 for manual workers) with 35 years of contributions.
Sources: OECD, Employment database (as of 2010), estimates derived from the European andnational labor force surveys.
Table 2 Family policy indicators
France Italy Sweden US
Spending as a percentage of GDP, average 1999–2005Childcare 0.37 0.15 0.70 0.09Pre-primary education 0.74 0.52 0.40 0.37
Public expenditure on preschool per child (US$, PPP converted), 2005a
Childcare support 2,858 1,558 6,409 794Pre-primary education 4,679 4,626 3,627 4,660
Enrollment rates of children in formal care or early education services (percent), 2006 (1)0–2 yearsb 43 29 44 313–5 years 100 99 86 58
Notes: aData covering the period of our study are not available. The most recent figures are published.However, those figures are very stable under the period of study. bData for children ages 0–2 yearsare for 2005 in the US.
Source: OECD Family database (as of 2009).
ARTICLE
164
of egalitarianism, decommodification, and individualization (Esping-Anderson 1999).7 The Swedish model is based on a strong politicalcommitment to the goal of full employment and to egalitarian ideals(Dominique Anxo and Harald Niklasson 2006). Swedish society has a highincidence of dual-earner households, egalitarian wage structures, anextensive and generous family policy, and strong welfare supportsystems for both childcare and parental leave (see Tables 1 and 2).8
Individualized taxation systems in a context of high average and marginaltax rates reinforce the dual breadwinner model. As far as paid working timeis concerned, some gender differences persist, with a relatively high shareof women working in the public sector and working part time. But incontrast to other European countries with high part-time employmentrates, like the UK or the Netherlands, many women in Sweden engage inpaid work for more than 24 hours per week. In Sweden, part-time paid workamong women began in the early 1970s. The percentage of Swedish womenworking part time in the market has declined since then: in 1981,47 percent of Swedish women worked part time in the labor market,compared with 33 percent in 2005 (Statistics Sweden 2011). This declinedemonstrates that part-time paid work in Sweden must be considered moreas a historical transition from married women’s low participation in thelabor market than a strategy largely initiated by labor market and politicalinstitutions to strengthen women’s labor market commitments.
The Swedish parental leave program has obviously sustained theincreased participation of women in the labor force. The length ofparental leave is 16 months, with full job security on return. The parentalleave system is therefore associated with a full employment guarantee, andthe employment contract is not suspended during the absence. The level ofcompensation is 80 percent of gross earnings for the first 390 days. For theremaining 90 days, parents receive a flat rate. Parental leave offersconsiderable scope for flexibility in that part of the leave can, for example,be taken over a longer period by working a shorter week with wagecompensation. Parents may use their right to parental leave from thechild’s birth or adoption until age 8. In order to favor a more equal genderdistribution of absence, there are two earmarked nontransferable monthsfor each parent.
The parental leave system allows for income-compensated temporaryreduction of paid working time, thereby reinforcing women’s status asvaluable breadwinners even when they are temporarily not participating ona full-time basis in the labor market. The overall political contextcharacterized by gender mainstreaming and high female involvement inthe political process and in institutions (government bodies, parliament,and labor market organizations) creates a favorable institutional setupconducive to a more balanced gender division of labor and responsibilitiesover the life course.
GENDER DIFFERENCES IN TIME USE
165
The US is often classified as the archetype of the so-called liberal orresidual welfare state regime. This regime is characterized by a lowdegree of social protection with an emphasis on poverty alleviationmainly based on means-tested benefits, as well as limited involvement ofthe state in the provision of services. The minimal safety net againstpoverty also favors the existence of a low-wage, low-skill labor market.The US has a strong institutionalized paid working culture, and themarket and the family play a dominant role in providing welfare.The low level of public social protection is offset by market-based meansof risk diversification through private insurance. The US does not,however, have a unified welfare system. The federal government has hada limited role in social welfare provision; many important functions areadministered at state level, including public assistance, social care, andvarious health schemes.
The high flexibility of the US labor market, in particular lowemployment protection and external flexibility,9 diminishes long-termunemployment risks and creates greater opportunities for the youngto enter the labor market (Thomas A. DiPrete 2002). In contrast toSweden and France, US family policy is weak and policies favoring awork–life balance are limited (only 0.35 percent of GDP is devoted toeither childcare or pre-primary education, around one-third of theamount devoted in France and Sweden). Family policy predominantlyfavors the provision of private services through tax deductions forchildcare (Ann Shola Orloff 2009). The enrollment rate of childrenaged 0–2 in formal childcare is about one-third, which is above theItalian level.10 A national parental leave entitlement was introduced in1993, but it is unpaid and the take-up rate among mothers is only 36percent (Wen-Jui Han and Jane Waldfogel 2003). The Family MedicalLeave Act (FMLA) provides some unpaid leave for childbirth. Theduration is limited to 12 weeks within a 12-month period for employeeswho work for at least 1 year for a private employer with more than fiftyemployees. Because of the qualifying restrictions (only 58 percent ofemployees in private firms are eligible for the unpaid leave FMLAprovides) and the lack of paid leave, the utilization of the leave is verylow. However, some special legislation exists at the state level, such aspaid family leave.
The US ranks fifteenth in the Gender Empowerment Measure (GEM)index according to indicators such as the number of seats held by women inparliament, and the estimated ratio of female to male earned income(Sweden ranks second, France eighteenth, and Italy twenty-first; see UnitedNations 2009). The US average female–male earnings ratio has shownconsiderable progress since the 1970s, and the wage gap is close to the levelof Nordic countries (Nabanita Datta Gupta, Ronald L. Oaxaca, and NinaSmith 2001).
ARTICLE
166
TIME-USE SURVEYS
Time-use surveys represent a unique and precious source of informationon daily activities. They use the time diary technique, where individualsreport their time use during the previous 24 hours, providing extremelydetailed information on the activities performed during that day. Thediary days are randomly distributed across days of the week for both menand women. The diary data are based on a grid of 10-minute intervals oftime with a description of the main activity carried out by the respondent,the second (or concurrent) activity, their location, and the presence ofother people. Besides the diary, all the data sets contain rich informationon the background and socioeconomic status of individuals andhouseholds.
The French data are a representative sample of the French population,and the National Institute of Statistics and Economic Studies (INSEE 2000)conducted the survey from February 1998 to February 1999. The sampleincludes over 12,000 individuals, ages 18–80 years. In Italy, the NationalInstitute of Statistics (ISTAT 2005a) carried out the time-use surveyin 2002–3 on a sample of over 55,000 individuals (more than 41,000 ages18–80). The daily diary includes information for all members of thehousehold age 3 or over.
Statistics Sweden (2002) conducted the Swedish time-use surveybetween October 2000 and October 2001 on a sample of more than7,000 individuals. Compared to the other data sets, three main exceptionsare worth noting: the survey draws a sample of individuals from a nationalregister and includes only a subsample of spouses; time-use information isgathered for a weekday and a weekend day; and only people age 20 andover were asked to complete the questionnaire.
The Bureau of Labor Statistics (BLS 2006a) conducted the US time-usesurvey in 2003 and 2004. Additional variables from the Current PopulationSurvey (BLS 2006b) are available. Only one person age 15–80 wasinterviewed in each household, with a sample of more than 33,000individuals age 18–80. Contrary to the other countries studied here, theinterviews were conducted by phone.
In the present study, we concentrate on three groups of activities:
1) Time devoted to market work. This includes all activities related topaid work: time spent in primary and secondary jobs, as well as inother paid work activities in a broader sense such as rest periods,coffee and lunch breaks, or transport during labor marketactivities. However, we do not include commuting, which cannotbe considered as paid working time in a proper sense.11
2) Time devoted to unpaid work, including the full range of domesticchores and care activities. The domestic tasks include: cooking,
GENDER DIFFERENCES IN TIME USE
167

dishwashing, laundry, cleanup and maintenance within thehouse; cleanup, repair, and other maintenance outside the house,including yard work, shopping, and bookkeeping; and householdmanagement. Care encompasses childcare, care of other householdmembers, and pet care.12
3) Leisure time. This includes socializing, relaxing, sports and exercise,walks, cultural activities, religious and spiritual activities, volunteeractivities, conversations, and meals outside the house. Leisure time isnot the complement of paid and unpaid work, since physiologicalneeds (sleeping, personal care, etc.) are not included.13
METHODOLOGICAL APPROACH AND SAMPLECHARACTERISTICS
To map the time allocation profile of men and women at different points inthe life course we restrict the sample populations to adults age 18–80,14
and use a variant of the family cycle approach developed by Paul C. Glick inthe late 1940s (Glick 1947). Our methodological choice consisted ofselecting a range of household categories coinciding with widelyexperienced transitions and phases in the life course. These typologiescan be depicted as results of some steps in an individual biography: thetransition out of the parental home (by a young single previously living inthe parental home) and the constitution of an independent household (byyoung singles without children), union formation (cohabiting coupleswithout children), parenthood (differentiating couples according to themean age of children),15 midlife empty nest period (middle-aged coupleswithout cohabiting children), and lastly the older phase and exit from thelabor market (couples and singles above 59 years old). See Box 1 for thedetails of the nine typologies of household life phases that we focus on inour analysis.
Box 1 Stylized household life-course typologies
Single and childless young people
1. Single persons (under 36 years), without children, living with theirparents
2. Single persons (under 36 years), without children, living on theirown
Childless couples
3. Younger couples (woman under age 46), without children
ARTICLE
168

Couple households with resident childrenThe mean age of the children is used to indicate the nature of parentalresponsibilities across the life course, from the intense nature ofpreschool childcare through to the different needs and demands ofchildren as they grow up and become more independent.
4. Couple with youngest children (mean age of children, under 6years)
5. Couple with young children (mean age of children, 6–15 years)6. Couple with teenage children (mean age of children, 16–25 years)
Older couples or singles without children living at home
7. Midlife ‘‘empty nest’’ couples without resident children, (womanage 45–59)
8. Older retired couples without resident children (both spouses age60 years or older)
9. Older retired singles without resident children age 60 years orolder
Notes: Due to data limitation, the age interval for children in Swedendeparts from that of the other countries. For couples with residentchildren, the age intervals for Sweden are:55, 5–12, and 13–18 years.
Although our approach is not longitudinal and is based on cross-sectionaltime-use surveys, it can serve as a heuristic device to identify cross-countrydifferences in the patterns of labor market integration and gender divisionof unpaid work and leisure over the life course, and to assess the influenceof the societal context on the prevailing gender division of labor. However,one needs to be cautious with the interpretation of the results and bear inmind the usual drawbacks associated with cross-section analysis, inparticular the difficulties of disentangling age, cohort, and period effects.In other words, some differences in time use across our householdtypologies can be ascribed to selection processes. In spite of a positivecorrelation at the country level between lowest fertility rates and lowemployment rates, the microrelation may appear differently: at the microlevel, more labor market-oriented women and men can be less likely tohave children, causing different effects according to different institutionalcontexts. In fact, the selection effect should play a minor role where it iseasier to reconcile paid work and family commitments.
Furthermore, the family cycle suffers from some limitations that shouldbe stressed. This approach implies a ‘‘natural sequence’’ of predeterminedstages from marriage/cohabitation to widowhood, yet this sequencing of
GENDER DIFFERENCES IN TIME USE
169

life stages is becoming more diversified in contemporary societies. We makeno assumptions about sequencing or duration on the different life stagesituations we have selected for analysis; rather, in our typology we havesought to include some of the most prevalent transitions and life phases forcomparative analysis. This typology does not include all the possiblehousehold categories and it leaves out important and growing categoriessuch as lone parents, same-sex couples, and prime age and midlife singles.However, our typology covers between 80 (Italy) and 88 percent (Sweden)of all household categories found in each society at a given point in time(see Table 3).
We are therefore aware that the life-cycle stages we consider are not (andcannot be) exhaustive, and they do not necessarily occur in the expectedorder. As the individual life trajectories become more and moreheterogeneous, the predictive value of average time-use profiles weakens.Moreover, families with children are not differentiated according to thenumber of children but only with respect to the children’s mean age.Nevertheless, the description of these simple time-use profiles can be a veryuseful basis for comparative studies, both across time and across countries.
In a comparative perspective it is also interesting to assess whether beingin a specific life-cycle stage has the same effect on time use for men andwomen, all other things being equal. We therefore estimate three differentequations with, as dependent variables, time in paid work, time in unpaidwork, and time in leisure. The variables of interest are our householdtypologies, and control variables include educational attainment, income oreconomic situation, regional and urban areas, characteristics of the home
Table 3 Country samples by household types in the life cycle (weighted proportion)
Individual 18–80 years old France Italy Swedena US
Single536 with parents 9.0 16.8 1.7 8.8Single536 on their own 4.3 2.2 9.4 5.4Couple546 no children 6.9 4.7 9.3 8.3Couple children 0–5 7.6 8.1 15.2 9.5Couple children 6–15 15.8 12.2 8.9 14.3Couple children 16–25 11.1 13.1 5.2 7.7Empty nest 45–59 7.4 3.7 15.5 9.2Couple 60þ 13.8 12.0 15.1 11.9Single 60þ 6.1 6.9 7.8 7.2Total excluded 18.2 20.3 11.7 17.8
Single-parent families 5.8 5.3 4.4 5.9Single 36–59 4.6 3.8 7.3 8.1Other excluded 7.8 11.2 – 3.9
Sample size 12,442 41,440 7,272 33,077
Notes: aThe data from Sweden are for people from 20 to 80 years old. Due to data limitation, the ageinterval for children in Sweden departs from that of the other countries. For couples with residentchildren, the age intervals for Sweden are:55 , 5–12, and 13–18 years.
ARTICLE
170

(ownership, number of rooms, and presence of a yard), access to domesticservices (housekeepers, baby sitter, or a caregiver for older people), otherspecific characteristics by country (such as ethnicity for the US orcitizenship for France), and the day of the week of the interview.
We use a generalized Tobit for market work in order to correct forpotential selection bias and to discriminate between the impact ofcovariates on participation in market work that day and paid workinghours given participation (see James Heckman 1978).16 For housework, weuse a standard Tobit to take account of the fact that some individuals donot report housework. Since in both the generalized and standard Tobitthe estimated coefficients have no natural interpretation, we reportmarginal effects evaluated at sample means. For leisure, we use a usualordinary least squares (OLS) since all individuals in our four samples reportthat they spent time on leisure.
EMPLOYMENT PROFILES ACROSS THE LIFE CYCLE
First, we examine the pattern of employment over the life cycle. We adopt arelatively broad definition of employment, since we count both peoplecurrently working in the labor market and those temporarily absent frompaid work as employed.17 For men, employment profiles over the life cycleare quite similar across countries (see Figure 1) and follow an inverseU-curve. Men progressively enter employment in their youth and reach a veryhigh employment level when they are fathers. Young men living with theirparents have a lower employment rate compared with those living on theirown, reflecting the transition from the educational system to the labormarket. Leaving the parental home often coincides with entry into the labormarket and financial independence. This effect is particularly strong inFrance and Sweden and lower in Italy and the US since, respectively, 60 and70 percent of men living with their parents are already working in the labormarket. Fathers spend more time in market work than childless cohabitatingor married men especially in France but also in Sweden and the US. Familyresponsibilities may exert a push effect to find a job, and/or couples may waituntil the man has a job before having a child. This is not the case in Italy,where the highest male employment rate is already reached when they forma childless couple. This effect could also be ascribed to an age effect since, asmentioned previously, the transition out of the parental home in Italy occurslater than in the other countries. Middle-aged and older men withdrawearlier from the labor market in Italy due to early retirement schemes. Notealso that the employment rate of older men is comparatively higher inSweden and the US, while extremely low in France. Despite quitecomparable minimum legal retirement ages (60 in France, 61 in Sweden,62 in the US at the time of this study), the conditions for entitlement to a fullretirement pension and the nature of both employment policies and human
GENDER DIFFERENCES IN TIME USE
171

Figu
re1
Pro
file
of
emp
loym
ent
rate
so
ver
the
life
cou
rse
Sou
rce:
Ow
nca
lcu
lati
on
s,b
ased
on
nat
ion
alti
me-
use
surv
eys.
ARTICLE
172
resources strategies differ and explain the main disparities in the mean age ofwithdrawal from the labor market across countries (see Table 1 for statisticson the mean age of men’s withdrawal from the labor market). Furthermore,the French low senior employment rate may be explained by a relatively lowretirement age, extensive use of early retirement schemes,18 a high rate ofsenior unemployment, and the existence of specific retirement regimes(with earlier retirement age) in certain sectors. Indeed, encouraging olderpeople to leave the labor market was common practice in the 1980s and1990s in France as a tool to reduce unemployment. On the contrary, Swedenhas set up a very active employment policy targeted at older employees. Alsoin the US, laws against age discrimination, introduced in the early 1960s, havehelped to maintain senior employment rates (David Neumark and Wendy A.Stock 1999).
Not surprisingly, female employment patterns across the life cycle differfrom their male counterparts in all countries, with some notablediscrepancies across countries.19 In France and Sweden, union formationis associated with an increasing employment rate (see Figure 1), while inItaly the employment rate of women living in a couple without children isslightly lower than for their childless single counterparts. This suggests thatunion formation in Italy is still associated with a decline in women’semployment levels. Interestingly, the arrival of children has a negativeimpact on female employment rates in all countries. The decrease isparticularly pronounced in the US (the employment rate falls from 82 to 58percent) and Italy (from 74 to 54 percent). The gender employment gap isparticularly high in those two countries at this stage of the life course,amounting to around 40 percentage points compared to around 20percentage points in France and Sweden. While in the US, France, andSweden, the female employment rate increases again when childrenbecome older, in Italy it continues to decline with the age of children.However, rather than a life-course change it may be ascribed to a cohorteffect, with older cohorts having a lower attachment to the labor market.
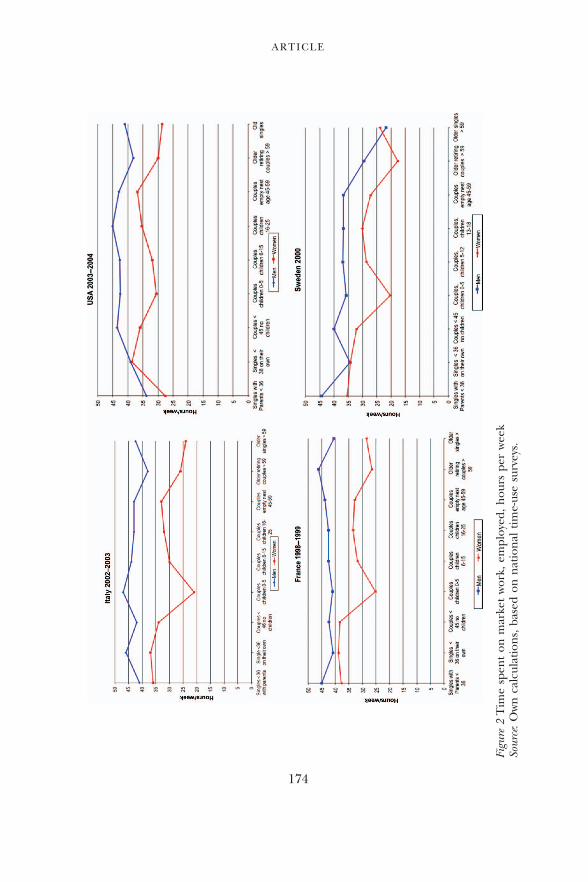
If we look at the volume of hours spent on market work per week givenemployment (based on the time-use surveys; see Figure 2), the decrease inpaid working hours for employed women with preschool children is larger,due to the increasing proportion of women working part time in the labormarket taking maternity leave when they have young children. Thereduction in paid working time is more concentrated around the children’searly years, particularly in France, Italy, and Sweden. In Italy, there is a realspecialization between men and women with an increase in men’s paidworking hours that is not perceptible in the other countries, where thevolume of hours spent on the labor market seems to be independent of thefamily situation.
Even though the identified patterns of labor market integration over thelife course reveal some interesting features, the observed cross-country
GENDER DIFFERENCES IN TIME USE
173
Figu
re2
Tim
esp
ent
on
mar
ket
wo
rk,
emp
loye
d,
ho
urs
per
wee
kSo
urc
e:O
wn
calc
ula
tio
ns,
bas
edo
nn
atio
nal
tim
e-u
sesu
rvey
s.
ARTICLE
174

discrepancies may conceal important structural differences in householdsocioeconomic characteristics. In order to control for these structuraldifferences, we estimate a set of labor supply equations by gender andcountries using a generalized Tobit model to take account of potentialselection bias.
The results of the pure effects of family types on the estimations areconsistent with the employment and working time profiles describedabove. We choose to include in our models some crucial control variablesavailable in each country: educational attainment that is a determinant ofthe cost of time, especially for women; the day of week and the town size,which reflect the social rhythms of the country that may differ accordingto employment regulation (legislation regarding Sunday work, forinstance); and some country-specific covariates such as indicators ofincome (predicted wage or wage dispersion indicators) and wealth ineach country (nonlabor income, paid domestic services and/or homeproperty according to the availability in each survey), and some indicatorsof ethnic origin (citizenship in France, ethnicity in the US) as well asgeographical indicators such as region of residence in Italy and the US,which are particularly relevant in noncentralized states.
After controlling for these covariates, the nine household categories ofour typology (our variables of interest) remain still statistically significant atthe 10 percent level or lower.20 In the following discussion, we discriminatebetween the impact of our life stage categories on employment rates (seethe second part of Table 4) and paid working time given participation inmarket work (see the third part of Table 4).
The effect of children on men’s employment rates differs acrosscountries. We observe no impact of young children for French fathersbut a positive impact on labor supply in Italy and the US and a negativeimpact in Sweden. On the other hand, we find no impact of young childrenon fathers’ paid working time, given participation in market work.
As their children grow older, the employment rate of American fatherscontinues to increase (without impact on paid working time, givenparticipation), but the effect on Italian or Swedish fathers’ labor supplyvanishes. US fathers of children age 16–25 have a higher labor supply, bothin terms of participation and paid working time, given participation. Bycontrast, French fathers reduce both their participation and their paidworking hours when children are teenagers or young adults. We find anegative effect on participation for the empty nest category in Italy andFrance, and the earlier retirement and pre-retirement schemes in Francecould explain this decline. In addition, unemployment also affects olderindividuals in France whereas in Sweden and the US, antidiscriminationlaws and employment policies protect these categories. Men in an emptynest also spend less time on market work given participation in paid work inFrance and Italy. Part-time, early retirement programs could explain this
GENDER DIFFERENCES IN TIME USE
175

Tab
le4
Gen
eral
ized
To
bit
regr
essi
on
on
mar
ket
wo
rkw
eekl
yh
ou
rs(m
argi
nal
effe
cts
eval
uat
edat
sam
ple
mea
n)
by
cou
ntr
yan
dge
nd
er
Men
Wom
en
Hou
seho
ldli
fe-c
ours
ety
polo
gies
Fran
ceIt
aly
Swed
enU
SFr
ance
Ital
ySw
eden
US
(ref
eren
ce:
cou
ple5
46
no
chil
dren
)d
y/d
xSD
dy/
dx
SDd
y/d
xSD
dy/
dx
SDd
y/d
xSD
dy/
dx
SDd
y/d
xSD
dy/
dx
SD
Tot
alm
argi
nal
effe
ctSi
ngl
e5
36w
ith
par
ents
-4.7
5**
1.85
9-9
.37*
**0.
867
-10.
82**
*2.
637
-6.7
7***
1.02
4-1
.73
1.01
2-2
.55*
**0.
378
3.61
3.54
8-3
.38*
**0.
786
Sin
gle5
36o
nth
eir
ow
n1.
092.
498
-1.3
71.
477
-7.2
1***
1.82
91.
321.
203
-1.1
61.
288
1.42
0.90
4-1
.08
1.78
73.
87**
*1.
091
Co
up
lech
ild
ren
0–5
-1.8
52.
022
2.94
**1.
247
-4.1
6**
1.86
44.
99**
*0.
952
-4.6
8***
0.71
1-3
.74*
**0.
299
-6.2
1***
1.13
6-6
.49*
**0.
454
Co
up
lech
ild
ren
6–15
-4.4
0**
1.82
30.
781.
091
-0.9
22.
201
5.12
***
0.84
2-2
.62*
**0.
857
-2.2
1***
0.38
10.
281.
517
3.25
***
0.46
3C
ou
ple
chil
dre
n16
–25
-7.1
5***
1.85
3-4
.18*
**0.
982
-2.7
02.
405
4.70
***
1.26
4-2
.85*
**0.
894
-2.3
5***
0.38
30.
561.
827
-0.6
40.
783
Em
pty
nes
t46
–59
-8.7
0***
1.79
7-7
.95*
**1.
025
-2.0
31.
957
0.48
1.01
9-3
.99*
**0.
794
-3.2
5***
0.35
1-0
.57
1.36
5-1
.75*
**0.
604
Co
up
le60þ
-26.
50**
*0.
950
-21.
53**
*0.
405
-18.
79**
*1.
029
-17.
57**
*0.
579
-9.8
7***
0.52
7-7
.58*
**0.
210
-12.
71**
*0.
758
-12.
14**
*0.
306
Sin
gle
60þ
-19.
13**
*1.
097
-17.
31**
*0.
361
-18.
81**
*0.
767
-18.
05**
*0.
639
-9.1
8***
0.44
9-7
.31*
**0.
200
-12.
32**
*0.
687
-12.
41**
*0.
314
Exp
ecte
dva
lue
20.0
1.85
917
.10.
867
17.6
2.63
721
.81.
024
7.4
1.01
25.
30.
378
12.2
3.54
812
.70.
786
Imp
act
onem
plo
ymen
tSe
lect
ion
effe
ctSi
ngl
e5
36w
ith
par
ents
-0.0
30.
039
-0.1
7***
0.01
6-0
.22*
**0.
050
-0.1
0***
0.01
9-0
.02
0.03
0-0
.06*
**0.
008
0.10
0.07
3-0
.05*
**0.
017
Sin
gle5
36o
nth
eir
ow
n0.
080.
050
-0.0
30.
027
-0.1
4***
0.03
50.
020.
020
-0.0
20.
035
0.03
0.02
0-0
.03
0.03
60.
08**
*0.
021
Co
up
lech
ild
ren
0–5
-0.0
30.
038
0.05
**0.
022
-0.0
7**
0.03
50.
10**
*0.
016
-0.1
2***
0.02
0-0
.08*
**0.
007
-0.1
0***
0.02
5-0
.12*
**0.
010
Co
up
lech
ild
ren
6–15
-0.0
8**
0.03
50.
030.
020
0.01
0.04
20.
10**
*0.
014
-0.0
40.
025
-0.0
4***
0.00
90.
040.
033
-0.0
4***
0.01
0C
ou
ple
chil
dre
n16
–25
-0.1
3*0.
037
-0.0
7***
0.01
8-0
.03
0.04
70.
07**
*0.
020
-0.0
40.
027
-0.0
4***
0.00
90.
020.
038
0.00
0.01
6E
mp
tyn
est
46–5
9-0
.15*
**0.
037
-0.1
4***
0.02
0-0
.02
0.03
60.
010.
017
-0.0
8***
0.02
5-0
.07*
**0.
008
0.02
0.03
0-0
.02
0.01
3C
ou
ple
60þ
-0.5
0***
0.02
0-0
.41*
**0.
007
-0.3
5***
0.02
2-0
.31*
**0.
011
-0.2
6***
0.01
5-0
.17*
**0.
004
-0.2
7***
0.01
7-0
.25*
**0.
007
Sin
gle
60þ
-0.3
9***
0.02
4-0
.33*
**0.
007
-0.3
6***
0.01
7-0
.35*
**0.
012
-0.2
3***
0.01
4-0
.17*
**0.
004
-0.2
6***
0.01
6-0
.26*
**0.
007
Exp
ecte
dva
lue
0.42
0.03
90.
340.
016
0.36
0.05
00.
430.
019
0.22
0.03
00.
120.
008
0.27
0.07
30.
280.
017
Con
diti
onal
mar
gin
alef
fect
Sin
gle5
36w
ith
par
ents
-8.1
7***
1.79
4-1
.80*
1.02
40.
075.
892
-5.4
3***
1.40
9-5
.70*
**1.
933
0.95
1.12
2-2
.02
4.35
1-4
.30*
**1.
482
Sin
gle5
36o
nth
eir
ow
n-5
.23*
*2.
054
0.37
1.45
6-1
.97
2.56
50.
551.
278
-1.8
52.
157
-0.0
81.
663
0.95
2.66
11.
411.
333
Co
up
lech
ild
ren
0–5
-1.4
01.
612
1.10
1.08
9-1
.46
2.24
30.
320.
947
-4.8
6***
1.79
4-7
.71*
**1.
320
-8.1
8***
2.04
4-6
.58*
**1.
010
Co
up
lech
ild
ren
6–15
-1.8
41.
504
-1.6
01.
021
-3.9
72.
483
0.54
0.84
5-6
.69*
**1.
531
-6.6
1***
1.13
4-4
.48*
*2.
085
-5.4
2***
0.78
9C
ou
ple
chil
dre
n16
–25
-3.3
7**
1.70
2-2
.19*
*1.
037
-4.0
02.
909
2.03
*1.
226
-8.5
4***
1.72
9-4
.63*
**1.
149
-1.3
12.
447
-1.5
31.
193
Em
pty
nes
t46
–59
-5.2
8***
1.79
7-3
.48*
*1.
448
-2.5
12.
245
-0.4
71.
089
-8.5
8***
1.79
4-3
.91*
*1.
552
-5.5
5***
1.94
1-2
.43*
*0.
980
Co
up
le60þ
-20.
12**
*3.
115
-6.4
8***
1.63
9-1
5.01
***
3.18
7-9
.21*
**1.
236
-16.
30**
*3.
330
-9.3
0***
2.67
4-1
0.75
***
3.49
1-1
0.92
***
1.48
0Si
ngl
e60þ
-10.
25*
6.20
4-6
.16*
*2.
502
-22.
64**
*5.
332
-2.7
31.
984
-23.
16**
*4.
056
-6.1
8**
3.15
0-1
0.89
**5.
141
-8.1
4***
1.31
4E
xpec
ted
valu
e47
.51.
794
51.1
1.02
448
.65.
892
50.2
1.40
933
.91.
933
43.3
1.12
244
.44.
351
44.1
1.48
2
Not
es:
Oth
erco
vari
ates
:ed
uca
tio
nal
atta
inm
ent,
urb
anar
eas,
wee
kday
inal
lco
un
trie
s,p
lus
pre
dic
ted
wag
e,n
on
lab
or
inco
me,
citi
zen
ship
(Fra
nce
),et
hn
icit
y(U
S),
regi
on
alar
ea(I
taly
and
the
US)
.**
*,**
,an
d*
ind
icat
est
atis
tica
lsi
gnifi
can
ceat
the
1,5,
and
10p
erce
nt
leve
ls,
resp
ecti
vely
.
ARTICLE
176

effect in France. As expected, after age 60, participation in market workdecreases dramatically in our four countries independently of householdcomposition (single/widow or couple).
Like men, young Italian and American women living with their parentsparticipate less frequently in the labor market. French and American youngwomen living at home also work fewer paid hours when they participate inthe labor market compared with childless women cohabiting with malepartners. In contrast, childless young singles have a higher employmentrate in Italy and the US, reflecting the penalty of union formation onfemale labor supply in these two countries, which is absent in France andSweden. Not surprisingly, having very young children has a strong anduniversal negative effect on female labor supply, reducing both the extentof participation in paid work and the time devoted to market work.
The employment rate of mothers of older children (even for 16- to25-year-olds) remains weaker in Italy and the US. Italian mothers have bothweaker participation in market work and shorter paid working time whenthey participate, while for American mothers the impact of childrenessentially takes the form of reduced participation. In France and Sweden,mothers of children age 6–15 or older have the same level of participationas young childless cohabiting women, but they work fewer paid hours(except Swedish mothers of 16–25 year-olds). In the US, one strategyavailable to parents is to stagger their paid working hours so that only oneparent is working in the market at any given time. For instance in 1997, in31 percent of dual-earner couples with children under 14, at least onepartner worked a schedule other than standard office hours (HarrietPresser 1999).
The empty nest phase is associated with a decline in women’s employmentrate in France, Italy, and the US, which could be explained by the lessinclusive labor market for older women. It could also be ascribed to a cohorteffect that we are not able to control for with our cross-sectional data. Whenolder women participate in the labor market, their paid working time is alsoshorter than that of childless, cohabiting women. As expected, we observe anoverall decrease in both participation and paid working time for olderwomen living in couples and for single women over 60.
TIME SPENT IN UNPAID WORK OVER THE LIFE CYCLE
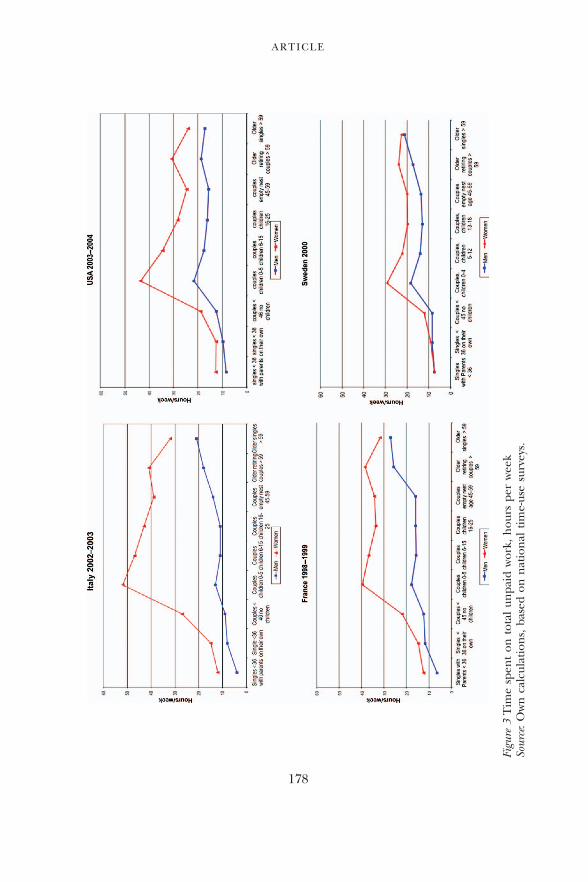
The time devoted to unpaid work (housework and care activities) variesconsiderably across countries (Figure 3). On average, Italian womenspend more hours in unpaid household activities at all stages of the lifecycle (12–51 hours per week), followed by French women. Conversely,Swedish women devote remarkably fewer hours to these activities (8–29hours per week). American women are usually in between, but they workmore hours at home than French women when they have preschool
GENDER DIFFERENCES IN TIME USE
177
Figu
re3
Tim
esp
ent
on
tota
lu
np
aid
wo
rk,
ho
urs
per
wee
kSo
urc
e:O
wn
calc
ula
tio
ns,
bas
edo
nn
atio
nal
tim
e-u
sesu
rvey
s.
ARTICLE
178

children. These variations reflect different norms regarding housework,cleanliness, appearance, and sociability. For instance, in France and Italymeals are a ritual social time for meeting, exchange, and conversation –home-cooked food is at the center of this ritual; while in Sweden and theUS, different expectations make quick family meals and fast or conveniencefood more acceptable. These cross-country variations also mean that stateor market substitutes for housework differ in acceptability and availability.
Especially for women, time devoted to housework strongly varies over thelife cycle. Women’s time spent in unpaid work increases with unionformation in all of these countries but particularly in Italy and France. Notsurprisingly, independent of the country, women’s profiles show a peakwhen they have preschool children. In general, our data show that womenreduce their involvement in domestic activities only when they live alone inthe final phase of their life cycle.21 Men, however, in France, Italy, Sweden,and the US usually spend less time on housework and care activities thantheir female counterparts. With very few exceptions (men over 59 yearsold), their involvement is always less than 20 hours a week (Figure 3).Moreover, the profile of their participation is quite flat over the life cycleand more similar across countries. The number of hours they spend onhousework and care increases meaningfully only after retiring and for thoseliving alone at older ages. It increases slightly when they have youngchildren, but in Italy and France the time fathers of young children spendon unpaid work remains lower than the time childless women devote tohousework. In three countries out of four (the US is the exception), menover 60 devote more hours to unpaid work than younger men, even whenthe latter are fathers of preschool children.
The gender gap in time devoted to domestic chores and care activitiesexists in all countries in this study at all stages of the life course (Figure 3).It is usually less remarkable at the extreme phases of the life cycle: amongvery young singles, and those over 59 years old, again especially amongsingles. In France and Italy, the gender gap increases with union formation.Gender differences are extremely wide for the Italians at all points of thelife cycle, but particularly when they live in a couple with children. Italianwomen with children under age 3 spend on average 40 hours a week morein unpaid domestic work than their male counterparts, while in Swedenwomen in the same category spend only 11 hours more than their malecounterparts. In Italy the gender gap is also noteworthy (about 10 hours aweek) among young singles living both in the parental home and alone, aswell as among the widowed. The opposite case is represented by Sweden,where the gender differences are never remarkable and in no case do theycount for more than 11 hours. French and American women aresomewhere in between: the gender differences are similarly small in theearly stage of the life cycle, and they grow with the presence of childrenunder age 3. In the US, mothers of preschool children devote around 20
GENDER DIFFERENCES IN TIME USE
179
hours more in unpaid household activities than men. In France, the gendergap remains large until the empty nest phase, while in the US it decreasesquickly as the children grow up.
The time spent in unpaid work varies considerably across our simulatedlife cycle, even after controlling for educational attainment that couldshape attitudes and gender roles, the day of the week, place of residence forall four countries, and for some additional specific covariates not availablein all countries such as predicted wage, nonlabor income and citizenship inFrance, ethnicity in the US geographical area in Italy and the US, housingcharacteristics, and the presence of paid domestic services in Italy andFrance (see the results of the Tobit estimations summarized in Table 5).
Our estimations confirm that women’s time in unpaid work is moreinfluenced by the various phases of our stylized life course (almost all themarginal effect are statistically significant at the 1 percent level and largerin magnitude) than their male counterparts (see Table 5). With respect tothe reference category (young couple without children), we find that youngsingles living with their parents do the least domestic work at home and thatthe reduction is particularly strong for women in France and Italy. In allcountries in this study, the transition out of the parental home entails anincrease in the time devoted to domestic activities. Note also that bothsingle and cohabitating young men spend the same amount of time ondomestic activities in Sweden and France (the parameter is not statisticallysignificant at a conventional level) and in Italy (small marginal effect),whereas for women of all ages cohabitation means a heavier burden interms of unpaid work. Childless, young, female singles spend less time indomestic activities than their childless, cohabiting counterparts, but in thiscase the differences are statistically significant everywhere at a conventionallevel, and the marginal effect is not negligible, especially in Italy and the US(see Table 5).
The greatest ‘‘change’’ in the time that individuals spend in unpaid work isrelated to the presence of children, especially the youngest (under 6 yearsold). All other things being equal, when they become mothers, Italianwomen’s domestic time increases (in absolute terms) the most (more than 22hours on average per week) followed by American women (more than 18hours on average per week; see Table 5). French and Swedish womenincreased domestic time by about 16 hours. As children grow up, womenreduce the time devoted to unpaid work, but when children are teenagers oryoung adults (age 16–25) they still spend from 5 (in Sweden) to 13 (in Italy)hours more per week in unpaid work than cohabiting women withoutchildren. Young fathers’ involvement in the domestic sphere is moreheterogeneous across countries. Swedish fathers exhibit a statisticallysignificant (at the 1 percent level) increase in the amount of time spent indomestic tasks and care activities when they have preschool children (morethan 10 hours a week), and they also maintain their involvement as children
ARTICLE
180

Tab
le5
Mar
gin
alef
fect
sfr
om
To
bit
mo
del
for
tota
lh
ou
sew
ork
tim
e(e
valu
ated
atsa
mp
lem
ean
,b
oo
tstr
ap)
by
cou
ntr
yan
dge
nd
er
Fran
ceIt
aly
Swed
enU
S
Men
Wom
enM
enW
omen
Men
Wom
enM
enW
omen
dy/
dx
SDd
y/d
xSD
dy/
dx
SDd
y/d
xSD
dy/
dx
SDd
y/d
xSD
dy/
dx
SDd
y/d
xSD
Hou
seho
ldli
fe-c
ours
ety
polo
gies
(ref
eren
ce:
cou
ple5
46n
och
ildr
en)
Sin
gle5
36w
ith
par
ents
-10.
63**
*0.
795
-17.
63**
*1.
024
-7.7
1***
0.30
4-1
6.39
***
0.54
9-2
.77
1.73
8-5
.79*
**1.
489
-6.7
0***
0.42
4-1
1.18
***
0.64
0Si
ngl
e5
36o
nth
eir
ow
n-0
.03
1.32
8-5
.36
***
1.16
1-2
.73*
**0.
523
-10.
10**
*0.
863
-1.2
70.
785
-3.0
4***
0.64
7-4
.19*
**0.
611
-9.5
0***
0.64
9C
ou
ple
chil
dre
n0–
55.
53*
**1.
075
16.0
4***
1.07
96.
15**
*0.
535
22.6
7***
0.78
610
.42*
**1.
028
15.9
3***
0.87
57.
43**
*0.
506
18.1
9***
0.75
9C
ou
ple
chil
dre
n6–
153.
14*
**0.
810
11.7
8***
0.99
92.
63**
*0.
415
16.1
9***
0.61
56.
04**
*1.
106
9.38
***
0.88
63.
77**
*0.
411
10.1
7***
0.49
8C
ou
ple
chil
dre
n16
–25
1.7
1*0.
876
9.5
9***
1.29
01.
31**
*0.
399
13.1
7***
0.68
65.
46**
*1.
252
7.59
***
1.06
81.
030.
720
4.74
***
0.86
3E
mp
tyn
est
46–5
92.
85*
*1.
168
8.7
2***
1.15
42.
69**
*0.
742
10.2
7***
0.83
45.
12**
*1.
031
7.47
***
0.85
10.
400.
589
1.44
**0.
587
Co
up
le60þ
6.6
5***
1.08
27.
26*
**1.
139
4.36
***
0.47
110
.45*
**0.
626
6.88
***
1.16
29.
94**
*0.
850
1.41
**0.
552
4.04
***
0.63
8Si
ngl
e60þ
7.91
***
1.43
62.
20**
1.00
39.
30**
*0.
714
1.38
**0.
671
9.41
***
1.64
87.
55**
*1.
406
1.75
***
0.59
8-1
.55*
**0.
533
Oth
erch
arac
teri
stic
sP
red
icte
dw
age
0.0
0**
0.00
00.
00*
*0.
000
No
nla
bo
rin
com
e0.
00**
0.00
00.
00**
0.00
0In
com
e(e
last
icit
y)-0
.04*
**0.
003
0.01
0.00
0L
ow
inco
me
(ref
eren
ce:
med
ium
)-3
.40*
**0.
558
-1.4
51.
105
-1.5
3***
0.44
70.
97**
0.40
3
Hig
hin
com
e(r
efer
ence
:m
ediu
m)
0.50
**0.
228
1.94
***
0.33
4-0
.04
0.32
6-0
.74*
0.41
3
Lo
wed
uca
tio
n(r
efer
ence
:m
ediu
m)
-0.3
80.
509
0.66
0.62
0-0
.70*
**0.
237
3.31
***
0.33
1-0
.30
0.71
60.
230.
720
-1.9
3***
0.64
5-0
.02
0.74
5
Hig
hed
uca
tio
n(r
efer
ence
:m
ediu
m)
0.77
0.52
30.
310.
670
0.33
0.31
1-1
.67*
**0.
456
0.19
0.41
20.
96*
0.57
40.
77**
0.32
9-0
.43
0.36
8
Fre
nch
citi
zen
ship
1.6
3*0.
976
-1.3
81.
112
His
pan
ic(r
efer
ence
:w
hit
en
on
-His
pan
ic)
-1.8
8***
0.57
70.
160.
548
Bla
ck(r
efer
ence
:w
hit
en
on
-His
pan
ic)
-3.5
3***
0.45
4-5
.04*
**0.
454
Oth
ers
(ref
eren
ce:
wh
ite
no
n-H
isp
anic
)-1
.51*
*0.
592
0.60
0.83
0
Liv
ing
inb
igci
ty-0
.02
0.46
-0.7
40.
559
0.11
0.22
1-0
.65*
*0.
311
-3.1
7***
0.61
2-2
.04*
**0.
537
-0.4
00.
306
0.04
0.29
5P
aid
do
mes
tic
serv
ices
-0.0
40.
767
-4.3
6***
0.97
7-0
.09*
**0.
030
-0.3
3***
0.04
2H
om
eo
wn
er1.
02**
*0.
213
-0.3
30.
377
Ho
use
dw
elle
r2.
47*
**0.
633
0.35
0.79
3N
um
ber
of
roo
ms
inh
ou
seo
rap
artm
ent
-0.0
40.
206
0.8
7***
0.20
00.
120.
081
0.08
0.10
0
Yard
1.95
***
0.61
42.
28**
*0.
675
1.37
***
0.23
80.
66**
0.29
6
(con
tin
ued
)
GENDER DIFFERENCES IN TIME USE
181

Tab
le5
(Con
tin
ued
)
Fran
ceIt
aly
Swed
enU
S
Men
Wom
enM
enW
omen
Men
Wom
enM
enW
omen
dy/
dx
SDd
y/d
xSD
dy/
dx
SDd
y/d
xSD
dy/
dx
SDd
y/d
xSD
dy/
dx
SDd
y/d
xSD
Cen
ter
(ref
eren
ce:
No
rth
)-0
.67*
**0.
257
1.89
***
0.39
5
Sou
th(r
efer
ence
:N
ort
h)
-2.6
9***
0.18
94.
22**
*0.
323
Mid
wes
t(r
efer
ence
:N
ort
hE
ast)
-0.0
40.
439
-0.9
2**
0.44
2
Sou
th(r
efer
ence
:N
ort
hE
ast)
-0.3
80.
402
-1.7
9***
0.40
8
Wes
t(r
efer
ence
:N
ort
hE
ast)
0.45
0.48
3-1
.07*
*0.
492
Satu
rday
(ref
eren
ce:
Mo
n–F
ri)
6.8
8***
0.65
94.
08*
**0.
779
3.77
***
0.24
72.
34**
*0.
345
4.22
***
0.57
93.
14**
*0.
747
6.71
***
0.40
14.
80**
*0.
426
Sun
day
(ref
eren
ce:
Mo
n–F
ri)
0.26
0.63
7-2
.48*
**0.
614
0.03
0.26
0-5
.40*
**0.
290
3.70
***
0.62
71.
54**
0.66
45.
17**
*0.
391
0.31
0.38
3
Exp
ecte
dva
lue
16.7
31.9
11.5
34.4
15.2
21.3
18.4
28.3
Nu
mb
ero
fo
bse
rvat
ion
s4,
768
5,06
916
,187
17,0
962,
893
3,32
912
,555
16,2
68C
enso
red
ob
serv
atio
ns
887
150
4,81
491
436
311
21,
978
887
Lo
gli
keli
ho
od
-174
44-2
0755
-522
24-7
0361
-107
49-1
3237
-492
09-6
9937
Pro
bab
ilit
y4
chi2
0.00
00.
000
0.00
00.
000
0.00
00.
000
0.00
00.
000
Pse
ud
oR
20.
029
0.04
70.
028
0.05
70.
017
0.02
20.
010
0.01
7
Not
e:**
*,**
,an
d*
ind
icat
est
atis
tica
lsi
gnifi
can
ceat
the
1,5,
and
10p
erce
nt
leve
ls,
resp
ecti
vely
.
ARTICLE
182
grow up (around 6 hours). Their Italian or French counterparts show asmaller change when children are younger (around 6 hours), and only a verysmall one when children grow up. US fathers are in an intermediate position.For the fathers with resident children age 16–25 years old, things are alsodifferent across countries (see Table 5). Italian, French, and American menincrease their involvement by less than 2 hours a week with respect to childlesscohabiting men, whereas Swedish fathers spend more time on domesticchores than cohabiting men without children (more than 5 hours per week).
Overall, both men and women in an empty nest family spend, ceterisparibus, more time in domestic activities than the reference category (seeTable 5). In Italy, France, and Sweden, compared with mothers of 16- to 25-year-olds, the quantity of unpaid work decreases for women when childrenleave the parental home, and the US shows an even larger reduction.Among men, in Italy and France the time increases, whereas in the US, wedo not find any statistically significant effect at the conventional level. Onlyin Sweden, do men in empty nest families slightly reduce the time devotedto unpaid work compared to fathers of 16- to 25-year-olds. Retirement isassociated with an intensification of men’s participation in unpaid work. InItaly, the male contribution increases only slightly, while in Sweden and theUS the intensification is more notable. Retired women only decrease theirunpaid work in France (see Table 5).
Lastly, widowhood/singlehood has opposite effects on the time devotedto domestic activities for men and women (see Table 5): it is much higherfor men and lower for women compared with the same age categories stillliving with partners. Of course, being single reduces the total amount ofhousework, and this result is beneficial for widows/singles. Conversely,whether separated, widowed, or divorced, previously partnered, single men,and women older than 59 years are obliged to do the domestic taskspreviously performed by their spouses. The effect seems to be particularlystrong in Italy and France. In the US, the involvement of older widows andsingles in unpaid work is also lower with respect to the reference category.
TIME SPENT ON LEISURE OVER THE LIFE CYCLE
The pattern of time spent on leisure over the life cycle is very similar acrosscountries, following a U-curve with a high level of leisure at the two ends of theage distribution (Figure 4). The gender gap in leisure time is much smallerthan for paid and unpaid work, and this gap varies less according to the stagesof the life course.22 However, we observe some gender discrepancies acrosscountries: leisure time is higher for men than for women, except in Sweden.The gender gap is larger in Italy and almost negligible in Sweden, consistentwith what we have seen for market and unpaid work.
Not surprisingly, retired people and young men and women still livingwith their parents have higher levels of leisure. When they move out of their
GENDER DIFFERENCES IN TIME USE
183
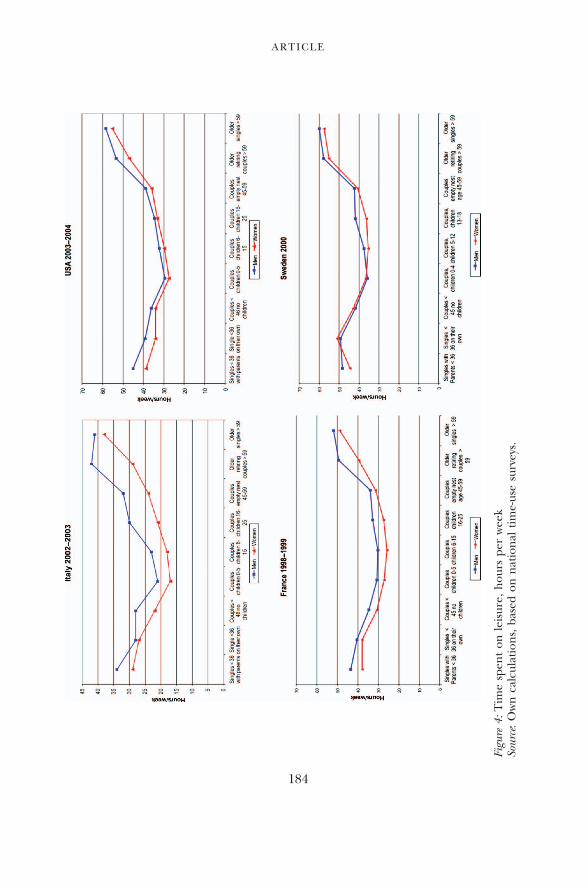
Figu
re4:
Tim
esp
ent
on
leis
ure
,h
ou
rsp
erw
eek
Sou
rce:
Ow
nca
lcu
lati
on
s,b
ased
on
nat
ion
alti
me-
use
surv
eys.
ARTICLE
184
parents home, on average much earlier than their counterparts in theother countries, young Swedish men and women are the only ones whoincrease their leisure time, whereas the transition out of the parental homeentails a reduction of leisure time in the other countries. As shown by theestimation results in Table 6, French, Italian, and Swedish childless, singlewomen have more leisure time than cohabiting, childless women, thoughthis is not the case in the US. Except for Sweden, there are no differencesfor men: living in a childless couple allows French, US, and Italian men tomaintain their previous leisure level.
The negative impact on leisure of having preschool children is universal(statistically significant at the 1 percent level) in the four countries and forboth genders. It is stronger at a statistically significant level for women,except in the US. For children age 6–15 years old, the penalty on theirmothers’ leisure is still high in the four countries. It disappears for Frenchand Italian fathers, but not for Swedish and US fathers, reflecting theirstronger involvement in parental tasks. Later, with 16- to 25-year-olds, thepenalty is still large for Swedish mothers, whereas we observe a noticeableleisure gain for Italian fathers (see Table 6). The negative impact ofchildren on fathers’ leisure, more persistent in Sweden (not only visible forpreschool children), disappears for older teenagers and young adults stillliving at the parental home (16–25 years old). In the US, the relative impactof children is stronger for men, whatever their age, due to their largerinvestment in market work when they have children.
When the children leave the parental home and among older singles, thegender gap remains: men’s leisure time is always higher than women’s, butagain the gender gap is notably lower in Sweden. For couples over 60, thegender differences remain large: ceteris paribus, the increase in leisure timefor cohabiting men is twice that of their female counterparts in France,Italy, and Sweden. Women have to wait until widowhood or singlehood inolder age to overtake male leisure time in France and Italy. In the US,leisure seems to be more equally shared between genders, the time spenton leisure activities becoming similar between spouses over 59 years old orbetween widows and widowers over 59 years old.
Finally, the pattern of leisure by gender is obviously the counterpart ofpaid work and housework history. The life stages where time is the mostconstrained, such as preschool childrearing, are those where leisure is themost reduced. At those crucial stages, the gender gap is particularly low, asif inequalities in leisure time between parents would be considered unfair.One explanation of this comparable level of leisure time between mothersand fathers would be that they spend their scarce leisure time together. Thedata we use do not allow us to check this explanation, as individuals and notcouples are interviewed, except in France. But Daniel S. Hamermesh(2002), using British data, and Christine Barnet-Verzat, Ariane Pailhe, andAnne Solaz (2010) using French data, found that the leisure time spent
GENDER DIFFERENCES IN TIME USE
185

Tab
le6
Mar
gin
alef
fect
sfr
om
OL
Sre
gres
sio
nm
od
elfo
rle
isu
reti
me,
by
cou
ntr
yan
dge
nd
er
Fran
ceIt
aly
Swed
enU
S
Men
Wom
enM
enW
omen
Men
Wom
enM
enW
omen
Co
eff.
SDC
oef
f.SD
Co
eff.
SDC
oef
f.SD
Co
eff.
SDC
oef
f.SD
Co
eff.
SDC
oef
f.SD
Co
nst
ant
35
.13
1.75
33
3.3
11.
631
26
.49
0.84
52
2.8
60.
664
36
.53
1.64
94
0.5
91.
322
35
.81
1.64
13
2.9
51.
409
Hou
seho
ldli
fe-c
ours
ety
polo
gies
(ref
eren
ce:
cou
ple5
46n
och
ildr
en)
Sin
gle5
36w
ith
par
ents
5.9
3***
1.55
44
.18*
**1.
435
7.43
***
0.67
58.
26**
*0.
561
6.91
**3.
320
1.64
2.97
34.
68**
*1.
081
3.44
***
1.00
5Si
ngl
e5
36o
nth
eir
ow
n1.
701.
635
3.92
**1.
658
1.60
1.02
42.
71**
*0.
944
8.33
***
1.73
16.
97**
*1.
712
-0.6
91.
036
0.35
0.97
0C
ou
ple
chil
dre
n0–
5-3
.51
***
1.22
9-5
.13*
**1.
140
-4.4
3***
0.70
5-5
.83*
**0.
554
-5.1
9***
1.47
6-7
.12*
**1.
209
-11.
20**
*0.
700
-7.2
0***
0.54
1C
ou
ple
chil
dre
n6–
15-1
.77
1.20
0-5
.00*
**1.
080
-0.4
30.
676
-3.8
3***
0.52
9-4
.16*
*1.
679
-7.4
8***
1.34
7-7
.40*
**0.
653
-4.2
3***
0.50
8C
ou
ple
chil
dre
n16
–25
1.97
1.33
2-1
.93
1.20
14.
26**
*0.
691
-0.4
00.
540
0.90
2.03
1-5
.83*
**1.
565
-3.5
2***
0.94
5-0
.81
0.79
0E
mp
tyn
est
46–5
92.
59*
1.38
20.
511.
205
5.84
***
0.92
81.
68**
0.66
81.
711.
612
-2.1
1*1.
266
0.24
0.87
22.
51**
*0.
694
Co
up
le60þ
10.0
2***
1.39
55
.07*
**1.
171
15.1
1***
0.72
06.
47**
*0.
577
14.1
7***
1.62
98.
5***
81.
399
12.2
5***
0.77
011
.37*
**0.
690
Sin
gle
60þ
10.7
7**
*1.
938
12.
87**
*1.
271
11.3
7***
0.96
511
.89*
**0.
611
18.0
4***
2.02
411
.86*
**1.
783
15.0
4***
1.08
516
.10*
**0.
634
Oth
erch
arac
teri
stic
sP
red
icte
dw
age
0.0
00
.00
No
nla
bo
rin
com
e0
.00
0.0
0In
com
e(e
last
icit
y)-0
.54
-0.0
32L
ow
inco
me/
ec.
sit.
(ref
eren
ce:
med
.)0.
470.
977
0.65
0.76
93.
56**
*0.
692
2.79
***
0.48
2
Hig
hin
com
e/ec
.si
t.(r
efer
ence
:m
ed.)
0.65
*0.
358
-0.3
20.
273
-2.1
2***
0.47
9-1
.58*
**0.
406
Lo
wed
uca
tio
n(r
efer
ence
:m
ediu
m)
-0.1
90.
717
-0.8
80.
588
-1.9
7***
0.34
3-1
.06*
**0.
285
1.62
1.02
41.
140.
948
1.67
***
0.47
10.
900.
893
Hig
hed
uca
tio
n(r
efer
ence
:m
ediu
m)
3.1
4***
0.74
11.
50*
*0.
642
-0.6
40.
567
0.72
0.45
50.
650.
951
-1.3
5*0.
755
-2.1
6***
0.64
1-1
.95*
**0.
398
Fre
nch
citi
zen
ship
-0.1
51.
266
0.62
1.14
7H
isp
anic
(ref
eren
ce:
Wh
ite
no
n-H
isp
anic
)-2
.42
0.78
2-4
.34*
*0.
616
Bla
ck(r
efer
ence
:W
hit
en
on
-His
pan
ic)
7.01
***
0.84
81.
54**
0.62
8
Oth
ers
(ref
eren
ce:
Wh
ite
no
n-H
isp
anic
)0.
901.
009
-2.4
5***
0.84
6
Liv
ing
inb
igci
ty-0
.79
0.61
6-0
.33
0.51
91.
18**
*0.
320
1.48
***
0.24
93.
82**
*0.
894
1.51
**0.
754
0.33
0.47
10.
570.
471
Do
mes
tic
pai
dse
rvic
es-0
.28
1.07
52
.18*
*0.
924
-0.0
50.
041
0.09
***
0.03
3H
ou
sed
wel
ler
-4.3
7**
*0.
971
-2.0
***8
0.80
4N
um
ber
of
roo
ms
inh
ou
seo
rfl
at0.
43*
0.24
8-0
.22
0.21
4-0
.22*
*0.
100
-0.1
00.
076
(con
tin
ued
)
ARTICLE
186

Tab
le6
(Con
tin
ued
)
Fran
ceIt
aly
Swed
enU
S
Men
Wom
enM
enW
omen
Men
Wom
enM
enW
omen
Co
eff.
SDC
oef
f.SD
Co
eff.
SDC
oef
f.SD
Co
eff.
SDC
oef
f.SD
Co
eff.
SDC
oef
f.SD
Yard
-0.2
10.
943
-0.7
80.
765
-1.8
5***
0.34
5-0
.68*
**0.
263
Ho
me
ow
ner
0.13
0.36
1-0
.57*
*0.
276
Cen
ter
(ref
eren
ce:
No
rth
)-2
.13*
**0.
410
-2.6
4***
0.32
0
Sou
th(r
efer
ence
:N
ort
h)
-1.6
8***
0.32
9-1
.56*
**0.
257
Mid
wes
t(r
efer
ence
:N
ort
hE
ast)
0.10
0.64
1-0
.28
0.52
2
Sou
th(r
efer
ence
:N
ort
hE
ast)
0.24
0.60
9-0
.06
0.49
8
Wes
t(r
efer
ence
:N
ort
hE
ast)
0.01
0.66
5-1
.03
0.54
6
Satu
rday
(ref
eren
ce:
Mo
n–F
ri)
14.7
4**
*0.
928
7.64
***
0.74
77.
96**
*0.
348
3.03
***
0.26
917
.60*
**0.
980
13.1
7***
0.84
315
.30*
**0.
536
9.62
***
0.42
3
Sun
day
(ref
eren
ce:
Mo
n–F
ri)
22.8
7**
*0.
998
15.
10**
*0.
819
15.7
9***
0.34
88.
87**
*0.
275
13.3
8***
0.92
210
.31*
**0.
778
17.7
9***
0.52
113
.37*
**0.
422
Mod
elN
um
ber
of
ob
serv
atio
ns
4,76
85,
069
16,1
8717
,096
2,89
33,
329
16,2
6812
,555
R-s
qu
ared
0.30
60.
281
0.18
70.
185
0.22
30.
188
0.17
50.
206
Not
e:**
*,**
,an
d*
ind
icat
est
atis
tica
lsi
gnifi
can
ceat
the
1,5,
and
10p
erce
nt
leve
ls,
resp
ecti
vely
.
GENDER DIFFERENCES IN TIME USE
187
together by partners is also reduced for young parents. So, this level of leisureseems to be an individual minimum that cannot be cut down. However, thisminimum level differs according to countries; it is especially low in Italy(about 20 minutes per day, 50 percent more in the other countries).
CONCLUSION
This study has examined time allocation over the life cycle in a gender andcomparative perspective. We hypothesized that disparities in theinstitutional and societal context do influence the extent of men’s andwomen’s involvement in various activities and shape differences in genderroles across countries to varying degrees according to life-cycle stages. Wehave compared Italy, France, Sweden, and the US, which representdifferent institutional contexts and diverge considerably in terms ofwelfare regimes, employment systems, family policy, and social norms. Wehave distinguished nine key life-cycle stages according to age and familystructure, reflecting major life events and life stages for a majority ofindividuals, such as the transition out of the parental home, unionformation, and parenthood and retirement phases. Time-use data arecomparable across countries and thus give a unique instrument to assessthe effect of institutional contexts on time use.
In a gender and comparative perspective, this life-course approach gives anew and innovative way of analyzing time allocation. Indeed, our resultsshow large discrepancies in the gender division of labor at the different lifestages. This gender gap, which exists in all countries at all stages of the lifecourse, is usually smaller at the two ends of the age distribution but largerwith parenthood. Preschool children especially reinforce the gender gap intime allocation, particularly for participation in domestic chores and careactivities. Despite these similarities we find large cross-country perioddifferences, and it is clear that different institutional contexts shape genderroles in different ways. If social norms play an important role in explainingthe large and persistent gender differences in time allocation, the designof family policies and employment regimes play a crucial role in thecross-country differences along the life cycle.
Sweden presents the lowest gender gap in time allocation thanks to its activepolicies that promote gender equality and balance paid work and family, inparticular a generous and flexible parental leave system, the provision of high-quality public childcare facilities as well as reversible paid working timeoptions over the life course. A more equal gender distribution of educationalattainment and limited earning loss related to childbirth are also importantfactors explaining the relatively lower gains to specialization in home andmarket work in Sweden compared with the other countries. The specificity ofthe institutional setup alongside the societal environment in Swedencontributes to strengthen the bargaining power of Swedish women and
ARTICLE
188

hence explain why we observe a relatively more equal gender division of laborin this country. Furthermore, the overall political context characterized bygender mainstreaming, high female involvement in the political process andinstitutions (government bodies, parliament, and labor marketorganizations), creates a favorable institutional setup conducive to a morebalanced gender division of labor and responsibilities over the life course.
Italy presents the largest gender gap in time use along all stages of the lifecourse. The gender roles are still shaped in a traditional way, especially whenthe children are very young. There is a strong specialization between menand women – with a sharp decrease of women’s paid working hours whenchildren are born, whereas men’s paid working hours increase. However, thisis not perceptible in the other countries, where the volume of hours spent inthe labor market seems to be independent of household composition. Theseresults confirm that in Italy, balancing motherhood and market work isparticularly difficult because of cultural factors such as traditional genderroles and scarce support from male partners, as well as structural constraintssuch as limited supply of public childcare, the rigidity of the labor market,and, in particular, strict employment protection and relatively inflexible paidworking time. Italy is the only country where the female employment ratedoes not start rising again as children become older. This can be attributedpartly to a cohort effect, since women with grown-up children are older.While young women have increased their labor force participation, theoverall pattern is still that of gender inequity, as reflected by Italy’s poor scoreon the GEM index for instance (United Nations 2009).
Despite their very different welfare state regimes, the gender gap in timeuse along the life course is of a comparable level in France and the US. Thisintermediate level between Sweden and Italy is due to the provision ofsubsidized childcare facilities in France and less traditional gender roles inthe US. Thus, France and the US have comparable time allocation, throughdifferent channels: an active family policy in the case of the conservativewelfare state in France, and the large development of market substitutes inthe case of the liberal welfare state in the US.
Moreover, the influence of phases in the life course on the gender gapvaries between countries: Italian leisure is more sensitive to life-course phasesthan Sweden. The widening of the gender gap in time allocation also starts atdifferent life stages across countries, reflecting different organizations withincouples across countries. The decline of female labor supply starts at the timeof union formation in Italy and the US; but in France and Sweden, the fall inmarket work coincides with the presence of preschool children. Likewise forunpaid work, the gender gap starts increasing with union formation inFrance and in Italy – characterized by more traditional gender roles – whilein the other countries it widens only with the presence of children.
The duration of the impact of parenthood on time allocation alsovaries according to countries. In those countries where policies that
GENDER DIFFERENCES IN TIME USE
189

promote gender equality and balance paid work and family are moreeffective and traditionally well established, such as Sweden and France,the major effect of having young children is a temporary reduction ofpaid working time. Conversely, in countries where family policies arealmost absent (the US) or where the provision of public childcare servicesis limited (Italy and the US), a large share of women still withdraw fromthe labor market.
Lastly, to finish on a positive note: women’s long experience in doingmore housework may benefit them at the end of their lives: widows spendless time on housework than their male counterparts. This is the only life-course phase in which gender roles are reversed.
Dominique AnxoLinnaeus University, School of Management and Economics
Universitetsplatsen 1, 351 95 Vaxjo, Swedene-mail: [email protected]
Letizia MencariniCollegio Carlo Alberto and Department of Economics,
‘‘S. Cognetti de Martiis’’University of Turin
via Real Collegio 30, 10024 Moncalieri (To), Italye-mail: [email protected]
Ariane PailheInstitut National Etudes Demographiques (INED)
133 bd Davout, Paris 75020, Francee-mail: [email protected]
Anne SolazInstitut National Etudes Demographiques (INED)
133 bd Davout, Paris 75020, Francee-mail: [email protected]
Maria Letizia TanturrUniversity of Padua, Department of Statistics
via C. Battisti 241, 35121 Padua, Italye-mail: [email protected]
Lennart FloodUniversity of Gothenburg, Department of Economics
School of Business, Economics, and LawVasagatan 1, PO Box 600, SE 405 30, Gothenburg, Sweden
e-mail: [email protected]
ARTICLE
190

ACKNOWLEDGMENTS
The financial supports received by the French Ministry of Research andGalileo project (Italian-French University) are gratefully acknowledged.We thank all the members of the ACI ‘‘Temps de vie’’ for their helpfulcomments and Olivier Thevenon for giving us access to the more recentcomparative contextual data.
NOTES1 Anxo et al. (2007a), as well as Anxo, Erhel, and Schippers (2007), include the
following European countries: France, Germany, Italy, the Netherlands, Spain, andthe UK; while Apps and Rees (2005) analyzed only three countries: Australia,Germany, and the UK.
2 The countries Blossfeld and Drobnic study (2001) are Germany, the Netherlands, theFlemish part of Belgium, Italy, Spain, Great Britain, the US, Sweden, Denmark, Poland,Hungary, and China.
3 In the present study, parenthood is limited to heterosexual cohabiting or marriedcouples.
4 Peter Moss and Karin Wall (2007) compare leave policies from twenty-three, mostlyEuropean, countries.
5 Own calculation based on data from Romina Fraboni (2006).6 The rates vary according to different sources, as highlighted by Chiara Saraceno
(2010).7 Strategies of decommodification are aimed at making people more independent of
markets by insulating the satisfaction of wants and needs from the nexus of markettransactions. Individualization has been a key part of the Swedish universal welfarestate: the individual, and not the family, has for many years been the unit not only oftaxation but also of social benefits and social rights.
8 Sweden is one of the countries with the lowest general gender gap worldwide and hasthe second highest Gender Empowerment Measure (GEM) (United Nations 2009).
9 External flexibility refers to the adjustment of labor intake achieved by employingworkers on temporary paid work or fixed-term contracts or through relaxed hiringand firing regulations.
10 This figure refers to formal childcare (daycare, professional nannies, and so on) andthus does not reflect all childcare options such as babysitting by grandparents or otherfamily members.
11 We do not include time spent on commuting in the two other activities: houseworkand leisure. However, we do include it in the time devoted to childcare.
12 Childcare includes various activities devoted to children such as playing with them,homework, daily care, and also transportation for the children’s activities.
13 There is endless debate on the definition of leisure; some consider that physiologicaltime may be a leisure time. Physiological time is not included in leisure time becauseintroducing sleeping masks a lot of minor differences. Moreover, we considered thatincluding physiological time such as washing oneself is incompressible.
14 Except for Sweden, where it is between 20 and 80 years of age.15 Here we use the mean age of children because taking into account both age and the
number of children in our classification would have resulted in too many categories.Furthermore, we believe that using the mean age is more informative of the life-cyclestage than, for instance, the youngest-child criterion (in an early stage of parenthood,when infants are very young, the mean age is low; when a family has a baby and an
GENDER DIFFERENCES IN TIME USE
191
older child, mean age increases, and parents thus belong to a later life stage thatbetter reflects the timing of their fertility). Since the birth intervals are quite narrow –for instance, in France the average number of years between the first and the last birthis 5 – the choice does not affect most categories. In fact, only 6 percent of familiesbelong to different categories according to the two different definitions (mean ageversus age of youngest child).
16 A technical appendix with details on modeling is available upon request from theauthors.
17 People absent from employment due to illness, a holiday or vacation, vocationaltraining, a temporary layoff, a labor dispute, a sick child or family member, andmaternity/paternity or parental leave are counted as employed.
18 Because of declining demand and rising unemployment, early retirement has beenincreasingly considered by firms as a way to deal with their excess capacities andrejuvenate their workforce.
19 As already mentioned in the methodological section, our data are not longitudinalbut ‘‘pseudo’’ longitudinal family typologies based on cross-sectional, time-use data.
20 The reference category is couples without children.21 A large majority of single women over 59 years of age are either widows (67 percent in
Italy and the US and 75 percent in France), or divorced/separated (11 percent inFrance and 25 percent in Italy and the US). The rest are single.
22 Leisure time is not exactly the complement of paid and unpaid work, sincephysiological needs (sleeping, personal care, and so on) are not included.
REFERENCES
Anxo, Dominique, Christine Erhel, and Joop Schippers, eds. 2007. Labour MarketTransitions and Time Adjustment of the Life Course. Amsterdam: Dutch University Press.
Anxo, Dominique, Colette Fagan, Inmaculada Cebrian, and Gloria Moreno. 2007a.‘‘Patterns of Labour Market Integration in Europe: A Life Course Perspective on TimePolicies.’’ Socio-Economic Review 5(2): 233–60.
Anxo, Dominique, Colette Fagan, Marie-Therese Letablier, Corinne Peraudin, and MarcSmith. 2007b. Parental Leave in European Companies. Dublin: European Foundation forthe Improvement of Working Life and Working Conditions.
Anxo, Dominique and Harald Niklasson. 2006. ‘‘The Swedish Model in Turbulent Times:Decline or Renaissance?’’ International Labour Review 145(4): 339–71.
Apps, Patricia and Ray Rees. 2005. ‘‘Gender, Time Use, and Public Policy over the LifeCycle.’’ Oxford Review of Economic Policy 21(3): 439–61.
Barbagli, Marzio, Maria Castiglioni, and Gianpiero Dalla Zuanna. 2003. Fare famiglia inItalia: Un secolo di cambiamenti [Family formation in Italy: A century of changes].Bologna: Il Mulino.
Barnet-Verzat, Christine, Ariane Pailhe, and Anne Solaz. 2010. ‘‘Spending TimeTogether: The Impact of Children on Couples’ Leisure Synchronization.’’ Review ofEconomics of the Household. http://www.springerlink.com/content/4463v552h42k2514/(accessed April 2011).
Blossfeld, Hans-Peter and Sonja Drobnic, eds. 2001. Careers of Couples in ContemporarySociety: From Male Breadwinner to Dual-Earner Families. New York: Oxford UniversityPress.
Bureau of Labor Statistics (BLS). 2006a. American Time-Use Survey 2004–2005. UnitedStates Department of Labor. http://www.bls.gov/tus/ (accessed November 2009).
———. 2006b. Current Population Survey 2004–2005. Washington, DC: United StatesBureau of the Census for the Bureau of Labor Statistics.
ARTICLE
192

Caldwell, John C. and Thomas Schindlmayr. 2003. ‘‘Explanations of the FertilityCrisis in Modern Societies: A Research for Commonalities.’’ Population Studies 57(3):241–63.
Crompton, Rosemary, Michaela Brockmann, and Clare Lyonette. 2005. ‘‘Attitudes,Women’s Employment, and the Domestic Division of Labour: A Cross-NationalAnalysis in Two Waves.’’ Work, Employment, and Society 19(2): 213–33.
Crompton, Rosemary and Clare Lyonette. 2005. ‘‘The New Gender Essentialism:Domestic and Family ‘Choices’ and Their Relation to Attitudes.’’ British Journal ofSociology 56(4): 601–20.
Del Boca, Daniela, Rolf Aaberge, Ugo Colombino, John Ermisch, Marco Francesconi,Silvia Pasqua, and Steinar Strøm. 2005. ‘‘Labour Market Participation of Women andFertility: The Effect of Social Policies,’’ in Tito Boeri, Daniela Del Boca, andChristopher Pissarides, eds. Women at Work: An Economic Perspective, pp. 121–240. NewYork: Oxford University Press.
DiPrete, Thomas A. 2002. ‘‘Life Course Risks, Mobility Regimes, and MobilityConsequences: A Comparison of Sweden, Germany, and the United States.’’ AmericanJournal of Sociology 108(2): 267–309.
Esping-Andersen, Gosta. 1999. Social Foundations of Postindustrial Economies. New York:Oxford University Press.
Fraboni, Romina. 2006. ‘‘Strutture familiari e opinioni su famiglia e figli – indagine multiscoposulle famiglie ‘famiglia e soggetti sociali’ anno 2003’’ [Household structure and opinionson family and children – multipurpose survey on family and social subjects, 2003].Rome: Instituto Nazionale de Statistica (ISTAT).
Gazzetta Ufficiale. 2000. Legge 08-03-2000, n. 53 Disposizioni per il sostegno dellamaternita e della paternita, per il diritto alla cura e alla formazione e per ilcoordinamento dei tempi delle citta [Law of 8 March 2000, Regulation formotherhood and fatherhood sustain, the care and formation rights and town’s timecoordination]. G.U. 13-03-2000, n. 60, Serie Generale.
Gershuny, Jonathan. 2000. Changing Times: Work and Leisure in Postindustrial Society. NewYork: Oxford University Press.
Glick, Paul C. 1947. ‘‘The Family Cycle.’’ American Sociological Review 12(2): 164–74.Gornick, Janet C., Marcia K. Meyers, and Katherin E. Ross. 1997. ‘‘Supporting the
Employment of Mothers: Policy Variation Across Fourteen Welfare States.’’ Journal ofEuropean Social Policy 7(1): 45–70.
Gupta, Nabanita Datta, Ronald L. Oaxaca, and Nina Smith. 2001. ‘‘Swimming Upstream,Floating Downstream: Trends in the US and Danish Gender Wage Gaps.’’ CLSWorking Paper 01-06, Centre for Labour Market and Social Research, University ofAarhus, Denmark.
Gustafsson, Siv. 2001. ‘‘Optimal Age at Motherhood. Theoretical and EmpiricalConsiderations on Postponement of Maternity in Europe.’’ Journal of PopulationEconomics 14(2): 225–47.
Han, Wen-Jui and Jane Waldfogel. 2003. ‘‘Parental Leave: The Impact of RecentLegislation on Parents’ Leave Taking.’’ Demography 40(1): 191–200.
Hamermesh, Daniel S. 2002. ‘‘Timing, Togetherness, and Time Windfalls.’’ Journal ofPopulation Economics 15(4): 601–23.
Heckman, James. 1978. ‘‘Dummy Endogenous Variables in a Simultaneous EquationSystem.’’ Econometrica 46(4): 931–60.
Hochschild, Arlie Russell with Anne Machung. 1989. The Second Shift: Working Parents andthe Revolution at Home. New York: Viking Penguin.
INSEE (National Institute of Statistics and Economic Studies). 2000. Enquete emploi dutemps, 1998/1999. Paris: Institut National de la Statistique et Etudes Economiques.
ISTAT. 2005a. ‘‘L’uso del tempo, anni 2002–2003.’’ Rome: Instituto Nazionale de Statistica.
GENDER DIFFERENCES IN TIME USE
193
———. 2005b. Rapporto Annuale - La situazione del Paese nel 2004, Par. 4.3, pp 258–71. http://www.istat.it/dati/catalogo/rapporto2004/rapporto2004.pdf (accessed April 2011).
Joshi, Heather. 2002. ‘‘Production, Reproduction, and Education: Women, Children,and Work in a British Perspective.’’ Population and Development Review 28(3): 445–74.
Klerman, Jacob Alex and Arleen Leibowitz. 1999. ‘‘Job Continuity among New Mothers.’’Demography 36(2): 145–55.
Leher, Evelyn and Marc Nerlove. 1986. ‘‘Female Labor Force Behavior and Fertility inthe United States.’’ Annual Review of Sociology 12: 181–204.
Lewis, Jane. 1992. ‘‘Gender and the Development of Welfare Regimes.’’ Journal ofEuropean Social Policy 2(3): 159–73.
Lundberg, Shelly and Elaina Rose. 1999 ‘‘The Determinants of Specialization withinMarriage.’’ Working Paper UWEC-2005-07, University of Washington. http://www.econ.washington.edu/user/erose/spec.pdf (accessed April 2011).
Macunovich, Diane J. 1996. ‘‘Relative Income and Price of Time: Exploring Their Effectson US Fertility and Female Labor Force Participation.’’ Population and DevelopmentReview 22(Supplement: Fertility in the United States: New Patterns, New Theories):223–57.
Matthews, Beverly J. 1999. ‘‘The Gender System and Fertility: An Exploration of theHidden Links.’’ Canadian Studies in Population 26(1): 21–38.
McDonald, Peter. 2000. ‘‘Gender Equity in Theories of Fertility.’’ Population andDevelopment Review 26(3): 427–39.
Mincer, Jacob and Solomon Polachek. 1974. ‘‘Family Investments in Human Capital:Earnings of Women.’’ Journal of Political Economy 82(2): S76–S108.
Moss, Peter and Karin Wall, eds. 2007. International Review of Leave Policies and RelatedResearch. Employment Relations Research Series 80. http://www.berr.gov.uk/files/file40677.pdf (accessed April 2011).
Neumark, David and Wendy A. Stock. 1999. ‘‘Age Discrimination Laws and Labor MarketEfficiency.’’ The Journal of Political Economy 107(5): 1081–125.
Neyer, Gerda. 2003. ‘‘Family Policies and Low Fertility in Western Europe.’’ The Review ofComparative Social Security Research 143: 17–38.
Organisation for Economic Co-operation and Development (OECD). 2010. OnlineOECD Employment database. http://www.oecd.org/document/34/0,3343,en_2649_33927_40917154_1_1_1_1,00.html (accessed April 2011).
———. 2010. Online OECD Family database. http://www.oecd.org/document/4/0,3746,en_2649_34819_37836996_1_1_1_1,00.html (accessed April 2011).
Orloff, Ann Shola. 2009. Farewell to Maternalism? State Policies, Feminist Politics, and Mothers’Employment in the US and Europe. New York: Russell Sage.
Pailhe, Ariane and Anne Solaz. 2006. ‘‘Employment and Childbearing: Women Bear theBurden of the Work–Family Balance.’’ Population and Societies 426: 1–4. https://efe.web.ined.fr/pdf/publis/popetsoc426_english.pdf (accessed April 2011).
Presser, Harriet B. 1999. ‘‘Toward a 24-Hour Economy.’’ Science 284(11): 1178–9.Sainsbury, Diane. 1998. Gender, Equality and Welfare States. Cambridge, UK: Cambridge
University Press.———, ed. 1999. Gender and Welfare State Regimes. New York: Oxford University Press.Saraceno, Chiara. 2010. ‘‘Perche e cosı difficile avere dati certi sui nidi in Italia?’’ [Why is
it so difficult to have data on below three childcare in Italy?]. Neodemos. http://www.neodemos.it/index.php?file¼ onenews&form_id_notizia¼ 389&form_search_key¼ Saraceno (accessed April 2011).
Scisci, Anna and Marta Vinci. 2002. Differenze di genere, famiglia e lavoro [Gender, family,and job differences]. Rome: Carocci.
Shaw, Kathryn. 1994. ‘‘The Persistence of Female Labor Supply: Empirical Evidence andImplications.’’ The Journal of Human Resources 29(2): 348–78.
ARTICLE
194

Statistics Sweden (SCB). 2002. Time-Use Survey 2000/2001. Stockholm: SCB.———. 2011. Swedish Labour Force Survey, various years. Stockholm: SCB.United Nations Development Programme. 2009. Overcoming barriers: Human Mobility and
Development. Human Development Report. New York: UNDP. http://hdrstats.undp.org/en/indicators/125.html (accessed April 2011).
Wetzels, Cecile. 2001. Squeezing Birth into Working Life: Household Panel Data AnalysesComparing Germany, Great Britain, Sweden, and the Netherlands. Aldershot: Ashgate.
GENDER DIFFERENCES IN TIME USE
195

Copyright of Feminist Economics is the property of Routledge and its content may not be copied or emailed to
multiple sites or posted to a listserv without the copyright holder's express written permission. However, users
may print, download, or email articles for individual use.
Related Documents