Yuri Belfali Gender differences in Education through the lens of PISA Francesca Borgonovi

Welcome message from author
This document is posted to help you gain knowledge. Please leave a comment to let me know what you think about it! Share it to your friends and learn new things together.
Transcript
Yuri Belfali
Gender differences in Education through the lens of PISA
Francesca Borgonovi
Educational attainment
Measured in the most common metric - years of schooling - the industrialised world
essentially closed the educational gender gap in the 1960s
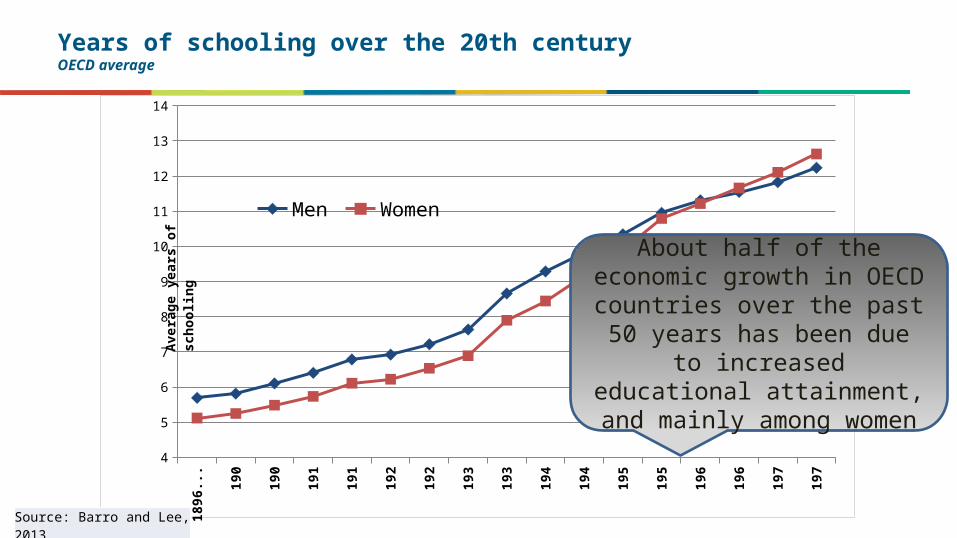
Years of schooling over the 20th centuryOECD average
1896
-...
1901
-05
1906
-10
1911
-15
1916
-20
1921
-25
1926
-30
1931
-35
1936
-40
1941
-45
1946
-50
1951
-55
1956
-60
1961
-65
1966
-70
1971
-75
1976
-80
4
5
6
7
8
9
10
11
12
13
14
Men Women
Ave
rage
yea
rs o
f sch
ool-
ing
About half of the economic growth in OECD countries over the
past 50 years has been due to increased educational attainment,
and mainly among women
Source: Barro and Lee, 2013.
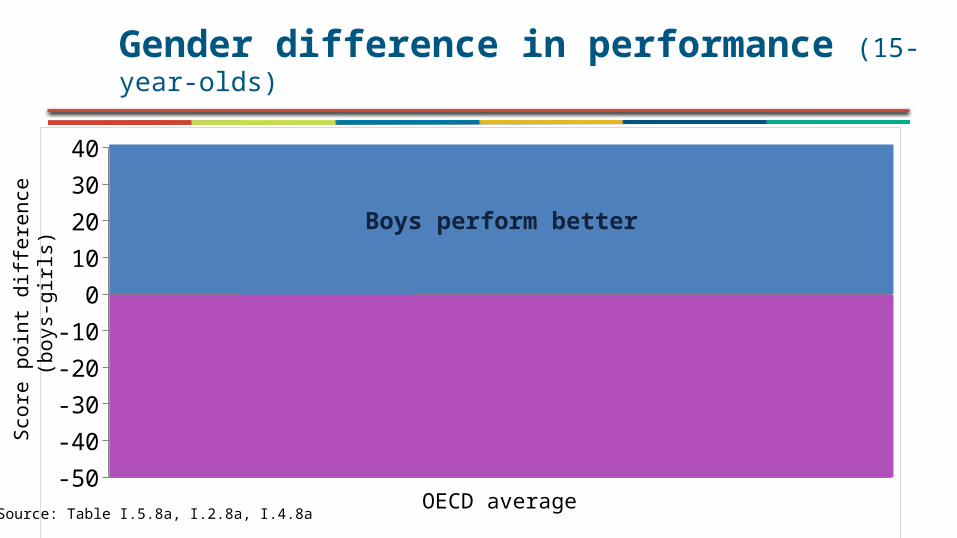
Gender difference in performance (15-year-olds)
OECD average-50-40-30-20-10
010203040
Reading
MathematicsScience
Scor
e po
int d
iffer
ence
(b
oys-
girls
)
Boys perform better
Girls perform better
Source: Table I.5.8a, I.2.8a, I.4.8a
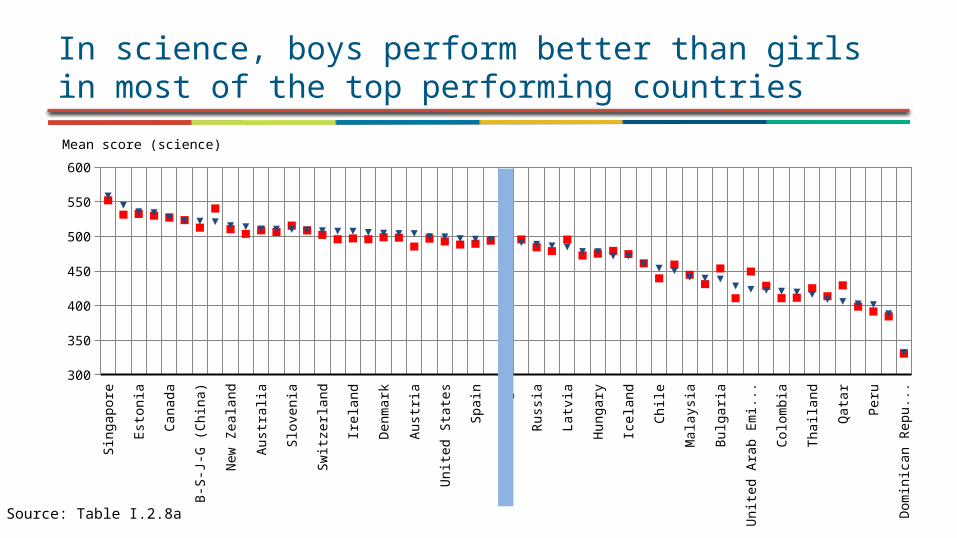
In science, boys perform better than girls in most of the top performing countries
Sing
apor
eJa
pan
Esto
nia
Chin
ese
Taip
eiCa
nada
Hong
Kon
g (C
hina
)B-
S-J-G
(Chi
na)
Finl
and
New
Zea
land
Germ
any
Aust
ralia
Neth
erla
nds
Slov
enia
Unite
d Ki
ngdo
mSw
itzer
land
Belg
ium
Irela
ndPo
rtug
alDe
nmar
kPo
land
Aust
riaNo
rway
Unite
d St
ates
Czec
h Re
publ
icSp
ain
Fran
ceO
ECD
aver
age
Swed
enRu
ssia
Luxe
mbo
urg
Latv
iaCr
oatia
Hung
ary
Lithu
ania
Icela
ndSl
ovak
Rep
ublic
Chile
Gree
ceM
alay
siaUr
ugua
yBu
lgar
iaCo
sta
Rica
Unite
d Ar
ab E
mira
tes
Turk
eyCo
lom
bia
Mex
icoTh
aila
ndM
onte
negr
oQ
atar
Braz
ilPe
ruTu
nisia
Dom
inica
n Re
publ
ic
300
350
400
450
500
550
600
Girls BoysMean score (science)
Source: Table I.2.8a
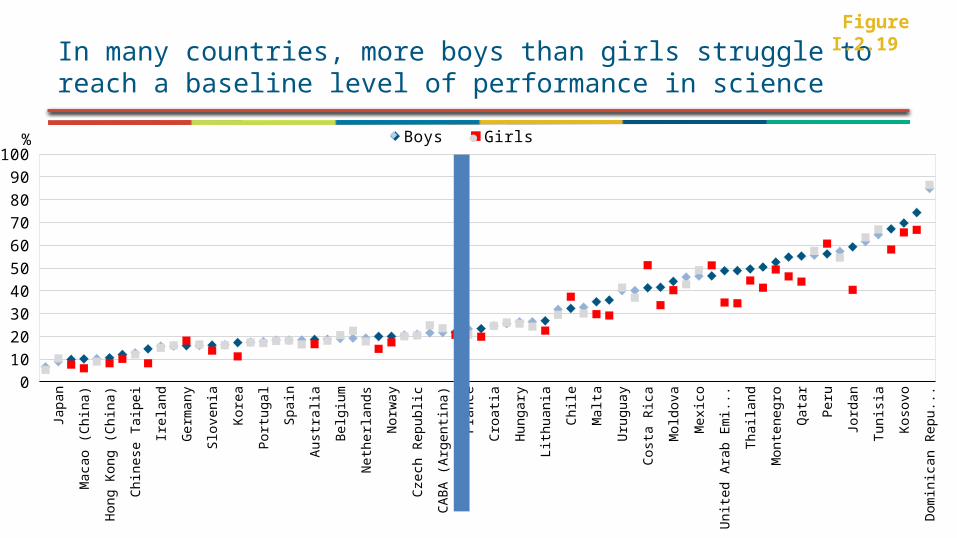
In many countries, more boys than girls struggle to reach a baseline level of performance in science
Figure I.2.19
Dom
inica
n Re
publ
icKo
sovo
Tuni
siaJo
rdan
Peru
Qata
rMo
nten
egro
Thai
land
Unite
d Ar
ab E
mira
tes
Mexi
coMo
ldov
aCo
sta
Rica
Urug
uay
Malta
Chile
Lithu
ania
Hung
ary
Croa
tiaFr
ance
CABA
(Arg
entin
a)Cz
ech
Repu
blic
Norw
ayNe
ther
land
sBe
lgiu
mAu
stra
liaSp
ain
Portu
gal
Kore
aSl
oven
iaGe
rman
yIre
land
Chin
ese
Taip
eiHo
ng K
ong
(Chi
na)
Maca
o (C
hina
)Ja
pan0
102030405060708090
100Boys Girls%
Dom
inica
n Re
publ
icAl
geria
Indo
nesiaPeru
Mexi
coAl
bani
aTh
aila
ndMo
nten
egro
Mold
ova
Braz
ilTr
inid
ad a
nd T
obag
oUr
ugua
yGr
eece
Unite
d Ar
ab E
mira
tes
CABA
(Arg
entin
a)Sl
ovak
Rep
ublic
Russ
iaHu
ngar
ySp
ain
Malta
Hong
Kon
g (C
hina
)Vi
et N
amPo
land
Czec
h Re
publ
icFr
ance
Portu
gal
Maca
o (C
hina
)Sl
oven
iaSw
itzer
land
Kore
aAu
stra
liaFin
land
New
Zeal
and
B-S-
J-G (C
hina
)Ja
pan0
5
10
15
20
25
30Boys Girls%
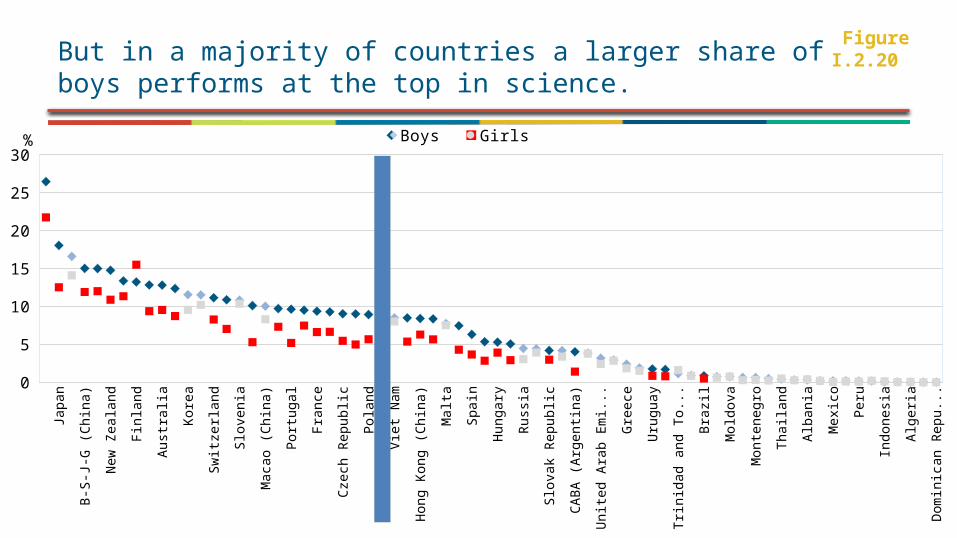
But in a majority of countries a larger share of boys performs at the top in science.
Figure I.2.20
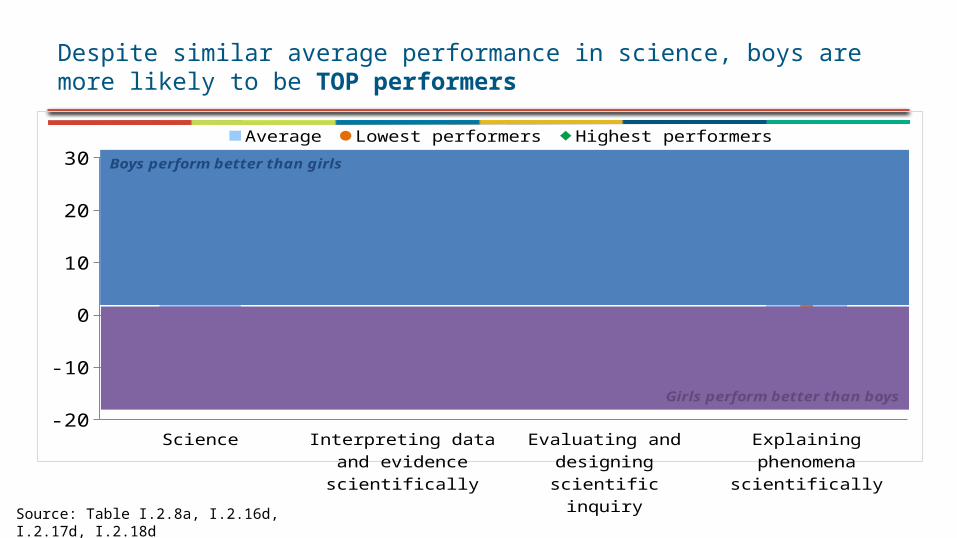
Despite similar average performance in science, boys are more likely to be TOP performers
-20
-10
0
10
20
30Average Lowest performers Highest performers
Boys perform better than girls
Girls perform better than boys
Source: Table I.2.8a, I.2.16d, I.2.17d, I.2.18d
99 Aptitude, behaviour, confidence
Despite major progress in closing gender gaps, we need to find new ways to address the social and
emotional aspects of opening children’s minds to their abilities and future careers
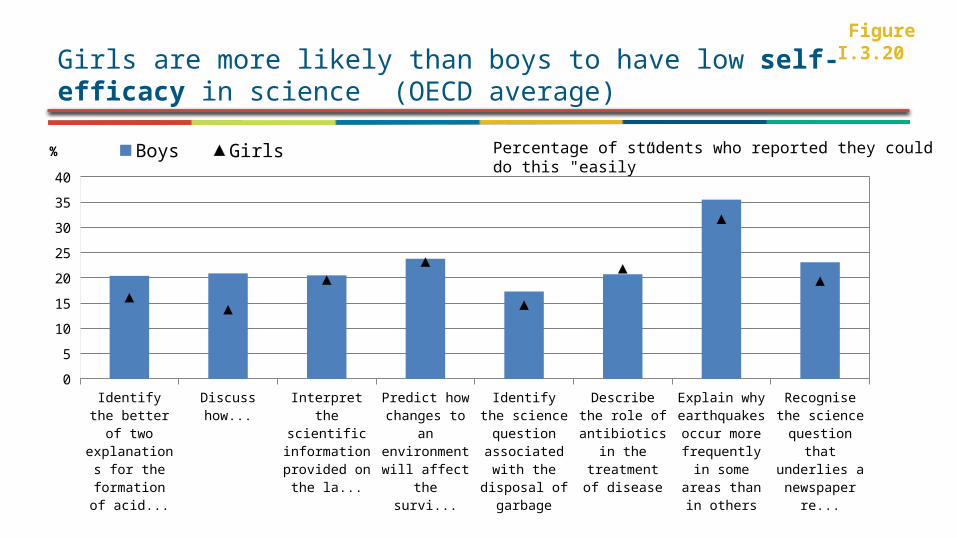
Girls are more likely than boys to have low self-efficacy in science (OECD average)
Recognise the science question that underlies a newspaper re-
port on a health issue
Explain why earthquakes occur more
frequently in some areas
than in others
Describe the role of antibiotics in the treatment of
disease
Identify the sci-ence question
associated with the disposal of
garbage
Predict how changes to an
environment will affect the survival of certain species
Interpret the sci-entific informa-
tion provided on the labelling of
food items
Discuss how new evidence can lead
you to change your understand-
ing about the possibility of life
on Mars
Identify the bet -ter of two expla-nations for the
formation of acid rain
0
5
10
15
20
25
30
35
40
Boys Girls%
Figure I.3.20
Percentage of students who reported they could do this "easily”
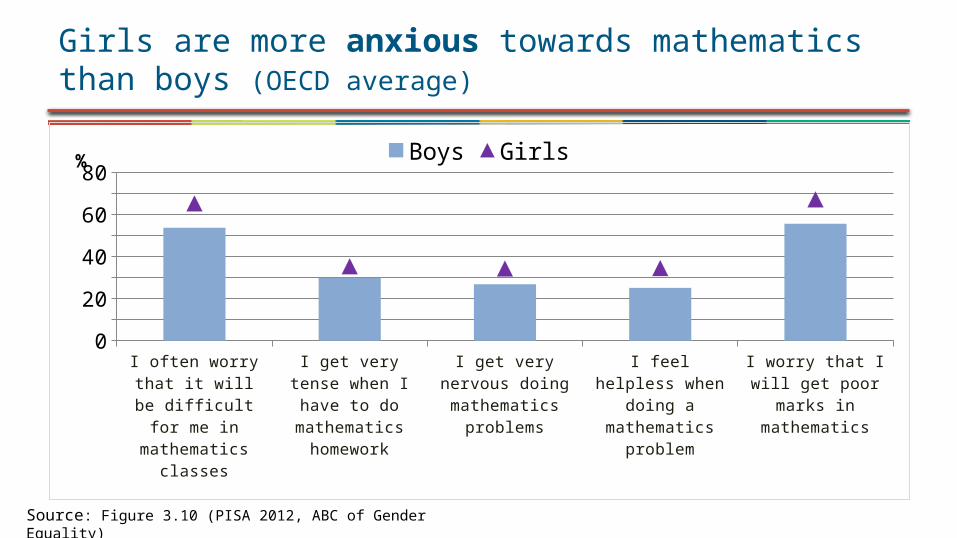
I often worry that it will be difficult for me
in mathematics classes
I get very tense when I have to do mathemat -
ics homework
I get very nervous do-ing mathematics prob-
lems
I feel helpless when doing a mathematics
problem
I worry that I will get poor marks in math-
ematics
01020304050607080
Boys Girls%
Girls are more anxious towards mathematics than boys (OECD average)
Source: Figure 3.10 (PISA 2012, ABC of Gender Equality)
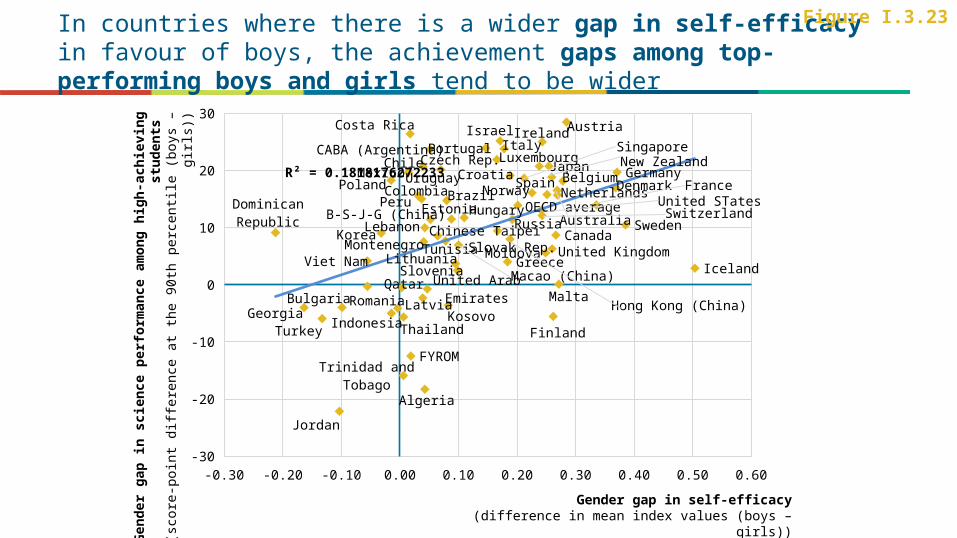
In countries where there is a wider gap in self-efficacy in favour of boys, the achievement gaps among top-performing boys and girls tend to be wider
Figure I.3.23
-0.30 -0.20 -0.10 0.00 0.10 0.20 0.30 0.40 0.50 0.60-30
-20
-10
0
10
20
30
OECD average
CABA (Argentina)Costa Rica
Sweden
Bulgaria Romania
Jordan
Luxembourg
Viet Nam
UruguayPolandUnited STatesNorway
ChileDenmark
Hungary
ItalyCzech Rep.
AustraliaB-S-J-G (China)
TurkeyGeorgia
Chinese Taipei
MexicoPortugal
Iceland
RussiaKorea
Hong Kong (China)Qatar
JapanBelgium
Israel
Trinidad and Tobago
Croatia
Lithuania
FYROM
United Arab Emi-rates
Montenegro
Algeria
Ireland
Indonesia
Greece
New Zealand
Colombia
Tunisia
Peru
Macao (China)
Spain
Switzerland
Malta
EstoniaLebanon
Dominican RepublicNetherlands
GermanySingapore
Slovak Rep.
Austria
CanadaUnited Kingdom
Slovenia
FranceBrazil
KosovoFinlandThailand
Latvia
Moldova
R² = 0.1818176272233G
ende
r ga
p in
sci
ence
per
form
ance
am
ong
high
-ach
ievi
ng
stud
ents
(s
core
-poi
nt d
iffer
ence
at t
he 9
0th
perc
entil
e (b
oys –
girl
s))
Gender gap in self-efficacy(difference in mean index values (boys – girls))
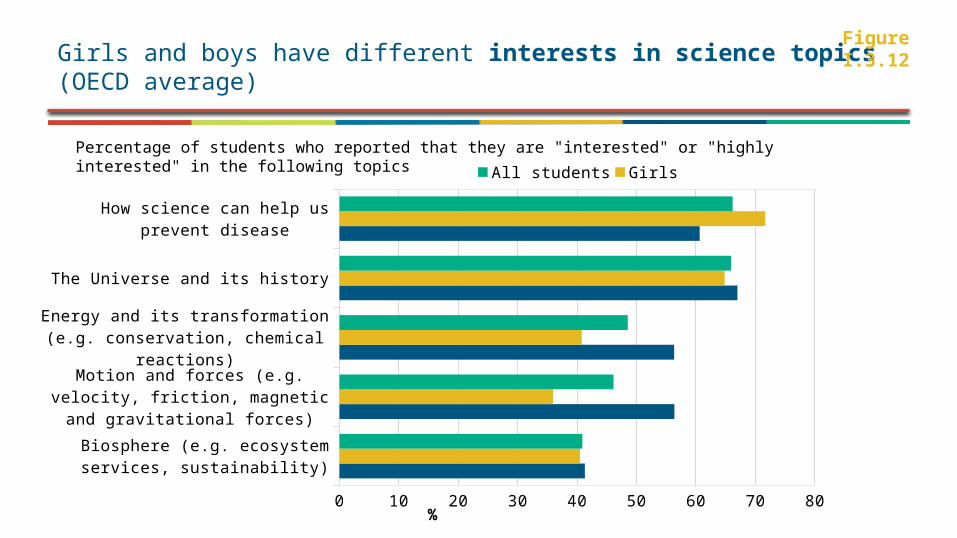
Girls and boys have different interests in science topics (OECD average)
Figure I.3.12
Biosphere (e.g. ecosystem services, sustainability)
Motion and forces (e.g. velocity, fric-tion, magnetic and gravitational
forces)
Energy and its transformation (e.g. conservation, chemical reactions)
The Universe and its history
How science can help us prevent disease
0 10 20 30 40 50 60 70 80
All students Girls Boys
%
Percentage of students who reported that they are "interested" or "highly interested" in the following topics
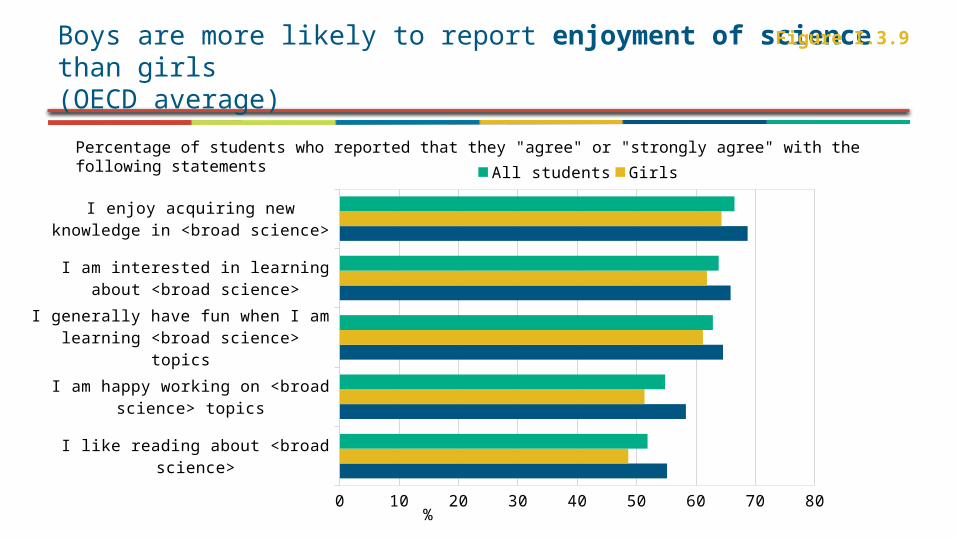
Boys are more likely to report enjoyment of science than girls (OECD average)
Figure I.3.9
I like reading about <broad science>
I am happy working on <broad science> topics
I generally have fun when I am learn-ing <broad science> topics
I am interested in learning about <broad science>
I enjoy acquiring new knowledge in <broad science>
0 10 20 30 40 50 60 70 80
All students Girls Boys
%
Percentage of students who reported that they "agree" or "strongly agree" with the following statements
1515 Aptitude and confidence
Career choices seem to reflect aptitude and confidence more than performance
This is significant not only because women are severely under-represented in the science, technology, engineering and mathematics (STEM) fields of study and
occupations, but also because graduates of these fields are in high demand in the labour market and because jobs in these fields are among the most highly paid.
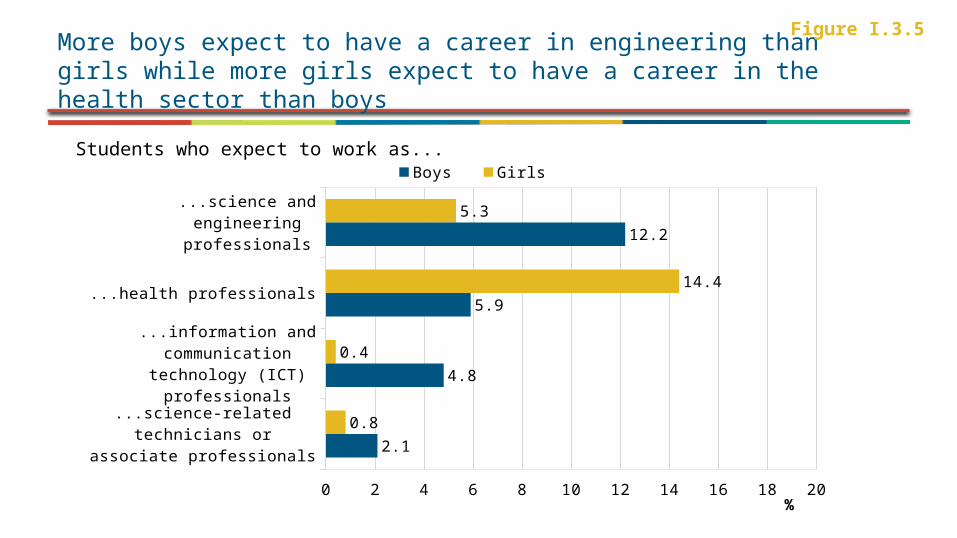
More boys expect to have a career in engineering than girls while more girls expect to have a career in the health sector than boys
Figure I.3.5
...science and engineering professionals
...health professionals
...information and commu-nication technology (ICT)
professionals
...science-related techni-cians or associate pro-
fessionals
0 2 4 6 8 10 12 14 16 18 20
5.3
14.4
0.4
0.8
12.2
5.9
4.8
2.1
Boys Girls
%
Students who expect to work as...
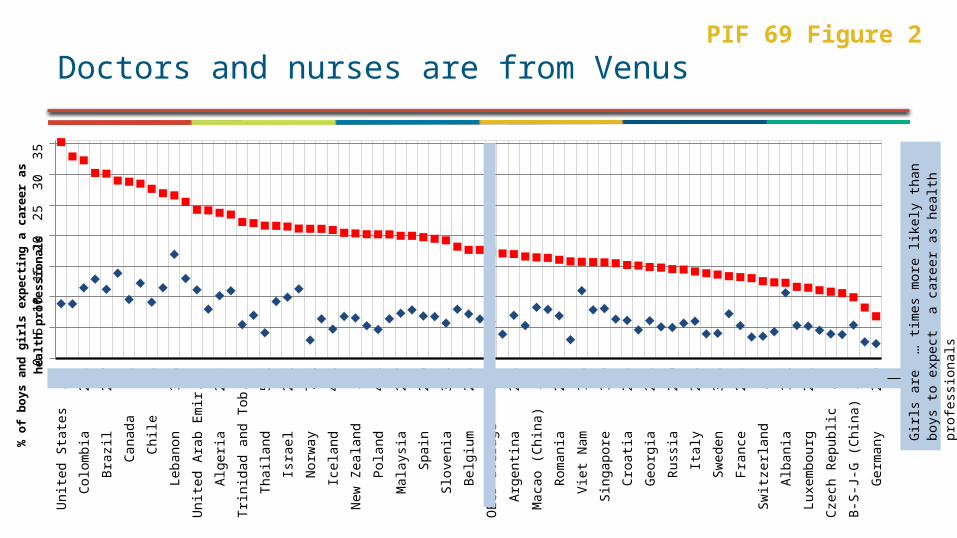
Doctors and nurses are from VenusUn
ited
Stat
es
4
Colo
mbi
a
2.8
Braz
il
2.7
Cana
da
3
Chile
3
Leba
non
1
.6
Unite
d Ar
ab E
mira
tes
2.
2
Alge
ria
2.3
Trin
idad
and
Tob
ago
4
.1
Thai
land
5
.2
Israe
l
2.2
Norw
ay
7.2
Icela
nd
4.4
New
Zea
land
3
.1
Pola
nd
4.3
Mal
aysia
2
.7
Spai
n
2.9
Slov
enia
3
.4
Belg
ium
2
.5
OEC
D av
erag
e
2.9
Arge
ntina
2
.4
Mac
ao (C
hina
)
2
Rom
ania
2
.3
Viet
Nam
1
.4
Sing
apor
e
1.9
Croa
tia
2.5
Geor
gia
2
.4
Russ
ia
2.9
Italy
2
.4
Swed
en
3.4
Fran
ce
2.5
Switz
erla
nd
3.5
Alba
nia
1
.2
Luxe
mbo
urg
2
.2
Czec
h Re
publ
ic
2.8
B-S-
J-G (C
hina
)
1.8
Germ
any
2
.9
05
1015
2025
3035
Boys Girls
% o
f boy
s an
d gi
rls e
xpec
ting
a ca
reer
as
heal
th p
rofe
ssio
nals
Girls
are
...
times
mor
e lik
ely
than
boy
s to
expe
ct a
ca-
reer
as h
ealth
pro
fess
iona
ls
PIF 69 Figure 2
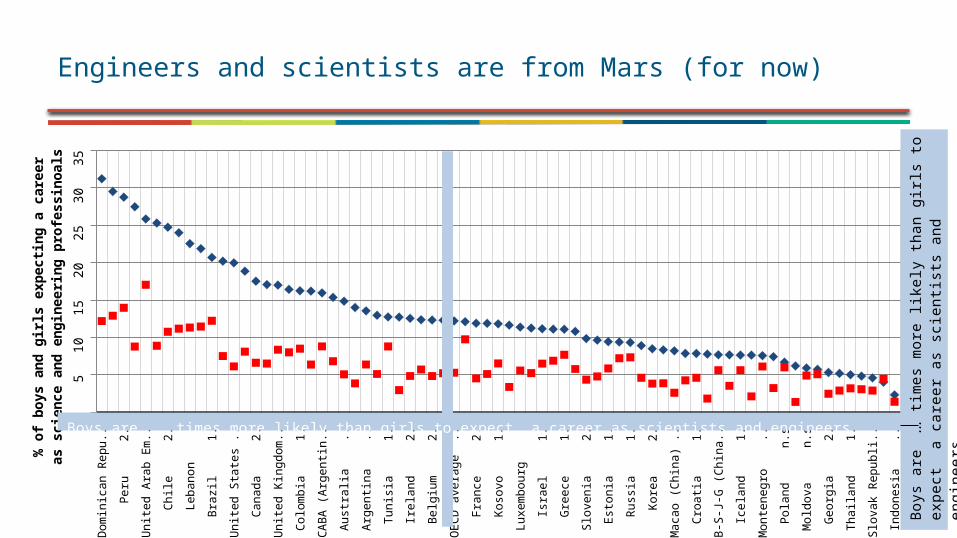
Engineers and scientists are from Mars (for now)Do
min
ican
Rep
ublic
...
Peru
2
.1
Uni
ted
Arab
Em
irate
s ...
Chile
2
.3
Leba
non
2
Braz
il
1.7
Uni
ted
Stat
es
3.3
Cana
da
2.7
Uni
ted
King
dom
2
Colo
mbi
a
1.9
CABA
(Arg
entin
a)
...
Aust
ralia
2
.9
Arge
ntina
2
.1
Tuni
sia
1
.4
Irela
nd
2.6
Belg
ium
2
.6
OEC
D av
erag
e
2.4
Fran
ce
2.6
Koso
vo
1.8
Luxe
mbo
urg
2
Isra
el
1.7
Gre
ece
1
.4
Slov
enia
2
.3
Esto
nia
1
.6
Russ
ia
1.3
Kore
a
2.2
Mac
ao (C
hina
)
3.2
Croa
tia
1.7
B-S-
J-G
(Chi
na)
1.
4
Icel
and
1
.4
Mon
tene
gro
1
.2
Pola
nd
n.s
.
Mol
dova
n
.s.
Geo
rgia
2
.2
Thai
land
1
.6
Slov
ak R
epub
lic
1.6
Indo
nesi
a
1.7
05
1015
2025
3035
Boys Girls
% o
f boy
s an
d gi
rls e
xpec
ting
a ca
reer
as s
cien
ce a
nd
engi
neer
ing
prof
essi
noal
s
Boys are ... times more likely than girls to expect a career as scientists and engineers
Boys
are
... ti
mes
mor
e lik
ely
than
girl
s to
expe
ct a
care
er a
s sci-
entis
ts a
nd e
ngin
eers

1919 Closing the gaps
What's needed is neither extensive nor expensive reform but a concerted effort
by parents, teachers and employers
What parents can do
Hung
ary
(28
)
Port
ugal
(2
7)
Chile
(2
8)
Italy
(2
4)
Croa
tia
(18)
Germ
any
(19
)
Mex
ico
(21)
Hong
Kon
g-Ch
ina
(13
)
Kore
a (
7)
Mac
ao-C
hina
(1
0)
0
10
20
30
40
50
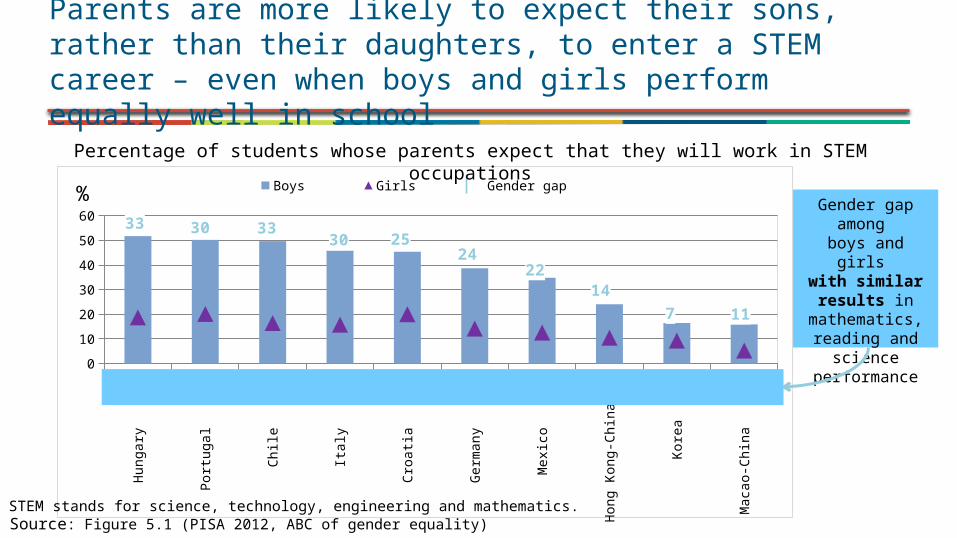
60 33 30 3330 25
2422
147 11
Boys Girls Gender gap%
Parents are more likely to expect their sons, rather than their daughters, to enter a STEM career – even when boys and girls perform equally well in school
Source: Figure 5.1 (PISA 2012, ABC of gender equality)
Gender gap among boys and girls with similar
results in mathematics, reading and
science performance
STEM stands for science, technology, engineering and mathematics.
Percentage of students whose parents expect that they will work in STEM occupations
Shan
ghai
-Chi
na
-1.2
Kaza
khst
an
-1.2
Italy
-3
.1
Rom
ania
-1
.8
Viet
Nam
Aust
ralia
-1
.0
Lithu
ania
-2
.8
Hong
Kon
g-Ch
ina
-1.
8
Unite
d St
ates
-1
.8
Alba
nia
Colo
mbi
a -
0.6
Mex
ico
-0.6
Croa
tia
-2.2
Belg
ium
-1
.7
Cana
da
-1.8
Thai
land
-2
.0
Mal
aysia
-1
.0
OEC
D av
erag
e -
1.3
Fran
ce
-1.7
Urug
uay
-1.
1
Israe
l -1
.2
Germ
any
-1.
7
Denm
ark
-1.
2
Jord
an
-1.1
Japa
n -
0.6
Mon
tene
gro
-1.
8
Tuni
sia
-0.3
Cost
a Ri
ca
-0.4
Chile
-0
.5
Liech
tens
tein
Swed
en
-1.1
Czec
h Re
publ
ic -
0.9
Finl
and
-1.
1
0
2
4
6
8
10
12
14
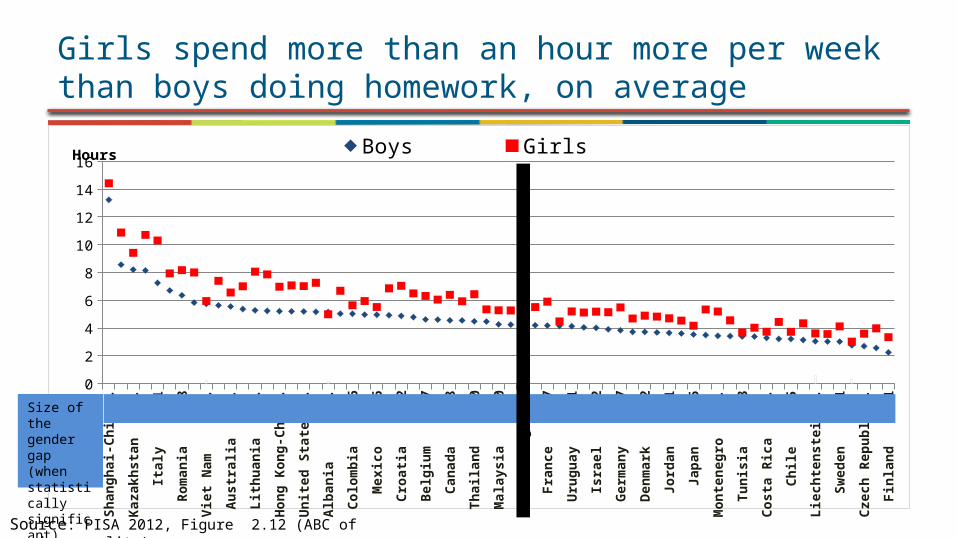
16Boys GirlsHours
Girls spend more than an hour more per week than boys doing homework, on average
Source: PISA 2012, Figure 2.12 (ABC of gender equality)
Size of the gender gap (when statistically significant)
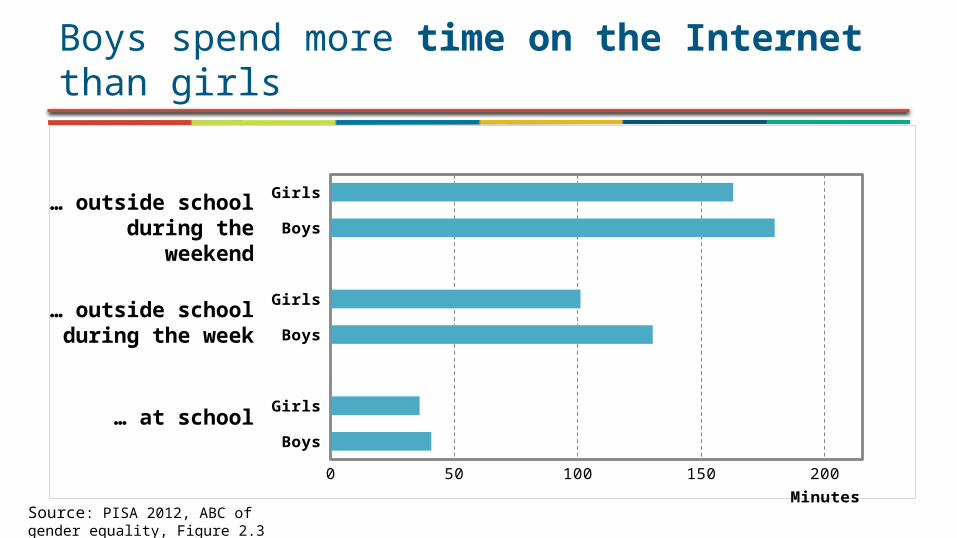
Boys spend more time on the Internet than girls
Source: PISA 2012, ABC of gender equality, Figure 2.3
Boys
Girls
Boys
Girls
Boys
Girls
0 50 100 150 200
OECD average-29
Minutes
… at school
… outside school during the week
… outside school during the weekend

2323 Closing the gaps
What's needed is neither extensive nor expensive reform but a concerted effort
by parents, teachers and employers
What teachers can do
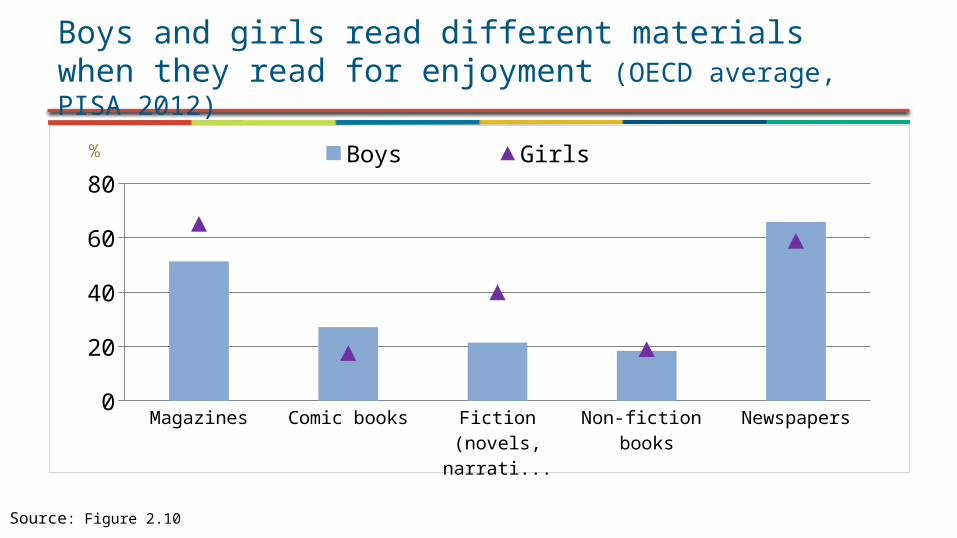
010203040506070
Boys Girls%
Boys and girls read different materials when they read for enjoyment (OECD average, PISA 2012)
Source: Figure 2.10
Colombia
Tunisi
a
Uruguay
Belgium
Portuga
l
Luxe
mbourg
Netherlands
Chile
Switz
erland
Mexico
Turke
y
Liech
tenstein
Qatar
OECD av
erage
Austria
Shan
ghai-
China
Canada
Irelan
d
Slova
k Republic
Greece
Czech
Republic
New Zeala
nd
Sweden
Slovenia
Romania
Albania
Lithuan
ia
Croatia
Israe
l
Kazakh
stan
Icelan
d05
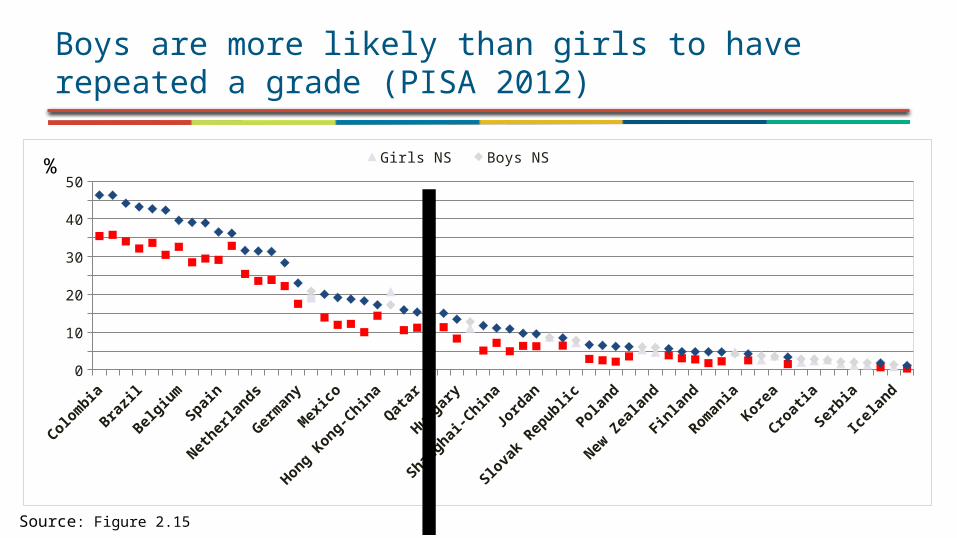
101520253035404550
Girls NS Boys NS%
Boys are more likely than girls to have repeated a grade (PISA 2012)
Source: Figure 2.15
Alba
nia
Icel
and
Gree
ce
Spai
n
Israe
l
OEC
D av
erag
e
Unite
d St
ates
Chile
Denm
ark
Fran
ce
Indo
nesia
Peru
Bulg
aria
Mac
edon
ia (F
YR)
-12
-10
-8
-6
-4
-2
0
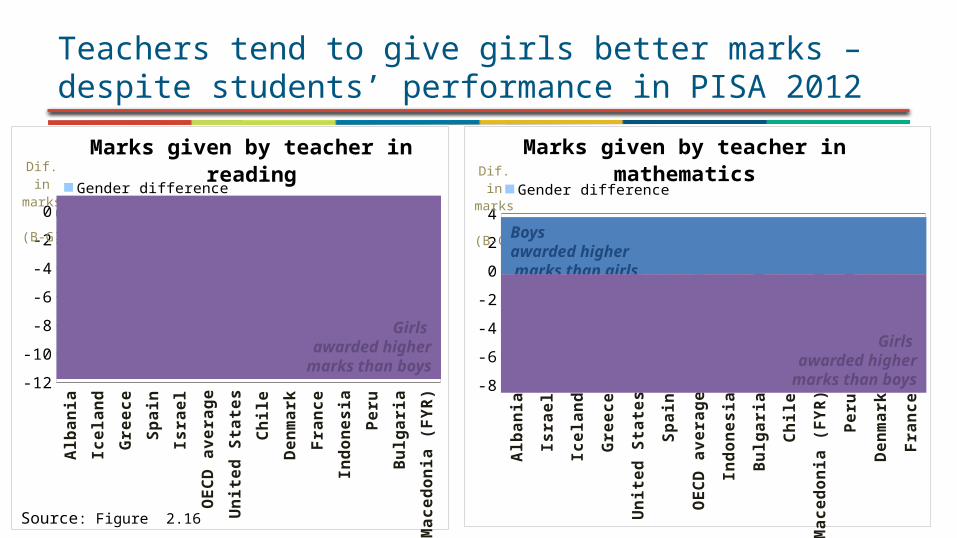
Marks given by teacher in readingGender differenceGender difference after accounting for PISA scores
Dif. in marks (B-G)
Teachers tend to give girls better marks – despite students’ performance in PISA 2012
Source: Figure 2.16Al
bani
a
Israe
l
Icel
and
Gree
ce
Unite
d St
ates
Spai
n
OEC
D av
erag
e
Indo
nesia
Bulg
aria
Chile
Mac
edon
ia (F
YR)
Peru
Denm
ark
Fran
ce
-8
-6
-4
-2
0
2
4
Marks given by teacher in mathematics
Gender differenceGender difference after accounting for PISA scores
Dif. in marks (B-G)
Boys awarded higher marks than girls
Girls awarded higher
marks than boysGirls
awarded higher marks than boys

2727 Closing the gaps
What's needed is neither extensive nor expensive reform but a concerted effort
by parents, teachers and employersWhat employers can do
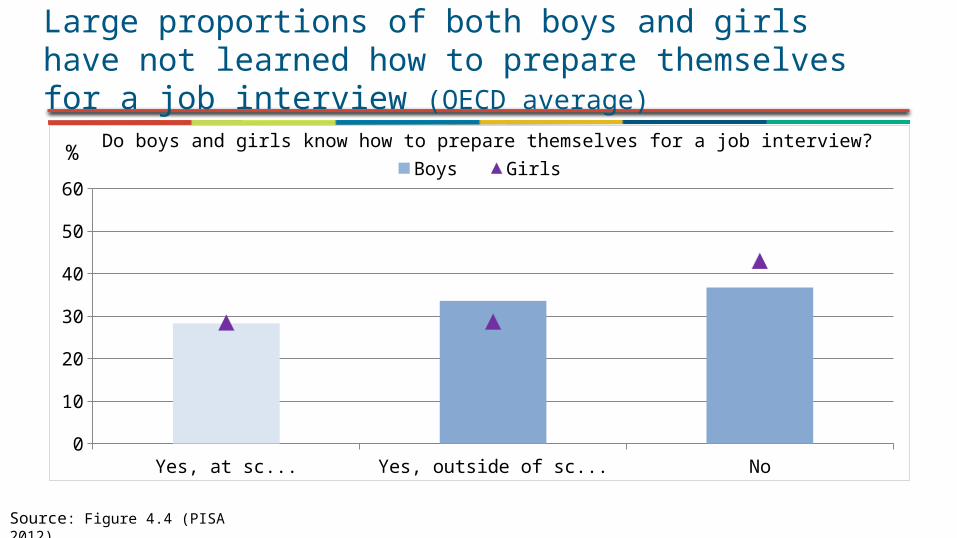
Yes, at school Yes, outside of school No0
10
20
30
40
50
60Boys Girls
%
Large proportions of both boys and girls have not learned how to prepare themselves for a job interview (OECD average)
Source: Figure 4.4 (PISA 2012)
Do boys and girls know how to prepare themselves for a job interview?
01020304050607080
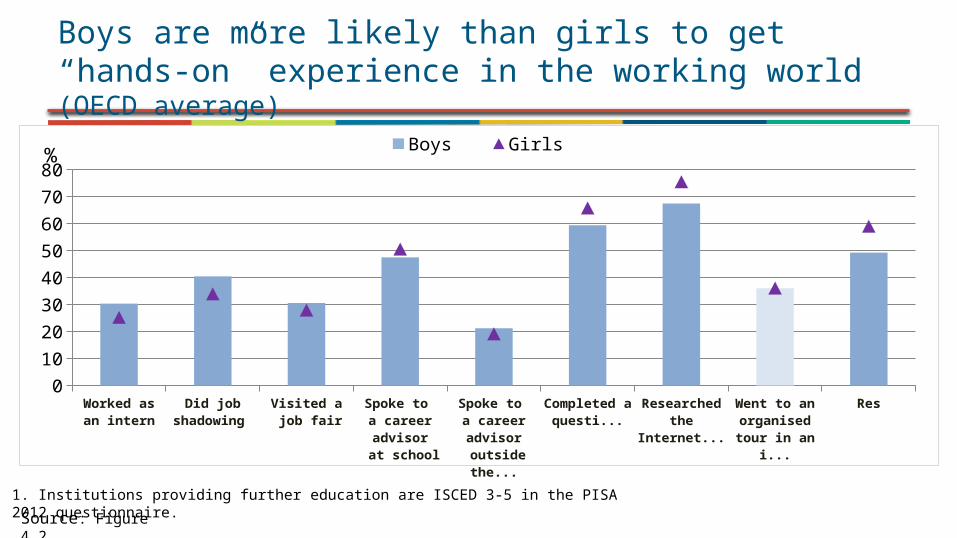
Boys Girls%
Boys are more likely than girls to get “hands-on” experience in the working world (OECD average)
Source: Figure 4.2
1. Institutions providing further education are ISCED 3-5 in the PISA 2012 questionnaire.
Japa
n
Finl
and
Neth
erla
nds
Kore
a
Flan
ders
Swed
en
Esto
nia
Aust
ralia
Czec
h Re
publ
ic
Germ
any
OEC
D av
erag
e
Aust
ria
Cana
da
Pola
nd
Norw
ay
Denm
ark
Slov
ak R
epub
lic
Fran
ce
Unite
d St
ates
Irela
nd
Unite
d Ki
ngdo
m
Russ
ian
Fede
ra...
Spai
n
Italy
250
260
270
280
290
300
310
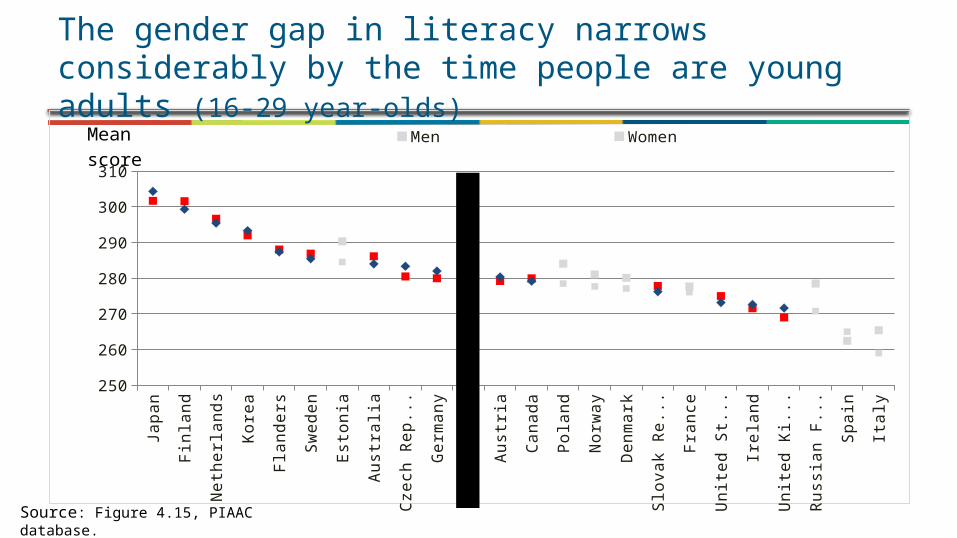
Men Women Mean score
The gender gap in literacy narrows considerably by the time people are young adults (16-29 year-olds)
Source: Figure 4.15, PIAAC database.
Japa
n
Kore
a
Aust
ria
Nor
way
Net
herla
nds
Flan
ders
Fran
ce
Czec
h Re
publ
ic
Germ
any
Cana
da
Swed
en
Denm
ark
Unite
d St
ates
OEC
D av
erag
e
Unite
d Ki
ngdo
m
Irela
nd
Spai
n
Finl
and
Aust
ralia
Italy
Esto
nia
Slov
ak R
epub
lic
Russ
ian
Fede
ratio
n
Pola
nd
-0.30-0.20-0.100.000.100.200.300.400.50
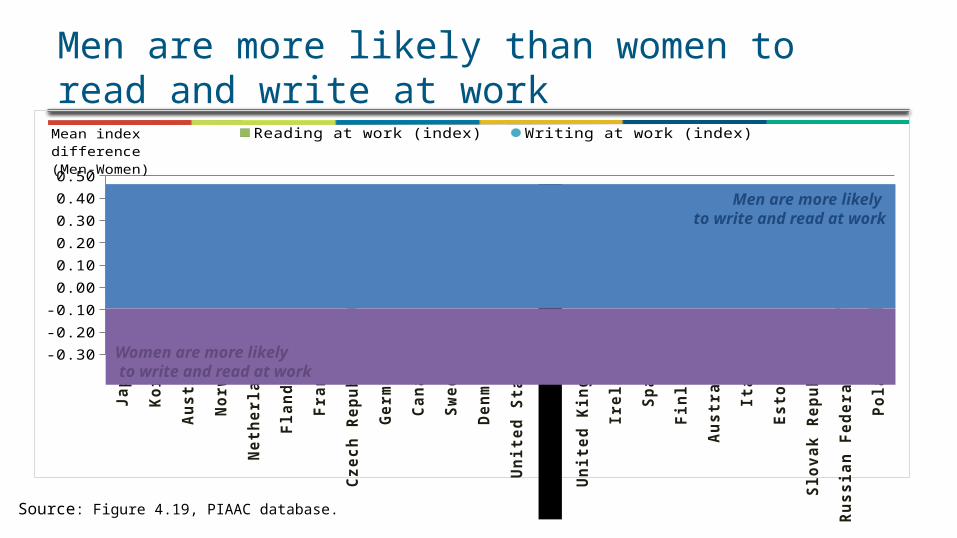
Reading at work (index) Writing at work (index)Mean index difference (Men-Women)
Men are more likely than women to read and write at work
Source: Figure 4.19, PIAAC database.
Men are more likely to write and read at work
Women are more likely to write and read at work
Parents
EmployersTeachers
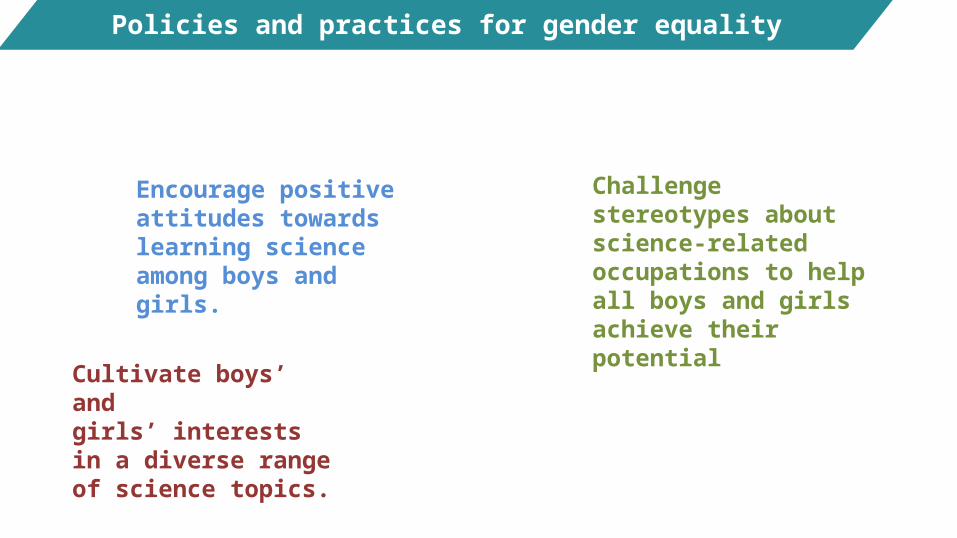
Challenge stereotypes about science-related occupations to help all boys and girlsachieve their potential
Encourage positive attitudes towards learning science among boys and girls.
Cultivate boys’ andgirls’ interests in a diverse range of science topics.
Policies and practices for gender equality
THANK YOU
Find out more about PISA at www. oecd.org/pisa
• All national and international publications• The complete micro-level database
Related Documents