Gemeinsam zum Handeln anregen Zurich Insurance Group Geschäftsbericht 2021

Welcome message from author
This document is posted to help you gain knowledge. Please leave a comment to let me know what you think about it! Share it to your friends and learn new things together.
Transcript
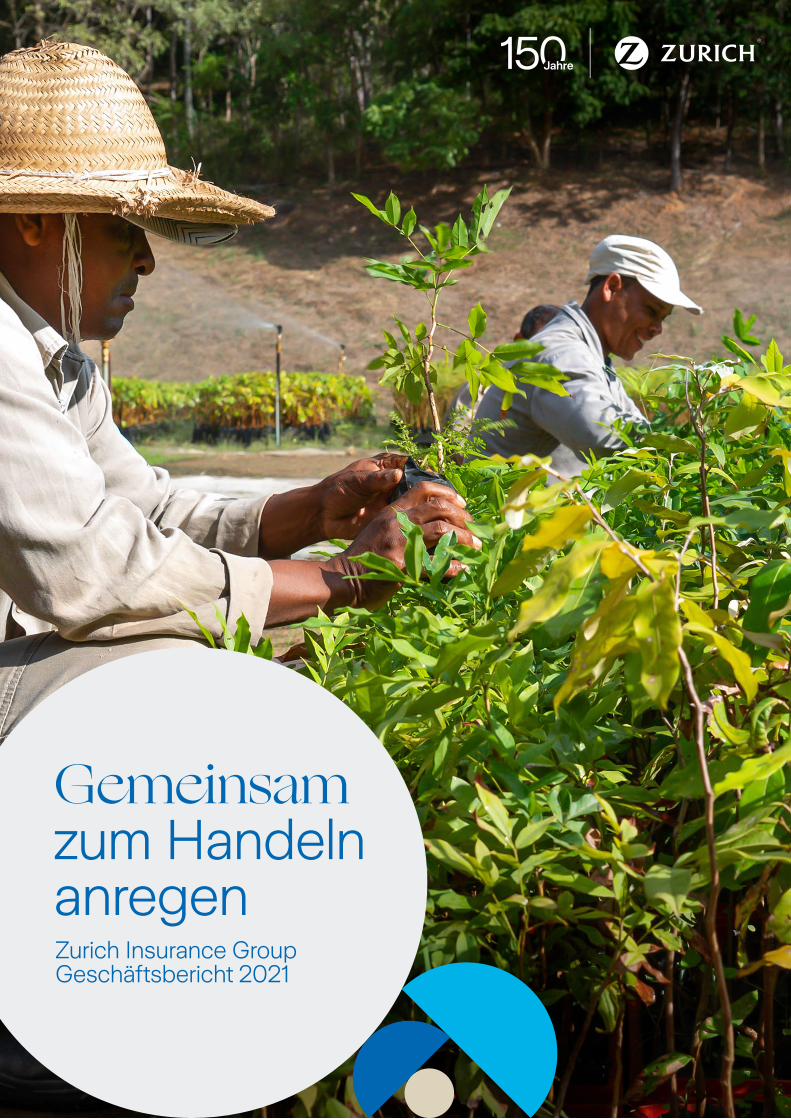
Gemeinsam zum Handeln anregenZurich Insurance GroupGeschäftsbericht 2021
Konzernüberblick
Unser Geschäft 3
Brief des Verwaltungsratspräsidenten 10
Brief des Group CEO 12
Unser Geschäftsmodell 16
Unsere Strategie 18
Unsere Anspruchsgruppen 21
Governance
Mitteilung des Verwaltungsratspräsidenten zur Corporate Governance 40
Bericht über die Corporate Governance 42
Mitteilung des Vorsitzenden des Vergütungsausschusses 84
Vergütungsbericht 86
Integrated sustainability disclosure
Executive message on sustainability 120
Integrated sustainability disclosure 122
Risk review
Message from our Group Chief Risk Officer 184
Risk review 186
Financial review
Message from our Group Chief Financial Officer 218
Financial overview 220
Message from our Group Chief Investment Officer 230
Consolidated financial statements 232
Holding company 354
Shareholder information 368
Glossar 370
Kontakt 373
Zurich Insurance Group (Zurich) ist eine führende Mehrspartenversicherung, die über 55 Millionen Kunden – sowohl Privatpersonen als auch Unternehmen – in mehr als 210 Ländern und Gebieten betreut. Vor 150 Jahren gegründet, treibt Zurich heute den Wandel in der Versicherungsbranche voran. Die Gruppe bietet neben Versicherungsschutz zunehmend auch Präventionsdienstleistungen an, die beispielsweise das Wohlbefinden fördern und die Klimaresilienz stärken.
Im Einklang mit dem Ziel «gemeinsam eine bessere Zukunft zu gestalten» strebt Zurich danach, eines der verantwortungs und wirkungsvollsten Unternehmen der Welt zu sein. Die Gruppe beabsichtigt, bis 2050 NettoNullEmissionen zu erreichen, und ist gemäss dem S&P Global Corporate Sustainability Assessment einer der nachhaltigsten Versicherer weltweit. Im Jahr 2020 lancierte Zurich das Projekt «Zurich Forest», um die Wiederaufforstung und Wiederherstellung der Biodiversität in Brasilien zu unterstützen.
Die Gruppe hat ihren Hauptsitz in Zürich, Schweiz, und beschäftigt rund 56’000 Mitarbeitende. Zurich Insurance Group AG (ZURN) ist an der SIX Swiss Exchange kotiert und verfügt über ein Level I American Depositary Receipt Programm (ZURVY), das ausserbörslich an der OTCQX gehandelt wird. Weitere Informationen über Zurich sind verfügbar unter www.zurich.com.
Wenn wir zusammenarbeiten, erreichen wir mehr. Lernen Sie einige der Menschen kennen, die mit oder für Zurich arbeiten und dazu beitragen, das Unternehmen zu dem zu machen, was es heute ist. Erfahren Sie etwas über ihre Ansichten und wie sie andere dazu inspirieren, es ihnen gleichzutun und sich für wichtige Anliegen einzusetzen. Wir ziehen Bilanz aus 150 Jahren Innovation und blicken in eine Zukunft, in der sich Zurich weiter anpassen und wachsen wird – im Interesse des Unternehmens, seiner Kunden, Mitarbeitenden, Partner und des Planeten.
Zurich Insurance Group Geschäftsbericht 2021
Zum Handeln anregen
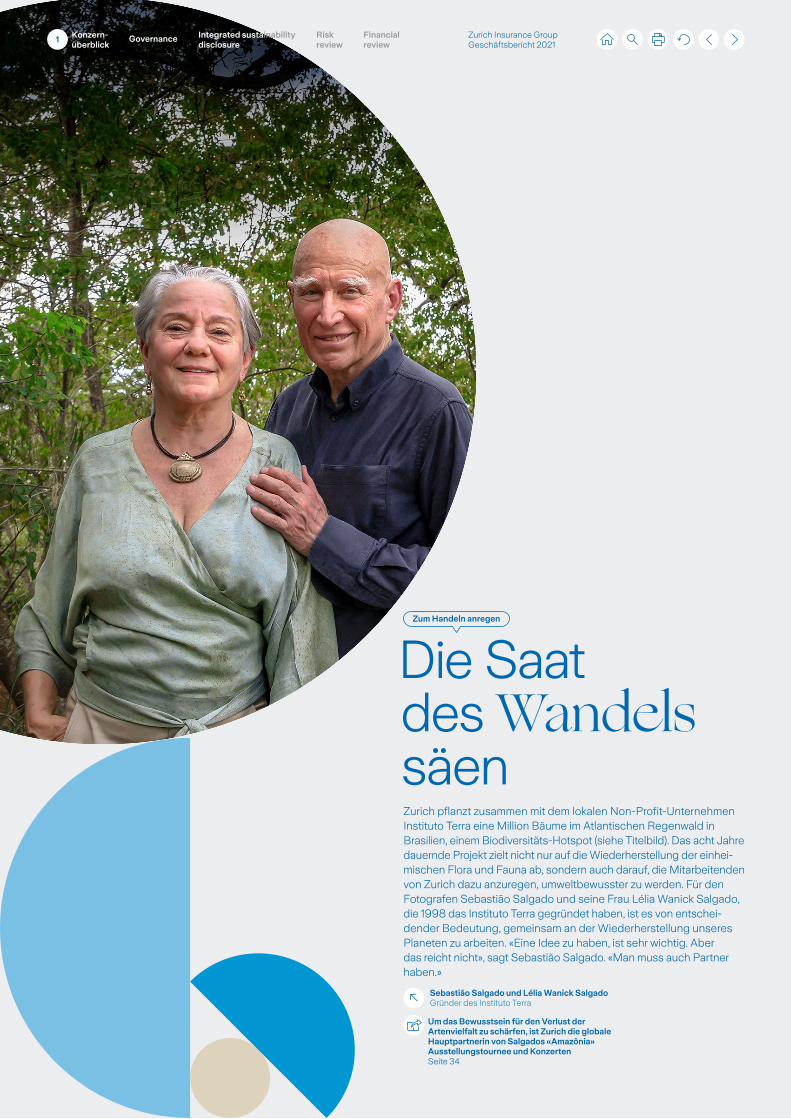
Zurich pflanzt zusammen mit dem lokalen NonProfitUnternehmen Instituto Terra eine Million Bäume im Atlantischen Regenwald in Brasilien, einem BiodiversitätsHotspot (siehe Titelbild). Das acht Jahre dauernde Projekt zielt nicht nur auf die Wiederherstellung der einheimischen Flora und Fauna ab, sondern auch darauf, die Mitarbeitenden von Zurich dazu anzuregen, umweltbewusster zu werden. Für den Fotografen Sebastião Salgado und seine Frau Lélia Wanick Salgado, die 1998 das Instituto Terra gegründet haben, ist es von entscheidender Bedeutung, gemeinsam an der Wiederherstellung unseres Planeten zu arbeiten. «Eine Idee zu haben, ist sehr wichtig. Aber das reicht nicht», sagt Sebastião Salgado. «Man muss auch Partner haben.»
Sebastião Salgado und Lélia Wanick SalgadoGründer des Instituto Terra
Um das Bewusstsein für den Verlust der Artenvielfalt zu schärfen, ist Zurich die globale Hauptpartnerin von Salgados «Amazônia» Ausstellungstournee und KonzertenSeite 34
Die Saat des Wandels säen
Zurich Insurance Group Geschäftsbericht 2021
1 Konzern-überblick
Integrated sustainability disclosure
Governance Risk review
Financial review
Zum Handeln anregen
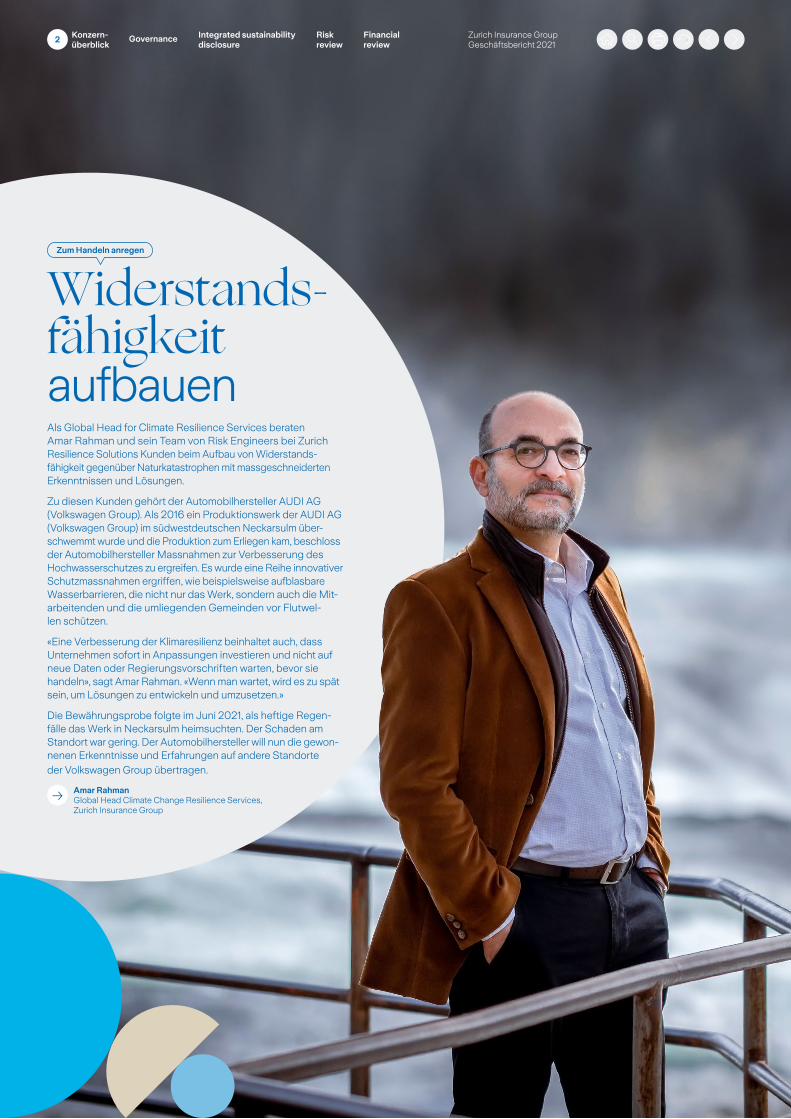
Widerstandsfähigkeit aufbauenAls Global Head for Climate Resilience Services beraten Amar Rahman und sein Team von Risk Engineers bei Zurich Resilience Solutions Kunden beim Aufbau von Widerstandsfähigkeit gegenüber Naturkatastrophen mit massgeschneiderten Erkenntnissen und Lösungen.
Zu diesen Kunden gehört der Automobilhersteller AUDI AG (Volkswagen Group). Als 2016 ein Produktionswerk der AUDI AG (Volkswagen Group) im südwestdeutschen Neckarsulm überschwemmt wurde und die Produktion zum Erliegen kam, beschloss der Automobilhersteller Massnahmen zur Verbesserung des Hochwasserschutzes zu ergreifen. Es wurde eine Reihe innovativer Schutzmassnahmen ergriffen, wie beispielsweise aufblasbare Wasserbarrieren, die nicht nur das Werk, sondern auch die Mitarbeitenden und die umliegenden Gemeinden vor Flutwellen schützen.
«Eine Verbesserung der Klimaresilienz beinhaltet auch, dass Unternehmen sofort in Anpassungen investieren und nicht auf neue Daten oder Regierungsvorschriften warten, bevor sie handeln», sagt Amar Rahman. «Wenn man wartet, wird es zu spät sein, um Lösungen zu entwickeln und umzusetzen.»
Die Bewährungsprobe folgte im Juni 2021, als heftige Regenfälle das Werk in Neckarsulm heimsuchten. Der Schaden am Standort war gering. Der Automobilhersteller will nun die gewonnenen Erkenntnisse und Erfahrungen auf andere Standorte der Volkswagen Group übertragen.
Amar RahmanGlobal Head Climate Change Resilience Services, Zurich Insurance Group
2 Zurich Insurance Group Geschäftsbericht 2021
Konzern-überblick
Integrated sustainability disclosure
Governance Risk review
Financial review
Unser Geschäft
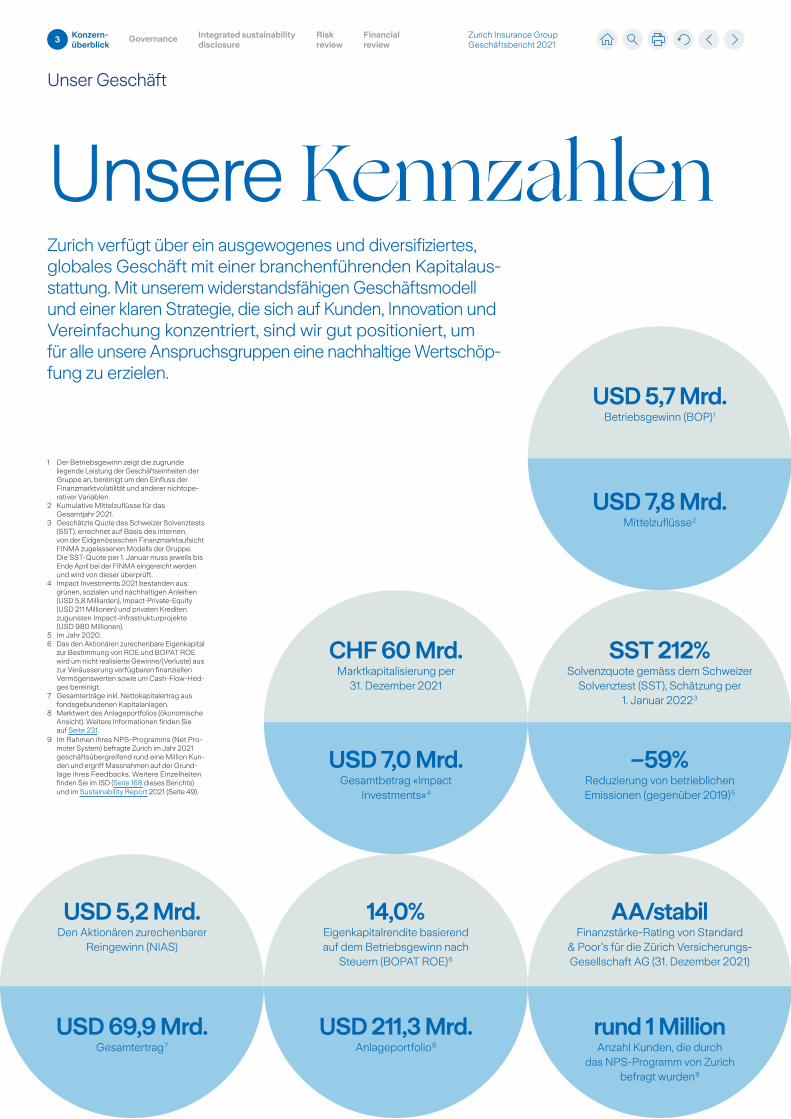
Unsere KennzahlenZurich verfügt über ein ausgewogenes und diversifiziertes, globales Geschäft mit einer branchenführenden Kapitalausstattung. Mit unserem widerstandsfähigen Geschäftsmodell und einer klaren Strategie, die sich auf Kunden, Innovation und Vereinfachung konzentriert, sind wir gut positioniert, um für alle unsere Anspruchsgruppen eine nachhaltige Wertschöpfung zu erzielen.
1 Der Betriebsgewinn zeigt die zugrunde liegende Leistung der Geschäftseinheiten der Gruppe an, bereinigt um den Einfluss der Finanzmarktvolatilität und anderer nichtoperativer Variablen.
2 Kumulative Mittelzuflüsse für das Gesamtjahr 2021.
3 Geschätzte Quote des Schweizer Solvenztests (SST), errechnet auf Basis des internen, von der Eidgenössischen Finanzmarktaufsicht FINMA zugelassenen Modells der Gruppe. Die SSTQuote per 1. Januar muss jeweils bis Ende April bei der FINMA eingereicht werden und wird von dieser überprüft.
4 Impact Investments 2021 bestanden aus: grünen, sozialen und nachhaltigen Anleihen (USD 5,8 Milliarden), ImpactPrivateEquity (USD 211 Millionen) und privaten Krediten zugunsten ImpactInfrastrukturprojekte (USD 980 Millionen).
5 Im Jahr 2020.6 Das den Aktionären zurechenbare Eigenkapital
zur Bestimmung von ROE und BOPAT ROE wird um nicht realisierte Gewinne/(Verluste) aus zur Veräusserung verfügbaren finanziellen Vermögenswerten sowie um CashFlowHedges bereinigt.
7 Gesamterträge inkl. Nettokapitalertrag aus fondsgebundenen Kapitalanlagen.
8 Marktwert des Anlageportfolios (ökonomische Ansicht). Weitere Informationen finden Sie auf Seite 231.
9 Im Rahmen ihres NPSProgramms (Net Promoter System) befragte Zurich im Jahr 2021 geschäftsübergreifend rund eine Million Kunden und ergriff Massnahmen auf der Grundlage ihres Feedbacks. Weitere Einzelheiten finden Sie im ISD (Seite 168 dieses Berichts) und im Sustainability Report 2021 (Seite 49).
USD 5,7 Mrd.Betriebsgewinn (BOP) 1
USD 5,2 Mrd.Den Aktionären zurechenbarer
Reingewinn (NIAS)
14,0%Eigenkapitalrendite basierend auf dem Betriebsgewinn nach
Steuern (BOPAT ROE) 6
USD 7,8 Mrd.Mittelzuflüsse 2
USD 69,9 Mrd.Gesamtertrag 7
USD 211,3 Mrd.Anlageportfolio 8
CHF 60 Mrd.Marktkapitalisierung per
31. Dezember 2021
SST 212%Solvenzquote gemäss dem Schweizer
Solvenztest (SST), Schätzung per 1. Januar 2022 3
AA/stabilFinanzstärkeRating von Standard
& Poor’s für die Zürich VersicherungsGesellschaft AG (31. Dezember 2021)
USD 7,0 Mrd.Gesamtbetrag «Impact
Investments» 4
–59%Reduzierung von betrieblichen Emissionen (gegenüber 2019) 5
rund 1 MillionAnzahl Kunden, die durch
das NPSProgramm von Zurich befragt wurden 9
3 Zurich Insurance Group Geschäftsbericht 2021
Konzern-überblick
Integrated sustainability disclosure
Governance Risk review
Financial review
Unser Geschäft (fortgesetzt)
1.
2.
3.
4.
5.
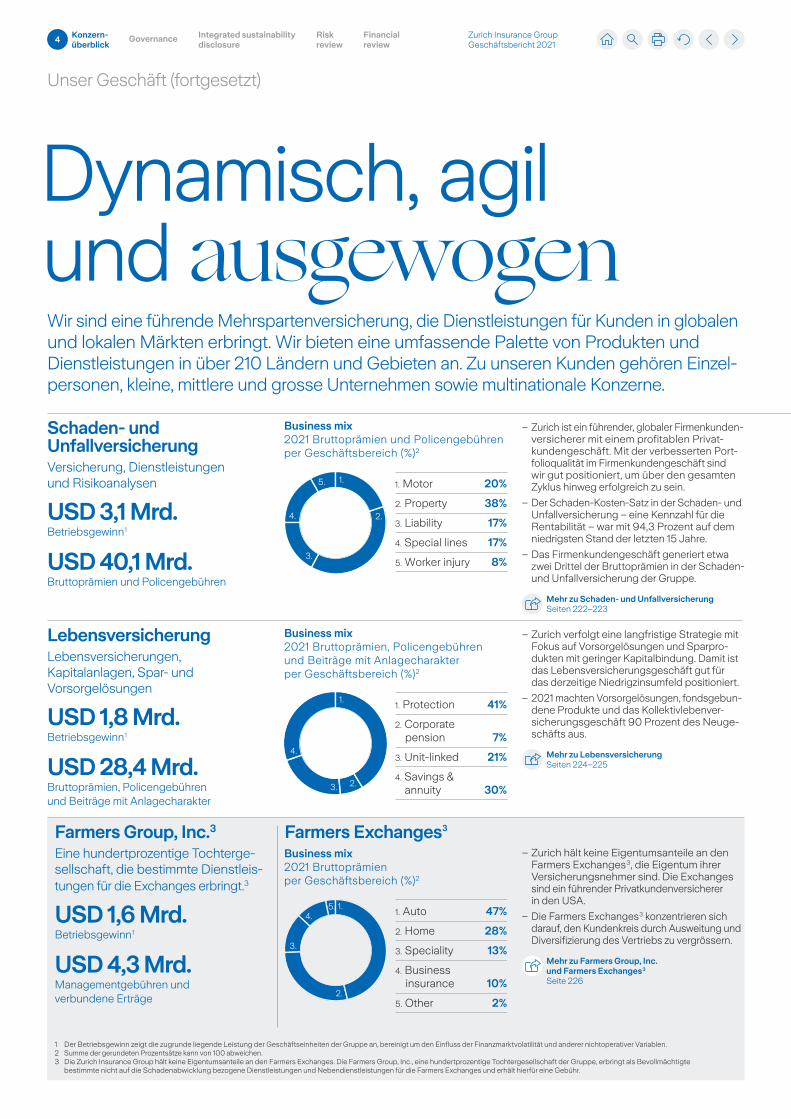
Business mix2021 Bruttoprämien und Policengebühren per Geschäftsbereich (%)2
1. Motor 20%
2. Property 38%
3. Liability 17%
4. Special lines 17%
5. Worker injury 8%
Business mix2021 Bruttoprämien, Policengebühren und Beiträge mit Anlagecharakter per Geschäftsbereich (%)2
1.
2.3.
4.
1. Protection 41%
2. Corporate pension 7%
3. Unit-linked 21%
4. Savings & annuity 30%
Business mix2021 Bruttoprämien per Geschäftsbereich (%)2
1. Auto 47%
2. Home 28%
3. Speciality 13%
4. Business insurance 10%
5. Other 2%
1.
2.
3.
4.5.
Dynamisch, agil und ausgewogenWir sind eine führende Mehrspartenversicherung, die Dienstleistungen für Kunden in globalen und lokalen Märkten erbringt. Wir bieten eine umfassende Palette von Produkten und Dienstleistungen in über 210 Ländern und Gebieten an. Zu unseren Kunden gehören Einzelpersonen, kleine, mittlere und grosse Unternehmen sowie multinationale Konzerne.
Schaden- und UnfallversicherungVersicherung, Dienstleistungen und Risikoanalysen
USD 3,1 Mrd.Betriebsgewinn 1
USD 40,1 Mrd.Bruttoprämien und Policengebühren
LebensversicherungLebensversicherungen, Kapitalanlagen, Spar und Vorsorgelösungen
USD 1,8 Mrd.Betriebsgewinn 1
USD 28,4 Mrd.Bruttoprämien, Policengebühren und Beiträge mit Anlagecharakter
Farmers Group, Inc.3
Eine hundertprozentige Tochtergesellschaft, die bestimmte Dienstleistungen für die Exchanges erbringt.3
USD 1,6 Mrd.Betriebsgewinn 1
USD 4,3 Mrd.Managementgebühren und verbundene Erträge
Farmers Exchanges3
– Zurich ist ein führender, globaler Firmenkundenversicherer mit einem profitablen Privatkundengeschäft. Mit der verbesserten Portfolioqualität im Firmenkundengeschäft sind wir gut positioniert, um über den gesamten Zyklus hinweg erfolgreich zu sein.
– Der SchadenKostenSatz in der Schaden und Unfallversicherung – eine Kennzahl für die Rentabilität – war mit 94,3 Prozent auf dem niedrigsten Stand der letzten 15 Jahre.
– Das Firmenkundengeschäft generiert etwa zwei Drittel der Bruttoprämien in der Schaden und Unfallversicherung der Gruppe.
Mehr zu Schaden- und UnfallversicherungSeiten 222–223
– Zurich verfolgt eine langfristige Strategie mit Fokus auf Vorsorgelösungen und Sparprodukten mit geringer Kapitalbindung. Damit ist das Lebensversicherungsgeschäft gut für das derzeitige Niedrigzinsumfeld positioniert.
– 2021 machten Vorsorgelösungen, fondsgebundene Produkte und das Kollektivlebenversicherungsgeschäft 90 Prozent des Neugeschäfts aus.
Mehr zu LebensversicherungSeiten 224–225
– Zurich hält keine Eigentumsanteile an den Farmers Exchanges 3, die Eigentum ihrer Versicherungsnehmer sind. Die Exchanges sind ein führender Privatkundenversicherer in den USA.
– Die Farmers Exchanges 3 konzentrieren sich darauf, den Kundenkreis durch Ausweitung und Diversifizierung des Vertriebs zu vergrössern.
Mehr zu Farmers Group, Inc. und Farmers Exchanges 3
Seite 226
1 Der Betriebsgewinn zeigt die zugrunde liegende Leistung der Geschäftseinheiten der Gruppe an, bereinigt um den Einfluss der Finanzmarktvolatilität und anderer nichtoperativer Variablen.2 Summe der gerundeten Prozentsätze kann von 100 abweichen.3 Die Zurich Insurance Group hält keine Eigentumsanteile an den Farmers Exchanges. Die Farmers Group, Inc., eine hundert prozentige Tochtergesellschaft der Gruppe, erbringt als Bevoll mäch tigte
bestimmte nicht auf die Schadenabwicklung bezogene Dienstleistungen und Nebendienstleistungen für die Farmers Exchanges und erhält hierfür eine Gebühr.
4 Zurich Insurance Group Geschäftsbericht 2021
Konzern-überblick
Integrated sustainability disclosure
Governance Risk review
Financial review

5 Konzern-überblick
Financial review
Risk review
Governance Integrated sustainability disclosure
Zum Handeln anregen
Zum Handeln anregen
Vertrauen gewinnenAls Assistentin in der Schadenabwicklung von Zurich setzt Carriane Chan unsere kundenorientierte Strategie täglich um. Bei jeder Schadenanfrage setzt Carriane Chan darauf, Vertrauen zu den Kundinnen und Kunden aufzubauen, indem sie ihnen zuhört, ihre Bedürfnisse erkennt und sie vor allem als Menschen behandelt. «Es ist wichtig, dass wir uns in die Situation unserer Kundinnen und Kunden hineinversetzen», sagt Carriane Chan, die in Hongkong arbeitet. «Indem wir uns auf die Einzigartigkeit und nicht auf die Gemeinsamkeiten jeder einzelnen Schadenanfrage konzentrieren, können wir unseren Kundinnen und Kunden eine bessere Erfahrung bieten – und wenn sie zufriedener sind, sind auch wir zufriedener mit unserer Arbeit.»
Carriane ChanClaims Service Assistant, Zurich Hong Kong
Für etwas einstehen«Mit kleinen Veränderungen und gemeinsamem Handeln lässt sich viel bewirken», sagt Amy Meek, Mitbegründerin der britischen gemeinnützigen Organisation Kids Against Plastic. Amy Meek gründete die Organisation zusammen mit ihrer Schwester Ella im Jahr 2016, als sie gerade 12 und 10 Jahre alt waren. Kids Against Plastic weckt das Bewusstsein für die mit der Plastikverschmutzung verbundenen Umweltprobleme und inspiriert die Menschen dazu, Plastikabfälle zu vermeiden. Amy Meek sprach kürzlich auf der Youth Against Carbon Conference, die von Zurich UK organisiert wurde, um jungen Menschen eine Stimme in der Debatte über Massnahmen zur Bekämpfung des Klimawandels zu geben. Sie spielte auch eine Schlüsselrolle in der globalen Markenkampagne des Unternehmens, in der sie als «Klimaheldin» agierte, um zu inspirieren und die geballte Kraft des gemeinsamen Handelns zu zeigen.
Amy MeekAktivistin und Mitbegründerin von Kids Against Plastic
Zurich Insurance Group Geschäftsbericht 2021
Zum Handeln anregen
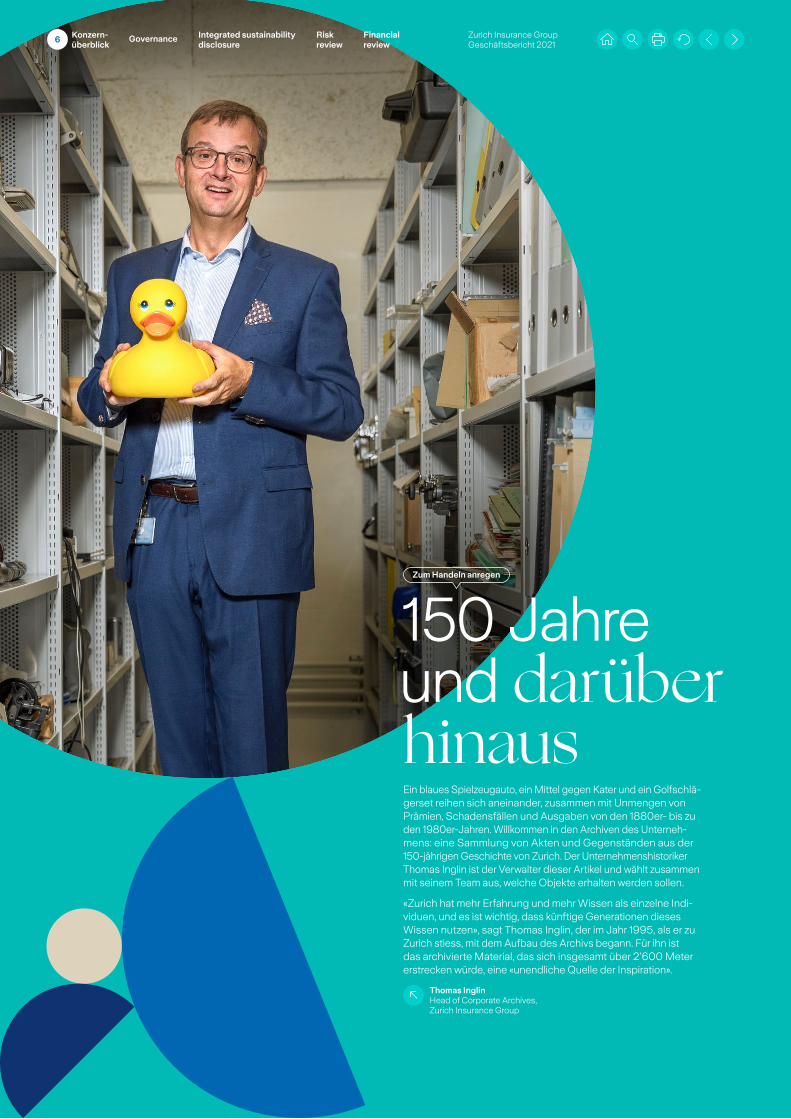
Ein blaues Spielzeugauto, ein Mittel gegen Kater und ein Golfschlägerset reihen sich aneinander, zusammen mit Unmengen von Prämien, Schadensfällen und Ausgaben von den 1880er bis zu den 1980erJahren. Willkommen in den Archiven des Unternehmens: eine Sammlung von Akten und Gegenständen aus der 150jährigen Geschichte von Zurich. Der Unternehmenshistoriker Thomas Inglin ist der Verwalter dieser Artikel und wählt zusammen mit seinem Team aus, welche Objekte erhalten werden sollen.
«Zurich hat mehr Erfahrung und mehr Wissen als einzelne Individuen, und es ist wichtig, dass künftige Generationen dieses Wissen nutzen», sagt Thomas Inglin, der im Jahr 1995, als er zu Zurich stiess, mit dem Aufbau des Archivs begann. Für ihn ist das archivierte Material, das sich insgesamt über 2’600 Meter erstrecken würde, eine «unendliche Quelle der Inspiration».
Thomas InglinHead of Corporate Archives, Zurich Insurance Group
150 Jahre und darüber hinaus
6 Zurich Insurance Group Geschäftsbericht 2021
Konzern-überblick
Integrated sustainability disclosure
Governance Risk review
Financial review
Unser Geschäft (fortgesetzt)
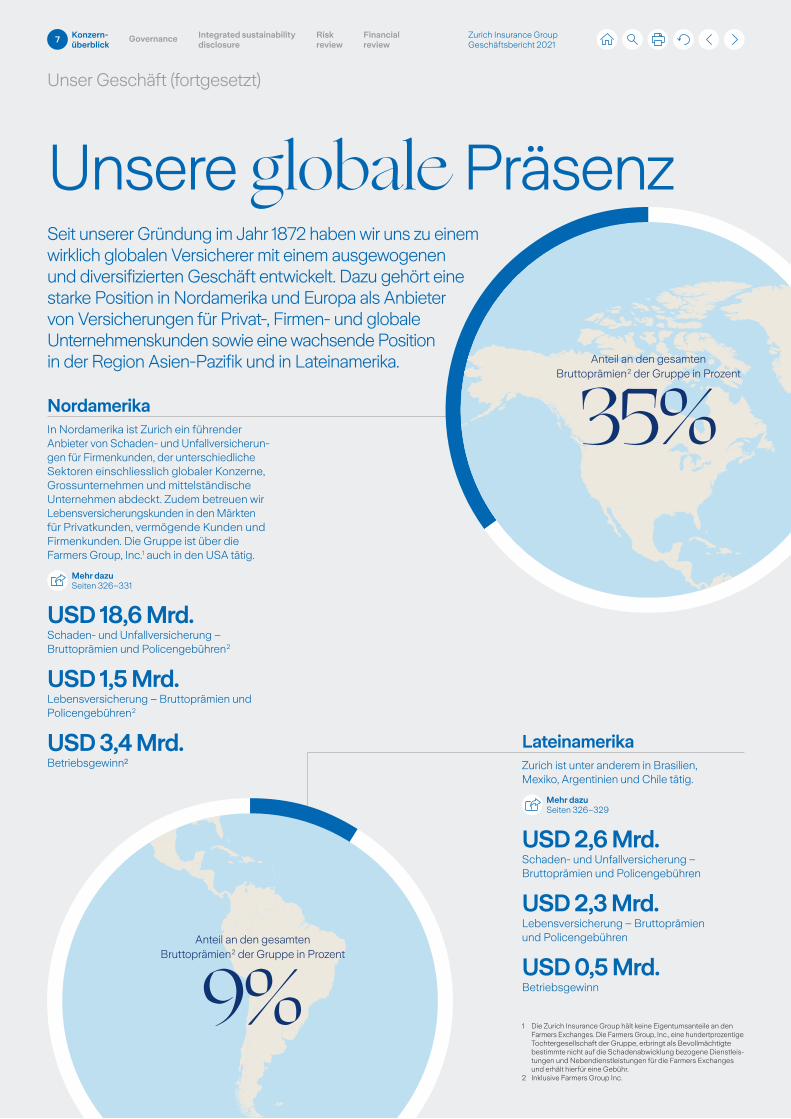
Unsere globale PräsenzSeit unserer Gründung im Jahr 1872 haben wir uns zu einem wirklich globalen Versicherer mit einem ausgewogenen und diversifizierten Geschäft entwickelt. Dazu gehört eine starke Position in Nordamerika und Europa als Anbieter von Versicherungen für Privat, Firmen und globale Unternehmenskunden sowie eine wachsende Position in der Region AsienPazifik und in Lateinamerika.
NordamerikaIn Nordamerika ist Zurich ein führender Anbieter von Schaden und Unfallversicherungen für Firmenkunden, der unterschiedliche Sektoren einschliesslich globaler Konzerne, Grossunternehmen und mittelständische Unternehmen abdeckt. Zudem betreuen wir Lebensversicherungskunden in den Märkten für Privatkunden, vermögende Kunden und Firmenkunden. Die Gruppe ist über die Farmers Group, Inc.1 auch in den USA tätig.
Mehr dazuSeiten 326–331
USD 18,6 Mrd.Schaden und Unfallversicherung – Bruttoprämien und Policengebühren 2
USD 1,5 Mrd.Lebensversicherung – Bruttoprämien und Policengebühren 2
USD 3,4 Mrd.Betriebsgewinn�
Anteil an den gesamten Bruttoprämien 2 der Gruppe in Prozent
35%
Lateinamerika Zurich ist unter anderem in Brasilien, Mexiko, Argentinien und Chile tätig.
Mehr dazuSeiten 326–329
USD 2,6 Mrd.Schaden und Unfallversicherung – Bruttoprämien und Policengebühren
USD 2,3 Mrd.Lebensversicherung – Bruttoprämien und Policengebühren
USD 0,5 Mrd.Betriebsgewinn
1 Die Zurich Insurance Group hält keine Eigentumsanteile an den Farmers Exchanges. Die Farmers Group, Inc., eine hundertprozentige Tochtergesellschaft der Gruppe, erbringt als Bevollmächtigte bestimmte nicht auf die Schadenabwicklung bezogene Dienstleistungen und Nebendienstleistungen für die Farmers Exchanges und erhält hierfür eine Gebühr.
2 Inklusive Farmers Group Inc.
Anteil an den gesamten Bruttoprämien 2 der Gruppe in Prozent
9%
7 Zurich Insurance Group Geschäftsbericht 2021
Konzern-überblick
Integrated sustainability disclosure
Governance Risk review
Financial review
Unser Geschäft (fortgesetzt)
Asien-PazifikZurich baut ihre Präsenz in der Region AsienPazifik aus, mit Standorten in Australien, Hongkong, Indonesien, Japan und Malaysia.
Mehr dazuSeiten 326–329
USD 3,2 Mrd.Schaden und Unfallversicherung – Bruttoprämien und Policengebühren
USD 2,6 Mrd.Lebensversicherung – Bruttoprämien und Policengebühren
USD 0,6 Mrd.Betriebsgewinn
1 Inklusive Farmers Group Inc.
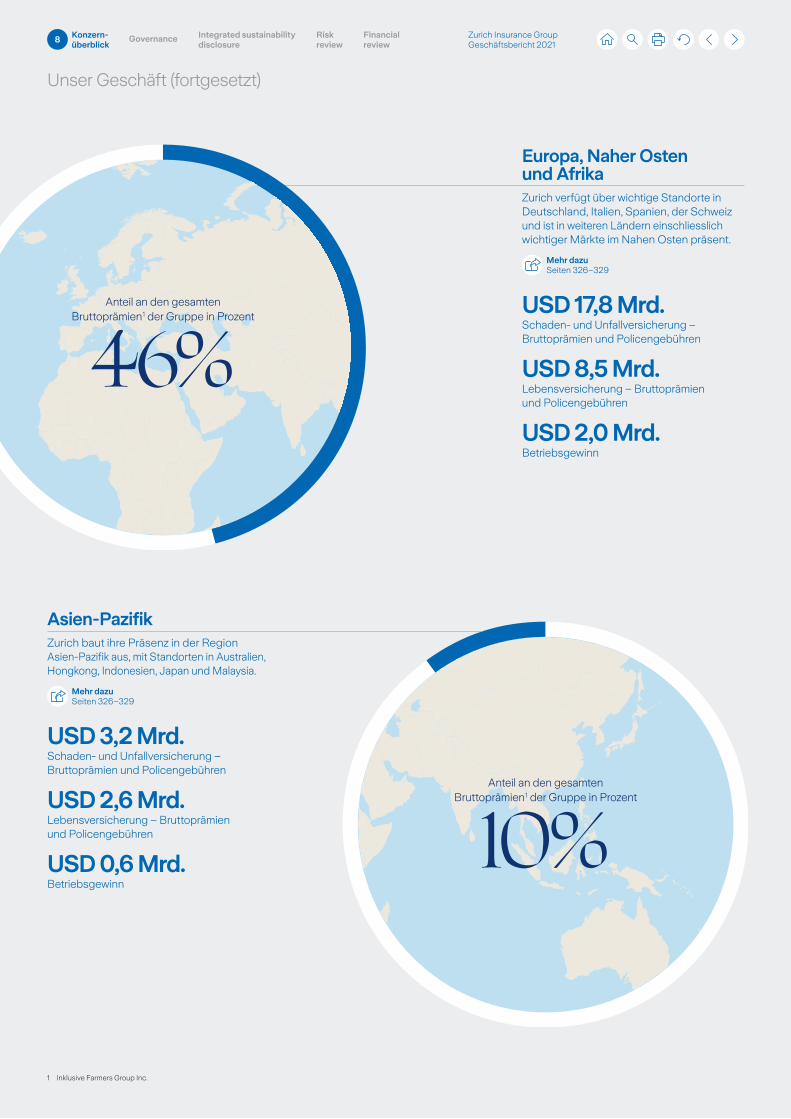
Europa, Naher Osten und Afrika Zurich verfügt über wichtige Standorte in Deutschland, Italien, Spanien, der Schweiz und ist in weiteren Ländern einschliesslich wichtiger Märkte im Nahen Osten präsent.
Mehr dazuSeiten 326–329
USD 17,8 Mrd.Schaden und Unfallversicherung – Bruttoprämien und Policengebühren
USD 8,5 Mrd.Lebensversicherung – Bruttoprämien und Policengebühren
USD 2,0 Mrd.Betriebsgewinn
Anteil an den gesamten Bruttoprämien 1 der Gruppe in Prozent
10%
Anteil an den gesamten Bruttoprämien 1 der Gruppe in Prozent
46%
8 Zurich Insurance Group Geschäftsbericht 2021
Konzern-überblick
Integrated sustainability disclosure
Governance Risk review
Financial review

Zum Handeln anregen
«Returnships» bieten qualifizierten Frauen die Möglichkeit, nach einer beruflichen Auszeit ins Berufsleben zurückzukehren. Dies ist nur ein Beispiel dafür, wie Zurich unterschiedlichste Talente anzieht und für sich gewinnt. Im Rahmen eines ReturnshipProgramms konnte Gabriela Reynolds nach einer zweijährigen Auszeit von ihrer Tätigkeit als Anwältin eine Festanstellung bei Zurich finden und dabei von einem Onthejob Training sowie von vielfältigen Vernetzungsmöglichkeiten profitieren.
Gabriela arbeitet jetzt in der Abteilung Human Resources und hofft, dass ihre Geschichte andere dazu inspiriert, die Vorteile eines ReturnshipProgramms bei Zurich zu nutzen. «Es handelt sich um eine WinwinSituation für die Teilnehmenden und das Unternehmen», sagt Gabriela. «Für die Teilnehmenden geht es darum, das Beste aus der Erfahrung zu machen: das Unternehmen und die Menschen kennenlernen und die eigenen Kompetenzen ausbauen, um für zukünftige berufliche Chancen darauf aufbauen zu können. Für das Unternehmen ist es eine wunderbare Gelegenheit, Menschen mit Energie, Leidenschaft und einer frischen Perspektive willkommen zu heissen.»
Gabriela ReynoldsHR Program Manager, Zurich Insurance Group
Ein Comeback starten
9 Zurich Insurance Group Geschäftsbericht 2021
Konzern-überblick
Integrated sustainability disclosure
Governance Risk review
Financial review
Brief des Verwaltungsratspräsidenten
Zum Handeln anregen
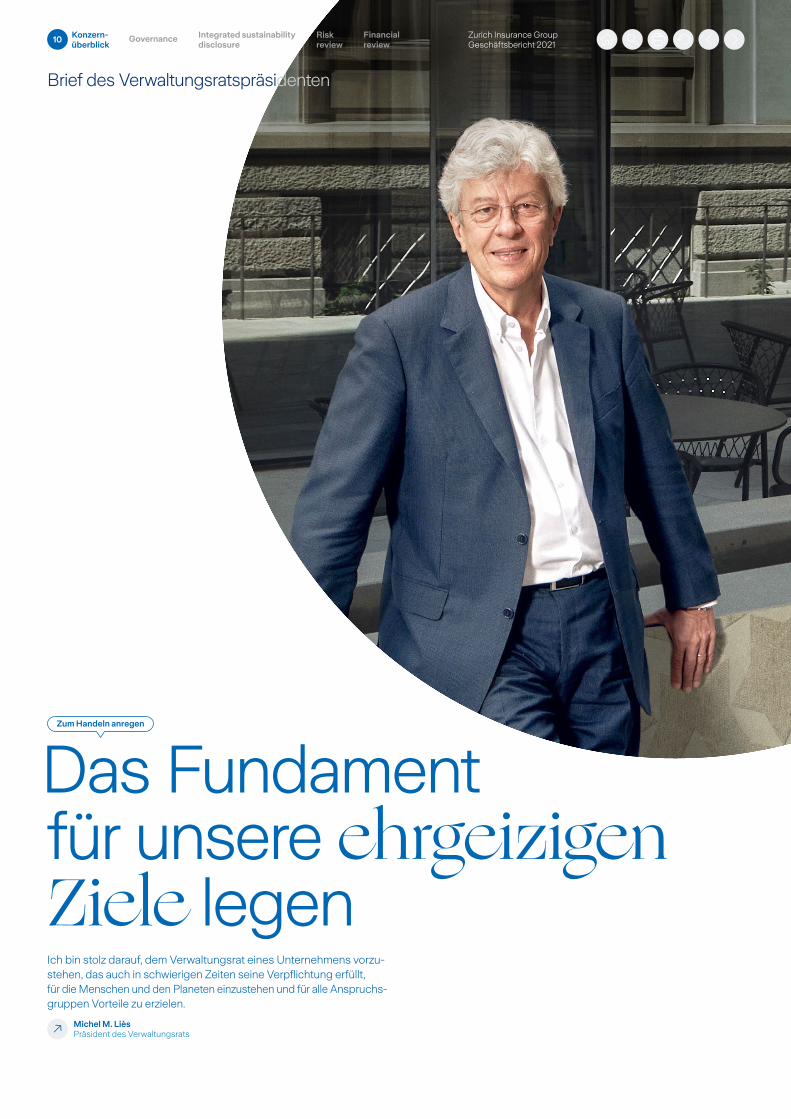
Das Fundament für unsere ehrgeizigen Ziele legenIch bin stolz darauf, dem Verwaltungsrat eines Unternehmens vorzustehen, das auch in schwierigen Zeiten seine Verpflichtung erfüllt, für die Menschen und den Planeten einzustehen und für alle Anspruchsgruppen Vorteile zu erzielen.
Michel M. LièsPräsident des Verwaltungsrats
10 Konzern-überblick
Integrated sustainability disclosure
Governance Risk review
Financial review
Zurich Insurance Group Geschäftsbericht 2021
Brief des Verwaltungsratspräsidenten (fortgesetzt)
Das Fundament für unsere ehrgeizigen Ziele legen
Es ist kaum zu glauben, dass es zwei Jahre her ist, seit COVID19 zur Pandemie erklärt wurde. Wir haben einen langen Kampf geführt, um das Virus einzudämmen, Leben zu retten, unsere mentale Gesundheit zu erhalten, Existenzen zu sichern, Bildung zu ermöglichen und unseren Alltag weiterhin so gut wie möglich zu bewältigen.
Ebenso wie der Rest der Welt mussten wir bei Zurich uns ständig an die sich verändernden Umstände anpassen. Dennoch hat unser Unternehmen seine Widerstandsfähigkeit bewahrt, und dafür danke ich all unseren 56’000 Mitarbeitenden. Sie haben eine anstrengende und turbulente Zeit hinter sich, und ich habe tiefes Mitgefühl mit denen, die durch die Pandemie persönliches Leid erfahren haben.
Ebenso wie 2020 war auch das letzte Jahr für unsere Kunden wieder eine Herausforderung. Unsere Mitarbeitenden haben Stärke, Flexibilität und Einfallsreichtum gezeigt, damit die Kunden weiterhin an erster Stelle stehen. Ihr Engagement hat mich wirklich inspiriert.
Robuste Ziele und Werte Es überrascht mich nicht, dass unsere Mitarbeitenden der Herausforderung gewachsen sind. Es gehört zur DNA unseres Unternehmens, ein Verständnis dafür zu haben, dass wir für unsere Kunden da sein müssen, wenn sie uns am dringendsten brauchen, selbst in diesen sehr besonderen Zeiten.
Unsere DNA wird unterstützt durch eine ehrgeizige Zielsetzung, robuste Werte und einen glaubwürdigen Verhaltenskodex. Ich bin stolz darauf, dem Verwaltungsrat eines Unternehmens vorzustehen, das auch in schwierigen Zeiten seine Verpflichtung erfüllt, für die Menschen und den Planeten einzustehen und für alle Anspruchsgruppen Vorteile zu erzielen – Kunden, Mitarbeitende, Investoren und Gemeinschaften.
Als Verwaltungsrat nehmen wir auch unsere Verantwortung für die Aufrechterhaltung und Einbettung unserer Strategie für Umwelt, Soziales und Governance (ESG) sehr ernst, die ständiger Veränderung unterliegt und uns die Möglichkeit gibt, auf kritische Risiken in diesen Bereichen zu reagieren – von Klimawandel und Verlust der Biodiversität bis zu sozialer Ungleichheit und der anhaltenden Pandemie (siehe Seiten 40–41).
Widerstandsfähigkeit bildet das Fundament für ehrgeizige ZieleZu Beginn des letzten Jahres unseres dreijährigen Strategiezyklus liegt die Gruppe weiterhin auf Kurs, um unsere Ziele für 2022 zu erreichen. Unsere Massnahmen zur Digitalisierung unseres Geschäfts haben Zurich leistungsfähiger, schneller und widerstandsfähiger als je zuvor gemacht. Das verleiht uns ein starkes Fundament, um ehrgeizige Ziele für einen neuen dreijährigen Strategiezyklus festzulegen, die wir im November präsentieren werden.
Im Jahr 2022 werden wir zudem unser 150jähriges Bestehen feiern. Ich hoffe, dass dies ein Jahr sein wird, in dem wir uns darauf konzentrieren können, die Welt zu einem besseren Ort für alle zu machen.
Michel M. LièsPräsident des Verwaltungsrats
Zurich Insurance Group Geschäftsbericht 2021
Integrated sustainability disclosure
Governance Risk review
Financial review
Konzern-überblick
11
Brief des Group CEO
Zum Handeln anregen
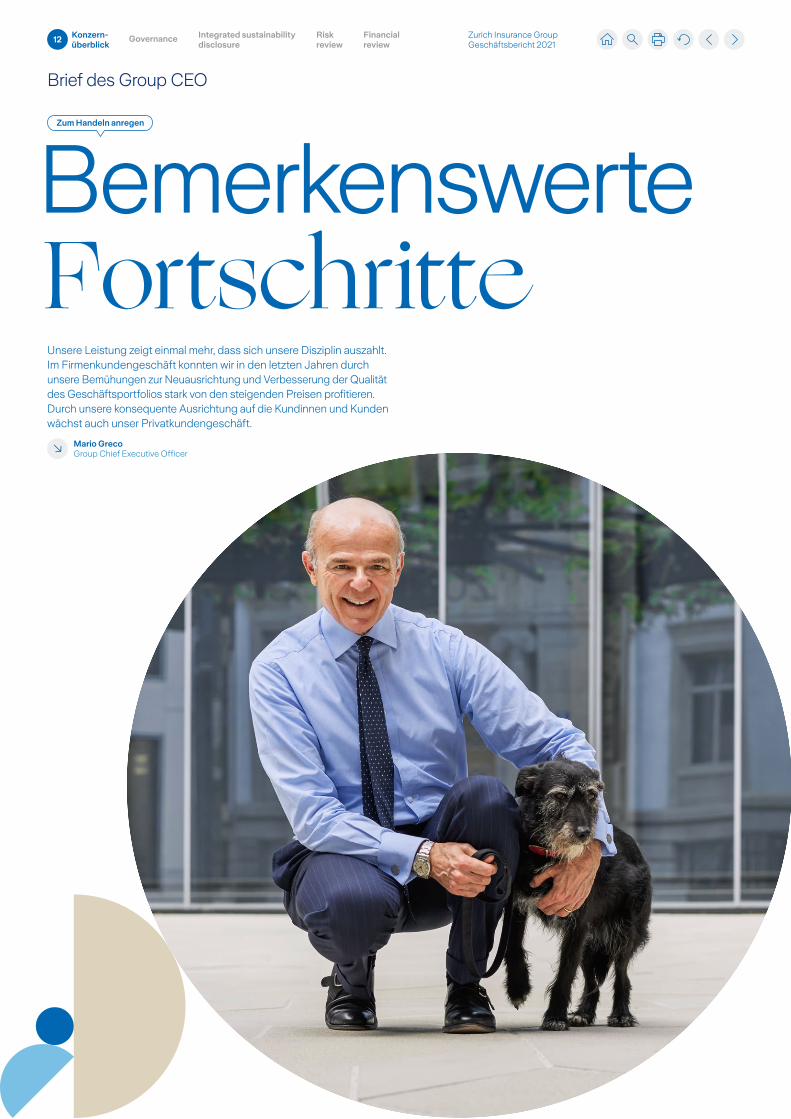
Unsere Leistung zeigt einmal mehr, dass sich unsere Disziplin auszahlt. Im Firmenkundengeschäft konnten wir in den letzten Jahren durch unsere Bemühungen zur Neuausrichtung und Verbesserung der Qualität des Geschäftsportfolios stark von den steigenden Preisen profitieren. Durch unsere konsequente Ausrichtung auf die Kundinnen und Kunden wächst auch unser Privatkundengeschäft.
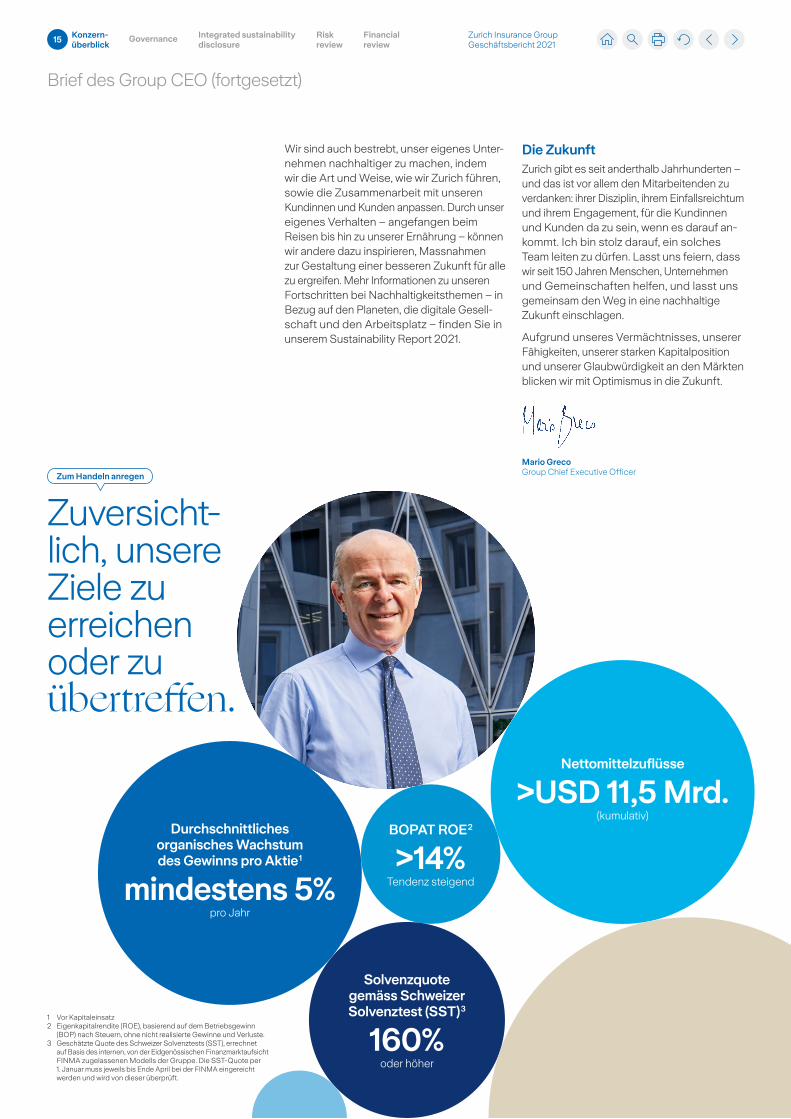
Mario GrecoGroup Chief Executive Officer
Bemerkenswerte Fortschritte
12 Zurich Insurance Group Geschäftsbericht 2021
Konzern-überblick
Integrated sustainability disclosure
Governance Risk review
Financial review
Brief des Group CEO (fortgesetzt)
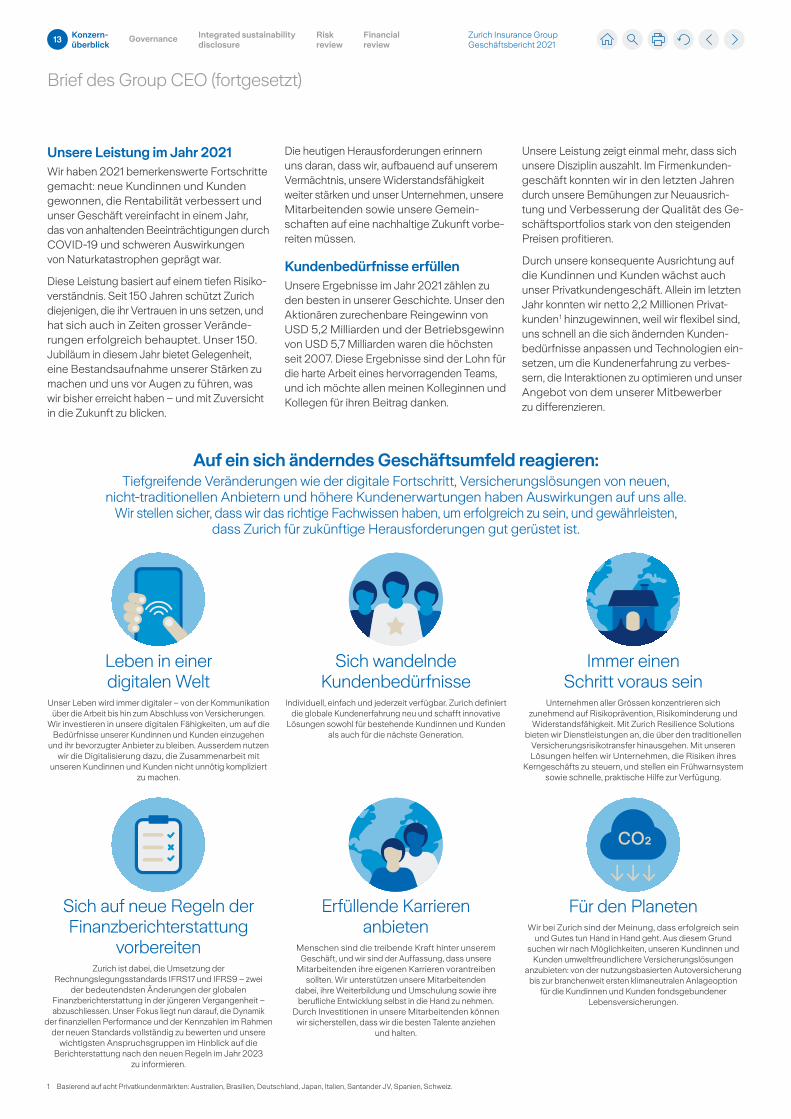
Erfüllende Karrieren anbieten
Menschen sind die treibende Kraft hinter unserem Geschäft, und wir sind der Auffassung, dass unsere
Mitarbeitenden ihre eigenen Karrieren vorantreiben sollten. Wir unterstützen unsere Mitarbeitenden
dabei, ihre Weiterbildung und Umschulung sowie ihre berufliche Entwicklung selbst in die Hand zu nehmen.
Durch Investitionen in unsere Mitarbeitenden können wir sicherstellen, dass wir die besten Talente anziehen
und halten.
Für den PlanetenWir bei Zurich sind der Meinung, dass erfolgreich sein
und Gutes tun Hand in Hand geht. Aus diesem Grund suchen wir nach Möglichkeiten, unseren Kundinnen und
Kunden umweltfreundlichere Versicherungslösungen anzubieten: von der nutzungsbasierten Autoversicherung
bis zur branchenweit ersten klimaneutralen Anlageoption für die Kundinnen und Kunden fondsgebundener
Lebensversicherungen.
Sich auf neue Regeln der Finanzberichterstattung
vorbereitenZurich ist dabei, die Umsetzung der
Rechnungslegungsstandards IFRS17 und IFRS9 – zwei der bedeutendsten Änderungen der globalen
Finanzberichterstattung in der jüngeren Vergangenheit – abzuschliessen. Unser Fokus liegt nun darauf, die Dynamik
der finanziellen Performance und der Kennzahlen im Rahmen der neuen Standards vollständig zu bewerten und unsere
wichtigsten Anspruchsgruppen im Hinblick auf die Berichterstattung nach den neuen Regeln im Jahr 2023
zu informieren.
Sich wandelnde Kundenbedürfnisse
Individuell, einfach und jederzeit verfügbar. Zurich definiert die globale Kundenerfahrung neu und schafft innovative
Lösungen sowohl für bestehende Kundinnen und Kunden als auch für die nächste Generation.
Immer einen Schritt voraus sein
Unternehmen aller Grössen konzentrieren sich zunehmend auf Risikoprävention, Risikominderung und Widerstandsfähigkeit. Mit Zurich Resilience Solutions
bieten wir Dienstleistungen an, die über den traditionellen Versicherungsrisikotransfer hinausgehen. Mit unseren Lösungen helfen wir Unternehmen, die Risiken ihres
Kerngeschäfts zu steuern, und stellen ein Frühwarnsystem sowie schnelle, praktische Hilfe zur Verfügung.
Leben in einer digitalen Welt
Unser Leben wird immer digitaler – von der Kommunikation über die Arbeit bis hin zum Abschluss von Versicherungen.
Wir investieren in unsere digitalen Fähigkeiten, um auf die Bedürfnisse unserer Kundinnen und Kunden einzugehen
und ihr bevorzugter Anbieter zu bleiben. Ausserdem nutzen wir die Digitalisierung dazu, die Zusammenarbeit mit
unseren Kundinnen und Kunden nicht unnötig kompliziert zu machen.
Auf ein sich änderndes Geschäftsumfeld reagieren:Tiefgreifende Veränderungen wie der digitale Fortschritt, Versicherungslösungen von neuen,
nichttraditionellen Anbietern und höhere Kundenerwartungen haben Auswirkungen auf uns alle. Wir stellen sicher, dass wir das richtige Fachwissen haben, um erfolgreich zu sein, und gewährleisten,
dass Zurich für zukünftige Herausforderungen gut gerüstet ist.
Unsere Leistung im Jahr 2021Wir haben 2021 bemerkenswerte Fortschritte gemacht: neue Kundinnen und Kunden gewonnen, die Rentabilität verbessert und unser Geschäft vereinfacht in einem Jahr, das von anhaltenden Beeinträchtigungen durch COVID19 und schweren Auswirkungen von Naturkatastrophen geprägt war.
Diese Leistung basiert auf einem tiefen Risikoverständnis. Seit 150 Jahren schützt Zurich diejenigen, die ihr Vertrauen in uns setzen, und hat sich auch in Zeiten grosser Veränderungen erfolgreich behauptet. Unser 150. Jubiläum in diesem Jahr bietet Gelegenheit, eine Bestandsaufnahme unserer Stärken zu machen und uns vor Augen zu führen, was wir bisher erreicht haben – und mit Zuversicht in die Zukunft zu blicken.
Die heutigen Herausforderungen erinnern uns daran, dass wir, aufbauend auf unserem Vermächtnis, unsere Widerstandsfähigkeit weiter stärken und unser Unternehmen, unsere Mitarbeitenden sowie unsere Gemein schaf ten auf eine nachhaltige Zukunft vorbereiten müssen.
Kundenbedürfnisse erfüllenUnsere Ergebnisse im Jahr 2021 zählen zu den besten in unserer Geschichte. Unser den Aktionären zurechenbare Reingewinn von USD 5,2 Milliarden und der Betriebsgewinn von USD 5,7 Milliarden waren die höchsten seit 2007. Diese Ergebnisse sind der Lohn für die harte Arbeit eines hervorragenden Teams, und ich möchte allen meinen Kolleginnen und Kollegen für ihren Beitrag danken.
Unsere Leistung zeigt einmal mehr, dass sich unsere Disziplin auszahlt. Im Firmenkundengeschäft konnten wir in den letzten Jahren durch unsere Bemühungen zur Neuausrichtung und Verbesserung der Qualität des Geschäftsportfolios stark von den steigenden Preisen profitieren.
Durch unsere konsequente Ausrichtung auf die Kundinnen und Kunden wächst auch unser Privatkundengeschäft. Allein im letzten Jahr konnten wir netto 2,2 Millionen Privatkunden 1 hinzugewinnen, weil wir flexibel sind, uns schnell an die sich ändernden Kundenbedürfnisse anpassen und Technologien einsetzen, um die Kundenerfahrung zu verbessern, die Interaktionen zu optimieren und unser Angebot von dem unserer Mitbewerber zu differenzieren.
Bemerkenswerte Fortschritte
1 Basierend auf acht Privatkundenmärkten: Australien, Brasilien, Deutschland, Japan, Italien, Santander JV, Spanien, Schweiz.
13 Zurich Insurance Group Geschäftsbericht 2021
Konzern-überblick
Integrated sustainability disclosure
Governance Risk review
Financial review
Brief des Group CEO (fortgesetzt)
Unser 150-jähriges JubiläumWir von Zurich wollen Vertrauen in die Zukunft wecken. Seit 1872 helfen wir jeden Tag Unternehmen, Familien und Gemeinschaften dabei, erfolgreich zu sein und zu wachsen.
Im Rahmen unseres 150jährigen Jubiläums feiern wir unsere Vergangenheit und unsere Gegenwart, unsere Kundinnen und Kunden, unsere Gemeinschaften und unsere Mitarbeitenden – all jene, die uns so weit gebracht haben.
Zu den Feierlichkeiten gehören globale Town Halls, spezielle Veranstaltungen und die Veröffentlichung eines Jubiläumsbuchs im EBookFormat. Der Höhepunkt wird die offizielle Jubiläumsfeier im Oktober sein (siehe Seite 32).
Seit mehr als 150 Jahren setzt Zurich positive Akzente. Wir haben bewiesen, dass wir auf Herausforderungen richtig reagieren und uns anpassen können, und wir blicken zuversichtlich auf die Zukunft.
Nur wenige Monate nach Bekanntgabe unserer Ziele für 2020–2022 stellte die Pandemie unsere Pläne auf den Kopf, worauf wir schnell reagierten und einen neuen Kurs einschlugen. Zwei Jahre später sind wir auf dem besten Weg, unsere Ziele zu erreichen, und wir sind bereit, uns neue Ziele für den nächsten Strategiezyklus im November zu setzen.
Risiken in Chancen verwandelnDas Versicherungsgeschäft hat sich seit der Gründung von Zurich im Jahr 1872 – des Zeitalters von Dampfmaschinen, Pferden und Telegrafen – drastisch verändert. Die heutigen Risiken sind komplexer, miteinander verknüpft und global. Wir unterstützen unsere Kundinnen und Kunden, unsere Geschäftspartner und unsere Gemeinschaften aktiv dabei, ihre Widerstandsfähigkeit gegenüber unerwünschten Ereignissen zu stärken, bevor diese eintreten, und ergänzen damit den traditionellen Risikotransfer, der die Kosten deckt, wenn etwas schiefgeht.
Durch unsere enge Beziehung zu unseren Kundinnen und Kunden und unsere 150jährige Erfahrung können wir ihnen spezifische Erkenntnisse und Instrumente an die Hand geben, um sie bei der Steuerung traditioneller und neuer Risiken zu unterstützen, sei es im Zusammenhang mit dem Klimawandel, den Lieferketten oder der Cybersicherheit. Das gehört zur Rolle einer Versicherung in der Gesellschaft: Wir helfen, Risiken zu verringern und nachhaltiges Verhalten zu fördern.
Wir reagieren auch auf die Komplexität und den rasanten Wandel unserer Zeit, indem wir unseren Mitarbeitenden helfen, sich in diesem Umfeld zurechtzufinden. Nachhaltige Arbeitsgestaltung ist für uns zentral, daher unterstützen wir unsere Kolleginnen und Kollegen unter anderem dabei, ihre Fähigkeiten ständig weiterzuentwickeln, und der beste Beweis für unseren Erfolg ist, dass zwei Drittel der offenen Stellen bei Zurich mit internen Kandidatinnen und Kandidaten besetzt werden.
Zum Handeln anregenUm die Risiken des Klimawandels, der Digital isierung und der sozialen Ungleichheit zu bewältigen, ist gemeinsames Handeln gefragt – von Regierungen, Unternehmen und Einzelpersonen. Wir wollen unsere Kundinnen und Kunden, unsere Mitarbeitenden, unsere Partner und die Gemeinschaften, in denen wir tätig sind, dabei unterstützen, das zu tun, was für sie am wichtigsten ist.
Unser Projekt «Zurich Forest» trägt zum Beispiel dazu bei, das Umweltbewusstsein unserer Mitarbeitenden zu stärken. In Zusammenarbeit mit dem gemeinnützigen Instituto Terra unterstützen wir die artenreiche Aufforstung des atlantischen Regenwalds in Brasilien. Seit September 2020 sind mehr als 200’000 Setzlinge gepflanzt worden. Die Mitarbeitenden können sich einen Baum aussuchen und danach den Prozess der Wiederaufforstung Schritt für Schritt verfolgen.
Im Jahr 2021 zeigten die Geschäftseinheiten, die Mitarbeitenden, die Kundinnen und Kunden sowie die Vertriebspartner von Zurich im Rahmen der grössten Spendenaktion der Z Zurich Foundation 1 seit ihrer Gründung im Jahr 1973, was man mit vereinten Kräften erreichen kann. Die im Zuge der Spendenaktion gesammelten Mittel ermöglichen der UNICEF, mehr als 1,7 Millionen besonders gefährdeten Personen jeweils zwei Dosen COVID19Impfstoff zu verabreichen.
1 Die Z Zurich Foundation ist eine gemeinnützige Stiftung mit Sitz in der Schweiz, die von verschiedenen Mitgliedern der Gruppe finanziert wird. Sie ist das wichtigste Vehikel zur Umsetzung der globalen Investitionsstrategie von Zurich zugunsten von Gemeinschaften.
14 Zurich Insurance Group Geschäftsbericht 2021
Konzern-überblick
Integrated sustainability disclosure
Governance Risk review
Financial review
Brief des Group CEO (fortgesetzt)
Nettomittelzuflüsse
>USD 11,5 Mrd.(kumulativ)
1 Vor Kapitaleinsatz2 Eigenkapitalrendite (ROE), basierend auf dem Betriebsgewinn
(BOP) nach Steuern, ohne nicht realisierte Gewinne und Verluste.3 Geschätzte Quote des Schweizer Solvenztests (SST), errechnet
auf Basis des internen, von der Eidgenössischen Finanzmarktaufsicht FINMA zugelassenen Modells der Gruppe. Die SSTQuote per 1. Januar muss jeweils bis Ende April bei der FINMA eingereicht werden und wird von dieser überprüft.
BOPAT ROE 2
>14%Tendenz steigend
Durchschnittliches organisches Wachstum des Gewinns pro Aktie 1
mindestens 5%pro Jahr
Solvenzquote gemäss Schweizer Solvenztest (SST) 3
160%oder höher
Zuversichtlich, unsere Ziele zu erreichen oder zu
bertreffen.
Wir sind auch bestrebt, unser eigenes Unternehmen nachhaltiger zu machen, indem wir die Art und Weise, wie wir Zurich führen, sowie die Zusammenarbeit mit unseren Kundinnen und Kunden anpassen. Durch unser eigenes Verhalten – angefangen beim Reisen bis hin zu unserer Ernährung – können wir andere dazu inspirieren, Massnahmen zur Gestaltung einer besseren Zukunft für alle zu ergreifen. Mehr Informationen zu unseren Fortschritten bei Nachhaltigkeitsthemen – in Bezug auf den Planeten, die digitale Gesellschaft und den Arbeitsplatz – finden Sie in unserem Sustainability Report 2021.
Die ZukunftZurich gibt es seit anderthalb Jahrhunderten – und das ist vor allem den Mitarbeitenden zu verdanken: ihrer Disziplin, ihrem Einfallsreichtum und ihrem Engagement, für die Kundinnen und Kunden da zu sein, wenn es darauf ankommt. Ich bin stolz darauf, ein solches Team leiten zu dürfen. Lasst uns feiern, dass wir seit 150 Jahren Menschen, Unternehmen und Gemeinschaften helfen, und lasst uns gemeinsam den Weg in eine nachhaltige Zukunft einschlagen.
Aufgrund unseres Vermächtnisses, unserer Fähigkeiten, unserer starken Kapitalposition und unserer Glaubwürdigkeit an den Märkten blicken wir mit Optimismus in die Zukunft.
Mario GrecoGroup Chief Executive OfficerZum Handeln anregen
15 Zurich Insurance Group Geschäftsbericht 2021
Konzern-überblick
Integrated sustainability disclosure
Governance Risk review
Financial review
Unser Geschäftsmodell
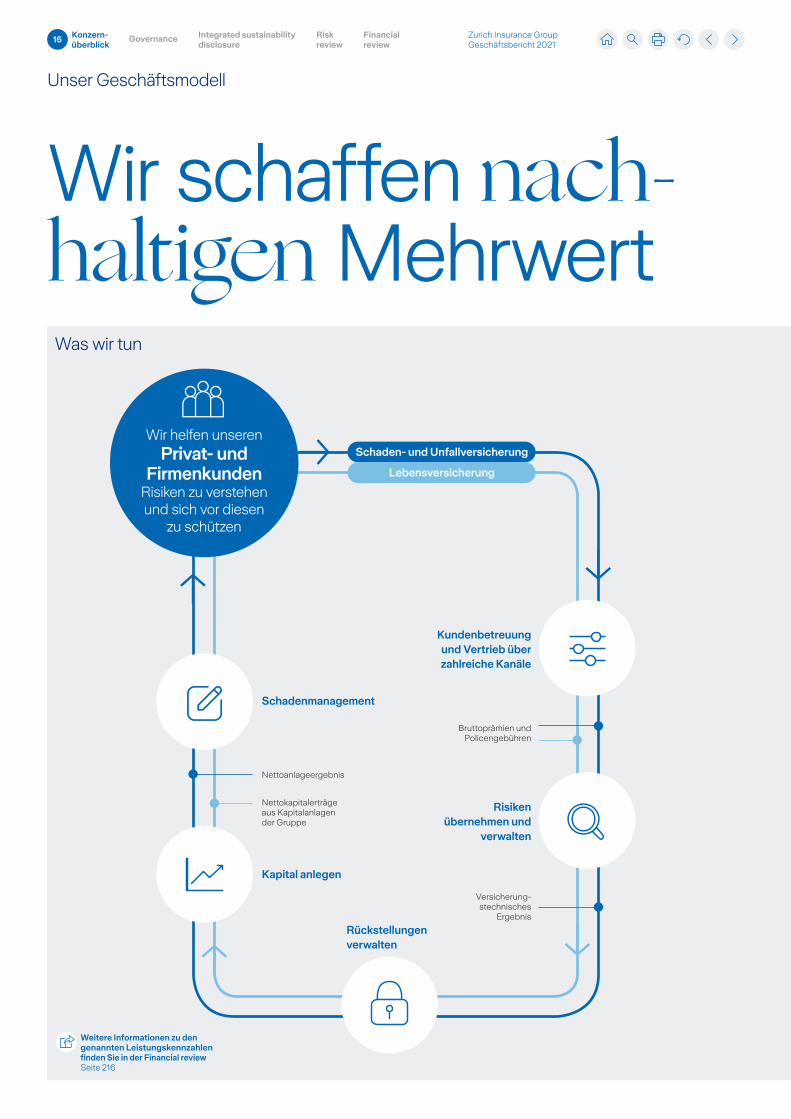
Schaden- und Unfallversicherung
Lebensversicherung
Wir schaffen nachhaltigen MehrwertWas wir tun
Kundenbetreuung und Vertrieb über zahlreiche Kanäle
Risiken übernehmen und
verwalten
Rückstellungen verwalten
Kapital anlegen
Schadenmanagement
Bruttoprämien und Policengebühren
Nettoanlageergebnis
Nettokapitalerträge aus Kapitalanlagen der Gruppe
Versicherungstechnisches
Ergebnis
Wir helfen unseren Privat- und
Firmenkunden Risiken zu verstehen und sich vor diesen
zu schützen
Weitere Informationen zu den genannten Leistungskennzahlen finden Sie in der Financial reviewSeite 216
16 Zurich Insurance Group Geschäftsbericht 2021
Konzern-überblick
Integrated sustainability disclosure
Governance Risk review
Financial review
Unser Geschäftsmodell (fortgesetzt)
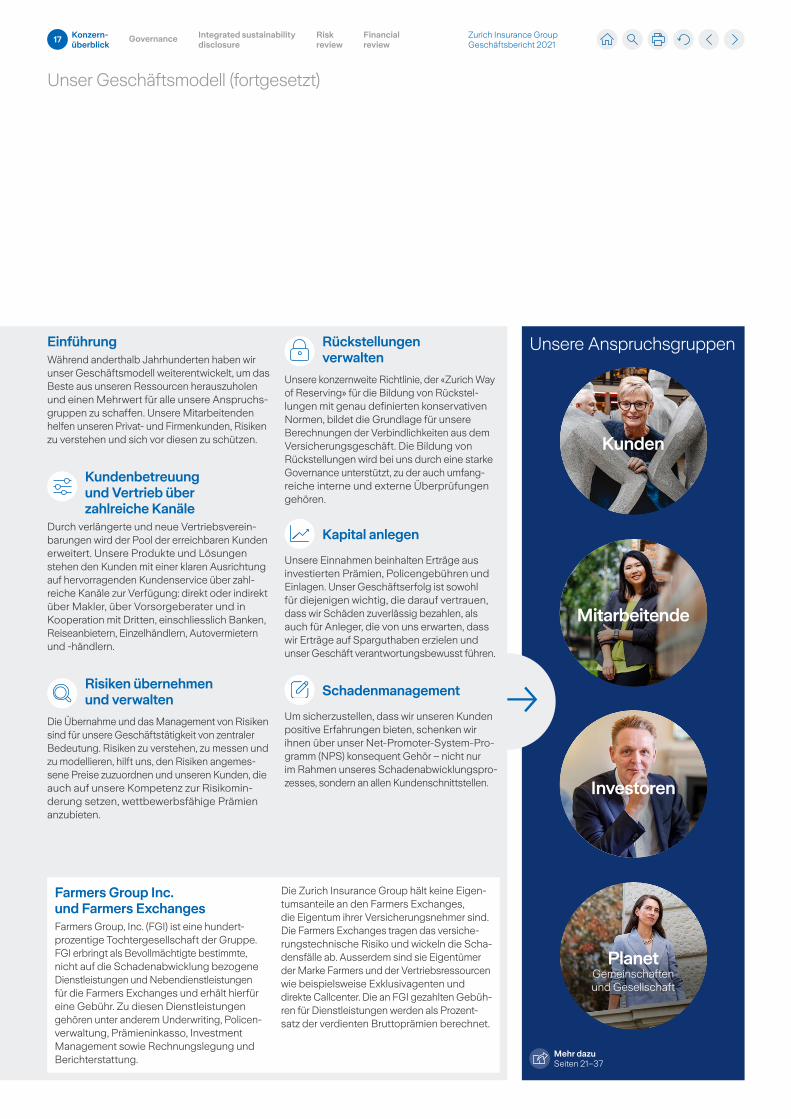
Rückstellungen verwalten
Unsere konzernweite Richtlinie, der «Zurich Way of Reserving» für die Bildung von Rückstellungen mit genau definierten konservativen Normen, bildet die Grundlage für unsere Berechnungen der Verbindlichkeiten aus dem Versicherungsgeschäft. Die Bildung von Rückstellungen wird bei uns durch eine starke Governance unterstützt, zu der auch umfangreiche interne und externe Überprüfungen gehören.
Kapital anlegen
Unsere Einnahmen beinhalten Erträge aus investierten Prämien, Policengebühren und Einlagen. Unser Geschäftserfolg ist sowohl für diejenigen wichtig, die darauf vertrauen, dass wir Schäden zuverlässig bezahlen, als auch für Anleger, die von uns erwarten, dass wir Erträge auf Sparguthaben erzielen und unser Geschäft verantwortungsbewusst führen.
Schadenmanagement
Um sicherzustellen, dass wir unseren Kunden positive Erfahrungen bieten, schenken wir ihnen über unser NetPromoterSystemProgramm (NPS) konsequent Gehör – nicht nur im Rahmen unseres Schadenabwicklungsprozesses, sondern an allen Kundenschnittstellen.
EinführungWährend anderthalb Jahrhunderten haben wir unser Geschäftsmodell weiterentwickelt, um das Beste aus unseren Ressourcen herauszuholen und einen Mehrwert für alle unsere Anspruchsgruppen zu schaffen. Unsere Mitarbeitenden helfen unseren Privat und Firmenkunden, Risiken zu verstehen und sich vor diesen zu schützen.
Kundenbetreuung und Vertrieb über zahlreiche Kanäle
Durch verlängerte und neue Vertriebsvereinbarungen wird der Pool der erreichbaren Kunden erweitert. Unsere Produkte und Lösungen stehen den Kunden mit einer klaren Ausrichtung auf hervorragenden Kundenservice über zahlreiche Kanäle zur Verfügung: direkt oder indirekt über Makler, über Vorsorgeberater und in Kooperation mit Dritten, einschliesslich Banken, Reiseanbietern, Einzelhändlern, Autovermietern und händlern.
Risiken übernehmen und verwalten
Die Übernahme und das Management von Risiken sind für unsere Geschäftstätigkeit von zentraler Bedeutung. Risiken zu verstehen, zu messen und zu modellieren, hilft uns, den Risiken angemessene Preise zuzuordnen und unseren Kunden, die auch auf unsere Kompetenz zur Risiko minderung setzen, wettbewerbsfähige Prämien anzubieten.
Farmers Group Inc. und Farmers ExchangesFarmers Group, Inc. (FGI) ist eine hundertprozentige Tochtergesellschaft der Gruppe. FGI erbringt als Bevollmächtigte bestimmte, nicht auf die Schadenabwicklung bezogene Dienstleistungen und Nebendienstleistungen für die Farmers Exchanges und erhält hierfür eine Gebühr. Zu diesen Dienstleistungen gehören unter anderem Underwriting, Policenverwaltung, Prämieninkasso, Investment Management sowie Rechnungslegung und Berichterstattung.
Die Zurich Insurance Group hält keine Eigentumsanteile an den Farmers Exchanges, die Eigentum ihrer Versicherungsnehmer sind. Die Farmers Exchanges tragen das versicherungstechnische Risiko und wickeln die Schadensfälle ab. Ausserdem sind sie Eigentümer der Marke Farmers und der Vertriebsressourcen wie beispielsweise Exklusivagenten und direkte Callcenter. Die an FGI gezahlten Gebühren für Dienstleistungen werden als Prozentsatz der verdienten Bruttoprämien berechnet.
Unsere Anspruchsgruppen
Mehr dazuSeiten 21–37
Kunden
Mitarbeitende
Investoren
PlanetGemeinschaften und Gesellschaft
17 Zurich Insurance Group Geschäftsbericht 2021
Konzern-überblick
Integrated sustainability disclosure
Governance Risk review
Financial review
Unsere Strategie
KundenUnser Wandel zu einem wirklich
kundenorientierten Unternehmen trägt Früchte. Wir werden
weiterhin Lösungen bereitstellen, die den sich wandelnden Bedürfnissen der Kunden
entsprechen.
Unser bisheriger Fortschritt – Wir konnten mit netto 2,2 Millionen neuen Privatkunden 1 die Zahl unserer Kunden weiter steigern und haben in unseren wichtigsten Märkten für KMU in den Kundenservice investiert.
– Wir haben die Kundenzufriedenheit weiter verbessert, indem wir neue Technologien eingesetzt, unsere Dienstleistungen angepasst und unseren Kunden zugehört haben. Wir haben im Rahmen unseres NetPromoterSystemProgramms (NPS) im Jahr 2021 rund eine Million Kunden befragt.
– Lancierung einer Markenkampagne für den Aufbau einer emotionalen Beziehung zu den Privatkunden (siehe Seite 26).
Die nächsten Schritte – Weiter wachsen und uns, sobald die Auswirkungen der COVID19Pandemie nachlassen, für weiteren Kundenzuwachs in Stellung bringen.
– Globale Einführung unserer neuen CustomerExperienceStrategie und CustomerExperienceStandards.
– Umsetzung unseres neuen Kundensegmentierungsansatzes und Digitalisierung des AgentenKanals.
– Den Einsatz von Datenanalysen deutlich erhöhen, um Kunden besser zu bedienen und die Kundenbindung zu stärken.
Wir setzen unsere Strategie um, indem wir unseren Zielen und Werten treu bleiben und unsere Stärken ausspielen, um so den Grundstein unseres Erfolgs zu legen. Wir verfügen über ein ausgewogenes Geschäft mit einer soliden Finanzlage und einer verlässlichen Marke, das von talentierten Mitarbeitenden angetrieben wird.
Im Mittelpunkt unserer strategischen Prioritäten stehen:
1 Kunden
2 Vereinfachung
3 Innovation
Wir setzen auf unsere St rken
1 Basierend auf acht Privatkundenmärkten: Australien, Brasilien, Deutschland, Japan, Italien, Santander JV, Spanien, Schweiz.
18 Zurich Insurance Group Geschäftsbericht 2021
Konzern-überblick
Integrated sustainability disclosure
Governance Risk review
Financial review
Unsere Strategie (fortgesetzt)
VereinfachungWir vereinfachen erfolgreich unser Geschäft und unsere
Betriebsabläufe und reduzieren unnötige Komplexität, um unsere
Ressourcen besser nutzen zu können.
Unser bisheriger Fortschritt – «Zurich, Simplified» ist ein globales Projekt mit dem Ziel weiterer Vereinfachung bei Zurich. Mitarbeitende werden aufgefordert, Vorschläge zur Vereinfachung der Organisation zu machen, und mit Unterstützung des Managements werden umgesetzte Initia tiven gesammelt und gewürdigt. Für den Wettbewerb wurden 253 Lösungen von 1’000 Mitarbeitenden aus Geschäftsbereichen wie HR, Underwriting, Compliance und Lebensversicherung eingereicht. Die Kolleginnen und Kollegen werden aufgefordert, ihre Lieblingslö sung zu wählen, und jede Stimme entspricht einer Spende von USD 1 für wohltätige Zwecke.
– Wir haben uns darauf konzentriert, die Digitalisierung im Bereich Underwriting voranzutreiben. Am deutlichsten zeigt sich der Einfluss der Digitalisierung auf das Underwriting in der Versicherungsindustrie in der Entwicklung von automatisierten Risikobeurteilungssystemen.
– Wir haben in digitale Plattformen, ITLösungen und vereinfachte Produkte in unseren drei wichtigsten Märkten für KMU investiert: Grossbritannien, Schweiz und Deutschland.
Die nächsten Schritte – Weitere Vereinfachung der Interaktion mit unseren Kunden (z. B. Verbesserung des digitalen Zugangs, Selbstbedienungsfunktionen usw.).
– Effizienz in unserem Betriebsmodell durch Automatisierung und Robotik weiter steigern.
– Weitere Vereinfachung der Produkte im RetailBereich sowohl für KMU als auch für Privatkunden.
– Komplexität der internen Prozesse und Verfahren weiter verringern.
InnovationWir passen uns an, um die
Erwartungen und Bedürfnisse der Kunden weiterhin zu erfüllen und
zu übertreffen.
Unser bisheriger Fortschritt – Die Bewerbungen für die Zurich Innovation Championship haben sich 2022 verdoppelt (2’672 gegenüber 1’350 bei der letzten Auflage), da Startups an einer Zusammenarbeit mit uns interessiert sind.
– Wir haben unsere digitalen Fähigkeiten durch Akquisitionen und die Einstellung neuer Talente für die Zukunft gestärkt (siehe Seite 30).
– Durch unsere Investitionen in die Cybersicherheit im Rahmen unserer Zusammenarbeit mit dem InsurtechUnternehmen BOXX konnten wir auf dem schnell wachsenden Cybermarkt Fuss fassen.
Die nächsten Schritte – Weiterbildungsangebote im Bereich Digitalisierung für alle Mitarbeitenden von Zurich im Rahmen der Digital Transformation Academy. Die Academy wurde geschaffen, um allen Mitarbeitenden von Zurich die Möglichkeit zu geben, eine grundlegende digitale Kompetenz zu erwerben.
– Vertiefung unserer internen Kompetenzen in bestimmten technischen Bereichen über eine interne Plattform, die eingeführt wurde, um die Mitarbeitenden von Technology & Operations zu unterstützen, sich in allen Aspekten ihrer technischen Fähigkeiten zu verbessern.
– Fortsetzung der Zusammenarbeit mit unserem Netzwerk von Startups und Hochschulen, um unsere Fähigkeiten schneller zu erweitern.
19 Zurich Insurance Group Geschäftsbericht 2021
Konzern-überblick
Integrated sustainability disclosure
Governance Risk review
Financial review
Unsere Strategie (fortgesetzt)
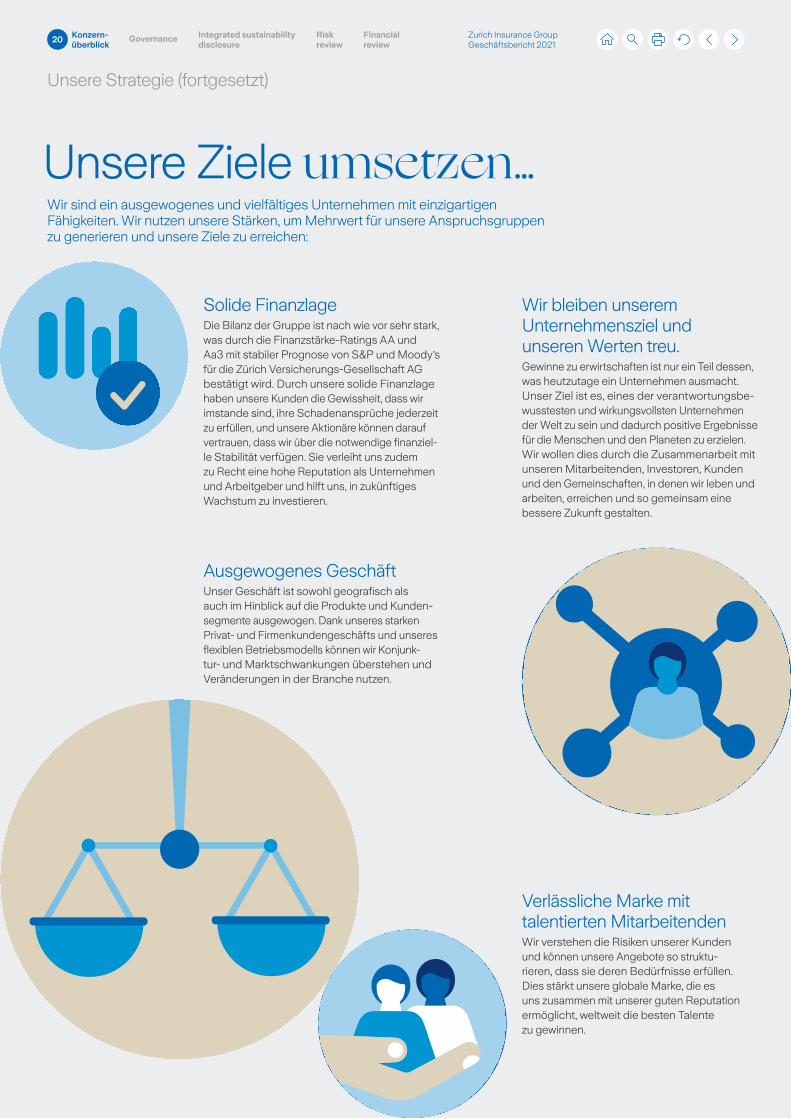
Unsere Ziele umsetzen…Wir sind ein ausgewogenes und vielfältiges Unternehmen mit einzigartigen Fähigkeiten. Wir nutzen unsere Stärken, um Mehrwert für unsere Anspruchsgruppen zu generieren und unsere Ziele zu erreichen:
Solide FinanzlageDie Bilanz der Gruppe ist nach wie vor sehr stark, was durch die FinanzstärkeRatings AA und Aa3 mit stabiler Prognose von S&P und Moody’s für die Zürich VersicherungsGesellschaft AG bestätigt wird. Durch unsere solide Finanzlage haben unsere Kunden die Gewissheit, dass wir imstande sind, ihre Schadenansprüche jederzeit zu erfüllen, und unsere Aktionäre können darauf vertrauen, dass wir über die notwendige finanzielle Stabilität verfügen. Sie verleiht uns zudem zu Recht eine hohe Reputation als Unternehmen und Arbeitgeber und hilft uns, in zukünftiges Wachstum zu investieren.
Ausgewogenes GeschäftUnser Geschäft ist sowohl geografisch als auch im Hinblick auf die Produkte und Kundensegmente ausgewogen. Dank unseres starken Privat und Firmenkundengeschäfts und unseres flexiblen Betriebsmodells können wir Konjunktur und Marktschwankungen überstehen und Veränderungen in der Branche nutzen.
Wir bleiben unserem Unternehmensziel und unseren Werten treu.Gewinne zu erwirtschaften ist nur ein Teil dessen, was heutzutage ein Unternehmen ausmacht. Unser Ziel ist es, eines der verantwortungsbewusstesten und wirkungsvollsten Unternehmen der Welt zu sein und dadurch positive Ergebnisse für die Menschen und den Planeten zu erzielen. Wir wollen dies durch die Zusammenarbeit mit unseren Mitarbeitenden, Investoren, Kunden und den Gemeinschaften, in denen wir leben und arbeiten, erreichen und so gemeinsam eine bessere Zukunft gestalten.
Verlässliche Marke mit talentierten MitarbeitendenWir verstehen die Risiken unserer Kunden und können unsere Angebote so strukturieren, dass sie deren Bedürfnisse erfüllen. Dies stärkt unsere globale Marke, die es uns zusammen mit unserer guten Reputation ermöglicht, weltweit die besten Talente zu gewinnen.
20 Zurich Insurance Group Geschäftsbericht 2021
Konzern-überblick
Integrated sustainability disclosure
Governance Risk review
Financial review
Unsere Anspruchsgruppen
Zurich setzt sich dafür ein, für all ihre Anspruchsgruppen nachhaltigen Mehrwert zu schaffen. Lernen Sie auf den folgenden Seiten unsere Anspruchsgruppen kennen und erfahren Sie, wie sie andere dazu anregen, gemeinsam Massnahmen zu ergreifen – zum Wohle unserer Kunden, Mitarbeitenden, Investoren und unseres Planeten.
21 Zurich Insurance Group Geschäftsbericht 2021
Konzern-überblick
Integrated sustainability disclosure
Governance Risk review
Financial review
Unsere Anspruchsgruppen (fortgesetzt)
PlanetZum Handeln anregen
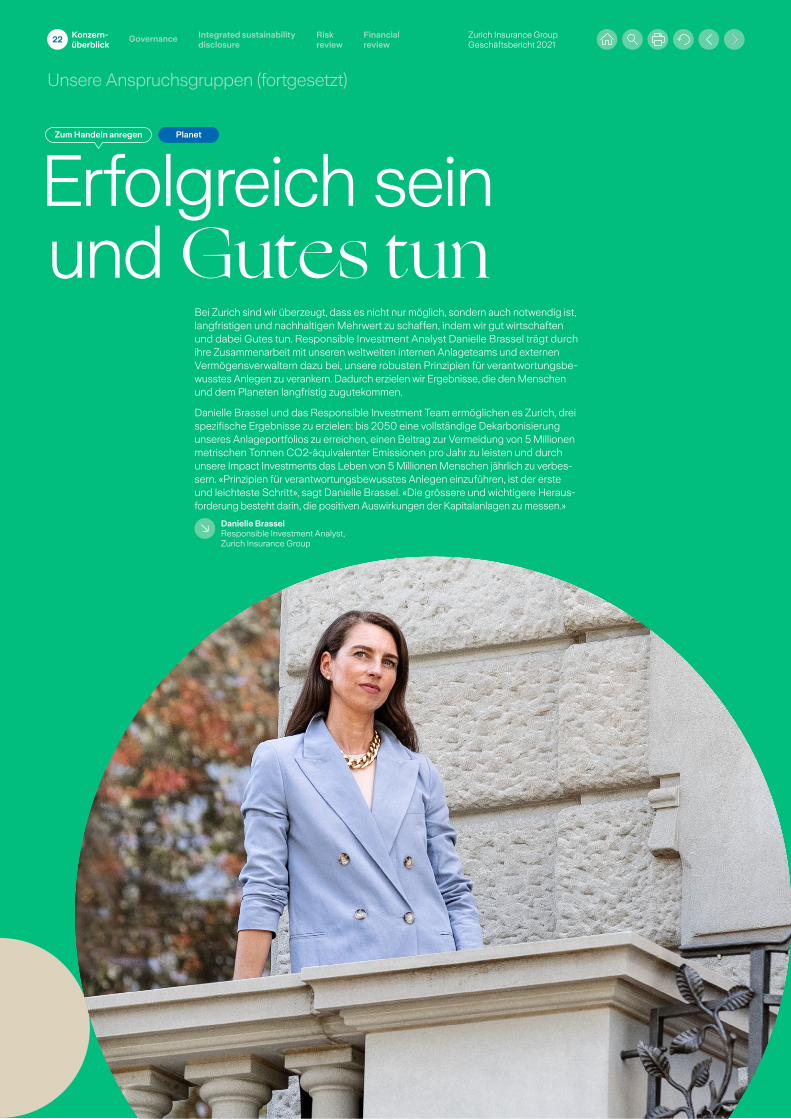
Erfolgreich sein und Gutes tun
Bei Zurich sind wir überzeugt, dass es nicht nur möglich, sondern auch notwendig ist, langfristigen und nachhaltigen Mehrwert zu schaffen, indem wir gut wirtschaften und dabei Gutes tun. Responsible Investment Analyst Danielle Brassel trägt durch ihre Zusammenarbeit mit unseren weltweiten internen Anlageteams und externen Vermögensverwaltern dazu bei, unsere robusten Prinzipien für verantwortungsbewusstes Anlegen zu verankern. Dadurch erzielen wir Ergebnisse, die den Menschen und dem Planeten langfristig zugutekommen.
Danielle Brassel und das Responsible Investment Team ermöglichen es Zurich, drei spezifische Ergebnisse zu erzielen: bis 2050 eine vollständige Dekarbonisierung unseres Anlageportfolios zu erreichen, einen Beitrag zur Vermeidung von 5 Millionen metrischen Tonnen CO2äquivalenter Emissionen pro Jahr zu leisten und durch unsere Impact Investments das Leben von 5 Millionen Menschen jährlich zu verbessern. «Prinzipien für verantwortungsbewusstes Anlegen einzuführen, ist der erste und leichteste Schritt», sagt Danielle Brassel. «Die grössere und wichtigere Herausforderung besteht darin, die positiven Auswirkungen der Kapitalanlagen zu messen.»
Danielle BrasselResponsible Investment Analyst, Zurich Insurance Group
22 Zurich Insurance Group Geschäftsbericht 2021
Konzern-überblick
Integrated sustainability disclosure
Governance Risk review
Financial review
Unsere Anspruchsgruppen (fortgesetzt)
PlanetZum Handeln anregen
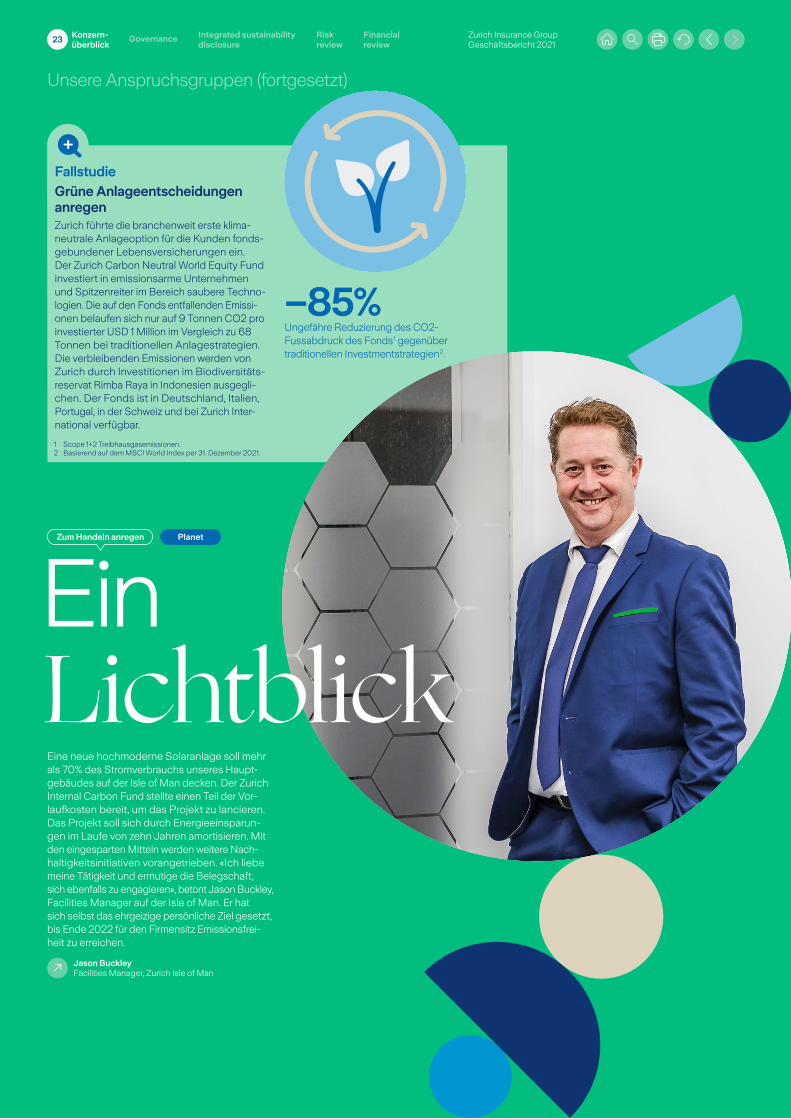
Ein LichtblickEine neue hochmoderne Solaranlage soll mehr als 70% des Stromverbrauchs unseres Hauptgebäudes auf der Isle of Man decken. Der Zurich Internal Carbon Fund stellte einen Teil der Vorlaufkosten bereit, um das Projekt zu lancieren. Das Projekt soll sich durch Energieeinsparungen im Laufe von zehn Jahren amortisieren. Mit den eingesparten Mitteln werden weitere Nachhaltigkeitsinitiativen vorangetrieben. «Ich liebe meine Tätigkeit und ermutige die Belegschaft, sich ebenfalls zu engagieren», betont Jason Buckley, Facilities Manager auf der Isle of Man. Er hat sich selbst das ehrgeizige persönliche Ziel gesetzt, bis Ende 2022 für den Firmensitz Emissionsfreiheit zu erreichen.
Jason BuckleyFacilities Manager, Zurich Isle of Man
FallstudieGrüne Anlageentscheidungen anregen Zurich führte die branchenweit erste klimaneutrale Anlageoption für die Kunden fondsgebundener Lebensversicherungen ein. Der Zurich Carbon Neutral World Equity Fund investiert in emissionsarme Unternehmen und Spitzenreiter im Bereich saubere Technologien. Die auf den Fonds entfallenden Emissionen belaufen sich nur auf 9 Tonnen CO2 pro investierter USD 1 Million im Vergleich zu 68 Tonnen bei traditionellen Anlagestrategien. Die verbleibenden Emissionen werden von Zurich durch Investitionen im Biodiversitätsreservat Rimba Raya in Indonesien ausge glichen. Der Fonds ist in Deutschland, Italien, Portugal, in der Schweiz und bei Zurich International verfügbar.
–85%Ungefähre Reduzierung des CO2Fussabdruck des Fonds 1 gegenüber traditionellen Investmentstrategien 2.
1 Scope 1+2 Treibhausgasemissionen.2 Basierend auf dem MSCI World Index per 31. Dezember 2021.
23 Zurich Insurance Group Geschäftsbericht 2021
Konzern-überblick
Integrated sustainability disclosure
Governance Risk review
Financial review
Unsere Anspruchsgruppen (fortgesetzt)
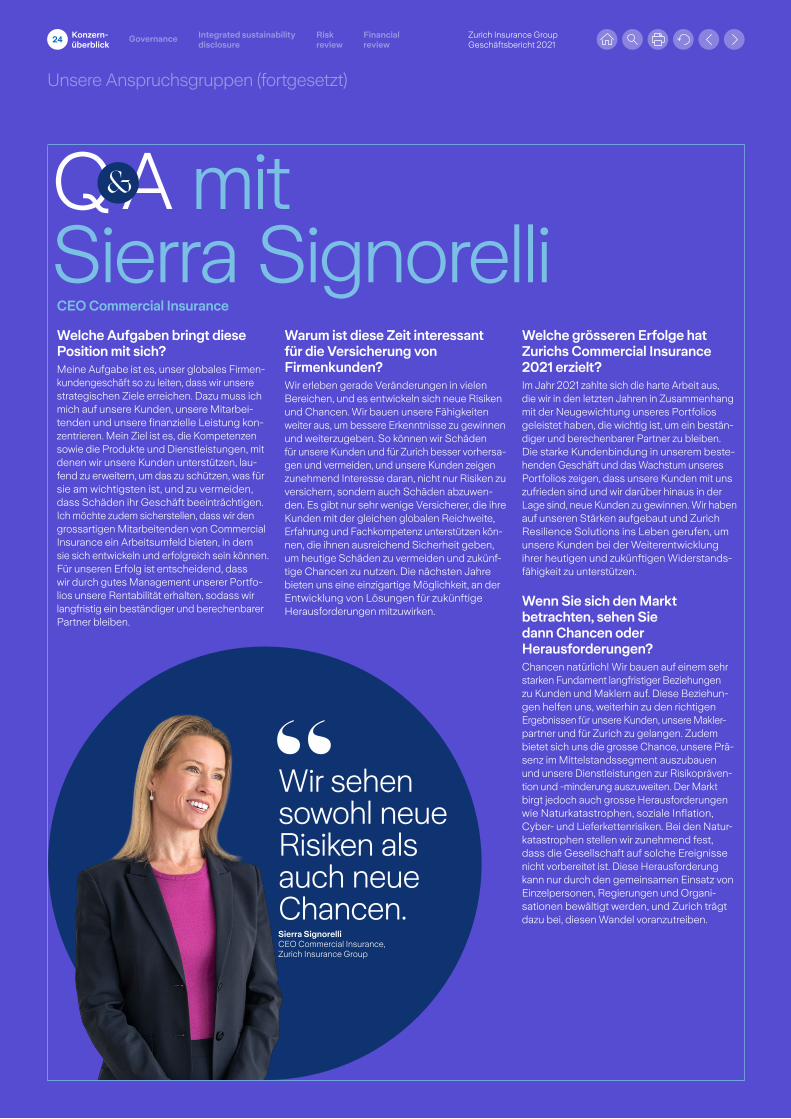
Q A mit Sierra Signorelli
Wir sehen sowohl neue Risiken als auch neue Chancen.Sierra SignorelliCEO Commercial Insurance, Zurich Insurance Group
Welche Aufgaben bringt diese Position mit sich?Meine Aufgabe ist es, unser globales Firmenkundengeschäft so zu leiten, dass wir unsere strategischen Ziele erreichen. Dazu muss ich mich auf unsere Kunden, unsere Mitarbeitenden und unsere finanzielle Leistung konzentrieren. Mein Ziel ist es, die Kompetenzen sowie die Produkte und Dienstleistungen, mit denen wir unsere Kunden unterstützen, laufend zu erweitern, um das zu schützen, was für sie am wichtigsten ist, und zu vermeiden, dass Schäden ihr Geschäft beeinträchtigen. Ich möchte zudem sicherstellen, dass wir den grossartigen Mitarbeitenden von Commercial Insurance ein Arbeitsumfeld bieten, in dem sie sich entwickeln und erfolgreich sein können. Für unseren Erfolg ist entscheidend, dass wir durch gutes Management unserer Portfolios unsere Rentabilität erhalten, sodass wir langfristig ein beständiger und berechenbarer Partner bleiben.
Warum ist diese Zeit interessant für die Versicherung von Firmenkunden?Wir erleben gerade Veränderungen in vielen Bereichen, und es entwickeln sich neue Risiken und Chancen. Wir bauen unsere Fähigkeiten weiter aus, um bessere Erkenntnisse zu gewinnen und weiterzugeben. So können wir Schäden für unsere Kunden und für Zurich besser vorhersagen und vermeiden, und unsere Kunden zeigen zunehmend Interesse daran, nicht nur Risiken zu versichern, sondern auch Schäden abzuwenden. Es gibt nur sehr wenige Versicherer, die ihre Kunden mit der gleichen globalen Reichweite, Erfahrung und Fachkompetenz unterstützen können, die ihnen ausreichend Sicherheit geben, um heutige Schäden zu vermeiden und zukünftige Chancen zu nutzen. Die nächsten Jahre bieten uns eine einzigartige Möglichkeit, an der Entwicklung von Lösungen für zukünftige Herausforderungen mitzuwirken.
Welche grösseren Erfolge hat Zurichs Commercial Insurance 2021 erzielt?Im Jahr 2021 zahlte sich die harte Arbeit aus, die wir in den letzten Jahren in Zusammenhang mit der Neugewichtung unseres Portfolios geleistet haben, die wichtig ist, um ein beständiger und berechenbarer Partner zu bleiben. Die starke Kundenbindung in unserem bestehenden Geschäft und das Wachstum unseres Portfolios zeigen, dass unsere Kunden mit uns zufrieden sind und wir darüber hinaus in der Lage sind, neue Kunden zu gewinnen. Wir haben auf unseren Stärken aufgebaut und Zurich Resilience Solutions ins Leben gerufen, um unsere Kunden bei der Weiterentwicklung ihrer heutigen und zukünftigen Widerstandsfähigkeit zu unterstützen.
Wenn Sie sich den Markt betrachten, sehen Sie dann Chancen oder Herausforderungen?Chancen natürlich! Wir bauen auf einem sehr starken Fundament langfristiger Beziehungen zu Kunden und Maklern auf. Diese Beziehungen helfen uns, weiterhin zu den richtigen Ergebnissen für unsere Kunden, unsere Maklerpartner und für Zurich zu gelangen. Zudem bietet sich uns die grosse Chance, unsere Präsenz im Mittelstandssegment auszubauen und unsere Dienstleistungen zur Risikoprävention und minderung auszuweiten. Der Markt birgt jedoch auch grosse Herausforderungen wie Naturkatastrophen, soziale Inflation, Cyber und Lieferkettenrisiken. Bei den Naturkatastrophen stellen wir zunehmend fest, dass die Gesellschaft auf solche Ereignisse nicht vorbereitet ist. Diese Herausforderung kann nur durch den gemeinsamen Einsatz von Einzelpersonen, Regierungen und Organisationen bewältigt werden, und Zurich trägt dazu bei, diesen Wandel voranzutreiben.
CEO Commercial Insurance
24 Zurich Insurance Group Geschäftsbericht 2021
Konzern-überblick
Integrated sustainability disclosure
Governance Risk review
Financial review
Unsere Anspruchsgruppen (fortgesetzt)
KundenZum Handeln anregen
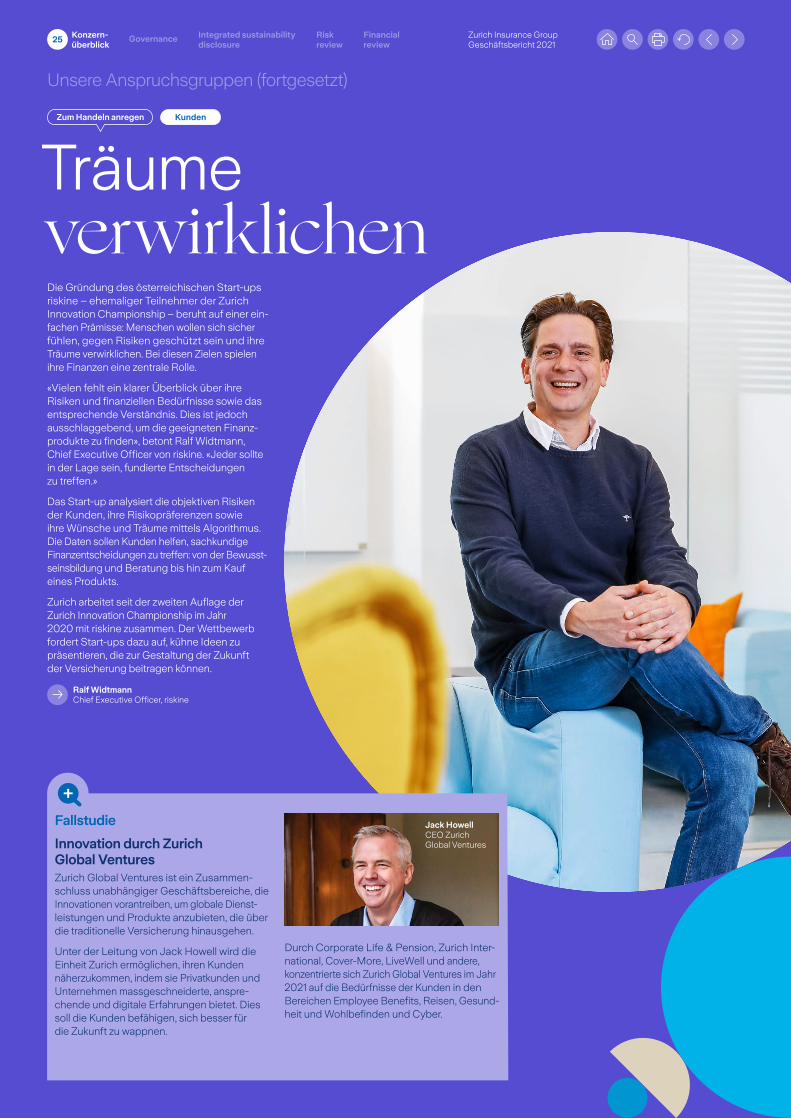
Träume verwirklichenDie Gründung des österreichischen Startups riskine – ehemaliger Teilnehmer der Zurich Innovation Championship – beruht auf einer einfachen Prämisse: Menschen wollen sich sicher fühlen, gegen Risiken geschützt sein und ihre Träume verwirklichen. Bei diesen Zielen spielen ihre Finanzen eine zentrale Rolle.
«Vielen fehlt ein klarer Überblick über ihre Risiken und finanziellen Bedürfnisse sowie das entsprechende Verständnis. Dies ist jedoch ausschlaggebend, um die geeigneten Finanzprodukte zu finden», betont Ralf Widtmann, Chief Executive Officer von riskine. «Jeder sollte in der Lage sein, fundierte Entscheidungen zu treffen.»
Das Startup analysiert die objektiven Risiken der Kunden, ihre Risikopräferenzen sowie ihre Wünsche und Träume mittels Algorithmus. Die Daten sollen Kunden helfen, sachkundige Finanzentscheidungen zu treffen: von der Bewusstseinsbildung und Beratung bis hin zum Kauf eines Produkts.
Zurich arbeitet seit der zweiten Auflage der Zurich Innovation Championship im Jahr 2020 mit riskine zusammen. Der Wettbewerb fordert Startups dazu auf, kühne Ideen zu präsentieren, die zur Gestaltung der Zukunft der Versicherung beitragen können.
Ralf WidtmannChief Executive Officer, riskine
Durch Corporate Life & Pension, Zurich International, CoverMore, LiveWell und andere, konzentrierte sich Zurich Global Ventures im Jahr 2021 auf die Bedürfnisse der Kunden in den Bereichen Employee Benefits, Reisen, Gesundheit und Wohlbefinden und Cyber.
Jack HowellCEO Zurich Global Ventures
Fallstudie
Innovation durch Zurich Global VenturesZurich Global Ventures ist ein Zusammenschluss unabhängiger Geschäftsbereiche, die Innovationen vorantreiben, um globale Dienstleistungen und Produkte anzubieten, die über die traditionelle Versicherung hinausgehen.
Unter der Leitung von Jack Howell wird die Einheit Zurich ermöglichen, ihren Kunden näherzukommen, indem sie Privatkunden und Unternehmen massgeschneiderte, ansprechende und digitale Erfahrungen bietet. Dies soll die Kunden befähigen, sich besser für die Zukunft zu wappnen.
25 Zurich Insurance Group Geschäftsbericht 2021
Konzern-überblick
Integrated sustainability disclosure
Governance Risk review
Financial review
Unsere Anspruchsgruppen (fortgesetzt)
Fallstudie
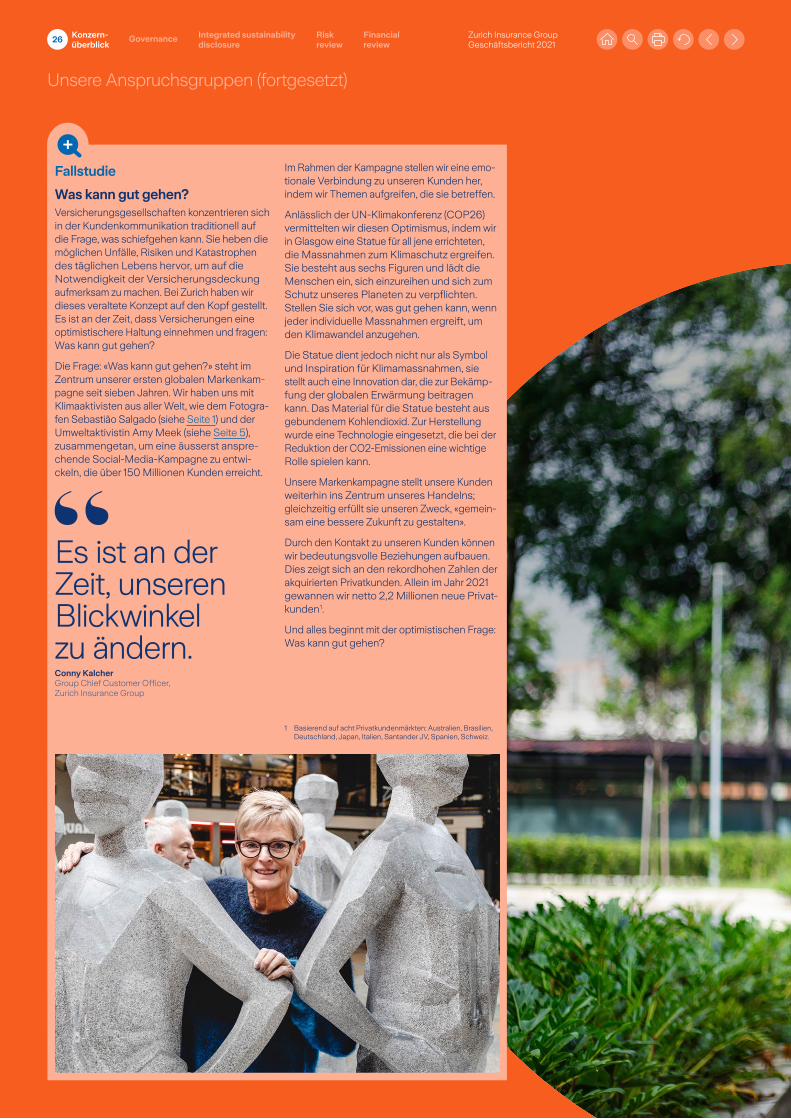
Was kann gut gehen?Versicherungsgesellschaften konzentrieren sich in der Kundenkommunikation traditionell auf die Frage, was schiefgehen kann. Sie heben die möglichen Unfälle, Risiken und Katastrophen des täglichen Lebens hervor, um auf die Notwendigkeit der Versicherungsdeckung aufmerksam zu machen. Bei Zurich haben wir dieses veraltete Konzept auf den Kopf gestellt. Es ist an der Zeit, dass Versicherungen eine optimistischere Haltung einnehmen und fragen: Was kann gut gehen?
Die Frage: «Was kann gut gehen?» steht im Zentrum unserer ersten globalen Markenkampagne seit sieben Jahren. Wir haben uns mit Klimaaktivisten aus aller Welt, wie dem Fotografen Sebastião Salgado (siehe Seite 1) und der Umweltaktivistin Amy Meek (siehe Seite 5), zusammengetan, um eine äusserst ansprechende SocialMediaKampagne zu entwickeln, die über 150 Millionen Kunden erreicht.
Im Rahmen der Kampagne stellen wir eine emotionale Verbindung zu unseren Kunden her, indem wir Themen aufgreifen, die sie betreffen.
Anlässlich der UNKlimakonferenz (COP26) vermittelten wir diesen Optimismus, indem wir in Glasgow eine Statue für all jene errichteten, die Massnahmen zum Klimaschutz ergreifen. Sie besteht aus sechs Figuren und lädt die Menschen ein, sich einzureihen und sich zum Schutz unseres Planeten zu verpflichten. Stellen Sie sich vor, was gut gehen kann, wenn jeder individuelle Massnahmen ergreift, um den Klimawandel anzugehen.
Die Statue dient jedoch nicht nur als Symbol und Inspiration für Klimamassnahmen, sie stellt auch eine Innovation dar, die zur Bekämpfung der globalen Erwärmung beitragen kann. Das Material für die Statue besteht aus gebundenem Kohlendioxid. Zur Herstellung wurde eine Technologie eingesetzt, die bei der Reduktion der CO2Emissionen eine wichtige Rolle spielen kann.
Unsere Markenkampagne stellt unsere Kunden weiterhin ins Zentrum unseres Handelns; gleichzeitig erfüllt sie unseren Zweck, «gemeinsam eine bessere Zukunft zu gestalten».
Durch den Kontakt zu unseren Kunden können wir bedeutungsvolle Beziehungen aufbauen. Dies zeigt sich an den rekordhohen Zahlen der akquirierten Privatkunden. Allein im Jahr 2021 gewannen wir netto 2,2 Millionen neue Privatkunden 1.
Und alles beginnt mit der optimistischen Frage: Was kann gut gehen?
Es ist an der Zeit, unseren Blickwinkel zu ändern.Conny KalcherGroup Chief Customer Officer, Zurich Insurance Group
1 Basierend auf acht Privatkundenmärkten: Australien, Brasilien, Deutschland, Japan, Italien, Santander JV, Spanien, Schweiz.
26 Zurich Insurance Group Geschäftsbericht 2021
Konzern-überblick
Integrated sustainability disclosure
Governance Risk review
Financial review

Unsere Anspruchsgruppen (fortgesetzt)
Zum Handeln anregen MitarbeitendeZum Handeln anregen
Wenn es etwas gibt, das Samantha Chow während ihrer Tätigkeit bei Brand Marketing and Communications, Zurich Malaysia, gelernt hat, dann, dass Taten mehr sagen als Worte.
«Es bringt nichts, über etwas nur zu sprechen», sagt Samantha. «Man muss bereit sein, sich die Hände schmutzig zu machen. Menschen inspiriert man am besten zum Handeln, indem man es selbst tut und mit gutem Beispiel vorangeht.»
Seit ihrem Eintritt in das Unternehmen im Jahr 2020 beschäftigt sie sich mit Kampagnen in den Bereichen Klima, Nachhaltigkeit und Wohlbefinden. Sie schätzt das Engagement von Zurich, eine Kultur zu fördern, in der die Mitarbeitenden ermutigt werden, sowohl am Arbeitsplatz als auch in der Gemeinschaft etwas zu bewirken. Für das Jahr 2022 haben wir uns zum Ziel gesetzt, dass unsere Mitarbeitenden insgesamt 150’000 Stunden ehrenamtliche Arbeit leisten.
Was Samantha wirklich Hoffnung gibt, ist das Potenzial jedes Einzelnen, etwas zu bewirken.
«Manchmal haben wir vielleicht das Gefühl, dass unsere Bemühungen nichts bewirken, aber wenn alle dasselbe denken, dann wird auch nichts geschehen. Es gibt Menschen, die im Alleingang einen ganzen Wald gepflanzt haben. Wenn diese gedacht hätten, dass sie als einzelne Person ohnehin nichts bewirken könnten und nicht den ersten Baum gepflanzt hätten, gäbe es keinen Wald.»
Wenn Samantha selber Zuspruch braucht, weiss sie genau, an wen sie sich wenden kann. «Mein Vater ist das beste Beispiel für Widerstandsfähigkeit, Bescheidenheit und Intelligenz und die erste Person, die ich anrufe, wenn ich bei wichtigen Entscheidungen Hilfe brauche.»
Samantha ChowBrand Marketing and Communications, Zurich Malaysia
Mit gutem Beispiel vorangehen.
27 Zurich Insurance Group Geschäftsbericht 2021
Konzern-überblick
Integrated sustainability disclosure
Governance Risk review
Financial review
Unsere Anspruchsgruppen (fortgesetzt)
PlanetZum Handeln anregen
Wir alle können etwas bewirken«Jeder Einzelne von uns kann etwas bewirken, jeden Tag, an dem wir leben.» So lautete die Botschaft der Hoffnung und der Ermächtigung der britischen Primatenforscherin und Umweltschützerin Dr. Jane Goodall in der ersten Runde der Gesprächsreihe ZTalks by Zurich, bei der die Bekämpfung des Klimawandels im Mittelpunkt stand.
Die am globalen Hauptsitz von Zurich stattfindende Gesprächsreihe ZTalks by Zurich besteht aus vier LiveEvents. Zu diesen Veranstaltungen kommen Vordenker, Akademiker, Aktivisten, Nichtregierungsorganisationen (NGOs) und Führungskräfte von Unternehmen zusammen, um die dringendsten aktuellen Themen zu erörtern. Dabei geht es unter anderem um den Klimawandel, die psychische Gesundheit und die digitale Transformation (siehe Foto auf Seite 29). Die Gesprächsreihe unterstreicht das Ziel von Zurich, eines der verantwortungsbewusstesten und wirkungsvollsten Unternehmen der Welt zu sein.
Jane Goodall, PhD, DBE Gründerin des Jane Goodall Institute und UNFriedensbotschafterin
Fallstudie
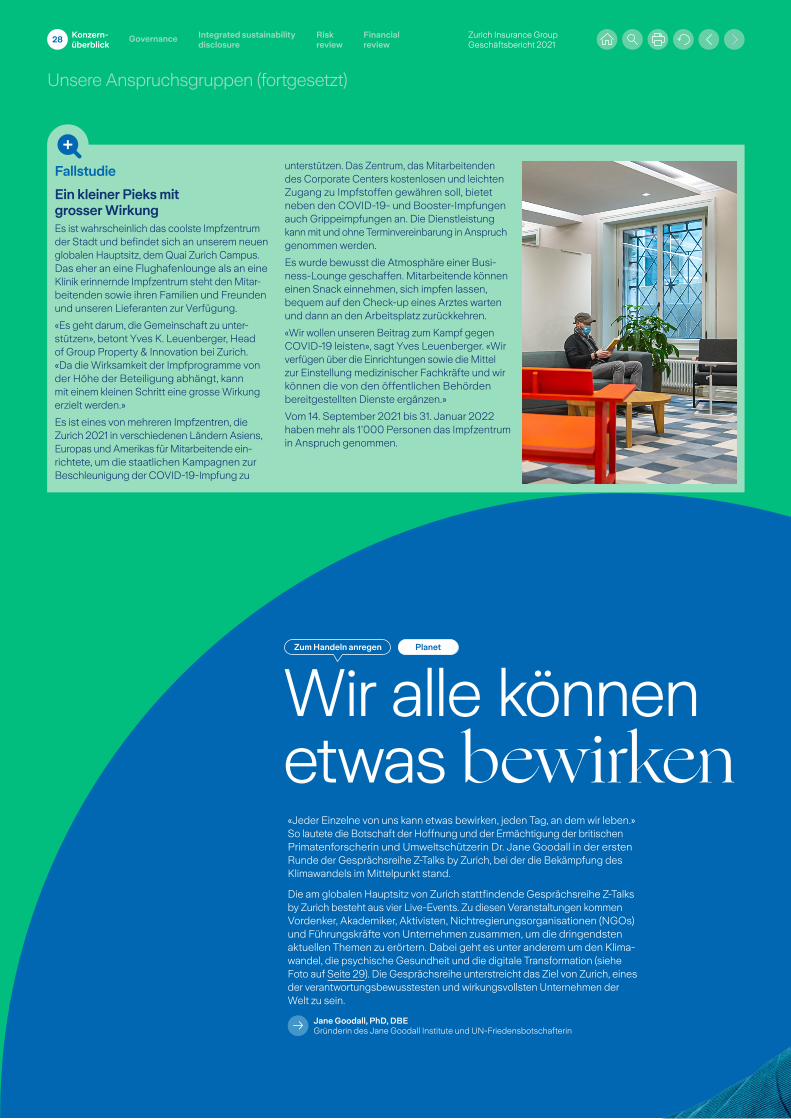
Ein kleiner Pieks mit grosser WirkungEs ist wahrscheinlich das coolste Impfzentrum der Stadt und befindet sich an unserem neuen globalen Hauptsitz, dem Quai Zurich Campus. Das eher an eine Flughafenlounge als an eine Klinik erinnernde Impfzentrum steht den Mitarbeitenden sowie ihren Familien und Freunden und unseren Lieferanten zur Verfügung.
«Es geht darum, die Gemeinschaft zu unterstützen», betont Yves K. Leuenberger, Head of Group Property & Innovation bei Zurich. «Da die Wirksamkeit der Impfprogramme von der Höhe der Beteiligung abhängt, kann mit einem kleinen Schritt eine grosse Wirkung erzielt werden.»
Es ist eines von mehreren Impfzentren, die Zurich 2021 in verschiedenen Ländern Asiens, Europas und Amerikas für Mitarbeitende einrichtete, um die staatlichen Kampagnen zur Beschleunigung der COVID19Impfung zu
unterstützen. Das Zentrum, das Mitarbeitenden des Corporate Centers kostenlosen und leich ten Zugang zu Impfstoffen gewähren soll, bietet neben den COVID19 und BoosterImpfungen auch Grippeimpfungen an. Die Dienstleistung kann mit und ohne Terminvereinbarung in Anspruch genommen werden.
Es wurde bewusst die Atmosphäre einer BusinessLounge geschaffen. Mitarbeitende können einen Snack einnehmen, sich impfen lassen, bequem auf den Checkup eines Arztes warten und dann an den Arbeitsplatz zurückkehren.
«Wir wollen unseren Beitrag zum Kampf gegen COVID19 leisten», sagt Yves Leuenberger. «Wir verfügen über die Einrichtungen sowie die Mittel zur Einstellung medizinischer Fachkräfte und wir können die von den öffentlichen Behörden bereitgestellten Dienste ergänzen.»
Vom 14. September 2021 bis 31. Januar 2022 haben mehr als 1’000 Personen das Impfzentrum in Anspruch genommen.
28 Zurich Insurance Group Geschäftsbericht 2021
Konzern-überblick
Integrated sustainability disclosure
Governance Risk review
Financial review
Unsere Anspruchsgruppen (fortgesetzt)
Wir alle können etwas bewirken
Fallstudie
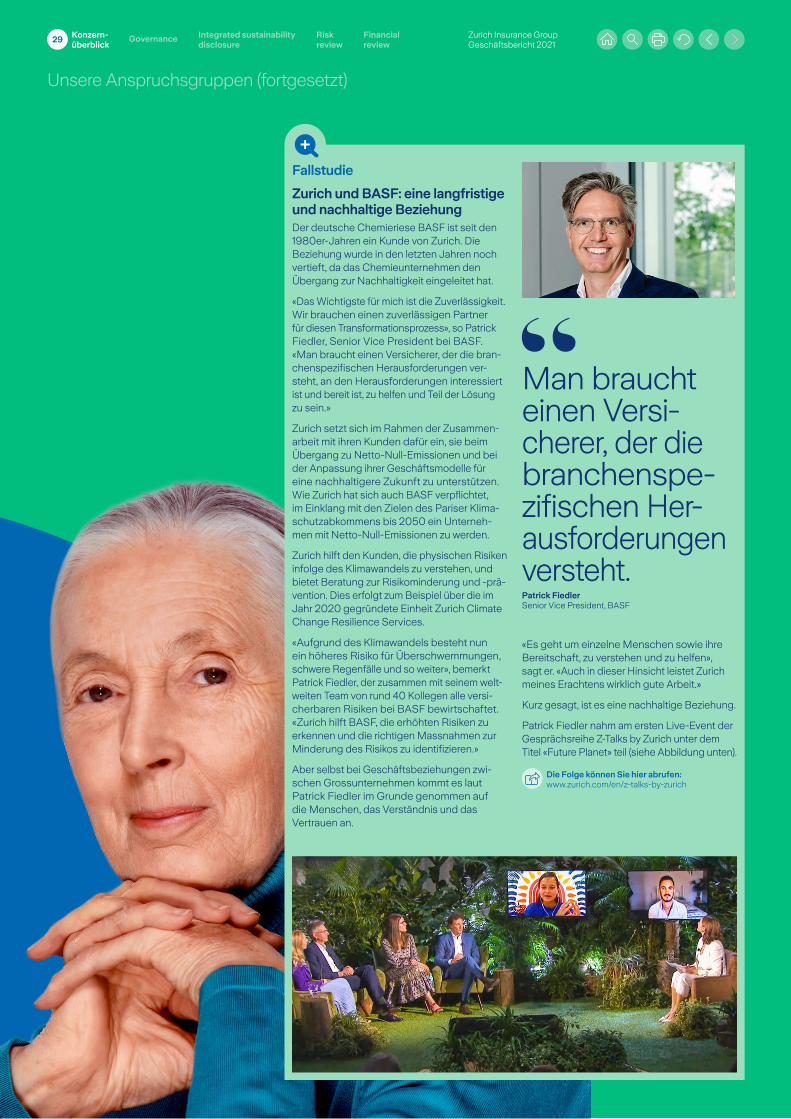
Zurich und BASF: eine langfristige und nachhaltige Beziehung Der deutsche Chemieriese BASF ist seit den 1980erJahren ein Kunde von Zurich. Die Beziehung wurde in den letzten Jahren noch vertieft, da das Chemieunternehmen den Übergang zur Nachhaltigkeit eingeleitet hat.
«Das Wichtigste für mich ist die Zuverlässigkeit. Wir brauchen einen zuverlässigen Partner für diesen Transformationsprozess», so Patrick Fiedler, Senior Vice President bei BASF. «Man braucht einen Versicherer, der die branchenspezifischen Herausforderungen versteht, an den Herausforderungen interessiert ist und bereit ist, zu helfen und Teil der Lösung zu sein.»
Zurich setzt sich im Rahmen der Zusammenarbeit mit ihren Kunden dafür ein, sie beim Übergang zu NettoNullEmissionen und bei der Anpassung ihrer Geschäftsmodelle für eine nachhaltigere Zukunft zu unterstützen. Wie Zurich hat sich auch BASF verpflichtet, im Einklang mit den Zielen des Pariser Klimaschutzabkommens bis 2050 ein Unternehmen mit NettoNullEmissionen zu werden.
Zurich hilft den Kunden, die physischen Risiken infolge des Klimawandels zu verstehen, und bietet Beratung zur Risikominderung und prävention. Dies erfolgt zum Beispiel über die im Jahr 2020 gegründete Einheit Zurich Climate Change Resilience Services.
«Aufgrund des Klimawandels besteht nun ein höheres Risiko für Überschwemmungen, schwere Regenfälle und so weiter», bemerkt Patrick Fiedler, der zusammen mit seinem weltweiten Team von rund 40 Kollegen alle versicherbaren Risiken bei BASF bewirtschaftet. «Zurich hilft BASF, die erhöhten Risiken zu erkennen und die richtigen Massnahmen zur Minderung des Risikos zu identifizieren.»
Aber selbst bei Geschäftsbeziehungen zwischen Grossunternehmen kommt es laut Patrick Fiedler im Grunde genommen auf die Menschen, das Verständnis und das Vertrauen an.
«Es geht um einzelne Menschen sowie ihre Bereitschaft, zu verstehen und zu helfen», sagt er. «Auch in dieser Hinsicht leistet Zurich meines Erachtens wirklich gute Arbeit.»
Kurz gesagt, ist es eine nachhaltige Beziehung.
Patrick Fiedler nahm am ersten LiveEvent der Gesprächsreihe ZTalks by Zurich unter dem Titel «Future Planet» teil (siehe Abbildung unten).
Die Folge können Sie hier abrufen:www.zurich.com/en/ztalksbyzurich
Man braucht einen Versicherer, der die branchenspezifischen Herausforderungen versteht.Patrick FiedlerSenior Vice President, BASF
29 Zurich Insurance Group Geschäftsbericht 2021
Konzern-überblick
Integrated sustainability disclosure
Governance Risk review
Financial review
Unsere Anspruchsgruppen (fortgesetzt)
Fallstudie
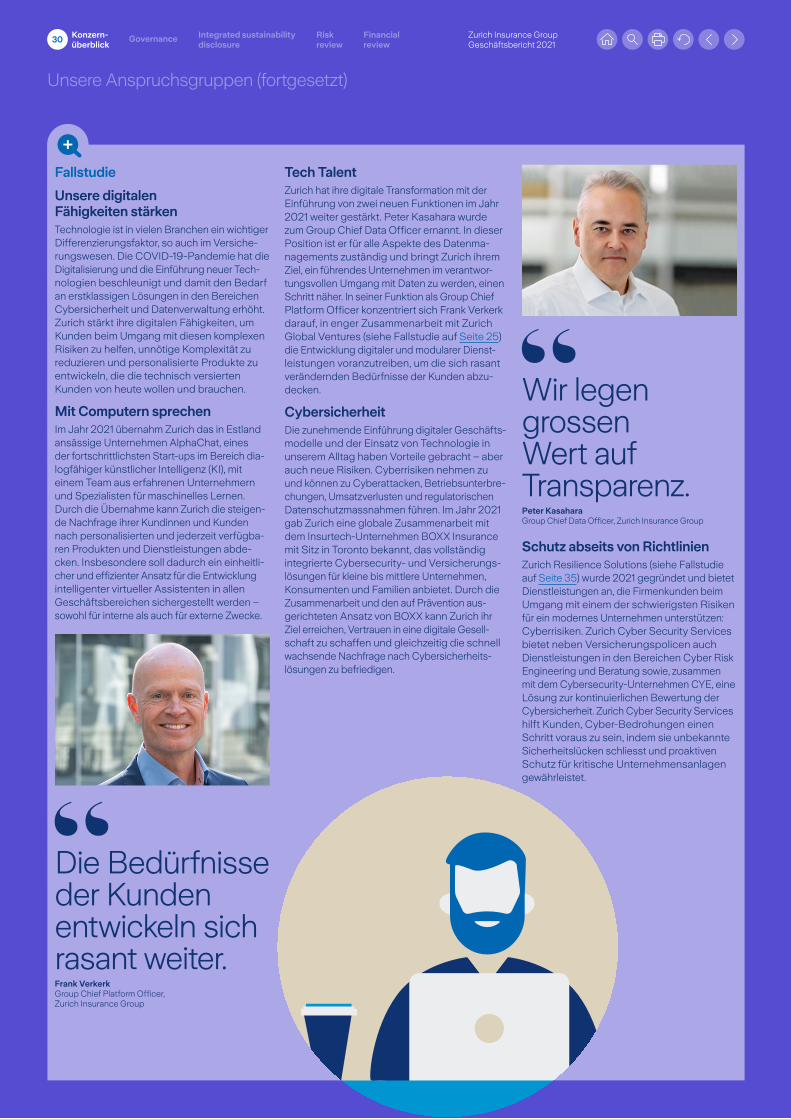
Unsere digitalen Fähigkeiten stärken Technologie ist in vielen Branchen ein wichtiger Differenzierungsfaktor, so auch im Versicherungswesen. Die COVID19Pandemie hat die Digitalisierung und die Einführung neuer Technologien beschleunigt und damit den Bedarf an erstklassigen Lösungen in den Bereichen Cybersicherheit und Datenverwaltung erhöht. Zurich stärkt ihre digitalen Fähigkeiten, um Kunden beim Umgang mit diesen komplexen Risiken zu helfen, unnötige Komplexität zu reduzieren und personalisierte Produkte zu entwickeln, die die technisch versierten Kunden von heute wollen und brauchen.
Mit Computern sprechenIm Jahr 2021 übernahm Zurich das in Estland ansässige Unternehmen AlphaChat, eines der fortschrittlichsten Startups im Bereich dialogfähiger künstlicher Intelligenz (KI), mit einem Team aus erfahrenen Unternehmern und Spezialisten für maschinelles Lernen. Durch die Übernahme kann Zurich die steigende Nachfrage ihrer Kundinnen und Kunden nach perso nalisierten und jederzeit verfügbaren Produkten und Dienstleistungen abdecken. Insbesondere soll dadurch ein einheitlicher und effizienter Ansatz für die Entwicklung intelligenter virtueller Assistenten in allen Ge schäftsbereichen sichergestellt werden – sowohl für interne als auch für externe Zwecke.
Tech TalentZurich hat ihre digitale Transformation mit der Einführung von zwei neuen Funktionen im Jahr 2021 weiter gestärkt. Peter Kasahara wurde zum Group Chief Data Officer ernannt. In dieser Position ist er für alle Aspekte des Datenmanagements zuständig und bringt Zurich ihrem Ziel, ein führendes Unternehmen im verantwortungsvollen Umgang mit Daten zu werden, einen Schritt näher. In seiner Funktion als Group Chief Platform Officer konzentriert sich Frank Verkerk darauf, in enger Zusammenarbeit mit Zurich Global Ventures (siehe Fallstudie auf Seite 25) die Entwicklung digitaler und modularer Dienstleistungen voranzutreiben, um die sich rasant verändernden Bedürfnisse der Kunden abzudecken.
CybersicherheitDie zunehmende Einführung digitaler Geschäftsmodelle und der Einsatz von Technologie in unserem Alltag haben Vorteile gebracht – aber auch neue Risiken. Cyberrisiken nehmen zu und können zu Cyberattacken, Betriebsunterbrechungen, Umsatzverlusten und regulatorischen Datenschutzmassnahmen führen. Im Jahr 2021 gab Zurich eine globale Zusammenarbeit mit dem InsurtechUnternehmen BOXX Insurance mit Sitz in Toronto bekannt, das vollständig integrierte Cybersecurity und Versicherungslösungen für kleine bis mittlere Unternehmen, Konsumenten und Familien anbietet. Durch die Zusammenarbeit und den auf Prävention aus gerichteten Ansatz von BOXX kann Zurich ihr Ziel erreichen, Vertrauen in eine digitale Gesellschaft zu schaffen und gleichzeitig die schnell wachsende Nachfrage nach Cybersicherheitslösungen zu befriedigen.
Schutz abseits von RichtlinienZurich Resilience Solutions (siehe Fallstudie auf Seite 35) wurde 2021 gegründet und bietet Dienstleistungen an, die Firmenkunden beim Umgang mit einem der schwierigsten Risiken für ein modernes Unternehmen unterstützen: Cyberrisiken. Zurich Cyber Security Services bietet neben Versicherungspolicen auch Dienstleistungen in den Bereichen Cyber Risk Engineering und Beratung sowie, zusammen mit dem CybersecurityUnternehmen CYE, eine Lösung zur kontinuierlichen Bewertung der Cybersicherheit. Zurich Cyber Security Services hilft Kunden, CyberBedrohungen einen Schritt voraus zu sein, indem sie unbekannte Sicherheitslücken schliesst und proaktiven Schutz für kritische Unternehmensanlagen gewährleistet.
Die Bedürfnisse der Kunden entwickeln sich rasant weiter.Frank VerkerkGroup Chief Platform Officer, Zurich Insurance Group
Wir legen grossen Wert auf Transparenz.Peter KasaharaGroup Chief Data Officer, Zurich Insurance Group
30 Zurich Insurance Group Geschäftsbericht 2021
Konzern-überblick
Integrated sustainability disclosure
Governance Risk review
Financial review
Unsere Anspruchsgruppen (fortgesetzt)
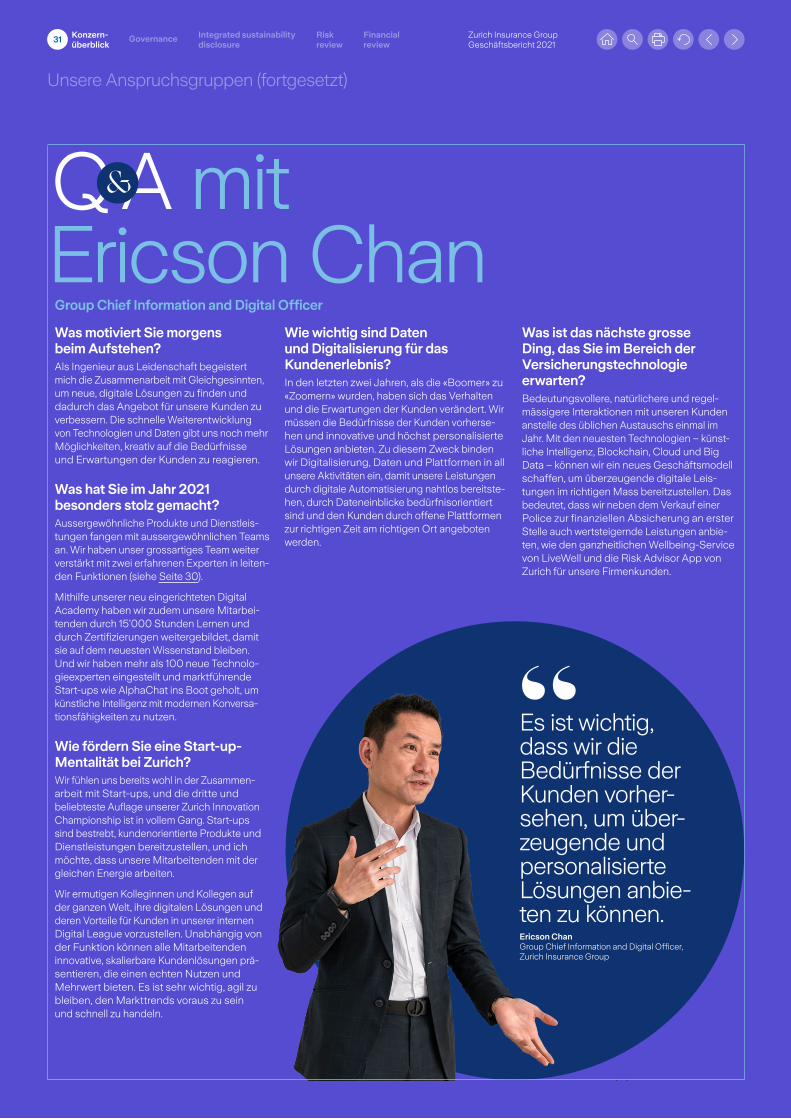
Q A mit Ericson ChanWas motiviert Sie morgens beim Aufstehen?Als Ingenieur aus Leidenschaft begeistert mich die Zusammenarbeit mit Gleichgesinnten, um neue, digitale Lösungen zu finden und dadurch das Angebot für unsere Kunden zu verbessern. Die schnelle Weiterentwicklung von Technologien und Daten gibt uns noch mehr Möglichkeiten, kreativ auf die Bedürfnisse und Erwartungen der Kunden zu reagieren.
Was hat Sie im Jahr 2021 besonders stolz gemacht?Aussergewöhnliche Produkte und Dienstleistungen fangen mit aussergewöhnlichen Teams an. Wir haben unser grossartiges Team weiter verstärkt mit zwei erfahrenen Experten in leitenden Funktionen (siehe Seite 30).
Mithilfe unserer neu eingerichteten Digital Academy haben wir zudem unsere Mitarbeitenden durch 15’000 Stunden Lernen und durch Zertifizierungen weitergebildet, damit sie auf dem neuesten Wissenstand bleiben. Und wir haben mehr als 100 neue Technologieexperten eingestellt und marktführende Startups wie AlphaChat ins Boot geholt, um künstliche Intelligenz mit modernen Konversationsfähigkeiten zu nutzen.
Wie fördern Sie eine Start-up-Mentalität bei Zurich?Wir fühlen uns bereits wohl in der Zusammenarbeit mit Startups, und die dritte und beliebteste Auflage unserer Zurich Innovation Championship ist in vollem Gang. Startups sind bestrebt, kundenorientierte Produkte und Dienstleistungen bereitzustellen, und ich möchte, dass unsere Mitarbeitenden mit der gleichen Energie arbeiten.
Wir ermutigen Kolleginnen und Kollegen auf der ganzen Welt, ihre digitalen Lösungen und deren Vorteile für Kunden in unserer internen Digital League vorzustellen. Unabhängig von der Funktion können alle Mitarbeitenden innovative, skalierbare Kundenlösungen präsentieren, die einen echten Nutzen und Mehrwert bieten. Es ist sehr wichtig, agil zu bleiben, den Markttrends voraus zu sein und schnell zu handeln.
Wie wichtig sind Daten und Digitalisierung für das Kundenerlebnis?In den letzten zwei Jahren, als die «Boomer» zu «Zoomern» wurden, haben sich das Verhalten und die Erwartungen der Kunden verändert. Wir müssen die Bedürfnisse der Kunden vorhersehen und innovative und höchst personalisierte Lösungen anbieten. Zu diesem Zweck binden wir Digitalisierung, Daten und Plattformen in all unsere Aktivitäten ein, damit unsere Leistungen durch digitale Automatisierung nahtlos bereitstehen, durch Dateneinblicke bedürfnisorientiert sind und den Kunden durch offene Plattformen zur richtigen Zeit am richtigen Ort angeboten werden.
Was ist das nächste grosse Ding, das Sie im Bereich der Versicherungstechnologie erwarten? Bedeutungsvollere, natürlichere und regelmässigere Interaktionen mit unseren Kunden anstelle des üblichen Austauschs einmal im Jahr. Mit den neuesten Technologien – künstliche Intelligenz, Blockchain, Cloud und Big Data – können wir ein neues Geschäftsmodell schaffen, um überzeugende digitale Leistungen im richtigen Mass bereitzustellen. Das bedeutet, dass wir neben dem Verkauf einer Police zur finanziellen Absicherung an erster Stelle auch wertsteigernde Leistungen anbieten, wie den ganzheitlichen WellbeingService von LiveWell und die Risk Advisor App von Zurich für unsere Firmenkunden.
Es ist wichtig, dass wir die Bedürfnisse der Kunden vorhersehen, um überzeugende und personalisierte Lösungen anbieten zu können.Ericson Chan Group Chief Information and Digital Officer,Zurich Insurance Group
Group Chief Information and Digital Officer
31 Zurich Insurance Group Geschäftsbericht 2021
Konzern-überblick
Integrated sustainability disclosure
Governance Risk review
Financial review
Zum Handeln anregen
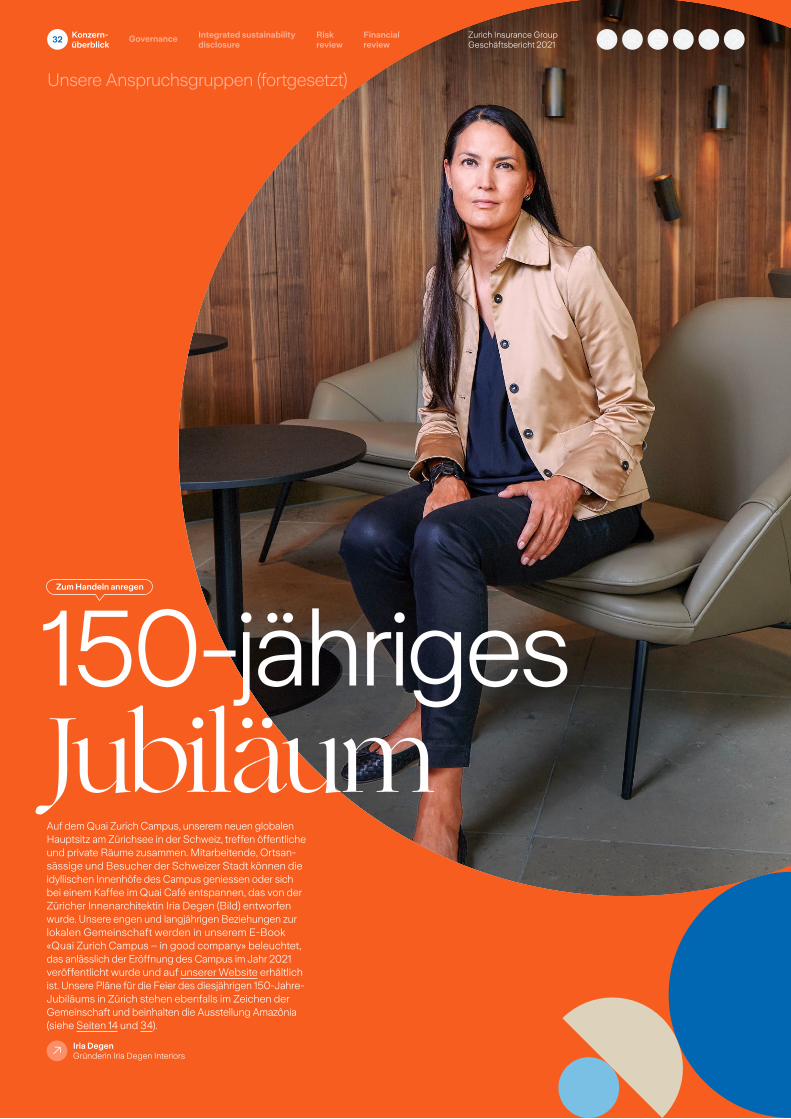
150jähriges Jubil umAuf dem Quai Zurich Campus, unserem neuen globalen Hauptsitz am Zürichsee in der Schweiz, treffen öffentliche und private Räume zusammen. Mitarbeitende, Ortsansässige und Besucher der Schweizer Stadt können die idyllischen Innenhöfe des Campus geniessen oder sich bei einem Kaffee im Quai Café entspannen, das von der Züricher Innenarchitektin Iria Degen (Bild) entworfen wurde. Unsere engen und langjährigen Beziehungen zur lokalen Gemeinschaft werden in unserem EBook «Quai Zurich Campus – in good company» beleuchtet, das anlässlich der Eröffnung des Campus im Jahr 2021 veröffentlicht wurde und auf unserer Website erhältlich ist. Unsere Pläne für die Feier des diesjährigen 150Jahre Jubiläums in Zürich stehen ebenfalls im Zeichen der Gemeinschaft und beinhalten die Ausstellung Amazônia (siehe Seiten 14 und 34).
Iria Degen Gründerin Iria Degen Interiors
Unsere Anspruchsgruppen (fortgesetzt)
32 Zurich Insurance Group Geschäftsbericht 2021
Konzern-überblick
Integrated sustainability disclosure
Governance Risk review
Financial review

Fallstudie
Quai Zurich Campus: unser historischer Hauptsitz neu gestaltetDer neue Hauptsitz von Zurich, der im Jahr 2021 die Türen für die Mitarbeitenden öffnete, verbindet Elemente des ursprünglichen Gebäudes aus dem Jahr 1901 mit unserer Visi on für die Zukunft der Arbeit. Der Quai Zurich Campus am Ufer des Zürichsees ist eines der nachhaltigsten Gebäude der Welt. Es wurde zur Förderung unseres hybriden Arbeitsmodells entwickelt, das ein ausgewogenes Verhältnis zwischen der Arbeit vor Ort und im Homeoffice vorsieht. Der Campus wird mit Seewasser gekühlt und geheizt, das durch das Gebäude gepumpt wird, und für die Toilettenspülung wird Regenwasser verwendet.
In den Blumenkästen an den Fenstern wachsen Sukkulenten, und auf den Tischplatten der gemeinsamen Arbeitsplätze gedeihen grüne Schlangenpflanzen, wodurch die Luft gereinigt und ein Hauch von Natur in die Räume gebracht wird. Übrigens – falls Sie das noch nicht überzeugt – erzeugen die Fitnessgeräte im Fitnessstudio für Mitarbeitende ihre eigene Energie.
Fallstudie
Farmers ExchangesDie Farmers Exchanges 1 und die Farmers Group, Inc. schlossen im Jahr 2021 ihre Akquisition des U.S. Schaden und Unfallversicherungsgeschäfts von MetLife ab. Dadurch ist die Marke Farmers einzigartig positioniert, um ihre Reichweite auf neue Märkte in den gesamten USA auszuweiten. Gezielte Bemühungen zur Integration der neuen Einheit haben bereits
dazu geführt, dass den spezialisierten Vertretern von Farmers® weitere Produkte und Vertriebs systeme zur Verfügung stehen. So haben Konsumentinnen und Konsumenten mehr Möglichkeiten, mit Farmers zu interagieren. Dadurch ist das Unternehmen gut aufgestellt, um das Wachstum zu beschleunigen.
1 Die Zurich Insurance Group hält keine Eigentumsanteile an den Farmers Exchanges. Farmers Group Inc., eine hundertprozentige Tochtergesellschaft der Gruppe, erbringt als Bevollmächtigte bestimmte, nicht auf die Schadenabwicklung bezogene Dienstleis tungen und Nebendienstleistungen für die Farmers Exchanges und erhält hierfür eine Gebühr.
Unsere Anspruchsgruppen (fortgesetzt)
33 Zurich Insurance Group Geschäftsbericht 2021
Konzern-überblick
Integrated sustainability disclosure
Governance Risk review
Financial review
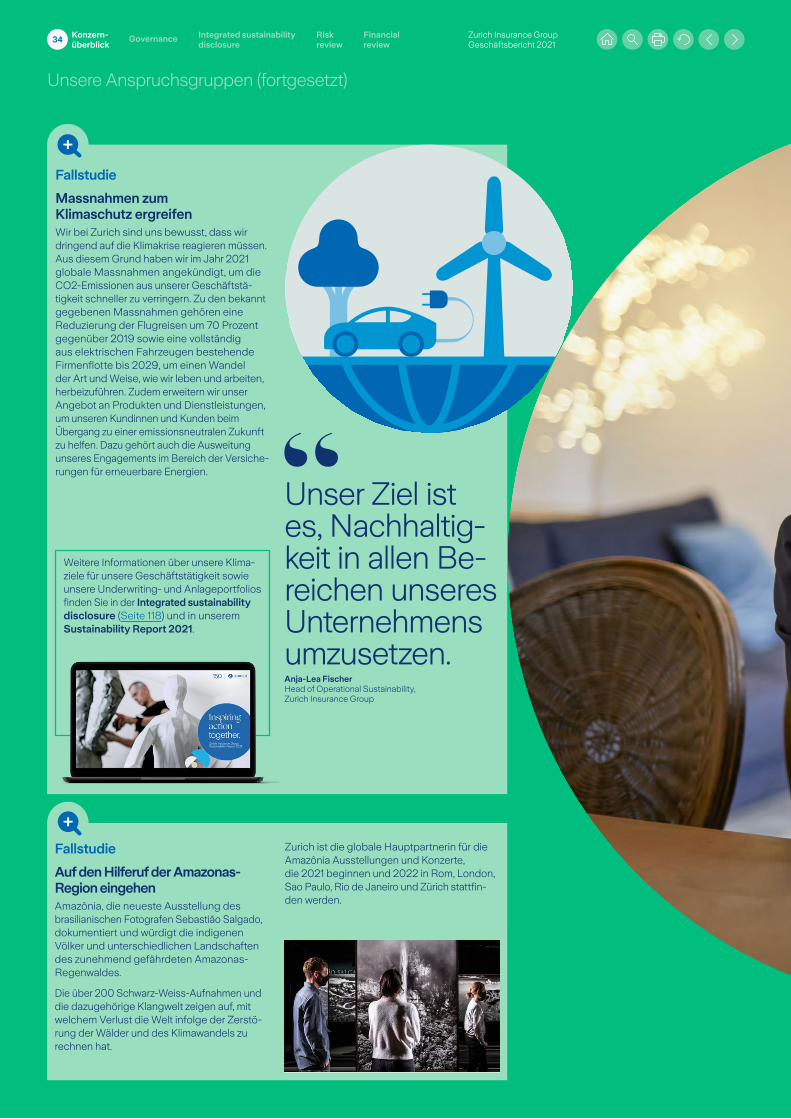
Fallstudie
Massnahmen zum Klimaschutz ergreifenWir bei Zurich sind uns bewusst, dass wir dringend auf die Klimakrise reagieren müssen. Aus diesem Grund haben wir im Jahr 2021 globale Massnahmen angekündigt, um die CO2Emissionen aus unserer Geschäftstätigkeit schneller zu verringern. Zu den bekannt gegebenen Massnahmen gehören eine Reduzierung der Flugreisen um 70 Prozent gegenüber 2019 sowie eine vollständig aus elektrischen Fahrzeugen bestehende Firmenflotte bis 2029, um einen Wan del der Art und Weise, wie wir leben und arbeiten, herbeizuführen. Zudem erweitern wir unser Angebot an Produkten und Dienstleistungen, um unseren Kundinnen und Kunden beim Übergang zu einer emissionsneutralen Zukunft zu helfen. Dazu gehört auch die Ausweitung unseres Engagements im Bereich der Versicherungen für erneuerbare Energien.
Weitere Informationen über unsere Klimaziele für unsere Geschäftstätigkeit sowie unsere Underwriting und Anlageportfolios finden Sie in der Integrated sustainability disclosure (Seite 118) und in unserem Sustainability Report 2021.
Unser Ziel ist es, Nachhaltigkeit in allen Bereichen unseres Unternehmens umzusetzen. Anja-Lea FischerHead of Operational Sustainability, Zurich Insurance Group
Fallstudie
Auf den Hilferuf der Amazonas-Region eingehenAmazônia, die neueste Ausstellung des brasilianischen Fotografen Sebastião Salgado, dokumentiert und würdigt die indigenen Völker und unterschiedlichen Landschaften des zunehmend gefährdeten Amazonas Regenwaldes.
Die über 200 SchwarzWeissAufnahmen und die dazugehörige Klangwelt zeigen auf, mit welchem Verlust die Welt infolge der Zerstörung der Wälder und des Klimawandels zu rechnen hat.
Zurich ist die globale Hauptpartnerin für die Amazônia Ausstellungen und Konzerte, die 2021 beginnen und 2022 in Rom, London, Sao Paulo, Rio de Janeiro und Zürich stattfinden werden.
Konzern-überblick
Integrated sustainability disclosure
Governance Risk review
Financial review
Zurich Insurance Group Geschäftsbericht 2021
34
Unsere Anspruchsgruppen (fortgesetzt)
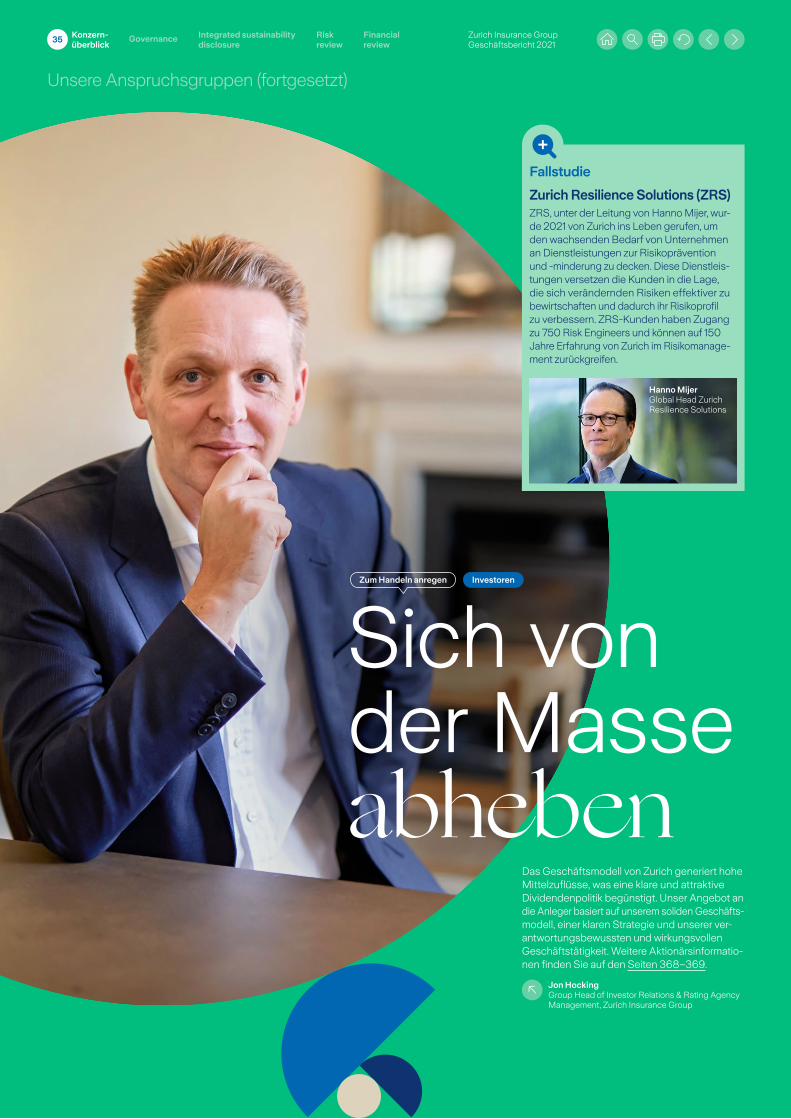
InvestorenZum Handeln anregen
Hanno MijerGlobal Head Zurich Resilience Solutions
Fallstudie
Zurich Resilience Solutions (ZRS)ZRS, unter der Leitung von Hanno Mijer, wurde 2021 von Zurich ins Leben gerufen, um den wachsenden Bedarf von Unternehmen an Dienstleistungen zur Risikoprävention und minderung zu decken. Diese Dienstleistungen versetzen die Kunden in die Lage, die sich verändernden Risiken effektiver zu bewirtschaften und dadurch ihr Risikoprofil zu verbessern. ZRSKunden haben Zugang zu 750 Risk Engineers und können auf 150 Jahre Erfahrung von Zurich im Risikomanagement zurückgreifen.
Sich von der Masse abheben
Das Geschäftsmodell von Zurich generiert hohe Mittelzuflüsse, was eine klare und attraktive Dividendenpolitik begünstigt. Unser Angebot an die Anleger basiert auf unserem soliden Geschäftsmodell, einer klaren Strategie und unserer verantwortungsbewussten und wirkungsvollen Geschäftstätigkeit. Weitere Aktionärsinformationen finden Sie auf den Seiten 368–369.
Jon HockingGroup Head of Investor Relations & Rating Agency Management, Zurich Insurance Group
Konzern-überblick
Integrated sustainability disclosure
Governance Risk review
Financial review
Zurich Insurance Group Geschäftsbericht 2021
35
Unsere Anspruchsgruppen (fortgesetzt)
Unsere Anspruchsgruppen (fortgesetzt)
Konzern-überblick
Integrated sustainability disclosure
Governance Risk review
Financial review
Zurich Insurance Group Geschäftsbericht 2021
36
Gemeinsam handeln
Die Z Zurich Foundation (die Stiftung) ist eine gemeinnützige Stiftung mit Sitz in Zürich, Schweiz. Sie wurde von der Zürich VersicherungsGesellschaft AG und der Zürich LebensversicherungsGesellschaft AG nach Schweizer Recht gegründet und ist das wichtigste Vehikel zur Umsetzung der globalen Investitionsstrategie von Zurich zugunsten von Gemeinschaften.
Die Stiftung setzt sich für eine bessere Zukunft für gefährdete Menschen ein, mit dem Ziel, bis 2024 mindestens 11 Millionen Menschen weltweit positiv zu beeinflussen.
Sie arbeitet gemeinsam mit den Mitarbeitenden von Zurich, Unternehmen, Regierungen und Nichtregierungsorganisationen an einer Zukunft, in der sich Menschen angesichts der
zunehmenden Klimabedrohungen optimal entfalten können, in der sich diejenigen unter uns, die unter dem Druck des Alltags leiden, zu Wort melden können und in der die Ausgegrenzten in unserer Gesellschaft ihr volles Potenzial ausschöpfen können.
Massnahmen für Chancen-gleichheit und GerechtigkeitZu den wichtigsten Massnahmen, mit denen die Stiftung versucht, soziale Gleichheit zu schaffen, gehören der Aufbau einer Plattform für diejenigen, die keine Stimme haben, und die Unterstützung junger Menschen, damit sie ihre Zukunft selbst in die Hand nehmen können. Im Rahmen von Förderprogrammen arbeitet die Stiftung weltweit mit den Geschäftseinheiten von Zurich zusammen, um lokale gesellschaftliche Probleme anzugehen sowie soziale Gleichheit zu fördern und zu verwirklichen. 2021 genehmigte die Stiftung die Finanzierung von vier neuen mehrjährigen Förderprogrammen ab 2022 in Ecuador, Spanien und Frankreich.
Wir alle schaffen eine bessere Zukunft für die besonders gefährdeten Personen.Grégory RenandHead of the Z Zurich Foundation
Fallstudie
Spendenaktion für UNICEFDie Z Zurich Foundation hat sich dazu verpflichtet, die UNICEF (das Kinderhilfswerk der Vereinten Nationen) bei ihren Bemühungen zu unterstützen, den gefährdetsten Menschen weltweit Impfdosen gegen COVID19 bereitzustellen. Die Geschäftseinheiten, Mitarbeitenden, Kunden und Vertriebspartner von Zurich unterstützten mit ihrer Teilnahme an der grössten Spendenaktion seit der Gründung der Stiftung im Jahr 1973 die Bestrebungen zur Beendigung der Pandemie. Die im Zuge der Spendenaktion gesammelten Mittel ermö glichen der UNICEF, mehr als 1,7 Millionen Menschen jeweils zwei Dosen COVID19Impfstoff zu verabreichen.
Für weitere Informationen über die Arbeit der Z Zurich Foundation siehe den Sustainability Report 2021:www.zurich.com/sustainability/ reportingandnews/reportspublications
Unsere Anspruchsgruppen (fortgesetzt)
Konzern-überblick
Integrated sustainability disclosure
Governance Risk review
Financial review
Zurich Insurance Group Geschäftsbericht 2021
37
PlanetZum Handeln anregen
«Gleichheit ist ein zentrales Anliegen der Z Zurich Foundation. Deshalb unterstützen wir die Verteilung von COVID19Impfstoffen an einige der gefährdetsten Gemeinschaften der Welt. Die Reaktion der Mitarbeitenden von Zurich auf unsere globale Spendenkampagne hat uns sehr beeindruckt: Sie haben ihre persönlichen und beruflichen Netzwerke mobilisiert und sich mit Leidenschaft und Engagement eingesetzt. Diese Fähigkeit, sich gegenseitig zu inspirieren, bildet das Fundament der Stiftung.»
Gary ShaughnessyVorsitzender des Stiftungsrats, Z Zurich Foundation
Die psychische Gesundheit in den Vordergrund stellenAuf der Grundlage einer Reihe preisgekrönter lokaler Projekte in Australien, Irland, der Türkei und auf der Isle of Man hat die Stiftung eine dreijährige globale strategische Partnerschaft mit UNICEF zur Förderung des seelischen Wohlbefindens junger Menschen gestartet. Die Partnerschaft hat zum Ziel, zunächst 400’000 Jugendliche und 150’000 Betreuungspersonen in sieben Ländern (Vietnam, Mexiko, Indonesien, Nepal, Kolumbien, Ecuador und den Malediven) mit Informationen, Kompetenzen und Strategien auszustatten, wie sie sich um ihr eigenes seelisches Wohlbefinden sowie das ihrer Mitmenschen kümmern können.
Im Jahr 2021 hat die Stiftung ausserdem Gelder zur Unterstützung von drei neuen, mehrjährigen Programmen in Neuseeland, Portugal und Brasilien bereitgestellt. Ferner hat sie eine landesweite Umfrage über den Zustand des seelischen Wohlbefindens von Schweizer Jugendlichen mitfinanziert.
Zur Unterstützung ihrer im Jahr 2019 neu festgelegten Strategie richtet die Z Zurich Foundation ihre Bemühungen auf drei gesellschaftliche Herausforderungen. Dies geschieht durch die Finanzierung von Subventionsprogrammen in Zusammen arbeit mit den Geschäftseinheiten von Zurich und Wohltätigkeitsorganisationen weltweit sowie durch die Entwicklung von Engagement Initiativen.
Anpassung an den
Klimawandel
Verbesserung des seelischen Wohlbefindens
Förderung der sozialen Gleichheit
Unsere Bemühungen verstärken Durch den Aufbau von Widerstandsfähigkeit in Gemeinschaften wird das Leben Tausender Menschen positiv beeinflusst. Die Stiftung hat damit begonnen, unterversorgte und gefährdete Gemeinschaften bei der Stärkung der Resilienz in städtischen Gebieten zu unterstützen. Dabei wurde das Knowhow genutzt, das in Zusammenarbeit mit der Zurich Flood Resilience Alliance, einer sektorübergreifenden Partnerschaft zur Verbesserung des Hochwasserschutzes, entwickelt wurde. Die Stiftung hat für 2021 die Unterstützung von drei neuen Programmen zur Stärkung der Resilienz in städtischen Gebieten zugesagt: in den USA, in Ecuador und Kolumbien. Die Zurich Flood Resilience Alliance hat sich im Jahr 2021 um das Vierfache vergrössert und unterstützt nun 300 Ge meinschaften in 23 Ländern gegenüber 75 Gemeinschaften im Jahr 2020.
Fallstudie
Helden der Gemeinschaft auszeichnenMit den Community Hero Awards der Z Zurich Foundation werden Mitarbeitende von Zurich ausgezeichnet, die einen bedeutenden Beitrag in ihren Gemeinschaften geleistet haben. Die Mitarbeitenden können Kolleginnen und Kollegen für Aktivitäten wie beispielsweise Spendensammlungen, ehrenamtliche Tätigkeiten oder Kampagnenarbeit nominieren. Jeder Gewinner erhält eine einmalige Zahlung in Höhe von CHF 25’000. 2021 haben wir 16 Einzelpersonen oder Teams ausgezeichnet, die für ihre lokalen Gemeinschaften über sich hinauswuchsen. Mario Greco, CEO von Zurich, und der Stiftungsrat verkündeten die Auszeichnungen im November im Rahmen einer virtuellen Veranstaltung.
Gemeinsam sind wir stärker

Anna WengerGroup Financial Accounting and Reporting, Zurich Insurance Group
Das Video können Sie hier abrufen:www.zurich.com/reports/2021/annualreport
Einander ermutigenZurich strebt an, eines der verantwortungsbewusstesten und wirkungsvollsten Unternehmen der Welt zu sein. Gemeinsam mit unseren Kunden, Mitarbeitenden, Investoren und Gemeinschaften wollen wir jeden dazu ermutigen, einen Beitrag zu einer besseren Zukunft für die Menschen und den Planeten zu leisten. “Wir können andere zum Handeln anregen, indem wir ein Bewusstsein schaffen, uns von Vorbildern leiten lassen und dann mit gutem Beispiel vorangehen”, sagt Anna Wenger, Group Financial Accounting and Reporting.
Zum Handeln anregen
Zurich Insurance Group Geschäftsbericht 2021
Konzern-überblick
Integrated sustainability disclosure
Governance Risk review
Financial review
38
Governance42 Bericht über die
Corporate Governance86 Vergütungsbericht
Zurich Insurance Group Geschäftsbericht 2021
Konzern-überblick
Integrated sustainability disclosure
Governance Risk review
Financial review
39
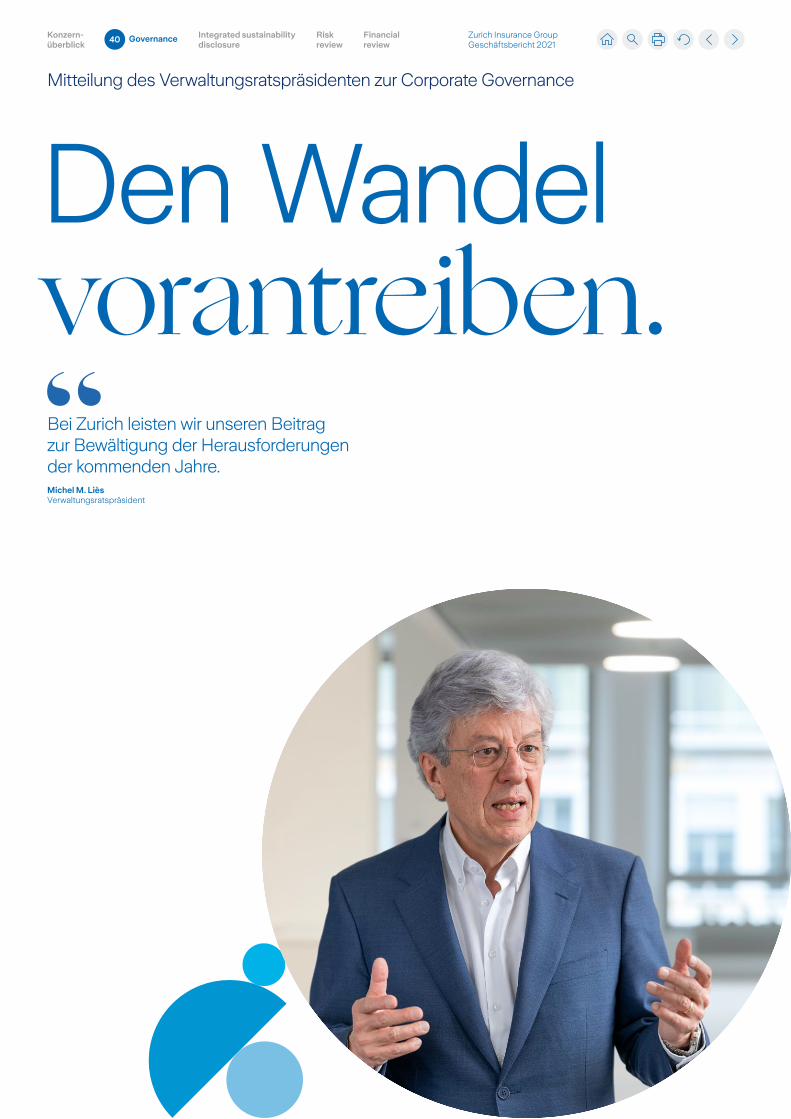
Mitteilung des Verwaltungsratspräsidenten zur Corporate Governance
Mitteilung des Verwaltungsratspräsidenten zur Corporate Governance
Den Wandelvorantreiben.Bei Zurich leisten wir unseren Beitrag zur Bewältigung der Herausforderungen der kommenden Jahre.Michel M. LièsVerwaltungsratspräsident
Zurich Insurance Group Geschäftsbericht 2021
Konzern-überblick
Integrated sustainability disclosure
Governance Risk review
Financial review
40
Mitteilung des Verwaltungsratspräsidenten zur Corporate Governance (fortgesetzt)
Sehr geehrte Aktionärin, sehr geehrter Aktionär Wir stehen vor noch nie dagewesenen Heraus forderungen mit Auswirkungen auf unseren Planeten: vom Klimawandel und dem Verlust der Biodiversität bis hin zu sozialen Ungleichheiten und den anhaltenden Herausforde rungen im Zusammenhang mit der COVID19Pandemie.
In diesen anspruchsvollen Zeiten profitiert Zurich von ihrem starken Corporate Governance Framework. Dieses beinhaltet klare Strukturen, Regeln und Prozesse sowie einen vielfältig zusammengesetzten und unabhängigen Verwaltungsrat, der gut aufgestellt ist, um das Management bei der Umsetzung der strategischen Prioritäten zu unterstützen.
Das Engagement unseres Verwaltungsrats hört damit aber nicht auf. Unterstützt durch die Arbeit unserer Ausschüsse und des Managements, überprüfen wir laufend unsere Rolle in der Gesellschaft und Möglichkeiten, wie Zürich dazu beitragen kann, die Herausforderungen der kommenden Jahre zu bewältigen.
Besonders wichtig ist, dass wir einen deutlichen Schwerpunkt auf die Integration von ESGThemen legen. Wir stellen sicher, dass unsere ESGStrategie nicht nur solide und authentisch, sondern auch in unsere Geschäftsbereiche eingebettet ist. Das verleiht uns die Glaubwürdigkeit, einen vertrauensvollen Dialog über Themen zu führen, welche die Gesellschaft betreffen.
Unsere ESGStrategie wird für unsere Mitarbeitenden, Kunden und Anleger immer wichtiger. Vor diesem Hintergrund haben wir im Laufe des Jahres 2021 Schritte unternommen, um unsere Verpflichtungen zu stärken, und wir werden unsere Position im Jahr 2022 weiter überprüfen.
Wichtige Schritte in Richtung einer «grüneren Zukunft»Im Jahr 2021 haben wir uns beispielsweise als Gründungsmitglied der NetZero Insurance Alliance verpflichtet, die CO2Intensität unserer Versicherungsportfolios bis 2050 auf nettonull zu reduzieren.
In der Folge haben wir neue Underwriting Richtlinien für den Öl und Gassektor eingeführt, die auf unseren bestehenden Richtlinien für Kraftwerkskohle, Ölsand und Ölschiefer aufbauen. Aber Ausschlüsse sind immer nur das letzte Mittel. Wir sind davon überzeugt, dass der beste Weg zur Erreichung der NettoNullZiele darin besteht, mit Kunden und Beteiligungsunternehmen zusammenzuarbeiten und sie bei der Umstellung auf eine umweltfreundlichere Zukunft zu beraten und zu unterstützen.
Zurich hat zudem als erster Versicherer begonnen, einen klimaneutralen Aktienfonds für Lebensversicherungskunden anzubieten und hat neue globale Massnahmen ergriffen, um die Reduktion der CO2Emissionen aus der eigenen Geschäftstätigkeit zu beschleunigen. Ausserdem erweitern wir unsere Ver sicherungsdeckung für den Sektor der erneuerbaren Energien und stärken unsere UnderwritingKapazitäten für alternative Energien.
Vielfalt bleibt ein wichtiges AnliegenEin weiteres wichtiges Anliegen ist für uns die Vielfalt in unserem Verwaltungsrat und der Konzernleitung, im Einklang mit der Vielfalt unserer Mitarbeitenden und Kunden. Auch im letzten Jahr war unser Verwaltungsrat vielfältig zusammengesetzt, insbesondere hinsichtlich des Geschlechterverhältnisses mit einem Frauenanteil von 55%. Für 2022 gehen wir von einer ausgewogenen Vertretung der Geschlechter aus, vorausgesetzt, unsere Aktionäre folgen unserem Vorschlag, Peter Maurer als neues Verwaltungsratsmitglied an der nächsten ordentlichen Generalversamm
lung zu wählen. Weiter werden derzeit zwei unserer vier Verwaltungsratsausschüsse von weiblichen Mitgliedern geleitet, und in der Konzernleitung führen vier Frauen wichtige Geschäftsbereiche.
Ausblick auf das Jahr 20222022 wird ein besonderes Jahr für Zurich, in dem wir unser 150jähriges Bestehen feiern werden. Wir werden uns Zeit nehmen, um auf unsere Geschichte zurückzublicken. Zurich hat sich schon immer proaktiv mit gesellschaftlichen Anliegen auseinandergesetzt – sei es durch Philanthropie, interne Richtlinien oder ESGRisikobeurteilungen.
Wir werden uns aber auch Gedanken über die Zukunft machen – und überlegen, wie wir gemeinsam und für alle eine bessere Zukunft schaffen können. Wir müssen uns mit dem Klimawandel auseinandersetzen, die Chancen eines «grünen Aufschwungs» nutzen und gegen gesellschaftliche Ungleichheiten vorgehen.
Gleichzeitig müssen wir uns auf eine nachhaltige Wertschöpfung für alle unsere Anspruchsgruppen konzentrieren. Dies wird einer unserer Schwerpunktbereiche sein, wenn wir im Laufe des Jahres 2022 die neuen Ziele für einen Strategiezyklus festlegen, die wir im November präsentieren werden.
Sie können sich darauf verlassen, dass wir Entscheidungen treffen werden, die allen Anspruchsgruppen in den kommenden Jahren zugutekommen werden. Wir lassen uns weiterhin von unserem Ziel leiten, eines der verantwortungsbewusstesten und wirkungsvollsten Unternehmen der Welt zu sein.
Vielen Dank für Ihr anhaltendes Vertrauen, Ihre Unterstützung und Ihr Engagement.
Michel M. LièsVerwaltungsratspräsident
Änderungen in der Konzernleitung
Am 13. Juli 2021 reichte Urban Angehrn, Group Chief Investment Officer seit Juli 2015 und Mitglied der Konzernleitung der Gruppe, seinen Rücktritt ein. Er war zuvor zum CEO der Eidgenössischen Finanzmarkt- aufsicht FINMA ernannt worden. Infolgedessen hat Peter Giger, Group Chief Risk Officer und Konzern- leitungsmitglied, die zusätzlichen Aufgaben als Group Chief Investment Officer ad interim übernommen. Stephan van Vliet wurde per 1. Mai 2022 zum Group Chief Investment Officer und Mitglied der Konzernleitung ernannt.
Sierra Signorelli, ehemalige Group Chief Underwriting Officer, wurde per 4. März 2021 CEO Commercial Insurance und Konzernleitungsmitglied. Sie trat die Nachfolge von James Shea an, der sich entschlossen hatte, Zurich zu verlassen, um sich neuen Aufgaben ausserhalb des Unternehmens zu widmen.
Änderungen im Verwaltungsrat
An der ordentlichen Generalversammlung am 7. April 2021 haben wir Sabine Keller-Busse als neues Verwaltungsratsmitglied begrüsst. Vor der ordent- lichen Generalversammlung 2021 hatte Jeffrey Hayman seine Kandidatur aufgrund zukünftiger Vollzeitverpflichtungen zurückgezogen.
Für die ordentliche Generalversammlung am 6. April 2022 schlägt der Verwaltungsrat den Aktionärinnen und Aktionären die Wiederwahl aller gegenwärtigen Mitglieder sowie die Wahl von Peter Maurer als neues Verwaltungsratsmitglied vor, wobei Peter Maurer sein Mandat erst per 1. Oktober 2022 antritt (weitere Einzelheiten entnehmen Sie bitte der Einladung zur Generalversammlung 2022).
Tulsi Naidu, ehemalige CEO UK, wurde per 1. Januar 2021 zum CEO Asia Pacific und Mitglied der Konzern- leitung ernannt. Sie trat die Nachfolge von Jack Howell an, der per 1. Januar 2021 die Rolle des CEO Zurich Global Ventures (vormals CEO Global Business Platforms) übernommen hat und in dieser Funktion Mitglied der Konzernleitung bleibt.
Kristof Terryn, ehemaliger Group Chief Operating Officer, wurde per 1. Januar 2021 zum CEO North America ernannt. Er trat die Nachfolge von Kathleen Savio an, die zum gleichen Zeitpunkt aus der Konzern- leitung ausschied, um die neu geschaffene Position des Group Chief Transformation Officer zu übernehmen.
Zurich Insurance Group Geschäftsbericht 2021
Konzern-überblick
Integrated sustainability disclosure
Governance Risk review
Financial review
41
Bericht über die Corporate Governance
Bericht über die Corporate Governance Inhalt
Governance der Gruppe 43
Kapitalstruktur 45
Aktionäre 47
Verwaltungsrat 50
Konzernleitung 66
Governance und Kontrollfunktionen 76
Externe Revisionsstelle 79
Zusätzliche Informationen 81
Zurich Insurance Group Geschäftsbericht 2021
Konzern-überblick
Integrated sustainability disclosure
Governance Risk review
Financial review
42
Bericht über die Corporate Governance (fortgesetzt)
Governance der Gruppe
Unser Engagement für eine wirksame Corporate GovernanceDie Zurich Insurance Group, die aus der Zurich Insurance Group AG und deren Tochtergesellschaften besteht (die «Gruppe» oder «Zurich»), ist bestrebt, zum Wohl ihrer Aktionäre, Kunden, Mitarbeitenden und weiterer Anspruchsgruppen eine wirksame Corporate Governance zu gewährleisten, die auf Fairness, Transparenz und Übernahme von Verantwortung basiert. Die Strukturen, Regeln und Prozesse schaffen klare Befugnisse und Verantwortlichkeiten der Organe und Mitarbeitenden der Gruppe und damit die Grundlage für ein angemessenes Geschäftsverhalten. Unsere Strukturen sorgen für Kontrollmechanismen und die institutionelle Unabhängigkeit des Verwaltungsrats vom Group Chief Executive Officer (Group CEO) und von der Konzernleitung, die zusammen für die Führung der Gruppe im täglichen Geschäft verantwortlich sind.
Die Prinzipien der Corporate Governance von Zurich sind in zahlreichen Dokumenten beschrieben, insbesondere in den Statuten, dem Organisationsreglement und den internen Richtlinien der Verwaltungsratsausschüsse der Zurich Insurance Group AG (Organisationsreglement) (www.zurich.com/aboutus/corporategovernance/corporatedocuments). Zurich befolgt ebenfalls den Swiss Code of Best Practice for Corporate Governance (Swiss Code of Best Practice), der von economiesuisse veröffentlicht wird. Der Governance, Nominierungs und Nachhaltigkeitsausschuss (GNSC) überprüft die Corporate Governance der Gruppe regelmässig im Hinblick auf BestPracticeStandards.
Eine wirksame Corporate Governance wird durch ein Vergütungssystem ergänzt, das die richtigen Verhaltensweisen fördert. Informationen über Vergütungen, Aktienbesitz sowie Darlehen an Mitglieder des Verwaltungsrats und der Konzernleitung sind im Vergütungsbericht enthalten (siehe Seiten 84 bis 117).
AufsichtZurich untersteht der Versicherungsgruppenaufsicht der Eidgenössischen Finanzmarktaufsicht FINMA (FINMA). Die regulatorischen Vorschriften für Versicherungen in der Schweiz verpflichten schweizerische Versicherungsgesellschaften und gruppen zur Schaffung und Aufrechterhaltung von robusten Governance und Risikomanagement systemen sowie wirksamer interner Kontrollsysteme, die im Hinblick auf die Geschäftsaktivitäten angemessen sind. Ausserdem muss eine risikobasierte Solvabilität sowohl konzernweit als auch auf Ebene der einzelnen Gesellschaften gemäss dem Schweizer Solvenztest (SST) ausgewiesen werden. Unter anderem müssen alle wichtigen gruppeninternen Transaktionen der FINMA gemeldet werden. Neben der von der FINMA ausgeübten Gruppenaufsicht sowie der Versicherungsaufsicht über die juristischen Personen Zürich VersicherungsGesellschaft AG, Zürich LebensversicherungsGesellschaft AG, Zürich RückversicherungsGesellschaft AG und Orion RechtsschutzVersicherung AG unterliegen die Versicherungsgesellschaften und die weiteren Finanzdienstleistungsgesellschaften der Gruppe den jeweiligen lokalen Finanzmarktregulierungen.
Operative KonzernstrukturZurich Insurance Group AG ist die börsenkotierte Holdinggesellschaft der Gruppe und eine Aktiengesellschaft nach schweizerischem Recht, die unter der Adresse Mythenquai 2, 8002 Zürich, eingetragen ist. Im Mittelpunkt der Geschäftstätigkeit von Zurich steht die Bereitstellung erstklassiger Produkte und Dienstleistungen im Bereich der Schaden und Unfallversicherung sowie der Lebensversicherung für Privatpersonen sowie kleine, mittlere und grosse Unternehmen.
Die operative Struktur widerspiegelt die von der Gruppe betriebenen Geschäftsbereiche und wie diese strategisch geführt werden, um verschiedene Produkte und Dienstleistungen bestimmten Kundengruppen anzubieten. Die Gruppe wird nach Regionen geführt; hinzu kommen CommercialInsurance, Zurich Global Ventures und Farmers in den USA:
– Durch die Regionen (APAC, EMEA, LATAM und Nordamerika) bietet die Gruppe eine Vielzahl von Produkten der Schaden und Unfallversicherung sowie Lebensversicherung für Privat und Firmenkunden sowie Rückversicherungen an. Jede Region wird von einem regionalen CEO geleitet.
– Commercial Insurance fasst die weltweite Expertise in den Bereichen Gross und Firmenkundengeschäft unter einem Dach zusammen. Es ist als globales Geschäft organisiert und wird vom CEO Commercial Insurance geleitet.
– Zurich Global Ventures (vormals Global Business Platforms) wurde am 1. Januar 2021 gegründet, um die Kundenorientierung und die Entwicklung digitaler Dienstleistungen zur Förderung des Versicherungsgeschäfts weltweit voranzutreiben. Die Einheit umfasst auch CoverMore und Zurich International (ZINT), die in die Regionen integriert sind. Am 1. Januar 2022 wurde innerhalb von Zurich Global Ventures die neue Einheit Zurich Integrated Benefits Solutions (ZIBS) gegründet, in der verschiedene bestehende Geschäftsbereiche, die Lösungen für Leistungen an Mitarbeitende anbieten, zusammengeführt wurden (u. a. die Geschäftsbereiche International Markets und Europe von ZINT). Zurich Global Ventures wird vom CEO Zurich Global Ventures geleitet.
– Die Farmers Group, Inc., eine hundertprozentige Tochtergesellschaft der Gruppe, ist keine Versicherungsgesellschaft. Sie erbringt als Bevollmächtigte der Farmers Exchanges in den USA bestimmte, nicht auf die Schadenabwicklung bezogene Dienstleistungen und Nebendienstleistungen für die Farmers Exchanges und bezieht hierfür Gebühreneinnahmen. Die Zurich Insurance Group ist nicht an den Farmers Exchanges beteiligt. Farmers Group, Inc. wird vom CEO der Farmers Group, Inc. geleitet.
Zurich Insurance Group Geschäftsbericht 2021
Konzern-überblick
Integrated sustainability disclosure
Governance Risk review
Financial review
43
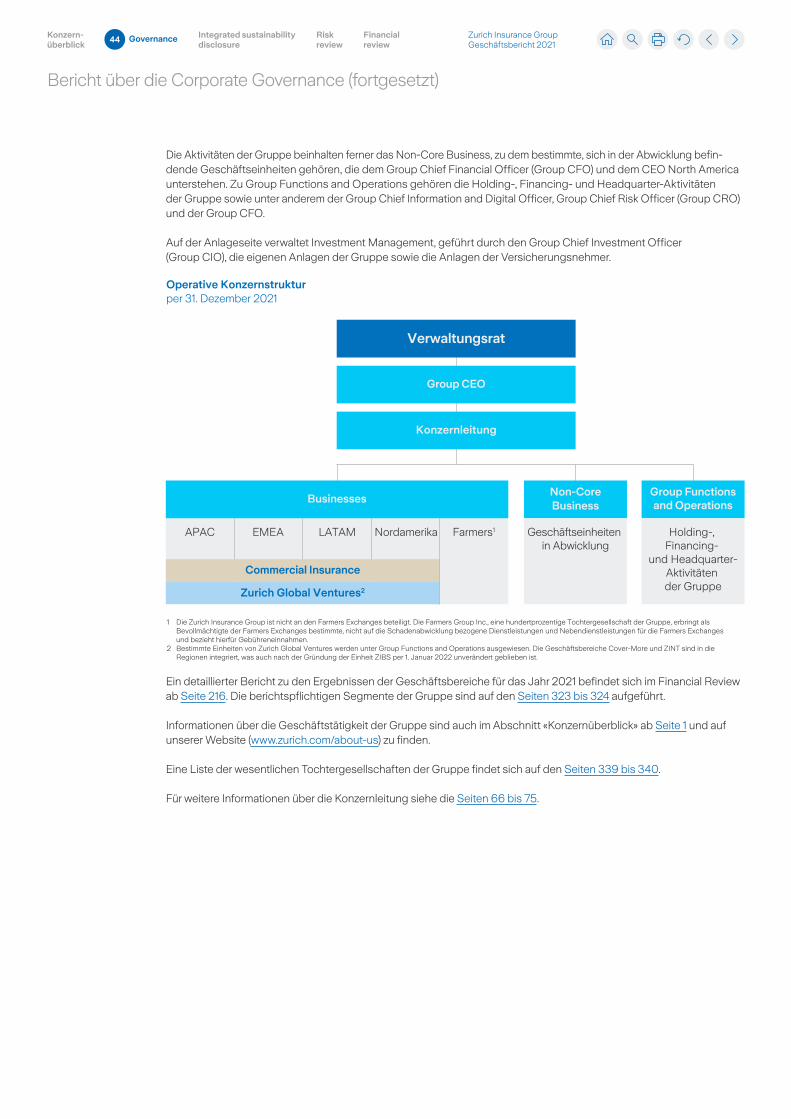
Bericht über die Corporate Governance (fortgesetzt)
Die Aktivitäten der Gruppe beinhalten ferner das NonCore Business, zu dem bestimmte, sich in der Abwicklung befindende Geschäftseinheiten gehören, die dem Group Chief Financial Officer (Group CFO) und dem CEO North America unterstehen. Zu Group Functions and Operations gehören die Holding, Financing und HeadquarterAktivitäten der Gruppe sowie unter anderem der Group Chief Information and Digital Officer, Group Chief Risk Officer (Group CRO) und der Group CFO.
Auf der Anlageseite verwaltet Investment Management, geführt durch den Group Chief Investment Officer (Group CIO), die eigenen Anlagen der Gruppe sowie die Anlagen der Versicherungsnehmer.
Verwaltungsrat
Group CEO
Konzernleitung
Group Functionsand Operations
Non-CoreBusiness
Businesses
Operative Konzernstruktur per 31. Dezember 2021
Holding-, Financing-
und Headquarter-Aktivitäten der Gruppe
Geschäftseinheiten in Abwicklung
Farmers1NordamerikaLATAMAPAC EMEA
Commercial Insurance
Zurich Global Ventures2
1 Die Zurich Insurance Group ist nicht an den Farmers Exchanges beteiligt. Die Farmers Group Inc., eine hundertprozentige Tochtergesellschaft der Gruppe, erbringt als Bevollmächtigte der Farmers Exchanges bestimmte, nicht auf die Schadenabwicklung bezogene Dienstleistungen und Nebendienstleistungen für die Farmers Exchanges und bezieht hierfür Gebühreneinnahmen.2 Bestimmte Einheiten von Zurich Global Ventures werden unter Group Functions and Operations ausgewiesen. Die Geschäftsbereiche Cover-More und ZINT sind in die Regionen integriert, was auch nach der Gründung der Einheit ZIBS per 1. Januar 2022 unverändert geblieben ist.
Ein detaillierter Bericht zu den Ergebnissen der Geschäftsbereiche für das Jahr 2021 befindet sich im Financial Review ab Seite 216. Die berichtspflichtigen Segmente der Gruppe sind auf den Seiten 323 bis 324 aufgeführt.
Informationen über die Geschäftstätigkeit der Gruppe sind auch im Abschnitt «Konzernüberblick» ab Seite 1 und auf unserer Website (www.zurich.com/aboutus) zu finden.
Eine Liste der wesentlichen Tochtergesellschaften der Gruppe findet sich auf den Seiten 339 bis 340.
Für weitere Informationen über die Konzernleitung siehe die Seiten 66 bis 75.
Zurich Insurance Group Geschäftsbericht 2021
Konzern-überblick
Integrated sustainability disclosure
Governance Risk review
Financial review
44
Bericht über die Corporate Governance (fortgesetzt)
Kapitalstruktur
Aktienkapital und AktienDie Aktien der Zurich Insurance Group AG (ZIG) sind an der Schweizer Börse SIX Swiss Exchange (ISIN: CH0011075394, Kürzel: ZURN) kotiert. Des Weiteren sind Schuldtitel im Rahmen des EuroMediumTermNote Programms und andere Finanzinstrumente verschiedener Konzerngesellschaften börsenkotiert.
Per 31. Dezember 2021 betrug das ordentliche Aktienkapital von ZIG CHF 15’046’016.70, aufgeteilt in 150’460’167 voll liberierte Namenaktien mit einem Nennwert von je CHF 0.10. Die Marktkapitalisierung per 31. Dezember 2021 betrug CHF 60’244’250’867.
ZIG verfügt über ein American Depositary Receipt (ADR) Level1Programm bei der Bank of New York Mellon (BNYM).1 Per 31. Dezember 2021 hielten Anleger 23’343’430 ADRs (dies entspricht 2’334’343 Aktien von ZIG).
Für Informationen über eigene Aktien siehe Seite 294. Weitere Informationen über die Aktien von ZIG finden Sie auch unter: www.zurich.com/investorrelations/ourshares.
Genehmigtes und bedingtes AktienkapitalAm 7. April 2021 genehmigte die Generalversammlung eine Erneuerung des genehmigten Aktienkapitals um weitere zwei Jahre (von April 2021 bis 7. April 2023). Bis und mit 7. April 2023 ist der Verwaltungsrat berechtigt, das Aktienkapital durch Ausgabe von höchstens 44’882’400 voll zu liberierenden Namenaktien im Nennwert von je CHF 0.10 um höchstens CHF 4’488’240 zu erhöhen (Art. 5bis). Dieses genehmigte Aktienkapital entspricht etwa 30% der per 31. Dezember 2021 insgesamt ausgegebenen Namenaktien. Aktienemissionen aus dem genehmigten Aktienkapital, bei denen die Bezugsrechte der Aktionäre eingeschränkt oder ausgeschlossen sind, sind auf 14’960’800 Aktien begrenzt (also rund 10% der gesamten per 31. Dezember 2021 ausgegebenen Namenaktien).
ZIG kann das Aktienkapital zudem durch die Ausgabe von höchstens 29’921’600 voll zu liberierenden Namenaktien im Nennwert von je CHF 0.10 um höchstens CHF 2’992’160 erhöhen – durch freiwillige oder zwangsweise Ausübung von Wandel und/oder Optionsrechten, welche in Verbindung mit Darlehen, Anleihen oder ähnlichen Schuldinstrumenten, aktiengebundenen Finanzinstrumenten oder anderen Finanzmarktinstrumenten (zusammen «Finanzinstrumente») von ZIG oder einer ihrer Konzerngesellschaften eingeräumt werden, oder durch zwangsweise Wandlung von Finanzinstrumenten von ZIG oder einer ihrer Konzerngesellschaften, welche eine bedingte zwangsweise Umwandlung in Aktien der ZIG erlauben, oder durch Ausübung von Optionsrechten, welche den Aktionären eingeräumt werden (Art. 5ter Abs. 1a). Dieses bedingte Aktienkapital entspricht etwa 20% der per 31. Dezember 2021 insgesamt ausgegebenen Namenaktien.
Bis und mit 7. April 2023 darf die Gesamtzahl der neuen Aktien, welche (i) aus genehmigtem Aktienkapital gemäss Art. 5bis Abs. 4 der Statuten unter Beschränkung oder Aufhebung der Bezugsrechte und (ii) aus bedingtem Aktienkapital im Zusammenhang mit Finanzinstrumenten gemäss Art. 5ter Abs. 1 unter Beschränkung oder Aufhebung der Vorwegzeichnungsrechte ausgegeben werden, 14’960’800 neue Aktien nicht überschreiten (also rund 10% der per 31. Dezember 2021 insgesamt ausgegebenen Namenaktien).
Das Unternehmen verfügt zudem über weiteres bedingtes Aktienkapital (Art. 5ter Abs. 2a) in Höhe von CHF 409’509.20 bzw. über 4’095’092 voll zu liberierende Namenaktien mit einem Nennwert von je CHF 0.10, die an Mitarbeitende von ZIG oder einer ihrer Konzerngesellschaften ausgegeben werden können. Dieses bedingte Aktienkapital entspricht etwa 2,7% der per 31. Dezember 2021 insgesamt ausgegebenen Namenaktien.
Für weitere Informationen siehe Art. 5bis und 5ter der Statuten (www.zurich.com/dede/investorrelations/ourshares/ articlesofassociation) und Erläuterung 19 auf den Seiten 293 bis 295 der geprüften konsolidierten Jahresrechnung.
1 Im Rahmen dieses Programms gibt die BNYM American Depositary Shares (ADSs) aus. Jede ADS repräsentiert das Recht auf den Erhalt eines Zehntels einer Aktie von ZIG. ADSs von ZIG werden ausserbörslich (OTC) gehandelt und durch American Depositary Receipts (ADRs) nachgewiesen. Seit dem 1. Juli 2010 werden die ADRs von ZIG unter dem Kürzel ZURVY an der «OTCQX», einer elektronischen Plattform, die von OTC Markets Group, Inc. betrieben wird, gehandelt. ADSInhaber werden nicht als Aktionäre von ZIG behandelt und sind nicht in der Lage, Aktionärsrechte direkt durchzusetzen oder auszuüben. Nur die BNYM als Depositary des Level1Programms kann Stimmrechte gemäss Weisungen ausüben, die sie von den wirtschaftlich Berechtigten der ADRs erhält.
Zurich Insurance Group Geschäftsbericht 2021
Konzern-überblick
Integrated sustainability disclosure
Governance Risk review
Financial review
45
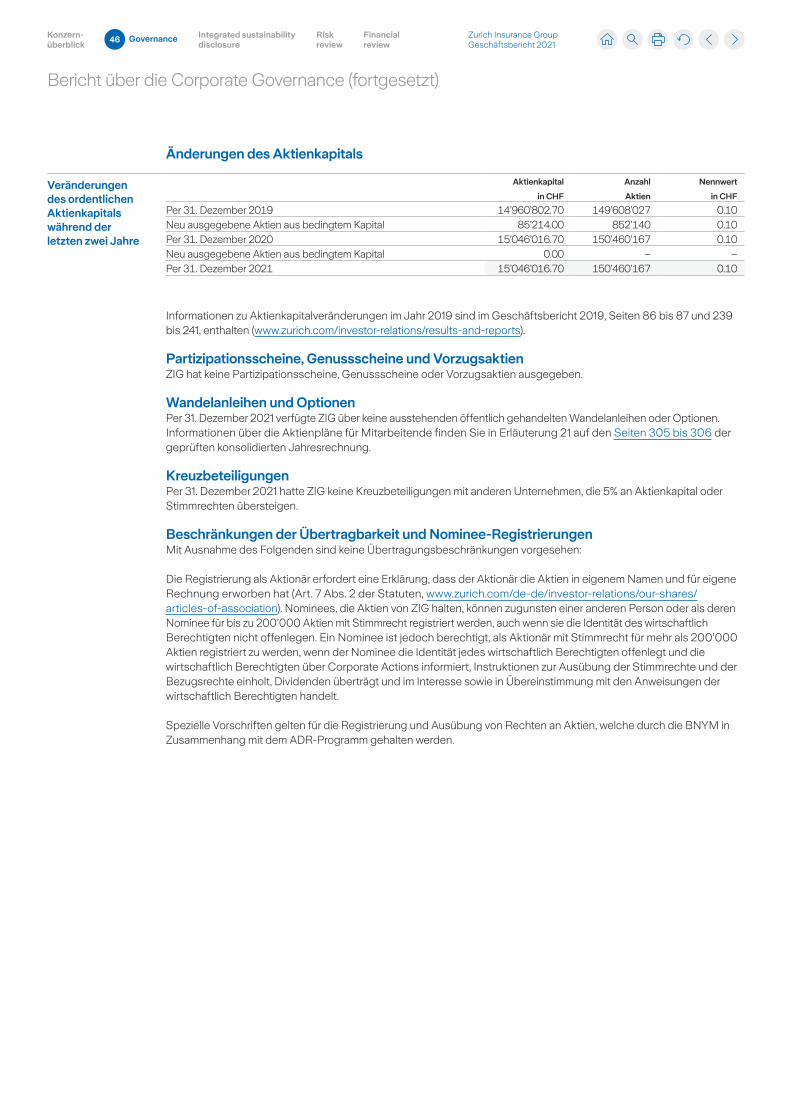
Bericht über die Corporate Governance (fortgesetzt)
Änderungen des Aktienkapitals
Veränderungen des ordentlichen Aktienkapitals während der letzten zwei Jahre
Aktienkapital
in CHF
Anzahl
Aktien
Nennwert
in CHF
Per 31. Dezember 2019 14’960’802.70 149’608’027 0.10Neu ausgegebene Aktien aus bedingtem Kapital 85’214.00 852’140 0.10Per 31. Dezember 2020 15’046’016.70 150’460’167 0.10Neu ausgegebene Aktien aus bedingtem Kapital 0.00 – –Per 31. Dezember 2021 15’046’016.70 150’460’167 0.10
Informationen zu Aktienkapitalveränderungen im Jahr 2019 sind im Geschäftsbericht 2019, Seiten 86 bis 87 und 239 bis 241, enthalten (www.zurich.com/investorrelations/resultsandreports).
Partizipationsscheine, Genussscheine und Vorzugsaktien ZIG hat keine Partizipationsscheine, Genussscheine oder Vorzugsaktien ausgegeben.
Wandelanleihen und OptionenPer 31. Dezember 2021 verfügte ZIG über keine ausstehenden öffentlich gehandelten Wandelanleihen oder Optionen. Informationen über die Aktienpläne für Mitarbeitende finden Sie in Erläuterung 21 auf den Seiten 305 bis 306 der geprüften konsolidierten Jahresrechnung.
KreuzbeteiligungenPer 31. Dezember 2021 hatte ZIG keine Kreuzbeteiligungen mit anderen Unternehmen, die 5% an Aktienkapital oder Stimmrechten übersteigen.
Beschränkungen der Übertragbarkeit und Nominee-RegistrierungenMit Ausnahme des Folgenden sind keine Übertragungsbeschränkungen vorgesehen:
Die Registrierung als Aktionär erfordert eine Erklärung, dass der Aktionär die Aktien in eigenem Namen und für eigene Rechnung erworben hat (Art. 7 Abs. 2 der Statuten, www.zurich.com/dede/investorrelations/ourshares/ articlesofassociation). Nominees, die Aktien von ZIG halten, können zugunsten einer anderen Person oder als deren Nominee für bis zu 200’000 Aktien mit Stimmrecht registriert werden, auch wenn sie die Identität des wirtschaftlich Berechtigten nicht offenlegen. Ein Nominee ist jedoch berechtigt, als Aktionär mit Stimmrecht für mehr als 200’000 Aktien registriert zu werden, wenn der Nominee die Identität jedes wirtschaftlich Berechtigten offenlegt und die wirtschaftlich Berechtigten über Corporate Actions informiert, Instruktionen zur Ausübung der Stimmrechte und der Bezugsrechte einholt, Dividenden überträgt und im Interesse sowie in Übereinstimmung mit den Anweisungen der wirtschaftlich Berechtigten handelt.
Spezielle Vorschriften gelten für die Registrierung und Ausübung von Rechten an Aktien, welche durch die BNYM in Zusammenhang mit dem ADRProgramm gehalten werden.
Zurich Insurance Group Geschäftsbericht 2021
Konzern-überblick
Integrated sustainability disclosure
Governance Risk review
Financial review
46
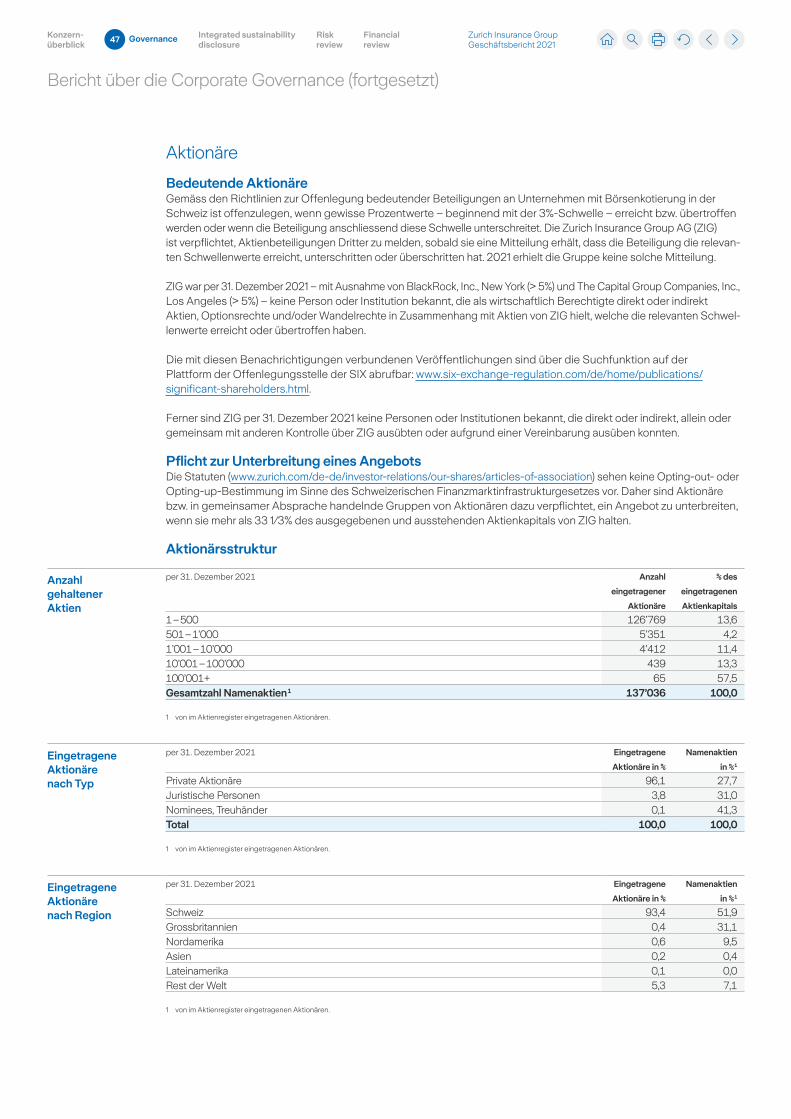
Bericht über die Corporate Governance (fortgesetzt)
Aktionäre
Bedeutende AktionäreGemäss den Richtlinien zur Offenlegung bedeutender Beteiligungen an Unternehmen mit Börsenkotierung in der Schweiz ist offenzulegen, wenn gewisse Prozentwerte – beginnend mit der 3%Schwelle – erreicht bzw. übertroffen werden oder wenn die Beteiligung anschliessend diese Schwelle unterschreitet. Die Zurich Insurance Group AG (ZIG) ist verpflichtet, Aktienbeteiligungen Dritter zu melden, sobald sie eine Mitteilung erhält, dass die Beteiligung die relevanten Schwellenwerte erreicht, unterschritten oder überschritten hat. 2021 erhielt die Gruppe keine solche Mitteilung.
ZIG war per 31. Dezember 2021 – mit Ausnahme von BlackRock, Inc., New York (> 5%) und The Capital Group Companies, Inc., Los Angeles (> 5%) – keine Person oder Institution bekannt, die als wirtschaftlich Berechtigte direkt oder indirekt Aktien, Optionsrechte und/oder Wandelrechte in Zusammenhang mit Aktien von ZIG hielt, welche die relevanten Schwellenwerte erreicht oder übertroffen haben.
Die mit diesen Benachrichtigungen verbundenen Veröffentlichungen sind über die Suchfunktion auf der Plattform der Offenlegungsstelle der SIX abrufbar: www.sixexchangeregulation.com/de/home/publications/ significantshareholders.html.
Ferner sind ZIG per 31. Dezember 2021 keine Personen oder Institutionen bekannt, die direkt oder indirekt, allein oder gemeinsam mit anderen Kontrolle über ZIG ausübten oder aufgrund einer Vereinbarung ausüben konnten.
Pflicht zur Unterbreitung eines AngebotsDie Statuten (www.zurich.com/dede/investorrelations/ourshares/articlesofassociation) sehen keine Optingout oder OptingupBestimmung im Sinne des Schweizerischen Finanzmarktinfrastrukturgesetzes vor. Daher sind Aktionäre bzw. in gemeinsamer Absprache handelnde Gruppen von Aktionären dazu verpflichtet, ein Angebot zu unterbreiten, wenn sie mehr als 33 1⁄3% des ausgegebenen und ausstehenden Aktienkapitals von ZIG halten.
Aktionärsstruktur
Anzahl gehaltener Aktien
per 31. Dezember 2021 Anzahl
eingetragener
Aktionäre
% des
eingetragenen
Aktienkapitals
1 – 500 126’769 13,6501 – 1’000 5’351 4,21’001 – 10’000 4’412 11,410’001 – 100’000 439 13,3100’001+ 65 57,5Gesamtzahl Namenaktien 1 137’036 100,0
1 von im Aktienregister eingetragenen Aktionären.
Eingetragene Aktionäre nach Typ
per 31. Dezember 2021 Eingetragene
Aktionäre in %
Namenaktien
in % 1
Private Aktionäre 96,1 27,7Juristische Personen 3,8 31,0Nominees, Treuhänder 0,1 41,3Total 100,0 100,0
1 von im Aktienregister eingetragenen Aktionären.
Eingetragene Aktionäre nach Region
per 31. Dezember 2021 Eingetragene
Aktionäre in %
Namenaktien
in % 1
Schweiz 93,4 51,9Grossbritannien 0,4 31,1Nordamerika 0,6 9,5Asien 0,2 0,4Lateinamerika 0,1 0,0Rest der Welt 5,3 7,1
1 von im Aktienregister eingetragenen Aktionären.
Zurich Insurance Group Geschäftsbericht 2021
Konzern-überblick
Integrated sustainability disclosure
Governance Risk review
Financial review
47
Bericht über die Corporate Governance (fortgesetzt)
Rechte der AktionäreÜberblickGemäss Art. 14 der Statuten (www.zurich.com/dede/investorrelations/ourshares/articlesofassociation) berechtigt jede im Aktienregister eingetragene Aktie den Inhaber zu einer Stimme an der Generalversammlung und zur Ausübung aller übrigen mit einer solchen Aktie verbundenen Mitgliedschaftsrechte. Jede Aktie verleiht den Aktionären einen Anspruch auf Dividendenzahlungen (mit Ausnahme von eigenen Aktien). Der Verwaltungsrat wird den Aktionären anlässlich der Generalversammlung vom 6. April 2022 eine Dividende von CHF 22 je Aktie vorschlagen.
Stimmrechtsbeschränkungen und -vertretungenEs gibt keine Stimmrechtsbeschränkungen (ausser den unter «Beschränkungen der Übertragbarkeit und NomineeRegistrierungen» aufgeführten Beschränkungen, siehe Seite 46).
Ein stimmberechtigter Aktionär kann persönlich an der Generalversammlung teilnehmen oder seinen gesetzlichen Vertreter, eine andere Person, die nicht Aktionär sein muss, oder den unabhängigen Stimmrechtsvertreter bevollmächtigen. Sowohl schriftlich als auch über die OnlinePlattform der Computershare Schweiz AG können die Aktionäre ihre Zutrittskarte bestellen oder einen Vertreter bevollmächtigen.
Die Generalversammlung wählt den unabhängigen Stimmrechtsvertreter für eine Amtsdauer bis zum Abschluss der nächsten Generalversammlung. Der unabhängige Stimmrechtsvertreter kann wiedergewählt werden.
Die ZIG informiert zu Beginn der Generalversammlung in der Regel alle Aktionäre über die Gesamtzahl der durch Aktionäre oder ihre Vertreter, die physisch an der Versammlung teilnehmen, vertretenen Aktien und die Gesamtzahl der durch den unabhängigen Stimmrechtsvertreter vertretenen Aktien. Gemäss der Schweizer Gesetzgebung, die im Zuge der COVID19Pandemie erlassen wurde, hatte ZIG jedoch beschlossen, dass die Aktionäre nicht persönlich an der Generalversammlung vom 7. April 2021 teilnehmen, sondern ihre Stimmrechte nur durch schriftliche oder elektronische Weisungen an den unabhängigen Stimmrechtsvertreter ausüben konnten. ZIG hat ihre eingetragenen Aktionäre entsprechend informiert.
Statutarische QuorenGemäss Art. 15 der Statuten (www.zurich.com/dede/investorrelations/ourshares/articlesofassociation) ist die Generalversammlung unabhängig von der Anzahl der anwesenden Aktionäre und der vertretenen Aktien beschlussfähig. Beschlüsse und Wahlen erfordern die Zustimmung einer absoluten Mehrheit der vertretenen Stimmen, es sei denn, die Statuten (was derzeit jedoch nicht der Fall ist) oder zwingende gesetzliche Bestimmungen sähen eine andere Regelung vor. Gemäss Art. 704 des Schweizerischen Obligationenrechts sind zwei Drittel der vertretenen Stimmen und die absolute Mehrheit der vertretenen Aktiennennwerte für bestimmte wichtige Beschlüsse erforderlich, wie beispielsweise eine Änderung des Gesellschaftszwecks oder des Gesellschaftssitzes, die Auflösung der Gesellschaft sowie gewisse Anträge im Zusammenhang mit Kapitalerhöhungen.
Einberufung der GeneralversammlungGeneralversammlungen werden vom Verwaltungsrat einberufen oder, falls erforderlich, von der externen Revisionsstelle und anderen Organen nach Massgabe der Art. 699 und 700 des Schweizerischen Obligationenrechts. Aktionäre mit Stimmrecht, die zusammen mindestens 10% des Aktienkapitals halten, können, unter Angabe der Verhandlungsgegenstände und der damit zusammenhängenden Anträge, eine Generalversammlung einberufen. Die Einladung an die eingetragenen Aktionäre erfolgt mindestens 20 Kalendertage vor der Generalversammlung per Post und wird zusätzlich im Schweizerischen Handelsamtsblatt veröffentlicht.
TraktandenlisteDer Verwaltungsrat ist für die Festlegung der Traktandenliste verantwortlich. Aktionäre mit Stimmrecht, die zusammen Aktien im Nennwert von mindestens CHF 10’000 vertreten, können schriftlich bis spätestens 45 Tage vor der Generalversammlung die Traktandierung bestimmter Themen verlangen. Ein solches Begehren muss schriftlich gestellt werden und die entsprechenden Anträge enthalten.
Eintragungen in das Aktienbuch Um ein ordnungsgemässes Verfahren sicherzustellen, legt der Verwaltungsrat einen Stichtag fest, an dem die Aktionäre im Aktienbuch eingetragen sein müssen, um an der Generalversammlung teilnehmen zu können. Der Stichtag wird zusammen mit der Einladung zur Generalversammlung im Schweizerischen Handelsamtsblatt veröffentlicht.
Zurich Insurance Group Geschäftsbericht 2021
Konzern-überblick
Integrated sustainability disclosure
Governance Risk review
Financial review
48

DIESE SEITE WURDE ABSICHTLICH FREI GELASSEN
Zurich Insurance Group Geschäftsbericht 2021
Konzern-überblick
Integrated sustainability disclosure
Governance Risk review
Financial review
49
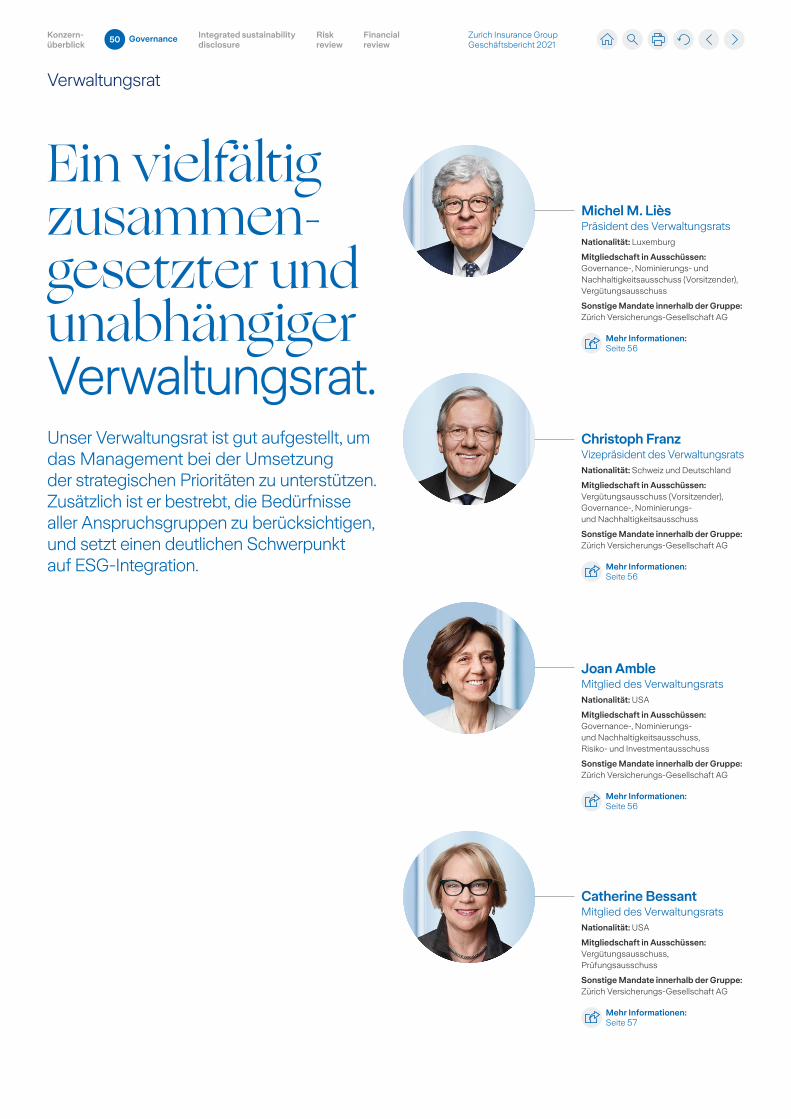
Verwaltungsrat
Verwaltungsrat
Michel M. LièsPräsident des VerwaltungsratsNationalität: Luxemburg
Mitgliedschaft in Ausschüssen:Governance, Nominierungs und Nachhaltigkeitsausschuss (Vorsitzender), Vergütungsausschuss
Sonstige Mandate innerhalb der Gruppe:Zürich VersicherungsGesellschaft AG
Mehr Informationen:Seite 56
Joan AmbleMitglied des VerwaltungsratsNationalität: USA
Mitgliedschaft in Ausschüssen:Governance, Nominierungs und Nachhaltigkeitsausschuss, Risiko und Investmentausschuss
Sonstige Mandate innerhalb der Gruppe:Zürich VersicherungsGesellschaft AG
Mehr Informationen:Seite 56
Christoph FranzVizepräsident des VerwaltungsratsNationalität: Schweiz und Deutschland
Mitgliedschaft in Ausschüssen:Vergütungsausschuss (Vorsitzender), Governance, Nominierungs und Nachhaltigkeitsausschuss
Sonstige Mandate innerhalb der Gruppe:Zürich VersicherungsGesellschaft AG
Mehr Informationen:Seite 56
Catherine BessantMitglied des VerwaltungsratsNationalität: USA
Mitgliedschaft in Ausschüssen:Vergütungsausschuss, Prüfungsausschuss
Sonstige Mandate innerhalb der Gruppe:Zürich VersicherungsGesellschaft AG
Mehr Informationen:Seite 57
Ein vielfältig zusammengesetzter und unabhängiger Verwaltungsrat.Unser Verwaltungsrat ist gut aufgestellt, um das Management bei der Umsetzung der strategischen Prioritäten zu unterstützen. Zusätzlich ist er bestrebt, die Bedürfnisse aller Anspruchsgruppen zu berücksichtigen, und setzt einen deutlichen Schwerpunkt auf ESGIntegration.
Zurich Insurance Group Geschäftsbericht 2021
Konzern-überblick
Integrated sustainability disclosure
Governance Risk review
Financial review
50
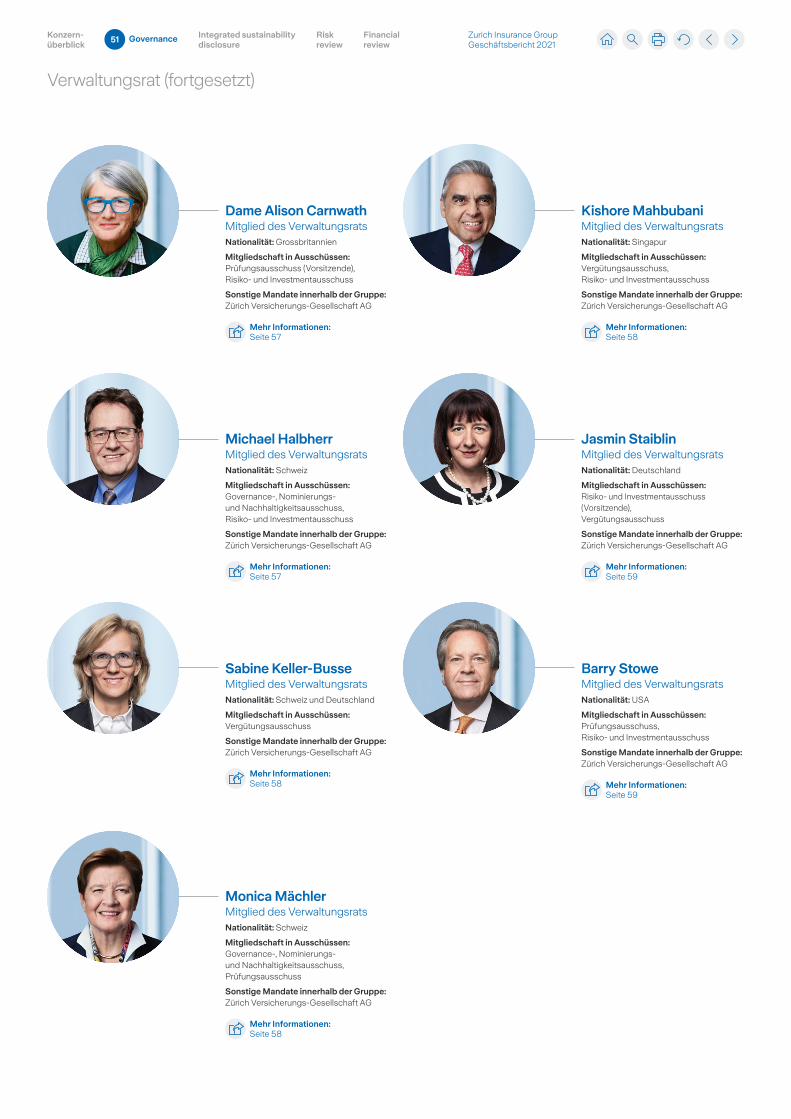
Verwaltungsrat (fortgesetzt)
Dame Alison CarnwathMitglied des VerwaltungsratsNationalität: Grossbritannien
Mitgliedschaft in Ausschüssen:Prüfungsausschuss (Vorsitzende), Risiko und Investmentausschuss
Sonstige Mandate innerhalb der Gruppe:Zürich VersicherungsGesellschaft AG
Mehr Informationen:Seite 57
Kishore MahbubaniMitglied des VerwaltungsratsNationalität: Singapur
Mitgliedschaft in Ausschüssen:Vergütungsausschuss, Risiko und Investmentausschuss
Sonstige Mandate innerhalb der Gruppe:Zürich VersicherungsGesellschaft AG
Mehr Informationen:Seite 58
Sabine Keller-BusseMitglied des VerwaltungsratsNationalität: Schweiz und Deutschland
Mitgliedschaft in Ausschüssen:Vergütungsausschuss
Sonstige Mandate innerhalb der Gruppe:Zürich VersicherungsGesellschaft AG
Mehr Informationen:Seite 58
Barry StoweMitglied des VerwaltungsratsNationalität: USA
Mitgliedschaft in Ausschüssen:Prüfungsausschuss, Risiko und Investmentausschuss
Sonstige Mandate innerhalb der Gruppe:Zürich VersicherungsGesellschaft AG
Mehr Informationen:Seite 59
Michael HalbherrMitglied des VerwaltungsratsNationalität: Schweiz
Mitgliedschaft in Ausschüssen:Governance, Nominierungs und Nachhaltigkeitsausschuss, Risiko und Investmentausschuss
Sonstige Mandate innerhalb der Gruppe:Zürich VersicherungsGesellschaft AG
Mehr Informationen:Seite 57
Jasmin StaiblinMitglied des VerwaltungsratsNationalität: Deutschland
Mitgliedschaft in Ausschüssen:Risiko und Investmentausschuss (Vorsitzende), Vergütungsausschuss
Sonstige Mandate innerhalb der Gruppe:Zürich VersicherungsGesellschaft AG
Mehr Informationen:Seite 59
Monica MächlerMitglied des VerwaltungsratsNationalität: Schweiz
Mitgliedschaft in Ausschüssen:Governance, Nominierungs und Nachhaltigkeitsausschuss, Prüfungsausschuss
Sonstige Mandate innerhalb der Gruppe:Zürich VersicherungsGesellschaft AG
Mehr Informationen:Seite 58
Zurich Insurance Group Geschäftsbericht 2021
Konzern-überblick
Integrated sustainability disclosure
Governance Risk review
Financial review
51
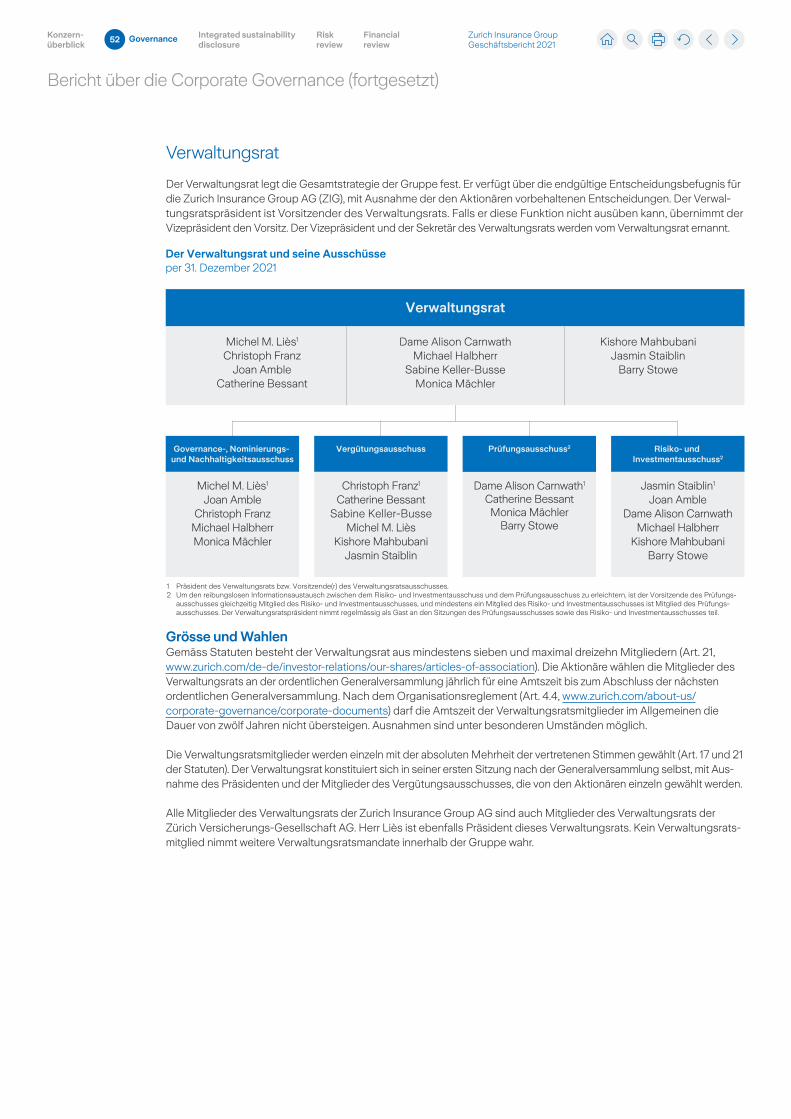
Bericht über die Corporate Governance (fortgesetzt)
Verwaltungsrat
Der Verwaltungsrat legt die Gesamtstrategie der Gruppe fest. Er verfügt über die endgültige Entscheidungsbefugnis für die Zurich Insurance Group AG (ZIG), mit Ausnahme der den Aktionären vorbehaltenen Entscheidungen. Der Verwaltungsratspräsident ist Vorsitzender des Verwaltungsrats. Falls er diese Funktion nicht ausüben kann, übernimmt der Vizepräsident den Vorsitz. Der Vizepräsident und der Sekretär des Verwaltungsrats werden vom Verwaltungsrat ernannt.
Grösse und WahlenGemäss Statuten besteht der Verwaltungsrat aus mindestens sieben und maximal dreizehn Mitgliedern (Art. 21, www.zurich.com/dede/investorrelations/ourshares/articlesofassociation). Die Aktionäre wählen die Mitglieder des Verwaltungsrats an der ordentlichen Generalversammlung jährlich für eine Amtszeit bis zum Abschluss der nächsten ordentlichen Generalversammlung. Nach dem Organisationsreglement (Art. 4.4, www.zurich.com/aboutus/ corporategovernance/corporatedocuments) darf die Amtszeit der Verwaltungsratsmitglieder im Allgemeinen die Dauer von zwölf Jahren nicht übersteigen. Ausnahmen sind unter besonderen Umständen möglich.
Die Verwaltungsratsmitglieder werden einzeln mit der absoluten Mehrheit der vertretenen Stimmen gewählt (Art. 17 und 21 der Statuten). Der Verwaltungsrat konstituiert sich in seiner ersten Sitzung nach der Generalversammlung selbst, mit Ausnahme des Präsidenten und der Mitglieder des Vergütungsausschusses, die von den Aktionären einzeln gewählt werden.
Alle Mitglieder des Verwaltungsrats der Zurich Insurance Group AG sind auch Mitglieder des Verwaltungsrats der Zürich VersicherungsGesellschaft AG. Herr Liès ist ebenfalls Präsident dieses Verwaltungsrats. Kein Verwaltungsratsmitglied nimmt weitere Verwaltungsratsmandate innerhalb der Gruppe wahr.
Der Verwaltungsrat und seine Ausschüsseper 31. Dezember 2021
Governance-, Nominierungs- und Nachhaltigkeitsausschuss
Vergütungsausschuss Prüfungsausschuss2 Risiko- und Investmentausschuss2
Michel M. Liès1
Joan AmbleChristoph Franz
Michael HalbherrMonica Mächler
Dame Alison Carnwath1
Catherine BessantMonica Mächler
Barry Stowe
Christoph Franz1
Catherine BessantSabine Keller-Busse
Michel M. LièsKishore Mahbubani
Jasmin Staiblin
Jasmin Staiblin1
Joan AmbleDame Alison Carnwath
Michael HalbherrKishore Mahbubani
Barry Stowe
1 Präsident des Verwaltungsrats bzw. Vorsitzende(r) des Verwaltungsratsausschusses.2 Um den reibungslosen Informationsaustausch zwischen dem Risiko- und Investmentausschuss und dem Prüfungsausschuss zu erleichtern, ist der Vorsitzende des Prüfungs- ausschusses gleichzeitig Mitglied des Risiko- und Investmentausschusses, und mindestens ein Mitglied des Risiko- und Investmentausschusses ist Mitglied des Prüfungs- ausschusses. Der Verwaltungsratspräsident nimmt regelmässig als Gast an den Sitzungen des Prüfungsausschusses sowie des Risiko- und Investmentausschusses teil.
Michel M. Liès1
Christoph FranzJoan Amble
Catherine Bessant
Dame Alison CarnwathMichael Halbherr
Sabine Keller-BusseMonica Mächler
Kishore MahbubaniJasmin Staiblin
Barry Stowe
Verwaltungsrat
Zurich Insurance Group Geschäftsbericht 2021
Konzern-überblick
Integrated sustainability disclosure
Governance Risk review
Financial review
52
Bericht über die Corporate Governance (fortgesetzt)
UnabhängigkeitFür Zurich ist die Unabhängigkeit der Verwaltungsratsmitglieder ein wesentliches Merkmal einer guten Corporate Governance. Die Unabhängigkeitskriterien von Zurich entsprechen den geltenden gesetzlichen Bestimmungen und richten sich nach BestPracticeStandards wie der Richtlinie betreffend Informationen zur Corporate Governance der SIX Exchange Regulation und dem Swiss Code of Best Practice. Der Governance, Nominierungs und Nachhaltigkeitsausschuss (GNSC) überprüft jährlich die Unabhängigkeit der Verwaltungsratsmitglieder und teilt seine Feststellun gen dem Verwaltungsrat mit, der für den finalen Entscheid zuständig ist. Der GNSC überprüft die Unabhängigkeitskriterien, bevor er ein neues Verwaltungsratsmitglied zur Wahl und danach jährlich zur Wiederwahl vorschlägt. Er bestätigt insbesondere, dass im Jahr 2021 und in den vergangenen drei Jahren:
– weder Verwaltungsratsmitglieder (ausser in ihrer Eigenschaft als Verwaltungsrats oder Ausschussmitglied) noch deren unmittelbare Familienmitglieder oder andere ihnen nahestehende Personen auf direktem oder indirektem Weg Beratungshonorare oder andere Vergütungen erhielten;
– weder Verwaltungsratsmitglieder noch deren unmittelbare Familienmitglieder bei einem Mitglied der Gruppe beschäftigt sind oder waren;
– kein Mitglied des Verwaltungsrats bei der externen Revisionsstelle beschäftigt oder mit ihr verbunden ist oder war;
– kein Mitglied des Verwaltungsrats in einer wesentlichen direkten oder indirekten Beziehung zu einem Mitglied der Gruppe stand.
Gemäss Empfehlung des GNSC bestimmte der Verwaltungsrat, dass er per 9. Februar 2022 ausschliesslich aus Mitgliedern bestand, die nicht mit der Geschäftsführung betraut und unabhängig vom Management waren. Weitere Informationen zu den Unabhängigkeitskriterien finden Sie in Art. 16.6 des Anhangs des Organisationsreglements (www.zurich.com/aboutus/corporategovernance/corporatedocuments). Für die Verwaltungsratsmitglieder gelten zudem die Vorschriften und Regeln zur Vermeidung von Interessenkonflikten und des Missbrauchs von Insiderinformationen.
NachfolgeplanungFür den Verwaltungsrat ist es von zentraler Bedeutung, dass er auch weiterhin seine strategische Funktion wahrnehmen kann, um Risiken und Chancen zu antizipieren und die Aufsicht und Kontrolle zu gewährleisten. Dabei spielt insbesondere die Bewahrung und Erhöhung der Vielfalt des Verwaltungsrats eine wichtige Rolle.
Zu diesem Zweck führt der Präsident mit Unterstützung des GNSC jährlich einen strukturierten Nachfolgeplanungsprozess durch, wobei die Herausforderungen und Chancen der Gruppe sowie die derzeit und in absehbarer Zukunft benötigten Fähigkeiten, Kenntnisse und Fachkenntnisse evaluiert werden. Im Jahr 2021 führte der GNSC eine spezielle Sitzungsfolge zur Besprechung all dieser Faktoren durch, und die Ergebnisse dieser Diskussionen flossen in einen Suchprozess ein, der von einer Personalberatungsfirma unterstützt wurde und Folgendes umfasste:
– endgültige Bestimmung des erforderlichen Hintergrunds, der Fähigkeiten und der Kenntnisse der möglichen Kandidaten;
– Identifizierung geeigneter Kandidaten;
– Gespräche der in die engere Wahl gekommenen Kandidaten mit dem Vorsitzenden und den Mitgliedern des GNSC;
– Vorschlag von Kandidaten durch den GNSC an den Verwaltungsrat zur Nominierung von Kandidaten für die Wahl durch die Aktionäre.
Im Rahmen dieses Prozesses legt der Verwaltungsrat bei der Identifizierung und dem Vorschlag von Kandidaten für neue Verwaltungsratsmitglieder besonderen Wert auf: Fähigkeiten, Fachwissen, Vielfalt und Hintergrund, das Zusammenspiel zwischen der individuellen Persönlichkeit, dem Fachwissen und der Erfahrung eines Kandidaten und derjenigen der amtierenden Verwaltungsratsmitglieder, hohe Werte und Integrität sowie die zeitliche Verfügbarkeit (für weitere Informationen siehe die Nominierungsgrundsätze in Art. 15 ff. des Anhangs des Organisationsreglements unter www.zurich.com/ aboutus/corporategovernance/corporatedocuments).
Zurich Insurance Group Geschäftsbericht 2021
Konzern-überblick
Integrated sustainability disclosure
Governance Risk review
Financial review
53
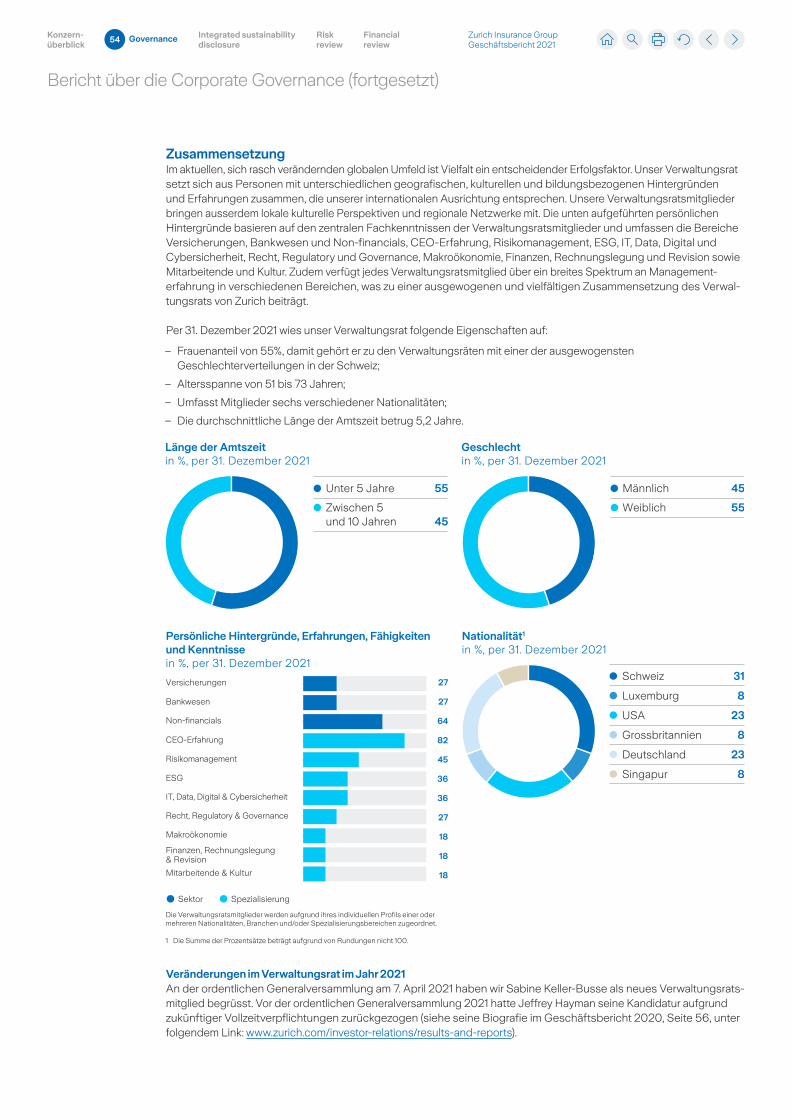
Bericht über die Corporate Governance (fortgesetzt)
Zusammensetzung Im aktuellen, sich rasch verändernden globalen Umfeld ist Vielfalt ein entscheidender Erfolgsfaktor. Unser Verwaltungsrat setzt sich aus Personen mit unterschiedlichen geografischen, kulturellen und bildungsbezogenen Hintergründen und Erfahrungen zusammen, die unserer internationalen Ausrichtung entsprechen. Unsere Verwaltungsratsmitglieder bringen ausserdem lokale kulturelle Perspektiven und regionale Netzwerke mit. Die unten aufgeführten persönlichen Hintergründe basieren auf den zentralen Fachkenntnissen der Verwaltungsratsmitglieder und umfassen die Bereiche Versicherungen, Bankwesen und Nonfinancials, CEOErfahrung, Risikomanagement, ESG, IT, Data, Digital und Cybersicherheit, Recht, Regulatory und Governance, Makroökonomie, Finanzen, Rechnungslegung und Revision sowie Mitarbeitende und Kultur. Zudem verfügt jedes Verwaltungsratsmitglied über ein breites Spektrum an Managementerfahrung in verschiedenen Bereichen, was zu einer ausgewogenen und vielfältigen Zusammensetzung des Verwaltungsrats von Zurich beiträgt.
Per 31. Dezember 2021 wies unser Verwaltungsrat folgende Eigenschaften auf:
– Frauenanteil von 55%, damit gehört er zu den Verwaltungsräten mit einer der ausgewogensten Geschlechterverteilungen in der Schweiz;
– Altersspanne von 51 bis 73 Jahren;
– Umfasst Mitglieder sechs verschiedener Nationalitäten;
– Die durchschnittliche Länge der Amtszeit betrug 5,2 Jahre.
Veränderungen im Verwaltungsrat im Jahr 2021An der ordentlichen Generalversammlung am 7. April 2021 haben wir Sabine KellerBusse als neues Verwaltungsratsmitglied begrüsst. Vor der ordentlichen Generalversammlung 2021 hatte Jeffrey Hayman seine Kandidatur aufgrund zukünftiger Vollzeitverpflichtungen zurückgezogen (siehe seine Biografie im Geschäftsbericht 2020, Seite 56, unter folgendem Link: www.zurich.com/investorrelations/resultsandreports).
Länge der Amtszeitin %, per 31. Dezember 2021
Unter 5 Jahre 55
Zwischen 5 und 10 Jahren 45
Geschlechtin %, per 31. Dezember 2021
Männlich 45
Weiblich 55
Nationalität1
in %, per 31. Dezember 2021
Schweiz 31
Luxemburg 8
USA 23
Grossbritannien 8
Deutschland 23
Singapur 8
Die Verwaltungsratsmitglieder werden aufgrund ihres individuellen Profils einer oder mehreren Nationalitäten, Branchen und/oder Spezialisierungsbereichen zugeordnet.
1 Die Summe der Prozentsätze beträgt aufgrund von Rundungen nicht 100.
Persönliche Hintergründe, Erfahrungen, Fähigkeiten und Kenntnissein %, per 31. Dezember 2021
Versicherungen
Bankwesen
Non-financials
CEO-Erfahrung
Risikomanagement
ESG
IT, Data, Digital & Cybersicherheit
Recht, Regulatory & Governance
Makroökonomie
Finanzen, Rechnungslegung & Revision
Mitarbeitende & Kultur
27
27
64
82
45
36
36
27
18
18
18
Sektor Spezialisierung
Zurich Insurance Group Geschäftsbericht 2021
Konzern-überblick
Integrated sustainability disclosure
Governance Risk review
Financial review
54

DIESE SEITE WURDE ABSICHTLICH FREI GELASSEN
Zurich Insurance Group Geschäftsbericht 2021
Konzern-überblick
Integrated sustainability disclosure
Governance Risk review
Financial review
55
Bericht über die Corporate Governance (fortgesetzt)
Michel M. LièsPräsident des Verwaltungsrats
Jahrgang: 1954
Fähigkeiten und ErfahrungMichel M. Liès verfügt über eine 40jährige Erfahrung im weltweiten Versicherungs, Rückversicherungs, Lebensversicherungs, Schaden und Unfallversicherungsgeschäft. Er hat eine Vielzahl von Positionen in der Versicherungsindustrie bekleidet, darunter die des Group Chief Executive Officer von Swiss Re. Er begann seine Karriere beim Rückver sicherer im Jahr 1978, wobei er zunächst für den Bereich Leben in Lateinamerika tätig war und 1983 nach Europa wechselte. Hier hatte er eine Reihe von leitenden Positionen im Lebensversicherungsgeschäft von Swiss Re inne. Im Jahr 1994 trat er in den Nichtlebenbereich von Swiss Re ein, wo er für Südeuropa und Lateinamerika verantwortlich war. Von 1998 bis 2000 fungierte Herr Liès als Leiter der Division Lateinamerika. Er wurde 2000 Leiter der Division Europa für das Schaden und Unfallversicherungsgeschäft der Gruppe. 2005 wurde er Head Client Markets von Swiss Re, wo er für die weltweiten Kundenbeziehungen verantwortlich war. Ausserdem wurde er zum Mitglied der Konzernleitung des Rückversicherers ernannt. Von 2011 bis 2012 war Herr Liès Chairman of Global Partnerships von Swiss Re. Dieses Gremium arbeitet mit Regierungen, internationalen Entwicklungseinrichtungen und Nichtregierungsorganisationen zusammen, um globale Risiken anzugehen, einzudämmen und die Widerstandsfähigkeit zu verbessern. Im Februar 2012 wurde er zum Group CEO von Swiss Re ernannt und bekleidete diese Position bis zu seiner Pensionierung im Jahr 2016. Seit April 2018 ist er Verwaltungsratspräsident der Zurich Insurance Group AG und der Zürich VersicherungsGesellschaft AG.
Mitgliedschaft in AusschüssenGovernance, Nominierungs und Nachhaltigkeitsausschuss (Vorsitzender), Vergütungsausschuss
Sonstige Mandate innerhalb der Gruppe Zürich VersicherungsGesellschaft AG
Externe ErnennungenHerr Liès ist Präsident des Stiftungsrats von Avenir Suisse, Mitglied des Leitungsgremiums des Verwaltungsrats (stellvertretender Vorsitzender Versicherungen) des Institute of International Finance (IIF) und Mitglied des Stiftungsrats des Schweizerischen Instituts für Auslandforschung. Des Weiteren ist er Mitglied des European Financial Services Round Table und Stiftungsratsmitglied des Lucerne Festival sowie stellvertretender Vorsitzender des Leitungsausschusses des Insurance Development Forum.
AusbildungHerr Liès hat einen Master in Mathematik der Eidgenössischen Technischen Hochschule (ETH) in Zürich. Er absolvierte 1991 das Stanford Executive Program an der Stanford University, USA und schloss 1996 das Senior Executive Program an der Harvard University, USA, ab.
Christoph FranzVizepräsident des Verwaltungsrats
Jahrgang: 1960
Fähigkeiten und ErfahrungChristoph Franz begann seine berufliche Karriere 1990 bei der Deutschen Lufthansa AG. Von 1994 bis 2003 übte er verschiedene Führungsfunktionen bei der Deutschen Bahn AG aus, u.a. als Vorstandsmitglied und als CEO der Division Personenverkehr. 2004 übernahm er die CEOPosition bei Swiss International Air Lines AG. 2009 wurde er zum Stellvertreter des Vorstandsvorsitzenden der Deutschen Lufthansa AG und zum CEO Passenger Airlines befördert. Von 2011 bis 2014 war er Vorstandsvorsitzender und CEO der Deutschen Lufthansa AG. Seit April 2014 ist er Mitglied der Verwaltungsräte der Zurich Insurance Group AG und der Zürich VersicherungsGesellschaft AG. Im April 2018 wurde er zum Vizepräsidenten des Verwaltungsrats gewählt.
Mitgliedschaft in AusschüssenVergütungsausschuss (Vorsitzender), Governance, Nominierungs und Nachhaltigkeitsausschuss
Sonstige Mandate innerhalb der Gruppe Zürich VersicherungsGesellschaft AG
Externe ErnennungenIm März 2014 wurde Herr Franz zum Verwaltungsratspräsidenten von Roche Holding AG gewählt. Er ist darüber hinaus Mitglied des Verwaltungsrats von Chugai Pharmaceuticals Ltd. (kontrolliert durch Roche Holding AG) sowie von Stadler Rail AG. Des Weiteren ist Herr Franz Mitglied der Stiftungsräte der Ernst Goehner Stiftung, von Avenir Suisse, der Schweizerischen Studienstiftung und des Lucerne Festival sowie Mitglied des Beirats der Universität St.Gallen (HSG). Er wurde im Mai 2017 zum Honorarprofessor für Betriebswirtschaftslehre an der Universität St.Gallen ernannt. Im September 2017 wurde Herr Franz zum Mitglied der Versammlung des Internationalen Komitees vom Roten Kreuz (IKRK) gewählt, dem übergeordneten Organ der Organisation, zusätzlich wurde er im Mai 2018 in den Rat der Versammlung gewählt.
AusbildungHerr Franz studierte Wirtschaftsingenieurwesen an der Technischen Universität Darmstadt und schloss sein Studium, ebenfalls an dieser Universität, mit einem Doktor der Wirtschafts und Sozialwissenschaften (Dr. rer. pol.) ab. Weiter studierte er an der École Centrale de Lyon und absolvierte einen Forschungsaufenthalt (postdoctorate) an der University of California, Berkeley.
Joan AmbleMitglied des Verwaltungsrats
Jahrgang: 1953
Fähigkeiten und ErfahrungJoan Amble verfügt über umfangreiche Erfahrungen in der Finanzbranche. Sie begann ihre Karriere 1977 als Buchhalterin bei Ernst & Ernst (heute Ernst & Young). Von 1984 bis 1989 arbeitete sie beim Financial Accounting Standards Board (FASB) und war spezialisiert auf Renten, Derivate und andere Finanzinstrumente. Danach war sie während 14 Jahren in verschiedenen Führungspositionen bei General Electric Company (GE) tätig. Dazu gehörten unter anderem: Chief Financial Officer (CFO) GE Real Estate, Chief Operating Officer und CFO GE Capital Markets sowie Vice President und Chief Accounting Officer von GE Financial Services. Von 2004 bis Mai 2011 war Frau Amble Executive Vice President und Principal Accounting Officer, anschliessend bis Ende 2011 Executive Vice President, Finance, bei American Express Company. Im Dezember 2011 endete ihre vierjährige Amtsdauer als Mitglied des Financial Accounting Standards Advisory Council (FASAC) und im Dezember 2020 beendete Frau Amble ihre zweite dreijährige Amtszeit als Mitglied der Standing Advisory Group (SAG) des Public Company Accounting Oversight Board (PCAOB). Von 2006 bis 2008 war sie Mitglied des Verwaltungsrates sowie Vorsitzende des Prüfungsausschusses von XM Satellite Radio. Nach dem Zusammenschluss von XM Satellite Radio mit Sirius Satellite Radio war sie von 2008 bis 2021 Mitglied im Verwaltungsrat von Sirius XM Satellite Radio und stand dem Prüfungsausschuss vor. Seit April 2015 ist sie Mitglied des Verwaltungsrats der Zurich Insurance Group AG und der Zürich VersicherungsGesellschaft AG.
Mitgliedschaft in Ausschüssen Governance, Nominierungs und Nachhaltigkeitsausschuss, Risiko und Investmentausschuss
Sonstige Mandate innerhalb der Gruppe Zürich VersicherungsGesellschaft AG
Externe ErnennungenFrau Amble ist Mitglied des Verwaltungsrats und des Prüfungsausschusses von Booz Allen Hamilton sowie Mitglied des Verwaltungsrats, Vorsitzende des Prüfungsausschusses und Mitglied des Nominierungs und Governanceausschusses von BuzzFeed Inc. Seit Oktober 2016 ist sie unabhängige Beraterin des Kontroll und Risikoausschusses der Geschäftsleitung der amerikanischen Tochtergesellschaft von Société Générale S.A., einer französischen multinationalen Bank und Finanzgesellschaft. Frau Amble engagiert sich ausserdem für die Förderung von Frauen im Berufsleben, unter anderem als emeritierte Präsidentin und Mitbegründerin der W.O.M.E.N. in America Inc., und hält verschiedene Vorträge dazu. Frau Amble nimmt ebenfalls an Verwaltungsrats und anderen Foren teil und referiert zum Thema Corporate Governance sowie Corporate Culture.
AusbildungFrau Amble schloss ihr Studium an der Pennsylvania State University mit einem Bachelor in Buchhaltung ab. Später erwarb sie einen Abschluss als Certified Public Accountant (derzeit inaktiv).
Biografien
Zurich Insurance Group Geschäftsbericht 2021
Konzern-überblick
Integrated sustainability disclosure
Governance Risk review
Financial review
56
Bericht über die Corporate Governance (fortgesetzt)
Catherine BessantMitglied des Verwaltungsrats
Jahrgang: 1960
Fähigkeiten und Erfahrung Catherine Bessant ist Vice Chair, Global Strategy sowie Mitglied der Geschäftsleitung der Bank of America. In dieser Funktion ist sie verantwortlich für die Zusammenarbeit mit den europäischen Verwaltungsräten der Bank of America und konzentriert sich auf die globale integrierte Strategie, Governance sowie die Beziehungen zu Kunden und Aufsichtsbehörden. Seit sie 1982 ihre Tätigkeit im Corporate Banking der Bank of America aufnahm, bekleidete sie verschiedene Führungspositionen innerhalb des Unternehmens: President of Global Product Solutions and Global Treasury Services, Chief Marketing Officer, President of Consumer Real Estate and Community Development Banking, National Small Business Segment Executive, Market President der Bank of America, Florida und President of Global Corporate Banking. Bevor sie ihre heutige Position übernahm, war Frau Bessant als Chief Operations and Technology Officer tätig. Sie leitete den Bereich Global Technology and Operations der Bank of America von 2010 bis September 2021. In dieser Funktion war sie unternehmensweit verantwortlich für EndtoEndTechnologie und operative Dienstleistungen sowie Bestrebungen für Geschäftskontinuität und Informationssicherheit für die fast 95’000 Mitarbeitenden und Auftragnehmer in über 35 Ländern. Als Anerkennung für ihre sektorübergreifende Führung wurde Frau Bessant im 2020 in die «Most Powerful Women in Banking Hall of Fame» von American Banker aufgenommen. Dies, nachdem sie drei Jahre in Folge die Nummer 1 der «25 Most Powerful Woman in Banking» war. Seit März 2017 ist sie Mitglied des Verwaltungsrats der Zurich Insurance Group AG und der Zürich Versicherungs Gesellschaft AG.
Mitgliedschaft in AusschüssenVergütungsausschuss, Prüfungsausschuss
Sonstige Mandate innerhalb der Gruppe Zürich VersicherungsGesellschaft AG
Externe ErnennungenFrau Bessant ist Verwaltungsratspräsidentin von USA Field Hockey und Mitglied des Advisory Board der Ross School of Business an der University of Michigan. Sie war 16 Jahre Mitglied des Verwaltungsrats von Florida Blue, früher Blue Cross and Blue Shield of Florida und war dort zudem Lead Independent Director.
AusbildungFrau Bessant schloss ihr Studium an der Ross School of Business der University of Michigan mit einem Bachelor of Business Administration ab.
Dame Alison CarnwathMitglied des Verwaltungsrats
Jahrgang: 1953
Fähigkeiten und Erfahrung Dame Alison Carnwath verfügt über umfangreiche Erfahrungen in der Finanzbranche. Sie begann ihre Karriere 1975 bei Peat Marwick Mitchell, jetzt KPMG, wo sie bis 1980 als Wirtschaftsprüferin arbeitete. Von 1980 bis 1982 arbeitete sie bei Lloyds Bank International als Finanzberaterin in Corporate Finance. Von 1982 bis 1993 war sie als Assistant Director und später Director bei J. Henry Schroder Wagg & Co in London und New York tätig. Von 1993 bis 1997 war Frau Carnwath Senior Partner beim Finanzberater Phoenix Partnership. Nachdem das Unternehmen Ende 1997 von Donaldson Lufkin Jenrette (DLJ) übernommen worden war, arbeitete sie bis 2000 weiter für DLJ. Sie übte verschiedene Verwaltungsratsmandate aus. Von 2000 bis 2005 war sie Präsidentin des Verwaltungsrats von Vitec Group plc und von 2001 bis 2006 Mitglied des Verwaltungsrats von Welsh Water. Von 2004 bis 2007 war sie Mitglied des Verwaltungsrats von Friends Provident plc. Frau Carnwath war zudem von 2004 bis 2007 Mitglied des Verwaltungsrats von Gallaher Group und von 2007 bis 2010 unabhängige Verwaltungsratspräsidentin von MF Global Inc. Weiter war sie von 2010 bis 2012 Mitglied des Verwaltungsrats von Barclays sowie von 2001 bis 2013 Mitglied des Verwaltungsrats von Man Group plc. Von 2008 bis Juli 2018 war sie Verwaltungsratspräsidentin von Land Securities Group plc und von Mai 2018 bis Januar 2021 Mitglied des Verwaltungsrats von BP plc. Seit März 2012 ist sie Mitglied des Verwaltungsrats der Zurich Insurance Group AG und der Zürich VersicherungsGesellschaft AG.
Mitgliedschaft in AusschüssenPrüfungsausschuss (Vorsitzende), Risiko und Investmentausschuss
Sonstige Mandate innerhalb der Gruppe Zürich VersicherungsGesellschaft AG
Externe Ernennungen Frau Carnwath ist nicht exekcutives Mitglied der Verwaltungsräte von PACCAR Inc., Bellis Topco 2 Limited, Broadwell Capital Limited, Coller Capital Ltd. und EG Group Holdings Limited. Sie ist zudem Mitglied des Aufsichtsrats und Vorsitzende des Prüfungsausschusses der BASF SE. Darüber hinaus ist sie Senior Advisor von Evercore Partners, Vorsitzende des strategischen Advisory Board von Livingbridge und Mitglied des Advisory Council der St. George’s Society of New York.
AusbildungFrau Carnwath schloss ihr Studium in Wirtschaft und Deutsch an der Universität von Reading ab. Sie hält zudem einen Ehrendoktortitel (LLB) von der Universität von Reading und der Universität von Exeter.
Michael HalbherrMitglied des Verwaltungsrats
Jahrgang: 1964
Fähigkeiten und Erfahrung Michael Halbherr verfügt über umfassende Erfahrung in der Technologiebranche als Investor, aktives Verwaltungsratsmitglied und Berater für junge, aufstrebende Unternehmen in vielen verschiedenen Bereichen, darunter digitale Kartierung, Mobilitätstechnologie, mobile Betriebssysteme und Industrieanwendungen. Von 2006 bis 2014 bekleidete er verschiedene Führungspositionen bei Nokia Corporation. Unter ande rem war er von 2011 bis 2014 Mitglied des Leadership Teams von Nokia und später CEO von HERE BV, einer 100prozentigen Tochtergesellschaft von Nokia und einem führenden Unternehmen in der Fahrzeugortungstechnologie. Von 2001 bis 2006 fungierte er als CEO von gate5, einem Startup im Bereich MobiltelefonieSoftware mit Sitz in Berlin, das 2006 von Nokia übernommen wurde. Von 2000 bis 2001 war er Managing Director bei Europeatweb, dem Risikokapitalbereich von Groupe Arnault und einem Investor von gate5. Zuvor war er von 1994 bis 2000 als Manager bei Boston Consulting Group (BCG) an den Standorten Zürich und Boston ein aktives Mitglied des Technologieteams. Er begann seine berufliche Laufbahn im Laboratory for Computer Science des Massachusetts Institute of Technology (MIT), wo er von 1992 bis 1994 als Gastwissenschaftler und Postdoktorand mit Schwerpunkt auf Programmierparadigmen für massivparallele Rechner forschte. Seit April 2019 ist er Mitglied der Verwaltungsräte der Zurich Insurance Group AG und der Zürich VersicherungsGesellschaft AG.
Mitgliedschaft in AusschüssenGovernance, Nominierungs und Nachhaltigkeitsausschuss, Risiko und Investmentausschuss
Sonstige Mandate innerhalb der Gruppe Zürich VersicherungsGesellschaft AG
Externe ErnennungenMichael Halbherr ist Mitglied des Verwaltungsrats von Vontobel Holding AG in Zurich. Er ist zudem ein nicht exekutives Mitglied des Verwaltungsrats und Verwaltungsratspräsident von German Bionic Systems GmbH in Augsburg, Trafi Ltd. in Vilnius, FATMAP Ltd. in Berlin, Nanoleq AG in Zürich sowie strategischer Berater der Zeotap GmbH.
AusbildungMichael Halbherr verfügt über ein Doktorat in Elektrotechnik der Eidgenössischen Technischen Hochschule (ETH) in Zürich.
Biografien (fortgesetzt)
Zurich Insurance Group Geschäftsbericht 2021
Konzern-überblick
Integrated sustainability disclosure
Governance Risk review
Financial review
57
Bericht über die Corporate Governance (fortgesetzt)
Sabine Keller-BusseMitglied des Verwaltungsrats
Jahrgang: 1965
Fähigkeiten und ErfahrungSabine KellerBusse verfügt über umfangreiche Erfahrung in der Finanzbranche. Sie ist President UBS Switzerland. Seit ihrem Eintritt in die UBS im Jahr 2010 bekleidete sie verschiedene Führungspositionen wie Group Chief Operating Officer, President Europe, Middle East and Africa, Group Head Human Resources und Chief Operating Officer UBS Switzerland. Frau KellerBusse wurde im Jahr 2016 Mitglied der Konzernleitung der UBS Group AG. Bevor sie zu UBS stiess, war sie von 2008 bis 2010 für das Privatkundengeschäft Region Zürich der Credit Suisse zuständig. Von 1995 bis 2008 arbeitete sie in der Beratung bei McKinsey & Co. mit Fokus auf die Finanzdienstleistungsbranche und wurde 2002 zum Partner gewählt. Von 2012 bis April 2021 war Sabine KellerBusse Mitglied des Verwaltungsrats der SIX Group, seit 2017 Vizepräsidentin und Vorsitzende des Nomination und Compensation Committee. Seit April 2021 ist sie Mitglied der Verwaltungsräte der Zurich Insurance Group AG und der Zürich VersicherungsGesellschaft AG.
Mitgliedschaft in Ausschüssen Vergütungsausschuss
Sonstige Mandate innerhalb der Gruppe Zürich VersicherungsGesellschaft AG
Externe ErnennungenFrau KellerBusse ist seit 2017 Stiftungsratsmitglied der USZ Stiftung des Universitätsspitals Zürich. Seit 2020 ist sie Stiftungsratsmitglied des UBS International Center of Economics in Society an der Universität Zürich.
AusbildungFrau KellerBusse studierte Betriebswirtschaft an der Universität St.Gallen (HSG) und schloss ihr Studium mit einem Doktortitel der Wirtschaftswissenschaften (Dr. oec.) ab.
Monica MächlerMitglied des Verwaltungsrats
Jahrgang: 1956
Fähigkeiten und Erfahrung Monica Mächler verfügt über fundierte Fachkenntnisse in den Bereichen Recht, Finanzmarktregulierung und Governance im nationalen und internationalen Umfeld. Sie war von 2009 bis 2012 als Vizepräsidentin des Verwaltungsrats der integrierten Eidgenössischen Finanzmarktaufsicht (FINMA) tätig, nachdem sie zuvor von 2007 bis 2008 das schweizerische Bundesamt für Privatversicherungen geleitet hatte. Von 2010 bis 2012 leitete Frau Mächler zudem das Technical Committee der International Association of Insurance Supervisors (IAIS). Von 1999 bis 2006 war sie als Group General Counsel der Zurich Insurance Group tätig und führte das Verwaltungsratssekretariat. Sie stiess 1990 zur Zurich Insurance Group und wurde 2001 zum Mitglied des Group Management Board ernannt. Zwischen 1985 und 1990 war sie in einer Rechtsanwaltskanzlei mit Schwerpunkt Bank und Wirtschaftsrecht tätig. Frau Mächler war Mitglied verschiedener eidgenössischer Expertenkommissionen zu regulatorischen Projekten. Sie hält regelmässig Vorlesungen sowie Vorträge und publiziert in den Bereichen internationales Wirtschaftsrecht sowie Regulierung und deren Auswirkungen. Sie war von Mai 2012 bis Mai 2018 Mitglied des Aufsichtsrats der Deutsche Börse AG. Seit April 2013 ist sie Mitglied der Verwaltungsräte der Zurich Insurance Group AG und der Zürich VersicherungsGesellschaft AG.
Mitgliedschaft in Ausschüssen Governance, Nominierungs und Nachhaltigkeitsausschuss, Prüfungsausschuss
Sonstige Mandate innerhalb der GruppeZürich VersicherungsGesellschaft AG
Externe ErnennungenFrau Mächler ist seit April 2015 Mitglied des Verwaltungsrats der Cembra Money Bank AG. Sie ist auch Vorsitzende des Advisory Board des International Center for Insurance Regulation der Goethe Universität Frankfurt am Main sowie Mitglied des Stiftungsrats der Stiftung für schweizerische Rechtspflege, Mitglied des Vorstands des Europa Instituts an der Universität Zürich und Mitglied der Leitungsorgane des Institute for International Criminal Investigations (IICI), einer gemeinnützigen Organisation in Kalifornien, sowie der Institute for International Criminal Investigations Foundation (IICIF), einer niederländischen gemeinnützigen Stiftung mit Sitz in Den Haag.
AusbildungNachdem Frau Mächler in Rechtswissenschaften an der Universität Zürich promoviert und ihre Studien mit Programmen zu britischem, USamerikanischem und internationalem Privatrecht ergänzt hatte, erwarb sie das Anwaltspatent des Kantons Zürich.
Kishore MahbubaniMitglied des Verwaltungsrats
Jahrgang: 1948
Fähigkeiten und Erfahrung Kishore Mahbubani begann seine Karriere 1971 als Diplomat beim Aussenministerium in Singapur. Dort war er bis 2004 tätig und wurde in dieser Zeit nach Kambodscha, Malaysia, Washington D.C. und New York entsandt. Er repräsentierte Singapur im Januar 2001 und im Mai 2002 als Botschafter in den Vereinten Nationen und als Präsident des UNSicherheitsrats. Von 1993 bis 1998 war Herr Mahbubani Staatssekretär im Aussenministerium von Singapur. Als Gründungsmitglied und erster Dekan war Herr Mahbubani von 2004 bis Ende 2017 an der Lee Kuan Yew School of Public Policy der National Univer s ity of Singapore (NUS) tätig. Seit Juli 2019 ist er Distinguished Fellow am Asia Research Institute (ARI) der NUS. Er tritt öffentlich auf und publiziert zu geopolitischen und wirtschaftlichen Themen. Die Financial Times hat sein Buch «The Great Convergence: Asia, the West, and the Logic of One World» zu einem der besten Wirtschaftsbücher des Jahres 2013 gewählt. Sein neustes Buch, «Has China Won?», wurde im April 2020 in den USA veröffentlicht und von Martin Wolf als «an excellent and important book» beschrieben. Seit April 2015 ist er Mitglied der Verwaltungsräte der Zurich Insurance Group AG und der Zürich VersicherungsGesellschaft AG.
Mitgliedschaft in AusschüssenVergütungsausschuss, Risiko und Investmentausschuss
Sonstige Mandate innerhalb der Gruppe Zürich VersicherungsGesellschaft AG
Externe ErnennungenIm Februar 2021 wurde Herr Mahbubani zum Verwaltungsratspräsidenten des NUS Medical International Council ernannt und im Oktober 2021 wurde er Berater von Jabil Inc. Im September 2017 wurde er zum Verwaltungsratspräsidenten von Aggregate Asset Management gewählt. Seit Januar 2016 ist er ein unabhängiges Mitglied des Verwaltungsrats von Wilmar International Limited, Singapur. Zudem nahm er Einsitz in den Verwaltungsräten und Beiräten verschiedener Institutionen in Singapur, Europa und Nordamerika. Momentan ist er Mitglied des Yale President’s Council on International Activities (PCIA) und des Global Agenda Council on China des World Economic Forums. Im April 2019 wurde er Mitglied der American Academy of Arts and Sciences.
AusbildungHerr Mahbubani schloss sein Studium der Philosophie an der University of Singapore mit Auszeichnung ab. Weiter erwarb er einen Master of Arts in Philosophie der Dalhousie University, Kanada, die ihm ausserdem die Ehrendoktorwürde verlieh.
Biografien (fortgesetzt)
Zurich Insurance Group Geschäftsbericht 2021
Konzern-überblick
Integrated sustainability disclosure
Governance Risk review
Financial review
58
Bericht über die Corporate Governance (fortgesetzt)
Jasmin StaiblinMitglied des Verwaltungsrats
Jahrgang: 1970
Fähigkeiten und ErfahrungJasmin Staiblin bringt ihr umfassendes Wissen bezüglich der Transformation von Geschäftsfeldern und der zunehmenden Bedeutung der Digitalisierung und der Nachhaltigkeit als wettbewerbsrelevantes Unterscheidungsmerkmal in ihre Rolle ein. Sie gilt als eine der führenden europäischen Exper tinnen im Bereich Energie und war bis 31. Dezember 2018 CEO von Alpiq, einem führenden Schweizer Energiedienstleister und Stromproduzenten in Europa. Sie begann ihre Karriere 1997 im globalen schwedischschweizerischen Technologiekonzern ABB Group. Sie bekleidete verschiedene globale Funktionen als Mitglied des Managementteams der Division Power Technologies von ABB. Von 2006 bis 2012 war sie CEO von ABB Schweiz und von 2013 bis 2018 CEO der Alpiq Holding AG. Seit April 2019 ist sie Mitglied der Verwaltungsräte der Zurich Insurance Group AG und der Zürich VersicherungsGesellschaft AG.
Mitgliedschaft in AusschüssenRisiko und Investmentausschuss (Vorsitzende), Vergütungsausschuss
Sonstige Mandate innerhalb der Gruppe Zürich VersicherungsGesellschaft AG
Externe ErnennungenFrau Staiblin ist Mitglied des Verwaltungsrats von NXP Semiconductors N.V., Eindhoven, und Georg Fischer AG, Schaffhausen. Sie ist ausserdem Vorsitzende des Aufsichtsrats der RollsRoyce Power Systems AG und deren Tochtergesellschaft RollsRoyce Solutions GmbH, beide mit Sitz in Friedrichshafen und vollständig durch die RollsRoyce plc kontrolliert.
Ausbildung Frau Staiblin studierte Physik und Elektrotechnik an der Technischen Hochschule Karlsruhe, Deutschland und an der Königlichen Technischen Hochschule in Stockholm, Schweden. Sie beendete ihr Studium mit einem Abschluss in Physik und verfügt über einen Master of Science in Elektrotechnik.
Barry StoweMitglied des Verwaltungsrats
Jahrgang: 1957
Fähigkeiten und ErfahrungBarry Stowe verfügt über umfassende berufliche Erfahrungen und Kenntnisse, die er in diversen leitenden Positionen in der Versicherungsbranche in Nordamerika und Asien erwarb. Von 2006 bis 2018 war er Mitglied des Verwaltungsrats und der Konzernleitung von Prudential plc. Von 2015 bis 2018 war er Verwaltungsratspräsident und CEO von Jackson Holdings Ltd., einer Tochtergesellschaft von Prudential plc, und von 2006 bis 2015 CEO von Prudential Corporation Asia. Von 1995 bis 2006 war er in verschiedenen leitenden Funktionen bei American International Group (AIG) tätig, unter anderem leitete er von 2001 bis 2006 AIG Life Companies Accident & Health Worldwide mit Sitz in Hongkong. Von 1992 bis 1995 war er Vorsitzender von NISUS, einer Tochtergesellschaft von PanAmerican Life Insurance Group. Von 1980 bis 1992 nahm er unterschiedliche Funktionen beim Versicherungs und Rückversicherungsmakler Willis Corroon Group plc in den USA wahr. Seit April 2019 ist er Mitglied der Verwaltungsräte der Zurich Insurance Group AG und der Zürich VersicherungsGesellschaft AG.
Mitgliedschaft in Ausschüssen Prüfungsausschuss, Risiko und Investmentausschuss
Sonstige Mandate innerhalb der GruppeZürich VersicherungsGesellschaft AG
Externe Ernennungen Barry Stowe ist Senior Advisor für McKinsey & Company, CoVorsitzender des Retirement Income Institute in Washington D.C., Vizepräsident von Cheekwood Estate & Gardens in Nashville, Tennessee, und Mitglied des Tennessee Business Leadership Council.
Ausbildung Barry Stowe verfügt über einen Bachelor of Arts in Politikwissenschaft und Klassischer Altertumswissenschaft der Lipscomb University in Nashville, Tennessee.
Biografien (fortgesetzt)
Zurich Insurance Group Geschäftsbericht 2021
Konzern-überblick
Integrated sustainability disclosure
Governance Risk review
Financial review
59
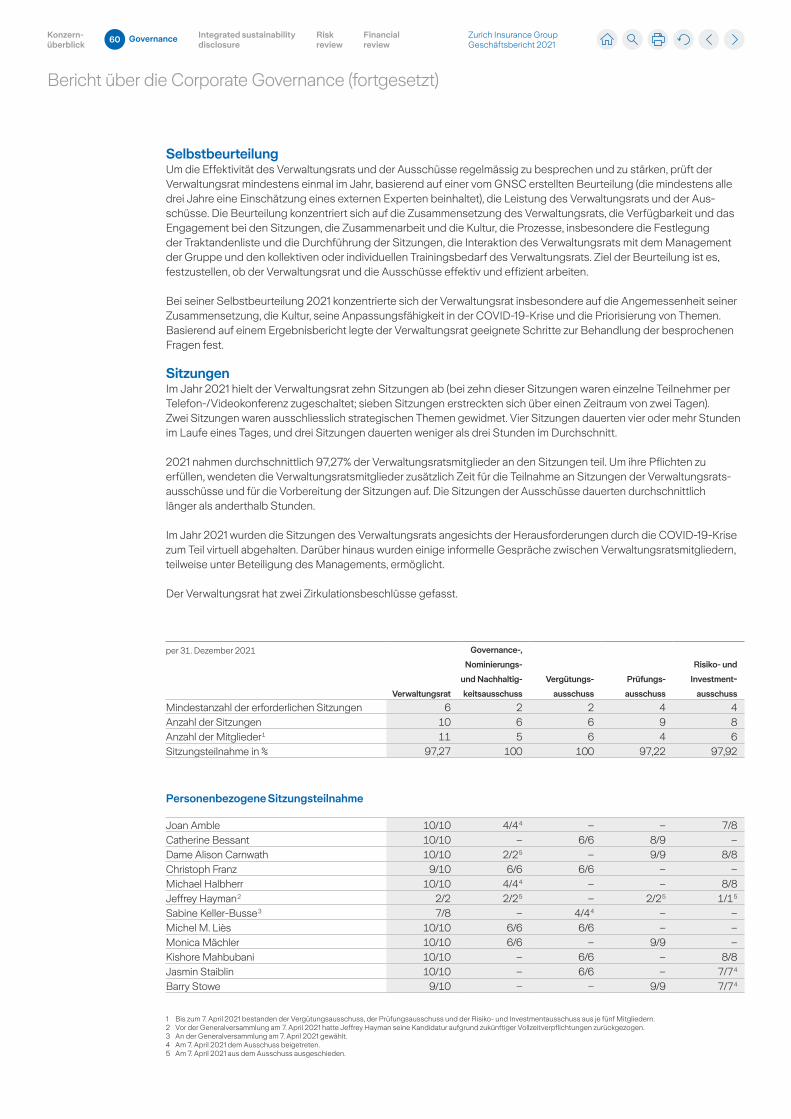
Bericht über die Corporate Governance (fortgesetzt)
SelbstbeurteilungUm die Effektivität des Verwaltungsrats und der Ausschüsse regelmässig zu besprechen und zu stärken, prüft der Verwaltungsrat mindestens einmal im Jahr, basierend auf einer vom GNSC erstellten Beurteilung (die mindestens alle drei Jahre eine Einschätzung eines externen Experten beinhaltet), die Leistung des Verwaltungsrats und der Ausschüsse. Die Beurteilung konzentriert sich auf die Zusammensetzung des Verwaltungsrats, die Verfügbarkeit und das Engage ment bei den Sitzungen, die Zusammenarbeit und die Kultur, die Prozesse, insbesondere die Festlegung der Traktandenliste und die Durchführung der Sitzungen, die Interaktion des Verwaltungsrats mit dem Management der Gruppe und den kollektiven oder individuellen Trainingsbedarf des Verwaltungsrats. Ziel der Beurteilung ist es, festzustellen, ob der Verwaltungsrat und die Ausschüsse effektiv und effizient arbeiten.
Bei seiner Selbstbeurteilung 2021 konzentrierte sich der Verwaltungsrat insbesondere auf die Angemessenheit seiner Zusammensetzung, die Kultur, seine Anpassungsfähigkeit in der COVID19Krise und die Priorisierung von Themen. Basierend auf einem Ergebnisbericht legte der Verwaltungsrat geeignete Schritte zur Behandlung der besprochenen Fragen fest.
SitzungenIm Jahr 2021 hielt der Verwaltungsrat zehn Sitzungen ab (bei zehn dieser Sitzungen waren einzelne Teilnehmer per Telefon/Videokonferenz zugeschaltet; sieben Sitzungen erstreckten sich über einen Zeitraum von zwei Tagen). Zwei Sitzungen waren ausschliesslich strategischen Themen gewidmet. Vier Sitzungen dauerten vier oder mehr Stunden im Laufe eines Tages, und drei Sitzungen dauerten weniger als drei Stunden im Durchschnitt.
2021 nahmen durchschnittlich 97,27% der Verwaltungsratsmitglieder an den Sitzungen teil. Um ihre Pflichten zu erfüllen, wendeten die Verwaltungsratsmitglieder zusätzlich Zeit für die Teilnahme an Sitzungen der Verwaltungsratsausschüsse und für die Vorbereitung der Sitzungen auf. Die Sitzungen der Ausschüsse dauerten durchschnittlich länger als anderthalb Stunden.
Im Jahr 2021 wurden die Sitzungen des Verwaltungsrats angesichts der Herausforderungen durch die COVID19Krise zum Teil virtuell abgehalten. Darüber hinaus wurden einige informelle Gespräche zwischen Verwaltungsratsmitgliedern, teilweise unter Beteiligung des Managements, ermöglicht.
Der Verwaltungsrat hat zwei Zirkulationsbeschlüsse gefasst.
per 31. Dezember 2021
Verwaltungsrat
Governance-,
Nominierungs-
und Nachhaltig-
keitsausschuss
Vergütungs-
ausschuss
Prüfungs-
ausschuss
Risiko- und
Investment-
ausschuss
Mindestanzahl der erforderlichen Sitzungen 6 2 2 4 4Anzahl der Sitzungen 10 6 6 9 8Anzahl der Mitglieder 1 11 5 6 4 6Sitzungsteilnahme in % 97,27 100 100 97,22 97,92
Personenbezogene Sitzungsteilnahme
Joan Amble 10/10 4/4 4 – – 7/8Catherine Bessant 10/10 – 6/6 8/9 –Dame Alison Carnwath 10/10 2/2 5 – 9/9 8/8Christoph Franz 9/10 6/6 6/6 – –Michael Halbherr 10/10 4/4 4 – – 8/8Jeffrey Hayman 2 2/2 2/2 5 – 2/2 5 1/1 5
Sabine KellerBusse 3 7/8 – 4/4 4 – –Michel M. Liès 10/10 6/6 6/6 – –Monica Mächler 10/10 6/6 – 9/9 –Kishore Mahbubani 10/10 – 6/6 – 8/8Jasmin Staiblin 10/10 – 6/6 – 7/7 4
Barry Stowe 9/10 – – 9/9 7/7 4
1 Bis zum 7. April 2021 bestanden der Vergütungsausschuss, der Prüfungsausschuss und der Risiko und Investmentausschuss aus je fünf Mitgliedern. 2 Vor der Generalversammlung am 7. April 2021 hatte Jeffrey Hayman seine Kandidatur aufgrund zukünftiger Vollzeitverpflichtungen zurückgezogen. 3 An der Generalversammlung am 7. April 2021 gewählt. 4 Am 7. April 2021 dem Ausschuss beigetreten. 5 Am 7. April 2021 aus dem Ausschuss ausgeschieden.
Zurich Insurance Group Geschäftsbericht 2021
Konzern-überblick
Integrated sustainability disclosure
Governance Risk review
Financial review
60
Bericht über die Corporate Governance (fortgesetzt)
TrainingDer Präsident sorgt gemeinsam mit dem GNSC dafür, dass neue Verwaltungsratsmitglieder ein Einführungsprogramm erhalten und bestehende Verwaltungsratsmitglieder passende Trainings absolvieren können. Um die Bedeutung dieses Themas zu unterstreichen, hat der Verwaltungsrat Leitlinien für die Einführung und Trainings erstellt.
Nach ihrer Ernennung absolvieren die neuen Verwaltungsratsmitglieder ein ausführliches und massgeschneidertes Einführungsprogramm, das in der Regel Folgendes umfasst:
– die Strategie der Gruppe, ihr Geschäftsmodell sowie ihre finanziellen und nichtfinanziellen Ziele;
– die Rechts und Führungsstruktur der Gruppe, die CorporateGovernanceStrukturen und Prozesse, den Verhaltenskodex von Zurich sowie die relevanten rechtlichen und regulatorischen Rahmenbedingungen;
– das Risk Management Framework der Gruppe sowie die entsprechenden Anforderungen und Prozesse im Bereich Compliance;
– Schulung und Einführung in spezifische Themen entsprechend den regulatorischen Anforderungen (z. B. regulatorische Kapitalmodelle);
– relevante Prozesse des Verwaltungsrats, Sitzungspläne und andere administrative Themen.
Im Rahmen des Einführungsprogramms werden Sitzungen mit dem Präsidenten, den Vorsitzenden der Ausschüsse, in welchen das neue Verwaltungsratsmitglied Einsitz nehmen wird, dem Group CEO, ausgewählten Mitgliedern des Managements sowie dem Sekretär des Verwaltungsrats geplant.
Ferner wird der Trainingsbedarf des Verwaltungsrats im Rahmen der jährlichen Selbstbeurteilung des Verwaltungsrats oder auf Basis von regulatorischen Anforderungen evaluiert und im Laufe des Jahres bei Bedarf regelmässig neu beurteilt. Im Jahr 2021 erhielt der Verwaltungsrat unter anderem ein Training zu Rückstellungstechniken/methoden und zum Einsatz von Technologie in der Prüfungspraxis. Individuelle Trainings erfolgten in den Bereichen Risikomana gementstrategie und prozesse, Governance des Verwaltungsrats und Herausforderungen für Verwaltungsräte wie geostrategische Herausforderungen, digitale Transformation, ESG und Kommunikation mit externen Anspruchsgruppen.
Die Rolle des Verwaltungsrats Der Verwaltungsrat ist für die Oberleitung von ZIG und der gesamten Gruppe sowie für die Überwachung der Geschäftsführung zuständig. Insbesondere ist er für folgende Bereiche verantwortlich:
– Konzernstrategie: Der Verwaltungsrat genehmigt den Strategieplan und die Gesamtziele der Gruppe basierend auf den Empfehlungen des Group CEO und erhält Berichte des Group CEO über die Umsetzung der Konzernstrategie und die dabei erzielten Fortschritte.
– Nachhaltigkeit: Der Verwaltungsrat genehmigt die Nachhaltigkeitsstrategie und ziele der Gruppe einschliesslich solcher Ziele, die einen wesentlichen Einfluss auf die Gruppe haben. Ausserdem legt der Verwaltungsrat die Werte und Grundsätze der Gruppe fest, um sicherzustellen, dass die Erwartungen der Anspruchsgruppen erfüllt werden.
– Finanzen: Der Verwaltungsrat genehmigt jährlich den Finanz und den operativen Plan und erstellt Richtlinien für die Eigenkapitalzuteilung und Finanzplanung. Der Verwaltungsrat genehmigt wichtige Transaktionen der Kreditaufnahme und Kreditgewährung, die bestimmte Schwellenwerte übersteigen. Er bespricht die Dividendenpolitik und den Vorschlag des Verwaltungsrats bezüglich Dividendenzahlung. Im Rahmen seiner Befugnisse fasst der Verwaltungsrat auch Beschlüsse über Kapitalerhöhungen.
– Berichterstattung: Der Verwaltungsrat prüft und genehmigt den Geschäftsbericht und die halbjährliche Finanzberichterstattung der Gruppe sowie die Zwischenberichte am Ende des ersten und dritten Quartals und den Bericht über die Finanzlage. Darüber hinaus genehmigt der Verwaltungsrat den Sustainability Report.
– Struktur und Organisation der Gruppe: Der Verwaltungsrat bestimmt und prüft regelmässig die Grundsätze der Konzernstruktur und wichtige Veränderungen an der Managementorganisation der Gruppe und in den Konzernfunktionen. In diesem Zusammenhang bespricht der Verwaltungsrat insbesondere die Struktur der Corporate Governance, das Vergütungssystem der Gruppe sowie angemessene Kontrollen und Gewährleistung. Im Rahmen seiner Pflicht, die Generalversammlung einzuberufen, genehmigt er Vorschläge und unterbreitet sie dieser.
– Geschäftsentwicklung: Über bestimmten Schwellenwerten bespricht und genehmigt der Verwaltungsrat regelmässig Akquisitionen oder Veräusserungen von Geschäften und Aktiven, Kapitalanlagen, neue Geschäfte, Fusionen, Joint Ventures, Kooperationen und die Umstrukturierung von Geschäftseinheiten oder Geschäftsportfolios.
– Unternehmenskultur: Der Verwaltungsrat genehmigt und überprüft zudem regelmässig die Standards in den Bereichen Ethik und Compliance der Gruppe, insbesondere den Verhaltenskodex von Zurich.
– Risikomanagement: Der Verwaltungsrat genehmigt die wesentlichen Grundsätze und Verfahren des Risikomanagements der Gruppe, insbesondere den Grad der Risikobereitschaft und Risikotoleranz der Gruppe. Er genehmigt auch das Own Risk and Solvency Assessment (Group ORSA) sowie den Sanierungsplan der Gruppe.
Für weitere Informationen siehe Art. 5.1 bis 5.13 des Organisationsreglements (www.zurich.com/aboutus/corporate governance/corporatedocuments).
Zurich Insurance Group Geschäftsbericht 2021
Konzern-überblick
Integrated sustainability disclosure
Governance Risk review
Financial review
61
Bericht über die Corporate Governance (fortgesetzt)
Zu den Schwerpunkten der Aktivitäten/Diskussionen im Jahr 2021 gehörten:
– Umsetzung der strategischen Prioritäten für den Strategiezyklus 2020–2022, insbesondere mit Blick auf das Firmenkunden und Privatkundengeschäft, einschliesslich Entwicklungen in allen Regionen, neue Geschäftsmodelle und die Marke;
– Umsetzung der Nachhaltigkeitsstrategie und deren Einbindung in die Unternehmensziele;
– Status und digitale Transformation von Technologie und Geschäftstätigkeit;
– Vom Group CEO vorgeschlagene Änderungen in der Konzernleitung;
– genaue Überwachung von Finanz und Geschäftsrisiken während der COVID19Krise, Auswirkungen auf die Umsetzung der Strategie, die Mitarbeitenden und die Geschäftstätigkeit;
– Nachfolgeplanung für den Verwaltungsrat;
– Risikomanagement, einschliesslich Risikobereitschaft und toleranz sowie internes Kontrollsystem, was eine integrierte Betrachtung von Risiken und Kundentrends im AssuranceBereich, strukturellen Veränderungen in der Branche und neuen Technologien ermöglicht;
– KrisenmanagementÜbung für den Verwaltungsrat;
– Management von Fusions, Übernahme und Anlagetransaktionen;
– Selbstbeurteilung des Verwaltungsrats mit entsprechenden Empfehlungen;
– gesetzliches und regulatorisches Umfeld.
Die Rolle des PräsidentenDer Präsident leitet den Verwaltungsrat, beruft die Sitzungen des Verwaltungsrats ein und legt deren Traktandenliste fest. Er steht in ständigem Kontakt mit dem Group CEO und fördert eine konstruktive Beziehung zwischen dem Verwaltungsrat und der Konzernleitung. In seiner Rolle nimmt er auch folgende Aufgaben wahr:
– Er führt den Vorsitz der Generalversammlung.
– Er gewährleistet die Richtigkeit und ordnungsgemässe Umsetzung der Beschlüsse des Verwaltungsrats.
– Er gewährleistet, dass die Verwaltungsratsmitglieder genaue, zeitnahe und klare Informationen erhalten.
– Er trifft dringende Entscheidungen, die dann vom Verwaltungsrat ratifiziert werden müssen.
– Er sorgt gemeinsam mit dem GNSC für das Einführungs und Trainingprogramm des Verwaltungsrats.
– Er gibt weitere Leitlinien zur Erfüllung der Anforderungen bezüglich Eignung («Fit und Proper»Kriterien) von Kandidaten und Mitgliedern des Verwaltungsrats vor.
– Er organisiert die Selbstbeurteilung des Verwaltungsrats.
Für weitere Informationen siehe Art. 9.1 bis 9.4 des Organisationsreglements (www.zurich.com/aboutus/corporate governance/corporatedocuments).
Die Rolle des VizepräsidentenDer Vizepräsident unterstützt den Präsidenten bei der Wahrnehmung seiner Aufgaben und übernimmt das Amt, wenn der Präsident nicht in der Lage ist, seine Funktionen auszuüben.
Rolle der Verwaltungsratsausschüsse Der Verwaltungsrat kann Ausschüsse für spezifische Themen bilden sowie Aufgabenbereiche und Regeln hinsichtlich der delegierten Aufgaben und Verantwortlichkeiten sowie der Berichterstattung an den Verwaltungsrat festlegen. Mit Ausnahme des Vergütungsausschusses bildet der Verwaltungsrat solche Ausschüsse nach eigenem Ermessen aus seinen Mitgliedern.
Die Ausschüsse unterstützen den Verwaltungsrat bei der Erfüllung seiner Aufgaben und Pflichten. Sie diskutieren die betreffenden Angelegenheiten und unterbreiten dem Verwaltungsrat Vorschläge, sofern sie nicht in bestimmten Bereichen zur eigenen Beschlussfassung ermächtigt sind. Alle Ausschüsse haben die Befugnis, sich extern beraten zu lassen. Um eine Sicht von aussen zu erhalten, laden der Verwaltungsrat und/oder seine Ausschüsse gelegentlich externe Berater ein (z. B. den unabhängigen Berater des Vergütungsausschusses, die externe Revisionsstelle), um an einer Sitzung teilzunehmen und/oder ein bestimmtes Thema zu präsentieren.
Der Verwaltungsrat verfügt über die nachfolgend erwähnten ständigen Ausschüsse:
Zurich Insurance Group Geschäftsbericht 2021
Konzern-überblick
Integrated sustainability disclosure
Governance Risk review
Financial review
62
Bericht über die Corporate Governance (fortgesetzt)
Governance-, Nominierungs- und Nachhaltigkeitsausschuss Hauptaufgaben und Verantwortlichkeiten:
– Er unterstützt den Verwaltungsrat dabei, an der Spitze einen angemessenen Ton zu setzen, um wichtige Werte und Verhaltensweisen zu fördern und eine solide und offene Kultur im gesamten Unternehmen zu gewährleisten.
– Er unterstützt den Verwaltungsrat durch die Einführung von Corporate Governance Best Practices in der gesamten Gruppe, wobei darauf geachtet wird, dass die Rechte der Aktionäre und anderer wichtiger Anspruchsgruppen geschützt werden.
– Er stellt sicher, dass Strukturen und Prozesse für eine angemessene Corporate Governance und eine ordnungsgemässe Dokumentierung vorhanden sind.
– Er überwacht die Entwicklung von gesetzlichen und regulatorischen Vorschriften sowie die Anforderungen an die Berichterstattung in Bezug auf Corporate Governance und Nachhaltigkeit.
– Er ist mit der Nachfolgeplanung für den Verwaltungsrat und die Konzernleitung betraut und unterbreitet dem Verwaltungsrat Vorschläge zu dessen Zusammensetzung sowie zur Ernennung des Präsidenten und Vizepräsidenten des Verwaltungsrats, des Group CEO und der Mitglieder der Konzernleitung. Abschliessende Entscheidungen werden vom Verwaltungsrat getroffen, unter dem Vorbehalt der Zustimmung der Aktionäre, sofern diese erforderlich ist.
– Er überwacht das Talentmanagement und die Nachfolgeplanung für den Group CEO.
– Er überprüft die Nachhaltigkeitsstrategie und ziele der Gruppe einschliesslich solcher Ziele, die einen wesentlichen Einfluss auf die Gruppe haben, und schlägt sie dem Verwaltungsrat zur Genehmigung vor.
Zu den Schwerpunkten der Aktivitäten/Diskussionen im Jahr 2021 gehörten:
– Veränderungen in der Konzernleitung wie vom Group CEO entsprechend den strategischen Prioritäten vorgeschlagen;
– Steuerung und Überwachung der Umsetzung der Nachhaltigkeitsstrategie und ihrer drei Säulen (Klimaschutz, Vertrauensbildung in einer digitalen Gesellschaft und nachhaltige Arbeitsgestaltung) einschliesslich zentraler Initiativen wie die Ausrichtung auf eine 1,5°CZukunft oder der Beitritt zur NetZero Insurance Alliance;
– Nichtfinanzielle Offenlegungsstandards und Best Practices in der Branche;
– GovernanceStrukturen im Bereich Nachhaltigkeit, einschliesslich für die Berichterstattung;
– Nachfolgeplanung für den Verwaltungsrat und die Konzernleitung;
– Prüfung von Dokumenten zur Corporate Governance und Übermittlung von Änderungsvorschlägen an den Verwaltungsrat;
– Entwicklungen mit Auswirkungen auf die Corporate Governance, einschliesslich Änderungen von Gesetzen, Vorschriften und Tendenzen in der Schweiz und auf internationaler Ebene;
– Prüfung des Corporate Governance Berichts und des Sustainability Reports sowie Empfehlung an den Verwaltungsrat zur Genehmigung;
– ESGRoadshow.
VergütungsausschussHauptaufgaben und Verantwortlichkeiten:
– Er prüft jährlich die Vergütungsarchitektur und das Vergütungssystem der Gruppe sowie das Vergütungsreglement von Zurich und schlägt dem Verwaltungsrat entsprechende Änderungen vor. Der Verwaltungsrat ist für die Entwicklung, Umsetzung und Überwachung der Vergütungsstruktur verantwortlich.
– Er prüft jährlich die Vergütungskonditionen für die Mitglieder des Verwaltungsrats und unterbreitet dem Verwaltungsrat diesbezügliche Vorschläge.
– Er prüft die Anstellungsbedingungen des Group CEO und unterbreitet dem Verwaltungsrat entsprechende Vorschläge. Ebenso prüft er die durch den Group CEO vorgeschlagenen Anstellungsbedingungen der Konzernleitungsmitglieder, einschliesslich der jährlichen Überprüfung der Leistungsziele und Ergebnisse, und legt dem Verwaltungsrat gegebenenfalls entsprechende Änderungsvorschläge zur Genehmigung vor.
– Er prüft die Zielerreichung im Hinblick auf die festgelegten Leistungsmessgrössen für die kurz und langfristigen IncentivePläne (STIP und LTIP) und erstellt eine qualitative Leistungsbeurteilung, bevor er dem Verwaltungsrat die Finanzierung der STIPPools, die definitive LTIPZuteilung und die Höhe des Gesamtpools der variablen Vergütung vorschlägt.
– Er arbeitet mit dem Group CEO bei sonstigen wichtigen Fragen bezüglich Anstellung, Entlöhnung und Zusatzleistungen zusammen.
– Er prüft die Höhe der Vergütung von Verwaltungsrat und Konzernleitung und unterbreitet dem Verwaltungsrat diesbezüglich Vorschläge für die Vorlage zur Genehmigung an der ordentlichen Generalversammlung.
– Er erörtert Aspekte des aufsichtsrechtlichen Umfelds und des Risikomanagements bezüglich Vergütung und der damit verbundenen Offenlegungen und erstellt den Vergütungsbericht.
Zurich Insurance Group Geschäftsbericht 2021
Konzern-überblick
Integrated sustainability disclosure
Governance Risk review
Financial review
63
Bericht über die Corporate Governance (fortgesetzt)
Zu den Schwerpunkten der Aktivitäten/Diskussionen im Jahr 2021 gehörten:
– Leistung der Gruppe, der Länder und der Konzernleitung sowie Genehmigung der Werte für die definitiven STIP und LTIPZuteilungen für den per 31. Dezember 2020 endenden Zeitraum;
– Genehmigung des Gesamtpools der variablen Vergütungen für 2020;
– aufsichtsrechtliches Umfeld und externe Entwicklungen bezüglich Vergütung und der damit verbundenen Offenlegungen sowie die Auswirkungen auf Zurich;
– Verordnung gegen übermässige Vergütungen bei börsenkotierten Aktiengesellschaften, einschliesslich der vorgeschlagenen maximalen Gesamtvergütung von Verwaltungsrat und Konzernleitung im Hinblick auf die Abstimmungen der Aktionäre an der ordentlichen Generalversammlung sowie die Ergebnisse der Abstimmungen von der ordentlichen Generalversammlung 2021;
– gemeinsam mit dem Risiko und Investmentausschuss wurden Aspekte des Risikomanagements der Vergütungsstruktur der Gruppe sowie wesentliche Aktivitäten mit Blick auf Positionen von bekannten Risikoträgern («Key Risk Takers»), wie beispielsweise deren risikobezogene Beurteilung, besprochen;
– Vergütungsbericht, die Informationen über die Genehmigung der Vergütung des Verwaltungsrats und der Konzernleitung in der Einladung zur Generalversammlung und andere damit zusammenhängende Offenlegungen;
– Vergütungsreglement von Zurich, welches durch den Verwaltungsrat genehmigt wurde;
– Vergütungsstrukturen von Verwaltungsrat und Konzernleitung einschliesslich des Aktienbesitzes gemäss den Richtlinien;
– Aktivitäten des Group Pensions Committee;
– Leistungs und IncentiveArchitektur für 2021 und die Vorschau auf 2022;
– ESGRoadshow.
Weitere Einzelheiten über die Vergütungsstruktur der Gruppe sind im Vergütungsbericht auf den Seiten 84 bis 117 aufgeführt.
PrüfungsausschussHauptaufgaben und Verantwortlichkeiten:
– Er dient als zentrale Anlaufstelle für die Kommunikation und Beaufsichtigung in Bezug auf Rechnungslegung sowie finanzielle und nichtfinanzielle Berichterstattung, interne Kontrolle, Versicherungsmathematik sowie die finanzielle und aufsichtsrechtliche Compliance.
– Er kontrolliert den Prüfungsprozess der Gruppe (einschliesslich der Festlegung der Grundsätze und der Unterbreitung von Vorschlägen für die Rechnungsprüfung von ZIG und der Gruppe).
– Mindestens einmal im Jahr überprüft er die internen Kontrollstandards, einschliesslich der Tätigkeit, Planung, Organisation und Qualität von Group Audit und Group Compliance.
– Er prüft die konsolidierten Jahres und Halbjahresabschlüsse der Gruppe, die Zwischenberichte am Ende des ersten und dritten Quartals sowie den Geschäftsbericht der Gruppe.
Zu den Schwerpunkten der Aktivitäten/Diskussionen im Jahr 2021 gehörten:
– Jahres und Halbjahresabschlüsse mit deutlichem Schwerpunkt auf Rechnungslegungs und Rückstellungsthemen sowie Zwischenberichte der Gruppe am Ende des ersten und dritten Quartals;
– regelmässige Beurteilung der Finanzlage der Gruppe mit Blick auf die COVID19Krise, deren Auswirkungen auf das Finanzgeschäft und auf die Leistung gegenüber dem Finanzplan;
– Beurteilung der nichtfinanziellen Berichterstattung;
– Strategie, Umfang und Effektivität des internen Kontrollsystems, einschliesslich der internen Kontrollmechanismen für die Finanzberichterstattung (ICFR);
– Jahresplan von Group Audit, Feststellungen von Group Audit und Umsetzung der Abhilfemassnahmen durch die Geschäftsführung;
– Nachfolge des Head of Group Audit;
– Framework der Gruppe mit Bezug auf Betrugsrisiken;
– Arbeit der externen Revisionsstelle, einschliesslich der regelmässigen Überprüfung der NonAudit Services Policy, die Feststellungen der externen Revisionsstelle zu wichtigen Beurteilungen und Schätzungen in den Abschlüssen sowie der Wechsel zur neuen externen Revisionsstelle;
– jährlicher Group Compliance Plan, Aktivitäten zur Unterstützung des Managements von ComplianceRisiken, Aktualisierung und Verbesserung von ComplianceRichtlinien, Feststellungen zur Compliance, das Resultat der jährlichen Schulung zum Verhaltenskodex von Zurich sowie die sich verändernden Erwartungen der Aufsichtsbehörden;
– Finanzsysteme und Digitalisierungsinitiativen, u. a. im Bereich der künstlichen Intelligenz und des Process Mining von Group Finance, sowie die Entwicklungen der externen Revisionsstelle im Unternehmenssteuerrrecht;
– rechtliche und regulatorische Fragen, einschliesslich Änderungen der AdhocOffenlegungsanforderungen der SIX.
Zurich Insurance Group Geschäftsbericht 2021
Konzern-überblick
Integrated sustainability disclosure
Governance Risk review
Financial review
64
Bericht über die Corporate Governance (fortgesetzt)
Risiko- und InvestmentausschussHauptaufgaben und Verantwortlichkeiten:
– Risikotoleranz und RisikoGovernanceFramework:
– Er überwacht die Risikobereitschaft und toleranz der Gruppe. Dazu gehören festgelegte Obergrenzen, die vom Verwaltungsrat als für die ZIG und die Gruppe als tragbar erachtet werden, ebenso wie die Aggregation festgelegter Obergrenzen auf Gruppenebene, die Überwachung der Einhaltung der festgesetzten Risikobereitschaft und toleranz sowie die Risikobereitschaft und toleranz der Gruppe in Bezug auf die erwartete Höhe des Kapitals.
– Er überwacht das unternehmensweite Enterprise Risk Management Framework der Gruppe, das Richtlinien, Modelle, Methoden, Reporting, Systeme, Prozesse und Mitarbeitende umfasst.
– Er überwacht die Auswirkungen von Risiken auf die wirtschaftlichen und regulatorischen Kapitalanforderungen.
– Risikoberichterstattung:
– Er erhält regelmässig Berichte von der RisikomanagementFunktion und beurteilt, ob alle «wesentlichen» Risikofragen (gemäss Definition in der Zurich Risk Policy; ZRP) angemessen und rechtzeitig von Konzernleitungsmitgliedern behandelt werden.
– Er prüft den Group ORSABericht sowie den Sanierungsplan der Gruppe und legt sie dem Verwaltungsrat zur Genehmigung vor.
– Kapitalanlagen:
– Er überwacht den Anlageprozess.
– Er prüft Kapitalanlagen, die über einen vorab festgelegten Schwellenwert hinausgehen, und legt sie dem Verwaltungsrat zur Genehmigung vor.
– Er überwacht die makroökonomischen Entwicklungen.
– Er erhält Statusberichte über die jährliche strategische AssetAllocation der Gruppe, den Marktrisikoverbrauch im Verhältnis zum zugewiesenen Marktrisikokapital und limit sowie die wichtigsten Marktrisikotreiber;
– Er erhält Statusberichte über das Anlageergebnis, die wirtschaftliche Anlagerendite im Verhältnis zu den Verbindlichkeiten und zur Performance der Vermögensverwalter.
Zu den Schwerpunkten der Aktivitäten/Diskussionen im Jahr 2021 gehörten:
– aktuelle Informationen zum Enterprise Risk Management, einschliesslich vierteljährlicher Risikoberichte, strategischer Risikobeurteilung (Group Total Risk Profile), Enterprise Risk Management Framework und regelmässige Besprechungen von Szenarioanalysen;
– Erklärung zur Risikobereitschaft und Risikotoleranz der Gruppe im Jahr 2022;
– Group ORSABericht, einschliesslich Selbstbeurteilung der Effektivität des Risikomanagementsystems;
– Sanierungsplan der Gruppe 2021;
– regelmässige Besprechungen der makroökonomischen Entwicklungen und der Auswirkungen auf die Anlageperformance;
– eine vertiefte Analyse von Investment Management zum Thema Umgang mit privaten Schuldtiteln und Update zur Infrastrukturallokation sowie zum Illiquiditätsaufschlag bei privaten Schuldtiteln;
– Update mit Blick auf das wirtschaftliche und regulatorische Kapital einschliesslich Offenlegung;
– Ergebnisse der Modellvalidierung 2020 und der Plan für 2021;
– aktuelle Informationen zu Kredit und Länderrisiken und halbjährlicher Bericht zu Derivaten;
– aktuelle Informationen zur eigenen Versicherung;
– aktuelle Informationen zu den Themen Kumulierung, Underwriting im Bereich Commercial Insurance und operationelles Risiko;
– Entwicklungen im Bereich der Versicherungsrisiken in Bezug auf die psychische Gesundheit;
– aktuelle Informationen zu Massnahmen und Kontrollen zum Schutz von Kundendaten und dem Verhalten gegenüber dem Kunden;
– aktuelle Informationen zur Strategie von Group Risk Management sowie regionale RisikoUpdates;
– aktuelle Informationen über die Rückversicherungsstrategie und die Leistung der Länder;
– Vergütungsstruktur und aktuelle Informationen zu Key Risk Takers (KRTs).
Weitere Informationen zur Risk Governance finden Sie im Risk Review auf den Seiten 183 bis 214.
Weitere Informationen zu den Ausschüssen des Verwaltungsrates im Allgemeinen finden Sie im Anhang des Organisationsreglements (unter www.zurich.com/aboutus/corporategovernance/corporatedocuments).
Zurich Insurance Group Geschäftsbericht 2021
Konzern-überblick
Integrated sustainability disclosure
Governance Risk review
Financial review
65
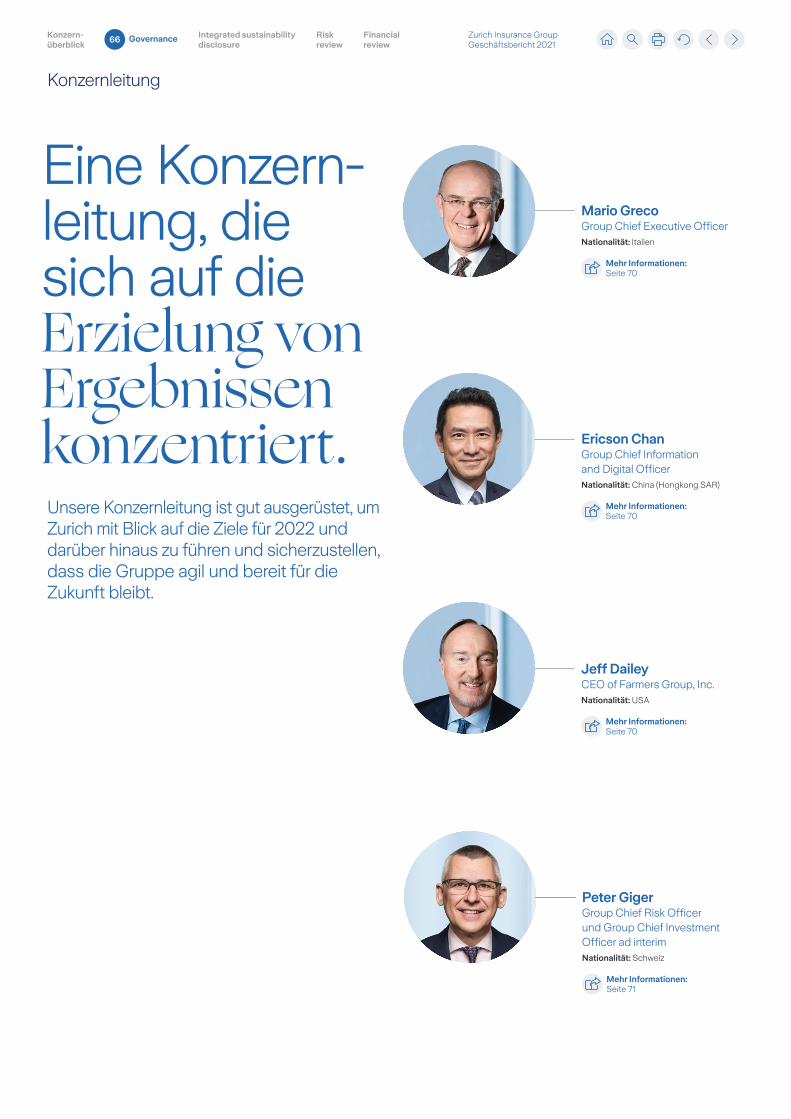
Konzernleitung
Mario GrecoGroup Chief Executive OfficerNationalität: Italien
Mehr Informationen:Seite 70
Peter GigerGroup Chief Risk Officer und Group Chief Investment Officer ad interimNationalität: Schweiz
Mehr Informationen:Seite 71
Ericson ChanGroup Chief Information and Digital OfficerNationalität: China (Hongkong SAR)
Mehr Informationen:Seite 70
Eine Konzernleitung, die sich auf die Erzielung von Ergebnissen konzentriert. Unsere Konzernleitung ist gut ausgerüstet, um Zurich mit Blick auf die Ziele für 2022 und darüber hinaus zu führen und sicherzustellen, dass die Gruppe agil und bereit für die Zukunft bleibt.
Jeff DaileyCEO of Farmers Group, Inc.Nationalität: USA
Mehr Informationen:Seite 70
Konzernleitung
Zurich Insurance Group Geschäftsbericht 2021
Konzern-überblick
Integrated sustainability disclosure
Governance Risk review
Financial review
66
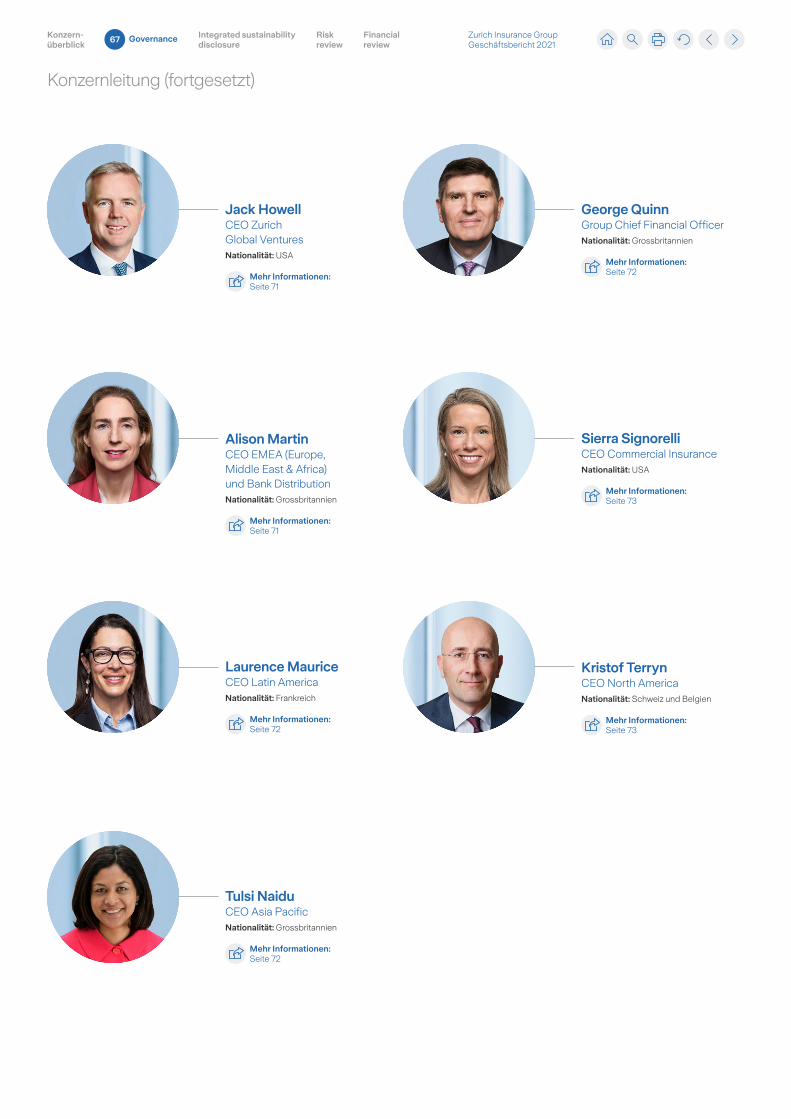
Konzernleitung (fortgesetzt)
Sierra SignorelliCEO Commercial InsuranceNationalität: USA
Mehr Informationen:Seite 73
Alison MartinCEO EMEA (Europe, Middle East & Africa) und Bank DistributionNationalität: Grossbritannien
Mehr Informationen:Seite 71
Kristof TerrynCEO North AmericaNationalität: Schweiz und Belgien
Mehr Informationen:Seite 73
Jack HowellCEO Zurich Global VenturesNationalität: USA
Mehr Informationen:Seite 71
Laurence MauriceCEO Latin AmericaNationalität: Frankreich
Mehr Informationen:Seite 72
Tulsi NaiduCEO Asia PacificNationalität: Grossbritannien
Mehr Informationen:Seite 72
George QuinnGroup Chief Financial OfficerNationalität: Grossbritannien
Mehr Informationen:Seite 72
Zurich Insurance Group Geschäftsbericht 2021
Konzern-überblick
Integrated sustainability disclosure
Governance Risk review
Financial review
67
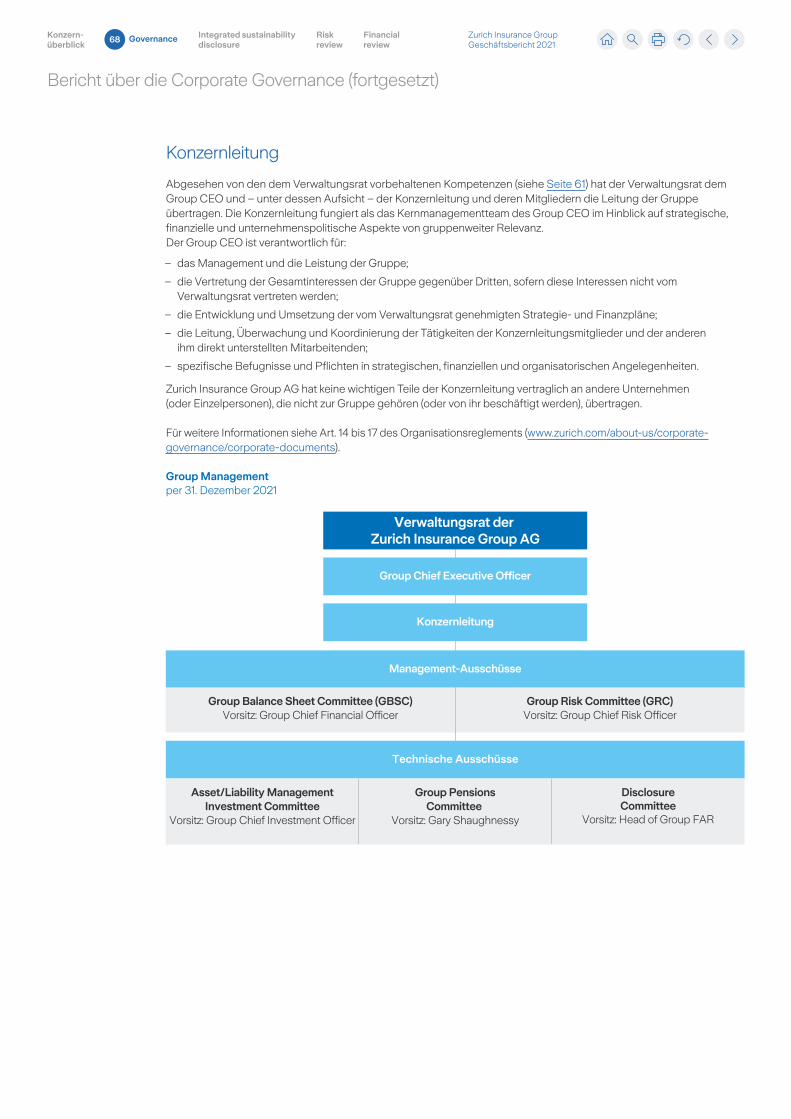
Bericht über die Corporate Governance (fortgesetzt)
Konzernleitung
Abgesehen von den dem Verwaltungsrat vorbehaltenen Kompetenzen (siehe Seite 61) hat der Verwaltungsrat dem Group CEO und – unter dessen Aufsicht – der Konzernleitung und deren Mitgliedern die Leitung der Gruppe übertragen. Die Konzernleitung fungiert als das Kernmanagementteam des Group CEO im Hinblick auf strategische, finanzielle und unternehmenspolitische Aspekte von gruppenweiter Relevanz. Der Group CEO ist verantwortlich für:
– das Management und die Leistung der Gruppe;
– die Vertretung der Gesamtinteressen der Gruppe gegenüber Dritten, sofern diese Interessen nicht vom Verwaltungsrat vertreten werden;
– die Entwicklung und Umsetzung der vom Verwaltungsrat genehmigten Strategie und Finanzpläne;
– die Leitung, Überwachung und Koordinierung der Tätigkeiten der Konzernleitungsmitglieder und der anderen ihm direkt unterstellten Mitarbeitenden;
– spezifische Befugnisse und Pflichten in strategischen, finanziellen und organisatorischen Angelegenheiten.
Zurich Insurance Group AG hat keine wichtigen Teile der Konzernleitung vertraglich an andere Unternehmen (oder Einzelpersonen), die nicht zur Gruppe gehören (oder von ihr beschäftigt werden), übertragen.
Für weitere Informationen siehe Art. 14 bis 17 des Organisationsreglements (www.zurich.com/aboutus/corporate governance/corporatedocuments).
Group Managementper 31. Dezember 2021
Verwaltungsrat der Zurich Insurance Group AG
Group Chief Executive Officer
Konzernleitung
Management-Ausschüsse
Technische Ausschüsse
Group Balance Sheet Committee (GBSC)Vorsitz: Group Chief Financial Officer
DisclosureCommittee
Vorsitz: Head of Group FAR
Group PensionsCommittee
Vorsitz: Gary Shaughnessy
Group Risk Committee (GRC)Vorsitz: Group Chief Risk Officer
Asset/Liability ManagementInvestment Committee
Vorsitz: Group Chief Investment Officer
Zurich Insurance Group Geschäftsbericht 2021
Konzern-überblick
Integrated sustainability disclosure
Governance Risk review
Financial review
68
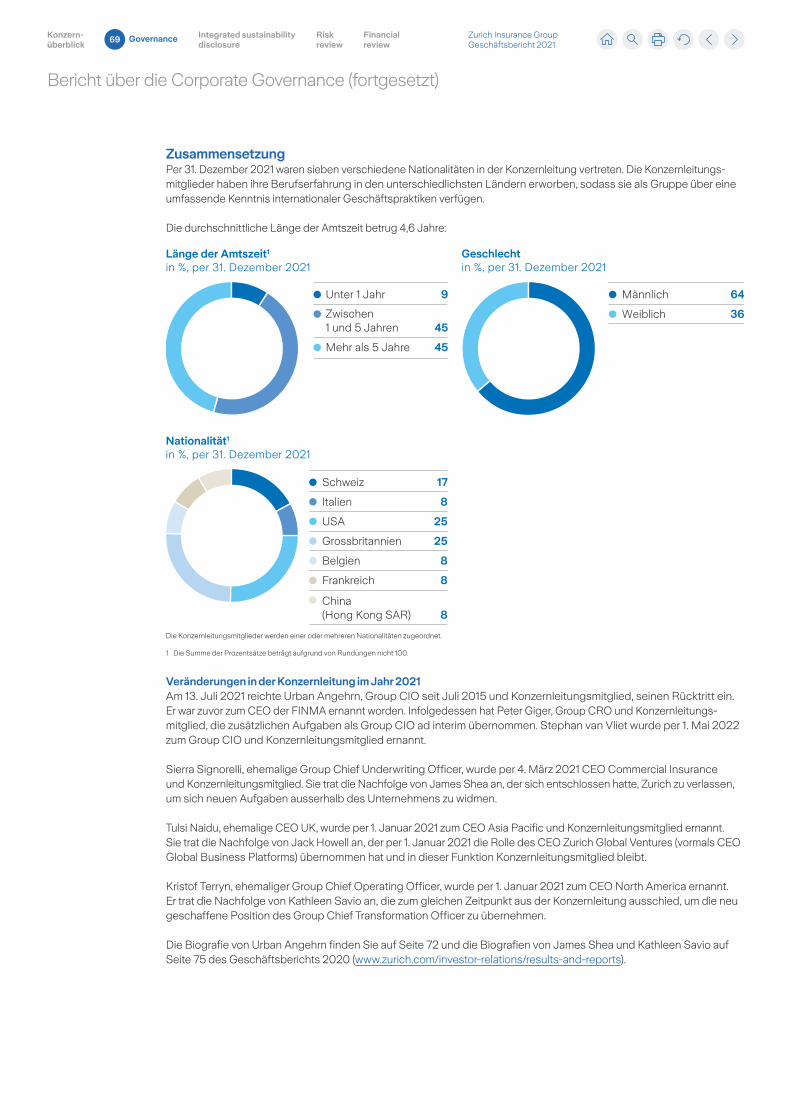
Bericht über die Corporate Governance (fortgesetzt)
ZusammensetzungPer 31. Dezember 2021 waren sieben verschiedene Nationalitäten in der Konzernleitung vertreten. Die Konzernleitungsmitglieder haben ihre Berufserfahrung in den unterschiedlichsten Ländern erworben, sodass sie als Gruppe über eine umfassende Kenntnis internationaler Geschäftspraktiken verfügen.
Die durchschnittliche Länge der Amtszeit betrug 4,6 Jahre:
Veränderungen in der Konzernleitung im Jahr 2021Am 13. Juli 2021 reichte Urban Angehrn, Group CIO seit Juli 2015 und Konzernleitungsmitglied, seinen Rücktritt ein. Er war zuvor zum CEO der FINMA ernannt worden. Infolgedessen hat Peter Giger, Group CRO und Konzernleitungsmitglied, die zusätzlichen Aufgaben als Group CIO ad interim übernommen. Stephan van Vliet wurde per 1. Mai 2022 zum Group CIO und Konzernleitungsmitglied ernannt.
Sierra Signorelli, ehemalige Group Chief Underwriting Officer, wurde per 4. März 2021 CEO Commercial Insurance und Konzernleitungsmitglied. Sie trat die Nachfolge von James Shea an, der sich entschlossen hatte, Zurich zu verlassen, um sich neuen Aufgaben ausserhalb des Unternehmens zu widmen.
Tulsi Naidu, ehemalige CEO UK, wurde per 1. Januar 2021 zum CEO Asia Pacific und Konzernleitungsmitglied ernannt. Sie trat die Nachfolge von Jack Howell an, der per 1. Januar 2021 die Rolle des CEO Zurich Global Ventures (vormals CEO Global Business Platforms) übernommen hat und in dieser Funktion Konzernleitungsmitglied bleibt.
Kristof Terryn, ehemaliger Group Chief Operating Officer, wurde per 1. Januar 2021 zum CEO North America ernannt. Er trat die Nachfolge von Kathleen Savio an, die zum gleichen Zeitpunkt aus der Konzernleitung ausschied, um die neu geschaffene Position des Group Chief Transformation Officer zu übernehmen.
Die Biografie von Urban Angehrn finden Sie auf Seite 72 und die Biografien von James Shea und Kathleen Savio auf Seite 75 des Geschäftsberichts 2020 (www.zurich.com/investorrelations/resultsandreports).
Geschlechtin %, per 31. Dezember 2021
Länge der Amtszeit1
in %, per 31. Dezember 2021
Männlich 64
Weiblich 36
Unter 1 Jahr 9
Zwischen 1 und 5 Jahren 45
Mehr als 5 Jahre 45
Nationalität1
in %, per 31. Dezember 2021
Schweiz 17
Italien 8
USA 25
Grossbritannien 25
Belgien 8
Frankreich 8
China (Hong Kong SAR) 8
Die Konzernleitungsmitglieder werden einer oder mehreren Nationalitäten zugeordnet.
1 Die Summe der Prozentsätze beträgt aufgrund von Rundungen nicht 100.
Zurich Insurance Group Geschäftsbericht 2021
Konzern-überblick
Integrated sustainability disclosure
Governance Risk review
Financial review
69
Bericht über die Corporate Governance (fortgesetzt)
Biografien Mario GrecoGroup Chief Executive Officer
Jahrgang: 1959
Fähigkeiten und Erfahrung Mario Greco stiess im März 2016 als Group Chief Executive Officer und Mitglied der Konzernleitung zu Zurich. Herr Greco begann seine berufliche Laufbahn im Bereich Management Consulting. Von 1986 bis 1994 war er für McKinsey & Company in Mailand tätig, wo er 1992 Partner und später Partner Leader im Bereich Versicherungen wurde. 1995 stiess er als Leiter der Schadenabteilung zur RAS (Allianz Gruppe) in Mailand. Im drauffolgenden Jahr wurde er zum General Manager für das Versicherungsgeschäft und 1998 zu dessen Managing Director ernannt. Im Jahre 2000 wurde er CEO des Unternehmens. Ende 2004 berief man ihn in die Geschäftsleitung der Allianz AG, wo er für das Geschäft in Frankreich, Italien, Spanien, Portugal, Griechenland und der Türkei verantwortlich zeichnete. Im April 2005 wechselte Mario Greco zur Sanpaolo IMI Group in Mailand, wo er als CEO von EurizonVita tätig war. Im Oktober 2005 wurde er zum CEO der Eurizon Financial Group ernannt. Von 2007 bis 2012 war er bei Zurich tätig. Zuerst als CEO Global Life und von 2010 als CEO General Insurance. 2012 wurde er zum CEO von Generali ernannt.
Externe Ernennungen Mario Greco ist Vorsitzender des PanEuropean Insurance Forum und Vorstandsmitglied der SwissAmerican Chamber of Commerce. Zudem ist er Mitglied des International Advisory Council der Bocconi Universität, Mitglied der Executive Faculty und des EMBA X Advisory Board an der Universität St.Gallen (HSG) und Mitglied des Beirats des Department of Economics an der Universität Zürich.
Ausbildung Mario Greco hat einen Bachelorabschluss in Wirtschaftswissenschaften der Universität Rom sowie einen Master in International Economics and Monetary Theory der Universität Rochester im Bundesstaat New York (USA).
Ericson ChanGroup Chief Information and Digital Officer
Jahrgang: 1966
Fähigkeiten und Erfahrung Vor seinem Eintritt bei Zurich im Oktober 2020 als Group Chief Information and Digital Officer sowie Mitglied der Konzernleitung hat Ericson Chan umfassende Erfahrungen im Bereich Technologieführerschaft gewonnen. Von 2016 bis 2020 war er CEO von Ping An Technology, wo er dazu beitrug, mithilfe digitaler Dienstleistungen einschliesslich verschiedener FintechProdukte und OnlinePlattformen das Geschäftsmodell und die OnlineÖkosysteme der Ping An Group zu transformieren. Von 1998 bis 2016 bekleidete Ericson Chan verschiedene Führungspositionen im Technologie und operativen Bereich bei Standard Chartered Bank in Hongkong, Shanghai und Singapur. Unter anderem war er Chief Information Officer für Nordasien, Head of Corporate & Investment Banking Operations in China sowie Global Head of Consumer Banking Technology. Zudem hat er während sechs Jahren in den USA Erfahrung im Healthtech Sektor gesammelt.
Externe Ernennungen Ericson Chan ist Mitglied des Beratungsausschusses für Finanzinfrastruktur der Hong Kong Monetary Authority und Boardmitglied des Centre for Finance, Technology and Entrepreneurship in London. Ferner ist er Verwaltungsratspräsident des Jane Goodall Institute in Hongkong und Mitglied des Advisory Board der University of Wisconsin School of Business.
Ausbildung Ericson Chan besitzt einen Bachelor of Science der University of Wisconsin Madison in Computerwissenschaften und einen MBA des Edgewood College in Madison, Wisconsin.
Jeff DaileyCEO of Farmers Group, Inc.
Jahrgang: 1957
Fähigkeiten und Erfahrung Jeff Dailey begann seine Karriere 1980 bei der Mutual Service Insurance Company und war bald auch für die Progressive Insurance Company tätig. Er gründete später die Reliant Insurance Company, ein StartupUnternehmen im Bereich Autoversicherungen, das sich im Besitz der Reliance Group Holdings befand und 2001 an Bristol West Holdings, Inc. verkauft wurde. Von 2001 bis 2003 war Herr Dailey Chief Operating Officer (COO) von Bristol West Holdings, Inc. Im Jahr 2003 wurde er im Zuge des erfolgreichen Börsengangs des Unternehmens an der New Yorker Börse zum Präsidenten und COO und 2006 zum CEO von Bristol West Holdings, Inc. ernannt. Herr Dailey kam 2007 als Vizepräsident zu Farmers Group, Inc., als Farmers Bristol West Holdings, Inc. übernahm, und wurde 2008 zum Executive Vice President des Privatkundengeschäfts befördert. Im Januar 2011 wurde er zum Präsidenten und COO von Farmers Group, Inc. ernannt. Im Februar 2011 wurde er Mitglied des Verwaltungsrats der Farmers Group, Inc. und ist seit Oktober 2015 deren Verwaltungsratspräsident. Per Januar 2012 wurde er in seine aktuelle Funktion als CEO von Farmers Group, Inc. sowie in die Konzernleitung berufen.
Externe Ernennungen Herr Dailey ist Mitglied des Stiftungsrats von The Institutes und des Beirats von Team Rubicon, einer Katastrophenhilfeorganisation, die Militärveteranen, Ersthelfer, medizinische Fachkräfte und Technologieexperten zusammenbringt.
Ausbildung Herr Dailey besitzt einen Bachelor der University of WisconsinMadison in Volkswirtschaft und einen Master der University of WisconsinMilwaukee in Betriebswirtschaft.
Zurich Insurance Group Geschäftsbericht 2021
Konzern-überblick
Integrated sustainability disclosure
Governance Risk review
Financial review
70
Bericht über die Corporate Governance (fortgesetzt)
Peter GigerGroup Chief Risk Officer und Group Chief Investment Officer ad interim
Jahrgang: 1964
Fähigkeiten und Erfahrung Peter Giger verfügt über umfangreiche Erfahrung in der Versicherungs und Rückversicherungsbranche, unter anderem in den Bereichen Finanzen, Risikomanagement, Strategie, Underwriting und Regulierungsmanagement. Er wurde im Oktober 2019 zum Group Chief Risk Officer und Mitglied der Konzernleitung der Zurich berufen und übernahm im Juli 2021 die zusätzlichen Aufgaben als Group Chief Investment Officer auf Interimsbasis. Davor war er von 2014 bis 2018 vier Jahre lang als Leiter des Geschäftsbereichs Versicherungen der Eidgenössischen Finanzmarktaufsicht (FINMA) tätig. In dieser Zeit war er zudem stellvertretender Direktor der FINMA und Mitglied der Geschäftsleitung. In seiner Zeit bei der FINMA vertrat er die Schweiz bei internationalen Organisationen, führte Standardverfahrensprozeduren und richtlinien ein und war massgeblich beteiligt an der Konsolidierung des Modells für den Schweizer Solvenztest. Von 2002 bis 2014 hatte er Führungspositionen bei Zurich inne, einschliesslich der Position des CFO des Geschäftsbereichs General Insurance von 2010 bis 2014. Davor leitete er von 1999 bis 2002 den Bereich Structured Finance bei Swiss Re. Seine berufliche Laufbahn begann Peter Giger bei Zurich, wo er von 1992 bis 1999 eine Reihe von Führungspositionen innehatte.
Externe Ernennungen Im Februar 2020 wurde Peter Giger Mitglied des Beirats des ETH Risk Center Advisory Board. Seit Oktober 2019 ist er Mitglied des CRO Forum und wurde im Oktober 2020 zum Vizepräsidenten gewählt.
Ausbildung Peter Giger hat einen Doktortitel in Betriebswirtschaft der Universität Zürich und einen Lizentiatsabschluss in Betriebswirtschaft mit Schwerpunkt IT der Universität St.Gallen (HSG).
Jack HowellCEO Zurich Global Ventures
Jahrgang: 1970
Fähigkeiten und Erfahrung Jack Howell hat über 25 Jahre Berufserfahrung im Finanzdienstleistungsbereich, davon über 15 Jahre in verschiedenen Führungspositionen bei Versicherungsgesellschaften in Asien. Vor seiner Berufung zu Zurich war Herr Howell Regional Officer für Asien für Assicurazioni Generali mit Sitz in Hongkong. Davor war er bei Prudential plc Group tätig; zuerst für kurze Zeit als CEO und President Director für PT Prudential Life Assurance Indonesia und dann fast sechs Jahre als CEO von Prudential Vietnam Assurance. Vor seiner Tätigkeit bei Prudential hatte er verschiedene Positionen bei AIG auf den Philippinen, in Hongkong und New York inne. Daneben war er einer der Gründer einer InvestmentbankBoutique namens TwentyTen und arbeitete mehrere Jahre als Berater, unter anderem für The Boston Consulting Group. Herr Howell kam im September 2016 als CEO Asia Pacific zu Zurich und gehört seit Oktober 2016 der Konzernleitung an. Er wurde per 1. Januar 2021 zum CEO Global Business Platforms ernannt. Global Business Platforms wurde inzwischen in Zurich Global Ventures umbenannt.
Externe Ernennungen Keine.
Ausbildung Herr Howell verfügt über einen MBA der Universität Chicago sowie einen Bachelor of Science in quantitativer Ökonomie der Tufts University in Massachusetts.
Biografien (fortgesetzt)
Alison Martin CEO EMEA (Europe, Middle East & Africa) und Bank Distribution
Jahrgang: 1974
Fähigkeiten und Erfahrung Alison Martin verfügt über eine umfangreiche Management, Finanz und Geschäftserfahrung in der Versicherungsbranche. Sie wurde im Juli 2019 zum Chief Executive Officer Europe, Middle East & Africa (EMEA) und Bank Distribution ernannt und ist verantwortlich für Nachhaltigkeit bei Zurich Insurance Group. Davor war sie von Januar 2018 bis September 2019 Group Chief Risk Officer. Alison Martin begann ihre Karriere als zertifizierte Wirtschaftsprüferin bei PwC, wo sie von 1995 bis 2003 mit Versicherungskunden in Prüfungs und Beratungsfunktionen zusammenarbeitete. Anschliessend hatte sie Führungspositionen bei Swiss Re inne, wo sie 2003 als Finance Director Life & Health eintrat. Ab Januar 2011 arbeitete sie als Group Managing Director der Life & Health Products Division. Im Jahr 2013 wurde sie zum Head of Life & Health Business Management von Swiss Re ernannt. In dieser Position war sie tätig, bis sie 2017 als designierter Group Chief Risk Officer und Mitglied der Konzernleitung zu Zurich stiess.
Externe Ernennungen Im Juni 2019 wurde Alison Martin zum Vorstandsmitglied der BritischSchweizerischen Handelskammer ernannt.
Ausbildung Frau Martin schloss 1995 die University of Birmingham mit einen Bachelor in Rechtswissenschaften mit Auszeichnung ab. Seit 1998 ist sie Associate Member des Institute of Chartered Accountants in England and Wales. 2010 erlangte sie das Chartered Financial Analyst Investment Management Certificate.
Zurich Insurance Group Geschäftsbericht 2021
Konzern-überblick
Integrated sustainability disclosure
Governance Risk review
Financial review
71
Bericht über die Corporate Governance (fortgesetzt)
Biografien (fortgesetzt)
Tulsi Naidu CEO Asia Pacific
Jahrgang: 1973
Fähigkeiten und Erfahrung Tulsi Naidu wurde per 1. Januar 2021 zur CEO Asia Pacific und zum Mitglied der Konzernleitung ernannt. Sie verfügt über mehr als 25 Jahre Erfahrung im Finanzdienstleistungsbereich in Europa und Asien, sowohl im Lebens als auch im Sachversicherungsgeschäft, zuletzt als CEO von Zurich UK seit November 2016. Bevor sie im September 2016 als Head of Business Development for Europe, Middle East & Africa zu Zurich stiess, war Tulsi Naidu 14 Jahre lang bei Prudential in verschiedenen Führungspositionen im britischen und europäischen Geschäft des Unternehmens tätig. Davor bekleidete sie Positionen bei Credit Suisse First Boston, ICICI und Arthur Andersen an Standorten wie Mumbai, Hongkong und Singapur. Sie ist ehemalige Vorsitzende des Practitioner Panel der britischen Financial Conduct Authority.
Externe Ernennungen Tulsi Naidu ist Mitglied des Verwaltungsrats von Wipro Ltd.
Ausbildung Tulsi Naidu hat einen BachelorAbschluss in Mathematik, Wirtschaftswissenschaften und Statistik des Nizam College in Hyderabad und schloss ein Nachdiplomstudium in Management des Indian Institute of Management in Ahmedabad ab.
Laurence MauriceCEO Latin America
Jahrgang: 1965
Fähigkeiten und Erfahrung Laurence Maurice verfügt über umfangreiche Erfahrung in der Versicherungsbranche und in der organisatorischen Umgestaltung. Vor ihrem Eintritt bei Zurich im Oktober 2020 als CEO Latin America und Mitglied der Konzernleitung fungierte Laurence Maurice fünf Jahre lang als CEO of Spain und Head of Southern Europe von Allianz Partners. Während dieser Zeit überarbeitete sie die Strategie und unterstützte die globale Umgestaltung ihres Unternehmens. Davor verbrachte sie sieben Jahre als Global CFO bei Allianz Global Assistance sowie sieben Jahre als CFO Brazil und dann CFO Latin America von Allianz Seguros. Davor war Laurence Maurice als Head of Business Division und Head of International Internal Audit bei Allianz France tätig. Ihre berufliche Laufbahn hatte sie bei PWC begonnen.
Externe Ernennungen Keine.
Ausbildung Frau Maurice besitzt einen Abschluss in Ingenieurwissenschaften der SupAgro Montpellier sowie einen Master in Rechnungsprüfung der ESCP Europe.
George QuinnGroup Chief Financial Officer
Jahrgang: 1966
Fähigkeiten und Erfahrung George Quinn begann seine Karriere 1988 bei KPMG in London, wo er verschiedene Positionen in Zusammenarbeit mit der Versicherungs und Rückversicherungswirtschaft bekleidete. Im Jahr 1999 stiess er als Group Chief Accounting Officer zu Swiss Re in Zürich und wurde später Chief Financial Officer (CFO) für die Geschäftseinheit Financial Services der Swiss Re Group. 2005 wurde er Regional Chief Financial Officer von Swiss Re Americas in New York. Von März 2007 bis 2014 amtete er als Chief Financial Officer für Swiss Re Group. Im Mai 2014 stiess er als Group CFO und Mitglied der Konzernleitung zu Zurich.
Externe Ernennungen Herr Quinn ist Mitglied des Finance Chapters der SchweizerischAmerikanischen Handelskammer.
Ausbildung Herr Quinn verfügt über einen Abschluss der Universität Strathclyde in Ingenieurwissenschaften. Er ist Mitglied des Institute of Chartered Accountants in England und Wales.
Zurich Insurance Group Geschäftsbericht 2021
Konzern-überblick
Integrated sustainability disclosure
Governance Risk review
Financial review
72
Bericht über die Corporate Governance (fortgesetzt)
Sierra SignorelliCEO Commercial Insurance
Jahrgang: 1975
Fähigkeiten und Erfahrung Sierra Signorelli wurde im März 2021 zum CEO Commercial Insurance und als Mitglied der Konzernleitung ernannt. Sie verfügt über umfassende Erfahrung in der Versicherungsbranche und war ab September 2020 als Group Chief Underwriting Officer von Zurich und zuvor nach ihrem Eintritt in das Unternehmen im Jahr 2017 als Chief Underwriting Officer, Commercial Insurance tätig. Ihre frühere Erfahrung umfasst 17 Jahre bei American International Group, wo sie verschiedene leitende Positionen im Fachbereich Global Specialties des Versicherers innehatte, unter anderem als Global Chief Underwriting Officer, Specialty Lines, als Specialty Executive in der Region AsienPazifik und als Global Head of Network Partner Practice.
Externe Ernennungen Keine.
Ausbildung Sierra Signorelli verfügt über einen Bachelor of Science in Umweltwissenschaft der University of California, Santa Barbara. Sie absolvierte zudem das Stanford Executive Program an der Stanford University School of Business.
Kristof TerrynCEO North America
Jahrgang: 1967
Fähigkeiten und Erfahrung Kristof Terryn begann seine berufliche Laufbahn 1993 im Bankgeschäft, wo er im Bereich Kapitalmärkte tätig war. 1997 wechselte er zu McKinsey & Company und war dort in unterschiedlichen Positionen im Finanzdienstleistungsbereich in Brüssel und Chicago tätig. 2004 begann er seine Tätigkeit für Zurich in der Finanzabteilung. Im Jahr 2007 wurde er Chief Operating Officer für den Geschäftsbereich Global Corporate und übernahm im Januar 2009 die Position des Chief Operating Officer für das Segment General Insurance. Herr Terryn wurde 2010, anlässlich seiner Ernennung zum Group Head Operations, Mitglied der Konzernleitung. Er wurde im September 2013 zum CEO Global Life ernannt und im Oktober 2015 zum CEO General Insurance, blieb jedoch CEO Global Life ad interim bis Ende Dezember 2015. Im Juli 2016 wurde er zum Group Chief Operating Officer ernannt. Am 1. Januar 2021 übernahm Herr Terryn die Rolle des CEO North America.
Externe Ernennungen Herr Terryn ist Vorstandsmitglied der American Property Casualty Insurance Association (APCIA) sowie der St. John’s School of Risk Management.
Ausbildung Kristof Terryn schloss sein Rechts und Wirtschaftsstudium an der Universität von Leuven, Belgien, ab und erwarb einen MBA an der Universität von Michigan.
Biografien (fortgesetzt)
Zurich Insurance Group Geschäftsbericht 2021
Konzern-überblick
Integrated sustainability disclosure
Governance Risk review
Financial review
73
Bericht über die Corporate Governance (fortgesetzt)
Management-Ausschüsse Zur Vereinfachung der Koordination und Abstimmung der dem Group CEO zur Genehmigung vorzulegenden Empfehlungen zu spezifischen Themen wurden für Schlüsselbereiche die folgenden funktionsübergreifenden Ausschüsse eingerichtet.
Group Balance Sheet Committee (GBSC)Mitglieder: Group CFO (Vorsitzender), Group CEO, Group CRO, Group CIO. Der Group General Counsel nimmt ex officio an den Sitzungen teil, ist aber kein stimmberechtigtes Mitglied.
Hauptaufgaben und Verantwortlichkeiten: Das GBSC dient als funktionsübergreifendes Beratungsgremium für Angelegenheiten, die die Finanzlage der gesamten Gruppe wesentlich beeinflussen könnten. Der Ausschuss legt dem Group CEO Empfehlungen vor.
Das GBSC überwacht alle wichtigen Bestimmungsfaktoren der Bilanz, wie Transaktionen, Kapitalmanagement, Rückversicherung, Asset/Liability Management, Dividenden und Aktienrückkaufprogramme, Liquidität, Verschuldung, Ratingagenturen und andere bilanzbezogene Angelegenheiten und Themen, wie sie vom internen ökonomischen Kapitalmodell einschliesslich Zurich Economic Capital Model (ZECM), RiskBased Capital (RBC) und verwandter Modelle wie SST und Solvabilität II erfasst werden.
Die Überwachung geschieht dadurch, dass mit diesen Bereichen verbundene Pläne, Richtlinien und spezifische Transaktionen regelmässig überprüft werden und dem Group CEO sowie gegebenenfalls den zuständigen Entscheidungsorganen und ManagementAusschüssen der Gruppe geeignete Massnahmen empfohlen werden.
Zentrale Themen sind:
– Kapitalmanagement bei Eigenkapitalzuteilungen und Entscheidungen zur Kreditaufnahme und Kreditgewährung;
– Strategie für das Ratingmanagement und Management der Zielratings;
– Bilanzplanung bezüglich Strategien zu Liquidität, Solvabilität, Anlagen und Asset/Liability Management und der damit verbundenen Eigenkapitalzuteilung, einschliesslich Änderungen bei der Anlagestrategie;
– Fragen der Geschäftsentwicklung bei Unternehmenstransaktionen mit Dritten, interne Umstrukturierung, Kapitalanlagen einschliesslich Immobilien und Einstieg in neue Arten von Geschäften und Märkten;
– wesentliche Rückversicherungsstrategien und Rückversicherungsprogramme der Gruppe;
– andere vom Vorsitzenden des GBSC festgelegte Themen, die einen wesentlichen Einfluss auf die Bilanz der Gruppe haben.
Group Risk Committee (GRC)Mitglieder: Group CRO (Vorsitzender), Group CFO, Group CIO, CEO EMEA und Bank Distribution1, CEO Commercial Insurance2, Group General Counsel. Der Head of Group Audit und der Group Chief Compliance Officer werden ex officio zu den Sitzungen eingeladen, sind aber keine stimmberechtigten Mitglieder.
Hauptaufgaben und Verantwortlichkeiten: Die wichtigste Aufgabe des GRC ist, hinsichtlich der Aktivitäten im Zusammenhang mit dem Gesamtrisikoprofil der Gruppe, einschliesslich u. a. Versicherungs, Finanzmarkt, Kredit sowie operativer, strategischer und Reputationsrisiken, Empfehlungen zu überprüfen und gegenüber dem Group CEO auszusprechen.
Das GRC überprüft und spricht Empfehlungen zu Themen aus wie:
– die Gesamtrisikobereitschaft, toleranz und limiten der Gruppe sowie das aggregierte Risikoprofil und die Risikopositionen im Vergleich zu den erklärten Risikotoleranzen und limiten der Gruppe;
– Anfragen für den Vorstoss in neue Sparten des Versicherungsgeschäfts oder neue Arten der Versicherungsdeckung mit erheblichen Auswirkungen auf das Risikoprofil der Gruppe;
– Änderungen der wesentlichen Grundsätze und Verfahren des Risikomanagements, der ZRP sowie Ausnahmen von Limiten, wie sie die ZRP vorsieht;
– wesentliche Elemente von aufsichtsrechtlichen Meldeverfahren (insbesondere SST, Group ORSABericht und Sanierungsplan der Gruppe);
– das gesamte interne Kontrollsystem der Gruppe und die internen Betriebskontrollen;
– zukünftige Änderungen an den Kapitalmodellen und den Kapitalansätzen mit erheblichen Auswirkungen auf die ökonomischen Solvabilitätsquoten;
– die Politik der Gruppe hinsichtlich der Modellvalidierung und Validierungsergebnisse in Bezug auf die Kapitalmodelle und bedeutende Bewertungsmodelle, einschliesslich Abhilfemassnahmen;
– deutliche Abweichungen von festgelegten Solvabilitätszielen durch Tochtergesellschaften; bei Bedarf werden Abhilfemassnahmen vorgeschlagen.
1 Die CEO EMEA und Bank Distribution ist Mitglied des GRC aufgrund ihrer Verantwortung für das Life Business Management (inkl. Underwriting und Schadenbearbeitung für Lebensversicherungen).
2 Die CEO Commercial Insurance ist Mitglied des GRC aufgrund ihrer zusätzlichen Verantwortung für Underwriting und Schadenbearbeitung für Schaden und Unfallversicherungen.
Zurich Insurance Group Geschäftsbericht 2021
Konzern-überblick
Integrated sustainability disclosure
Governance Risk review
Financial review
74
Bericht über die Corporate Governance (fortgesetzt)
Technische AusschüsseNeben ManagementAusschüssen sieht die Führungsstruktur der Gruppe auch mit Fragen technischer Art befasste Ausschüsse vor, die sich mit weiteren Aspekten der Geschäftstätigkeit von Zurich beschäftigen. Dazu gehören:
Das Asset/Liability Management Investment Committee unter der Leitung des Group CIO ist als bereichsübergreifendes Organ in erster Linie für die Überwachung und Prüfung des Asset/Liability Management der Gruppe und die strategische AssetAllocation der angelegten Aktiven von Zurich zuständig.
Das Group Pensions Committee unter der Leitung von Gary Shaughnessy ist für die Entwicklung, Überprüfung und beratende Betreuung der GovernanceStruktur der Gruppe für Angelegenheiten im Zusammenhang mit Altersvorsorgevereinbarungen und anderen Vorsorgeleistungen verantwortlich. Es ist für die Aufsicht und Beratung in den Bereichen Markt, Demografie und Reputationsrisiko zuständig. Es berichtet dem GBSC und legt diesem Empfehlungen zu wesentlichen pensionsbezogenen Angelegenheiten vor und berichtet regelmässig an den Vergütungsausschuss.
Das Disclosure Committee unter der Leitung des Head of Group Financial Accounting and Reporting (FAR) ist für die Prüfung sämtlicher externer Kommunikation und Offenlegung von Informationen verantwortlich, die für die Finanz und Kapitallage und/oder die Ertragskraft der Gruppe von wesentlicher Bedeutung sind. Es prüft insbesondere die Halbjahres und Jahresergebnisse nach IFRS sowie die Zwischenberichte der Gruppe am Ende des ersten und dritten Quartals und die damit zusammenhängenden Dokumente, wie diesbezügliche Pressemitteilungen und Analysteninformationen. Es prüft ferner andere externe Mitteilungen, die Informationen oder Hinweise zum Ertrag in Bezug auf die aktuelle oder künftige Berichtsperioden enthalten, sowie externe Unterlagen, die gemäss den geltenden gesetzlichen Bestimmungen und Vorschriften im Zusammenhang mit öffentlichen Finanzierungstransaktionen oder öffentlich angekündigten Aktienrückkaufprogrammen erforderlich sind, sowie nichtfinanzielle Berichte und den Sustainability Report. Es überprüft auch die Kontrollsysteme und Verfahren hinsichtlich der Effektivität der internen Kontrollmechanismen der Gruppe im Zusammenhang mit der Finanzberichterstattung. Es legt dem Group CFO Empfehlungen vor.
Zurich Insurance Group Geschäftsbericht 2021
Konzern-überblick
Integrated sustainability disclosure
Governance Risk review
Financial review
75
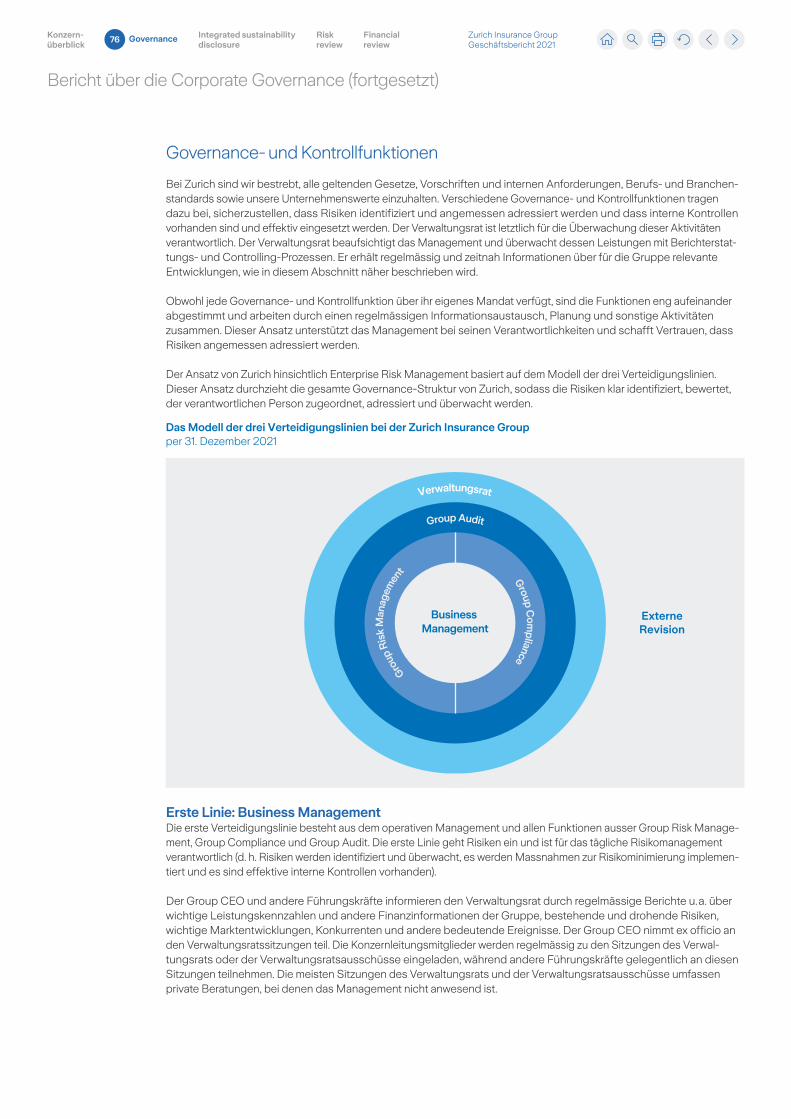
Bericht über die Corporate Governance (fortgesetzt)
Governance und Kontrollfunktionen
Bei Zurich sind wir bestrebt, alle geltenden Gesetze, Vorschriften und internen Anforderungen, Berufs und Branchenstandards sowie unsere Unternehmenswerte einzuhalten. Verschiedene Governance und Kontrollfunktionen tragen dazu bei, sicherzustellen, dass Risiken identifiziert und angemessen adressiert werden und dass interne Kontrollen vorhanden sind und effektiv eingesetzt werden. Der Verwaltungsrat ist letztlich für die Überwachung dieser Aktivitäten verantwortlich. Der Verwaltungsrat beaufsichtigt das Management und überwacht dessen Leistungen mit Berichterstattungs und ControllingProzessen. Er erhält regelmässig und zeitnah Informationen über für die Gruppe relevante Entwicklungen, wie in diesem Abschnitt näher beschrieben wird.
Obwohl jede Governance und Kontrollfunktion über ihr eigenes Mandat verfügt, sind die Funktionen eng aufeinander abgestimmt und arbeiten durch einen regelmässigen Informationsaustausch, Planung und sonstige Aktivitäten zusammen. Dieser Ansatz unterstützt das Management bei seinen Verantwortlichkeiten und schafft Vertrauen, dass Risiken angemessen adressiert werden.
Der Ansatz von Zurich hinsichtlich Enterprise Risk Management basiert auf dem Modell der drei Verteidigungslinien. Dieser Ansatz durchzieht die gesamte GovernanceStruktur von Zurich, sodass die Risiken klar identifiziert, bewertet, der verantwortlichen Person zugeordnet, adressiert und überwacht werden.
Erste Linie: Business ManagementDie erste Verteidigungslinie besteht aus dem operativen Management und allen Funktionen ausser Group Risk Management, Group Compliance und Group Audit. Die erste Linie geht Risiken ein und ist für das tägliche Risikomanagement verantwortlich (d. h. Risiken werden identifiziert und überwacht, es werden Massnahmen zur Risikominimierung implementiert und es sind effektive interne Kontrollen vorhanden).
Der Group CEO und andere Führungskräfte informieren den Verwaltungsrat durch regelmässige Berichte u. a. über wichtige Leistungskennzahlen und andere Finanzinformationen der Gruppe, bestehende und drohende Risiken, wichtige Marktentwicklungen, Konkurrenten und andere bedeutende Ereignisse. Der Group CEO nimmt ex officio an den Verwaltungsratssitzungen teil. Die Konzernleitungsmitglieder werden regelmässig zu den Sitzungen des Verwaltungsrats oder der Verwaltungsratsausschüsse eingeladen, während andere Führungskräfte gelegentlich an diesen Sitzungen teilnehmen. Die meisten Sitzungen des Verwaltungsrats und der Verwaltungsratsausschüsse umfassen private Beratungen, bei denen das Management nicht anwesend ist.
Group
Ris
k M
anag
emen
t
Group C
ompliance
Group Audit
Verwaltungsrat
Business Management
Das Modell der drei Verteidigungslinien bei der Zurich Insurance Groupper 31. Dezember 2021
ExterneRevision
Zurich Insurance Group Geschäftsbericht 2021
Konzern-überblick
Integrated sustainability disclosure
Governance Risk review
Financial review
76
Bericht über die Corporate Governance (fortgesetzt)
Der Verwaltungsratspräsident traf sich im Jahr 2021 regelmässig mit dem Group CEO. Der Verwaltungsratspräsident trifft sich ausserhalb der regulären Verwaltungsratssitzungen gelegentlich mit anderen Konzernleitungsmitgliedern und dem Management. Ebenso verfahren auch die anderen Verwaltungsratsmitglieder, sie treffen sich insbesondere mit dem Group CFO und dem Group CRO.
Die Gruppe besitzt ein Informations und Finanzberichtssystem. Die Jahresplanung der Gruppe, zu der eine Übersicht der finanziellen und operativen Kennzahlen gehört, wird von der Konzernleitung detailliert überprüft und vom Verwaltungsrat genehmigt. Die Prognosen für das Gesamtjahr werden bei Bedarf angepasst, um veränderte Sensitivitäten und Risiken zu berücksichtigen, die sich auf die Ergebnisse der Gruppe auswirken können. Beim Auftreten von Abweichungen werden gegebenenfalls geeignete Massnahmen ergriffen. Diese Informationen werden von Konzernleitung und Verwaltungsrat regelmässig überprüft.
Zweite Linie: Group Risk Management und Group ComplianceDie zweite Verteidigungslinie besteht aus den beiden Kontrollfunktionen Group Risk Management und Group Compliance.
Group Risk ManagementGroup Risk Management ist für das Enterprise Risk Management Framework von Zurich verantwortlich. Der Group CRO erstattet den SeniorManagementAusschüssen, dem Group CEO und dem Risiko und Investmentausschuss regelmässig Bericht über Risikofragen (z. B. in Form von vierteljährlichen Risikoberichten und updates). Informationen zum Enterprise Risk Management und zum internen Kontrollsystem der Gruppe finden Sie im Risk Review auf den Seiten 183 bis 214. Die Gruppe beschreibt diese Informationen in diesem Bericht über die Corporate Governance nicht mehr gesondert.
Group ComplianceGroup Compliance ist dafür verantwortlich, dem Management Sicherheit zu geben, dass die ComplianceRisiken im Rahmen ihres Mandats angemessen identifiziert und adressiert werden. Group Compliance hat folgende Aufgaben:
– dem Geschäft zu ermöglichen, seine ComplianceRisiken zu steuern;
– ein vertrauenswürdiger Berater zu sein;
– eine unabhängige Hinterfragung, Überwachung und Beurteilung vorzunehmen;
– das Management dabei zu unterstützen, die ComplianceKultur und Ethik zu fördern.
Group Compliance ist vertikal integriert, um ein globales Framework zu unterstützen, und wird vom Group Chief Compliance Officer geführt. Dieser ist direkt dem Group CEO unterstellt, wobei er als zweite Verteidigungslinie seine funktionale Unabhänigkeit wahrt. Der Group Chief Compliance Officer hat direkten Zugang zum Vorsitzenden des Prüfungsausschusses und angemessenen Zugang zum Verwaltungsratspräsidenten.
Group Compliance bietet eine unabhängige Sicht auf die massgeblichen ComplianceRisiken für das Geschäft, führt unabhängige risikobasierte Überwachungs und Beurteilungsaktivitäten durch und hinterfragt das Geschäft. Group Compliance übt ihre Tätigkeit gemäss dem Global Annual Compliance Plan aus. Jeder Annual Compliance Plan (Global, Regional, Local) ist ein risikobasierter Plan und muss auf der Grundlage einer unabhängigen zukunftsgerichteten Beurteilung der ComplianceRisiken erstellt werden, wobei die massgeblichen Risikotreiber aus dem internen wie auch dem externen Umfeld zu berücksichtigen sind.
Group Compliance vermittelt durch seine relevante und gezielte Berichterstattung Erkenntnisse zu ComplianceRisiken. Group Compliance liefert der Konzernleitung und dem Prüfungsausschuss im Rahmen der vierteljährlichen Berichterstattung Einblicke in die wichtigsten ComplianceTrends, Probleme und Risiken sowie in die Fortschritte in Bezug auf den Global Annual Compliance Plan, damit die Mitglieder des jeweiligen Organs fundierte Geschäftsentscheidungen treffen können. Die entsprechenden regionalen und lokalen Leitungsorgane erhalten Einblicke in relevante ComplianceThemen, einschliesslich der Fortschritte bei den jeweiligen risikobasierten Plänen. Durch diese Berichtsflüsse wird sichergestellt, dass die Organisation auf allen Ebenen die Erkenntnisse und Aktivitäten der Group Compliance einbezieht, um sich vor regulatorischen und geschäftlichen Risiken zu schützen.
Der Group Chief Compliance Officer definiert und erlässt die für die Gruppe relevanten ComplianceRichtlinien und legt geeignete Prozesse und Vorgaben fest. Group Compliance unterstützt eine starke ComplianceKultur in der gesamten Gruppe durch Schulungs und Aufklärungsinitiativen und pflegt den globalen Meldemechanismus für Bedenken. Zurich ermutigt ihre Mitarbeitenden, sich gegen regelwidriges Verhalten, das nach ihrer Einschätzung gesetzeswidrig oder unethisch ist oder gegen den Verhaltenskodex von Zurich oder gegen die Richtlinien der Gruppe verstösst, zu wehren und es zu melden. Die Mitarbeitenden können sich dazu an das Management oder die Personalabteilung, die Rechtsabteilung der Gruppe, die ComplianceFunktion oder die «Zurich Ethics Line» (oder entsprechende lokale Stellen) wenden. Die «Zurich Ethics Line» ist telefonisch oder per Internet zu erreichen und wird von einem unabhängigen externen Unternehmen betrieben. Zurich duldet keinerlei Vergeltungsmassnahmen gegenüber Mitarbeitenden, die Bedenken in gutem Glauben äussern.
Zurich Insurance Group Geschäftsbericht 2021
Konzern-überblick
Integrated sustainability disclosure
Governance Risk review
Financial review
77
Bericht über die Corporate Governance (fortgesetzt)
Dritte Linie: Group AuditDie Aufgabe von Group Audit besteht darin, für den Verwaltungsrat, den Prüfungsausschuss, den Group CEO und das Management sowie die Verwaltungsräte und Prüfungsausschüsse der Tochtergesellschaften eine unabhängige und objektive Beurteilung über die Angemessenheit und Effektivität des Risikomanagements, der internen Kontrollen und der GovernanceProzesse der Gruppe vorzunehmen.
Der Head of Group Audit untersteht funktional dem Vorsitzenden des Prüfungsausschusses und administrativ dem Group CEO. Group Audit trägt keine operative Verantwortung in den von ihm geprüften Bereichen, und um Unabhängigkeit zu gewährleisten, berichten alle Mitarbeitenden von Group Audit (über Audit Manager) an den Head of Group Audit. In einigen Fällen haben die Country Audit Manager auch eine Berichtslinie zum lokalen CEO, um die regulatorischen Anforderungen zu erfüllen.
Group Audit entwickelt einen risikobasierten Plan und aktualisiert ihn laufend, wenn sich die Risiken, mit denen das Unternehmen konfrontiert ist, ändern. Dieser Plan basiert auf dem Gesamtspektrum der Geschäftsrisiken der Gruppe und umfasst unter anderem Anliegen des Prüfungsausschusses, des Managements und anderer Anspruchsgruppen. Der Prüfungsausschuss genehmigt den Plan jährlich, und allfällige Änderungen des Plans werden vierteljährlich überprüft und genehmigt. Der Prüfungsplan für 2021 umfasste 472 Audits, wobei die wichtigsten Risiken und regulatorischen Anforderungen in der gesamten Gruppe berücksichtigt wurden.
Group Audit ist befugt, alle Bereiche der Gruppe zu prüfen, und hat uneingeschränkten Zugang zu allen Gruppenaktivitäten, Geschäftsbüchern, Aufzeichnungen, Vermögenswerten und Personen, die für die Erfüllung seiner Pflichten erforderlich sind. Group Audit berücksichtigt auch die Arbeit der anderen AssuranceFunktionen. Group Audit koordiniert seine Aktivitäten insbesondere mit der externen Revisionsstelle und tauscht mit dieser Risikobeurteilungen, Arbeitspläne, Revisionsberichte und Fortschritte bei der Umsetzung von Abhilfemassnahmen aus. Group Audit und die externe Revisionsstelle treffen sich regelmässig auf allen Organisationsebenen, um die Bereitstellung von AssuranceAktivitäten und deren Effizienz zu optimieren.
Group Audit setzt seinen Plan in Übereinstimmung mit definierten Betriebsstandards um, welche die vom Institute of Internal Auditors (IIA) erlassenen «Internationalen Standards für die berufliche Praxis der Internen Revision» beinhalten und mit diesen übereinstimmen. Group Audit stellt sicher, dass von ihm erkannte Probleme, welche die Geschäftstätigkeit der Gruppe beeinflussen könnten, den entsprechenden Managementebenen zur Kenntnis gebracht werden und dass rechtzeitig FollowupAktivitäten erfolgen. Der Head of Group Audit trifft sich monatlich mit dem Group CEO. Der Prüfungsausschuss und die Prüfungsausschüsse der Tochtergesellschaften werden mindestens vierteljährlich über wesentliche Revisionsergebnisse informiert, einschliesslich negativer Prüfvermerke und den Stand der Abhilfemassnahmen des Managements. Unterstützt wird dies durch die Teilnahme des Head of Group Audit an jeder Sitzung des Prüfungsausschusses und durch monatliche Treffen zwischen dem Head of Group Audit und dem Vorsitzenden des Prüfungsausschusses.
Der Prüfungsausschuss beurteilt die Unabhängigkeit von Group Audit und überprüft seine Aktivitäten, Pläne und Organisation sowie die Qualität seiner Arbeit und seine Zusammenarbeit mit der externen Revisionsstelle. Gemäss dem IIAStandard wird die interne Revision mindestens alle fünf Jahre einer Qualitätsprüfung durch einen unabhängigen qualifizierten Sachverständigen unterzogen. Diese Prüfung wurde zuletzt in der zweiten Hälfte des Jahres 2021 durchgeführt und dem Prüfungsausschuss im Februar 2022 zur Kenntnis gebracht. Die Ergebnisse bestätigten, dass die Praktiken von Group Audit im Allgemeinen mit dem Institute of Internal Auditors Code of Ethics, den International Standards sowie der Guidance, welche von der European Confederation of Institutes of Internal Auditing erlassen wurden, übereinstimmen.
Zurich Insurance Group Geschäftsbericht 2021
Konzern-überblick
Integrated sustainability disclosure
Governance Risk review
Financial review
78
Bericht über die Corporate Governance (fortgesetzt)
Externe Revisionsstelle
Dauer des Mandats und Amtszeit der verantwortlichen RevisorenErnst & Young AG (EY), Maagplatz 1, 8005 Zürich, wurde als externe Revisionsstelle der Gruppe für das Geschäftsjahr 2021 ernannt, nachdem die Aktionäre an der Generalversammlung vom 7. April 2021 dem Antrag des Verwaltungsrats, EY zu wählen, zugestimmt hatten.
EY ersetzte die PricewaterhouseCoopers AG (PwC), die zusammen mit ihren Vorgängerorganisationen seit 1983 als externe Revisionsstelle tätig war. Dieser Wechsel steht im Einklang mit der aktualisierten Vorgehensweise der Gruppe hinsichtlich Wechsels der externen Revisionsstelle, wonach von der Europäischen Union beschlossene Best Practices übernommen werden und künftig alle zehn Jahre eine Ausschreibung des Mandats vorgeschrieben ist.
EY übernimmt sämtliche Prüfungen, die vom Gesetz und von den Statuten (www.zurich.com/dede/investorrelations/ourshares/articlesofassociation) vorgeschrieben sind. EY ist verantwortlich für die Prüfung der Jahresrechnung der Gruppe und die Prüfung der Einhaltung spezifischer regulatorischer Anforderungen durch Zurich.
Isabelle Santenac von EY ist Global Relationship Partner und leitende Revisorin. Thomas Fiepke hat als Audit Engagement Partner den Revisionsbericht für 2021 mitunterzeichnet. Christian Fleig ist der verantwortliche Revisor für die regulatorische Prüfung. Alle diese Partner traten ihr Amt im Jahr 2021 an. Die Gruppe sorgt gemeinsam mit EY dafür, dass diese mindestens alle fünf Jahre ausgetauscht werden.
Die Aktionäre wählen jährlich die externe Revisionsstelle. Der Verwaltungsrat beantragt an der ordentlichen Generalversammlung vom 6. April 2022, EY als externe Revisionsstelle für das Geschäftsjahr 2022 wiederzuwählen. EY erfüllt alle notwendigen Anforderungen des Bundesgesetzes über die Zulassung und Beaufsichtigung der Revisorinnen und Revisoren und ist von der Schweizerischen Revisionsaufsichtsbehörde als eingetragenes Revisionsunternehmen zugelassen.
RevisionshonorareInsgesamt beliefen sich die von EY im Jahr 2021 in Rechnung gestellten Revisionshonorare (einschliesslich Auslagen und Mehrwertsteuer) auf USD 39,3 Mio.
Das Revisionshonorar wird vom Prüfungsausschuss jährlich genehmigt. Vor der Genehmigung durch den Prüfungsausschuss überprüft und validiert das Management den Vorschlag von EY, der hauptsächlich auf einer Analyse der bestehenden Berichtseinheiten und der erwarteten Veränderungen der rechtlichen und operativen Struktur im Laufe des Jahres basiert.
Nachdem die Honorare vereinbart sind, werden sie den Ländern und Berichtseinheiten mittels eines globalen Zuordnungsprozesses zugewiesen, und die Zuordnungen werden den lokalen CFOs und FARControllern mitgeteilt. Am Jahresende wird das tatsächlich in Rechnung gestellte Honorar geprüft und mit den lokalen CFOs vereinbart. Auf allen Ebenen (Gruppe und lokal) besteht ein klares Verständnis der Grundlagen für das Honorar des laufenden Jahres einschliesslich der Auswirkungen von Veränderungen im Umfang oder anderer Faktoren. Ungeplante Überschreitungen werden geprüft und mit der Geschäftseinheit (dem verantwortlichen CFO oder Ansprechpartner der Revisionsstelle) vereinbart.
Prüfungsfremde HonorareInsgesamt beliefen sich die Honorare (einschliesslich Auslagen und Mehrwertsteuer) für prüfungsfremde Dienstleistungen wie Steuerberatung und revisionsbezogene Dienstleistungen (insbesondere für Service Organization Control Reports, NonAudit Assurance Engagements und versicherungsmathematische regulatorische Reviews) und sonstige Dienstleistungen im Jahr 2021 auf USD 16,8 Mio.
Der Prüfungsausschuss hat eine umfassende Richtlinie für prüfungsfremde Dienstleistungen genehmigt, in der zulässige und nicht zulässige prüfungsfremde Dienstleistungen sowie Genehmigungsgrenzen für prüfungsfremde Mandate auf lokaler und Gruppenebene festgelegt sind. Zulässige prüfungsfremde Dienstleistungen können Steuerberatung, Comfort Letter, Einverständniserklärungen, Bescheinigungen und Bestätigungen umfassen, sofern solche Tätigkeiten im Einklang mit den geltenden gesetzlichen und regulatorischen Bestimmungen stehen und nicht die Unabhängigkeit und Objektivität von EY beeinträchtigen. Alle zulässigen prüfungsfremden Dienstleistungen müssen je nach Umfang des zu erwartenden Honorars zuvor vom Prüfungsausschuss (Vorsitzender), dem Group CFO, dem Head of Group FAR oder dem lokalen CFO genehmigt werden, damit Interessenkonflikte vermieden werden. Ferner erfordert diese Richtlinie unter anderem einen schriftlichen Auftrag, in welchem die zu erbringenden Dienstleistungen festgehalten werden müssen.
EY überwacht ebenfalls die prüfungsfremden Dienstleistungen und berichtet den Umfang der weltweit erbrachten prüfungsfremden Dienstleistungen quartalsweise an den Head of Group FAR und den Prüfungsausschuss.
Zurich Insurance Group Geschäftsbericht 2021
Konzern-überblick
Integrated sustainability disclosure
Governance Risk review
Financial review
79
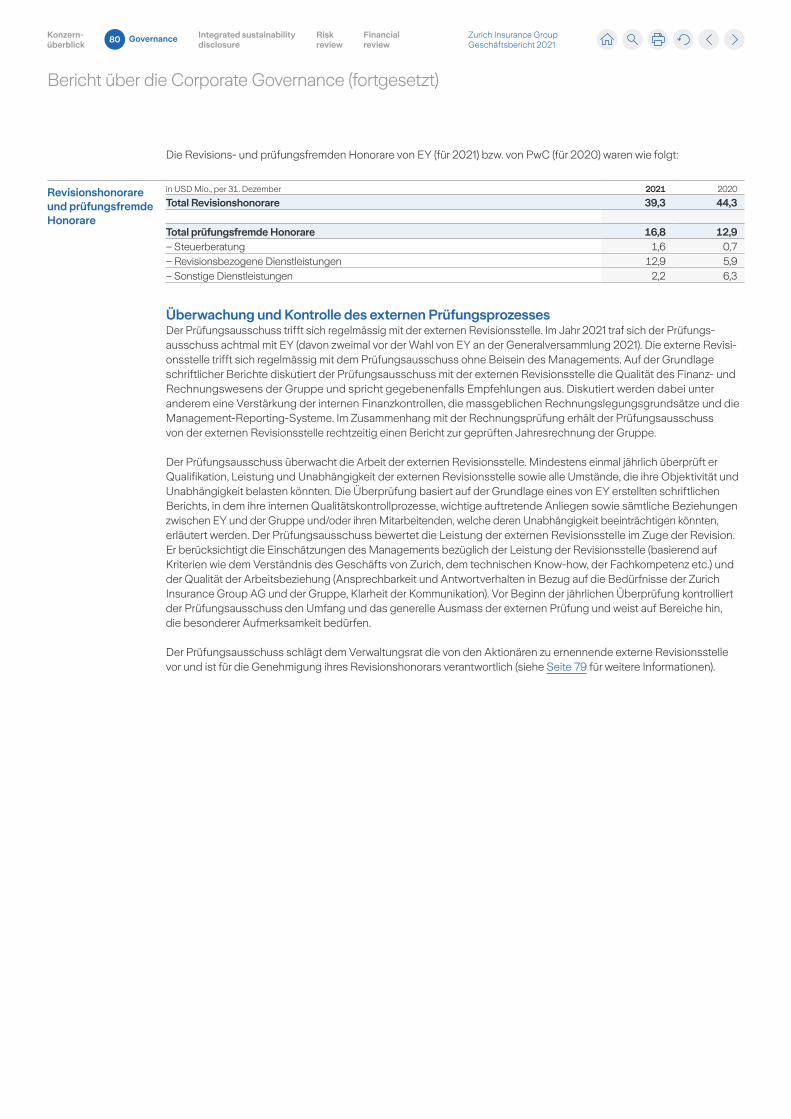
Bericht über die Corporate Governance (fortgesetzt)
Die Revisions und prüfungsfremden Honorare von EY (für 2021) bzw. von PwC (für 2020) waren wie folgt:
Revisionshonorare und prüfungsfremde Honorare
in USD Mio., per 31. Dezember 2021 2020
Total Revisionshonorare 39,3 44,3 Total prüfungsfremde Honorare 16,8 12,9– Steuerberatung 1,6 0,7– Revisionsbezogene Dienstleistungen 12,9 5,9– Sonstige Dienstleistungen 2,2 6,3
Überwachung und Kontrolle des externen PrüfungsprozessesDer Prüfungsausschuss trifft sich regelmässig mit der externen Revisionsstelle. Im Jahr 2021 traf sich der Prüfungsausschuss achtmal mit EY (davon zweimal vor der Wahl von EY an der Generalversammlung 2021). Die externe Revisionsstelle trifft sich regelmässig mit dem Prüfungsausschuss ohne Beisein des Managements. Auf der Grundlage schriftlicher Berichte diskutiert der Prüfungsausschuss mit der externen Revisionsstelle die Qualität des Finanz und Rechnungswesens der Gruppe und spricht gegebenenfalls Empfehlungen aus. Diskutiert werden dabei unter ande rem eine Verstärkung der internen Finanzkontrollen, die massgeblichen Rechnungslegungsgrundsätze und die ManagementReportingSysteme. Im Zusammenhang mit der Rechnungsprüfung erhält der Prüfungsausschuss von der externen Revisionsstelle rechtzeitig einen Bericht zur geprüften Jahresrechnung der Gruppe.
Der Prüfungsausschuss überwacht die Arbeit der externen Revisionsstelle. Mindestens einmal jährlich überprüft er Qualifikation, Leistung und Unabhängigkeit der externen Revisionsstelle sowie alle Umstände, die ihre Objektivität und Unabhängigkeit belasten könnten. Die Überprüfung basiert auf der Grundlage eines von EY erstellten schriftlichen Berichts, in dem ihre internen Qualitätskontrollprozesse, wichtige auftretende Anliegen sowie sämtliche Beziehungen zwischen EY und der Gruppe und/oder ihren Mitarbeitenden, welche deren Unabhängigkeit beeinträchtigen könnten, erläutert werden. Der Prüfungsausschuss bewertet die Leistung der externen Revisionsstelle im Zuge der Revision. Er berücksichtigt die Einschätzungen des Managements bezüglich der Leistung der Revisionsstelle (basierend auf Kriterien wie dem Verständnis des Geschäfts von Zurich, dem technischen Knowhow, der Fachkompetenz etc.) und der Qualität der Arbeitsbeziehung (Ansprechbarkeit und Antwortverhalten in Bezug auf die Bedürfnisse der Zurich Insurance Group AG und der Gruppe, Klarheit der Kommunikation). Vor Beginn der jährlichen Überprüfung kontrolliert der Prüfungsausschuss den Umfang und das generelle Ausmass der externen Prüfung und weist auf Bereiche hin, die besonderer Aufmerksamkeit bedürfen.
Der Prüfungsausschuss schlägt dem Verwaltungsrat die von den Aktionären zu ernennende externe Revisionsstelle vor und ist für die Genehmigung ihres Revisionshonorars verantwortlich (siehe Seite 79 für weitere Informationen).
Zurich Insurance Group Geschäftsbericht 2021
Konzern-überblick
Integrated sustainability disclosure
Governance Risk review
Financial review
80
Bericht über die Corporate Governance (fortgesetzt)
Zusätzliche Informationen
Change-of-Control-Klauseln Für die Arbeitsverträge mit den Mitgliedern der Konzernleitung gilt eine Kündigungsfrist von höchstens 12 Monaten. Das Reglement für den aktienbasierten langfristigen IncentivePlan der Gruppe, das für alle Teilnehmer des Plans einschliesslich der Konzernleitungsmitglieder und einer bestimmten Gruppe von Führungskräften gilt, sieht vor, dass der PlanAdministrator im Falle eines Kontrollwechsels nach seinem Ermessen entweder bestehende Aktienverpflichtungen in neue Rechte auf Aktien umwandeln oder eine Gegenleistung anstelle von Aktienverpflichtungen oder eine beschleunigte Ausübung und die Aufhebung von Veräusserungsbeschränkungen vorsehen kann.
Es gibt keine weiteren ChangeofControlKlauseln, die Verwaltungsratsmitglieder, Konzernleitungsmitglieder oder andere Mitglieder des Managements begünstigen würden.
Close periods Gemäss der Group Policy on Dealing in Securities von Zurich (die «Policy») ist es Personen, die als «Group Insider» gelten, untersagt, während der von Zurich als «Close Periods» bezeichneten Zeiträume mit «Zurich Securities» zu handeln. «Close Periods» sind die Zeiträume (von mindestens 30 Tagen), die bis zum Handelstag der Bekanntgabe der Quartals, Halbjahres und Jahresergebnisse der Gruppe reichen und diesen einschliessen. In der Praxis dauern die Close Periods rund 40 Tage, wobei der Zeitraum am Jahresende länger ist.
Zudem gelten für Insider, die an (potenziell) preissensiblen Projekten beteiligt sind, Handelsbeschränkungen während bestimmter Zeiträume («Prohibited Periods»). Ausserhalb der Close und der Prohibited Periods können Group Insider mit vorheriger Genehmigung durch Group Compliance mit Zurich Securities handeln.
Betroffene Personen Führungskräfte (wie z. B. Konzernleitungsmitglieder, Leiter bestimmter Konzernfunktionen) und die Mitglieder des Verwaltungsrats der Zurich Insurance Group AG (ZIG) und bestimmter wichtiger Tochtergesellschaften gelten aufgrund ihrer Position als Group Insider.
Weitere Personen können als Group Insider bezeichnet werden, wenn sie mit potenziell preissensiblen Informationen über Zurich Securities in Berührung kommen. Zurich führt eine Liste mit diesen Personen.
Zudem müssen Group Insider sicherstellen, dass «Verbundene Personen» (wie Ehepartner, Lebenspartner, minderjährige Kinder, Finanzberater, verbundene Unternehmen usw.) während der Close und Prohibited Periods nicht mit Zurich Securities handeln.
Relevante Wertpapiere «Zurich Securities» sind «Securities» von ZIG oder ihrer Tochtergesellschaften und verbundenen Unternehmen weltweit. Der Begriff «Securities» umfasst:
– Wertpapiere, die zum Handel an einer Börse oder einer börsenähnlichen Einrichtung in der Schweiz und im Ausland zugelassen sind;
– Wertpapiere, die auf dem Primär (z. B. Initial Public Offering/IPO) und Sekundärmarkt gehandelt werden;
– Ausserbörsliche (OTC)Finanzinstrumente (z. B. ADRs, Derivate);
– Von Wertpapieren abgeleitete Finanzinstrumente, deren Preis wesentlich (d. h. mit einem Gewicht von mehr als 20%) von dem zugrunde liegenden Wertpapier abhängt, einschliesslich Schuldtitel.
AusnahmenWährend einer Close oder Prohibited Period kann dem Group Insider eine Verkaufsfreigabe erteilt werden, wenn dieser nicht im Besitz von InsiderInformationen über Zurich ist und ein aussergewöhnlicher Umstand vorliegt (z. B. ein persönlicher oder familiärer Notfall wie gesundheitliche Angelegenheiten oder eine rechtliche oder finanzielle Notlage), bei dem der Verkauf von Zurich Securities die einzige vernünftige Handlungsmöglichkeit für den Group Insider darstellt. Die Entscheidung, ob ein Umstand als aussergewöhnlich gilt, treffen der Group Chief Compliance Officer und der Verwaltungsratspräsident.
Sind die Anforderungen der Policy erfüllt, sind zudem regelmässige Investitionen auf der Grundlage eines vordefinierten Handelsplans nicht genehmigungspflichtig und können auch während der Close und Prohibited Periods fortgesetzt werden.
Zurich Insurance Group Geschäftsbericht 2021
Konzern-überblick
Integrated sustainability disclosure
Governance Risk review
Financial review
81
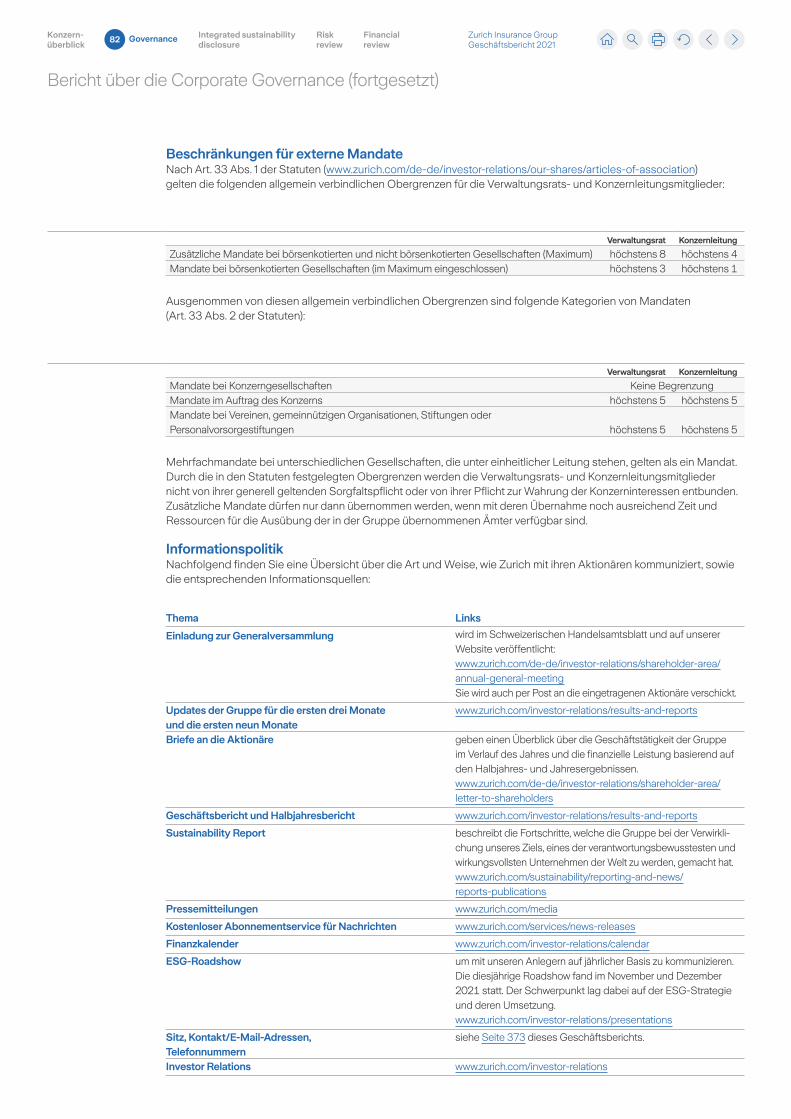
Bericht über die Corporate Governance (fortgesetzt)
Beschränkungen für externe MandateNach Art. 33 Abs. 1 der Statuten (www.zurich.com/dede/investorrelations/ourshares/articlesofassociation) gelten die folgenden allgemein verbindlichen Obergrenzen für die Verwaltungsrats und Konzernleitungsmitglieder:
Verwaltungsrat Konzernleitung
Zusätzliche Mandate bei börsenkotierten und nicht börsenkotierten Gesellschaften (Maximum) höchstens 8 höchstens 4 Mandate bei börsenkotierten Gesellschaften (im Maximum eingeschlossen) höchstens 3 höchstens 1
Ausgenommen von diesen allgemein verbindlichen Obergrenzen sind folgende Kategorien von Mandaten (Art. 33 Abs. 2 der Statuten):
Verwaltungsrat Konzernleitung
Mandate bei Konzerngesellschaften Keine Begrenzung Mandate im Auftrag des Konzerns höchstens 5 höchstens 5 Mandate bei Vereinen, gemeinnützigen Organisationen, Stiftungen oder Personalvorsorgestiftungen höchstens 5 höchstens 5
Mehrfachmandate bei unterschiedlichen Gesellschaften, die unter einheitlicher Leitung stehen, gelten als ein Mandat. Durch die in den Statuten festgelegten Obergrenzen werden die Verwaltungsrats und Konzernleitungsmitglieder nicht von ihrer generell geltenden Sorgfaltspflicht oder von ihrer Pflicht zur Wahrung der Konzerninteressen entbunden. Zusätzliche Mandate dürfen nur dann übernommen werden, wenn mit deren Übernahme noch ausreichend Zeit und Ressourcen für die Ausübung der in der Gruppe übernommenen Ämter verfügbar sind.
InformationspolitikNachfolgend finden Sie eine Übersicht über die Art und Weise, wie Zurich mit ihren Aktionären kommuniziert, sowie die entsprechenden Informationsquellen:
Thema Links
Einladung zur Generalversammlung wird im Schweizerischen Handelsamtsblatt und auf unserer Website veröffentlicht: www.zurich.com/dede/investorrelations/shareholderarea/annualgeneralmeetingSie wird auch per Post an die eingetragenen Aktionäre verschickt.
Updates der Gruppe für die ersten drei Monate und die ersten neun Monate
www.zurich.com/investorrelations/resultsandreports
Briefe an die Aktionäre geben einen Überblick über die Geschäftstätigkeit der Gruppe im Verlauf des Jahres und die finanzielle Leistung basierend auf den Halbjahres und Jahresergebnissen.www.zurich.com/dede/investorrelations/shareholderarea/lettertoshareholders
Geschäftsbericht und Halbjahresbericht www.zurich.com/investorrelations/resultsandreports
Sustainability Report beschreibt die Fortschritte, welche die Gruppe bei der Verwirklichung unseres Ziels, eines der verantwortungsbewusstesten und wirkungsvollsten Unternehmen der Welt zu werden, gemacht hat.www.zurich.com/sustainability/reportingandnews/ reportspublications
Pressemitteilungen www.zurich.com/media
Kostenloser Abonnementservice für Nachrichten www.zurich.com/services/newsreleases
Finanzkalender www.zurich.com/investorrelations/calendar
ESG-Roadshow um mit unseren Anlegern auf jährlicher Basis zu kommunizieren. Die diesjährige Roadshow fand im November und Dezember 2021 statt. Der Schwerpunkt lag dabei auf der ESG-Strategie und deren Umsetzung.www.zurich.com/investorrelations/presentations
Sitz, Kontakt/E-Mail-Adressen, Telefonnummern
siehe Seite 373 dieses Geschäftsberichts.
Investor Relations www.zurich.com/investorrelations
Zurich Insurance Group Geschäftsbericht 2021
Konzern-überblick
Integrated sustainability disclosure
Governance Risk review
Financial review
82

THIS PAGE HAS INTENTIONALLY BEEN LEFT BLANK
Zurich Insurance Group Geschäftsbericht 2021
Konzern-überblick
Integrated sustainability disclosure
Governance Risk review
Financial review
83
Mitteilung des Vorsitzenden des Vergütungsausschusses
Positive Beitr ge belohnen.Das ausgewogene und wirksam verwaltete Vergütungssystem ist Teil des gesamten Beschäftigungsangebots und unterstützt die Mitarbeitenden dabei, einen positiven Beitrag zum Erfolg der Gruppe zu leisten.Christoph FranzVorsitzender des Vergütungsausschusses
Sehr geehrte Aktionärin, sehr geehrter AktionärDie Mitarbeitenden von Zurich gestalten die Zukunft dieses Unternehmens mit. Jeden Tag tragen sie mit ihrer Flexibilität, ihrer offenen Denkweise und ihrem Engagement für persönliche Entwicklung dazu bei, die Anliegen und die Werte von Zurich zugunsten der Kunden, Partner, Gemeinschaften und unseres Planeten umzusetzen und zu leben. Die Vergütungs philosophie der Gruppe ist ein integraler Bestandteil des gesamten Angebots an die Mitarbeitenden. Sie trägt dazu bei, das oberste Ziel von Zurich zu erreichen: eines der verantwortungsvollsten und wirkungsvollsten Unternehmen der Welt zu werden.
Der Vergütungsansatz von Zurich gewährleistet ein angemessenes Gleichgewicht zwischen einer Vergütung, die an nachweisbare Leistungen gekoppelt ist, und einer Vergütung, die wettbewerbsfähig genug ist, um die Talente anzuziehen, die für eine positive Wirkung benötigt werden. Eine solide Risikostruktur spielt eine zentrale Rolle bei der Berücksichtigung von Risikoüberlegungen bei Vergütungsentscheidungen.
Zurich Insurance Group Geschäftsbericht 2021
Konzern-überblick
Integrated sustainability disclosure
Governance Risk review
Financial review
84
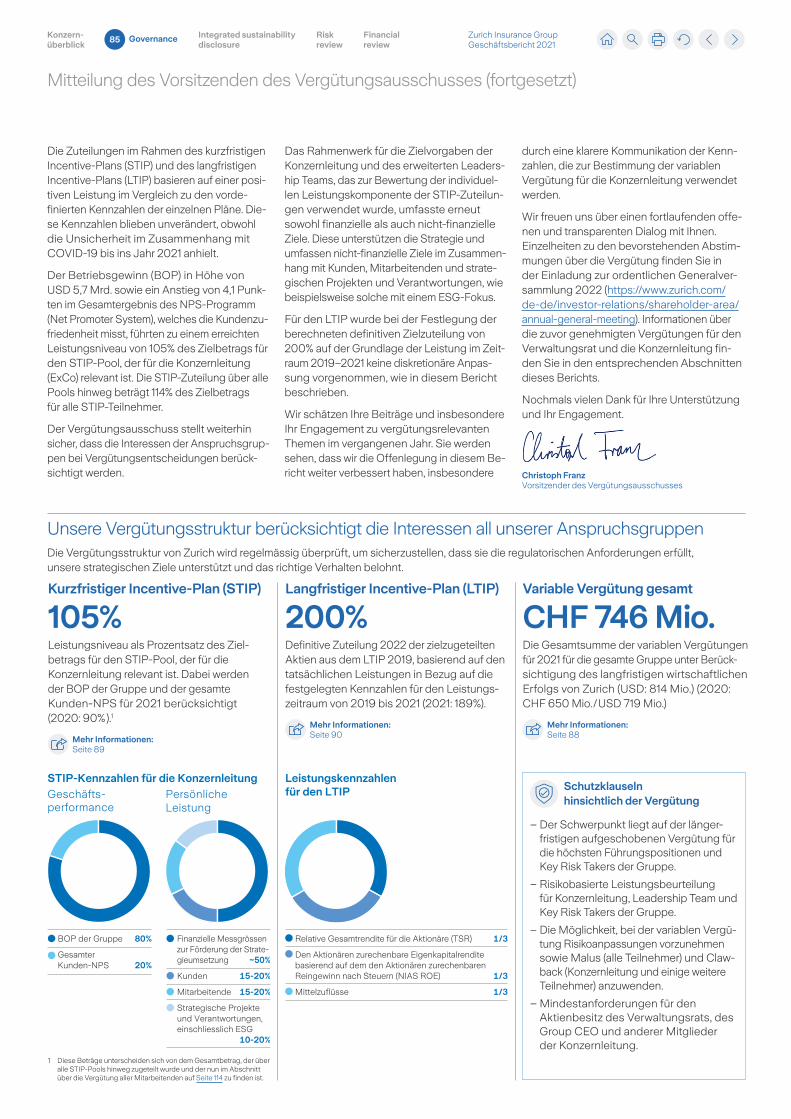
Mitteilung des Vorsitzenden des Vergütungsausschusses (fortgesetzt)
STIP-Kennzahlen für die KonzernleitungGeschäfts-performance
PersönlicheLeistung
BOP der Gruppe 80%
Gesamter Kunden-NPS 20%
Finanzielle Messgrössen zur Förderung der Strate- gieumsetzung ~50%
Kunden 15-20%
Mitarbeitende 15-20%
Strategische Projekte und Verantwortungen, einschliesslich ESG 10-20%
Leistungskennzahlen für den LTIP
Relative Gesamtrendite für die Aktionäre (TSR) 1/3
Den Aktionären zurechenbare Eigenkapitalrendite basierend auf dem den Aktionären zurechenbaren Reingewinn nach Steuern (NIAS ROE) 1/3
Mittelzuflüsse 1/3
Unsere Vergütungsstruktur berücksichtigt die Interessen all unserer AnspruchsgruppenDie Vergütungsstruktur von Zurich wird regelmässig überprüft, um sicherzustellen, dass sie die regulatorischen Anforderungen erfüllt, unsere strategischen Ziele unterstützt und das richtige Verhalten belohnt.
Kurzfristiger Incentive-Plan (STIP)
105%Langfristiger Incentive-Plan (LTIP)
200%Variable Vergütung gesamt
CHF 746 Mio.Leistungsniveau als Prozentsatz des Zielbetrags für den STIPPool, der für die Kon zernleitung relevant ist. Dabei wer den der BOP der Gruppe und der gesamte KundenNPS für 2021 berücksichtigt (2020: 90% ).1
Definitive Zuteilung 2022 der zielzugeteilten Aktien aus dem LTIP 2019, basierend auf den tatsächlichen Leistungen in Bezug auf die festgelegten Kennzahlen für den Leistungszeitraum von 2019 bis 2021 (2021: 189%).
Die Gesamtsumme der variablen Vergütungen für 2021 für die gesamte Gruppe unter Berücksichtigung des langfristigen wirtschaftlichen Erfolgs von Zurich (USD: 814 Mio.) (2020: CHF 650 Mio. / USD 719 Mio.)
Schutzklauseln hinsichtlich der Vergütung
– Der Schwerpunkt liegt auf der längerfristigen aufgeschobenen Vergütung für die höchsten Führungspositionen und Key Risk Takers der Gruppe.
– Risikobasierte Leistungsbeurteilung für Konzernleitung, Leadership Team und Key Risk Takers der Gruppe.
– Die Möglichkeit, bei der variablen Vergütung Risikoanpassungen vorzunehmen sowie Malus (alle Teilnehmer) und Clawback (Konzernleitung und einige weitere Teilnehmer) anzuwenden.
– Mindestanforderungen für den Aktienbesitz des Verwaltungsrats, des Group CEO und anderer Mitglieder der Konzernleitung.
Mehr Informationen:Seite 89
Mehr Informationen:Seite 90
Mehr Informationen:Seite 88
Die Zuteilungen im Rahmen des kurzfristigen IncentivePlans (STIP) und des langfristigen IncentivePlans (LTIP) basieren auf einer positiven Leistung im Vergleich zu den vordefinierten Kennzahlen der einzelnen Pläne. Diese Kennzahlen blieben unverändert, obwohl die Unsicherheit im Zusammenhang mit COVID19 bis ins Jahr 2021 anhielt.
Der Betriebsgewinn (BOP) in Höhe von USD 5,7 Mrd. sowie ein Anstieg von 4,1 Punkten im Gesamtergebnis des NPSProgramm (Net Promoter System), welches die Kundenzufriedenheit misst, führten zu einem erreichten Leistungsniveau von 105% des Zielbetrags für den STIPPool, der für die Konzernleitung (ExCo) relevant ist. Die STIPZuteilung über alle Pools hinweg beträgt 114% des Zielbetrags für alle STIPTeilnehmer.
Der Vergütungsausschuss stellt weiterhin sicher, dass die Interessen der Anspruchsgruppen bei Vergütungsentscheidungen berücksichtigt werden.
Das Rahmenwerk für die Zielvorgaben der Konzernleitung und des erweiterten Leadership Teams, das zur Bewertung der individuellen Leistungskomponente der STIPZuteilungen verwendet wurde, umfasste erneut sowohl finanzielle als auch nichtfinanzielle Ziele. Diese unterstützen die Strategie und umfassen nichtfinanzielle Ziele im Zusammenhang mit Kunden, Mitarbeitenden und strategischen Projekten und Verantwortungen, wie beispielsweise solche mit einem ESGFokus.
Für den LTIP wurde bei der Festlegung der berechneten definitiven Zielzuteilung von 200% auf der Grundlage der Leistung im Zeitraum 2019–2021 keine diskretionäre Anpassung vorgenommen, wie in diesem Bericht beschrieben.
Wir schätzen Ihre Beiträge und insbesondere Ihr Engagement zu vergütungsrelevanten Themen im vergangenen Jahr. Sie werden sehen, dass wir die Offenlegung in diesem Bericht weiter verbessert haben, insbesondere
durch eine klarere Kommunikation der Kennzahlen, die zur Bestimmung der variablen Vergütung für die Konzernleitung verwendet werden.
Wir freuen uns über einen fortlaufenden offenen und transparenten Dialog mit Ihnen. Einzelheiten zu den bevorstehenden Abstimmungen über die Vergütung finden Sie in der Einladung zur ordentlichen Generalversammlung 2022 (https://www.zurich.com/ dede/investorrelations/shareholderarea/annualgeneralmeeting). Informationen über die zuvor genehmigten Vergütungen für den Verwaltungsrat und die Konzernleitung finden Sie in den entsprechenden Abschnitten dieses Berichts.
Nochmals vielen Dank für Ihre Unterstützung und Ihr Engagement.
Christoph FranzVorsitzender des Vergütungsausschusses
1 Diese Beträge unterscheiden sich von dem Gesamtbetrag, der über alle STIPPools hinweg zugeteilt wurde und der nun im Abschnitt über die Vergütung aller Mitarbeitenden auf Seite 114 zu finden ist.
Zurich Insurance Group Geschäftsbericht 2021
Konzern-überblick
Integrated sustainability disclosure
Governance Risk review
Financial review
85
Vergütungsbericht
Vergütungsbericht Inhalt
Zusammenfassung der Vergütungen 2021 87
Vergütungsstruktur 92
Philosophie 92
Vergütungselemente 92
Vergütungsgovernance 99
Gesetzliche und regulatorische Anforderungen 100
Vergütung und Risiko 100
Richtlinien zum Aktienbesitz 101
Aktienverwässerung 101
Vergütungen und Aktienbesitz 2021 102
Verwaltungsrat 102
Konzernleitung 106
Alle Mitarbeitenden 114
Ausblick 2022 116
Bericht der Revisionsstelle über den Vergütungsbericht 117
Zurich Insurance Group Geschäftsbericht 2021
Konzern-überblick
Integrated sustainability disclosure
Governance Risk review
Financial review
86
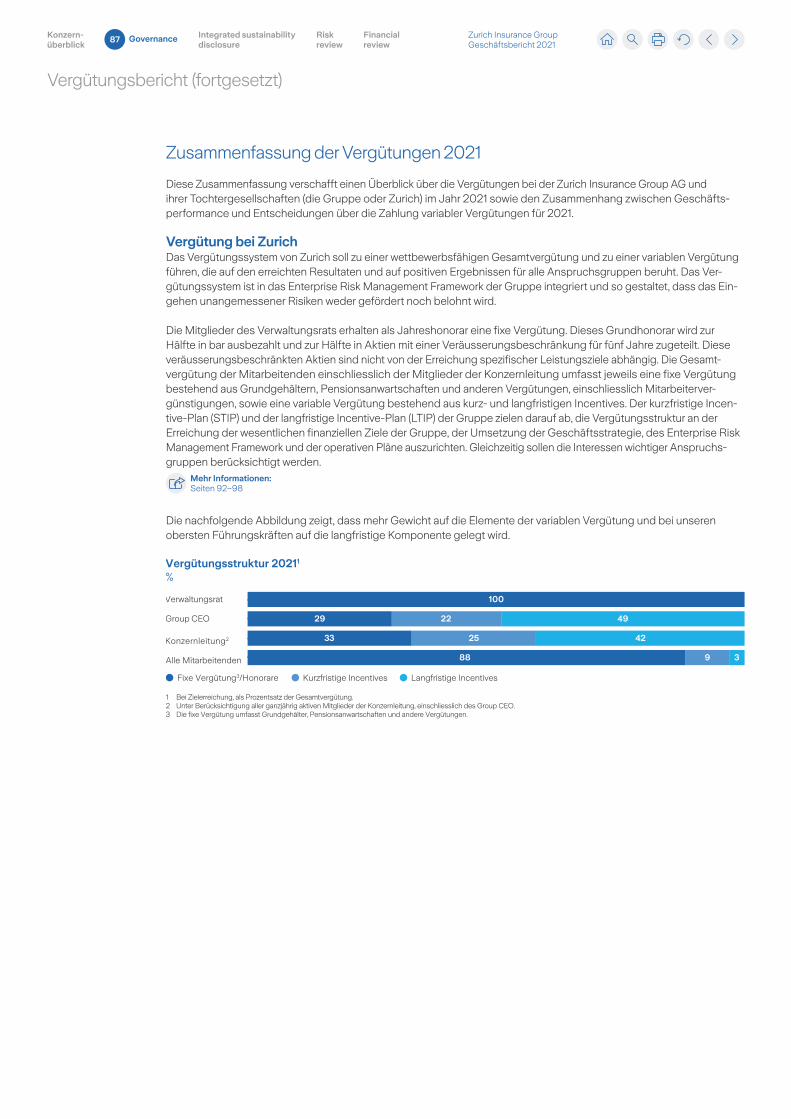
Vergütungsbericht (fortgesetzt)
Zusammenfassung der Vergütungen 2021
Diese Zusammenfassung verschafft einen Überblick über die Vergütungen bei der Zurich Insurance Group AG und ihrer Tochtergesellschaften (die Gruppe oder Zurich) im Jahr 2021 sowie den Zusammenhang zwischen Geschäftsperformance und Entscheidungen über die Zahlung variabler Vergütungen für 2021.
Vergütung bei ZurichDas Vergütungssystem von Zurich soll zu einer wettbewerbsfähigen Gesamtvergütung und zu einer variablen Vergütung führen, die auf den erreichten Resultaten und auf positiven Ergebnissen für alle Anspruchsgruppen beruht. Das Vergütungssystem ist in das Enterprise Risk Management Framework der Gruppe integriert und so gestaltet, dass das Eingehen unangemessener Risiken weder gefördert noch belohnt wird.
Die Mitglieder des Verwaltungsrats erhalten als Jahreshonorar eine fixe Vergütung. Dieses Grundhonorar wird zur Hälfte in bar ausbezahlt und zur Hälfte in Aktien mit einer Veräusserungsbeschränkung für fünf Jahre zugeteilt. Diese veräu sserungsbeschränkten Aktien sind nicht von der Erreichung spezifischer Leistungsziele abhängig. Die Gesamtvergütung der Mitarbeitenden einschliesslich der Mitglieder der Konzernleitung umfasst jeweils eine fixe Vergütung bestehend aus Grundgehältern, Pensionsanwartschaften und anderen Vergütungen, einschliesslich Mitarbeitervergünstigungen, sowie eine variable Vergütung bestehend aus kurz und langfristigen Incentives. Der kurzfristige IncentivePlan (STIP) und der langfristige IncentivePlan (LTIP) der Gruppe zielen darauf ab, die Vergütungsstruktur an der Erreichung der wesentlichen finanziellen Ziele der Gruppe, der Umsetzung der Geschäftsstrategie, des Enterprise Risk Management Framework und der operativen Pläne auszurichten. Gleichzeitig sollen die Interessen wichtiger Anspruchsgruppen berücksichtigt werden.
Mehr Informationen:Seiten 92–98
Die nachfolgende Abbildung zeigt, dass mehr Gewicht auf die Elemente der variablen Vergütung und bei unseren obersten Führungskräften auf die langfristige Komponente gelegt wird.
Vergütungsstruktur 20211
%
Verwaltungsrat
Konzernleitung2
Group CEO
Alle Mitarbeitenden
Fixe Vergütung3/Honorare Kurzfristige Incentives Langfristige Incentives
1 Bei Zielerreichung, als Prozentsatz der Gesamtvergütung.2 Unter Berücksichtigung aller ganzjährig aktiven Mitglieder der Konzernleitung, einschliesslich des Group CEO.3 Die fixe Vergütung umfasst Grundgehälter, Pensionsanwartschaften und andere Vergütungen.
29 22
33 25 42
100
88
49
9 3
Zurich Insurance Group Geschäftsbericht 2021
Konzern-überblick
Integrated sustainability disclosure
Governance Risk review
Financial review
87
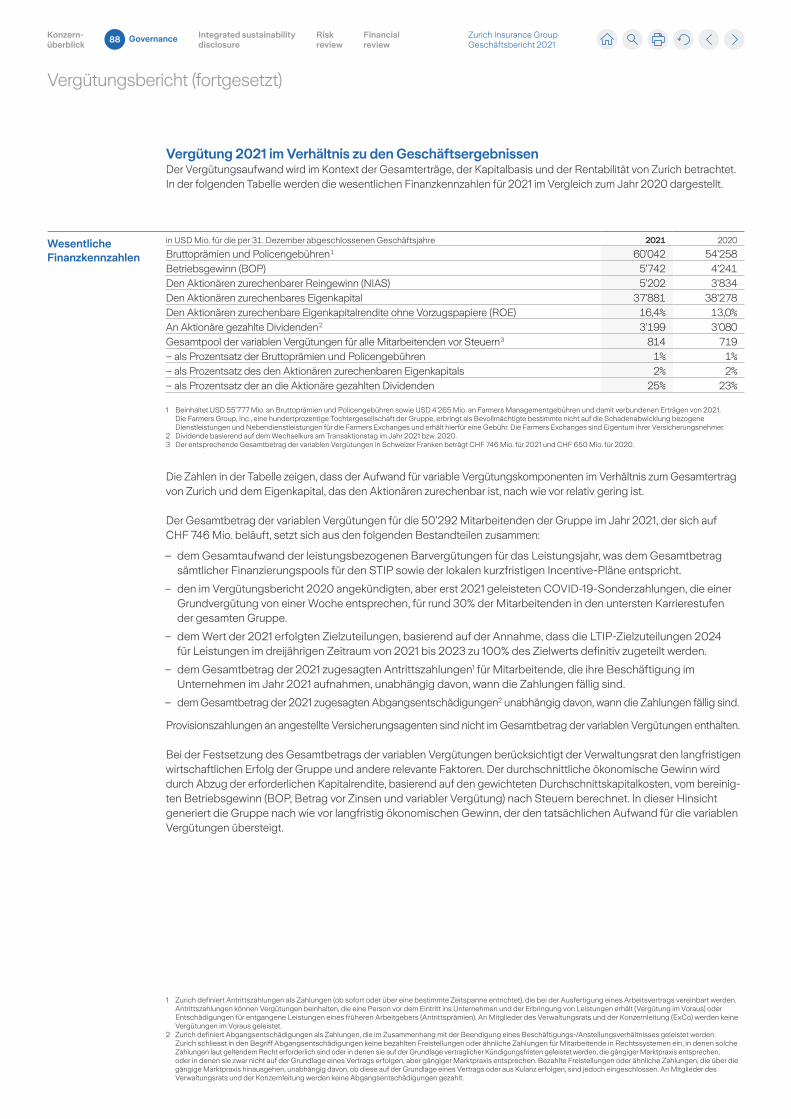
Vergütungsbericht (fortgesetzt)
Vergütung 2021 im Verhältnis zu den GeschäftsergebnissenDer Vergütungsaufwand wird im Kontext der Gesamterträge, der Kapitalbasis und der Rentabilität von Zurich betrachtet. In der folgenden Tabelle werden die wesentlichen Finanzkennzahlen für 2021 im Vergleich zum Jahr 2020 dargestellt.
Wesentliche Finanzkennzahlen
in USD Mio. für die per 31. Dezember abgeschlossenen Geschäftsjahre 2021 2020
Bruttoprämien und Policengebühren 1 60’042 54’258 Betriebsgewinn (BOP) 5’742 4’241 Den Aktionären zurechenbarer Reingewinn (NIAS) 5’202 3’834 Den Aktionären zurechenbares Eigenkapital 37’881 38’278 Den Aktionären zurechenbare Eigenkapitalrendite ohne Vorzugspapiere (ROE) 16,4% 13,0%An Aktionäre gezahlte Dividenden 2 3’199 3’080 Gesamtpool der variablen Vergütungen für alle Mitarbeitenden vor Steuern 3 814 719 – als Prozentsatz der Bruttoprämien und Policengebühren 1% 1%– als Prozentsatz des den Aktionären zurechenbaren Eigenkapitals 2% 2%– als Prozentsatz der an die Aktionäre gezahlten Dividenden 25% 23%
1 Beinhaltet USD 55’777 Mio. an Bruttoprämien und Policengebühren sowie USD 4’265 Mio. an Farmers Managementgebühren und damit verbundenen Erträgen von 2021. Die Farmers Group, Inc., eine hundertprozentige Tochtergesellschaft der Gruppe, erbringt als Bevollmächtigte bestimmte nicht auf die Schadenabwicklung bezogene Dienstleistungen und Nebendienstleistungen für die Farmers Exchanges und erhält hierfür eine Gebühr. Die Farmers Exchanges sind Eigentum ihrer Versicherungsnehmer.
2 Dividende basierend auf dem Wechselkurs am Transaktionstag im Jahr 2021 bzw. 2020.3 Der entsprechende Gesamtbetrag der variablen Vergütungen in Schweizer Franken beträgt CHF 746 Mio. für 2021 und CHF 650 Mio. für 2020.
Die Zahlen in der Tabelle zeigen, dass der Aufwand für variable Vergütungskomponenten im Verhältnis zum Gesamtertrag von Zurich und dem Eigenkapital, das den Aktionären zurechenbar ist, nach wie vor relativ gering ist.
Der Gesamtbetrag der variablen Vergütungen für die 50’292 Mitarbeitenden der Gruppe im Jahr 2021, der sich auf CHF 746 Mio. beläuft, setzt sich aus den folgenden Bestandteilen zusammen:
– dem Gesamtaufwand der leistungsbezogenen Barvergütungen für das Leistungsjahr, was dem Gesamtbetrag sämtlicher Finanzierungspools für den STIP sowie der lokalen kurzfristigen IncentivePläne entspricht.
– den im Vergütungsbericht 2020 angekündigten, aber erst 2021 geleisteten COVID19Sonderzahlungen, die einer Grundvergütung von einer Woche entsprechen, für rund 30% der Mitarbeitenden in den untersten Karrierestufen der gesamten Gruppe.
– dem Wert der 2021 erfolgten Zielzuteilungen, basierend auf der Annahme, dass die LTIPZielzuteilungen 2024 für Leistungen im dreijährigen Zeitraum von 2021 bis 2023 zu 100% des Zielwerts definitiv zugeteilt werden.
– dem Gesamtbetrag der 2021 zugesagten Antrittszahlungen1 für Mitarbeitende, die ihre Beschäftigung im Unternehmen im Jahr 2021 aufnahmen, unabhängig davon, wann die Zahlungen fällig sind.
– dem Gesamtbetrag der 2021 zugesagten Abgangsentschädigungen2 unabhängig davon, wann die Zahlungen fällig sind.
Provisionszahlungen an angestellte Versicherungsagenten sind nicht im Gesamtbetrag der variablen Vergütungen enthalten.
Bei der Festsetzung des Gesamtbetrags der variablen Vergütungen berücksichtigt der Verwaltungsrat den langfristigen wirtschaftlichen Erfolg der Gruppe und andere relevante Faktoren. Der durchschnittliche ökonomische Gewinn wird durch Abzug der erforderlichen Kapitalrendite, basierend auf den gewichteten Durchschnittskapitalkosten, vom bereinigten Betriebsgewinn (BOP, Betrag vor Zinsen und variabler Vergütung) nach Steuern berechnet. In dieser Hinsicht generiert die Gruppe nach wie vor langfristig ökonomischen Gewinn, der den tatsächlichen Aufwand für die variablen Vergütungen übersteigt.
1 Zurich definiert Antrittszahlungen als Zahlungen (ob sofort oder über eine bestimmte Zeitspanne entrichtet), die bei der Ausfertigung eines Arbeitsvertrags vereinbart werden. Antrittszahlungen können Vergütungen beinhalten, die eine Person vor dem Eintritt ins Unternehmen und der Erbringung von Leistungen erhält (Vergütung im Voraus) oder Entschädigungen für entgangene Leistungen eines früheren Arbeitgebers (Antrittsprämien). An Mitglieder des Verwaltungsrats und der Konzernleitung (ExCo) werden keine Vergütungen im Voraus geleistet.
2 Zurich definiert Abgangsentschädigungen als Zahlungen, die im Zusammenhang mit der Beendigung eines Beschäftigungs/Anstellungsverhältnisses geleistet werden. Zurich schliesst in den Begriff Abgangsentschädigungen keine bezahlten Freistellungen oder ähnliche Zahlungen für Mitarbeitende in Rechtssystemen ein, in denen solche Zahlungen laut geltendem Recht erforderlich sind oder in denen sie auf der Grundlage vertraglicher Kündigungsfristen geleistet werden, die gängiger Marktpraxis entsprechen, oder in denen sie zwar nicht auf der Grundlage eines Vertrags erfolgen, aber gängiger Marktpraxis entsprechen. Bezahlte Freistellungen oder ähnliche Zahlungen, die über die gängige Marktpraxis hinausgehen, unabhängig davon, ob diese auf der Grundlage eines Vertrags oder aus Kulanz erfolgen, sind jedoch eingeschlossen. An Mitglieder des Verwaltungsrats und der Konzernleitung werden keine Abgangsentschädigungen gezahlt.
Zurich Insurance Group Geschäftsbericht 2021
Konzern-überblick
Integrated sustainability disclosure
Governance Risk review
Financial review
88
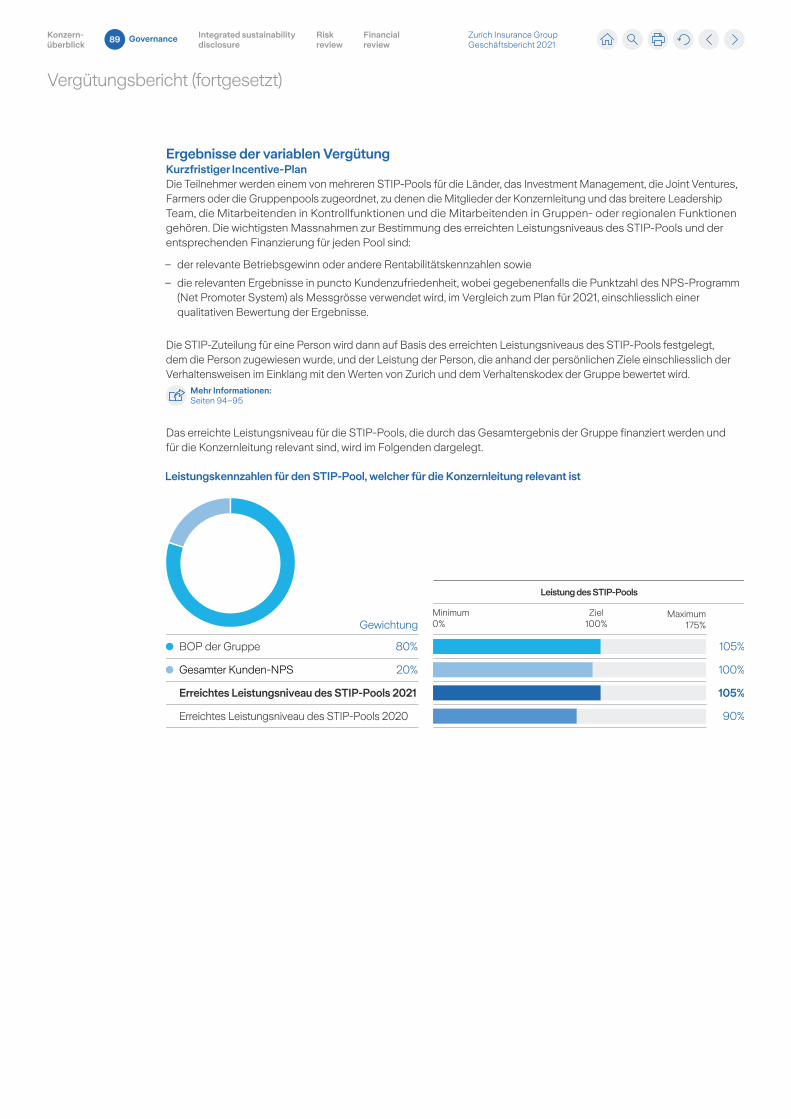
Vergütungsbericht (fortgesetzt)
Ergebnisse der variablen VergütungKurzfristiger Incentive-PlanDie Teilnehmer werden einem von mehreren STIPPools für die Länder, das Investment Management, die Joint Ventures, Farmers oder die Gruppenpools zugeordnet, zu denen die Mitglieder der Konzernleitung und das breitere Leadership Team, die Mitarbeitenden in Kontrollfunktionen und die Mitarbeitenden in Gruppen oder regionalen Funktionen gehören. Die wichtigsten Massnahmen zur Bestimmung des erreichten Leistungsniveaus des STIPPools und der entsprechenden Finanzierung für jeden Pool sind:
– der relevante Betriebsgewinn oder andere Rentabilitätskennzahlen sowie
– die relevanten Ergebnisse in puncto Kundenzufriedenheit, wobei gegebenenfalls die Punktzahl des NPSProgramm (Net Promoter System) als Messgrösse verwendet wird, im Vergleich zum Plan für 2021, einschliesslich einer qualitativen Bewertung der Ergebnisse.
Die STIPZuteilung für eine Person wird dann auf Basis des erreichten Leistungsniveaus des STIPPools festgelegt, dem die Person zugewiesen wurde, und der Leistung der Person, die anhand der persönlichen Ziele einschliesslich der Verhaltensweisen im Einklang mit den Werten von Zurich und dem Verhaltenskodex der Gruppe bewertet wird.
Mehr Informationen:Seiten 94–95
Das erreichte Leistungsniveau für die STIPPools, die durch das Gesamtergebnis der Gruppe finanziert werden und für die Konzernleitung relevant sind, wird im Folgenden dargelegt.
BOP der Gruppe 80%
Gesamter Kunden-NPS 20%
Erreichtes Leistungsniveau des STIP-Pools 2021
Erreichtes Leistungsniveau des STIP-Pools 2020
Gewichtung
Leistungskennzahlen für den STIP-Pool, welcher für die Konzernleitung relevant ist
105%
100%
105%
90%
Leistung des STIP-Pools
Minimum0%
Ziel100%
Maximum175%
Zurich Insurance Group Geschäftsbericht 2021
Konzern-überblick
Integrated sustainability disclosure
Governance Risk review
Financial review
89
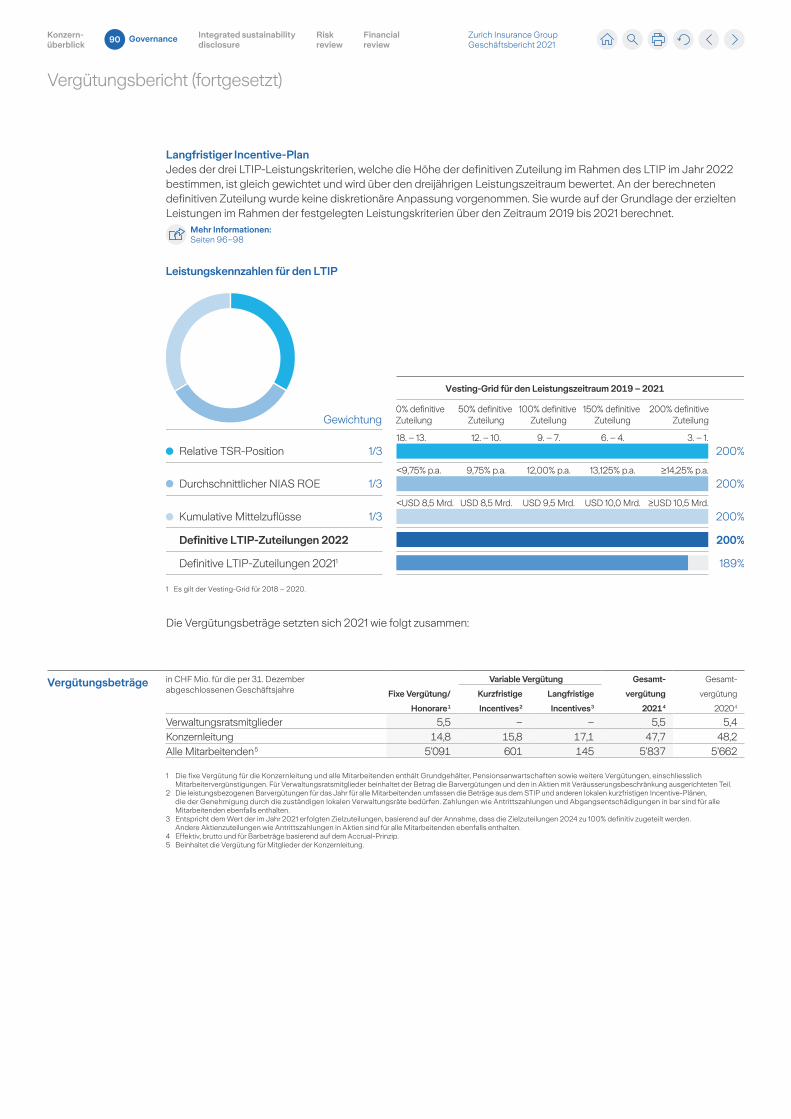
Vergütungsbericht (fortgesetzt)
Langfristiger Incentive-PlanJedes der drei LTIPLeistungskriterien, welche die Höhe der definitiven Zuteilung im Rahmen des LTIP im Jahr 2022 bestimmen, ist gleich gewichtet und wird über den dreijährigen Leistungszeitraum bewertet. An der berechneten definitiven Zuteilung wurde keine diskretionäre Anpassung vorgenommen. Sie wurde auf der Grundlage der erzielten Leistungen im Rahmen der festgelegten Leistungskriterien über den Zeitraum 2019 bis 2021 berechnet.
Mehr Informationen:Seiten 96–98
Relative TSR-Position 1/3
Gewichtung
Durchschnittlicher NIAS ROE 1/3
Kumulative Mittelzuflüsse 1/3
Definitive LTIP-Zuteilungen 2022
Definitive LTIP-Zuteilungen 20211
Leistungskennzahlen für den LTIP
200%
200%
200%
200%
189%
18. – 13. 12. – 10. 9. – 7. 6. – 4. 3. – 1.
<9,75% p.a. 9,75% p.a. 12,00% p.a. 13,125% p.a. ≥14,25% p.a.
<USD 8,5 Mrd. USD 8,5 Mrd. USD 9,5 Mrd. USD 10,0 Mrd. ≥USD 10,5 Mrd.
0% definitive Zuteilung
50% definitive Zuteilung
100% definitive Zuteilung
150% definitive Zuteilung
200% definitiveZuteilung
–
Vesting-Grid für den Leistungszeitraum 2019 – 2021
1 Es gilt der Vesting-Grid für 2018 – 2020.
Die Vergütungsbeträge setzten sich 2021 wie folgt zusammen:
Vergütungsbeträge in CHF Mio. für die per 31. Dezember abgeschlossenen Geschäftsjahre Fixe Vergütung/
Honorare 1
Variable Vergütung Gesamt-
vergütung
2021 4
Gesamt
vergütung
2020 4
Kurzfristige
Incentives 2
Langfristige
Incentives 3
Verwaltungsratsmitglieder 5,5 – – 5,5 5,4Konzernleitung 14,8 15,8 17,1 47,7 48,2Alle Mitarbeitenden 5 5’091 601 145 5’837 5’662
1 Die fixe Vergütung für die Konzernleitung und alle Mitarbeitenden enthält Grundgehälter, Pensionsanwartschaften sowie weitere Vergütungen, einschliesslich Mitarbeitervergünstigungen. Für Verwaltungsratsmitglieder beinhaltet der Betrag die Barvergütungen und den in Aktien mit Veräusserungsbeschränkung ausgerichteten Teil.
2 Die leistungsbezogenen Barvergütungen für das Jahr für alle Mitarbeitenden umfassen die Beträge aus dem STIP und anderen lokalen kurzfristigen IncentivePlänen, die der Genehmigung durch die zuständigen lokalen Verwaltungsräte bedürfen. Zahlungen wie Antrittszahlungen und Abgangsentschädigungen in bar sind für alle Mitarbeitenden ebenfalls enthalten.
3 Entspricht dem Wert der im Jahr 2021 erfolgten Zielzuteilungen, basierend auf der Annahme, dass die Zielzuteilungen 2024 zu 100% definitiv zugeteilt werden. Andere Aktienzuteilungen wie Antrittszahlungen in Aktien sind für alle Mitarbeitenden ebenfalls enthalten.
4 Effektiv, brutto und für Barbeträge basierend auf dem AccrualPrinzip.5 Beinhaltet die Vergütung für Mitglieder der Konzernleitung.
Zurich Insurance Group Geschäftsbericht 2021
Konzern-überblick
Integrated sustainability disclosure
Governance Risk review
Financial review
90
Vergütungsbericht (fortgesetzt)
Zusammenfassender Ausblick auf 2022
– Jährliche Überprüfung der Vergütungsstruktur: Die Vergütungskennzahlen werden im Einklang mit den strategischen Zielen überprüft, die für den nächsten Strategiezyklus von 2023 bis 2025 festgelegt werden, um sicherzustellen, dass die Vergütungsstruktur weiterhin die Umsetzung der Strategie unterstützt.
Mehr Informationen:Seite 116
– Die Einbeziehung zusätzlicher ESG-Kennzahlen in die variable Vergütung wird geprüft: Der STIP berücksichtigt derzeit nichtfinanzielle Kennzahlen sowohl für die Finanzierung der Zuteilungen als auch für die persönlichen Ziele der Mitarbeitenden, die für die individuelle Leistungsbeurteilung herangezogen werden. Im Jahr 2022 werden weitere Optionen für ESGKennzahlen geprüft, die für die IncentivePläne vor dem nächsten Strategiezyklus infrage kommen könnten.
Mehr Informationen:Seite 116
– Verwaltungsrat: Für 2022 werden keine Änderungen der Verwaltungsratsgebühren vorgeschlagen.
Mehr Informationen:Seiten 102–106
– Konzernleitung: 2022 werden keine Änderungen an der Vergütungsstruktur für die Konzernleitung insgesamt vorgeschlagen. Relevante individuelle Leistungsziele für 2022 wurden festgelegt, um die Umsetzung der Strategie zu unterstützen, wobei auch Risiko und Verhaltensaspekte berücksichtigt werden.
Mehr Informationen:Seiten 106–113
Zurich Insurance Group Geschäftsbericht 2021
Konzern-überblick
Integrated sustainability disclosure
Governance Risk review
Financial review
91
Vergütungsbericht (fortgesetzt)
Vergütungsstruktur
PhilosophieDie Mitarbeitenden von Zurich gestalten die Zukunft des Unternehmens mit. Ein Unternehmen, das seinen Mitarbeitenden und Kunden ein einzigartiges Erlebnis bietet, die sozialen Bedingungen verbessert und gemeinsam mit unseren Anspruchsgruppen eine bessere Zukunft schafft. Unsere Vergütungsphilosophie ist ein integraler Bestandteil des gesamten Beschäftigungsangebots und unterstützt die Mitarbeitenden dabei, einen positiven Beitrag zum Erfolg des Unternehmens zu leisten. Basierend auf etablierten Vergütungsgrundsätzen hat die Gruppe ein ausgeglichenes und effektiv verwaltetes Vergütungssystem, das eine wettbewerbsfähige Gesamtvergütung gewährleistet, um Mitarbeitende zu gewinnen, zu halten, zu motivieren und zu entlohnen. Das Vergütungssystem und die Vergütungspraktiken sind in das Enterprise Risk Management Framework der Gruppe eingebettet und berücksichtigen gesetzliche und regulatorische Anforderungen sowie Marktentwicklungen.
Leitsätze der VergütungsphilosophieDie im Vergütungsreglement von Zurich dargelegten Leitsätze der Vergütungsphilosophie lauten wie folgt:
– Die Vergütungsstruktur ist einfach, transparent und praktisch umsetzbar und berücksichtigt die Interessen wichtiger Anspruchsgruppen wie Kunden, Aktionäre und Mitarbeitende.
– Prämienentscheidungen erfolgen leistungsbezogen – auf der Grundlage von Leistungen, Fertigkeiten, Erfahrungen, Qualifikationen und Potenzial – und frei von jeglichen Diskriminierungen aufgrund unterschiedlicher Hintergründe. Das Vergütungssystem und die Vergütungspraktiken stellen Chancengleichheit für alle Mitarbeitenden sicher.
– Struktur und Höhe der Gesamtvergütung sind auf die Risikopolitik der Gruppe und auf ihre Risikokapazität abgestimmt.
– Die Elemente der Vergütung für jeden Mitarbeitenden berücksichtigen angemessene interne und externe Faktoren und sind bei Mitarbeitenden, die wesentlichen Einfluss auf das Risikoprofil der Gruppe nehmen, an langfristige Ergebnisse geknüpft.
– Im Rahmen eines klar definierten Leistungs und Entwicklungskonzepts werden die Mitarbeitenden während des ganzen Jahres angeleitet, persönliche Ziele zu erreichen und Verhaltensweisen an den Tag zu legen, die mit dem Verhaltenskodex, dem Unternehmenszweck und den Werten der Gruppe übereinstimmen.
– Bei den variablen Vergütungen werden relevante Leistungsfaktoren berücksichtigt. Hierzu können die Leistung der Gruppe, der Länder, der Geschäftseinheiten, der Funktionen sowie individuelle Leistungen zählen.
– Die Gruppen IncentivePläne STIP und LTIP, die bei der variablen Vergütung Anwendung finden, sind an geeignete Leistungskriterien geknüpft, die so ausgewählt werden, dass sie die Umsetzung der Strategie der Gruppe unterstützen. Der gesamte Aufwand für die variablen Vergütungen wird im Zusammenhang mit der langfristigen wirtschaftlichen Leistung der Gruppe betrachtet.
– Durch den LTIP werden Teile der variablen Vergütung an die zukünftige Entwicklung der Leistung und der Risiken gebunden, indem aufgeschobene Vergütungsmechanismen eingesetzt werden. Dadurch werden die Teilnehmer ermutigt, das Unternehmen auf nachhaltige Weise zu führen.
– Den Mitarbeitenden wird eine Reihe von Leistungen angeboten, die auf lokaler Marktpraxis beruhen.
VergütungselementeGesamtvergütungDie Gesamtvergütung eines einzelnen Mitarbeitenden und ihre Zusammensetzung können von verschiedenen Faktoren abhängen, wie dem Umfang und der Komplexität der Funktion, der Verantwortungsstufe, der Risikoexposition, der Geschäftsperformance der Gruppe und der wirtschaftlichen Tragfähigkeit, der persönlichen Leistung, der Berufserfahrung, den internen Relativitäten, der externen Wettbewerbsfähigkeit, dem geografischen Standort sowie rechtlichen Anforderungen. Die Vergütung orientiert sich an den Medianwerten in klar definierten Märkten, die, abhängig von der Funktion, lokal, regional oder global sein können und Praktiken in der Versicherungsbranche, der Finanzdienstleistungsbranche oder sonstigen Branchen widerspiegeln.
Zurich Insurance Group Geschäftsbericht 2021
Konzern-überblick
Integrated sustainability disclosure
Governance Risk review
Financial review
92
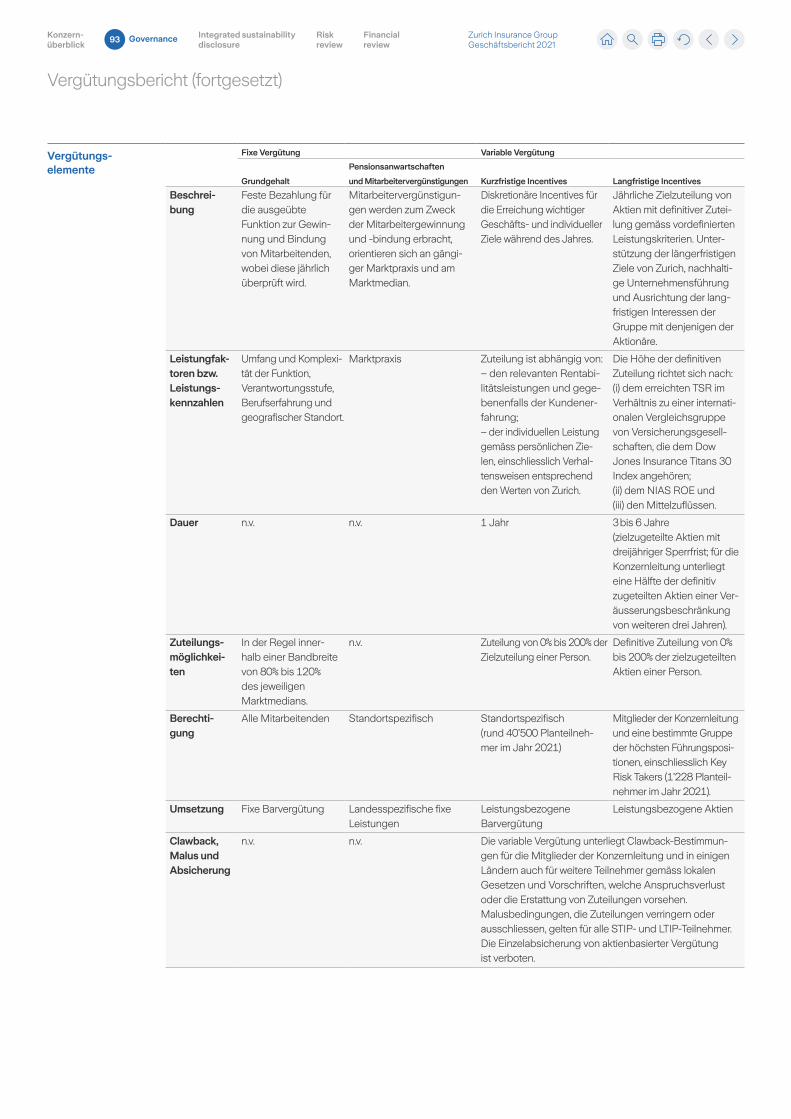
Vergütungsbericht (fortgesetzt)
Vergütungs- elemente
Fixe Vergütung Variable Vergütung
Grundgehalt
Pensionsanwartschaften
und Mitarbeitervergünstigungen Kurzfristige Incentives Langfristige Incentives
Beschrei-bung
Feste Bezahlung für die ausgeübte Funktion zur Gewinnung und Bindung von Mitarbeitenden, wobei diese jährlich überprüft wird.
Mitarbeitervergünstigungen werden zum Zweck der Mitarbeitergewinnung und bindung erbracht, orientieren sich an gängiger Marktpraxis und am Marktmedian.
Diskretionäre Incentives für die Erreichung wichtiger Geschäfts und individueller Ziele während des Jahres.
Jährliche Zielzuteilung von Aktien mit definitiver Zuteilung gemäss vordefinierten Leistungskriterien. Unterstützung der längerfristigen Ziele von Zurich, nachhaltige Unternehmensführung und Ausrichtung der langfristigen Interessen der Gruppe mit denjenigen der Aktionäre.
Leistungfak-toren bzw. Leistungs-kennzahlen
Umfang und Komplexität der Funktion, Verantwortungsstufe, Berufserfahrung und geografischer Standort.
Marktpraxis Zuteilung ist abhängig von: – den relevanten Rentabilitätsleistungen und gegebenenfalls der Kundenerfahrung; – der individuellen Leistung gemäss persönlichen Zielen, einschliesslich Verhaltensweisen entsprechend den Werten von Zurich.
Die Höhe der definitiven Zuteilung richtet sich nach: (i) dem erreichten TSR im Verhältnis zu einer internationalen Vergleichsgruppe von Versicherungsgesellschaften, die dem Dow Jones Insurance Titans 30 Index angehören; (ii) dem NIAS ROE und (iii) den Mittelzuflüssen.
Dauer n.v. n.v. 1 Jahr 3 bis 6 Jahre (zielzugeteilte Aktien mit dreijähriger Sperrfrist; für die Konzernleitung unterliegt eine Hälfte der definitiv zugeteilten Aktien einer Veräusserungsbeschränkung von weiteren drei Jahren).
Zuteilungs-möglichkei-ten
In der Regel innerhalb einer Bandbreite von 80% bis 120% des jeweiligen Marktmedians.
n.v. Zuteilung von 0% bis 200% der Zielzuteilung einer Person.
Definitive Zuteilung von 0% bis 200% der zielzugeteilten Aktien einer Person.
Berechti-gung
Alle Mitarbeitenden Standortspezifisch Standortspezifisch (rund 40’500 Planteilnehmer im Jahr 2021)
Mitglieder der Konzernleitung und eine bestimmte Gruppe der höchsten Führungspositionen, einschliesslich Key Risk Takers (1’228 Planteilnehmer im Jahr 2021).
Umsetzung Fixe Barvergütung Landesspezifische fixe Leistungen
Leistungsbezogene Barvergütung
Leistungsbezogene Aktien
Clawback, Malus und Absicherung
n.v. n.v. Die variable Vergütung unterliegt ClawbackBestimmungen für die Mitglieder der Konzernleitung und in einigen Ländern auch für weitere Teilnehmer gemäss lokalen Gesetzen und Vorschriften, welche Anspruchsverlust oder die Erstattung von Zuteilungen vorsehen. Malusbedingungen, die Zuteilungen verringern oder ausschliessen, gelten für alle STIP und LTIPTeilnehmer. Die Einzelabsicherung von aktienbasierter Vergütung ist verboten.
Zurich Insurance Group Geschäftsbericht 2021
Konzern-überblick
Integrated sustainability disclosure
Governance Risk review
Financial review
93
Vergütungsbericht (fortgesetzt)
Fixe VergütungDie fixe Vergütung umfasst Grundgehälter, Pensionsanwartschaften sowie weitere Vergütungen, einschliesslich Mitarbeitervergünstigungen.
Hinsichtlich der Altersvorsorge bietet die Gruppe ihren Mitarbeitenden eine Reihe von Pensionsleistungen, die sich an der lokalen Marktpraxis orientieren sollen. Die Höhe der Leistungen wird am jeweiligen Marktmedian ausgerichtet. Das Group Pensions Committee sorgt für die Überwachung und fungiert als Fokus und Koordinationspunkt auf Gruppenebene in Bezug auf das langfristige finanzielle und operative Risiko sowie die Governance im Zusammenhang mit den Pensionsvereinbarungen der Gruppe. In den letzten Jahren verlagerte sich der Schwerpunkt eindeutig weg von Pensionsplänen mit Leistungsprimat, bei denen die Höhe der Leistungen sich nach dem Endgehalt richtet. Heute nehmen fast alle neuen Mitarbeitenden an Plänen teil, die auf einem Beitragsprimat und/oder einem CashBalanceAnsatz basieren.
Die Gruppe sieht ausserdem eine Reihe von Mitarbeitervergünstigungen vor, die sich an der lokalen Marktpraxis orientieren, zum Beispiel Lebensversicherungen, Krankenversicherung und flexible Nebenleistungen, und kann auch spezifische Komponenten von Zurich einschliessen. Weiter gelten in der Gruppe einige mobilitätsbezogene Richtlinien, welche die Mitarbeitenden bei Standortwechseln innerhalb der Organisation unterstützen.
Variable VergütungDie IncentivePläne sehen eine Reihe von Zuteilungsmöglichkeiten vor, die an das Leistungsniveau gekoppelt sind. Überdurchschnittliche Geschäftsergebnisse und persönliche Leistungen der Mitarbeitenden können zu über der Zielgrösse liegenden variablen Zahlungen führen. Bleiben die Leistungen hinter den Erwartungen zurück, kann die variable Vergütung geringer als die Zielgrösse ausfallen. Variable Vergütungen werden gewährt, um die Mitarbeiten den zu motivieren, wichtige kurz und langfristige Geschäftsziele zu erreichen, welche zur Umsetzung der Strategie der Gruppe beitragen. Mehr Informationen zum STIP und LTIP der Gruppe finden Sie weiter unten.
Kurzfristige IncentivesKurzfristige Incentives (ein Jahr) sind leistungsabhängig und für das Jahr 2021 wie folgt strukturiert:Barvergütungen im Rahmen des kurzfristigen IncentivePlans unterstützen Mitarbeitende, ihre Leistung auf die Erreichung wichtiger finanzieller, kundenbezogener und individueller Ziele zu fokussieren, die zu Beginn des Jahres festgelegt werden. Sie werden primär über den gruppenweiten STIP ausgerichtet, der im gesamten Unternehmen verwendet wird und in vielen Ländern für alle Mitarbeitenden gültig ist. In einigen Ländern nimmt, je nach Marktpraxis am betreffenden Standort, nur das oberste Management daran teil. Die Bestimmung der endgültigen individuellen STIPZuteilung für das am 31. Dezember 2021 abgeschlossene Jahr basiert auf der STIPZielzuteilung einer Person, der Geschäftsperformance in Übereinstimmung mit dem Pool, dem die Person zugeteilt wurde, und der persönlichen Leistung der Person in Bezug auf Ziele und Verhaltensweisen, wie in der Übersicht auf der folgenden Seite dargestellt. Für Mitarbeitende unterhalb einer bestimmten Stufe haben die Märkte auch die Möglichkeit, die Zuteilung ausschliesslich von der individuellen STIPZielzuteilung und dem erreichten Leistungsniveau des entsprechenden Pools abhängig zu machen, sofern ein Mindeststandard an individueller Leistung und erwarteten Verhaltensweisen erreicht worden ist.
Zurich Insurance Group Geschäftsbericht 2021
Konzern-überblick
Integrated sustainability disclosure
Governance Risk review
Financial review
94
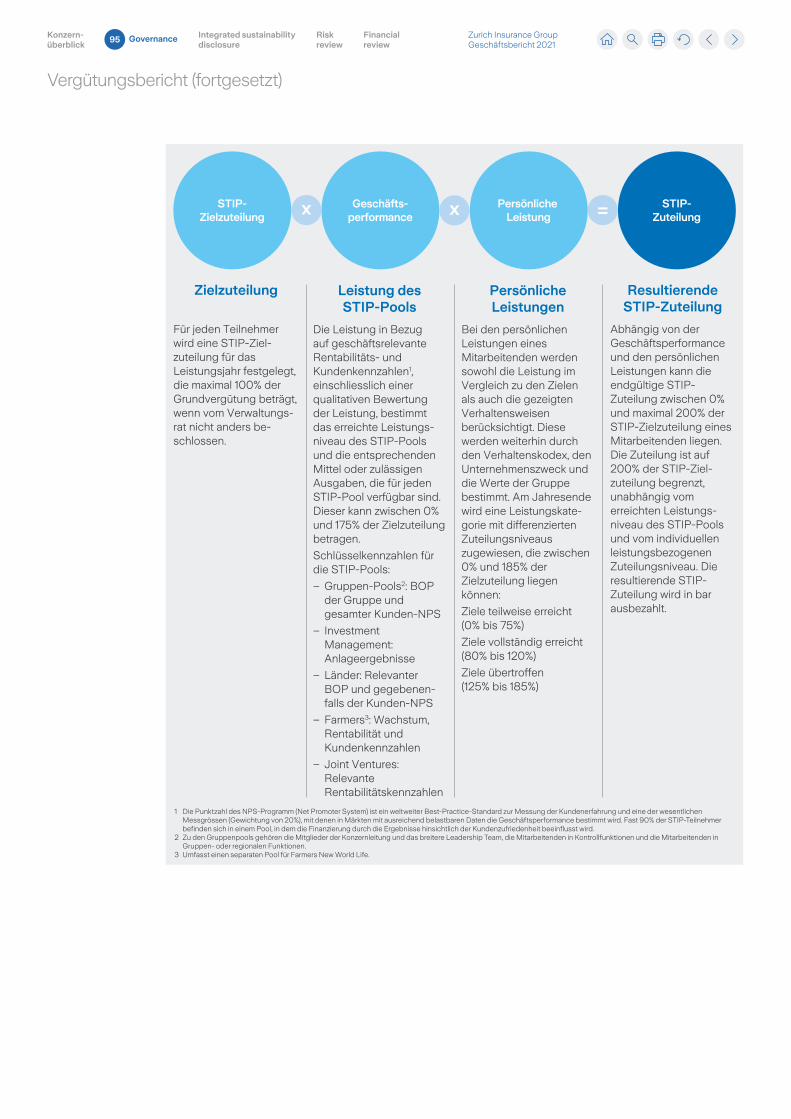
Vergütungsbericht (fortgesetzt)
STIP-Zielzuteilung
STIP-Zuteilung
Persönliche Leistung
Geschäfts-performance
1 Die Punktzahl des NPS-Programm (Net Promoter System) ist ein weltweiter Best-Practice-Standard zur Messung der Kundenerfahrung und eine der wesentlichen Messgrössen (Gewichtung von 20%), mit denen in Märkten mit ausreichend belastbaren Daten die Geschäftsperformance bestimmt wird. Fast 90% der STIP-Teilnehmer befinden sich in einem Pool, in dem die Finanzierung durch die Ergebnisse hinsichtlich der Kundenzufriedenheit beeinflusst wird.
2 Zu den Gruppenpools gehören die Mitglieder der Konzernleitung und das breitere Leadership Team, die Mitarbeitenden in Kontrollfunktionen und die Mitarbeitenden in Gruppen- oder regionalen Funktionen.
3 Umfasst einen separaten Pool für Farmers New World Life.
Zielzuteilung
Für jeden Teilnehmer wird eine STIP-Ziel-zuteilung für das Leistungsjahr festgelegt, die maximal 100% der Grundvergütung beträgt, wenn vom Verwaltungs-rat nicht anders be- schlossen.
Resultierende STIP-Zuteilung
Abhängig von der Geschäftsperformance und den persönlichen Leistungen kann die endgültige STIP-Zuteilung zwischen 0% und maximal 200% der STIP-Zielzuteilung eines Mitarbeitenden liegen. Die Zuteilung ist auf 200% der STIP-Ziel-zuteilung begrenzt, unabhängig vom erreichten Leistungs-niveau des STIP-Pools und vom individuellen leistungsbezogenen Zuteilungsniveau. Die resultierende STIP-Zuteilung wird in bar ausbezahlt.
Leistung des STIP-Pools
Die Leistung in Bezug auf geschäftsrelevante Rentabilitäts- und Kundenkennzahlen1, einschliesslich einer qualitativen Bewertung der Leistung, bestimmt das erreichte Leistungs- niveau des STIP-Pools und die entsprechenden Mittel oder zulässigen Ausgaben, die für jeden STIP-Pool verfügbar sind. Dieser kann zwischen 0% und 175% der Zielzuteilungbetragen.
Schlüsselkennzahlen für die STIP-Pools:
– Gruppen-Pools2: BOP der Gruppe und gesamter Kunden-NPS
– Investment Management: Anlageergebnisse
– Länder: Relevanter BOP und gegebenen- falls der Kunden-NPS
– Farmers3: Wachstum, Rentabilität und Kundenkennzahlen
– Joint Ventures: Relevante Rentabilitätskennzahlen
Persönliche Leistungen
Bei den persönlichen Leistungen eines Mitarbeitenden werden sowohl die Leistung im Vergleich zu den Zielen als auch die gezeigten Verhaltensweisen berücksichtigt. Diese werden weiterhin durch den Verhaltenskodex, den Unternehmenszweck und die Werte der Gruppe bestimmt. Am Jahresende wird eine Leistungskate-gorie mit differenzierten Zuteilungsniveaus zugewiesen, die zwischen 0% und 185% der Zielzuteilung liegen können:
Ziele teilweise erreicht (0% bis 75%)
Ziele vollständig erreicht (80% bis 120%)
Ziele übertroffen (125% bis 185%)
x x =
Zurich Insurance Group Geschäftsbericht 2021
Konzern-überblick
Integrated sustainability disclosure
Governance Risk review
Financial review
95
Vergütungsbericht (fortgesetzt)
Langfristige IncentivesLangfristige IncentivePläne (drei bis sechs Jahre) sind leistungsabhängig und für den Leistungszeitraum 2021 bis 2023 wie folgt strukturiert:Um das Erreichen der längerfristigen finanziellen Ziele der Gruppe zu unterstützen, gibt es langfristige Incentives für eine festgelegte Gruppe der höchsten Führungspositionen in der Gruppe, die einen erheblichen Einfluss auf das Risikoprofil der Gruppe haben, sowie für Personen, die für eine Teilnahme geeignet erscheinen, weil sie beispielsweise aufgrund ihrer Fähigkeiten und Fachgebiete am Markt umworben sind. Zu dieser Gruppe gehören im Allgemeinen die Personen mit den höchsten Gesamtvergütungen. Der LTIP bringt die Incentives und Verhaltensweisen der Teilnehmer mit den langfristigen Interessen der Gruppe und ihrer Aktionäre in Einklang. Um diese Zielsetzung weiter zu unterstützen, ist die Einzelabsicherung von Aktien der Zurich Insurance Group AG verboten.
In Abstimmung mit dem Risikoprofil und der Geschäftsstrategie der Gruppe und unter Berücksichtigung der BestPracticeGrundsätze für Versicherungsgesellschaften sowie der Ansichten von Stimmrechtsberatern und Aktionären werden die langfristigen Incentives mit einem aufgeschobenen Element ausgestattet, das den wesentlichen Risiken und dem zeitlichen Horizont Rechnung trägt. Eine derartige aufgeschobene Vergütung ist so strukturiert, dass sie das Risikobewusstsein der Teilnehmer fördert und sie ermutigt, das Geschäft auf nachhaltige Weise zu führen. Der LTIP für den Leistungszeitraum 2021 bis 2023 ist auf der folgenden Seite dargestellt.
Einzelheiten des LTIP, die nach dem Leistungszeitraum von 2019 bis 2021 für die definitiven Zuteilungen 2022 massgeblich sind, finden Sie im Vergütungsbericht 2019 (www.zurich.com/en/investorrelations/resultsandreports). Die Leistungsergebnisse sind in der Zusammenfassung der Vergütung auf Seite 90 aufgeführt.
Zurich Insurance Group Geschäftsbericht 2021
Konzern-überblick
Integrated sustainability disclosure
Governance Risk review
Financial review
96
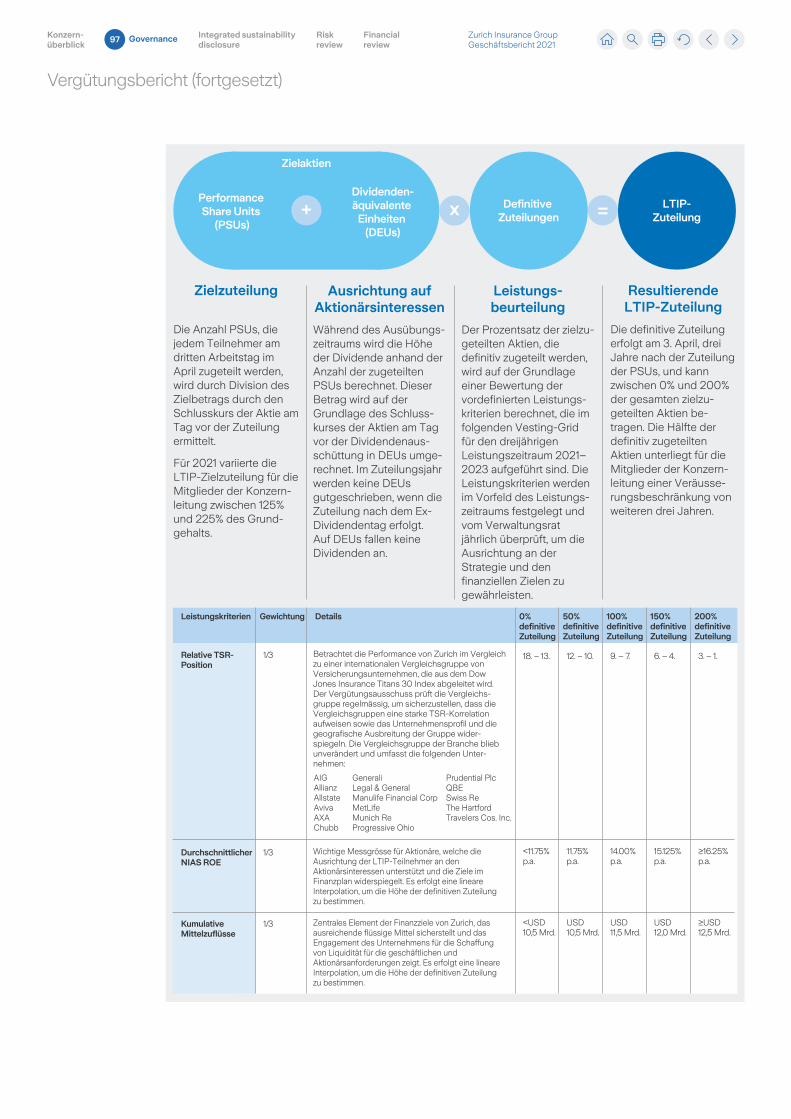
Vergütungsbericht (fortgesetzt)
Performance Share Units
(PSUs)
Zielaktien
LTIP-Zuteilung
Definitive Zuteilungen
Dividenden-äquivalente
Einheiten (DEUs)
Zielzuteilung
Die Anzahl PSUs, die jedem Teilnehmer am dritten Arbeitstag im April zugeteilt werden, wird durch Division des Zielbetrags durch den Schlusskurs der Aktie am Tag vor der Zuteilung ermittelt.
Für 2021 variierte die LTIP-Zielzuteilung für die Mitglieder der Konzern-leitung zwischen 125% und 225% des Grund-gehalts.
Resultierende LTIP-Zuteilung
Die definitive Zuteilung erfolgt am 3. April, drei Jahre nach der Zuteilung der PSUs, und kann zwischen 0% und 200% der gesamten zielzu-geteilten Aktien be-tragen. Die Hälfte der definitiv zugeteilten Aktien unterliegt für die Mitglieder der Konzern-leitung einer Veräusse-rungsbeschränkung von weiteren drei Jahren.
Ausrichtung auf Aktionärsinteressen
Während des Ausübungs-zeitraums wird die Höhe der Dividende anhand der Anzahl der zugeteilten PSUs berechnet. Dieser Betrag wird auf der Grundlage des Schluss-kurses der Aktien am Tag vor der Dividendenaus-schüttung in DEUs umge-rechnet. Im Zuteilungsjahr werden keine DEUs gutgeschrieben, wenn die Zuteilung nach dem Ex-Dividendentag erfolgt. Auf DEUs fallen keine Dividenden an.
Gewichtung DetailsLeistungskriterien
Relative TSR- Position
1/3
200% definitive Zuteilung
3. – 1.
150% definitive Zuteilung
6. – 4.
100% definitive Zuteilung
9. – 7.
50% definitive Zuteilung
12. – 10.
0% definitive Zuteilung
18. – 13.Betrachtet die Performance von Zurich im Vergleich zu einer internationalen Vergleichsgruppe von Versicherungsunternehmen, die aus dem Dow Jones Insurance Titans 30 Index abgeleitet wird. Der Vergütungsausschuss prüft die Vergleichs-gruppe regelmässig, um sicherzustellen, dass die Vergleichsgruppen eine starke TSR-Korrelation aufweisen sowie das Unternehmensprofil und die geografische Ausbreitung der Gruppe wider-spiegeln. Die Vergleichsgruppe der Branche blieb unverändert und umfasst die folgenden Unter-nehmen:
Durchschnittlicher NIAS ROE
1/3 ≥16.25% p.a.
15.125% p.a.
14.00% p.a.
11.75% p.a.
<11.75% p.a.
Wichtige Messgrösse für Aktionäre, welche die Ausrichtung der LTIP-Teilnehmer an den Aktionärsinteressen unterstützt und die Ziele im Finanzplan widerspiegelt. Es erfolgt eine lineare Interpolation, um die Höhe der definitiven Zuteilung zu bestimmen.
Kumulative Mittelzuflüsse
1/3 ≥USD 12,5 Mrd.
USD 12,0 Mrd.
USD 11,5 Mrd.
USD 10,5 Mrd.
<USD 10,5 Mrd.
Zentrales Element der Finanzziele von Zurich, das ausreichende flüssige Mittel sicherstellt und das Engagement des Unternehmens für die Schaffung von Liquidität für die geschäftlichen und Aktionärsanforderungen zeigt. Es erfolgt eine lineare Interpolation, um die Höhe der definitiven Zuteilung zu bestimmen.
AIGAllianzAllstateAvivaAXAChubb
GeneraliLegal & GeneralManulife Financial CorpMetLifeMunich ReProgressive Ohio
Prudential PlcQBESwiss ReThe HartfordTravelers Cos. Inc.
Leistungs-beurteilung
Der Prozentsatz der zielzu-geteilten Aktien, die definitiv zugeteilt werden, wird auf der Grundlage einer Bewertung der vordefinierten Leistungs-kriterien berechnet, die im folgenden Vesting-Grid für den dreijährigen Leistungszeitraum 2021–2023 aufgeführt sind. Die Leistungskriterien werden im Vorfeld des Leistungs-zeitraums festgelegt und vom Verwaltungsrat jährlich überprüft, um die Ausrichtung an der Strategie und den finanziellen Zielen zu gewährleisten.
+ x =
Zurich Insurance Group Geschäftsbericht 2021
Konzern-überblick
Integrated sustainability disclosure
Governance Risk review
Financial review
97
Vergütungsbericht (fortgesetzt)
Aussergewöhnliche AnpassungenDer Verwaltungsrat kann die definitive Zuteilung nach eigenem Ermessen anpassen, um unangemessene Ergebnisse zu vermeiden oder die finanziellen Auswirkungen der getroffenen Entscheidungen zur Umsetzung der Strategie zu berücksichtigen oder mit aussergewöhnlichen Umständen umzugehen. Eine Anpassung um +/–25% der berechneten definitiven Zuteilung kann vorgenommen werden; diese kann positiv oder negativ sein. Nach dem Leistungszeitraum 2019–2021 wurde an der berechneten definitiven Zuteilung für 2022 keine diskretionäre Anpassung vorgenommen.
Das Recht, die Höhe der Zuteilung zu ändern, um individuellen Umständen Rechnung zu tragen, ist dem Group CEO vorbehalten. Ausgenommen hiervon sind Änderungen, die Mitglieder der Konzernleitung betreffen, bei denen dieses Recht dem Verwaltungsrat auf Empfehlung des Vergütungsausschusses vorbehalten ist. Vor der definitiven Zuteilung kann eine Anpassung der Höhe der berechneten definitiven Zuteilung um +/–25% im Einzelfall vorgenommen werden. Wenn die Leistung es jedoch unter aussergewöhnlichen oder unüblichen Umständen rechtfertigt, können Ausnahmen von der Anpassung um +/–25% gemacht werden. In dieser Hinsicht behält sich Zurich das Recht vor, die definitive Zuteilung anzupassen und ihre Höhe während der Periode vor der definitiven Zuteilung für einen Mitarbeitenden gegebenenfalls auf 0% zu setzen, um speziellen Umständen Rechnung zu tragen (z.B. im Zusammenhang mit einem Verstoss gegen interne oder externe Regelungen). Sämtliche derartigen Anpassungen sind jedoch ausschliesslich dem Verwaltungsrat auf Empfehlung des Vergütungsausschusses vorbehalten.
Clawback- und MalusbedingungenDie variable Vergütung unterliegt ClawbackBestimmungen für die Mitglieder der Konzernleitung und in einigen Ländern auch für weitere Teilnehmer gemäss lokalen Gesetzen und Vorschriften, welche die Erstattung von Zuteilungen oder Anspruchsverlust vorsehen. Malusbedingungen zur Verringerung oder Ausschliessung von Zuteilungen gelten für alle STIP und LTIPTeilnehmer. Clawback oder Malusbedingungen können beispielsweise in Fällen von Fehlverhalten, Verstössen gegen den Verhaltenskodex der Gruppe oder gegen geltende Gesetze oder im Falle einer wesentlichen Bilanzberichtigung gelten.
Zurich Insurance Group Geschäftsbericht 2021
Konzern-überblick
Integrated sustainability disclosure
Governance Risk review
Financial review
98
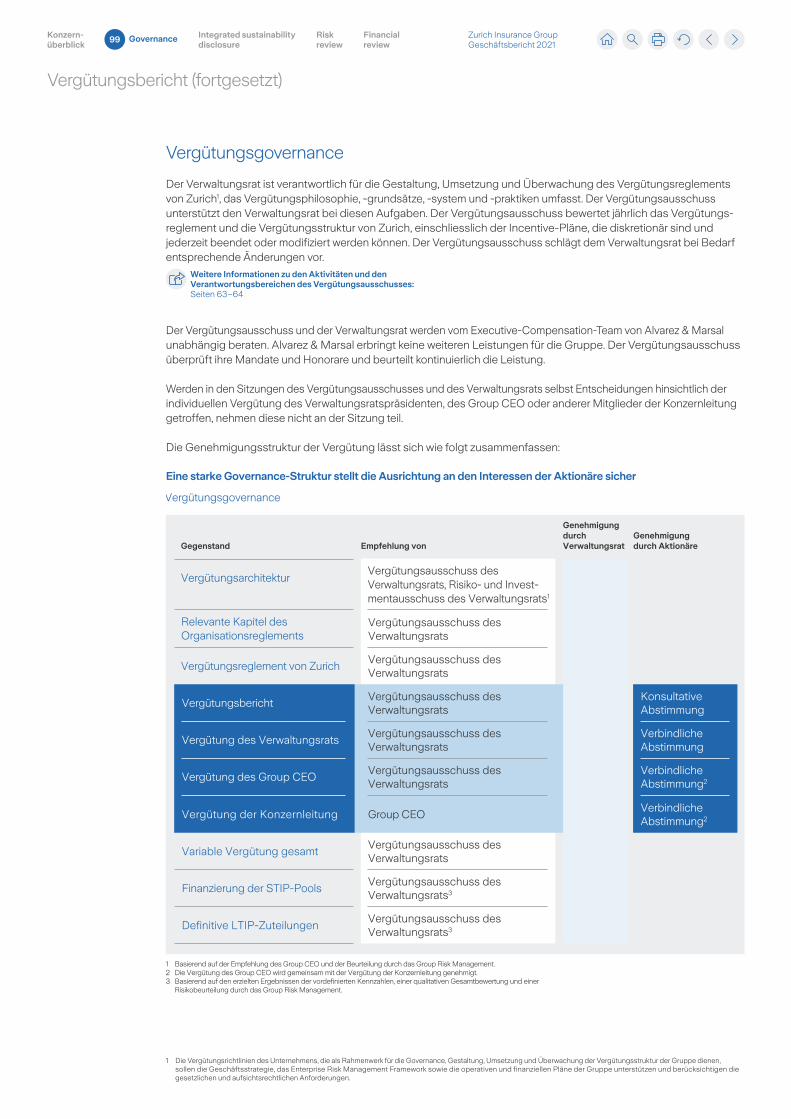
Vergütungsbericht (fortgesetzt)
Vergütungsgovernance
Der Verwaltungsrat ist verantwortlich für die Gestaltung, Umsetzung und Überwachung des Vergütungsreglements von Zurich1, das Vergütungsphilosophie, grundsätze, system und praktiken umfasst. Der Vergütungsausschuss unterstützt den Verwaltungsrat bei diesen Aufgaben. Der Vergütungsausschuss bewertet jährlich das Vergütungsreglement und die Vergütungsstruktur von Zurich, einschliesslich der IncentivePläne, die diskretionär sind und jederzeit beendet oder modifiziert werden können. Der Vergütungsausschuss schlägt dem Verwaltungsrat bei Bedarf entsprechende Änderungen vor.
Weitere Informationen zu den Aktivitäten und den Verantwortungsbereichen des Vergütungsausschusses:Seiten 63–64
Der Vergütungsausschuss und der Verwaltungsrat werden vom ExecutiveCompensationTeam von Alvarez & Marsal unabhängig beraten. Alvarez & Marsal erbringt keine weiteren Leistungen für die Gruppe. Der Vergütungsausschuss überprüft ihre Mandate und Honorare und beurteilt kontinuierlich die Leistung.
Werden in den Sitzungen des Vergütungsausschusses und des Verwaltungsrats selbst Entscheidungen hinsichtlich der individuellen Vergütung des Verwaltungsratspräsidenten, des Group CEO oder anderer Mitglieder der Konzernleitung getroffen, nehmen diese nicht an der Sitzung teil.
Die Genehmigungsstruktur der Vergütung lässt sich wie folgt zusammenfassen:
Vergütungsausschuss des Verwaltungsrats, Risiko- und Invest-mentausschuss des Verwaltungsrats1
Vergütungsausschuss des Verwaltungsrats
Vergütungsausschuss des Verwaltungsrats
Vergütungsausschuss des Verwaltungsrats
Vergütungsausschuss des Verwaltungsrats
Vergütungsausschuss des Verwaltungsrats
Relevante Kapitel des Organisationsreglements
Vergütungsreglement von Zurich
Vergütungsbericht
Vergütung des Group CEO
Vergütung der Konzernleitung
Vergütung des Verwaltungsrats
Finanzierung der STIP-Pools
Definitive LTIP-Zuteilungen
Variable Vergütung gesamt
Vergütungsausschuss des Verwaltungsrats3
Vergütungsausschuss des Verwaltungsrats
Gegenstand Empfehlung von
Genehmigungdurch Verwaltungsrat
Genehmigungdurch Aktionäre
KonsultativeAbstimmung
VerbindlicheAbstimmung2
VerbindlicheAbstimmung2
VerbindlicheAbstimmung
Vergütungsausschuss des Verwaltungsrats3
Vergütungsarchitektur
Vergütungsgovernance
Group CEO
1 Basierend auf der Empfehlung des Group CEO und der Beurteilung durch das Group Risk Management.2 Die Vergütung des Group CEO wird gemeinsam mit der Vergütung der Konzernleitung genehmigt.3 Basierend auf den erzielten Ergebnissen der vordefinierten Kennzahlen, einer qualitativen Gesamtbewertung und einer Risikobeurteilung durch das Group Risk Management.
Eine starke Governance-Struktur stellt die Ausrichtung an den Interessen der Aktionäre sicher
1 Die Vergütungsrichtlinien des Unternehmens, die als Rahmenwerk für die Governance, Gestaltung, Umsetzung und Überwachung der Vergütungsstruktur der Gruppe dienen, sollen die Geschäftsstrategie, das Enterprise Risk Management Framework sowie die operativen und finanziellen Pläne der Gruppe unterstützen und berücksichtigen die gesetzlichen und aufsichtsrechtlichen Anforderungen.
Zurich Insurance Group Geschäftsbericht 2021
Konzern-überblick
Integrated sustainability disclosure
Governance Risk review
Financial review
99
Vergütungsbericht (fortgesetzt)
Gesetzliche und regulatorische AnforderungenDer vorliegende Vergütungsbericht enthält alle erforderlichen Angaben gemäss den folgenden Vorschriften, die Zurich einhält:
– Kapitel 5 der Richtlinie betreffend Informationen zur Corporate Governance der SIX Exchange Regulation.
– Swiss Code of Best Practice for Corporate Governance.
– Art. 14–16 der Schweizerischen Verordnung gegen übermässige Vergütungen bei börsenkotierten Aktiengesellschaften (VegüV).
– Art. 663c Abs. 3 des Schweizerischen Obligationenrechts.
– Rundschreiben 2010/1 der Eidgenössischen Finanzmarktaufsicht FINMA zu den Mindeststandards für Vergütungssysteme bei Finanzinstituten.
Die Aktionäre stimmen über den maximalen Gesamtbetrag der Vergütung des Verwaltungsrats für den nächsten einjährigen Zeitraum zwischen den ordentlichen Generalversammlungen sowie über den maximalen Gesamtbetrag der Vergütung der Konzernleitung für das nächste Geschäftsjahr ab und genehmigen diese Beträge (Art. 18 Abs. 1 der Statuten: www.zurich.com/dede/investorrelations/ourshares/articlesofassociation). Einzelheiten zu den Abstimmungen sind in der Einladung zur ordentlichen Generalversammlung 2022 zu finden (www.zurich.com/dede/investorrelations/shareholderarea/annualgeneralmeeting) sowie in den entsprechenden Abschnitten des Vergütungsberichts über den Verwaltungsrat (Seite 105) und die Konzernleitung (Seite 111). Die Art. 18, 28, 32 und 34 der Statuten beschreiben den Ansatz bei den Abstimmungen über Gehälter, zu zusätzlichen Beträgen für neue Mitglieder der Konzernleitung während eines Zeitraums, für den die Vergütung der Konzernleitung bereits genehmigt wurde, zur leistungsbezogenen Vergütung der Konzernleitung, zur Zuteilung von Aktien, zu Verträgen mit Mitgliedern des Verwaltungsrats und der Konzernleitung sowie zur Vorgehensweise in Bezug auf Darlehen und Kredite.
Vergütung und RisikoDer Vergütungsausschuss und der Risiko und Investmentausschuss treffen sich jährlich, um eine Risikoüberprüfung der Vergütungsstruktur und der VergütungsGovernance zu besprechen. Die Risikobeurteilung bei Prämienentscheidungen und die Fähigkeit, Risikoanpassungen vorzunehmen und gegebenenfalls Malus und Clawback anzuwenden, sind Merkmale des Vergütungssystems von Zurich. Group Risk Management bewertete die Vergütungsstruktur im Jahr 2021 und berichtete, dass keine Anreize geschaffen werden, unangemessene Risiken einzugehen, welche die von der Gruppe tolerierten Risiken übersteigen.
Um die Ausrichtung der Vergütung an der Risikokapazität der Gruppe weiter zu fördern, berät sich Group Risk Management mit anderen Kontroll, Governance und AssuranceFunktionen, um dem Group CEO eine Auswertung über die Risikofaktoren vorzulegen, die bei der Beurteilung der Gesamtleistung für die jährliche Finanzierung von Incentives berücksichtigt werden sollten. Der Group Chief Risk Officer steht zur Verfügung, um diese Ergebnisse mit dem Vergütungsausschuss und dem Verwaltungsrat zu erörtern. Neben anderen Faktoren berücksichtigt der Group CEO die Beurteilung des Group Risk Management, wenn er dem Vergütungsausschuss seine Vorschläge für die STIPZuteilungen vorlegt, damit der Ausschuss eine Empfehlung an den Verwaltungsrat zur endgültigen Genehmigung aussprechen kann.
Alle Positionen des Leadership Teams gelten als KeyRiskTakerPositionen. Zur Vergütung der KeyRiskTakerPositionen gehören sowohl der STIP als auch der LTIP, wobei die langfristigen Incentives und somit die aufgeschobene Vergütungskomponente stärker gewichtet werden. Group Risk Management liefert im Rahmen der jährlichen individuellen Leistungsbeurteilung und für die Zielsetzungen (Target Cards) des Leadership Teams, einschliesslich der Konzernleitung, zusammen mit anderen Kontroll und AssuranceFunktionen Risiko, Compliance und Prüfungsinformationen über alle Key Risk Takers. Dies wird bei der Beurteilung der Leistung und bei Prämienentscheidungen berücksichtigt.
Die variable Vergütung von Mitarbeitenden in Kontroll und AssuranceFunktionen ist so strukturiert, dass Interessenkonflikte vermieden werden, indem sie an Messgrössen für die Rentabilität der Gruppe gekoppelt ist statt an die Rentabilität des Geschäftsbereichs, der von diesen Funktionen gesteuert wird.
Group Audit beurteilt regelmässig die operative Umsetzung des Vergütungsreglements bei Zurich, um sicherzustellen, dass die Vergütungsstruktur in der gesamten Gruppe befolgt wird.
Zurich Insurance Group Geschäftsbericht 2021
Konzern-überblick
Integrated sustainability disclosure
Governance Risk review
Financial review
100
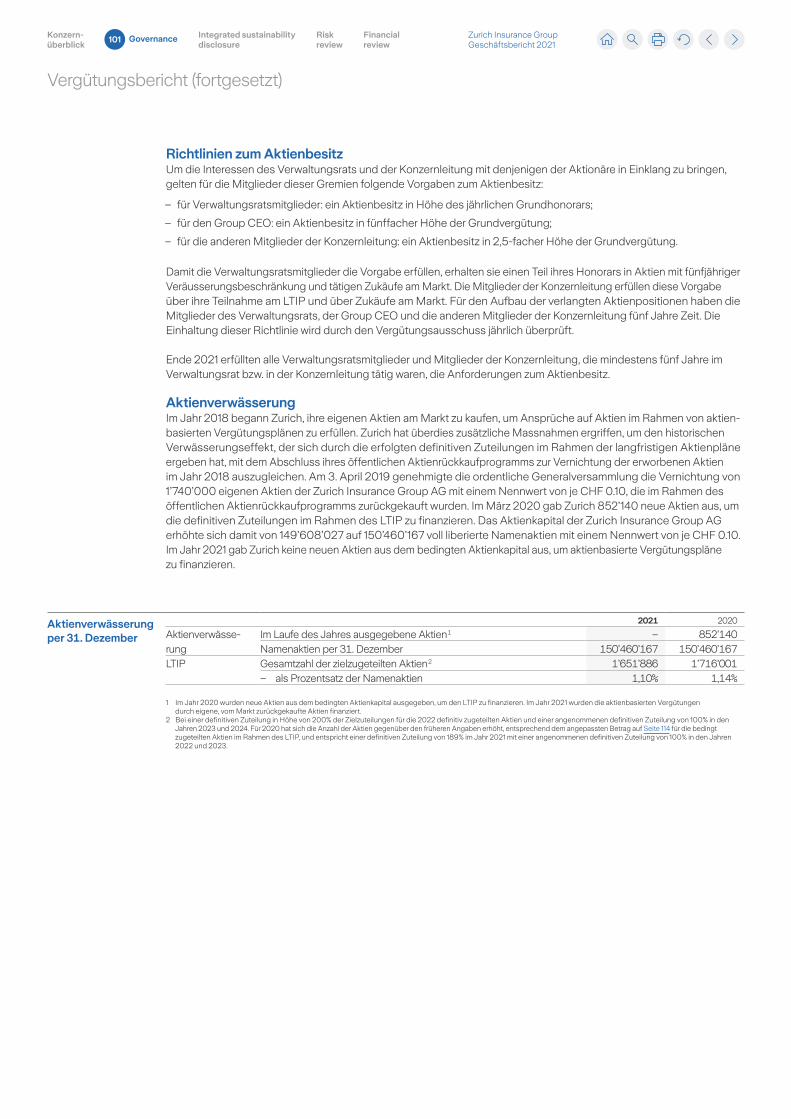
Vergütungsbericht (fortgesetzt)
Richtlinien zum AktienbesitzUm die Interessen des Verwaltungsrats und der Konzernleitung mit denjenigen der Aktionäre in Einklang zu bringen, gelten für die Mitglieder dieser Gremien folgende Vorgaben zum Aktienbesitz:
– für Verwaltungsratsmitglieder: ein Aktienbesitz in Höhe des jährlichen Grundhonorars;
– für den Group CEO: ein Aktienbesitz in fünffacher Höhe der Grundvergütung;
– für die anderen Mitglieder der Konzernleitung: ein Aktienbesitz in 2,5facher Höhe der Grundvergütung.
Damit die Verwaltungsratsmitglieder die Vorgabe erfüllen, erhalten sie einen Teil ihres Honorars in Aktien mit fünfjähriger Veräusserungsbeschränkung und tätigen Zukäufe am Markt. Die Mitglieder der Konzernleitung erfüllen diese Vorgabe über ihre Teilnahme am LTIP und über Zukäufe am Markt. Für den Aufbau der verlangten Aktienpositionen haben die Mitglieder des Verwaltungsrats, der Group CEO und die anderen Mitglieder der Konzernleitung fünf Jahre Zeit. Die Einhaltung dieser Richtlinie wird durch den Vergütungsausschuss jährlich überprüft.
Ende 2021 erfüllten alle Verwaltungsratsmitglieder und Mitglieder der Konzernleitung, die mindestens fünf Jahre im Verwaltungsrat bzw. in der Konzernleitung tätig waren, die Anforderungen zum Aktienbesitz.
AktienverwässerungIm Jahr 2018 begann Zurich, ihre eigenen Aktien am Markt zu kaufen, um Ansprüche auf Aktien im Rahmen von aktienbasierten Vergütungsplänen zu erfüllen. Zurich hat überdies zusätzliche Massnahmen ergriffen, um den historischen Verwässerungseffekt, der sich durch die erfolgten definitiven Zuteilungen im Rahmen der langfristigen Aktienpläne ergeben hat, mit dem Abschluss ihres öffentlichen Aktienrückkaufprogramms zur Vernichtung der erworbenen Aktien im Jahr 2018 auszugleichen. Am 3. April 2019 genehmigte die ordentliche Generalversammlung die Vernichtung von 1’740’000 eigenen Aktien der Zurich Insurance Group AG mit einem Nennwert von je CHF 0.10, die im Rahmen des öffentlichen Aktienrückkaufprogramms zurückgekauft wurden. Im März 2020 gab Zurich 852’140 neue Aktien aus, um die definitiven Zuteilungen im Rahmen des LTIP zu finanzieren. Das Aktienkapital der Zurich Insurance Group AG erhöhte sich damit von 149’608’027 auf 150’460’167 voll liberierte Namenaktien mit einem Nennwert von je CHF 0.10. Im Jahr 2021 gab Zurich keine neuen Aktien aus dem bedingten Aktienkapital aus, um aktienbasierte Vergütungspläne zu finanzieren.
Aktienverwässerung per 31. Dezember
2021 2020
Aktienverwässerung
Im Laufe des Jahres ausgegebene Aktien 1 – 852’140Namenaktien per 31. Dezember 150’460’167 150’460’167
LTIP Gesamtzahl der zielzugeteilten Aktien 2 1’651’886 1’716’001– als Prozentsatz der Namenaktien 1,10% 1,14%
1 Im Jahr 2020 wurden neue Aktien aus dem bedingten Aktienkapital ausgegeben, um den LTIP zu finanzieren. Im Jahr 2021 wurden die aktienbasierten Vergütungen durch eigene, vom Markt zurückgekaufte Aktien finanziert.
2 Bei einer definitiven Zuteilung in Höhe von 200% der Zielzuteilungen für die 2022 definitiv zugeteilten Aktien und einer angenommenen definitiven Zuteilung von 100% in den Jahren 2023 und 2024. Für 2020 hat sich die Anzahl der Aktien gegenüber den früheren Angaben erhöht, entsprechend dem angepassten Betrag auf Seite 114 für die bedingt zugeteilten Aktien im Rahmen des LTIP, und entspricht einer definitiven Zuteilung von 189% im Jahr 2021 mit einer angenommenen definitiven Zuteilung von 100% in den Jahren 2022 und 2023.
Zurich Insurance Group Geschäftsbericht 2021
Konzern-überblick
Integrated sustainability disclosure
Governance Risk review
Financial review
101
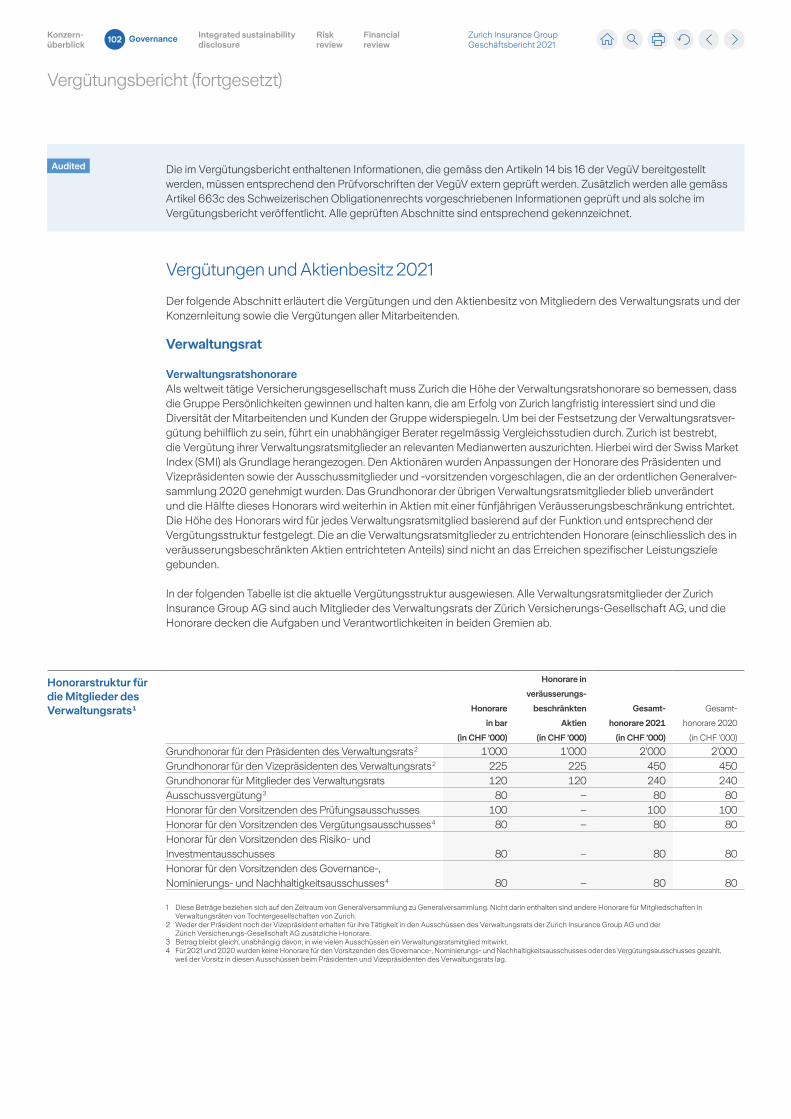
Vergütungsbericht (fortgesetzt)
Audited Die im Vergütungsbericht enthaltenen Informationen, die gemäss den Artikeln 14 bis 16 der VegüV bereitgestellt werden, müssen entsprechend den Prüfvorschriften der VegüV extern geprüft werden. Zusätzlich werden alle gemäss Artikel 663c des Schweizerischen Obligationenrechts vorgeschriebenen Informationen geprüft und als solche im Vergütungsbericht veröffentlicht. Alle geprüften Abschnitte sind entsprechend gekennzeichnet.
Vergütungen und Aktienbesitz 2021
Der folgende Abschnitt erläutert die Vergütungen und den Aktienbesitz von Mitgliedern des Verwaltungsrats und der Konzernleitung sowie die Vergütungen aller Mitarbeitenden.
Verwaltungsrat VerwaltungsratshonorareAls weltweit tätige Versicherungsgesellschaft muss Zurich die Höhe der Verwaltungsratshonorare so bemessen, dass die Gruppe Persönlichkeiten gewinnen und halten kann, die am Erfolg von Zurich langfristig interessiert sind und die Diversität der Mitarbeitenden und Kunden der Gruppe widerspiegeln. Um bei der Festsetzung der Verwaltungsratsvergütung behilflich zu sein, führt ein unabhängiger Berater regelmässig Vergleichsstudien durch. Zurich ist bestrebt, die Vergütung ihrer Verwaltungsratsmitglieder an relevanten Medianwerten auszurichten. Hierbei wird der Swiss Market Index (SMI) als Grundlage herangezogen. Den Aktionären wurden Anpassungen der Honorare des Präsidenten und Vizepräsidenten sowie der Ausschussmitglieder und vorsitzenden vorgeschlagen, die an der ordentlichen Generalversammlung 2020 genehmigt wurden. Das Grundhonorar der übrigen Verwaltungsratsmitglieder blieb unverändert und die Hälfte dieses Honorars wird weiterhin in Aktien mit einer fünfjährigen Veräusserungsbeschränkung entrichtet. Die Höhe des Honorars wird für jedes Verwaltungsratsmitglied basierend auf der Funktion und entsprechend der Vergütungsstruktur festgelegt. Die an die Verwaltungsratsmitglieder zu entrichtenden Honorare (einschliesslich des in veräusserungsbeschränkten Aktien entrichteten Anteils) sind nicht an das Erreichen spezifischer Leistungsziele gebunden.
In der folgenden Tabelle ist die aktuelle Vergütungsstruktur ausgewiesen. Alle Verwaltungsratsmitglieder der Zurich Insurance Group AG sind auch Mitglieder des Verwaltungsrats der Zürich VersicherungsGesellschaft AG, und die Honorare decken die Aufgaben und Verantwortlichkeiten in beiden Gremien ab.
Honorarstruktur für die Mitglieder des Verwaltungsrats 1 Honorare
in bar
(in CHF ’000)
Honorare in
veräusserungs-
beschränkten
Aktien
(in CHF ’000)
Gesamt-
honorare 2021
(in CHF ’000)
Gesamt
honorare 2020
(in CHF ’000)
Grundhonorar für den Präsidenten des Verwaltungsrats 2 1’000 1’000 2’000 2’000 Grundhonorar für den Vizepräsidenten des Verwaltungsrats 2 225 225 450 450Grundhonorar für Mitglieder des Verwaltungsrats 120 120 240 240Ausschussvergütung 3 80 – 80 80Honorar für den Vorsitzenden des Prüfungsausschusses 100 – 100 100Honorar für den Vorsitzenden des Vergütungsausschusses 4 80 – 80 80Honorar für den Vorsitzenden des Risiko und Investmentausschusses 80 – 80 80Honorar für den Vorsitzenden des Governance, Nominierungs und Nachhaltigkeitsausschusses 4 80 – 80 80
1 Diese Beträge beziehen sich auf den Zeitraum von Generalversammlung zu Generalversammlung. Nicht darin enthalten sind andere Honorare für Mitgliedschaften in Verwaltungsräten von Tochtergesellschaften von Zurich.
2 Weder der Präsident noch der Vizepräsident erhalten für ihre Tätigkeit in den Ausschüssen des Verwaltungsrats der Zurich Insurance Group AG und der Zürich VersicherungsGesellschaft AG zusätzliche Honorare.
3 Betrag bleibt gleich, unabhängig davon, in wie vielen Ausschüssen ein Verwaltungsratsmitglied mitwirkt.4 Für 2021 und 2020 wurden keine Honorare für den Vorsitzenden des Governance, Nominierungs und Nachhaltigkeitsausschusses oder des Vergütungsausschusses gezahlt,
weil der Vorsitz in diesen Ausschüssen beim Präsidenten und Vizepräsidenten des Verwaltungsrats lag.
Zurich Insurance Group Geschäftsbericht 2021
Konzern-überblick
Integrated sustainability disclosure
Governance Risk review
Financial review
102
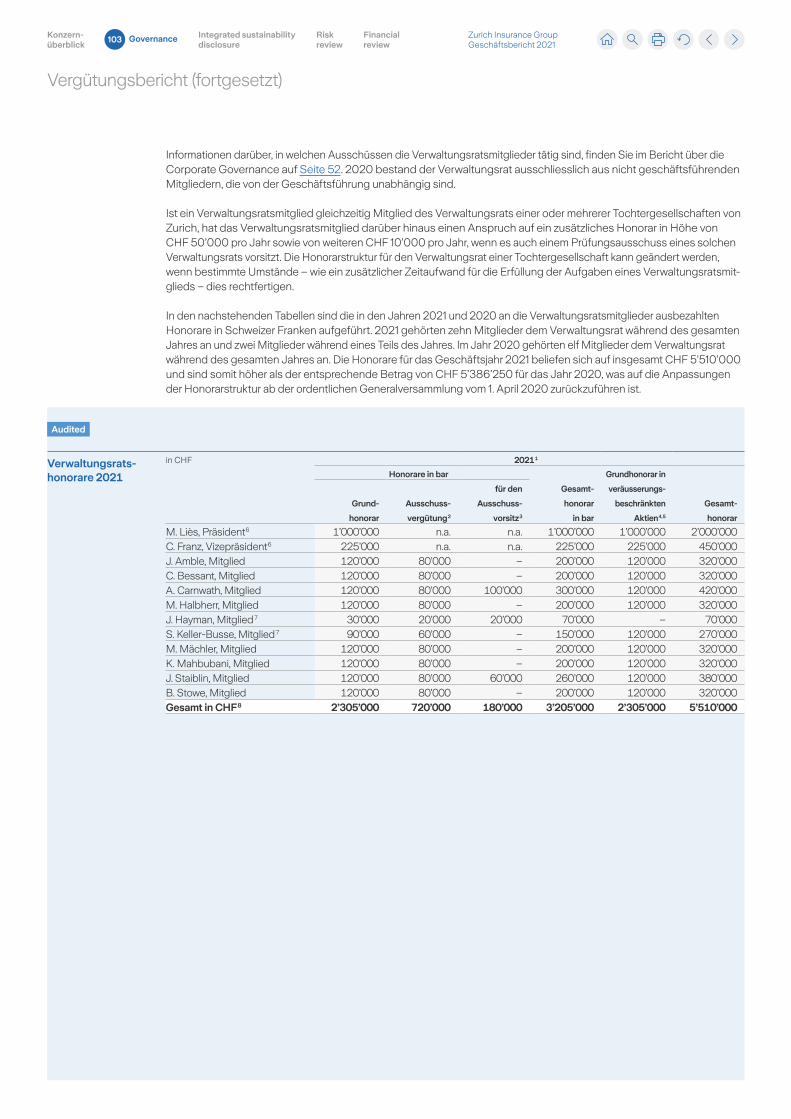
Vergütungsbericht (fortgesetzt)
Audited
Informationen darüber, in welchen Ausschüssen die Verwaltungsratsmitglieder tätig sind, finden Sie im Bericht über die Corporate Governance auf Seite 52. 2020 bestand der Verwaltungsrat ausschliesslich aus nicht geschäftsführenden Mitgliedern, die von der Geschäftsführung unabhängig sind.
Ist ein Verwaltungsratsmitglied gleichzeitig Mitglied des Verwaltungsrats einer oder mehrerer Tochtergesellschaften von Zurich, hat das Verwaltungsratsmitglied darüber hinaus einen Anspruch auf ein zusätzliches Honorar in Höhe von CHF 50’000 pro Jahr sowie von weiteren CHF 10’000 pro Jahr, wenn es auch einem Prüfungsausschuss eines solchen Verwaltungsrats vorsitzt. Die Honorarstruktur für den Verwaltungsrat einer Tochtergesellschaft kann geändert werden, wenn bestimmte Umstände – wie ein zusätzlicher Zeitaufwand für die Erfüllung der Aufgaben eines Verwaltungsratsmitglieds – dies rechtfertigen.
In den nachstehenden Tabellen sind die in den Jahren 2021 und 2020 an die Verwaltungsratsmitglieder ausbezahlten Honorare in Schweizer Franken aufgeführt. 2021 gehörten zehn Mitglieder dem Verwaltungsrat während des gesamten Jahres an und zwei Mitglieder während eines Teils des Jahres. Im Jahr 2020 gehörten elf Mitglieder dem Verwaltungsrat während des gesamten Jahres an. Die Honorare für das Geschäftsjahr 2021 beliefen sich auf insgesamt CHF 5’510’000 und sind somit höher als der entsprechende Betrag von CHF 5’386’250 für das Jahr 2020, was auf die Anpassungen der Honorarstruktur ab der ordentlichen Generalversammlung vom 1. April 2020 zurückzuführen ist.
Verwaltungsrats- honorare 2021
in CHF 2021 1
Honorare in bar
Gesamt-
honorar
in bar
Grundhonorar in
veräusserungs-
beschränkten
Aktien 4, 5
Gesamt-
honorar
Grund-
honorar
Ausschuss-
vergütung 2
für den
Ausschuss-
vorsitz 3
M. Liès, Präsident 6 1’000’000 n.a. n.a. 1’000’000 1’000’000 2’000’000C. Franz, Vizepräsident 6 225’000 n.a. n.a. 225’000 225’000 450’000J. Amble, Mitglied 120’000 80’000 – 200’000 120’000 320’000C. Bessant, Mitglied 120’000 80’000 – 200’000 120’000 320’000A. Carnwath, Mitglied 120’000 80’000 100’000 300’000 120’000 420’000M. Halbherr, Mitglied 120’000 80’000 – 200’000 120’000 320’000J. Hayman, Mitglied 7 30’000 20’000 20’000 70’000 – 70’000S. KellerBusse, Mitglied 7 90’000 60’000 – 150’000 120’000 270’000M. Mächler, Mitglied 120’000 80’000 – 200’000 120’000 320’000K. Mahbubani, Mitglied 120’000 80’000 – 200’000 120’000 320’000J. Staiblin, Mitglied 120’000 80’000 60’000 260’000 120’000 380’000B. Stowe, Mitglied 120’000 80’000 – 200’000 120’000 320’000Gesamt in CHF 8 2’305’000 720’000 180’000 3’205’000 2’305’000 5’510’000
Zurich Insurance Group Geschäftsbericht 2021
Konzern-überblick
Integrated sustainability disclosure
Governance Risk review
Financial review
103
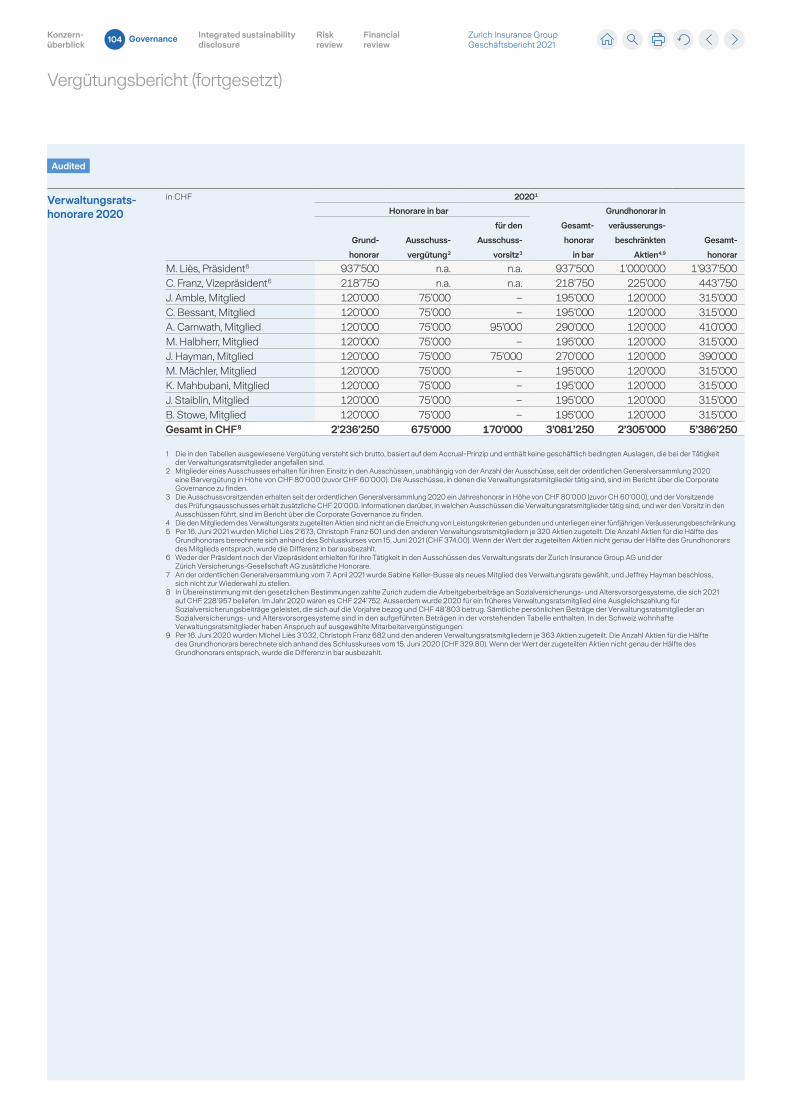
Vergütungsbericht (fortgesetzt)
Audited
Verwaltungsrats- honorare 2020
in CHF 2020 1
Honorare in bar
Gesamt-
honorar
in bar
Grundhonorar in
veräusserungs-
beschränkten
Aktien 4, 9
Gesamt-
honorar
Grund-
honorar
Ausschuss-
vergütung 2
für den
Ausschuss-
vorsitz 3
M. Liès, Präsident 6 937’500 n.a. n.a. 937’500 1’000’000 1’937’500C. Franz, Vizepräsident 6 218’750 n.a. n.a. 218’750 225’000 443’750J. Amble, Mitglied 120’000 75’000 – 195’000 120’000 315’000C. Bessant, Mitglied 120’000 75’000 – 195’000 120’000 315’000A. Carnwath, Mitglied 120’000 75’000 95’000 290’000 120’000 410’000M. Halbherr, Mitglied 120’000 75’000 – 195’000 120’000 315’000J. Hayman, Mitglied 120’000 75’000 75’000 270’000 120’000 390’000M. Mächler, Mitglied 120’000 75’000 – 195’000 120’000 315’000K. Mahbubani, Mitglied 120’000 75’000 – 195’000 120’000 315’000J. Staiblin, Mitglied 120’000 75’000 – 195’000 120’000 315’000B. Stowe, Mitglied 120’000 75’000 – 195’000 120’000 315’000Gesamt in CHF 8 2’236’250 675’000 170’000 3’081’250 2’305’000 5’386’250
1 Die in den Tabellen ausgewiesene Vergütung versteht sich brutto, basiert auf dem AccrualPrinzip und enthält keine geschäftlich bedingten Auslagen, die bei der Tätigkeit der Verwaltungsratsmitglieder angefallen sind.
2 Mitglieder eines Ausschusses erhalten für ihren Einsitz in den Ausschüssen, unabhängig von der Anzahl der Ausschüsse, seit der ordentlichen Generalversammlung 2020 eine Barvergütung in Höhe von CHF 80’000 (zuvor CHF 60’000). Die Ausschüsse, in denen die Verwaltungsratsmitglieder tätig sind, sind im Bericht über die Corporate Governance zu finden.
3 Die Ausschussvorsitzenden erhalten seit der ordentlichen Generalversammlung 2020 ein Jahreshonorar in Höhe von CHF 80’000 (zuvor CH 60’000), und der Vorsitzende des Prüfungsausschusses erhält zusätzliche CHF 20’000. Informationen darüber, in welchen Ausschüssen die Verwaltungsratsmitglieder tätig sind, und wer den Vorsitz in den Ausschüssen führt, sind im Bericht über die Corporate Governance zu finden.
4 Die den Mitgliedern des Verwaltungsrats zugeteilten Aktien sind nicht an die Erreichung von Leistungskriterien gebunden und unterliegen einer fünfjährigen Veräusserungsbeschränkung.5 Per 16. Juni 2021 wurden Michel Liès 2’673, Christoph Franz 601 und den anderen Verwaltungsratsmitgliedern je 320 Aktien zugeteilt. Die Anzahl Aktien für die Hälfte des
Grundhonorars berechnete sich anhand des Schlusskurses vom 15. Juni 2021 (CHF 374.00). Wenn der Wert der zugeteilten Aktien nicht genau der Hälfte des Grundhonorars des Mitglieds entsprach, wurde die Differenz in bar ausbezahlt.
6 Weder der Präsident noch der Vizepräsident erhielten für ihre Tätigkeit in den Ausschüssen des Verwaltungsrats der Zurich Insurance Group AG und der Zürich VersicherungsGesellschaft AG zusätzliche Honorare.
7 An der ordentlichen Generalversammlung vom 7. April 2021 wurde Sabine KellerBusse als neues Mitglied des Verwaltungsrats gewählt, und Jeffrey Hayman beschloss, sich nicht zur Wiederwahl zu stellen.
8 In Übereinstimmung mit den gesetzlichen Bestimmungen zahlte Zurich zudem die Arbeitgeberbeiträge an Sozialversicherungs und Altersvorsorgesysteme, die sich 2021 auf CHF 228’957 beliefen. Im Jahr 2020 waren es CHF 224’752. Ausserdem wurde 2020 für ein früheres Verwaltungsratsmitglied eine Ausgleichszahlung für Sozialversicherungsbeiträge geleistet, die sich auf die Vorjahre bezog und CHF 48’803 betrug. Sämtliche persönlichen Beiträge der Verwaltungsratsmitglieder an Sozialversicherungs und Altersvorsorgesysteme sind in den aufgeführten Beträgen in der vorstehenden Tabelle enthalten. In der Schweiz wohnhafte Verwaltungsratsmitglieder haben Anspruch auf ausgewählte Mitarbeitervergünstigungen.
9 Per 16. Juni 2020 wurden Michel Liès 3’032, Christoph Franz 682 und den anderen Verwaltungsratsmitgliedern je 363 Aktien zugeteilt. Die Anzahl Aktien für die Hälfte des Grundhonorars berechnete sich anhand des Schlusskurses vom 15. Juni 2020 (CHF 329.80). Wenn der Wert der zugeteilten Aktien nicht genau der Hälfte des Grundhonorars entsprach, wurde die Differenz in bar ausbezahlt.
Zurich Insurance Group Geschäftsbericht 2021
Konzern-überblick
Integrated sustainability disclosure
Governance Risk review
Financial review
104
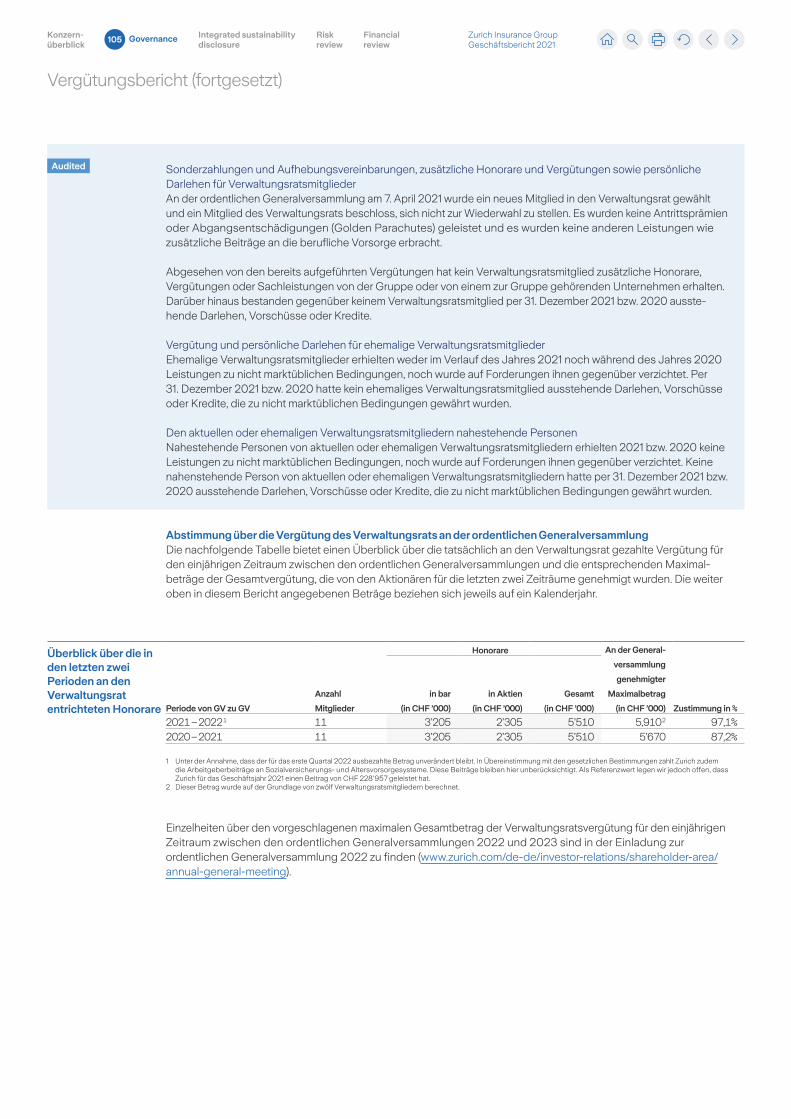
Vergütungsbericht (fortgesetzt)
Audited Sonderzahlungen und Aufhebungsvereinbarungen, zusätzliche Honorare und Vergütungen sowie persönliche Darlehen für VerwaltungsratsmitgliederAn der ordentlichen Generalversammlung am 7. April 2021 wurde ein neues Mitglied in den Verwaltungsrat gewählt und ein Mitglied des Verwaltungsrats beschloss, sich nicht zur Wiederwahl zu stellen. Es wurden keine Antrittsprämien oder Abgangsentschädigungen (Golden Parachutes) geleistet und es wurden keine anderen Leistungen wie zusätzliche Beiträge an die berufliche Vorsorge erbracht.
Abgesehen von den bereits aufgeführten Vergütungen hat kein Verwaltungsratsmitglied zusätzliche Honorare, Vergütungen oder Sachleistungen von der Gruppe oder von einem zur Gruppe gehörenden Unternehmen erhalten. Darüber hinaus bestanden gegenüber keinem Verwaltungsratsmitglied per 31. Dezember 2021 bzw. 2020 ausstehende Darlehen, Vorschüsse oder Kredite.
Vergütung und persönliche Darlehen für ehemalige VerwaltungsratsmitgliederEhemalige Verwaltungsratsmitglieder erhielten weder im Verlauf des Jahres 2021 noch während des Jahres 2020 Leistungen zu nicht marktüblichen Bedingungen, noch wurde auf Forderungen ihnen gegenüber verzichtet. Per 31. Dezember 2021 bzw. 2020 hatte kein ehemaliges Verwaltungsratsmitglied ausstehende Darlehen, Vorschüsse oder Kredite, die zu nicht marktüblichen Bedingungen gewährt wurden.
Den aktuellen oder ehemaligen Verwaltungsratsmitgliedern nahestehende PersonenNahestehende Personen von aktuellen oder ehemaligen Verwaltungsratsmitgliedern erhielten 2021 bzw. 2020 keine Leistungen zu nicht marktüblichen Bedingungen, noch wurde auf Forderungen ihnen gegenüber verzichtet. Keine nahenstehende Person von aktuellen oder ehemaligen Verwaltungsratsmitgliedern hatte per 31. Dezember 2021 bzw. 2020 ausstehende Darlehen, Vorschüsse oder Kredite, die zu nicht marktüblichen Bedingungen gewährt wurden.
Abstimmung über die Vergütung des Verwaltungsrats an der ordentlichen GeneralversammlungDie nachfolgende Tabelle bietet einen Überblick über die tatsächlich an den Verwaltungsrat gezahlte Vergütung für den einjährigen Zeitraum zwischen den ordentlichen Generalversammlungen und die entsprechenden Maximalbeträge der Gesamtvergütung, die von den Aktionären für die letzten zwei Zeiträume genehmigt wurden. Die weiter oben in diesem Bericht angegebenen Beträge beziehen sich jeweils auf ein Kalenderjahr.
Überblick über die in den letzten zwei Perioden an den Verwaltungsrat entrichteten Honorare
Honorare An der General-
versammlung
genehmigter
Maximalbetrag
(in CHF ’000) Zustimmung in %Periode von GV zu GV
Anzahl
Mitglieder
in bar
(in CHF ’000)
in Aktien
(in CHF ’000)
Gesamt
(in CHF ’000)
2021 – 2022 1 11 3’205 2’305 5’510 5,910 2 97,1%2020 – 2021 11 3’205 2’305 5’510 5’670 87,2%
1 Unter der Annahme, dass der für das erste Quartal 2022 ausbezahlte Betrag unverändert bleibt. In Übereinstimmung mit den gesetzlichen Bestimmungen zahlt Zurich zudem die Arbeitgeberbeiträge an Sozialversicherungs und Altersvorsorgesysteme. Diese Beiträge bleiben hier unberücksichtigt. Als Referenzwert legen wir jedoch offen, dass Zurich für das Geschäftsjahr 2021 einen Beitrag von CHF 228’957 geleistet hat.
2 Dieser Betrag wurde auf der Grundlage von zwölf Verwaltungsratsmitgliedern berechnet.
Einzelheiten über den vorgeschlagenen maximalen Gesamtbetrag der Verwaltungsratsvergütung für den einjährigen Zeitraum zwischen den ordentlichen Generalversammlungen 2022 und 2023 sind in der Einladung zur ordentlichen Generalversammlung 2022 zu finden (www.zurich.com/dede/investorrelations/shareholderarea/annualgeneralmeeting).
Zurich Insurance Group Geschäftsbericht 2021
Konzern-überblick
Integrated sustainability disclosure
Governance Risk review
Financial review
105
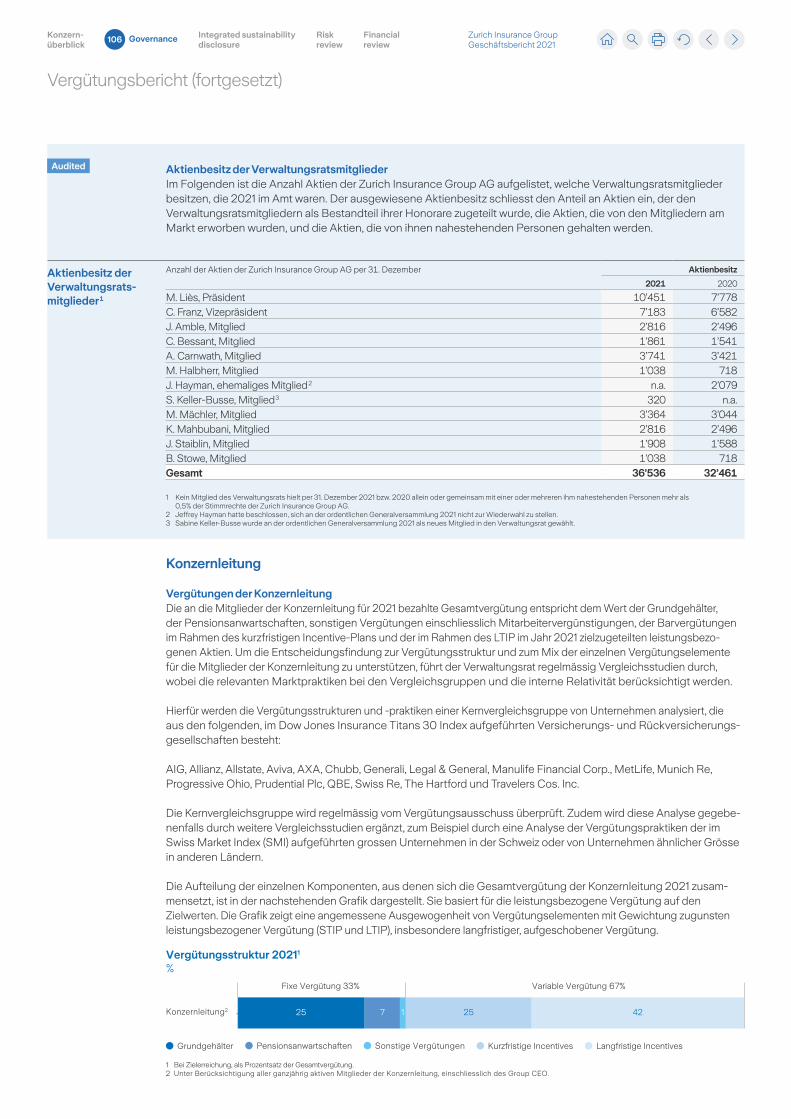
Vergütungsbericht (fortgesetzt)
Audited Aktienbesitz der VerwaltungsratsmitgliederIm Folgenden ist die Anzahl Aktien der Zurich Insurance Group AG aufgelistet, welche Verwaltungsratsmitglieder besitzen, die 2021 im Amt waren. Der ausgewiesene Aktienbesitz schliesst den Anteil an Aktien ein, der den Verwaltungsratsmitgliedern als Bestandteil ihrer Honorare zugeteilt wurde, die Aktien, die von den Mitgliedern am Markt erworben wurden, und die Aktien, die von ihnen nahestehenden Personen gehalten werden.
Aktienbesitz der Verwaltungsrats- mitglieder 1
Anzahl der Aktien der Zurich Insurance Group AG per 31. Dezember Aktienbesitz
2021 2020
M. Liès, Präsident 10’451 7’778C. Franz, Vizepräsident 7’183 6’582J. Amble, Mitglied 2’816 2’496C. Bessant, Mitglied 1’861 1’541A. Carnwath, Mitglied 3’741 3’421M. Halbherr, Mitglied 1’038 718J. Hayman, ehemaliges Mitglied 2 n.a. 2’079S. KellerBusse, Mitglied 3 320 n.a. M. Mächler, Mitglied 3’364 3’044K. Mahbubani, Mitglied 2’816 2’496J. Staiblin, Mitglied 1’908 1’588B. Stowe, Mitglied 1’038 718Gesamt 36’536 32’461
1 Kein Mitglied des Verwaltungsrats hielt per 31. Dezember 2021 bzw. 2020 allein oder gemeinsam mit einer oder mehreren ihm nahestehenden Personen mehr als 0,5% der Stimmrechte der Zurich Insurance Group AG.
2 Jeffrey Hayman hatte beschlossen, sich an der ordentlichen Generalversammlung 2021 nicht zur Wiederwahl zu stellen.3 Sabine KellerBusse wurde an der ordentlichen Generalversammlung 2021 als neues Mitglied in den Verwaltungsrat gewählt.
Konzernleitung
Vergütungen der KonzernleitungDie an die Mitglieder der Konzernleitung für 2021 bezahlte Gesamtvergütung entspricht dem Wert der Grundgehälter, der Pensionsanwartschaften, sonstigen Vergütungen einschliesslich Mitarbeitervergünstigungen, der Barvergütungen im Rahmen des kurzfristigen IncentivePlans und der im Rahmen des LTIP im Jahr 2021 zielzugeteilten leistungsbezogenen Aktien. Um die Entscheidungsfindung zur Vergütungsstruktur und zum Mix der einzelnen Vergütungselemente für die Mitglieder der Konzernleitung zu unterstützen, führt der Verwaltungsrat regelmässig Vergleichsstudien durch, wobei die relevanten Marktpraktiken bei den Vergleichsgruppen und die interne Relativität berücksichtigt werden.
Hierfür werden die Vergütungsstrukturen und praktiken einer Kernvergleichsgruppe von Unternehmen analysiert, die aus den folgenden, im Dow Jones Insurance Titans 30 Index aufgeführten Versicherungs und Rückversicherungsgesellschaften besteht:
AIG, Allianz, Allstate, Aviva, AXA, Chubb, Generali, Legal & General, Manulife Financial Corp., MetLife, Munich Re, Progressive Ohio, Prudential Plc, QBE, Swiss Re, The Hartford und Travelers Cos. Inc.
Die Kernvergleichsgruppe wird regelmässig vom Vergütungsausschuss überprüft. Zudem wird diese Analyse gegebenenfalls durch weitere Vergleichsstudien ergänzt, zum Beispiel durch eine Analyse der Vergütungspraktiken der im Swiss Market Index (SMI) aufgeführten grossen Unternehmen in der Schweiz oder von Unternehmen ähnlicher Grösse in anderen Ländern.
Die Aufteilung der einzelnen Komponenten, aus denen sich die Gesamtvergütung der Konzernleitung 2021 zusammensetzt, ist in der nachstehenden Grafik dargestellt. Sie basiert für die leistungsbezogene Vergütung auf den Zielwerten. Die Grafik zeigt eine angemessene Ausgewogenheit von Vergütungselementen mit Gewichtung zugunsten leistungsbezogener Vergütung (STIP und LTIP), insbesondere langfristiger, aufgeschobener Vergütung.
25 25 427 1
Vergütungsstruktur 20211
%
Konzernleitung2
Grundgehälter Kurzfristige Incentives Langfristige Incentives
Fixe Vergütung 33% Variable Vergütung 67%
1 Bei Zielerreichung, als Prozentsatz der Gesamtvergütung.2 Unter Berücksichtigung aller ganzjährig aktiven Mitglieder der Konzernleitung, einschliesslich des Group CEO.
Pensionsanwartschaften Sonstige Vergütungen
Zurich Insurance Group Geschäftsbericht 2021
Konzern-überblick
Integrated sustainability disclosure
Governance Risk review
Financial review
106
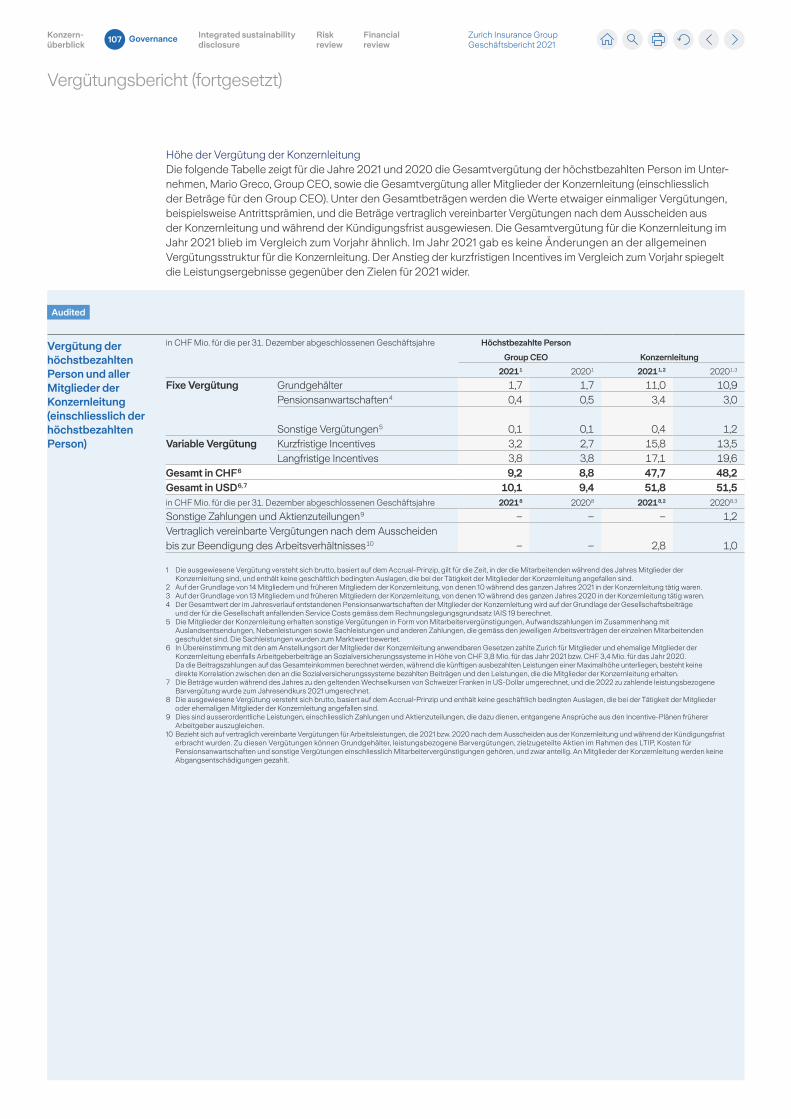
Vergütungsbericht (fortgesetzt)
Audited
Höhe der Vergütung der KonzernleitungDie folgende Tabelle zeigt für die Jahre 2021 und 2020 die Gesamtvergütung der höchstbezahlten Person im Unternehmen, Mario Greco, Group CEO, sowie die Gesamtvergütung aller Mitglieder der Konzernleitung (einschliesslich der Beträge für den Group CEO). Unter den Gesamtbeträgen werden die Werte etwaiger einmaliger Vergütungen, beispielsweise Antrittsprämien, und die Beträge vertraglich vereinbarter Vergütungen nach dem Ausscheiden aus der Konzernleitung und während der Kündigungsfrist ausgewiesen. Die Gesamtvergütung für die Konzernleitung im Jahr 2021 blieb im Vergleich zum Vorjahr ähnlich. Im Jahr 2021 gab es keine Änderungen an der allgemeinen Vergütungsstruktur für die Konzernleitung. Der Anstieg der kurzfristigen Incentives im Vergleich zum Vorjahr spiegelt die Leistungsergebnisse gegenüber den Zielen für 2021 wider.
Vergütung der höchstbezahlten Person und aller Mitglieder der Konzernleitung (einschliesslich der höchstbezahlten Person)
in CHF Mio. für die per 31. Dezember abgeschlossenen Geschäftsjahre Höchstbezahlte Person
Group CEO Konzernleitung
2021 1 2020 1 2021 1, 2 2020 1, 3
Fixe Vergütung
Grundgehälter 1,7 1,7 11,0 10,9Pensionsanwartschaften 4 0,4 0,5 3,4 3,0
Sonstige Vergütungen 5 0,1 0,1 0,4 1,2Variable Vergütung Kurzfristige Incentives 3,2 2,7 15,8 13,5
Langfristige Incentives 3,8 3,8 17,1 19,6Gesamt in CHF 6 9,2 8,8 47,7 48,2Gesamt in USD 6, 7 10,1 9,4 51,8 51,5in CHF Mio. für die per 31. Dezember abgeschlossenen Geschäftsjahre 2021 8 2020 8 2021 8, 2 2020 8, 3
Sonstige Zahlungen und Aktienzuteilungen 9 – – – 1,2Vertraglich vereinbarte Vergütungen nach dem Ausscheiden bis zur Beendigung des Arbeitsverhältnisses 10 – – 2,8 1,0
1 Die ausgewiesene Vergütung versteht sich brutto, basiert auf dem AccrualPrinzip, gilt für die Zeit, in der die Mitarbeitenden während des Jahres Mitglieder der Konzernleitung sind, und enthält keine geschäftlich bedingten Auslagen, die bei der Tätigkeit der Mitglieder der Konzernleitung angefallen sind.
2 Auf der Grundlage von 14 Mitgliedern und früheren Mitgliedern der Konzernleitung, von denen 10 während des ganzen Jahres 2021 in der Konzernleitung tätig waren.3 Auf der Grundlage von 13 Mitgliedern und früheren Mitgliedern der Konzernleitung, von denen 10 während des ganzen Jahres 2020 in der Konzernleitung tätig waren.4 Der Gesamtwert der im Jahresverlauf entstandenen Pensionsanwartschaften der Mitglieder der Konzernleitung wird auf der Grundlage der Gesellschaftsbeiträge
und der für die Gesellschaft anfallenden Service Costs gemäss dem Rechnungslegungsgrundsatz IAIS 19 berechnet.5 Die Mitglieder der Konzernleitung erhalten sonstige Vergütungen in Form von Mitarbeitervergünstigungen, Aufwandszahlungen im Zusammenhang mit
Auslandsentsendungen, Nebenleistungen sowie Sachleistungen und anderen Zahlungen, die gemäss den jeweiligen Arbeitsverträgen der einzelnen Mitarbeitenden geschuldet sind. Die Sachleistungen wurden zum Marktwert bewertet.
6 In Übereinstimmung mit den am Anstellungsort der Mitglieder der Konzernleitung anwendbaren Gesetzen zahlte Zurich für Mitglieder und ehemalige Mitglieder der Konzernleitung ebenfalls Arbeitgeberbeiträge an Sozialversicherungssysteme in Höhe von CHF 3,8 Mio. für das Jahr 2021 bzw. CHF 3,4 Mio. für das Jahr 2020. Da die Beitragszahlungen auf das Gesamteinkommen berechnet werden, während die künftigen ausbezahlten Leistungen einer Maximalhöhe unterliegen, besteht keine direkte Korrelation zwischen den an die Sozialversicherungssysteme bezahlten Beiträgen und den Leistungen, die die Mitglieder der Konzernleitung erhalten.
7 Die Beträge wurden während des Jahres zu den geltenden Wechselkursen von Schweizer Franken in USDollar umgerechnet, und die 2022 zu zahlende leistungsbezogene Barvergütung wurde zum Jahresendkurs 2021 umgerechnet.
8 Die ausgewiesene Vergütung versteht sich brutto, basiert auf dem AccrualPrinzip und enthält keine geschäftlich bedingten Auslagen, die bei der Tätigkeit der Mitglieder oder ehemaligen Mitglieder der Konzernleitung angefallen sind.
9 Dies sind ausserordentliche Leistungen, einschliesslich Zahlungen und Aktienzuteilungen, die dazu dienen, entgangene Ansprüche aus den IncentivePlänen früherer Arbeitgeber auszugleichen.
10 Bezieht sich auf vertraglich vereinbarte Vergütungen für Arbeitsleistungen, die 2021 bzw. 2020 nach dem Ausscheiden aus der Konzernleitung und während der Kündigungs frist erbracht wurden. Zu diesen Vergütungen können Grundgehälter, leistungsbezogene Barvergütungen, zielzugeteilte Aktien im Rahmen des LTIP, Kosten für Pensionsanwartschaften und sonstige Vergütungen einschliesslich Mitarbeitervergünstigungen gehören, und zwar anteilig. An Mitglieder der Konzernleitung werden keine Abgangsentschädigungen gezahlt.
Zurich Insurance Group Geschäftsbericht 2021
Konzern-überblick
Integrated sustainability disclosure
Governance Risk review
Financial review
107
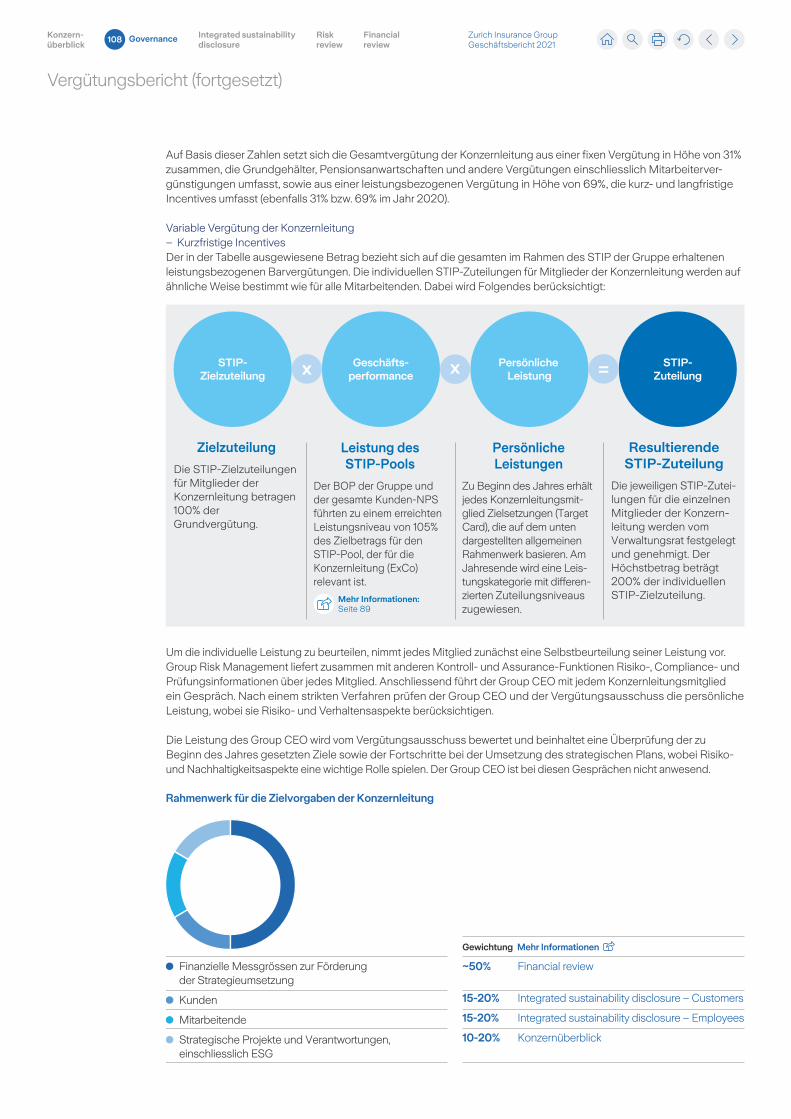
Vergütungsbericht (fortgesetzt)
Auf Basis dieser Zahlen setzt sich die Gesamtvergütung der Konzernleitung aus einer fixen Vergütung in Höhe von 31% zusammen, die Grundgehälter, Pensionsanwartschaften und andere Vergütungen einschliesslich Mitarbeitervergünstigungen umfasst, sowie aus einer leistungsbezogenen Vergütung in Höhe von 69%, die kurz und langfristige Incentives umfasst (ebenfalls 31% bzw. 69% im Jahr 2020).
Variable Vergütung der Konzernleitung– Kurzfristige IncentivesDer in der Tabelle ausgewiesene Betrag bezieht sich auf die gesamten im Rahmen des STIP der Gruppe erhaltenen leistungsbezogenen Barvergütungen. Die individuellen STIPZuteilungen für Mitglieder der Konzernleitung werden auf ähnliche Weise bestimmt wie für alle Mitarbeitenden. Dabei wird Folgendes berücksichtigt:
STIP-Zielzuteilung
STIP-Zuteilung
Persönliche Leistung
Geschäfts-performance
Zielzuteilung
Die STIP-Zielzuteilungen für Mitglieder der Konzernleitung betragen 100% der Grundvergütung.
Resultierende STIP-Zuteilung
Die jeweiligen STIP-Zutei-lungen für die einzelnen Mitglieder der Konzern-leitung werden vom Verwaltungsrat festgelegt und genehmigt. Der Höchstbetrag beträgt 200% der individuellen STIP-Zielzuteilung.
Leistung des STIP-Pools
Der BOP der Gruppe und der gesamte Kunden-NPS führten zu einem erreichten Leistungsniveau von 105% des Zielbetrags für den STIP-Pool, der für die Konzernleitung (ExCo) relevant ist.
Persönliche Leistungen
Zu Beginn des Jahres erhält jedes Konzernleitungsmit-glied Zielsetzungen (Target Card), die auf dem unten dargestellten allgemeinen Rahmenwerk basieren. Am Jahresende wird eine Leis-tungskategorie mit differen-zierten Zuteilungsniveaus zugewiesen.
x x =
Mehr Informationen:Seite 89
Um die individuelle Leistung zu beurteilen, nimmt jedes Mitglied zunächst eine Selbstbeurteilung seiner Leistung vor. Group Risk Management liefert zusammen mit anderen Kontroll und AssuranceFunktionen Risiko, Compliance und Prüfungsinformationen über jedes Mitglied. Anschliessend führt der Group CEO mit jedem Konzernleitungsmitglied ein Gespräch. Nach einem strikten Verfahren prüfen der Group CEO und der Vergütungsausschuss die persönliche Leistung, wobei sie Risiko und Verhaltensaspekte berücksichtigen.
Die Leistung des Group CEO wird vom Vergütungsausschuss bewertet und beinhaltet eine Überprüfung der zu Beginn des Jahres gesetzten Ziele sowie der Fortschritte bei der Umsetzung des strategischen Plans, wobei Risiko und Nachhaltigkeitsaspekte eine wichtige Rolle spielen. Der Group CEO ist bei diesen Gesprächen nicht anwesend.
Finanzielle Messgrössen zur Förderung der Strategieumsetzung
Kunden
Mitarbeitende
Strategische Projekte und Verantwortungen, einschliesslich ESG
Rahmenwerk für die Zielvorgaben der Konzernleitung
Gewichtung Mehr Informationen
~50% Financial review
15-20% Integrated sustainability disclosure – Customers
15-20% Integrated sustainability disclosure – Employees
10-20% Konzernüberblick
Zurich Insurance Group Geschäftsbericht 2021
Konzern-überblick
Integrated sustainability disclosure
Governance Risk review
Financial review
108
Vergütungsbericht (fortgesetzt)
– Langfristige IncentivesIm Rahmen des gruppenweiten LTIP wurden den Mitgliedern der Konzernleitung 2021 für den dreijährigen Leistungszeitraum von 2021 bis 2023 insgesamt 42’116 PSUs zielzugeteilt. Die PSUs werden anhand des Schlusskurses von CHF 406.20 am Tag vor der Zuteilung (zweiter Arbeitstag im April) bewertet. Es wird eine definitive Zuteilung von 100% im Jahr 2024 angenommen. DEUs, die während des Leistungszeitraums anfallen könnten, werden hier nicht eingerechnet.
Für die Mitglieder der Konzernleitung variierte die LTIPZielzuteilung 2021 zwischen 125% und 225% des Grundgehalts. Die maximale Höhe der definitiven, im Jahr 2024 zu bewertenden Zuteilung beläuft sich auf 200% der Gesamtanzahl der zielzugeteilten Aktien (PSUs und DEUs).
Von den im Jahr 2019 im Rahmen des LTIP zielzugeteilten Aktien werden 2022 200% definitiv zugeteilt. An der berechneten definitiven Zuteilung wurde keine diskretionäre Anpassung vorgenommen, wie auf Seite 90 beschrieben.
AntrittsprämienUnter besonderen Umständen, bei denen Zahlungen an neu eingestellte Mitglieder geleistet werden, um entgangene Ansprüche aus den IncentivePlänen früherer Arbeitgeber auszugleichen, entsprechen die Zahlungen tendenziell in Bezug auf Art und Zeitpunkt den entgangenen Zahlungen und können Barzahlungen und/oder die Zielzuteilung veräusserungsbeschränkter Aktien (RSUs) oder PSUs umfassen. Bei Barzahlungen besteht in der Regel ein Rückforderungszeitraum, wenn der Mitarbeitende das Unternehmen innerhalb der ersten zwei Jahre nach Einstellung freiwillig verlässt. RSUs werden normalerweise drei bis fünf Jahre nach der Zielzuteilung definitiv zugeteilt. Solchen Aktien werden während des Ausübungszeitraums auch DEUs gutgeschrieben, um Dividendenausschüttungen auszugleichen. RSUs und entsprechende DEUs verfallen in der Regel, wenn der Begünstigte solcher Zuteilungen das Unternehmen vor dem Datum der definitiven Zuteilung verlässt und das Anstellungsverhältnis beendet wird.
Im Jahr 2021 wurden keine Antrittsprämien geleistet. Neue Mitglieder der Konzernleitung, die im Jahr 2020 ihre Beschäftigung bei der Gruppe aufnahmen, erhielten Antrittsprämien, und zwar in Form von Barvergütungen im Jahr 2021 und RSUs, deren definitive Zuteilung zwischen 2021 und 2026 fällig ist.
Zurich Insurance Group Geschäftsbericht 2021
Konzern-überblick
Integrated sustainability disclosure
Governance Risk review
Financial review
109
Vergütungsbericht (fortgesetzt)
Audited Sonderzahlungen und Aufhebungsvereinbarungen, zusätzliche Honorare und Vergütungen sowie persönliche Darlehen für Konzernleitungsmitglieder2021 wurden zwei neue Mitglieder durch interne Beförderungen in die Konzernleitung aufgenommen, und zwei Mitglieder gaben ihre Verantwortung als Mitglieder der Konzernleitung auf.
Es wurden keine Abgangsentschädigungen (Golden Parachutes) oder Vergütungen im Voraus geleistet und es wurden keine anderen Vorteile wie Vereinbarungen über spezielle Kündigungsfristen oder längerfristige Arbeitsverträge (mit über zwölf Monaten Dauer) oder zusätzliche Beiträge an die berufliche Vorsorge gewährt.
Kein Mitglied der Konzernleitung hat 2021 oder 2020 neben den in den vorstehenden Tabellen aufgeführten Vergütungen weitere Vergütungen von der Gruppe oder von einem zur Gruppe gehörenden Unternehmen erhalten.
Per 31. Dezember 2021 bzw. 2020 hatte kein Konzernleitungsmitglied ausstehende Darlehen, Vorschüsse oder Kredite.
Vergütung und persönliche Darlehen für ehemalige KonzernleitungsmitgliederEhemalige Mitglieder der Konzernleitung können nach ihrem Ausscheiden infolge Pensionierung ihre Hypothekendarlehen zu ähnlichen Bedingungen wie während ihrer Beschäftigung fortführen. Per 31. Dezember 2021 bzw. 2020 hatte kein ehemaliges Konzernleitungsmitglied ausstehende Darlehen, Vorschüsse oder Kredite, die zu nicht marktüblichen Bedingungen gewährt wurden.
Kein ehemaliges Mitglied der Konzernleitung hat 2021 oder 2020 neben den im Vergütungsbericht 2021 aufgeführten Beträgen weitere Vergütungen für die Amtszeit als Mitglied der Konzernleitung erhalten.
Den aktuellen oder ehemaligen Konzernleitungsmitgliedern nahestehende PersonenNahestehende Personen von aktuellen oder ehemaligen Mitgliedern der Konzernleitung erhielten 2021 bzw. 2020 keine Leistungen zu nicht marktüblichen Bedingungen, noch wurde auf Forderungen ihnen gegenüber verzichtet. Keine nahenstehende Person von aktuellen oder ehemaligen Mitgliedern der Konzernleitung hatte per 31. Dezember 2021 bzw. 2020 ausstehende Darlehen, Vorschüsse oder Kredite, die zu nicht marktüblichen Bedingungen gewährt wurden.
Zurich Insurance Group Geschäftsbericht 2021
Konzern-überblick
Integrated sustainability disclosure
Governance Risk review
Financial review
110
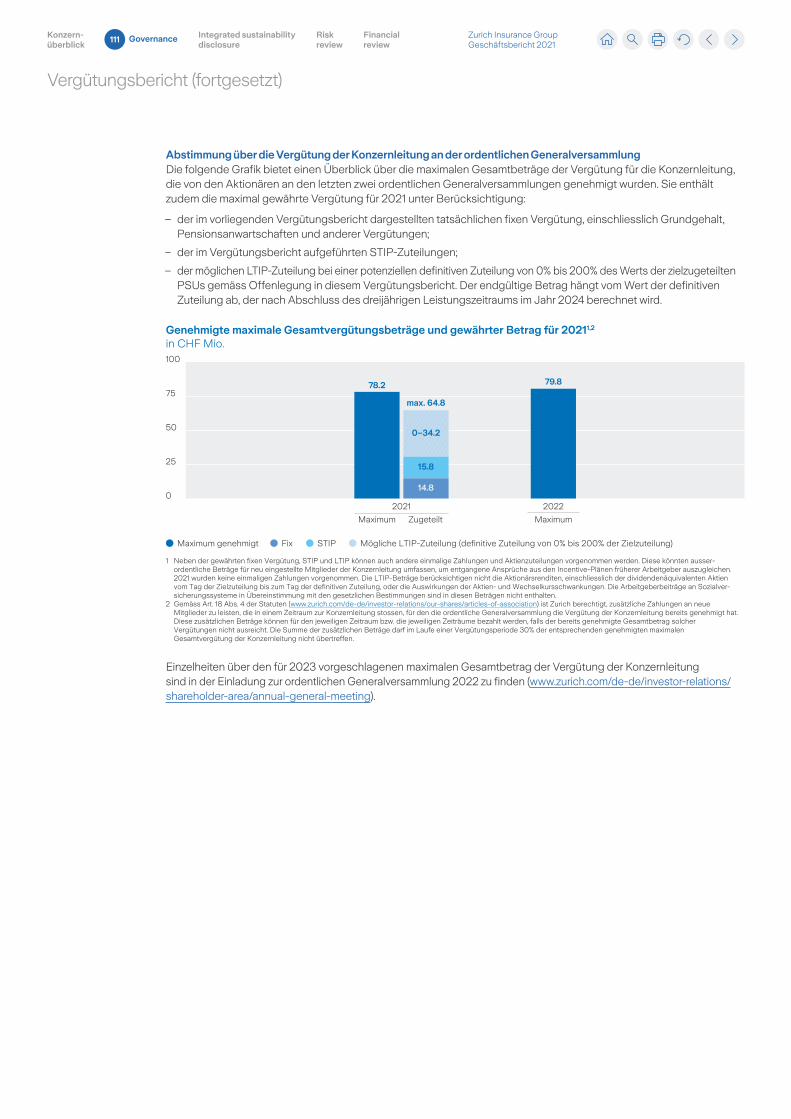
Vergütungsbericht (fortgesetzt)
Abstimmung über die Vergütung der Konzernleitung an der ordentlichen GeneralversammlungDie folgende Grafik bietet einen Überblick über die maximalen Gesamtbeträge der Vergütung für die Konzernleitung, die von den Aktionären an den letzten zwei ordentlichen Generalversammlungen genehmigt wurden. Sie enthält zudem die maximal gewährte Vergütung für 2021 unter Berücksichtigung:
– der im vorliegenden Vergütungsbericht dargestellten tatsächlichen fixen Vergütung, einschliesslich Grundgehalt, Pensionsanwartschaften und anderer Vergütungen;
– der im Vergütungsbericht aufgeführten STIPZuteilungen;
– der möglichen LTIPZuteilung bei einer potenziellen definitiven Zuteilung von 0% bis 200% des Werts der zielzugeteilten PSUs gemäss Offenlegung in diesem Vergütungsbericht. Der endgültige Betrag hängt vom Wert der definitiven Zuteilung ab, der nach Abschluss des dreijährigen Leistungszeitraums im Jahr 2024 berechnet wird.
Maximum genehmigt STIPFix Mögliche LTIP-Zuteilung (definitive Zuteilung von 0% bis 200% der Zielzuteilung)
1 Neben der gewährten fixen Vergütung, STIP und LTIP können auch andere einmalige Zahlungen und Aktienzuteilungen vorgenommen werden. Diese könnten ausser-ordentliche Beträge für neu eingestellte Mitglieder der Konzernleitung umfassen, um entgangene Ansprüche aus den Incentive-Plänen früherer Arbeitgeber auszugleichen. 2021 wurden keine einmaligen Zahlungen vorgenommen. Die LTIP-Beträge berücksichtigen nicht die Aktionärsrenditen, einschliesslich der dividendenäquivalenten Aktien vom Tag der Zielzuteilung bis zum Tag der definitiven Zuteilung, oder die Auswirkungen der Aktien- und Wechselkursschwankungen. Die Arbeitgeberbeiträge an Sozialver-
sicherungssysteme in Übereinstimmung mit den gesetzlichen Bestimmungen sind in diesen Beträgen nicht enthalten.2 Gemäss Art. 18 Abs. 4 der Statuten (www.zurich.com/de-de/investor-relations/our-shares/articles-of-association) ist Zurich berechtigt, zusätzliche Zahlungen an neue
Mitglieder zu leisten, die in einem Zeitraum zur Konzernleitung stossen, für den die ordentliche Generalversammlung die Vergütung der Konzernleitung bereits genehmigt hat. Diese zusätzlichen Beträge können für den jeweiligen Zeitraum bzw. die jeweiligen Zeiträume bezahlt werden, falls der bereits genehmigte Gesamtbetrag solcher Vergütungen nicht ausreicht. Die Summe der zusätzlichen Beträge darf im Laufe einer Vergütungsperiode 30% der entsprechenden genehmigten maximalen Gesamtvergütung der Konzernleitung nicht übertreffen.
100
75
50
25
0
Genehmigte maximale Gesamtvergütungsbeträge und gewährter Betrag für 20211,2
in CHF Mio.
78.2
14.8
0–34.2
15.8
Maximum Zugeteilt
2021
Maximum
2022
79.8
max. 64.8
Einzelheiten über den für 2023 vorgeschlagenen maximalen Gesamtbetrag der Vergütung der Konzernleitung sind in der Einladung zur ordentlichen Generalversammlung 2022 zu finden (www.zurich.com/dede/investorrelations/shareholderarea/annualgeneralmeeting).
Zurich Insurance Group Geschäftsbericht 2021
Konzern-überblick
Integrated sustainability disclosure
Governance Risk review
Financial review
111
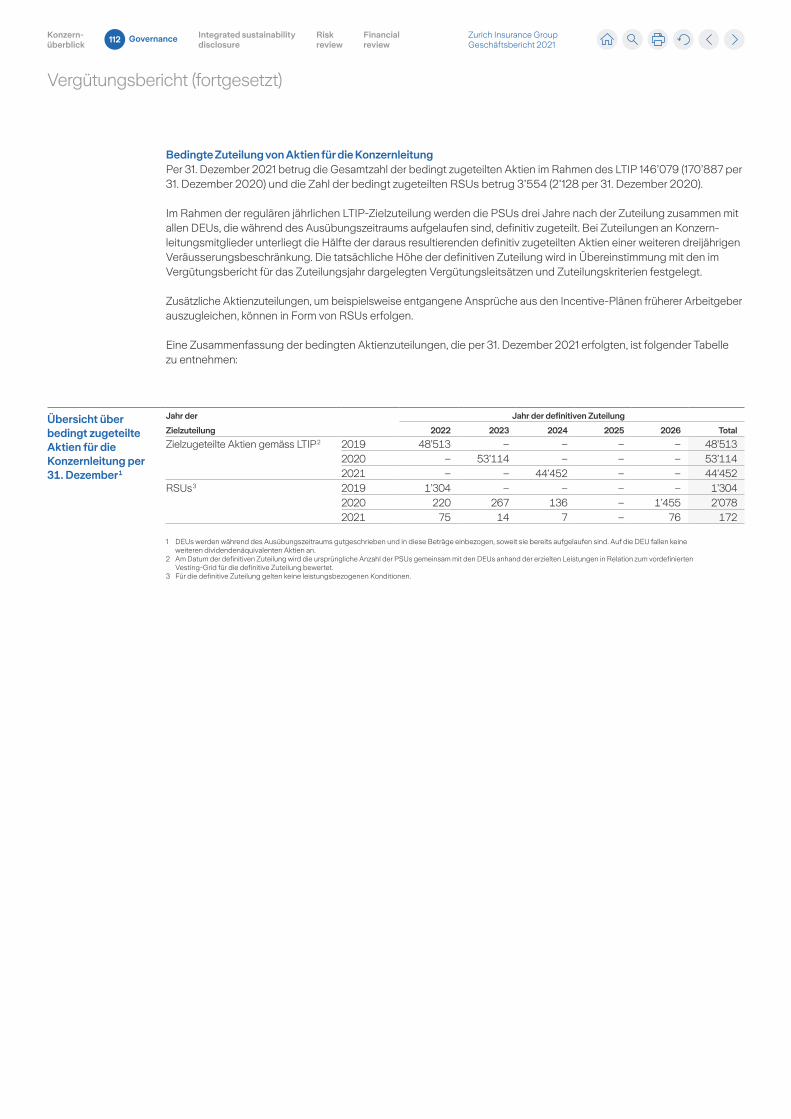
Vergütungsbericht (fortgesetzt)
Bedingte Zuteilung von Aktien für die KonzernleitungPer 31. Dezember 2021 betrug die Gesamtzahl der bedingt zugeteilten Aktien im Rahmen des LTIP 146’079 (170’887 per 31. Dezember 2020) und die Zahl der bedingt zugeteilten RSUs betrug 3’554 (2’128 per 31. Dezember 2020).
Im Rahmen der regulären jährlichen LTIPZielzuteilung werden die PSUs drei Jahre nach der Zuteilung zusammen mit allen DEUs, die während des Ausübungszeitraums aufgelaufen sind, definitiv zugeteilt. Bei Zuteilungen an Konzernleitungsmitglieder unterliegt die Hälfte der daraus resultierenden definitiv zugeteilten Aktien einer weiteren dreijährigen Veräusserungsbeschränkung. Die tatsächliche Höhe der definitiven Zuteilung wird in Übereinstimmung mit den im Vergütungsbericht für das Zuteilungsjahr dargelegten Vergütungsleitsätzen und Zuteilungskriterien festgelegt.
Zusätzliche Aktienzuteilungen, um beispielsweise entgangene Ansprüche aus den IncentivePlänen früherer Arbeitgeber auszugleichen, können in Form von RSUs erfolgen.
Eine Zusammenfassung der bedingten Aktienzuteilungen, die per 31. Dezember 2021 erfolgten, ist folgender Tabelle zu entnehmen:
Übersicht über bedingt zugeteilte Aktien für die Konzernleitung per 31. Dezember 1
Jahr der
Zielzuteilung
Jahr der definitiven Zuteilung
2022 2023 2024 2025 2026 Total
Zielzugeteilte Aktien gemäss LTIP 2 2019 48’513 – – – – 48’5132020 – 53’114 – – – 53’1142021 – – 44’452 – – 44’452
RSUs 3 2019 1’304 – – – – 1’3042020 220 267 136 – 1’455 2’0782021 75 14 7 – 76 172
1 DEUs werden während des Ausübungszeitraums gutgeschrieben und in diese Beträge einbezogen, soweit sie bereits aufgelaufen sind. Auf die DEU fallen keine weiteren dividendenäquivalenten Aktien an.
2 Am Datum der definitiven Zuteilung wird die ursprüngliche Anzahl der PSUs gemeinsam mit den DEUs anhand der erzielten Leistungen in Relation zum vordefinierten VestingGrid für die definitive Zuteilung bewertet.
3 Für die definitive Zuteilung gelten keine leistungsbezogenen Konditionen.
Zurich Insurance Group Geschäftsbericht 2021
Konzern-überblick
Integrated sustainability disclosure
Governance Risk review
Financial review
112
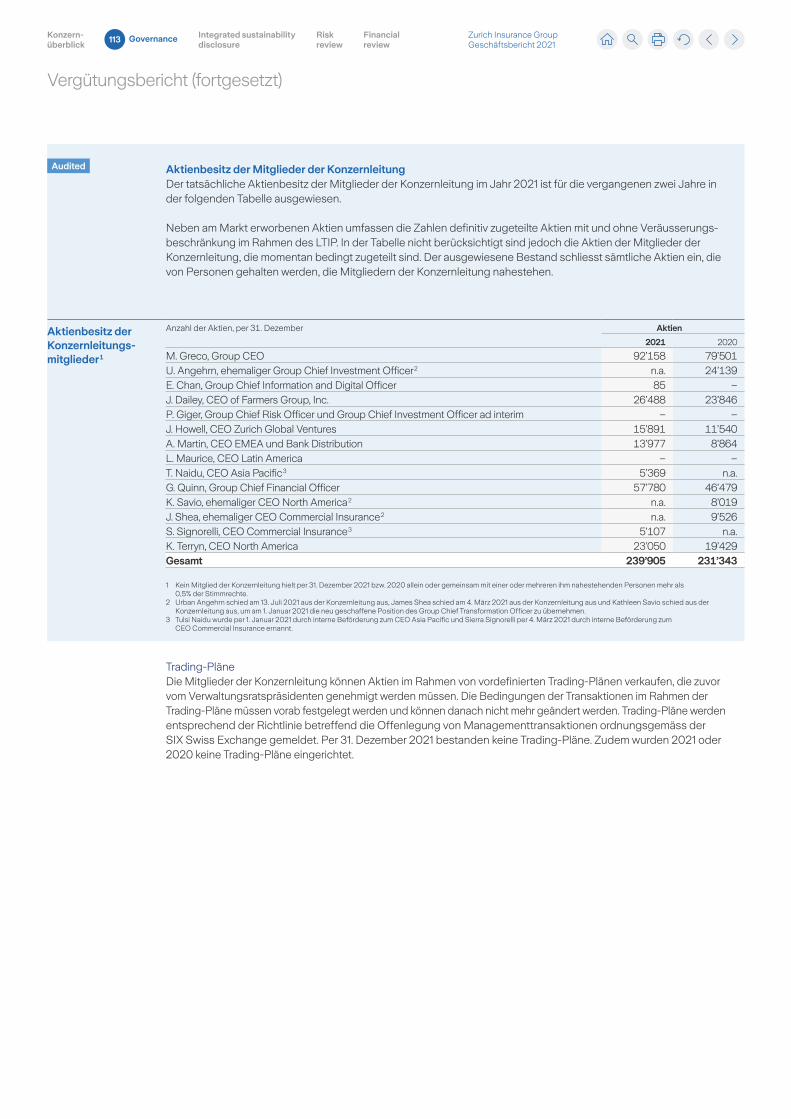
Vergütungsbericht (fortgesetzt)
Audited Aktienbesitz der Mitglieder der KonzernleitungDer tatsächliche Aktienbesitz der Mitglieder der Konzernleitung im Jahr 2021 ist für die vergangenen zwei Jahre in der folgenden Tabelle ausgewiesen.
Neben am Markt erworbenen Aktien umfassen die Zahlen definitiv zugeteilte Aktien mit und ohne Veräusserungsbeschränkung im Rahmen des LTIP. In der Tabelle nicht berücksichtigt sind jedoch die Aktien der Mitglieder der Konzernleitung, die momentan bedingt zugeteilt sind. Der ausgewiesene Bestand schliesst sämtliche Aktien ein, die von Personen gehalten werden, die Mitgliedern der Konzernleitung nahestehen.
Aktienbesitz der Konzernleitungs- mitglieder 1
Anzahl der Aktien, per 31. Dezember Aktien
2021 2020
M. Greco, Group CEO 92’158 79’501U. Angehrn, ehemaliger Group Chief Investment Officer 2 n.a. 24’139E. Chan, Group Chief Information and Digital Officer 85 –J. Dailey, CEO of Farmers Group, Inc. 26’488 23’846P. Giger, Group Chief Risk Officer und Group Chief Investment Officer ad interim – –J. Howell, CEO Zurich Global Ventures 15’891 11’540A. Martin, CEO EMEA und Bank Distribution 13’977 8’864L. Maurice, CEO Latin America – –T. Naidu, CEO Asia Pacific 3 5’369 n.a. G. Quinn, Group Chief Financial Officer 57’780 46’479K. Savio, ehemaliger CEO North America 2 n.a. 8’019J. Shea, ehemaliger CEO Commercial Insurance 2 n.a. 9’526S. Signorelli, CEO Commercial Insurance 3 5’107 n.a. K. Terryn, CEO North America 23’050 19’429Gesamt 239’905 231’343
1 Kein Mitglied der Konzernleitung hielt per 31. Dezember 2021 bzw. 2020 allein oder gemeinsam mit einer oder mehreren ihm nahestehenden Personen mehr als 0,5% der Stimmrechte.
2 Urban Angehrn schied am 13. Juli 2021 aus der Konzernleitung aus, James Shea schied am 4. März 2021 aus der Konzernleitung aus und Kathleen Savio schied aus der Konzernleitung aus, um am 1. Januar 2021 die neu geschaffene Position des Group Chief Transformation Officer zu übernehmen.
3 Tulsi Naidu wurde per 1. Januar 2021 durch interne Beförderung zum CEO Asia Pacific und Sierra Signorelli per 4. März 2021 durch interne Beförderung zum CEO Commercial Insurance ernannt.
TradingPläneDie Mitglieder der Konzernleitung können Aktien im Rahmen von vordefinierten TradingPlänen verkaufen, die zuvor vom Verwaltungsratspräsidenten genehmigt werden müssen. Die Bedingungen der Transaktionen im Rahmen der TradingPläne müssen vorab festgelegt werden und können danach nicht mehr geändert werden. TradingPläne werden entsprechend der Richtlinie betreffend die Offenlegung von Managementtransaktionen ordnungsgemäss der SIX Swiss Exchange gemeldet. Per 31. Dezember 2021 bestanden keine TradingPläne. Zudem wurden 2021 oder 2020 keine TradingPläne eingerichtet.
Zurich Insurance Group Geschäftsbericht 2021
Konzern-überblick
Integrated sustainability disclosure
Governance Risk review
Financial review
113
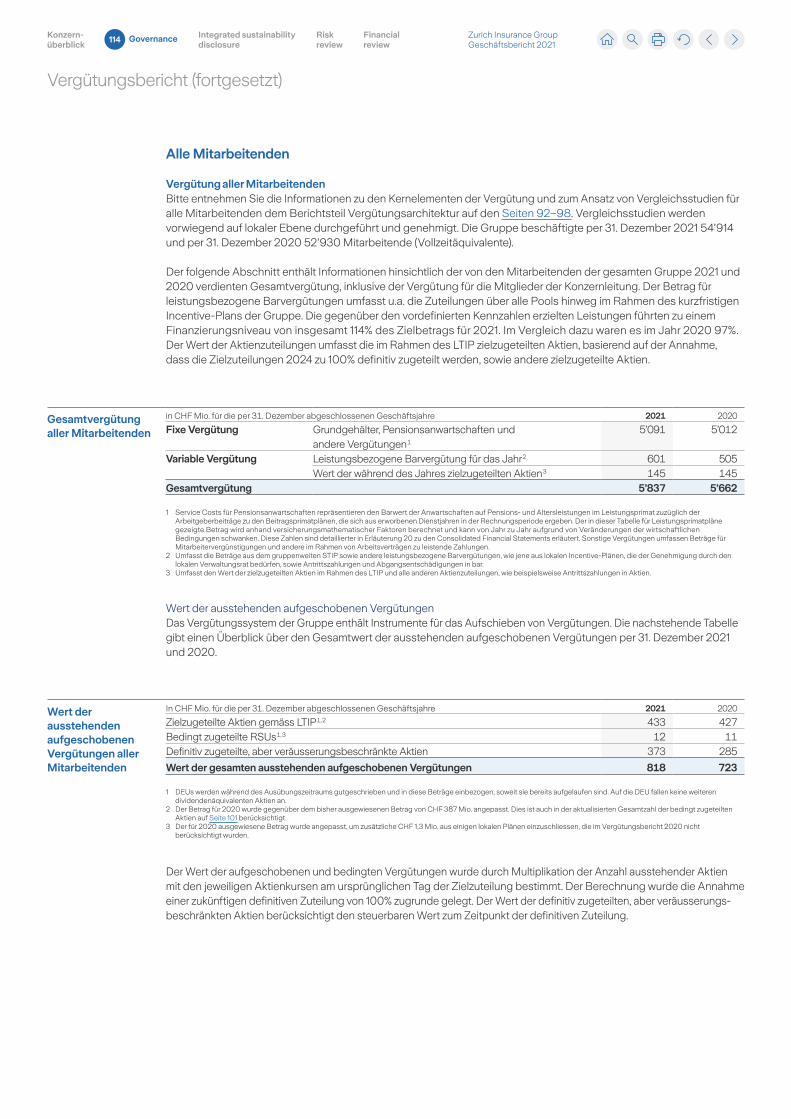
Vergütungsbericht (fortgesetzt)
Alle Mitarbeitenden
Vergütung aller MitarbeitendenBitte entnehmen Sie die Informationen zu den Kernelementen der Vergütung und zum Ansatz von Vergleichsstudien für alle Mitarbeitenden dem Berichtsteil Vergütungsarchitektur auf den Seiten 92–98. Vergleichsstudien werden vorwiegend auf lokaler Ebene durchgeführt und genehmigt. Die Gruppe beschäftigte per 31. Dezember 2021 54’914 und per 31. Dezember 2020 52’930 Mitarbeitende (Vollzeitäquivalente).
Der folgende Abschnitt enthält Informationen hinsichtlich der von den Mitarbeitenden der gesamten Gruppe 2021 und 2020 verdienten Gesamtvergütung, inklusive der Vergütung für die Mitglieder der Konzernleitung. Der Betrag für leistungsbezogene Barvergütungen umfasst u.a. die Zuteilungen über alle Pools hinweg im Rahmen des kurzfristigen IncentivePlans der Gruppe. Die gegenüber den vordefinierten Kennzahlen erzielten Leistungen führten zu einem Finanzierungsniveau von insgesamt 114% des Zielbetrags für 2021. Im Vergleich dazu waren es im Jahr 2020 97%. Der Wert der Aktienzuteilungen umfasst die im Rahmen des LTIP zielzugeteilten Aktien, basierend auf der Annahme, dass die Zielzuteilungen 2024 zu 100% definitiv zugeteilt werden, sowie andere zielzugeteilte Aktien.
Gesamtvergütung aller Mitarbeitenden
in CHF Mio. für die per 31. Dezember abgeschlossenen Geschäftsjahre 2021 2020
Fixe Vergütung Grundgehälter, Pensionsanwartschaften und andere Vergütungen 1
5’091 5’012
Variable Vergütung Leistungsbezogene Barvergütung für das Jahr 2 601 505Wert der während des Jahres zielzugeteilten Aktien 3 145 145
Gesamtvergütung 5’837 5’662
1 Service Costs für Pensionsanwartschaften repräsentieren den Barwert der Anwartschaften auf Pensions und Altersleistungen im Leistungsprimat zuzüglich der Arbeitgeberbeiträge zu den Beitragsprimatplänen, die sich aus erworbenen Dienstjahren in der Rechnungsperiode ergeben. Der in dieser Tabelle für Leistungsprimatpläne gezeigte Betrag wird anhand versicherungsmathematischer Faktoren berechnet und kann von Jahr zu Jahr aufgrund von Veränderungen der wirtschaftlichen Bedingungen schwanken. Diese Zahlen sind detaillierter in Erläuterung 20 zu den Consolidated Financial Statements erläutert. Sonstige Vergütungen umfassen Beträge für Mitarbeitervergünstigungen und andere im Rahmen von Arbeitsverträgen zu leistende Zahlungen.
2 Umfasst die Beträge aus dem gruppenweiten STIP sowie andere leistungsbezogene Barvergütungen, wie jene aus lokalen IncentivePlänen, die der Genehmigung durch den lokalen Verwaltungsrat bedürfen, sowie Antrittszahlungen und Abgangsentschädigungen in bar.
3 Umfasst den Wert der zielzugeteilten Aktien im Rahmen des LTIP und alle anderen Aktienzuteilungen, wie beispielsweise Antrittszahlungen in Aktien.
Wert der ausstehenden aufgeschobenen VergütungenDas Vergütungssystem der Gruppe enthält Instrumente für das Aufschieben von Vergütungen. Die nachstehende Tabelle gibt einen Überblick über den Gesamtwert der ausstehenden aufgeschobenen Vergütungen per 31. Dezember 2021 und 2020.
Wert der ausstehenden aufgeschobenen Vergütungen aller Mitarbeitenden
In CHF Mio. für die per 31. Dezember abgeschlossenen Geschäftsjahre 2021 2020
Zielzugeteilte Aktien gemäss LTIP 1, 2 433 427Bedingt zugeteilte RSUs 1, 3 12 11Definitiv zugeteilte, aber veräusserungsbeschränkte Aktien 373 285
Wert der gesamten ausstehenden aufgeschobenen Vergütungen 818 723
1 DEUs werden während des Ausübungszeitraums gutgeschrieben und in diese Beträge einbezogen, soweit sie bereits aufgelaufen sind. Auf die DEU fallen keine weiteren dividendenäquivalenten Aktien an.
2 Der Betrag für 2020 wurde gegenüber dem bisher ausgewiesenen Betrag von CHF 387 Mio. angepasst. Dies ist auch in der aktualisierten Gesamtzahl der bedingt zugeteilten Aktien auf Seite 101 berücksichtigt.
3 Der für 2020 ausgewiesene Betrag wurde angepasst, um zusätzliche CHF 1,3 Mio. aus einigen lokalen Plänen einzuschliessen, die im Vergütungsbericht 2020 nicht berücksichtigt wurden.
Der Wert der aufgeschobenen und bedingten Vergütungen wurde durch Multiplikation der Anzahl ausstehender Aktien mit den jeweiligen Aktienkursen am ursprünglichen Tag der Zielzuteilung bestimmt. Der Berechnung wurde die Annahme einer zukünftigen definitiven Zuteilung von 100% zugrunde gelegt. Der Wert der definitiv zugeteilten, aber veräusserungsbeschränkten Aktien berücksichtigt den steuerbaren Wert zum Zeitpunkt der definitiven Zuteilung.
Zurich Insurance Group Geschäftsbericht 2021
Konzern-überblick
Integrated sustainability disclosure
Governance Risk review
Financial review
114
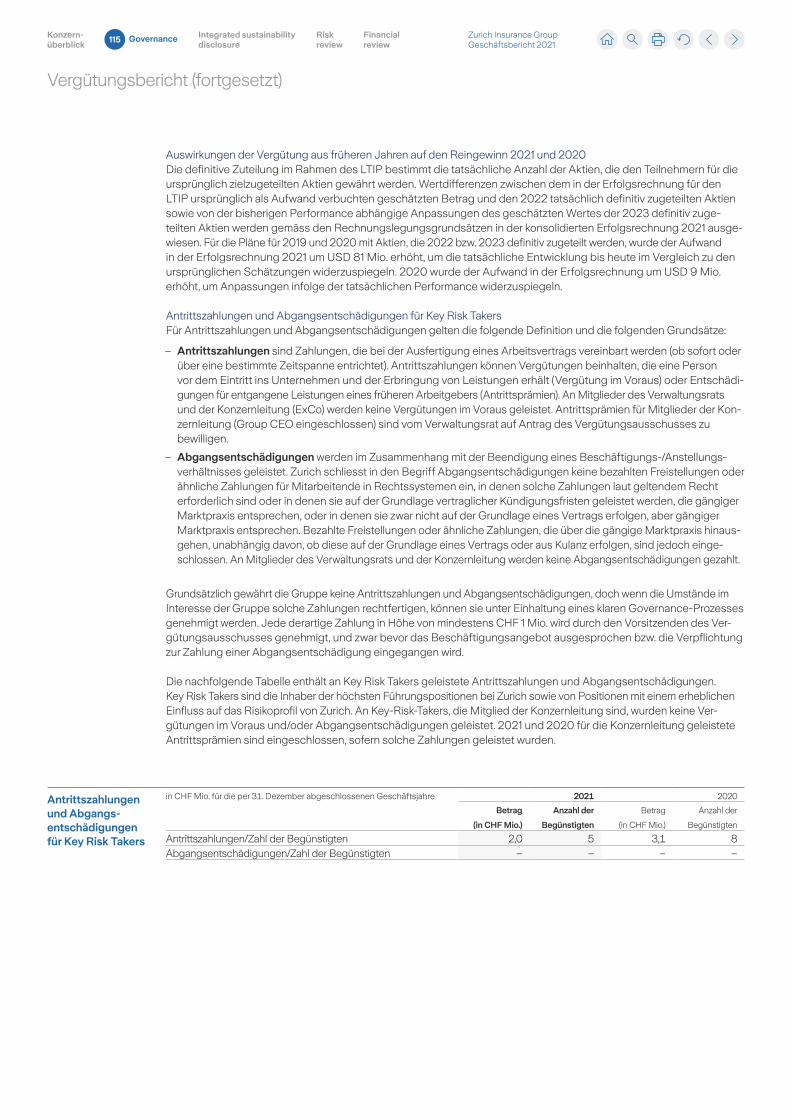
Vergütungsbericht (fortgesetzt)
Auswirkungen der Vergütung aus früheren Jahren auf den Reingewinn 2021 und 2020Die definitive Zuteilung im Rahmen des LTIP bestimmt die tatsächliche Anzahl der Aktien, die den Teilnehmern für die ursprünglich zielzugeteilten Aktien gewährt werden. Wertdifferenzen zwischen dem in der Erfolgsrechnung für den LTIP ursprünglich als Aufwand verbuchten geschätzten Betrag und den 2022 tatsächlich definitiv zugeteilten Aktien sowie von der bisherigen Performance abhängige Anpassungen des geschätzten Wertes der 2023 definitiv zugeteilten Aktien werden gemäss den Rechnungslegungsgrundsätzen in der konsolidierten Erfolgsrechnung 2021 ausgewiesen. Für die Pläne für 2019 und 2020 mit Aktien, die 2022 bzw. 2023 definitiv zugeteilt werden, wurde der Aufwand in der Erfolgsrechnung 2021 um USD 81 Mio. erhöht, um die tatsächliche Entwicklung bis heute im Vergleich zu den ursprünglichen Schätzungen widerzuspiegeln. 2020 wurde der Aufwand in der Erfolgsrechnung um USD 9 Mio. erhöht, um Anpassungen infolge der tatsächlichen Performance widerzuspiegeln.
Antrittszahlungen und Abgangsentschädigungen für Key Risk TakersFür Antrittszahlungen und Abgangsentschädigungen gelten die folgende Definition und die folgenden Grundsätze:
– Antrittszahlungen sind Zahlungen, die bei der Ausfertigung eines Arbeitsvertrags vereinbart werden (ob sofort oder über eine bestimmte Zeitspanne entrichtet). Antrittszahlungen können Vergütungen beinhalten, die eine Person vor dem Eintritt ins Unternehmen und der Erbringung von Leistungen erhält (Vergütung im Voraus) oder Entschädigungen für entgangene Leistungen eines früheren Arbeitgebers (Antrittsprämien). An Mitglieder des Verwaltungsrats und der Konzernleitung (ExCo) werden keine Vergütungen im Voraus geleistet. Antrittsprämien für Mitglieder der Konzernleitung (Group CEO eingeschlossen) sind vom Verwaltungsrat auf Antrag des Vergütungsausschusses zu bewilligen.
– Abgangsentschädigungen werden im Zusammenhang mit der Beendigung eines Beschäftigungs/Anstellungsverhältnisses geleistet. Zurich schliesst in den Begriff Abgangsentschädigungen keine bezahlten Freistellungen oder ähnliche Zahlungen für Mitarbeitende in Rechtssystemen ein, in denen solche Zahlungen laut geltendem Recht erforderlich sind oder in denen sie auf der Grundlage vertraglicher Kündigungsfristen geleistet werden, die gängiger Marktpraxis entsprechen, oder in denen sie zwar nicht auf der Grundlage eines Vertrags erfolgen, aber gängiger Marktpraxis entsprechen. Bezahlte Freistellungen oder ähnliche Zahlungen, die über die gängige Marktpraxis hinausgehen, unabhängig davon, ob diese auf der Grundlage eines Vertrags oder aus Kulanz erfolgen, sind jedoch eingeschlossen. An Mitglieder des Verwaltungsrats und der Konzernleitung werden keine Abgangsentschädigungen gezahlt.
Grundsätzlich gewährt die Gruppe keine Antrittszahlungen und Abgangsentschädigungen, doch wenn die Umstände im Interesse der Gruppe solche Zahlungen rechtfertigen, können sie unter Einhaltung eines klaren GovernanceProzesses genehmigt werden. Jede derartige Zahlung in Höhe von mindestens CHF 1 Mio. wird durch den Vorsitzenden des Vergütungsausschusses genehmigt, und zwar bevor das Beschäftigungsangebot ausgesprochen bzw. die Verpflichtung zur Zahlung einer Abgangsentschädigung eingegangen wird.
Die nachfolgende Tabelle enthält an Key Risk Takers geleistete Antrittszahlungen und Abgangsentschädigungen. Key Risk Takers sind die Inhaber der höchsten Führungspositionen bei Zurich sowie von Positionen mit einem erheblichen Einfluss auf das Risikoprofil von Zurich. An KeyRiskTakers, die Mitglied der Konzernleitung sind, wurden keine Vergütungen im Voraus und/oder Abgangsentschädigungen geleistet. 2021 und 2020 für die Konzernleitung geleistete Antrittsprämien sind eingeschlossen, sofern solche Zahlungen geleistet wurden.
Antrittszahlungen und Abgangs- entschädigungen für Key Risk Takers
in CHF Mio. für die per 31. Dezember abgeschlossenen Geschäftsjahre 2021 2020
Betrag
(in CHF Mio.)
Anzahl der
Begünstigten
Betrag
(in CHF Mio.)
Anzahl der
Begünstigten
Antrittszahlungen/Zahl der Begünstigten 2,0 5 3,1 8Abgangsentschädigungen/Zahl der Begünstigten – – – –
Zurich Insurance Group Geschäftsbericht 2021
Konzern-überblick
Integrated sustainability disclosure
Governance Risk review
Financial review
115
Vergütungsbericht (fortgesetzt)
Ausblick 2022
Der Vergütungsausschuss überprüft den Vergütungsrahmen, das System und die Praktiken der Gruppe jährlich. Im Jahr 2022 legen wir den Fokus besonders darauf, die Kennzahlen und den Ansatz mit den Zielen für den nächsten strategischen Zyklus von 2023 bis 2025 in Einklang zu bringen. Rechtliche, regulatorische und Marktentwicklungen sowie Risikoüberlegungen und eine starke GovernanceStruktur werden weiterhin ein wichtiger Bestandteil des Überprüfungsprozesses sein.
Ausserdem werden wir weiterhin zusätzliche ESGKennzahlen für die variable Vergütung prüfen. Der STIP der Gruppe beinhaltet derzeit eine nicht finanzielle kundenbezogene Kennzahl, um die STIPFinanzierung für die Mehrheit der Teilnehmer zu bestimmen. Zu den persönlichen Zielen können auch relevante ESGThemen gehören, die das Nachhaltigkeitsengagement der Gruppe unterstützen, um die individuelle Leistung bei der Bestimmung der STIPZulagen zu bewerten. Mögliche Optionen für die Einbeziehung zusätzlicher ESGKennzahlen werden im Vorfeld des nächsten Strategiezyklus geprüft. Zu den Überlegungen gehören die strategische Relevanz und Wesentlichkeit möglicher Kennzahlen für Zurich und ihre Anspruchsgruppen.
Der Vergütungsausschuss begrüsste den engagierten Dialog mit Anlegern und Stimmrechtsberatern im vergangenen Jahr und freut sich auf eine weitere Gelegenheit im Jahr 2022. An der ordentlichen Generalversammlung 2022 können die Aktionäre im Rahmen einer Konsultativabstimmung ebenfalls ihre Meinung zum Vergütungsbericht 2021 äussern. Zudem haben sie die Möglichkeit, im Rahmen der verbindlichen Abstimmungen den maximalen Gesamtbetrag der Vergütungen des Verwaltungsrats für den einjährigen Zeitraum von der GV 2022 bis zur GV 2023 und für die Konzernleitung für das Geschäftsjahr 2023 zu genehmigen. Weitere Informationen zu diesen Abstimmungen sind in der Einladung zur ordentlichen Generalversammlung 2022 (www.zurich.com/dede/investorrelations/shareholderarea/annual generalmeeting) und in den jeweiligen Abschnitten dieses Berichts zu finden.
Zurich Insurance Group Geschäftsbericht 2021
Konzern-überblick
Integrated sustainability disclosure
Governance Risk review
Financial review
116
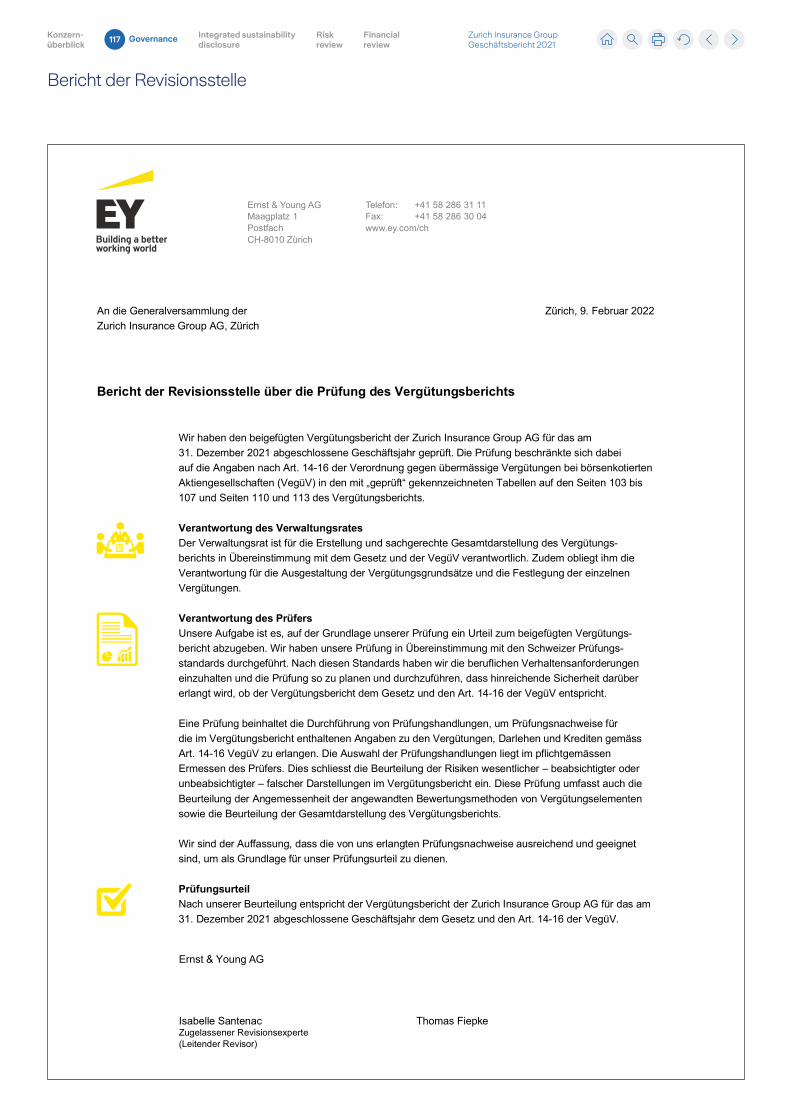
Bericht der Revisionsstelle
Ernst & Young AGMaagplatz 1PostfachCH-8010 Zürich
Telefon: +41 58 286 31 11Fax: +41 58 286 30 04www.ey.com/ch
An die Generalversammlung derZurich Insurance Group AG, Zürich
Zürich, 9. Februar 2022
Bericht der Revisionsstelle über die Prüfung des Vergütungsberichts
Wir haben den beigefügten Vergütungsbericht der Zurich Insurance Group AG für das am31. Dezember 2021 abgeschlossene Geschäftsjahr geprüft. Die Prüfung beschränkte sich dabeiauf die Angaben nach Art. 14-16 der Verordnung gegen übermässige Vergütungen bei börsenkotiertenAktiengesellschaften (VegüV) in den mit „geprüft“ gekennzeichneten Tabellen auf den Seiten 103 bis107 und Seiten 110 und 113 des Vergütungsberichts.
Verantwortung des VerwaltungsratesDer Verwaltungsrat ist für die Erstellung und sachgerechte Gesamtdarstellung des Vergütungs-berichts in Übereinstimmung mit dem Gesetz und der VegüV verantwortlich. Zudem obliegt ihm dieVerantwortung für die Ausgestaltung der Vergütungsgrundsätze und die Festlegung der einzelnenVergütungen.
Verantwortung des PrüfersUnsere Aufgabe ist es, auf der Grundlage unserer Prüfung ein Urteil zum beigefügten Vergütungs-bericht abzugeben. Wir haben unsere Prüfung in Übereinstimmung mit den Schweizer Prüfungs-standards durchgeführt. Nach diesen Standards haben wir die beruflichen Verhaltensanforderungeneinzuhalten und die Prüfung so zu planen und durchzuführen, dass hinreichende Sicherheit darübererlangt wird, ob der Vergütungsbericht dem Gesetz und den Art. 14-16 der VegüV entspricht.
Eine Prüfung beinhaltet die Durchführung von Prüfungshandlungen, um Prüfungsnachweise fürdie im Vergütungsbericht enthaltenen Angaben zu den Vergütungen, Darlehen und Krediten gemässArt. 14-16 VegüV zu erlangen. Die Auswahl der Prüfungshandlungen liegt im pflichtgemässenErmessen des Prüfers. Dies schliesst die Beurteilung der Risiken wesentlicher – beabsichtigter oderunbeabsichtigter – falscher Darstellungen im Vergütungsbericht ein. Diese Prüfung umfasst auch dieBeurteilung der Angemessenheit der angewandten Bewertungsmethoden von Vergütungselementensowie die Beurteilung der Gesamtdarstellung des Vergütungsberichts.
Wir sind der Auffassung, dass die von uns erlangten Prüfungsnachweise ausreichend und geeignetsind, um als Grundlage für unser Prüfungsurteil zu dienen.
PrüfungsurteilNach unserer Beurteilung entspricht der Vergütungsbericht der Zurich Insurance Group AG für das am31. Dezember 2021 abgeschlossene Geschäftsjahr dem Gesetz und den Art. 14-16 der VegüV.
Ernst & Young AG
Isabelle Santenac Thomas FiepkeZugelassener Revisionsexperte(Leitender Revisor)
Zurich Insurance Group Geschäftsbericht 2021
Konzern-überblick
Integrated sustainability disclosure
Governance Risk review
Financial review
117
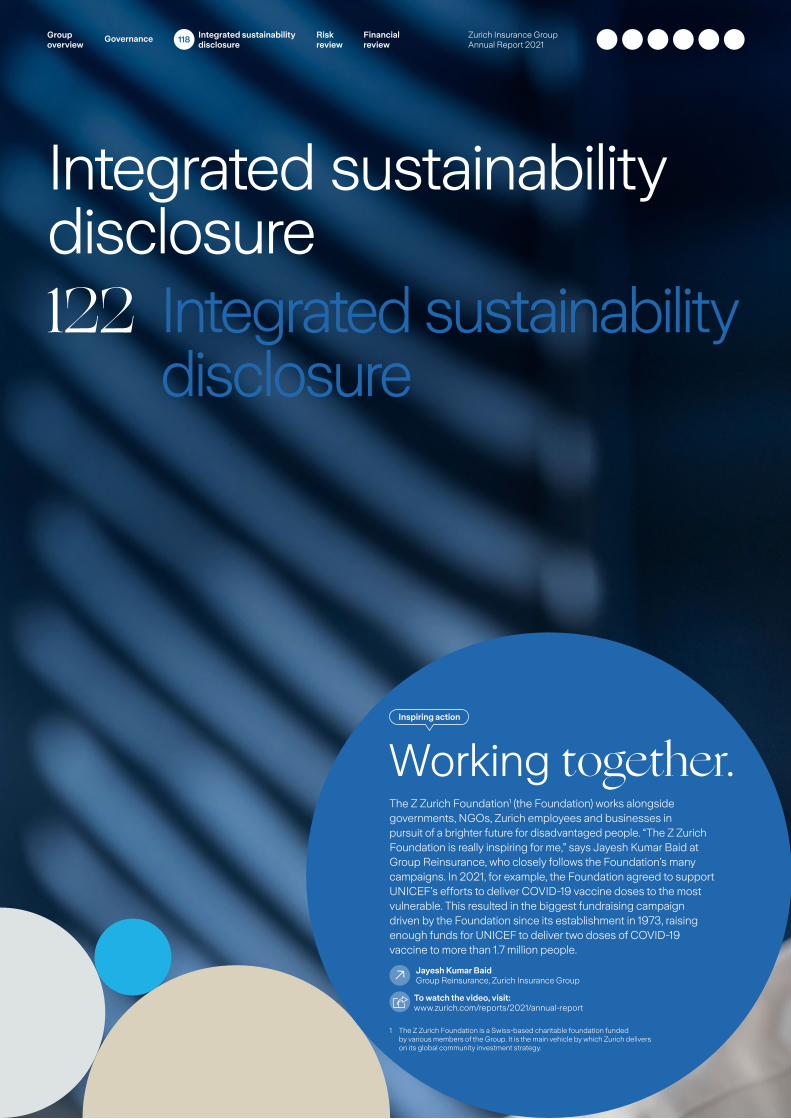
Integrated sustainability disclosure122 Integrated sustainability
disclosure
Jayesh Kumar BaidGroup Reinsurance, Zurich Insurance Group
To watch the video, visit:www.zurich.com/reports/2021/annual-report
Inspiring action
Working together.The Z Zurich Foundation1 (the Foundation) works alongside governments, NGOs, Zurich employees and businesses in pursuit of a brighter future for disadvantaged people. “The Z Zurich Foundation is really inspiring for me,” says Jayesh Kumar Baid at Group Reinsurance, who closely follows the Foundation’s many campaigns. In 2021, for example, the Foundation agreed to support UNICEF’s efforts to deliver COVID-19 vaccine doses to the most vulnerable. This resulted in the biggest fundraising campaign driven by the Foundation since its establishment in 1973, raising enough funds for UNICEF to deliver two doses of COVID-19 vaccine to more than 1.7 million people.
1 The Z Zurich Foundation is a Swiss-based charitable foundation funded by various members of the Group. It is the main vehicle by which Zurich delivers on its global community investment strategy.
Zurich Insurance Group Annual Report 2021
Group overview
Integrated sustainability disclosure
Governance Risk review
Financial review
118

Zurich Insurance Group Annual Report 2021
Group overview
Integrated sustainability disclosure
Governance Risk review
Financial review
119

Executive message on sustainability
Dear shareholderWe believe it’s critical to be clear on what a company stands for and how the organization as a whole acts to deliver sustainable value to all stakeholders. We stand for doing business today in a way that supports future generations and builds resilience. That also means helping our people to have meaningful careers with relevant skills in a rapidly evolving digital world, treating our customers with the utmost priority and taking action to mitigate the impact of climate change.
Our three sustainability pillars call out the transformational themes that impact our business the most. They’re the cornerstone of our sustainability ambition and guide us in building a resilient organization that responds to the needs of our time. By better managing the impact that digitalization will have on our own workforce as well as the way we serve our customers, we’re preparing our organization for the future of insurance.
Building resilience.In this report, we demonstrate the impact our actions are having by being more transparent about how we measure progress on our sustainability ambition and how we offer more sustainable solutions to our customers.Alison MartinCEO EMEA (Europe, Middle East & Africa) and Bank Distribution
Zurich Insurance Group Annual Report 2021
Group overview
Integrated sustainability disclosure
Governance Risk review
Financial review
120
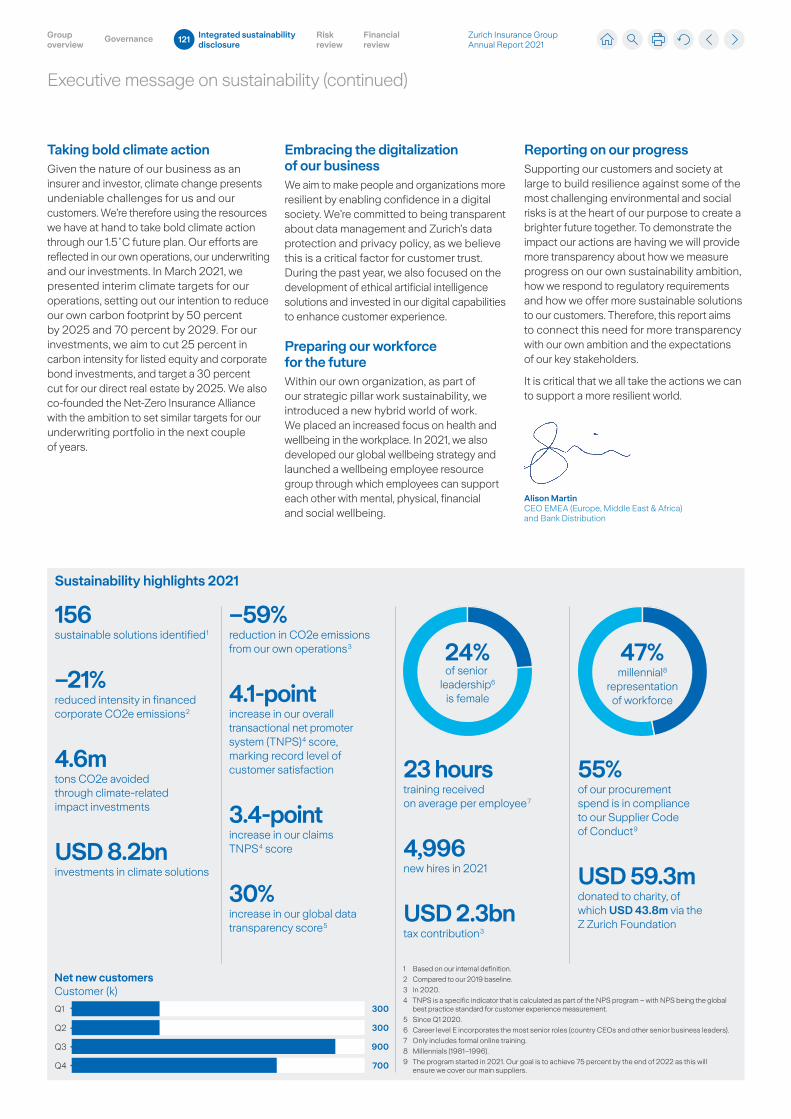
Executive message on sustainability (continued)
Sustainability highlights 2021
47%millennial8
representationof workforce
24%of senior
leadership6
is female
300
300
900
700
Net new customersCustomer (k)
Q1
Q2
Q3
Q4
Embracing the digitalization of our businessWe aim to make people and organizations more resilient by enabling confidence in a digital society. We’re committed to being transparent about data management and Zurich’s data protection and privacy policy, as we believe this is a critical factor for customer trust. During the past year, we also focused on the development of ethical artificial intelligence solutions and invested in our digital capabilities to enhance customer experience.
Preparing our workforce for the futureWithin our own organization, as part of our strategic pillar work sustainability, we introduced a new hybrid world of work. We placed an increased focus on health and wellbeing in the workplace. In 2021, we also developed our global wellbeing strategy and launched a wellbeing employee resource group through which employees can support each other with mental, physical, financial and social wellbeing.
Taking bold climate actionGiven the nature of our business as an insurer and investor, climate change presents undeniable challenges for us and our customers. We’re therefore using the resources we have at hand to take bold climate action through our 1.5˚C future plan. Our efforts are reflected in our own operations, our underwriting and our investments. In March 2021, we presented interim climate targets for our operations, setting out our intention to reduce our own carbon footprint by 50 percent by 2025 and 70 percent by 2029. For our investments, we aim to cut 25 percent in carbon intensity for listed equity and corporate bond investments, and target a 30 percent cut for our direct real estate by 2025. We also co-founded the Net-Zero Insurance Alliance with the ambition to set similar targets for our underwriting portfolio in the next couple of years.
Reporting on our progressSupporting our customers and society at large to build resilience against some of the most challenging environmental and social risks is at the heart of our purpose to create a brighter future together. To demonstrate the impact our actions are having we will provide more transparency about how we measure progress on our own sustainability ambition, how we respond to regulatory requirements and how we offer more sustainable solutions to our customers. Therefore, this report aims to connect this need for more transparency with our own ambition and the expectations of our key stakeholders.
It is critical that we all take the actions we can to support a more resilient world.
Alison MartinCEO EMEA (Europe, Middle East & Africa) and Bank Distribution
156sustainable solutions identified 1
–21%reduced intensity in financed corporate CO2e emissions 2
4.6m tons CO2e avoided through climate-related impact investments
USD 8.2bninvestments in climate solutions
55%of our procurement spend is in compliance to our Supplier Code of Conduct 9
USD 59.3mdonated to charity, of which USD 43.8m via the Z Zurich Foundation
23 hourstraining received on average per employee 7
4,996new hires in 2021
USD 2.3bntax contribution 3
–59%reduction in CO2e emissions from our own operations 3
4.1-pointincrease in our overall transactional net promoter system (TNPS) 4 score, marking record level of customer satisfaction
3.4-pointincrease in our claims TNPS 4 score
30%increase in our global data transparency score 5
1 Based on our internal definition.
2 Compared to our 2019 baseline.
3 In 2020.
4 TNPS is a specific indicator that is calculated as part of the NPS program – with NPS being the global best practice standard for customer experience measurement.
5 Since Q1 2020.
6 Career level E incorporates the most senior roles (country CEOs and other senior business leaders).
7 Only includes formal online training.
8 Millennials (1981–1996).
9 The program started in 2021. Our goal is to achieve 75 percent by the end of 2022 as this will ensure we cover our main suppliers.
Zurich Insurance Group Annual Report 2021
Group overview
Integrated sustainability disclosure
Governance Risk review
Financial review
121
Contents
1 Introduction 123
2 Creating positive impact for stakeholders 125
2.1 Our purpose 125
2.2 Sustainability in everything we do 125
2.2.1 Assessing materiality 126
2.2.2 Managing risks and opportunities 128
2.3 Involving our stakeholders 129
2.3.1 Investors 129
2.3.2 Sustainable sourcing 129
2.3.3 Responsible tax 130
2.3.4 Community investment 131
3 Governance: Sustainability is embedded in our governance 132
4 Our planet: Drive positive impact 134
4.1 Strategy 135
4.1.1 Our climate-related strategy 135
4.1.2 Climate-related risks 140
4.1.3 Climate risk assessment 2021 142
4.2 Governance 153
4.3 Risk management 153
4.3.1 Integration of climate risk within the overall risk management framework 153
4.3.2 Portfolio-level scenario-based climate risk assessment 153
4.3.3 Managing risks from climate-related natural catastrophes 155
4.4 Metrics and targets 156
4.4.1 Our targets 156
4.4.2 Our performance metrics 157
5 Our customers: Their needs are at the heart of everything we do 167
5.1 Customer-centric solutions and experiences 167
5.1.1 Customer attraction and retention 168
5.2 Fair and transparent advice and engagements 169
5.2.1 Customer communication 169
5.2.2 Continuously measuring and improving claims handling 169
5.3 Digital confidence and trust 170
5.3.1 Data Commitment 170
5.3.2 Cybersecurity 170
5.3.3 Business resilience 171
5.3.4 Ethical use of artificial intelligence (AI) 171
6 Our employees: Let’s grow together 172
6.1 Talent attraction for a sustainable future 172
6.1.1 Talent attraction and retention 172
6.1.2 Training and development 175
6.2 A safe working environment that supports health and wellbeing 175
6.3 An integrated and systematic approach to diversity, equity, inclusion and belonging (DEIB) 176
6.3.1 Ratio of compensation to areas of equality 176
6.3.2 Global DEIB framework 176
6.4 Prevention of bribery and corruption 177
6.4.1 Group Anti-Bribery and Anti-Corruption Policy 177
6.4.2 Training and awareness 177
6.4.3 Protected advice 177
7 Independent assurance report 178
Financial review
Risk review
Governance 122 Integrated sustainability disclosure
Group overview
Zurich Insurance Group Annual Report 2021
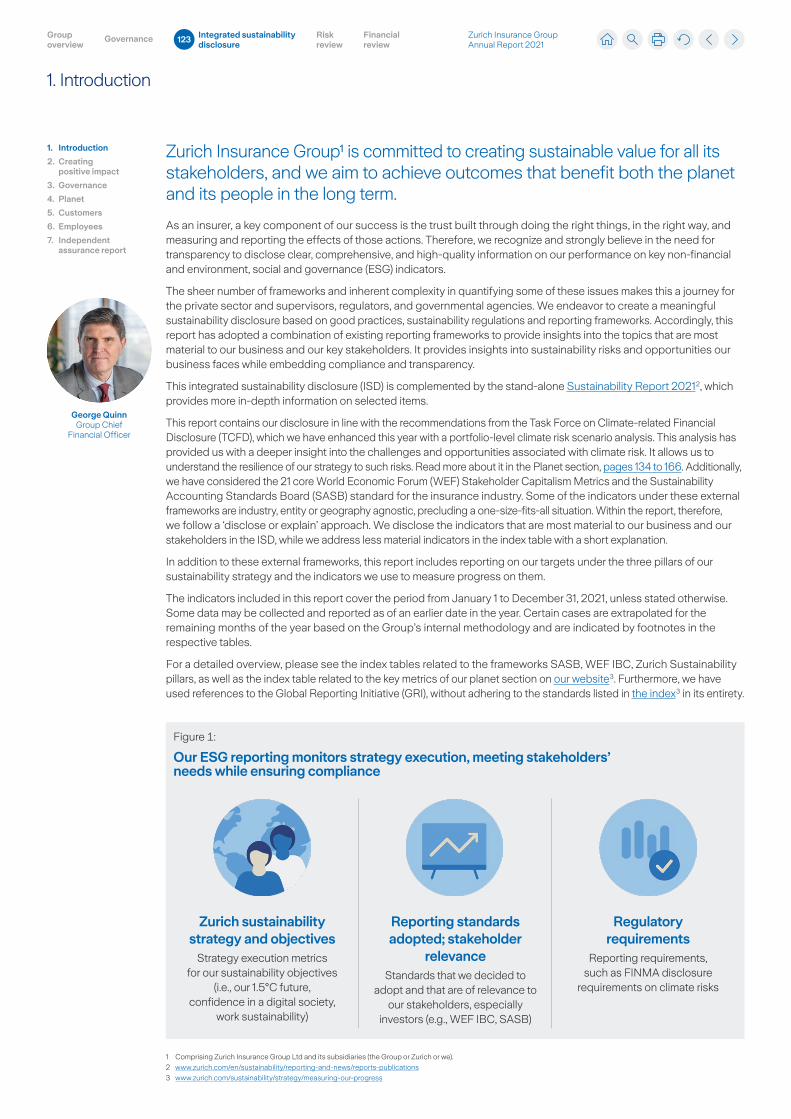
1. Introduction
George Quinn Group Chief
Financial Officer
Zurich Insurance Group¹ is committed to creating sustainable value for all its stakeholders, and we aim to achieve outcomes that benefit both the planet and its people in the long term.
As an insurer, a key component of our success is the trust built through doing the right things, in the right way, and measuring and reporting the effects of those actions. Therefore, we recognize and strongly believe in the need for transparency to disclose clear, comprehensive, and high-quality information on our performance on key non-financial and environment, social and governance (ESG) indicators.
The sheer number of frameworks and inherent complexity in quantifying some of these issues makes this a journey for the private sector and supervisors, regulators, and governmental agencies. We endeavor to create a meaningful sustainability disclosure based on good practices, sustainability regulations and reporting frameworks. Accordingly, this report has adopted a combination of existing reporting frameworks to provide insights into the topics that are most material to our business and our key stakeholders. It provides insights into sustainability risks and opportunities our business faces while embedding compliance and transparency.
This integrated sustainability disclosure (ISD) is complemented by the stand-alone Sustainability Report 2021 2, which provides more in-depth information on selected items.
This report contains our disclosure in line with the recommendations from the Task Force on Climate-related Financial Disclosure (TCFD), which we have enhanced this year with a portfolio-level climate risk scenario analysis. This analysis has provided us with a deeper insight into the challenges and opportunities associated with climate risk. It allows us to understand the resilience of our strategy to such risks. Read more about it in the Planet section, pages 134 to 166. Additionally, we have considered the 21 core World Economic Forum (WEF) Stakeholder Capitalism Metrics and the Sustainability Accounting Standards Board (SASB) standard for the insurance industry. Some of the indicators under these external frameworks are industry, entity or geography agnostic, precluding a one-size-fits-all situation. Within the report, therefore, we follow a ‘disclose or explain’ approach. We disclose the indicators that are most material to our business and our stakeholders in the ISD, while we address less material indicators in the index table with a short explanation.
In addition to these external frameworks, this report includes reporting on our targets under the three pillars of our sustainability strategy and the indicators we use to measure progress on them.
The indicators included in this report cover the period from January 1 to December 31, 2021, unless stated otherwise. Some data may be collected and reported as of an earlier date in the year. Certain cases are extrapolated for the remaining months of the year based on the Group’s internal methodology and are indicated by footnotes in the respective tables.
For a detailed overview, please see the index tables related to the frameworks SASB, WEF IBC, Zurich Sustainability pillars, as well as the index table related to the key metrics of our planet section on our website 3. Furthermore, we have used references to the Global Reporting Initiative (GRI), without adhering to the standards listed in the index 3 in its entirety.
Zurich sustainability strategy and objectives
Strategy execution metrics for our sustainability objectives
(i.e., our 1.5°C future, confidence in a digital society,
work sustainability)
Reporting standards adopted; stakeholder
relevanceStandards that we decided to
adopt and that are of relevance to our stakeholders, especially
investors (e.g., WEF IBC, SASB)
Regulatory requirements
Reporting requirements, such as FINMA disclosure
requirements on climate risks
Figure 1:
Our ESG reporting monitors strategy execution, meeting stakeholders’ needs while ensuring compliance
1. Introduction
2. Creating positive impact
3. Governance
4. Planet
5. Customers
6. Employees
7. Independent assurance report
1 Comprising Zurich Insurance Group Ltd and its subsidiaries (the Group or Zurich or we).
2 www.zurich.com/en/sustainability/reporting-and-news/reports-publications
3 www.zurich.com/sustainability/strategy/measuring-our-progress
Zurich Insurance Group Annual Report 2021
Group overview
Integrated sustainability disclosure
Governance Risk review
Financial review
123
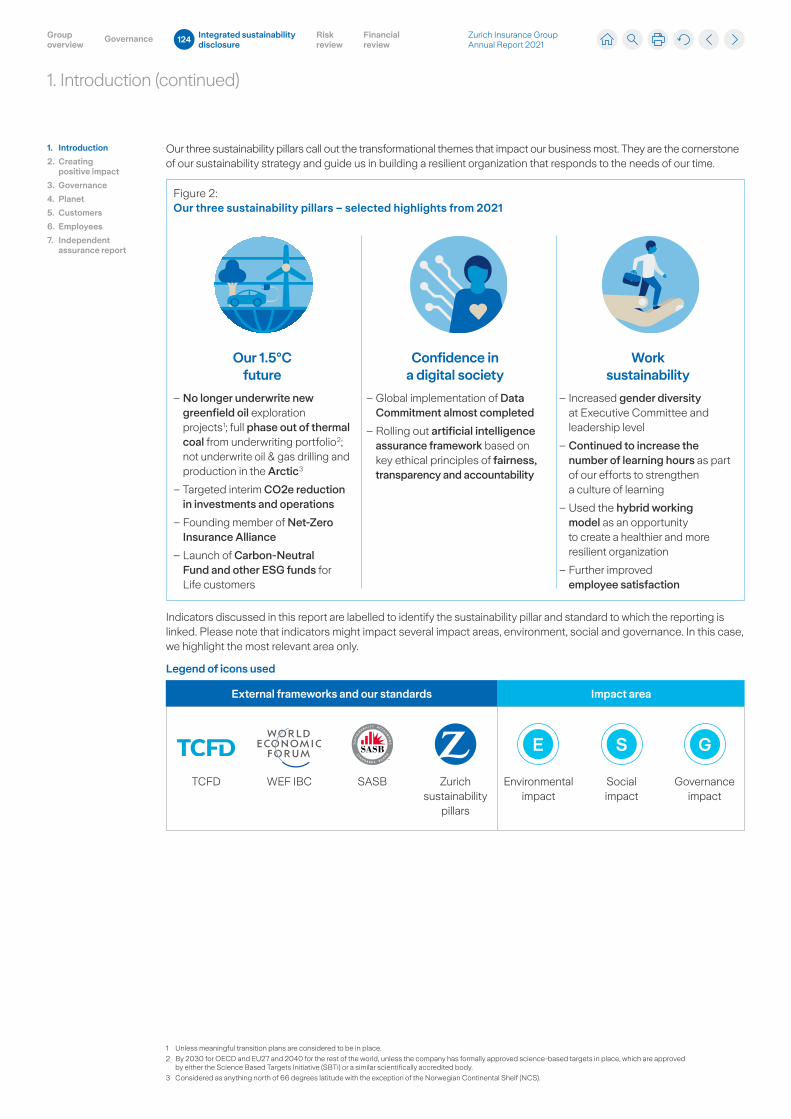
1. Introduction (continued)
1. Introduction
2. Creating positive impact
3. Governance
4. Planet
5. Customers
6. Employees
7. Independent assurance report
Our three sustainability pillars call out the transformational themes that impact our business most. They are the cornerstone of our sustainability strategy and guide us in building a resilient organization that responds to the needs of our time.
Figure 2: Our three sustainability pillars – selected highlights from 2021
Our 1.5°C future
– No longer underwrite new greenfield oil exploration projects 1; full phase out of thermal coal from underwriting portfolio 2; not underwrite oil & gas drilling and production in the Arctic 3
– Targeted interim CO2e reduction in investments and operations
– Founding member of Net-Zero Insurance Alliance
– Launch of Carbon-Neutral Fund and other ESG funds for Life customers
Confidence in a digital society
– Global implementation of Data Commitment almost completed
– Rolling out artificial intelligence assurance framework based on key ethical principles of fairness, transparency and accountability
Work sustainability
– Increased gender diversity at Executive Committee and leadership level
– Continued to increase the number of learning hours as part of our efforts to strengthen a culture of learning
– Used the hybrid working model as an opportunity to create a healthier and more resilient organization
– Further improved employee satisfaction
Indicators discussed in this report are labelled to identify the sustainability pillar and standard to which the reporting is linked. Please note that indicators might impact several impact areas, environment, social and governance. In this case, we highlight the most relevant area only.
Legend of icons used
Impact area
TCFD WEF IBC SASB Zurich sustainability
pillars
Environmental impact
Social impact
Governance impact
External frameworks and our standards
E S G
1 Unless meaningful transition plans are considered to be in place.
2 By 2030 for OECD and EU27 and 2040 for the rest of the world, unless the company has formally approved science-based targets in place, which are approved by either the Science Based Targets Initiative (SBTi) or a similar scientifically accredited body.
3 Considered as anything north of 66 degrees latitude with the exception of the Norwegian Continental Shelf (NCS).
Zurich Insurance Group Annual Report 2021
Group overview
Integrated sustainability disclosure
Governance Risk review
Financial review
124
2. Creating positive impact for stakeholders
1. Introduction
2. Creating positive impact
3. Governance
4. Planet
5. Customers
6. Employees
7. Independent assurance report
We believe social responsibility and care for our planet are aligned with shareholders’ interests. Sustainability is a business opportunity as well as an urgent global imperative. Our ambition is to be one of the most responsible and impactful businesses in the world. This means creating positive outcomes for all stakeholders, taking economic, social and environmental considerations into account.
2.1 Our purpose
Our purpose is to create a brighter future together. We do not strive to realize a static ideal, but rather to be an enabler for evolution and continuous improvement. Over a century and a half, we have refined our business model to make the most of our resources and generate value in a way that
considers all our stakeholders and the physical and social environment around us. We are proud of our heritage and understand that protecting our reputation and our assets is critical to our long-term success. When looking to the future, we are confident we will thrive based on our tradition and grow based on our purpose.
We are convinced that living up to our purpose will strengthen our core business and have a positive impact on our performance as an underwriter and investor. With changing customer expectations and an increasing demand for social and environmental engagement, sustainability is increasingly becoming a driver for success. Evolving legislation and the increasingly visible impacts of climate change underline the urgency of the topic. We are supporting our customers who face these risks, and we are enhancing preventative advisory solutions to complement traditional underwriting services.
2.2 Sustainability in everything we do
To ensure we invest our resources where we can make the biggest impact, we continuously work to identify new challenges and opportunities that arise. We strive to understand the environment around us and look for ways to capture the opportunities it presents for our business. We believe that taking an integrated approach is the key to our success, hence we consider sustainability in everything we do.
We are conscious of the impact we have on people and planet and consider this in our own operations, our investment portfolio, and our underwriting. To set a solid foundation, we have been working on the efficiency and sustainability of our own operations for a long time. In 2021, for example, we established interim targets toward a climate-neutral 2050 to support our climate strategy on the one hand, and focused on digitalization and internal growth as part of our focus on developing our people, on the other. We believe challenging ourselves and our employees will enhance our positive environmental and social impact.
Secondly, we have been one of the early adopters when it comes to sustainable investment. To date, we leverage this expertise to engage companies on our portfolio in the net-zero transition. Finally, we see great opportunities in the field of underwriting and want to strengthen our focus on this to capture the value it holds for our business and our customers. We support our customers in risk prevention and mitigation, for example the increasing challenges of cyber security during the COVID-19 pandemic. We also became a founding member of the Net-Zero Insurance Alliance (NZIA) in 2021, as part of our goal to accelerate the transition to a net-zero emissions future and embed sustainability into our underwriting activities.
G
Zurich Insurance Group Annual Report 2021
Group overview
Integrated sustainability disclosure
Governance Risk review
Financial review
125
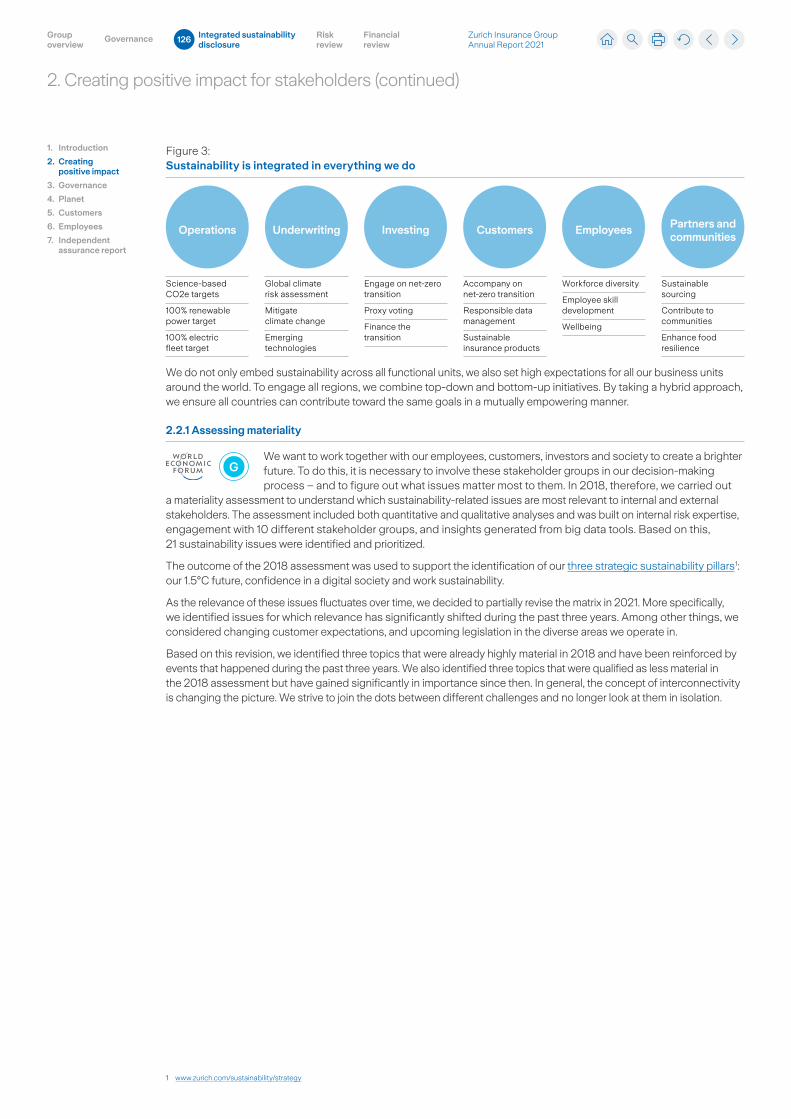
2. Creating positive impact for stakeholders (continued)
1. Introduction
2. Creating positive impact
3. Governance
4. Planet
5. Customers
6. Employees
7. Independent assurance report
Customers Partners and communities
InvestingUnderwritingOperations Employees
Figure 3: Sustainability is integrated in everything we do
Accompany on net-zero transition
Responsible data management
Sustainable insurance products
Workforce diversity
Employee skill development
Wellbeing
Science-based CO2e targets
100% renewable power target
100% electric fleet target
Global climate risk assessment
Mitigate climate change
Emerging technologies
Engage on net-zero transition
Proxy voting
Finance the transition
Sustainable sourcing
Contribute to communities
Enhance food resilience
We do not only embed sustainability across all functional units, we also set high expectations for all our business units around the world. To engage all regions, we combine top-down and bottom-up initiatives. By taking a hybrid approach, we ensure all countries can contribute toward the same goals in a mutually empowering manner.
2.2.1 Assessing materiality
We want to work together with our employees, customers, investors and society to create a brighter future. To do this, it is necessary to involve these stakeholder groups in our decision-making process – and to figure out what issues matter most to them. In 2018, therefore, we carried out
a materiality assessment to understand which sustainability-related issues are most relevant to internal and external stakeholders. The assessment included both quantitative and qualitative analyses and was built on internal risk expertise, engagement with 10 different stakeholder groups, and insights generated from big data tools. Based on this, 21 sustainability issues were identified and prioritized.
The outcome of the 2018 assessment was used to support the identification of our three strategic sustainability pillars 1: our 1.5°C future, confidence in a digital society and work sustainability.
As the relevance of these issues fluctuates over time, we decided to partially revise the matrix in 2021. More specifically, we identified issues for which relevance has significantly shifted during the past three years. Among other things, we considered changing customer expectations, and upcoming legislation in the diverse areas we operate in.
Based on this revision, we identified three topics that were already highly material in 2018 and have been reinforced by events that happened during the past three years. We also identified three topics that were qualified as less material in the 2018 assessment but have gained significantly in importance since then. In general, the concept of interconnectivity is changing the picture. We strive to join the dots between different challenges and no longer look at them in isolation.
G
1 www.zurich.com/sustainability/strategy
Zurich Insurance Group Annual Report 2021
Group overview
Integrated sustainability disclosure
Governance Risk review
Financial review
126
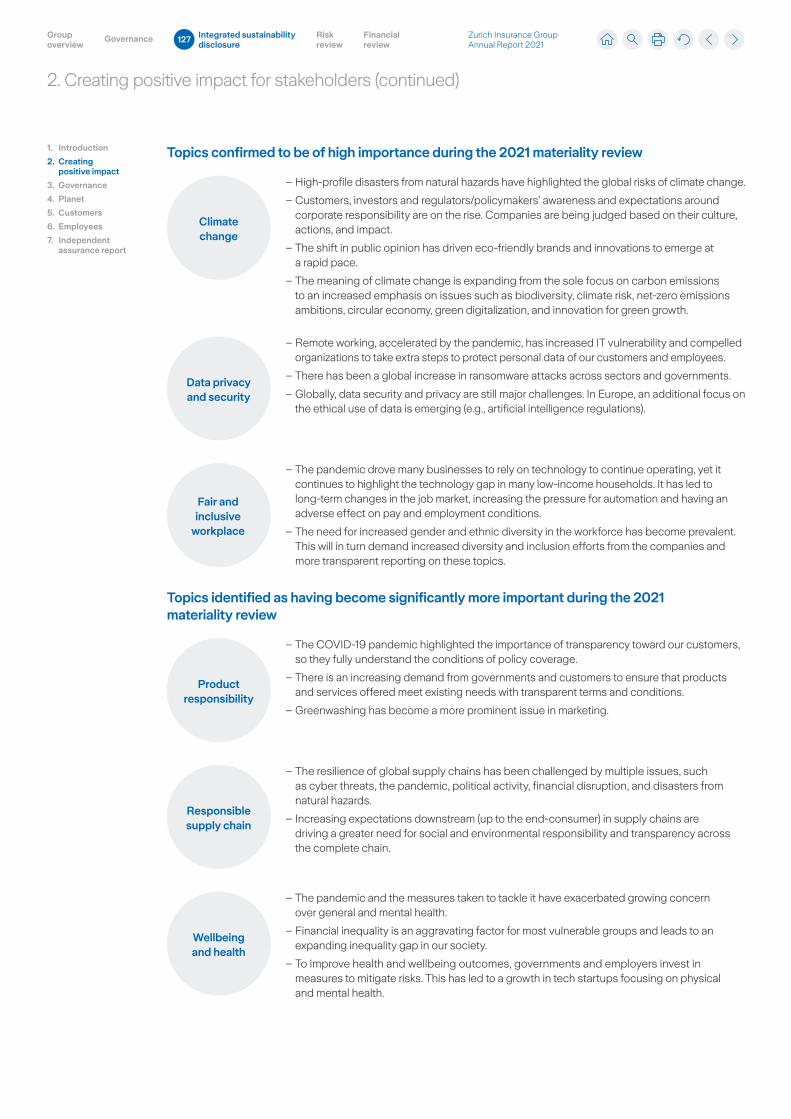
2. Creating positive impact for stakeholders (continued)
1. Introduction
2. Creating positive impact
3. Governance
4. Planet
5. Customers
6. Employees
7. Independent assurance report
Topics confirmed to be of high importance during the 2021 materiality review
Climate change
– High-profile disasters from natural hazards have highlighted the global risks of climate change.
– Customers, investors and regulators/policymakers’ awareness and expectations around corporate responsibility are on the rise. Companies are being judged based on their culture, actions, and impact.
– The shift in public opinion has driven eco-friendly brands and innovations to emerge at a rapid pace.
– The meaning of climate change is expanding from the sole focus on carbon emissions to an increased emphasis on issues such as biodiversity, climate risk, net-zero emissions ambitions, circular economy, green digitalization, and innovation for green growth.
Data privacy and security
– Remote working, accelerated by the pandemic, has increased IT vulnerability and compelled organizations to take extra steps to protect personal data of our customers and employees.
– There has been a global increase in ransomware attacks across sectors and governments.
– Globally, data security and privacy are still major challenges. In Europe, an additional focus on the ethical use of data is emerging (e.g., artificial intelligence regulations).
Fair and inclusive
workplace
– The pandemic drove many businesses to rely on technology to continue operating, yet it continues to highlight the technology gap in many low-income households. It has led to long-term changes in the job market, increasing the pressure for automation and having an adverse effect on pay and employment conditions.
– The need for increased gender and ethnic diversity in the workforce has become prevalent. This will in turn demand increased diversity and inclusion efforts from the companies and more transparent reporting on these topics.
Topics identified as having become significantly more important during the 2021 materiality review
Product responsibility
– The COVID-19 pandemic highlighted the importance of transparency toward our customers, so they fully understand the conditions of policy coverage.
– There is an increasing demand from governments and customers to ensure that products and services offered meet existing needs with transparent terms and conditions.
– Greenwashing has become a more prominent issue in marketing.
Responsible supply chain
– The resilience of global supply chains has been challenged by multiple issues, such as cyber threats, the pandemic, political activity, financial disruption, and disasters from natural hazards.
– Increasing expectations downstream (up to the end-consumer) in supply chains are driving a greater need for social and environmental responsibility and transparency across the complete chain.
Wellbeing and health
– The pandemic and the measures taken to tackle it have exacerbated growing concern over general and mental health.
– Financial inequality is an aggravating factor for most vulnerable groups and leads to an expanding inequality gap in our society.
– To improve health and wellbeing outcomes, governments and employers invest in measures to mitigate risks. This has led to a growth in tech startups focusing on physical and mental health.
Zurich Insurance Group Annual Report 2021
Group overview
Integrated sustainability disclosure
Governance Risk review
Financial review
127
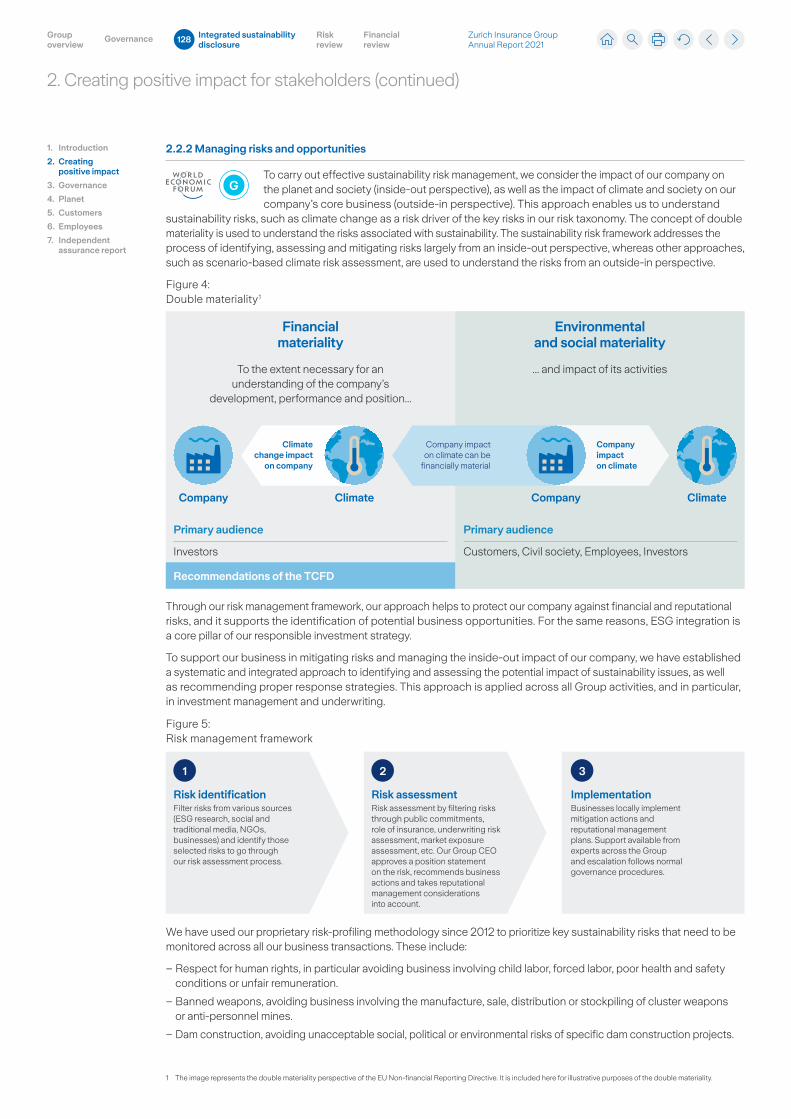
2. Creating positive impact for stakeholders (continued)
1. Introduction
2. Creating positive impact
3. Governance
4. Planet
5. Customers
6. Employees
7. Independent assurance report
2.2.2 Managing risks and opportunities
To carry out effective sustainability risk management, we consider the impact of our company on the planet and society (inside-out perspective), as well as the impact of climate and society on our company’s core business (outside-in perspective). This approach enables us to understand
sustainability risks, such as climate change as a risk driver of the key risks in our risk taxonomy. The concept of double materiality is used to understand the risks associated with sustainability. The sustainability risk framework addresses the process of identifying, assessing and mitigating risks largely from an inside-out perspective, whereas other approaches, such as scenario-based climate risk assessment, are used to understand the risks from an outside-in perspective.
Figure 4: Double materiality 1
Financial materiality
To the extent necessary for an understanding of the company’s
development, performance and position...
Environmental and social materiality
... and impact of its activities
Company Company ClimateClimate
Climate change impact
on company
Company impact on climate can be
financially material
Primary audience
Investors
Recommendations of the TCFD
Primary audience
Customers, Civil society, Employees, Investors
Company impact on climate
Through our risk management framework, our approach helps to protect our company against financial and reputational risks, and it supports the identification of potential business opportunities. For the same reasons, ESG integration is a core pillar of our responsible investment strategy.
To support our business in mitigating risks and managing the inside-out impact of our company, we have established a systematic and integrated approach to identifying and assessing the potential impact of sustainability issues, as well as recommending proper response strategies. This approach is applied across all Group activities, and in particular, in investment management and underwriting.
Figure 5: Risk management framework
Risk identificationFilter risks from various sources (ESG research, social and traditional media, NGOs, businesses) and identify those selected risks to go through our risk assessment process.
Risk assessment Risk assessment by filtering risks through public commitments, role of insurance, underwriting risk assessment, market exposure assessment, etc. Our Group CEO approves a position statement on the risk, recommends business actions and takes reputational management considerations into account.
ImplementationBusinesses locally implement mitigation actions and reputational management plans. Support available from experts across the Group and escalation follows normal governance procedures.
1 2 3
We have used our proprietary risk-profiling methodology since 2012 to prioritize key sustainability risks that need to be monitored across all our business transactions. These include:
– Respect for human rights, in particular avoiding business involving child labor, forced labor, poor health and safety conditions or unfair remuneration.
– Banned weapons, avoiding business involving the manufacture, sale, distribution or stockpiling of cluster weapons or anti-personnel mines.
– Dam construction, avoiding unacceptable social, political or environmental risks of specific dam construction projects.
G
1 The image represents the double materiality perspective of the EU Non-financial Reporting Directive. It is included here for illustrative purposes of the double materiality.
Zurich Insurance Group Annual Report 2021
Group overview
Integrated sustainability disclosure
Governance Risk review
Financial review
128
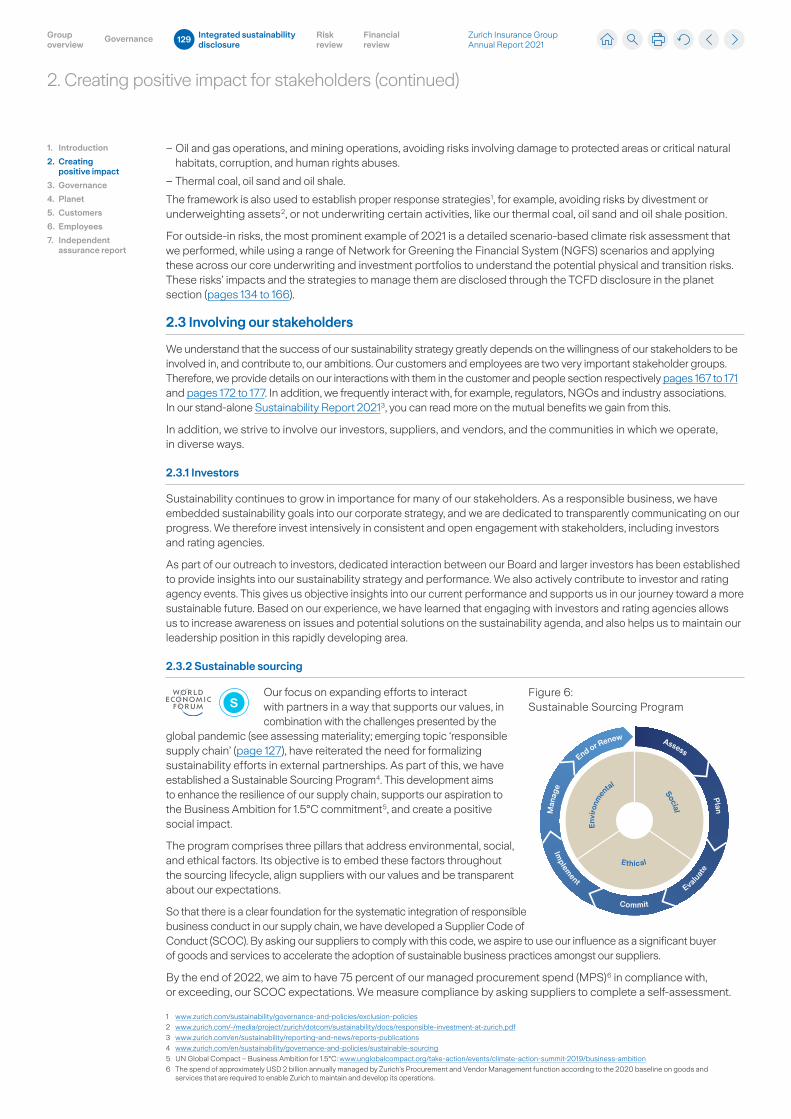
2. Creating positive impact for stakeholders (continued)
1 www.zurich.com/sustainability/governance-and-policies/exclusion-policies
2 www.zurich.com/-/media/project/zurich/dotcom/sustainability/docs/responsible-investment-at-zurich.pdf
3 www.zurich.com/en/sustainability/reporting-and-news/reports-publications
4 www.zurich.com/en/sustainability/governance-and-policies/sustainable-sourcing
5 UN Global Compact – Business Ambition for 1.5°C: www.unglobalcompact.org/take-action/events/climate-action-summit-2019/business-ambition
6 The spend of approximately USD 2 billion annually managed by Zurich’s Procurement and Vendor Management function according to the 2020 baseline on goods and services that are required to enable Zurich to maintain and develop its operations.
– Oil and gas operations, and mining operations, avoiding risks involving damage to protected areas or critical natural habitats, corruption, and human rights abuses.
– Thermal coal, oil sand and oil shale.
The framework is also used to establish proper response strategies 1, for example, avoiding risks by divestment or underweighting assets 2, or not underwriting certain activities, like our thermal coal, oil sand and oil shale position.
For outside-in risks, the most prominent example of 2021 is a detailed scenario-based climate risk assessment that we performed, while using a range of Network for Greening the Financial System (NGFS) scenarios and applying these across our core underwriting and investment portfolios to understand the potential physical and transition risks. These risks’ impacts and the strategies to manage them are disclosed through the TCFD disclosure in the planet section (pages 134 to 166).
2.3 Involving our stakeholders
We understand that the success of our sustainability strategy greatly depends on the willingness of our stakeholders to be involved in, and contribute to, our ambitions. Our customers and employees are two very important stakeholder groups. Therefore, we provide details on our interactions with them in the customer and people section respectively pages 167 to 171 and pages 172 to 177. In addition, we frequently interact with, for example, regulators, NGOs and industry associations. In our stand-alone Sustainability Report 2021 3, you can read more on the mutual benefits we gain from this.
In addition, we strive to involve our investors, suppliers, and vendors, and the communities in which we operate, in diverse ways.
2.3.1 Investors
Sustainability continues to grow in importance for many of our stakeholders. As a responsible business, we have embedded sustainability goals into our corporate strategy, and we are dedicated to transparently communicating on our progress. We therefore invest intensively in consistent and open engagement with stakeholders, including investors and rating agencies.
As part of our outreach to investors, dedicated interaction between our Board and larger investors has been established to provide insights into our sustainability strategy and performance. We also actively contribute to investor and rating agency events. This gives us objective insights into our current performance and supports us in our journey toward a more sustainable future. Based on our experience, we have learned that engaging with investors and rating agencies allows us to increase awareness on issues and potential solutions on the sustainability agenda, and also helps us to maintain our leadership position in this rapidly developing area.
2.3.2 Sustainable sourcing
Our focus on expanding efforts to interact with partners in a way that supports our values, in combination with the challenges presented by the
global pandemic (see assessing materiality; emerging topic ‘responsible supply chain’ (page 127), have reiterated the need for formalizing sustainability efforts in external partnerships. As part of this, we have established a Sustainable Sourcing Program 4. This development aims to enhance the resilience of our supply chain, supports our aspiration to the Business Ambition for 1.5°C commitment 5, and create a positive social impact.
The program comprises three pillars that address environmental, social, and ethical factors. Its objective is to embed these factors throughout the sourcing lifecycle, align suppliers with our values and be transparent about our expectations.
So that there is a clear foundation for the systematic integration of responsible business conduct in our supply chain, we have developed a Supplier Code of Conduct (SCOC). By asking our suppliers to comply with this code, we aspire to use our influence as a significant buyer of goods and services to accelerate the adoption of sustainable business practices amongst our suppliers.
By the end of 2022, we aim to have 75 percent of our managed procurement spend (MPS) 6 in compliance with, or exceeding, our SCOC expectations. We measure compliance by asking suppliers to complete a self-assessment.
S
Assess
Plan
Evaluate
Commit
Implem
ent
Man
age
End or Renew
Env
iron
mental
Social
Ethical
Figure 6: Sustainable Sourcing Program
1. Introduction
2. Creating positive impact
3. Governance
4. Planet
5. Customers
6. Employees
7. Independent assurance report
Zurich Insurance Group Annual Report 2021
Group overview
Integrated sustainability disclosure
Governance Risk review
Financial review
129
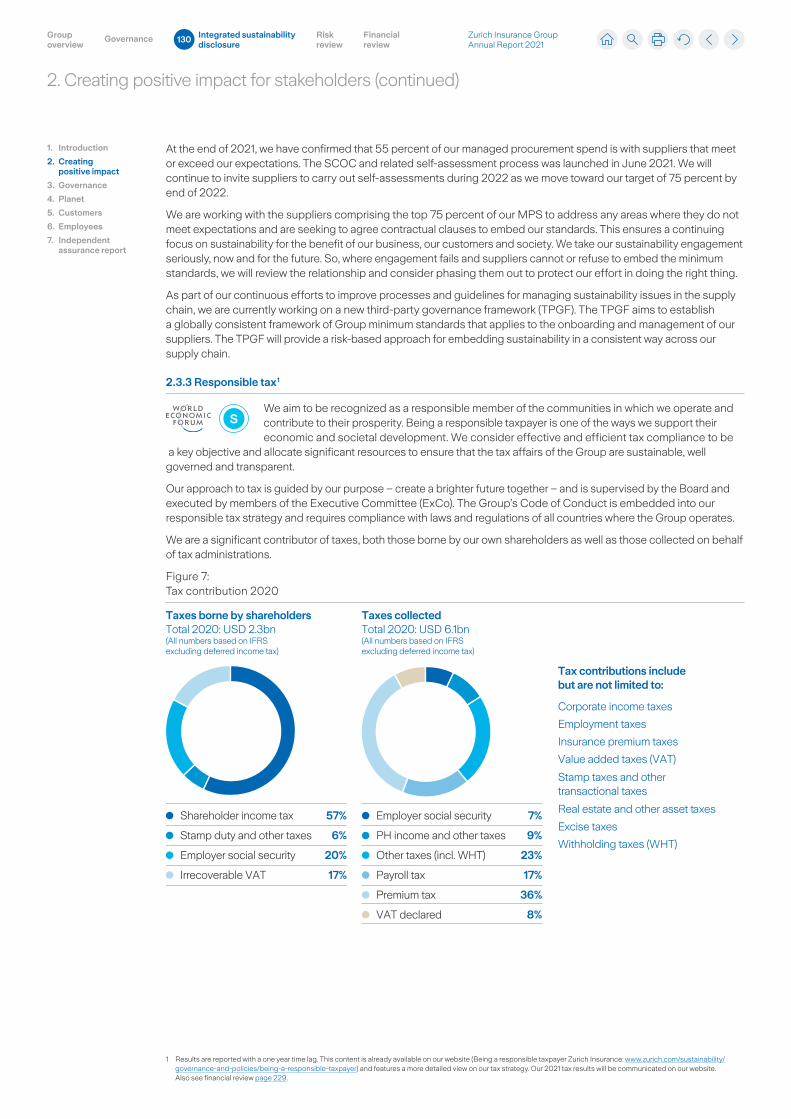
2. Creating positive impact for stakeholders (continued)
At the end of 2021, we have confirmed that 55 percent of our managed procurement spend is with suppliers that meet or exceed our expectations. The SCOC and related self-assessment process was launched in June 2021. We will continue to invite suppliers to carry out self-assessments during 2022 as we move toward our target of 75 percent by end of 2022.
We are working with the suppliers comprising the top 75 percent of our MPS to address any areas where they do not meet expectations and are seeking to agree contractual clauses to embed our standards. This ensures a continuing focus on sustainability for the benefit of our business, our customers and society. We take our sustainability engagement seriously, now and for the future. So, where engagement fails and suppliers cannot or refuse to embed the minimum standards, we will review the relationship and consider phasing them out to protect our effort in doing the right thing.
As part of our continuous efforts to improve processes and guidelines for managing sustainability issues in the supply chain, we are currently working on a new third-party governance framework (TPGF). The TPGF aims to establish a globally consistent framework of Group minimum standards that applies to the onboarding and management of our suppliers. The TPGF will provide a risk-based approach for embedding sustainability in a consistent way across our supply chain.
2.3.3 Responsible tax 1
We aim to be recognized as a responsible member of the communities in which we operate and contribute to their prosperity. Being a responsible taxpayer is one of the ways we support their economic and societal development. We consider effective and efficient tax compliance to be
a key objective and allocate significant resources to ensure that the tax affairs of the Group are sustainable, well governed and transparent.
Our approach to tax is guided by our purpose – create a brighter future together – and is supervised by the Board and executed by members of the Executive Committee (ExCo). The Group’s Code of Conduct is embedded into our responsible tax strategy and requires compliance with laws and regulations of all countries where the Group operates.
We are a significant contributor of taxes, both those borne by our own shareholders as well as those collected on behalf of tax administrations.
Figure 7: Tax contribution 2020
Taxes borne by shareholdersTotal 2020: USD 2.3bn(All numbers based on IFRS excluding deferred income tax)
Taxes collectedTotal 2020: USD 6.1bn(All numbers based on IFRS excluding deferred income tax)
Employer social security 7%
PH income and other taxes 9%
Other taxes (incl. WHT) 23%
Payroll tax 17%
Premium tax 36%
VAT declared 8%
Shareholder income tax 57%
Stamp duty and other taxes 6%
Employer social security 20%
Irrecoverable VAT 17%
Tax contributions includebut are not limited to:
Corporate income taxes
Employment taxes
Insurance premium taxes
Value added taxes (VAT)
Stamp taxes and other transactional taxes
Real estate and other asset taxes
Excise taxes
Withholding taxes (WHT)
S
1. Introduction
2. Creating positive impact
3. Governance
4. Planet
5. Customers
6. Employees
7. Independent assurance report
1 Results are reported with a one year time lag. This content is already available on our website (Being a responsible taxpayer Zurich Insurance: www.zurich.com/sustainability/governance-and-policies/being-a-responsible-taxpayer) and features a more detailed view on our tax strategy. Our 2021 tax results will be communicated on our website. Also see financial review page 229.
Zurich Insurance Group Annual Report 2021
Group overview
Integrated sustainability disclosure
Governance Risk review
Financial review
130
2. Creating positive impact for stakeholders (continued)
2.3.4 Community investment 1
Our community investment activities are mainly delivered by the Z Zurich Foundation (the Foundation), a charitable organization funded by various members of Zurich Insurance Group. The Foundation is at the heart of Zurich’s ambition to be one of the most responsible and impactful businesses in the
world and is creating a brighter future for vulnerable people with the aim to positively impact at least 11 million people worldwide by 2024.
In 2021, the COVID-19 pandemic continued to challenge the world and its population. The Foundation has continued to support the most vulnerable by providing tailored grants to support local disaster relief initiatives identified by our business units. Our employees also went above and beyond to support vulnerable people affected by the various natural hazards, mobilizing their network. These collective efforts led to results of which we are proud, with some of the highlights for 2021 being:
– A global fundraising campaign, engaging our employees and all business units to support UNICEF’s efforts to deliver COVID-19 vaccines to low- and middle-income countries for the COVID-19 Vaccines Global Access (COVAX) Facility.
– Significant developments of the Foundation’s ‘Adapting to Climate Change’, ‘Improving Mental Wellbeing’ and ‘Enabling Social Equity’ activities with new local grants and new global partnerships signed.
– Seventeen new local grant programs to support projects under the Foundation’s strategic areas.
– Sixteen Community Hero Awards presented to recognize Zurich employees, who are going above and beyond to support their communities.
In addition to the work driven by the Foundation, our local business units also hold smaller budgets to account for local needs and priorities.
Table 1: Employee fundraising and volunteering 2020 figures 2, 3
2020 2019 Change
Fundraising and donations (USD millions) 4 2.5 2.3 10%Total time volunteered by workforce (business hours) 38,830 129,702 (70%)
of which skills-based hours 19,485 31,463 (38%)Workforce actively volunteering (% of total headcount) 9.3% 20.9% (11.5 ppts)
Table 2: Charitable cash contributions 2021 figures (USD millions)
2021 2020 Change
Charitable cash contributions by Zurich business units 5 15.6 31.9 (104%)Charitable cash contributions by Zurich to Z Zurich Foundation 6 43.8 42.7 3%
Please note that parentheses around percentages or points indicate a reduction.
S
1 Note: Zurich Insurance Group and its employees are contributing through fundraising, volunteering and cash contributions apart from the community investment activities carried out by the Foundation.
2 All figures exclude Farmers Exchanges. Zurich Insurance Group has no ownership interest in the Farmers Exchanges. Farmers Group, Inc., a wholly owned subsidiary of the Group, provides certain non-claims services and ancillary services to the Farmers Exchanges as attorney-in-fact and receives fees for its services.
3 2021 figures will be disclosed in the Foundation’s annual report published in June 2022.
4 Mostly includes Zurich employees’ fundraising and donations. As the share of the Zurich business units’ matching becomes negligible, the split of these two sub-categories is no longer reflected.
5 ‘Charitable cash contributions’ captures voluntary contributions from Zurich business units to non-profit organizations, excluding the Foundation. Once a year the data is consolidated and the total group number is reported. The decrease in cash contributions in 2020 is mainly due to a one-off donation to the COVID-19 Support Fund in the UK in 2020.
6 Charitable cash contributions captures voluntary contributions from Zurich to the Foundation. The donation is made yearly and reported once a year. The donation is made by various legal entities of the Zurich Insurance Group and amounted to CHF 40 million in 2020 and 2021. The dollar amount increase in the table above is due to foreign exchange rate movements.
1. Introduction
2. Creating positive impact
3. Governance
4. Planet
5. Customers
6. Employees
7. Independent assurance report
Zurich Insurance Group Annual Report 2021
Group overview
Integrated sustainability disclosure
Governance Risk review
Financial review
131
3. Governance: Sustainability is embedded in our governance
Our governance structure supports a stakeholder-inclusive approach. As we believe sustainability needs to be embedded in the existing business to optimize our impact, it is treated as an integral part of our governing system.
GThe Board of Zurich Insurance Group Ltd has ultimate responsibility for the success of the Group and for delivering sustainable value within a framework of prudent and effective controls. It sets the Group’s values and standards to meet the expectations of our stakeholders. As part of its strategic
responsibility, the Board approves the Group’s sustainability strategy and objectives, including related targets that have a material impact on the company or the Group. It is supported by its Board Committees within their respective core mandates:
– the Governance, Nominations and Sustainability Committee recommends the Group’s sustainability strategy and objectives and exercises oversight on sustainability-related matters.
– the Audit Committee provides oversight on the ISD.
– the Risk and Investment Committee provides oversight of risks (including sustainability risks).
– the Remuneration Committee evaluates the Group’s remuneration architecture, including incentive plans which are linked to appropriate performance criteria supporting the execution of the Group’s strategy.
For example, the target card framework used to assess individual performance of the ExCo for the 2021 short-term incentive plan (STIP) awards, includes both financial and non-financial targets. The non-financial
targets are related to customers, employees, and strategic projects such as those with an ESG, including climate, focus.
The Board of Zurich Insurance Group Ltd is a supervisory board. Its members receive fixed remuneration as an annual fee, of which the basic fee is paid half in cash and half in five-year sales-restricted shares which
are not subject to the achievement of any specific performance conditions 1 (see the remuneration report, pages 84 to 117 for further details).
At management level, accountability for different areas of expertise, including sustainability aspects related to each of these areas, are assigned to an ExCo member or a Group CEO direct report. In addition, the Group CEO has designated the CEO EMEA & Bank Distribution as the ExCo-level sponsor for sustainability (Sustainability ExCo Sponsor). This role is supported by the Group Head of Sustainability and the Group Sustainability team. The sponsorship includes driving the strategic sustainability approach of the Group and acting as a sounding board for strategic alignment of global sustainability priorities to assure a consistent approach and to facilitate oversight. The Sustainability ExCo Sponsor is also responsible for monitoring progress with respect to the sustainability priorities and targets and reporting thereon to the Board’s Governance Nominations and Sustainability Committee, the Group CEO and the ExCo.
By opting for an integrated approach, our existing governance bodies are responsible for sustainability related topics that concern their field of expertise.
The implementation of the sustainability strategy and objectives in the businesses, function, regions and countries is facilitated by the Sustainability Leaders Council (SLC). The SLC comprises senior executives from across the Group and is chaired by the Group Head of Sustainability and sponsored by the Sustainability ExCo Sponsor.
1. Introduction
2. Creating positive impact
3. Governance
4. Planet
5. Customers
6. Employees
7. Independent assurance report
1 In line with the TCFD disclosure, we specify that the remuneration of the Board is not impacted by climate-related performance.
Zurich Insurance Group Annual Report 2021
Group overview
Integrated sustainability disclosure
Governance Risk review
Financial review
132
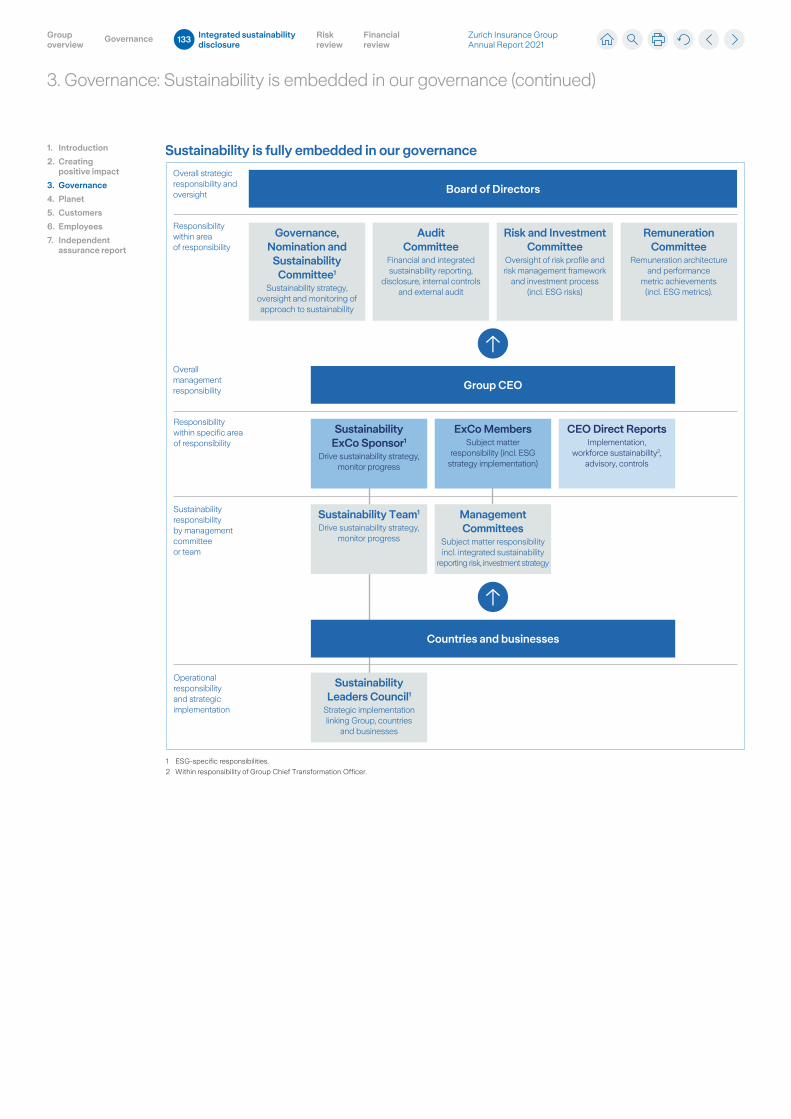
3. Governance: Sustainability is embedded in our governance (continued)
Board of Directors
Group CEO
Sustainability is fully embedded in our governance
Overall strategic responsibility and oversight
Responsibility within area of responsibility
Governance,Nomination and
Sustainability Committee1
Sustainability strategy,oversight and monitoring ofapproach to sustainability
RemunerationCommittee
Remuneration architecture and performance
metric achievements (incl. ESG metrics).
Sustainability ExCo Sponsor1
Drive sustainability strategy,monitor progress
Sustainability responsibilityby management committeeor team
Operational responsibility and strategic implementation
SustainabilityLeaders Council1
Strategic implementation linking Group, countries
and businesses
1 ESG-specific responsibilities.
2 Within responsibility of Group Chief Transformation Officer.
Countries and businesses
Sustainability Team1
Drive sustainability strategy,monitor progress
ManagementCommittees
Subject matter responsibilityincl. integrated sustainability
reporting risk, investment strategy
ExCo MembersSubject matter
responsibility (incl. ESG strategy implementation)
CEO Direct ReportsImplementation,
workforce sustainability2,advisory, controls
Risk and InvestmentCommittee
Oversight of risk profile andrisk management framework
and investment process(incl. ESG risks)
AuditCommittee
Financial and integrated sustainability reporting,
disclosure, internal controlsand external audit
Overall management responsibility
Responsibility within specific area of responsibility
1. Introduction
2. Creating positive impact
3. Governance
4. Planet
5. Customers
6. Employees
7. Independent assurance report
Zurich Insurance Group Annual Report 2021
Group overview
Integrated sustainability disclosure
Governance Risk review
Financial review
133
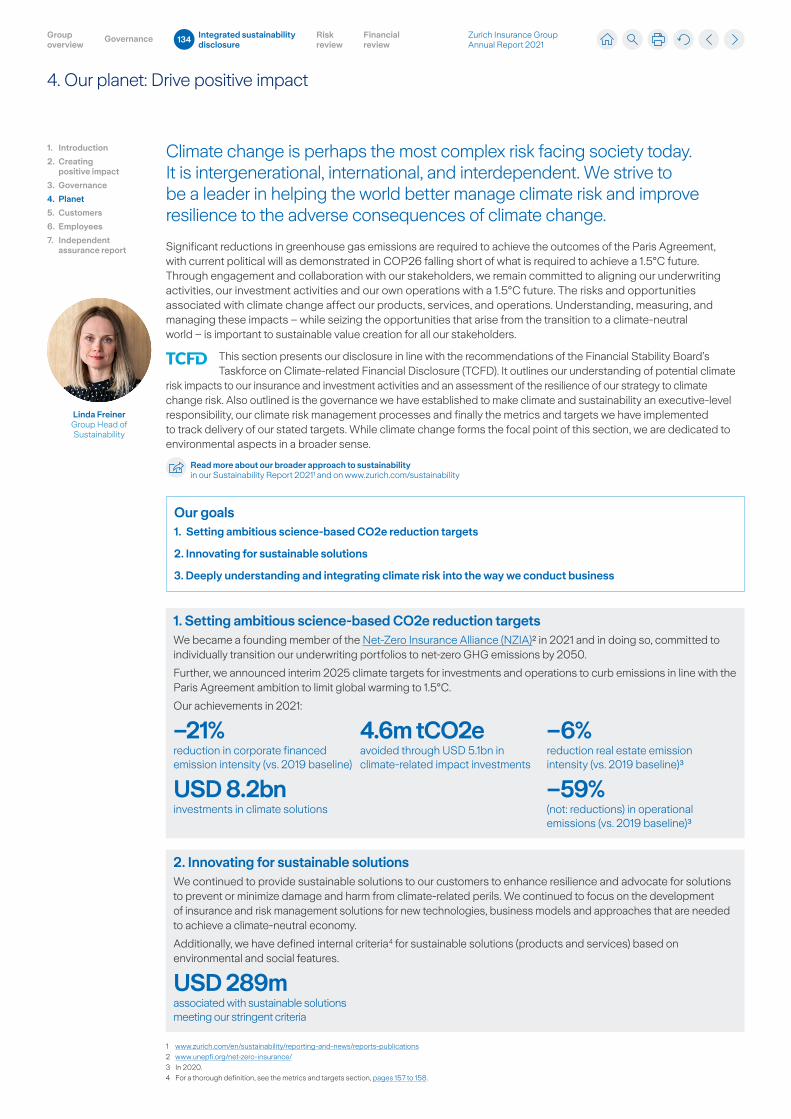
4. Our planet: Drive positive impact
Linda FreinerGroup Head of Sustainability
Climate change is perhaps the most complex risk facing society today. It is intergenerational, international, and interdependent. We strive to be a leader in helping the world better manage climate risk and improve resilience to the adverse consequences of climate change.
Significant reductions in greenhouse gas emissions are required to achieve the outcomes of the Paris Agreement, with current political will as demonstrated in COP26 falling short of what is required to achieve a 1.5°C future. Through engagement and collaboration with our stakeholders, we remain committed to aligning our underwriting activities, our investment activities and our own operations with a 1.5°C future. The risks and opportunities associated with climate change affect our products, services, and operations. Understanding, measuring, and managing these impacts – while seizing the opportunities that arise from the transition to a climate-neutral world – is important to sustainable value creation for all our stakeholders.
This section presents our disclosure in line with the recommendations of the Financial Stability Board’s Taskforce on Climate-related Financial Disclosure (TCFD). It outlines our understanding of potential climate
risk impacts to our insurance and investment activities and an assessment of the resilience of our strategy to climate change risk. Also outlined is the governance we have established to make climate and sustainability an executive-level responsibility, our climate risk management processes and finally the metrics and targets we have implemented to track delivery of our stated targets. While climate change forms the focal point of this section, we are dedicated to environmental aspects in a broader sense.
Read more about our broader approach to sustainability in our Sustainability Report 2021¹ and on www.zurich.com/sustainability
Our goals1. Setting ambitious science-based CO2e reduction targets
2. Innovating for sustainable solutions
3. Deeply understanding and integrating climate risk into the way we conduct business
1. Setting ambitious science-based CO2e reduction targets
We became a founding member of the Net-Zero Insurance Alliance (NZIA)² in 2021 and in doing so, committed to individually transition our underwriting portfolios to net-zero GHG emissions by 2050.
Further, we announced interim 2025 climate targets for investments and operations to curb emissions in line with the Paris Agreement ambition to limit global warming to 1.5°C.
Our achievements in 2021:
–21%reduction in corporate financed emission intensity (vs. 2019 baseline)
4.6m tCO2e avoided through USD 5.1bn in climate-related impact investments
–6%reduction real estate emission intensity (vs. 2019 baseline)³
USD 8.2bninvestments in climate solutions
–59% (not: reductions) in operational emissions (vs. 2019 baseline)³
2. Innovating for sustainable solutionsWe continued to provide sustainable solutions to our customers to enhance resilience and advocate for solutions to prevent or minimize damage and harm from climate-related perils. We continued to focus on the development of insurance and risk management solutions for new technologies, business models and approaches that are needed to achieve a climate-neutral economy.
Additionally, we have defined internal criteria 4 for sustainable solutions (products and services) based on environmental and social features.
USD 289massociated with sustainable solutions meeting our stringent criteria
1. Introduction
2. Creating positive impact
3. Governance
4. Planet
5. Customers
6. Employees
7. Independent assurance report
1 www.zurich.com/en/sustainability/reporting-and-news/reports-publications
2 www.unepfi.org/net-zero-insurance/
3 In 2020.
4 For a thorough definition, see the metrics and targets section, pages 157 to 158.
Zurich Insurance Group Annual Report 2021
Group overview
Integrated sustainability disclosure
Governance Risk review
Financial review
134
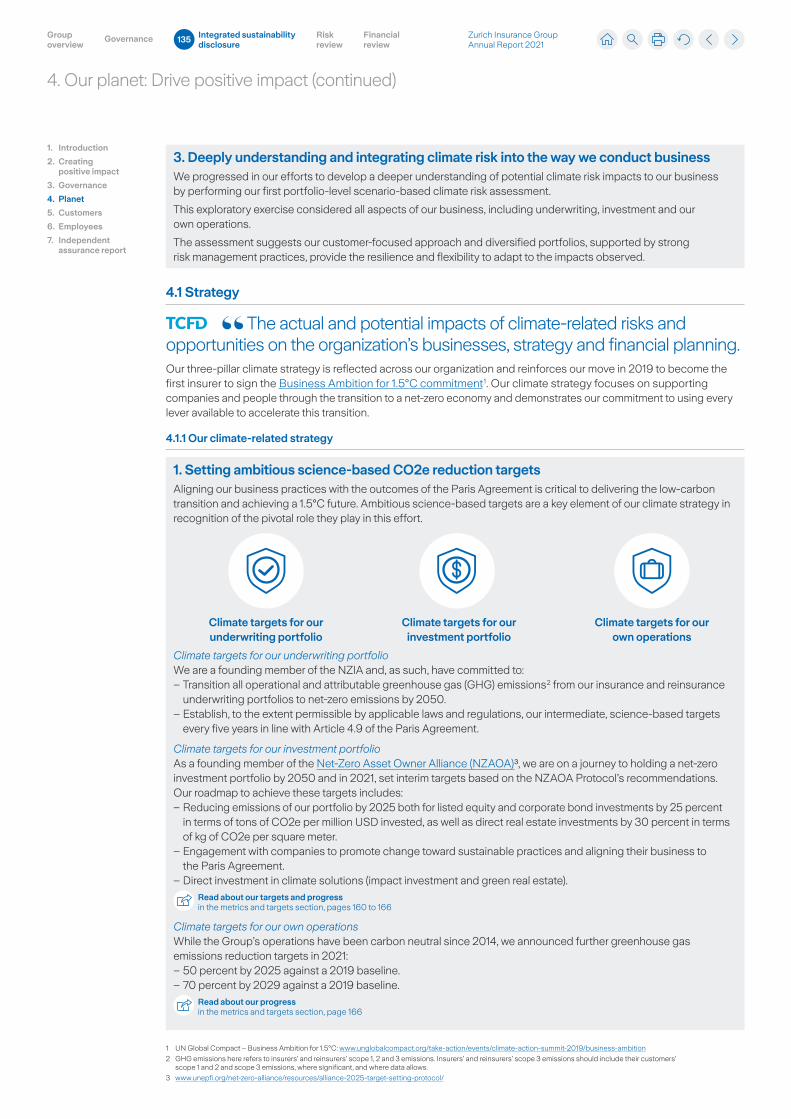
4. Our planet: Drive positive impact (continued)
1. Introduction
2. Creating positive impact
3. Governance
4. Planet
5. Customers
6. Employees
7. Independent assurance report
3. Deeply understanding and integrating climate risk into the way we conduct businessWe progressed in our efforts to develop a deeper understanding of potential climate risk impacts to our business by performing our first portfolio-level scenario-based climate risk assessment.
This exploratory exercise considered all aspects of our business, including underwriting, investment and our own operations.
The assessment suggests our customer-focused approach and diversified portfolios, supported by strong risk management practices, provide the resilience and flexibility to adapt to the impacts observed.
4.1 Strategy
The actual and potential impacts of climate-related risks and opportunities on the organization’s businesses, strategy and financial planning. Our three-pillar climate strategy is reflected across our organization and reinforces our move in 2019 to become the first insurer to sign the Business Ambition for 1.5°C commitment 1. Our climate strategy focuses on supporting companies and people through the transition to a net-zero economy and demonstrates our commitment to using every lever available to accelerate this transition.
4.1.1 Our climate-related strategy
1. Setting ambitious science-based CO2e reduction targets Aligning our business practices with the outcomes of the Paris Agreement is critical to delivering the low-carbon transition and achieving a 1.5°C future. Ambitious science-based targets are a key element of our climate strategy in recognition of the pivotal role they play in this effort.
Climate targets for our underwriting portfolio
Climate targets for our investment portfolio
Climate targets for our own operations
Climate targets for our underwriting portfolioWe are a founding member of the NZIA and, as such, have committed to:
– Transition all operational and attributable greenhouse gas (GHG) emissions 2 from our insurance and reinsurance underwriting portfolios to net-zero emissions by 2050.
– Establish, to the extent permissible by applicable laws and regulations, our intermediate, science-based targets every five years in line with Article 4.9 of the Paris Agreement.
Climate targets for our investment portfolioAs a founding member of the Net-Zero Asset Owner Alliance (NZAOA)³, we are on a journey to holding a net-zero investment portfolio by 2050 and in 2021, set interim targets based on the NZAOA Protocol’s recommendations. Our roadmap to achieve these targets includes:
– Reducing emissions of our portfolio by 2025 both for listed equity and corporate bond investments by 25 percent in terms of tons of CO2e per million USD invested, as well as direct real estate investments by 30 percent in terms of kg of CO2e per square meter.
– Engagement with companies to promote change toward sustainable practices and aligning their business to the Paris Agreement.
– Direct investment in climate solutions (impact investment and green real estate).
Read about our targets and progress in the metrics and targets section, pages 160 to 166
Climate targets for our own operationsWhile the Group’s operations have been carbon neutral since 2014, we announced further greenhouse gas emissions reduction targets in 2021:
– 50 percent by 2025 against a 2019 baseline. – 70 percent by 2029 against a 2019 baseline.
Read about our progress in the metrics and targets section, page 166
1 UN Global Compact – Business Ambition for 1.5°C: www.unglobalcompact.org/take-action/events/climate-action-summit-2019/business-ambition
2 GHG emissions here refers to insurers’ and reinsurers’ scope 1, 2 and 3 emissions. Insurers’ and reinsurers’ scope 3 emissions should include their customers’ scope 1 and 2 and scope 3 emissions, where significant, and where data allows.
3 www.unepfi.org/net-zero-alliance/resources/alliance-2025-target-setting-protocol/
Zurich Insurance Group Annual Report 2021
Group overview
Integrated sustainability disclosure
Governance Risk review
Financial review
135
4. Our planet: Drive positive impact (continued)
2. Innovating for sustainable solutionsWe believe insurance is key to facilitating the change required to achieve the low-carbon transition. We work with customers and collaborate with public and private organizations to enhance resilience and advocate for solutions to prevent or minimize damage and harm from climate-related perils. We develop insurance and risk management solutions for new technologies, business models and approaches that are needed to achieve a climate-neutral economy. We also use capital markets to search for and fund solutions to many pressing social or environmental issues. We apply our leading impact investing approach to build a portfolio of green impact investments that helps avoid five million tons of CO2e per year. We are working with the NZAOA to increase the pipeline of investment opportunities in climate solutions that are suitable for institutional investors.
Unit-linked sustainability solutionsWe launched a set of innovative unit-linked sustainability solutions that leverage our responsible investment expertise for the benefit of our unit-linked customers. For example, we launched an industry-first Carbon Neutral World Equity Fund 1 that combines a low-carbon investment strategy with carbon offsetting. The fund is available in Germany, Italy, Portugal and Switzerland, with rollout to additional markets expected in 2022.
Read more about our unit-linked funds in our Sustainability Report 2021², section Customer
Climate risk solutionsTo enhance our customers’ ability to manage transition risk, we have strengthened our support for renewable energy through the addition of specialist roles within the organization to help manage and develop risk positions. This will help ensure we maintain a balanced portfolio, keeping in mind the potential for higher risks associated with renewable energy construction projects.
We have expanded our existing natural hazards risk advisory service to address customers’ physical climate change risks. As part of our Climate Change Resilience Services (CCRS) 3, a dedicated team of climate risk experts helps businesses better understand how climate change risk may affect their operations, strategy, and financial position and ultimately strengthen their resilience to climate risks.
Read more about our CCRS in our Sustainability Report 2021², section Customer
Measuring sustainable solutions based on an internal definitionIn 2021, we established an internal definition of sustainable solutions and measured their associated revenue for the first time. Those stringent criteria have been thoroughly assessed through an internal process to be qualified as sustainable solutions. Meeting those criteria are also a pre-requisite to promoting a product as sustainable.
Read more about our definition and progressin the metrics and targets section, pages 157 to 158
Fostering internal innovationTo foster innovative thinking internally, we set up a community of practice focusing on knowledge sharing and the development of customer-facing solutions to support the transition (mobility, green consumerism, energy, carbon and sustainable infrastructure). We encourage our workforce to engage in efforts to reduce our operational footprint and in 2021 established an internal carbon fund to support this objective. Governed by the SLC, this fund supports the implementation of initiatives proposed by employees and intended to address operational emissions and ensure our continued carbon neutrality. Our internal carbon price – set at USD 15 per ton in 2021 – is subject to annual increase.
Read more about our carbon fund in our Sustainability Report 2021², section Planet
1. Introduction
2. Creating positive impact
3. Governance
4. Planet
5. Customers
6. Employees
7. Independent assurance report
1 www.zurich.com/media/news-releases/2021/2021-0907-01
2 www.zurich.com/en/sustainability/reporting-and-news/reports-publications
3 www.zurich.com/products-and-services/protect-your-business/risk-engineering/climate-change-resilience-services
Zurich Insurance Group Annual Report 2021
Group overview
Integrated sustainability disclosure
Governance Risk review
Financial review
136
4. Our planet: Drive positive impact (continued)
3. Deeply understanding and integrating climate risk into the way we conduct businessUnderstanding and managing climate impacts is an important aspect of maintaining our long-term profitability. Our approach to climate risk is part of our Group-wide risk management process. It is managed in a way that is consistent with other risks to which the Group is exposed. We are integrating assessments of the evolving physical and transition risk landscape into our underwriting and investment strategies.
Natural catastrophe modelingTo manage our climate risks more effectively, we are investing to improve our understanding of them, with modeling the effects of physical risk on our portfolios as a key focus area. While climate change models are constantly improving, they remain less accurate at the smaller spatial resolutions needed for a detailed analysis of the impact of natural catastrophe changes on our portfolio. In contrast, traditional commercial catastrophe models that form the basis of our current modeling are typically based on historical data and hence would not reflect future changes in trends. For this reason, we have started to combine climate change scenarios and natural catastrophe models to complement our Zurich view framework with a view of climate change, and to integrate this view into our accumulation risk and peril-region modeling.
Read more about natural catastrophe modelingin the managing risks from climate-related natural catastrophes section, page 155
Portfolio-level climate risk scenario analysisA deep understanding of potential medium- to long-term impacts of climate change risk to our underwriting and investment portfolios is fundamental to formulating appropriate strategic responses. We employ scenario analysis at the portfolio level to develop such an understanding. Our first exploratory scenario-based climate risk assessment, performed in 2021, considered outcomes from 2030 onward, with impacts quantified where possible. Outcomes of this analysis are used to determine appropriate responses and ensure the resilience of our strategy.
We view disclosure of the outcomes of these processes in line with the TCFD recommendations as a critical proof point to demonstrate our understanding and management of this risk.
Read more about the outcomes of our first scenario-based climate risk assessment in the climate risk assessment 2021 section, pages 144 to 152
Read more about how we have integrated scenario analysis into our risk management processes in the portfolio-level scenario-based climate risk assessment section, pages 153 to 154
1. Introduction
2. Creating positive impact
3. Governance
4. Planet
5. Customers
6. Employees
7. Independent assurance report
Zurich Insurance Group Annual Report 2021
Group overview
Integrated sustainability disclosure
Governance Risk review
Financial review
137
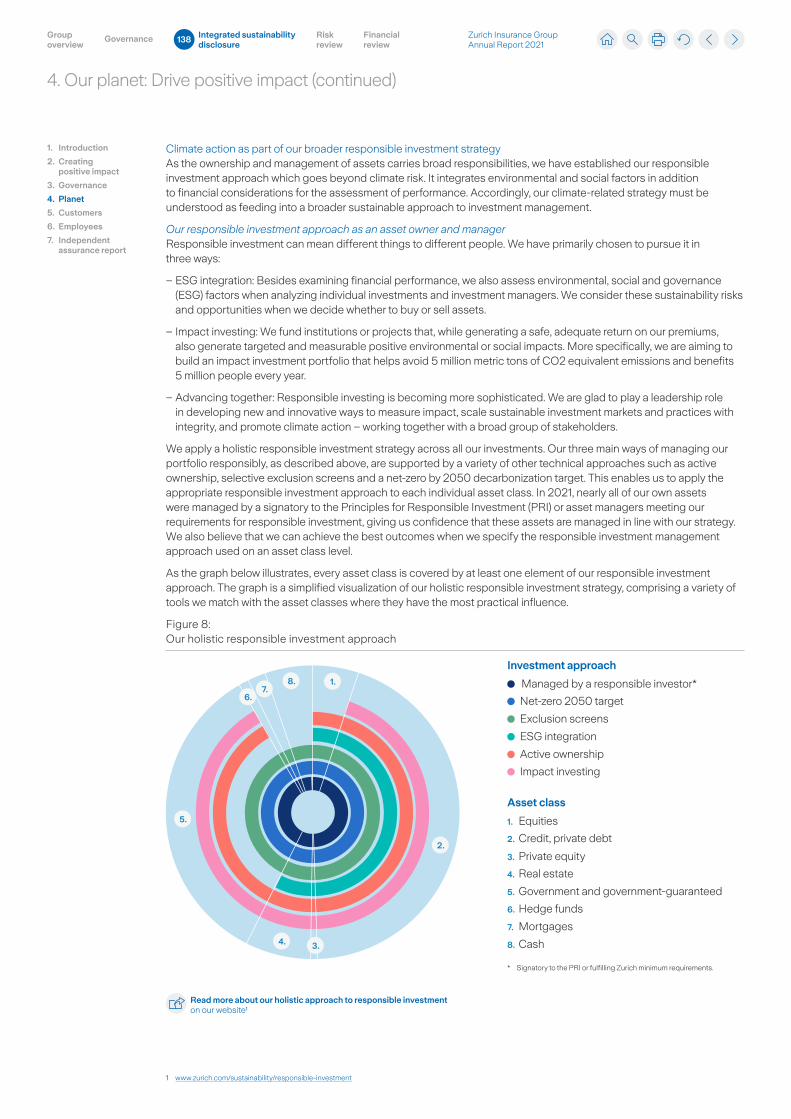
4. Our planet: Drive positive impact (continued)
1. Introduction
2. Creating positive impact
3. Governance
4. Planet
5. Customers
6. Employees
7. Independent assurance report
Climate action as part of our broader responsible investment strategyAs the ownership and management of assets carries broad responsibilities, we have established our responsible investment approach which goes beyond climate risk. It integrates environmental and social factors in addition to financial considerations for the assessment of performance. Accordingly, our climate-related strategy must be understood as feeding into a broader sustainable approach to investment management.
Our responsible investment approach as an asset owner and managerResponsible investment can mean different things to different people. We have primarily chosen to pursue it in three ways:
– ESG integration: Besides examining financial performance, we also assess environmental, social and governance (ESG) factors when analyzing individual investments and investment managers. We consider these sustainability risks and opportunities when we decide whether to buy or sell assets.
– Impact investing: We fund institutions or projects that, while generating a safe, adequate return on our premiums, also generate targeted and measurable positive environmental or social impacts. More specifically, we are aiming to build an impact investment portfolio that helps avoid 5 million metric tons of CO2 equivalent emissions and benefits 5 million people every year.
– Advancing together: Responsible investing is becoming more sophisticated. We are glad to play a leadership role in developing new and innovative ways to measure impact, scale sustainable investment markets and practices with integrity, and promote climate action – working together with a broad group of stakeholders.
We apply a holistic responsible investment strategy across all our investments. Our three main ways of managing our portfolio responsibly, as described above, are supported by a variety of other technical approaches such as active ownership, selective exclusion screens and a net-zero by 2050 decarbonization target. This enables us to apply the appropriate responsible investment approach to each individual asset class. In 2021, nearly all of our own assets were managed by a signatory to the Principles for Responsible Investment (PRI) or asset managers meeting our requirements for responsible investment, giving us confidence that these assets are managed in line with our strategy. We also believe that we can achieve the best outcomes when we specify the responsible investment management approach used on an asset class level.
As the graph below illustrates, every asset class is covered by at least one element of our responsible investment approach. The graph is a simplified visualization of our holistic responsible investment strategy, comprising a variety of tools we match with the asset classes where they have the most practical influence.
Figure 8: Our holistic responsible investment approach
* Signatory to the PRI or fulfilling Zurich minimum requirements.
Investment approach
Managed by a responsible investor*
Exclusion screens
Active ownership
Impact investing
Net-zero 2050 target
ESG integration
Asset class
1. Equities
3. Private equity
6. Hedge funds
5. Government and government-guaranteed
8. Cash
2. Credit, private debt
4. Real estate
7. Mortgages
2.
4.
5.
8. 1.
6.
3.
7.
Read more about our holistic approach to responsible investment on our website¹
1 www.zurich.com/sustainability/responsible-investment
Zurich Insurance Group Annual Report 2021
Group overview
Integrated sustainability disclosure
Governance Risk review
Financial review
138
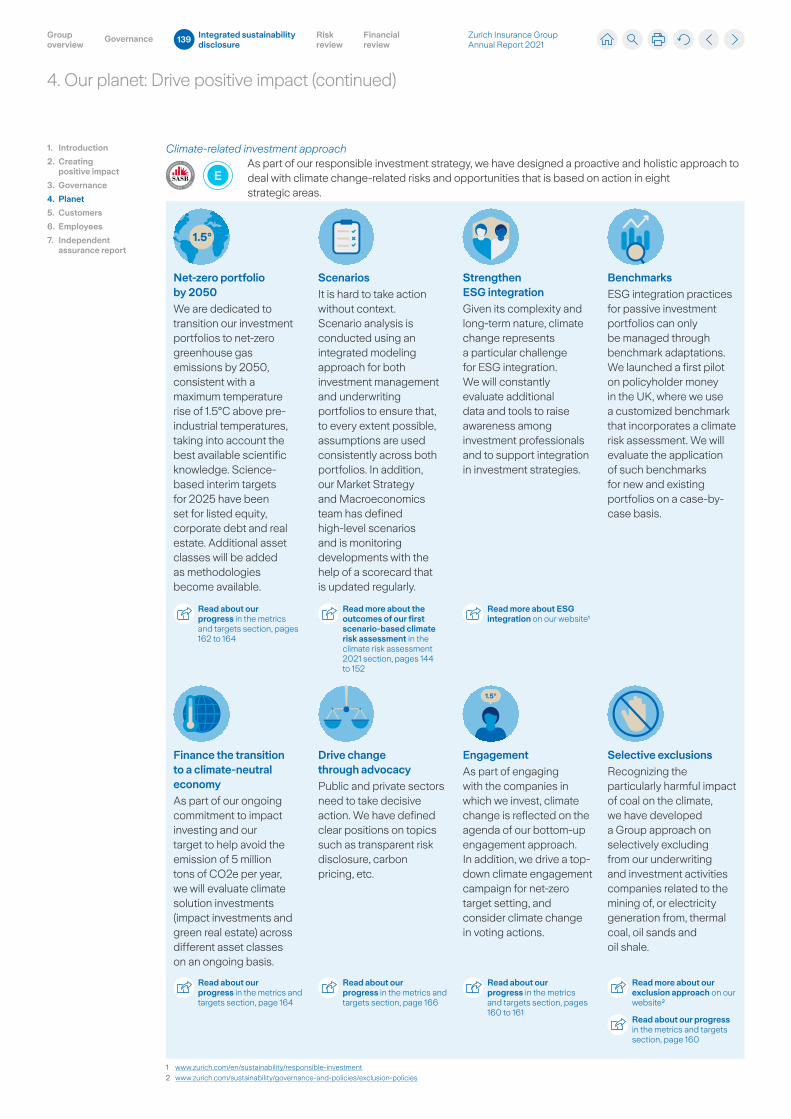
4. Our planet: Drive positive impact (continued)
1. Introduction
2. Creating positive impact
3. Governance
4. Planet
5. Customers
6. Employees
7. Independent assurance report
Climate-related investment approach
EAs part of our responsible investment strategy, we have designed a proactive and holistic approach to deal with climate change-related risks and opportunities that is based on action in eight strategic areas.
Net-zero portfolio by 2050
We are dedicated to transition our investment portfolios to net-zero greenhouse gas emissions by 2050, consistent with a maximum temperature rise of 1.5°C above pre-industrial temperatures, taking into account the best available scientific knowledge. Science-based interim targets for 2025 have been set for listed equity, corporate debt and real estate. Additional asset classes will be added as methodologies become available.
Scenarios
It is hard to take action without context. Scenario analysis is conducted using an integrated modeling approach for both investment management and underwriting portfolios to ensure that, to every extent possible, assumptions are used consistently across both portfolios. In addition, our Market Strategy and Macroeconomics team has defined high-level scenarios and is monitoring developments with the help of a scorecard that is updated regularly.
Strengthen ESG integration
Given its complexity and long-term nature, climate change represents a particular challenge for ESG integration. We will constantly evaluate additional data and tools to raise awareness among investment professionals and to support integration in investment strategies.
Benchmarks
ESG integration practices for passive investment portfolios can only be managed through benchmark adaptations. We launched a first pilot on policyholder money in the UK, where we use a customized benchmark that incorporates a climate risk assessment. We will evaluate the application of such benchmarks for new and existing portfolios on a case-by-case basis.
Finance the transition to a climate-neutral economy
As part of our ongoing commitment to impact investing and our target to help avoid the emission of 5 million tons of CO2e per year, we will evaluate climate solution investments (impact investments and green real estate) across different asset classes on an ongoing basis.
Drive change through advocacy
Public and private sectors need to take decisive action. We have defined clear positions on topics such as transparent risk disclosure, carbon pricing, etc.
Engagement
As part of engaging with the companies in which we invest, climate change is reflected on the agenda of our bottom-up engagement approach. In addition, we drive a top-down climate engagement campaign for net-zero target setting, and consider climate change in voting actions.
Selective exclusions
Recognizing the particularly harmful impact of coal on the climate, we have developed a Group approach on selectively excluding from our underwriting and investment activities companies related to the mining of, or electricity generation from, thermal coal, oil sands and oil shale.
Read about our progress in the metrics and targets section, pages 160 to 161
Read about our progress in the metrics and targets section, page 166
Read about our progress in the metrics and targets section, page 164
Read about our progress in the metrics and targets section, pages 162 to 164
Read more about the outcomes of our first scenario-based climate risk assessment in the climate risk assessment 2021 section, pages 144 to 152
Read more about ESG integration on our website¹
1 www.zurich.com/en/sustainability/responsible-investment
2 www.zurich.com/sustainability/governance-and-policies/exclusion-policies
Read about our progress in the metrics and targets section, page 160
Read more about our exclusion approach on our website²
Zurich Insurance Group Annual Report 2021
Group overview
Integrated sustainability disclosure
Governance Risk review
Financial review
139
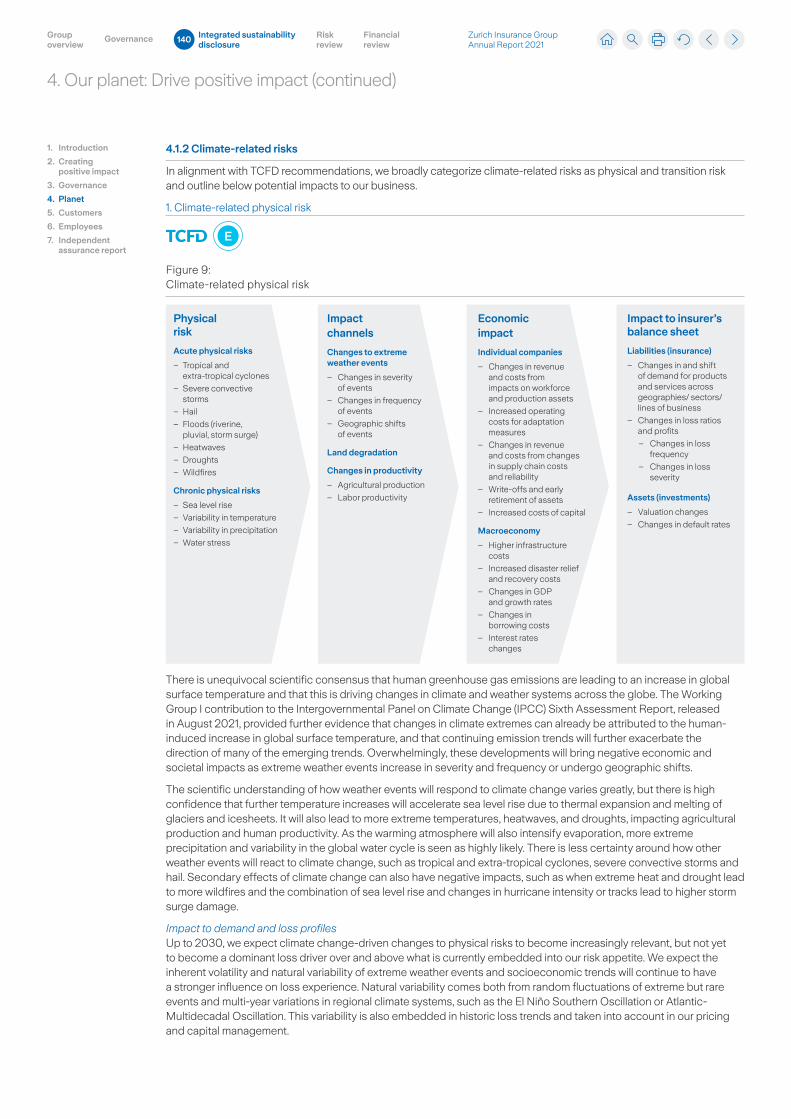
4. Our planet: Drive positive impact (continued)
4.1.2 Climate-related risks
In alignment with TCFD recommendations, we broadly categorize climate-related risks as physical and transition risk and outline below potential impacts to our business.
1. Climate-related physical risk
E
Figure 9: Climate-related physical risk
Physical risk
Acute physical risks
– Tropical and extra-tropical cyclones
– Severe convective storms
– Hail
– Floods (riverine, pluvial, storm surge)
– Heatwaves
– Droughts
– Wildfires
Chronic physical risks
– Sea level rise
– Variability in temperature
– Variability in precipitation
– Water stress
Impact channels
Changes to extreme weather events
– Changes in severity of events
– Changes in frequency of events
– Geographic shifts of events
Land degradation
Changes in productivity
– Agricultural production
– Labor productivity
Economic impact
Individual companies
– Changes in revenue and costs from impacts on workforce and production assets
– Increased operating costs for adaptation measures
– Changes in revenue and costs from changes in supply chain costs and reliability
– Write-offs and early retirement of assets
– Increased costs of capital
Macroeconomy
– Higher infrastructure costs
– Increased disaster relief and recovery costs
– Changes in GDP and growth rates
– Changes in borrowing costs
– Interest rates changes
Impact to insurer’s balance sheet
Liabilities (insurance)
– Changes in and shift of demand for products and services across geographies/ sectors/ lines of business
– Changes in loss ratios and profits
– Changes in loss frequency
– Changes in loss severity
Assets (investments)
– Valuation changes
– Changes in default rates
There is unequivocal scientific consensus that human greenhouse gas emissions are leading to an increase in global surface temperature and that this is driving changes in climate and weather systems across the globe. The Working Group I contribution to the Intergovernmental Panel on Climate Change (IPCC) Sixth Assessment Report, released in August 2021, provided further evidence that changes in climate extremes can already be attributed to the human-induced increase in global surface temperature, and that continuing emission trends will further exacerbate the direction of many of the emerging trends. Overwhelmingly, these developments will bring negative economic and societal impacts as extreme weather events increase in severity and frequency or undergo geographic shifts.
The scientific understanding of how weather events will respond to climate change varies greatly, but there is high confidence that further temperature increases will accelerate sea level rise due to thermal expansion and melting of glaciers and icesheets. It will also lead to more extreme temperatures, heatwaves, and droughts, impacting agricultural production and human productivity. As the warming atmosphere will also intensify evaporation, more extreme precipitation and variability in the global water cycle is seen as highly likely. There is less certainty around how other weather events will react to climate change, such as tropical and extra-tropical cyclones, severe convective storms and hail. Secondary effects of climate change can also have negative impacts, such as when extreme heat and drought lead to more wildfires and the combination of sea level rise and changes in hurricane intensity or tracks lead to higher storm surge damage.
Impact to demand and loss profilesUp to 2030, we expect climate change-driven changes to physical risks to become increasingly relevant, but not yet to become a dominant loss driver over and above what is currently embedded into our risk appetite. We expect the inherent volatility and natural variability of extreme weather events and socioeconomic trends will continue to have a stronger influence on loss experience. Natural variability comes both from random fluctuations of extreme but rare events and multi-year variations in regional climate systems, such as the El Niño Southern Oscillation or Atlantic-Multidecadal Oscillation. This variability is also embedded in historic loss trends and taken into account in our pricing and capital management.
1. Introduction
2. Creating positive impact
3. Governance
4. Planet
5. Customers
6. Employees
7. Independent assurance report
Zurich Insurance Group Annual Report 2021
Group overview
Integrated sustainability disclosure
Governance Risk review
Financial review
140
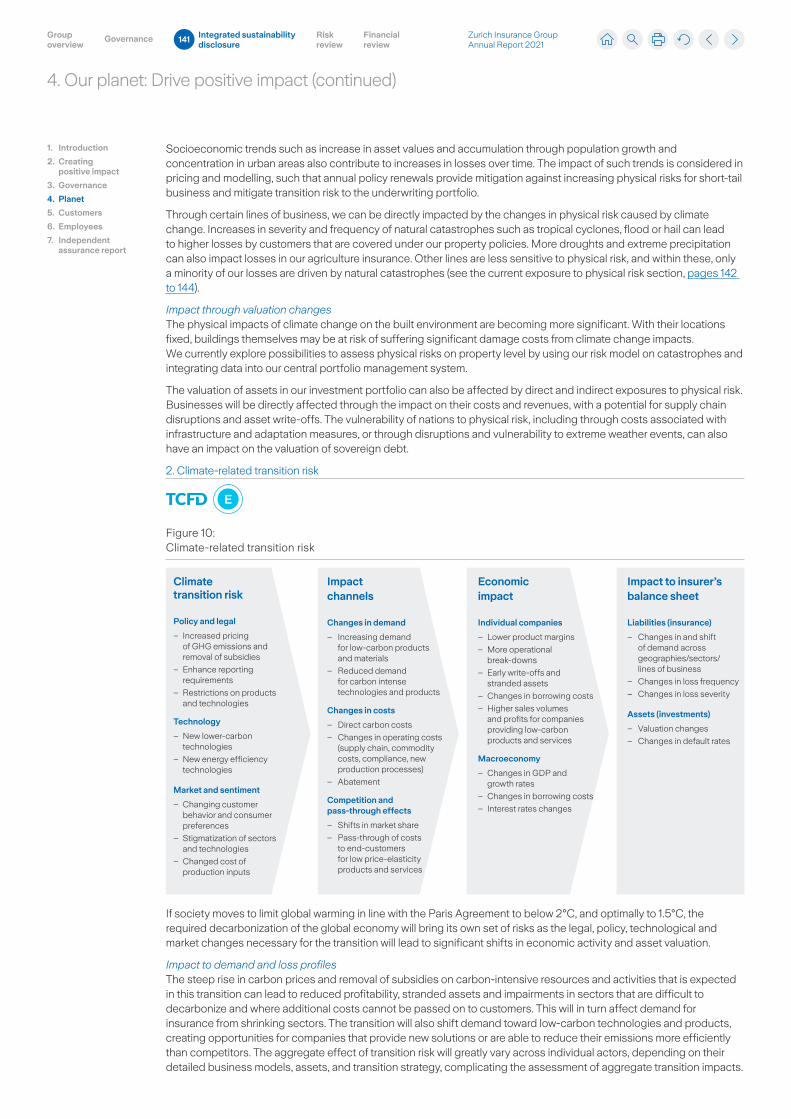
4. Our planet: Drive positive impact (continued)
Socioeconomic trends such as increase in asset values and accumulation through population growth and concentration in urban areas also contribute to increases in losses over time. The impact of such trends is considered in pricing and modelling, such that annual policy renewals provide mitigation against increasing physical risks for short-tail business and mitigate transition risk to the underwriting portfolio.
Through certain lines of business, we can be directly impacted by the changes in physical risk caused by climate change. Increases in severity and frequency of natural catastrophes such as tropical cyclones, flood or hail can lead to higher losses by customers that are covered under our property policies. More droughts and extreme precipitation can also impact losses in our agriculture insurance. Other lines are less sensitive to physical risk, and within these, only a minority of our losses are driven by natural catastrophes (see the current exposure to physical risk section, pages 142 to 144).
Impact through valuation changesThe physical impacts of climate change on the built environment are becoming more significant. With their locations fixed, buildings themselves may be at risk of suffering significant damage costs from climate change impacts. We currently explore possibilities to assess physical risks on property level by using our risk model on catastrophes and integrating data into our central portfolio management system.
The valuation of assets in our investment portfolio can also be affected by direct and indirect exposures to physical risk. Businesses will be directly affected through the impact on their costs and revenues, with a potential for supply chain disruptions and asset write-offs. The vulnerability of nations to physical risk, including through costs associated with infrastructure and adaptation measures, or through disruptions and vulnerability to extreme weather events, can also have an impact on the valuation of sovereign debt.
2. Climate-related transition risk
E
Figure 10: Climate-related transition risk
Climate transition risk
Policy and legal
– Increased pricing of GHG emissions and removal of subsidies
– Enhance reporting requirements
– Restrictions on products and technologies
Technology
– New lower-carbon technologies
– New energy efficiency technologies
Market and sentiment
– Changing customer behavior and consumer preferences
– Stigmatization of sectors and technologies
– Changed cost of production inputs
Impact channels
Changes in demand
– Increasing demand for low-carbon products and materials
– Reduced demand for carbon intense technologies and products
Changes in costs
– Direct carbon costs
– Changes in operating costs (supply chain, commodity costs, compliance, new production processes)
– Abatement
Competition and pass-through effects
– Shifts in market share
– Pass-through of costs to end-customers for low price-elasticity products and services
Economic impact
Individual companies
– Lower product margins
– More operational break-downs
– Early write-offs and stranded assets
– Changes in borrowing costs
– Higher sales volumes and profits for companies providing low-carbon products and services
Macroeconomy
– Changes in GDP and growth rates
– Changes in borrowing costs
– Interest rates changes
Impact to insurer’s balance sheet
Liabilities (insurance)
– Changes in and shift of demand across geographies/sectors/ lines of business
– Changes in loss frequency
– Changes in loss severity
Assets (investments)
– Valuation changes
– Changes in default rates
If society moves to limit global warming in line with the Paris Agreement to below 2°C, and optimally to 1.5°C, the required decarbonization of the global economy will bring its own set of risks as the legal, policy, technological and market changes necessary for the transition will lead to significant shifts in economic activity and asset valuation.
Impact to demand and loss profilesThe steep rise in carbon prices and removal of subsidies on carbon-intensive resources and activities that is expected in this transition can lead to reduced profitability, stranded assets and impairments in sectors that are difficult to decarbonize and where additional costs cannot be passed on to customers. This will in turn affect demand for insurance from shrinking sectors. The transition will also shift demand toward low-carbon technologies and products, creating opportunities for companies that provide new solutions or are able to reduce their emissions more efficiently than competitors. The aggregate effect of transition risk will greatly vary across individual actors, depending on their detailed business models, assets, and transition strategy, complicating the assessment of aggregate transition impacts.
1. Introduction
2. Creating positive impact
3. Governance
4. Planet
5. Customers
6. Employees
7. Independent assurance report
Zurich Insurance Group Annual Report 2021
Group overview
Integrated sustainability disclosure
Governance Risk review
Financial review
141
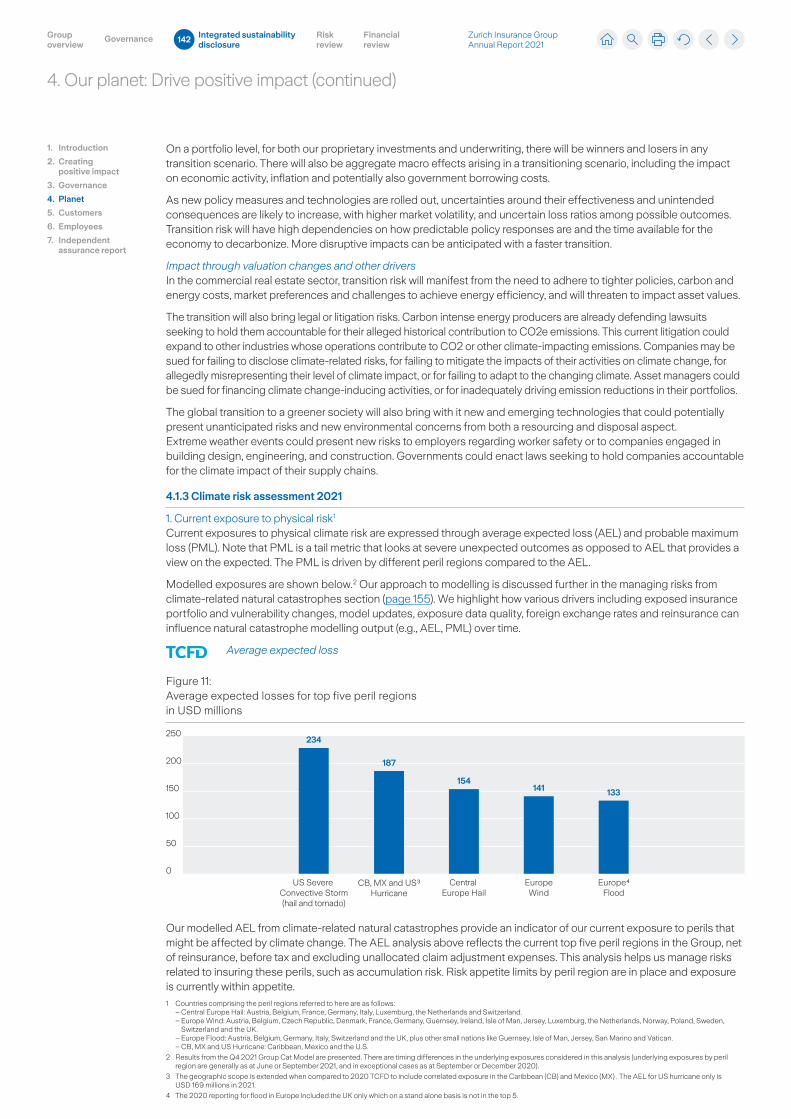
4. Our planet: Drive positive impact (continued)
1. Introduction
2. Creating positive impact
3. Governance
4. Planet
5. Customers
6. Employees
7. Independent assurance report
On a portfolio level, for both our proprietary investments and underwriting, there will be winners and losers in any transition scenario. There will also be aggregate macro effects arising in a transitioning scenario, including the impact on economic activity, inflation and potentially also government borrowing costs.
As new policy measures and technologies are rolled out, uncertainties around their effectiveness and unintended consequences are likely to increase, with higher market volatility, and uncertain loss ratios among possible outcomes. Transition risk will have high dependencies on how predictable policy responses are and the time available for the economy to decarbonize. More disruptive impacts can be anticipated with a faster transition.
Impact through valuation changes and other driversIn the commercial real estate sector, transition risk will manifest from the need to adhere to tighter policies, carbon and energy costs, market preferences and challenges to achieve energy efficiency, and will threaten to impact asset values.
The transition will also bring legal or litigation risks. Carbon intense energy producers are already defending lawsuits seeking to hold them accountable for their alleged historical contribution to CO2e emissions. This current litigation could expand to other industries whose operations contribute to CO2 or other climate-impacting emissions. Companies may be sued for failing to disclose climate-related risks, for failing to mitigate the impacts of their activities on climate change, for allegedly misrepresenting their level of climate impact, or for failing to adapt to the changing climate. Asset managers could be sued for financing climate change-inducing activities, or for inadequately driving emission reductions in their portfolios.
The global transition to a greener society will also bring with it new and emerging technologies that could potentially present unanticipated risks and new environmental concerns from both a resourcing and disposal aspect. Extreme weather events could present new risks to employers regarding worker safety or to companies engaged in building design, engineering, and construction. Governments could enact laws seeking to hold companies accountable for the climate impact of their supply chains.
4.1.3 Climate risk assessment 2021
1. Current exposure to physical risk 1
Current exposures to physical climate risk are expressed through average expected loss (AEL) and probable maximum loss (PML). Note that PML is a tail metric that looks at severe unexpected outcomes as opposed to AEL that provides a view on the expected. The PML is driven by different peril regions compared to the AEL.
Modelled exposures are shown below. 2 Our approach to modelling is discussed further in the managing risks from climate-related natural catastrophes section (page 155). We highlight how various drivers including exposed insurance portfolio and vulnerability changes, model updates, exposure data quality, foreign exchange rates and reinsurance can influence natural catastrophe modelling output (e.g., AEL, PML) over time.
Average expected loss
Figure 11: Average expected losses for top five peril regions in USD millions
250
200
150
100
50
0
141
234
154
187
133
US Severe Convective Storm(hail and tornado)
CB, MX and US³Hurricane
Central Europe Hail
EuropeWind
Europe⁴Flood
Our modelled AEL from climate-related natural catastrophes provide an indicator of our current exposure to perils that might be affected by climate change. The AEL analysis above reflects the current top five peril regions in the Group, net of reinsurance, before tax and excluding unallocated claim adjustment expenses. This analysis helps us manage risks related to insuring these perils, such as accumulation risk. Risk appetite limits by peril region are in place and exposure is currently within appetite.1 Countries comprising the peril regions referred to here are as follows:
– Central Europe Hail: Austria, Belgium, France, Germany, Italy, Luxemburg, the Netherlands and Switzerland. – Europe Wind: Austria, Belgium, Czech Republic, Denmark, France, Germany, Guernsey, Ireland, Isle of Man, Jersey, Luxemburg, the Netherlands, Norway, Poland, Sweden,
Switzerland and the UK.– Europe Flood: Austria, Belgium, Germany, Italy, Switzerland and the UK, plus other small nations like Guernsey, Isle of Man, Jersey, San Marino and Vatican.– CB, MX and US Hurricane: Caribbean, Mexico and the U.S.
2 Results from the Q4 2021 Group Cat Model are presented. There are timing differences in the underlying exposures considered in this analysis (underlying exposures by peril region are generally as at June or September 2021, and in exceptional cases as at September or December 2020).
3 The geographic scope is extended when compared to 2020 TCFD to include correlated exposure in the Caribbean (CB) and Mexico (MX) . The AEL for US hurricane only is USD 169 millions in 2021.
4 The 2020 reporting for flood in Europe included the UK only which on a stand alone basis is not in the top 5.
Zurich Insurance Group Annual Report 2021
Group overview
Integrated sustainability disclosure
Governance Risk review
Financial review
142
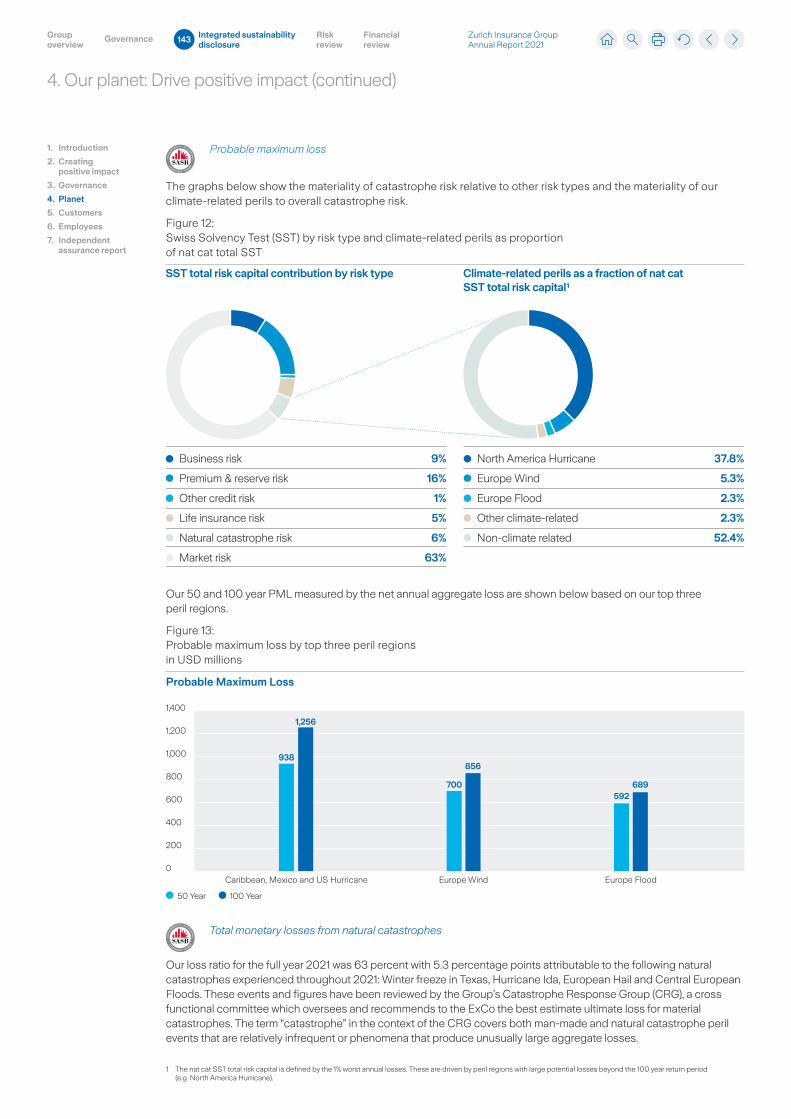
4. Our planet: Drive positive impact (continued)
1 The nat cat SST total risk capital is defined by the 1% worst annual losses. These are driven by peril regions with large potential losses beyond the 100 year return period (e.g. North America Hurricane).
Probable maximum loss
The graphs below show the materiality of catastrophe risk relative to other risk types and the materiality of our climate-related perils to overall catastrophe risk.
Figure 12: Swiss Solvency Test (SST) by risk type and climate-related perils as proportion of nat cat total SST
SST total risk capital contribution by risk type Climate-related perils as a fraction of nat catSST total risk capital¹
North America Hurricane 37.8%
Europe Wind 5.3%
Europe Flood 2.3%
Other climate-related 2.3%
Non-climate related 52.4%
Business risk 9%
Premium & reserve risk 16%
Other credit risk 1%
Life insurance risk 5%
Natural catastrophe risk 6%
Market risk 63%
Our 50 and 100 year PML measured by the net annual aggregate loss are shown below based on our top three peril regions.
Figure 13: Probable maximum loss by top three peril regions in USD millions
Probable Maximum Loss
1,400
1,200
1,000
800
600
400
200
0
938
1,256
700
856
592689
Caribbean, Mexico and US Hurricane Europe Wind Europe Flood
50 Year 100 Year
Total monetary losses from natural catastrophes
Our loss ratio for the full year 2021 was 63 percent with 5.3 percentage points attributable to the following natural catastrophes experienced throughout 2021: Winter freeze in Texas, Hurricane Ida, European Hail and Central European Floods. These events and figures have been reviewed by the Group’s Catastrophe Response Group (CRG), a cross functional committee which oversees and recommends to the ExCo the best estimate ultimate loss for material catastrophes. The term “catastrophe” in the context of the CRG covers both man-made and natural catastrophe peril events that are relatively infrequent or phenomena that produce unusually large aggregate losses.
1. Introduction
2. Creating positive impact
3. Governance
4. Planet
5. Customers
6. Employees
7. Independent assurance report
Zurich Insurance Group Annual Report 2021
Group overview
Integrated sustainability disclosure
Governance Risk review
Financial review
143
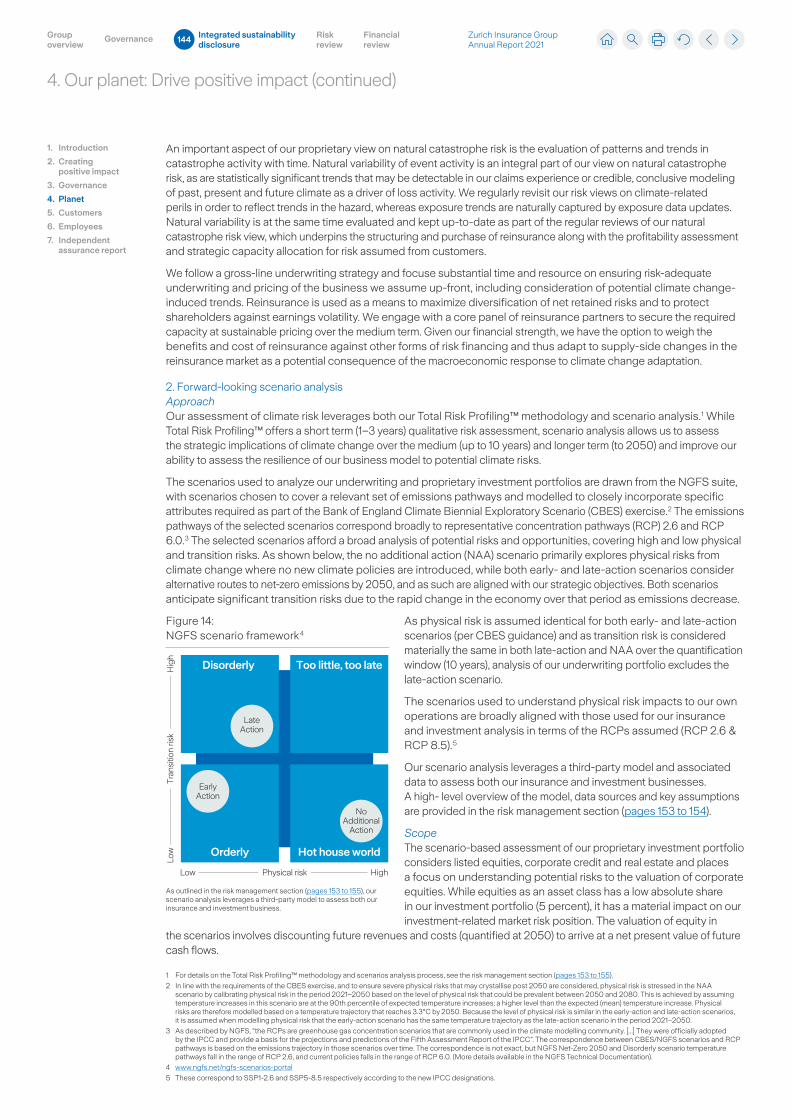
4. Our planet: Drive positive impact (continued)
An important aspect of our proprietary view on natural catastrophe risk is the evaluation of patterns and trends in catastrophe activity with time. Natural variability of event activity is an integral part of our view on natural catastrophe risk, as are statistically significant trends that may be detectable in our claims experience or credible, conclusive modeling of past, present and future climate as a driver of loss activity. We regularly revisit our risk views on climate-related perils in order to reflect trends in the hazard, whereas exposure trends are naturally captured by exposure data updates. Natural variability is at the same time evaluated and kept up-to-date as part of the regular reviews of our natural catastrophe risk view, which underpins the structuring and purchase of reinsurance along with the profitability assessment and strategic capacity allocation for risk assumed from customers.
We follow a gross-line underwriting strategy and focuse substantial time and resource on ensuring risk-adequate underwriting and pricing of the business we assume up-front, including consideration of potential climate change-induced trends. Reinsurance is used as a means to maximize diversification of net retained risks and to protect shareholders against earnings volatility. We engage with a core panel of reinsurance partners to secure the required capacity at sustainable pricing over the medium term. Given our financial strength, we have the option to weigh the benefits and cost of reinsurance against other forms of risk financing and thus adapt to supply-side changes in the reinsurance market as a potential consequence of the macroeconomic response to climate change adaptation.
2. Forward-looking scenario analysisApproachOur assessment of climate risk leverages both our Total Risk Profiling™ methodology and scenario analysis. 1 While Total Risk Profiling™ offers a short term (1–3 years) qualitative risk assessment, scenario analysis allows us to assess the strategic implications of climate change over the medium (up to 10 years) and longer term (to 2050) and improve our ability to assess the resilience of our business model to potential climate risks.
The scenarios used to analyze our underwriting and proprietary investment portfolios are drawn from the NGFS suite, with scenarios chosen to cover a relevant set of emissions pathways and modelled to closely incorporate specific attributes required as part of the Bank of England Climate Biennial Exploratory Scenario (CBES) exercise. 2 The emissions pathways of the selected scenarios correspond broadly to representative concentration pathways (RCP) 2.6 and RCP 6.0. 3 The selected scenarios afford a broad analysis of potential risks and opportunities, covering high and low physical and transition risks. As shown below, the no additional action (NAA) scenario primarily explores physical risks from climate change where no new climate policies are introduced, while both early- and late-action scenarios consider alternative routes to net-zero emissions by 2050, and as such are aligned with our strategic objectives. Both scenarios anticipate significant transition risks due to the rapid change in the economy over that period as emissions decrease.
As physical risk is assumed identical for both early- and late-action scenarios (per CBES guidance) and as transition risk is considered materially the same in both late-action and NAA over the quantification window (10 years), analysis of our underwriting portfolio excludes the late-action scenario.
The scenarios used to understand physical risk impacts to our own operations are broadly aligned with those used for our insurance and investment analysis in terms of the RCPs assumed (RCP 2.6 & RCP 8.5). 5
Our scenario analysis leverages a third-party model and associated data to assess both our insurance and investment businesses. A high- level overview of the model, data sources and key assumptions are provided in the risk management section (pages 153 to 154).
ScopeThe scenario-based assessment of our proprietary investment portfolio considers listed equities, corporate credit and real estate and places a focus on understanding potential risks to the valuation of corporate equities. While equities as an asset class has a low absolute share in our investment portfolio (5 percent), it has a material impact on our investment-related market risk position. The valuation of equity in
the scenarios involves discounting future revenues and costs (quantified at 2050) to arrive at a net present value of future cash flows.
Figure 14: NGFS scenario framework 4 Figure X: NGFS scenario framework
HighLow
Orderly
Disorderly Too little, too late
Hot house world
Late Action
Early Action
No Additional
Action
Physical risk
Hig
hLo
wTr
ansi
tion
risk
As outlined in the risk management section (pages 153 to 155), our scenario analysis leverages a third-party model to assess both our insurance and investment business.
1. Introduction
2. Creating positive impact
3. Governance
4. Planet
5. Customers
6. Employees
7. Independent assurance report
1 For details on the Total Risk Profiling™ methodology and scenarios analysis process, see the risk management section (pages 153 to 155).
2 In line with the requirements of the CBES exercise, and to ensure severe physical risks that may crystallise post 2050 are considered, physical risk is stressed in the NAA scenario by calibrating physical risk in the period 2021–2050 based on the level of physical risk that could be prevalent between 2050 and 2080. This is achieved by assuming temperature increases in this scenario are at the 90th percentile of expected temperature increases; a higher level than the expected (mean) temperature increase. Physical risks are therefore modelled based on a temperature trajectory that reaches 3.3°C by 2050. Because the level of physical risk is similar in the early-action and late-action scenarios, it is assumed when modelling physical risk that the early-action scenario has the same temperature trajectory as the late-action scenario in the period 2021–2050.
3 As described by NGFS, “the RCPs are greenhouse gas concentration scenarios that are commonly used in the climate modelling community. [...] They were officially adopted by the IPCC and provide a basis for the projections and predictions of the Fifth Assessment Report of the IPCC”. The correspondence between CBES/NGFS scenarios and RCP pathways is based on the emissions trajectory in those scenarios over time. The correspondence is not exact, but NGFS Net-Zero 2050 and Disorderly scenario temperature pathways fall in the range of RCP 2.6, and current policies falls in the range of RCP 6.0. (More details available in the NGFS Technical Documentation).
4 www.ngfs.net/ngfs-scenarios-portal
5 These correspond to SSP1-2.6 and SSP5-8.5 respectively according to the new IPCC designations.
Zurich Insurance Group Annual Report 2021
Group overview
Integrated sustainability disclosure
Governance Risk review
Financial review
144
4. Our planet: Drive positive impact (continued)
The analysis of our underwriting portfolio leverages outputs from the same third-party model as inputs to a bespoke modeling of the relationship between key climate drivers, insurance demand, and loss experience. The total book was analyzed by line of business, geographic region and industry/sector to identify a set of nine at risk ‘clusters’ with potentially high exposure to the impacts of physical and transition risks. Each cluster was then subject to a deep dive analysis to identify and translate key drivers of physical and transition risk into quantitative impacts. The resultant deep dives performed consider 49 percent of the total Property & Casualty (P&C) portfolio (USD 18 billion of USD 37 billion), mostly concentrated in North America (NA) and Europe, reflective of our underwriting footprint. Analysis of our Life book focuses on protection-related products in EMEA and Latin America (LATAM), representing 37 percent of the Life portfolio (USD 5 billion of USD 14 billion).
Quantification is performed to underpin our medium-term assessment (to 2030), an approach considered reasonable for determining strategic management actions in response to risks identified given the prevalence of annual policy renewals across a high proportion of our portfolio. Given the increasing uncertainty inherent in considering longer time periods, impacts to 2050 are analyzed qualitatively.
Two metrics are chosen to quantify scenario-based impacts of climate risk on our insurance business:
– percentage change in demand: estimated impacts on size and composition of demand for insurance products due to physical and transition climate risk drivers in each scenario, compared with a baseline of no further climate action and no further climate change relative to current day levels.
– percentage change in expected losses: estimated impacts on claims due to physical and transition climate risk drivers in each scenario, compared with a baseline of no further climate action and no further climate change relative to current day levels.
A scenario-based assessment of the potential impacts of physical climate risk on our business operations was performed, leveraging a separate modelling approach underpinned by third-party data. This assessment focused on employee locations, strategic data centers and critical supplier locations.
1. Introduction
2. Creating positive impact
3. Governance
4. Planet
5. Customers
6. Employees
7. Independent assurance report
Zurich Insurance Group Annual Report 2021
Group overview
Integrated sustainability disclosure
Governance Risk review
Financial review
145
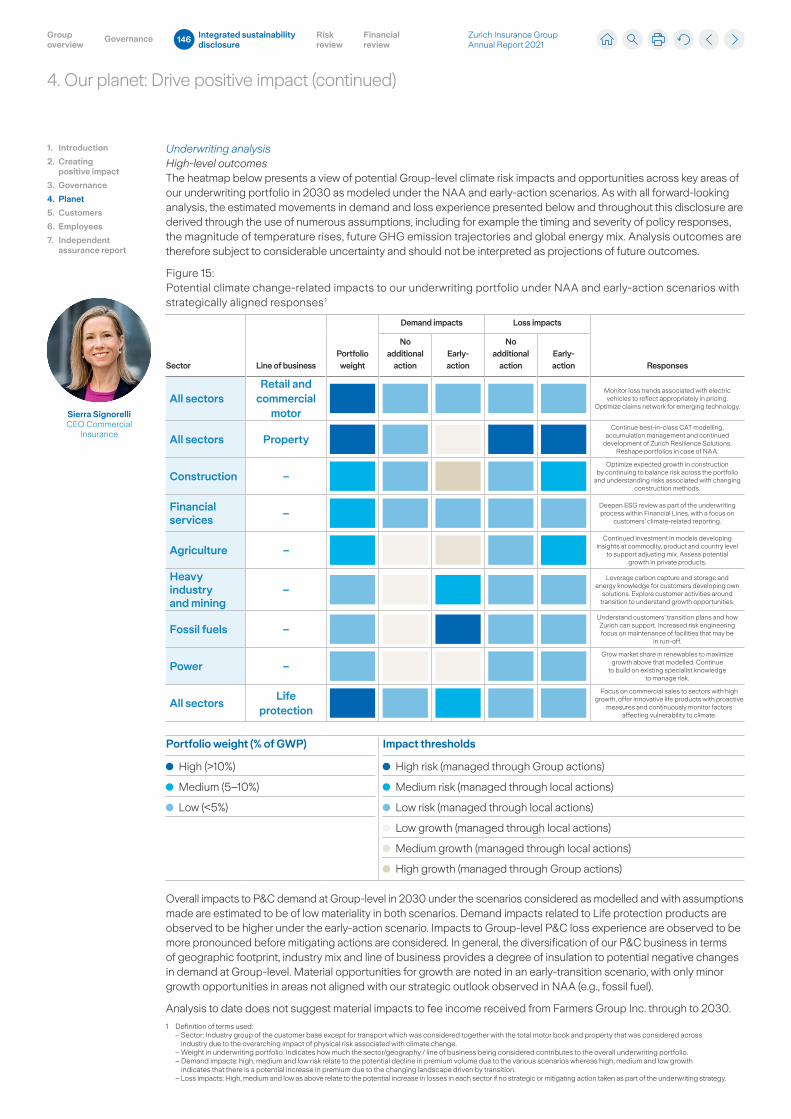
4. Our planet: Drive positive impact (continued)
Sierra SignorelliCEO Commercial
Insurance
Underwriting analysisHigh-level outcomesThe heatmap below presents a view of potential Group-level climate risk impacts and opportunities across key areas of our underwriting portfolio in 2030 as modeled under the NAA and early-action scenarios. As with all forward-looking analysis, the estimated movements in demand and loss experience presented below and throughout this disclosure are derived through the use of numerous assumptions, including for example the timing and severity of policy responses, the magnitude of temperature rises, future GHG emission trajectories and global energy mix. Analysis outcomes are therefore subject to considerable uncertainty and should not be interpreted as projections of future outcomes.
Figure 15: Potential climate change-related impacts to our underwriting portfolio under NAA and early-action scenarios with strategically aligned responses 1
Sector Line of businessPortfolio weight
Demand impacts Loss impacts
Responses
No additional
actionEarly- action
No additional
actionEarly- action
All sectorsRetail and
commercial motor
Monitor loss trends associated with electric vehicles to reflect appropriately in pricing.
Optimize claims network for emerging technology.
All sectors PropertyContinue best-in-class CAT modelling,
accumulation management and continued development of Zurich Resilience Solutions.
Reshape portfolios in case of NAA.
Construction –Optimize expected growth in construction
by continuing to balance risk across the portfolio and understanding risks associated with changing
construction methods.
Financial services
–Deepen ESG review as part of the underwriting process within Financial Lines, with a focus on
customers’ climate-related reporting.
Agriculture –Continued investment in models developing
insights at commodity, product and country level to support adjusting mix. Assess potential
growth in private products.
Heavy industry and mining
–Leverage carbon capture and storage and
energy knowledge for customers developing own solutions. Explore customer activities around
transition to understand growth opportunities.
Fossil fuels –Understand customers’ transition plans and how Zurich can support. Increased risk engineering focus on maintenance of facilities that may be
in run-off.
Power –Grow market share in renewables to maximize
growth above that modelled. Continue to build on existing specialist knowledge
to manage risk.
All sectorsLife
protection
Focus on commercial sales to sectors with high growth, offer innovative life products with proactive
measures and continuously monitor factors affecting vulnerability to climate.
Portfolio weight (% of GWP)
High (>10%)
Medium (5–10%)
Low (<5%)
Impact thresholds
High risk (managed through Group actions)
Medium risk (managed through local actions)
Low risk (managed through local actions)
Low growth (managed through local actions)
Medium growth (managed through local actions)
High growth (managed through Group actions)
Overall impacts to P&C demand at Group-level in 2030 under the scenarios considered as modelled and with assumptions made are estimated to be of low materiality in both scenarios. Demand impacts related to Life protection products are observed to be higher under the early-action scenario. Impacts to Group-level P&C loss experience are observed to be more pronounced before mitigating actions are considered. In general, the diversification of our P&C business in terms of geographic footprint, industry mix and line of business provides a degree of insulation to potential negative changes in demand at Group-level. Material opportunities for growth are noted in an early-transition scenario, with only minor growth opportunities in areas not aligned with our strategic outlook observed in NAA (e.g., fossil fuel).
Analysis to date does not suggest material impacts to fee income received from Farmers Group Inc. through to 2030.
1. Introduction
2. Creating positive impact
3. Governance
4. Planet
5. Customers
6. Employees
7. Independent assurance report
1 Definition of terms used: – Sector: Industry group of the customer base except for transport which was considered together with the total motor book and property that was considered across
industry due to the overarching impact of physical risk associated with climate change.– Weight in underwriting portfolio: Indicates how much the sector/geography / line of business being considered contributes to the overall underwriting portfolio. – Demand impacts: high, medium and low risk relate to the potential decline in premium volume due to the various scenarios whereas high, medium and low growth
indicates that there is a potential increase in premium due to the changing landscape driven by transition.– Loss impacts: High, medium and low as above relate to the potential increase in losses in each sector if no strategic or mitigating action taken as part of the underwriting strategy.
Zurich Insurance Group Annual Report 2021
Group overview
Integrated sustainability disclosure
Governance Risk review
Financial review
146
4. Our planet: Drive positive impact (continued)
1. Introduction
2. Creating positive impact
3. Governance
4. Planet
5. Customers
6. Employees
7. Independent assurance report
NAA: a closer lookNo additional climate action leads to an increased need for more sophisticated modelling as weather events increasingly impact portfolio, as well as stronger push on resilience. It also requires the focused reshaping of portfolios away from areas with high risk from physical impact of unabated climate change.
Physical risk is assumed to dominate in the NAA scenario. In line with scenario narratives, increased levels of physical risk modestly suppress economic activity up to 2030 due to impacts on productivity, reducing GDP and consequently demand for insurance. Impacts to demand quantified at the Group level are observed to be pervasive, relatively low and geographically inhomogeneous. The reduction in GDP impacts the motor book by reducing demand in commercial insurance and declining retail purchasing power leading to overall decline in vehicle sales. Retail property and life protection demand is similarly impacted due to suppressed economic activity. Impacts from insuring financial services are mostly second order, being driven by the exposure companies have to climate sensitive sectors.
Potential increase in demand in the agricultural sector is driven by the expansion of the North American biofuel sector and could represent an opportunity in this scenario but is expected to be offset by a decrease in other crop types. Other minor growth opportunities are noted in books to which we have limited exposure and in areas which are not aligned with our strategic objectives as we commit to move our underwriting portfolio toward net-zero.
The impact of climate change on physical losses in property, and to a lesser extent, construction is expected to be the main driver of increased losses under the NAA scenario. Adverse loss trends in property are reflective of expected average annual loss increase due to (extra-)tropical cyclones, floods and severe convective storms. Increase in frequency and severity of claims due to hydrological events such as heavy rain, cyclones and flooding are noted to drive trends for construction.
Early-action: a closer look The early-action scenario aligns to our commitment to a 1.5°C future, and brings greater opportunities for growth in various sectors. The well-balanced nature of our portfolio limits negative demand impacts even before strategic actions aimed at maximising growth and limiting loss exposure are considered.
The transition to low carbon is observed to have pervasive impacts on our portfolio under the early-action scenario.
Increasing explicit and implicit carbon prices will in particular affect the heavy industry, mining and the fossil fuels sectors and the expected shift away from fossil fuels will in turn benefit the power sector, as end-use sectors move energy demand toward alternate sources of power.
Within the power sector, the transition will yield a shift toward renewables. The resulting impact on demand for insurance from the power sector will be contingent on the price trajectory of renewable assets. Indeed, by 2030 the increase in demand for electricity is expected to be offset by fast decreasing renewable asset prices in some regions, meaning overall sector revenue and insurance demand will stabilize.
Significant investment in the power sector to increase renewable generation capacity and grid infrastructure will have positive spillover impacts on the construction sector, together with the growing need to renovate and rebuild to reduce building emissions.
The increasing importance of biofuels to power the clean-energy transition will potentially drive growth in the agriculture sector (above that observed in the NAA scenario), together with increased yield size due to adoption of more efficient farming practices.
Heavy industry and mining will suffer from increased carbon costs potentially resulting in reduced demand. However, increases in demand for minerals critical to the transition to a low-carbon future, particularly cobalt and copper, which are input into key low-carbon technologies like batteries and photovoltaic panels, represent an opportunity for the mining portfolio.
The cumulative effect of corporate sectoral shifts associated with an early-action scenario contribute to overall decreases in demand for Life protection products.
Increasing carbon costs will drive the uptake of new low-carbon technologies; such emerging technologies represent opportunities for insurers, but they will also come with increased risk. This applies to new technologies in renewables, carbon capture and storage for power and industry, hydrogen for industry, as well as new construction materials and techniques in the construction sector.
The transformation of the motor industry, with increasing uptake of electric or alternatively fueled vehicles, is not expected to significantly impact demand or expected losses, as the behavior of drivers of electric vehicles will align with that of standard vehicles, meaning loss profiles will in turn align.
In the agriculture sector the increased productivity of land serves as an additional loss driver for agriculture as any loss event would potentially have a greater financial impact, however this would potentially be compensated for through the pricing mechanism within the crop business.
Zurich Insurance Group Annual Report 2021
Group overview
Integrated sustainability disclosure
Governance Risk review
Financial review
147
4. Our planet: Drive positive impact (continued)
Looking to 2050 In the long term (beyond 2030), the severity and frequency of acute and chronic physical risks are expected to increase, shifting loss profiles across many lines of business including, for example, property, given the expected concentration of acute hazards around high-risk regions (e.g., coastal areas, wildfire zones). The high degree of uncertainty over how electric vehicles and autonomous technology affects the functioning of the transport system (e.g., car sharing, modal shifts, self-driving vehicles) and the resulting demand for cars will likely lead to demand and loss impacts to our motor book. Overall, shifting loss profiles could mean that certain impacts can no longer be compensated through pricing, and that some risks may become uninsurable. 1
The energy transition continues beyond 2030 and extends to other industrial sectors: this could further increase risks for sectors such as fossil fuels and create opportunities in others such as construction and power. The scale of electrical and mechanical construction projects required to deliver the low-carbon stock necessary for net-zero is a once-in- a-generation opportunity, but it will also come with new risks. Offsite construction, increasing value of materials and components and unknown risk profiles could all contribute to an increase in the number and value of claims in our property and engineering lines book.
Demand for insurance due to the growth in cropland for biofuels will continue to increase in the long term, as biofuel production picks up pace. Improvements in crop yields will remain constant after 2030 due to high initial penetration of new technologies in the sector. Demand profiles for financial services are likely to shift as exposure to climate sensitive holdings by financial institutions becomes a key driver of demand from individual companies. Liability risks are also likely to increase as stricter climate-related accountability and responsibility on financial institutions are introduced.
Proprietary investment portfolio analysisHigh-level outcomesThe scenarios, as currently modeled, indicate that climate change-related risk to asset valuation would not pose a major risk to our capital position, either at aggregate portfolio or individual asset class level, even without considering the potentially mitigating effect on liability valuation. This conclusion considers impacts across three major asset classes (listed equities, corporate credit and real estate) covering 36 percent of the investment portfolio, without considering the potential mitigating effect on liability valuation, and is made in accordance with our Total Risk Profiling™ methodology. 2 This methodology considers a major risk to be one that could have a negative impact on the Group’s economic capital position in excess of USD 5 billion, either at aggregate portfolio or individual asset class level.
In the NAA scenario, physical risk is limited over the time horizon in the analysis (2021–2050), with the exception of a few sectors and regions (e.g., agriculture and tropical regions) to which we have limited investment exposure.
In the transition risk scenarios, the aggregate impact is also low as transitioning is modelled as being relatively frictionless. Moreover, while some industries and businesses would experience a large negative impact on their market valuations in these scenarios, the aggregate risks stemming from this are limited.
Given the enormous transformation that is required, an orderly and smooth transition, such as the one described by the two 1.5°C scenarios, may be difficult to achieve, with periods of higher volatility likely. There is the potential for significant spill-over effects from the most affected sectors and regions, as well as a potentially positive – but possibly also disruptive – impact stemming from the development of new technology and productivity gains. As the scenarios highlight, there will also be large divergencies across businesses and sectors, with opportunities, as well as risk, associated with the transitioning.
Listed equities: a closer lookApplying the various scenarios and third-party model to our global listed equity portfolio in comparison with a broad market benchmark, transition risk is found to be material for businesses that operate in carbon-intensive sectors, have relatively high emissions, and are less able to absorb, reduce or pass on carbon costs. The approach also sheds light on transition opportunities, including those that stem from the greening of the economy.
In contrast to transition risk, additional physical risk relative to today’s level is estimated to be relatively limited over the time span considered, even in the NAA scenario, as it will take time before more significant additional climate change effects materialize. More severe impact will therefore be restricted to a few regions and sectors such as agriculture and tropical regions, to which we have limited investment exposure.
As shown below, the largest relative valuation effects on our global listed equity portfolio are found in the early-action scenario, where the impact is somewhat higher than in the late-action scenario, due to the discounting of future impact, and a very front-loaded, albeit gradual, rise in the carbon price. From a financial materiality perspective, only minor impacts to our listed equity portfolio are observed.
1. Introduction
2. Creating positive impact
3. Governance
4. Planet
5. Customers
6. Employees
7. Independent assurance report
1 This risk was not analysed quantitatively.
2 See the risk management section (pages 153 to 155) for further details on the Total Risk Profiling™ methodology.
Zurich Insurance Group Annual Report 2021
Group overview
Integrated sustainability disclosure
Governance Risk review
Financial review
148
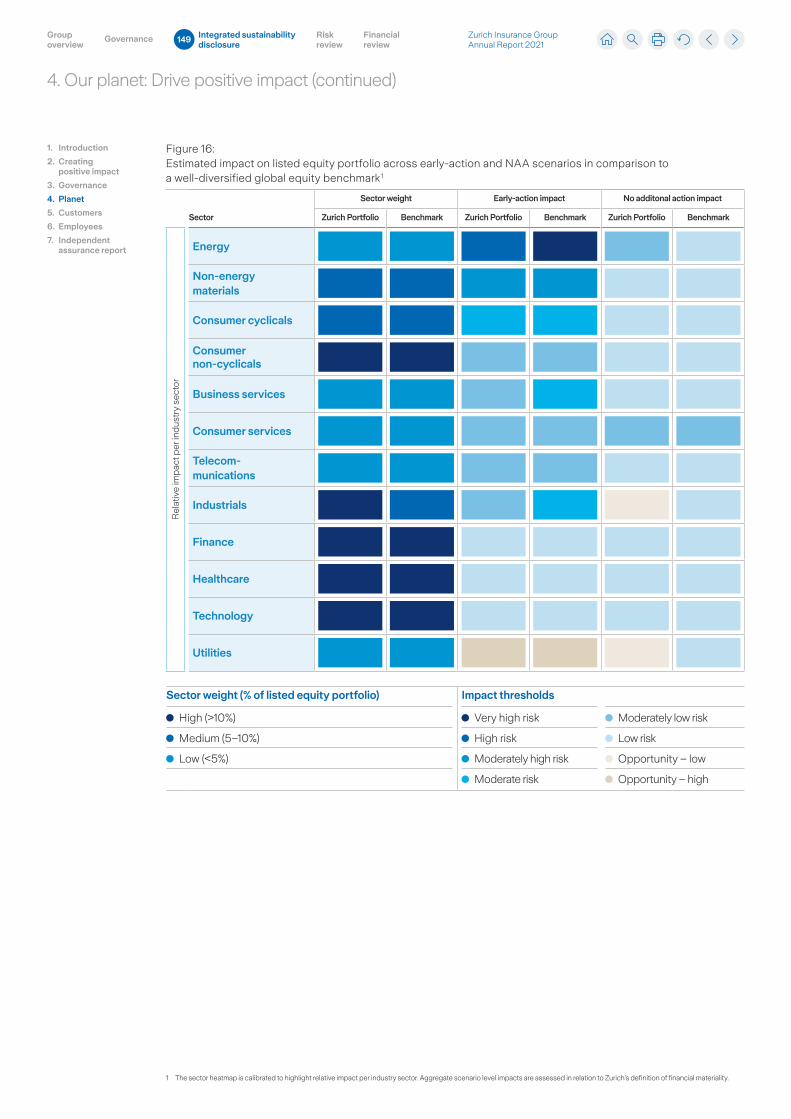
4. Our planet: Drive positive impact (continued)
Figure 16: Estimated impact on listed equity portfolio across early-action and NAA scenarios in comparison to a well-diversified global equity benchmark 1
Sector
Sector weight Early-action impact No additonal action impact
Zurich Portfolio Benchmark Zurich Portfolio Benchmark Zurich Portfolio Benchmark
Rel
ativ
e im
pac
t per
ind
ustr
y se
cto
r
Energy
Non-energy materials
Consumer cyclicals
Consumer non-cyclicals
Business services
Consumer services
Telecom- munications
Industrials
Finance
Healthcare
Technology
Utilities
Sector weight (% of listed equity portfolio)
High (>10%)
Medium (5–10%)
Low (<5%)
Impact thresholds
Very high risk Moderately low risk
High risk Low risk
Moderately high risk Opportunity – low
Moderate risk Opportunity – high
1. Introduction
2. Creating positive impact
3. Governance
4. Planet
5. Customers
6. Employees
7. Independent assurance report
1 The sector heatmap is calibrated to highlight relative impact per industry sector. Aggregate scenario level impacts are assessed in relation to Zurich’s definition of financial materiality.
Zurich Insurance Group Annual Report 2021
Group overview
Integrated sustainability disclosure
Governance Risk review
Financial review
149
4. Our planet: Drive positive impact (continued)
1 Climate data sourced from Jupiter Intelligence, ClimateScore Global v2.3, Oct. 2021.
The results demonstrate how relatively higher transition risks to our listed equity portfolio are limited to few sectors, including energy, non-energy materials, and consumer cyclicals (which includes vehicles). This result is not a reflection of the relative weighting of our book but captures the general impact on the economy and consequently market pricing in a transition risk scenario. By contrast, the services sector, which contributes the largest share to global economy activity, sees little impact. The relative resilience of services appears reasonable, but there are a few caveats to this result. For the finance sector, only direct exposure to climate-related risk is considered. Indirect exposure through the valuation of assets and financial interlinkages, which are arguably more important in a transitioning scenario, are not captured. Additionally, if rapid transitioning were to lead to energy scarcity and bottlenecks in the economy and rising costs for energy and materials, this could impact sentiment and demand and have broader effects on the economy, including on the services sector.
Overall, the impacts on our global equity portfolio are somewhat smaller than those of a broad market benchmark. Reasons contributing to the difference are differing sector weights and geographic exposure; differing security selection resulting from our long-standing practice of ESG integration as part of our responsible investment approach as well as our climate-related exclusion screens. Since 2017 we have divested from companies that derive more than 30 percent of their revenues from mining of or generate more than 30 percent of electricity from thermal coal, oil sands and oil shale.
The applied model assumes that an early-transition scenario can lead to transition opportunities and risks within industry sectors. Within the energy, utilities, and non-energy materials sectors that experience significant and negative median impacts, the characteristics of individual counterparties also have a strong impact on their exposure to climate risk. In the utilities sector, for example, some utilities experience significant decreases in value, as their high CO2e emissions intensity leaves them in a weak competitive position relative to less emissions-intensive rivals, leading to reduced profitability and market share. Other utilities with lower emissions intensity benefit from increased electricity demand, higher electricity prices, and the ability to gain market share at the expense of more emissions-intensive rivals. This variance in individual counterparty impacts also occurs in other sectors, including for example industrials and consumer cyclicals, where median impacts are small.
Overall, the applied model suggests a manageable level of risk across all scenarios and results in a valuation impact of minor materiality. Relatively more material risks are connected to sectors where these risks are relatively well understood and an increasing body of climate risk-related ESG research provides ongoing insights. We also believe that an early transition to a climate-neutral economy may provide opportunities in a wider variety of business models and industry sectors than the applied model assumes. Our portfolio continues to be well diversified across sectors and geographies and is managed with an ESG integration lens, which includes information about both climate change risks and opportunities. It is also managed to become net-zero by 2050, with the progressing decarbonization successively shielding it from the companies that are lagging behind in the transition.
The analysis supports various hypotheses: earlier-action scenarios materially increase transition risks, but in turn reduce the long-term impacts of physical risks. Even in a challenging transition risk scenario, the overall negative effect on the listed equity portfolio is moderate and concentrated in sectors that are most CO2e emission intensive, but also play the largest role in actively driving the transition. Emissions in the economy are disproportionally concentrated in a few sectors (utilities, energy, materials, agriculture, forestry and land use) and so are financed emissions in a global equity portfolio. In our listed equity portfolio, 62 percent of financed emissions in the top emitting sectors (building materials, energy, chemicals and utilities) represent only 12 percent of market value. However, sector deep dives show that there are also investment opportunities in these sectors.
Overall, the risk appears well diversified though the portfolio requires ongoing monitoring and active management as risks materialize.
Own operationsAn assessment of potential climate change impacts on our own business operations was performed in collaboration with our CCRS team.
Physical risk assessment scope and approachA scenario-based assessment of physical risk was performed leveraging a third-party model and data 1 with quantification performed for 2030 and 2050.
The assessment considered:
– Offices supporting more than 250 employees (41 office locations).
– All strategic data centers (10 locations).
– Supplier locations including those providing critical services to the Group (focusing on the known service locations) and suppliers that together comprise 75 percent of managed procurement spend (346 locations).
An assessment of physical perils was conducted to understand exposure level and criticality under two scenarios: early-action and NAA. The assessment identified the number of employees or percentage of locations (relative to the overall total) exposed to the qualitative hazard levels, for our offices, data centers, and supplier locations. The qualitative hazard levels are based upon specific physical parameters for each peril and include flood, wind, temperature, drought, hail, wildfire, precipitation, thunderstorms (lightning), and coastal flooding.
1. Introduction
2. Creating positive impact
3. Governance
4. Planet
5. Customers
6. Employees
7. Independent assurance report
Zurich Insurance Group Annual Report 2021
Group overview
Integrated sustainability disclosure
Governance Risk review
Financial review
150
4. Our planet: Drive positive impact (continued)
The consequences of some of these hazards (hail, lightning, precipitation, wildfire, wind) may affect both property (buildings, equipment, cars, etc.) and employee safety, while others are limited to employees’ wellbeing (temperature, drought). There is a potential interdependency (or combined effect) of some hazards. Increased temperature and drought may influence water availability and quality, and increase demand for electricity. Increased thunderstorm and temperature hazard may increase the likelihood of hailstorms. Roof-mounted equipment may be damaged (impact by lightning or hailstones). High wind speeds (intense rainfall may occur concurrently with windstorms) may displace (poorly anchored) roof-mounted equipment, with ensuing damage to the roofing system, resulting in ingress of water to the building interior. Poorly maintained or older roofing systems may also be damaged during a windstorm. Water penetration/ingress into the building may also occur if the roof drainage systems are poorly maintained (blockage of drains or collector pipes).
For data centers, a particular vulnerability is related to lightning strikes (thunderstorm). Loss of power or even data transmission cables may be exposed in thunderstorms if the lightning protection system (internal and external, e.g., power surge protection as well as lightning arrestors) is not effective or reliable.
Key outcomes – Current exposure levels across offices, strategic data centers and suppliers are effectively managed through existing processes.
– In the early-action scenario, precipitation and drought demonstrated increased exposure (by at least 15 and 10 percent, respectively) between 2030 and 2050 across offices, strategic data centers and supplier locations.
– In the NAA scenario, the increased risk exposure for these perils persisted, most notably leading to an at least 90 percent exposure by 2050 across offices, strategic data centers and supplier locations. In the same scenario, thunderstorm risks are at least high across 70 percent of strategic data center locations already in 2030.
– We did not observe significant variances in risk exposures levels across either of the two scenarios between 2030 and 2050.
Our existing business resilience activities focus on protecting and recovering critical business assets and resources from a wide range of existing and developing risks, including those related to the impacts of climate change. Corporate real estate and security teams are responsible to ensure offices comply with evolving building safety and security codes and requirements. Local teams are aware of risks associated with public infrastructure including risks from aging infrastructure that impact mobility and security of energy supply. To avoid situations where safety, security, and business continuity can no longer be effectively managed, office re-locations would be planned for. These activities are forward looking and iterative, taking into account the changing and evolving risk landscape. The adaptive nature of the resilience program and daily operational planning requirements mean that processes will continue to change in response to the risks resulting from climate change. We note the significant increase in distributed workforces as a result of COVID-19, something which has redefined the operational boundaries to be considered for business continuity. Further analysis is required to identify opportunities to adapt our business continuity planning to a distributed workforce.
Business resilience planning is carried over into supply chain relationship management. We are aware of and manage concentration risks where multiple suppliers are located in a common geographic area. We run annual disaster recovery tests for our strategic data centers. The test assumes complete loss of the primary data center and recovery in the secondary data center which is located out of region or country.
Transition risksGiven the low-carbon intensity of the insurance sector’s operations compared to more carbon-intensive manufacturing sectors, our focus on sustainability within our operations, and business-as-usual planning processes, we do not consider transition risk to be material for our own operations considering impacts through to 2050. Regulatory changes related, for example, to the price of carbon, are monitored and can be planned for, with impacts minimized by reducing our carbon footprint in line with our science-based targets.
Risks within our supply chain are mitigated by placing increasing scrutiny on our suppliers’ sustainability performance and commitments and setting clear expectations for suppliers in our SCOC. Overall, price increases for products and services are anticipated with carbon pricing schemes and other policy or voluntary requirements to internalize the cost of climate change.
1. Introduction
2. Creating positive impact
3. Governance
4. Planet
5. Customers
6. Employees
7. Independent assurance report
Zurich Insurance Group Annual Report 2021
Group overview
Integrated sustainability disclosure
Governance Risk review
Financial review
151
4. Our planet: Drive positive impact (continued)
Other climate risk assessment outcomesOur climate risk assessment includes consideration of both litigation and reputational risks.
Litigation risk: Though not a focus of our scenario analysis, some current litigation drivers were considered in specific deep dive areas, with none presently identified as a material risk driver in the medium term. We closely monitor developments potentially impacting litigation-related risks and drive actions to address them proactively.
Reputational risk: Given our strong ambitions to address the impacts of climate change, we acknowledge we are under higher public scrutiny and any perceived or real failure to live up to our set objectives and targets could have a particularly significant impact on our reputation. To reduce the risk of failing against our targets, we employ controls and monitor progress through the governance structures described in the corporate governance report (see pages 38 to 83). We believe strong internal focus on delivery coupled with detailed public disclosure on progress are sufficient to mitigate this risk.
3. Conclusions
Our initial scenario-based climate risk assessment has strengthened our understanding of the potential impacts of climate risk on our business. The assessment suggests our customer focused approach and diversified portfolios, supported by strong risk management practices, provide the resilience and flexibility to adapt to the impacts observed.From an underwriting perspective, we believe annual repricing will provide mitigation against short-tail business lines and mitigate transition risk in our underwriting portfolio. As the effects of climate change materialize over time, we have the possibility to ensure that our risk appetite for natural catastrophe exposure is maintained or adapted accordingly. We also purchase reinsurance to protect the company’s balance sheet from large natural catastrophe impacts and to support earnings volatility management. The reinsurance strategy is regularly reviewed to account for relevant loss trends.
We believe our multi-faceted responsible investment strategy is sufficiently flexible to adapt to the impacts highlighted by this analysis and will continue to demonstrate resilience. Our structured and disciplined investment management approach is carefully crafted to match liabilities, minimize unrewarded risks and remain stable throughout the macroeconomic cycle. The resulting portfolio is highly diversified across asset classes, sectors and geographies. On an issuer level, both transition risks and opportunities are reflected through ESG integration. Our net-zero 2050 strategy is leading to a continuous decarbonization of the portfolio, which also reduces transition risks stemming from highly carbon intensive issuers without adequate transition pathways that could mitigate their risk, while seizing opportunities created by the transition.
Highly carbon intensive pockets of our insurance and proprietary investment portfolios experience elevated exposure to transition risk, however we believe our in force thermal coal, oil sands and oil shale exclusion policy allows us to address this exposure whilst aligning with our commitment to a low carbon future.
The adaptive nature of our business resilience program mean processes will adapt to changing physical risk profiles ensuring operational resilience.
We caveat these conclusions by acknowledging the hypothetical nature of scenarios, the uncertainty inherent in scenario modelling over the timeframes considered and the somewhat conservative modelling of physical and transition risk.
As the effects of climate change gradually increase over the coming decades, adaptation efforts at the individual, company and state level will increase and provide resilience against expected impacts. This is likely to reduce societal and economic losses, however the details heavily depend on uncertain societal and technological developments. On the other hand, exceeding tipping points, such as accelerated melting of Antarctic ice sheets or permafrost thawing, could lead to large-scale discontinuities in the global climate systems and accelerate the impacts from physical climate risk. We believe our strategy of continually analyzing changing risk profiles and retaining customer focus provides the flexibility required to maintain our resilience and continue to serve our customers’ needs as climate-related risk profiles evolve.
1. Introduction
2. Creating positive impact
3. Governance
4. Planet
5. Customers
6. Employees
7. Independent assurance report
Zurich Insurance Group Annual Report 2021
Group overview
Integrated sustainability disclosure
Governance Risk review
Financial review
152
4. Our planet: Drive positive impact (continued)
Peter GigerGroup Chief Risk Officer
4.2 Governance
The organization’s governance around climate-related risks and opportunities.As outlined in the governance section of the ISD (see pages 132 to 133), sustainability, and therefore climate-related topics, are integrated into our existing governance structure.
We ensure climate change is discussed with our Board and committees where and when required. In 2021, as part of regular strategy discussions, the Board requested a discussion of how major global forces stand to shape the future of our industry over a 10- to 15-year period. Considering the relevance of climate change to our underwriting and investing activities and our own operations, this topic was covered as part of the discussion. Outcomes of scenario-based climate risk assessments are considered as part of strategy setting processes.
To accelerate our understanding of climate risk and support consistent management of our aspiration toward a climate-neutral economy, we established a cross-functional 1.5°C taskforce under the sponsorship of the Group Underwriting Officer, reporting into the SLC.
4.3 Risk management
The processes used by the organization to identify, assess and manage climate-related risks.
4.3.1 Integration of climate risk within the overall risk management framework
We consider impacts from climate change as drivers for other risks, such as market or natural catastrophe risks, that are managed within our existing risk management framework. Our approach to managing climate risk is embedded in our multi-disciplinary Group-wide risk management framework, following the same objectives of informed and disciplined risk taking. The risk management framework is based on a governance process that sets forth clear responsibilities for taking, managing, monitoring and reporting risks.
To identify, assess, manage, monitor and report risks that can have an impact on the achievement of our strategic objectives, including climate change, the Group applies a proprietary Total Risk Profiling™ methodology. This short-term assessment considers our planning horizon and allows us to classify risks according to their materiality based on the estimated severity and the likelihood of the risk materializing. Further, it supports the definition and implementation of mitigating actions. At Group level, this is an annual process, followed by regular reviews and updates by management.
Taking the long-term nature of climate change into account, we complement our Total Risk Profiling™ methodology with portfolio-level climate risk scenario analysis to provide an outlook on medium- and long-term risk developments relevant to our underwriting and investment portfolios, as outlined in the strategy section (see page 137). The details of our risk management framework are outlined in the risk review (see pages 182 to 215).
4.3.2 Portfolio-level scenario-based climate risk assessment
Assessments of the resilience of our business model to potential climate risks over longer time periods are performed using scenario analysis. To ensure a consistent Group view on potential climate change pathways, scenarios selected for this analysis will underpin all assessments Group wide, unless other local regulatory requirements exist. Assessment granularity and timeframes can be tailored to the specific requirements of the assessment.
In line with established governance, the ExCo Sponsor for Sustainability reviews the outcomes of the climate change scenario analysis exercise and reports key outcomes and agrees actions with the ExCo for Group CEO approval. The ExCo Sponsor for Sustainability reports outcomes and actions to the Board’s Governance, Nominations and Sustainability Committee (GNSC). The GNSC makes recommendations to the Board, as required.
An integrated modeling approach, leveraging a third-party model, is adopted for the analysis of our underwriting and proprietary investment portfolios to ensure, to the extent possible, the consistent use of assumptions.
To quantify impacts on Group assets, the model adopts a bottom-up approach to analyze the exposures of businesses and industries to physical and transition risk. To provide a map of vulnerabilities, it uses asset-level data on relevant risk drivers, including carbon emissions, abatement options, exposure to physical risks (including location-based exposure to acute physical risks), exposure to the greening of the economy, dependency on fossil fuels and competitiveness. The strength of this bottom-up approach is that it provides a coherent framework for analyzing climate change-related risk at the industry and corporate sector level.
1. Introduction
2. Creating positive impact
3. Governance
4. Planet
5. Customers
6. Employees
7. Independent assurance report
Zurich Insurance Group Annual Report 2021
Group overview
Integrated sustainability disclosure
Governance Risk review
Financial review
153
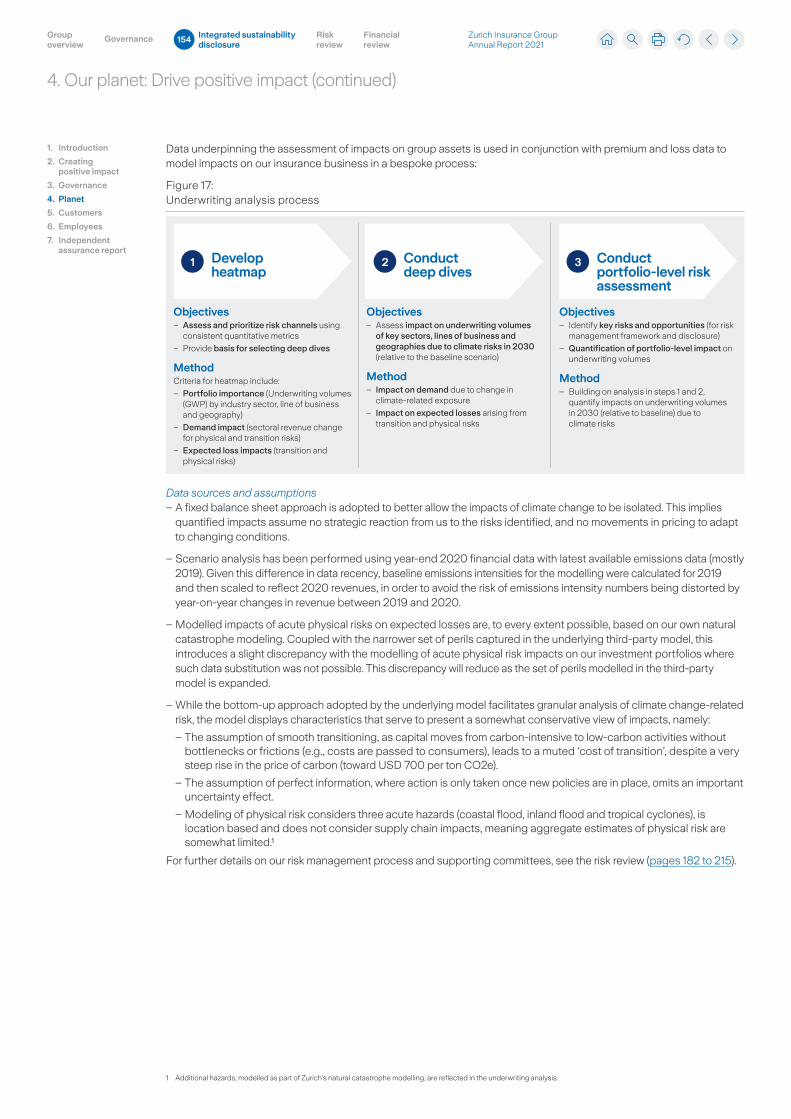
4. Our planet: Drive positive impact (continued)
Data underpinning the assessment of impacts on group assets is used in conjunction with premium and loss data to model impacts on our insurance business in a bespoke process:
Figure 17: Underwriting analysis process
Objectives – Assess and prioritize risk channels using
consistent quantitative metrics
– Provide basis for selecting deep dives
MethodCriteria for heatmap include:
– Portfolio importance (Underwriting volumes (GWP) by industry sector, line of business and geography)
– Demand impact (sectoral revenue change for physical and transition risks)
– Expected loss impacts (transition and physical risks)
Objectives – Assess impact on underwriting volumes
of key sectors, lines of business and geographies due to climate risks in 2030 (relative to the baseline scenario)
Method – Impact on demand due to change in
climate-related exposure
– Impact on expected losses arising from transition and physical risks
Objectives – Identify key risks and opportunities (for risk
management framework and disclosure)
– Quantification of portfolio-level impact on underwriting volumes
Method – Building on analysis in steps 1 and 2,
quantify impacts on underwriting volumes in 2030 (relative to baseline) due to climate risks
Develop heatmap
Conduct deep dives
Conduct portfolio-level risk assessment
321
Data sources and assumptions – A fixed balance sheet approach is adopted to better allow the impacts of climate change to be isolated. This implies quantified impacts assume no strategic reaction from us to the risks identified, and no movements in pricing to adapt to changing conditions.
– Scenario analysis has been performed using year-end 2020 financial data with latest available emissions data (mostly 2019). Given this difference in data recency, baseline emissions intensities for the modelling were calculated for 2019 and then scaled to reflect 2020 revenues, in order to avoid the risk of emissions intensity numbers being distorted by year-on-year changes in revenue between 2019 and 2020.
– Modelled impacts of acute physical risks on expected losses are, to every extent possible, based on our own natural catastrophe modeling. Coupled with the narrower set of perils captured in the underlying third-party model, this introduces a slight discrepancy with the modelling of acute physical risk impacts on our investment portfolios where such data substitution was not possible. This discrepancy will reduce as the set of perils modelled in the third-party model is expanded.
– While the bottom-up approach adopted by the underlying model facilitates granular analysis of climate change-related risk, the model displays characteristics that serve to present a somewhat conservative view of impacts, namely:
– The assumption of smooth transitioning, as capital moves from carbon-intensive to low-carbon activities without bottlenecks or frictions (e.g., costs are passed to consumers), leads to a muted ‘cost of transition’, despite a very steep rise in the price of carbon (toward USD 700 per ton CO2e).
– The assumption of perfect information, where action is only taken once new policies are in place, omits an important uncertainty effect.
– Modeling of physical risk considers three acute hazards (coastal flood, inland flood and tropical cyclones), is location based and does not consider supply chain impacts, meaning aggregate estimates of physical risk are somewhat limited.¹
For further details on our risk management process and supporting committees, see the risk review (pages 182 to 215).
1. Introduction
2. Creating positive impact
3. Governance
4. Planet
5. Customers
6. Employees
7. Independent assurance report
1 Additional hazards, modelled as part of Zurich’s natural catastrophe modelling, are reflected in the underwriting analysis.
Zurich Insurance Group Annual Report 2021
Group overview
Integrated sustainability disclosure
Governance Risk review
Financial review
154
4. Our planet: Drive positive impact (continued)
4.3.3 Managing risks from climate-related natural catastrophes
As outlined in the strategy section (see pages 140 to 141), changes in physical risks can impact us through the property business via changes in severity and probability of climate-related natural catastrophes. To manage our underwriting selection and ensure accumulations stay within intended exposure limits and assess the capital requirement due to natural catastrophes, we have established sophisticated natural catastrophe modeling capabilities. The resulting view on natural catastrophe risk also underpins profitability assessments and strategic capacity allocation and guides the type and quantity of reinsurance that we buy. To ensure global consistency, natural catastrophe exposures are modeled in the Group Risk Management function.
Third-party models provide a starting point for the assessment of natural catastrophe risk. However, they are generally built for the market average and need validation and adjustment by specialized teams to reflect the best view of risk. We have been a leader in model validation and developed our proprietary ‘Zurich View’ of risk since 2005, giving us over a decade of experience in applying a structured and quantitative approach to optimize our risk view. To arrive at the Zurich View, models are adjusted in terms of frequency, severity and event uncertainty. Adjustment factors address potential losses from non-modeled property-related exposures or secondary perils to the extent not covered by the third-party models. Every catastrophe event provides an opportunity to learn from our own claims experience and the modeling framework provides a place to capture the new insights. We constantly review and expand the scope and sophistication of our modeling and strive to improve data quality. We supplement internal know-how with external knowledge (e.g., the Advisory Council for Catastrophes). We are also a shareholder of catastrophe exposure and loss data aggregation and estimation firm PERILS AG, Switzerland and are a member of the open-source initiative Oasis Loss Modeling Framework.
Catastrophe models that are generally based on historical data would not capture potential future climate change-related shifts of extreme weather events. However, when combined with general circulation models (GCMs) they are best positioned to help also understand the risk of future climate conditions. GCMs build representations of the Earth’s physical climate systems and therefore can provide model results for climatic scenarios beyond past events. The quality of GCMs continues to evolve as scientific understanding of the earth’s climate systems increases and is also driven by progress in computing power and artificial intelligence that extrapolates insights from current modeled regions to future climate scenarios. This science is evolving, and we have strengthened our catastrophe modeling team with dedicated resources to create methodologies to integrate forward-looking aspects such as this into our modeling approach.
1. Introduction
2. Creating positive impact
3. Governance
4. Planet
5. Customers
6. Employees
7. Independent assurance report
Zurich Insurance Group Annual Report 2021
Group overview
Integrated sustainability disclosure
Governance Risk review
Financial review
155
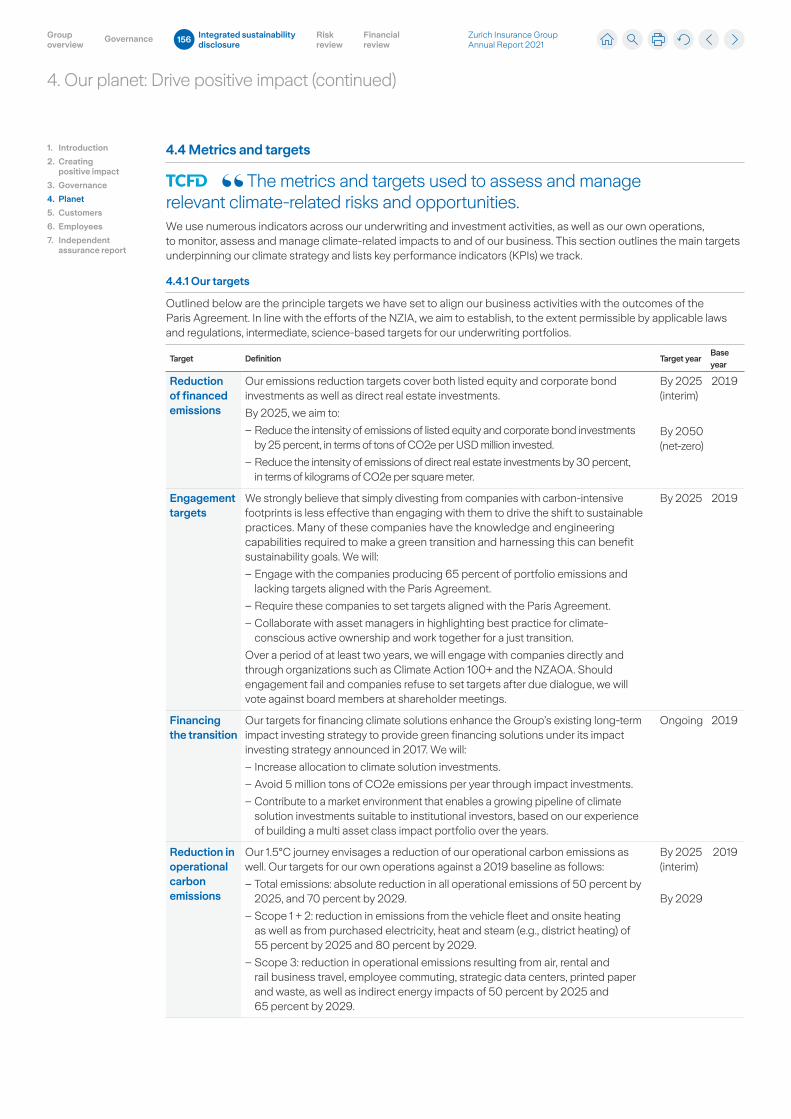
4. Our planet: Drive positive impact (continued)
4.4 Metrics and targets
The metrics and targets used to assess and manage relevant climate-related risks and opportunities.We use numerous indicators across our underwriting and investment activities, as well as our own operations, to monitor, assess and manage climate-related impacts to and of our business. This section outlines the main targets underpinning our climate strategy and lists key performance indicators (KPIs) we track.
4.4.1 Our targets
Outlined below are the principle targets we have set to align our business activities with the outcomes of the Paris Agreement. In line with the efforts of the NZIA, we aim to establish, to the extent permissible by applicable laws and regulations, intermediate, science-based targets for our underwriting portfolios.
Target Definition Target yearBase year
Reduction of financed emissions
Our emissions reduction targets cover both listed equity and corporate bond investments as well as direct real estate investments.
By 2025, we aim to:
– Reduce the intensity of emissions of listed equity and corporate bond investments by 25 percent, in terms of tons of CO2e per USD million invested.
– Reduce the intensity of emissions of direct real estate investments by 30 percent, in terms of kilograms of CO2e per square meter.
By 2025 (interim)
By 2050 (net-zero)
2019
Engagement targets
We strongly believe that simply divesting from companies with carbon-intensive footprints is less effective than engaging with them to drive the shift to sustainable practices. Many of these companies have the knowledge and engineering capabilities required to make a green transition and harnessing this can benefit sustainability goals. We will:
– Engage with the companies producing 65 percent of portfolio emissions and lacking targets aligned with the Paris Agreement.
– Require these companies to set targets aligned with the Paris Agreement.
– Collaborate with asset managers in highlighting best practice for climate-conscious active ownership and work together for a just transition.
Over a period of at least two years, we will engage with companies directly and through organizations such as Climate Action 100+ and the NZAOA. Should engagement fail and companies refuse to set targets after due dialogue, we will vote against board members at shareholder meetings.
By 2025 2019
Financing the transition
Our targets for financing climate solutions enhance the Group’s existing long-term impact investing strategy to provide green financing solutions under its impact investing strategy announced in 2017. We will:
– Increase allocation to climate solution investments.
– Avoid 5 million tons of CO2e emissions per year through impact investments.
– Contribute to a market environment that enables a growing pipeline of climate solution investments suitable to institutional investors, based on our experience of building a multi asset class impact portfolio over the years.
Ongoing 2019
Reduction in operational carbon emissions
Our 1.5°C journey envisages a reduction of our operational carbon emissions as well. Our targets for our own operations against a 2019 baseline as follows:
– Total emissions: absolute reduction in all operational emissions of 50 percent by 2025, and 70 percent by 2029.
– Scope 1 + 2: reduction in emissions from the vehicle fleet and onsite heating as well as from purchased electricity, heat and steam (e.g., district heating) of 55 percent by 2025 and 80 percent by 2029.
– Scope 3: reduction in operational emissions resulting from air, rental and rail business travel, employee commuting, strategic data centers, printed paper and waste, as well as indirect energy impacts of 50 percent by 2025 and 65 percent by 2029.
By 2025 (interim)
By 2029
2019
1. Introduction
2. Creating positive impact
3. Governance
4. Planet
5. Customers
6. Employees
7. Independent assurance report
Zurich Insurance Group Annual Report 2021
Group overview
Integrated sustainability disclosure
Governance Risk review
Financial review
156
4. Our planet: Drive positive impact (continued)
4.4.2 Our performance metrics
This section highlights our key metrics used to measure and manage climate-related risks and opportunities. They represent a combination of metrics derived from the SASB and WEF IBC standards expanded with further own metrics and in line with the guidance on metrics of the TCFD.
Underwriting
ECarbon intensity
As a founding member of the NZIA, we have agreed to report the carbon intensity of our underwriting portfolio and to independently set targets as we move toward net-zero within our underwriting
book. Ahead of an agreed methodology from the NZIA, we have already started work to understand our weighted average carbon intensity (WACI) at a Group level as well as a country level.
ERevenues from sustainable solutions
As an insurer, we aim to support our customers in the transition toward a sustainable future. To succeed, we need to fully understand the changing world around us and respond to these
emerging challenges through the lens of an underwriter. Our sustainable insurance and investment solutions enable us to formulate an answer to challenges such as climate change or changing demographics.
In order to measure the revenues from sustainable solutions, we developed an internal definition for sustainable solutions and collected data from business units for the first time in 2021.
The total revenue associated with sustainable solutionsSustainable solutions refer to insurance products, add-on coverages, investment products and advisory services that are designed or adapted to support activities that generate positive environmental or social
impacts and contribute to mitigating climate risks.
In the table, we share our definition of revenues from sustainable solutions of three categories (environmental, social and investment) and provide details for each category.
Table 3: Internal definition of revenues from sustainable solutions
Revenues from sustainable environmental solutions
Solutions related to technologies and/or activities that have an impact on reducing greenhouse gases, preserve or enhance biodiversity as well as enable the responsible use of natural resources. These solutions aim to mitigate and support resilience against the adverse impact of environmental related risks on our customers.
Examples include:
– Insurance coverage for electric vehicles.
– Insurance coverage for carbon mitigation solutions.
– Risk prevention services that contribute to more customer awareness and resilience to the adverse impacts of climate change e.g., flood resilience.
1. Introduction
2. Creating positive impact
3. Governance
4. Planet
5. Customers
6. Employees
7. Independent assurance report
Zurich Insurance Group Annual Report 2021
Group overview
Integrated sustainability disclosure
Governance Risk review
Financial review
157
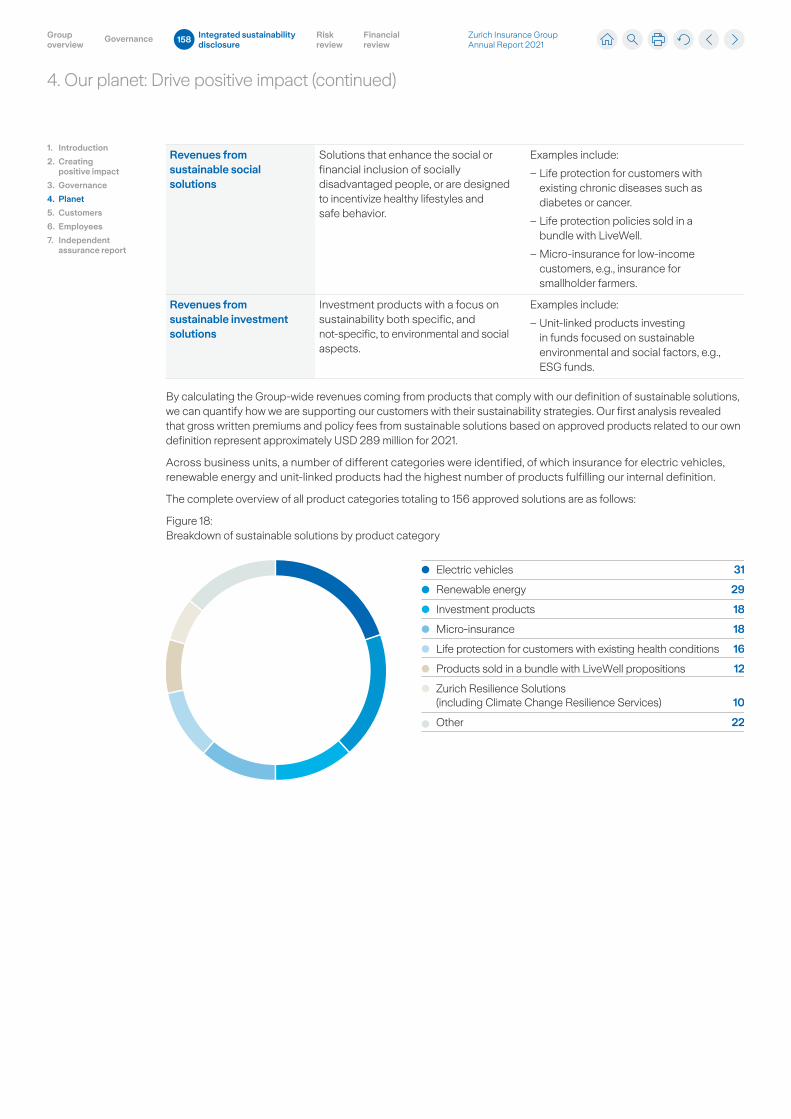
4. Our planet: Drive positive impact (continued)
Revenues from sustainable social solutions
Solutions that enhance the social or financial inclusion of socially disadvantaged people, or are designed to incentivize healthy lifestyles and safe behavior.
Examples include:
– Life protection for customers with existing chronic diseases such as diabetes or cancer.
– Life protection policies sold in a bundle with LiveWell.
– Micro-insurance for low-income customers, e.g., insurance for smallholder farmers.
Revenues from sustainable investment solutions
Investment products with a focus on sustainability both specific, and not-specific, to environmental and social aspects.
Examples include:
– Unit-linked products investing in funds focused on sustainable environmental and social factors, e.g., ESG funds.
By calculating the Group-wide revenues coming from products that comply with our definition of sustainable solutions, we can quantify how we are supporting our customers with their sustainability strategies. Our first analysis revealed that gross written premiums and policy fees from sustainable solutions based on approved products related to our own definition represent approximately USD 289 million for 2021.
Across business units, a number of different categories were identified, of which insurance for electric vehicles, renewable energy and unit-linked products had the highest number of products fulfilling our internal definition.
The complete overview of all product categories totaling to 156 approved solutions are as follows:
Figure 18: Breakdown of sustainable solutions by product category
Electric vehicles 31
Renewable energy 29
Investment products 18
Micro-insurance 18
Life protection for customers with existing health conditions 16
Products sold in a bundle with LiveWell propositions 12
Zurich Resilience Solutions (including Climate Change Resilience Services) 10
Other 22
1. Introduction
2. Creating positive impact
3. Governance
4. Planet
5. Customers
6. Employees
7. Independent assurance report
Zurich Insurance Group Annual Report 2021
Group overview
Integrated sustainability disclosure
Governance Risk review
Financial review
158
4. Our planet: Drive positive impact (continued)
Revenues related to energy efficiency and carbon technology¹More specifically, we also assessed products related to energy efficiency and low-carbon technology, separately priced, which amount to USD 121 million of gross written premiums and policy fees.
Description of product incentivizing sustainable behaviorsSeveral products incentivize health, safety, and/or environmentally responsible actions and/or behavior. Please find below a set of examples.
Supporting climate informed practices Our ‘Build Back Better’ program is one of the responsible initiatives that can be found in a range of policy clauses. For example, we offer retail customers in Europe a 20 percent payback above the cost of a property restoration after damage when environmentally friendly materials are used. In North America, we cover additional costs that might occur when choosing environmentally friendly alternatives to rebuild property, thereby helping customers rebuild their property after damage in compliance with existing or emerging green standards.
We have also launched several initiatives for our commercial customers. For example, as part of our CCRS, we help businesses to identify, assess, mitigate and adapt to current and future climate change risks.
As well as incentivizing green building and resource-efficient investment, we encourage green travel. For example, we provide retail customers in Italy with a 50 percent discount on their third party liability car insurance if the vehicle is fully electric. In Switzerland, customers receive a discount on their insurance if the vehicle uses alternative fuels. In addition, we developed a product called ‘AutoSense’ that incentivizes safe and ecological driving and allows customers to compensate for their CO2 emissions.
Incentivizing healthy behaviorIn 2020, we developed our LiveWell program with a mission to inspire positive change and provide services and solutions that encourage our customers to make positive lifestyle choices. In 2021, LiveWell added capabilities around lifestyle tracking, challenges, screenings and telemedicine. To date, we are supporting one million contracted lives (lives in scope as per the customer contracts) on a daily basis to live a healthy lifestyle. LiveWell has achieved a strong NPS score in its first year. We will continue to measure our progress to understand how to best serve our customers and improve their daily experiences.
1. Introduction
2. Creating positive impact
3. Governance
4. Planet
5. Customers
6. Employees
7. Independent assurance report
1 Revenues capture gross written premiums and policy fees.
Zurich Insurance Group Annual Report 2021
Group overview
Integrated sustainability disclosure
Governance Risk review
Financial review
159
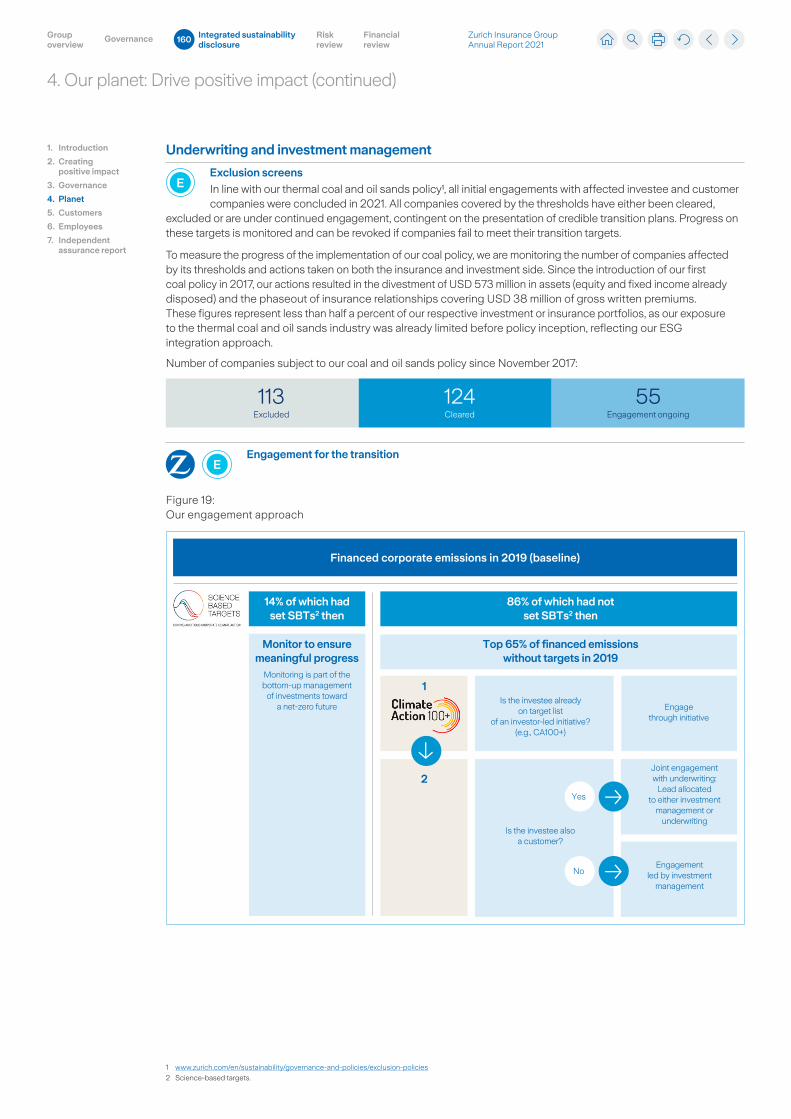
4. Our planet: Drive positive impact (continued)
Underwriting and investment management
EExclusion screens
In line with our thermal coal and oil sands policy¹, all initial engagements with affected investee and customer companies were concluded in 2021. All companies covered by the thresholds have either been cleared,
excluded or are under continued engagement, contingent on the presentation of credible transition plans. Progress on these targets is monitored and can be revoked if companies fail to meet their transition targets.
To measure the progress of the implementation of our coal policy, we are monitoring the number of companies affected by its thresholds and actions taken on both the insurance and investment side. Since the introduction of our first coal policy in 2017, our actions resulted in the divestment of USD 573 million in assets (equity and fixed income already disposed) and the phaseout of insurance relationships covering USD 38 million of gross written premiums. These figures represent less than half a percent of our respective investment or insurance portfolios, as our exposure to the thermal coal and oil sands industry was already limited before policy inception, reflecting our ESG integration approach.
113Excluded
124Cleared
55Engagement ongoing
Number of companies subject to our coal and oil sands policy since November 2017:
EEngagement for the transition
Figure 19: Our engagement approach
Financed corporate emissions in 2019 (baseline)
14% of which had set SBTs2 then
Engage through initiative
Is the investee already on target list
of an investor-led initiative? (e.g., CA100+)
1
Is the investee also a customer?
Joint engagement with underwriting:
Lead allocated to either investment
management or underwriting
Engagement led by investment
management
Monitor to ensure meaningful progress
Monitoring is part of the bottom-up management
of investments toward a net-zero future
86% of which had not set SBTs2 then
Top 65% of financed emissions without targets in 2019
2
Yes
No
1. Introduction
2. Creating positive impact
3. Governance
4. Planet
5. Customers
6. Employees
7. Independent assurance report
1 www.zurich.com/en/sustainability/governance-and-policies/exclusion-policies
2 Science-based targets.
Zurich Insurance Group Annual Report 2021
Group overview
Integrated sustainability disclosure
Governance Risk review
Financial review
160
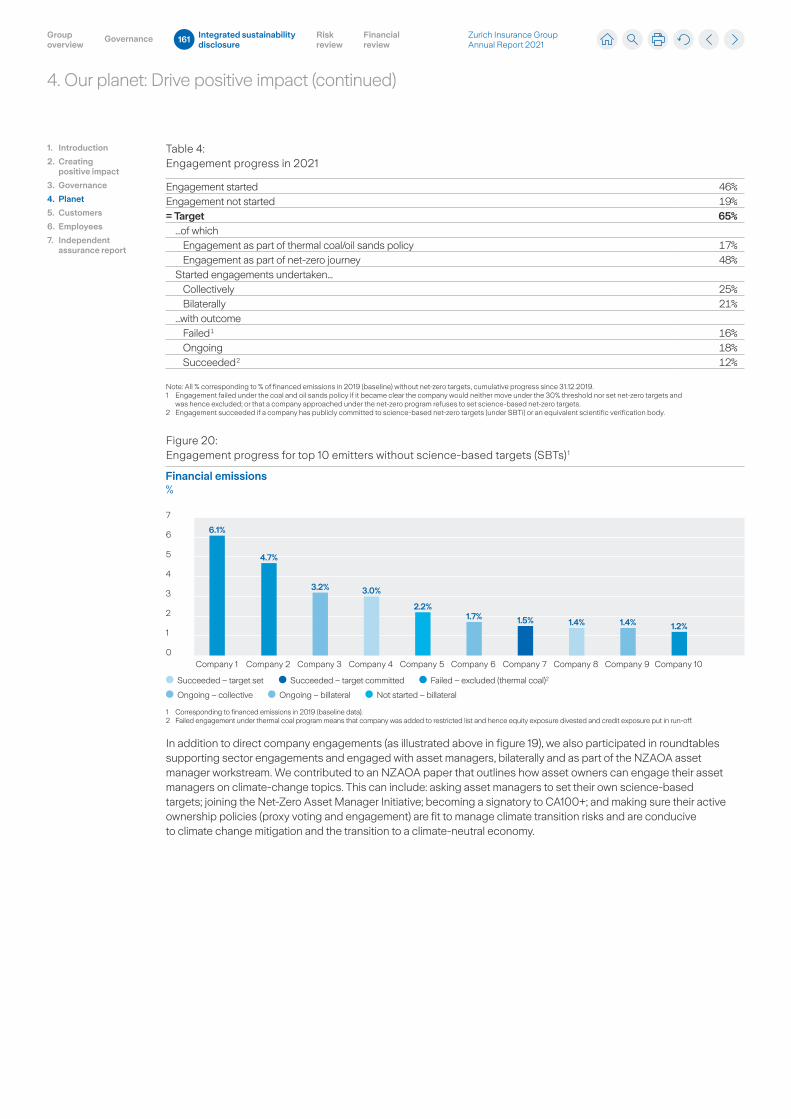
4. Our planet: Drive positive impact (continued)
Table 4: Engagement progress in 2021
Engagement started 46%Engagement not started 19%= Target 65%
...of whichEngagement as part of thermal coal/oil sands policy 17%Engagement as part of net-zero journey 48%
Started engagements undertaken...Collectively 25%Bilaterally 21%
...with outcomeFailed 1 16%Ongoing 18%Succeeded 2 12%
Note: All % corresponding to % of financed emissions in 2019 (baseline) without net-zero targets, cumulative progress since 31.12.2019. 1 Engagement failed under the coal and oil sands policy if it became clear the company would neither move under the 30% threshold nor set net-zero targets and
was hence excluded; or that a company approached under the net-zero program refuses to set science-based net-zero targets. 2 Engagement succeeded if a company has publicly committed to science-based net-zero targets (under SBTi) or an equivalent scientific verification body.
Figure 20: Engagement progress for top 10 emitters without science-based targets (SBTs) 1
Financial emissions%
7
6
5
4
3
2
1
0
6.1%
4.7%
3.2% 3.0%
2.2%
1.5% 1.4% 1.4% 1.2%1.7%
Company 1 Company 2 Company 3 Company 4 Company 5 Company 6 Company 7 Company 8 Company 9 Company 10
Succeeded – target set
1 Corresponding to financed emissions in 2019 (baseline data).2 Failed engagement under thermal coal program means that company was added to restricted list and hence equity exposure divested and credit exposure put in run-off.
Succeeded – target committed Failed – excluded (thermal coal)2
Ongoing – collective Ongoing – billateral Not started – billateral
In addition to direct company engagements (as illustrated above in figure 19), we also participated in roundtables supporting sector engagements and engaged with asset managers, bilaterally and as part of the NZAOA asset manager workstream. We contributed to an NZAOA paper that outlines how asset owners can engage their asset managers on climate-change topics. This can include: asking asset managers to set their own science-based targets; joining the Net-Zero Asset Manager Initiative; becoming a signatory to CA100+; and making sure their active ownership policies (proxy voting and engagement) are fit to manage climate transition risks and are conducive to climate change mitigation and the transition to a climate-neutral economy.
1. Introduction
2. Creating positive impact
3. Governance
4. Planet
5. Customers
6. Employees
7. Independent assurance report
Zurich Insurance Group Annual Report 2021
Group overview
Integrated sustainability disclosure
Governance Risk review
Financial review
161
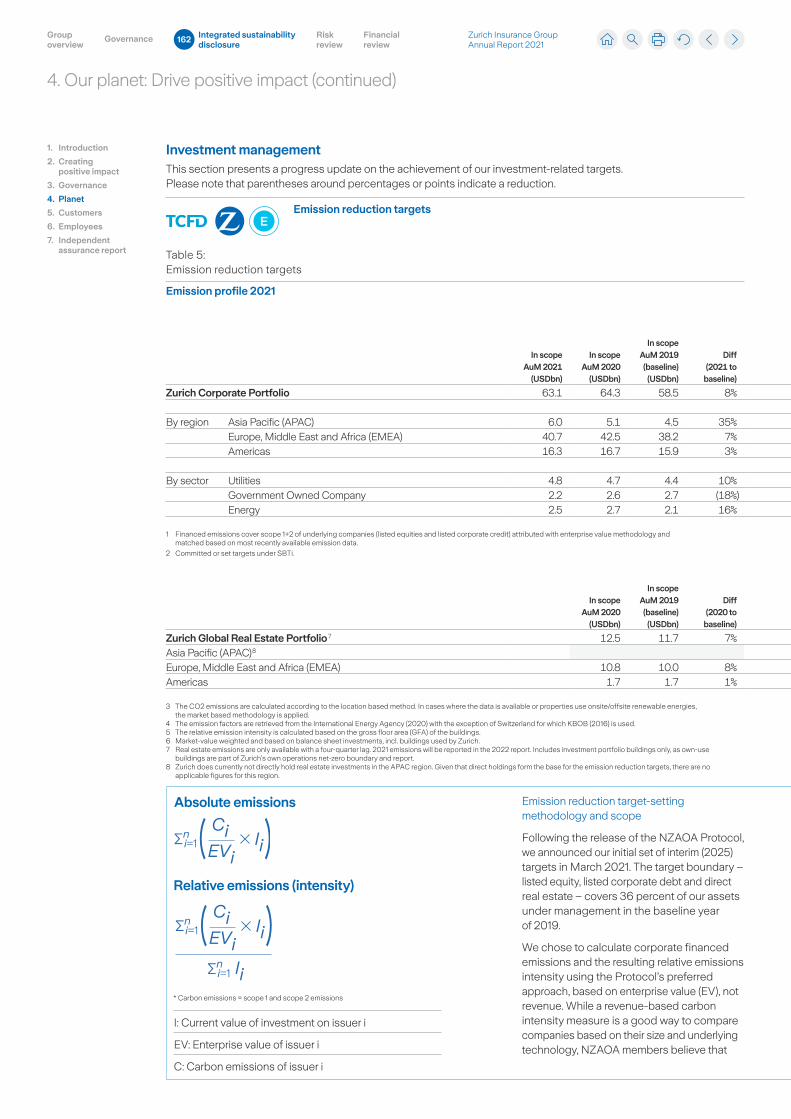
4. Our planet: Drive positive impact (continued)
Absolute emissions
∑ni=1
Ci IiEVi
∑ni=1
∑ni=1
Ci Ii
Ii
EVi
∑ni=1
Ci IiEVi
∑ni=1
∑ni=1
Ci Ii
Ii
EVi
Investment managementThis section presents a progress update on the achievement of our investment-related targets. Please note that parentheses around percentages or points indicate a reduction.
EEmission reduction targets
Table 5: Emission reduction targets
Emission profile 2021
In scope AuM 2021
(USDbn)
In scope AuM 2020
(USDbn)
In scope AuM 2019 (baseline)
(USDbn)
Diff (2021 to
baseline)
Absolute financed
emissions 2021
(m t CO2e) 1
Absolute financed
emissions 2020
(m t CO2e)
Absolute financed
emissions 2019
(baseline) (m t CO2e)
Diff (2021 to
baseline)
Relative emission intensity
2021 (tCO2e/1m
MV)
Relative emission intensity
2020 (tCO2e/1m
MV)
Relative emission intensity
2019 (tCO2e/1m
MV) (baseline)
Diff (2021 to
baseline) Target
% of financed
emissions with SBT
2021 2
% of financed
emissions with SBT
2020
% of financed
emissions with SBT
2019 (baseline)
Diff (2021 to
baseline)
% of financed
emissions in run-off
under coal/oil sands
policy 2021
Zurich Corporate Portfolio 63.1 64.3 58.5 8% 6.8 8.3 7.9 (15%) 108 128 136 (21%) (25%) 19.9 19.5 14.3 39% 12.7
By region Asia Pacific (APAC) 6.0 5.1 4.5 35% 1.8 1.8 1.8 (2%) 292 355 400 (27%) 1.2 1.6 1.2 6% 44.7Europe, Middle East and Africa (EMEA) 40.7 42.5 38.2 7% 3.9 4.8 4.5 (13%) 95 113 118 (19%) 32.4 31.3 22.9 41% 0.8Americas 16.3 16.7 15.9 3% 1.1 1.6 1.7 (32%) 70 98 105 (34%) 6.1 4.3 5.3 16% 3.8
By sector Utilities 4.8 4.7 4.4 10% 2.9 2.7 2.7 7% 600 565 616 (2%) 16.7 17.9 14.4 16% 28.5Government Owned Company 2.2 2.6 2.7 (18%) 0.8 1.3 1.4 (42%) 375 498 529 (29%) 26.5 24.3 5.4 388% 2.1Energy 2.5 2.7 2.1 16% 0.8 1.0 0.7 18% 310 384 305 2% – – – – 1.1
1 Financed emissions cover scope 1+2 of underlying companies (listed equities and listed corporate credit) attributed with enterprise value methodology and matched based on most recently available emission data.
2 Committed or set targets under SBTi.
In scope AuM 2020
(USDbn)
In scope AuM 2019 (baseline)
(USDbn)
Diff (2020 to
baseline)
Absolute emissions
2020 (tCO2e) 3, 4
Absolute Emissions
2019 (baseline)
(tCO2e)
Diff (2020 to
baseline)
Relative emission intensity 2020 (kg
CO2e/sqm) 5
Relative emission intensity 2019 (kg
CO2e/sqm) (baseline)
Diff (2020 to
baseline) Target
% of green certified
buildings 2021 6
Zurich Global Real Estate Portfolio 7 12.5 11.7 7% 50,669 53,181 (5%) 20.4 21.6 (6%) (30%) 19Asia Pacific (APAC) 8
Europe, Middle East and Africa (EMEA) 10.8 10.0 8% 37,244 41,153 (9%) 21.3 22.9 (7%) 20Americas 1.7 1.7 1% 13,425 12,028 12% 18.1 18.0 1% 19
3 The CO2 emissions are calculated according to the location based method. In cases where the data is available or properties use onsite/offsite renewable energies, the market based methodology is applied.
4 The emission factors are retrieved from the International Energy Agency (2020) with the exception of Switzerland for which KBOB (2016) is used.5 The relative emission intensity is calculated based on the gross floor area (GFA) of the buildings.6 Market-value weighted and based on balance sheet investments, incl. buildings used by Zurich.7 Real estate emissions are only available with a four-quarter lag. 2021 emissions will be reported in the 2022 report. Includes investment portfolio buildings only, as own-use
buildings are part of Zurich’s own operations net-zero boundary and report. 8 Zurich does currently not directly hold real estate investments in the APAC region. Given that direct holdings form the base for the emission reduction targets, there are no
applicable figures for this region.
1. Introduction
2. Creating positive impact
3. Governance
4. Planet
5. Customers
6. Employees
7. Independent assurance report
Emission reduction target-setting methodology and scope
Following the release of the NZAOA Protocol, we announced our initial set of interim (2025) targets in March 2021. The target boundary – listed equity, listed corporate debt and direct real estate – covers 36 percent of our assets under management in the baseline year of 2019.
We chose to calculate corporate financed emissions and the resulting relative emissions intensity using the Protocol’s preferred approach, based on enterprise value (EV), not revenue. While a revenue-based carbon intensity measure is a good way to compare companies based on their size and underlying technology, NZAOA members believe that
Relative emissions (intensity)
I: Current value of investment on issuer i
EV: Enterprise value of issuer i
C: Carbon emissions of issuer i
* Carbon emissions = scope 1 and scope 2 emissions
Zurich Insurance Group Annual Report 2021
Group overview
Integrated sustainability disclosure
Governance Risk review
Financial review
162
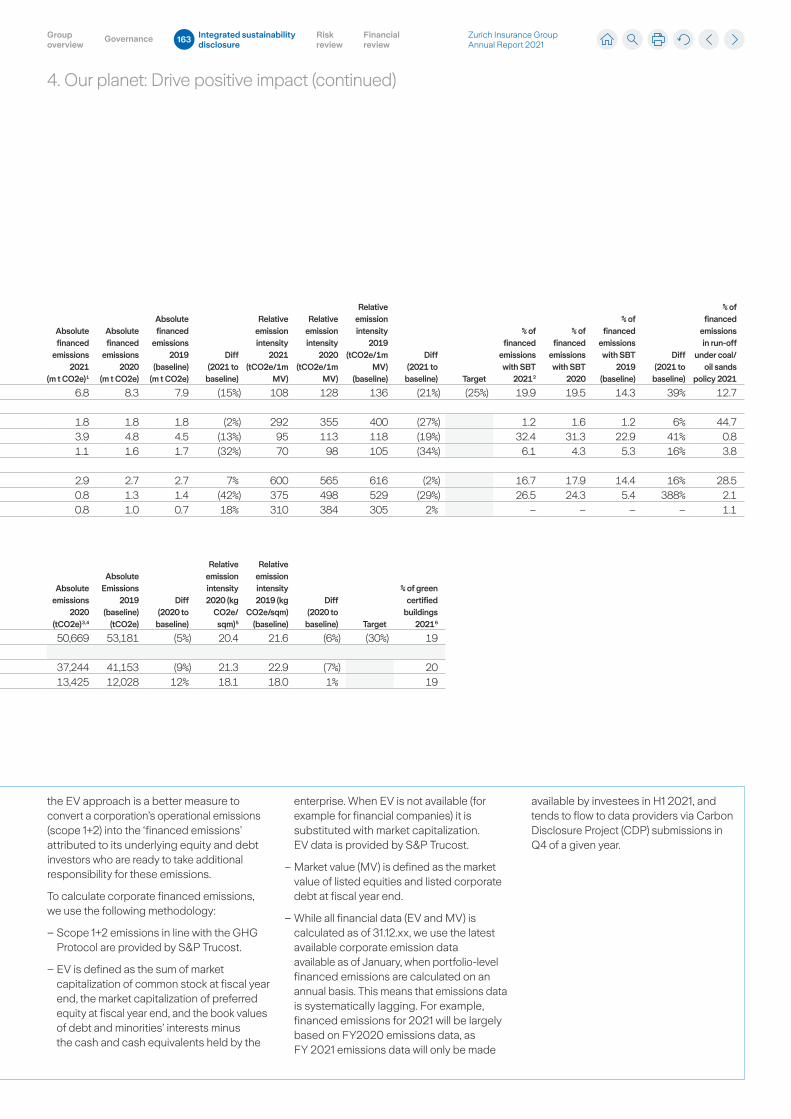
4. Our planet: Drive positive impact (continued)
Absolute emissions
Investment managementThis section presents a progress update on the achievement of our investment-related targets. Please note that parentheses around percentages or points indicate a reduction.
EEmission reduction targets
Table 5: Emission reduction targets
Emission profile 2021
In scope AuM 2021
(USDbn)
In scope AuM 2020
(USDbn)
In scope AuM 2019 (baseline)
(USDbn)
Diff (2021 to
baseline)
Absolute financed
emissions 2021
(m t CO2e) 1
Absolute financed
emissions 2020
(m t CO2e)
Absolute financed
emissions 2019
(baseline) (m t CO2e)
Diff (2021 to
baseline)
Relative emission intensity
2021 (tCO2e/1m
MV)
Relative emission intensity
2020 (tCO2e/1m
MV)
Relative emission intensity
2019 (tCO2e/1m
MV) (baseline)
Diff (2021 to
baseline) Target
% of financed
emissions with SBT
2021 2
% of financed
emissions with SBT
2020
% of financed
emissions with SBT
2019 (baseline)
Diff (2021 to
baseline)
% of financed
emissions in run-off
under coal/oil sands
policy 2021
Zurich Corporate Portfolio 63.1 64.3 58.5 8% 6.8 8.3 7.9 (15%) 108 128 136 (21%) (25%) 19.9 19.5 14.3 39% 12.7
By region Asia Pacific (APAC) 6.0 5.1 4.5 35% 1.8 1.8 1.8 (2%) 292 355 400 (27%) 1.2 1.6 1.2 6% 44.7Europe, Middle East and Africa (EMEA) 40.7 42.5 38.2 7% 3.9 4.8 4.5 (13%) 95 113 118 (19%) 32.4 31.3 22.9 41% 0.8Americas 16.3 16.7 15.9 3% 1.1 1.6 1.7 (32%) 70 98 105 (34%) 6.1 4.3 5.3 16% 3.8
By sector Utilities 4.8 4.7 4.4 10% 2.9 2.7 2.7 7% 600 565 616 (2%) 16.7 17.9 14.4 16% 28.5Government Owned Company 2.2 2.6 2.7 (18%) 0.8 1.3 1.4 (42%) 375 498 529 (29%) 26.5 24.3 5.4 388% 2.1Energy 2.5 2.7 2.1 16% 0.8 1.0 0.7 18% 310 384 305 2% – – – – 1.1
1 Financed emissions cover scope 1+2 of underlying companies (listed equities and listed corporate credit) attributed with enterprise value methodology and matched based on most recently available emission data.
2 Committed or set targets under SBTi.
In scope AuM 2020
(USDbn)
In scope AuM 2019 (baseline)
(USDbn)
Diff (2020 to
baseline)
Absolute emissions
2020 (tCO2e) 3, 4
Absolute Emissions
2019 (baseline)
(tCO2e)
Diff (2020 to
baseline)
Relative emission intensity 2020 (kg
CO2e/sqm) 5
Relative emission intensity 2019 (kg
CO2e/sqm) (baseline)
Diff (2020 to
baseline) Target
% of green certified
buildings 2021 6
Zurich Global Real Estate Portfolio 7 12.5 11.7 7% 50,669 53,181 (5%) 20.4 21.6 (6%) (30%) 19Asia Pacific (APAC) 8
Europe, Middle East and Africa (EMEA) 10.8 10.0 8% 37,244 41,153 (9%) 21.3 22.9 (7%) 20Americas 1.7 1.7 1% 13,425 12,028 12% 18.1 18.0 1% 19
3 The CO2 emissions are calculated according to the location based method. In cases where the data is available or properties use onsite/offsite renewable energies, the market based methodology is applied.
4 The emission factors are retrieved from the International Energy Agency (2020) with the exception of Switzerland for which KBOB (2016) is used.5 The relative emission intensity is calculated based on the gross floor area (GFA) of the buildings.6 Market-value weighted and based on balance sheet investments, incl. buildings used by Zurich.7 Real estate emissions are only available with a four-quarter lag. 2021 emissions will be reported in the 2022 report. Includes investment portfolio buildings only, as own-use
buildings are part of Zurich’s own operations net-zero boundary and report. 8 Zurich does currently not directly hold real estate investments in the APAC region. Given that direct holdings form the base for the emission reduction targets, there are no
applicable figures for this region.
the EV approach is a better measure to convert a corporation’s operational emissions (scope 1+2) into the ‘financed emissions’ attributed to its underlying equity and debt investors who are ready to take additional responsibility for these emissions.
To calculate corporate financed emissions, we use the following methodology:
– Scope 1+2 emissions in line with the GHG Protocol are provided by S&P Trucost.
– EV is defined as the sum of market capitalization of common stock at fiscal year end, the market capitalization of preferred equity at fiscal year end, and the book values of debt and minorities’ interests minus the cash and cash equivalents held by the
enterprise. When EV is not available (for example for financial companies) it is substituted with market capitalization. EV data is provided by S&P Trucost.
– Market value (MV) is defined as the market value of listed equities and listed corporate debt at fiscal year end.
– While all financial data (EV and MV) is calculated as of 31.12.xx, we use the latest available corporate emission data available as of January, when portfolio-level financed emissions are calculated on an annual basis. This means that emissions data is systematically lagging. For example, financed emissions for 2021 will be largely based on FY2020 emissions data, as FY 2021 emissions data will only be made
available by investees in H1 2021, and tends to flow to data providers via Carbon Disclosure Project (CDP) submissions in Q4 of a given year.
Zurich Insurance Group Annual Report 2021
Group overview
Integrated sustainability disclosure
Governance Risk review
Financial review
163
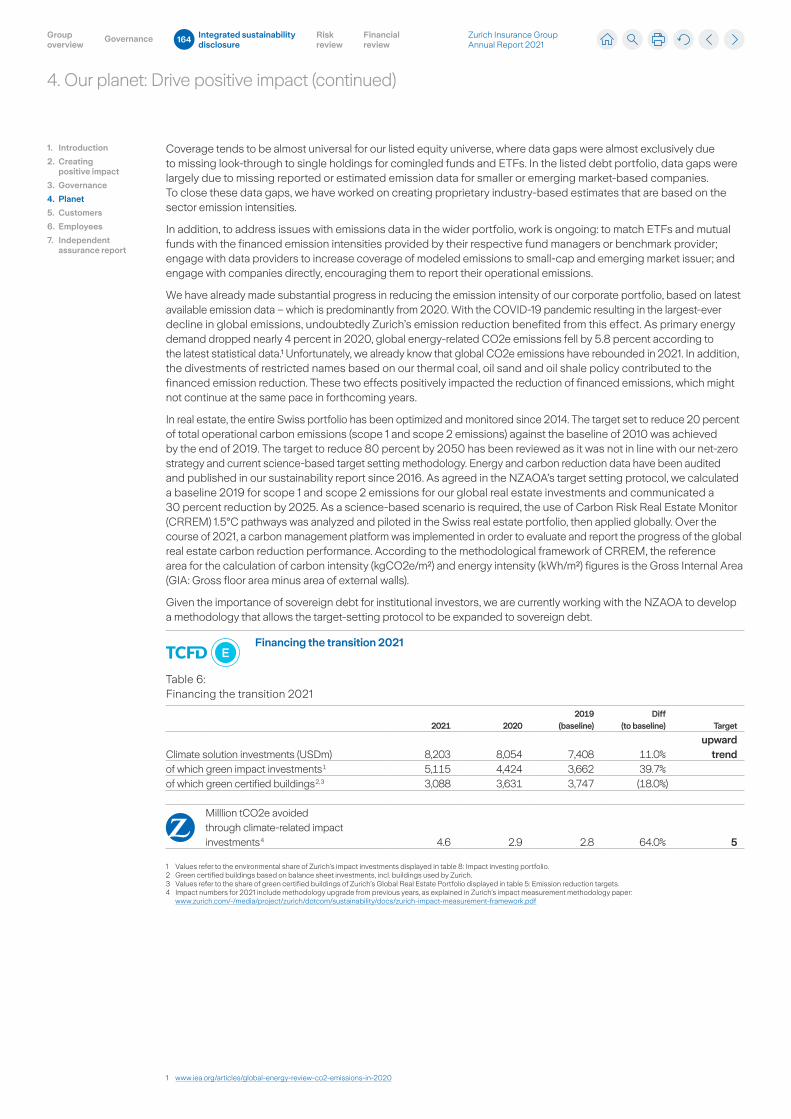
4. Our planet: Drive positive impact (continued)
Coverage tends to be almost universal for our listed equity universe, where data gaps were almost exclusively due to missing look-through to single holdings for comingled funds and ETFs. In the listed debt portfolio, data gaps were largely due to missing reported or estimated emission data for smaller or emerging market-based companies. To close these data gaps, we have worked on creating proprietary industry-based estimates that are based on the sector emission intensities.
In addition, to address issues with emissions data in the wider portfolio, work is ongoing: to match ETFs and mutual funds with the financed emission intensities provided by their respective fund managers or benchmark provider; engage with data providers to increase coverage of modeled emissions to small-cap and emerging market issuer; and engage with companies directly, encouraging them to report their operational emissions.
We have already made substantial progress in reducing the emission intensity of our corporate portfolio, based on latest available emission data – which is predominantly from 2020. With the COVID-19 pandemic resulting in the largest-ever decline in global emissions, undoubtedly Zurich’s emission reduction benefited from this effect. As primary energy demand dropped nearly 4 percent in 2020, global energy-related CO2e emissions fell by 5.8 percent according to the latest statistical data.¹ Unfortunately, we already know that global CO2e emissions have rebounded in 2021. In addition, the divestments of restricted names based on our thermal coal, oil sand and oil shale policy contributed to the financed emission reduction. These two effects positively impacted the reduction of financed emissions, which might not continue at the same pace in forthcoming years.
In real estate, the entire Swiss portfolio has been optimized and monitored since 2014. The target set to reduce 20 percent of total operational carbon emissions (scope 1 and scope 2 emissions) against the baseline of 2010 was achieved by the end of 2019. The target to reduce 80 percent by 2050 has been reviewed as it was not in line with our net-zero strategy and current science-based target setting methodology. Energy and carbon reduction data have been audited and published in our sustainability report since 2016. As agreed in the NZAOA’s target setting protocol, we calculated a baseline 2019 for scope 1 and scope 2 emissions for our global real estate investments and communicated a 30 percent reduction by 2025. As a science-based scenario is required, the use of Carbon Risk Real Estate Monitor (CRREM) 1.5°C pathways was analyzed and piloted in the Swiss real estate portfolio, then applied globally. Over the course of 2021, a carbon management platform was implemented in order to evaluate and report the progress of the global real estate carbon reduction performance. According to the methodological framework of CRREM, the reference area for the calculation of carbon intensity (kgCO2e/m²) and energy intensity (kWh/m²) figures is the Gross Internal Area (GIA: Gross floor area minus area of external walls).
Given the importance of sovereign debt for institutional investors, we are currently working with the NZAOA to develop a methodology that allows the target-setting protocol to be expanded to sovereign debt.
EFinancing the transition 2021
Table 6: Financing the transition 2021
2021 20202019
(baseline)Diff
(to baseline) Target
Climate solution investments (USDm) 8,203 8,054 7,408 11.0%upward
trendof which green impact investments 1 5,115 4,424 3,662 39.7%of which green certified buildings 2, 3 3,088 3,631 3,747 (18.0%)
Milllion tCO2e avoided through climate-related impact investments 4 4.6 2.9 2.8 64.0% 5
1 Values refer to the environmental share of Zurich’s impact investments displayed in table 8: Impact investing portfolio.2 Green certified buildings based on balance sheet investments, incl. buildings used by Zurich.3 Values refer to the share of green certified buildings of Zurich’s Global Real Estate Portfolio displayed in table 5: Emission reduction targets.4 Impact numbers for 2021 include methodology upgrade from previous years, as explained in Zurich’s impact measurement methodology paper:
www.zurich.com/-/media/project/zurich/dotcom/sustainability/docs/zurich-impact-measurement-framework.pdf
1. Introduction
2. Creating positive impact
3. Governance
4. Planet
5. Customers
6. Employees
7. Independent assurance report
1 www.iea.org/articles/global-energy-review-co2-emissions-in-2020
Zurich Insurance Group Annual Report 2021
Group overview
Integrated sustainability disclosure
Governance Risk review
Financial review
164
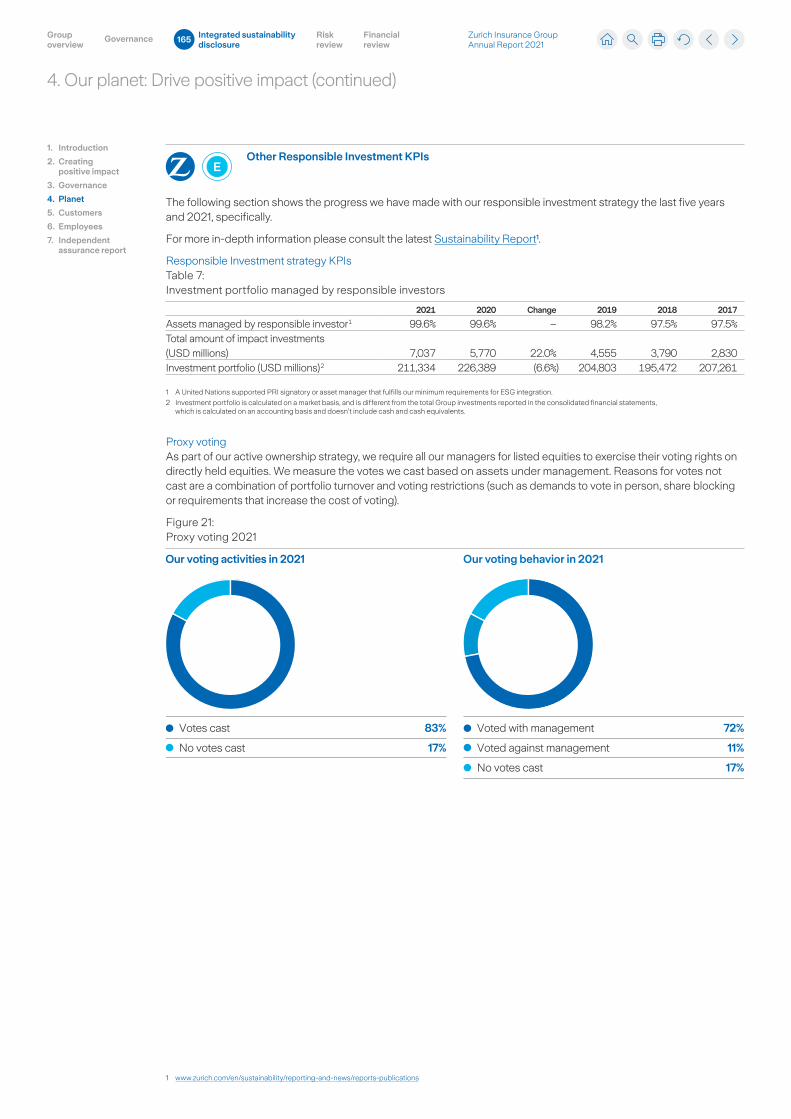
4. Our planet: Drive positive impact (continued)
EOther Responsible Investment KPIs
The following section shows the progress we have made with our responsible investment strategy the last five years and 2021, specifically.
For more in-depth information please consult the latest Sustainability Report¹.
Responsible Investment strategy KPIsTable 7: Investment portfolio managed by responsible investors
2021 2020 Change 2019 2018 2017
Assets managed by responsible investor 1 99.6% 99.6% – 98.2% 97.5% 97.5%Total amount of impact investments
(USD millions) 7,037 5,770 22.0% 4,555 3,790 2,830 Investment portfolio (USD millions) 2 211,334 226,389 (6.6%) 204,803 195,472 207,261
1 A United Nations supported PRI signatory or asset manager that fulfills our minimum requirements for ESG integration.
2 Investment portfolio is calculated on a market basis, and is different from the total Group investments reported in the consolidated financial statements, which is calculated on an accounting basis and doesn’t include cash and cash equivalents.
Proxy voting As part of our active ownership strategy, we require all our managers for listed equities to exercise their voting rights on directly held equities. We measure the votes we cast based on assets under management. Reasons for votes not cast are a combination of portfolio turnover and voting restrictions (such as demands to vote in person, share blocking or requirements that increase the cost of voting).
Figure 21: Proxy voting 2021
Our voting activities in 2021 Our voting behavior in 2021
Voted with management 72%
Voted against management 11%
No votes cast 17%
Votes cast 83%
No votes cast 17%
1. Introduction
2. Creating positive impact
3. Governance
4. Planet
5. Customers
6. Employees
7. Independent assurance report
1 www.zurich.com/en/sustainability/reporting-and-news/reports-publications
Zurich Insurance Group Annual Report 2021
Group overview
Integrated sustainability disclosure
Governance Risk review
Financial review
165
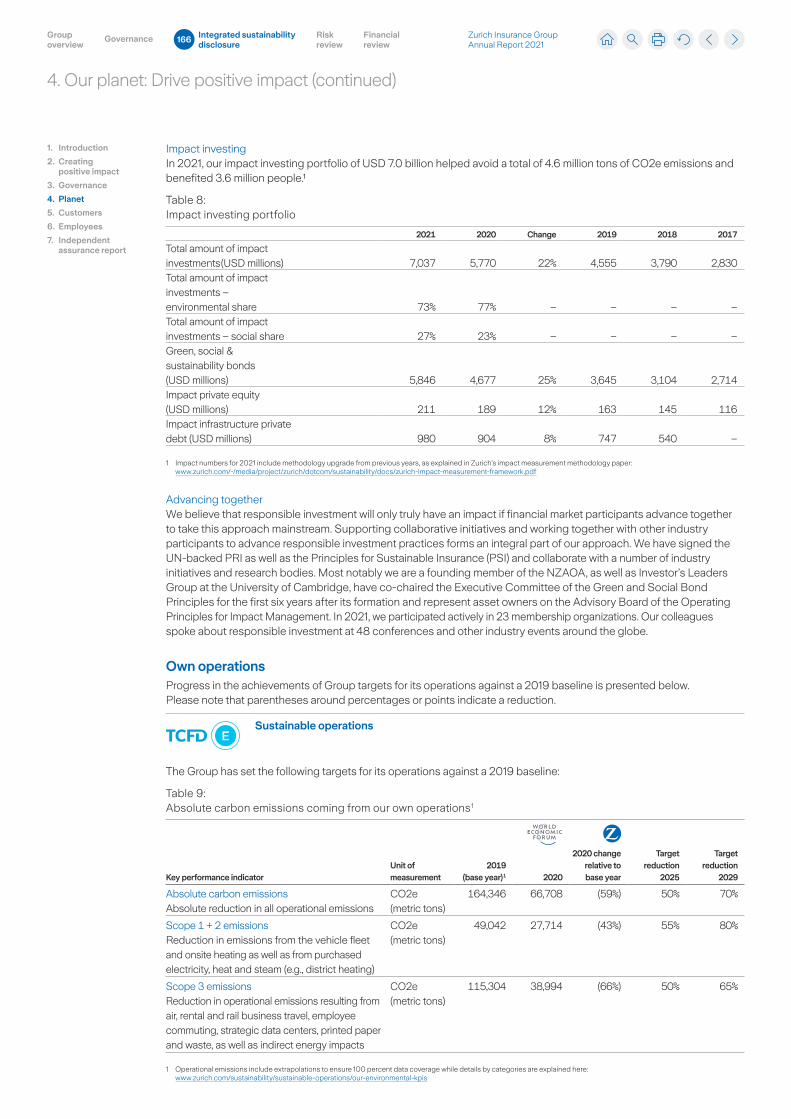
4. Our planet: Drive positive impact (continued)
1. Introduction
2. Creating positive impact
3. Governance
4. Planet
5. Customers
6. Employees
7. Independent assurance report
Impact investingIn 2021, our impact investing portfolio of USD 7.0 billion helped avoid a total of 4.6 million tons of CO2e emissions and benefited 3.6 million people.¹
Table 8: Impact investing portfolio
2021 2020 Change 2019 2018 2017
Total amount of impact investments (USD millions) 7,037 5,770 22% 4,555 3,790 2,830 Total amount of impact investments – environmental share 73% 77% – – – – Total amount of impact investments – social share 27% 23% – – – – Green, social & sustainability bonds (USD millions) 5,846 4,677 25% 3,645 3,104 2,714 Impact private equity (USD millions) 211 189 12% 163 145 116 Impact infrastructure private debt (USD millions) 980 904 8% 747 540 –
1 Impact numbers for 2021 include methodology upgrade from previous years, as explained in Zurich’s impact measurement methodology paper: www.zurich.com/-/media/project/zurich/dotcom/sustainability/docs/zurich-impact-measurement-framework.pdf
Advancing together We believe that responsible investment will only truly have an impact if financial market participants advance together to take this approach mainstream. Supporting collaborative initiatives and working together with other industry participants to advance responsible investment practices forms an integral part of our approach. We have signed the UN-backed PRI as well as the Principles for Sustainable Insurance (PSI) and collaborate with a number of industry initiatives and research bodies. Most notably we are a founding member of the NZAOA, as well as Investor’s Leaders Group at the University of Cambridge, have co-chaired the Executive Committee of the Green and Social Bond Principles for the first six years after its formation and represent asset owners on the Advisory Board of the Operating Principles for Impact Management. In 2021, we participated actively in 23 membership organizations. Our colleagues spoke about responsible investment at 48 conferences and other industry events around the globe.
Own operationsProgress in the achievements of Group targets for its operations against a 2019 baseline is presented below. Please note that parentheses around percentages or points indicate a reduction.
ESustainable operations
The Group has set the following targets for its operations against a 2019 baseline:
Table 9: Absolute carbon emissions coming from our own operations 1
Key performance indicatorUnit of measurement
2019(base year) 1
2020
2020 change relative to base year
Target reduction
2025
Target reduction
2029
Absolute carbon emissionsAbsolute reduction in all operational emissions
CO2e (metric tons)
164,346 66,708 (59%) 50% 70%
Scope 1 + 2 emissionsReduction in emissions from the vehicle fleet and onsite heating as well as from purchased electricity, heat and steam (e.g., district heating)
CO2e (metric tons)
49,042 27,714 (43%) 55% 80%
Scope 3 emissionsReduction in operational emissions resulting from air, rental and rail business travel, employee commuting, strategic data centers, printed paper and waste, as well as indirect energy impacts
CO2e (metric tons)
115,304 38,994 (66%) 50% 65%
1 Operational emissions include extrapolations to ensure 100 percent data coverage while details by categories are explained here: www.zurich.com/sustainability/sustainable-operations/our-environmental-kpis
Zurich Insurance Group Annual Report 2021
Group overview
Integrated sustainability disclosure
Governance Risk review
Financial review
166
Customers are at the core of our business. They include individuals, small businesses, mid-sized and large companies, and multinational corporations. We create value for our customers by helping them understand, prevent and protect themselves from risk. At Zurich we continue to take action to build more meaningful relationships with customers as part of an ongoing transformation program.
We have proven to be a reliable and trustworthy company in an unstable world, with a long history of using our expertise to care for society and people. However, customer expectations are evolving and lifestyles are changing, creating new demands. As technology has a profound impact on our lives, customers increasingly expect a seamless digital experience. They want more personalized products, faster delivery and simpler processes.
Our goals5.1 Customer-centric solutions and experiences
5.2 Fair and transparent experiences
5.3 Digital confidence and trust
5.1 Customer-centric solutions and experiencesWe aim to use every Zurich experience to build a meaningful relationship with our customers and become a trusted partner: so we feel confident together, connected to our community, and optimistic about the future. To create the solutions and experiences that support our customers, we must understand their evolving needs and innovate along the way.
This focus on innovative, customer-centric solutions is illustrated by the wide range of new products and services being developed across the Group. In the planet section, on page 136, of this report, we discussed the CCRS and the unit-linked sustainability solutions. Additionally, Zurich Global Ventures (ZGV), an innovation hub that drives the development of a series of independent and multi-faceted insurance-related solutions, was created with the aim, amongst others, of providing innovative services and product offerings that go beyond traditional insurance coverage and are available across markets globally. The goal is to get closer to our customers by offering a customized, proactive and digital experience that empowers individuals and businesses to be better prepared for the future.
These new products and services complement our existing insurance propositions, ensuring that we are providing our customers with a wide range of solutions that meet their needs.
1. Introduction
2. Creating positive impact
3. Governance
4. Planet
5. Customers
6. Employees
7. Independent assurance report
5. Our customers: Their needs are at the heart of everything we do
Conny KalcherGroup Chief Customer
Officer
Zurich Insurance Group Annual Report 2021
Group overview
Integrated sustainability disclosure
Governance Risk review
Financial review
167
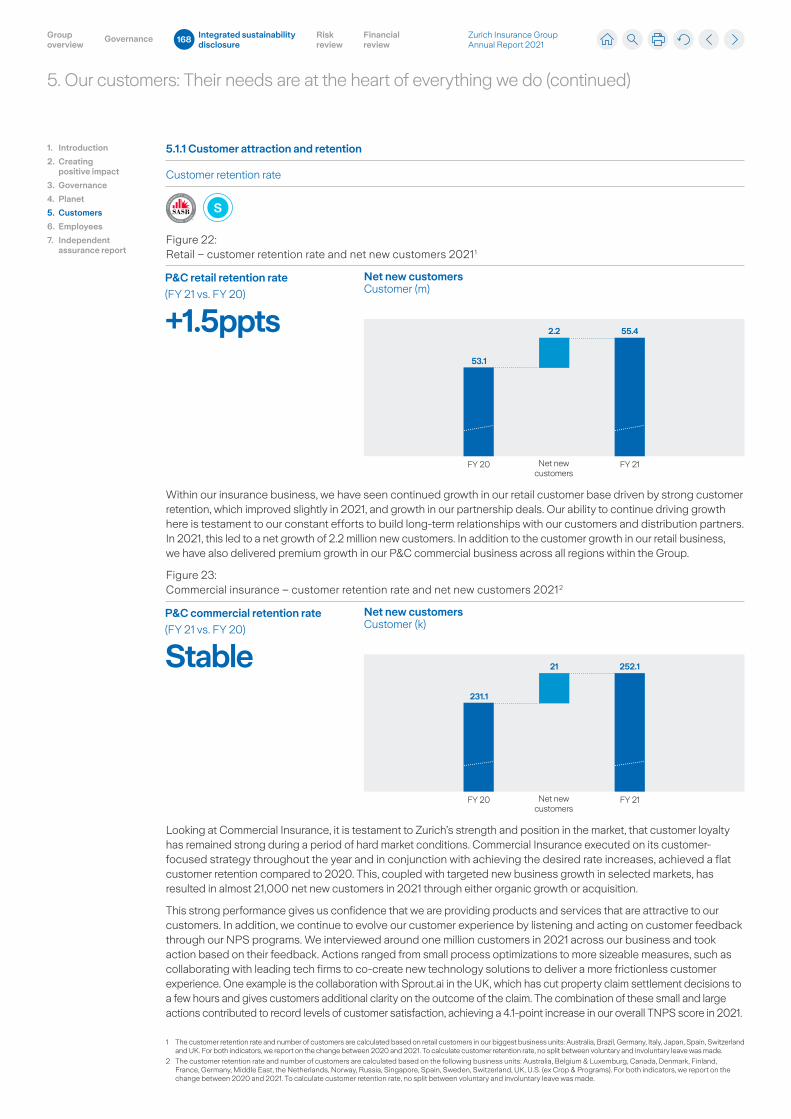
5.1.1 Customer attraction and retention
Customer retention rate
S
Figure 22: Retail – customer retention rate and net new customers 2021 1
Net new customersCustomer (m)
FY 20
2.2
FY 21
55.4
53.1
Net newcustomers
Within our insurance business, we have seen continued growth in our retail customer base driven by strong customer retention, which improved slightly in 2021, and growth in our partnership deals. Our ability to continue driving growth here is testament to our constant efforts to build long-term relationships with our customers and distribution partners. In 2021, this led to a net growth of 2.2 million new customers. In addition to the customer growth in our retail business, we have also delivered premium growth in our P&C commercial business across all regions within the Group.
Figure 23: Commercial insurance – customer retention rate and net new customers 2021 2
Net new customersCustomer (k)
FY 20
21
FY 21
252.1
231.1
Net newcustomers
Looking at Commercial Insurance, it is testament to Zurich’s strength and position in the market, that customer loyalty has remained strong during a period of hard market conditions. Commercial Insurance executed on its customer-focused strategy throughout the year and in conjunction with achieving the desired rate increases, achieved a flat customer retention compared to 2020. This, coupled with targeted new business growth in selected markets, has resulted in almost 21,000 net new customers in 2021 through either organic growth or acquisition.
This strong performance gives us confidence that we are providing products and services that are attractive to our customers. In addition, we continue to evolve our customer experience by listening and acting on customer feedback through our NPS programs. We interviewed around one million customers in 2021 across our business and took action based on their feedback. Actions ranged from small process optimizations to more sizeable measures, such as collaborating with leading tech firms to co-create new technology solutions to deliver a more frictionless customer experience. One example is the collaboration with Sprout.ai in the UK, which has cut property claim settlement decisions to a few hours and gives customers additional clarity on the outcome of the claim. The combination of these small and large actions contributed to record levels of customer satisfaction, achieving a 4.1-point increase in our overall TNPS score in 2021.
P&C retail retention rate
(FY 21 vs. FY 20)
+1.5ppts
P&C commercial retention rate
(FY 21 vs. FY 20)
Stable
1 The customer retention rate and number of customers are calculated based on retail customers in our biggest business units: Australia, Brazil, Germany, Italy, Japan, Spain, Switzerland and UK. For both indicators, we report on the change between 2020 and 2021. To calculate customer retention rate, no split between voluntary and involuntary leave was made.
2 The customer retention rate and number of customers are calculated based on the following business units: Australia, Belgium & Luxemburg, Canada, Denmark, Finland, France, Germany, Middle East, the Netherlands, Norway, Russia, Singapore, Spain, Sweden, Switzerland, UK, U.S. (ex Crop & Programs). For both indicators, we report on the change between 2020 and 2021. To calculate customer retention rate, no split between voluntary and involuntary leave was made.
1. Introduction
2. Creating positive impact
3. Governance
4. Planet
5. Customers
6. Employees
7. Independent assurance report
5. Our customers: Their needs are at the heart of everything we do (continued)
Zurich Insurance Group Annual Report 2021
Group overview
Integrated sustainability disclosure
Governance Risk review
Financial review
168
1 www.zurich.com/about-us/corporate-governance/code-of-conduct/we-care-about-our-customers
2 Argentina, Austria, Australia, Brazil, Canada, Chile, China, Germany, Hong Kong, Ireland, Indonesia, Italy, Japan, Malaysia, Mexico, Portugal, Singapore, Spain, Switzerland, Turkey, UK, U.S., and Zurich International.
3 Due to optimizations in our system, we continue to collect feedback from an increasing number of customers. This can also impact the TNPS score, meaning that part of the increase should be attributed to this trend.
4 High volumes due to increased need for road assistance during the holiday period.
5.2 Fair and transparent advice and engagements
In line with our Group’s Code of Conduct, we strive to manage the risks of poor outcomes for our customers and conduct our business in a way that treats them fairly. We acknowledge that they can be exposed to different risks at different stages of the customer journey and believe that clear and transparent communication is critical to mitigate these risks. To support strong customer management, including fair communication practices, in all our business units, we have a Global Customer Facing Conduct Framework 1 in place.
As part of our continued focus on enhancing customer experience, we have also defined a set of customer experience standards. These standards define what good customer experience looks like at Zurich and provide a common benchmark of quality for the whole organization. By going beyond what is required in local laws and regulations to strive for customer experience standards, we are better positioned to meet and exceed customer expectations.
5.2.1 Customer communication
To account for the wide range of products and services we provide across more than 215 countries and territories, our local businesses ensure that our approach to informing customers about our products is fully in line with both regulatory and customer expectations. We have a wide range of product
literature available to inform customers about our products and services, including product suitability, policy coverage, cost structures, exclusions, etc. Information on our range of products is available through several channels, including our website, financial intermediaries, email, social media, television, press, digital and print advertising.
5.2.2 Continuously measuring and improving claims handling
As part of our TNPS survey, we strive to get a better understanding of how our customers experience different aspects of the customer journey. One of the elements that is very important to our customers, is the way we handle claims when we receive them. The claims TNPS provides us with insights on how
our customers value our claims handling procedure and which aspects, or drivers affect their experiences most over time. The claims TNPS is calculated for a broad set of countries 2, both for retail and commercial insurance.
Compared to 2020, the claims TNPS score increased by 3.4 points 3 by end of 2021. In general, our customers value that we are easy to deal with and that we have helpful advisors in customer support. The lead time to handle claims and the quality of the information we provide, are the areas most in need of improvement. The main difference compared to last year is that the driver ‘it was easy to deal with Zurich’ has moved from an area in need of improvement to one of our strengths.
The results shown above prove that dedicated initiatives can have a direct impact on customer satisfaction. Some examples that helped us increase customer experience in 2021 include the obligatory onboarding of all advisors in Switzerland on the Digital Agents Workplace, leading to more personalized advice for our customers. Furthermore, we invested in additional education for our Swiss staff and the recruitment of extra advisors for the high-volume summer months. 4 All of this has led to quicker and easier claims settlements in Switzerland. In Brazil, we introduced several initiatives to simplify the communication toward our customers and reduced the lead time by digitalizing our processes. And in Japan, we simplified our claim process, which led to a steady increase in customer satisfaction. These initiatives confirm that our efforts improve our customer experience and, by consequence, strengthen our claims TNPS score.
S
S
1. Introduction
2. Creating positive impact
3. Governance
4. Planet
5. Customers
6. Employees
7. Independent assurance report
5. Our customers: Their needs are at the heart of everything we do (continued)
Zurich Insurance Group Annual Report 2021
Group overview
Integrated sustainability disclosure
Governance Risk review
Financial review
169
5.3 Digital confidence and trust
One of our goals is to make people and organizations more resilient by fostering confidence in a digital society. We aim to use this goal to improve customer experience. We are determined to be transparent about data management and Zurich’s data protection and privacy policy, as we believe this is a critical factor for customer trust. During the past year, we also focused on the development of AI solutions and invested in a resilient digital experience, in line with our customer promise.
5.3.1 Data Commitment 1
We have accelerated global efforts to deliver on our Data Commitment, which aims to go beyond regulatory compliance. Particular focus is given to enhancing standards, processes, systems and controls across regions to ensure an increased level of transparency on how we collect, use and share personal
data. The analysis of the effectiveness, strength and robustness of processes and controls in place is used to calculate the transparency score per country. 2
In EMEA and North America (NA), more than 90 percent of countries achieved the transparency score we aim for.
Across LATAM and APAC, more than 70 percent of the countries have also achieved the targets we aim for, in spite of the different level of robustness of local data protection and privacy regulations. Countries with less demanding data protection and privacy regulations are using ongoing transformation and digitalization initiatives to enhance processes and systems, so they can proactively inform customers 3 about how their personal data is being used (and with whom it is being shared) and obtain appropriate consent. Overall, since Q1 2020 our transparency score has increased by 30 percent globally, taking into account the ratio of countries that made major improvements against the targets we aim for.
5.3.2 Cybersecurity 4
Given the scale of the cybercrime threat, we have opted for a layered approach to protect our data and ensure resilience, by leveraging industry best practices and frameworks such as the NIST Cybersecurity Framework. 5 We continuously work on important areas of focus such as data protection, attack surface reduction and security capabilities development.
To strengthen our data protection, we have developed a global standard policy for data loss prevention (DLP), and we provide solution for DLP to our business units throughout the EMEA region, and this will be expanded globally over time. Local data protection coordinators for each country and business unit ensure responsiveness to local regulatory requirements for data protection. Data is protected and stored in accordance with its level of sensitivity. We address privacy by design from a forward-looking perspective for all new systems.
Our attack surface reduction efforts are focused on finding, reporting, and reducing risk associated with vulnerabilities and exploitable configuration issues for systems and applications. Cybersecurity and response capabilities allow us to understand the cyber threat environment and prevent, detect, and respond to malicious threats. To ensure proper oversight, our defense-in-depth security model enables us to identify information security risk across the organization through programs such as phishing and awareness training, insider threat detection, strategic and dedicated risk assessments, threat intelligence acquisition and vulnerability management. During 2021, we met all targets for application website protection from malicious threats and continued an aggressive attack surface reduction campaign to ensure positive management of all IT vulnerabilities.
We leverage dedicated security technologies with detection, protection, logging and monitoring capabilities and we are making additional investments to counter growing security threats. In 2021, we significantly enhanced our server and workstation threat protection capabilities by upgrading to an industry-leading threat management solution.
Our focus moving forward is to bring all privileged user 6 and system accounts under management, continuing vulnerability reduction, conducting dataflow analysis for confidential data, strengthening third-party information security governance, and continuing to enhance business resilience.
Since 2021 we have begun to implement a new internal controls integrated framework 7, which will provide control testing and assurance to ensure the effectiveness of information security controls (see the risk review, pages 210 to 211 for more information).
We are also dedicated to full transparency concerning information security and cyber incidents that may affect customer data. We have strict protocols in place to comply with all regulatory notification requirements and will immediately inform and provide full assistance to any customers whose data or data privacy may be impacted, regardless of whether the incident involved Zurich directly or one of our partners.
S
1 Reporting excludes Farmers Group Services, Joint Ventures and Zurich Global Ventures except for Zurich International.
2 The calculation of the score is based on self-assessment by reporting units, complemented by quality assurance reviews conducted at regional and Group level.
3 In the section on ‘our digital society’, customer refers to policyholders, claimants, beneficiaries and employees.
4 Reporting excludes Farmers Group Services, and Zurich Global Ventures except for Zurich International.
5 A set of guidelines for mitigating organizational cybersecurity risks, published by the U.S. National Institute of Standards and Technology (NIST) based on existing standards, guidelines, and practices.
6 A privileged user has special/higher access rights. These elevated access rights are usually given to superusers and allow for full control of systems, applications and data.
7 The framework covers the development, implementation, execution and monitoring of internal controls. Cybersecurity is just one topic.
1. Introduction
2. Creating positive impact
3. Governance
4. Planet
5. Customers
6. Employees
7. Independent assurance report
5. Our customers: Their needs are at the heart of everything we do (continued)
Zurich Insurance Group Annual Report 2021
Group overview
Integrated sustainability disclosure
Governance Risk review
Financial review
170
5.3.3 Business resilience 1
The increased sophistication of cyberattacks also means we must continuously enhance our protective, responsive and recovery capabilities. Our goal is to be able to continue providing highly critical services to our customers under a “total loss of technology” scenario.
To do this, we have identified all critical services and management activities in all countries and functions. Services are considered end-to-end, to the ultimate third-party provider. They are defined as critical if their disruption, whether internally within Zurich or with a third party, can generate distress to our customers or threaten our viability under an extreme loss of technology scenario. The combination of these services and management activities represents the Zurich minimum viable operating environment (MVOE).
To ensure continuity of MVOE services and activities, we are implementing a set of digital capabilities that are required for internal and external communication (email, telephony), and to make key customer, policy and claims data available for minimum service, such as claims notification and claim settlement.
In parallel, we are building recovery capabilities, beyond traditional disaster recovery, to allow restoration of our critical IT infrastructure, and, ultimately, recovery of critical business applications before a transition to business as usual.
We set out clear expectations for suppliers in our SCOC including in relation to data protection, privacy and cyber security. We carry out risk based due diligence to verify that the supplier meets Zurich’s expectations and have in place detailed policies and guidelines which our Procurement and Vendor Management teams follow. Our due diligence is based on the nature of the supplier engagement and the relevant risks. With supplier engagements that involve the processing of personal data, we carry out extensive checks on a supplier’s cyber security and compliance measures. Once completed, we enter appropriate contractual clauses with robust obligations to keep personal data secure.
5.3.4 Ethical use of artificial intelligence (AI) 2
In Q3 2021, we initiated the roll-out (field-testing phase) of an AI assurance framework – a governance model that ensures the ethical use of AI solutions taking into consideration emerging regulations (e.g., EU AI Act).
We use AI for several purposes, including i) to better understand our customers’ needs; ii) to enhance the efficiency of our business operations; iii) to develop innovative solutions that best protect and serve our customers; and iv) to contribute to positive and sustainable societal outcomes, such as financial and social inclusion, affordability and fair treatment of vulnerable customers.
In the course of 2021, new AI / machine learning (ML) solutions have been implemented across the value chain in major markets, for example in Germany, Japan, Switzerland and the UK with processes and controls to ensure adherence to globally consented ethical principles of fairness, transparency and accountability. Currently, we have three focus areas for AI / ML. First the deployment of predictive models to better understand risks, e.g., in the area of property risk engineering or property enrichment with open data. Second, document classification techniques, e.g., to generate efficiency gains in the areas of underwriting or claims. And finally, testing of conversational AI by using chatbots to improve customer experience and increase operational efficiency.
Given this domain’s growing importance, we are establishing AI ethics committees to provide assurance and guidance over implementation of AI solutions. These committees provide a holistic, diverse and balanced view on the risks and potential benefits of the AI solution and its compliance with our Ethical AI Principles.
S
S
1 Reporting excludes Farmers Group Services, and Zurich Global Ventures except for Zurich International.
2 Reporting excludes Farmers Group Services, Joint Ventures and Zurich Global Ventures except for Zurich International.
1. Introduction
2. Creating positive impact
3. Governance
4. Planet
5. Customers
6. Employees
7. Independent assurance report
5. Our customers: Their needs are at the heart of everything we do (continued)
Zurich Insurance Group Annual Report 2021
Group overview
Integrated sustainability disclosure
Governance Risk review
Financial review
171
“Let’s grow together”, reflects our aspiration to support employees in their lifelong learning and growth. It is a shared engagement that asks our people to play an active role in shaping their careers and reinforces the provision of good working conditions and fair and equal compensation, in line with our focus on work sustainability.
Our goals6.1 Talent attraction for a sustainable future
6.2 A safe working environment that supports health and wellbeing
6.3 Integrated and systematic approach to diversity, equity, inclusion and belonging (DEIB)
6.4 Prevention of bribery and corruption
6.1 Talent attraction for a sustainable future
6.1.1 Talent attraction and retention
In 2021, we observed an increase in headcount composition across the organization, with a 6 percent increase year on year. At the same time, we have seen the continued effects of high demand for key skills and capabilities, with candidates holding strong choice and negotiating power in certain markets. In response, we have closely examined where to invest and how to attract and retain talent.
We have seen a decrease in Group employee turnover since 2016, with a drop in 2020 as a result of the COVID-19 pandemic. Although we had anticipated an increase in 2021 as labor markets picked up, the impact was less than expected, with continued low employee turnover across the Group.
We saw a higher turnover in NA, APAC and LATAM in 2021. This is partly in line with historical trends and the local context of more dynamic markets.
A particular area of attention for us is the increasing voluntary turnover of next-generation (NextGen) employees compared to other employee groups. In addition to us strengthening our junior pipeline, we are running “listen and act” initiatives to understand more about their preferences, pain points, and recommendations for developing potential solutions. We are also focused on offering more transparent and flexible career paths, which will form an integral part of developing and retaining all segments of the workforce.
1. Introduction
2. Creating positive impact
3. Governance
4. Planet
5. Customers
6. Employees
7. Independent assurance report
Kathleen SavioGroup Chief
Transformation Officer
6. Our employees: Let’s grow together
Zurich Insurance Group Annual Report 2021
Group overview
Integrated sustainability disclosure
Governance Risk review
Financial review
172
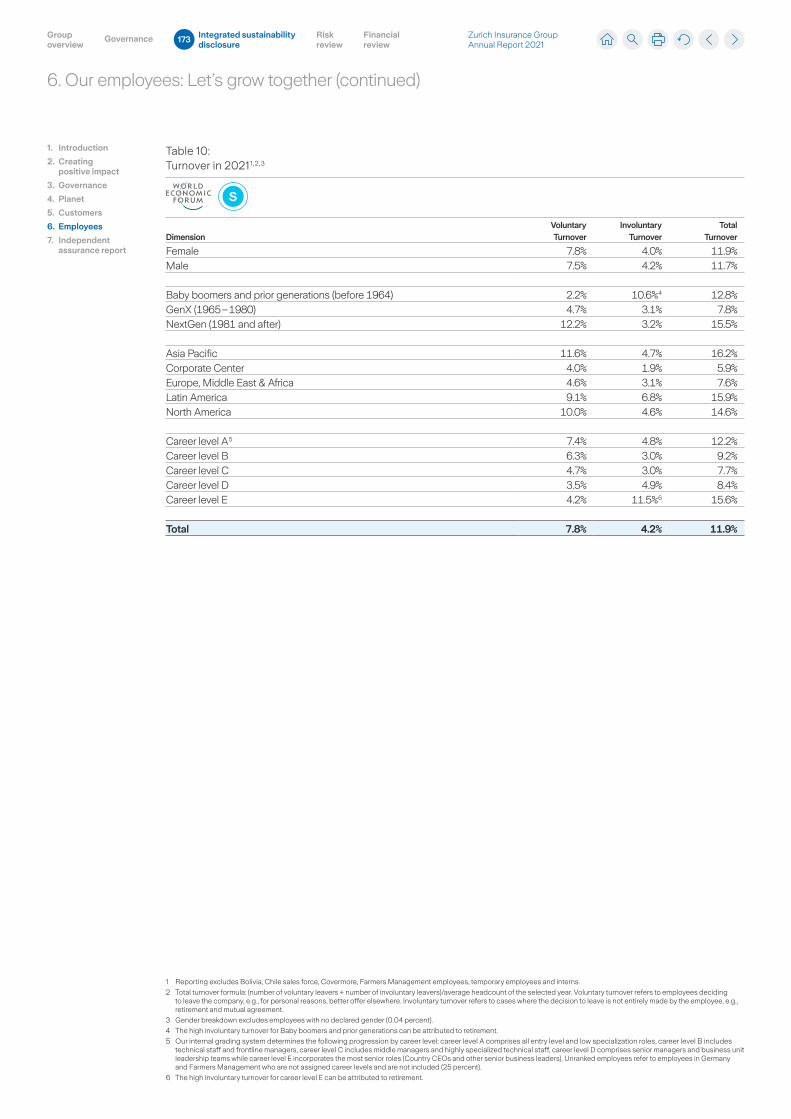
1. Introduction
2. Creating positive impact
3. Governance
4. Planet
5. Customers
6. Employees
7. Independent assurance report
Table 10: Turnover in 2021 1, 2, 3
S
DimensionVoluntary Turnover
Involuntary Turnover
Total Turnover
Female 7.8% 4.0% 11.9%Male 7.5% 4.2% 11.7%
Baby boomers and prior generations (before 1964) 2.2% 10.6% 4 12.8%GenX (1965 – 1980) 4.7% 3.1% 7.8%NextGen (1981 and after) 12.2% 3.2% 15.5%
Asia Pacific 11.6% 4.7% 16.2%Corporate Center 4.0% 1.9% 5.9%Europe, Middle East & Africa 4.6% 3.1% 7.6%Latin America 9.1% 6.8% 15.9%North America 10.0% 4.6% 14.6%
Career level A 5 7.4% 4.8% 12.2%Career level B 6.3% 3.0% 9.2%Career level C 4.7% 3.0% 7.7%Career level D 3.5% 4.9% 8.4%Career level E 4.2% 11.5% 6 15.6%
Total 7.8% 4.2% 11.9%
1 Reporting excludes Bolivia, Chile sales force, Covermore, Farmers Management employees, temporary employees and interns.
2 Total turnover formula: (number of voluntary leavers + number of involuntary leavers)/average headcount of the selected year. Voluntary turnover refers to employees deciding to leave the company, e.g., for personal reasons, better offer elsewhere. Involuntary turnover refers to cases where the decision to leave is not entirely made by the employee, e.g., retirement and mutual agreement.
3 Gender breakdown excludes employees with no declared gender (0.04 percent).
4 The high involuntary turnover for Baby boomers and prior generations can be attributed to retirement.
5 Our internal grading system determines the following progression by career level: career level A comprises all entry level and low specialization roles, career level B includes technical staff and frontline managers, career level C includes middle managers and highly specialized technical staff, career level D comprises senior managers and business unit leadership teams while career level E incorporates the most senior roles (Country CEOs and other senior business leaders). Unranked employees refer to employees in Germany and Farmers Management who are not assigned career levels and are not included (25 percent).
6 The high involuntary turnover for career level E can be attributed to retirement.
6. Our employees: Let’s grow together (continued)
Zurich Insurance Group Annual Report 2021
Group overview
Integrated sustainability disclosure
Governance Risk review
Financial review
173
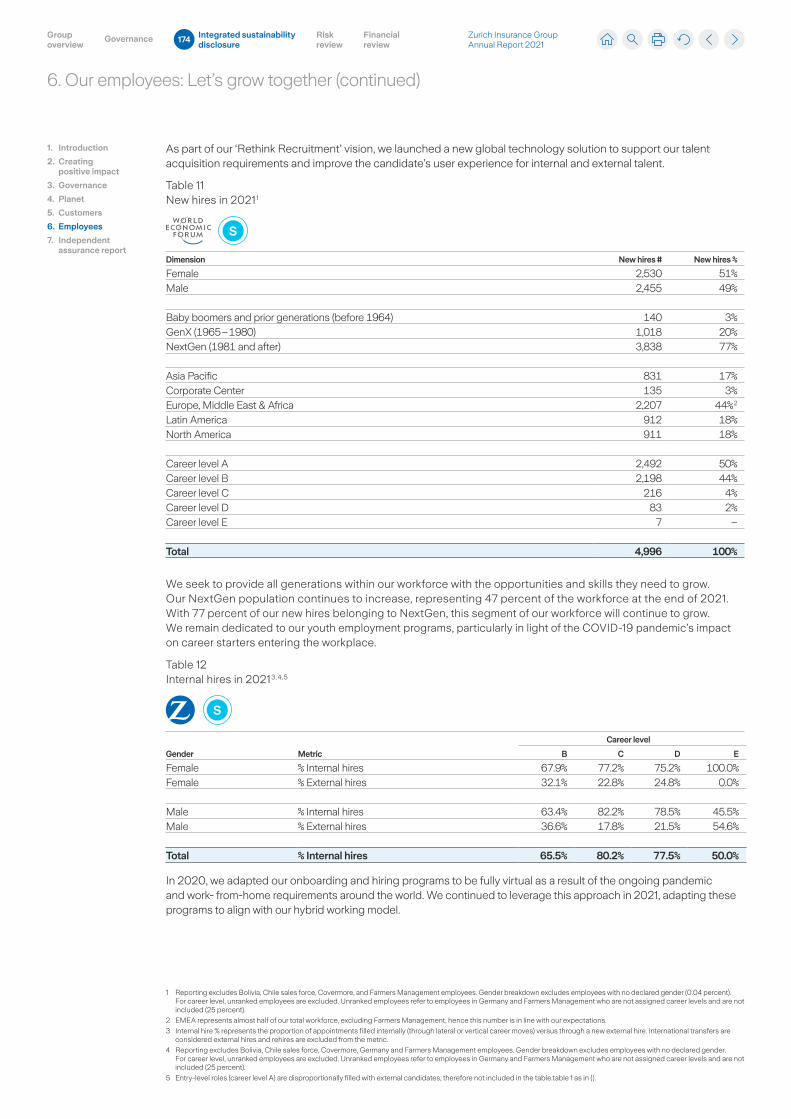
As part of our ‘Rethink Recruitment’ vision, we launched a new global technology solution to support our talent acquisition requirements and improve the candidate’s user experience for internal and external talent.
Table 11 New hires in 2021 1
S
Dimension New hires # New hires %
Female 2,530 51%Male 2,455 49%
Baby boomers and prior generations (before 1964) 140 3%GenX (1965 – 1980) 1,018 20%NextGen (1981 and after) 3,838 77%
Asia Pacific 831 17%Corporate Center 135 3%Europe, Middle East & Africa 2,207 44% 2
Latin America 912 18%North America 911 18%
Career level A 2,492 50%Career level B 2,198 44%Career level C 216 4%Career level D 83 2%Career level E 7 –
Total 4,996 100%
We seek to provide all generations within our workforce with the opportunities and skills they need to grow. Our NextGen population continues to increase, representing 47 percent of the workforce at the end of 2021. With 77 percent of our new hires belonging to NextGen, this segment of our workforce will continue to grow. We remain dedicated to our youth employment programs, particularly in light of the COVID-19 pandemic’s impact on career starters entering the workplace.
Table 12 Internal hires in 2021 3, 4, 5
S
Gender Metric
Career level
B C D E
Female % Internal hires 67.9% 77.2% 75.2% 100.0%Female % External hires 32.1% 22.8% 24.8% 0.0%
Male % Internal hires 63.4% 82.2% 78.5% 45.5%Male % External hires 36.6% 17.8% 21.5% 54.6%
Total % Internal hires 65.5% 80.2% 77.5% 50.0%
In 2020, we adapted our onboarding and hiring programs to be fully virtual as a result of the ongoing pandemic and work- from-home requirements around the world. We continued to leverage this approach in 2021, adapting these programs to align with our hybrid working model.
1 Reporting excludes Bolivia, Chile sales force, Covermore, and Farmers Management employees. Gender breakdown excludes employees with no declared gender (0.04 percent). For career level, unranked employees are excluded. Unranked employees refer to employees in Germany and Farmers Management who are not assigned career levels and are not included (25 percent).
2 EMEA represents almost half of our total workforce, excluding Farmers Management, hence this number is in line with our expectations.
3 Internal hire % represents the proportion of appointments filled internally (through lateral or vertical career moves) versus through a new external hire. International transfers are considered external hires and rehires are excluded from the metric.
4 Reporting excludes Bolivia, Chile sales force, Covermore, Germany and Farmers Management employees. Gender breakdown excludes employees with no declared gender. For career level, unranked employees are excluded. Unranked employees refer to employees in Germany and Farmers Management who are not assigned career levels and are not included (25 percent).
5 Entry-level roles (career level A) are disproportionally filled with external candidates, therefore not included in the table.table 1 as in ().
1. Introduction
2. Creating positive impact
3. Governance
4. Planet
5. Customers
6. Employees
7. Independent assurance report
6. Our employees: Let’s grow together (continued)
Zurich Insurance Group Annual Report 2021
Group overview
Integrated sustainability disclosure
Governance Risk review
Financial review
174
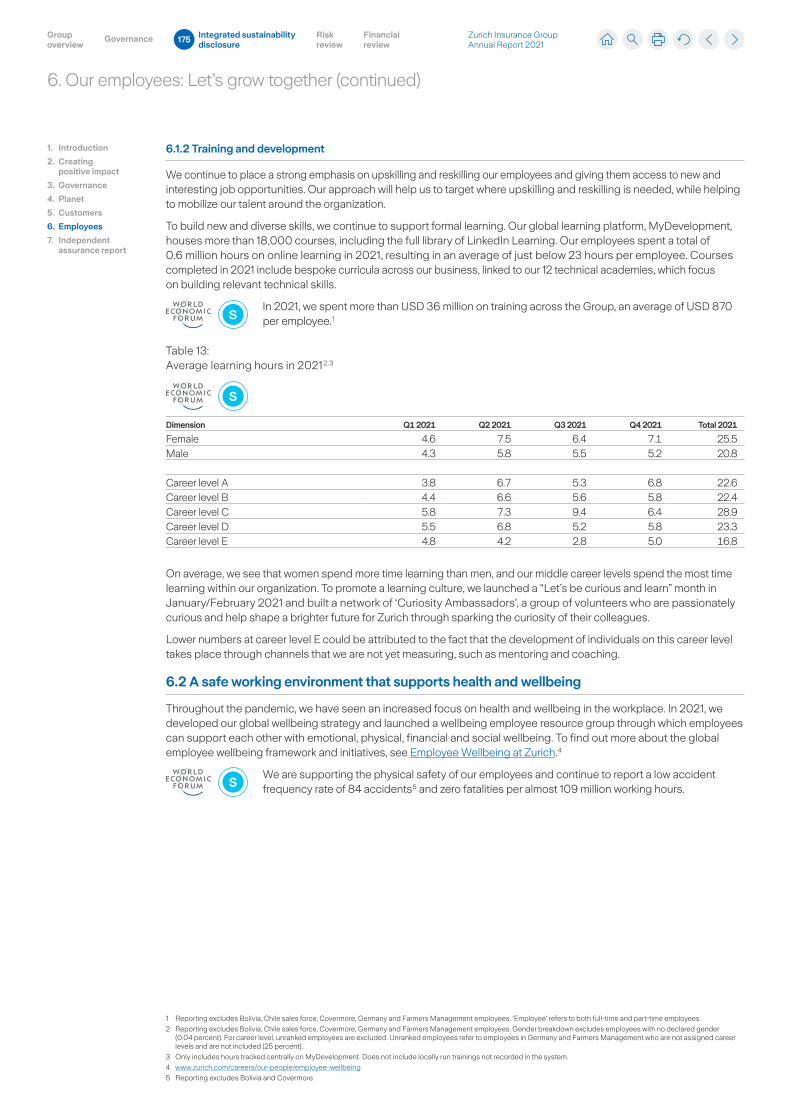
1 Reporting excludes Bolivia, Chile sales force, Covermore, Germany and Farmers Management employees. ‘Employee’ refers to both full-time and part-time employees.
2 Reporting excludes Bolivia, Chile sales force, Covermore, Germany and Farmers Management employees. Gender breakdown excludes employees with no declared gender (0.04 percent). For career level, unranked employees are excluded. Unranked employees refer to employees in Germany and Farmers Management who are not assigned career levels and are not included (25 percent).
3 Only includes hours tracked centrally on MyDevelopment. Does not include locally run trainings not recorded in the system.
4 www.zurich.com/careers/our-people/employee-wellbeing
5 Reporting excludes Bolivia and Covermore.
6.1.2 Training and development
We continue to place a strong emphasis on upskilling and reskilling our employees and giving them access to new and interesting job opportunities. Our approach will help us to target where upskilling and reskilling is needed, while helping to mobilize our talent around the organization.
To build new and diverse skills, we continue to support formal learning. Our global learning platform, MyDevelopment, houses more than 18,000 courses, including the full library of LinkedIn Learning. Our employees spent a total of 0.6 million hours on online learning in 2021, resulting in an average of just below 23 hours per employee. Courses completed in 2021 include bespoke curricula across our business, linked to our 12 technical academies, which focus on building relevant technical skills.
SIn 2021, we spent more than USD 36 million on training across the Group, an average of USD 870 per employee. 1
Table 13: Average learning hours in 2021 2, 3
S
Dimension Q1 2021 Q2 2021 Q3 2021 Q4 2021 Total 2021
Female 4.6 7.5 6.4 7.1 25.5Male 4.3 5.8 5.5 5.2 20.8
Career level A 3.8 6.7 5.3 6.8 22.6Career level B 4.4 6.6 5.6 5.8 22.4Career level C 5.8 7.3 9.4 6.4 28.9Career level D 5.5 6.8 5.2 5.8 23.3Career level E 4.8 4.2 2.8 5.0 16.8
On average, we see that women spend more time learning than men, and our middle career levels spend the most time learning within our organization. To promote a learning culture, we launched a “Let’s be curious and learn” month in January/February 2021 and built a network of ‘Curiosity Ambassadors’, a group of volunteers who are passionately curious and help shape a brighter future for Zurich through sparking the curiosity of their colleagues.
Lower numbers at career level E could be attributed to the fact that the development of individuals on this career level takes place through channels that we are not yet measuring, such as mentoring and coaching.
6.2 A safe working environment that supports health and wellbeing
Throughout the pandemic, we have seen an increased focus on health and wellbeing in the workplace. In 2021, we developed our global wellbeing strategy and launched a wellbeing employee resource group through which employees can support each other with emotional, physical, financial and social wellbeing. To find out more about the global employee wellbeing framework and initiatives, see Employee Wellbeing at Zurich. 4
We are supporting the physical safety of our employees and continue to report a low accident frequency rate of 84 accidents 5 and zero fatalities per almost 109 million working hours.S
1. Introduction
2. Creating positive impact
3. Governance
4. Planet
5. Customers
6. Employees
7. Independent assurance report
6. Our employees: Let’s grow together (continued)
Zurich Insurance Group Annual Report 2021
Group overview
Integrated sustainability disclosure
Governance Risk review
Financial review
175
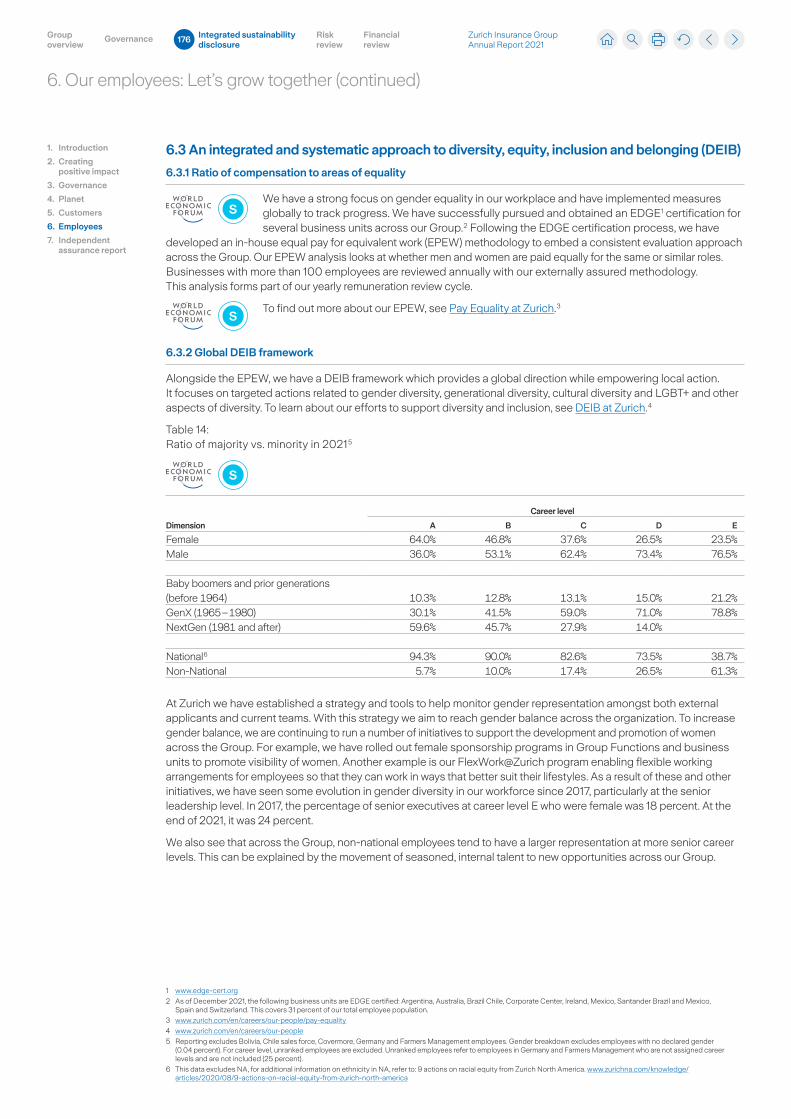
6.3 An integrated and systematic approach to diversity, equity, inclusion and belonging (DEIB)
6.3.1 Ratio of compensation to areas of equality
We have a strong focus on gender equality in our workplace and have implemented measures globally to track progress. We have successfully pursued and obtained an EDGE 1 certification for several business units across our Group. 2 Following the EDGE certification process, we have
developed an in-house equal pay for equivalent work (EPEW) methodology to embed a consistent evaluation approach across the Group. Our EPEW analysis looks at whether men and women are paid equally for the same or similar roles. Businesses with more than 100 employees are reviewed annually with our externally assured methodology. This analysis forms part of our yearly remuneration review cycle.
To find out more about our EPEW, see Pay Equality at Zurich. 3
6.3.2 Global DEIB framework
Alongside the EPEW, we have a DEIB framework which provides a global direction while empowering local action. It focuses on targeted actions related to gender diversity, generational diversity, cultural diversity and LGBT+ and other aspects of diversity. To learn about our efforts to support diversity and inclusion, see DEIB at Zurich. 4
Table 14: Ratio of majority vs. minority in 2021 5
S
Dimension
Career level
A B C D E
Female 64.0% 46.8% 37.6% 26.5% 23.5%Male 36.0% 53.1% 62.4% 73.4% 76.5%
Baby boomers and prior generations (before 1964) 10.3% 12.8% 13.1% 15.0% 21.2%GenX (1965 – 1980) 30.1% 41.5% 59.0% 71.0% 78.8%NextGen (1981 and after) 59.6% 45.7% 27.9% 14.0%
National 6 94.3% 90.0% 82.6% 73.5% 38.7%Non-National 5.7% 10.0% 17.4% 26.5% 61.3%
At Zurich we have established a strategy and tools to help monitor gender representation amongst both external applicants and current teams. With this strategy we aim to reach gender balance across the organization. To increase gender balance, we are continuing to run a number of initiatives to support the development and promotion of women across the Group. For example, we have rolled out female sponsorship programs in Group Functions and business units to promote visibility of women. Another example is our FlexWork@Zurich program enabling flexible working arrangements for employees so that they can work in ways that better suit their lifestyles. As a result of these and other initiatives, we have seen some evolution in gender diversity in our workforce since 2017, particularly at the senior leadership level. In 2017, the percentage of senior executives at career level E who were female was 18 percent. At the end of 2021, it was 24 percent.
We also see that across the Group, non-national employees tend to have a larger representation at more senior career levels. This can be explained by the movement of seasoned, internal talent to new opportunities across our Group.
S
S
1 www.edge-cert.org
2 As of December 2021, the following business units are EDGE certified: Argentina, Australia, Brazil Chile, Corporate Center, Ireland, Mexico, Santander Brazil and Mexico, Spain and Switzerland. This covers 31 percent of our total employee population.
3 www.zurich.com/en/careers/our-people/pay-equality
4 www.zurich.com/en/careers/our-people
5 Reporting excludes Bolivia, Chile sales force, Covermore, Germany and Farmers Management employees. Gender breakdown excludes employees with no declared gender (0.04 percent). For career level, unranked employees are excluded. Unranked employees refer to employees in Germany and Farmers Management who are not assigned career levels and are not included (25 percent).
6 This data excludes NA, for additional information on ethnicity in NA, refer to: 9 actions on racial equity from Zurich North America. www.zurichna.com/knowledge/articles/2020/08/9-actions-on-racial-equity-from-zurich-north-america
1. Introduction
2. Creating positive impact
3. Governance
4. Planet
5. Customers
6. Employees
7. Independent assurance report
6. Our employees: Let’s grow together (continued)
Zurich Insurance Group Annual Report 2021
Group overview
Integrated sustainability disclosure
Governance Risk review
Financial review
176
6.4 Prevention of bribery and corruption
6.4.1 Group Anti-Bribery and Anti-Corruption Policy
Given the serious consequences of financial crime, we invest heavily in controls to prevent and detect any bribery or corruption. We are firmly engaged with strong and effective controls, and we monitor financial, legal and regulatory developments to conduct business in an ethical and compliant manner.
Zurich’s Group Policy Anti-Bribery and Anti-Corruption (Group Policy ABC) sets out the minimum requirements with which its subsidiaries and employees need to comply, and provides a list of best practices and recommendations that business units should adopt.
The Group Policy ABC requires the appointment of an Anti-Bribery and Corruption Officer (ABCO) for each business unit. The ABCO’s duty is to monitor compliance with the Group Policy ABC and the applicable local anti-bribery and anti-corruption framework. The ABCO is also responsible for maintaining the local framework and reviewing it regularly to ensure that it appropriately addresses bribery and corruption risks in the business unit.
Our Group Policy ABC sets out minimum requirements in relation to the following, amongst others:
– Associated persons due diligence.
– Third-party payment due diligence.
– Incentives.
– Gifts, entertainment, and other adavantages.
6.4.2 Training and awareness
We are aware of the importance of fostering a culture of compliance among all our employees, and we understand that creating general awareness and understanding of potential areas of bribery and corruption risk, applicable laws, and our policies is critical to achieving this.
We frequently educate our employees and senior management on topics related to compliance and ethics. This begins with mandatory Code of Conduct training. 1 This annual training raises awareness on what it means to do the right thing and makes employees and managers more confident in making ethical decisions in their day-to-day work. Among other topics covered, the training helps employees to spot and report possible bribery and corruption incidents. In 2021, almost all our employees and senior management completed the training, resulting in a global completion rate of 99.96 percent. The completion rate was above 99 percent in all regions. 2
Employees and managers whose role exposes them to potentially greater bribery and corruption-related risks are also required to undergo enhanced training on how to identify and respond to potential bribery and corruption risks. Group Compliance develops the training in line with the Group Policy ABC and in consideration of local risks, regulations and requirements for each jurisdiction. The training is reviewed on an annual basis to incorporate new developments and requirements. This keeps our employees and management at the forefront of managing the prevention of bribery and corruption and helps us make good on our ambition of being a responsible and ethical business.
6.4.3 Protected advice
As discussed above, Zurich and its employees are all subject to our Group Policy ABC 3 and Code of Conduct 4, and we provide them with training and other resources that aim to prevent and detect misconduct. If employees suspect misconduct, we want them to feel comfortable reporting
their concern and feel supported by the organization when doing so.
There are multiple channels for employees to raise concerns, including local line managers and legal or compliance functions. They can also use the Zurich ethics line (ZEL) to report concerns, either via telephone or online via a web form. The ZEL can also be used by other (external) stakeholders to raise concerns. Reports to the ZEL can be made anonymously. We do not tolerate retaliation against any employee who reports a concern in good faith.
The ZEL is available globally and offers support in local languages. Once a report is received, it is sent to a designated person within Zurich to be reviewed and if necessary investigated. If a report of misconduct is substantiated, we will take remedial actions as appropriate, including potential disciplinary action, and if required, referring the matter to the relevant authorities.
G
G
G
1 The Code of Conduct training includes the topic of anti-bribery and anti-corruption.
2 The Code of Conduct training is shared with Board members and may be shared with various business partners depending on country requirements. Completion for both groups is not centrally tracked.
3 www.zurich.com/sustainability/governance-and-policies/anti-bribery-and-anti-corruption
4 www.zurich.com/about-us/corporate-governance/code-of-conduct
1. Introduction
2. Creating positive impact
3. Governance
4. Planet
5. Customers
6. Employees
7. Independent assurance report
6. Our employees: Let’s grow together (continued)
Zurich Insurance Group Annual Report 2021
Group overview
Integrated sustainability disclosure
Governance Risk review
Financial review
177
1. Introduction
2. Creating positive impact
3. Governance
4. Planet
5. Customers
6. Employees
7. Independent assurance report
Ernst & Young LtdMaagplatz 1P.O. BoxCH-8010 Zurich
Phone: +41 58 286 31 11Fax: +41 58 286 30 04www.ey.com/ch
To the Executive Committee ofZurich Insurance Group Ltd, Zurich
Zurich, February 18, 2022
Independent assurance report
We have been engaged to perform assurance procedures to provide limited assurance on SustainabilityDisclosures of the Zurich Insurance Group Ltd and its consolidated subsidiaries (‘ZIG’ or ‘ZurichInsurance Group’ or ‘Zurich’). Our engagement is focused on selected quantitative performanceindicators (the “performance indicators 2021”) disclosed in the Annual Report 2021 of ZIG “Integratedsustainability disclosure” (“the sustainability disclosures”) for the twelve-month period endingDecember 31, 2021. A listing of these performance indicators 2021 including section references andpage numbers is attached as appendix to our independent assurance report.
Other than as described in the preceding paragraph, which sets out the scope of our engagement,we did not perform assurance procedures on the remaining information included in the sustainabilitydisclosures, and accordingly, we do not express a conclusion on this information.
Applicable criteriaZurich Insurance Company Ltd defined as applicable criteria (the “applicable criteria”):► World Economic Forum’s (WEF) Metrics of Sustainable Value Creation for performance indicators
2021 listed under “WEF IBC metrics” section in the appendix. The guideline is presented on theWEF webpage.
► SASB Insurance reporting standard for performance indicators 2021 listed under “SASB standarddisclosures” section in the appendix. The guideline is presented on the SASB webpage.
► ZIG’s own methodology for performance indicators 2021 listed under “Disclosures based on ZurichInsurance Group Ltd’s own methodology” section in the appendix. A description of the methodologyfor these performance indicators is included in the relevant sections of the sustainability disclosuresas listed in the appendix.
We believe that these criteria are a suitable basis for our limited assurance engagement.
Responsibility of Zurich Insurance Group’s managementZIG’s management is responsible for the selection of the applicable criteria and for the preparationand presentation of the performance indicators 2021 in accordance with the applicable criteria. Thisresponsibility includes the design, implementation, and maintenance of internal controls relevant to thepreparation of the performance indicators 2021 that are free from material misstatement, whether due tofraud or error.
Independence and Quality ControlWe have complied with the independence and other ethical requirements of the International Codeof Ethics for Professional Accountants (including International Independence Standards) of theInternational Ethics Standards Board for Accountants (IESBA Code), which is founded on fundamentalprinciples of integrity, objectivity, professional competence and due care, confidentiality andprofessional behavior.
Our firm applies the International Standard on Quality Control 1 and accordingly maintains acomprehensive system of quality control including documented policies and procedures regardingcompliance with ethical requirements, professional standards and applicable legal and regulatoryrequirements.
7. Independent assurance report
Zurich Insurance Group Annual Report 2021
Group overview
Integrated sustainability disclosure
Governance Risk review
Financial review
178
1. Introduction
2. Creating positive impact
3. Governance
4. Planet
5. Customers
6. Employees
7. Independent assurance report
2
Our responsibilityOur responsibility is to express an opinion on the performance indicators 2021 based on theevidence we have obtained. We conducted our limited assurance engagement in accordance with theInternational Standard on Assurance Engagements (ISAE) 3000 Assurance Engagements Other thanAudits or Reviews of Historical Financial Information. That standard requires that we plan and performthe engagement to obtain limited assurance about whether the performance indicators 2021 are freefrom material misstatement, whether due to fraud or error.
In accordance with the engagement agreement, our duty of care for this engagement only extends tothe management of Zurich Insurance Group.
Based on risk and materiality consideration we have undertaken procedures to obtain sufficientappropriate evidence. The procedures selected depend on the practitioner’s judgment. This includesthe assessment of the risks of material misstatements in the performance indicators 2021. Theprocedures performed in a limited assurance engagement vary in nature and timing from, and are lessin scope than for, a reasonable assurance engagement. Consequently, the level of assurance obtainedin a limited assurance engagement is substantially lower than the assurance that would have beenobtained had we performed a reasonable assurance engagement.
Summary of work performedOur limited assurance procedures included, amongst others, the following work:► Assessment of the suitability of the underlying criteria and their consistent application► Inquiries of company’s representatives responsible for collecting, consolidating and calculating the
performance indicators 2021 in order to assess the process of preparing the data, the reportingsystem, the completeness of the data capture and compilation methods as well as internal controlsto the extent relevant for the limited assurance engagement
► Inspection of the relevant documentation of the systems and processes for compiling, analyzing,and aggregating the performance indicators 2021 and testing such documentation on a samplebasis
► Analytical procedures and inspection of documents on a sample basis with respect to thecompilation and reporting of the performance indicators 2021
► Analytical procedures of the sustainability report regarding plausibility and consistency withperformance indicators 2021
We believe that the evidence obtained is sufficient and appropriate to provide a basis for our limitedassurance conclusion.
Our conclusionBased on the procedures performed and the evidence obtained, nothing has come to our attention thatcauses us to believe that the performance indicators 2021 have not been prepared, in all materialrespects, in accordance with the applicable criteria.
Ernst & Young Ltd
Partner Director
Appendix:Selected quantitative performance indicators (performance indicators 2021)
Isabelle Santenac (QualifiedSignature)
Mark Veser (QualifiedSignature)
7. Independent assurance report (continued)
Zurich Insurance Group Annual Report 2021
Group overview
Integrated sustainability disclosure
Governance Risk review
Financial review
179
1. Introduction
2. Creating positive impact
3. Governance
4. Planet
5. Customers
6. Employees
7. Independent assurance report
3
Appendix: Selected quantitative performance indicators (performance indicators 2021)
WEF IBC metrics► Section 2.3.3 Responsible tax on page 130► Table 10: Turnover in 2021 in Section 6.1.1 Talent attraction and retention on page 173► Table 11: New hires in 2021 in Section 6.1.1 Talent attraction and retention on page 174► KPIs on training spend and Table 13: Average learning hours in 2021 in Section 6.1.2 Training and development
on page 175► Table 14: Ratio of majority vs. minority in 2021 in Section 6.3.2 Global DEIB framework on page 176► Section 6.4.2 Training and awareness on page 177► Financial assistance received from the government in WEF IBC index table online, disclosure ‘Employment and
wealth generation’, reference ‘Economic contribution’
SASB standard disclosures► Figure 13: Probable maximum loss by top three peril regions in Section 4.1.3 Climate risk assessment 2021 on page
143, see also FN-IN-450a.1 in SASB index table online► Revenues related to energy efficiency and carbon technology in Section 4.4.2 Our performance metrics on page 159,
see also FN-IN-410b.1 in SASB index table online► Section 5.1.1 Customer attraction and retention on page 168, see also FN-IN-270a.3 in SASB index table online
Disclosures based on Zurich Insurance Company Ltd.’s own methodology► KPI on percentage of managed procurement spend with suppliers meeting or exceeding Zurich’s expectations in
Section 2.3.2 Sustainable sourcing on page 130► Table 2: Charitable cash contributions 2021 figures in Section 2.3.4 Community investment on page 131► Figure 11: Average expected losses for top five peril regions in Section 4.1.3 Climate risk assessment 2021 on
page 142► KPIs on revenue and number of sustainable products in Section 4.4.2 Our performance metrics on page 158► KPIs on coal and oil sands policy in Section 4.4.2 Our performance metrics on page 160► Table 4: Engagement progress in 2021 in Section 4.4.2 Our performance metrics on page 161► Table 5: Emission reduction targets in Section 4.4.2 Our performance metrics on pages 162 to 163► Table 6: Financing the transition 2021 in Section 4.4.2 Our performance metrics on page 164► KPIs on Assets managed by responsible investor in Section 4.4.2 Our performance metrics on page 165► Figure 21: Proxy voting 2021 in Section 4.4.2 Our performance metrics on page 165► KPI on people benefited and emissions avoided through impact investment portfolio in Section 4.4.2 Our
performance metrics on page 166► Table 8: Impact investing portfolio in Section 4.4.2 Our performance metrics on page 166► KPIs on transparency score in Section 5.3.1 Data commitment on page 170► Table 12: Internal hires in 2021 in Section 6.1.1 Talent attraction and retention on page 174
7. Independent assurance report (continued)
Zurich Insurance Group Annual Report 2021
Group overview
Integrated sustainability disclosure
Governance Risk review
Financial review
180

Zurich Insurance Group Annual Report 2021
Group overview
Integrated sustainability disclosure
Governance Risk review
Financial review
181
THIS PAGE HAS INTENTIONALLY BEEN LEFT BLANK

Zurich Insurance Group Annual Report 2021
Group overview
Integrated sustainability disclosure
Governance Risk review
Financial review
182 Zurich Insurance Group Annual Report 2021
Group overview
Integrated sustainability disclosure
Governance Risk review
Financial review
182
Risk review186 Risk review
Caitlin St. Vincent WelchGroup Legal, Zurich Insurance Group
To watch the video, visit:www.zurich.com/reports/2021/annual-report
Inspiring action
Looking to the future.At Zurich, being a responsible and sustainable company is at the foundation of our business. We’re swiftly reducing our own carbon footprint, helping our customers adopt more sustainable behaviors, supporting employee wellbeing, and helping communities become more resilient to natural hazards and extreme weather. “We need a sustainable future for us and for next generations,” says Caitlin St. Vincent Welch, Group Legal.
Zurich Insurance Group Annual Report 2021
Group overview
Integrated sustainability disclosure
Governance Risk review
Financial review
183 Zurich Insurance Group Annual Report 2021
Group overview
Integrated sustainability disclosure
Governance Risk review
Financial review
183

Message from our Group Chief Risk Officer
Zurich Insurance Group Annual Report 2021
Group overview
Integrated sustainability disclosure
Governance Risk review
Financial review
184
Risk management, at the center of what we do In 2021, we returned toward normality following the severe disruption of the previous year. Zurich successfully navigated through a dynamic environment as the risk landscape evolved rapidly. Despite uncertainty from the continuing pandemic, we remained operationally resilient and maintained our focus on enabling our people to adapt and support our customers.
Maintaining principled and focused risk management was at the center of this journey. The Group’s continued focus on high-priority matters allowed us to identify, assess and manage uncertain situations. Risk management equipped our business leaders with the right level of information and discipline to actively take risks within the Group’s risk appetite and tolerance.
Managing risk to help things go right.In 2021, risk management was at the center of the return toward normality, helping us to navigate through an increasingly dynamic environment. By effectively managing our risks, we maintained our resilience and made sure we were there to help when our customers needed us most.Peter GigerGroup Chief Risk Officer and Group Chief Investment Officer ad interim
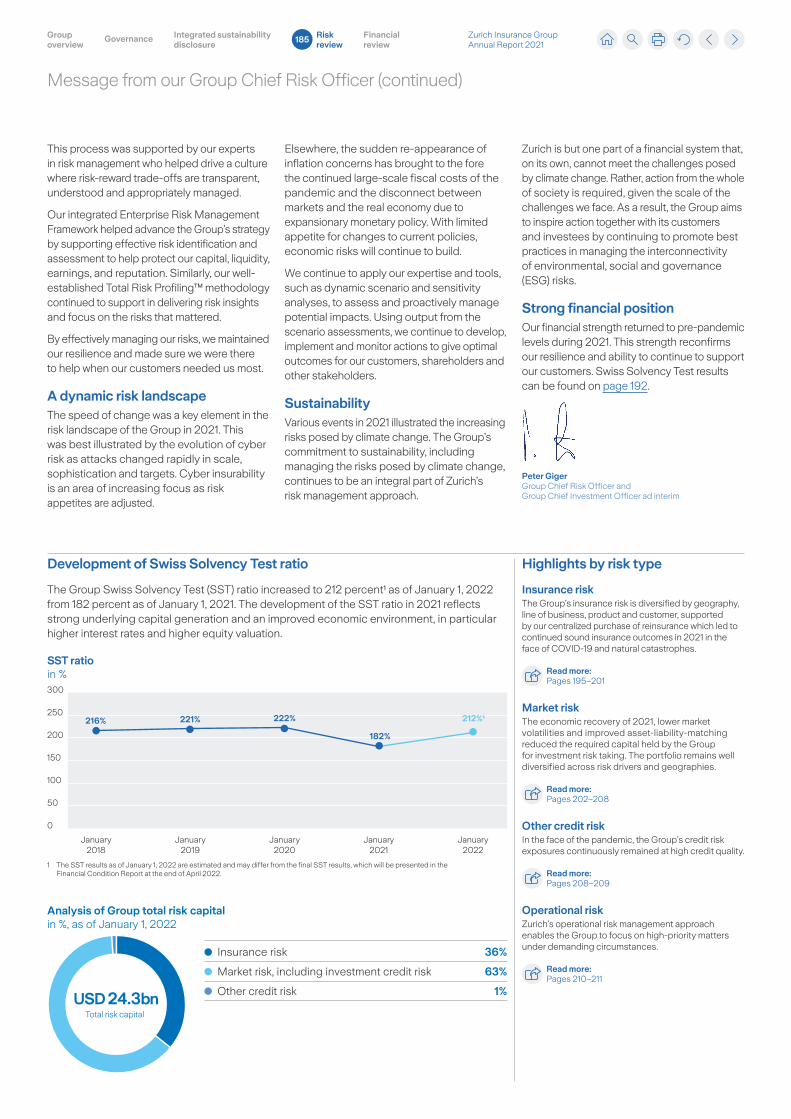
Message from our Group Chief Risk Officer (continued)
Zurich Insurance Group Annual Report 2021
Group overview
Integrated sustainability disclosure
Governance Risk review
Financial review
185
Development of Swiss Solvency Test ratio Highlights by risk type
The Group Swiss Solvency Test (SST) ratio increased to 212 percent¹ as of January 1, 2022 from 182 percent as of January 1, 2021. The development of the SST ratio in 2021 reflects strong underlying capital generation and an improved economic environment, in particular higher interest rates and higher equity valuation.
This process was supported by our experts in risk management who helped drive a culture where risk-reward trade-offs are transparent, understood and appropriately managed.
Our integrated Enterprise Risk Management Framework helped advance the Group’s strategy by supporting effective risk identification and assessment to help protect our capital, liquidity, earnings, and reputation. Similarly, our well-established Total Risk Profiling™ methodology continued to support in delivering risk insights and focus on the risks that mattered.
By effectively managing our risks, we maintained our resilience and made sure we were there to help when our customers needed us most.
A dynamic risk landscapeThe speed of change was a key element in the risk landscape of the Group in 2021. This was best illustrated by the evolution of cyber risk as attacks changed rapidly in scale, sophistication and targets. Cyber insurability is an area of increasing focus as risk appetites are adjusted.
Elsewhere, the sudden re-appearance of inflation concerns has brought to the fore the continued large-scale fiscal costs of the pandemic and the disconnect between markets and the real economy due to expansionary monetary policy. With limited appetite for changes to current policies, economic risks will continue to build.
We continue to apply our expertise and tools, such as dynamic scenario and sensitivity analyses, to assess and proactively manage potential impacts. Using output from the scenario assessments, we continue to develop, implement and monitor actions to give optimal outcomes for our customers, shareholders and other stakeholders.
Sustainability Various events in 2021 illustrated the increasing risks posed by climate change. The Group’s commitment to sustainability, including managing the risks posed by climate change, continues to be an integral part of Zurich’s risk management approach.
Zurich is but one part of a financial system that, on its own, cannot meet the challenges posed by climate change. Rather, action from the whole of society is required, given the scale of the challenges we face. As a result, the Group aims to inspire action together with its customers and investees by continuing to promote best practices in managing the interconnectivity of environmental, social and governance (ESG) risks.
Strong financial positionOur financial strength returned to pre-pandemic levels during 2021. This strength reconfirms our resilience and ability to continue to support our customers. Swiss Solvency Test results can be found on page 192.
Peter GigerGroup Chief Risk Officer and Group Chief Investment Officer ad interim
Insurance riskThe Group’s insurance risk is diversified by geography, line of business, product and customer, supported by our centralized purchase of reinsurance which led to continued sound insurance outcomes in 2021 in the face of COVID-19 and natural catastrophes.
Read more:Pages 195–201
Market riskThe economic recovery of 2021, lower market volatilities and improved asset-liability-matching reduced the required capital held by the Group for investment risk taking. The portfolio remains well diversified across risk drivers and geographies.
Read more:Pages 202–208
Other credit riskIn the face of the pandemic, the Group’s credit risk exposures continuously remained at high credit quality.
Read more:Pages 208–209
Operational riskZurich’s operational risk management approach enables the Group to focus on high-priority matters under demanding circumstances.
Read more:Pages 210–211
Analysis of Group total risk capitalin %, as of January 1, 2022
Insurance risk 36%
Market risk, including investment credit risk 63%
Other credit risk 1%USD 24.3bn
Total risk capital
SST ratioin %300
250
200
150
100
50
0
January2019
January2020
January2021
January2022
January2018
216% 221% 212%�
182%
222%
1 The SST results as of January 1, 2022 are estimated and may differ from the final SST results, which will be presented in the Financial Condition Report at the end of April 2022.
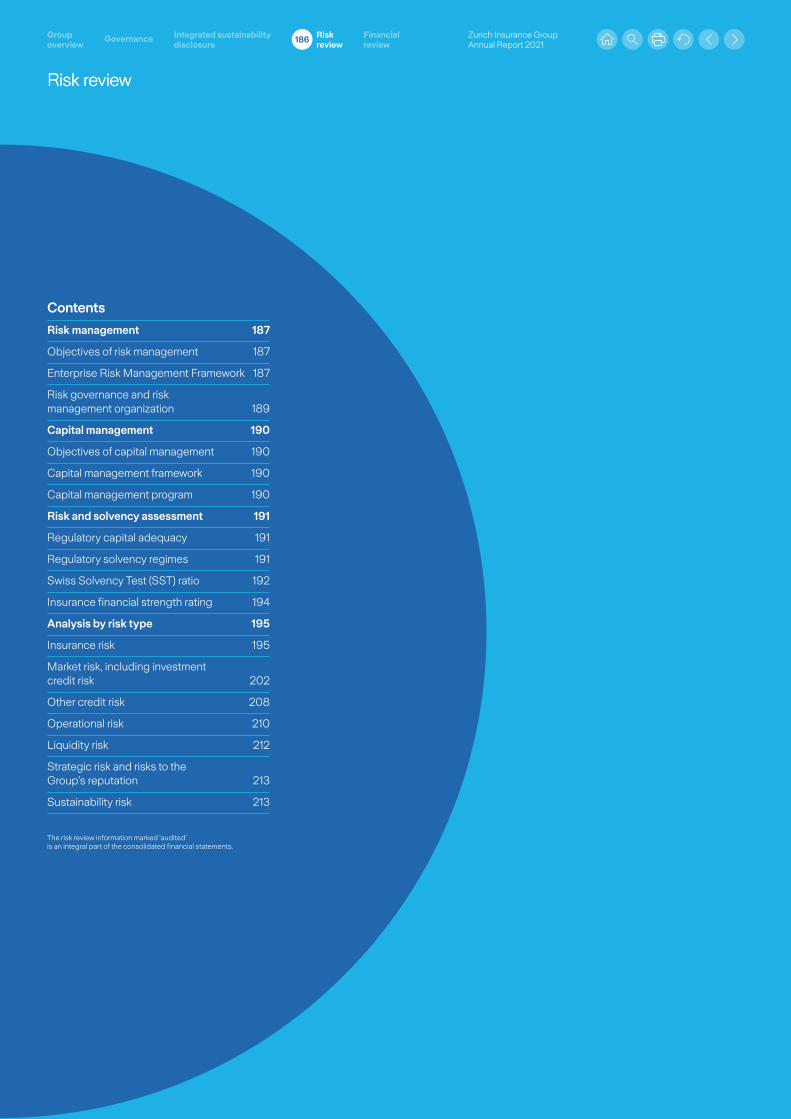
Risk review
Contents
Risk management 187
Objectives of risk management 187
Enterprise Risk Management Framework 187
Risk governance and risk management organization 189
Capital management 190
Objectives of capital management 190
Capital management framework 190
Capital management program 190
Risk and solvency assessment 191
Regulatory capital adequacy 191
Regulatory solvency regimes 191
Swiss Solvency Test (SST) ratio 192
Insurance financial strength rating 194
Analysis by risk type 195
Insurance risk 195
Market risk, including investment credit risk 202
Other credit risk 208
Operational risk 210
Liquidity risk 212
Strategic risk and risks to the Group’s reputation 213
Sustainability risk 213
Risk review
Zurich Insurance Group Annual Report 2021
Group overview
Integrated sustainability disclosure
Governance Risk review
Financial review
186
The risk review information marked ‘audited’ is an integral part of the consolidated financial statements.
Risk review (continued)
Audited
Audited
Zurich Insurance Group Annual Report 2021
Group overview
Integrated sustainability disclosure
Governance Risk review
Financial review
187
Risk management
Objectives of risk management
Taking and managing risk is an integral part of the insurance business. Zurich takes and manages risks in an informed and disciplined manner and within a pre-determined risk appetite and tolerance.
The major risk management objectives at Zurich Insurance Group (Zurich, or the Group) are to:
– Support achievement of the Group’s strategy and protect capital, liquidity, earnings and reputation by monitoring that risks are taken within the Group’s risk tolerance.
– Enhance value creation by embedding disciplined risk-taking in the company’s culture and contributing to an optimal risk-return profile where risk-reward trade-offs are transparent, understood, and risks are appropriately rewarded.
– Efficiently and effectively diversify risk and avoid or mitigate unrewarded risks.
– Encourage openness and transparency to enable effective risk management.
– Support decision-making processes by providing consistent, reliable and timely risk information.
– Protect Zurich’s reputation and brand by promoting a sound culture of risk awareness, and disciplined and informed risk-taking.
Enterprise Risk Management Framework
The Enterprise Risk Management Framework is based on a governance framework that sets forth clear responsibilities for identifying, assessing, managing, monitoring and reporting risks.
The Group’s risk appetite and tolerance statement reflects Zurich’s willingness and capacity to take risks in pursuit of value creation and sets boundaries within which the businesses act. Zurich protects its capital, liquidity, earnings and reputation by monitoring that risks are taken within agreed risk appetite levels and tolerance limits. The Group regularly assesses and, as far as possible, quantifies material risks to which it is exposed.
The Zurich Risk Policy sets the principles and approach for effective risk management throughout the Group. The policy describes the Group’s Enterprise Risk Management Framework and provides a standardized set of risk types. Risk-specific policy manuals provide requirements and procedures to implement the principles in the Zurich Risk Policy.
The Group identifies, assesses, manages, monitors and reports risks that have an impact on the achievement of its strategic objectives by applying its proprietary Total Risk Profiling™ methodology. The methodology allows Zurich to assess risks in terms of severity and likelihood, and supports the definition and implementation of mitigating actions. At Group level, this is an annual process, followed by regular reviews and updates by management.
To foster transparency about risk, the Group regularly reports on its risk profile at business and Group levels. The Group has procedures to refer risk topics to senior management and the Board of Directors in a timely manner.
The risk review information marked ‘audited’ is an integral part of the consolidated financial statements.
Risk review (continued)
Audited
Zurich Insurance Group Annual Report 2021
Group overview
Integrated sustainability disclosure
Governance Risk review
Financial review
188
The Group’s solvency position is disclosed on the basis of the Swiss Solvency Test (SST) ratio. The Group’s SST internal model has been fully approved by the Swiss Financial Supervisory Authority (FINMA). Zurich’s goal is to maintain capital consistent with a ‘AA’ financial strength rating for the Group, which translates into an SST ratio target of 160 percent or above.
The Group applies the Zurich Economic Capital Model (Z-ECM) as an internal metric. Z-ECM provides a key input into the Group’s planning process as an assessment of the Group’s economic risk profile.
Risk-based remunerationBased on the Group’s remuneration rules, the Board of Directors designs and structures remuneration arrangements that support the achievement of strategic and financial objectives and do not encourage inappropriate risk-taking.
Group Risk Management’s role in respect of remuneration and its interaction with Board committees is described in the remuneration report.
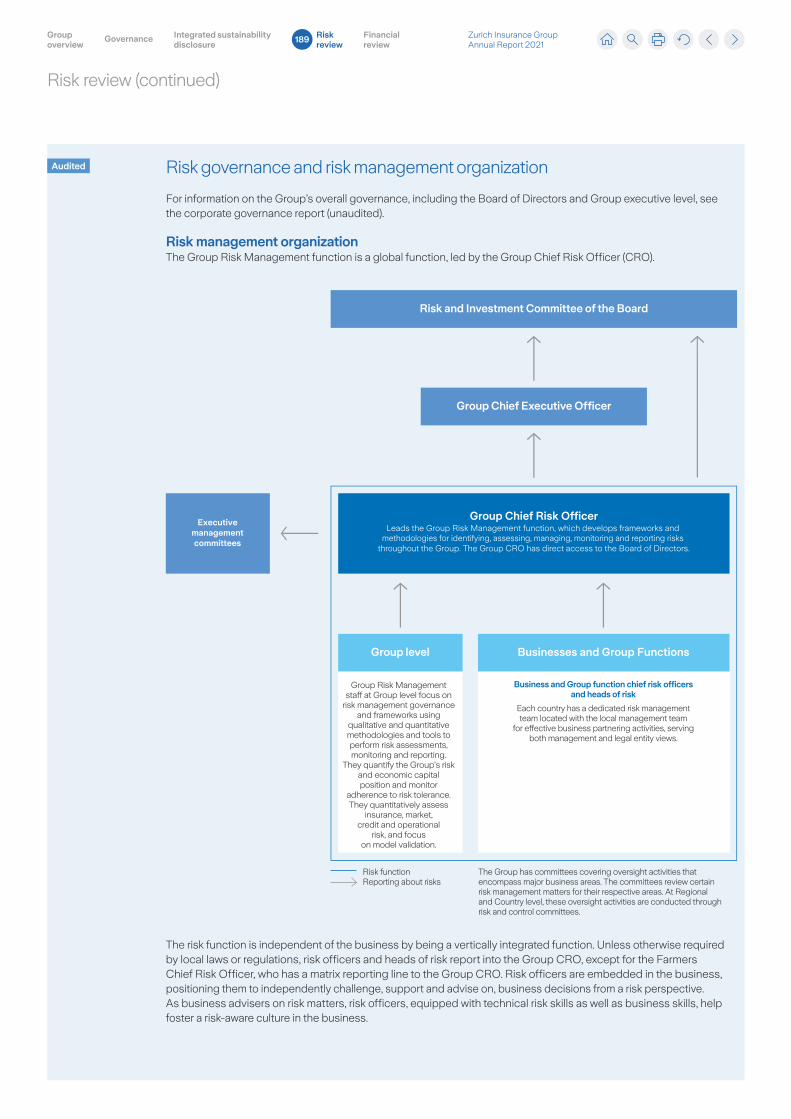
Risk review (continued)
Audited
Zurich Insurance Group Annual Report 2021
Group overview
Integrated sustainability disclosure
Governance Risk review
Financial review
189
Risk governance and risk management organization
For information on the Group’s overall governance, including the Board of Directors and Group executive level, see the corporate governance report (unaudited).
Risk management organizationThe Group Risk Management function is a global function, led by the Group Chief Risk Officer (CRO).
Group Chief Risk OfficerLeads the Group Risk Management function, which develops frameworks and
methodologies for identifying, assessing, managing, monitoring and reporting risks throughout the Group. The Group CRO has direct access to the Board of Directors.
Risk functionReporting about risks
Risk and Investment Committee of the Board
Group Chief Executive Officer
Executivemanagementcommittees
Group level Businesses and Group Functions
Group Risk Management staff at Group level focus on
risk management governance and frameworks using
qualitative and quantitative methodologies and tools to perform risk assessments, monitoring and reporting.
They quantify the Group’s risk and economic capital position and monitor
adherence to risk tolerance. They quantitatively assess
insurance, market, credit and operational
risk, and focus on model validation.
Business and Group function chief risk officers and heads of risk
Each country has a dedicated risk management team located with the local management team
for effective business partnering activities, serving both management and legal entity views.
The Group has committees covering oversight activities that encompass major business areas. The committees review certain risk management matters for their respective areas. At Regional and Country level, these oversight activities are conducted through risk and control committees.
The risk function is independent of the business by being a vertically integrated function. Unless otherwise required by local laws or regulations, risk officers and heads of risk report into the Group CRO, except for the Farmers Chief Risk Officer, who has a matrix reporting line to the Group CRO. Risk officers are embedded in the business, positioning them to independently challenge, support and advise on, business decisions from a risk perspective. As business advisers on risk matters, risk officers, equipped with technical risk skills as well as business skills, help foster a risk-aware culture in the business.
Risk review (continued)
Audited
Zurich Insurance Group Annual Report 2021
Group overview
Integrated sustainability disclosure
Governance Risk review
Financial review
190
Capital management
Objectives of capital management
The Group manages capital to maximize long-term value while maintaining financial strength within its ‘AA’ target range, and meeting regulatory, solvency and rating agency requirements.
As of December 31, 2021, International Financial Reporting Standards (IFRS) shareholders’ equity of USD 37.9 billion and subordinated debt of USD 9.8 billion were part of the capital available in the Group’s SST available financial resources (AFR). Further adjustments usually include items such as intangible assets, deferred tax assets and liabilities, allowing for discounting of liabilities and the value of in-force business, and market-consistent valuation of external debt according to the methodology under SST.
Zurich strives to simplify the Group’s legal entity structure to reduce complexity and increase fungibility of capital.
Capital management framework
The Group’s capital management framework forms the basis for actively managing capital within Zurich. The Group uses a number of different capital models, taking into account economic, regulatory, and rating agency constraints. The Group’s capital and solvency position is monitored and regularly reported to the Executive Committee (ExCo) and Board of Directors.
Zurich’s policy is to allocate capital to businesses earning the highest risk-adjusted returns, and to pool risks and capital as much as possible to operationalize its risk diversification.
The Group’s executive management determines the capital management strategy and sets the principles, standards and policies to execute the strategy. Group Treasury and Capital Management executes the strategy.
Capital management program
The Group’s capital management program comprises various actions to optimize shareholders’ total return and to meet capital needs, while enabling Zurich to take advantage of growth opportunities. Such actions include paying and receiving dividends, capital repayments, share buybacks, issuance of shares, issuance of senior and hybrid debt, securitization and purchase of reinsurance.
The Group seeks to maintain a balance between returns for shareholders and the security that a sound capital position provides, also for our customers. Dividends, share buybacks, and issuances and redemption of debt have a significant influence on capital levels. In 2021, the Group paid a dividend out of retained earnings, bought own shares to reduce future dilution from share-based employee compensation plans and issued senior and hybrid debt to finance redemptions and investments in the Group’s development.
The Swiss Code of Obligations stipulates that dividends may only be paid out of freely distributable reserves or retained earnings. Apart from what is specified by the Swiss Code of Obligations, Zurich Insurance Group Ltd faces no legal restrictions on dividends it may pay to its shareholders. As of December 31, 2021, the amount of the statutory general legal reserve was more than 50 times the paid-in share capital. The ability of the Group’s subsidiaries to pay dividends may be restricted or indirectly influenced by minimum capital and solvency requirements imposed by insurance and other regulators in the countries in which the subsidiaries operate. Other limitations or considerations include foreign exchange control restrictions in some countries, and rating agencies’ methodologies.
For details on issuances and redemptions of debt, see notes 18 and 29 of the consolidated financial statements.
Risk review (continued)
Audited
Zurich Insurance Group Annual Report 2021
Group overview
Integrated sustainability disclosure
Governance Risk review
Financial review
191
Risk and solvency assessment
Regulatory capital adequacy
The Group endeavors to manage its capital so that its regulated entities meet local regulatory capital requirements. In each country in which the Group operates, the local regulator specifies the minimum amount and type of capital that each of the regulated entities must hold in addition to their liabilities. In addition to the minimum capital required to comply with the solvency requirements, the Group aims to hold an adequate buffer under local solvency requirements to ensure regulated subsidiaries can absorb a level of volatility and meet local capital requirements.
Regulatory solvency regimes
Regulatory requirements in SwitzerlandThe Swiss Solvency Test (SST) adopts a risk-based and total balance sheet approach. Insurance companies are required to provide a market-consistent assessment of the value of their assets and liabilities. Possible changes to these balance sheet positions are modelled over a one-year period to arrive at the total required capital.
Under the SST, insurance companies and insurance groups can apply to use company-specific internal models to calculate risk-bearing and target capital, as well as the SST ratio. The SST ratio must be calculated as per January 1 and submitted to the Swiss Financial Market Supervisory Authority (FINMA). Zurich filed with FINMA an SST ratio of 182 percent (unaudited) as of January 1, 2021. Zurich met the regulatory solvency requirements in Switzerland throughout 2021.
The estimated SST ratio as of January 1, 2022 stands at 212 percent (unaudited). The final SST ratio as of January 1, 2022 will be filed with FINMA by the end of April 2022 and is subject to review by FINMA.
Regulatory requirements in the European Economic Area (EEA)The main regulatory framework governing the Group’s subsidiaries in the EEA is Solvency II. This is a risk-based capital framework which covers capital requirements (pillar 1), governance and risk management (pillar 2) and reporting (pillar 3). All EEA-based legal entities of the Group use the Solvency II standard formula for their pillar 1 requirements with the exception of Zurich Insurance plc (Ireland) that applies an approved internal model.
Regulatory requirements in the UKThe United Kingdom left the EU and the EEA on January 31, 2020 and the transition period ended on December 31, 2020, meaning UK regulations can diverge from Solvency II regulatory requirements. As of December 31, 2021 the UK regulations have not materially diverged.
Regulatory requirements in the U.S.In the U.S., required capital is determined to be ‘company action level risk-based capital’ calculated using the National Association of Insurance Commissioners’ risk-based capital model. This method, which builds on statutory accounts, measures the minimum amount of capital for an insurance company to support its overall business operations by taking into account its size and risk profile.
Regulatory requirements in other jurisdictionsEvery country has a capital standard for insurance companies. Several jurisdictions (e.g., Brazil and Mexico) have implemented approaches similar to Solvency II.
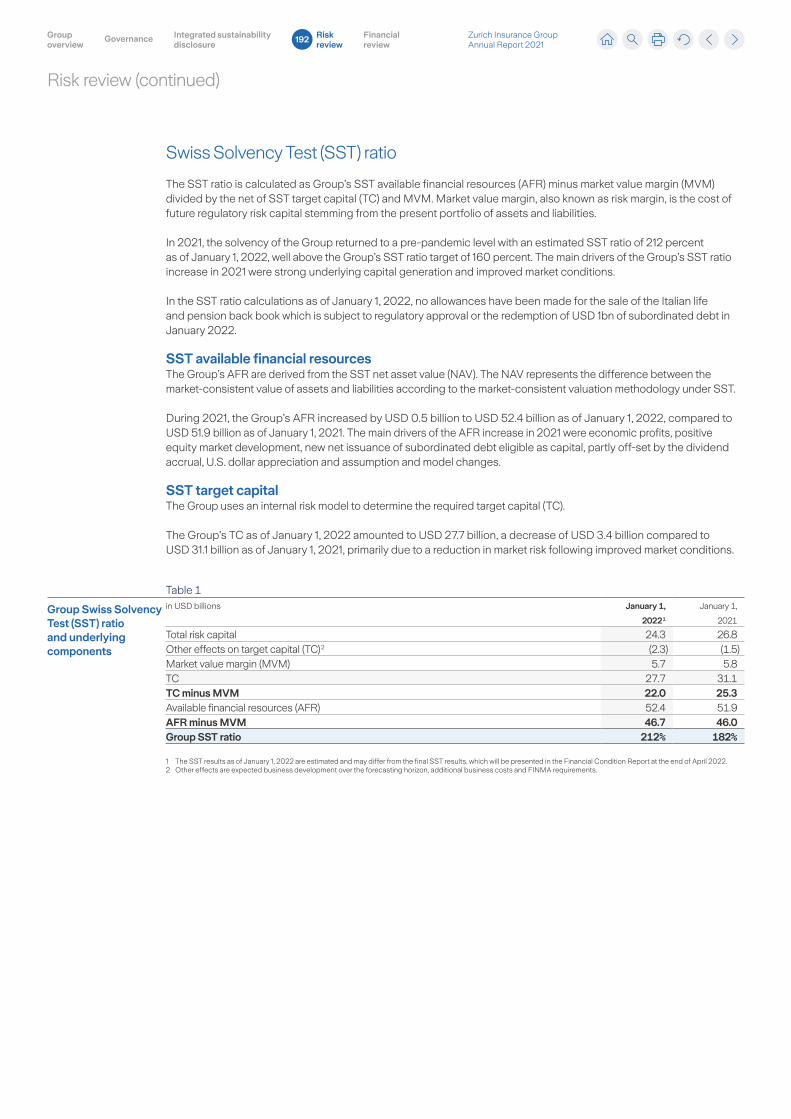
Risk review (continued)
Zurich Insurance Group Annual Report 2021
Group overview
Integrated sustainability disclosure
Governance Risk review
Financial review
192
Swiss Solvency Test (SST) ratio
The SST ratio is calculated as Group’s SST available financial resources (AFR) minus market value margin (MVM) divided by the net of SST target capital (TC) and MVM. Market value margin, also known as risk margin, is the cost of future regulatory risk capital stemming from the present portfolio of assets and liabilities.
In 2021, the solvency of the Group returned to a pre-pandemic level with an estimated SST ratio of 212 percent as of January 1, 2022, well above the Group’s SST ratio target of 160 percent. The main drivers of the Group’s SST ratio increase in 2021 were strong underlying capital generation and improved market conditions.
In the SST ratio calculations as of January 1, 2022, no allowances have been made for the sale of the Italian life and pension back book which is subject to regulatory approval or the redemption of USD 1bn of subordinated debt in January 2022.
SST available financial resourcesThe Group’s AFR are derived from the SST net asset value (NAV). The NAV represents the difference between the market-consistent value of assets and liabilities according to the market-consistent valuation methodology under SST.
During 2021, the Group’s AFR increased by USD 0.5 billion to USD 52.4 billion as of January 1, 2022, compared to USD 51.9 billion as of January 1, 2021. The main drivers of the AFR increase in 2021 were economic profits, positive equity market development, new net issuance of subordinated debt eligible as capital, partly off-set by the dividend accrual, U.S. dollar appreciation and assumption and model changes.
SST target capitalThe Group uses an internal risk model to determine the required target capital (TC).
The Group’s TC as of January 1, 2022 amounted to USD 27.7 billion, a decrease of USD 3.4 billion compared to USD 31.1 billion as of January 1, 2021, primarily due to a reduction in market risk following improved market conditions.
Table 1
Group Swiss Solvency Test (SST) ratio and underlying components
in USD billions January 1,
2022 1
January 1,
2021
Total risk capital 24.3 26.8Other effects on target capital (TC) 2 (2.3) (1.5)Market value margin (MVM) 5.7 5.8TC 27.7 31.1TC minus MVM 22.0 25.3Available financial resources (AFR) 52.4 51.9AFR minus MVM 46.7 46.0Group SST ratio 212% 182%
1 The SST results as of January 1, 2022 are estimated and may differ from the final SST results, which will be presented in the Financial Condition Report at the end of April 2022.2 Other effects are expected business development over the forecasting horizon, additional business costs and FINMA requirements.
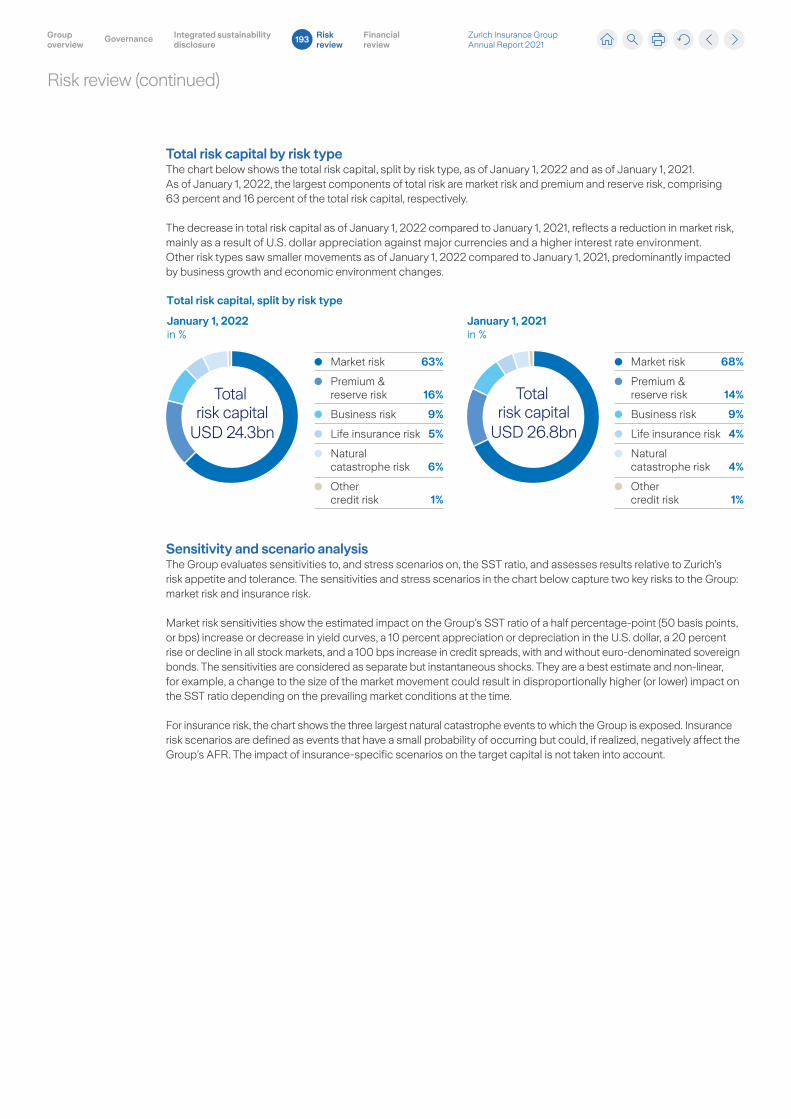
Risk review (continued)
Zurich Insurance Group Annual Report 2021
Group overview
Integrated sustainability disclosure
Governance Risk review
Financial review
193
Total risk capital by risk typeThe chart below shows the total risk capital, split by risk type, as of January 1, 2022 and as of January 1, 2021. As of January 1, 2022, the largest components of total risk are market risk and premium and reserve risk, comprising 63 percent and 16 percent of the total risk capital, respectively.
The decrease in total risk capital as of January 1, 2022 compared to January 1, 2021, reflects a reduction in market risk, mainly as a result of U.S. dollar appreciation against major currencies and a higher interest rate environment. Other risk types saw smaller movements as of January 1, 2022 compared to January 1, 2021, predominantly impacted by business growth and economic environment changes.
Total risk capital, split by risk type
January 1, 2021in %
January 1, 2022in %
Market risk 63%
Premium & reserve risk 16%
Business risk 9%
Life insurance risk 5%
Natural catastrophe risk 6%
Othercredit risk 1%
Market risk 68%
Premium & reserve risk 14%
Business risk 9%
Life insurance risk 4%
Natural catastrophe risk 4%
Othercredit risk 1%
Total risk capital
USD 24.3bn
Total risk capital
USD 26.8bn
Sensitivity and scenario analysisThe Group evaluates sensitivities to, and stress scenarios on, the SST ratio, and assesses results relative to Zurich’s risk appetite and tolerance. The sensitivities and stress scenarios in the chart below capture two key risks to the Group: market risk and insurance risk.
Market risk sensitivities show the estimated impact on the Group’s SST ratio of a half percentage-point (50 basis points, or bps) increase or decrease in yield curves, a 10 percent appreciation or depreciation in the U.S. dollar, a 20 percent rise or decline in all stock markets, and a 100 bps increase in credit spreads, with and without euro-denominated sovereign bonds. The sensitivities are considered as separate but instantaneous shocks. They are a best estimate and non-linear, for example, a change to the size of the market movement could result in disproportionally higher (or lower) impact on the SST ratio depending on the prevailing market conditions at the time.
For insurance risk, the chart shows the three largest natural catastrophe events to which the Group is exposed. Insurance risk scenarios are defined as events that have a small probability of occurring but could, if realized, negatively affect the Group’s AFR. The impact of insurance-specific scenarios on the target capital is not taken into account.
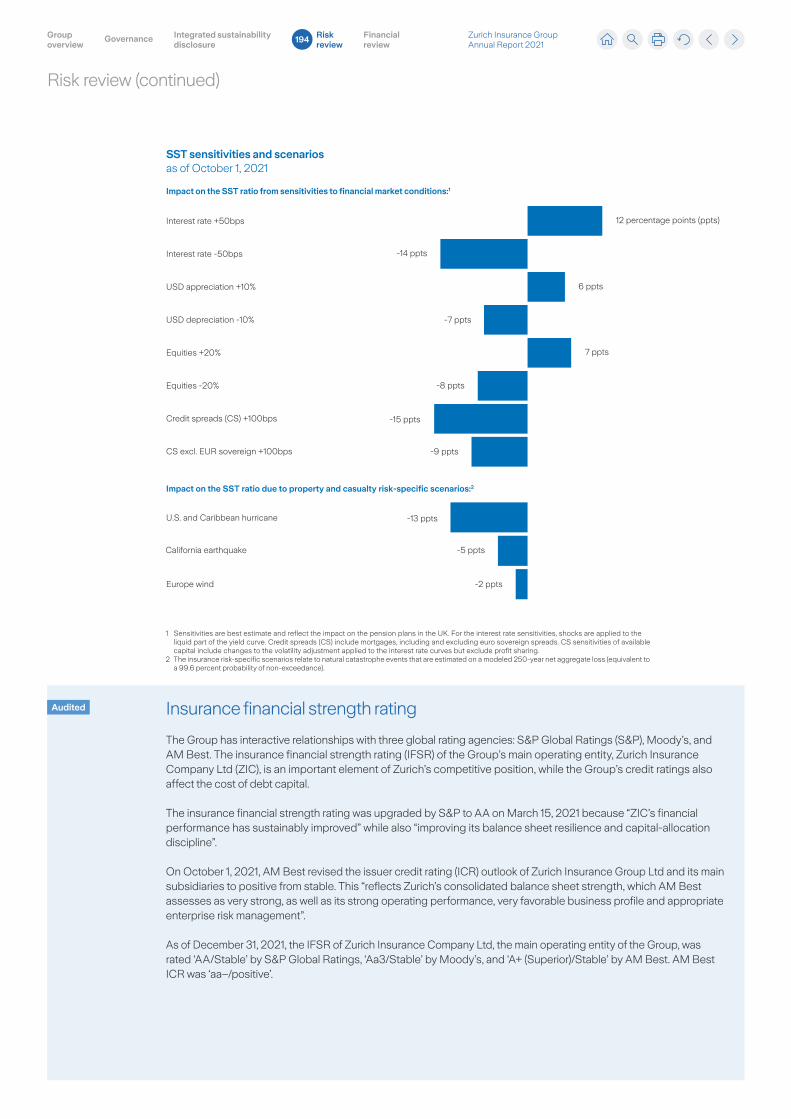
Risk review (continued)
Audited
Zurich Insurance Group Annual Report 2021
Group overview
Integrated sustainability disclosure
Governance Risk review
Financial review
194
Insurance financial strength rating
The Group has interactive relationships with three global rating agencies: S&P Global Ratings (S&P), Moody’s, and AM Best. The insurance financial strength rating (IFSR) of the Group’s main operating entity, Zurich Insurance Company Ltd (ZIC), is an important element of Zurich’s competitive position, while the Group’s credit ratings also affect the cost of debt capital.
The insurance financial strength rating was upgraded by S&P to AA on March 15, 2021 because “ZIC’s financial performance has sustainably improved” while also “improving its balance sheet resilience and capital-allocation discipline”.
On October 1, 2021, AM Best revised the issuer credit rating (ICR) outlook of Zurich Insurance Group Ltd and its main subsidiaries to positive from stable. This “reflects Zurich’s consolidated balance sheet strength, which AM Best assesses as very strong, as well as its strong operating performance, very favorable business profile and appropriate enterprise risk management”.
As of December 31, 2021, the IFSR of Zurich Insurance Company Ltd, the main operating entity of the Group, was rated ‘AA/Stable’ by S&P Global Ratings, ‘Aa3/Stable’ by Moody’s, and ‘A+ (Superior)/Stable’ by AM Best. AM Best ICR was ‘aa–/positive’.
Impact on the SST ratio from sensitivities to financial market conditions:1
U.S. and Caribbean hurricane
California earthquake
Europe wind
Impact on the SST ratio due to property and casualty risk-specific scenarios:2
Interest rate +50bps
Interest rate -50bps
USD appreciation +10%
USD depreciation -10%
Equities +20%
Equities -20%
Credit spreads (CS) +100bps
CS excl. EUR sovereign +100bps
SST sensitivities and scenariosas of October 1, 2021
1 Sensitivities are best estimate and reflect the impact on the pension plans in the UK. For the interest rate sensitivities, shocks are applied to the liquid part of the yield curve. Credit spreads (CS) include mortgages, including and excluding euro sovereign spreads. CS sensitivities of available capital include changes to the volatility adjustment applied to the interest rate curves but exclude profit sharing.
2 The insurance risk-specific scenarios relate to natural catastrophe events that are estimated on a modeled 250-year net aggregate loss (equivalent to a 99.6 percent probability of non-exceedance).
-14 ppts
6 ppts
-7 ppts
-8 ppts
-15 ppts
-9 ppts
-5 ppts
-2 ppts
-13 ppts
12 percentage points (ppts)
7 ppts
Risk review (continued)
Audited
Zurich Insurance Group Annual Report 2021
Group overview
Integrated sustainability disclosure
Governance Risk review
Financial review
195
Analysis by risk type
Insurance risk
Insurance risk is the risk of deviations in the timing, frequency or severity of insured events from that expected, leading to loss, including adverse change in the value of insurance liabilities (Life and Property & Casualty (P&C)). This may result from inherent uncertainty of insured events or losses, inadequate or ineffective underwriting or accumulation management, inappropriate product development, pricing, claims management, reserving or reinsurance. The profitability of insurance business is also susceptible to business risk in the form of unexpected changes in expenses, policyholders’ behavior, and fluctuations in new business volumes. Zurich manages insurance risk through:
– Specific underwriting and claims standards and controls.
– Robust reserving processes.
– External reinsurance.
Property & Casualty (P&C) insurance riskP&C insurance risk arises from coverage provided for motor, property, liability, special lines and worker injury. It comprises premium and reserve risk, catastrophe risk, and business risk. Premium and reserve risk covers uncertainties in the frequency of the occurrence of the insured events as well as in the severity of the resulting claims. Catastrophe risk predominantly relates to uncertainty around natural catastrophes. Business risk for P&C predominantly relates to unexpected increases in the expenses relating to claims handling, underwriting, and administration.
Management of Property & Casualty (P&C) insurance riskThe Group’s underwriting strategy takes advantage of the diversification of P&C risks across lines of business, customers and geographic regions. Zurich defines Group-wide governance for insurance risk including for new products. Underwriting discipline is a fundamental part of managing insurance risk. The Group sets limits on underwriting capacity and delegates authority to individuals based on their specific expertise and sets appropriate underwriting and pricing guidelines. Technical reviews assure that underwriters perform within authorities and adhere to underwriting policies.
P&C insurance reserves are regularly estimated, reviewed and monitored by qualified and experienced actuaries at local, regional and Group levels. To arrive at their reserve estimates, the actuaries take into consideration, among other things, the latest available facts, trends and patterns of loss payments. Inflation is monitored with insights feeding into actuarial reserving models and Zurich’s underwriting processes and pricing.
To ensure a common understanding of business insights and new trends for reserve analysis, financial plans, underwriting and pricing decisions, the Group has established a culture of continuous cross-functional collaboration. For this, underwriting, actuarial (pricing and reserving), claims, finance, sales and distribution, risk engineering and risk management contribute to quarterly meetings at local and Group level.
Zurich’s Emerging and Sustainability Risk Committee – with cross-functional expertise from core insurance functions such as underwriting, claims and risk management – identifies, assesses and recommends actions for emerging risks.
Governance is in place to ensure appropriate focus on top-line targets and profitability. Reinsurance is deployed to help manage insurance risk. Group Risk Management also provides independent assurance through risk reviews.
The Group is exposed to losses that could arise from natural and man-made catastrophes. The main concentrations of risks arising from such potential catastrophes are regularly reported to executive management. The most important peril regions for natural catastrophes are U.S. and Caribbean hurricane, California earthquake and European windstorm.
Risk review (continued)
Audited
Zurich Insurance Group Annual Report 2021
Group overview
Integrated sustainability disclosure
Governance Risk review
Financial review
196
Natural catastrophesThe Group uses third-party models, adjusted to Zurich’s view, to manage its underwriting, ensure accumulations stay within intended exposure limits and assess the capital requirement due to natural catastrophes. Consistent with this view on natural catastrophes, Zurich performs profitability assessments and strategic capacity allocations, and chooses the type and quantity of reinsurance it buys.
To ensure global consistency, exposures to natural catastrophes are modeled by a dedicated Group function. Potential losses from property, motor and marine policies with material exposure in hazard-prone geographical areas are probabilistically modeled, as well as worker injury policies with material exposure in U.S. seismic zones. Losses for other lines of business are estimated based on adjustments to these modeled results. Risk modeling mainly addresses weather- induced perils such as wind, flood, tornado, and hail, and geological-induced perils such as earthquake.
Zurich regularly reviews and expands the scope and sophistication of its modeling and strives to improve data quality. Zurich has invested in a diversified, multi-vendor-based catastrophe modeling ecosystem and in expanding its catastrophe research and development capabilities to complement existing expertise in natural catastrophe risk management (e.g., risks relating to climate change, cyber, communicable diseases, and casualty catastrophes).
Zurich supplements internal know-how with external knowledge (e.g., the Advisory Council for Catastrophes) and is a shareholder of PERILS AG, Switzerland, a catastrophe exposure and loss data aggregation and estimation firm. Zurich is also a member of the open-source initiative, Oasis Loss Modelling Framework.
COVID-19 pandemicZurich has developed scenario modeling capabilities for the COVID-19 pandemic which continue to be refined based on claims data. The scope in terms of lines of business includes primarily property, travel, accident and health, and credit and surety. The scenario modeling continues to inform the Group about the financial impact of COVID-19 and understand the main sensitivities. The data and risk insights gained from COVID-19 were used to build a model to better assess the risk in the P&C portfolio from pandemics.
Man-made catastrophesMan-made catastrophes include events such as industrial accidents, terrorism and cyber attacks.
For terrorism, worker injury and property risk exposures are analyzed to identify areas with significant risk concentration. Other lines of business are assessed, although the potential exposure is not as significant. A vendor-provided catastrophe model is used to evaluate potential exposures in every major U.S. city. The Group’s analysis for the P&C business has shown that its exposures outside of North America are lower, in a large part due to government-provided pools. Outside the modeled areas, exposure concentrations are identified in Zurich’s Risk Exposure Data Store (REDS). Exposure concentrations for location-based man-made scenarios, other than terrorism, are also identified in REDS, for example, industrial explosions at global ports.
The Group uses third-party models to manage its underwriting and accumulations for cyber and casualty catastrophe risks. The Group actively monitors and manages its cyber exposure and continues to refine products to ensure their appropriateness. Improving modeling capabilities and data quality for cyber and casualty catastrophe risks are key focus areas.
Concentration of Property & Casualty (P&C) insurance riskThe Group defines concentration risk in the P&C business as the risk of exposure to increased losses associated with inadequately diversified portfolios. Concentration risk for a P&C insurer may arise due to a concentration of business written within a geographical area or of underlying risks covered.
Tables 2.a and 2.b show the Group’s concentration of risk within the P&C business by region and line of business based on direct written premiums before reinsurance. P&C premiums ceded to reinsurers (including retrocessions) amounted to USD 9.2 billion and USD 8.6 billion for the years ended December 31, 2021 and 2020, respectively. Reinsurance programs are managed on a global basis, and therefore, the net premium after reinsurance is monitored on an aggregated basis.
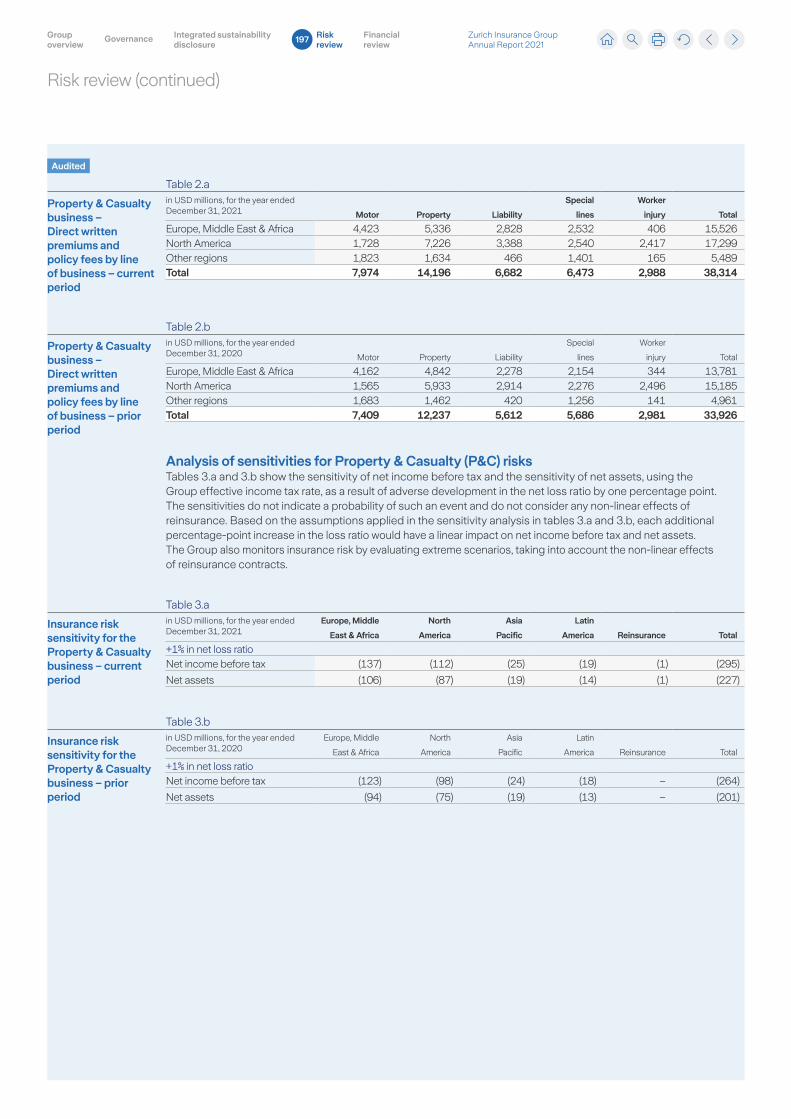
Risk review (continued)
Audited
Zurich Insurance Group Annual Report 2021
Group overview
Integrated sustainability disclosure
Governance Risk review
Financial review
197
Table 2.a
Property & Casualty business – Direct written premiums and policy fees by line of business – current period
in USD millions, for the year ended December 31, 2021 Motor Property Liability
Special
lines
Worker
injury Total
Europe, Middle East & Africa 4,423 5,336 2,828 2,532 406 15,526North America 1,728 7,226 3,388 2,540 2,417 17,299Other regions 1,823 1,634 466 1,401 165 5,489Total 7,974 14,196 6,682 6,473 2,988 38,314
Table 2.b
Property & Casualty business – Direct written premiums and policy fees by line of business – prior period
in USD millions, for the year ended December 31, 2020 Motor Property Liability
Special
lines
Worker
injury Total
Europe, Middle East & Africa 4,162 4,842 2,278 2,154 344 13,781North America 1,565 5,933 2,914 2,276 2,496 15,185Other regions 1,683 1,462 420 1,256 141 4,961Total 7,409 12,237 5,612 5,686 2,981 33,926
Analysis of sensitivities for Property & Casualty (P&C) risksTables 3.a and 3.b show the sensitivity of net income before tax and the sensitivity of net assets, using the Group effective income tax rate, as a result of adverse development in the net loss ratio by one percentage point. The sensitivities do not indicate a probability of such an event and do not consider any non-linear effects of reinsurance. Based on the assumptions applied in the sensitivity analysis in tables 3.a and 3.b, each additional percentage-point increase in the loss ratio would have a linear impact on net income before tax and net assets. The Group also monitors insurance risk by evaluating extreme scenarios, taking into account the non-linear effects of reinsurance contracts.
Table 3.a
Insurance risk sensitivity for the Property & Casualty business – current period
in USD millions, for the year ended December 31, 2021
Europe, Middle
East & Africa
North
America
Asia
Pacific
Latin
America Reinsurance Total
+1% in net loss ratioNet income before tax (137) (112) (25) (19) (1) (295)
Net assets (106) (87) (19) (14) (1) (227)
Table 3.b
Insurance risk sensitivity for the Property & Casualty business – prior period
in USD millions, for the year ended December 31, 2020
Europe, Middle
East & Africa
North
America
Asia
Pacific
Latin
America Reinsurance Total
+1% in net loss ratioNet income before tax (123) (98) (24) (18) – (264)
Net assets (94) (75) (19) (13) – (201)
Risk review (continued)
Audited
Zurich Insurance Group Annual Report 2021
Group overview
Integrated sustainability disclosure
Governance Risk review
Financial review
198
Life insurance riskThe risks associated with life insurance include:
Life liability risk
– Mortality risk – when, on average, the death incidence among policyholders is higher than expected.
– Longevity risk – when, on average, annuitants live longer than expected.
– Morbidity risk – when, on average, the incidence of disability due to sickness or accident among policyholders is higher than expected, or recovery from disability is lower than expected.
Life business risk
– Policyholder behavior risk – when, on average, policyholders discontinue or reduce contributions, or withdraw benefits prior to the maturity of contracts at a rate that is different from expected.
– Expense risk – when expenses incurred in acquiring and administering policies are higher than expected.
– New business risk – when volumes of new business are insufficient to cover fixed acquisition expenses.
Market risk
– Market risk – the risk associated with the Group’s balance sheet positions where the value or cash flow depends on financial markets, which is analyzed in the ‘market risk, including investment credit risk’ section.
Credit risk
– Credit risk – the risk associated with a loss or potential loss from counterparties failing to fulfill their financial obligations, which is analyzed in the ‘market risk, including investment credit risk’ and ‘other credit risk’ sections.
Management of Life insurance riskThe Group’s Life underwriting results are based on the assumptions relating to life insurance risks. The actual experience may differ to that expected at the time of writing the business. For example, mortality could be either higher or lower than expected due to an unexpectedly harsh or benign flu season.
To understand the potential impact of experience differing from expectations, Zurich uses models to perform sensitivity analyses. The impact of changing the assumptions is considered under different scenarios across the risk types and products. Changes relating to absolute level and trend development in assumptions are considered by product category. For example, Zurich looks at the impact of an increase in morbidity rates for protection products or changes in the level and trend of longevity for annuity products. These analyses assist in understanding how sensitive the business is to changes in various assumptions and where there are benefits of having a diversified portfolio of risks and products. Changes in the same assumption can have a positive impact on one product and a negative impact on another. For example, people living longer than expected may have a positive impact on products that offer life cover, as claims are then paid later than expected, but could have a negative impact on annuity products as payments are made for longer than expected. At Zurich, the Life liability risks are managed through established processes with requirements described in the Zurich Risk Policy.
The Group has local product development and approval committees and a Group-level committee to review potential new life products that could significantly increase or change the nature of the risks or introduce new risks. The Group also regularly reviews the continued suitability and the potential risks of existing life products open to new business to ensure sustainability of the business.
Product pricing involves setting assumptions relating to life insurance risks. Local teams have responsibility for the pricing of the products in line with the experience and emerging trends observed in each market. The emerging experience is regularly monitored and compared against expectations. Where permitted, premiums are adjusted for factors such as age, gender, and smoker status to reflect the corresponding risks. Policy terms and conditions and disclosure requirements are designed to mitigate the risk arising from non-standard and unpredictable risks that could result in a severe financial loss.
The underwriting process forms an important part of risk management and risk selection for life insurance risks. This process is supported through setting standards in the Zurich Risk Policy and providing support through additional underwriting guidelines.
Risk review (continued)
Audited
Zurich Insurance Group Annual Report 2021
Group overview
Integrated sustainability disclosure
Governance Risk review
Financial review
199
Where required and appropriate, life insurance risks are also managed using reinsurance.
Unit-linked products are designed to reduce much of the market and credit risk associated with the Group’s traditional business offerings. Risks that are inherent in these products are largely passed on to the policyholder, although a portion of the Group’s management fees is linked to the value of funds under management, and hence is at risk if fund values decrease. Contracts may have minimum guaranteed death benefits where the sum at risk depends on the fair value of the underlying investments. Other life insurance liabilities include traditional life insurance products, such as protection and life annuity products.
Protection products (including disability products) provide benefits linked to policyholders’ life and health and mainly carry mortality and morbidity risks. Changes in medical treatments and lifestyle changes are among the most significant factors that could result in earlier or more claims than expected or customers claiming for longer than expected. Disability, when defined in terms of the ability to perform an occupation, could also be affected by adverse economic conditions. This impact could come through, for example, an increase in claims relating to mental health conditions triggered by an economic downturn.
Life annuity products provide benefits that are paid to the customer either for a selected number of years, or until they die. Therefore, these products carry longevity risk as people living longer than expected can have a material impact on these products. Medical advances and improved social conditions that lead to increased longevity are significant risk drivers for these products. Annuitant (beneficiary) mortality assumptions include allowance for future mortality improvements. The trends in mortality improvements are monitored to ensure that changes in experience are considered. The exposure to longevity risk at a Group level is measured regularly and compared against the limit set by the Group.
The Group is exposed to risks posed by policyholder behavior and fluctuating expenses. These are mitigated by designing products that, as closely as possible, match revenue and expenses associated with the contract.
The Group is also exposed to investment and surrender risks related to bank-owned life insurance contracts sold in the U.S. These risks have reduced significantly in recent years as several significant policies have switched into less risky investment divisions. See heading ‘other contracts’ in note 7 of the consolidated financial statements for additional information.
In the past, low interest rates have led to an increase in both Life business risks and Life liability risks (especially longevity risk). While interest rates have recently started to rise, the level of interest rates remains an important factor in the evaluation of insurance risks.
Furthermore, interest rate guarantees (with concentration in traditional guaranteed business in Germany, Switzerland and Italy and variable annuity business in the U.S. containing minimum guaranteed death benefits) expose Zurich to financial losses that may arise as a result of adverse movements in interest rates. These guarantees are managed through a combination of asset-liability management and hedging.
The Group has a dynamic hedging strategy to reduce the investment risk associated with the closed book of variable annuitants written by its U.S. subsidiary Zurich American Life Insurance Company. This exposure has fallen substantially as a result of several policy buyback programs since 2015.
Diversification across regions and businesses, as shown in table 4 below, contributes to reducing the impacts of the risks associated with the Life business described above.
Concentration of Life insurance riskThe Group defines concentration risk in the Life business as the risk of exposure to increased losses associated with inadequately diversified portfolios of assets or obligations. Concentration risk for a life insurer may arise with respect to investments in a geographical area, economic sector, or individual issuers, or due to a concentration of business written within a geographical area, of a product type, or of underlying risks covered.
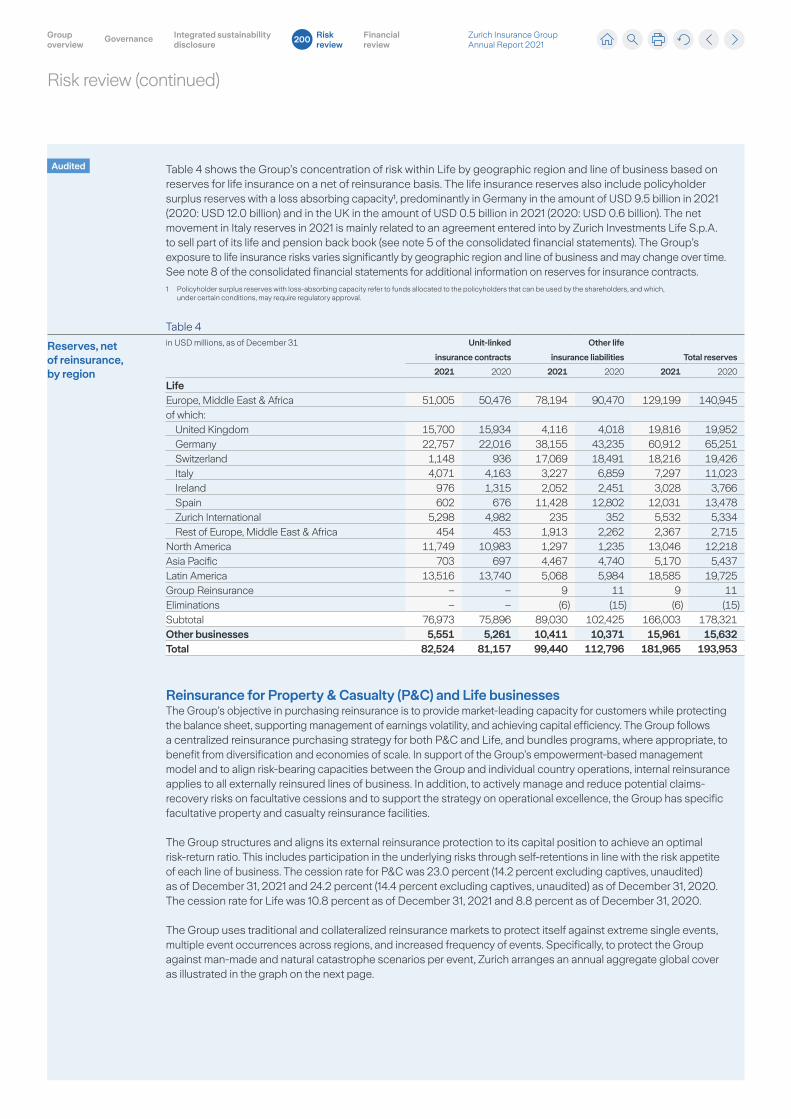
Risk review (continued)
Audited
Zurich Insurance Group Annual Report 2021
Group overview
Integrated sustainability disclosure
Governance Risk review
Financial review
200
Table 4 shows the Group’s concentration of risk within Life by geographic region and line of business based on reserves for life insurance on a net of reinsurance basis. The life insurance reserves also include policyholder surplus reserves with a loss absorbing capacity¹, predominantly in Germany in the amount of USD 9.5 billion in 2021 (2020: USD 12.0 billion) and in the UK in the amount of USD 0.5 billion in 2021 (2020: USD 0.6 billion). The net movement in Italy reserves in 2021 is mainly related to an agreement entered into by Zurich Investments Life S.p.A. to sell part of its life and pension back book (see note 5 of the consolidated financial statements). The Group’s exposure to life insurance risks varies significantly by geographic region and line of business and may change over time. See note 8 of the consolidated financial statements for additional information on reserves for insurance contracts.
1 Policyholder surplus reserves with loss-absorbing capacity refer to funds allocated to the policyholders that can be used by the shareholders, and which, under certain conditions, may require regulatory approval.
Table 4
Reserves, net of reinsurance, by region
in USD millions, as of December 31 Unit-linked
insurance contracts
Other life
insurance liabilities Total reserves
2021 2020 2021 2020 2021 2020
LifeEurope, Middle East & Africa 51,005 50,476 78,194 90,470 129,199 140,945of which:
United Kingdom 15,700 15,934 4,116 4,018 19,816 19,952Germany 22,757 22,016 38,155 43,235 60,912 65,251Switzerland 1,148 936 17,069 18,491 18,216 19,426Italy 4,071 4,163 3,227 6,859 7,297 11,023Ireland 976 1,315 2,052 2,451 3,028 3,766Spain 602 676 11,428 12,802 12,031 13,478Zurich International 5,298 4,982 235 352 5,532 5,334Rest of Europe, Middle East & Africa 454 453 1,913 2,262 2,367 2,715
North America 11,749 10,983 1,297 1,235 13,046 12,218Asia Pacific 703 697 4,467 4,740 5,170 5,437Latin America 13,516 13,740 5,068 5,984 18,585 19,725Group Reinsurance – – 9 11 9 11Eliminations – – (6) (15) (6) (15)Subtotal 76,973 75,896 89,030 102,425 166,003 178,321Other businesses 5,551 5,261 10,411 10,371 15,961 15,632Total 82,524 81,157 99,440 112,796 181,965 193,953
Reinsurance for Property & Casualty (P&C) and Life businessesThe Group’s objective in purchasing reinsurance is to provide market-leading capacity for customers while protecting the balance sheet, supporting management of earnings volatility, and achieving capital efficiency. The Group follows a centralized reinsurance purchasing strategy for both P&C and Life, and bundles programs, where appropriate, to benefit from diversification and economies of scale. In support of the Group’s empowerment-based management model and to align risk-bearing capacities between the Group and individual country operations, internal reinsurance applies to all externally reinsured lines of business. In addition, to actively manage and reduce potential claims-recovery risks on facultative cessions and to support the strategy on operational excellence, the Group has specific facultative property and casualty reinsurance facilities.
The Group structures and aligns its external reinsurance protection to its capital position to achieve an optimal risk-return ratio. This includes participation in the underlying risks through self-retentions in line with the risk appetite of each line of business. The cession rate for P&C was 23.0 percent (14.2 percent excluding captives, unaudited) as of December 31, 2021 and 24.2 percent (14.4 percent excluding captives, unaudited) as of December 31, 2020. The cession rate for Life was 10.8 percent as of December 31, 2021 and 8.8 percent as of December 31, 2020.
The Group uses traditional and collateralized reinsurance markets to protect itself against extreme single events, multiple event occurrences across regions, and increased frequency of events. Specifically, to protect the Group against man-made and natural catastrophe scenarios per event, Zurich arranges an annual aggregate global cover as illustrated in the graph on the next page.
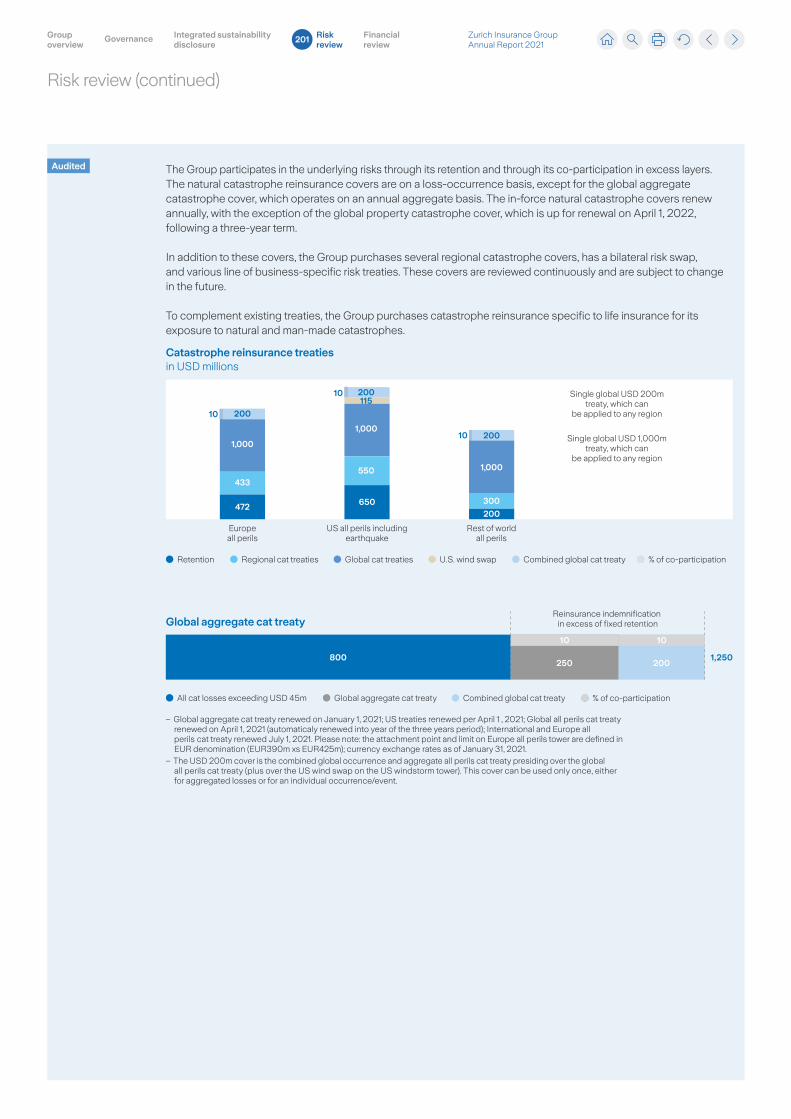
Risk review (continued)
Audited
Zurich Insurance Group Annual Report 2021
Group overview
Integrated sustainability disclosure
Governance Risk review
Financial review
201
The Group participates in the underlying risks through its retention and through its co-participation in excess layers. The natural catastrophe reinsurance covers are on a loss-occurrence basis, except for the global aggregate catastrophe cover, which operates on an annual aggregate basis. The in-force natural catastrophe covers renew annually, with the exception of the global property catastrophe cover, which is up for renewal on April 1, 2022, following a three-year term.
In addition to these covers, the Group purchases several regional catastrophe covers, has a bilateral risk swap, and various line of business-specific risk treaties. These covers are reviewed continuously and are subject to change in the future.
To complement existing treaties, the Group purchases catastrophe reinsurance specific to life insurance for its exposure to natural and man-made catastrophes.
800250 200
1,250
10 10
Reinsurance indemnification in excess of fixed retention
Single global USD 200mtreaty, which can
be applied to any region
Single global USD 1,000mtreaty, which can
be applied to any region
10
10
10
All cat losses exceeding USD 45m Global aggregate cat treaty Combined global cat treaty % of co-participation
– Global aggregate cat treaty renewed on January 1, 2021; US treaties renewed per April 1 , 2021; Global all perils cat treaty renewed on April 1, 2021 (automaticaly renewed into year of the three years period); International and Europe all perils cat treaty renewed July 1, 2021. Please note: the attachment point and limit on Europe all perils tower are defined in EUR denomination (EUR390m xs EUR425m); currency exchange rates as of January 31, 2021.
– The USD 200m cover is the combined global occurrence and aggregate all perils cat treaty presiding over the global all perils cat treaty (plus over the US wind swap on the US windstorm tower). This cover can be used only once, either for aggregated losses or for an individual occurrence/event.
Catastrophe reinsurance treatiesin USD millions
Global aggregate cat treaty
Retention Regional cat treaties Global cat treaties U.S. wind swap Combined global cat treaty % of co-participation
300
200
200
1,000
US all perils includingearthquake
Europeall perils
Rest of worldall perils
472
433
1,000
200
1,000
650
550
200115
Risk review (continued)
Audited
Zurich Insurance Group Annual Report 2021
Group overview
Integrated sustainability disclosure
Governance Risk review
Financial review
202
Market risk, including investment credit risk
Market risk relates to the possibility of loss of value due to changes in financial market conditions. Risk factors include:
– Equity market price changes.
– Real estate market price changes.
– Interest rate changes.
– Credit and swap spread changes.
– Defaults of issuers.
– Changes in currency exchange rates.
The Group manages the market risk of assets relative to liabilities on an economic total balance sheet basis. This is done to achieve the maximum risk-adjusted excess return on assets relative to the liability benchmark, while also taking into account the Group’s risk tolerance and local regulatory constraints.
The Group has policies and limits to manage market risk and keep its strategic asset allocation in line with its risk capacity. Zurich centrally manages certain asset classes to control aggregation of risk and provides a consistent approach to constructing portfolios and selecting external asset managers. It diversifies portfolios, investments and asset managers, and regularly measures and manages market risk exposure. The Group defines limits on concentration of investments in single issuers and certain asset classes, as well as the degree to which asset interest rate sensitivities may deviate from liability interest rate sensitivities. The Group regularly reviews its capacity to hold illiquid investments.
The Asset/Liability Management Investment Committee reviews and monitors the Group strategic asset allocation and tactical boundaries, and monitors Group asset/liability exposure. The Group oversees the activities of local asset/liability management investment committees and regularly assesses market risks at both Group and local business levels. The economic effect of potential extreme market moves is regularly examined and considered when setting the asset allocation.
Risk assessment reviews include the analysis of the management of interest rate risk for each major maturity bucket and adherence to the aggregate positions with risk limits. The Group follows processes to manage market risks and to analyze market risk hotspots. Actions to mitigate risks are taken, if necessary, to manage fluctuations affecting asset/liability mismatch and risk-based capital.
The Group may use derivative financial instruments to mitigate market risks arising from changes in currency exchange rates, interest rates and equity prices, from credit quality of assets, and from commitments to third parties. The Group enters into derivative financial instruments mostly for economic hedging purposes and, in limited circumstances, the instruments may also meet the definition of an effective hedge for accounting purposes.
In compliance with Swiss insurance regulation, the Group’s policy prohibits speculative trading in derivatives, meaning a pattern of so-called ‘in-and-out trading’ activity without any reference to an underlying position. The Group addresses the risks arising from derivatives through a stringent policy that requires approval of a derivative program before transactions are initiated, and by subsequent regular monitoring by Group Risk Management of open positions and annual reviews of derivative programs.
For more information on the Group’s investment result, including impairments and the treatment of selected financial instruments, see note 6 of the consolidated financial statements. For more information on derivative financial instruments and hedge accounting, see note 7 of the consolidated financial statements.
Risk review (continued)
Audited
Zurich Insurance Group Annual Report 2021
Group overview
Integrated sustainability disclosure
Governance Risk review
Financial review
203
Risk from equity securities and real estateThe Group is exposed to risks from price fluctuations on equity securities and real estate. These could affect the Group’s liquidity, reported income, economic surplus and regulatory capital position. Equity risk exposure includes common stocks (including equity unit trusts), private equity, common stock portfolios backing participating-with-profit policyholder contracts, and equities held for employee benefit plans. Exposure to real estate risk includes direct holdings in property and property company shares and funds. Returns on unit-linked contracts, whether classified as insurance or investment contracts, may be exposed to risks from equity and real estate, but these risks are borne by policyholders. The Group is however indirectly exposed to market movements from unit-linked contracts with respect to both earnings and economic capital; market movements affect the amount of fee income earned when the fee income level is dependent on the valuation of the asset base. Therefore, the value of in-force business for unit-linked business can be negatively affected by adverse movements in equity and real estate markets.
The Group manages its risks related to equity securities and real estate as part of the overall investment risk management process and applies limits as expressed in policies and guidelines. Specifically, Zurich limits holdings in equities, real estate and alternative investments. To realize an optimal level of risk diversification, the strategy for equities is defined through a composite of market benchmark indices. The Group has the capability and processes in place to change the exposure to key equity markets via the use of derivatives or purchase or sale of securities within a short time frame.
For additional information on equity securities and investment property, see note 6 of the consolidated financial statements.
Risk from interest rates and credit spreadsInterest rate risk is the risk of an adverse economic impact resulting from changes in interest rates, including changes in the shape of yield curves. Yield curve changes affect the value of interest rate-sensitive investments and derivatives as well as the fair value of insurance liabilities. Other balance sheet items, such as liability investment contracts, debt issued by the Group, commercial and residential mortgages, employee benefit plans, loans and receivables, are also affected.
The Group manages credit spread risk, which is the variation in economic value due to changes in the level or the volatility of credit spreads over the risk-free interest rate. Movements of credit spreads are driven by several factors including changes in expected default probability, default losses, risk premium, liquidity and other effects.
Returns on unit-linked contracts, whether classified as insurance or investment contracts, are at the risk of the policyholder; however, the Group is exposed to fluctuations in interest rates and credit spreads insofar as they affect the amount of fee income earned if the fee income level is dependent on the valuation of the asset base.
Risk review (continued)
Audited
Zurich Insurance Group Annual Report 2021
Group overview
Integrated sustainability disclosure
Governance Risk review
Financial review
204
Analysis of market risk sensitivities for interest rate, equity and credit spread risks
Group investment sensitivitiesThe gross economic market risk sensitivities of the fair value of IFRS Group investments before tax as of 2021 was negative USD 6.1 billion (negative USD 7.1 billion as of 2020) for a 50 basis points (bps) increase in interest rates. For a 50 bps decrease in interest rates, the sensitivity was USD 6.7 billion in 2021 (USD 7.9 billion as of 2020). For a 10 percent decline in equity markets, Group investments drop in value by USD 1.3 billion in 2021 compared with USD 1.3 billion as of 2020. A 100 bps increase in credit spreads resulted in a decrease of USD 6.2 billion in 2021 compared with USD 6.8 billion as of 2020.
The following describes limitations of the Group investment sensitivities. Group sensitivities show the effects of a change of certain risk factors, while other assumptions remain unchanged. The interest rate scenarios assume a parallel shift of all interest rates in the respective currencies. They do not take account of the possibility that interest rate changes might differ by rating class; these are disclosed separately as credit spread risk sensitivities.
The sensitivity analysis is based on economic assets, and not on shareholders’ equity or net income as set out in the consolidated financial statements. The sensitivities only cover Group investments and do not cover insurance or other liabilities. The equity market scenarios assume a concurrent movement of all stock markets. The sensitivity analysis does not take account of actions that might be taken to mitigate losses. Actions may involve changing the asset allocation, for example through selling and buying assets. Sensitivity calculations do not assign a probability to the scenario considered. The sensitivities do not indicate a probability of such events occurring in the future. They do not necessarily represent the Group’s view of expected future market changes.
In addition to the gross sensitivities, management uses sensitivities and stress scenarios to assess the impact of market movements on the Group’s net assets. For more information on sensitivities see ‘Group economic net asset sensitivities’ (unaudited), below.
Group economic net asset sensitivitiesThe following section presents the sensitivities of Group economic net assets under Swiss Solvency Test (SST) assumptions with respect to certain standard financial market scenarios.
The net asset impact – the difference between the impact on Group investments and liabilities – represents the economic risk related to changes in market risk factors to which the Group is exposed. Tables 5, 6 and 7 show the estimated economic market risk sensitivities of the net asset impact. Positive values represent an increase in the net assets, and values in parentheses represent a decrease. Mismatches in changes in value of assets relative to liabilities represent an economic risk to the Group.
In determining the sensitivities, investments and liabilities are fully re-valued under the given scenarios. Each instrument is re-valued separately, taking relevant product features into account. Non-linear valuation effects, where they exist, are reflected in the calculations. The sensitivities are shown before tax.
The basis of the presentation for tables 5, 6, and 7 is an economic valuation represented by the fair value of Group investments. IFRS insurance liabilities are discounted at risk-free market rates to reflect the present value of insurance liability cash flows and other liabilities, for example, own debt. The Group uses FINMA allowed risk-free curves for discounting. In the sensitivities, own debt does not include subordinated debt, which Zurich considers available to protect policyholders in a worst-case scenario.
The basis of presentation for the Life business to financial market movements uses replicating portfolios calibrated according to the methodology and cashflow models approved by FINMA. The replicating portfolios are portfolios of assets that replicate the cash flows or present values of the life insurance liabilities under stochastic scenarios from the local life valuation models. They are calibrated to match dependencies of life insurance liabilities on financial market developments in respect of interest rates, equity and property. The options and guarantees of the underlying life insurance liabilities are captured through the inclusion of options in the replicating portfolios.
Sensitivities are shown split by segment and for economic net assets net of minority interest. The heading ‘Rest of the business’ includes Farmers, Group Finance and Operations and Non-Core Businesses.
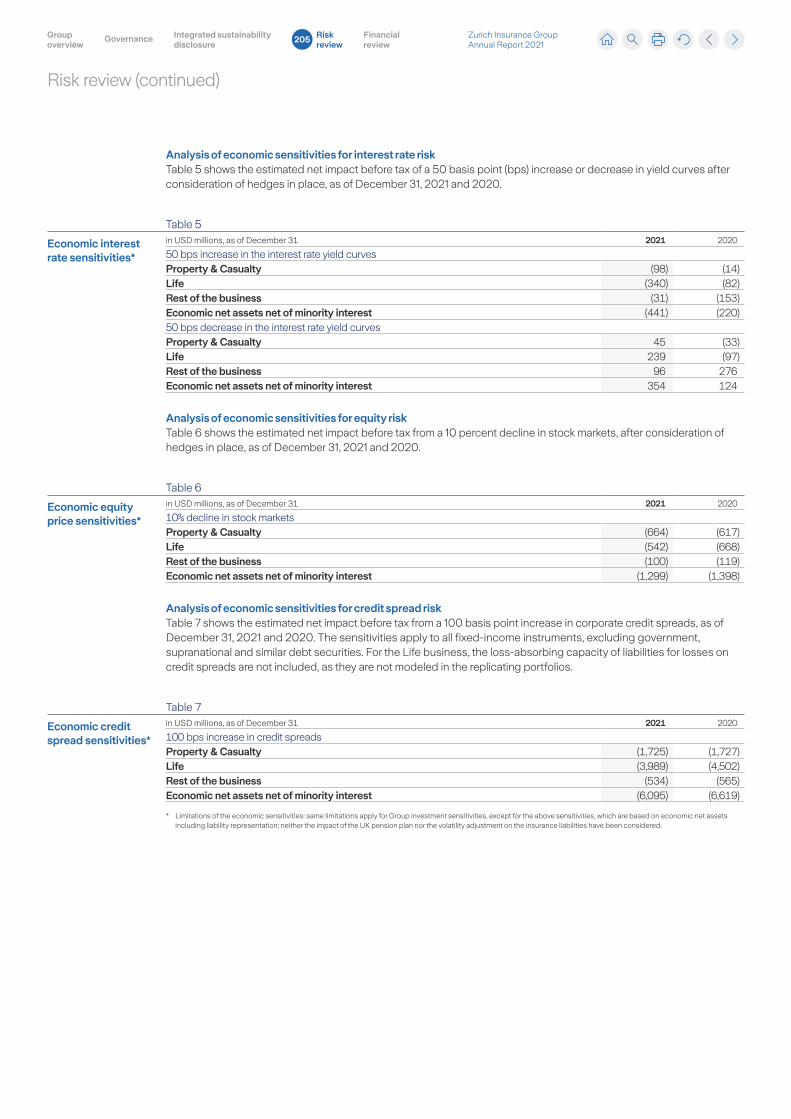
Risk review (continued)
Zurich Insurance Group Annual Report 2021
Group overview
Integrated sustainability disclosure
Governance Risk review
Financial review
205
Analysis of economic sensitivities for interest rate riskTable 5 shows the estimated net impact before tax of a 50 basis point (bps) increase or decrease in yield curves after consideration of hedges in place, as of December 31, 2021 and 2020.
Table 5
Economic interest rate sensitivities*
in USD millions, as of December 31 2021 2020
50 bps increase in the interest rate yield curvesProperty & Casualty (98) (14)Life (340) (82)Rest of the business (31) (153)Economic net assets net of minority interest (441) (220)50 bps decrease in the interest rate yield curvesProperty & Casualty 45 (33)Life 239 (97)Rest of the business 96 276Economic net assets net of minority interest 354 124
Analysis of economic sensitivities for equity riskTable 6 shows the estimated net impact before tax from a 10 percent decline in stock markets, after consideration of hedges in place, as of December 31, 2021 and 2020.
Table 6
Economic equity price sensitivities*
in USD millions, as of December 31 2021 2020
10% decline in stock marketsProperty & Casualty (664) (617)Life (542) (668)Rest of the business (100) (119)Economic net assets net of minority interest (1,299) (1,398)
Analysis of economic sensitivities for credit spread riskTable 7 shows the estimated net impact before tax from a 100 basis point increase in corporate credit spreads, as of December 31, 2021 and 2020. The sensitivities apply to all fixed-income instruments, excluding government, supranational and similar debt securities. For the Life business, the loss-absorbing capacity of liabilities for losses on credit spreads are not included, as they are not modeled in the replicating portfolios.
Table 7
Economic credit spread sensitivities*
in USD millions, as of December 31 2021 2020
100 bps increase in credit spreadsProperty & Casualty (1,725) (1,727)Life (3,989) (4,502)Rest of the business (534) (565)Economic net assets net of minority interest (6,095) (6,619)
* Limitations of the economic sensitivities: same limitations apply for Group investment sensitivities, except for the above sensitivities, which are based on economic net assets including liability representation; neither the impact of the UK pension plan nor the volatility adjustment on the insurance liabilities have been considered.
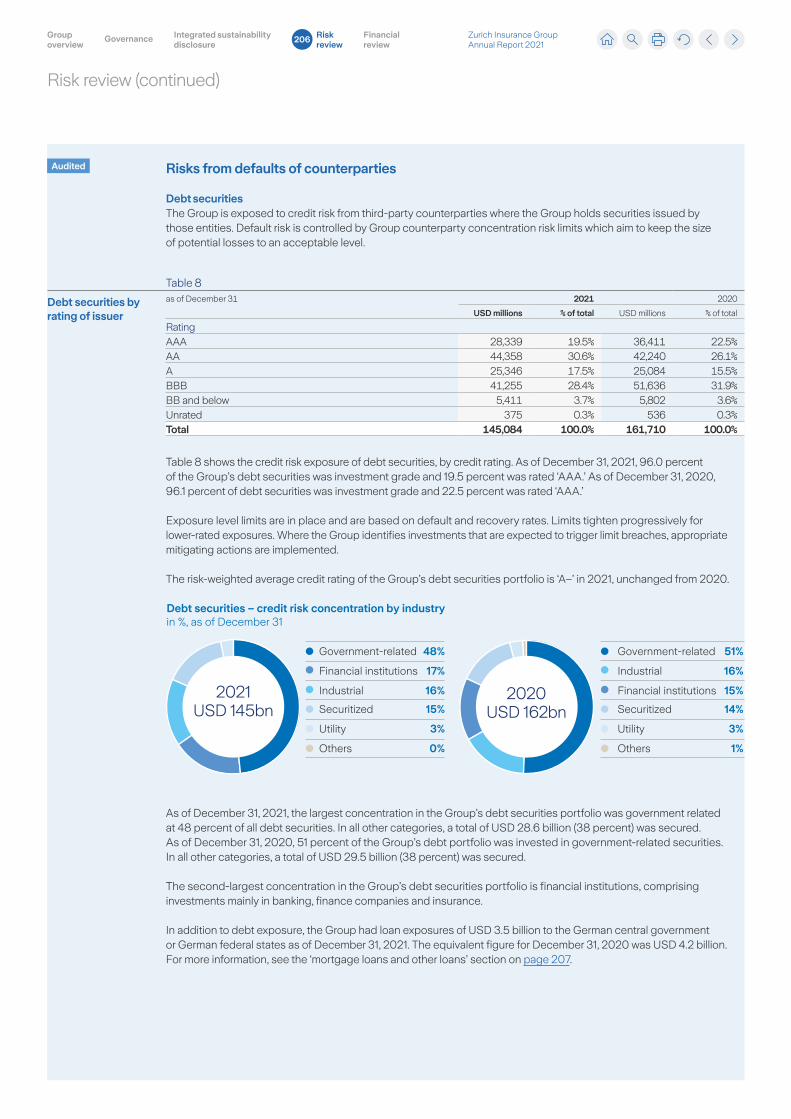
Risk review (continued)
Audited
Zurich Insurance Group Annual Report 2021
Group overview
Integrated sustainability disclosure
Governance Risk review
Financial review
206
Risks from defaults of counterparties
Debt securitiesThe Group is exposed to credit risk from third-party counterparties where the Group holds securities issued by those entities. Default risk is controlled by Group counterparty concentration risk limits which aim to keep the size of potential losses to an acceptable level.
Table 8
Debt securities by rating of issuer
as of December 31 2021 2020
USD millions % of total USD millions % of total
RatingAAA 28,339 19.5% 36,411 22.5%AA 44,358 30.6% 42,240 26.1%A 25,346 17.5% 25,084 15.5%BBB 41,255 28.4% 51,636 31.9%BB and below 5,411 3.7% 5,802 3.6%Unrated 375 0.3% 536 0.3%Total 145,084 100.0% 161,710 100.0%
Table 8 shows the credit risk exposure of debt securities, by credit rating. As of December 31, 2021, 96.0 percent of the Group’s debt securities was investment grade and 19.5 percent was rated ‘AAA.’ As of December 31, 2020, 96.1 percent of debt securities was investment grade and 22.5 percent was rated ‘AAA.’
Exposure level limits are in place and are based on default and recovery rates. Limits tighten progressively for lower-rated exposures. Where the Group identifies investments that are expected to trigger limit breaches, appropriate mitigating actions are implemented.
The risk-weighted average credit rating of the Group’s debt securities portfolio is ‘A–’ in 2021, unchanged from 2020.
Debt securities – credit risk concentration by industryin %, as of December 31
Government-related 48%
Financial institutions 17%
Industrial 16%
Securitized 15%
Utility 3%
Others 0%
Government-related 51%
Industrial 16%
Financial institutions 15%
Securitized 14%
Utility 3%
Others 1%
2021USD 145bn
2020USD 162bn
As of December 31, 2021, the largest concentration in the Group’s debt securities portfolio was government related at 48 percent of all debt securities. In all other categories, a total of USD 28.6 billion (38 percent) was secured. As of December 31, 2020, 51 percent of the Group’s debt portfolio was invested in government-related securities. In all other categories, a total of USD 29.5 billion (38 percent) was secured.
The second-largest concentration in the Group’s debt securities portfolio is financial institutions, comprising investments mainly in banking, finance companies and insurance.
In addition to debt exposure, the Group had loan exposures of USD 3.5 billion to the German central government or German federal states as of December 31, 2021. The equivalent figure for December 31, 2020 was USD 4.2 billion. For more information, see the ‘mortgage loans and other loans’ section on page 207.
Risk review (continued)
Audited
Zurich Insurance Group Annual Report 2021
Group overview
Integrated sustainability disclosure
Governance Risk review
Financial review
207
Cash and cash equivalentsTo reduce credit concentration, settlement and operational risks, the Group limits the amount of cash that can be deposited with a single counterparty. The Group also maintains an authorized list of acceptable cash counterparties.
Cash and cash equivalents amounted to USD 8.7 billion as of December 31, 2021 and USD 11.1 billion as of December 31, 2020. The risk-weighted average rating of the overall cash portfolio was ‘A–’ as of December 31, 2021 and ‘A’ as of December 31, 2020. The ten largest bank exposures represent 68 percent of the total, the risk- weighted average rating of which was ‘AA–’ as of December 31, 2021 and ‘AA–’ as of December 31, 2020.
Mortgage loans and other loansMortgage loans amounted to USD 6.1 billion as of December 31, 2021 and USD 5.8 billion as of December 31, 2020. The Group’s largest mortgage loan portfolios are held in Switzerland (USD 3.0 billion) and in Germany (USD 1.5 billion); these are predominantly secured against residential property but also include mortgages secured by commercial property. The Group invests in mortgages in the U.S. (USD 0.5 billion); these are mainly participations in large mortgage loans secured against commercial property.
The credit risk arising from other loans is assessed and monitored together with the debt securities portfolio. Out of the USD 7.1 billion reported loans as of December 31, 2021, 56 percent are government related, of which 89 percent are to the German central government or German federal states. As of December 31, 2021, USD 3.7 billion were rated as ‘AAA’ (52 percent) compared with 4.1 billion as of December 31, 2020; USD 1.0 billion as ‘AA’ (14 percent) compared with 1.8 billion as of December 31, 2020; USD 1.2 billion as ‘A’ (18 percent) compared with 1.4 billion as of December 31, 2020; USD 1.2 billion as ‘BBB’ and below (16 percent) compared with 1.0 billion as of December 31, 2020; and USD 0.0 billion as unrated (0 percent) compared with 0.3 billion as of December 31, 2020.
DerivativesThe replacement value of outstanding derivatives represents a credit risk to the Group. These instruments include interest rate and cross-currency swaps, forward contracts and purchased options. A potential exposure could also arise from possible changes in replacement values. The Group regularly monitors credit risk exposures arising from derivative transactions. Outstanding positions with external counterparties are managed through an approval process embedded in derivative programs.
To limit credit risk, derivative financial instruments are executed with counterparties rated ‘BBB’ or higher as per Zurich Risk Policy requirements. The Group’s standard practice is to only transact derivatives with those counterparties for which the Group has in place an ISDA Master Agreement, with a Credit Support Annex. This mitigates credit exposures from over-the-counter transactions due to close-out netting and requires the counterparty to post collateral when the derivative position exceeds an agreed threshold. The Group further mitigates credit exposures from derivative transactions by using exchange-traded or centrally cleared instruments whenever possible. The Group remained under the applicable thresholds for phase 5 of the initial margin rules for over-the-counter derivatives and therefore was not subject to a duty to exchange initial margin in 2021.
Risk from currency exchange rates Currency risk is the risk of loss resulting from changes in exchange rates. The Group operates internationally and therefore is exposed to the financial impact of changes in the exchange rates of various currencies. The Group’s presentation currency is the U.S. dollar, but its assets, liabilities, income and expenses are denominated in many currencies, with significant amounts in euro, Swiss franc, British pound and U.S. dollar. On entity balance sheets a currency mismatch may cause a balance sheet’s net asset value to fluctuate, either through income or directly through equity. The Group manages this risk by matching foreign currency positions on entity balance sheets within prescribed limits. Residual entity mismatches are reported centrally to make use of the netting effect across the Group. Zurich hedges these residual entity mismatches within an established limit through a central balance sheet. For information on net gains/losses on foreign currency transactions included in the consolidated income statements, see note 1 of the consolidated financial statements. The monetary currency risk exposure on entity balance sheets is considered immaterial.
Differences arise when functional currencies are translated into the Group’s presentation currency, the U.S. dollar. The Group applies net investment hedge accounting to protect against the impact that changes in certain exchange rates might have on selected net investments.
Table 9 shows the sensitivity of total IFRS equity to changes in exchange rates for the main functional currencies to which the Group is exposed. Positive values represent an increase in the value of the Group’s total equity. See notes 1, 3 and 7 of the consolidated financial statements for additional information on foreign currency translation and transactions.
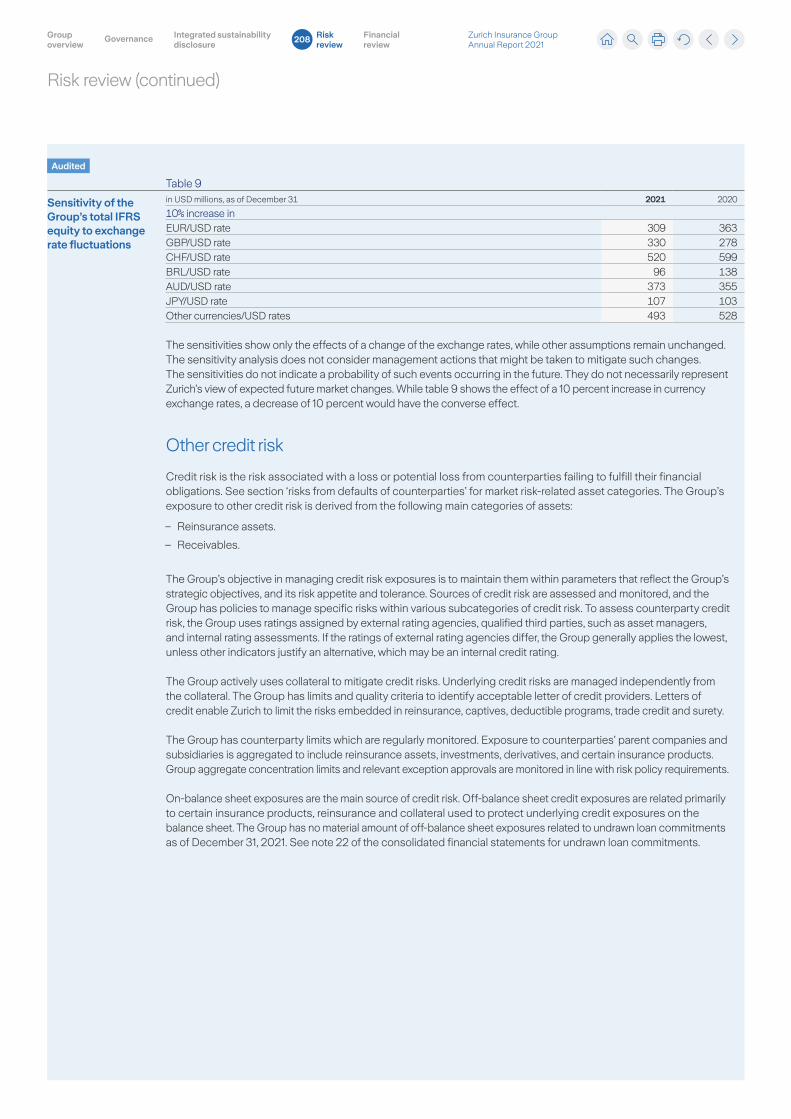
Risk review (continued)
Audited
Zurich Insurance Group Annual Report 2021
Group overview
Integrated sustainability disclosure
Governance Risk review
Financial review
208
Table 9
Sensitivity of the Group’s total IFRS equity to exchange rate fluctuations
in USD millions, as of December 31 2021 2020
10% increase inEUR/USD rate 309 363GBP/USD rate 330 278CHF/USD rate 520 599BRL/USD rate 96 138AUD/USD rate 373 355JPY/USD rate 107 103Other currencies/USD rates 493 528
The sensitivities show only the effects of a change of the exchange rates, while other assumptions remain unchanged. The sensitivity analysis does not consider management actions that might be taken to mitigate such changes. The sensitivities do not indicate a probability of such events occurring in the future. They do not necessarily represent Zurich’s view of expected future market changes. While table 9 shows the effect of a 10 percent increase in currency exchange rates, a decrease of 10 percent would have the converse effect.
Other credit risk
Credit risk is the risk associated with a loss or potential loss from counterparties failing to fulfill their financial obligations. See section ‘risks from defaults of counterparties’ for market risk-related asset categories. The Group’s exposure to other credit risk is derived from the following main categories of assets:
– Reinsurance assets.
– Receivables.
The Group’s objective in managing credit risk exposures is to maintain them within parameters that reflect the Group’s strategic objectives, and its risk appetite and tolerance. Sources of credit risk are assessed and monitored, and the Group has policies to manage specific risks within various subcategories of credit risk. To assess counterparty credit risk, the Group uses ratings assigned by external rating agencies, qualified third parties, such as asset managers, and internal rating assessments. If the ratings of external rating agencies differ, the Group generally applies the lowest, unless other indicators justify an alternative, which may be an internal credit rating.
The Group actively uses collateral to mitigate credit risks. Underlying credit risks are managed independently from the collateral. The Group has limits and quality criteria to identify acceptable letter of credit providers. Letters of credit enable Zurich to limit the risks embedded in reinsurance, captives, deductible programs, trade credit and surety.
The Group has counterparty limits which are regularly monitored. Exposure to counterparties’ parent companies and subsidiaries is aggregated to include reinsurance assets, investments, derivatives, and certain insurance products. Group aggregate concentration limits and relevant exception approvals are monitored in line with risk policy requirements.
On-balance sheet exposures are the main source of credit risk. Off-balance sheet credit exposures are related primarily to certain insurance products, reinsurance and collateral used to protect underlying credit exposures on the balance sheet. The Group has no material amount of off-balance sheet exposures related to undrawn loan commitments as of December 31, 2021. See note 22 of the consolidated financial statements for undrawn loan commitments.
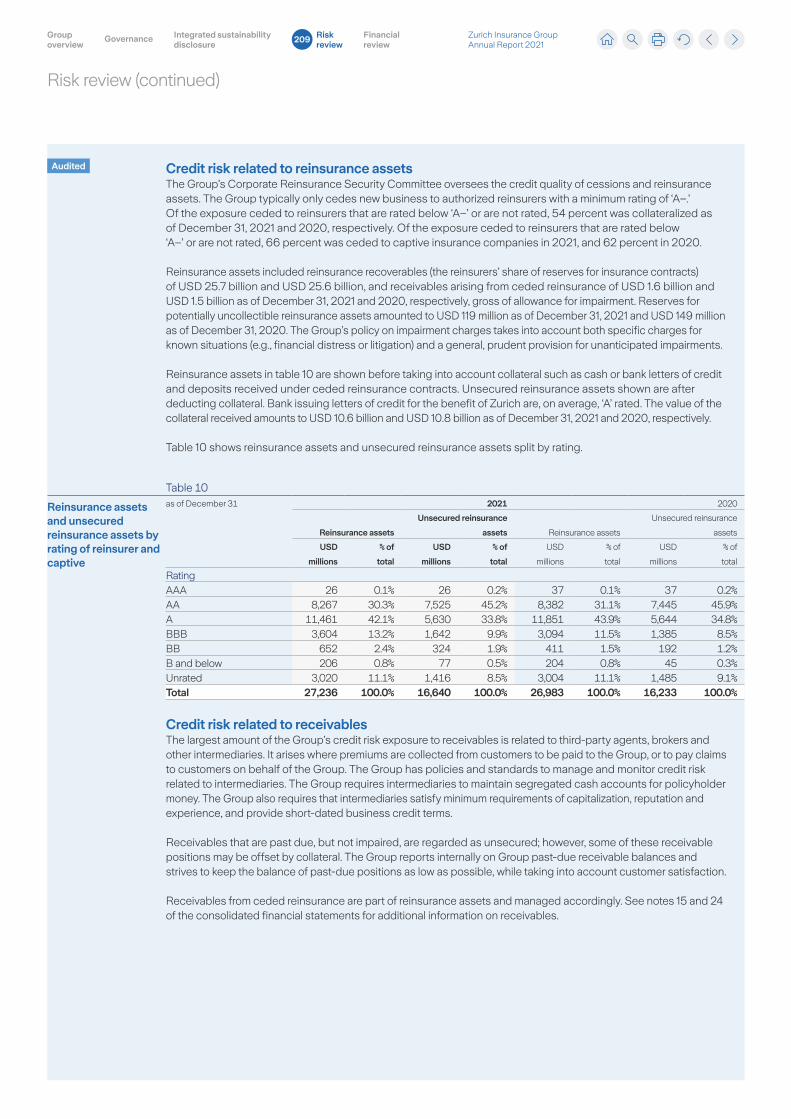
Risk review (continued)
Audited
Zurich Insurance Group Annual Report 2021
Group overview
Integrated sustainability disclosure
Governance Risk review
Financial review
209
Credit risk related to reinsurance assetsThe Group’s Corporate Reinsurance Security Committee oversees the credit quality of cessions and reinsurance assets. The Group typically only cedes new business to authorized reinsurers with a minimum rating of ‘A–.’ Of the exposure ceded to reinsurers that are rated below ‘A–’ or are not rated, 54 percent was collateralized as of December 31, 2021 and 2020, respectively. Of the exposure ceded to reinsurers that are rated below ‘A–’ or are not rated, 66 percent was ceded to captive insurance companies in 2021, and 62 percent in 2020.
Reinsurance assets included reinsurance recoverables (the reinsurers’ share of reserves for insurance contracts) of USD 25.7 billion and USD 25.6 billion, and receivables arising from ceded reinsurance of USD 1.6 billion and USD 1.5 billion as of December 31, 2021 and 2020, respectively, gross of allowance for impairment. Reserves for potentially uncollectible reinsurance assets amounted to USD 119 million as of December 31, 2021 and USD 149 million as of December 31, 2020. The Group’s policy on impairment charges takes into account both specific charges for known situations (e.g., financial distress or litigation) and a general, prudent provision for unanticipated impairments.
Reinsurance assets in table 10 are shown before taking into account collateral such as cash or bank letters of credit and deposits received under ceded reinsurance contracts. Unsecured reinsurance assets shown are after deducting collateral. Bank issuing letters of credit for the benefit of Zurich are, on average, ‘A’ rated. The value of the collateral received amounts to USD 10.6 billion and USD 10.8 billion as of December 31, 2021 and 2020, respectively.
Table 10 shows reinsurance assets and unsecured reinsurance assets split by rating.
Table 10
Reinsurance assets and unsecured reinsurance assets by rating of reinsurer and captive
as of December 31 2021 2020
Reinsurance assets
Unsecured reinsurance
assets Reinsurance assets
Unsecured reinsurance
assets
USD
millions
% of
total
USD
millions
% of
total
USD
millions
% of
total
USD
millions
% of
total
RatingAAA 26 0.1% 26 0.2% 37 0.1% 37 0.2%AA 8,267 30.3% 7,525 45.2% 8,382 31.1% 7,445 45.9%A 11,461 42.1% 5,630 33.8% 11,851 43.9% 5,644 34.8%BBB 3,604 13.2% 1,642 9.9% 3,094 11.5% 1,385 8.5%BB 652 2.4% 324 1.9% 411 1.5% 192 1.2%B and below 206 0.8% 77 0.5% 204 0.8% 45 0.3%Unrated 3,020 11.1% 1,416 8.5% 3,004 11.1% 1,485 9.1%Total 27,236 100.0% 16,640 100.0% 26,983 100.0% 16,233 100.0%
Credit risk related to receivablesThe largest amount of the Group’s credit risk exposure to receivables is related to third-party agents, brokers and other intermediaries. It arises where premiums are collected from customers to be paid to the Group, or to pay claims to customers on behalf of the Group. The Group has policies and standards to manage and monitor credit risk related to intermediaries. The Group requires intermediaries to maintain segregated cash accounts for policyholder money. The Group also requires that intermediaries satisfy minimum requirements of capitalization, reputation and experience, and provide short-dated business credit terms.
Receivables that are past due, but not impaired, are regarded as unsecured; however, some of these receivable positions may be offset by collateral. The Group reports internally on Group past-due receivable balances and strives to keep the balance of past-due positions as low as possible, while taking into account customer satisfaction.
Receivables from ceded reinsurance are part of reinsurance assets and managed accordingly. See notes 15 and 24 of the consolidated financial statements for additional information on receivables.
Risk review (continued)
Audited
Zurich Insurance Group Annual Report 2021
Group overview
Integrated sustainability disclosure
Governance Risk review
Financial review
210
Operational risk
Operational risk is the risk of financial loss, adverse reputational, legal or regulatory impact, resulting from inadequate or failed processes, people, systems or from external events, including external fraud, catastrophes, or failure in outsourcing arrangements. Zurich has a framework to identify, assess, manage, monitor, and report operational risk within the Group. Within this framework, the Group:
– Uses a scenario-based approach to assess, model and quantify the capital required for operational risk for business units under extreme circumstances. This approach allows information to be compared across the Group and highlights the main scenarios contributing to the capital required under Zurich Economic Capital Model (Z-ECM).
– Documents and reviews operational events exceeding a threshold determined by the Zurich Risk Policy. Remedial action is taken to avoid the recurrence of such operational events.
– Conducts risk assessments where operational risks are identified for key business areas. Risks identified and assessed to be above a certain threshold must have a risk response. Risk mitigation plans are documented and tracked on an ongoing basis. In the assessments, the Group uses sources of information such as the Total Risk Profiling™ process, internal control assessments, and audit findings, as well as scenario modeling and operational event data.
The Group has specific processes and systems in place to focus on high-priority operational matters such as managing information security and business resilience (see sub-section ‘risk focus specific to digital transformation’), as well as combating fraud.
Preventing, detecting and responding to fraud are embedded in Zurich’s business processes. Both claims and non-claims fraud are included in the common framework for assessing and managing operational risks. For Zurich’s internal model calculations, claims fraud is part of insurance risk and non-claims fraud is part of operational risk.
Risk focus specific to digital transformationDigital and technological advances have not only created a wide spectrum of benefits for society but also amplified the associated risks. Organizations are realigning their operations, forging new third-party relationships and putting data at the heart of their decision-making and analysis. All of this is happening at a rapid pace and against a backdrop of an increasingly hostile cyber threat landscape. In order to succeed, organizations need to be able to assess and understand the risks inherent in this changing environment and ensure that they are managed appropriately.
On a regular basis, the Group assesses and monitors exposure to defined information security and cyber risk scenarios through key risk indicators (KRIs) to effectively focus on actions and adequate resource allocation.
Data riskThe strategic relevance of data as a business asset is rising at a rapid pace and the risks associated with data management are becoming more and more prominent. Preventing risks such as data losses and privacy breaches and assessing and monitoring the potential misuse of data and losses triggered by failures in data management remain in focus. Specifically, appropriate governance of data for business purposes and decision-making processes, including automation, machine-learning techniques and other advanced technologies, remains a priority. As Zurich strives to inspire confidence in a digital society with its data commitment, assurance on the ethical use of advanced technologies is provided from a risk management perspective for the protection and privacy of data of our customers and other stakeholders.
The relevance of technological risks, such as cyber risk, is rapidly increasing across all data-driven industries. Exposure to these risks has grown in lockstep with the significant rise in digital services provided directly to customers and the increasing prevalence of digital ecosystems and cloud solutions in today’s interconnected world.
Third-party riskOutsourcing and engagement with third parties introduces risks relevant to the delivery of our strategy, such as data loss or disclosure, disruption to critical customer services and regulatory compliance. Digitalization has accelerated the complexity and changes to the Group’s third-party ecosystem. The Group addresses risks associated with third-party engagements along its supply and value chain. Applying a consistent Group-wide approach to outsourcing governance is among Zurich’s key priorities.
Risk review (continued)
Zurich Insurance Group Annual Report 2021
Group overview
Integrated sustainability disclosure
Governance Risk review
Financial review
211
Business resilience riskZurich, along with the rest of the insurance industry, is going through a period of transformation in order to meet changing customer expectations. In addition, increasing automation of processes, development of advanced analytics capabilities, and fragmented supply chains have contributed to an increasingly complex operating environment. In response to these challenges, and to better protect the interests of stakeholders, the Group continues to evolve its business resilience capability through a number of ongoing initiatives in relation to the protection and recovery of critical services and enhancing transparency around any associated risks. Zurich’s response to COVID-19 to date has proven to be effective with critical business services maintained throughout the Group.
Risk management and internal controlsThe Group considers internal controls to be essential for managing operational risk. The Board has overall responsibility for the Group’s risk management and internal control frameworks. The objectives of the Group’s internal control system are to provide reasonable assurance that Zurich’s financial statements and disclosures are materially correct, support reliable operations, and ensure legal and regulatory compliance. The internal control system is designed to mitigate rather than eliminate risks that could impact the achievement of business objectives.
The Group promotes risk awareness and understanding of controls through communication and training. Risk management and internal control systems are designed at Group level and implemented across the Group. Management, as the first line of defense, is responsible for identifying, evaluating and managing risk, and designing, implementing and maintaining internal controls. Testing effectiveness of relevant internal controls by the first line of defense also forms part of the control life cycle.
Key processes and controls in the organization are subject to review and challenge by all three lines of defense. The second and third lines of defense regularly report on observations, conclusions and recommendations that arise from their independent reviews of internal controls. Control issues of Group-level significance and associated mitigation actions are reported regularly to the Audit Committee of the Board. The Risk and Investment Committee of the Board reviews the effectiveness of the Group’s risk management system, including the Group’s risk tolerance and enterprise-wide risk governance framework, in accordance with the charter for each committee.
The Group’s Disclosure Committee, chaired by the Head of Group Financial Accounting and Reporting, reviews the accuracy, completeness and timeliness and compliance with legal and regulatory requirements of external disclosures and the effectiveness of the respective internal controls. The conclusions result in a recommendation to the Group Chief Financial Officer to release the disclosures to the Audit Committee of the Board, who may then challenge the disclosures further. The Board reviews and approves the announcement of the results and the annual report before they are made public.
Risk review (continued)
Audited
Zurich Insurance Group Annual Report 2021
Group overview
Integrated sustainability disclosure
Governance Risk review
Financial review
212
Liquidity risk
Liquidity risk is the risk that an entity within the Group may not have sufficient liquid financial resources to meet its obligations when they fall due or would have to incur excessive costs to do so. Zurich’s policy is to maintain adequate liquidity and contingent liquidity to meet its liquidity needs under normal conditions and in times of stress. To achieve this, the Group assesses, monitors and manages its liquidity needs on an ongoing basis.
Group-wide liquidity management policies and specific guidelines govern how entities plan, manage and report their entity liquidity and include regular stress tests for all major legal entities and branches within the Group. The stress tests use a standardized set of internally defined stress events, and are designed to provide an overview of the potential drain on liquidity should the Group have to recapitalize entity balance sheets. Similar guidelines apply at the Group level, and detailed liquidity forecasts are regularly conducted, based on entities’ input and the Group’s forecasts. As part of its liquidity management, the Group maintains sufficient cash and cash equivalents and high-quality, liquid investment portfolios to meet outflows under expected and stressed conditions.
The Group also maintains internal liquidity sources that cover the potential liquidity needs within the Group, including those that might arise in times of stress. The Group takes into account the amount, availability and speed at which these sources can be accessed. The Group has access to diverse funding sources to cover contingencies, including asset sales, external debt issuance and making use of committed borrowing facilities or letters of credit. The Group maintains a range of maturities for external debt securities. A potential source of liquidity risk is the effect of a downgrade of the credit rating of the Group. This could affect the Group’s commitments and guarantees, potentially increasing liquidity needs. This risk – and mitigating actions that might be employed – are assessed on an ongoing basis within the Group’s liquidity framework.
The Group regularly analyzes the liquidity of the investment assets and ensures that the liquidity of assets stays in line with liquidity requirements. In 2021, the Group’s holdings in illiquid assets were within its capacity.
For more information on debt obligation maturities, see note 18 of the consolidated financial statements, and for information on commitments and guarantees, see note 22 of the consolidated financial statements.
The Group’s ongoing liquidity monitoring includes regular reporting to the executive management and quarterly reporting to the Risk and Investment Committee of the Board, covering aspects such as the Group’s actual and forecast liquidity, possible adverse scenarios that could affect the Group’s liquidity and possible liquidity needs from the Group’s main subsidiaries, including under conditions of stress.
For more information on the Group’s other financial liabilities, see note 16 of the consolidated financial statements. See note 6 of the consolidated financial statements for information on the maturity of debt securities.
The Group has committed to contribute capital to subsidiaries and third parties that engage in making investments in direct private equity and private equity funds. Commitments may be called by the counterparty during the term of the investment (generally three to five years) and must be funded by the Group on a timely basis. See note 22 of the consolidated financial statements for more information.
Risk review (continued)
Audited
Zurich Insurance Group Annual Report 2021
Group overview
Integrated sustainability disclosure
Governance Risk review
Financial review
213
Strategic risk and risks to the Group’s reputation
Strategic riskZurich defines strategy as the long-term plan of action designed to allow the Group to achieve its goals and aspirations based on Zurich’s purpose and values.
Strategic risks can arise from:
– Inadequate risk-reward assessment of strategic plans.
– Improper execution of strategic plans.
– Unexpected changes to underlying assumptions, including those about the external environment.
The Group works to manage risks associated with strategic business decisions through its risk assessment processes and tools, including the Total Risk Profiling™ process. As part of the annual assessment of strategic risks, the Executive Committee assesses potential risks from both external and internal factors, looking at the current year and beyond. The Executive Committee members define actions to respond as appropriate and review changes to the key risks and their status of actions at least quarterly.
The Group evaluates the risks of merger and acquisition (M&A) transactions both from a quantitative and a qualitative perspective. The Group conducts risk assessments of M&A transactions to evaluate risks specifically related to integrating acquired businesses.
Risks to the Group’s reputationRisks include acts or omissions by the Group or any of its employees that could damage the Group’s reputation or lead to a loss of trust among its stakeholders. Every risk type has potential consequences for Zurich’s reputation. Effectively managing each risk type supports preventing adverse reputational outcomes.
The Group aims to preserve its reputation by:
– Adhering to applicable laws and regulations.
– Following the core values and principles of the Group’s code of conduct that promote integrity and good business practice.
– Living up to its sustainability commitments.
The Group centrally manages certain aspects of risk to reputation, for example, communications, through functions with the appropriate expertise. Potential risks to Zurich’s reputation are included in its risk assessment processes and tools, including the Total Risk Profiling™ process.
Sustainability risk
Zurich’s ambition is to be one of the most responsible and impactful businesses in the world. Trends like globalization, the mobility of talent and funds, shifting geopolitics, reskilling for a digital workplace, demographics, and climate change all pose immensely complex social issues.
Sustainability means doing business today in a way that safeguards the future of our company and our society. Sustainability risks and opportunities emanate both from effects that environmental, social and governance (ESG) challenges have on the company, as well as from how the company handles its positive or negative impact on ESG issues. To protect against financial and reputational impacts, both perspectives are included in the identification and assessment of sustainability issues.
Climate change, as one of the most complex risks facing society today, is intergenerational, international and interdependent. As a global insurer, Zurich faces risks from climate change and discloses its climate risk in line with the recommendations of the Financial Stability Board’s Task Force on Climate-related Financial Disclosures (TCFD).
Sustainability topics associated with ESG challenges are also becoming more complex and interconnected as a result of these trends. Insurers are increasingly becoming agents of change and playing a more impactful role in addressing sustainability risk.
Risk review (continued)
Zurich Insurance Group Annual Report 2021
Group overview
Integrated sustainability disclosure
Governance Risk review
Financial review
214
Zurich works with its customers and investee companies to ensure responsible and sustainable business practices while promoting best practices in managing ESG risks. The Group has policies in place that define the sustainability positions for which Zurich has no underwriting or investment appetite. Zurich continuously works to develop relevant products and services that help solve the most pressing societal and environmental issues of today.
Sustainability risk approachTo support the Group’s businesses in applying its purpose and values, as well as mitigating reputational risk impacts, Zurich has established a systematic and integrated approach to identifying, assessing and recommending action on potential risk and opportunity areas from a sustainability perspective across all the Group’s activities, in particular in investment management and underwriting.
This is a three-step process:
– Issue identification: Identify relevant issues to be considered within the risk assessment process by monitoring channels such as media, social media, information from non-governmental organizations and Zurich’s businesses.
– Risk assessment: Assess issues related to public commitments, the role of insurance underwriting, market exposure and materiality. The Group Chief Executive Officer approves position statements, recommended business actions, and reputational management considerations.
– Implementation: Implement mitigation actions, including managing reputational impacts locally in the businesses. Mobilize expert support available across the Group and escalate as necessary, according to governance procedures.
Zurich applies these steps across portfolios based on stated thresholds and verified data. Wherever possible, Zurich engages and works together with customers on the margins of Zurich’s thresholds to ensure responsible and sustainable business practices. This engagement may be short, or in some cases, last up to two years, depending on which part of the renewal cycle customers are in and the time required for them to demonstrate credible progress on ESG issues.
Clear roles and responsibilities, starting with the Board of Directors of Zurich Insurance Group Ltd and Zurich management, aim to ensure effective oversight and action with respect to climate change and other sustainability risks.

THIS PAGE HAS INTENTIONALLY BEEN LEFT BLANK
Zurich Insurance Group Annual Report 2021
Group overview
Integrated sustainability disclosure
Governance Risk review
Financial review
215
Financial review220 Financial overview232 Consolidated
financial statements354 Holding company
Wen LinGroup Risk Management, Zurich Insurance Group
To watch the video, visit:www.zurich.com/reports/2021/annual-report
Inspiring action
People power.Our people drive our business. We support our employees with learning the right skills to navigate an ever-evolving world of work – so they can help our customers do the same. “Zurich inspires people to take action by creating networks where we can learn from colleagues around the world,” says Wen Lin, Group Risk Management.
Zurich Insurance Group Annual Report 2021
Group overview
Integrated sustainability disclosure
Governance Risk review
Financial review
216

Zurich Insurance Group Annual Report 2021
Group overview
Integrated sustainability disclosure
Governance Risk review
Financial review
217
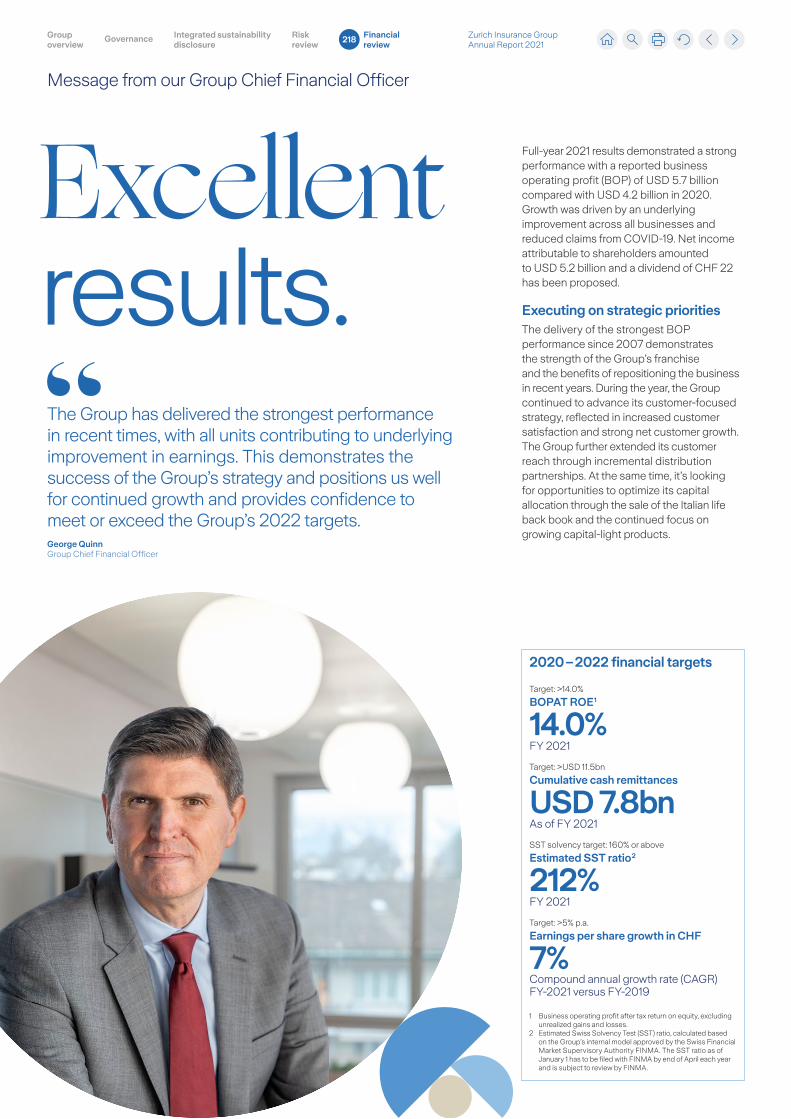
2020 – 2022 financial targets
1 Business operating profit after tax return on equity, excluding unrealized gains and losses.
2 Estimated Swiss Solvency Test (SST) ratio, calculated based on the Group’s internal model approved by the Swiss Financial Market Supervisory Authority FINMA. The SST ratio as of January 1 has to be filed with FINMA by end of April each year and is subject to review by FINMA.
Target: >14.0%
BOPAT ROE 1
14.0%FY 2021
Target: >USD 11.5bn
Cumulative cash remittances
USD 7.8bnAs of FY 2021
SST solvency target: 160% or above
Estimated SST ratio 2
212%FY 2021
Target: >5% p.a.
Earnings per share growth in CHF
7%Compound annual growth rate (CAGR) FY-2021 versus FY-2019
Full-year 2021 results demonstrated a strong performance with a reported business operating profit (BOP) of USD 5.7 billion compared with USD 4.2 billion in 2020. Growth was driven by an underlying improvement across all businesses and reduced claims from COVID-19. Net income attributable to shareholders amounted to USD 5.2 billion and a dividend of CHF 22 has been proposed.
Executing on strategic prioritiesThe delivery of the strongest BOP performance since 2007 demonstrates the strength of the Group’s franchise and the benefits of repositioning the business in recent years. During the year, the Group continued to advance its customer-focused strategy, reflected in increased customer satisfaction and strong net customer growth. The Group further extended its customer reach through incremental distribution partnerships. At the same time, it’s looking for opportunities to optimize its capital allocation through the sale of the Italian life back book and the continued focus on growing capital-light products.
Excellent results.The Group has delivered the strongest performance in recent times, with all units contributing to underlying improvement in earnings. This demonstrates the success of the Group’s strategy and positions us well for continued growth and provides confidence to meet or exceed the Group’s 2022 targets.George QuinnGroup Chief Financial Officer
Message from our Group Chief Financial Officer
Zurich Insurance Group Annual Report 2021
Group overview
Integrated sustainability disclosure
Governance Risk review
Financial review
218
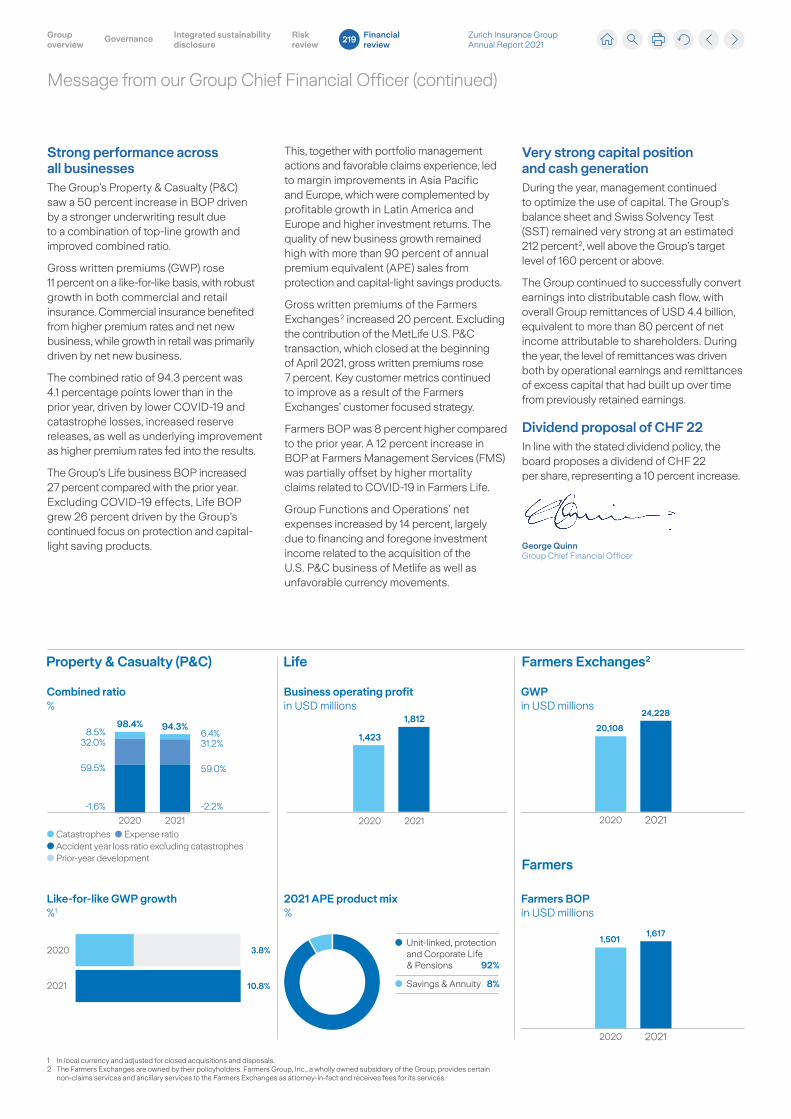
Property & Casualty (P&C)
Combined ratio %
2020
8.5%
-1.6% -2.2%
59.5% 59.0%
32.0% 31.2%
2021
6.4%98.4% 94.3%
Catastrophes Expense ratioAccident year loss ratio excluding catastrophesPrior-year development
2020 2021
Business operating profit
in USD millions
Life Farmers Exchanges2
Farmers
Like-for-like GWP growth %1
2020
2021
Unit-linked, protection and Corporate Life & Pensions 92%
Savings & Annuity 8%
2021 APE product mix %
Farmers BOP in USD millions
2020 2021
1,5011,617
1,423
1,812
10.8%
3.8%
GWP in USD millions
2020 2021
20,108
24,228
Strong performance across all businessesThe Group’s Property & Casualty (P&C) saw a 50 percent increase in BOP driven by a stronger underwriting result due to a combination of top-line growth and improved combined ratio.
Gross written premiums (GWP) rose 11 percent on a like-for-like basis, with robust growth in both commercial and retail insurance. Commercial insurance benefited from higher premium rates and net new business, while growth in retail was primarily driven by net new business.
The combined ratio of 94.3 percent was 4.1 percentage points lower than in the prior year, driven by lower COVID-19 and catastrophe losses, increased reserve releases, as well as underlying improvement as higher premium rates fed into the results.
The Group’s Life business BOP increased 27 percent compared with the prior year. Excluding COVID-19 effects, Life BOP grew 26 percent driven by the Group’s continued focus on protection and capital-light saving products.
This, together with portfolio management actions and favorable claims experience, led to margin improvements in Asia Pacific and Europe, which were complemented by profitable growth in Latin America and Europe and higher investment returns. The quality of new business growth remained high with more than 90 percent of annual premium equivalent (APE) sales from protection and capital-light savings products.
Gross written premiums of the Farmers Exchanges 2 increased 20 percent. Excluding the contribution of the MetLife U.S. P&C transaction, which closed at the beginning of April 2021, gross written premiums rose 7 percent. Key customer metrics continued to improve as a result of the Farmers Exchanges’ customer focused strategy.
Farmers BOP was 8 percent higher compared to the prior year. A 12 percent increase in BOP at Farmers Management Services (FMS) was partially offset by higher mortality claims related to COVID-19 in Farmers Life.
Group Functions and Operations’ net expenses increased by 14 percent, largely due to financing and foregone investment income related to the acquisition of the U.S. P&C business of Metlife as well as unfavorable currency movements.
Very strong capital position and cash generationDuring the year, management continued to optimize the use of capital. The Group’s balance sheet and Swiss Solvency Test (SST) remained very strong at an estimated 212 percent 2, well above the Group’s target level of 160 percent or above.
The Group continued to successfully convert earnings into distributable cash flow, with overall Group remittances of USD 4.4 billion, equivalent to more than 80 percent of net income attributable to shareholders. During the year, the level of remittances was driven both by operational earnings and remittances of excess capital that had built up over time from previously retained earnings.
Dividend proposal of CHF 22In line with the stated dividend policy, the board proposes a dividend of CHF 22 per share, representing a 10 percent increase.
George QuinnGroup Chief Financial Officer
1 In local currency and adjusted for closed acquisitions and disposals.2 The Farmers Exchanges are owned by their policyholders. Farmers Group, Inc., a wholly owned subsidiary of the Group, provides certain
non-claims services and ancillary services to the Farmers Exchanges as attorney-in-fact and receives fees for its services.
Message from our Group Chief Financial Officer (continued)
Zurich Insurance Group Annual Report 2021
Group overview
Integrated sustainability disclosure
Governance Risk review
Financial review
219
The information contained within the financial overview is unaudited and is based on the consolidated results of the Group for the years ended December 31, 2021 and 2020. All amounts are shown in U.S. dollars and rounded to the nearest million unless otherwise stated, with the consequence that the rounded amounts may not always add up to the rounded total. All ratios and variances are calculated using the underlying amounts rather than the rounded amounts. This document should be read in conjunction with the annual results 2021 of the Group and in particular with its consolidated financial statements for the year ended December 31, 2021.
In addition to the figures stated in accordance with International Financial Reporting Standards (IFRS), the Group uses business operating profit (BOP), new business metrics and other performance indicators to enhance the understanding of its results. Details of these additional measures are set out in the separately published glossary. These should be viewed as complementary to, and not as substitutes for, the IFRS figures. For a reconciliation of BOP to net income attributable to shareholders (NIAS), see note 27 (table 27.4) of the audited consolidated financial statements for the year ended December 31, 2021.
Certain comparatives have been revised as a result of reclassifications and other adjustments. For details refer to note 1 of the audited consolidated financial statements.
Contents
Financial highlights 221
Operating update 222
Property & Casualty (P&C) 222
Life 224
Farmers 226
Farmers Exchanges 226
Group Functions and Operations 227
Non-Core Businesses 227
Financial update 228
Balance sheet review 228
Treasury and capital management 228
Significant transactions in 2021 229
Being a responsible taxpayer 229
Message from our Group Chief Investment Officer 230
Financial overviewFinancial overview
Zurich Insurance Group Annual Report 2021
Group overview
Integrated sustainability disclosure
Governance Risk review
Financial review
220
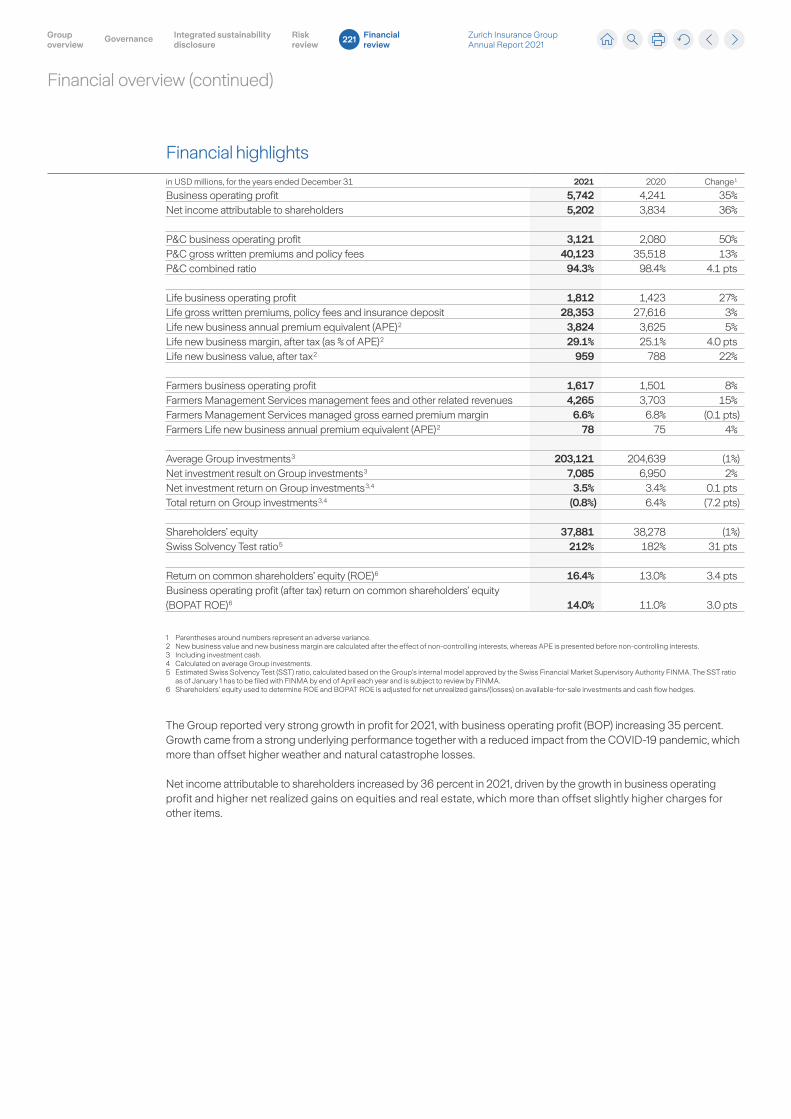
Financial highlights
in USD millions, for the years ended December 31 2021 2020 Change 1
Business operating profit 5,742 4,241 35%Net income attributable to shareholders 5,202 3,834 36%
P&C business operating profit 3,121 2,080 50%P&C gross written premiums and policy fees 40,123 35,518 13%P&C combined ratio 94.3% 98.4% 4.1 pts
Life business operating profit 1,812 1,423 27%Life gross written premiums, policy fees and insurance deposit 28,353 27,616 3%Life new business annual premium equivalent (APE) 2 3,824 3,625 5%Life new business margin, after tax (as % of APE) 2 29.1% 25.1% 4.0 ptsLife new business value, after tax 2 959 788 22%
Farmers business operating profit 1,617 1,501 8%Farmers Management Services management fees and other related revenues 4,265 3,703 15%Farmers Management Services managed gross earned premium margin 6.6% 6.8% (0.1 pts)Farmers Life new business annual premium equivalent (APE) 2 78 75 4%
Average Group investments 3 203,121 204,639 (1%)Net investment result on Group investments 3 7,085 6,950 2%Net investment return on Group investments 3, 4 3.5% 3.4% 0.1 ptsTotal return on Group investments 3, 4 (0.8%) 6.4% (7.2 pts)
Shareholders’ equity 37,881 38,278 (1%)Swiss Solvency Test ratio 5 212% 182% 31 pts
Return on common shareholders’ equity (ROE) 6 16.4% 13.0% 3.4 ptsBusiness operating profit (after tax) return on common shareholders’ equity (BOPAT ROE) 6 14.0% 11.0% 3.0 pts
1 Parentheses around numbers represent an adverse variance.2 New business value and new business margin are calculated after the effect of non-controlling interests, whereas APE is presented before non-controlling interests.3 Including investment cash.4 Calculated on average Group investments.5 Estimated Swiss Solvency Test (SST) ratio, calculated based on the Group’s internal model approved by the Swiss Financial Market Supervisory Authority FINMA. The SST ratio
as of January 1 has to be filed with FINMA by end of April each year and is subject to review by FINMA.6 Shareholders’ equity used to determine ROE and BOPAT ROE is adjusted for net unrealized gains/(losses) on available-for-sale investments and cash flow hedges.
The Group reported very strong growth in profit for 2021, with business operating profit (BOP) increasing 35 percent. Growth came from a strong underlying performance together with a reduced impact from the COVID-19 pandemic, which more than offset higher weather and natural catastrophe losses.
Net income attributable to shareholders increased by 36 percent in 2021, driven by the growth in business operating profit and higher net realized gains on equities and real estate, which more than offset slightly higher charges for other items.
Financial overview (continued)
Zurich Insurance Group Annual Report 2021
Group overview
Integrated sustainability disclosure
Governance Risk review
Financial review
221
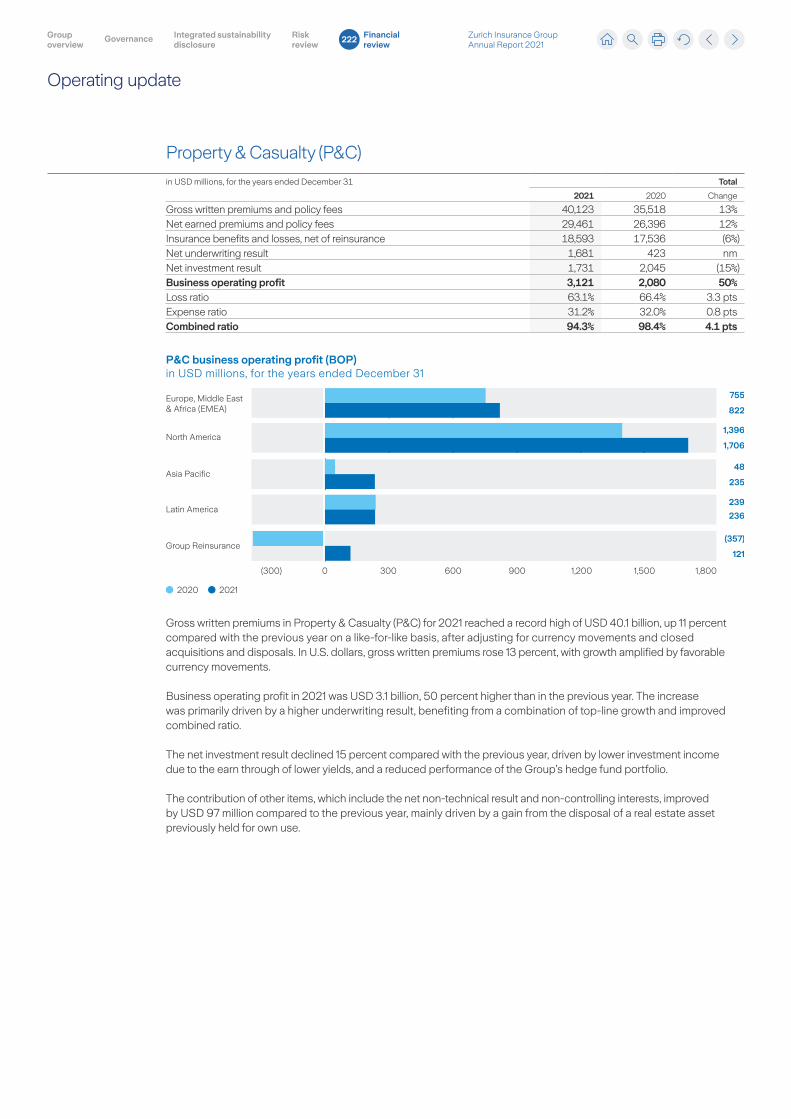
Property & Casualty (P&C)
in USD millions, for the years ended December 31 Total
2021 2020 Change
Gross written premiums and policy fees 40,123 35,518 13%Net earned premiums and policy fees 29,461 26,396 12%Insurance benefits and losses, net of reinsurance 18,593 17,536 (6%)Net underwriting result 1,681 423 nm Net investment result 1,731 2,045 (15%)Business operating profit 3,121 2,080 50%Loss ratio 63.1% 66.4% 3.3 ptsExpense ratio 31.2% 32.0% 0.8 ptsCombined ratio 94.3% 98.4% 4.1 pts
2021
P&C business operating profit (BOP)in USD millions, for the years ended December 31
121
(357)
239
236
235
48
1,706
1,396
755
822
1,5000 300 600 900 1,200 1,800(300)
Europe, Middle East & Africa (EMEA)
North America
Latin America
Group Reinsurance
Asia Pacific
2020
Gross written premiums in Property & Casualty (P&C) for 2021 reached a record high of USD 40.1 billion, up 11 percent compared with the previous year on a like-for-like basis, after adjusting for currency movements and closed acquisitions and disposals. In U.S. dollars, gross written premiums rose 13 percent, with growth amplified by favorable currency movements.
Business operating profit in 2021 was USD 3.1 billion, 50 percent higher than in the previous year. The increase was primarily driven by a higher underwriting result, benefiting from a combination of top-line growth and improved combined ratio.
The net investment result declined 15 percent compared with the previous year, driven by lower investment income due to the earn through of lower yields, and a reduced performance of the Group’s hedge fund portfolio.
The contribution of other items, which include the net non-technical result and non-controlling interests, improved by USD 97 million compared to the previous year, mainly driven by a gain from the disposal of a real estate asset previously held for own use.
Operating update
Operating update
Zurich Insurance Group Annual Report 2021
Group overview
Integrated sustainability disclosure
Governance Risk review
Financial review
222
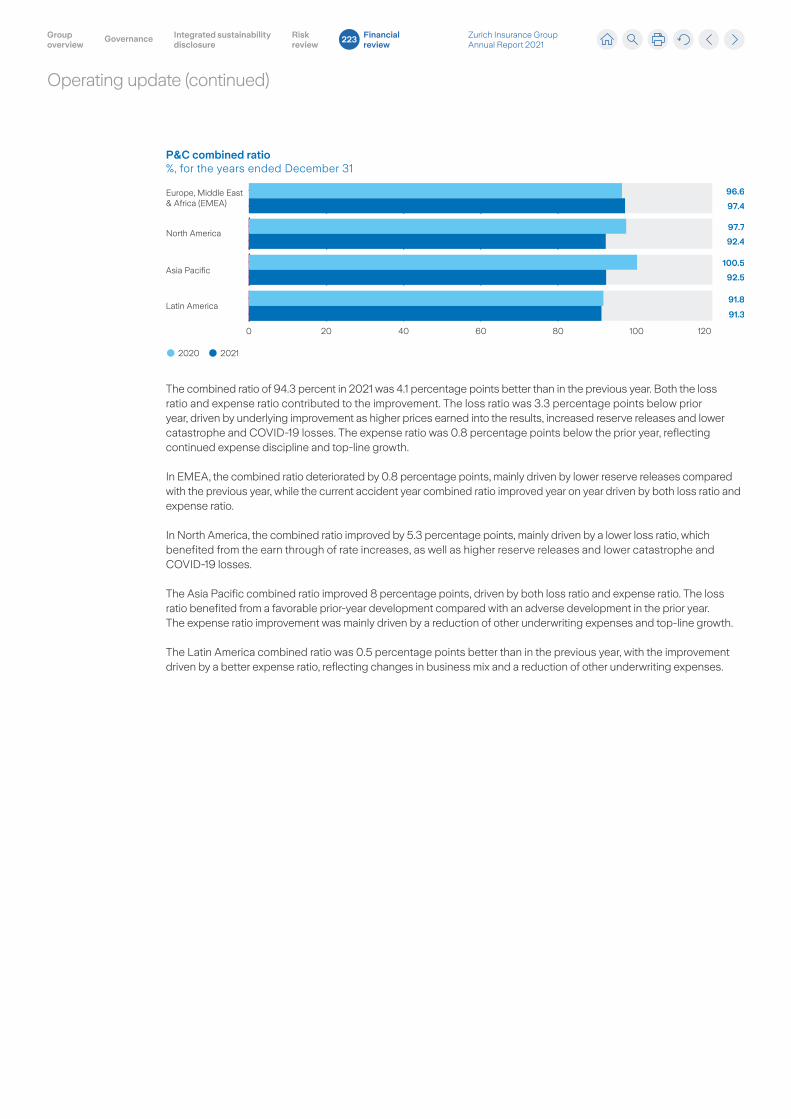
2021
P&C combined ratio%, for the years ended December 31
91.8
91.3
92.5
100.5
92.4
97.7
96.6
97.4
1000 20 40 60 80 120
Europe, Middle East & Africa (EMEA)
North America
Latin America
Asia Pacific
2020
The combined ratio of 94.3 percent in 2021 was 4.1 percentage points better than in the previous year. Both the loss ratio and expense ratio contributed to the improvement. The loss ratio was 3.3 percentage points below prior year, driven by underlying improvement as higher prices earned into the results, increased reserve releases and lower catastrophe and COVID-19 losses. The expense ratio was 0.8 percentage points below the prior year, reflecting continued expense discipline and top-line growth.
In EMEA, the combined ratio deteriorated by 0.8 percentage points, mainly driven by lower reserve releases compared with the previous year, while the current accident year combined ratio improved year on year driven by both loss ratio and expense ratio.
In North America, the combined ratio improved by 5.3 percentage points, mainly driven by a lower loss ratio, which benefited from the earn through of rate increases, as well as higher reserve releases and lower catastrophe and COVID-19 losses.
The Asia Pacific combined ratio improved 8 percentage points, driven by both loss ratio and expense ratio. The loss ratio benefited from a favorable prior-year development compared with an adverse development in the prior year. The expense ratio improvement was mainly driven by a reduction of other underwriting expenses and top-line growth.
The Latin America combined ratio was 0.5 percentage points better than in the previous year, with the improvement driven by a better expense ratio, reflecting changes in business mix and a reduction of other underwriting expenses.
Operating update (continued)
Zurich Insurance Group Annual Report 2021
Group overview
Integrated sustainability disclosure
Governance Risk review
Financial review
223
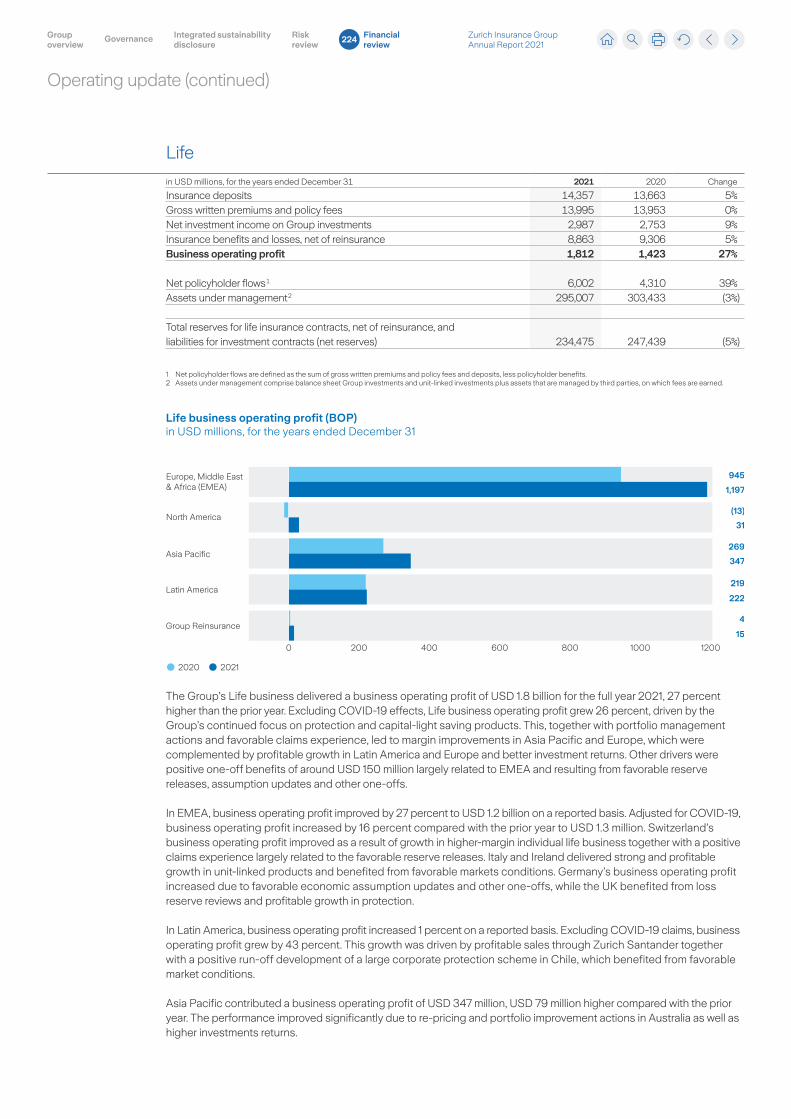
Life
in USD millions, for the years ended December 31 2021 2020 Change
Insurance deposits 14,357 13,663 5%Gross written premiums and policy fees 13,995 13,953 0%Net investment income on Group investments 2,987 2,753 9%Insurance benefits and losses, net of reinsurance 8,863 9,306 5%Business operating profit 1,812 1,423 27%
Net policyholder flows 1 6,002 4,310 39%Assets under management 2 295,007 303,433 (3%)
Total reserves for life insurance contracts, net of reinsurance, and liabilities for investment contracts (net reserves) 234,475 247,439 (5%)
1 Net policyholder flows are defined as the sum of gross written premiums and policy fees and deposits, less policyholder benefits.2 Assets under management comprise balance sheet Group investments and unit-linked investments plus assets that are managed by third parties, on which fees are earned.
Life business operating profit (BOP)in USD millions, for the years ended December 31
0 200 400 600 800 1000 1200
2021
219
222
4
15
347
269
31
(13)
945
1,197
Europe, Middle East & Africa (EMEA)
North America
Latin America
Asia Pacific
2020
Group Reinsurance
The Group’s Life business delivered a business operating profit of USD 1.8 billion for the full year 2021, 27 percent higher than the prior year. Excluding COVID-19 effects, Life business operating profit grew 26 percent, driven by the Group’s continued focus on protection and capital-light saving products. This, together with portfolio management actions and favorable claims experience, led to margin improvements in Asia Pacific and Europe, which were complemented by profitable growth in Latin America and Europe and better investment returns. Other drivers were positive one-off benefits of around USD 150 million largely related to EMEA and resulting from favorable reserve releases, assumption updates and other one-offs.
In EMEA, business operating profit improved by 27 percent to USD 1.2 billion on a reported basis. Adjusted for COVID-19, business operating profit increased by 16 percent compared with the prior year to USD 1.3 million. Switzerland’s business operating profit improved as a result of growth in higher-margin individual life business together with a positive claims experience largely related to the favorable reserve releases. Italy and Ireland delivered strong and profitable growth in unit-linked products and benefited from favorable markets conditions. Germany’s business operating profit increased due to favorable economic assumption updates and other one-offs, while the UK benefited from loss reserve reviews and profitable growth in protection.
In Latin America, business operating profit increased 1 percent on a reported basis. Excluding COVID-19 claims, business operating profit grew by 43 percent. This growth was driven by profitable sales through Zurich Santander together with a positive run-off development of a large corporate protection scheme in Chile, which benefited from favorable market conditions.
Asia Pacific contributed a business operating profit of USD 347 million, USD 79 million higher compared with the prior year. The performance improved significantly due to re-pricing and portfolio improvement actions in Australia as well as higher investments returns.
Operating update (continued)
Zurich Insurance Group Annual Report 2021
Group overview
Integrated sustainability disclosure
Governance Risk review
Financial review
224
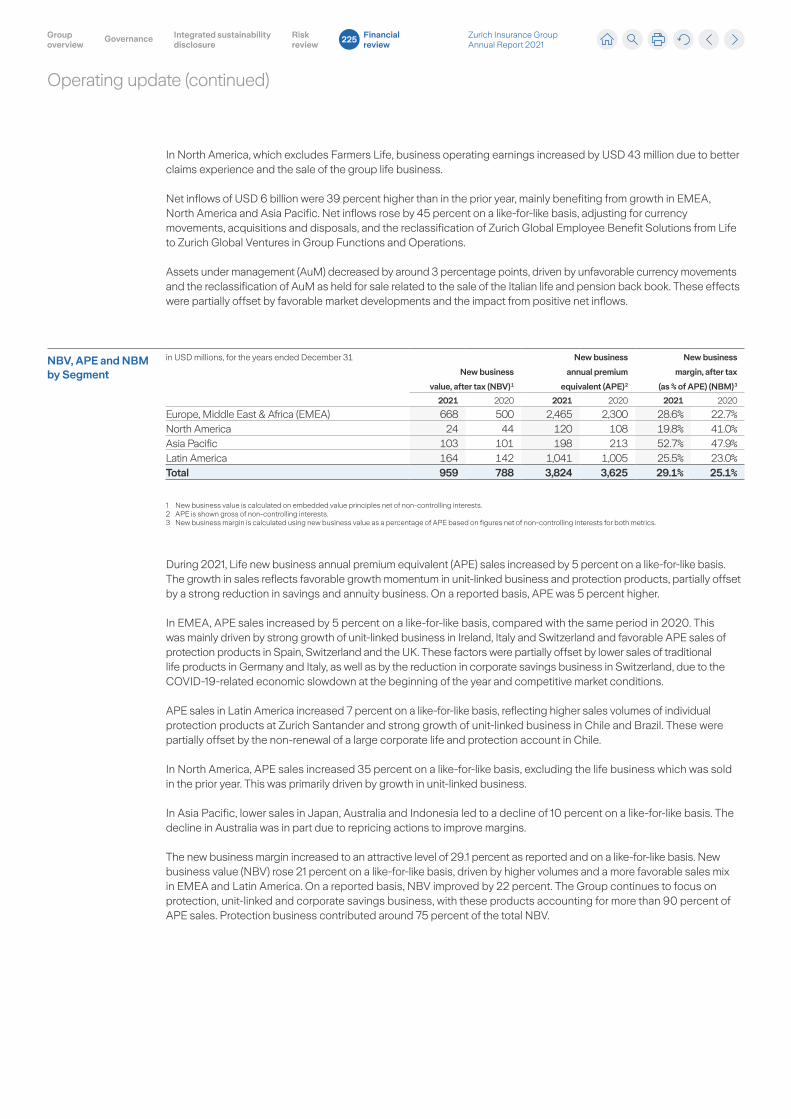
In North America, which excludes Farmers Life, business operating earnings increased by USD 43 million due to better claims experience and the sale of the group life business.
Net inflows of USD 6 billion were 39 percent higher than in the prior year, mainly benefiting from growth in EMEA, North America and Asia Pacific. Net inflows rose by 45 percent on a like-for-like basis, adjusting for currency movements, acquisitions and disposals, and the reclassification of Zurich Global Employee Benefit Solutions from Life to Zurich Global Ventures in Group Functions and Operations.
Assets under management (AuM) decreased by around 3 percentage points, driven by unfavorable currency movements and the reclassification of AuM as held for sale related to the sale of the Italian life and pension back book. These effects were partially offset by favorable market developments and the impact from positive net inflows.
NBV, APE and NBM by Segment
in USD millions, for the years ended December 31
New business
value, after tax (NBV) 1
New business
annual premium
equivalent (APE) 2
New business
margin, after tax
(as % of APE) (NBM) 3
2021 2020 2021 2020 2021 2020
Europe, Middle East & Africa (EMEA) 668 500 2,465 2,300 28.6% 22.7%North America 24 44 120 108 19.8% 41.0%Asia Pacific 103 101 198 213 52.7% 47.9%Latin America 164 142 1,041 1,005 25.5% 23.0%Total 959 788 3,824 3,625 29.1% 25.1%
1 New business value is calculated on embedded value principles net of non-controlling interests.2 APE is shown gross of non-controlling interests.3 New business margin is calculated using new business value as a percentage of APE based on figures net of non-controlling interests for both metrics.
During 2021, Life new business annual premium equivalent (APE) sales increased by 5 percent on a like-for-like basis. The growth in sales reflects favorable growth momentum in unit-linked business and protection products, partially offset by a strong reduction in savings and annuity business. On a reported basis, APE was 5 percent higher.
In EMEA, APE sales increased by 5 percent on a like-for-like basis, compared with the same period in 2020. This was mainly driven by strong growth of unit-linked business in Ireland, Italy and Switzerland and favorable APE sales of protection products in Spain, Switzerland and the UK. These factors were partially offset by lower sales of traditional life products in Germany and Italy, as well as by the reduction in corporate savings business in Switzerland, due to the COVID-19-related economic slowdown at the beginning of the year and competitive market conditions.
APE sales in Latin America increased 7 percent on a like-for-like basis, reflecting higher sales volumes of individual protection products at Zurich Santander and strong growth of unit-linked business in Chile and Brazil. These were partially offset by the non-renewal of a large corporate life and protection account in Chile.
In North America, APE sales increased 35 percent on a like-for-like basis, excluding the life business which was sold in the prior year. This was primarily driven by growth in unit-linked business.
In Asia Pacific, lower sales in Japan, Australia and Indonesia led to a decline of 10 percent on a like-for-like basis. The decline in Australia was in part due to repricing actions to improve margins.
The new business margin increased to an attractive level of 29.1 percent as reported and on a like-for-like basis. New business value (NBV) rose 21 percent on a like-for-like basis, driven by higher volumes and a more favorable sales mix in EMEA and Latin America. On a reported basis, NBV improved by 22 percent. The Group continues to focus on protection, unit-linked and corporate savings business, with these products accounting for more than 90 percent of APE sales. Protection business contributed around 75 percent of the total NBV.
Operating update (continued)
Zurich Insurance Group Annual Report 2021
Group overview
Integrated sustainability disclosure
Governance Risk review
Financial review
225
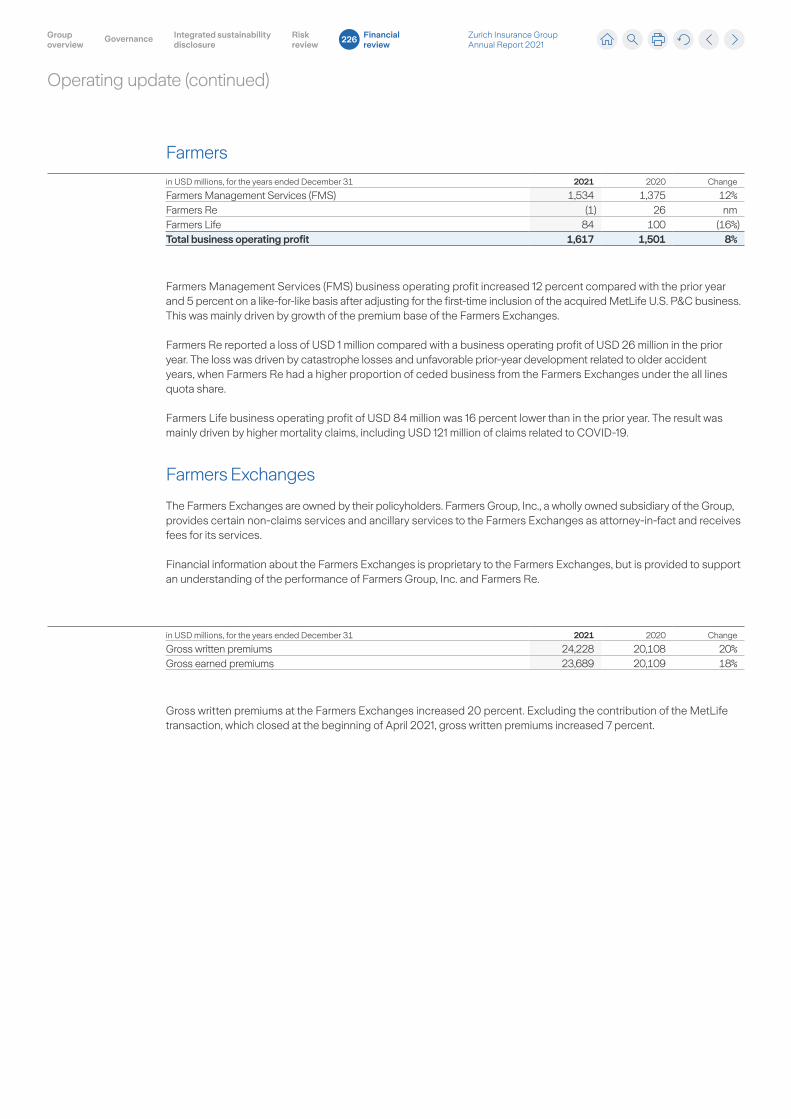
Farmers
in USD millions, for the years ended December 31 2021 2020 Change
Farmers Management Services (FMS) 1,534 1,375 12%Farmers Re (1) 26 nm Farmers Life 84 100 (16%)Total business operating profit 1,617 1,501 8%
Farmers Management Services (FMS) business operating profit increased 12 percent compared with the prior year and 5 percent on a like-for-like basis after adjusting for the first-time inclusion of the acquired MetLife U.S. P&C business. This was mainly driven by growth of the premium base of the Farmers Exchanges.
Farmers Re reported a loss of USD 1 million compared with a business operating profit of USD 26 million in the prior year. The loss was driven by catastrophe losses and unfavorable prior-year development related to older accident years, when Farmers Re had a higher proportion of ceded business from the Farmers Exchanges under the all lines quota share.
Farmers Life business operating profit of USD 84 million was 16 percent lower than in the prior year. The result was mainly driven by higher mortality claims, including USD 121 million of claims related to COVID-19.
Farmers Exchanges
The Farmers Exchanges are owned by their policyholders. Farmers Group, Inc., a wholly owned subsidiary of the Group, provides certain non-claims services and ancillary services to the Farmers Exchanges as attorney-in-fact and receives fees for its services.
Financial information about the Farmers Exchanges is proprietary to the Farmers Exchanges, but is provided to support an understanding of the performance of Farmers Group, Inc. and Farmers Re.
in USD millions, for the years ended December 31 2021 2020 Change
Gross written premiums 24,228 20,108 20%Gross earned premiums 23,689 20,109 18%
Gross written premiums at the Farmers Exchanges increased 20 percent. Excluding the contribution of the MetLife transaction, which closed at the beginning of April 2021, gross written premiums increased 7 percent.
Operating update (continued)
Zurich Insurance Group Annual Report 2021
Group overview
Integrated sustainability disclosure
Governance Risk review
Financial review
226
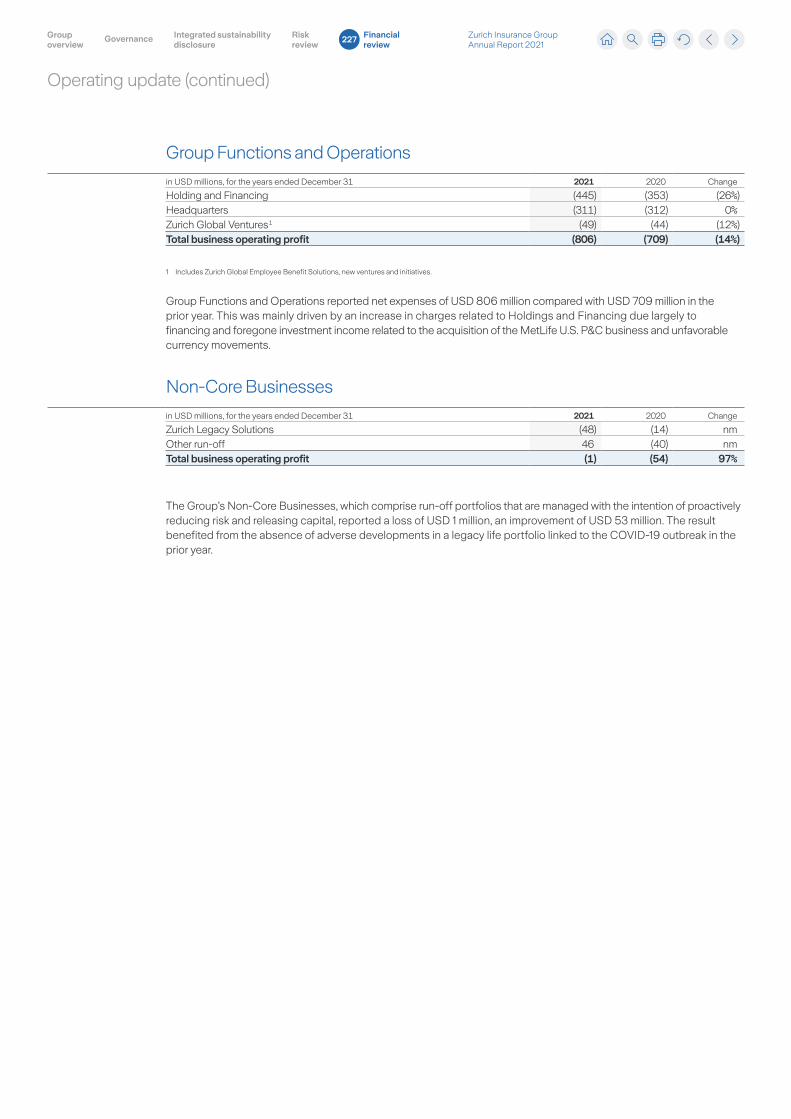
Group Functions and Operations
in USD millions, for the years ended December 31 2021 2020 Change
Holding and Financing (445) (353) (26%)Headquarters (311) (312) 0%Zurich Global Ventures 1 (49) (44) (12%)Total business operating profit (806) (709) (14%)
1 Includes Zurich Global Employee Benefit Solutions, new ventures and initiatives.
Group Functions and Operations reported net expenses of USD 806 million compared with USD 709 million in the prior year. This was mainly driven by an increase in charges related to Holdings and Financing due largely to financing and foregone investment income related to the acquisition of the MetLife U.S. P&C business and unfavorable currency movements.
Non-Core Businesses
in USD millions, for the years ended December 31 2021 2020 Change
Zurich Legacy Solutions (48) (14) nmOther run-off 46 (40) nmTotal business operating profit (1) (54) 97%
The Group’s Non-Core Businesses, which comprise run-off portfolios that are managed with the intention of proactively reducing risk and releasing capital, reported a loss of USD 1 million, an improvement of USD 53 million. The result benefited from the absence of adverse developments in a legacy life portfolio linked to the COVID-19 outbreak in the prior year.
Operating update (continued)
Zurich Insurance Group Annual Report 2021
Group overview
Integrated sustainability disclosure
Governance Risk review
Financial review
227
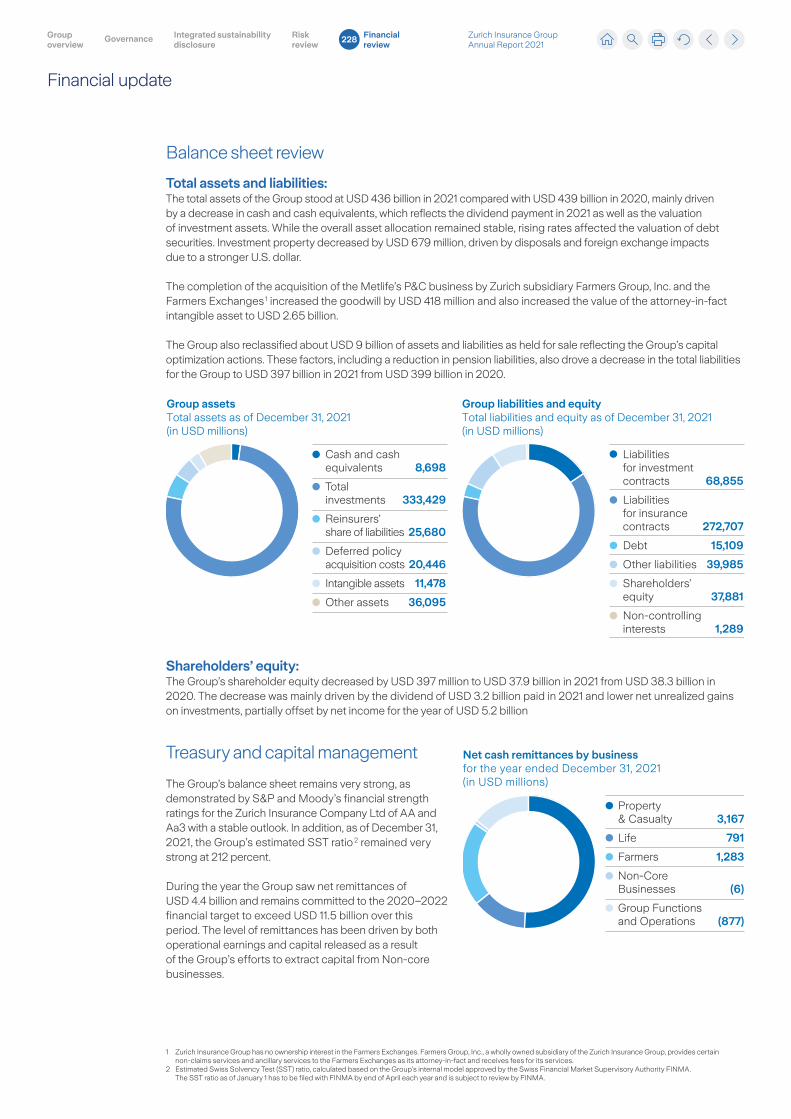
Balance sheet review
Total assets and liabilities:The total assets of the Group stood at USD 436 billion in 2021 compared with USD 439 billion in 2020, mainly driven by a decrease in cash and cash equivalents, which reflects the dividend payment in 2021 as well as the valuation of investment assets. While the overall asset allocation remained stable, rising rates affected the valuation of debt securities. Investment property decreased by USD 679 million, driven by disposals and foreign exchange impacts due to a stronger U.S. dollar.
The completion of the acquisition of the Metlife’s P&C business by Zurich subsidiary Farmers Group, Inc. and the Farmers Exchanges 1 increased the goodwill by USD 418 million and also increased the value of the attorney-in-fact intangible asset to USD 2.65 billion.
The Group also reclassified about USD 9 billion of assets and liabilities as held for sale reflecting the Group’s capital optimization actions. These factors, including a reduction in pension liabilities, also drove a decrease in the total liabilities for the Group to USD 397 billion in 2021 from USD 399 billion in 2020.
Group assetsTotal assets as of December 31, 2021(in USD millions)
Group liabilities and equityTotal liabilities and equity as of December 31, 2021(in USD millions)
Cash and cash equivalents 8,698
Total investments 333,429
Reinsurers’ share of liabilities 25,680
Deferred policyacquisition costs 20,446
Intangible assets 11,478
Other assets 36,095
Liabilities for investment contracts 68,855
Liabilities for insurancecontracts 272,707
Debt 15,109
Other liabilities 39,985
Shareholders’ equity 37,881
Non-controlling interests 1,289
Shareholders’ equity:The Group’s shareholder equity decreased by USD 397 million to USD 37.9 billion in 2021 from USD 38.3 billion in 2020. The decrease was mainly driven by the dividend of USD 3.2 billion paid in 2021 and lower net unrealized gains on investments, partially offset by net income for the year of USD 5.2 billion
Treasury and capital management
The Group’s balance sheet remains very strong, as demonstrated by S&P and Moody’s financial strength ratings for the Zurich Insurance Company Ltd of AA and Aa3 with a stable outlook. In addition, as of December 31, 2021, the Group’s estimated SST ratio 2 remained very strong at 212 percent.
During the year the Group saw net remittances of USD 4.4 billion and remains committed to the 2020–2022 financial target to exceed USD 11.5 billion over this period. The level of remittances has been driven by both operational earnings and capital released as a result of the Group’s efforts to extract capital from Non-core businesses.
Net cash remittances by businessfor the year ended December 31, 2021 (in USD millions)
Property & Casualty 3,167
Life 791
Farmers 1,283
Non-Core Businesses (6)
Group Functionsand Operations (877)
1 Zurich Insurance Group has no ownership interest in the Farmers Exchanges. Farmers Group, Inc., a wholly owned subsidiary of the Zurich Insurance Group, provides certain non-claims services and ancillary services to the Farmers Exchanges as its attorney-in-fact and receives fees for its services.
2 Estimated Swiss Solvency Test (SST) ratio, calculated based on the Group’s internal model approved by the Swiss Financial Market Supervisory Authority FINMA. The SST ratio as of January 1 has to be filed with FINMA by end of April each year and is subject to review by FINMA.
Financial update
Zurich Insurance Group Annual Report 2021
Group overview
Integrated sustainability disclosure
Governance Risk review
Financial review
228
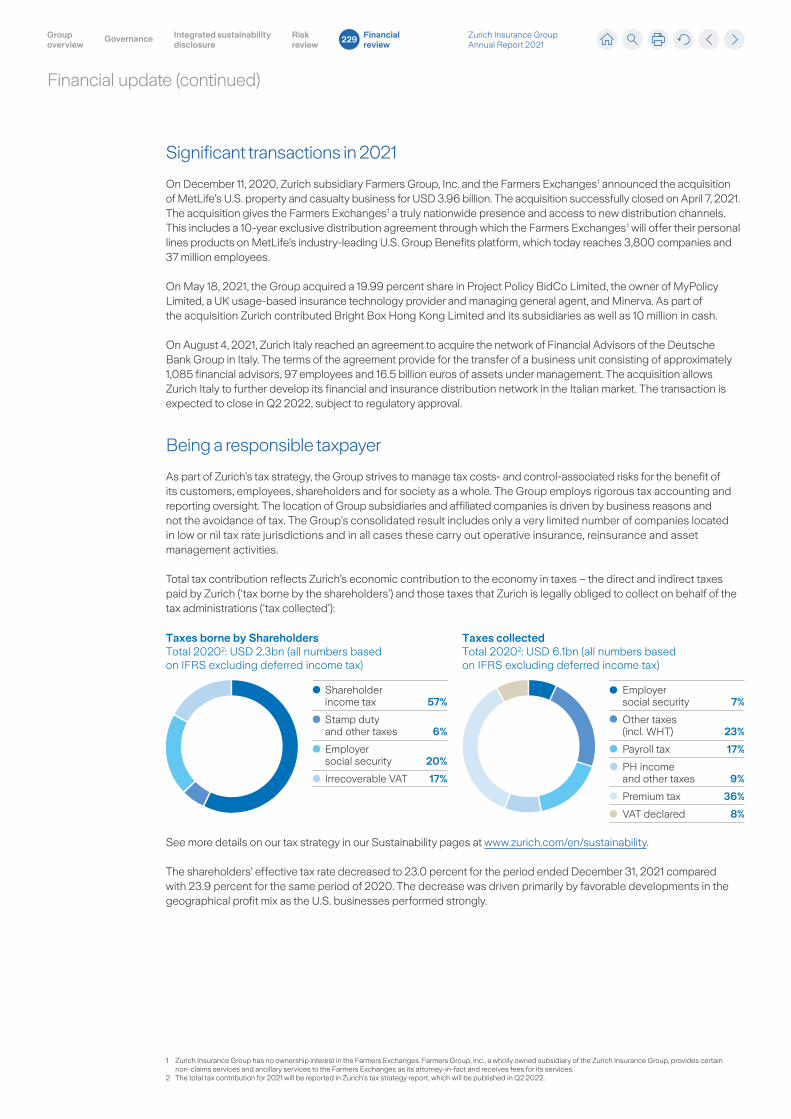
Significant transactions in 2021
On December 11, 2020, Zurich subsidiary Farmers Group, Inc. and the Farmers Exchanges 1 announced the acquisition of MetLife’s U.S. property and casualty business for USD 3.96 billion. The acquisition successfully closed on April 7, 2021. The acquisition gives the Farmers Exchanges 1 a truly nationwide presence and access to new distribution channels. This includes a 10-year exclusive distribution agreement through which the Farmers Exchanges 1 will offer their personal lines products on MetLife’s industry-leading U.S. Group Benefits platform, which today reaches 3,800 companies and 37 million employees.
On May 18, 2021, the Group acquired a 19.99 percent share in Project Policy BidCo Limited, the owner of MyPolicy Limited, a UK usage-based insurance technology provider and managing general agent, and Minerva. As part of the acquisition Zurich contributed Bright Box Hong Kong Limited and its subsidiaries as well as 10 million in cash.
On August 4, 2021, Zurich Italy reached an agreement to acquire the network of Financial Advisors of the Deutsche Bank Group in Italy. The terms of the agreement provide for the transfer of a business unit consisting of approximately 1,085 financial advisors, 97 employees and 16.5 billion euros of assets under management. The acquisition allows Zurich Italy to further develop its financial and insurance distribution network in the Italian market. The transaction is expected to close in Q2 2022, subject to regulatory approval.
Being a responsible taxpayer
As part of Zurich’s tax strategy, the Group strives to manage tax costs- and control-associated risks for the benefit of its customers, employees, shareholders and for society as a whole. The Group employs rigorous tax accounting and reporting oversight. The location of Group subsidiaries and affiliated companies is driven by business reasons and not the avoidance of tax. The Group’s consolidated result includes only a very limited number of companies located in low or nil tax rate jurisdictions and in all cases these carry out operative insurance, reinsurance and asset management activities.
Total tax contribution reflects Zurich’s economic contribution to the economy in taxes – the direct and indirect taxes paid by Zurich (‘tax borne by the shareholders’) and those taxes that Zurich is legally obliged to collect on behalf of the tax administrations (‘tax collected’):
Shareholder income tax 57%
Stamp duty and other taxes 6%
Employer social security 20%
Irrecoverable VAT 17%
Employer social security 7%
Other taxes (incl. WHT) 23%
Payroll tax 17%
PH income and other taxes 9%
Premium tax 36%
VAT declared 8%
Taxes borne by ShareholdersTotal 20202: USD 2.3bn (all numbers based on IFRS excluding deferred income tax)
Taxes collectedTotal 20202: USD 6.1bn (all numbers based on IFRS excluding deferred income tax)
See more details on our tax strategy in our Sustainability pages at www.zurich.com/en/sustainability.
The shareholders’ effective tax rate decreased to 23.0 percent for the period ended December 31, 2021 compared with 23.9 percent for the same period of 2020. The decrease was driven primarily by favorable developments in the geographical profit mix as the U.S. businesses performed strongly.
1 Zurich Insurance Group has no ownership interest in the Farmers Exchanges. Farmers Group, Inc., a wholly owned subsidiary of the Zurich Insurance Group, provides certain non-claims services and ancillary services to the Farmers Exchanges as its attorney-in-fact and receives fees for its services.
2 The total tax contribution for 2021 will be reported in Zurich’s tax strategy report, which will be published in Q2 2022.
Financial update (continued)
Zurich Insurance Group Annual Report 2021
Group overview
Integrated sustainability disclosure
Governance Risk review
Financial review
229
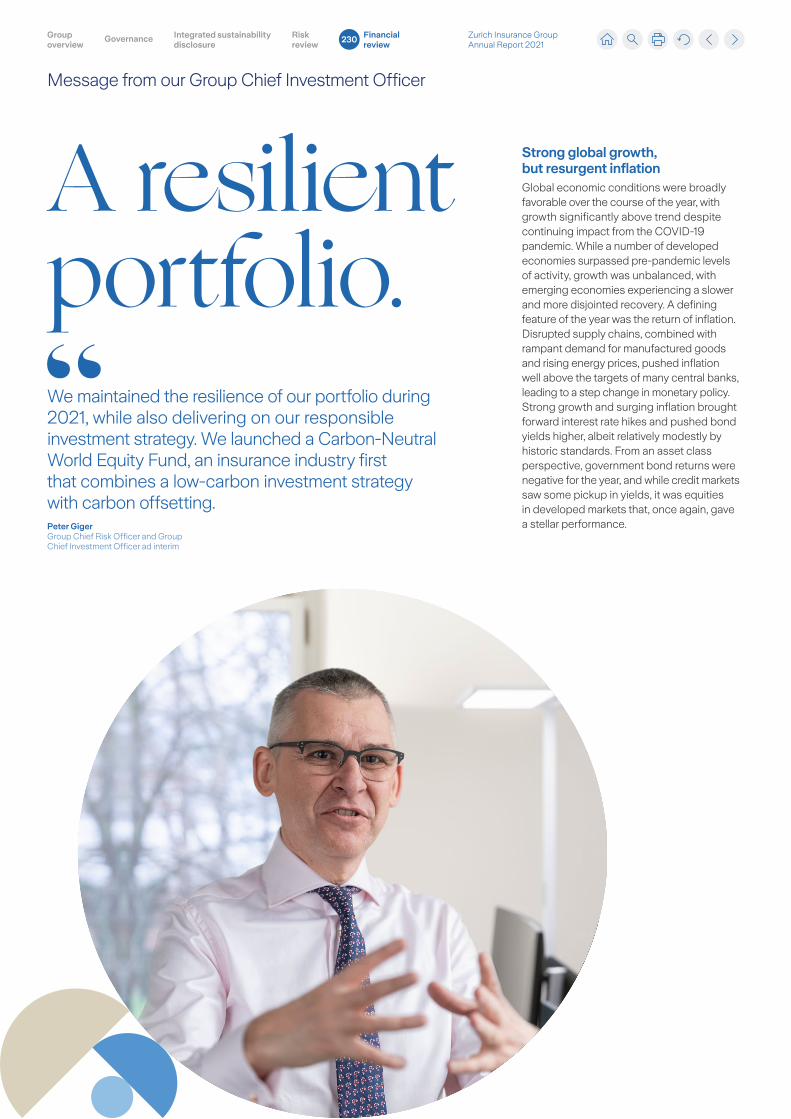
We maintained the resilience of our portfolio during 2021, while also delivering on our responsible investment strategy. We launched a Carbon-Neutral World Equity Fund, an insurance industry first that combines a low-carbon investment strategy with carbon offsetting.Peter GigerGroup Chief Risk Officer and Group Chief Investment Officer ad interim
A resilient portfolio.
Strong global growth, but resurgent inflationGlobal economic conditions were broadly favorable over the course of the year, with growth significantly above trend despite continuing impact from the COVID-19 pandemic. While a number of developed economies surpassed pre-pandemic levels of activity, growth was unbalanced, with emerging economies experiencing a slower and more disjointed recovery. A defining feature of the year was the return of inflation. Disrupted supply chains, combined with rampant demand for manufactured goods and rising energy prices, pushed inflation well above the targets of many central banks, leading to a step change in monetary policy. Strong growth and surging inflation brought forward interest rate hikes and pushed bond yields higher, albeit relatively modestly by historic standards. From an asset class perspective, government bond returns were negative for the year, and while credit markets saw some pickup in yields, it was equities in developed markets that, once again, gave a stellar performance.
Message from our Group Chief Investment Officer
Zurich Insurance Group Annual Report 2021
Group overview
Integrated sustainability disclosure
Governance Risk review
Financial review
230
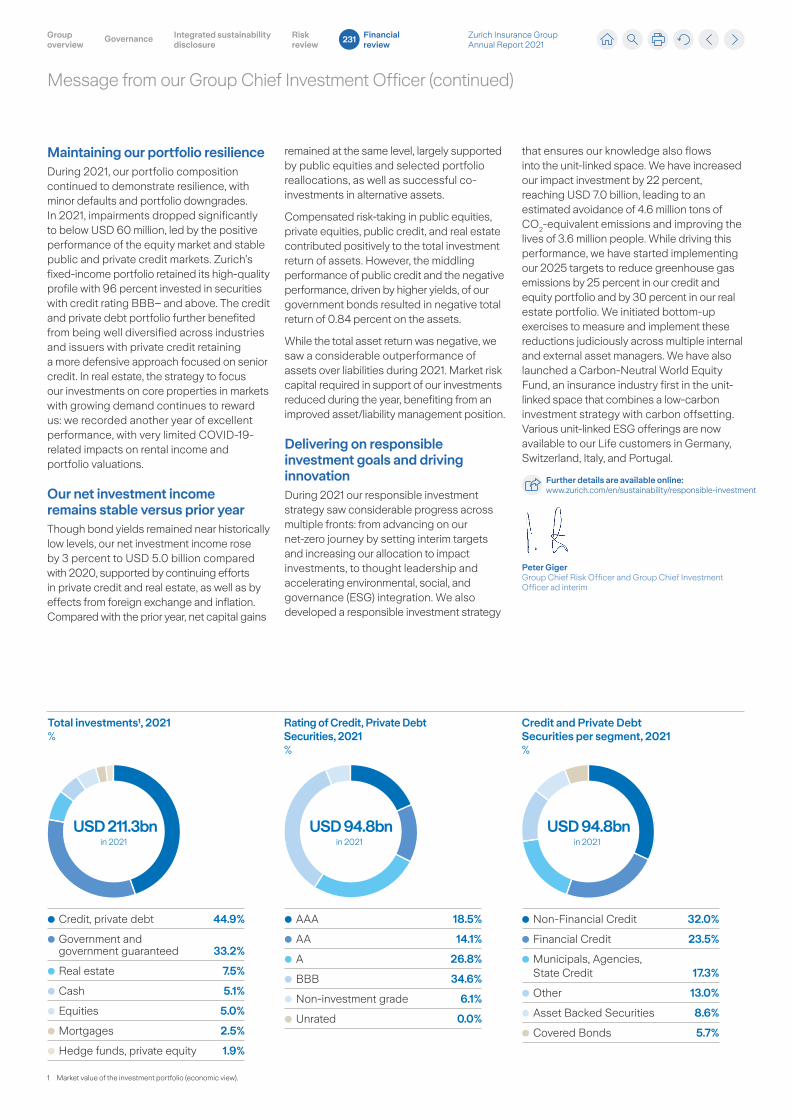
Total investments¹, 2021%
Non-Financial Credit 32.0%
Financial Credit 23.5%
Municipals, Agencies, State Credit 17.3%
Other 13.0%
Asset Backed Securities 8.6%
Covered Bonds 5.7%
Credit and Private Debt Securities per segment, 2021%
AAA 18.5%
AA 14.1%
A 26.8%
BBB 34.6%
Non-investment grade 6.1%
Unrated 0.0%
Rating of Credit, Private Debt Securities, 2021%
Credit, private debt 44.9%
Government and government guaranteed 33.2%
Real estate 7.5%
Cash 5.1%
Equities 5.0%
Mortgages 2.5%
Hedge funds, private equity 1.9%
USD 211.3bnin 2021
USD 94.8bnin 2021
USD 94.8bnin 2021
Maintaining our portfolio resilience During 2021, our portfolio composition continued to demonstrate resilience, with minor defaults and portfolio downgrades. In 2021, impairments dropped significantly to below USD 60 million, led by the positive performance of the equity market and stable public and private credit markets. Zurich’s fixed-income portfolio retained its high-quality profile with 96 percent invested in securities with credit rating BBB– and above. The credit and private debt portfolio further benefited from being well diversified across industries and issuers with private credit retaining a more defensive approach focused on senior credit. In real estate, the strategy to focus our investments on core properties in markets with growing demand continues to reward us: we recorded another year of excellent performance, with very limited COVID-19-related impacts on rental income and portfolio valuations.
Our net investment income remains stable versus prior yearThough bond yields remained near historically low levels, our net investment income rose by 3 percent to USD 5.0 billion compared with 2020, supported by continuing efforts in private credit and real estate, as well as by effects from foreign exchange and inflation. Compared with the prior year, net capital gains
remained at the same level, largely supported by public equities and selected portfolio reallocations, as well as successful co-investments in alternative assets.
Compensated risk-taking in public equities, private equities, public credit, and real estate contributed positively to the total investment return of assets. However, the middling performance of public credit and the negative performance, driven by higher yields, of our government bonds resulted in negative total return of 0.84 percent on the assets.
While the total asset return was negative, we saw a considerable outperformance of assets over liabilities during 2021. Market risk capital required in support of our investments reduced during the year, benefiting from an improved asset/liability management position.
Delivering on responsible investment goals and driving innovationDuring 2021 our responsible investment strategy saw considerable progress across multiple fronts: from advancing on our net-zero journey by setting interim targets and increasing our allocation to impact investments, to thought leadership and accelerating environmental, social, and governance (ESG) integration. We also developed a responsible investment strategy
that ensures our knowledge also flows into the unit-linked space. We have increased our impact investment by 22 percent, reaching USD 7.0 billion, leading to an estimated avoidance of 4.6 million tons of CO
2-equivalent emissions and improving the
lives of 3.6 million people. While driving this performance, we have started implementing our 2025 targets to reduce greenhouse gas emissions by 25 percent in our credit and equity portfolio and by 30 percent in our real estate portfolio. We initiated bottom-up exercises to measure and implement these reductions judiciously across multiple internal and external asset managers. We have also launched a Carbon-Neutral World Equity Fund, an insurance industry first in the unit-linked space that combines a low-carbon investment strategy with carbon offsetting. Various unit-linked ESG offerings are now available to our Life customers in Germany, Switzerland, Italy, and Portugal.
Further details are available online:www.zurich.com/en/sustainability/responsible-investment
Peter GigerGroup Chief Risk Officer and Group Chief Investment Officer ad interim
1 Market value of the investment portfolio (economic view).
Message from our Group Chief Investment Officer (continued)
Zurich Insurance Group Annual Report 2021
Group overview
Integrated sustainability disclosure
Governance Risk review
Financial review
231
Consolidated financial statements
Contents
12. Expenses 279
13. Property and equipment 280
14. Attorney-in-fact contracts, goodwilland other intangible assets 283
15. Receivables and other assets 285
16. Other liabilities 286
17. Income taxes 288
18. Senior and subordinated debt 291
19. Shareholders’ equity, dividendsand earnings per share 293
20. Employee benefits 296
21. Share-based compensation andcash incentive plans 305
22. Commitments and contingencies,legal proceedings and regulatory investigations 307
23. Fair value measurement 309
24. Analysis of financial assets 316
25. Related-party transactions 320
26. Relationship with the Farmers Exchanges 321
27. Segment information 323
28. Interest in subsidiaries 339
29. Events after the balance sheet date 342
Report of the statutory auditor 344
Consolidated income statements 233
Consolidated statements of comprehensive income 234
Consolidated balance sheets 236
Consolidated statements of cash flows 238
Consolidated statements of changes in equity 240
1. Basis of presentation 242
2. New accounting standards and amendments to published accounting standards 244
3. Summary of significant accounting policies 247
4. Critical accounting judgmentsand estimates 255
5. Acquisitions and divestments 259
6. Group investments 262
7. Group derivative financial instruments and hedge accounting 265
8. Liabilities for insurance contracts and reinsurers’ share of liabilities for insurance contracts 269
9. Liabilities for investment contracts 275
10. Gross and ceded insurance revenues and expenses 277
11. Deferred policy acquisition costs and deferred origination costs 278
Consolidated financial statements
Zurich Insurance Group Annual Report 2021
Group overview
Integrated sustainability disclosure
Governance Risk review
Financial review
232
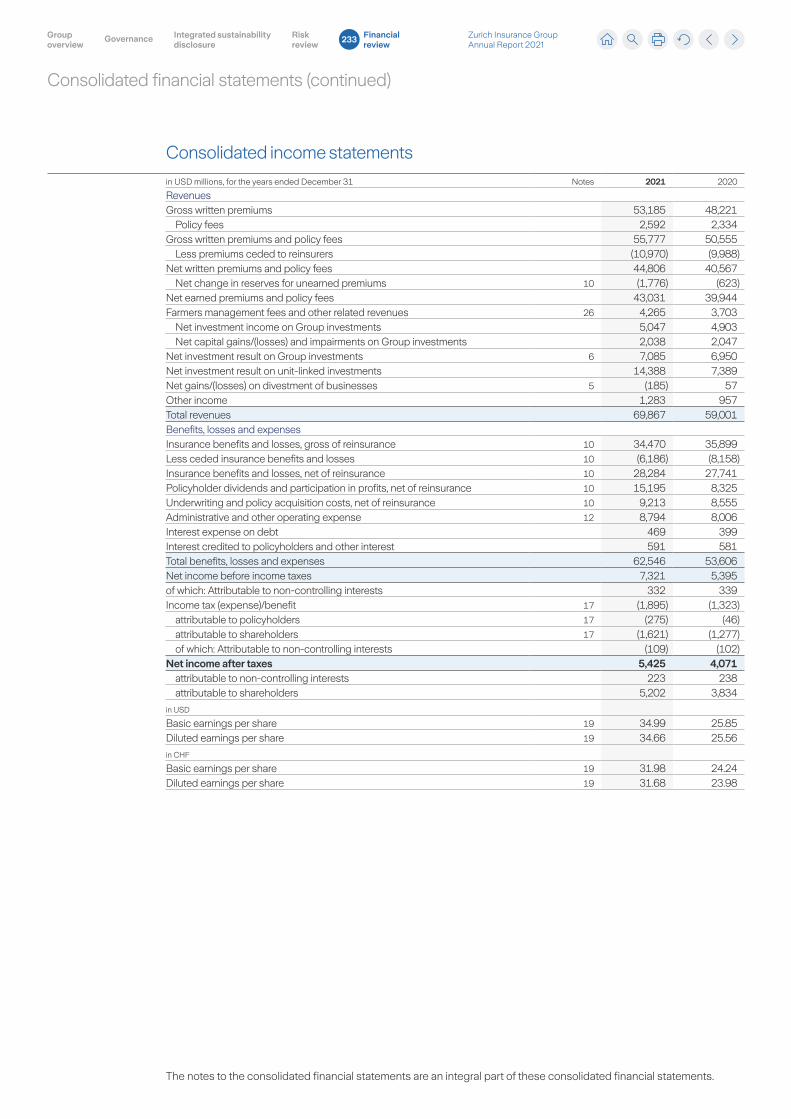
Consolidated financial statements (continued)
Consolidated income statements
in USD millions, for the years ended December 31 Notes 2021 2020
RevenuesGross written premiums 53,185 48,221
Policy fees 2,592 2,334Gross written premiums and policy fees 55,777 50,555
Less premiums ceded to reinsurers (10,970) (9,988)Net written premiums and policy fees 44,806 40,567
Net change in reserves for unearned premiums 10 (1,776) (623)Net earned premiums and policy fees 43,031 39,944Farmers management fees and other related revenues 26 4,265 3,703
Net investment income on Group investments 5,047 4,903Net capital gains/(losses) and impairments on Group investments 2,038 2,047
Net investment result on Group investments 6 7,085 6,950Net investment result on unit-linked investments 14,388 7,389Net gains/(losses) on divestment of businesses 5 (185) 57Other income 1,283 957Total revenues 69,867 59,001Benefits, losses and expensesInsurance benefits and losses, gross of reinsurance 10 34,470 35,899Less ceded insurance benefits and losses 10 (6,186) (8,158)Insurance benefits and losses, net of reinsurance 10 28,284 27,741Policyholder dividends and participation in profits, net of reinsurance 10 15,195 8,325Underwriting and policy acquisition costs, net of reinsurance 10 9,213 8,555Administrative and other operating expense 12 8,794 8,006Interest expense on debt 469 399Interest credited to policyholders and other interest 591 581Total benefits, losses and expenses 62,546 53,606Net income before income taxes 7,321 5,395of which: Attributable to non-controlling interests 332 339Income tax (expense)/benefit 17 (1,895) (1,323)
attributable to policyholders 17 (275) (46)attributable to shareholders 17 (1,621) (1,277)of which: Attributable to non-controlling interests (109) (102)
Net income after taxes 5,425 4,071attributable to non-controlling interests 223 238attributable to shareholders 5,202 3,834
in USD
Basic earnings per share 19 34.99 25.85Diluted earnings per share 19 34.66 25.56
in CHF
Basic earnings per share 19 31.98 24.24Diluted earnings per share 19 31.68 23.98
The notes to the consolidated financial statements are an integral part of these consolidated financial statements.
Zurich Insurance Group Annual Report 2021
Group overview
Integrated sustainability disclosure
Governance Risk review
Financial review
233
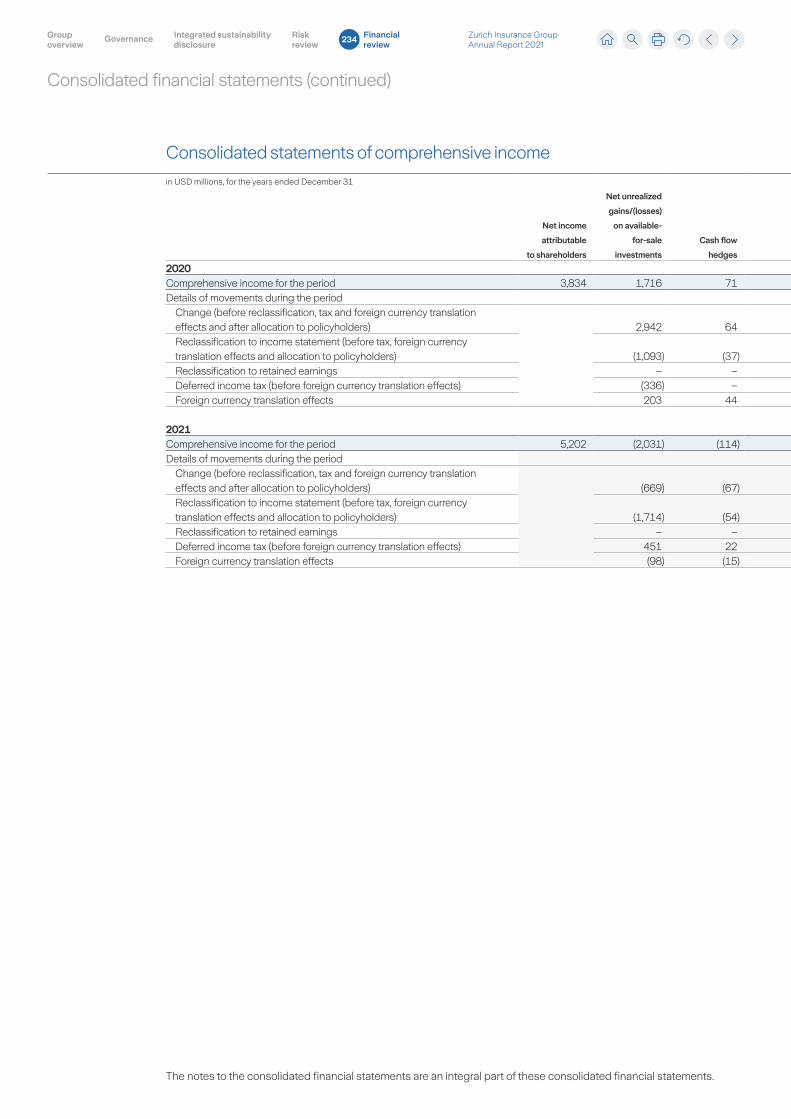
Consolidated financial statements (continued)
The notes to the consolidated financial statements are an integral part of these consolidated financial statements.
Consolidated statements of comprehensive income
in USD millions, for the years ended December 31
Net income
attributable
to shareholders
Net unrealized
gains/(losses)
on available-
for-sale
investments
Cash flow
hedges
Cumulative
foreign
currency
translation
adjustment
Total other
comprehensive
income
recycled through
profit or loss
Revaluation
reserve
Net actuarial
gains/(losses)
on pension plans
Total other
comprehensive
income
not recycled
through
profit or loss
Total other
comprehensive
income
attributable
to shareholders
Total
comprehensive
income
attributable
to shareholders
Total
comprehensive
income
attributable to
non-controlling
interests
Total
comprehensive
income
2020Comprehensive income for the period 3,834 1,716 71 585 2,372 61 (91) (30) 2,342 6,176 211 6,387Details of movements during the period
Change (before reclassification, tax and foreign currency translation effects and after allocation to policyholders) 2,942 64 601 3,608 83 29 112 3,720 Reclassification to income statement (before tax, foreign currency translation effects and allocation to policyholders) (1,093) (37) (17) (1,146) – – – (1,146) Reclassification to retained earnings – – – – (17) – (17) (17) Deferred income tax (before foreign currency translation effects) (336) – – (337) (5) (13) (18) (355) Foreign currency translation effects 203 44 247 – (107) (107) 140
2021Comprehensive income for the period 5,202 (2,031) (114) (1,088) (3,234) (19) 885 865 (2,368) 2,834 45 2,878Details of movements during the period
Change (before reclassification, tax and foreign currency translation effects and after allocation to policyholders) (669) (67) (1,081) (1,817) 8 886 895 (922) Reclassification to income statement (before tax, foreign currency translation effects and allocation to policyholders) (1,714) (54) (7) (1,775) – – – (1,775) Reclassification to retained earnings – – – – (13) – (13) (13) Deferred income tax (before foreign currency translation effects) 451 22 – 472 (15) (34) (49) 423 Foreign currency translation effects (98) (15) (114) – 33 33 (81)
Zurich Insurance Group Annual Report 2021
Group overview
Integrated sustainability disclosure
Governance Risk review
Financial review
234
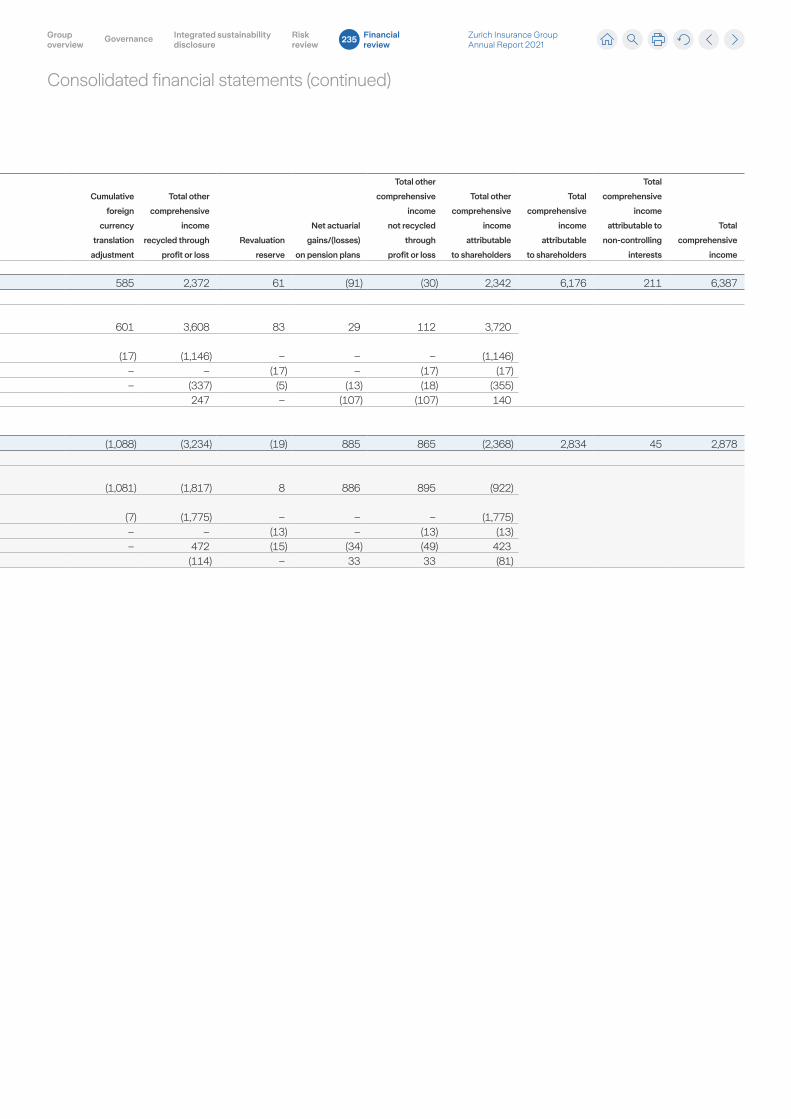
Consolidated financial statements (continued)
Consolidated statements of comprehensive income
in USD millions, for the years ended December 31
Net income
attributable
to shareholders
Net unrealized
gains/(losses)
on available-
for-sale
investments
Cash flow
hedges
Cumulative
foreign
currency
translation
adjustment
Total other
comprehensive
income
recycled through
profit or loss
Revaluation
reserve
Net actuarial
gains/(losses)
on pension plans
Total other
comprehensive
income
not recycled
through
profit or loss
Total other
comprehensive
income
attributable
to shareholders
Total
comprehensive
income
attributable
to shareholders
Total
comprehensive
income
attributable to
non-controlling
interests
Total
comprehensive
income
2020Comprehensive income for the period 3,834 1,716 71 585 2,372 61 (91) (30) 2,342 6,176 211 6,387Details of movements during the period
Change (before reclassification, tax and foreign currency translation effects and after allocation to policyholders) 2,942 64 601 3,608 83 29 112 3,720 Reclassification to income statement (before tax, foreign currency translation effects and allocation to policyholders) (1,093) (37) (17) (1,146) – – – (1,146) Reclassification to retained earnings – – – – (17) – (17) (17) Deferred income tax (before foreign currency translation effects) (336) – – (337) (5) (13) (18) (355) Foreign currency translation effects 203 44 247 – (107) (107) 140
2021Comprehensive income for the period 5,202 (2,031) (114) (1,088) (3,234) (19) 885 865 (2,368) 2,834 45 2,878Details of movements during the period
Change (before reclassification, tax and foreign currency translation effects and after allocation to policyholders) (669) (67) (1,081) (1,817) 8 886 895 (922) Reclassification to income statement (before tax, foreign currency translation effects and allocation to policyholders) (1,714) (54) (7) (1,775) – – – (1,775) Reclassification to retained earnings – – – – (13) – (13) (13) Deferred income tax (before foreign currency translation effects) 451 22 – 472 (15) (34) (49) 423 Foreign currency translation effects (98) (15) (114) – 33 33 (81)
Zurich Insurance Group Annual Report 2021
Group overview
Integrated sustainability disclosure
Governance Risk review
Financial review
235
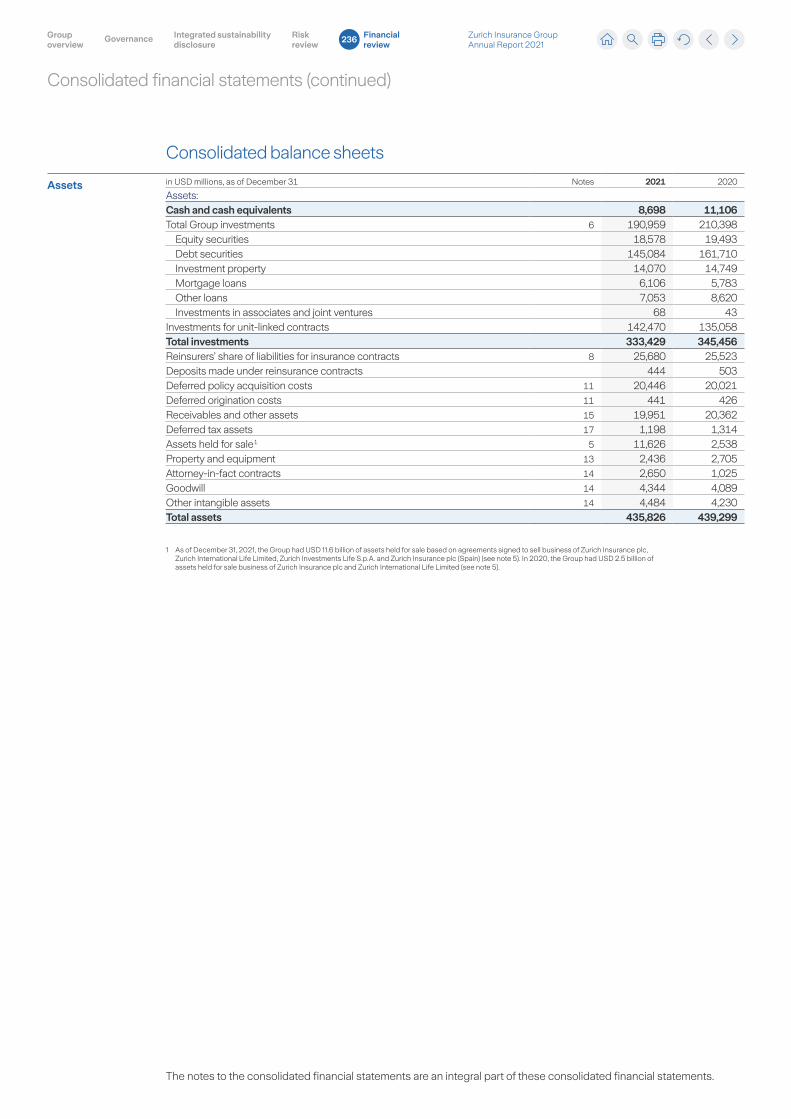
Consolidated financial statements (continued)
Consolidated balance sheets
Assets in USD millions, as of December 31 Notes 2021 2020
Assets:Cash and cash equivalents 8,698 11,106Total Group investments 6 190,959 210,398
Equity securities 18,578 19,493Debt securities 145,084 161,710Investment property 14,070 14,749Mortgage loans 6,106 5,783Other loans 7,053 8,620Investments in associates and joint ventures 68 43
Investments for unit-linked contracts 142,470 135,058Total investments 333,429 345,456Reinsurers’ share of liabilities for insurance contracts 8 25,680 25,523Deposits made under reinsurance contracts 444 503Deferred policy acquisition costs 11 20,446 20,021Deferred origination costs 11 441 426Receivables and other assets 15 19,951 20,362Deferred tax assets 17 1,198 1,314Assets held for sale 1 5 11,626 2,538Property and equipment 13 2,436 2,705Attorney-in-fact contracts 14 2,650 1,025Goodwill 14 4,344 4,089Other intangible assets 14 4,484 4,230Total assets 435,826 439,299
1 As of December 31, 2021, the Group had USD 11.6 billion of assets held for sale based on agreements signed to sell business of Zurich Insurance plc, Zurich International Life Limited, Zurich Investments Life S.p.A. and Zurich Insurance plc (Spain) (see note 5). In 2020, the Group had USD 2.5 billion of
assets held for sale business of Zurich Insurance plc and Zurich International Life Limited (see note 5).
The notes to the consolidated financial statements are an integral part of these consolidated financial statements.
Zurich Insurance Group Annual Report 2021
Group overview
Integrated sustainability disclosure
Governance Risk review
Financial review
236
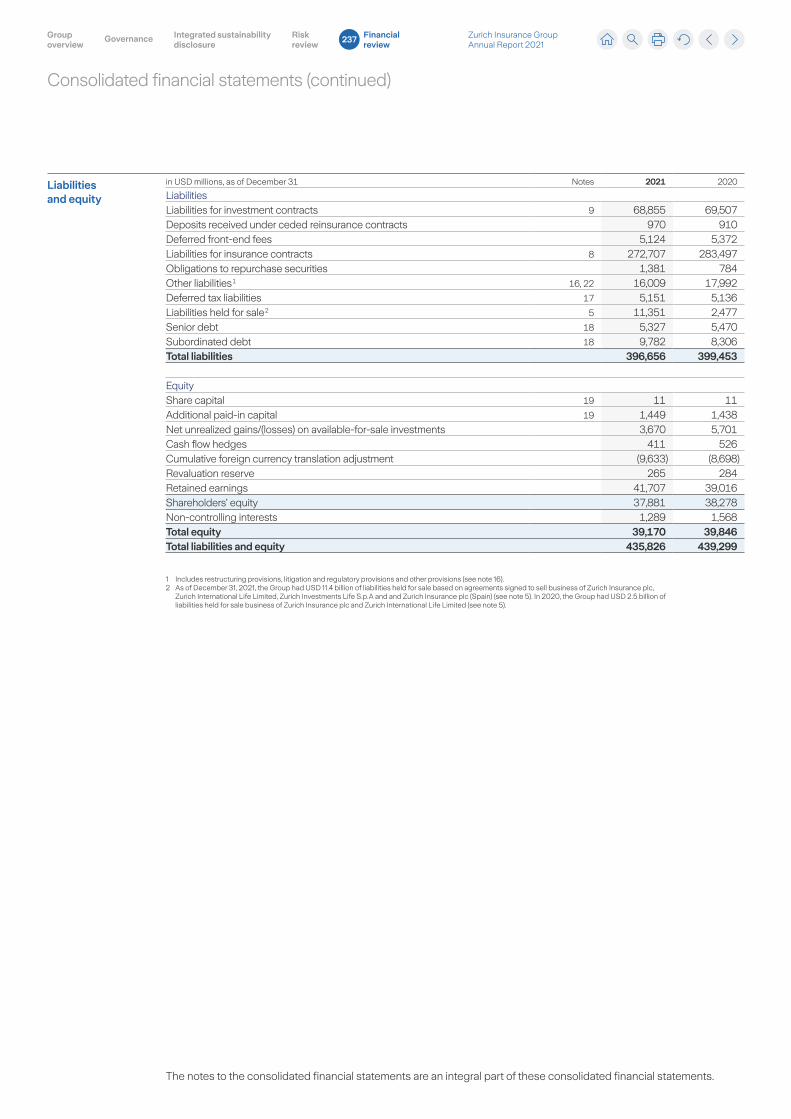
Consolidated financial statements (continued)
Liabilities and equity
in USD millions, as of December 31 Notes 2021 2020
LiabilitiesLiabilities for investment contracts 9 68,855 69,507Deposits received under ceded reinsurance contracts 970 910Deferred front-end fees 5,124 5,372Liabilities for insurance contracts 8 272,707 283,497Obligations to repurchase securities 1,381 784Other liabilities 1 16, 22 16,009 17,992Deferred tax liabilities 17 5,151 5,136Liabilities held for sale 2 5 11,351 2,477Senior debt 18 5,327 5,470Subordinated debt 18 9,782 8,306Total liabilities 396,656 399,453
EquityShare capital 19 11 11Additional paid-in capital 19 1,449 1,438Net unrealized gains/(losses) on available-for-sale investments 3,670 5,701Cash flow hedges 411 526Cumulative foreign currency translation adjustment (9,633) (8,698)Revaluation reserve 265 284Retained earnings 41,707 39,016Shareholders’ equity 37,881 38,278Non-controlling interests 1,289 1,568Total equity 39,170 39,846Total liabilities and equity 435,826 439,299
1 Includes restructuring provisions, litigation and regulatory provisions and other provisions (see note 16).2 As of December 31, 2021, the Group had USD 11.4 billion of liabilities held for sale based on agreements signed to sell business of Zurich Insurance plc,
Zurich International Life Limited, Zurich Investments Life S.p.A and and Zurich Insurance plc (Spain) (see note 5). In 2020, the Group had USD 2.5 billion of liabilities held for sale business of Zurich Insurance plc and Zurich International Life Limited (see note 5).
The notes to the consolidated financial statements are an integral part of these consolidated financial statements.
Zurich Insurance Group Annual Report 2021
Group overview
Integrated sustainability disclosure
Governance Risk review
Financial review
237
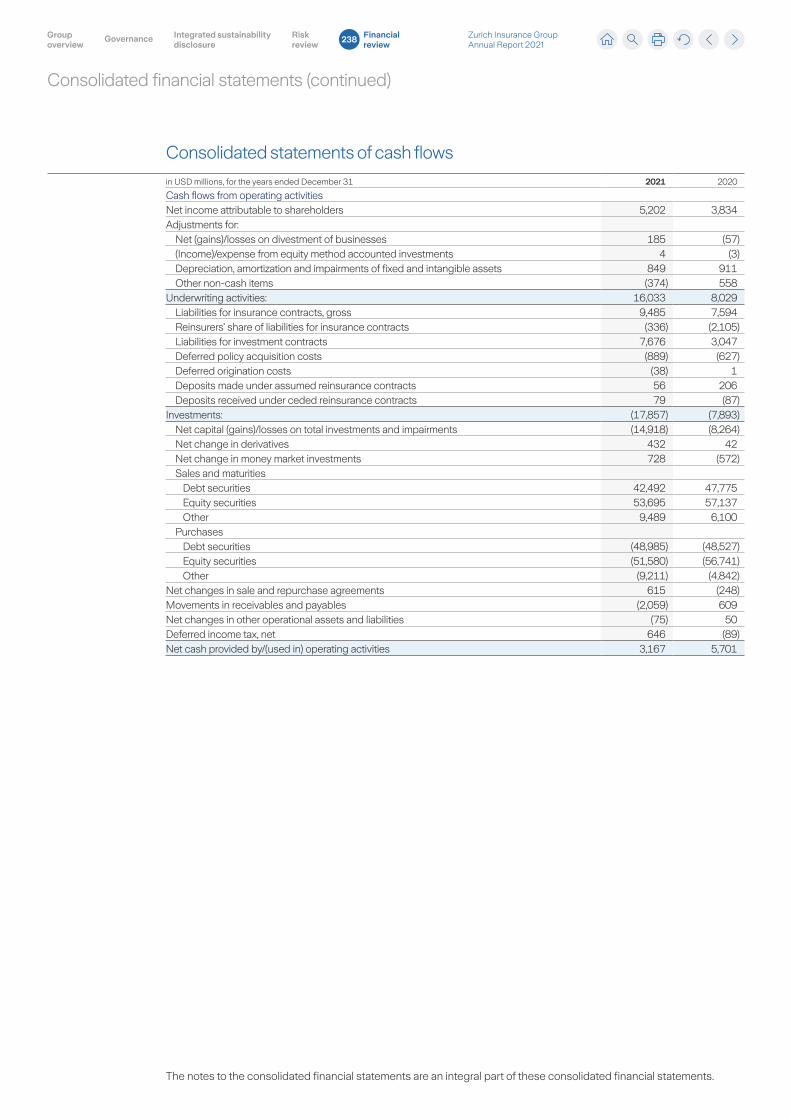
Consolidated financial statements (continued)
Consolidated statements of cash flows
in USD millions, for the years ended December 31 2021 2020
Cash flows from operating activitiesNet income attributable to shareholders 5,202 3,834Adjustments for:
Net (gains)/losses on divestment of businesses 185 (57)(Income)/expense from equity method accounted investments 4 (3)Depreciation, amortization and impairments of fixed and intangible assets 849 911Other non-cash items (374) 558
Underwriting activities: 16,033 8,029Liabilities for insurance contracts, gross 9,485 7,594Reinsurers’ share of liabilities for insurance contracts (336) (2,105)Liabilities for investment contracts 7,676 3,047Deferred policy acquisition costs (889) (627)Deferred origination costs (38) 1Deposits made under assumed reinsurance contracts 56 206Deposits received under ceded reinsurance contracts 79 (87)
Investments: (17,857) (7,893)Net capital (gains)/losses on total investments and impairments (14,918) (8,264)Net change in derivatives 432 42Net change in money market investments 728 (572)Sales and maturities
Debt securities 42,492 47,775Equity securities 53,695 57,137Other 9,489 6,100
PurchasesDebt securities (48,985) (48,527)Equity securities (51,580) (56,741)Other (9,211) (4,842)
Net changes in sale and repurchase agreements 615 (248)Movements in receivables and payables (2,059) 609Net changes in other operational assets and liabilities (75) 50Deferred income tax, net 646 (89)Net cash provided by/(used in) operating activities 3,167 5,701
The notes to the consolidated financial statements are an integral part of these consolidated financial statements.
Zurich Insurance Group Annual Report 2021
Group overview
Integrated sustainability disclosure
Governance Risk review
Financial review
238
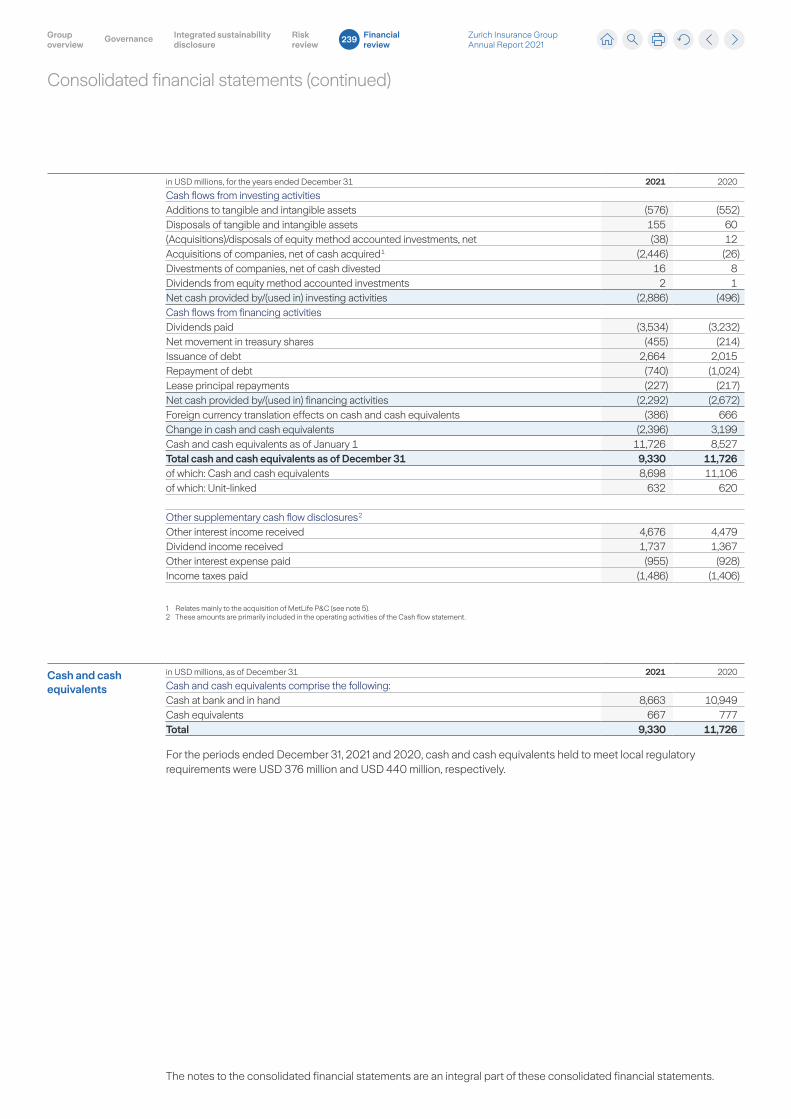
Consolidated financial statements (continued)
in USD millions, for the years ended December 31 2021 2020
Cash flows from investing activitiesAdditions to tangible and intangible assets (576) (552)Disposals of tangible and intangible assets 155 60(Acquisitions)/disposals of equity method accounted investments, net (38) 12Acquisitions of companies, net of cash acquired 1 (2,446) (26)Divestments of companies, net of cash divested 16 8Dividends from equity method accounted investments 2 1Net cash provided by/(used in) investing activities (2,886) (496)Cash flows from financing activitiesDividends paid (3,534) (3,232)Net movement in treasury shares (455) (214)Issuance of debt 2,664 2,015Repayment of debt (740) (1,024)Lease principal repayments (227) (217)Net cash provided by/(used in) financing activities (2,292) (2,672)Foreign currency translation effects on cash and cash equivalents (386) 666Change in cash and cash equivalents (2,396) 3,199Cash and cash equivalents as of January 1 11,726 8,527Total cash and cash equivalents as of December 31 9,330 11,726of which: Cash and cash equivalents 8,698 11,106of which: Unit-linked 632 620
Other supplementary cash flow disclosures 2
Other interest income received 4,676 4,479Dividend income received 1,737 1,367Other interest expense paid (955) (928)Income taxes paid (1,486) (1,406)
1 Relates mainly to the acquisition of MetLife P&C (see note 5).2 These amounts are primarily included in the operating activities of the Cash flow statement.
Cash and cash equivalents
in USD millions, as of December 31 2021 2020
Cash and cash equivalents comprise the following:Cash at bank and in hand 8,663 10,949Cash equivalents 667 777Total 9,330 11,726
For the periods ended December 31, 2021 and 2020, cash and cash equivalents held to meet local regulatory requirements were USD 376 million and USD 440 million, respectively.
The notes to the consolidated financial statements are an integral part of these consolidated financial statements.
Zurich Insurance Group Annual Report 2021
Group overview
Integrated sustainability disclosure
Governance Risk review
Financial review
239
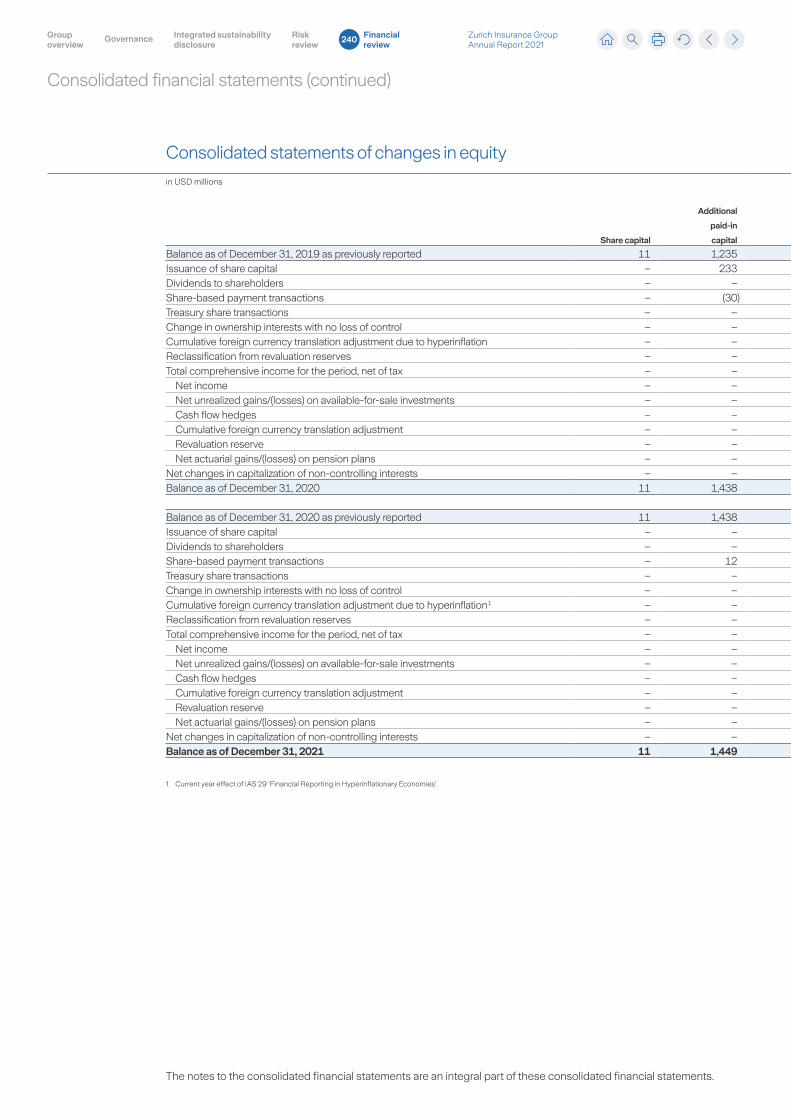
Consolidated financial statements (continued)
Consolidated statements of changes in equity
in USD millions
Share capital
Additional
paid-in
capital
Net unrealized
gains/(losses)
on available-
for-sale
investments
Cash flow
hedges
Cumulative
foreign
currency
translation
adjustment
Revaluation
reserve
Retained
earnings
Shareholders’
equity
Non-
controlling
interests
Total
equity
Balance as of December 31, 2019 as previously reported 11 1,235 3,985 454 (9,349) 223 38,445 35,004 1,545 36,549Issuance of share capital – 233 – – – – – 233 – 233Dividends to shareholders – – – – – – (3,080) (3,080) (152) (3,232)Share-based payment transactions – (30) – – – – 50 20 – 20Treasury share transactions – – – – – – (157) (157) – (157)Change in ownership interests with no loss of control – – – – – – (3) (3) – (3)Cumulative foreign currency translation adjustment due to hyperinflation – – – – 67 – – 67 6 73Reclassification from revaluation reserves – – – – – – 17 17 – 17Total comprehensive income for the period, net of tax – – 1,716 71 585 61 3,742 6,176 211 6,387
Net income – – – – – – 3,834 3,834 Net unrealized gains/(losses) on available-for-sale investments – – 1,716 – – – – 1,716 Cash flow hedges – – – 71 – – – 71 Cumulative foreign currency translation adjustment – – – – 585 – – 585 Revaluation reserve – – – – – 61 – 61 Net actuarial gains/(losses) on pension plans – – – – – – (91) (91)
Net changes in capitalization of non-controlling interests – – – – – – – – (42) (42)Balance as of December 31, 2020 11 1,438 5,701 526 (8,698) 284 39,016 38,278 1,568 39,846
Balance as of December 31, 2020 as previously reported 11 1,438 5,701 526 (8,698) 284 39,016 38,278 1,568 39,846Issuance of share capital – – – – – – – – – –Dividends to shareholders – – – – – – (3,199) (3,199) (335) (3,534)Share-based payment transactions – 12 – – – – (54) (42) – (42)Treasury share transactions – – – – – – (146) (146) – (146)Change in ownership interests with no loss of control – – – – – – – – – –Cumulative foreign currency translation adjustment due to hyperinflation 1 – – – – 153 – (10) 143 12 155Reclassification from revaluation reserves – – – – – – 13 13 – 13Total comprehensive income for the period, net of tax – – (2,031) (114) (1,088) (19) 6,087 2,834 45 2,878
Net income – – – – – – 5,202 5,202 Net unrealized gains/(losses) on available-for-sale investments – – (2,031) – – – – (2,031) Cash flow hedges – – – (114) – – – (114) Cumulative foreign currency translation adjustment – – – – (1,088) – – (1,088) Revaluation reserve – – – – – (19) – (19) Net actuarial gains/(losses) on pension plans – – – – – – 885 885
Net changes in capitalization of non-controlling interests – – – – – – – – – –Balance as of December 31, 2021 11 1,449 3,670 411 (9,633) 265 41,707 37,881 1,289 39,170
1 Current year effect of IAS 29 ‘Financial Reporting in Hyperinflationary Economies’.
The notes to the consolidated financial statements are an integral part of these consolidated financial statements.
Zurich Insurance Group Annual Report 2021
Group overview
Integrated sustainability disclosure
Governance Risk review
Financial review
240
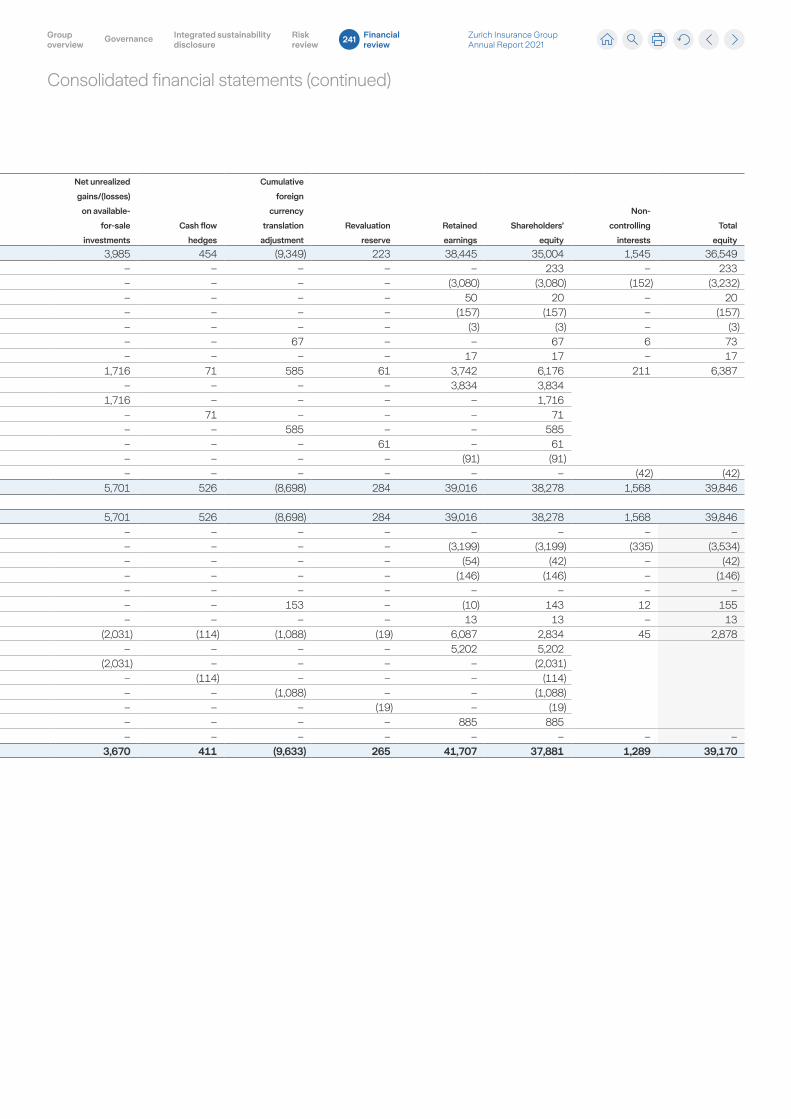
Consolidated financial statements (continued)
Consolidated statements of changes in equity
in USD millions
Share capital
Additional
paid-in
capital
Net unrealized
gains/(losses)
on available-
for-sale
investments
Cash flow
hedges
Cumulative
foreign
currency
translation
adjustment
Revaluation
reserve
Retained
earnings
Shareholders’
equity
Non-
controlling
interests
Total
equity
Balance as of December 31, 2019 as previously reported 11 1,235 3,985 454 (9,349) 223 38,445 35,004 1,545 36,549Issuance of share capital – 233 – – – – – 233 – 233Dividends to shareholders – – – – – – (3,080) (3,080) (152) (3,232)Share-based payment transactions – (30) – – – – 50 20 – 20Treasury share transactions – – – – – – (157) (157) – (157)Change in ownership interests with no loss of control – – – – – – (3) (3) – (3)Cumulative foreign currency translation adjustment due to hyperinflation – – – – 67 – – 67 6 73Reclassification from revaluation reserves – – – – – – 17 17 – 17Total comprehensive income for the period, net of tax – – 1,716 71 585 61 3,742 6,176 211 6,387
Net income – – – – – – 3,834 3,834 Net unrealized gains/(losses) on available-for-sale investments – – 1,716 – – – – 1,716 Cash flow hedges – – – 71 – – – 71 Cumulative foreign currency translation adjustment – – – – 585 – – 585 Revaluation reserve – – – – – 61 – 61 Net actuarial gains/(losses) on pension plans – – – – – – (91) (91)
Net changes in capitalization of non-controlling interests – – – – – – – – (42) (42)Balance as of December 31, 2020 11 1,438 5,701 526 (8,698) 284 39,016 38,278 1,568 39,846
Balance as of December 31, 2020 as previously reported 11 1,438 5,701 526 (8,698) 284 39,016 38,278 1,568 39,846Issuance of share capital – – – – – – – – – –Dividends to shareholders – – – – – – (3,199) (3,199) (335) (3,534)Share-based payment transactions – 12 – – – – (54) (42) – (42)Treasury share transactions – – – – – – (146) (146) – (146)Change in ownership interests with no loss of control – – – – – – – – – –Cumulative foreign currency translation adjustment due to hyperinflation 1 – – – – 153 – (10) 143 12 155Reclassification from revaluation reserves – – – – – – 13 13 – 13Total comprehensive income for the period, net of tax – – (2,031) (114) (1,088) (19) 6,087 2,834 45 2,878
Net income – – – – – – 5,202 5,202 Net unrealized gains/(losses) on available-for-sale investments – – (2,031) – – – – (2,031) Cash flow hedges – – – (114) – – – (114) Cumulative foreign currency translation adjustment – – – – (1,088) – – (1,088) Revaluation reserve – – – – – (19) – (19) Net actuarial gains/(losses) on pension plans – – – – – – 885 885
Net changes in capitalization of non-controlling interests – – – – – – – – – –Balance as of December 31, 2021 11 1,449 3,670 411 (9,633) 265 41,707 37,881 1,289 39,170
1 Current year effect of IAS 29 ‘Financial Reporting in Hyperinflationary Economies’.
Zurich Insurance Group Annual Report 2021
Group overview
Integrated sustainability disclosure
Governance Risk review
Financial review
241
Consolidated financial statements (continued)
Zurich Insurance Group Ltd and its subsidiaries (collectively the Group) is a provider of insurance products and related services. The Group operates in Europe, Middle East & Africa (EMEA), North America, Latin America and Asia Pacific through subsidiaries, as well as branch and representative offices.
Zurich Insurance Group Ltd, a Swiss corporation, is the holding company of the Group and its shares are listed on the SIX Swiss Exchange. Zurich Insurance Group Ltd was incorporated on April 26, 2000, in Zurich, Switzerland. It is recorded in the Commercial Register of the Canton of Zurich under its registered address at Mythenquai 2, 8002 Zurich.
On February 9, 2022, the Board of Directors of Zurich Insurance Group Ltd authorized these consolidated financial statements for issue. These financial statements will be submitted for approval to the Annual General Meeting of Shareholders to be held on April 6, 2022.
1. Basis of presentation
General informationThe consolidated financial statements of the Group have been prepared in accordance with International Financial Reporting Standards (IFRS) and comply with Swiss law. Where IFRS does not contain clear guidance governing the accounting treatment of certain transactions, including those that are specific to insurance and reinsurance products, IFRS permits reference to another comprehensive body of accounting principles that uses a similar conceptual framework. The Group’s accounting policies for insurance and reinsurance contracts are therefore based on those developed by the Group before the adoption of IFRS 4 in areas where IFRS 4 did not include specific requirements. Before the adoption of IFRS 4 on January 1, 2005, the Group typically applied U.S. GAAP pronouncements issued by the Financial Accounting Standards Board (FASB) on insurance and reinsurance contracts. Any changes to such pronouncements subsequent to this adoption are not reflected in the Group’s accounting policies. In case of business combinations, the Group may decide to maintain the local statutory treatment if this does not distort the fair presentation of the financial position of the Group. If significant, the impact of such cases would be described elsewhere in the notes to these consolidated financial statements.
The accounting policies applied by the reportable segments are the same as those applied by the Group. The Group accounts for inter-segment revenues and transfers as if the transactions were with third parties at current market prices. Dividends, realized capital gains and losses as well as gains and losses on the transfer of net assets are eliminated within the segment, whereas all other intercompany gains and losses are eliminated at Group level. In the consolidated financial statements, intersegment revenues and transfers are eliminated.
Certain amounts recorded in the consolidated financial statements reflect estimates and assumptions made by management about insurance liability reserves, investment valuations, interest rates and other factors.
The COVID-19 pandemic continues to evolve globally with new variants of the virus emerging, and so do the impacts on the insurance industry and the global economy. Though most of the impacts of the pandemic on the Group’s businesses, especially in the P&C business, are already known and management’s best estimate of claims is reflected in the loss reserves and loss adjustment expenses, some uncertainties remain. The Group is closely monitoring and actively dealing with the potential for further exposure from (i) claims litigation on policy coverage, (ii) regulator and market-led test cases or legislative developments in certain jurisdictions that could impact the scope of intended coverage, (iii) potential second-order impact on health which could have mortality or morbidity effects, and (iv) other extended macroeconomic impacts around the pandemic, including governmental actions. While expected to be very remote, any extreme outcomes on the foregoing could have a material adverse impact on the Group’s business, financial condition, results of operations or growth. For additional information on insurance liabilities, please see note 8.
Investment valuations and interest rates incorporate market conditions as of December 31, 2021 and recoverability of intangible assets has been tested where the value of these intangible assets, including goodwill, is sensitive to prevailing economic conditions. For more information on investments and fair value, please see note 6 and 23, respectively. For more information on intangible assets, please see note 14. Management has also implemented amendments to IFRS 16 Leases which allow lessees not to account for rent concessions as lease modifications if they are a direct consequence of COVID-19 and meet certain conditions. The impact of the amendments to IFRS 16 Leases is immaterial to the Group.
Disclosures under IFRS 4 ‘Insurance Contracts’ and IFRS 7 ‘Financial Instruments: Disclosures’ relating to the nature and extent of risks, and capital disclosures under IAS 1 ‘Presentation of Financial Statements’ have been included in the audited sections of the risk review on pages 187 to 214, and they form an integral part of the consolidated financial statements.
Zurich Insurance Group Annual Report 2021
Group overview
Integrated sustainability disclosure
Governance Risk review
Financial review
242
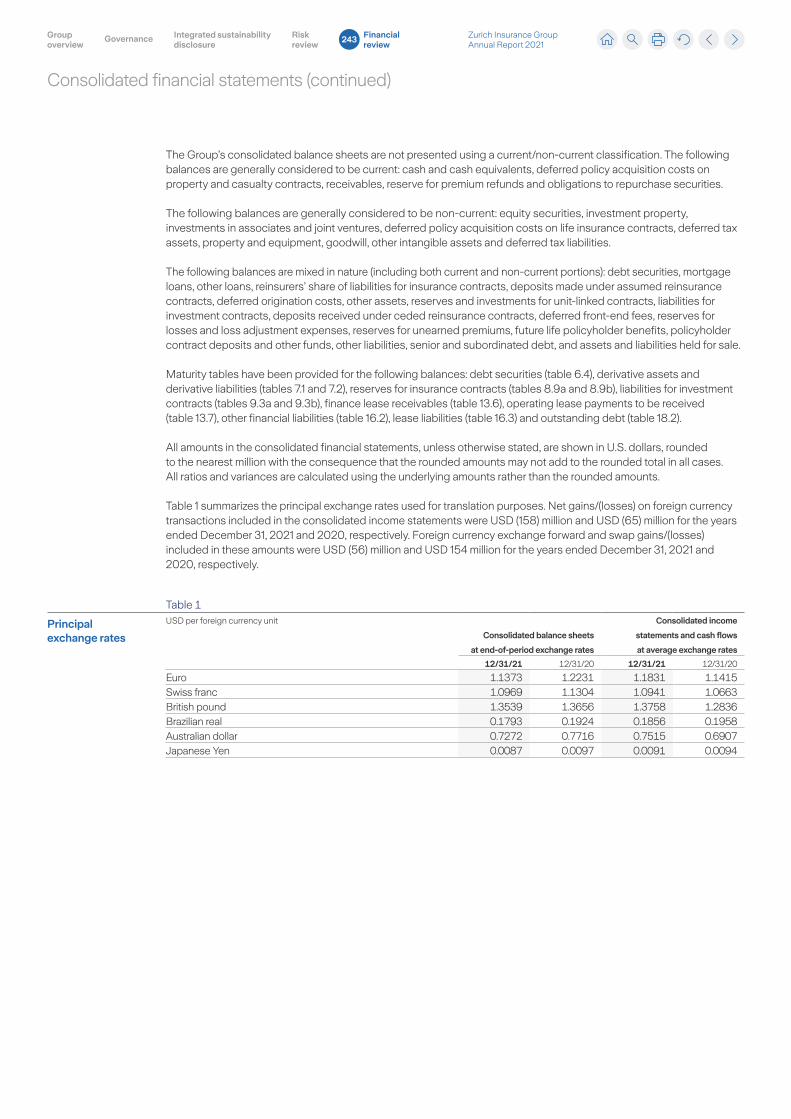
Consolidated financial statements (continued)
The Group’s consolidated balance sheets are not presented using a current/non-current classification. The following balances are generally considered to be current: cash and cash equivalents, deferred policy acquisition costs on property and casualty contracts, receivables, reserve for premium refunds and obligations to repurchase securities.
The following balances are generally considered to be non-current: equity securities, investment property, investments in associates and joint ventures, deferred policy acquisition costs on life insurance contracts, deferred tax assets, property and equipment, goodwill, other intangible assets and deferred tax liabilities.
The following balances are mixed in nature (including both current and non-current portions): debt securities, mortgage loans, other loans, reinsurers’ share of liabilities for insurance contracts, deposits made under assumed reinsurance contracts, deferred origination costs, other assets, reserves and investments for unit-linked contracts, liabilities for investment contracts, deposits received under ceded reinsurance contracts, deferred front-end fees, reserves for losses and loss adjustment expenses, reserves for unearned premiums, future life policyholder benefits, policyholder contract deposits and other funds, other liabilities, senior and subordinated debt, and assets and liabilities held for sale.
Maturity tables have been provided for the following balances: debt securities (table 6.4), derivative assets and derivative liabilities (tables 7.1 and 7.2), reserves for insurance contracts (tables 8.9a and 8.9b), liabilities for investment contracts (tables 9.3a and 9.3b), finance lease receivables (table 13.6), operating lease payments to be received (table 13.7), other financial liabilities (table 16.2), lease liabilities (table 16.3) and outstanding debt (table 18.2).
All amounts in the consolidated financial statements, unless otherwise stated, are shown in U.S. dollars, rounded to the nearest million with the consequence that the rounded amounts may not add to the rounded total in all cases. All ratios and variances are calculated using the underlying amounts rather than the rounded amounts.
Table 1 summarizes the principal exchange rates used for translation purposes. Net gains/(losses) on foreign currency transactions included in the consolidated income statements were USD (158) million and USD (65) million for the years ended December 31, 2021 and 2020, respectively. Foreign currency exchange forward and swap gains/(losses) included in these amounts were USD (56) million and USD 154 million for the years ended December 31, 2021 and 2020, respectively.
Table 1
Principal exchange rates
USD per foreign currency unit
Consolidated balance sheets
at end-of-period exchange rates
Consolidated income
statements and cash flows
at average exchange rates
12/31/21 12/31/20 12/31/21 12/31/20
Euro 1.1373 1.2231 1.1831 1.1415Swiss franc 1.0969 1.1304 1.0941 1.0663British pound 1.3539 1.3656 1.3758 1.2836Brazilian real 0.1793 0.1924 0.1856 0.1958Australian dollar 0.7272 0.7716 0.7515 0.6907Japanese Yen 0.0087 0.0097 0.0091 0.0094
Zurich Insurance Group Annual Report 2021
Group overview
Integrated sustainability disclosure
Governance Risk review
Financial review
243
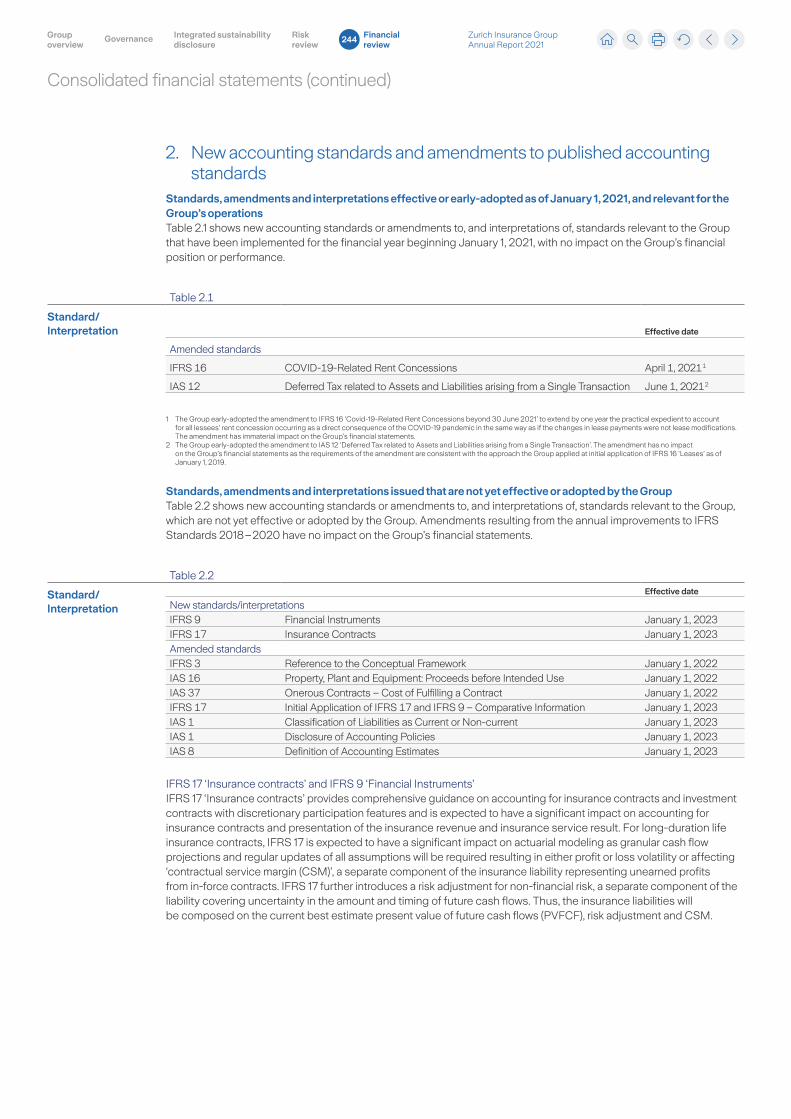
Consolidated financial statements (continued)
2. New accounting standards and amendments to published accounting standards
Standards, amendments and interpretations effective or early-adopted as of January 1, 2021, and relevant for the Group’s operationsTable 2.1 shows new accounting standards or amendments to, and interpretations of, standards relevant to the Group that have been implemented for the financial year beginning January 1, 2021, with no impact on the Group’s financial position or performance.
Table 2.1
Standard/ Interpretation Effective date
Amended standards
IFRS 16 COVID-19-Related Rent Concessions April 1, 2021 1
IAS 12 Deferred Tax related to Assets and Liabilities arising from a Single Transaction June 1, 2021 2
1 The Group early-adopted the amendment to IFRS 16 ‘Covid-19-Related Rent Concessions beyond 30 June 2021’ to extend by one year the practical expedient to account for all lessees’ rent concession occurring as a direct consequence of the COVID-19 pandemic in the same way as if the changes in lease payments were not lease modifications. The amendment has immaterial impact on the Group’s financial statements.
2 The Group early-adopted the amendment to IAS 12 ‘Deferred Tax related to Assets and Liabilities arising from a Single Transaction’. The amendment has no impact on the Group’s financial statements as the requirements of the amendment are consistent with the approach the Group applied at initial application of IFRS 16 ‘Leases’ as of January 1, 2019.
Standards, amendments and interpretations issued that are not yet effective or adopted by the GroupTable 2.2 shows new accounting standards or amendments to, and interpretations of, standards relevant to the Group, which are not yet effective or adopted by the Group. Amendments resulting from the annual improvements to IFRS Standards 2018 – 2020 have no impact on the Group’s financial statements.
Table 2.2
Standard/ Interpretation
Effective date
New standards/interpretationsIFRS 9 Financial Instruments January 1, 2023IFRS 17 Insurance Contracts January 1, 2023Amended standardsIFRS 3 Reference to the Conceptual Framework January 1, 2022IAS 16 Property, Plant and Equipment: Proceeds before Intended Use January 1, 2022IAS 37 Onerous Contracts – Cost of Fulfilling a Contract January 1, 2022IFRS 17 Initial Application of IFRS 17 and IFRS 9 – Comparative Information January 1, 2023IAS 1 Classification of Liabilities as Current or Non-current January 1, 2023IAS 1 Disclosure of Accounting Policies January 1, 2023IAS 8 Definition of Accounting Estimates January 1, 2023
IFRS 17 ‘Insurance contracts’ and IFRS 9 ‘Financial Instruments’IFRS 17 ‘Insurance contracts’ provides comprehensive guidance on accounting for insurance contracts and investment contracts with discretionary participation features and is expected to have a significant impact on accounting for insurance contracts and presentation of the insurance revenue and insurance service result. For long-duration life insurance contracts, IFRS 17 is expected to have a significant impact on actuarial modeling as granular cash flow projections and regular updates of all assumptions will be required resulting in either profit or loss volatility or affecting ‘contractual service margin (CSM)’, a separate component of the insurance liability representing unearned profits from in-force contracts. IFRS 17 further introduces a risk adjustment for non-financial risk, a separate component of the liability covering uncertainty in the amount and timing of future cash flows. Thus, the insurance liabilities will be composed on the current best estimate present value of future cash flows (PVFCF), risk adjustment and CSM.
Zurich Insurance Group Annual Report 2021
Group overview
Integrated sustainability disclosure
Governance Risk review
Financial review
244
Consolidated financial statements (continued)
IFRS 17 introduces different measurement approaches for the insurance contract liabilities reflecting a different extent of policyholder participation in investment or insurance entity performance: non-participating or indirect participating (general model) and direct participating (variable fee approach). For short-duration contracts, IFRS 17 foresees a simplified (or premium allocation) approach, which can be applied to contracts that have a coverage period of 12 months or less or for which such simplification would produce a measurement of the liability for remaining coverage that would not differ materially from the one obtained applying the general model. The simplification applies to the measurement of the liability for remaining coverage, which is not required to be disaggregated into PVFCF, risk adjustment and CSM but rather is largely based premium received, less earned premium and unamortized acquisition cash flows. The liability for incurred claims is measured consistently with the general model, whereby all the incurred claims are subject to discounting and risk adjustment.
IFRS 17 will also affect the presentation of the insurance contracts revenue, which will no longer include gross written premium or investment components. Further, the insurance revenue and insurance service expenses will be presented gross of reinsurance, with the reinsurance result included in the insurance service expense. Under IFRS 17, the insurance liabilities are subject to discounting; the unwind of the discount on insurance liabilities will be part of the investment result, rather than insurance service result.
IFRS 9 ‘Financial Instruments’ introduces a classification and measurement concept for financial assets that is based on the contractual cash flow characteristics and the holding intent. Under IFRS 9, all equity securities and fund investments, and some debt instruments will be measured at fair value through profit or loss because the characteristics of the contractual cash flows from such instruments are not solely payments of principal and interest on the principal amount outstanding. Though IFRS 9 introduces an option to account for some equity securities at fair value through other comprehensive income (OCI) with no recycling of gains or losses through profit or loss, the Group does not intend to make material use of this option. The debt instruments that are not measured at fair value through profit or loss will be measured at fair value with changes in fair value recorded in OCI, if held under the standard business model to collect contractual cash flows and for sale, or at amortized cost, if part of selected portfolios held to collect contractual cash flows. Furthermore, IFRS 9 introduces a requirement to recognize expected credit losses for financial assets carried at amortized cost or at fair value, with changes in fair value recognized in OCI.
Though overall profit or loss volatility is expected to increase under IFRS 9, the measurement approach for direct participating contracts in IFRS 17 allows such volatility to be largely absorbed in the measurement of insurance liabilities with an option to reflect in shareholders’ equity (OCI) the effect of any asset-liability mismatch. Therefore, the Group decided to defer the full implementation of IFRS 9 until IFRS 17 becomes effective to better align the measurement approaches for the financial assets held and the insurance liabilities where appropriate. Based on the analysis performed as of December 31, 2015, the Group was eligible to apply the temporary exemption from the adoption of IFRS 9 for reporting entities that have not previously applied any version of IFRS 9 and whose activities are predominantly related to insurance, as the predominance ratio reflecting the share of liabilities connected with insurance to total liabilities exceeded 90 percent. No reassessment of eligibility was required during subsequent annual periods up to and including 2021 as there was no significant change in the activities performed by the Group. We refer to the Annual Report 2016 for further details on the eligibility assessment. The Group presents additional disclosures of indicative effects from adoption of IFRS 9 required by IFRS 4 ‘Applying IFRS 9 with IFRS 4’ during the period of deferral (see note 24).
On December 9, 2021, the International Accounting Standards Board (IASB) published a narrow-scope amendment to the transition requirements of IFRS 17 and IFRS 9. The proposed amendment permits better alignment of presentation of comparative information under IFRS 17 and IFRS 9 by applying a ‘classification overlay’. The Group does not intend to restate the comparative period on initial application of IFRS 9 and therefore anticipates applying the classification overlay for selected asset portfolios backing direct participating insurance contracts which are accounted for at amortized cost under IAS 39 but are expected to be accounted for at fair value with changes in fair value recorded in OCI under IFRS 9. The Group does not envisage to apply the expected credit loss requirements as part of the overlay approach.
In order to adopt IFRS 17 and IFRS 9 in the consolidated financial statements, a joint IFRS 17 and IFRS 9 Group Implementation Program (Program) sponsored by the Group Chief Financial Officer has been operating since 2017. A steering committee comprised of senior management from various functions (finance, risk, IT, operations and investment management) oversees the work performed by individual work streams. A dedicated methodology work stream covers group accounting policies, actuarial methodologies and disclosure requirements to be consistently implemented throughout the Group. This work stream further contributes to the industry-wide discussions on standard interpretation and its operational effects and has been closely monitoring the developments in the IASB Transition Resource Group for IFRS 17 and IASB re-deliberations to evaluate the effects and align the accounting policies and actuarial methodologies accordingly. The implementation work stream drives the development of the target core solution landscape at Group and local levels and analyses processes, data and systems implications. In 2021, the focus of the program has shifted towards education of key stakeholders and analysis of wider impacts on Group operations while finalizing the implementation efforts and completing another set of parallel run activities.
Zurich Insurance Group Annual Report 2021
Group overview
Integrated sustainability disclosure
Governance Risk review
Financial review
245
Consolidated financial statements (continued)
The Group continues to assess the impact of the application of both IFRS 17 and IFRS 9. The Group expects that the majority of its non-life insurance contracts issued, and reinsurance contracts held in force as of transition date will be eligible for application of the simplified approach and intends to apply the simplified approach for such contracts under IFRS 17. As the Group already applies best estimate reserving under its current accounting policies, the implementation of IFRS 17 is not expected to have a major impact on non-life nominal reserves. The Group further expects that a significant portion of its life insurance liabilities (including unit-linked insurance liabilities) will qualify as direct participating contracts under IFRS 17. For the majority of its in-force insurance and reinsurance contracts, the Group intends to apply the option in IFRS 17 to disaggregate the (re-)insurance finance income or expense between profit or loss and OCI. Under this option, the unwind of discount in profit or loss under the general model and the simplified approach is based on locked-in discount rates and the difference between the current rates and locked-in rates valuation due to changes in discount rates is presented in OCI. Consistently, the Group expects that the majority of debt instruments held will be accounted for at fair value with changes in fair value recorded in OCI. As of December 31, 2021, it was not practicable to quantify what the potential impact would be on the Group’s financial position or performance once these standards are adopted.
Other standards, amendments and interpretations shown in table 2.2 are expected to have no, or an insignificant, impact on the Group’s financial position or performance.
Interest rate benchmark reform (including Phase 2 amendments to IAS 39, IFRS 7, IFRS 4 and IFRS 16) The ongoing market-wide reform targets replacement of some interbank offered rates (IBORs) with alternative reference rates (ARRs). To ensure an orderly transition to ARRs, the Group launched a cross functional IBOR transition working group that has analyzed the exposure and defined mitigating actions, for example, by adhering to the ISDA fallback protocols for derivatives, amending terms and conditions of new debt issuances and entering into bilateral negotiations with counterparties.
During 2021, further progress has been made with transitioning most of the Group’s exposures indexed to GBP, CHF and JPY to new ARRs. The decision to transition was made considering market readiness and liquidity. With the completion of the EURIBOR reform, no transition is required for financial instruments referencing those rates. Therefore, the exposures which are still subject to transition mainly consist of USD LIBOR linked instruments (such as floating rate notes, sinking bonds, asset- and mortgage-backed securities, collateralized loan obligations) representing 2.8 percent of the debt securities held by the Group. Given transition for these instruments is not foreseen before June 2023, the Group is not exposed to immediate risks arising from the IBOR reform. The reform has not resulted in changes to the Group risk management strategy.
The IASB addressed the financial reporting implications of the IBOR reform through IFRS amendments, which were fully adopted by the Group on January 1, 2020. Specifically, the phase 2 amendments introduce a practical expedient to account prospectively for a change in the basis for determining the contractual cash flows of a financial instrument attributable to the replacement of IBORs with ARR and relieves from specific hedge accounting requirements. Overall, the IBOR reform has no material effect on the Group’s financial statements and the effectiveness of Group’s hedging relationships.
Zurich Insurance Group Annual Report 2021
Group overview
Integrated sustainability disclosure
Governance Risk review
Financial review
246
Consolidated financial statements (continued)
3. Summary of significant accounting policies
Significant accounting policies applied in these consolidated financial statements are set out below. These policies have been consistently applied to all years presented unless otherwise stated. Other accounting policies are presented as part of the respective note disclosures.
a) Consolidation principlesThe Group’s consolidated financial statements include the assets, liabilities, equity, revenues, expenses and cash flows of Zurich Insurance Group Ltd and its subsidiaries. A subsidiary is an entity that Zurich Insurance Group Ltd either directly or indirectly controls. The results of subsidiaries acquired are included in the consolidated financial statements from the date of acquisition. The results of subsidiaries that have been divested during the year are included up to the date control ceased. All intra-Group balances, profits and transactions are eliminated.
Changes in ownership interests in a subsidiary that do not result in a change in control are recorded within equity.
Non-controlling interests are shown separately in equity, consolidated income statements, consolidated statements of comprehensive income and consolidated statements of changes in equity.
The consolidated financial statements are prepared as of December 31 based on individual company financial statements at the same date. In some cases, information is included with a time lag of up to three months. The resulting effect on the Group’s consolidated financial statements is not material.
b) Foreign currency translation and transactionsForeign currency translationDue to the Group’s economic exposure to the U.S. dollar (USD), the presentation currency of the Group’s consolidated financial statements is USD. Many Group companies have a different functional currency, being that of the respective primary economic environment in which these companies operate. Assets and liabilities are translated into the presentation currency at end-of-period exchange rates, while income statements and statements of cash flows are translated at average exchange rates for the period. The resulting foreign currency translation differences are recorded directly in other comprehensive income (OCI) as cumulative translation adjustment (CTA).
Foreign currency transactions and balancesForeign currency transactions are translated into the functional currency using the spot exchange rate at the date of the transaction or, for practical reasons, a weighted average rate, if exchange rates do not fluctuate significantly. Foreign currency monetary items and foreign currency non-monetary items that are carried at fair value are translated at end-of-period exchange rates. The resulting foreign currency translation differences are recorded in income, except for the following:
– Foreign currency translation differences that are recognized in OCI in conjunction with the recognition of unrealized gains or losses on available-for-sale investments; and
– Foreign currency translation differences arising on monetary items that form part of net investments in foreign operations, as well as foreign currency translation differences arising from monetary items that are designated as hedging instruments in a qualifying net investment hedge relationship, are included directly in OCI as CTA.
HyperinflationThe Group considers various factors to determine whether an economy in a country where a foreign operation is situated is hyperinflationary, including the cumulative three-year inflation rate. If an economy becomes hyperinflationary, the financial statements of foreign operations with the functional currency of the hyperinflationary economy are restated to reflect the current purchasing power at the end of the reporting period using the official consumer price indices commonly used in the respective country. The restatement includes all balance sheet amounts that are not expressed in terms of the measuring unit current at the balance sheet date and items of comprehensive income for the current year by applying the change in the price index from the dates when the items of income and expense were originally recorded. The restated financial statements of a foreign operation are translated into the Group’s presentation currency at closing rates. Any translation adjustment resulting from initial application of the hyperinflationary accounting is recognized directly in equity.
c) Insurance contracts and investment contracts with discretionary participating features (DPF)ClassificationContracts issued that transfer significant insurance risk to the Group and obligations arising from investment contracts with DPF are accounted for as insurance contracts.
Zurich Insurance Group Annual Report 2021
Group overview
Integrated sustainability disclosure
Governance Risk review
Financial review
247
Consolidated financial statements (continued)
The Group also issues products containing embedded options that entitle the policyholder to switch all or part of the current and future invested funds into another product issued by the Group. Where this results in the reclassification of an investment product to a product that meets the definition of an insurance contract, the previously held reserve and the related deferred origination costs are reclassified and are accounted for in accordance with the accounting policy that is to be applied to the new product on a prospective basis. As a consequence, no gain or loss is recognized when a contract is reclassified from an investment to an insurance contract.
Once a contract has been classified as an insurance contract, no reclassification can subsequently be made.
PremiumsProperty & CasualtyPremiums from the sale of property & casualty products are generally recorded when written and are recognized as revenue in relation to the insurance coverage provided. The unearned premium reserve represents the portion of the premiums written related to the unexpired coverage period.
Life insurancePremiums from traditional life insurance contracts, including participating contracts and annuity policies with life contingencies, are recognized as revenue when they are due from the policyholder. For single premium and limited pay contracts, premiums are recognized as revenue when due, with any excess profit deferred and recognized in income in a constant relationship to the insurance in-force or, for annuities, the amount of expected benefit payments.
Amounts collected as premiums from investment-type insurance contracts such as universal life, unit-linked and unitized with-profits contracts are generally reported as deposits. Revenue from these contracts consists of policy fees for the cost of insurance, administration and surrenders during the period. Front-end fees charged to the customer at inception, particularly for single premium contracts, are deferred and recognized over the estimated life of the contracts following the same pattern that is applied to deferred acquisition costs and addressed below. Regular fees charged to the customer periodically (monthly, quarterly or annually) either directly or by making a deduction from invested funds are billed in advance and recognized on a straight-line basis over the period in which the service is rendered. Fees charged at the end of the period are accrued over the service period as a receivable and are offset against the financial liability when charged to the customer.
Cash flows from certain universal life-type contracts in the Group’s Spanish operations are recognized as gross written premiums and insurance benefits and losses and not as deposits.
Reserves for losses and loss adjustment expensesLosses and loss adjustment expenses are charged to income as incurred. Reserves for losses and loss adjustment expenses represent estimates of future payments of reported and unreported claims for losses and related expenses, with respect to insured events that have occurred. Any changes in estimates are reflected in the results of operations in the period in which estimates are changed. The Group does not discount its loss reserves, other than for claims with payment patterns which are fixed and reasonably determinable, and claims in economies determined to be hyperinflationary where inflation constitutes a significant input in the reserving process.
Reserves for life benefitsFuture life policyholder benefits represent the estimated future benefit liability for traditional life insurance policies and include the value of accumulated declared bonuses or dividends that have vested to policyholders.
The reserves for life benefits for participating traditional life insurance policies are calculated using a net level premium valuation method based on actuarial assumptions taking into account guaranteed mortality benefits and interest rates.
The reserves for life benefits for other traditional life insurance policies are calculated using a net level premium valuation method based on actuarial assumptions including mortality, persistency, expenses and investment return, plus a margin for adverse deviations. These assumptions are locked in at inception and are regularly assessed as part of the liability adequacy testing over the period of the contract.
Policyholder contract deposits represent the estimated policy benefits for investment-type insurance contracts invested in non-unit-linked funds. This liability comprises the accumulation of premiums received, less charges, plus declared policyholder dividends.
Some insurance contracts and investment contracts with DPF offered by the Group contain benefit features for which the amount and timing of declaration and payment are at the discretion of the Group. Where that discretion has not been exercised, the total amount expected to be allocated to policyholders as required by local insurance regulation or contractual provisions is included in the policyholder other funds.
Zurich Insurance Group Annual Report 2021
Group overview
Integrated sustainability disclosure
Governance Risk review
Financial review
248
Consolidated financial statements (continued)
Unrealized gains or losses arising on the revaluation of available-for-sale assets are recorded directly in OCI in accordance with the Group’s accounting policy for such assets. Where these assets are related to life insurance, corresponding adjustments to the reserves for life benefits and related assets are also recognized directly in OCI.
Reserves for unit-linked contracts are based on the fair value of the financial instruments backing those contracts less any fees and assessments charged to the policyholders. The related assets for unit-linked insurance contracts are designated at fair value through profit or loss in order to reduce measurement inconsistencies.
For products containing guarantees in respect of minimum death benefits (GMDB), retirement income benefits (GRIB) and/or annuitization options (GAO), additional liabilities are recorded in proportion to the receipt of the contracted revenues which are subject to a liability adequacy test taking into account policyholder behavior and current market conditions.
For products managed on a dynamic basis using derivative hedging strategies, an option in IFRS 4 is used to measure insurance liabilities using current financial and non-financial assumptions to better reflect the way that these products are managed. Financial assets related to these liabilities are designated at fair value through profit or loss.
Deferred acquisition costs (DAC)Costs that vary with and are directly related to the acquisition of new and renewal business, including for example commissions and certain underwriting and policy issue expenses, are deferred and subsequently amortized over a defined period. Such costs are presented on balance sheet net of commissions paid to reinsurers in respect of business ceded.
Property & CasualtyDAC for property & casualty contracts is amortized over the period in which the related premiums are earned.
Life insuranceDAC for traditional participating life insurance contracts is amortized based on estimated gross margins expected to be realized over the life of the contract. Estimated gross margins are updated for actual and anticipated future experience and discounted using the latest revised interest rate for the remaining benefit period. Resulting deviations are reflected in income.
DAC for other traditional life insurance and annuity contracts is amortized over the life of the contracts, based on expected premiums. Expected premiums are estimated at the date of policy issue for application throughout the life of the contract unless a premium deficiency subsequently occurs.
DAC for investment-type insurance contracts such as universal life, unit-linked and unitized with-profits contracts is amortized based on estimated gross profits expected to be realized over the life of the contract. Estimated gross profits are updated for actual and anticipated future experience and discounted using either the interest rate in effect at the inception of the contracts or the latest revised interest rate for the remaining benefit period, depending on whether crediting is based on the policyholder’s or on the reporting entity’s investment performance. Resulting deviations are reflected in income.
Unamortized DAC for life insurance contracts accrues interest at a rate consistent with the related assumptions for reserves.
For traditional participating and investment-type life insurance contracts, DAC is adjusted for the impact of unrealized gains/(losses) on allocated investments that are recorded in OCI.
Liability adequacy testsLiability adequacy tests are performed annually for groupings of contracts determined in accordance with the Group’s manner of acquiring, servicing and measuring the profitability of its insurance contracts.
Property & CasualtyFor property & casualty contracts, unearned premiums are tested to determine whether they are sufficient to cover related expected losses, loss adjustment expenses, policyholder dividends, unamortized DAC and maintenance expenses, using current assumptions and considering anticipated investment returns. If a premium deficiency is identified, the DAC asset for the respective grouping of contracts is written down by the amount of the deficiency. If, after writing down the DAC asset to nil, a premium deficiency still exists for the respective grouping of contracts, then an additional reserve is established for the amount of the remaining deficiency.
Zurich Insurance Group Annual Report 2021
Group overview
Integrated sustainability disclosure
Governance Risk review
Financial review
249
Consolidated financial statements (continued)
Life insuranceFor life insurance contracts, the carrying amount of the existing reserve for life benefits, including any deferred front-end fees, reduced by the unamortized balance of DAC or present value of future profits of acquired insurance contracts (PVFP), is compared with the reserve for life benefits, calculated using revised assumptions for actual and anticipated experience as of the valuation date. If a deficiency is identified, the DAC or PVFP for the respective grouping of contracts is written down by the amount of the deficiency. If, after writing down the DAC or PVFP to nil, a deficiency still exists for the respective grouping of contracts, the reserve for life benefits is increased by the amount of the remaining deficiency.
ReinsuranceThe Group’s insurance subsidiaries cede risk in the normal course of business to limit the potential for losses arising from certain exposures. Reinsurance does not relieve the originating insurer of its liability. Certain Group insurance companies assume reinsurance business as part of their normal business.
Reinsurance contracts that do not transfer significant insurance risk are accounted for using the deposit method.
A deposit asset or liability is recognized based on the premium paid, or received less any explicitly identified premiums or fees to be retained by the ceding company. Interest on deposits is accounted for using the effective interest rate method. Future cash flows are estimated to calculate the effective yield, and revenues and expenses are recorded as interest income or expense. Reinsurance deposit assets or liabilities also include funds deposited or held by the Group under assumed or ceded reinsurance contracts, respectively, when funds are retained by the reinsured under the terms of the contract.
Reinsurance is recorded gross in the consolidated balance sheet. Reinsurance assets include balances expected to be recovered from reinsurance companies for ceded paid and unpaid losses and loss adjustment expenses, ceded unearned premiums and ceded future life policy benefits. Amounts recoverable from reinsurers are estimated in a manner consistent with the assumptions used for the liabilities associated with the underlying insurance contracts.
Reinsurance assets are assessed for impairment on a regular basis and impairment losses, if any, are recorded in the same manner as for loans and receivables.
d) Liabilities for investment contracts (without DPF)Investment contracts are those contracts that do not transfer significant insurance risk. The Group issues investment contracts without fixed terms (unit-linked) and investment contracts with fixed and guaranteed terms (fixed interest rate).
Unit-linked investment contractsThese represent portfolios maintained to meet the specific investment objectives of policyholders who bear the credit, market and liquidity risks related to the investments. The liabilities are carried at fair value, which is determined by reference to the underlying financial assets. Changes in fair value are recorded in income. The related assets for unit-linked investment contracts are designated at fair value through profit or loss in order to reduce measurement inconsistencies.
The services provided by the Group under such contracts are investment management and policy administration services that are provided over time and are not contingent on meeting specified performance criteria. Fees from such services are recognized ratably over the service period as policy fee revenue except where such fees are charged in connection with contract origination in which case such fees are recognized as contract liabilities (included within deferred front-end fees). The costs to fulfill the services over time are generally recognized as incurred, except the costs of acquiring new investment contracts with investment management services, such as commissions and other incremental expenses directly related to the issuance of each new contract. Such fees enhance the resources that will be used to satisfy future performance obligations and – to the extent recoverable – are capitalized as contract assets (deferred origination costs; DOC) and amortized in line with the revenue generated by providing investment management services. See note 11 for further information.
Investment contracts at amortized costLiabilities for investment contracts with fixed and guaranteed terms are measured at amortized cost using the effective interest rate method. Transaction costs are included in the calculation of the effective yield. As of each reporting date, the Group re-estimates the expected future cash flows and re-calculates the carrying amount of the financial liability by computing the present value of estimated future cash flows using the original effective interest rate for the financial liability. Any adjustment is immediately recognized in income.
Zurich Insurance Group Annual Report 2021
Group overview
Integrated sustainability disclosure
Governance Risk review
Financial review
250
Consolidated financial statements (continued)
e) Group investments excluding derivative financial instrumentsGroup investments are accounted for at either (a) fair value through OCI; (b) fair value through profit or loss; or (c) amortized cost. The Group continues to apply the requirements in IAS 39 ‘Financial Instruments: Recognition and Measurement’ until implementation of IFRS 9 ‘Financial Instruments’ on January 1, 2023 (see note 2).
The majority of Group investments are accounted for at fair value through OCI (available-for-sale financial assets) and include debt and equity securities as well as fund investments. Such assets are carried at fair value, with changes in fair value recognized in OCI, until the securities are either sold or impaired. Interest income determined using the effective interest method and dividend income from financial assets at fair value through OCI is included in net investment income. The cumulative unrealized gains or losses recorded in OCI are net of cumulative deferred income taxes, certain related life policyholder liabilities and deferred acquisition costs. When available-for-sale financial assets are sold, impaired or otherwise disposed of, the cumulative gains or losses are reclassified from OCI to income as net capital gains/(losses) on investments and impairments.
Group investments at fair value through profit or loss include debt and equity securities backing certain life insurance contracts with participation features, and financial assets evaluated on a fair value basis. The designation of these assets at fair value through profit or loss eliminates or significantly reduces a measurement inconsistency that would otherwise arise from measuring assets or recognizing the gains and losses on these assets on a different basis to the liabilities.
Group investments at amortized cost include debt securities for which the Group has the positive intention and ability to hold to maturity (held-to-maturity financial assets) as well as mortgage and other loans (loans and receivables). Such investments are carried at amortized cost using the effective interest rate method, less any charges for impairment. When an impairment is determined to have occurred, the carrying amount of held-to-maturity investments and loans and receivables is reduced through the use of an allowance account, and the movement in the impairment allowance is recognized in income as an impairment loss.
The Group recognizes regular purchases and sales of financial assets on the trade date, which is the date on which the Group commits to purchase or sell the asset.
Realized and unrealized gains and losses arising from changes in the fair value are recognized in income, within net capital gains/(losses) on investments and impairments, in the period in which they arise. Interest income determined using the effective interest method and dividend income from financial assets at fair value through profit or loss is included in net investment income.
Group investments include investment property accounted for at fair value through profit or loss. Rental income from investment property is recognized on a straight-line basis over the lease term and included in net investment income along with rental operating expenses for investment property recognized on an accrual basis.
Group investments include the following in cash and cash equivalents: cash on hand, deposits held at call with banks, cash collateral received, and other highly liquid investments with maturities of three months or less from the date of acquisition that are readily convertible into cash and are subject to an insignificant risk of change in fair value. Cash and cash equivalents are stated at current redemption value.
Impairment of financial assetsThe Group assesses at each reporting date whether there is objective evidence that loss events have occurred that negatively affect the estimated future cash flows of a financial asset or a group of financial assets. The evaluation of whether a financial asset is impaired requires significant judgment (see note 4).
f) Derivative financial instruments and hedge accountingDerivative financial instruments, except those designated under a qualifying cash flow or net investment hedge relationship, are carried at fair value on the balance sheet with changes in fair value recognized in income.
Derivative financial instruments that qualify for hedge accountingDerivative financial instruments are used by the Group to economically hedge risks. In limited circumstances derivative financial instruments are designated as hedging instruments for accounting purposes in:
– Fair value hedges, which are hedges of the exposure to changes in the fair value of a recognized asset or liability.
– Cash flow hedges, which are hedges of the exposure to variability in cash flows attributable to a particular risk either associated with a recognized asset or liability, or a highly probable forecast transaction that could affect profit or loss.
– Net investment hedges, which are hedges of a net investment in a foreign operation.
Zurich Insurance Group Annual Report 2021
Group overview
Integrated sustainability disclosure
Governance Risk review
Financial review
251
Consolidated financial statements (continued)
All hedge relationships are formally documented, including the risk management objectives and strategy for undertaking the hedge. At inception of a hedge and on an ongoing basis, the hedge relationship is formally assessed to determine whether the hedging instruments are expected to be (prospective assessment) and have been (retrospective assessment) highly effective in offsetting changes in fair values or cash flows of hedged items attributable to the hedged risk. If the qualifying criteria for the application of hedge accounting are no longer met, the hedge relationship is discontinued prospectively, in which case the hedging instrument and the hedged item are then subsequently reported independently in accordance with the respective accounting policy.
The accounting treatment of a qualifying hedge relationship is further described in note 7.
g) Attorney-in-fact (AIF) contractsThe AIF contracts reflect the ability of the Group to generate future revenues through Farmers Group Inc. (FGI) based on the FGI’s relationship with the Farmers Exchanges. The Farmers Exchanges are not owned by FGI, a wholly owned subsidiary of the Group. In determining that these relationships have an indefinite useful life, the Group took into consideration the organizational structure of inter-insurance exchanges, under which subscribers exchange contracts with each other and appoint an attorney-in-fact to provide non-claims services, and the historical AIF relationship between FGI and the Farmers Exchanges. The value of the AIF contracts is tested for impairment at least annually.
The services provided by FGI under such contracts are non-claims services including risk selection, preparation and mailing of policy documents and invoices, premium collection, management of the investment portfolios and certain other administrative functions. The multiple performance obligations covered by the consideration received are considered to be a series with the same pattern of transfer, therefore, the performance obligations are not separated. The revenue for the services provided includes Farmers management fee, membership fees and revenues for ancillary services. Farmers management fees are determined as a percentage of gross premiums earned by the Farmers Exchanges and recognized ratably over the period the services are provided. Membership fees are one-time fees charged at the time of the policy issuance that do not cover a distinct performance obligation. Such fees are recognized as revenue over the expected life of the customer relationship. The incremental costs incurred in connection with the customer setup activity are recognized as an asset and subsequently amortized using the same pattern as the related revenue. The revenue for ancillary services includes remuneration for services provided that are not covered by Farmers management fees where FGI acts as a principal. Typically, these services are provided over time, so that the revenue is also recognized over time. See note 26 for further information.
h) GoodwillGoodwill on the acquisition of subsidiaries is capitalized and tested for impairment annually, or more frequently if there are indications of impairment. For the purpose of impairment testing, goodwill is allocated to cash-generating units (CGUs) based on the level at which management monitors operations and makes decisions related to the continuation or disposal of assets and operations. If goodwill has been allocated to a CGU and an operation within that unit is disposed of, the carrying amount of the operation includes attributable goodwill when determining the gain or loss on disposal.
i) Other intangible assetsOther intangible assets typically have finite lives and are carried at cost, less accumulated amortization and impairments. Such assets are generally amortized using the straight-line method over their useful lives and reviewed for impairment at least annually, or whenever events or changes in circumstances indicate that the carrying amount may not be recoverable.
Present value of future profits from acquired insurance contracts (PVFP)An intangible asset representing the PVFP arises from the acquisition of life insurance businesses. Such an asset is amortized over the expected life of the acquired contracts, following the same principles as for DAC. The carrying value of the PVFP asset is tested periodically for impairment as part of the liability adequacy test for insurance contracts.
Distribution agreements Distribution agreements may have useful lives extending up to 30 years, estimated based on the period of time over which they are expected to provide economic benefits, but for no longer than the contractual term, after taking into account all economic and legal factors such as stability of the industry, competitive position and the period of control over the assets.
Zurich Insurance Group Annual Report 2021
Group overview
Integrated sustainability disclosure
Governance Risk review
Financial review
252
Consolidated financial statements (continued)
SoftwareCosts associated with research and maintenance of internally-developed computer software are expensed as incurred. Costs incurred during the development phase are capitalized. Software under development is tested for impairment annually.
Acquired computer software licenses are capitalized on the basis of the costs incurred to acquire and bring the specific software into use.
The useful lives of computer software licenses and capitalized internal software development costs generally range from three to five years. In limited circumstances, capitalized software development costs may be amortized over a period of up to 10 years, taking into account the effects of obsolescence, technology, competition and other economic and legal factors.
j) Employee benefitsShare-based compensation and cash incentive plansThe Group operates long-term incentive plans that are accounted for as equity-settled share-based compensation plans. The fair value of these incentive plans is determined at the grant date and is recognized as an expense in income over the vesting period, with a corresponding increase recorded in additional paid-in capital.
Subsequently, depending on the underlying performance metrics, the Group revises its estimates of the number of shares that are expected to be issued and recognizes the impact of the revision, if any, in income with a corresponding adjustment to additional paid-in capital. However, no subsequent adjustment is made after the vesting date.
Retirement benefitsThe Group operates various post-employment benefit plans for its employees worldwide, which include defined benefit and defined contribution pension plans, and other post-employment benefits, such as medical care and life insurance.
Contributions to defined contribution plans are recorded as an expense in the period in which the economic benefit from the employees’ service was received.
Defined benefit plan obligations and current service costs are determined annually by qualified actuaries using the projected unit credit method. The defined benefit liability represents the present value of defined benefit obligation at the end of the reporting period less the fair value of plan assets with changes from remeasurements recorded in OCI. If the fair value of the plan assets is higher than the present value of the defined benefit obligation, the recognition of the resulting net asset is limited to the present value of any economic benefits available in the form of refunds from the plan or reductions in future contributions to the plan.
Group’s expense related to these plans is accrued over the employees’ service periods based on the actuarially determined cost for the period. Net interest and service costs are determined using the spot rate approach. Actuarial gains and losses are recognized, in full in the period in which they occur, in OCI. Past service costs, which result from plan amendments and curtailments, are recognized in income when the plan amendment or curtailment occurs (which is the date from which the plan change is irrevocable) and the date on which a constructive obligation arises. Settlement gains or losses are recognized in income when the settlement occurs.
Other post-employment benefitsOther post-employment benefits, such as medical care and life insurance, are also provided for certain employees and are primarily funded internally. Similar to defined benefit plans, the cost of such benefits is accrued over the service period of the employees based on the actuarially determined cost for the period.
Zurich Insurance Group Annual Report 2021
Group overview
Integrated sustainability disclosure
Governance Risk review
Financial review
253
Consolidated financial statements (continued)
k) LeasesThe Group is typically acting as a lessee in property and car or equipment leases. Further, the Group is acting as a lessor in leases of investment property.
When acting as a lessee, under IFRS 16, the Group recognizes a right-of-use asset and a corresponding lease liability at the lease commencement date when the leased asset is available for use by the Group. The lease liability is measured at the present value of the lease payments due over the lease term, discounted using the Group’s incremental borrowing rate. Any options to extend or terminate a lease that the Group is reasonably certain to exercise are included in the lease term. The right-of-use asset is initially recognized at an amount equal to the lease liability adjusted for lease prepayments made or lease incentives received, initial direct costs and any estimated costs to dismantle or restore the leased asset.
The right-of-use asset is depreciated over the shorter of the leased asset’s useful life or the lease term on a straight-line basis. The right-of-use asset is included in ‘Property and equipment’ and disclosed separately in note 13. The carrying amount of the lease liability is increased to reflect the unwinding of the discount so as to produce a constant periodic rate of interest on the remaining balance of the liability for each period and is reduced by the lease payments made during the period. Lease payments include fixed payments and variable payments that depend on a non-leveraged index or a rate. Lease liabilities are included within ‘Other Liabilities.’
The Group records short-term leases and leases of low-value assets as an expense on a straight-line basis over the lease term. Short-term leases are leases with a lease term of 12 months or less. Low-value assets are comprised of hardware and smaller office equipment. The lease expense is included in ‘Administrative and other operating expense.’
When acting as a lessor of investment property in an operating lease, the Group follows the accounting policy in paragraph e).
Zurich Insurance Group Annual Report 2021
Group overview
Integrated sustainability disclosure
Governance Risk review
Financial review
254
Consolidated financial statements (continued)
4. Critical accounting judgments and estimates
The application of certain accounting policies requires critical accounting estimates that involve discretionary judgments and the use of assumptions which are susceptible to change due to inherent uncertainties. Because of the uncertainties involved, actual results could differ significantly from the assumptions and estimates made by management. Such critical accounting estimates are of significance to insurance reserves and deferred acquisition costs, the determination of fair value for financial assets and liabilities, impairment charges, deferred taxes and employee benefits.
a) Reserves for insurance contracts and deferred acquisition costsProperty & CasualtyThe Group is required to establish reserves for payment of losses and loss adjustment expenses that arise from the Group’s property & casualty products. These reserves represent the expected ultimate cost to settle claims occurring prior to, but still outstanding as of, the balance sheet date. The Group establishes its reserves by product line, type and extent of coverage and year of occurrence. There are two categories of loss reserve: reserves for reported losses and reserves for incurred but not reported (IBNR) losses. Additionally, reserves are held for loss adjustment expenses, which contain the estimated legal and other expenses expected to be incurred to finalize the settlement of the losses.
The Group’s reserves for reported losses and loss adjustment expenses are based on estimates of future payments to settle reported claims. The Group bases such estimates on the facts available at the time the reserves are established. These reserves are generally established on an undiscounted basis to recognize the estimated costs of bringing pending claims to final settlement. The reserve calculation takes into account inflation, as well as other factors that can influence the amount of reserves required, some of which are subjective and some of which are dependent on future events. In determining the level of reserves, the Group considers historical trends and patterns of loss payments, pending levels of unpaid claims and types of coverage. In addition, court decisions, economic conditions and public attitudes may affect the ultimate cost of settlement and, as a result, the Group’s estimation of reserves. Between the reporting and final settlement of a claim circumstances may change, which may result in changes to established reserves. Items such as changes in law and interpretations of relevant case law, results of litigation, changes in medical costs, as well as costs of vehicle and home repair materials and labor rates can substantially impact ultimate settlement costs. Accordingly, the Group reviews and re-evaluates claims and reserves on a regular basis. Amounts ultimately paid for losses and loss adjustment expenses can vary significantly from the level of reserves originally set.
The Group establishes IBNR reserves, to recognize the estimated cost of losses for events which have already occurred but which have not yet been notified. These reserves are established to recognize the estimated costs required to bring such claims to final settlement. As these losses have not yet been reported, the Group relies upon historical information and statistical models, based on product line, type and extent of coverage, to estimate its IBNR liability. The Group also uses reported claim trends, claim severities, exposure growth, and other factors in estimating its IBNR reserves. These reserves are revised as additional information becomes available and as claims are actually reported.
The time required to learn of and settle claims is an important consideration in establishing the Group’s reserves. Short-tail claims, such as those for motor and property damage, are normally reported soon after the incident and are generally settled within months. Long-tail claims, such as bodily injury, pollution, asbestos and product liability, can take years to develop and additional time to settle. For these claims, information concerning the event, such as the required medical treatment for bodily injury claims and the required measures to clean up pollution, may not be readily available. Accordingly, the reserving analysis of long-tail lines of business is generally more difficult and subject to greater uncertainties than for short-tail claims.
Since the Group does not establish reserves for catastrophes in advance of the occurrence of such events, these events may cause volatility in the levels of its incurred losses and reserves subject to the effects of reinsurance recoveries. This volatility may also be contingent upon political and legal developments after the occurrence of the event.
The Group uses a number of accepted actuarial methods to estimate and evaluate the amount of reserves recorded. The nature of the claim being reserved for and the geographic location of the claim influence the techniques used by the Group’s actuaries. Additionally, the Group’s Corporate Center actuaries perform periodic reserve reviews of the Group’s businesses throughout the world. Management considers the results of these reviews and adjusts its reserves for losses and loss adjustment expenses, where necessary.
Zurich Insurance Group Annual Report 2021
Group overview
Integrated sustainability disclosure
Governance Risk review
Financial review
255
Consolidated financial statements (continued)
Life insuranceThe reserves for future life policyholder benefits and policyholder contract deposits and other funds contain a number of assumptions regarding mortality or longevity, lapses, surrenders, expenses, discount rates and investment returns. These assumptions can vary by country, year of policy issuance and product type and are determined with reference to past experience adjusted for new trends, current market conditions and future expectations. As such the liabilities for future life policyholder benefits and policyholder contract deposits may not represent the ultimate amounts paid out to policyholders. For example:
– The estimated number of deaths determines the value of the benefit payments. The main source of uncertainty arises because of the potential for pandemics and wide-ranging lifestyle changes, such as changes in eating, smoking and exercise habits, which could result in earlier deaths for age groups in which the Group has significant exposure to mortality risk.
– For contracts that insure the risk of longevity, such as annuity contracts, an appropriate allowance is made for people living longer. Continuing improvements in medical care and social conditions could result in further improvements in longevity in excess of those allowed for in the estimates used to determine the liability for contracts where the Group is exposed to longevity risk.
– Under certain contracts, the Group has offered product guarantees (or options to take up product guarantees), including fixed minimum interest rate or mortality rate returns. In determining the value of these options and/or benefits, estimates have been made as to the percentage of contract holders that may exercise them. Changes in investment conditions could result in significantly more contract holders exercising their options and/or benefits than has been assumed.
– Estimates are made as to future investment income arising from the assets backing long-term insurance contracts. These estimates are based on current market returns as well as expectations about future economic and financial developments.
– Assumptions are determined with reference to current and historical customer data, as well as industry data. Interest rate assumptions reflect expected earnings on the assets supporting the future policyholder benefits. The information used by the Group’s qualified actuaries in setting such assumptions includes, but is not limited to, pricing assumptions, available experience studies and profitability analysis.
Deferred policy acquisition costs and the present value of future profits (PVFP) are recognized on balance sheet only to the extent that they are recoverable from future policy income which also depends on the above assumptions. Recoverability is tested at contract inception and subsequently on a regular basis with reference to current expectations of future profits or margins.
See note 8 for further information on liabilities for insurance contracts and note 11 for deferred policy acquisition costs. Also refer to the insurance risk section of the risk review.
b) Fair value measurementIn determining the fair values of investments in debt and equity instruments traded on exchanges and in over-the-counter (OTC) markets, the Group makes extensive use of independent, reliable and reputable third-party pricing providers and only in rare cases places reliance on valuations that are derived from internal models.
In addition, the Group’s policy is to ensure that independently-sourced prices are developed by making maximum use of current observable market inputs derived from orderly transactions and by employing widely-accepted valuation techniques and models. When third-party pricing providers are unable to obtain adequate observable information for a particular financial instrument, the fair value is determined either by requesting selective non-binding broker quotes or by using internal valuation models.
Valuations can be subject to significant judgment, especially when the fair value is determined based on at least one significant unobservable input parameter; such items are classified within level 3 of the fair value hierarchy. See notes 6, 7 and 23 for further information regarding the estimate of fair value.
Zurich Insurance Group Annual Report 2021
Group overview
Integrated sustainability disclosure
Governance Risk review
Financial review
256
Consolidated financial statements (continued)
c) Impairment of assets Financial assets A financial asset is considered impaired if there is objective evidence of impairment as a result of one or more occurred loss events that have an impact on the estimated future cash flows of the financial asset.
The evaluation of whether an available-for-sale debt security is impaired requires analysis of the credit standing of a particular issuer and involves management judgment. When assessing impairment of available-for-sale debt securities, the Group places emphasis on issuer specific factors, such as significant financial difficulty, default or delinquency on interest or principal payments. A credit rating downgrade, worsened liquidity or decline in fair value below the weighted-average cost is not by itself considered a loss event, but rather incorporated in the impairment analysis along with other available information.
The Group determines that there is objective evidence of impairment of an available-for-sale equity security, if at the reporting date:
– its fair value is below the weighted-average cost by an amount significantly exceeding the volatility threshold determined quarterly for the respective equity market (such as North America, Asia Pacific, UK, Switzerland and other European countries); or
– its fair value has been below the weighted-average cost for a prolonged period of 24 consecutive months or longer.
Goodwill and attorney-in-fact (AIF) contracts Goodwill is allocated to a cash generating unit (CGU) as outlined in note 3. The Group has defined the CGUs according to regions, separating Property & Casualty (P&C), Life businesses and other (see note 27). The CGUs which carry the majority of goodwill and AIF contracts are presented in table 4.
For goodwill impairment testing, the Group estimates the recoverable amount based on the value-in-use of the CGU.
Value-in-use is determined using the present value of estimated future cash flows expected to be generated from the CGU. Cash flow projections are based on business plan projections, which are approved by management, typically covering a three-year period or, if appropriate and adequately justified, a longer period, which may be necessary to more accurately represent the nature of the cash flows used to test the goodwill. Cash flows beyond this period are extrapolated using, among others, estimated perpetual growth rates, which typically do not exceed the expected inflation of the geographical areas in which the cash flows supporting the goodwill are generated. If cash flows are generated in different geographical areas with different expected inflation rates, weighted averages are used. The discount rates applied reflect the respective risk-free interest rate adjusted for the relevant risk factors to the extent they have not already been considered in the underlying cash flows.
The discount rates used in the recoverable amount calculations for developed markets are based on the weighted average cost of capital and consider government bond rates which are further adjusted for equity risk premium, appropriate beta and leverage ratio. In emerging markets, discount rates are based on the U.S. dollar discount rate taking into account inflation differential expectations and country risks. All input factors to the discount rates are based on observable market data.
Table 4 sets out for the major CGUs the applied discount rates and the perpetual nominal growth rates beyond the projection period that depend on expectations about country-specific growth rates and inflation as of the date of valuation, as well as the value of goodwill and AIF contracts as of December 31, 2021.
Table 4
Discount and perpetual growth rates for goodwill and AIF contracts for major CGUs Business
in USD
millions
Discount
rates in %
2021
Discount
rates in %
2020
Perpetual
nominal
growth
rate in %
2021
Perpetual
nominal
growth
rate in %
2020
Farmers Farmers 3,888 9.2 7.9 2.2 2.3North America P&C 350 9.0 7.8 2.2 2.0Europe, Middle East & Africa P&C 332 8.3 7.5 1.8 1.8Asia Pacific P&C 876 9.0 8.4 1.8 2.2Asia Pacific Life 1,198 9.1 8.4 2.0 2.1Latin America P&C 262 17.8 18.1 6.0 5.9Latin America Life 74 15.4 14.2 4.4 4.3
Zurich Insurance Group Annual Report 2021
Group overview
Integrated sustainability disclosure
Governance Risk review
Financial review
257
Consolidated financial statements (continued)
The recoverable amount of goodwill remains contingent on future cash flows and other assumptions, particularly discount rates and the perpetual growth rate. If the estimated future cash flows and other assumptions deviate significantly from the Group’s current outlook, there is a risk that the goodwill is impaired.
Quantitative sensitivity tests have been performed for all CGUs, by applying a reasonably possible change to each of the key assumptions to capture potential future variations in market conditions: a decrease in cash flows of up to 20 percent, an increase in the discount rate of 1.0 percentage point and a decrease in the perpetual growth rate of 1.0 percentage point. Under each individual scenario, reasonably possible changes in key assumptions did not impair goodwill and AIF contracts.
Distribution agreementsQualitative analyses have been performed on distribution agreements, typically comprising an analysis of the current financial performance, any change in the conditions in the agreement and environment that would indicate an impairment. No impairment was identified.
See notes 3, 6, 13, 14 and 15 for further information on impairment of assets.
d) Deferred taxesDeferred tax assets are recognized if sufficient future taxable income, including income from the reversal of existing taxable temporary differences and available tax planning strategies, is available for realization. The utilization of deferred tax assets arising from temporary differences between the carrying amounts of assets and liabilities in the consolidated financial statements and their tax bases depends on the generation of sufficient taxable profits in the period in which the underlying asset or liability is recovered or settled. If applicable tax law acknowledges different types of expenses to be tax deductible, deferred tax assets are only recognized if they give rise to deductions against the same type of taxable income. The utilization of deferred tax assets arising from unused tax losses or tax credits depends on the generation of sufficient taxable profits before the unused tax losses or tax credits expire. As of each balance sheet date, management evaluates the recoverability of deferred tax assets and, if it is considered probable that all or a portion of the deferred tax asset will not be utilized, then a valuation allowance is recognized.
See note 17 for further information on deferred taxes.
e) Employee benefitsThe Group provides defined benefit plans and other post-employment plans. In assessing the Group’s liability for these plans, critical judgments include estimates of mortality rates, rates of employment turnover, disability, early retirement, discount rates, future salary and pension increases and increases in long-term health care costs. Discount rates for significant plans are based on a yield curve approach. The Group sets the discount rate by creating a hypothetical portfolio of high-quality corporate bonds for which the timing and amount of cash flows approximate the estimated payouts of the defined benefit plan. These assumptions may differ from actual results due to changing economic conditions, higher or lower withdrawal rates, or longer or shorter life spans of participants. These differences may result in variability of pension income or expense recorded in future years.
See note 20 for further information on employee benefits.
Zurich Insurance Group Annual Report 2021
Group overview
Integrated sustainability disclosure
Governance Risk review
Financial review
258
Consolidated financial statements (continued)
5. Acquisitions and divestments
Transactions in 2021
Acquisitions Deutsche Bank Italian Financial Advisors network acquisitionOn August 4, 2021, Zurich Italy reached an agreement to acquire the network of Financial Advisors of the Deutsche Bank Group in Italy. The terms of the agreement provide for the transfer of a business unit consisting of approximately 1,085 Financial Advisors, 97 employees and 16.5 billion euros of assets under management. The acquisition allows Zurich Italy to further develop its financial and insurance distribution network in the Italian market. The transaction is subject to regulatory approval and is expected to close in the second half of 2022.
My Policy GroupOn May 18, 2021, the Group acquired a 19.99 percent share in Project Policy Bidco Limited, the owner of MyPolicy Limited, a UK usage-based insurance managing general agent, and Minerva. Science Limited. As part of the acquisition Zurich contributed Bright Box Hong Kong Limited and its subsidiaries as well as USD 10 million in cash. The investment is valued at USD 28 million. As a result of the transaction, the Group recognized a USD 33 million loss on sale of Bright Box Hong Kong Limited.
MetLife Property and Casualty businessOn December 11, 2020, Zurich Insurance Group (Zurich) subsidiary Farmers Group, Inc. (FGI) and Farmers Exchanges announced the acquisition of MetLife’s property and casualty (P&C) business in the U.S. for a purchase price of USD 3.96 billion. The acquisition successfully closed on April 7, 2021, and the acquired P&C business has since been rebranded to Farmers Workplace Solutions (FWS). As part of the transaction in effect, FGI acquired MetLife P&C’s management and administrative-related assets and liabilities to conduct its responsibilities as attorney-in-fact of the Farmers Exchanges and the Farmers Exchanges’ underlying insurance business. Zurich contributed USD 2.44 billion through FGI and the Farmers Exchanges, USD 1.52 billion. Farmers Group, Inc., a wholly owned subsidiary of the Group, provides certain non-claims services and ancillary services to the Farmers Exchanges as its attorney-in-fact and receives fees for its services. Attorney-in-fact services primarily include risk selection, preparation and mailing of policy documents and invoices, premium collection, management of the investment portfolios and certain other administrative and managerial functions. Fees for these services are primarily determined as a percentage of gross premiums earned by the Farmers Exchanges. Ancillary services primarily include information technology, brand advertising and certain distribution-related services that are not covered under the attorney-in-fact contracts for which FGI acts as a principal in arranging for those services to the Exchanges.
The acquisition gives the Farmers Exchanges a truly nationwide presence and access to new distribution channels. This includes a 10-year exclusive distribution agreement through which the Farmers Exchanges are offering their personal lines products on MetLife’s industry-leading U.S. Group Benefits platform, which today reaches 3,800 companies and 37 million employees.
Table 5.1 shows the updated opening balance sheet line items as of the acquisition date, representing the fair value of tangible and intangible assets. Goodwill has increased by USD 133 million due to adjustments to the purchase price allocation, in the second half of 2021, based on the finalization of certain tax contingencies associated with the acquisition.
Zurich Insurance Group Annual Report 2021
Group overview
Integrated sustainability disclosure
Governance Risk review
Financial review
259
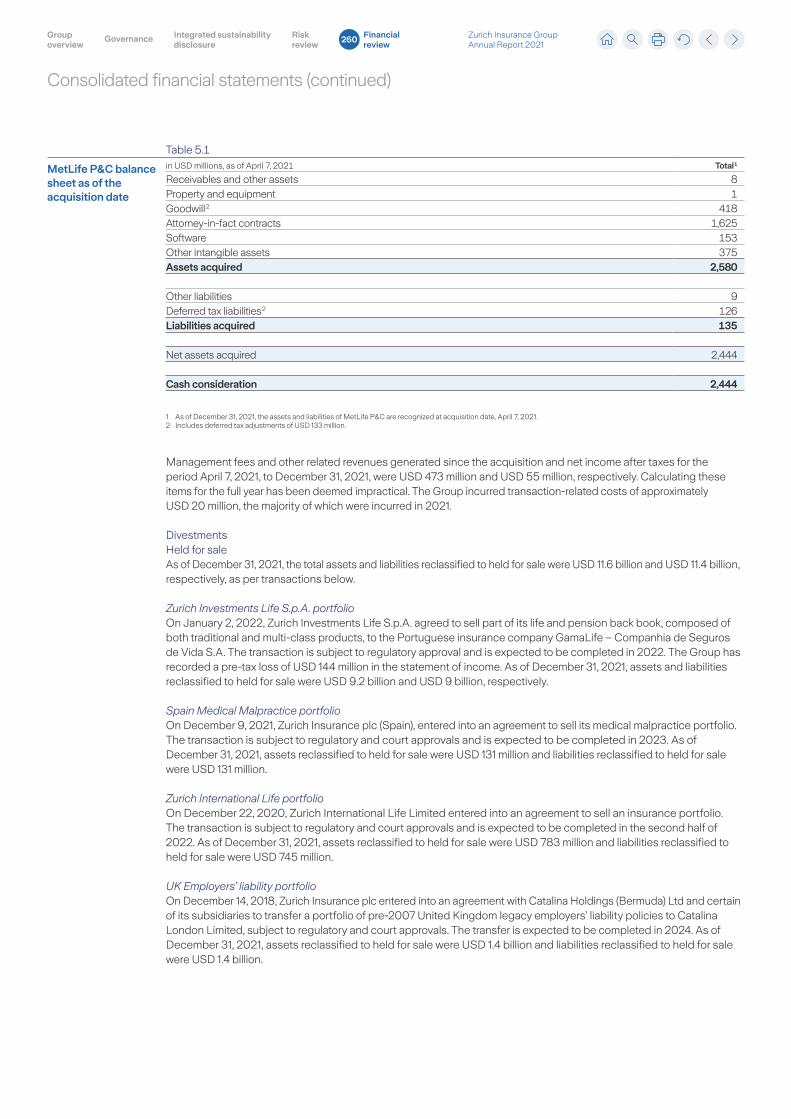
Consolidated financial statements (continued)
Table 5.1
MetLife P&C balance sheet as of the acquisition date
in USD millions, as of April 7, 2021 Total 1
Receivables and other assets 8Property and equipment 1Goodwill 2 418Attorney-in-fact contracts 1,625Software 153Other intangible assets 375Assets acquired 2,580
Other liabilities 9Deferred tax liabilities 2 126Liabilities acquired 135
Net assets acquired 2,444
Cash consideration 2,444
1 As of December 31, 2021, the assets and liabilities of MetLife P&C are recognized at acquisition date, April 7, 2021. 2 Includes deferred tax adjustments of USD 133 million.
Management fees and other related revenues generated since the acquisition and net income after taxes for the period April 7, 2021, to December 31, 2021, were USD 473 million and USD 55 million, respectively. Calculating these items for the full year has been deemed impractical. The Group incurred transaction-related costs of approximately USD 20 million, the majority of which were incurred in 2021.
DivestmentsHeld for saleAs of December 31, 2021, the total assets and liabilities reclassified to held for sale were USD 11.6 billion and USD 11.4 billion, respectively, as per transactions below.
Zurich Investments Life S.p.A. portfolioOn January 2, 2022, Zurich Investments Life S.p.A. agreed to sell part of its life and pension back book, composed of both traditional and multi-class products, to the Portuguese insurance company GamaLife – Companhia de Seguros de Vida S.A. The transaction is subject to regulatory approval and is expected to be completed in 2022. The Group has recorded a pre-tax loss of USD 144 million in the statement of income. As of December 31, 2021, assets and liabilities reclassified to held for sale were USD 9.2 billion and USD 9 billion, respectively.
Spain Medical Malpractice portfolioOn December 9, 2021, Zurich Insurance plc (Spain), entered into an agreement to sell its medical malpractice portfolio. The transaction is subject to regulatory and court approvals and is expected to be completed in 2023. As of December 31, 2021, assets reclassified to held for sale were USD 131 million and liabilities reclassified to held for sale were USD 131 million.
Zurich International Life portfolioOn December 22, 2020, Zurich International Life Limited entered into an agreement to sell an insurance portfolio. The transaction is subject to regulatory and court approvals and is expected to be completed in the second half of 2022. As of December 31, 2021, assets reclassified to held for sale were USD 783 million and liabilities reclassified to held for sale were USD 745 million.
UK Employers’ liability portfolioOn December 14, 2018, Zurich Insurance plc entered into an agreement with Catalina Holdings (Bermuda) Ltd and certain of its subsidiaries to transfer a portfolio of pre-2007 United Kingdom legacy employers’ liability policies to Catalina London Limited, subject to regulatory and court approvals. The transfer is expected to be completed in 2024. As of December 31, 2021, assets reclassified to held for sale were USD 1.4 billion and liabilities reclassified to held for sale were USD 1.4 billion.
Zurich Insurance Group Annual Report 2021
Group overview
Integrated sustainability disclosure
Governance Risk review
Financial review
260
Consolidated financial statements (continued)
Transactions in 2020
Acquisitions HealthinsiteOn December 15, 2020, Zurich Insurance Company Ltd completed the acquisition of Healthinsite Proprietary Limited and Insite Holding Pty Limited (collectively referred to as Healthinsite). Healthinsite provides innovative health and behavioral risk management solutions internationally to corporate clients and is the owner of proprietary software.
Swiss Commercial Accident and Health businessOn May 29, 2020, after receiving regulatory approval, Zurich Insurance Company Ltd acquired the Commercial Accident and Health business from CSS Versicherung AG.
DivestmentsDivestedUK International Portfolio BondOn November 30, 2020, Zurich Life Assurance plc completed the sale of its UK international Bond Portfolio to Monument Re, with a pre-tax loss of USD 14 million, recognized in the income statement.
US Corporate Life & Pensions (CLP)On March 19, 2020, Zurich Holding Company of America, Inc., Zurich American Life Insurance Company and Zurich American Life Insurance Company of New York signed an agreement to sell the Corporate Life and Pensions (CLP) business to Aflac Incorporated (Aflac) and its insurance subsidiaries, American Family Life Assurance Company of Columbus and American Family Life Assurance Company of New York. On November 2, 2020, the Group completed the sale with a pre-tax gain of USD 115 million, recognized in the income statement.
UK Retail Wealth BusinessOn November 19, 2019, Zurich Financial Services (UKISA) Limited and Allied Zurich Holdings Limited (AZH) entered into an agreement with Embark Group Limited (Embark) to sell the UK Retail Wealth business, which includes an Investment and Retail Wealth Platform business, Sterling ISA Managers Limited (SIML), and an Investment Management business, Zurich Investment Services (UK) Limited (ZISUK). On May 1, 2020, the Group completed the sale with a pre-tax loss of USD 143 million, of which USD 123 million was recognized in December 2019, in the income statement, including an impairment of assets of USD 210 million.
Germany Architects & Engineers portfolioOn September 5, 2019, Zurich Insurance plc entered into an agreement to transfer the German Architects & Engineers portfolio to Darag Deutsche Versicherungs- und Rückversicherungs-AG. On June 30, 2020, the Group completed the sale of the portfolio with a pre-tax gain of USD 22 million, recorded in the income statement.
Zurich Insurance Group Annual Report 2021
Group overview
Integrated sustainability disclosure
Governance Risk review
Financial review
261
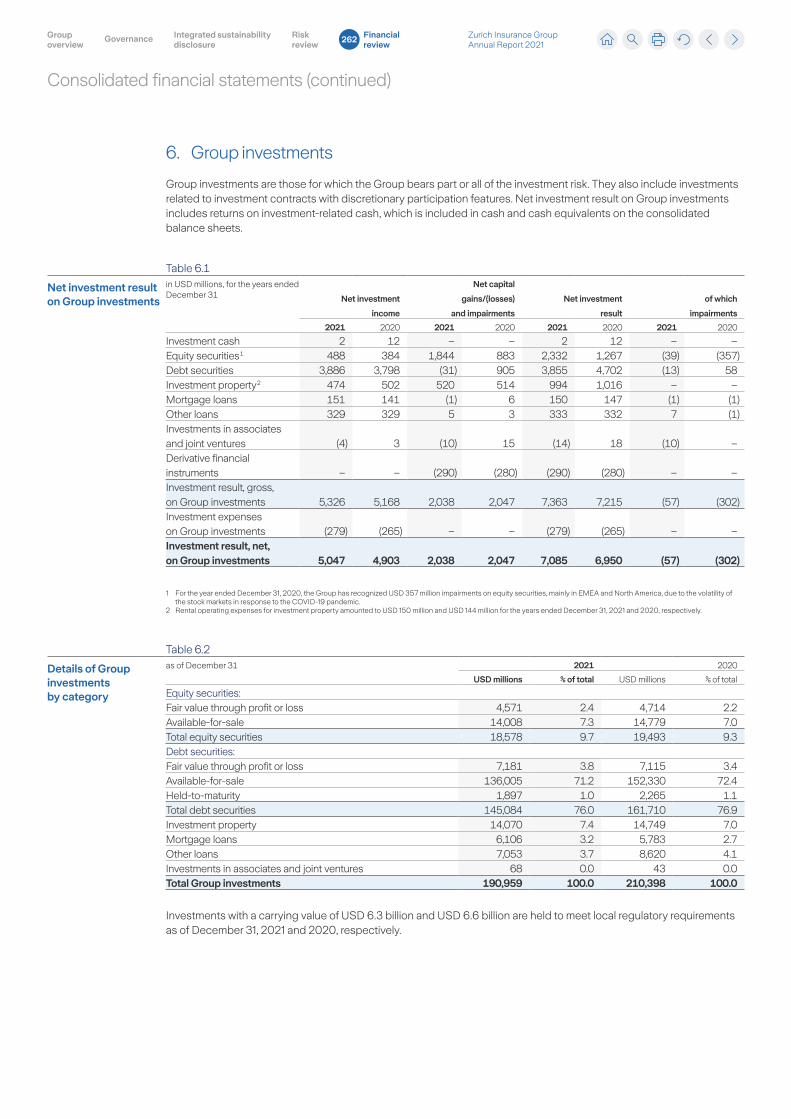
Consolidated financial statements (continued)
6. Group investments
Group investments are those for which the Group bears part or all of the investment risk. They also include investments related to investment contracts with discretionary participation features. Net investment result on Group investments includes returns on investment-related cash, which is included in cash and cash equivalents on the consolidated balance sheets.
Table 6.1
Net investment result on Group investments
in USD millions, for the years ended December 31 Net investment
income
Net capital
gains/(losses)
and impairments
Net investment
result
of which
impairments
2021 2020 2021 2020 2021 2020 2021 2020
Investment cash 2 12 – – 2 12 – –Equity securities 1 488 384 1,844 883 2,332 1,267 (39) (357)Debt securities 3,886 3,798 (31) 905 3,855 4,702 (13) 58Investment property 2 474 502 520 514 994 1,016 – –Mortgage loans 151 141 (1) 6 150 147 (1) (1)Other loans 329 329 5 3 333 332 7 (1)Investments in associates and joint ventures (4) 3 (10) 15 (14) 18 (10) –Derivative financial instruments – – (290) (280) (290) (280) – –Investment result, gross, on Group investments 5,326 5,168 2,038 2,047 7,363 7,215 (57) (302)Investment expenses on Group investments (279) (265) – – (279) (265) – –Investment result, net, on Group investments 5,047 4,903 2,038 2,047 7,085 6,950 (57) (302)
1 For the year ended December 31, 2020, the Group has recognized USD 357 million impairments on equity securities, mainly in EMEA and North America, due to the volatility of the stock markets in response to the COVID-19 pandemic.
2 Rental operating expenses for investment property amounted to USD 150 million and USD 144 million for the years ended December 31, 2021 and 2020, respectively.
Table 6.2
Details of Group investments by category
as of December 31 2021 2020
USD millions % of total USD millions % of total
Equity securities:Fair value through profit or loss 4,571 2.4 4,714 2.2Available-for-sale 14,008 7.3 14,779 7.0Total equity securities 18,578 9.7 19,493 9.3Debt securities:Fair value through profit or loss 7,181 3.8 7,115 3.4Available-for-sale 136,005 71.2 152,330 72.4Held-to-maturity 1,897 1.0 2,265 1.1Total debt securities 145,084 76.0 161,710 76.9Investment property 14,070 7.4 14,749 7.0Mortgage loans 6,106 3.2 5,783 2.7Other loans 7,053 3.7 8,620 4.1Investments in associates and joint ventures 68 0.0 43 0.0Total Group investments 190,959 100.0 210,398 100.0
Investments with a carrying value of USD 6.3 billion and USD 6.6 billion are held to meet local regulatory requirements as of December 31, 2021 and 2020, respectively.
Zurich Insurance Group Annual Report 2021
Group overview
Integrated sustainability disclosure
Governance Risk review
Financial review
262
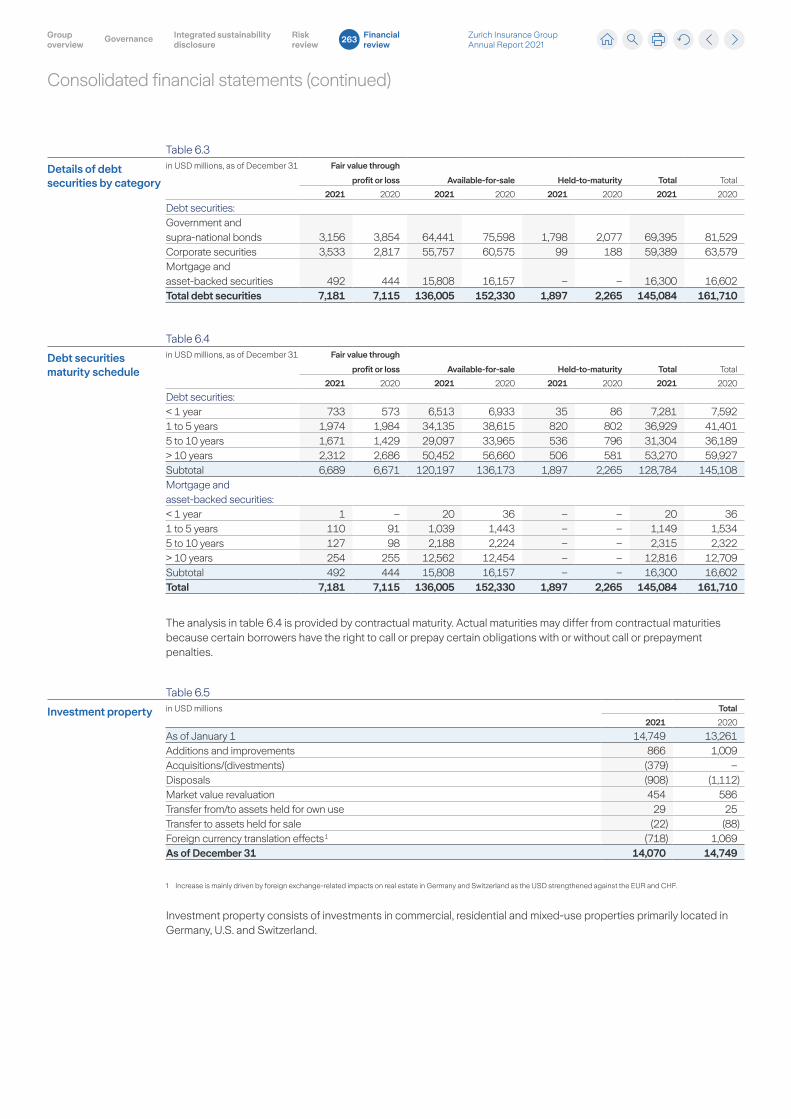
Consolidated financial statements (continued)
Table 6.3
Details of debt securities by category
in USD millions, as of December 31 Fair value through
profit or loss Available-for-sale Held-to-maturity Total Total
2021 2020 2021 2020 2021 2020 2021 2020
Debt securities:Government and supra-national bonds 3,156 3,854 64,441 75,598 1,798 2,077 69,395 81,529Corporate securities 3,533 2,817 55,757 60,575 99 188 59,389 63,579Mortgage and asset-backed securities 492 444 15,808 16,157 – – 16,300 16,602Total debt securities 7,181 7,115 136,005 152,330 1,897 2,265 145,084 161,710
Table 6.4
Debt securities maturity schedule
in USD millions, as of December 31 Fair value through
profit or loss Available-for-sale Held-to-maturity Total Total
2021 2020 2021 2020 2021 2020 2021 2020
Debt securities:< 1 year 733 573 6,513 6,933 35 86 7,281 7,5921 to 5 years 1,974 1,984 34,135 38,615 820 802 36,929 41,4015 to 10 years 1,671 1,429 29,097 33,965 536 796 31,304 36,189> 10 years 2,312 2,686 50,452 56,660 506 581 53,270 59,927Subtotal 6,689 6,671 120,197 136,173 1,897 2,265 128,784 145,108Mortgage and asset-backed securities:< 1 year 1 – 20 36 – – 20 361 to 5 years 110 91 1,039 1,443 – – 1,149 1,5345 to 10 years 127 98 2,188 2,224 – – 2,315 2,322> 10 years 254 255 12,562 12,454 – – 12,816 12,709Subtotal 492 444 15,808 16,157 – – 16,300 16,602Total 7,181 7,115 136,005 152,330 1,897 2,265 145,084 161,710
The analysis in table 6.4 is provided by contractual maturity. Actual maturities may differ from contractual maturities because certain borrowers have the right to call or prepay certain obligations with or without call or prepayment penalties.
Table 6.5
Investment property in USD millions Total
2021 2020
As of January 1 14,749 13,261Additions and improvements 866 1,009Acquisitions/(divestments) (379) –Disposals (908) (1,112)Market value revaluation 454 586Transfer from/to assets held for own use 29 25Transfer to assets held for sale (22) (88)Foreign currency translation effects 1 (718) 1,069As of December 31 14,070 14,749
1 Increase is mainly driven by foreign exchange-related impacts on real estate in Germany and Switzerland as the USD strengthened against the EUR and CHF.
Investment property consists of investments in commercial, residential and mixed-use properties primarily located in Germany, U.S. and Switzerland.
Zurich Insurance Group Annual Report 2021
Group overview
Integrated sustainability disclosure
Governance Risk review
Financial review
263
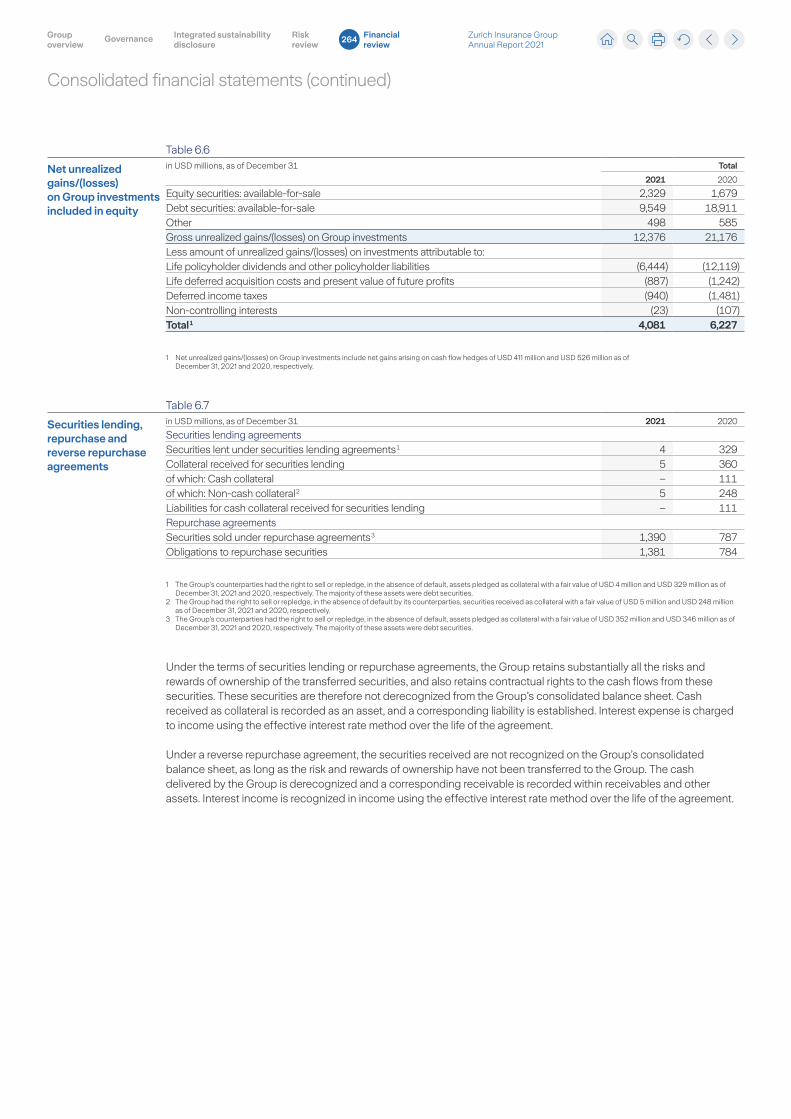
Consolidated financial statements (continued)
Table 6.6
Net unrealized gains/(losses) on Group investments included in equity
in USD millions, as of December 31 Total
2021 2020
Equity securities: available-for-sale 2,329 1,679Debt securities: available-for-sale 9,549 18,911Other 498 585Gross unrealized gains/(losses) on Group investments 12,376 21,176Less amount of unrealized gains/(losses) on investments attributable to:Life policyholder dividends and other policyholder liabilities (6,444) (12,119)Life deferred acquisition costs and present value of future profits (887) (1,242)Deferred income taxes (940) (1,481)Non-controlling interests (23) (107)Total 1 4,081 6,227
1 Net unrealized gains/(losses) on Group investments include net gains arising on cash flow hedges of USD 411 million and USD 526 million as of December 31, 2021 and 2020, respectively.
Table 6.7
Securities lending, repurchase and reverse repurchase agreements
in USD millions, as of December 31 2021 2020
Securities lending agreementsSecurities lent under securities lending agreements 1 4 329Collateral received for securities lending 5 360of which: Cash collateral – 111of which: Non-cash collateral 2 5 248Liabilities for cash collateral received for securities lending – 111Repurchase agreements Securities sold under repurchase agreements 3 1,390 787Obligations to repurchase securities 1,381 784
1 The Group’s counterparties had the right to sell or repledge, in the absence of default, assets pledged as collateral with a fair value of USD 4 million and USD 329 million as of December 31, 2021 and 2020, respectively. The majority of these assets were debt securities.
2 The Group had the right to sell or repledge, in the absence of default by its counterparties, securities received as collateral with a fair value of USD 5 million and USD 248 million as of December 31, 2021 and 2020, respectively.
3 The Group’s counterparties had the right to sell or repledge, in the absence of default, assets pledged as collateral with a fair value of USD 352 million and USD 346 million as of December 31, 2021 and 2020, respectively. The majority of these assets were debt securities.
Under the terms of securities lending or repurchase agreements, the Group retains substantially all the risks and rewards of ownership of the transferred securities, and also retains contractual rights to the cash flows from these securities. These securities are therefore not derecognized from the Group’s consolidated balance sheet. Cash received as collateral is recorded as an asset, and a corresponding liability is established. Interest expense is charged to income using the effective interest rate method over the life of the agreement.
Under a reverse repurchase agreement, the securities received are not recognized on the Group’s consolidated balance sheet, as long as the risk and rewards of ownership have not been transferred to the Group. The cash delivered by the Group is derecognized and a corresponding receivable is recorded within receivables and other assets. Interest income is recognized in income using the effective interest rate method over the life of the agreement.
Zurich Insurance Group Annual Report 2021
Group overview
Integrated sustainability disclosure
Governance Risk review
Financial review
264
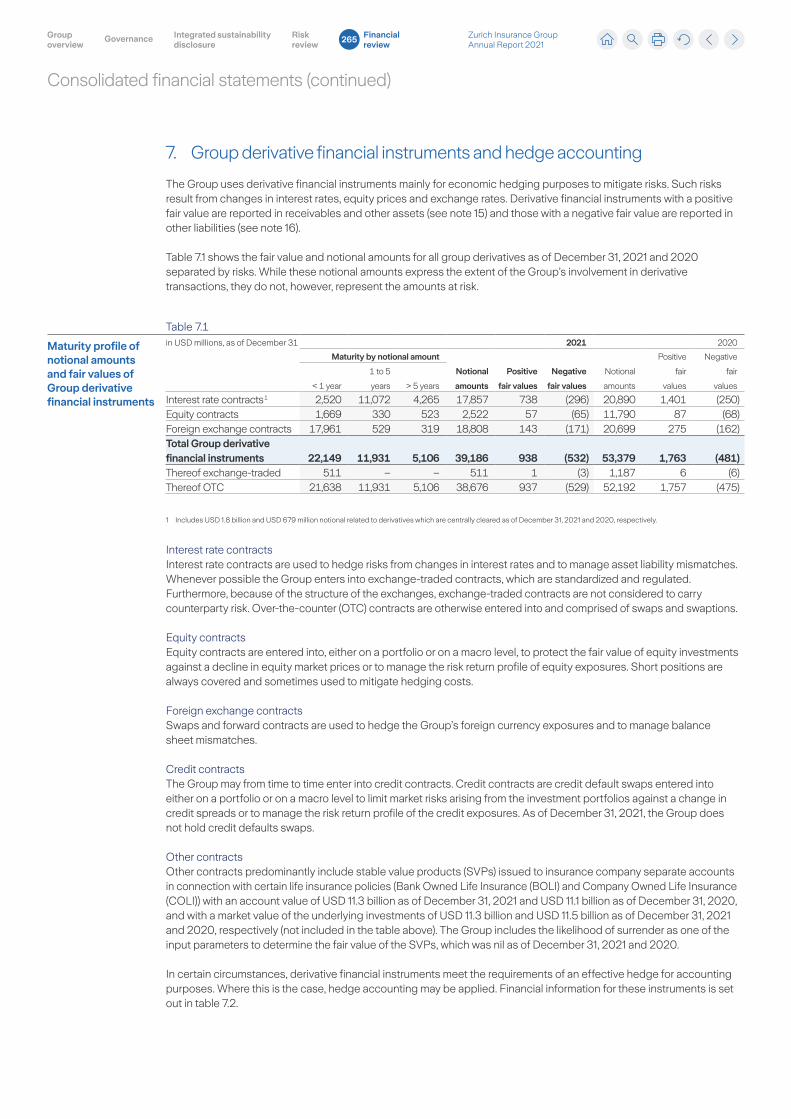
Consolidated financial statements (continued)
7. Group derivative financial instruments and hedge accounting
The Group uses derivative financial instruments mainly for economic hedging purposes to mitigate risks. Such risks result from changes in interest rates, equity prices and exchange rates. Derivative financial instruments with a positive fair value are reported in receivables and other assets (see note 15) and those with a negative fair value are reported in other liabilities (see note 16).
Table 7.1 shows the fair value and notional amounts for all group derivatives as of December 31, 2021 and 2020 separated by risks. While these notional amounts express the extent of the Group’s involvement in derivative transactions, they do not, however, represent the amounts at risk.
Table 7.1
Maturity profile of notional amounts and fair values of Group derivative financial instruments
in USD millions, as of December 31 2021 2020
Maturity by notional amount
Notional
amounts
Positive
fair values
Negative
fair values
Notional
amounts
Positive
fair
values
Negative
fair
values< 1 year
1 to 5
years > 5 years
Interest rate contracts 1 2,520 11,072 4,265 17,857 738 (296) 20,890 1,401 (250)Equity contracts 1,669 330 523 2,522 57 (65) 11,790 87 (68)Foreign exchange contracts 17,961 529 319 18,808 143 (171) 20,699 275 (162)Total Group derivative financial instruments 22,149 11,931 5,106 39,186 938 (532) 53,379 1,763 (481)Thereof exchange-traded 511 – – 511 1 (3) 1,187 6 (6)Thereof OTC 21,638 11,931 5,106 38,676 937 (529) 52,192 1,757 (475)
1 Includes USD 1.8 billion and USD 679 million notional related to derivatives which are centrally cleared as of December 31, 2021 and 2020, respectively.
Interest rate contractsInterest rate contracts are used to hedge risks from changes in interest rates and to manage asset liability mismatches. Whenever possible the Group enters into exchange-traded contracts, which are standardized and regulated. Furthermore, because of the structure of the exchanges, exchange-traded contracts are not considered to carry counterparty risk. Over-the-counter (OTC) contracts are otherwise entered into and comprised of swaps and swaptions.
Equity contractsEquity contracts are entered into, either on a portfolio or on a macro level, to protect the fair value of equity investments against a decline in equity market prices or to manage the risk return profile of equity exposures. Short positions are always covered and sometimes used to mitigate hedging costs.
Foreign exchange contractsSwaps and forward contracts are used to hedge the Group’s foreign currency exposures and to manage balance sheet mismatches.
Credit contractsThe Group may from time to time enter into credit contracts. Credit contracts are credit default swaps entered into either on a portfolio or on a macro level to limit market risks arising from the investment portfolios against a change in credit spreads or to manage the risk return profile of the credit exposures. As of December 31, 2021, the Group does not hold credit defaults swaps.
Other contractsOther contracts predominantly include stable value products (SVPs) issued to insurance company separate accounts in connection with certain life insurance policies (Bank Owned Life Insurance (BOLI) and Company Owned Life Insurance (COLI)) with an account value of USD 11.3 billion as of December 31, 2021 and USD 11.1 billion as of December 31, 2020, and with a market value of the underlying investments of USD 11.3 billion and USD 11.5 billion as of December 31, 2021 and 2020, respectively (not included in the table above). The Group includes the likelihood of surrender as one of the input parameters to determine the fair value of the SVPs, which was nil as of December 31, 2021 and 2020.
In certain circumstances, derivative financial instruments meet the requirements of an effective hedge for accounting purposes. Where this is the case, hedge accounting may be applied. Financial information for these instruments is set out in table 7.2.
Zurich Insurance Group Annual Report 2021
Group overview
Integrated sustainability disclosure
Governance Risk review
Financial review
265
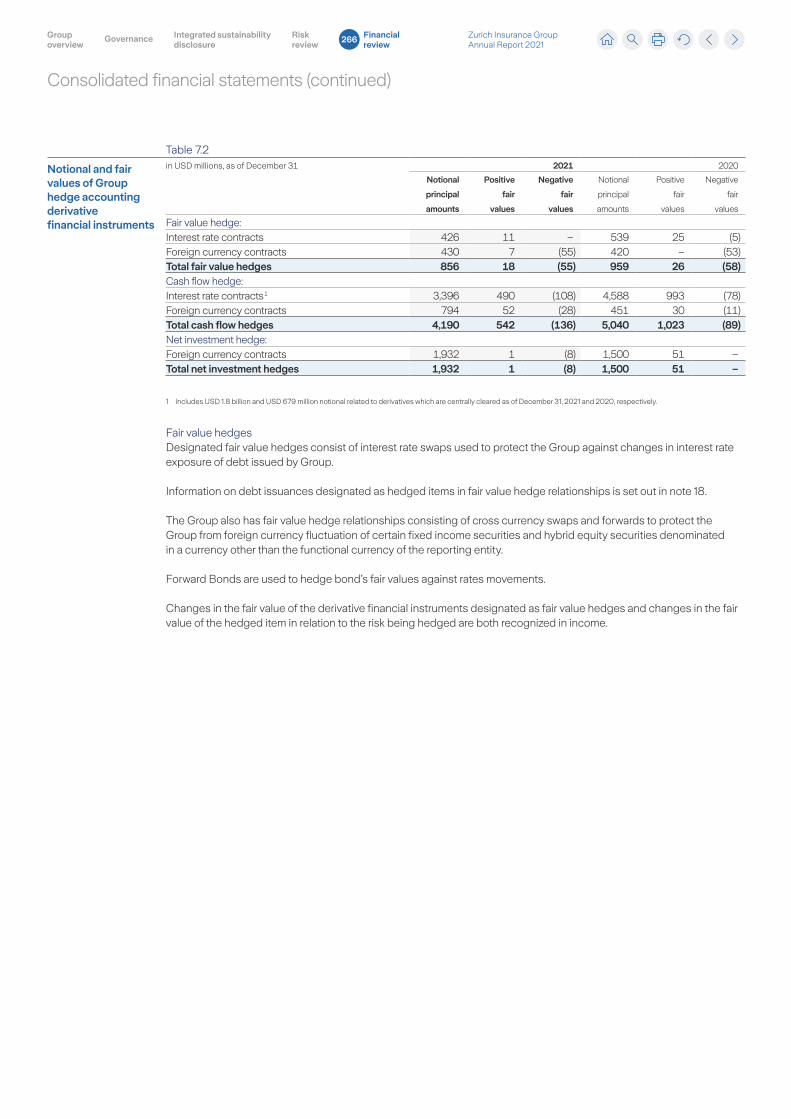
Consolidated financial statements (continued)
Table 7.2
Notional and fair values of Group hedge accounting derivative financial instruments
in USD millions, as of December 31 2021 2020
Notional
principal
amounts
Positive
fair
values
Negative
fair
values
Notional
principal
amounts
Positive
fair
values
Negative
fair
values
Fair value hedge:Interest rate contracts 426 11 – 539 25 (5)Foreign currency contracts 430 7 (55) 420 – (53)Total fair value hedges 856 18 (55) 959 26 (58)Cash flow hedge:Interest rate contracts 1 3,396 490 (108) 4,588 993 (78)Foreign currency contracts 794 52 (28) 451 30 (11)Total cash flow hedges 4,190 542 (136) 5,040 1,023 (89)Net investment hedge:Foreign currency contracts 1,932 1 (8) 1,500 51 –Total net investment hedges 1,932 1 (8) 1,500 51 –
1 Includes USD 1.8 billion and USD 679 million notional related to derivatives which are centrally cleared as of December 31, 2021 and 2020, respectively.
Fair value hedgesDesignated fair value hedges consist of interest rate swaps used to protect the Group against changes in interest rate exposure of debt issued by Group.
Information on debt issuances designated as hedged items in fair value hedge relationships is set out in note 18.
The Group also has fair value hedge relationships consisting of cross currency swaps and forwards to protect the Group from foreign currency fluctuation of certain fixed income securities and hybrid equity securities denominated in a currency other than the functional currency of the reporting entity.
Forward Bonds are used to hedge bond’s fair values against rates movements.
Changes in the fair value of the derivative financial instruments designated as fair value hedges and changes in the fair value of the hedged item in relation to the risk being hedged are both recognized in income.
Zurich Insurance Group Annual Report 2021
Group overview
Integrated sustainability disclosure
Governance Risk review
Financial review
266
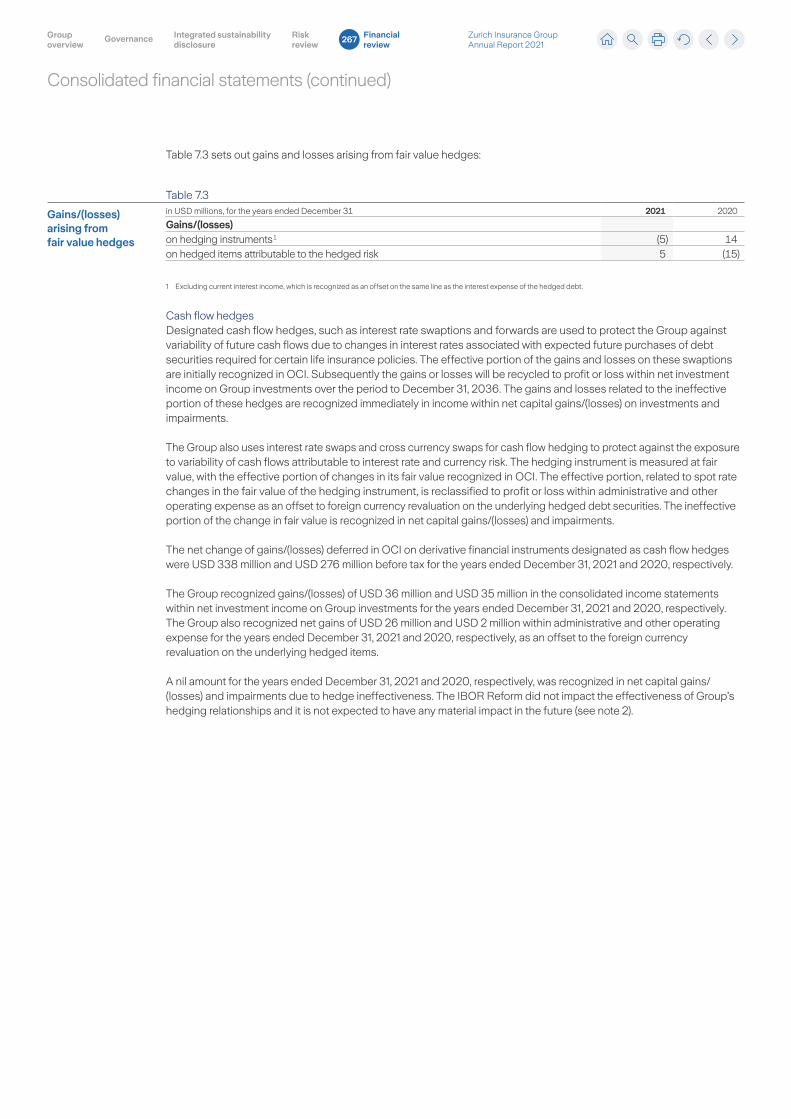
Consolidated financial statements (continued)
Table 7.3 sets out gains and losses arising from fair value hedges:
Table 7.3
Gains/(losses) arising from fair value hedges
in USD millions, for the years ended December 31 2021 2020
Gains/(losses)on hedging instruments 1 (5) 14on hedged items attributable to the hedged risk 5 (15)
1 Excluding current interest income, which is recognized as an offset on the same line as the interest expense of the hedged debt.
Cash flow hedgesDesignated cash flow hedges, such as interest rate swaptions and forwards are used to protect the Group against variability of future cash flows due to changes in interest rates associated with expected future purchases of debt securities required for certain life insurance policies. The effective portion of the gains and losses on these swaptions are initially recognized in OCI. Subsequently the gains or losses will be recycled to profit or loss within net investment income on Group investments over the period to December 31, 2036. The gains and losses related to the ineffective portion of these hedges are recognized immediately in income within net capital gains/(losses) on investments and impairments.
The Group also uses interest rate swaps and cross currency swaps for cash flow hedging to protect against the exposure to variability of cash flows attributable to interest rate and currency risk. The hedging instrument is measured at fair value, with the effective portion of changes in its fair value recognized in OCI. The effective portion, related to spot rate changes in the fair value of the hedging instrument, is reclassified to profit or loss within administrative and other operating expense as an offset to foreign currency revaluation on the underlying hedged debt securities. The ineffective portion of the change in fair value is recognized in net capital gains/(losses) and impairments.
The net change of gains/(losses) deferred in OCI on derivative financial instruments designated as cash flow hedges were USD 338 million and USD 276 million before tax for the years ended December 31, 2021 and 2020, respectively.
The Group recognized gains/(losses) of USD 36 million and USD 35 million in the consolidated income statements within net investment income on Group investments for the years ended December 31, 2021 and 2020, respectively. The Group also recognized net gains of USD 26 million and USD 2 million within administrative and other operating expense for the years ended December 31, 2021 and 2020, respectively, as an offset to the foreign currency revaluation on the underlying hedged items.
A nil amount for the years ended December 31, 2021 and 2020, respectively, was recognized in net capital gains/(losses) and impairments due to hedge ineffectiveness. The IBOR Reform did not impact the effectiveness of Group’s hedging relationships and it is not expected to have any material impact in the future (see note 2).
Zurich Insurance Group Annual Report 2021
Group overview
Integrated sustainability disclosure
Governance Risk review
Financial review
267
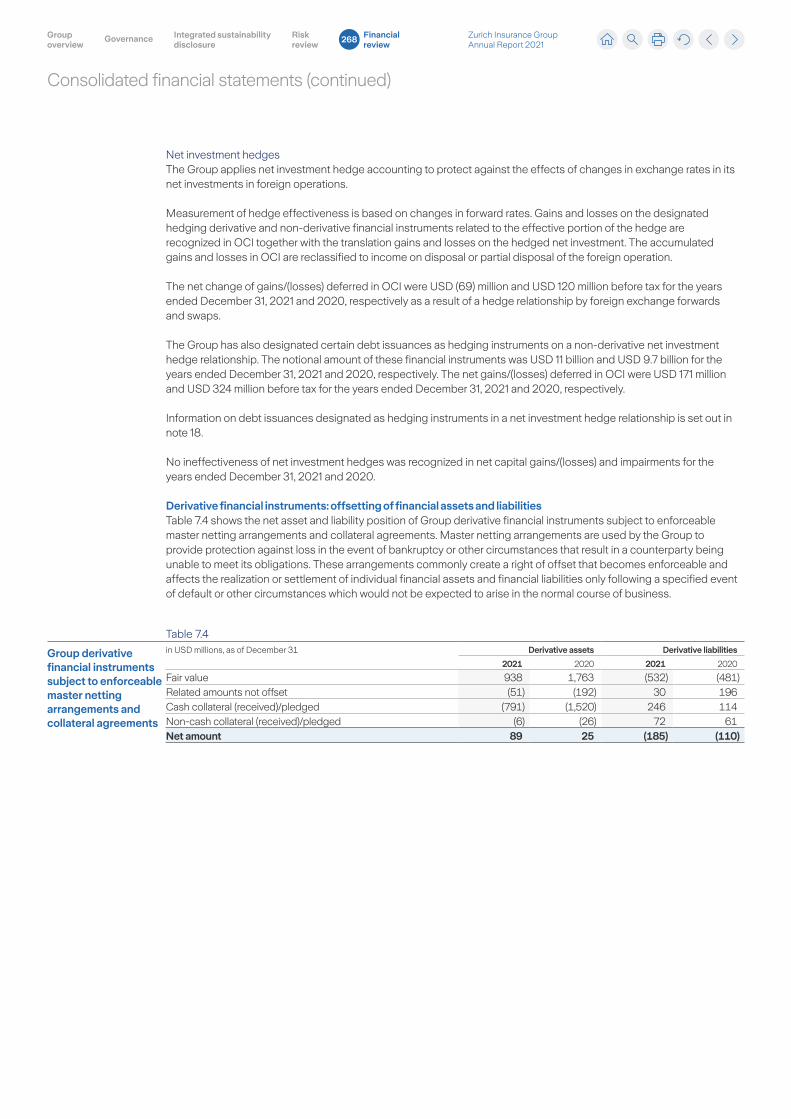
Consolidated financial statements (continued)
Net investment hedgesThe Group applies net investment hedge accounting to protect against the effects of changes in exchange rates in its net investments in foreign operations.
Measurement of hedge effectiveness is based on changes in forward rates. Gains and losses on the designated hedging derivative and non-derivative financial instruments related to the effective portion of the hedge are recognized in OCI together with the translation gains and losses on the hedged net investment. The accumulated gains and losses in OCI are reclassified to income on disposal or partial disposal of the foreign operation.
The net change of gains/(losses) deferred in OCI were USD (69) million and USD 120 million before tax for the years ended December 31, 2021 and 2020, respectively as a result of a hedge relationship by foreign exchange forwards and swaps.
The Group has also designated certain debt issuances as hedging instruments on a non-derivative net investment hedge relationship. The notional amount of these financial instruments was USD 11 billion and USD 9.7 billion for the years ended December 31, 2021 and 2020, respectively. The net gains/(losses) deferred in OCI were USD 171 million and USD 324 million before tax for the years ended December 31, 2021 and 2020, respectively.
Information on debt issuances designated as hedging instruments in a net investment hedge relationship is set out in note 18.
No ineffectiveness of net investment hedges was recognized in net capital gains/(losses) and impairments for the years ended December 31, 2021 and 2020.
Derivative financial instruments: offsetting of financial assets and liabilitiesTable 7.4 shows the net asset and liability position of Group derivative financial instruments subject to enforceable master netting arrangements and collateral agreements. Master netting arrangements are used by the Group to provide protection against loss in the event of bankruptcy or other circumstances that result in a counterparty being unable to meet its obligations. These arrangements commonly create a right of offset that becomes enforceable and affects the realization or settlement of individual financial assets and financial liabilities only following a specified event of default or other circumstances which would not be expected to arise in the normal course of business.
Table 7.4
Group derivative financial instruments subject to enforceable master netting arrangements and collateral agreements
in USD millions, as of December 31 Derivative assets Derivative liabilities
2021 2020 2021 2020
Fair value 938 1,763 (532) (481)Related amounts not offset (51) (192) 30 196Cash collateral (received)/pledged (791) (1,520) 246 114Non-cash collateral (received)/pledged (6) (26) 72 61Net amount 89 25 (185) (110)
Zurich Insurance Group Annual Report 2021
Group overview
Integrated sustainability disclosure
Governance Risk review
Financial review
268
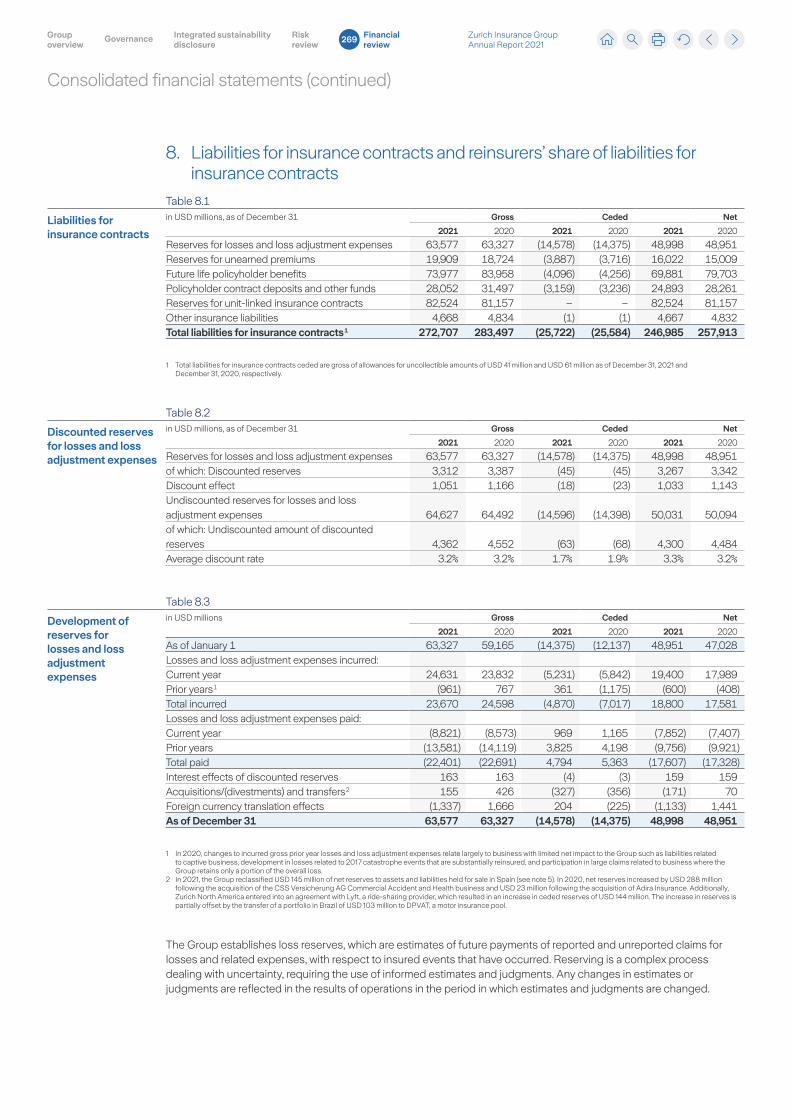
Consolidated financial statements (continued)
8. Liabilities for insurance contracts and reinsurers’ share of liabilities for insurance contracts
Table 8.1
Liabilities for insurance contracts
in USD millions, as of December 31 Gross Ceded Net
2021 2020 2021 2020 2021 2020
Reserves for losses and loss adjustment expenses 63,577 63,327 (14,578) (14,375) 48,998 48,951Reserves for unearned premiums 19,909 18,724 (3,887) (3,716) 16,022 15,009Future life policyholder benefits 73,977 83,958 (4,096) (4,256) 69,881 79,703Policyholder contract deposits and other funds 28,052 31,497 (3,159) (3,236) 24,893 28,261Reserves for unit-linked insurance contracts 82,524 81,157 – – 82,524 81,157Other insurance liabilities 4,668 4,834 (1) (1) 4,667 4,832Total liabilities for insurance contracts 1 272,707 283,497 (25,722) (25,584) 246,985 257,913
1 Total liabilities for insurance contracts ceded are gross of allowances for uncollectible amounts of USD 41 million and USD 61 million as of December 31, 2021 and December 31, 2020, respectively.
Table 8.2
Discounted reserves for losses and loss adjustment expenses
in USD millions, as of December 31 Gross Ceded Net
2021 2020 2021 2020 2021 2020
Reserves for losses and loss adjustment expenses 63,577 63,327 (14,578) (14,375) 48,998 48,951of which: Discounted reserves 3,312 3,387 (45) (45) 3,267 3,342Discount effect 1,051 1,166 (18) (23) 1,033 1,143Undiscounted reserves for losses and loss adjustment expenses 64,627 64,492 (14,596) (14,398) 50,031 50,094of which: Undiscounted amount of discounted reserves 4,362 4,552 (63) (68) 4,300 4,484Average discount rate 3.2% 3.2% 1.7% 1.9% 3.3% 3.2%
Table 8.3
Development of reserves for losses and loss adjustment expenses
in USD millions Gross Ceded Net
2021 2020 2021 2020 2021 2020
As of January 1 63,327 59,165 (14,375) (12,137) 48,951 47,028Losses and loss adjustment expenses incurred:Current year 24,631 23,832 (5,231) (5,842) 19,400 17,989Prior years 1 (961) 767 361 (1,175) (600) (408)Total incurred 23,670 24,598 (4,870) (7,017) 18,800 17,581Losses and loss adjustment expenses paid:Current year (8,821) (8,573) 969 1,165 (7,852) (7,407)Prior years (13,581) (14,119) 3,825 4,198 (9,756) (9,921)Total paid (22,401) (22,691) 4,794 5,363 (17,607) (17,328)Interest effects of discounted reserves 163 163 (4) (3) 159 159Acquisitions/(divestments) and transfers 2 155 426 (327) (356) (171) 70Foreign currency translation effects (1,337) 1,666 204 (225) (1,133) 1,441As of December 31 63,577 63,327 (14,578) (14,375) 48,998 48,951
1 In 2020, changes to incurred gross prior year losses and loss adjustment expenses relate largely to business with limited net impact to the Group such as liabilities related to captive business, development in losses related to 2017 catastrophe events that are substantially reinsured, and participation in large claims related to business where the Group retains only a portion of the overall loss.
2 In 2021, the Group reclassified USD 145 million of net reserves to assets and liabilities held for sale in Spain (see note 5). In 2020, net reserves increased by USD 288 million following the acquisition of the CSS Versicherung AG Commercial Accident and Health business and USD 23 million following the acquisition of Adira Insurance. Additionally, Zurich North America entered into an agreement with Lyft, a ride-sharing provider, which resulted in an increase in ceded reserves of USD 144 million. The increase in reserves is partially offset by the transfer of a portfolio in Brazil of USD 103 million to DPVAT, a motor insurance pool.
The Group establishes loss reserves, which are estimates of future payments of reported and unreported claims for losses and related expenses, with respect to insured events that have occurred. Reserving is a complex process dealing with uncertainty, requiring the use of informed estimates and judgments. Any changes in estimates or judgments are reflected in the results of operations in the period in which estimates and judgments are changed.
Zurich Insurance Group Annual Report 2021
Group overview
Integrated sustainability disclosure
Governance Risk review
Financial review
269
Consolidated financial statements (continued)
Significant delays may occur in the notification and settlement of claims, and a substantial measure of experience and judgment is involved in assessing outstanding liabilities, the ultimate cost of which cannot be known with certainty as of the balance sheet date. The reserves for losses and loss adjustment expenses are determined on the basis of the information available. However, it is inherent in the nature of the business written that the ultimate liabilities may vary as a result of subsequent developments.
For the year ended December 31, 2021, the increase of USD 47 million in net reserves for losses and loss adjustment expenses is the result of an increase in reserves following natural catastrophe losses in North America including the Texas freeze event and Hurricane Ida and also in Europe, Middle East and Africa (EMEA) being offset by foreign exchange-related reserve decreases.
Net favorable reserve development emerged from reserves established in prior years amounting to USD 600 million mainly related to the following:
– In EMEA, favorable prior year development of USD 143 million driven by retail motor;
– In North America, favorable prior year development of USD 509 million driven by worker injury.
For the year ended December 31, 2020, the increase of USD 1.9 billion in net reserves for losses and loss adjustment expenses is mainly driven by foreign exchange-related increases as the U.S. dollar weakened against the euro and British pound, and from reserves related to catastrophe losses including Hurricane Laura and Civil Unrest in North America, and COVID-19-related losses mainly in North America, Europe and Asia Pacific.
Net favorable reserve development emerged from reserves established in prior years amounting to USD 408 million mainly related to the following:
– In EMEA, favorable prior year development of USD 286 million driven by motor and liability in retail segment;
– In North America, favorable prior year development of USD 140 million driven by worker injury in retail and commercial segments.
Zurich Insurance Group Annual Report 2021
Group overview
Integrated sustainability disclosure
Governance Risk review
Financial review
270
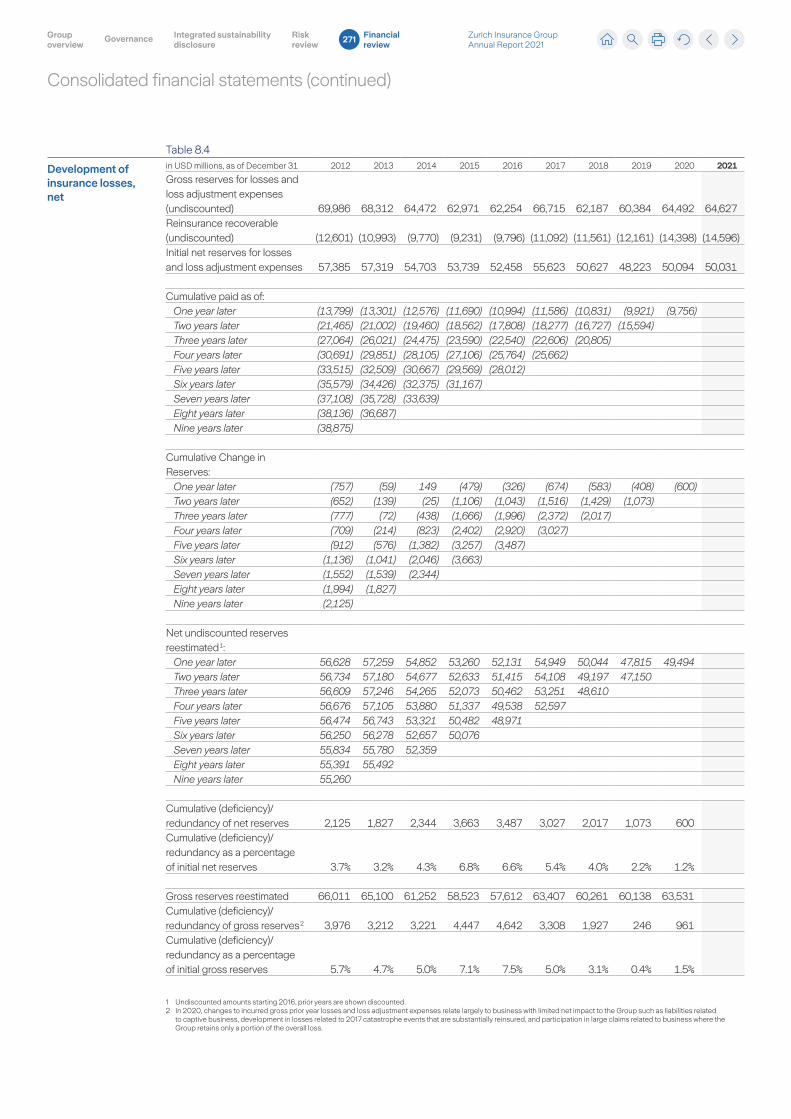
Consolidated financial statements (continued)
Table 8.4
Development of insurance losses, net
in USD millions, as of December 31 2012 2013 2014 2015 2016 2017 2018 2019 2020 2021
Gross reserves for losses and loss adjustment expenses (undiscounted) 69,986 68,312 64,472 62,971 62,254 66,715 62,187 60,384 64,492 64,627Reinsurance recoverable (undiscounted) (12,601) (10,993) (9,770) (9,231) (9,796) (11,092) (11,561) (12,161) (14,398) (14,596)Initial net reserves for losses and loss adjustment expenses 57,385 57,319 54,703 53,739 52,458 55,623 50,627 48,223 50,094 50,031
Cumulative paid as of:One year later (13,799) (13,301) (12,576) (11,690) (10,994) (11,586) (10,831) (9,921) (9,756)Two years later (21,465) (21,002) (19,460) (18,562) (17,808) (18,277) (16,727) (15,594)Three years later (27,064) (26,021) (24,475) (23,590) (22,540) (22,606) (20,805)Four years later (30,691) (29,851) (28,105) (27,106) (25,764) (25,662)Five years later (33,515) (32,509) (30,667) (29,569) (28,012)Six years later (35,579) (34,426) (32,375) (31,167)Seven years later (37,108) (35,728) (33,639)Eight years later (38,136) (36,687)Nine years later (38,875)
Cumulative Change in Reserves:
One year later (757) (59) 149 (479) (326) (674) (583) (408) (600)Two years later (652) (139) (25) (1,106) (1,043) (1,516) (1,429) (1,073)Three years later (777) (72) (438) (1,666) (1,996) (2,372) (2,017)Four years later (709) (214) (823) (2,402) (2,920) (3,027)Five years later (912) (576) (1,382) (3,257) (3,487)Six years later (1,136) (1,041) (2,046) (3,663)Seven years later (1,552) (1,539) (2,344)Eight years later (1,994) (1,827)Nine years later (2,125)
Net undiscounted reserves reestimated 1:
One year later 56,628 57,259 54,852 53,260 52,131 54,949 50,044 47,815 49,494Two years later 56,734 57,180 54,677 52,633 51,415 54,108 49,197 47,150Three years later 56,609 57,246 54,265 52,073 50,462 53,251 48,610Four years later 56,676 57,105 53,880 51,337 49,538 52,597Five years later 56,474 56,743 53,321 50,482 48,971Six years later 56,250 56,278 52,657 50,076Seven years later 55,834 55,780 52,359Eight years later 55,391 55,492Nine years later 55,260
Cumulative (deficiency)/ redundancy of net reserves 2,125 1,827 2,344 3,663 3,487 3,027 2,017 1,073 600Cumulative (deficiency)/ redundancy as a percentage of initial net reserves 3.7% 3.2% 4.3% 6.8% 6.6% 5.4% 4.0% 2.2% 1.2%
Gross reserves reestimated 66,011 65,100 61,252 58,523 57,612 63,407 60,261 60,138 63,531Cumulative (deficiency)/ redundancy of gross reserves 2 3,976 3,212 3,221 4,447 4,642 3,308 1,927 246 961Cumulative (deficiency)/ redundancy as a percentage of initial gross reserves 5.7% 4.7% 5.0% 7.1% 7.5% 5.0% 3.1% 0.4% 1.5%
1 Undiscounted amounts starting 2016, prior years are shown discounted.2 In 2020, changes to incurred gross prior year losses and loss adjustment expenses relate largely to business with limited net impact to the Group such as liabilities related
to captive business, development in losses related to 2017 catastrophe events that are substantially reinsured, and participation in large claims related to business where the Group retains only a portion of the overall loss.
Zurich Insurance Group Annual Report 2021
Group overview
Integrated sustainability disclosure
Governance Risk review
Financial review
271
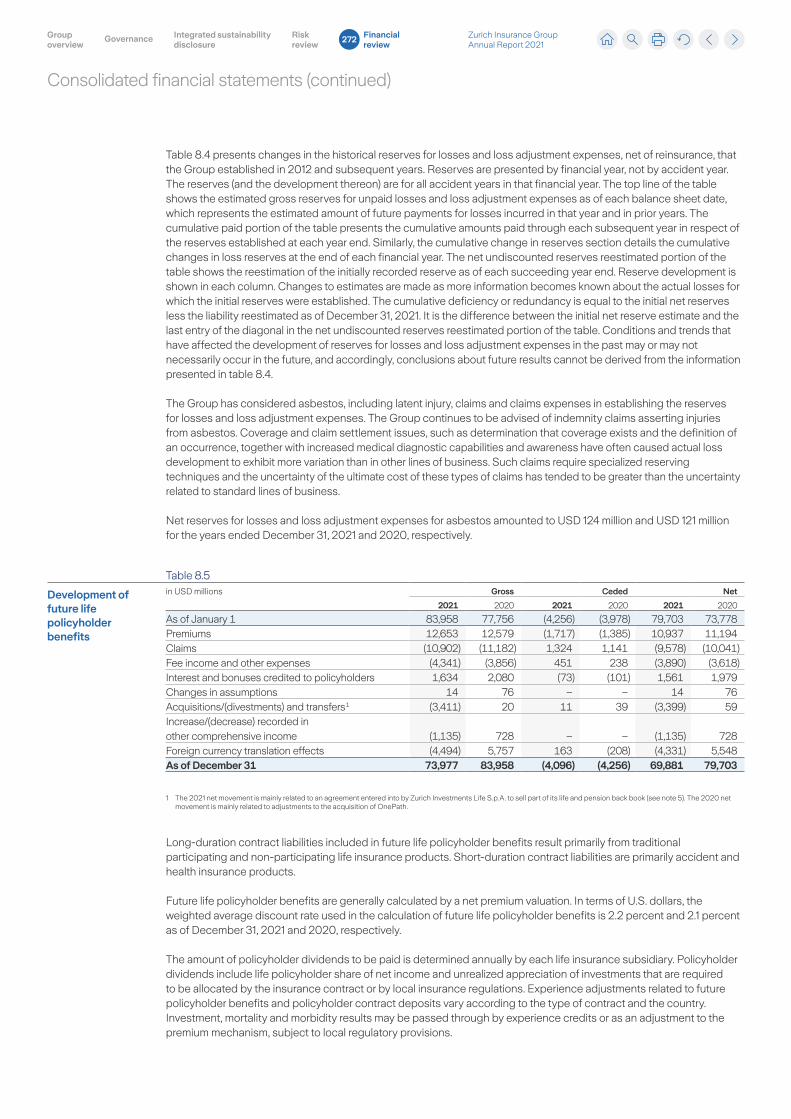
Consolidated financial statements (continued)
Table 8.4 presents changes in the historical reserves for losses and loss adjustment expenses, net of reinsurance, that the Group established in 2012 and subsequent years. Reserves are presented by financial year, not by accident year. The reserves (and the development thereon) are for all accident years in that financial year. The top line of the table shows the estimated gross reserves for unpaid losses and loss adjustment expenses as of each balance sheet date, which represents the estimated amount of future payments for losses incurred in that year and in prior years. The cumulative paid portion of the table presents the cumulative amounts paid through each subsequent year in respect of the reserves established at each year end. Similarly, the cumulative change in reserves section details the cumulative changes in loss reserves at the end of each financial year. The net undiscounted reserves reestimated portion of the table shows the reestimation of the initially recorded reserve as of each succeeding year end. Reserve development is shown in each column. Changes to estimates are made as more information becomes known about the actual losses for which the initial reserves were established. The cumulative deficiency or redundancy is equal to the initial net reserves less the liability reestimated as of December 31, 2021. It is the difference between the initial net reserve estimate and the last entry of the diagonal in the net undiscounted reserves reestimated portion of the table. Conditions and trends that have affected the development of reserves for losses and loss adjustment expenses in the past may or may not necessarily occur in the future, and accordingly, conclusions about future results cannot be derived from the information presented in table 8.4.
The Group has considered asbestos, including latent injury, claims and claims expenses in establishing the reserves for losses and loss adjustment expenses. The Group continues to be advised of indemnity claims asserting injuries from asbestos. Coverage and claim settlement issues, such as determination that coverage exists and the definition of an occurrence, together with increased medical diagnostic capabilities and awareness have often caused actual loss development to exhibit more variation than in other lines of business. Such claims require specialized reserving techniques and the uncertainty of the ultimate cost of these types of claims has tended to be greater than the uncertainty related to standard lines of business.
Net reserves for losses and loss adjustment expenses for asbestos amounted to USD 124 million and USD 121 million for the years ended December 31, 2021 and 2020, respectively.
Table 8.5
Development of future life policyholder benefits
in USD millions Gross Ceded Net
2021 2020 2021 2020 2021 2020
As of January 1 83,958 77,756 (4,256) (3,978) 79,703 73,778Premiums 12,653 12,579 (1,717) (1,385) 10,937 11,194Claims (10,902) (11,182) 1,324 1,141 (9,578) (10,041)Fee income and other expenses (4,341) (3,856) 451 238 (3,890) (3,618)Interest and bonuses credited to policyholders 1,634 2,080 (73) (101) 1,561 1,979Changes in assumptions 14 76 – – 14 76Acquisitions/(divestments) and transfers 1 (3,411) 20 11 39 (3,399) 59Increase/(decrease) recorded in other comprehensive income (1,135) 728 – – (1,135) 728Foreign currency translation effects (4,494) 5,757 163 (208) (4,331) 5,548As of December 31 73,977 83,958 (4,096) (4,256) 69,881 79,703
1 The 2021 net movement is mainly related to an agreement entered into by Zurich Investments Life S.p.A. to sell part of its life and pension back book (see note 5). The 2020 net movement is mainly related to adjustments to the acquisition of OnePath.
Long-duration contract liabilities included in future life policyholder benefits result primarily from traditional participating and non-participating life insurance products. Short-duration contract liabilities are primarily accident and health insurance products.
Future life policyholder benefits are generally calculated by a net premium valuation. In terms of U.S. dollars, the weighted average discount rate used in the calculation of future life policyholder benefits is 2.2 percent and 2.1 percent as of December 31, 2021 and 2020, respectively.
The amount of policyholder dividends to be paid is determined annually by each life insurance subsidiary. Policyholder dividends include life policyholder share of net income and unrealized appreciation of investments that are required to be allocated by the insurance contract or by local insurance regulations. Experience adjustments related to future policyholder benefits and policyholder contract deposits vary according to the type of contract and the country. Investment, mortality and morbidity results may be passed through by experience credits or as an adjustment to the premium mechanism, subject to local regulatory provisions.
Zurich Insurance Group Annual Report 2021
Group overview
Integrated sustainability disclosure
Governance Risk review
Financial review
272
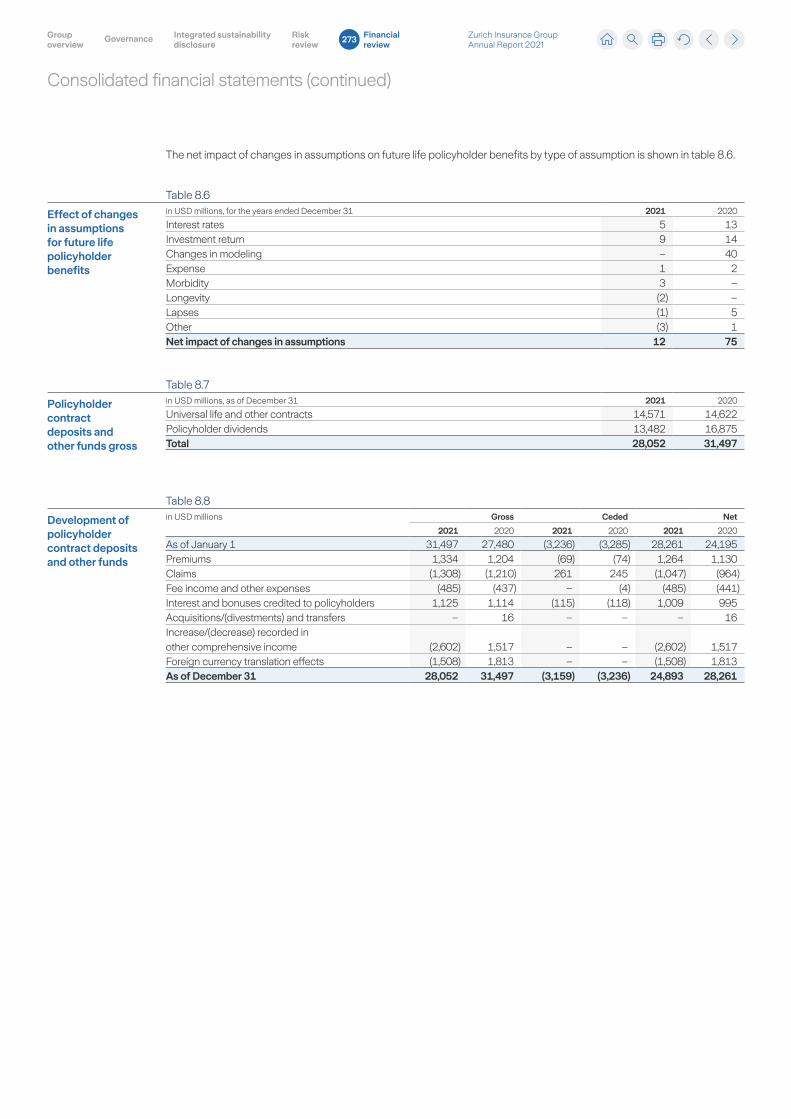
Consolidated financial statements (continued)
The net impact of changes in assumptions on future life policyholder benefits by type of assumption is shown in table 8.6.
Table 8.6
Effect of changes in assumptions for future life policyholder benefits
in USD millions, for the years ended December 31 2021 2020
Interest rates 5 13Investment return 9 14Changes in modeling – 40Expense 1 2Morbidity 3 –Longevity (2) –Lapses (1) 5Other (3) 1Net impact of changes in assumptions 12 75
Table 8.7
Policyholder contract deposits and other funds gross
in USD millions, as of December 31 2021 2020
Universal life and other contracts 14,571 14,622Policyholder dividends 13,482 16,875Total 28,052 31,497
Table 8.8
Development of policyholder contract deposits and other funds
in USD millions Gross Ceded Net
2021 2020 2021 2020 2021 2020
As of January 1 31,497 27,480 (3,236) (3,285) 28,261 24,195Premiums 1,334 1,204 (69) (74) 1,264 1,130Claims (1,308) (1,210) 261 245 (1,047) (964)Fee income and other expenses (485) (437) – (4) (485) (441)Interest and bonuses credited to policyholders 1,125 1,114 (115) (118) 1,009 995Acquisitions/(divestments) and transfers – 16 – – – 16Increase/(decrease) recorded in other comprehensive income (2,602) 1,517 – – (2,602) 1,517Foreign currency translation effects (1,508) 1,813 – – (1,508) 1,813As of December 31 28,052 31,497 (3,159) (3,236) 24,893 28,261
Zurich Insurance Group Annual Report 2021
Group overview
Integrated sustainability disclosure
Governance Risk review
Financial review
273
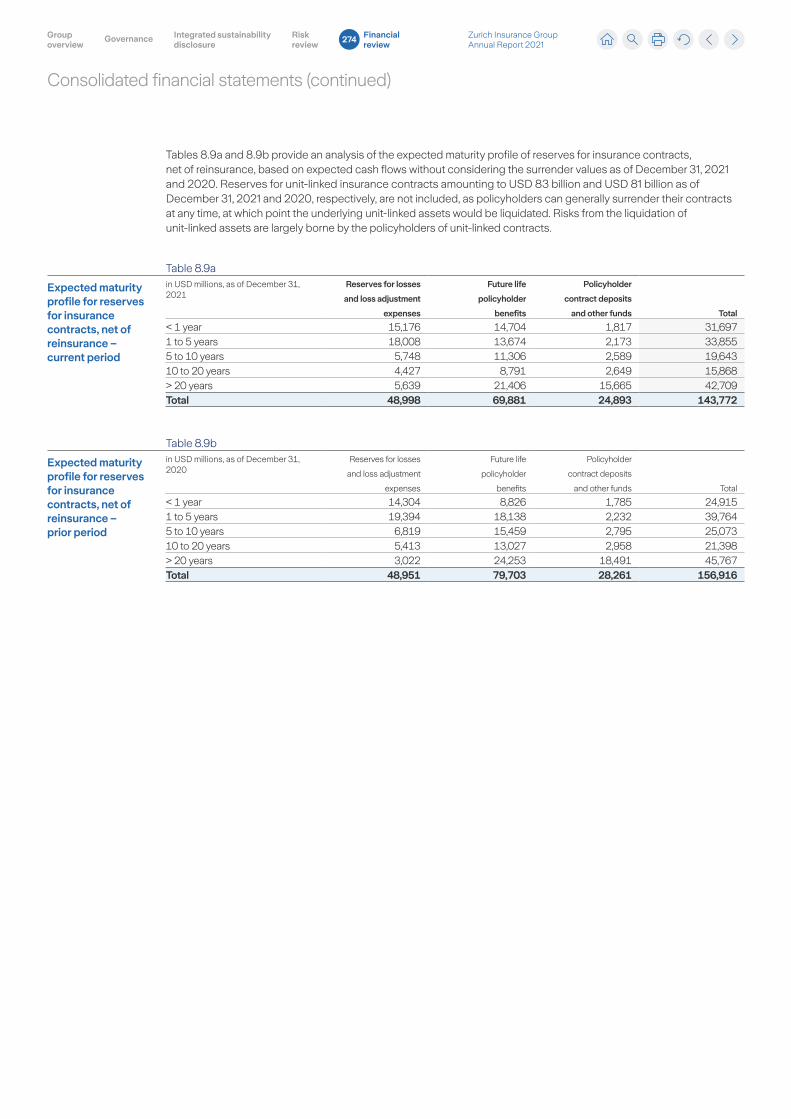
Consolidated financial statements (continued)
Tables 8.9a and 8.9b provide an analysis of the expected maturity profile of reserves for insurance contracts, net of reinsurance, based on expected cash flows without considering the surrender values as of December 31, 2021 and 2020. Reserves for unit-linked insurance contracts amounting to USD 83 billion and USD 81 billion as of December 31, 2021 and 2020, respectively, are not included, as policyholders can generally surrender their contracts at any time, at which point the underlying unit-linked assets would be liquidated. Risks from the liquidation of unit-linked assets are largely borne by the policyholders of unit-linked contracts.
Table 8.9a
Expected maturity profile for reserves for insurance contracts, net of reinsurance – current period
in USD millions, as of December 31, 2021
Reserves for losses
and loss adjustment
expenses
Future life
policyholder
benefits
Policyholder
contract deposits
and other funds Total
< 1 year 15,176 14,704 1,817 31,6971 to 5 years 18,008 13,674 2,173 33,8555 to 10 years 5,748 11,306 2,589 19,64310 to 20 years 4,427 8,791 2,649 15,868> 20 years 5,639 21,406 15,665 42,709Total 48,998 69,881 24,893 143,772
Table 8.9b
Expected maturity profile for reserves for insurance contracts, net of reinsurance – prior period
in USD millions, as of December 31, 2020
Reserves for losses
and loss adjustment
expenses
Future life
policyholder
benefits
Policyholder
contract deposits
and other funds Total
< 1 year 14,304 8,826 1,785 24,9151 to 5 years 19,394 18,138 2,232 39,7645 to 10 years 6,819 15,459 2,795 25,07310 to 20 years 5,413 13,027 2,958 21,398> 20 years 3,022 24,253 18,491 45,767Total 48,951 79,703 28,261 156,916
Zurich Insurance Group Annual Report 2021
Group overview
Integrated sustainability disclosure
Governance Risk review
Financial review
274
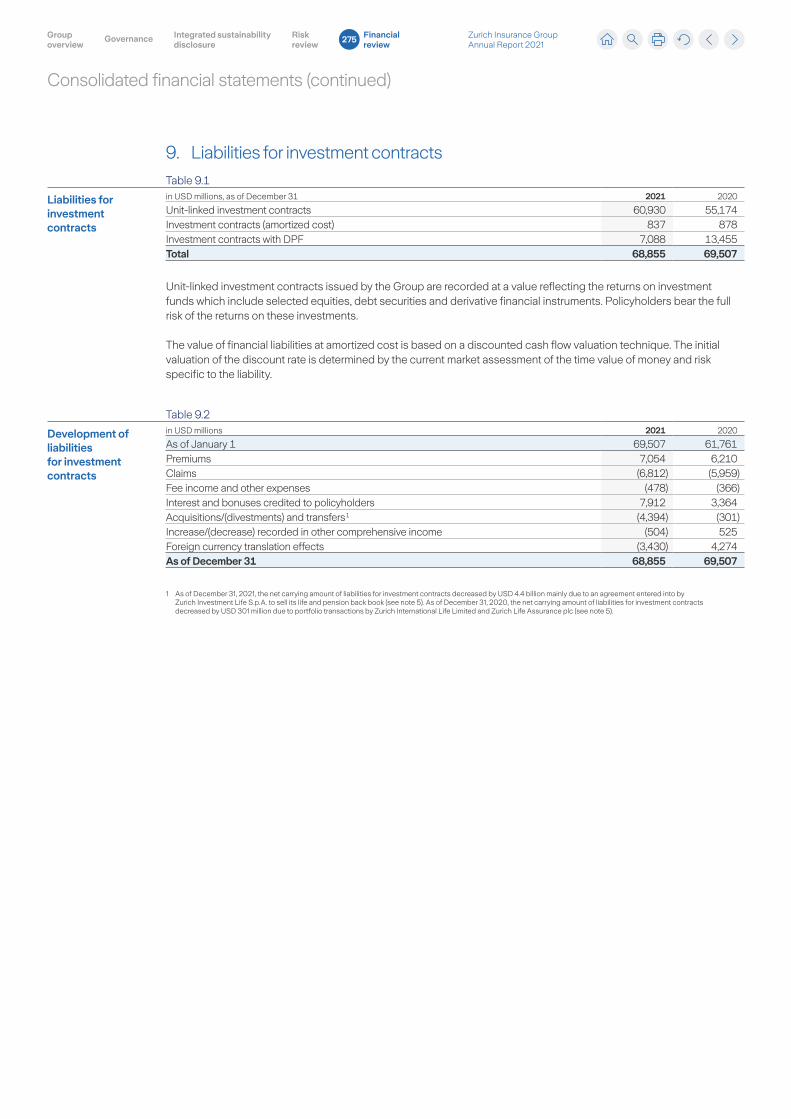
Consolidated financial statements (continued)
9. Liabilities for investment contracts
Table 9.1
Liabilities for investment contracts
in USD millions, as of December 31 2021 2020
Unit-linked investment contracts 60,930 55,174Investment contracts (amortized cost) 837 878Investment contracts with DPF 7,088 13,455Total 68,855 69,507
Unit-linked investment contracts issued by the Group are recorded at a value reflecting the returns on investment funds which include selected equities, debt securities and derivative financial instruments. Policyholders bear the full risk of the returns on these investments.
The value of financial liabilities at amortized cost is based on a discounted cash flow valuation technique. The initial valuation of the discount rate is determined by the current market assessment of the time value of money and risk specific to the liability.
Table 9.2
Development of liabilities for investment contracts
in USD millions 2021 2020
As of January 1 69,507 61,761Premiums 7,054 6,210Claims (6,812) (5,959)Fee income and other expenses (478) (366)Interest and bonuses credited to policyholders 7,912 3,364Acquisitions/(divestments) and transfers 1 (4,394) (301)Increase/(decrease) recorded in other comprehensive income (504) 525Foreign currency translation effects (3,430) 4,274As of December 31 68,855 69,507
1 As of December 31, 2021, the net carrying amount of liabilities for investment contracts decreased by USD 4.4 billion mainly due to an agreement entered into by Zurich Investment Life S.p.A. to sell its life and pension back book (see note 5). As of December 31, 2020, the net carrying amount of liabilities for investment contracts decreased by USD 301 million due to portfolio transactions by Zurich International Life Limited and Zurich Life Assurance plc (see note 5).
Zurich Insurance Group Annual Report 2021
Group overview
Integrated sustainability disclosure
Governance Risk review
Financial review
275
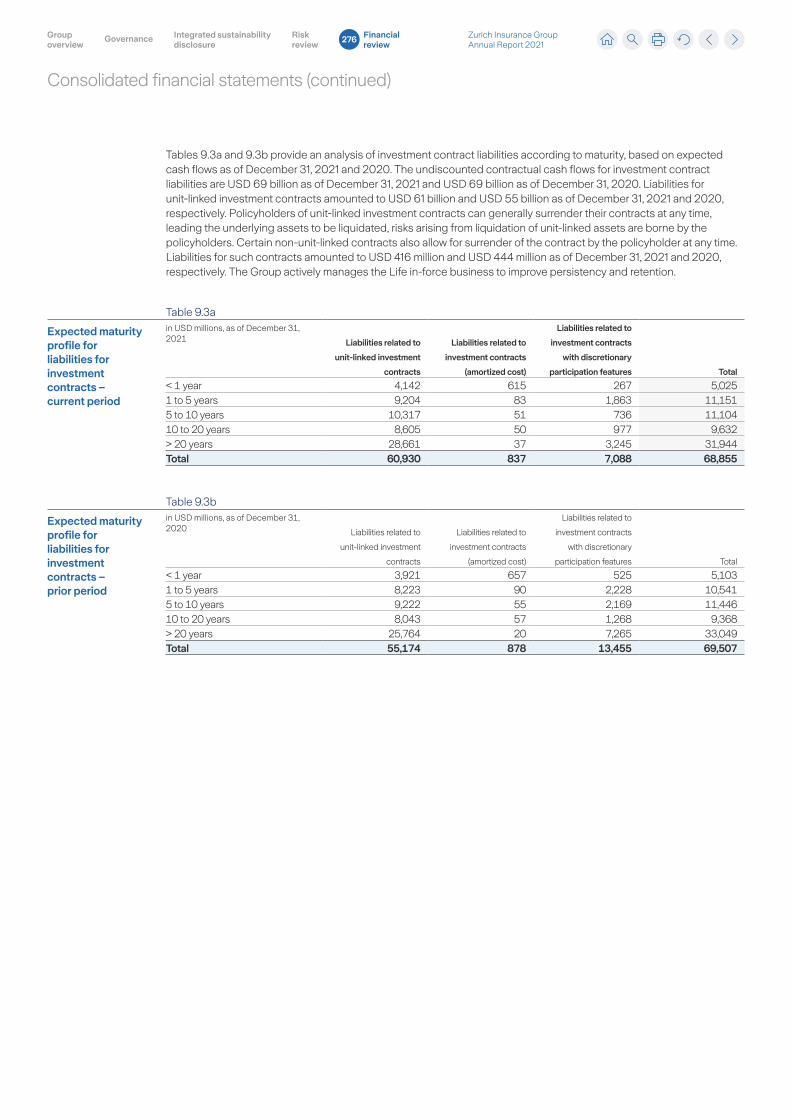
Consolidated financial statements (continued)
Tables 9.3a and 9.3b provide an analysis of investment contract liabilities according to maturity, based on expected cash flows as of December 31, 2021 and 2020. The undiscounted contractual cash flows for investment contract liabilities are USD 69 billion as of December 31, 2021 and USD 69 billion as of December 31, 2020. Liabilities for unit-linked investment contracts amounted to USD 61 billion and USD 55 billion as of December 31, 2021 and 2020, respectively. Policyholders of unit-linked investment contracts can generally surrender their contracts at any time, leading the underlying assets to be liquidated, risks arising from liquidation of unit-linked assets are borne by the policyholders. Certain non-unit-linked contracts also allow for surrender of the contract by the policyholder at any time. Liabilities for such contracts amounted to USD 416 million and USD 444 million as of December 31, 2021 and 2020, respectively. The Group actively manages the Life in-force business to improve persistency and retention.
Table 9.3a
Expected maturity profile for liabilities for investment contracts – current period
in USD millions, as of December 31, 2021 Liabilities related to
unit-linked investment
contracts
Liabilities related to
investment contracts
(amortized cost)
Liabilities related to
investment contracts
with discretionary
participation features Total
< 1 year 4,142 615 267 5,0251 to 5 years 9,204 83 1,863 11,1515 to 10 years 10,317 51 736 11,10410 to 20 years 8,605 50 977 9,632> 20 years 28,661 37 3,245 31,944Total 60,930 837 7,088 68,855
Table 9.3b
Expected maturity profile for liabilities for investment contracts – prior period
in USD millions, as of December 31, 2020 Liabilities related to
unit-linked investment
contracts
Liabilities related to
investment contracts
(amortized cost)
Liabilities related to
investment contracts
with discretionary
participation features Total
< 1 year 3,921 657 525 5,1031 to 5 years 8,223 90 2,228 10,5415 to 10 years 9,222 55 2,169 11,44610 to 20 years 8,043 57 1,268 9,368> 20 years 25,764 20 7,265 33,049Total 55,174 878 13,455 69,507
Zurich Insurance Group Annual Report 2021
Group overview
Integrated sustainability disclosure
Governance Risk review
Financial review
276
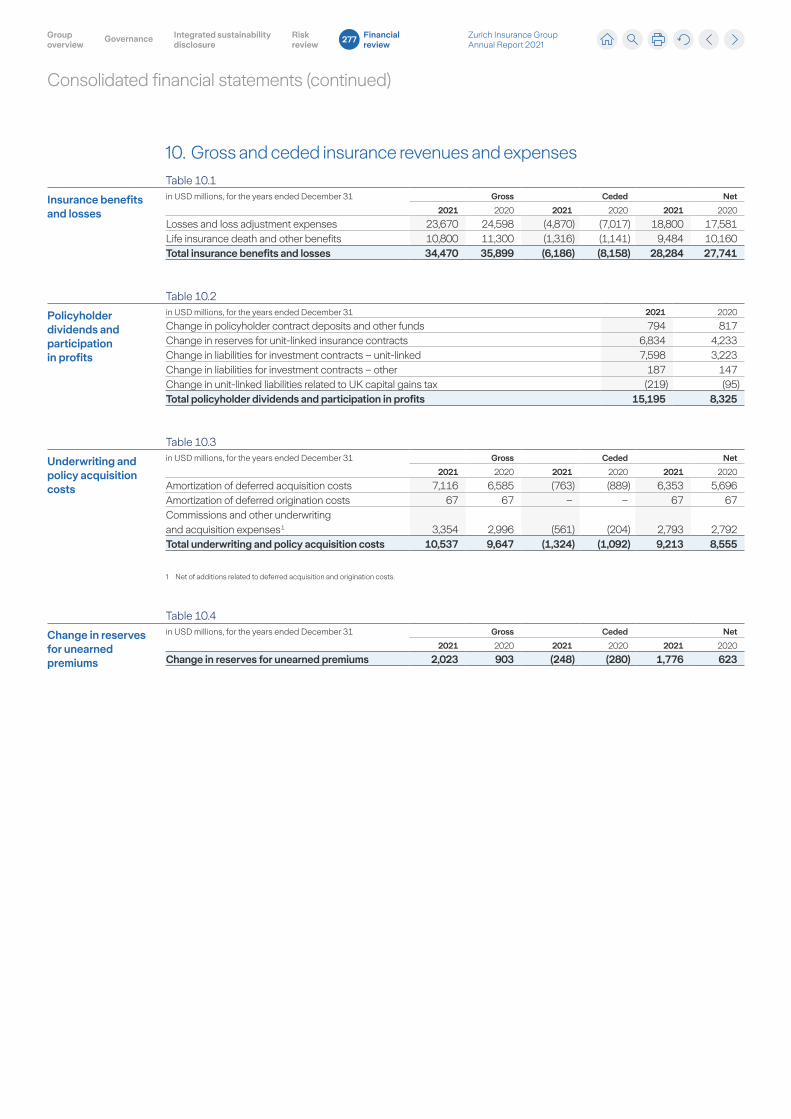
Consolidated financial statements (continued)
10. Gross and ceded insurance revenues and expenses
Table 10.1
Insurance benefits and losses
in USD millions, for the years ended December 31 Gross Ceded Net
2021 2020 2021 2020 2021 2020
Losses and loss adjustment expenses 23,670 24,598 (4,870) (7,017) 18,800 17,581Life insurance death and other benefits 10,800 11,300 (1,316) (1,141) 9,484 10,160Total insurance benefits and losses 34,470 35,899 (6,186) (8,158) 28,284 27,741
Table 10.2
Policyholder dividends and participation in profits
in USD millions, for the years ended December 31 2021 2020
Change in policyholder contract deposits and other funds 794 817Change in reserves for unit-linked insurance contracts 6,834 4,233Change in liabilities for investment contracts – unit-linked 7,598 3,223Change in liabilities for investment contracts – other 187 147Change in unit-linked liabilities related to UK capital gains tax (219) (95)Total policyholder dividends and participation in profits 15,195 8,325
Table 10.3
Underwriting and policy acquisition costs
in USD millions, for the years ended December 31 Gross Ceded Net
2021 2020 2021 2020 2021 2020
Amortization of deferred acquisition costs 7,116 6,585 (763) (889) 6,353 5,696Amortization of deferred origination costs 67 67 – – 67 67Commissions and other underwriting and acquisition expenses 1 3,354 2,996 (561) (204) 2,793 2,792Total underwriting and policy acquisition costs 10,537 9,647 (1,324) (1,092) 9,213 8,555
1 Net of additions related to deferred acquisition and origination costs.
Table 10.4
Change in reserves for unearned premiums
in USD millions, for the years ended December 31 Gross Ceded Net
2021 2020 2021 2020 2021 2020
Change in reserves for unearned premiums 2,023 903 (248) (280) 1,776 623
Zurich Insurance Group Annual Report 2021
Group overview
Integrated sustainability disclosure
Governance Risk review
Financial review
277
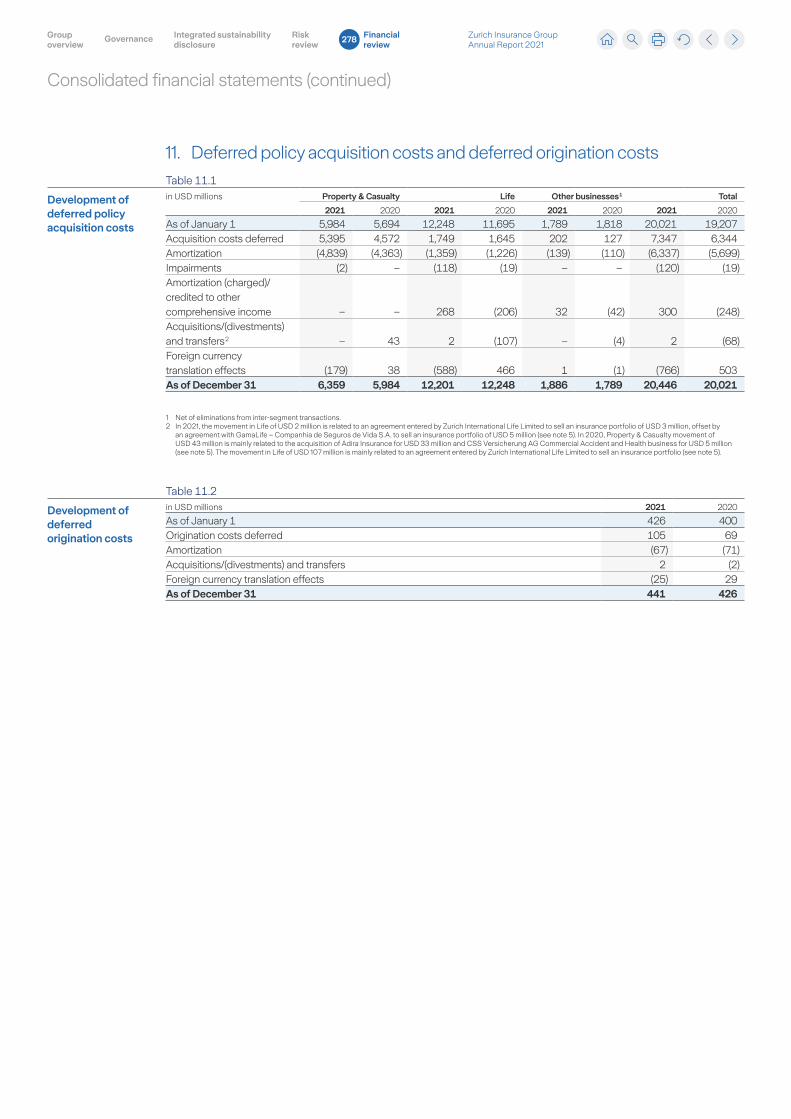
Consolidated financial statements (continued)
11. Deferred policy acquisition costs and deferred origination costs
Table 11.1
Development of deferred policy acquisition costs
in USD millions Property & Casualty Life Other businesses 1 Total
2021 2020 2021 2020 2021 2020 2021 2020
As of January 1 5,984 5,694 12,248 11,695 1,789 1,818 20,021 19,207Acquisition costs deferred 5,395 4,572 1,749 1,645 202 127 7,347 6,344Amortization (4,839) (4,363) (1,359) (1,226) (139) (110) (6,337) (5,699)Impairments (2) – (118) (19) – – (120) (19)Amortization (charged)/ credited to other comprehensive income – – 268 (206) 32 (42) 300 (248)Acquisitions/(divestments) and transfers 2 – 43 2 (107) – (4) 2 (68)Foreign currency translation effects (179) 38 (588) 466 1 (1) (766) 503As of December 31 6,359 5,984 12,201 12,248 1,886 1,789 20,446 20,021
1 Net of eliminations from inter-segment transactions.2 In 2021, the movement in Life of USD 2 million is related to an agreement entered by Zurich International Life Limited to sell an insurance portfolio of USD 3 million, offset by
an agreement with GamaLife – Companhia de Seguros de Vida S.A. to sell an insurance portfolio of USD 5 million (see note 5). In 2020, Property & Casualty movement of USD 43 million is mainly related to the acquisition of Adira Insurance for USD 33 million and CSS Versicherung AG Commercial Accident and Health business for USD 5 million (see note 5). The movement in Life of USD 107 million is mainly related to an agreement entered by Zurich International Life Limited to sell an insurance portfolio (see note 5).
Table 11.2
Development of deferred origination costs
in USD millions 2021 2020
As of January 1 426 400Origination costs deferred 105 69Amortization (67) (71)Acquisitions/(divestments) and transfers 2 (2)Foreign currency translation effects (25) 29As of December 31 441 426
Zurich Insurance Group Annual Report 2021
Group overview
Integrated sustainability disclosure
Governance Risk review
Financial review
278
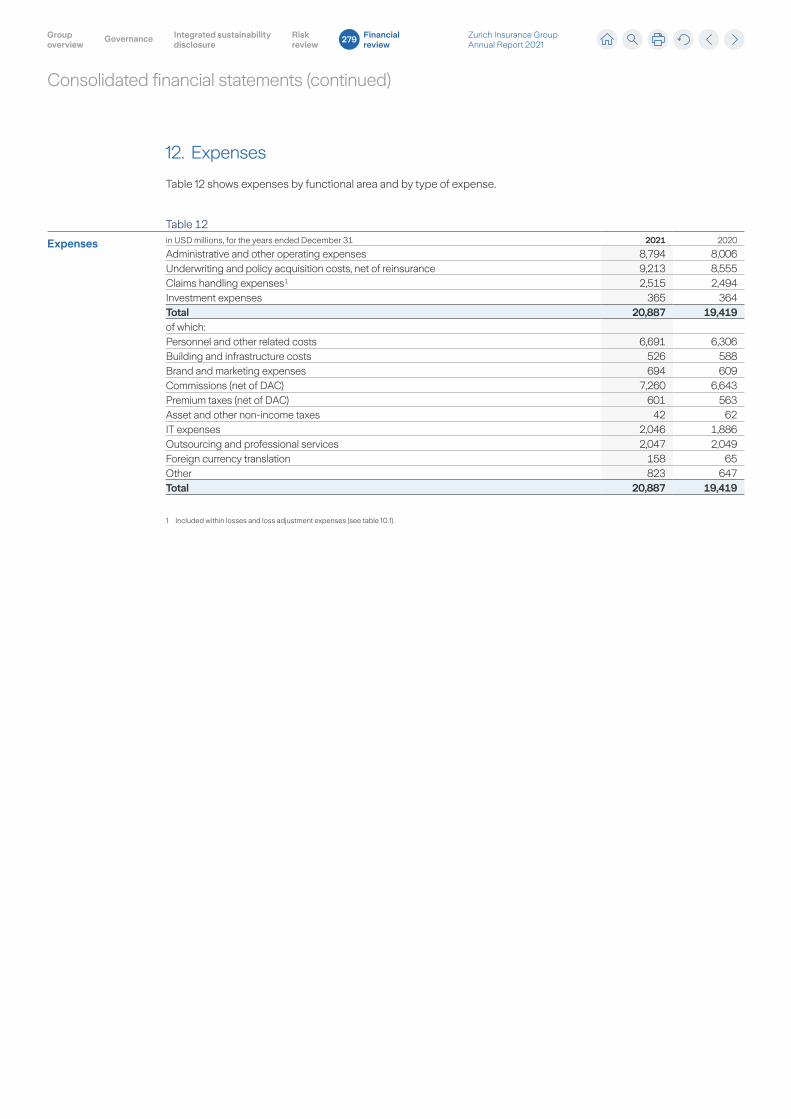
Consolidated financial statements (continued)
12. Expenses
Table 12 shows expenses by functional area and by type of expense.
Table 12
Expenses in USD millions, for the years ended December 31 2021 2020
Administrative and other operating expenses 8,794 8,006Underwriting and policy acquisition costs, net of reinsurance 9,213 8,555Claims handling expenses 1 2,515 2,494Investment expenses 365 364Total 20,887 19,419of which:Personnel and other related costs 6,691 6,306Building and infrastructure costs 526 588Brand and marketing expenses 694 609Commissions (net of DAC) 7,260 6,643Premium taxes (net of DAC) 601 563Asset and other non-income taxes 42 62IT expenses 2,046 1,886Outsourcing and professional services 2,047 2,049Foreign currency translation 158 65Other 823 647Total 20,887 19,419
1 Included within losses and loss adjustment expenses (see table 10.1).
Zurich Insurance Group Annual Report 2021
Group overview
Integrated sustainability disclosure
Governance Risk review
Financial review
279
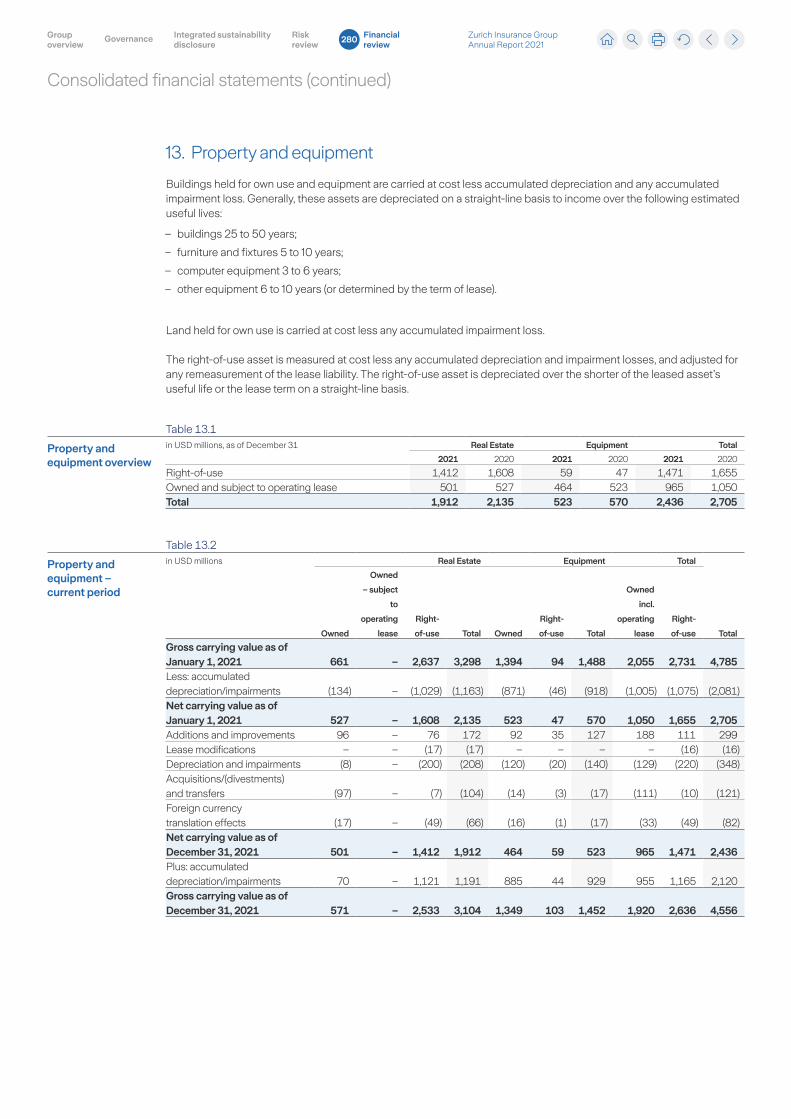
Consolidated financial statements (continued)
13. Property and equipment
Buildings held for own use and equipment are carried at cost less accumulated depreciation and any accumulated impairment loss. Generally, these assets are depreciated on a straight-line basis to income over the following estimated useful lives:
– buildings 25 to 50 years;
– furniture and fixtures 5 to 10 years;
– computer equipment 3 to 6 years;
– other equipment 6 to 10 years (or determined by the term of lease).
Land held for own use is carried at cost less any accumulated impairment loss.
The right-of-use asset is measured at cost less any accumulated depreciation and impairment losses, and adjusted for any remeasurement of the lease liability. The right-of-use asset is depreciated over the shorter of the leased asset’s useful life or the lease term on a straight-line basis.
Table 13.1
Property and equipment overview
in USD millions, as of December 31 Real Estate Equipment Total
2021 2020 2021 2020 2021 2020
Right-of-use 1,412 1,608 59 47 1,471 1,655Owned and subject to operating lease 501 527 464 523 965 1,050Total 1,912 2,135 523 570 2,436 2,705
Table 13.2
Property and equipment – current period
in USD millions Real Estate Equipment Total
TotalOwned
Owned
– subject
to
operating
lease
Right-
of-use Total Owned
Right-
of-use Total
Owned
incl.
operating
lease
Right-
of-use
Gross carrying value as of January 1, 2021 661 – 2,637 3,298 1,394 94 1,488 2,055 2,731 4,785Less: accumulated depreciation/impairments (134) – (1,029) (1,163) (871) (46) (918) (1,005) (1,075) (2,081)Net carrying value as of January 1, 2021 527 – 1,608 2,135 523 47 570 1,050 1,655 2,705Additions and improvements 96 – 76 172 92 35 127 188 111 299Lease modifications – – (17) (17) – – – – (16) (16)Depreciation and impairments (8) – (200) (208) (120) (20) (140) (129) (220) (348)Acquisitions/(divestments) and transfers (97) – (7) (104) (14) (3) (17) (111) (10) (121)Foreign currency translation effects (17) – (49) (66) (16) (1) (17) (33) (49) (82)Net carrying value as of December 31, 2021 501 – 1,412 1,912 464 59 523 965 1,471 2,436Plus: accumulated depreciation/impairments 70 – 1,121 1,191 885 44 929 955 1,165 2,120Gross carrying value as of December 31, 2021 571 – 2,533 3,104 1,349 103 1,452 1,920 2,636 4,556
Zurich Insurance Group Annual Report 2021
Group overview
Integrated sustainability disclosure
Governance Risk review
Financial review
280
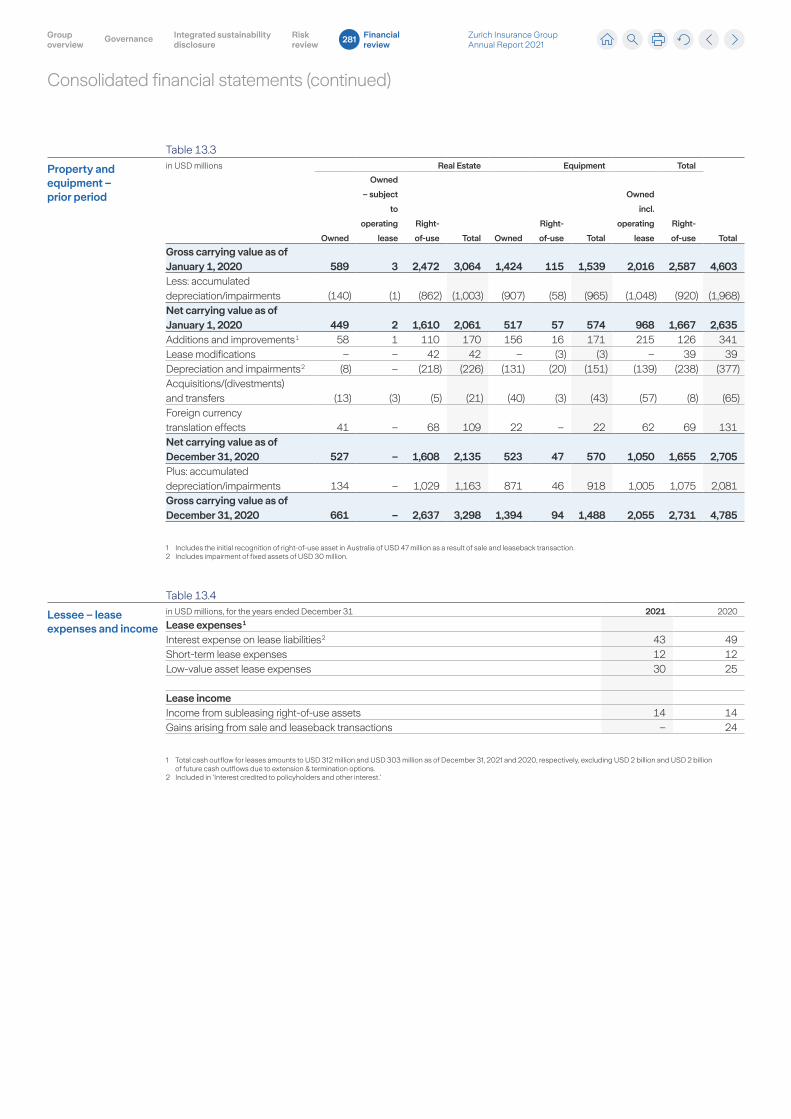
Consolidated financial statements (continued)
Table 13.3
Property and equipment – prior period
in USD millions Real Estate Equipment Total
TotalOwned
Owned
– subject
to
operating
lease
Right-
of-use Total Owned
Right-
of-use Total
Owned
incl.
operating
lease
Right-
of-use
Gross carrying value as of January 1, 2020 589 3 2,472 3,064 1,424 115 1,539 2,016 2,587 4,603Less: accumulated depreciation/impairments (140) (1) (862) (1,003) (907) (58) (965) (1,048) (920) (1,968)Net carrying value as of January 1, 2020 449 2 1,610 2,061 517 57 574 968 1,667 2,635Additions and improvements 1 58 1 110 170 156 16 171 215 126 341Lease modifications – – 42 42 – (3) (3) – 39 39Depreciation and impairments 2 (8) – (218) (226) (131) (20) (151) (139) (238) (377)Acquisitions/(divestments) and transfers (13) (3) (5) (21) (40) (3) (43) (57) (8) (65)Foreign currency translation effects 41 – 68 109 22 – 22 62 69 131Net carrying value as of December 31, 2020 527 – 1,608 2,135 523 47 570 1,050 1,655 2,705Plus: accumulated depreciation/impairments 134 – 1,029 1,163 871 46 918 1,005 1,075 2,081Gross carrying value as of December 31, 2020 661 – 2,637 3,298 1,394 94 1,488 2,055 2,731 4,785
1 Includes the initial recognition of right-of-use asset in Australia of USD 47 million as a result of sale and leaseback transaction.2 Includes impairment of fixed assets of USD 30 million.
Table 13.4
Lessee – lease expenses and income
in USD millions, for the years ended December 31 2021 2020
Lease expenses 1
Interest expense on lease liabilities 2 43 49Short-term lease expenses 12 12Low-value asset lease expenses 30 25
Lease incomeIncome from subleasing right-of-use assets 14 14Gains arising from sale and leaseback transactions – 24
1 Total cash outflow for leases amounts to USD 312 million and USD 303 million as of December 31, 2021 and 2020, respectively, excluding USD 2 billion and USD 2 billion of future cash outflows due to extension & termination options.
2 Included in ‘Interest credited to policyholders and other interest.’
Zurich Insurance Group Annual Report 2021
Group overview
Integrated sustainability disclosure
Governance Risk review
Financial review
281
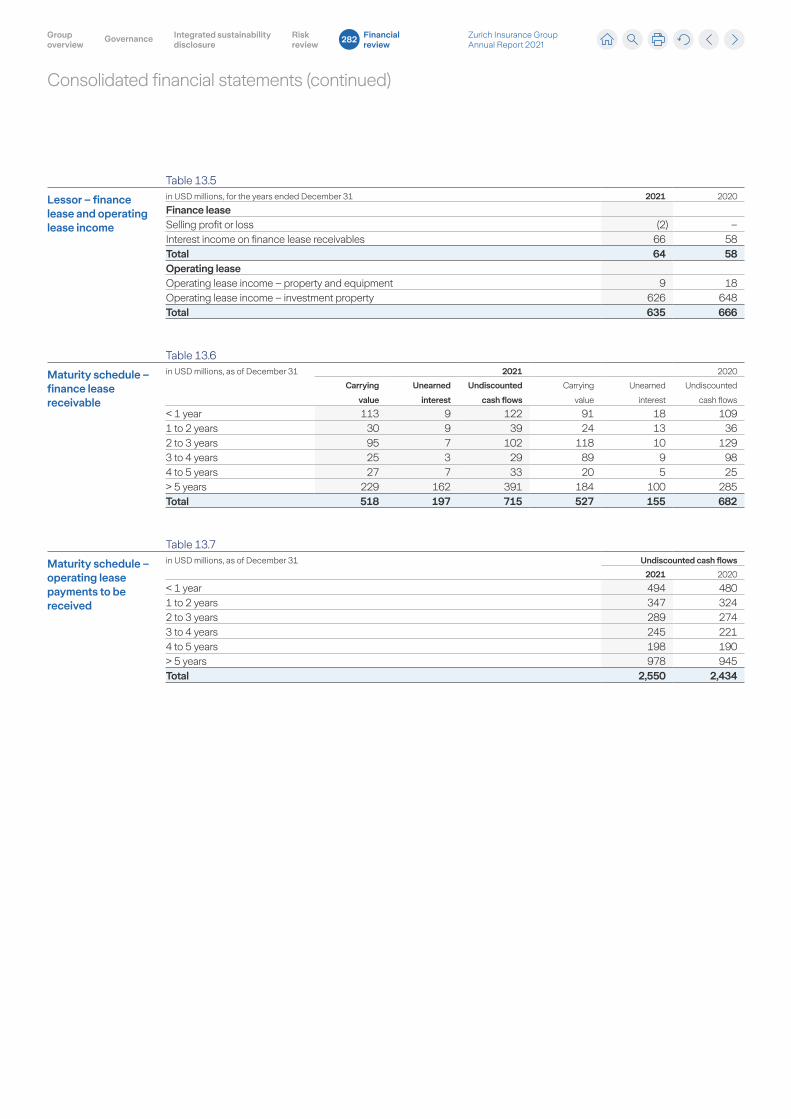
Consolidated financial statements (continued)
Table 13.5
Lessor – finance lease and operating lease income
in USD millions, for the years ended December 31 2021 2020
Finance leaseSelling profit or loss (2) –Interest income on finance lease receivables 66 58Total 64 58Operating leaseOperating lease income – property and equipment 9 18Operating lease income – investment property 626 648Total 635 666
Table 13.6
Maturity schedule – finance lease receivable
in USD millions, as of December 31 2021 2020
Carrying
value
Unearned
interest
Undiscounted
cash flows
Carrying
value
Unearned
interest
Undiscounted
cash flows
< 1 year 113 9 122 91 18 1091 to 2 years 30 9 39 24 13 362 to 3 years 95 7 102 118 10 1293 to 4 years 25 3 29 89 9 984 to 5 years 27 7 33 20 5 25> 5 years 229 162 391 184 100 285Total 518 197 715 527 155 682
Table 13.7
Maturity schedule – operating lease payments to be received
in USD millions, as of December 31 Undiscounted cash flows
2021 2020
< 1 year 494 4801 to 2 years 347 3242 to 3 years 289 2743 to 4 years 245 2214 to 5 years 198 190> 5 years 978 945Total 2,550 2,434
Zurich Insurance Group Annual Report 2021
Group overview
Integrated sustainability disclosure
Governance Risk review
Financial review
282
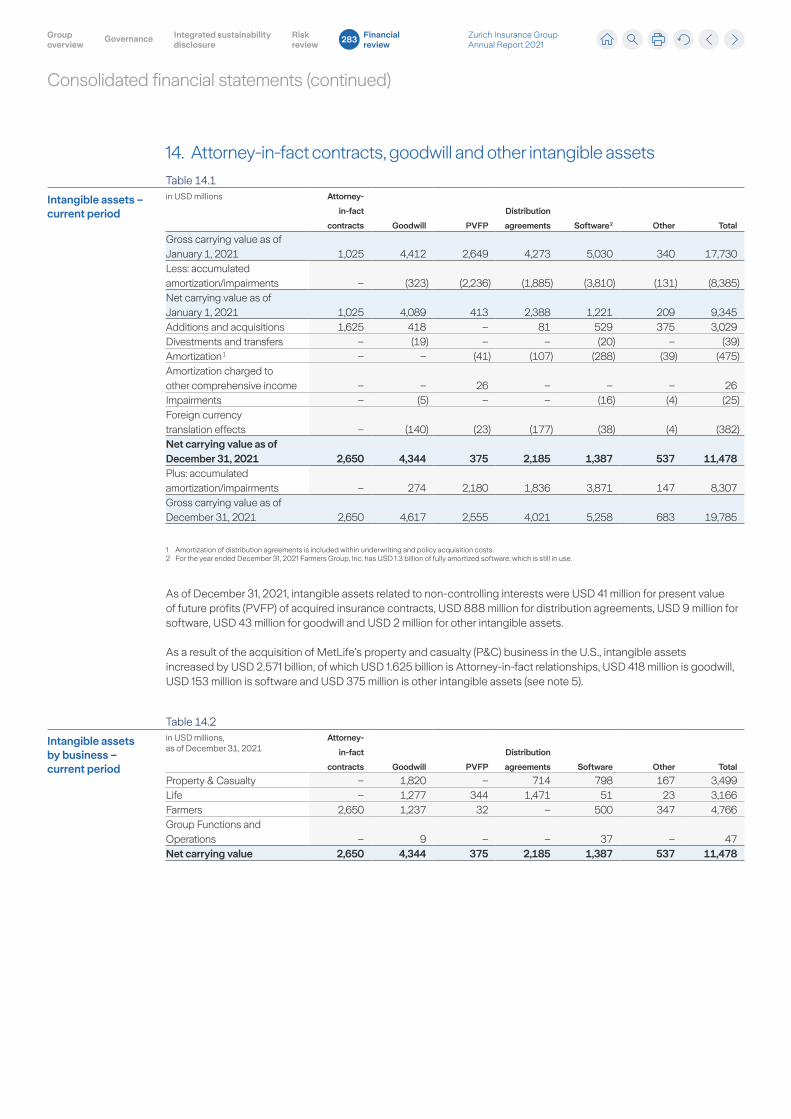
Consolidated financial statements (continued)
14. Attorney-in-fact contracts, goodwill and other intangible assets
Table 14.1
Intangible assets – current period
in USD millions Attorney-
in-fact
contracts Goodwill PVFP
Distribution
agreements Software 2 Other Total
Gross carrying value as of January 1, 2021 1,025 4,412 2,649 4,273 5,030 340 17,730Less: accumulated amortization/impairments – (323) (2,236) (1,885) (3,810) (131) (8,385)Net carrying value as of January 1, 2021 1,025 4,089 413 2,388 1,221 209 9,345Additions and acquisitions 1,625 418 – 81 529 375 3,029Divestments and transfers – (19) – – (20) – (39)Amortization 1 – – (41) (107) (288) (39) (475)Amortization charged to other comprehensive income – – 26 – – – 26Impairments – (5) – – (16) (4) (25)Foreign currency translation effects – (140) (23) (177) (38) (4) (382)Net carrying value as of December 31, 2021 2,650 4,344 375 2,185 1,387 537 11,478Plus: accumulated amortization/impairments – 274 2,180 1,836 3,871 147 8,307Gross carrying value as of December 31, 2021 2,650 4,617 2,555 4,021 5,258 683 19,785
1 Amortization of distribution agreements is included within underwriting and policy acquisition costs. 2 For the year ended December 31, 2021 Farmers Group, Inc. has USD 1.3 billion of fully amortized software, which is still in use.
As of December 31, 2021, intangible assets related to non-controlling interests were USD 41 million for present value of future profits (PVFP) of acquired insurance contracts, USD 888 million for distribution agreements, USD 9 million for software, USD 43 million for goodwill and USD 2 million for other intangible assets.
As a result of the acquisition of MetLife’s property and casualty (P&C) business in the U.S., intangible assets increased by USD 2.571 billion, of which USD 1.625 billion is Attorney-in-fact relationships, USD 418 million is goodwill, USD 153 million is software and USD 375 million is other intangible assets (see note 5).
Table 14.2
Intangible assets by business – current period
in USD millions, as of December 31, 2021
Attorney-
in-fact
contracts Goodwill PVFP
Distribution
agreements Software Other Total
Property & Casualty – 1,820 – 714 798 167 3,499Life – 1,277 344 1,471 51 23 3,166Farmers 2,650 1,237 32 – 500 347 4,766Group Functions and Operations – 9 – – 37 – 47Net carrying value 2,650 4,344 375 2,185 1,387 537 11,478
Zurich Insurance Group Annual Report 2021
Group overview
Integrated sustainability disclosure
Governance Risk review
Financial review
283
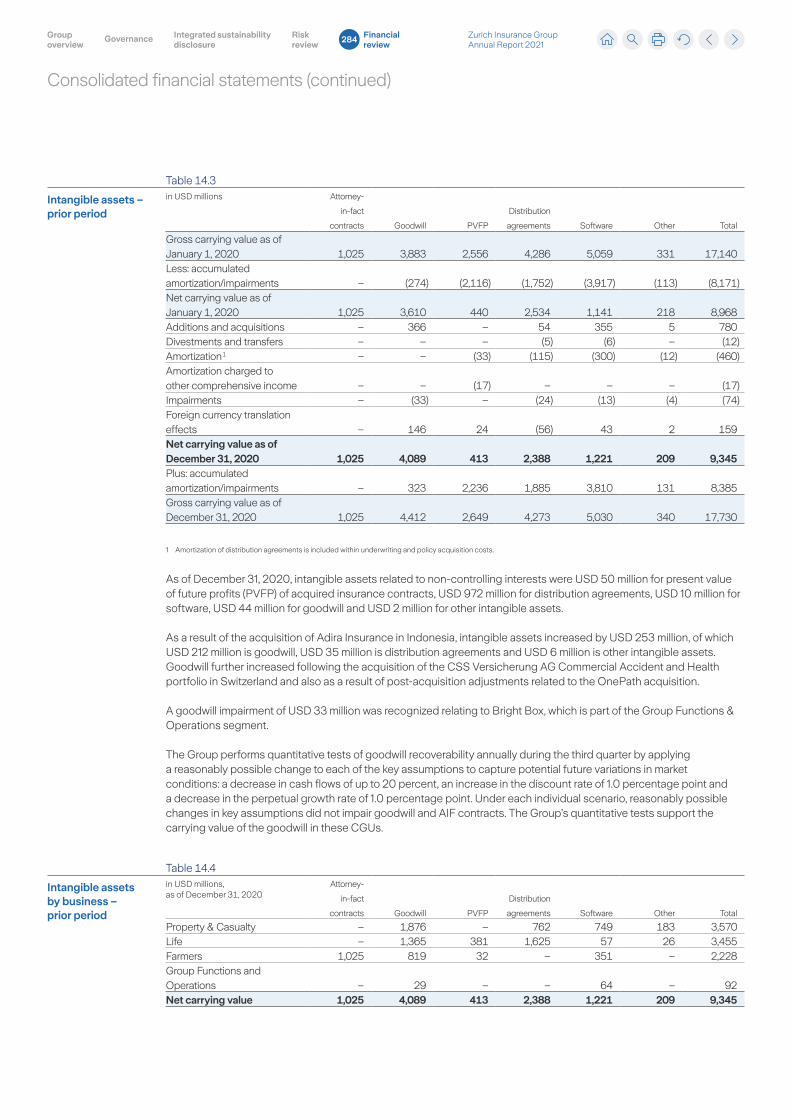
Consolidated financial statements (continued)
Table 14.3
Intangible assets – prior period
in USD millions Attorney-
in-fact
contracts Goodwill PVFP
Distribution
agreements Software Other Total
Gross carrying value as of January 1, 2020 1,025 3,883 2,556 4,286 5,059 331 17,140Less: accumulated amortization/impairments – (274) (2,116) (1,752) (3,917) (113) (8,171)Net carrying value as of January 1, 2020 1,025 3,610 440 2,534 1,141 218 8,968Additions and acquisitions – 366 – 54 355 5 780Divestments and transfers – – – (5) (6) – (12)Amortization 1 – – (33) (115) (300) (12) (460)Amortization charged to other comprehensive income – – (17) – – – (17)Impairments – (33) – (24) (13) (4) (74)Foreign currency translation effects – 146 24 (56) 43 2 159Net carrying value as of December 31, 2020 1,025 4,089 413 2,388 1,221 209 9,345Plus: accumulated amortization/impairments – 323 2,236 1,885 3,810 131 8,385Gross carrying value as of December 31, 2020 1,025 4,412 2,649 4,273 5,030 340 17,730
1 Amortization of distribution agreements is included within underwriting and policy acquisition costs.
As of December 31, 2020, intangible assets related to non-controlling interests were USD 50 million for present value of future profits (PVFP) of acquired insurance contracts, USD 972 million for distribution agreements, USD 10 million for software, USD 44 million for goodwill and USD 2 million for other intangible assets.
As a result of the acquisition of Adira Insurance in Indonesia, intangible assets increased by USD 253 million, of which USD 212 million is goodwill, USD 35 million is distribution agreements and USD 6 million is other intangible assets. Goodwill further increased following the acquisition of the CSS Versicherung AG Commercial Accident and Health portfolio in Switzerland and also as a result of post-acquisition adjustments related to the OnePath acquisition.
A goodwill impairment of USD 33 million was recognized relating to Bright Box, which is part of the Group Functions & Operations segment.
The Group performs quantitative tests of goodwill recoverability annually during the third quarter by applying a reasonably possible change to each of the key assumptions to capture potential future variations in market conditions: a decrease in cash flows of up to 20 percent, an increase in the discount rate of 1.0 percentage point and a decrease in the perpetual growth rate of 1.0 percentage point. Under each individual scenario, reasonably possible changes in key assumptions did not impair goodwill and AIF contracts. The Group’s quantitative tests support the carrying value of the goodwill in these CGUs.
Table 14.4
Intangible assets by business – prior period
in USD millions, as of December 31, 2020
Attorney-
in-fact
contracts Goodwill PVFP
Distribution
agreements Software Other Total
Property & Casualty – 1,876 – 762 749 183 3,570Life – 1,365 381 1,625 57 26 3,455Farmers 1,025 819 32 – 351 – 2,228Group Functions and Operations – 29 – – 64 – 92Net carrying value 1,025 4,089 413 2,388 1,221 209 9,345
Zurich Insurance Group Annual Report 2021
Group overview
Integrated sustainability disclosure
Governance Risk review
Financial review
284
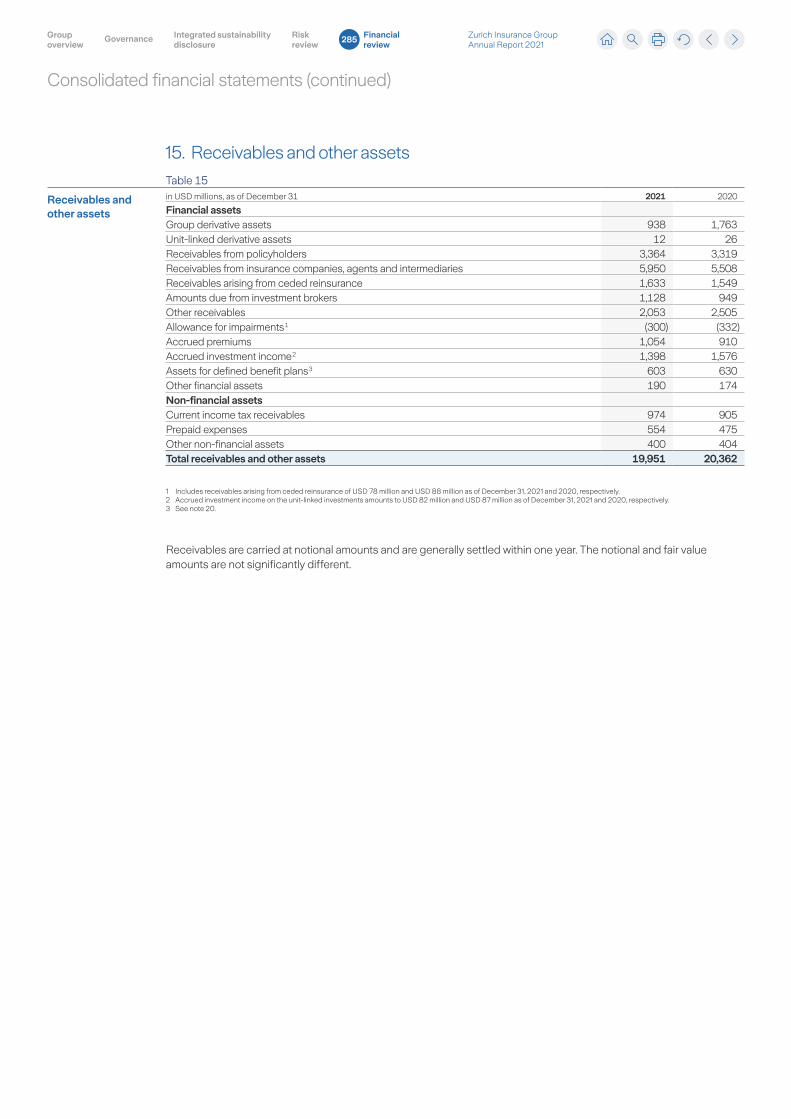
Consolidated financial statements (continued)
15. Receivables and other assets
Table 15
Receivables and other assets
in USD millions, as of December 31 2021 2020
Financial assetsGroup derivative assets 938 1,763Unit-linked derivative assets 12 26Receivables from policyholders 3,364 3,319Receivables from insurance companies, agents and intermediaries 5,950 5,508Receivables arising from ceded reinsurance 1,633 1,549Amounts due from investment brokers 1,128 949Other receivables 2,053 2,505Allowance for impairments 1 (300) (332)Accrued premiums 1,054 910Accrued investment income 2 1,398 1,576Assets for defined benefit plans 3 603 630Other financial assets 190 174Non-financial assetsCurrent income tax receivables 974 905Prepaid expenses 554 475Other non-financial assets 400 404Total receivables and other assets 19,951 20,362
1 Includes receivables arising from ceded reinsurance of USD 78 million and USD 88 million as of December 31, 2021 and 2020, respectively.2 Accrued investment income on the unit-linked investments amounts to USD 82 million and USD 87 million as of December 31, 2021 and 2020, respectively.3 See note 20.
Receivables are carried at notional amounts and are generally settled within one year. The notional and fair value amounts are not significantly different.
Zurich Insurance Group Annual Report 2021
Group overview
Integrated sustainability disclosure
Governance Risk review
Financial review
285
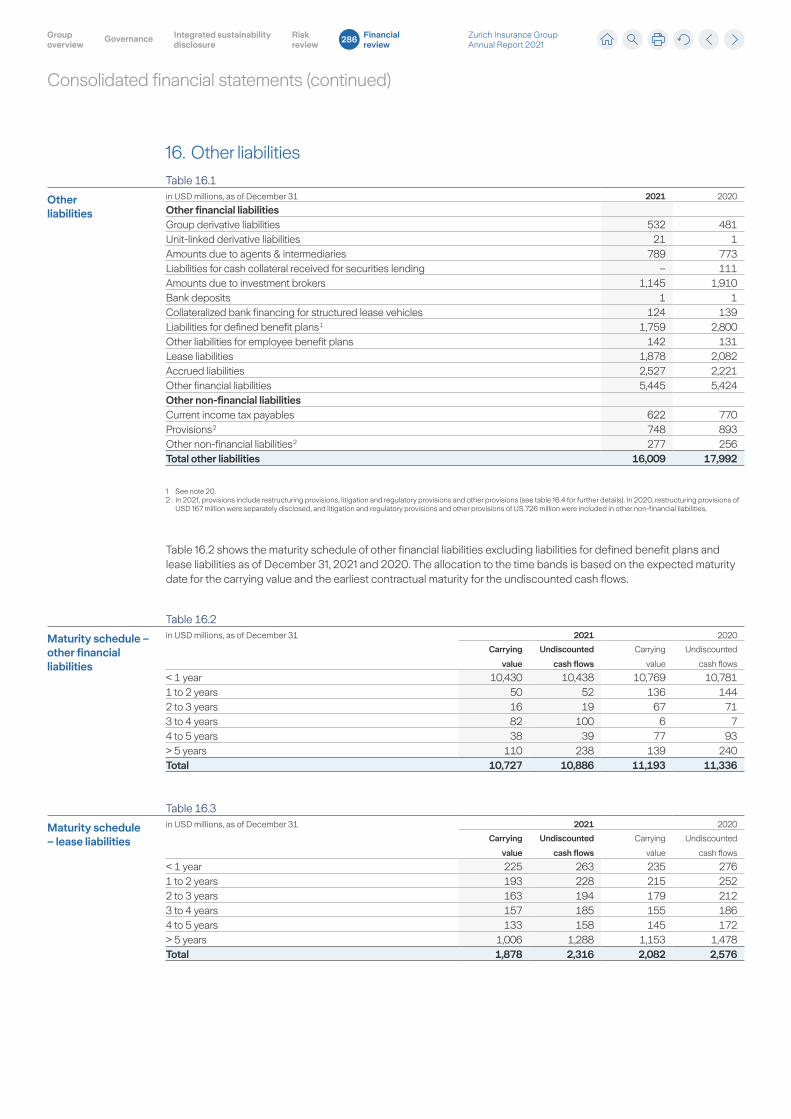
Consolidated financial statements (continued)
16. Other liabilities
Table 16.1
Other liabilities
in USD millions, as of December 31 2021 2020
Other financial liabilitiesGroup derivative liabilities 532 481Unit-linked derivative liabilities 21 1Amounts due to agents & intermediaries 789 773Liabilities for cash collateral received for securities lending – 111Amounts due to investment brokers 1,145 1,910Bank deposits 1 1Collateralized bank financing for structured lease vehicles 124 139Liabilities for defined benefit plans 1 1,759 2,800Other liabilities for employee benefit plans 142 131Lease liabilities 1,878 2,082Accrued liabilities 2,527 2,221Other financial liabilities 5,445 5,424Other non-financial liabilitiesCurrent income tax payables 622 770Provisions 2 748 893Other non-financial liabilities 2 277 256Total other liabilities 16,009 17,992
1 See note 20.2 In 2021, provisions include restructuring provisions, litigation and regulatory provisions and other provisions (see table 16.4 for further details). In 2020, restructuring provisions of
USD 167 million were separately disclosed, and litigation and regulatory provisions and other provisions of US 726 million were included in other non-financial liabilities.
Table 16.2 shows the maturity schedule of other financial liabilities excluding liabilities for defined benefit plans and lease liabilities as of December 31, 2021 and 2020. The allocation to the time bands is based on the expected maturity date for the carrying value and the earliest contractual maturity for the undiscounted cash flows.
Table 16.2
Maturity schedule – other financial liabilities
in USD millions, as of December 31 2021 2020
Carrying
value
Undiscounted
cash flows
Carrying
value
Undiscounted
cash flows
< 1 year 10,430 10,438 10,769 10,7811 to 2 years 50 52 136 1442 to 3 years 16 19 67 713 to 4 years 82 100 6 74 to 5 years 38 39 77 93> 5 years 110 238 139 240Total 10,727 10,886 11,193 11,336
Table 16.3
Maturity schedule – lease liabilities
in USD millions, as of December 31 2021 2020
Carrying
value
Undiscounted
cash flows
Carrying
value
Undiscounted
cash flows
< 1 year 225 263 235 2761 to 2 years 193 228 215 2522 to 3 years 163 194 179 2123 to 4 years 157 185 155 1864 to 5 years 133 158 145 172> 5 years 1,006 1,288 1,153 1,478Total 1,878 2,316 2,082 2,576
Zurich Insurance Group Annual Report 2021
Group overview
Integrated sustainability disclosure
Governance Risk review
Financial review
286
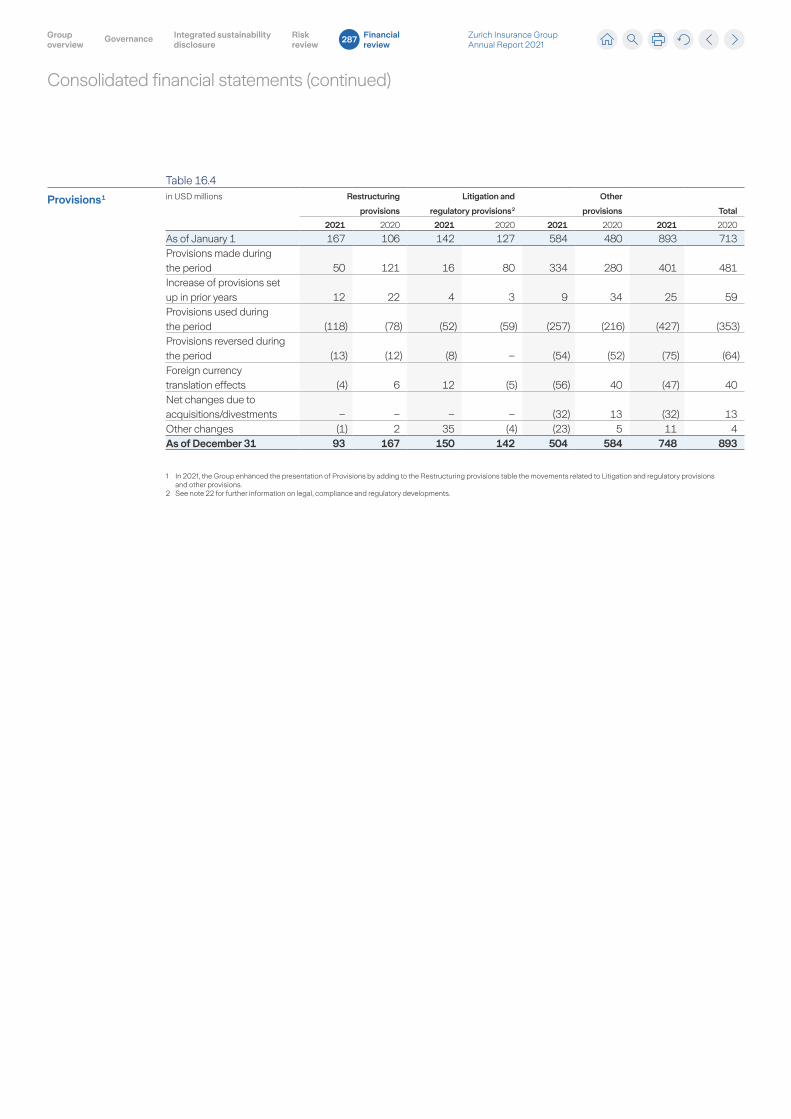
Consolidated financial statements (continued)
Table 16.4
Provisions 1 in USD millions Restructuring
provisions
Litigation and
regulatory provisions 2
Other
provisions Total
2021 2020 2021 2020 2021 2020 2021 2020
As of January 1 167 106 142 127 584 480 893 713Provisions made during the period 50 121 16 80 334 280 401 481Increase of provisions set up in prior years 12 22 4 3 9 34 25 59Provisions used during the period (118) (78) (52) (59) (257) (216) (427) (353)Provisions reversed during the period (13) (12) (8) – (54) (52) (75) (64)Foreign currency translation effects (4) 6 12 (5) (56) 40 (47) 40Net changes due to acquisitions/divestments – – – – (32) 13 (32) 13Other changes (1) 2 35 (4) (23) 5 11 4As of December 31 93 167 150 142 504 584 748 893
1 In 2021, the Group enhanced the presentation of Provisions by adding to the Restructuring provisions table the movements related to Litigation and regulatory provisions and other provisions.
2 See note 22 for further information on legal, compliance and regulatory developments.
Zurich Insurance Group Annual Report 2021
Group overview
Integrated sustainability disclosure
Governance Risk review
Financial review
287
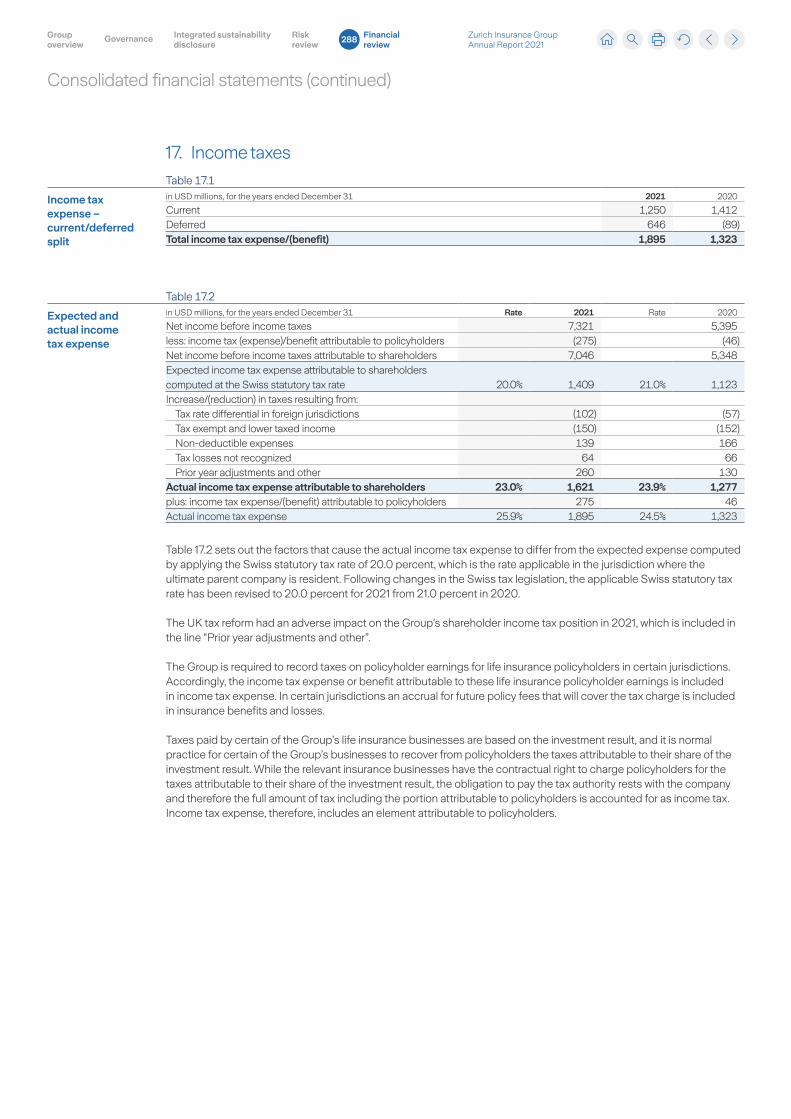
Consolidated financial statements (continued)
17. Income taxes
Table 17.1
Income tax expense – current/deferred split
in USD millions, for the years ended December 31 2021 2020
Current 1,250 1,412Deferred 646 (89)Total income tax expense/(benefit) 1,895 1,323
Table 17.2
Expected and actual income tax expense
in USD millions, for the years ended December 31 Rate 2021 Rate 2020
Net income before income taxes 7,321 5,395less: income tax (expense)/benefit attributable to policyholders (275) (46)Net income before income taxes attributable to shareholders 7,046 5,348Expected income tax expense attributable to shareholders computed at the Swiss statutory tax rate 20.0% 1,409 21.0% 1,123Increase/(reduction) in taxes resulting from:
Tax rate differential in foreign jurisdictions (102) (57)Tax exempt and lower taxed income (150) (152)Non-deductible expenses 139 166Tax losses not recognized 64 66Prior year adjustments and other 260 130
Actual income tax expense attributable to shareholders 23.0% 1,621 23.9% 1,277plus: income tax expense/(benefit) attributable to policyholders 275 46Actual income tax expense 25.9% 1,895 24.5% 1,323
Table 17.2 sets out the factors that cause the actual income tax expense to differ from the expected expense computed by applying the Swiss statutory tax rate of 20.0 percent, which is the rate applicable in the jurisdiction where the ultimate parent company is resident. Following changes in the Swiss tax legislation, the applicable Swiss statutory tax rate has been revised to 20.0 percent for 2021 from 21.0 percent in 2020.
The UK tax reform had an adverse impact on the Group’s shareholder income tax position in 2021, which is included in the line “Prior year adjustments and other”.
The Group is required to record taxes on policyholder earnings for life insurance policyholders in certain jurisdictions. Accordingly, the income tax expense or benefit attributable to these life insurance policyholder earnings is included in income tax expense. In certain jurisdictions an accrual for future policy fees that will cover the tax charge is included in insurance benefits and losses.
Taxes paid by certain of the Group’s life insurance businesses are based on the investment result, and it is normal practice for certain of the Group’s businesses to recover from policyholders the taxes attributable to their share of the investment result. While the relevant insurance businesses have the contractual right to charge policyholders for the taxes attributable to their share of the investment result, the obligation to pay the tax authority rests with the company and therefore the full amount of tax including the portion attributable to policyholders is accounted for as income tax. Income tax expense, therefore, includes an element attributable to policyholders.
Zurich Insurance Group Annual Report 2021
Group overview
Integrated sustainability disclosure
Governance Risk review
Financial review
288
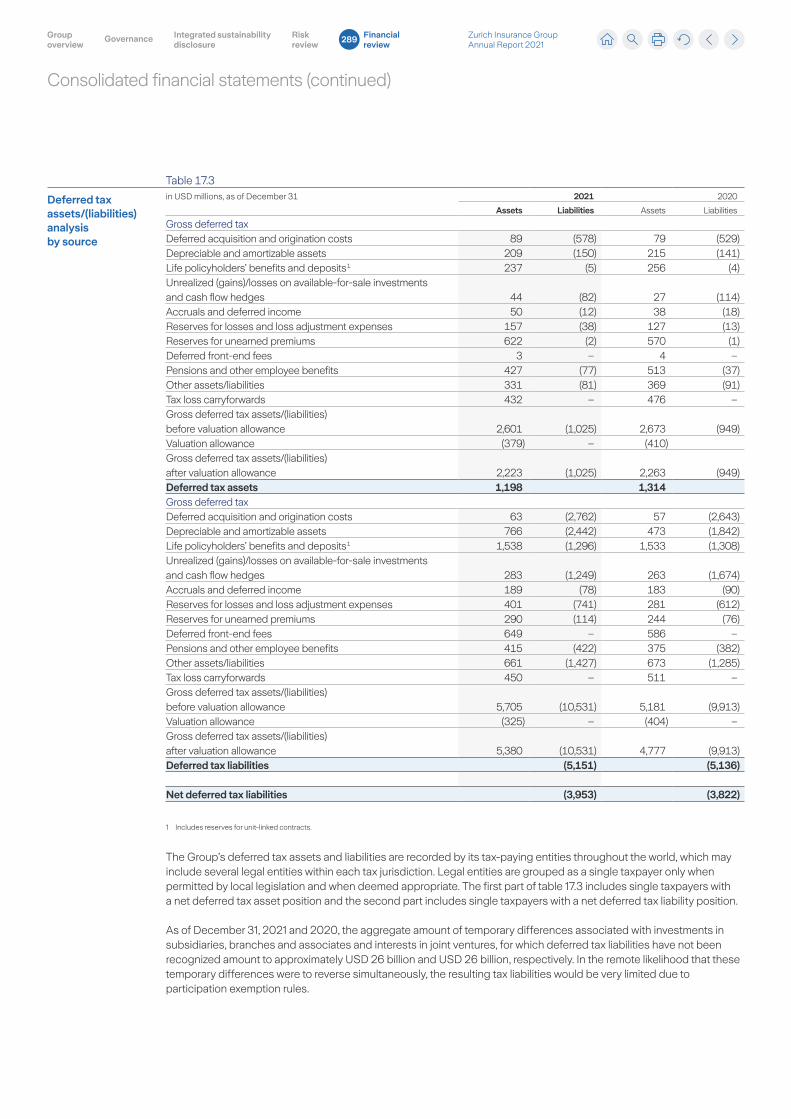
Consolidated financial statements (continued)
Table 17.3
Deferred tax assets/(liabilities) analysis by source
in USD millions, as of December 31 2021 2020
Assets Liabilities Assets Liabilities
Gross deferred taxDeferred acquisition and origination costs 89 (578) 79 (529)Depreciable and amortizable assets 209 (150) 215 (141)Life policyholders’ benefits and deposits 1 237 (5) 256 (4)Unrealized (gains)/losses on available-for-sale investments and cash flow hedges 44 (82) 27 (114)Accruals and deferred income 50 (12) 38 (18)Reserves for losses and loss adjustment expenses 157 (38) 127 (13)Reserves for unearned premiums 622 (2) 570 (1)Deferred front-end fees 3 – 4 –Pensions and other employee benefits 427 (77) 513 (37)Other assets/liabilities 331 (81) 369 (91)Tax loss carryforwards 432 – 476 –Gross deferred tax assets/(liabilities) before valuation allowance 2,601 (1,025) 2,673 (949)Valuation allowance (379) – (410)Gross deferred tax assets/(liabilities) after valuation allowance 2,223 (1,025) 2,263 (949)Deferred tax assets 1,198 1,314Gross deferred taxDeferred acquisition and origination costs 63 (2,762) 57 (2,643)Depreciable and amortizable assets 766 (2,442) 473 (1,842)Life policyholders’ benefits and deposits 1 1,538 (1,296) 1,533 (1,308)Unrealized (gains)/losses on available-for-sale investments and cash flow hedges 283 (1,249) 263 (1,674)Accruals and deferred income 189 (78) 183 (90)Reserves for losses and loss adjustment expenses 401 (741) 281 (612)Reserves for unearned premiums 290 (114) 244 (76)Deferred front-end fees 649 – 586 –Pensions and other employee benefits 415 (422) 375 (382)Other assets/liabilities 661 (1,427) 673 (1,285)Tax loss carryforwards 450 – 511 –Gross deferred tax assets/(liabilities) before valuation allowance 5,705 (10,531) 5,181 (9,913)Valuation allowance (325) – (404) –Gross deferred tax assets/(liabilities) after valuation allowance 5,380 (10,531) 4,777 (9,913)Deferred tax liabilities (5,151) (5,136)
Net deferred tax liabilities (3,953) (3,822)
1 Includes reserves for unit-linked contracts.
The Group’s deferred tax assets and liabilities are recorded by its tax-paying entities throughout the world, which may include several legal entities within each tax jurisdiction. Legal entities are grouped as a single taxpayer only when permitted by local legislation and when deemed appropriate. The first part of table 17.3 includes single taxpayers with a net deferred tax asset position and the second part includes single taxpayers with a net deferred tax liability position.
As of December 31, 2021 and 2020, the aggregate amount of temporary differences associated with investments in subsidiaries, branches and associates and interests in joint ventures, for which deferred tax liabilities have not been recognized amount to approximately USD 26 billion and USD 26 billion, respectively. In the remote likelihood that these temporary differences were to reverse simultaneously, the resulting tax liabilities would be very limited due to participation exemption rules.
Zurich Insurance Group Annual Report 2021
Group overview
Integrated sustainability disclosure
Governance Risk review
Financial review
289
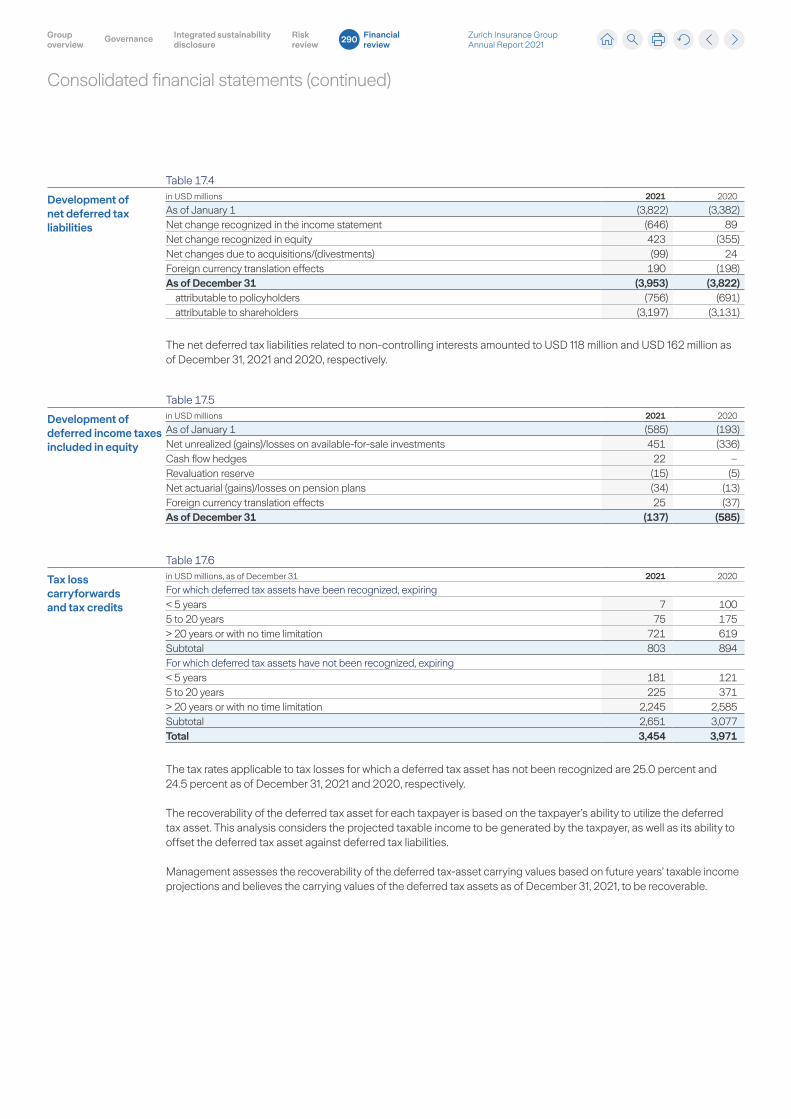
Consolidated financial statements (continued)
Table 17.4
Development of net deferred tax liabilities
in USD millions 2021 2020
As of January 1 (3,822) (3,382)Net change recognized in the income statement (646) 89Net change recognized in equity 423 (355)Net changes due to acquisitions/(divestments) (99) 24Foreign currency translation effects 190 (198)As of December 31 (3,953) (3,822)
attributable to policyholders (756) (691)attributable to shareholders (3,197) (3,131)
The net deferred tax liabilities related to non-controlling interests amounted to USD 118 million and USD 162 million as of December 31, 2021 and 2020, respectively.
Table 17.5
Development of deferred income taxes included in equity
in USD millions 2021 2020
As of January 1 (585) (193)Net unrealized (gains)/losses on available-for-sale investments 451 (336)Cash flow hedges 22 –Revaluation reserve (15) (5)Net actuarial (gains)/losses on pension plans (34) (13)Foreign currency translation effects 25 (37)As of December 31 (137) (585)
Table 17.6
Tax loss carryforwards and tax credits
in USD millions, as of December 31 2021 2020
For which deferred tax assets have been recognized, expiring< 5 years 7 1005 to 20 years 75 175> 20 years or with no time limitation 721 619Subtotal 803 894For which deferred tax assets have not been recognized, expiring< 5 years 181 1215 to 20 years 225 371> 20 years or with no time limitation 2,245 2,585Subtotal 2,651 3,077Total 3,454 3,971
The tax rates applicable to tax losses for which a deferred tax asset has not been recognized are 25.0 percent and 24.5 percent as of December 31, 2021 and 2020, respectively.
The recoverability of the deferred tax asset for each taxpayer is based on the taxpayer’s ability to utilize the deferred tax asset. This analysis considers the projected taxable income to be generated by the taxpayer, as well as its ability to offset the deferred tax asset against deferred tax liabilities.
Management assesses the recoverability of the deferred tax-asset carrying values based on future years’ taxable income projections and believes the carrying values of the deferred tax assets as of December 31, 2021, to be recoverable.
Zurich Insurance Group Annual Report 2021
Group overview
Integrated sustainability disclosure
Governance Risk review
Financial review
290
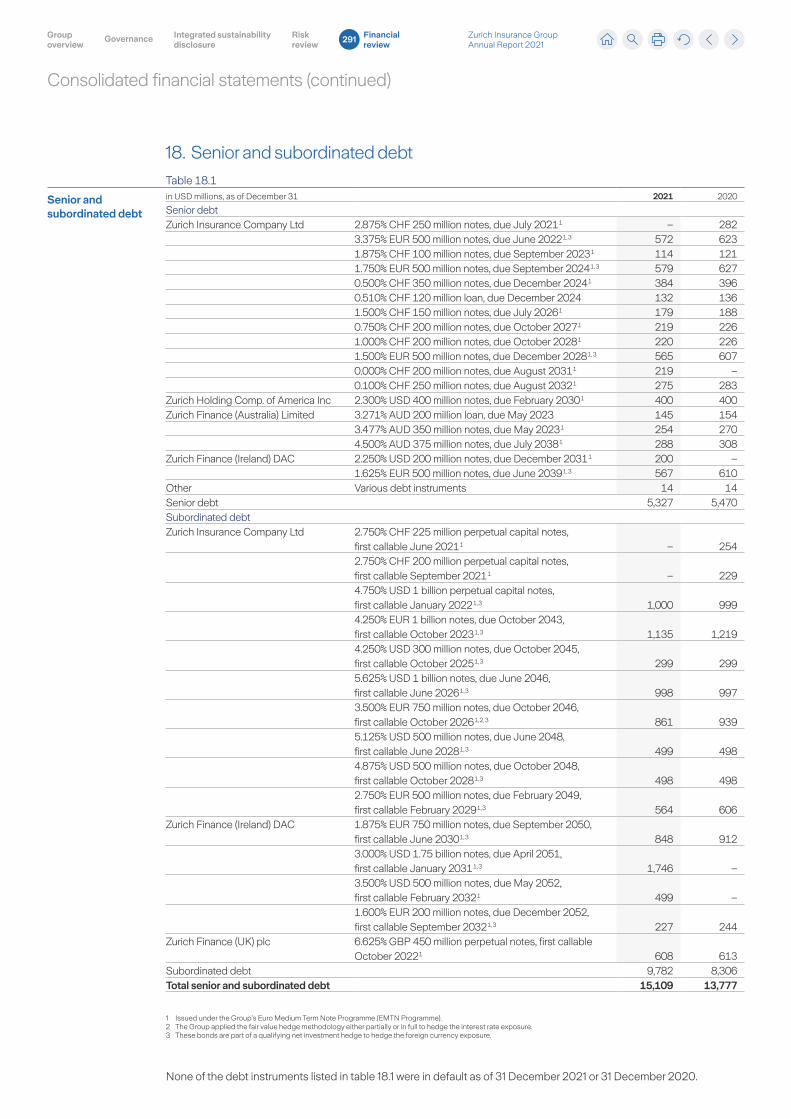
Consolidated financial statements (continued)
18. Senior and subordinated debt
Table 18.1
Senior and subordinated debt
in USD millions, as of December 31 2021 2020
Senior debtZurich Insurance Company Ltd 2.875% CHF 250 million notes, due July 2021 1 – 282
3.375% EUR 500 million notes, due June 2022 1, 3 572 6231.875% CHF 100 million notes, due September 2023 1 114 1211.750% EUR 500 million notes, due September 2024 1, 3 579 6270.500% CHF 350 million notes, due December 2024 1 384 3960.510% CHF 120 million loan, due December 2024 132 1361.500% CHF 150 million notes, due July 2026 1 179 1880.750% CHF 200 million notes, due October 2027 1 219 2261.000% CHF 200 million notes, due October 2028 1 220 2261.500% EUR 500 million notes, due December 2028 1, 3 565 6070.000% CHF 200 million notes, due August 2031 1 219 –0.100% CHF 250 million notes, due August 2032 1 275 283
Zurich Holding Comp. of America Inc 2.300% USD 400 million notes, due February 2030 1 400 400Zurich Finance (Australia) Limited 3.271% AUD 200 million loan, due May 2023 145 154
3.477% AUD 350 million notes, due May 2023 1 254 2704.500% AUD 375 million notes, due July 2038 1 288 308
Zurich Finance (Ireland) DAC 2.250% USD 200 million notes, due December 2031 1 200 –1.625% EUR 500 million notes, due June 2039 1, 3 567 610
Other Various debt instruments 14 14Senior debt 5,327 5,470Subordinated debtZurich Insurance Company Ltd 2.750% CHF 225 million perpetual capital notes,
first callable June 2021 1 – 2542.750% CHF 200 million perpetual capital notes, first callable September 2021 1 – 2294.750% USD 1 billion perpetual capital notes, first callable January 2022 1, 3 1,000 9994.250% EUR 1 billion notes, due October 2043, first callable October 2023 1, 3 1,135 1,2194.250% USD 300 million notes, due October 2045, first callable October 2025 1, 3 299 2995.625% USD 1 billion notes, due June 2046, first callable June 2026 1, 3 998 9973.500% EUR 750 million notes, due October 2046, first callable October 2026 1, 2, 3 861 9395.125% USD 500 million notes, due June 2048, first callable June 2028 1, 3 499 4984.875% USD 500 million notes, due October 2048, first callable October 2028 1, 3 498 4982.750% EUR 500 million notes, due February 2049, first callable February 2029 1, 3 564 606
Zurich Finance (Ireland) DAC 1.875% EUR 750 million notes, due September 2050, first callable June 2030 1, 3 848 9123.000% USD 1.75 billion notes, due April 2051, first callable January 2031 1, 3 1,746 –3.500% USD 500 million notes, due May 2052, first callable February 2032 1 499 –1.600% EUR 200 million notes, due December 2052, first callable September 2032 1, 3 227 244
Zurich Finance (UK) plc 6.625% GBP 450 million perpetual notes, first callable October 2022 1 608 613
Subordinated debt 9,782 8,306Total senior and subordinated debt 15,109 13,777
1 Issued under the Group’s Euro Medium Term Note Programme (EMTN Programme).2 The Group applied the fair value hedge methodology either partially or in full to hedge the interest rate exposure.3 These bonds are part of a qualifying net investment hedge to hedge the foreign currency exposure.
None of the debt instruments listed in table 18.1 were in default as of 31 December 2021 or 31 December 2020.
Zurich Insurance Group Annual Report 2021
Group overview
Integrated sustainability disclosure
Governance Risk review
Financial review
291
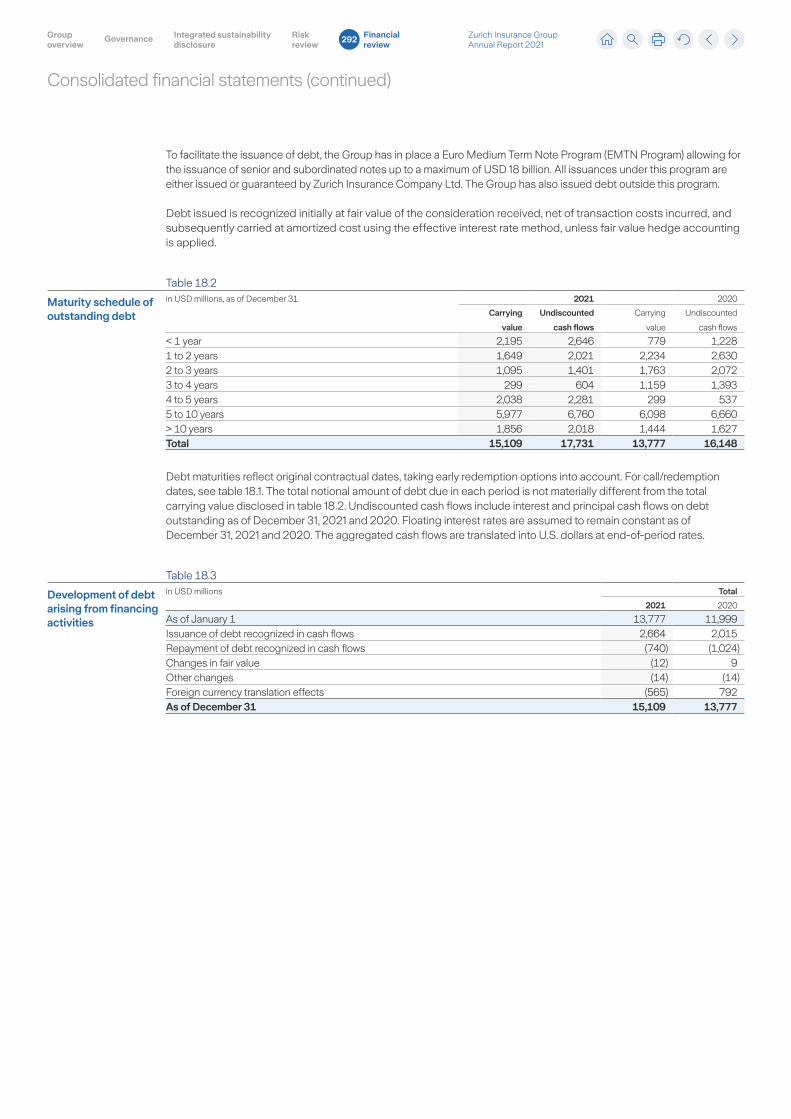
Consolidated financial statements (continued)
To facilitate the issuance of debt, the Group has in place a Euro Medium Term Note Program (EMTN Program) allowing for the issuance of senior and subordinated notes up to a maximum of USD 18 billion. All issuances under this program are either issued or guaranteed by Zurich Insurance Company Ltd. The Group has also issued debt outside this program.
Debt issued is recognized initially at fair value of the consideration received, net of transaction costs incurred, and subsequently carried at amortized cost using the effective interest rate method, unless fair value hedge accounting is applied.
Table 18.2
Maturity schedule of outstanding debt
in USD millions, as of December 31 2021 2020
Carrying
value
Undiscounted
cash flows
Carrying
value
Undiscounted
cash flows
< 1 year 2,195 2,646 779 1,2281 to 2 years 1,649 2,021 2,234 2,6302 to 3 years 1,095 1,401 1,763 2,0723 to 4 years 299 604 1,159 1,3934 to 5 years 2,038 2,281 299 5375 to 10 years 5,977 6,760 6,098 6,660> 10 years 1,856 2,018 1,444 1,627Total 15,109 17,731 13,777 16,148
Debt maturities reflect original contractual dates, taking early redemption options into account. For call/redemption dates, see table 18.1. The total notional amount of debt due in each period is not materially different from the total carrying value disclosed in table 18.2. Undiscounted cash flows include interest and principal cash flows on debt outstanding as of December 31, 2021 and 2020. Floating interest rates are assumed to remain constant as of December 31, 2021 and 2020. The aggregated cash flows are translated into U.S. dollars at end-of-period rates.
Table 18.3
Development of debt arising from financing activities
in USD millions Total
2021 2020
As of January 1 13,777 11,999Issuance of debt recognized in cash flows 2,664 2,015Repayment of debt recognized in cash flows (740) (1,024)Changes in fair value (12) 9Other changes (14) (14)Foreign currency translation effects (565) 792As of December 31 15,109 13,777
Zurich Insurance Group Annual Report 2021
Group overview
Integrated sustainability disclosure
Governance Risk review
Financial review
292
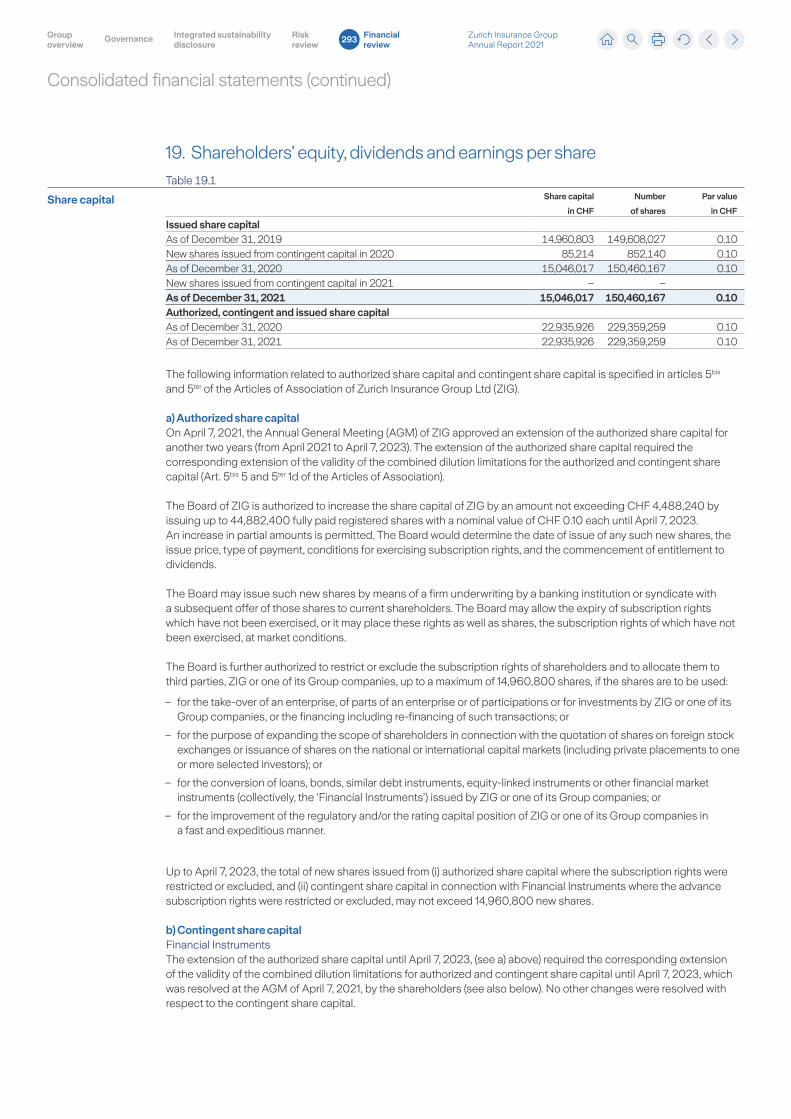
Consolidated financial statements (continued)
19. Shareholders’ equity, dividends and earnings per share
Table 19.1
Share capital Share capital
in CHF
Number
of shares
Par value
in CHF
Issued share capitalAs of December 31, 2019 14,960,803 149,608,027 0.10New shares issued from contingent capital in 2020 85,214 852,140 0.10As of December 31, 2020 15,046,017 150,460,167 0.10New shares issued from contingent capital in 2021 – –As of December 31, 2021 15,046,017 150,460,167 0.10Authorized, contingent and issued share capitalAs of December 31, 2020 22,935,926 229,359,259 0.10As of December 31, 2021 22,935,926 229,359,259 0.10
The following information related to authorized share capital and contingent share capital is specified in articles 5bis and 5ter of the Articles of Association of Zurich Insurance Group Ltd (ZIG).
a) Authorized share capital On April 7, 2021, the Annual General Meeting (AGM) of ZIG approved an extension of the authorized share capital for another two years (from April 2021 to April 7, 2023). The extension of the authorized share capital required the corresponding extension of the validity of the combined dilution limitations for the authorized and contingent share capital (Art. 5bis 5 and 5ter 1d of the Articles of Association).
The Board of ZIG is authorized to increase the share capital of ZIG by an amount not exceeding CHF 4,488,240 by issuing up to 44,882,400 fully paid registered shares with a nominal value of CHF 0.10 each until April 7, 2023. An increase in partial amounts is permitted. The Board would determine the date of issue of any such new shares, the issue price, type of payment, conditions for exercising subscription rights, and the commencement of entitlement to dividends.
The Board may issue such new shares by means of a firm underwriting by a banking institution or syndicate with a subsequent offer of those shares to current shareholders. The Board may allow the expiry of subscription rights which have not been exercised, or it may place these rights as well as shares, the subscription rights of which have not been exercised, at market conditions.
The Board is further authorized to restrict or exclude the subscription rights of shareholders and to allocate them to third parties, ZIG or one of its Group companies, up to a maximum of 14,960,800 shares, if the shares are to be used:
– for the take-over of an enterprise, of parts of an enterprise or of participations or for investments by ZIG or one of its Group companies, or the financing including re-financing of such transactions; or
– for the purpose of expanding the scope of shareholders in connection with the quotation of shares on foreign stock exchanges or issuance of shares on the national or international capital markets (including private placements to one or more selected investors); or
– for the conversion of loans, bonds, similar debt instruments, equity-linked instruments or other financial market instruments (collectively, the ‘Financial Instruments’) issued by ZIG or one of its Group companies; or
– for the improvement of the regulatory and/or the rating capital position of ZIG or one of its Group companies in a fast and expeditious manner.
Up to April 7, 2023, the total of new shares issued from (i) authorized share capital where the subscription rights were restricted or excluded, and (ii) contingent share capital in connection with Financial Instruments where the advance subscription rights were restricted or excluded, may not exceed 14,960,800 new shares.
b) Contingent share capital Financial Instruments The extension of the authorized share capital until April 7, 2023, (see a) above) required the corresponding extension of the validity of the combined dilution limitations for authorized and contingent share capital until April 7, 2023, which was resolved at the AGM of April 7, 2021, by the shareholders (see also below). No other changes were resolved with respect to the contingent share capital.
Zurich Insurance Group Annual Report 2021
Group overview
Integrated sustainability disclosure
Governance Risk review
Financial review
293
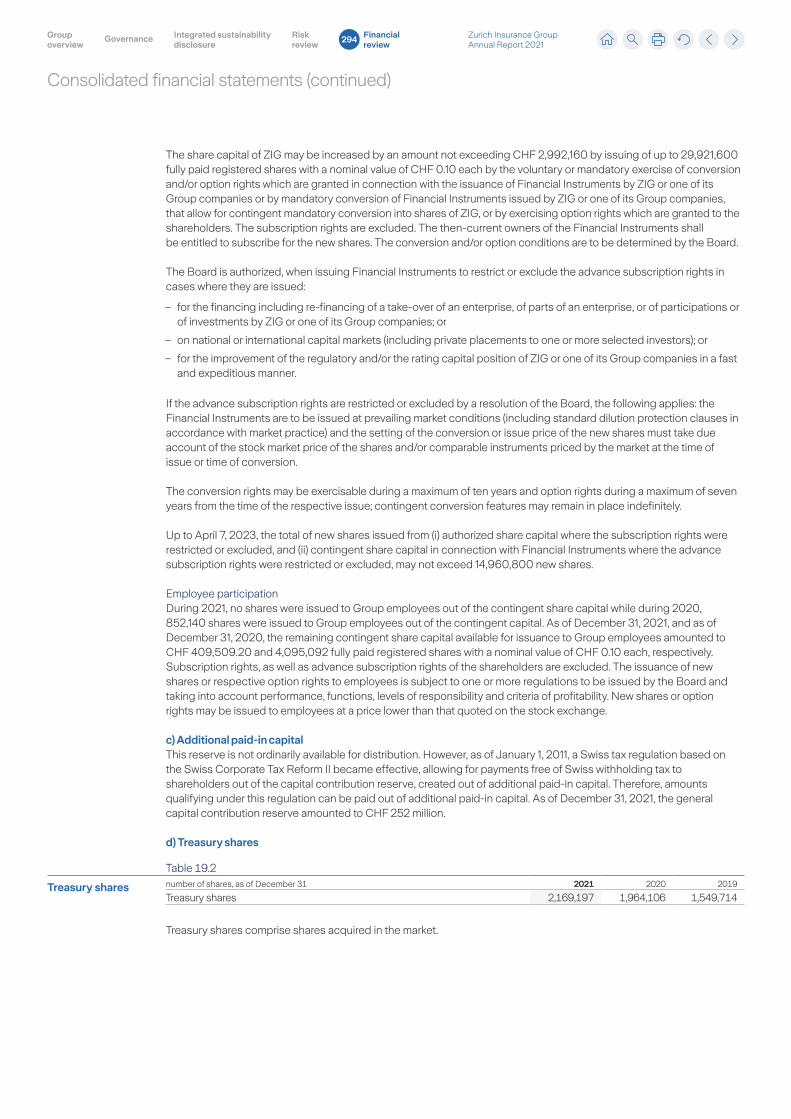
Consolidated financial statements (continued)
The share capital of ZIG may be increased by an amount not exceeding CHF 2,992,160 by issuing of up to 29,921,600 fully paid registered shares with a nominal value of CHF 0.10 each by the voluntary or mandatory exercise of conversion and/or option rights which are granted in connection with the issuance of Financial Instruments by ZIG or one of its Group companies or by mandatory conversion of Financial Instruments issued by ZIG or one of its Group companies, that allow for contingent mandatory conversion into shares of ZIG, or by exercising option rights which are granted to the shareholders. The subscription rights are excluded. The then-current owners of the Financial Instruments shall be entitled to subscribe for the new shares. The conversion and/or option conditions are to be determined by the Board.
The Board is authorized, when issuing Financial Instruments to restrict or exclude the advance subscription rights in cases where they are issued:
– for the financing including re-financing of a take-over of an enterprise, of parts of an enterprise, or of participations or of investments by ZIG or one of its Group companies; or
– on national or international capital markets (including private placements to one or more selected investors); or
– for the improvement of the regulatory and/or the rating capital position of ZIG or one of its Group companies in a fast and expeditious manner.
If the advance subscription rights are restricted or excluded by a resolution of the Board, the following applies: the Financial Instruments are to be issued at prevailing market conditions (including standard dilution protection clauses in accordance with market practice) and the setting of the conversion or issue price of the new shares must take due account of the stock market price of the shares and/or comparable instruments priced by the market at the time of issue or time of conversion.
The conversion rights may be exercisable during a maximum of ten years and option rights during a maximum of seven years from the time of the respective issue; contingent conversion features may remain in place indefinitely.
Up to April 7, 2023, the total of new shares issued from (i) authorized share capital where the subscription rights were restricted or excluded, and (ii) contingent share capital in connection with Financial Instruments where the advance subscription rights were restricted or excluded, may not exceed 14,960,800 new shares.
Employee participationDuring 2021, no shares were issued to Group employees out of the contingent share capital while during 2020, 852,140 shares were issued to Group employees out of the contingent capital. As of December 31, 2021, and as of December 31, 2020, the remaining contingent share capital available for issuance to Group employees amounted to CHF 409,509.20 and 4,095,092 fully paid registered shares with a nominal value of CHF 0.10 each, respectively. Subscription rights, as well as advance subscription rights of the shareholders are excluded. The issuance of new shares or respective option rights to employees is subject to one or more regulations to be issued by the Board and taking into account performance, functions, levels of responsibility and criteria of profitability. New shares or option rights may be issued to employees at a price lower than that quoted on the stock exchange.
c) Additional paid-in capitalThis reserve is not ordinarily available for distribution. However, as of January 1, 2011, a Swiss tax regulation based on the Swiss Corporate Tax Reform II became effective, allowing for payments free of Swiss withholding tax to shareholders out of the capital contribution reserve, created out of additional paid-in capital. Therefore, amounts qualifying under this regulation can be paid out of additional paid-in capital. As of December 31, 2021, the general capital contribution reserve amounted to CHF 252 million.
d) Treasury shares
Table 19.2
Treasury shares number of shares, as of December 31 2021 2020 2019
Treasury shares 2,169,197 1,964,106 1,549,714
Treasury shares comprise shares acquired in the market.
Zurich Insurance Group Annual Report 2021
Group overview
Integrated sustainability disclosure
Governance Risk review
Financial review
294
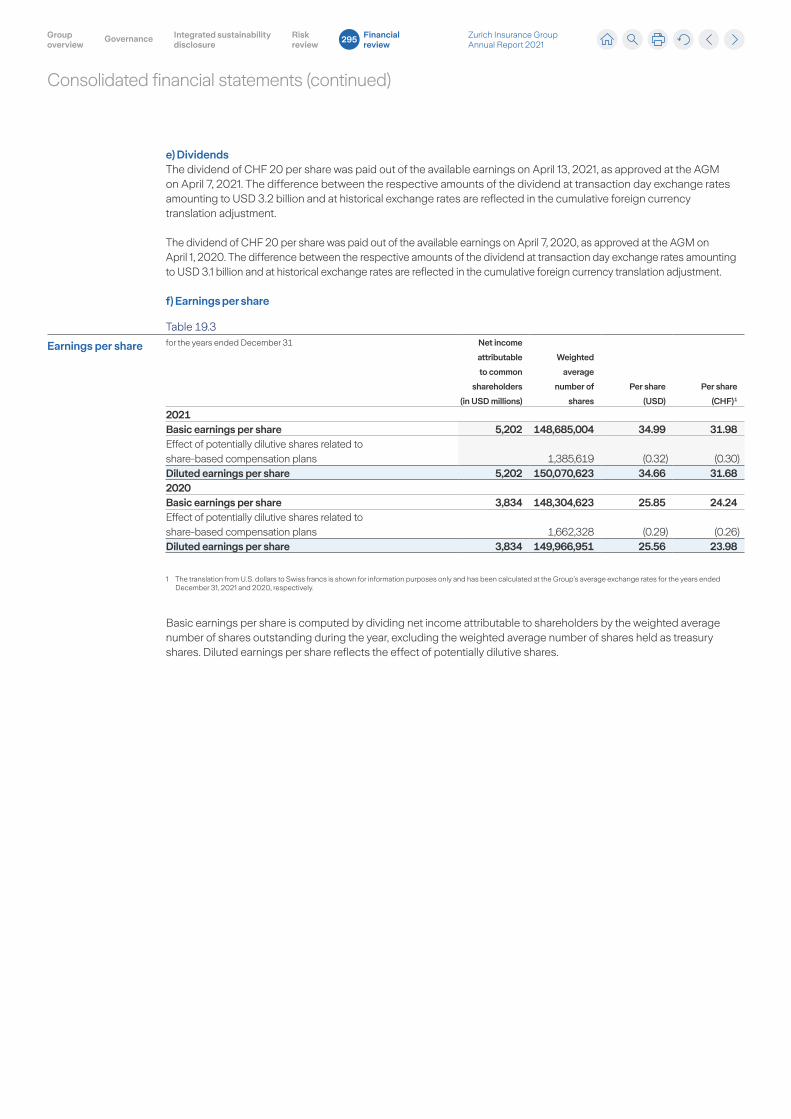
Consolidated financial statements (continued)
e) DividendsThe dividend of CHF 20 per share was paid out of the available earnings on April 13, 2021, as approved at the AGM on April 7, 2021. The difference between the respective amounts of the dividend at transaction day exchange rates amounting to USD 3.2 billion and at historical exchange rates are reflected in the cumulative foreign currency translation adjustment.
The dividend of CHF 20 per share was paid out of the available earnings on April 7, 2020, as approved at the AGM on April 1, 2020. The difference between the respective amounts of the dividend at transaction day exchange rates amounting to USD 3.1 billion and at historical exchange rates are reflected in the cumulative foreign currency translation adjustment.
f) Earnings per share
Table 19.3
Earnings per share for the years ended December 31 Net income
attributable
to common
shareholders
(in USD millions)
Weighted
average
number of
shares
Per share
(USD)
Per share
(CHF) 1
2021Basic earnings per share 5,202 148,685,004 34.99 31.98Effect of potentially dilutive shares related to share-based compensation plans 1,385,619 (0.32) (0.30)Diluted earnings per share 5,202 150,070,623 34.66 31.682020Basic earnings per share 3,834 148,304,623 25.85 24.24Effect of potentially dilutive shares related to share-based compensation plans 1,662,328 (0.29) (0.26)Diluted earnings per share 3,834 149,966,951 25.56 23.98
1 The translation from U.S. dollars to Swiss francs is shown for information purposes only and has been calculated at the Group’s average exchange rates for the years ended December 31, 2021 and 2020, respectively.
Basic earnings per share is computed by dividing net income attributable to shareholders by the weighted average number of shares outstanding during the year, excluding the weighted average number of shares held as treasury shares. Diluted earnings per share reflects the effect of potentially dilutive shares.
Zurich Insurance Group Annual Report 2021
Group overview
Integrated sustainability disclosure
Governance Risk review
Financial review
295
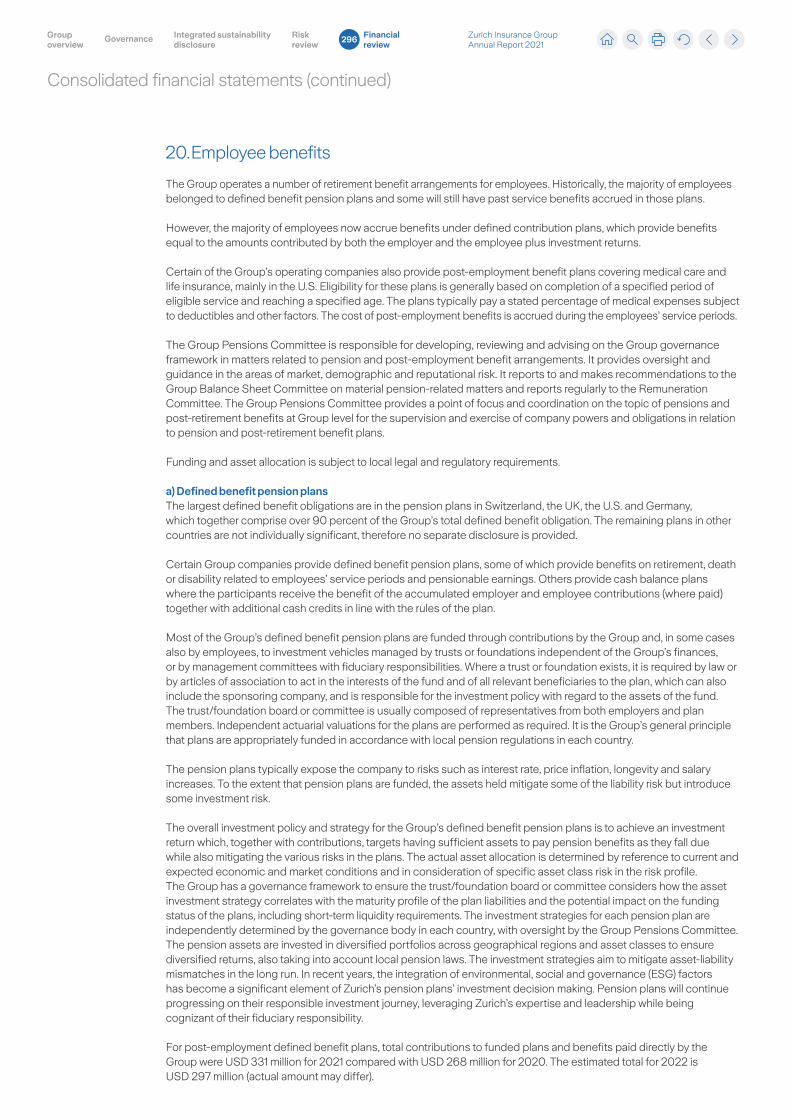
Consolidated financial statements (continued)
20. Employee benefits
The Group operates a number of retirement benefit arrangements for employees. Historically, the majority of employees belonged to defined benefit pension plans and some will still have past service benefits accrued in those plans.
However, the majority of employees now accrue benefits under defined contribution plans, which provide benefits equal to the amounts contributed by both the employer and the employee plus investment returns.
Certain of the Group’s operating companies also provide post-employment benefit plans covering medical care and life insurance, mainly in the U.S. Eligibility for these plans is generally based on completion of a specified period of eligible service and reaching a specified age. The plans typically pay a stated percentage of medical expenses subject to deductibles and other factors. The cost of post-employment benefits is accrued during the employees’ service periods.
The Group Pensions Committee is responsible for developing, reviewing and advising on the Group governance framework in matters related to pension and post-employment benefit arrangements. It provides oversight and guidance in the areas of market, demographic and reputational risk. It reports to and makes recommendations to the Group Balance Sheet Committee on material pension-related matters and reports regularly to the Remuneration Committee. The Group Pensions Committee provides a point of focus and coordination on the topic of pensions and post-retirement benefits at Group level for the supervision and exercise of company powers and obligations in relation to pension and post-retirement benefit plans.
Funding and asset allocation is subject to local legal and regulatory requirements.
a) Defined benefit pension plansThe largest defined benefit obligations are in the pension plans in Switzerland, the UK, the U.S. and Germany, which together comprise over 90 percent of the Group’s total defined benefit obligation. The remaining plans in other countries are not individually significant, therefore no separate disclosure is provided.
Certain Group companies provide defined benefit pension plans, some of which provide benefits on retirement, death or disability related to employees’ service periods and pensionable earnings. Others provide cash balance plans where the participants receive the benefit of the accumulated employer and employee contributions (where paid) together with additional cash credits in line with the rules of the plan.
Most of the Group’s defined benefit pension plans are funded through contributions by the Group and, in some cases also by employees, to investment vehicles managed by trusts or foundations independent of the Group’s finances, or by management committees with fiduciary responsibilities. Where a trust or foundation exists, it is required by law or by articles of association to act in the interests of the fund and of all relevant beneficiaries to the plan, which can also include the sponsoring company, and is responsible for the investment policy with regard to the assets of the fund. The trust/foundation board or committee is usually composed of representatives from both employers and plan members. Independent actuarial valuations for the plans are performed as required. It is the Group’s general principle that plans are appropriately funded in accordance with local pension regulations in each country.
The pension plans typically expose the company to risks such as interest rate, price inflation, longevity and salary increases. To the extent that pension plans are funded, the assets held mitigate some of the liability risk but introduce some investment risk.
The overall investment policy and strategy for the Group’s defined benefit pension plans is to achieve an investment return which, together with contributions, targets having sufficient assets to pay pension benefits as they fall due while also mitigating the various risks in the plans. The actual asset allocation is determined by reference to current and expected economic and market conditions and in consideration of specific asset class risk in the risk profile. The Group has a governance framework to ensure the trust/foundation board or committee considers how the asset investment strategy correlates with the maturity profile of the plan liabilities and the potential impact on the funding status of the plans, including short-term liquidity requirements. The investment strategies for each pension plan are independently determined by the governance body in each country, with oversight by the Group Pensions Committee. The pension assets are invested in diversified portfolios across geographical regions and asset classes to ensure diversified returns, also taking into account local pension laws. The investment strategies aim to mitigate asset-liability mismatches in the long run. In recent years, the integration of environmental, social and governance (ESG) factors has become a significant element of Zurich’s pension plans’ investment decision making. Pension plans will continue progressing on their responsible investment journey, leveraging Zurich’s expertise and leadership while being cognizant of their fiduciary responsibility.
For post-employment defined benefit plans, total contributions to funded plans and benefits paid directly by the Group were USD 331 million for 2021 compared with USD 268 million for 2020. The estimated total for 2022 is USD 297 million (actual amount may differ).
Zurich Insurance Group Annual Report 2021
Group overview
Integrated sustainability disclosure
Governance Risk review
Financial review
296
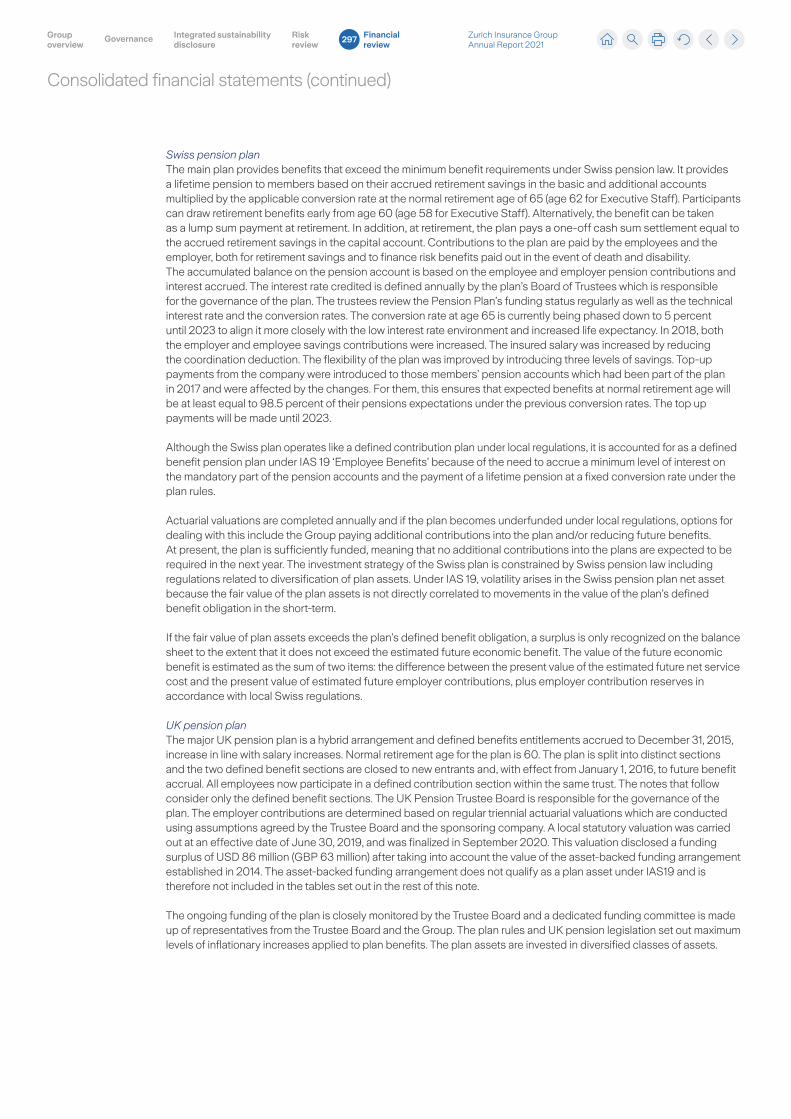
Consolidated financial statements (continued)
Swiss pension planThe main plan provides benefits that exceed the minimum benefit requirements under Swiss pension law. It provides a lifetime pension to members based on their accrued retirement savings in the basic and additional accounts multiplied by the applicable conversion rate at the normal retirement age of 65 (age 62 for Executive Staff). Participants can draw retirement benefits early from age 60 (age 58 for Executive Staff). Alternatively, the benefit can be taken as a lump sum payment at retirement. In addition, at retirement, the plan pays a one-off cash sum settlement equal to the accrued retirement savings in the capital account. Contributions to the plan are paid by the employees and the employer, both for retirement savings and to finance risk benefits paid out in the event of death and disability. The accumulated balance on the pension account is based on the employee and employer pension contributions and interest accrued. The interest rate credited is defined annually by the plan’s Board of Trustees which is responsible for the governance of the plan. The trustees review the Pension Plan’s funding status regularly as well as the technical interest rate and the conversion rates. The conversion rate at age 65 is currently being phased down to 5 percent until 2023 to align it more closely with the low interest rate environment and increased life expectancy. In 2018, both the employer and employee savings contributions were increased. The insured salary was increased by reducing the coordination deduction. The flexibility of the plan was improved by introducing three levels of savings. Top-up payments from the company were introduced to those members’ pension accounts which had been part of the plan in 2017 and were affected by the changes. For them, this ensures that expected benefits at normal retirement age will be at least equal to 98.5 percent of their pensions expectations under the previous conversion rates. The top up payments will be made until 2023.
Although the Swiss plan operates like a defined contribution plan under local regulations, it is accounted for as a defined benefit pension plan under IAS 19 ‘Employee Benefits’ because of the need to accrue a minimum level of interest on the mandatory part of the pension accounts and the payment of a lifetime pension at a fixed conversion rate under the plan rules.
Actuarial valuations are completed annually and if the plan becomes underfunded under local regulations, options for dealing with this include the Group paying additional contributions into the plan and/or reducing future benefits. At present, the plan is sufficiently funded, meaning that no additional contributions into the plans are expected to be required in the next year. The investment strategy of the Swiss plan is constrained by Swiss pension law including regulations related to diversification of plan assets. Under IAS 19, volatility arises in the Swiss pension plan net asset because the fair value of the plan assets is not directly correlated to movements in the value of the plan’s defined benefit obligation in the short-term.
If the fair value of plan assets exceeds the plan’s defined benefit obligation, a surplus is only recognized on the balance sheet to the extent that it does not exceed the estimated future economic benefit. The value of the future economic benefit is estimated as the sum of two items: the difference between the present value of the estimated future net service cost and the present value of estimated future employer contributions, plus employer contribution reserves in accordance with local Swiss regulations.
UK pension planThe major UK pension plan is a hybrid arrangement and defined benefits entitlements accrued to December 31, 2015, increase in line with salary increases. Normal retirement age for the plan is 60. The plan is split into distinct sections and the two defined benefit sections are closed to new entrants and, with effect from January 1, 2016, to future benefit accrual. All employees now participate in a defined contribution section within the same trust. The notes that follow consider only the defined benefit sections. The UK Pension Trustee Board is responsible for the governance of the plan. The employer contributions are determined based on regular triennial actuarial valuations which are conducted using assumptions agreed by the Trustee Board and the sponsoring company. A local statutory valuation was carried out at an effective date of June 30, 2019, and was finalized in September 2020. This valuation disclosed a funding surplus of USD 86 million (GBP 63 million) after taking into account the value of the asset-backed funding arrangement established in 2014. The asset-backed funding arrangement does not qualify as a plan asset under IAS19 and is therefore not included in the tables set out in the rest of this note.
The ongoing funding of the plan is closely monitored by the Trustee Board and a dedicated funding committee is made up of representatives from the Trustee Board and the Group. The plan rules and UK pension legislation set out maximum levels of inflationary increases applied to plan benefits. The plan assets are invested in diversified classes of assets.
Zurich Insurance Group Annual Report 2021
Group overview
Integrated sustainability disclosure
Governance Risk review
Financial review
297
Consolidated financial statements (continued)
U.S. pension plansThere are two major pension plans in the U.S., the Zurich North America (ZNA) pension plan and the Farmers Group, Inc. (FGI) pension plan. Both plans are funded entirely by the participating employers. The ZNA plan is a cash balance and the FGI pension plan utilizes a cash balance pension formula for benefits accruing after January 1, 2009, except with respect to certain grandfathered participants who retained a final average pay formula. Under a cash balance pension formula, an amount is credited to the cash balance account each quarter, determined by an employee’s age, service and their level of earnings up to and above the social security taxable wage base. The minimum annual interest credited on the account balance is 5 percent. The cash balance account is available from age 65, or age 55 with five years of service. The benefit can be taken as a monthly annuity or as a lump sum. Both the ZNA plan and the FGI pension plan have fiduciaries as required under local pension laws. The fiduciaries are responsible for the governance of the plans. Actuarial valuations are completed regularly. The annual employer minimum required contributions are equal to expected expenses paid from the plan each year, plus a rolling amortization of any prior underfunding.
The ZNA and FGI plans have been frozen with effect from December 31, 2018. ZNA and FGI employees with a cash balance account will continue to earn interest credits on their existing cash balance account balance after the freeze date and will continue to earn eligibility service used to determine vesting and early retirement eligibility. FGI employees participating in the final average pay formula will continue to earn eligibility service used to determine vesting and the percentage of pension benefit payable for early retirement before normal retirement age of 65. ZNA and FGI employees earn only defined contribution retirement benefits with effect from January 1, 2019. In conjunction with the change in the pension plan, ZNA and FGI employees receive an additional company contribution within their defined contribution plan.
German pension plansThere are a number of legacy defined benefit plans in Germany, most of which were set up under works council agreements. Contributions to support the pension commitments are made to a contractual trust arrangement. A separate arrangement was also established in 2010 to provide for retirement obligations that were in payment at that time. Consideration is given from time to time based on the fiscal efficiency of adding recent retirees to this arrangement and to adding assets to the contractual trust. In 2021 the pension liabilities are nearly fully funded therefore no additional funding was required.
The defined benefit plans provide benefits on either a final salary, career average salary or a cash balance basis. New entrants participate in a cash balance arrangement, which has the characteristics of a defined contribution arrangement, with a lump sum paid at retirement and a capital guarantee on members’ balances, which mirrors the capital guarantee given in a conventional life insurance arrangement in Germany.
Zurich Insurance Group Annual Report 2021
Group overview
Integrated sustainability disclosure
Governance Risk review
Financial review
298
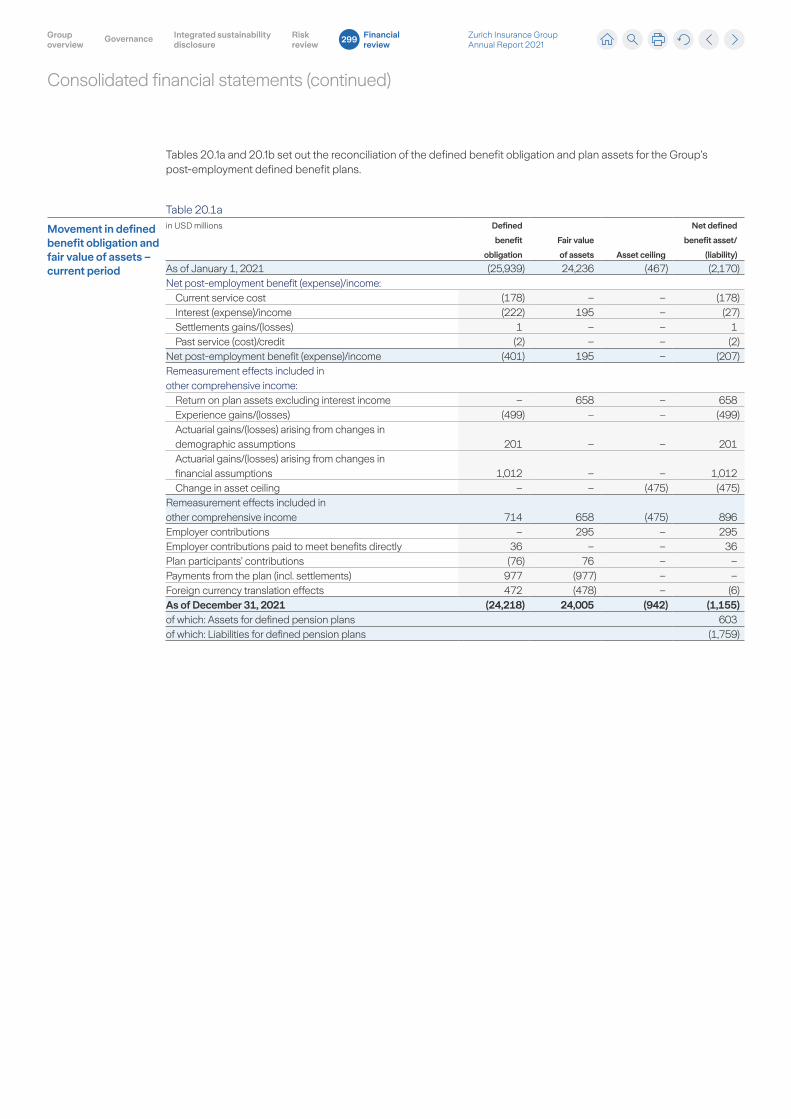
Consolidated financial statements (continued)
Tables 20.1a and 20.1b set out the reconciliation of the defined benefit obligation and plan assets for the Group’s post-employment defined benefit plans.
Table 20.1a
Movement in defined benefit obligation and fair value of assets – current period
in USD millions Defined
benefit
obligation
Fair value
of assets Asset ceiling
Net defined
benefit asset/
(liability)
As of January 1, 2021 (25,939) 24,236 (467) (2,170)Net post-employment benefit (expense)/income:
Current service cost (178) – – (178)Interest (expense)/income (222) 195 – (27)Settlements gains/(losses) 1 – – 1Past service (cost)/credit (2) – – (2)
Net post-employment benefit (expense)/income (401) 195 – (207)Remeasurement effects included in other comprehensive income:
Return on plan assets excluding interest income – 658 – 658Experience gains/(losses) (499) – – (499)Actuarial gains/(losses) arising from changes in demographic assumptions 201 – – 201Actuarial gains/(losses) arising from changes in financial assumptions 1,012 – – 1,012Change in asset ceiling – – (475) (475)
Remeasurement effects included in other comprehensive income 714 658 (475) 896Employer contributions – 295 – 295Employer contributions paid to meet benefits directly 36 – – 36Plan participants’ contributions (76) 76 – –Payments from the plan (incl. settlements) 977 (977) – –Foreign currency translation effects 472 (478) – (6)As of December 31, 2021 (24,218) 24,005 (942) (1,155)of which: Assets for defined pension plans 603of which: Liabilities for defined pension plans (1,759)
Zurich Insurance Group Annual Report 2021
Group overview
Integrated sustainability disclosure
Governance Risk review
Financial review
299
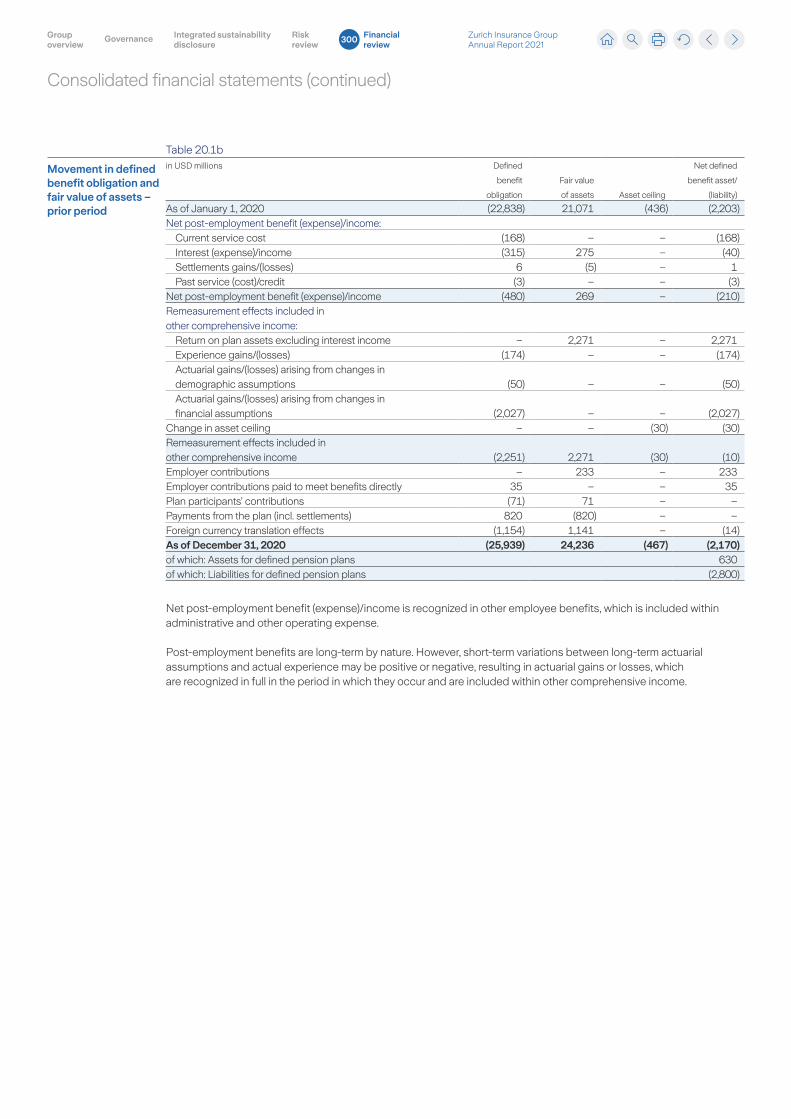
Consolidated financial statements (continued)
Table 20.1b
Movement in defined benefit obligation and fair value of assets – prior period
in USD millions Defined
benefit
obligation
Fair value
of assets Asset ceiling
Net defined
benefit asset/
(liability)
As of January 1, 2020 (22,838) 21,071 (436) (2,203)Net post-employment benefit (expense)/income:
Current service cost (168) – – (168)Interest (expense)/income (315) 275 – (40)Settlements gains/(losses) 6 (5) – 1Past service (cost)/credit (3) – – (3)
Net post-employment benefit (expense)/income (480) 269 – (210)Remeasurement effects included in other comprehensive income:
Return on plan assets excluding interest income – 2,271 – 2,271Experience gains/(losses) (174) – – (174)Actuarial gains/(losses) arising from changes in demographic assumptions (50) – – (50)Actuarial gains/(losses) arising from changes in financial assumptions (2,027) – – (2,027)
Change in asset ceiling – – (30) (30)Remeasurement effects included in other comprehensive income (2,251) 2,271 (30) (10)Employer contributions – 233 – 233Employer contributions paid to meet benefits directly 35 – – 35Plan participants’ contributions (71) 71 – –Payments from the plan (incl. settlements) 820 (820) – –Foreign currency translation effects (1,154) 1,141 – (14)As of December 31, 2020 (25,939) 24,236 (467) (2,170)of which: Assets for defined pension plans 630of which: Liabilities for defined pension plans (2,800)
Net post-employment benefit (expense)/income is recognized in other employee benefits, which is included within administrative and other operating expense.
Post-employment benefits are long-term by nature. However, short-term variations between long-term actuarial assumptions and actual experience may be positive or negative, resulting in actuarial gains or losses, which are recognized in full in the period in which they occur and are included within other comprehensive income.
Zurich Insurance Group Annual Report 2021
Group overview
Integrated sustainability disclosure
Governance Risk review
Financial review
300
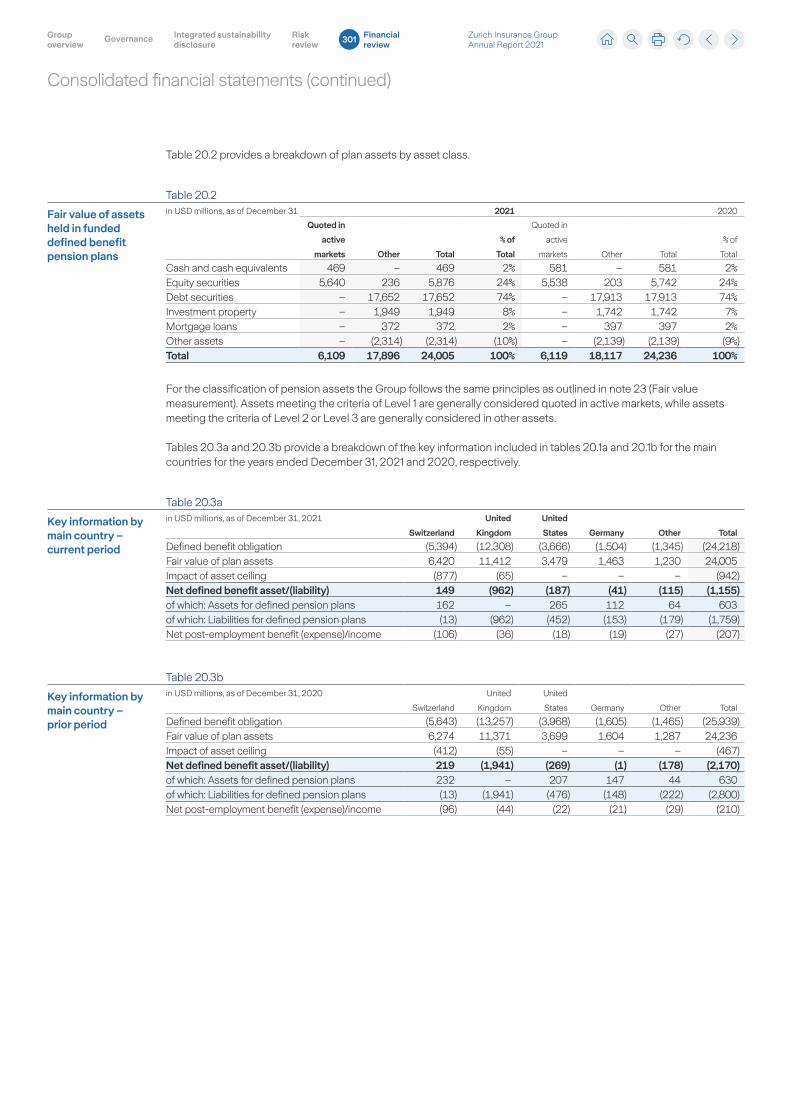
Consolidated financial statements (continued)
Table 20.2 provides a breakdown of plan assets by asset class.
Table 20.2
Fair value of assets held in funded defined benefit pension plans
in USD millions, as of December 31 2021 2020
Quoted in
active
markets Other Total
% of
Total
Quoted in
active
markets Other Total
% of
Total
Cash and cash equivalents 469 – 469 2% 581 – 581 2%Equity securities 5,640 236 5,876 24% 5,538 203 5,742 24%Debt securities – 17,652 17,652 74% – 17,913 17,913 74%Investment property – 1,949 1,949 8% – 1,742 1,742 7%Mortgage loans – 372 372 2% – 397 397 2%Other assets – (2,314) (2,314) (10%) – (2,139) (2,139) (9%)Total 6,109 17,896 24,005 100% 6,119 18,117 24,236 100%
For the classification of pension assets the Group follows the same principles as outlined in note 23 (Fair value measurement). Assets meeting the criteria of Level 1 are generally considered quoted in active markets, while assets meeting the criteria of Level 2 or Level 3 are generally considered in other assets.
Tables 20.3a and 20.3b provide a breakdown of the key information included in tables 20.1a and 20.1b for the main countries for the years ended December 31, 2021 and 2020, respectively.
Table 20.3a
Key information by main country – current period
in USD millions, as of December 31, 2021
Switzerland
United
Kingdom
United
States Germany Other Total
Defined benefit obligation (5,394) (12,308) (3,666) (1,504) (1,345) (24,218)Fair value of plan assets 6,420 11,412 3,479 1,463 1,230 24,005Impact of asset ceiling (877) (65) – – – (942)Net defined benefit asset/(liability) 149 (962) (187) (41) (115) (1,155)of which: Assets for defined pension plans 162 – 265 112 64 603of which: Liabilities for defined pension plans (13) (962) (452) (153) (179) (1,759)Net post-employment benefit (expense)/income (106) (36) (18) (19) (27) (207)
Table 20.3b
Key information by main country – prior period
in USD millions, as of December 31, 2020
Switzerland
United
Kingdom
United
States Germany Other Total
Defined benefit obligation (5,643) (13,257) (3,968) (1,605) (1,465) (25,939)Fair value of plan assets 6,274 11,371 3,699 1,604 1,287 24,236Impact of asset ceiling (412) (55) – – – (467)Net defined benefit asset/(liability) 219 (1,941) (269) (1) (178) (2,170)of which: Assets for defined pension plans 232 – 207 147 44 630of which: Liabilities for defined pension plans (13) (1,941) (476) (148) (222) (2,800)Net post-employment benefit (expense)/income (96) (44) (22) (21) (29) (210)
Zurich Insurance Group Annual Report 2021
Group overview
Integrated sustainability disclosure
Governance Risk review
Financial review
301
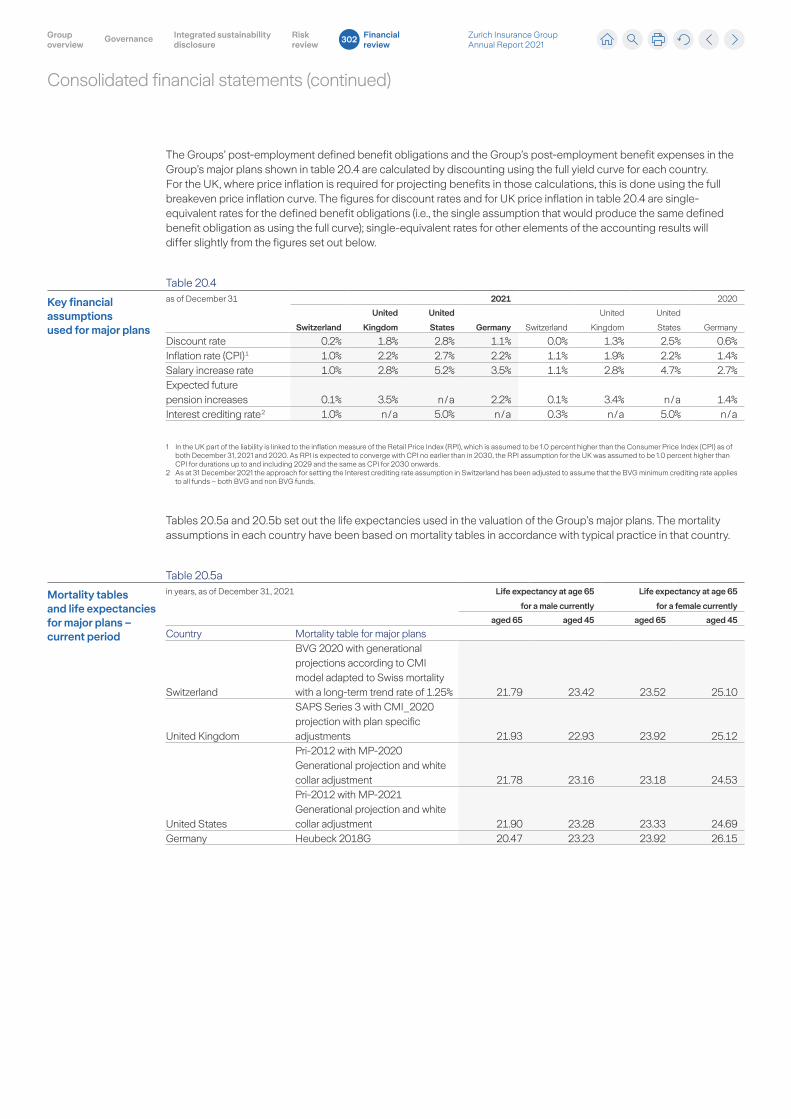
Consolidated financial statements (continued)
The Groups’ post-employment defined benefit obligations and the Group’s post-employment benefit expenses in the Group’s major plans shown in table 20.4 are calculated by discounting using the full yield curve for each country. For the UK, where price inflation is required for projecting benefits in those calculations, this is done using the full breakeven price inflation curve. The figures for discount rates and for UK price inflation in table 20.4 are single-equivalent rates for the defined benefit obligations (i.e., the single assumption that would produce the same defined benefit obligation as using the full curve); single-equivalent rates for other elements of the accounting results will differ slightly from the figures set out below.
Table 20.4
Key financial assumptions used for major plans
as of December 31 2021 2020
Switzerland
United
Kingdom
United
States Germany Switzerland
United
Kingdom
United
States Germany
Discount rate 0.2% 1.8% 2.8% 1.1% 0.0% 1.3% 2.5% 0.6%Inflation rate (CPI) 1 1.0% 2.2% 2.7% 2.2% 1.1% 1.9% 2.2% 1.4%Salary increase rate 1.0% 2.8% 5.2% 3.5% 1.1% 2.8% 4.7% 2.7%Expected future pension increases 0.1% 3.5% n / a 2.2% 0.1% 3.4% n / a 1.4%Interest crediting rate 2 1.0% n / a 5.0% n / a 0.3% n / a 5.0% n / a
1 In the UK part of the liability is linked to the inflation measure of the Retail Price Index (RPI), which is assumed to be 1.0 percent higher than the Consumer Price Index (CPI) as of both December 31, 2021 and 2020. As RPI is expected to converge with CPI no earlier than in 2030, the RPI assumption for the UK was assumed to be 1.0 percent higher than CPI for durations up to and including 2029 and the same as CPI for 2030 onwards.
2 As at 31 December 2021 the approach for setting the Interest crediting rate assumption in Switzerland has been adjusted to assume that the BVG minimum crediting rate applies to all funds – both BVG and non BVG funds.
Tables 20.5a and 20.5b set out the life expectancies used in the valuation of the Group’s major plans. The mortality assumptions in each country have been based on mortality tables in accordance with typical practice in that country.
Table 20.5a
Mortality tables and life expectancies for major plans – current period
in years, as of December 31, 2021 Life expectancy at age 65
for a male currently
Life expectancy at age 65
for a female currently
aged 65 aged 45 aged 65 aged 45
Country Mortality table for major plans
Switzerland
BVG 2020 with generational projections according to CMI model adapted to Swiss mortality with a long-term trend rate of 1.25% 21.79 23.42 23.52 25.10
United Kingdom
SAPS Series 3 with CMI_2020 projection with plan specific adjustments 21.93 22.93 23.92 25.12
United States
Pri-2012 with MP-2020 Generational projection and white collar adjustment 21.78 23.16 23.18 24.53 Pri-2012 with MP-2021 Generational projection and white collar adjustment 21.90 23.28 23.33 24.69
Germany Heubeck 2018G 20.47 23.23 23.92 26.15
Zurich Insurance Group Annual Report 2021
Group overview
Integrated sustainability disclosure
Governance Risk review
Financial review
302
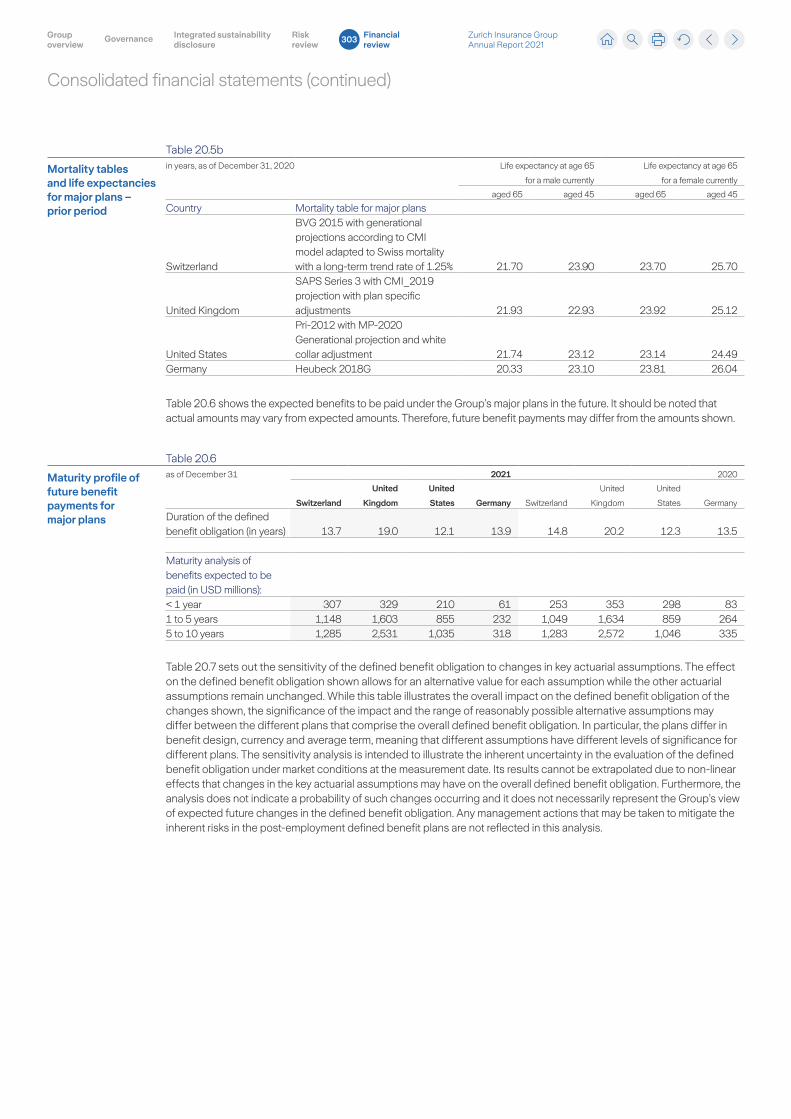
Consolidated financial statements (continued)
Table 20.5b
Mortality tables and life expectancies for major plans – prior period
in years, as of December 31, 2020 Life expectancy at age 65
for a male currently
Life expectancy at age 65
for a female currently
aged 65 aged 45 aged 65 aged 45
Country Mortality table for major plans
Switzerland
BVG 2015 with generational projections according to CMI model adapted to Swiss mortality with a long-term trend rate of 1.25% 21.70 23.90 23.70 25.70
United Kingdom
SAPS Series 3 with CMI_2019 projection with plan specific adjustments 21.93 22.93 23.92 25.12
United States
Pri-2012 with MP-2020 Generational projection and white collar adjustment 21.74 23.12 23.14 24.49
Germany Heubeck 2018G 20.33 23.10 23.81 26.04
Table 20.6 shows the expected benefits to be paid under the Group’s major plans in the future. It should be noted that actual amounts may vary from expected amounts. Therefore, future benefit payments may differ from the amounts shown.
Table 20.6
Maturity profile of future benefit payments for major plans
as of December 31 2021 2020
Switzerland
United
Kingdom
United
States Germany Switzerland
United
Kingdom
United
States Germany
Duration of the defined benefit obligation (in years) 13.7 19.0 12.1 13.9 14.8 20.2 12.3 13.5
Maturity analysis of benefits expected to be paid (in USD millions):< 1 year 307 329 210 61 253 353 298 83 1 to 5 years 1,148 1,603 855 232 1,049 1,634 859 264 5 to 10 years 1,285 2,531 1,035 318 1,283 2,572 1,046 335
Table 20.7 sets out the sensitivity of the defined benefit obligation to changes in key actuarial assumptions. The effect on the defined benefit obligation shown allows for an alternative value for each assumption while the other actuarial assumptions remain unchanged. While this table illustrates the overall impact on the defined benefit obligation of the changes shown, the significance of the impact and the range of reasonably possible alternative assumptions may differ between the different plans that comprise the overall defined benefit obligation. In particular, the plans differ in benefit design, currency and average term, meaning that different assumptions have different levels of significance for different plans. The sensitivity analysis is intended to illustrate the inherent uncertainty in the evaluation of the defined benefit obligation under market conditions at the measurement date. Its results cannot be extrapolated due to non-linear effects that changes in the key actuarial assumptions may have on the overall defined benefit obligation. Furthermore, the analysis does not indicate a probability of such changes occurring and it does not necessarily represent the Group’s view of expected future changes in the defined benefit obligation. Any management actions that may be taken to mitigate the inherent risks in the post-employment defined benefit plans are not reflected in this analysis.
Zurich Insurance Group Annual Report 2021
Group overview
Integrated sustainability disclosure
Governance Risk review
Financial review
303
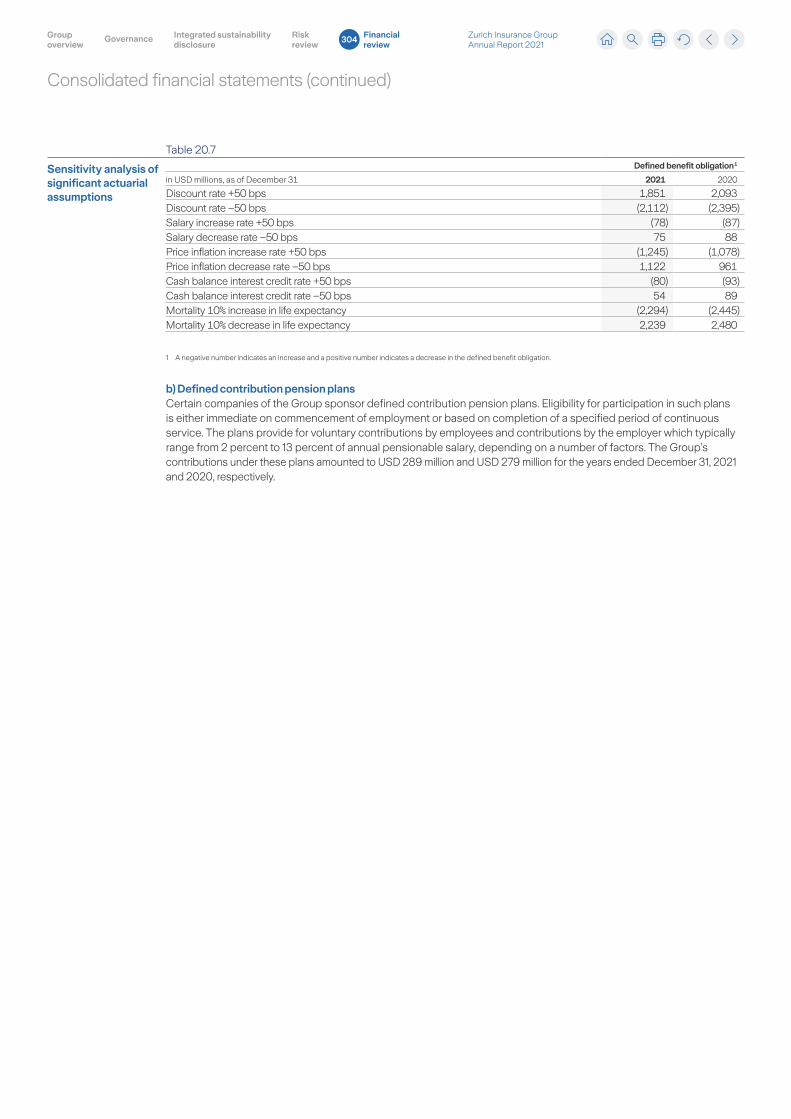
Consolidated financial statements (continued)
Table 20.7
Sensitivity analysis of significant actuarial assumptions
Defined benefit obligation 1
in USD millions, as of December 31 2021 2020
Discount rate +50 bps 1,851 2,093 Discount rate –50 bps (2,112) (2,395)Salary increase rate +50 bps (78) (87)Salary decrease rate –50 bps 75 88 Price inflation increase rate +50 bps (1,245) (1,078)Price inflation decrease rate –50 bps 1,122 961 Cash balance interest credit rate +50 bps (80) (93)Cash balance interest credit rate –50 bps 54 89 Mortality 10% increase in life expectancy (2,294) (2,445)Mortality 10% decrease in life expectancy 2,239 2,480
1 A negative number indicates an increase and a positive number indicates a decrease in the defined benefit obligation.
b) Defined contribution pension plansCertain companies of the Group sponsor defined contribution pension plans. Eligibility for participation in such plans is either immediate on commencement of employment or based on completion of a specified period of continuous service. The plans provide for voluntary contributions by employees and contributions by the employer which typically range from 2 percent to 13 percent of annual pensionable salary, depending on a number of factors. The Group’s contributions under these plans amounted to USD 289 million and USD 279 million for the years ended December 31, 2021 and 2020, respectively.
Zurich Insurance Group Annual Report 2021
Group overview
Integrated sustainability disclosure
Governance Risk review
Financial review
304
Consolidated financial statements (continued)
21. Share-based compensation and cash incentive plans
The Group has adopted various share-based compensation and cash incentive plans to attract, retain and motivate employees. The plans are designed to reward employees for their contribution to the performance of the Group and to encourage employee share ownership. Share-based compensation plans include performance-based share plans and employee share purchase plans. Share-based compensation plans are based on the provision of Zurich Insurance Group Ltd shares.
a) Cash incentive plansThe Group’s short-term incentive plan (STIP) is utilized across the Group and, in many countries covers all employees in that country who are selected to participate in a short-term incentive plan. In addition, there may be other local short-term incentive plans in place. Awards are made in cash, based on the accomplishment of both organizational and individual performance objectives. The expense recognized for these cash incentive plans amounted to USD 597 million and USD 532 million for the years ended December 31, 2021 and 2020, respectively.
b) Share-based compensation plans for employeesThe Group encourages employees to own shares in Zurich Insurance Group Ltd and has set up a framework based on the implementation of performance share programs. Actual plans are tailored to meet local market requirements.
The cost of share-based payments depends on various factors, including achievement of targets, and are subject to the discretion of the Remuneration Committee and the Board. Costs may therefore vary significantly from year to year. The net amounts of USD 279 million and USD 187 million for the years ended December 31, 2021 and 2020, respectively, reflect all aspects of share-based compensation, including adjustments made during the year.
The explanations below provide a more detailed overview of the main plans of the Group.
Employee share plansShare incentive plans for employees in the UKThe Group established an Inland Revenue approved Share Incentive Plan and launched the Partnership Shares element of this plan in 2003, which enabled participating employees to make monthly purchases of Zurich Insurance Group Ltd shares at the prevailing market price from their gross earnings. This plan was terminated in 2007. There were 16 and 25 participants in the plan as of December 31, 2021 and 2020, respectively.
A revised Partnership Share Scheme was launched in March 2013. Participants benefit from purchasing shares by making deductions from gross salary up to a maximum of GBP 1,800 or 10 percent of their year-to-date earnings. There were 694 and 690 active participants in the plan as of December 31, 2021 and 2020, respectively.
The Group also operates a profit-sharing element of the Share Incentive Plan (Reward Shares) which was launched in 2004 with annual share allocations being made in May each year subject to business performance. The awards are based on business operating profit (BOP) after tax for the year achieved by the business unit of each participating employee. Individual awards are subject to a maximum of 5 percent of a participant’s base salary (before any flexible benefit adjustments) with an overall maximum of GBP 3,600. The total number of participating employees in Reward Shares as of December 31, 2021 and 2020 was 3,997 and 4,280, respectively.
A Dividend Shares scheme was launched in 2014 which allows employees to reinvest their dividends from Partnership Shares and Reward Shares. As of December 31, 2021 and 2020, there were 564 and 522 participants in the scheme, respectively.
Share incentive plan for employees in SwitzerlandUnder the Employee Share Plan, eligible employees are allowed to acquire sales-restricted shares at a 30 percent discount to the market value. The maximum permitted investment at the preferential price in shares is equivalent to CHF 3,500 per employee per annum. During 2021, 4,383 employees were eligible to participate in the plan, compared with 4,145 in 2020. For the years ended December 31, 2021 and 2020, 2,240 and 2,080 employees, respectively, purchased shares under the 2020 and 2021 share plans.
The Group Long-Term Incentive Plan (LTIP)Participants in this plan are allocated a target number of performance shares units (PSUs) as notional shares of Zurich Insurance Group Ltd in April each year. The number of PSUs is calculated as a percentage of the annual base salary of each participant. To further align participants with the interests of shareholders, PSUs are credited with dividend equivalent units (DEUs) during the vesting period to compensate participants in LTIP for dividends paid to shareholders.
Zurich Insurance Group Annual Report 2021
Group overview
Integrated sustainability disclosure
Governance Risk review
Financial review
305
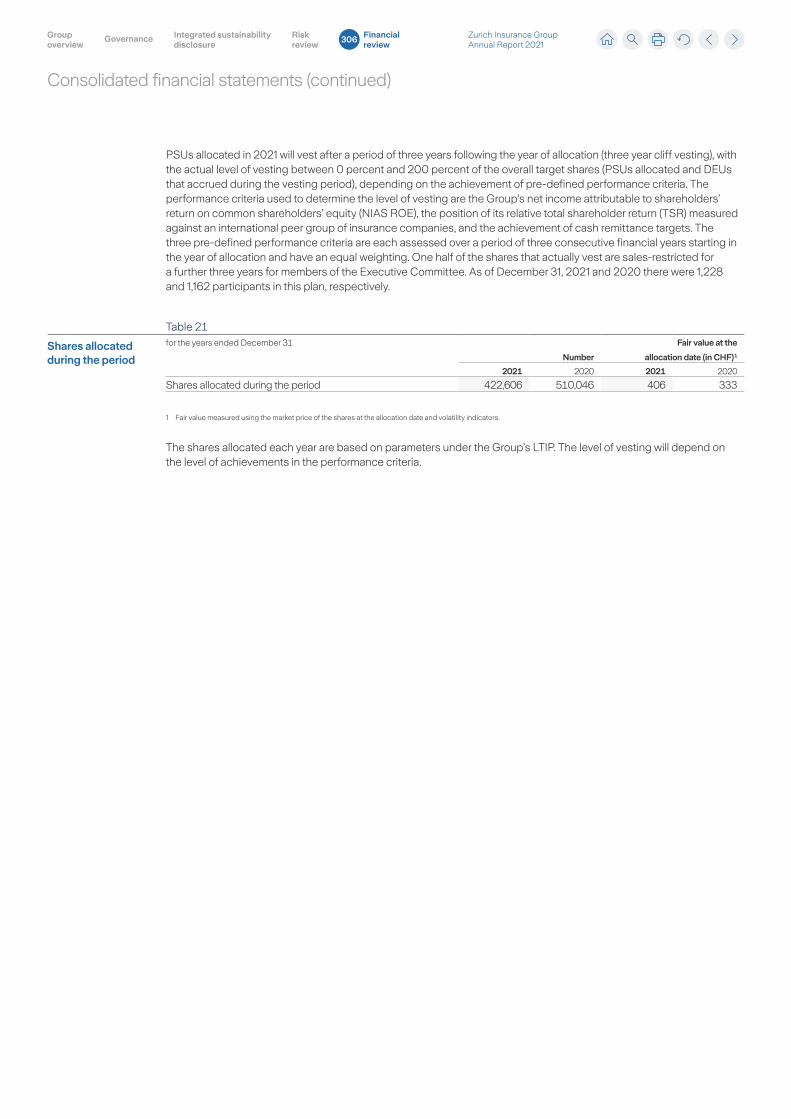
Consolidated financial statements (continued)
PSUs allocated in 2021 will vest after a period of three years following the year of allocation (three year cliff vesting), with the actual level of vesting between 0 percent and 200 percent of the overall target shares (PSUs allocated and DEUs that accrued during the vesting period), depending on the achievement of pre-defined performance criteria. The performance criteria used to determine the level of vesting are the Group’s net income attributable to shareholders’ return on common shareholders’ equity (NIAS ROE), the position of its relative total shareholder return (TSR) measured against an international peer group of insurance companies, and the achievement of cash remittance targets. The three pre-defined performance criteria are each assessed over a period of three consecutive financial years starting in the year of allocation and have an equal weighting. One half of the shares that actually vest are sales-restricted for a further three years for members of the Executive Committee. As of December 31, 2021 and 2020 there were 1,228 and 1,162 participants in this plan, respectively.
Table 21
Shares allocated during the period
for the years ended December 31
Number
Fair value at the
allocation date (in CHF) 1
2021 2020 2021 2020
Shares allocated during the period 422,606 510,046 406 333
1 Fair value measured using the market price of the shares at the allocation date and volatility indicators.
The shares allocated each year are based on parameters under the Group’s LTIP. The level of vesting will depend on the level of achievements in the performance criteria.
Zurich Insurance Group Annual Report 2021
Group overview
Integrated sustainability disclosure
Governance Risk review
Financial review
306
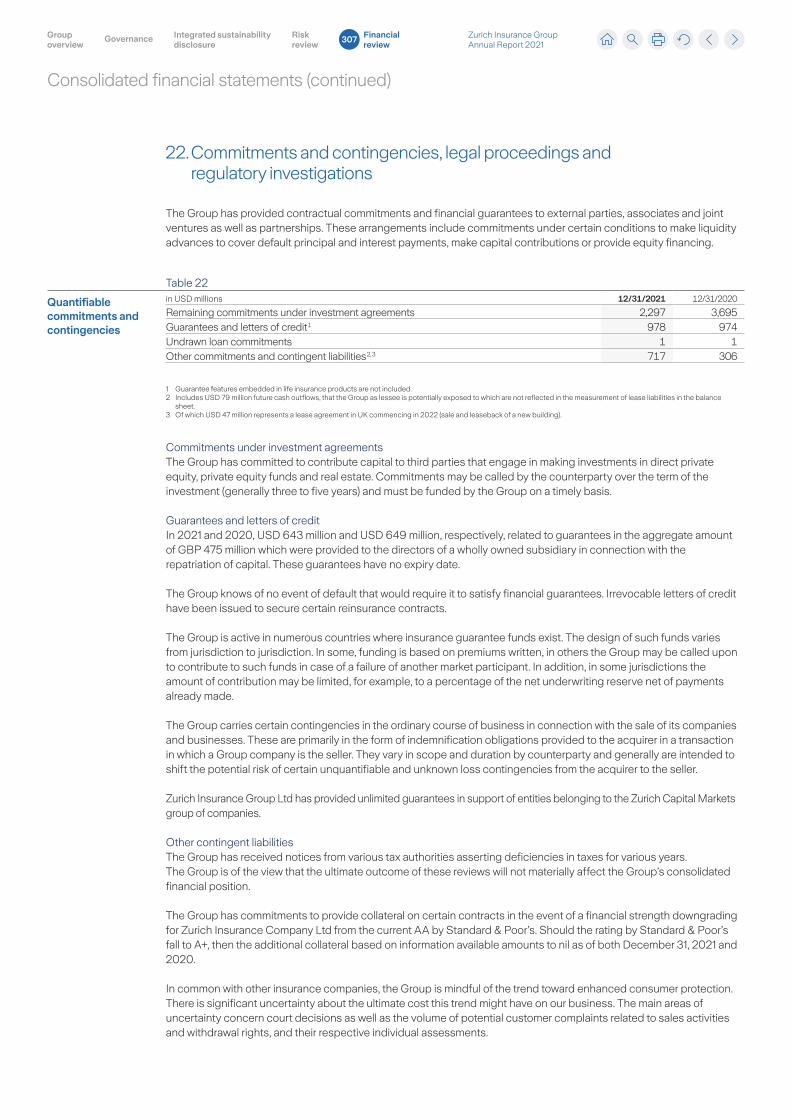
Consolidated financial statements (continued)
22. Commitments and contingencies, legal proceedings and regulatory investigations
The Group has provided contractual commitments and financial guarantees to external parties, associates and joint ventures as well as partnerships. These arrangements include commitments under certain conditions to make liquidity advances to cover default principal and interest payments, make capital contributions or provide equity financing.
Table 22
Quantifiable commitments and contingencies
in USD millions 12/31/2021 12/31/2020
Remaining commitments under investment agreements 2,297 3,695Guarantees and letters of credit 1 978 974Undrawn loan commitments 1 1Other commitments and contingent liabilities 2, 3 717 306
1 Guarantee features embedded in life insurance products are not included.2 Includes USD 79 million future cash outflows, that the Group as lessee is potentially exposed to which are not reflected in the measurement of lease liabilities in the balance
sheet.3 Of which USD 47 million represents a lease agreement in UK commencing in 2022 (sale and leaseback of a new building).
Commitments under investment agreementsThe Group has committed to contribute capital to third parties that engage in making investments in direct private equity, private equity funds and real estate. Commitments may be called by the counterparty over the term of the investment (generally three to five years) and must be funded by the Group on a timely basis.
Guarantees and letters of creditIn 2021 and 2020, USD 643 million and USD 649 million, respectively, related to guarantees in the aggregate amount of GBP 475 million which were provided to the directors of a wholly owned subsidiary in connection with the repatriation of capital. These guarantees have no expiry date.
The Group knows of no event of default that would require it to satisfy financial guarantees. Irrevocable letters of credit have been issued to secure certain reinsurance contracts.
The Group is active in numerous countries where insurance guarantee funds exist. The design of such funds varies from jurisdiction to jurisdiction. In some, funding is based on premiums written, in others the Group may be called upon to contribute to such funds in case of a failure of another market participant. In addition, in some jurisdictions the amount of contribution may be limited, for example, to a percentage of the net underwriting reserve net of payments already made.
The Group carries certain contingencies in the ordinary course of business in connection with the sale of its companies and businesses. These are primarily in the form of indemnification obligations provided to the acquirer in a transaction in which a Group company is the seller. They vary in scope and duration by counterparty and generally are intended to shift the potential risk of certain unquantifiable and unknown loss contingencies from the acquirer to the seller.
Zurich Insurance Group Ltd has provided unlimited guarantees in support of entities belonging to the Zurich Capital Markets group of companies.
Other contingent liabilitiesThe Group has received notices from various tax authorities asserting deficiencies in taxes for various years. The Group is of the view that the ultimate outcome of these reviews will not materially affect the Group’s consolidated financial position.
The Group has commitments to provide collateral on certain contracts in the event of a financial strength downgrading for Zurich Insurance Company Ltd from the current AA by Standard & Poor’s. Should the rating by Standard & Poor’s fall to A+, then the additional collateral based on information available amounts to nil as of both December 31, 2021 and 2020.
In common with other insurance companies, the Group is mindful of the trend toward enhanced consumer protection. There is significant uncertainty about the ultimate cost this trend might have on our business. The main areas of uncertainty concern court decisions as well as the volume of potential customer complaints related to sales activities and withdrawal rights, and their respective individual assessments.
Zurich Insurance Group Annual Report 2021
Group overview
Integrated sustainability disclosure
Governance Risk review
Financial review
307
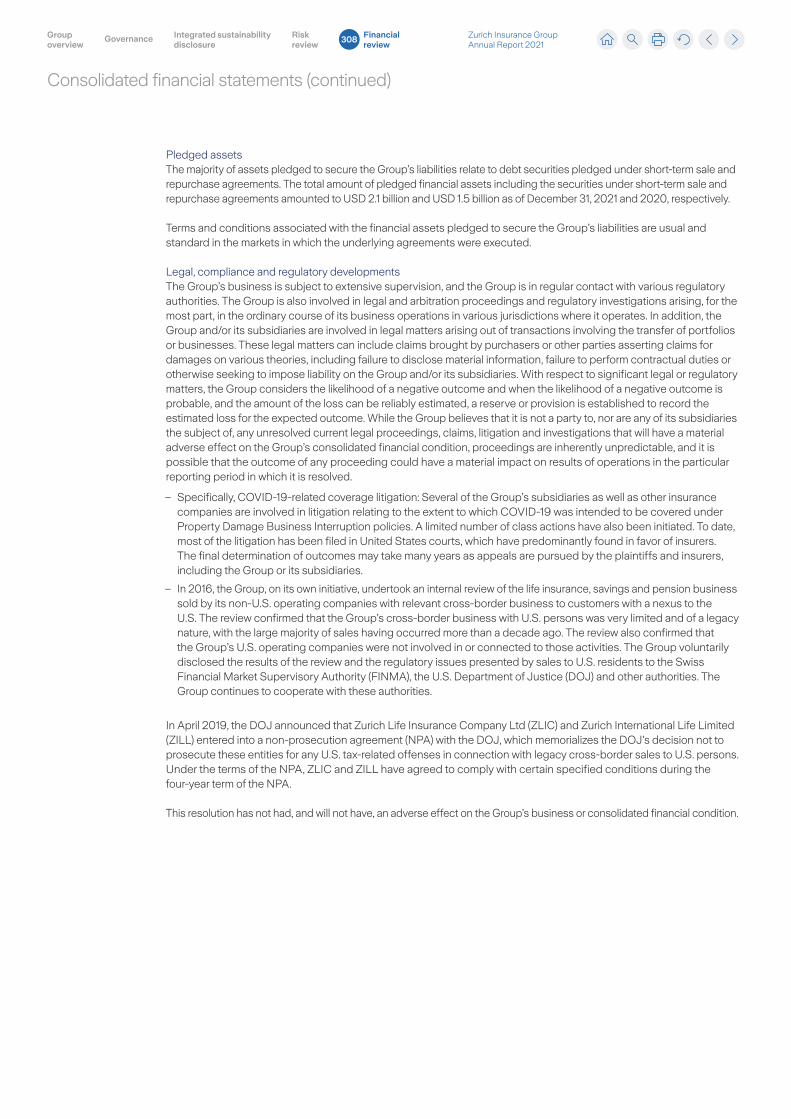
Consolidated financial statements (continued)
Pledged assetsThe majority of assets pledged to secure the Group’s liabilities relate to debt securities pledged under short-term sale and repurchase agreements. The total amount of pledged financial assets including the securities under short-term sale and repurchase agreements amounted to USD 2.1 billion and USD 1.5 billion as of December 31, 2021 and 2020, respectively.
Terms and conditions associated with the financial assets pledged to secure the Group’s liabilities are usual and standard in the markets in which the underlying agreements were executed.
Legal, compliance and regulatory developmentsThe Group’s business is subject to extensive supervision, and the Group is in regular contact with various regulatory authorities. The Group is also involved in legal and arbitration proceedings and regulatory investigations arising, for the most part, in the ordinary course of its business operations in various jurisdictions where it operates. In addition, the Group and/or its subsidiaries are involved in legal matters arising out of transactions involving the transfer of portfolios or businesses. These legal matters can include claims brought by purchasers or other parties asserting claims for damages on various theories, including failure to disclose material information, failure to perform contractual duties or otherwise seeking to impose liability on the Group and/or its subsidiaries. With respect to significant legal or regulatory matters, the Group considers the likelihood of a negative outcome and when the likelihood of a negative outcome is probable, and the amount of the loss can be reliably estimated, a reserve or provision is established to record the estimated loss for the expected outcome. While the Group believes that it is not a party to, nor are any of its subsidiaries the subject of, any unresolved current legal proceedings, claims, litigation and investigations that will have a material adverse effect on the Group’s consolidated financial condition, proceedings are inherently unpredictable, and it is possible that the outcome of any proceeding could have a material impact on results of operations in the particular reporting period in which it is resolved.
– Specifically, COVID-19-related coverage litigation: Several of the Group’s subsidiaries as well as other insurance companies are involved in litigation relating to the extent to which COVID-19 was intended to be covered under Property Damage Business Interruption policies. A limited number of class actions have also been initiated. To date, most of the litigation has been filed in United States courts, which have predominantly found in favor of insurers. The final determination of outcomes may take many years as appeals are pursued by the plaintiffs and insurers, including the Group or its subsidiaries.
– In 2016, the Group, on its own initiative, undertook an internal review of the life insurance, savings and pension business sold by its non-U.S. operating companies with relevant cross-border business to customers with a nexus to the U.S. The review confirmed that the Group’s cross-border business with U.S. persons was very limited and of a legacy nature, with the large majority of sales having occurred more than a decade ago. The review also confirmed that the Group’s U.S. operating companies were not involved in or connected to those activities. The Group voluntarily disclosed the results of the review and the regulatory issues presented by sales to U.S. residents to the Swiss Financial Market Supervisory Authority (FINMA), the U.S. Department of Justice (DOJ) and other authorities. The Group continues to cooperate with these authorities.
In April 2019, the DOJ announced that Zurich Life Insurance Company Ltd (ZLIC) and Zurich International Life Limited (ZILL) entered into a non-prosecution agreement (NPA) with the DOJ, which memorializes the DOJ’s decision not to prosecute these entities for any U.S. tax-related offenses in connection with legacy cross-border sales to U.S. persons. Under the terms of the NPA, ZLIC and ZILL have agreed to comply with certain specified conditions during the four-year term of the NPA.
This resolution has not had, and will not have, an adverse effect on the Group’s business or consolidated financial condition.
Zurich Insurance Group Annual Report 2021
Group overview
Integrated sustainability disclosure
Governance Risk review
Financial review
308
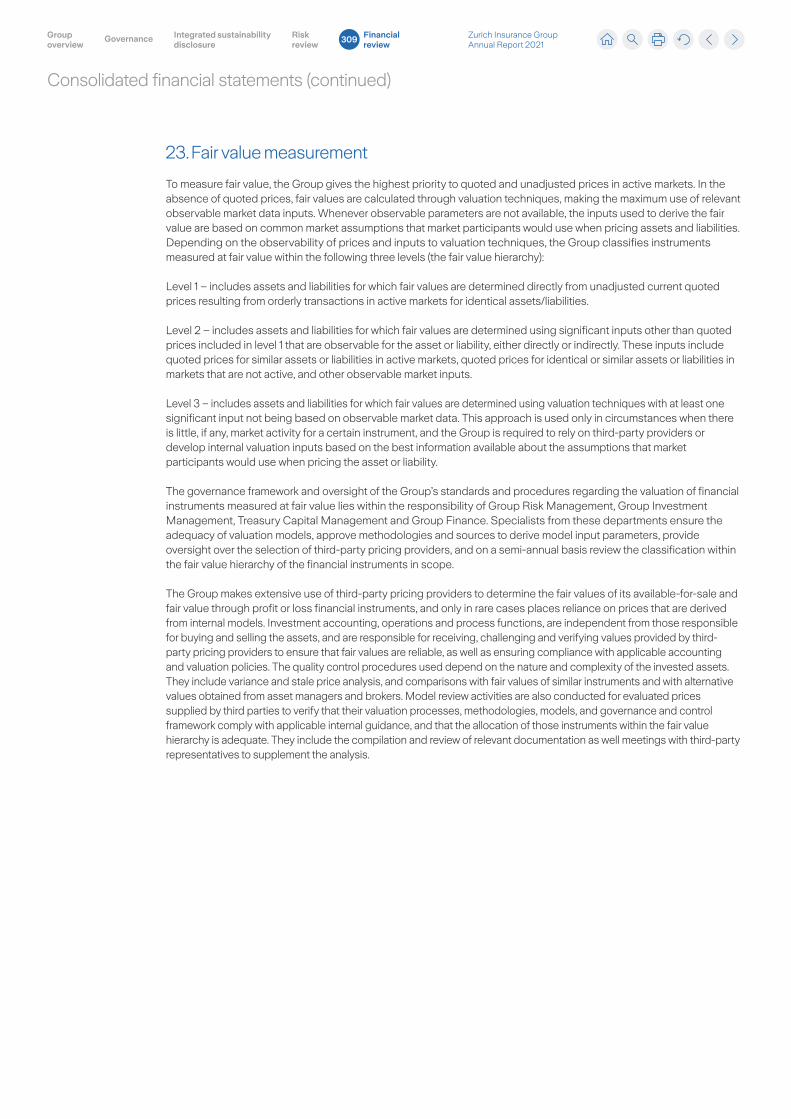
Consolidated financial statements (continued)
23. Fair value measurement
To measure fair value, the Group gives the highest priority to quoted and unadjusted prices in active markets. In the absence of quoted prices, fair values are calculated through valuation techniques, making the maximum use of relevant observable market data inputs. Whenever observable parameters are not available, the inputs used to derive the fair value are based on common market assumptions that market participants would use when pricing assets and liabilities. Depending on the observability of prices and inputs to valuation techniques, the Group classifies instruments measured at fair value within the following three levels (the fair value hierarchy):
Level 1 – includes assets and liabilities for which fair values are determined directly from unadjusted current quoted prices resulting from orderly transactions in active markets for identical assets/liabilities.
Level 2 – includes assets and liabilities for which fair values are determined using significant inputs other than quoted prices included in level 1 that are observable for the asset or liability, either directly or indirectly. These inputs include quoted prices for similar assets or liabilities in active markets, quoted prices for identical or similar assets or liabilities in markets that are not active, and other observable market inputs.
Level 3 – includes assets and liabilities for which fair values are determined using valuation techniques with at least one significant input not being based on observable market data. This approach is used only in circumstances when there is little, if any, market activity for a certain instrument, and the Group is required to rely on third-party providers or develop internal valuation inputs based on the best information available about the assumptions that market participants would use when pricing the asset or liability.
The governance framework and oversight of the Group’s standards and procedures regarding the valuation of financial instruments measured at fair value lies within the responsibility of Group Risk Management, Group Investment Management, Treasury Capital Management and Group Finance. Specialists from these departments ensure the adequacy of valuation models, approve methodologies and sources to derive model input parameters, provide oversight over the selection of third-party pricing providers, and on a semi-annual basis review the classification within the fair value hierarchy of the financial instruments in scope.
The Group makes extensive use of third-party pricing providers to determine the fair values of its available-for-sale and fair value through profit or loss financial instruments, and only in rare cases places reliance on prices that are derived from internal models. Investment accounting, operations and process functions, are independent from those responsible for buying and selling the assets, and are responsible for receiving, challenging and verifying values provided by third-party pricing providers to ensure that fair values are reliable, as well as ensuring compliance with applicable accounting and valuation policies. The quality control procedures used depend on the nature and complexity of the invested assets. They include variance and stale price analysis, and comparisons with fair values of similar instruments and with alternative values obtained from asset managers and brokers. Model review activities are also conducted for evaluated prices supplied by third parties to verify that their valuation processes, methodologies, models, and governance and control framework comply with applicable internal guidance, and that the allocation of those instruments within the fair value hierarchy is adequate. They include the compilation and review of relevant documentation as well meetings with third-party representatives to supplement the analysis.
Zurich Insurance Group Annual Report 2021
Group overview
Integrated sustainability disclosure
Governance Risk review
Financial review
309
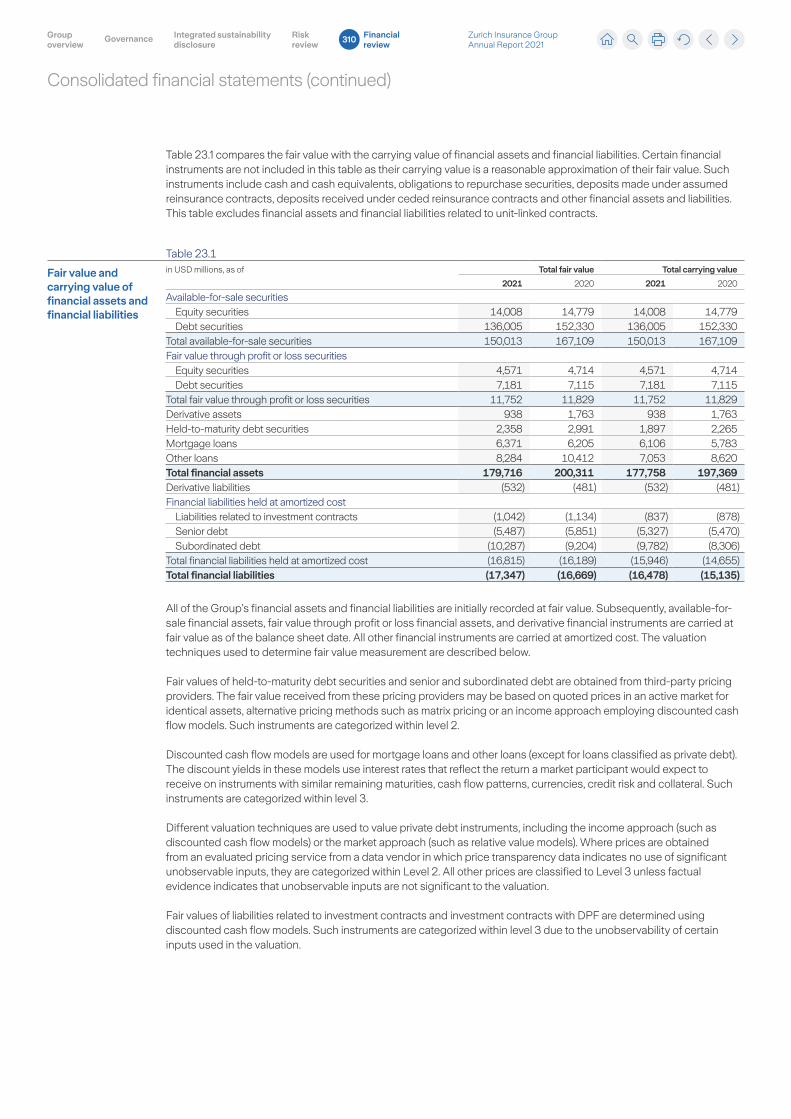
Consolidated financial statements (continued)
Table 23.1 compares the fair value with the carrying value of financial assets and financial liabilities. Certain financial instruments are not included in this table as their carrying value is a reasonable approximation of their fair value. Such instruments include cash and cash equivalents, obligations to repurchase securities, deposits made under assumed reinsurance contracts, deposits received under ceded reinsurance contracts and other financial assets and liabilities. This table excludes financial assets and financial liabilities related to unit-linked contracts.
Table 23.1
Fair value and carrying value of financial assets and financial liabilities
in USD millions, as of Total fair value Total carrying value
2021 2020 2021 2020
Available-for-sale securitiesEquity securities 14,008 14,779 14,008 14,779Debt securities 136,005 152,330 136,005 152,330
Total available-for-sale securities 150,013 167,109 150,013 167,109Fair value through profit or loss securities
Equity securities 4,571 4,714 4,571 4,714Debt securities 7,181 7,115 7,181 7,115
Total fair value through profit or loss securities 11,752 11,829 11,752 11,829Derivative assets 938 1,763 938 1,763Held-to-maturity debt securities 2,358 2,991 1,897 2,265Mortgage loans 6,371 6,205 6,106 5,783Other loans 8,284 10,412 7,053 8,620Total financial assets 179,716 200,311 177,758 197,369Derivative liabilities (532) (481) (532) (481)Financial liabilities held at amortized cost
Liabilities related to investment contracts (1,042) (1,134) (837) (878)Senior debt (5,487) (5,851) (5,327) (5,470)Subordinated debt (10,287) (9,204) (9,782) (8,306)
Total financial liabilities held at amortized cost (16,815) (16,189) (15,946) (14,655)Total financial liabilities (17,347) (16,669) (16,478) (15,135)
All of the Group’s financial assets and financial liabilities are initially recorded at fair value. Subsequently, available-for-sale financial assets, fair value through profit or loss financial assets, and derivative financial instruments are carried at fair value as of the balance sheet date. All other financial instruments are carried at amortized cost. The valuation techniques used to determine fair value measurement are described below.
Fair values of held-to-maturity debt securities and senior and subordinated debt are obtained from third-party pricing providers. The fair value received from these pricing providers may be based on quoted prices in an active market for identical assets, alternative pricing methods such as matrix pricing or an income approach employing discounted cash flow models. Such instruments are categorized within level 2.
Discounted cash flow models are used for mortgage loans and other loans (except for loans classified as private debt). The discount yields in these models use interest rates that reflect the return a market participant would expect to receive on instruments with similar remaining maturities, cash flow patterns, currencies, credit risk and collateral. Such instruments are categorized within level 3.
Different valuation techniques are used to value private debt instruments, including the income approach (such as discounted cash flow models) or the market approach (such as relative value models). Where prices are obtained from an evaluated pricing service from a data vendor in which price transparency data indicates no use of significant unobservable inputs, they are categorized within Level 2. All other prices are classified to Level 3 unless factual evidence indicates that unobservable inputs are not significant to the valuation.
Fair values of liabilities related to investment contracts and investment contracts with DPF are determined using discounted cash flow models. Such instruments are categorized within level 3 due to the unobservability of certain inputs used in the valuation.
Zurich Insurance Group Annual Report 2021
Group overview
Integrated sustainability disclosure
Governance Risk review
Financial review
310
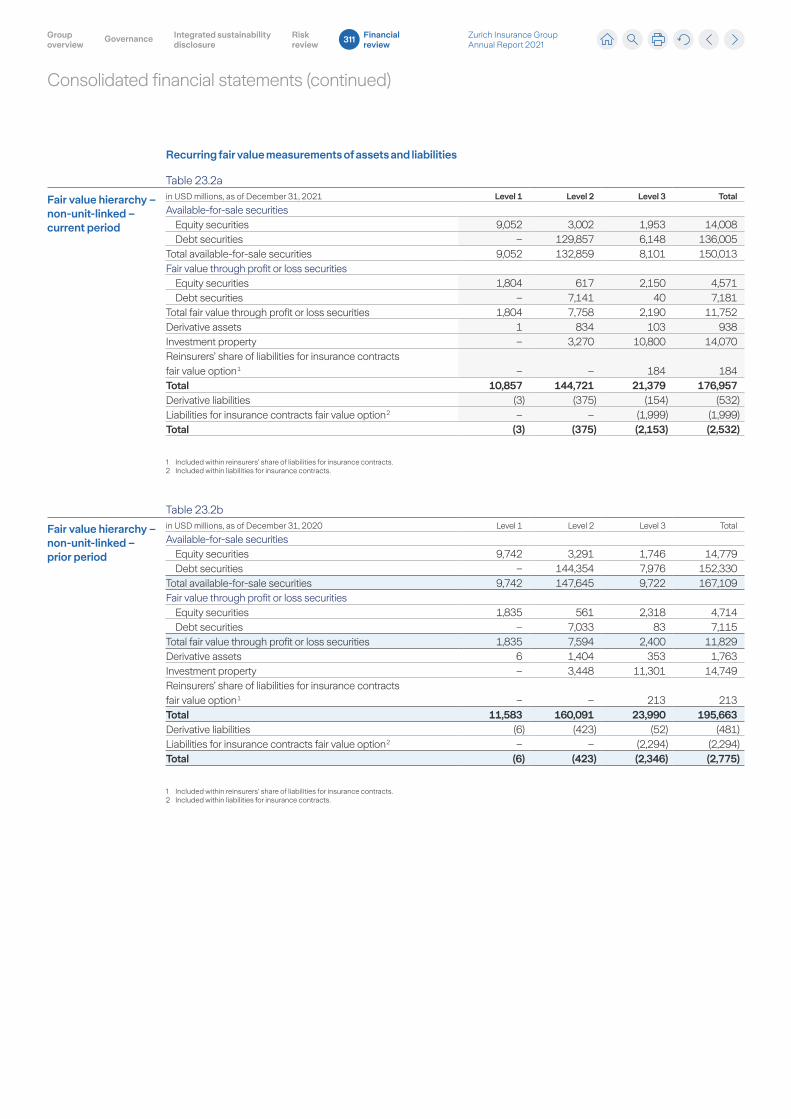
Consolidated financial statements (continued)
Recurring fair value measurements of assets and liabilities
Table 23.2a
Fair value hierarchy – non-unit-linked – current period
in USD millions, as of December 31, 2021 Level 1 Level 2 Level 3 Total
Available-for-sale securitiesEquity securities 9,052 3,002 1,953 14,008Debt securities – 129,857 6,148 136,005
Total available-for-sale securities 9,052 132,859 8,101 150,013Fair value through profit or loss securities
Equity securities 1,804 617 2,150 4,571Debt securities – 7,141 40 7,181
Total fair value through profit or loss securities 1,804 7,758 2,190 11,752Derivative assets 1 834 103 938Investment property – 3,270 10,800 14,070Reinsurers’ share of liabilities for insurance contracts fair value option 1 – – 184 184Total 10,857 144,721 21,379 176,957Derivative liabilities (3) (375) (154) (532)Liabilities for insurance contracts fair value option 2 – – (1,999) (1,999)Total (3) (375) (2,153) (2,532)
1 Included within reinsurers’ share of liabilities for insurance contracts.2 Included within liabilities for insurance contracts.
Table 23.2b
Fair value hierarchy – non-unit-linked – prior period
in USD millions, as of December 31, 2020 Level 1 Level 2 Level 3 Total
Available-for-sale securitiesEquity securities 9,742 3,291 1,746 14,779Debt securities – 144,354 7,976 152,330
Total available-for-sale securities 9,742 147,645 9,722 167,109Fair value through profit or loss securities
Equity securities 1,835 561 2,318 4,714Debt securities – 7,033 83 7,115
Total fair value through profit or loss securities 1,835 7,594 2,400 11,829Derivative assets 6 1,404 353 1,763Investment property – 3,448 11,301 14,749Reinsurers’ share of liabilities for insurance contracts fair value option 1 – – 213 213Total 11,583 160,091 23,990 195,663Derivative liabilities (6) (423) (52) (481)Liabilities for insurance contracts fair value option 2 – – (2,294) (2,294)Total (6) (423) (2,346) (2,775)
1 Included within reinsurers’ share of liabilities for insurance contracts.2 Included within liabilities for insurance contracts.
Zurich Insurance Group Annual Report 2021
Group overview
Integrated sustainability disclosure
Governance Risk review
Financial review
311
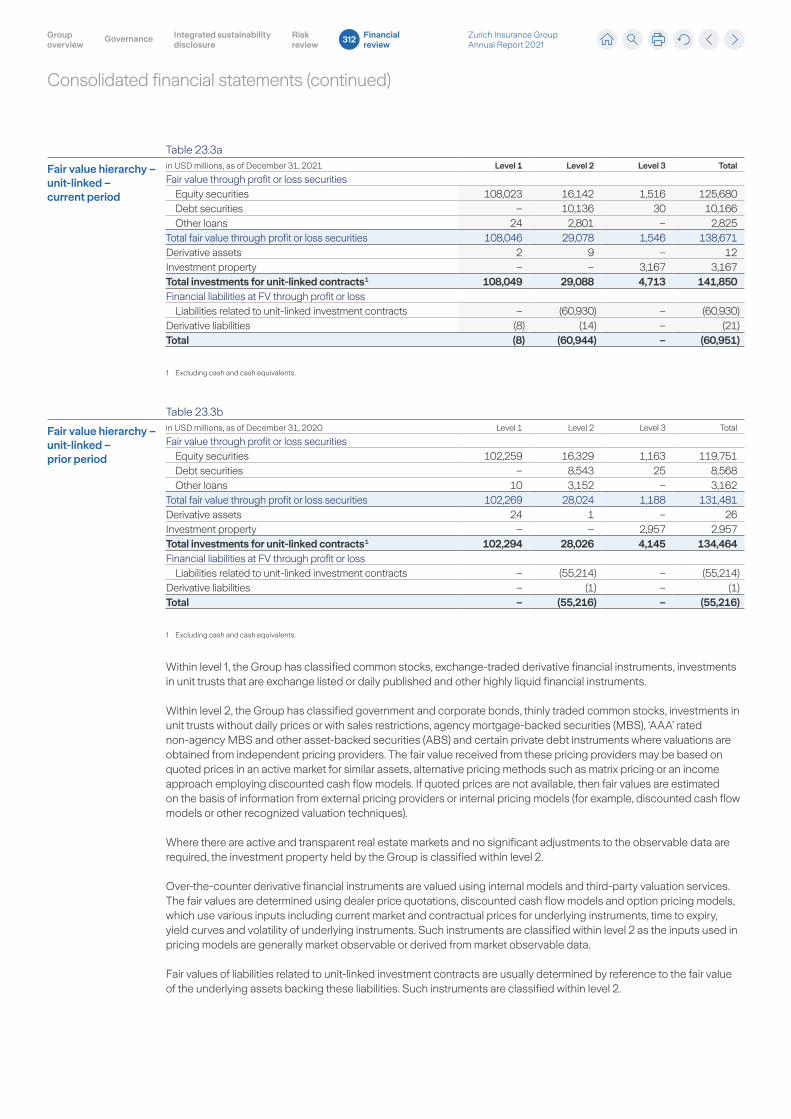
Consolidated financial statements (continued)
Table 23.3a
Fair value hierarchy – unit-linked – current period
in USD millions, as of December 31, 2021 Level 1 Level 2 Level 3 Total
Fair value through profit or loss securitiesEquity securities 108,023 16,142 1,516 125,680Debt securities – 10,136 30 10,166Other loans 24 2,801 – 2,825
Total fair value through profit or loss securities 108,046 29,078 1,546 138,671Derivative assets 2 9 – 12Investment property – – 3,167 3,167Total investments for unit-linked contracts 1 108,049 29,088 4,713 141,850Financial liabilities at FV through profit or loss
Liabilities related to unit-linked investment contracts – (60,930) – (60,930)Derivative liabilities (8) (14) – (21)Total (8) (60,944) – (60,951)
1 Excluding cash and cash equivalents.
Table 23.3b
Fair value hierarchy – unit-linked – prior period
in USD millions, as of December 31, 2020 Level 1 Level 2 Level 3 Total
Fair value through profit or loss securitiesEquity securities 102,259 16,329 1,163 119,751Debt securities – 8,543 25 8,568Other loans 10 3,152 – 3,162
Total fair value through profit or loss securities 102,269 28,024 1,188 131,481Derivative assets 24 1 – 26Investment property – – 2,957 2,957Total investments for unit-linked contracts 1 102,294 28,026 4,145 134,464Financial liabilities at FV through profit or loss
Liabilities related to unit-linked investment contracts – (55,214) – (55,214)Derivative liabilities – (1) – (1)Total – (55,216) – (55,216)
1 Excluding cash and cash equivalents.
Within level 1, the Group has classified common stocks, exchange-traded derivative financial instruments, investments in unit trusts that are exchange listed or daily published and other highly liquid financial instruments.
Within level 2, the Group has classified government and corporate bonds, thinly traded common stocks, investments in unit trusts without daily prices or with sales restrictions, agency mortgage-backed securities (MBS), ‘AAA’ rated non-agency MBS and other asset-backed securities (ABS) and certain private debt instruments where valuations are obtained from independent pricing providers. The fair value received from these pricing providers may be based on quoted prices in an active market for similar assets, alternative pricing methods such as matrix pricing or an income approach employing discounted cash flow models. If quoted prices are not available, then fair values are estimated on the basis of information from external pricing providers or internal pricing models (for example, discounted cash flow models or other recognized valuation techniques).
Where there are active and transparent real estate markets and no significant adjustments to the observable data are required, the investment property held by the Group is classified within level 2.
Over-the-counter derivative financial instruments are valued using internal models and third-party valuation services. The fair values are determined using dealer price quotations, discounted cash flow models and option pricing models, which use various inputs including current market and contractual prices for underlying instruments, time to expiry, yield curves and volatility of underlying instruments. Such instruments are classified within level 2 as the inputs used in pricing models are generally market observable or derived from market observable data.
Fair values of liabilities related to unit-linked investment contracts are usually determined by reference to the fair value of the underlying assets backing these liabilities. Such instruments are classified within level 2.
Zurich Insurance Group Annual Report 2021
Group overview
Integrated sustainability disclosure
Governance Risk review
Financial review
312
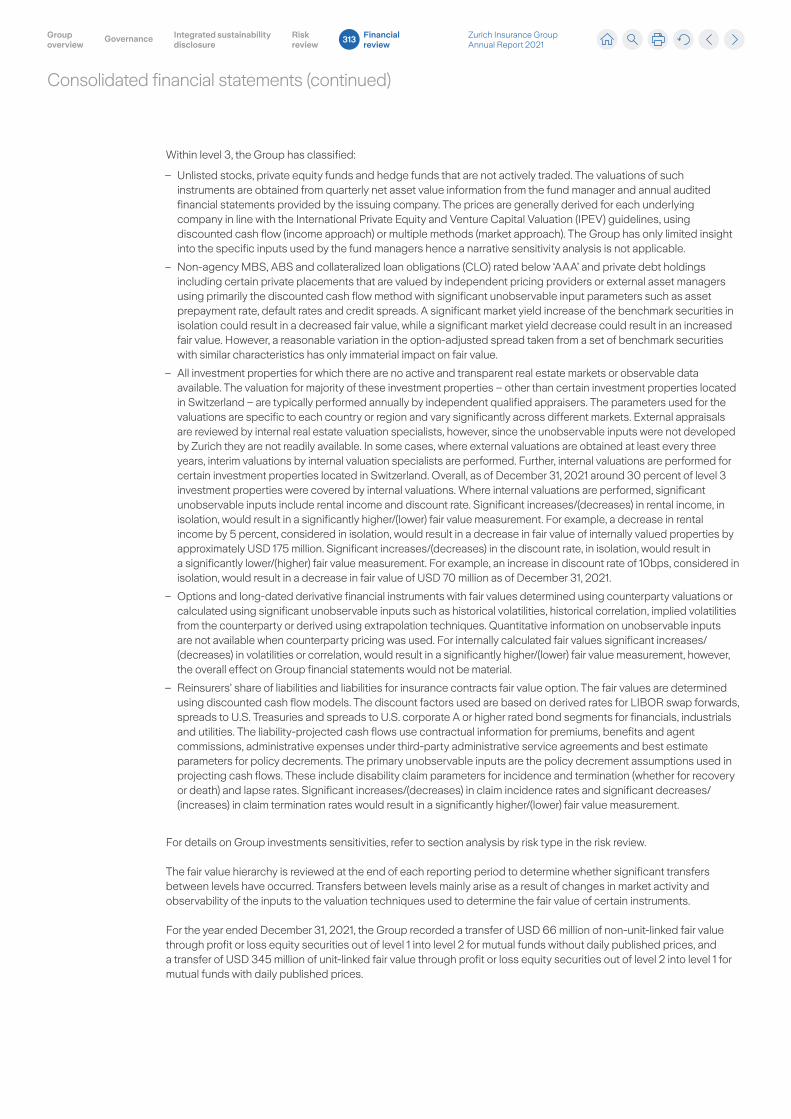
Consolidated financial statements (continued)
Within level 3, the Group has classified:
– Unlisted stocks, private equity funds and hedge funds that are not actively traded. The valuations of such instruments are obtained from quarterly net asset value information from the fund manager and annual audited financial statements provided by the issuing company. The prices are generally derived for each underlying company in line with the International Private Equity and Venture Capital Valuation (IPEV) guidelines, using discounted cash flow (income approach) or multiple methods (market approach). The Group has only limited insight into the specific inputs used by the fund managers hence a narrative sensitivity analysis is not applicable.
– Non-agency MBS, ABS and collateralized loan obligations (CLO) rated below ‘AAA’ and private debt holdings including certain private placements that are valued by independent pricing providers or external asset managers using primarily the discounted cash flow method with significant unobservable input parameters such as asset prepayment rate, default rates and credit spreads. A significant market yield increase of the benchmark securities in isolation could result in a decreased fair value, while a significant market yield decrease could result in an increased fair value. However, a reasonable variation in the option-adjusted spread taken from a set of benchmark securities with similar characteristics has only immaterial impact on fair value.
– All investment properties for which there are no active and transparent real estate markets or observable data available. The valuation for majority of these investment properties – other than certain investment properties located in Switzerland – are typically performed annually by independent qualified appraisers. The parameters used for the valuations are specific to each country or region and vary significantly across different markets. External appraisals are reviewed by internal real estate valuation specialists, however, since the unobservable inputs were not developed by Zurich they are not readily available. In some cases, where external valuations are obtained at least every three years, interim valuations by internal valuation specialists are performed. Further, internal valuations are performed for certain investment properties located in Switzerland. Overall, as of December 31, 2021 around 30 percent of level 3 investment properties were covered by internal valuations. Where internal valuations are performed, significant unobservable inputs include rental income and discount rate. Significant increases/(decreases) in rental income, in isolation, would result in a significantly higher/(lower) fair value measurement. For example, a decrease in rental income by 5 percent, considered in isolation, would result in a decrease in fair value of internally valued properties by approximately USD 175 million. Significant increases/(decreases) in the discount rate, in isolation, would result in a significantly lower/(higher) fair value measurement. For example, an increase in discount rate of 10bps, considered in isolation, would result in a decrease in fair value of USD 70 million as of December 31, 2021.
– Options and long-dated derivative financial instruments with fair values determined using counterparty valuations or calculated using significant unobservable inputs such as historical volatilities, historical correlation, implied volatilities from the counterparty or derived using extrapolation techniques. Quantitative information on unobservable inputs are not available when counterparty pricing was used. For internally calculated fair values significant increases/(decreases) in volatilities or correlation, would result in a significantly higher/(lower) fair value measurement, however, the overall effect on Group financial statements would not be material.
– Reinsurers’ share of liabilities and liabilities for insurance contracts fair value option. The fair values are determined using discounted cash flow models. The discount factors used are based on derived rates for LIBOR swap forwards, spreads to U.S. Treasuries and spreads to U.S. corporate A or higher rated bond segments for financials, industrials and utilities. The liability-projected cash flows use contractual information for premiums, benefits and agent commissions, administrative expenses under third-party administrative service agreements and best estimate parameters for policy decrements. The primary unobservable inputs are the policy decrement assumptions used in projecting cash flows. These include disability claim parameters for incidence and termination (whether for recovery or death) and lapse rates. Significant increases/(decreases) in claim incidence rates and significant decreases/(increases) in claim termination rates would result in a significantly higher/(lower) fair value measurement.
For details on Group investments sensitivities, refer to section analysis by risk type in the risk review.
The fair value hierarchy is reviewed at the end of each reporting period to determine whether significant transfers between levels have occurred. Transfers between levels mainly arise as a result of changes in market activity and observability of the inputs to the valuation techniques used to determine the fair value of certain instruments.
For the year ended December 31, 2021, the Group recorded a transfer of USD 66 million of non-unit-linked fair value through profit or loss equity securities out of level 1 into level 2 for mutual funds without daily published prices, and a transfer of USD 345 million of unit-linked fair value through profit or loss equity securities out of level 2 into level 1 for mutual funds with daily published prices.
Zurich Insurance Group Annual Report 2021
Group overview
Integrated sustainability disclosure
Governance Risk review
Financial review
313
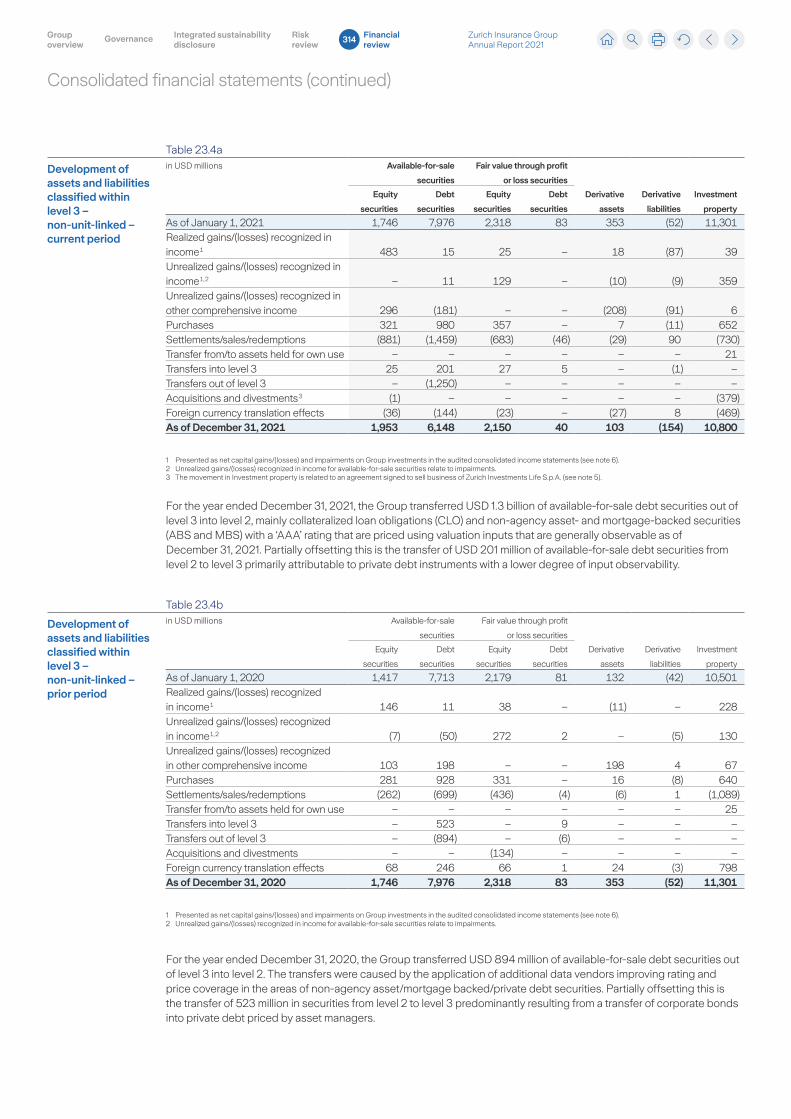
Consolidated financial statements (continued)
Table 23.4a
Development of assets and liabilities classified within level 3 – non-unit-linked – current period
in USD millions Available-for-sale
securities
Fair value through profit
or loss securities
Derivative
assets
Derivative
liabilities
Investment
property
Equity
securities
Debt
securities
Equity
securities
Debt
securities
As of January 1, 2021 1,746 7,976 2,318 83 353 (52) 11,301Realized gains/(losses) recognized in income 1 483 15 25 – 18 (87) 39Unrealized gains/(losses) recognized in income 1, 2 – 11 129 – (10) (9) 359Unrealized gains/(losses) recognized in other comprehensive income 296 (181) – – (208) (91) 6Purchases 321 980 357 – 7 (11) 652Settlements/sales/redemptions (881) (1,459) (683) (46) (29) 90 (730)Transfer from/to assets held for own use – – – – – – 21Transfers into level 3 25 201 27 5 – (1) –Transfers out of level 3 – (1,250) – – – – –Acquisitions and divestments 3 (1) – – – – – (379)Foreign currency translation effects (36) (144) (23) – (27) 8 (469)As of December 31, 2021 1,953 6,148 2,150 40 103 (154) 10,800
1 Presented as net capital gains/(losses) and impairments on Group investments in the audited consolidated income statements (see note 6).2 Unrealized gains/(losses) recognized in income for available-for-sale securities relate to impairments. 3 The movement in Investment property is related to an agreement signed to sell business of Zurich Investments Life S.p.A. (see note 5).
For the year ended December 31, 2021, the Group transferred USD 1.3 billion of available-for-sale debt securities out of level 3 into level 2, mainly collateralized loan obligations (CLO) and non-agency asset- and mortgage-backed securities (ABS and MBS) with a ‘AAA’ rating that are priced using valuation inputs that are generally observable as of December 31, 2021. Partially offsetting this is the transfer of USD 201 million of available-for-sale debt securities from level 2 to level 3 primarily attributable to private debt instruments with a lower degree of input observability.
Table 23.4b
Development of assets and liabilities classified within level 3 – non-unit-linked – prior period
in USD millions Available-for-sale
securities
Fair value through profit
or loss securities
Derivative
assets
Derivative
liabilities
Investment
property
Equity
securities
Debt
securities
Equity
securities
Debt
securities
As of January 1, 2020 1,417 7,713 2,179 81 132 (42) 10,501Realized gains/(losses) recognized in income 1 146 11 38 – (11) – 228Unrealized gains/(losses) recognized in income 1, 2 (7) (50) 272 2 – (5) 130Unrealized gains/(losses) recognized in other comprehensive income 103 198 – – 198 4 67Purchases 281 928 331 – 16 (8) 640Settlements/sales/redemptions (262) (699) (436) (4) (6) 1 (1,089)Transfer from/to assets held for own use – – – – – – 25Transfers into level 3 – 523 – 9 – – –Transfers out of level 3 – (894) – (6) – – –Acquisitions and divestments – – (134) – – – –Foreign currency translation effects 68 246 66 1 24 (3) 798As of December 31, 2020 1,746 7,976 2,318 83 353 (52) 11,301
1 Presented as net capital gains/(losses) and impairments on Group investments in the audited consolidated income statements (see note 6).2 Unrealized gains/(losses) recognized in income for available-for-sale securities relate to impairments.
For the year ended December 31, 2020, the Group transferred USD 894 million of available-for-sale debt securities out of level 3 into level 2. The transfers were caused by the application of additional data vendors improving rating and price coverage in the areas of non-agency asset/mortgage backed/private debt securities. Partially offsetting this is the transfer of 523 million in securities from level 2 to level 3 predominantly resulting from a transfer of corporate bonds into private debt priced by asset managers.
Zurich Insurance Group Annual Report 2021
Group overview
Integrated sustainability disclosure
Governance Risk review
Financial review
314
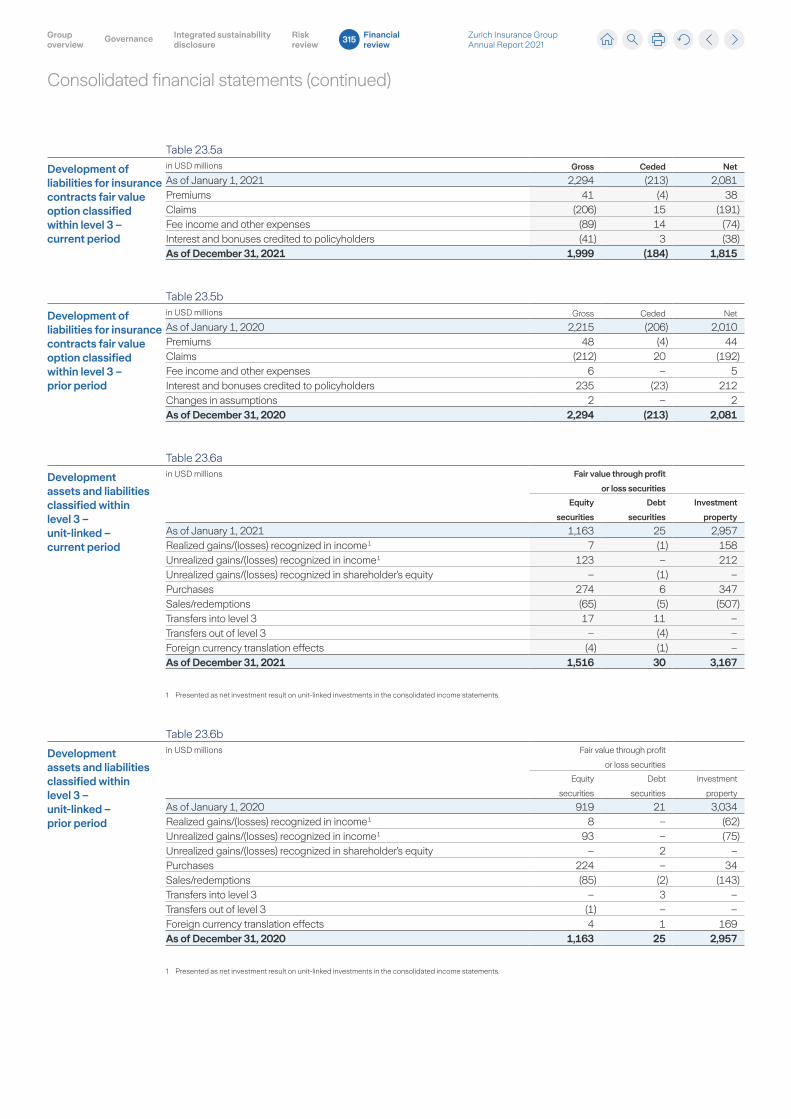
Consolidated financial statements (continued)
Table 23.5a
Development of liabilities for insurance contracts fair value option classified within level 3 – current period
in USD millions Gross Ceded Net
As of January 1, 2021 2,294 (213) 2,081Premiums 41 (4) 38Claims (206) 15 (191)Fee income and other expenses (89) 14 (74)Interest and bonuses credited to policyholders (41) 3 (38)As of December 31, 2021 1,999 (184) 1,815
Table 23.5b
Development of liabilities for insurance contracts fair value option classified within level 3 – prior period
in USD millions Gross Ceded Net
As of January 1, 2020 2,215 (206) 2,010Premiums 48 (4) 44Claims (212) 20 (192)Fee income and other expenses 6 – 5Interest and bonuses credited to policyholders 235 (23) 212Changes in assumptions 2 – 2As of December 31, 2020 2,294 (213) 2,081
Table 23.6a
Development assets and liabilities classified within level 3 – unit-linked – current period
in USD millions Fair value through profit
or loss securities
Equity
securities
Debt
securities
Investment
property
As of January 1, 2021 1,163 25 2,957Realized gains/(losses) recognized in income 1 7 (1) 158Unrealized gains/(losses) recognized in income 1 123 – 212Unrealized gains/(losses) recognized in shareholder’s equity – (1) –Purchases 274 6 347Sales/redemptions (65) (5) (507)Transfers into level 3 17 11 –Transfers out of level 3 – (4) –Foreign currency translation effects (4) (1) –As of December 31, 2021 1,516 30 3,167
1 Presented as net investment result on unit-linked investments in the consolidated income statements.
Table 23.6b
Development assets and liabilities classified within level 3 – unit-linked – prior period
in USD millions Fair value through profit
or loss securities
Equity
securities
Debt
securities
Investment
property
As of January 1, 2020 919 21 3,034Realized gains/(losses) recognized in income 1 8 – (62)Unrealized gains/(losses) recognized in income 1 93 – (75)Unrealized gains/(losses) recognized in shareholder’s equity – 2 –Purchases 224 – 34Sales/redemptions (85) (2) (143)Transfers into level 3 – 3 –Transfers out of level 3 (1) – –Foreign currency translation effects 4 1 169As of December 31, 2020 1,163 25 2,957
1 Presented as net investment result on unit-linked investments in the consolidated income statements.
Zurich Insurance Group Annual Report 2021
Group overview
Integrated sustainability disclosure
Governance Risk review
Financial review
315
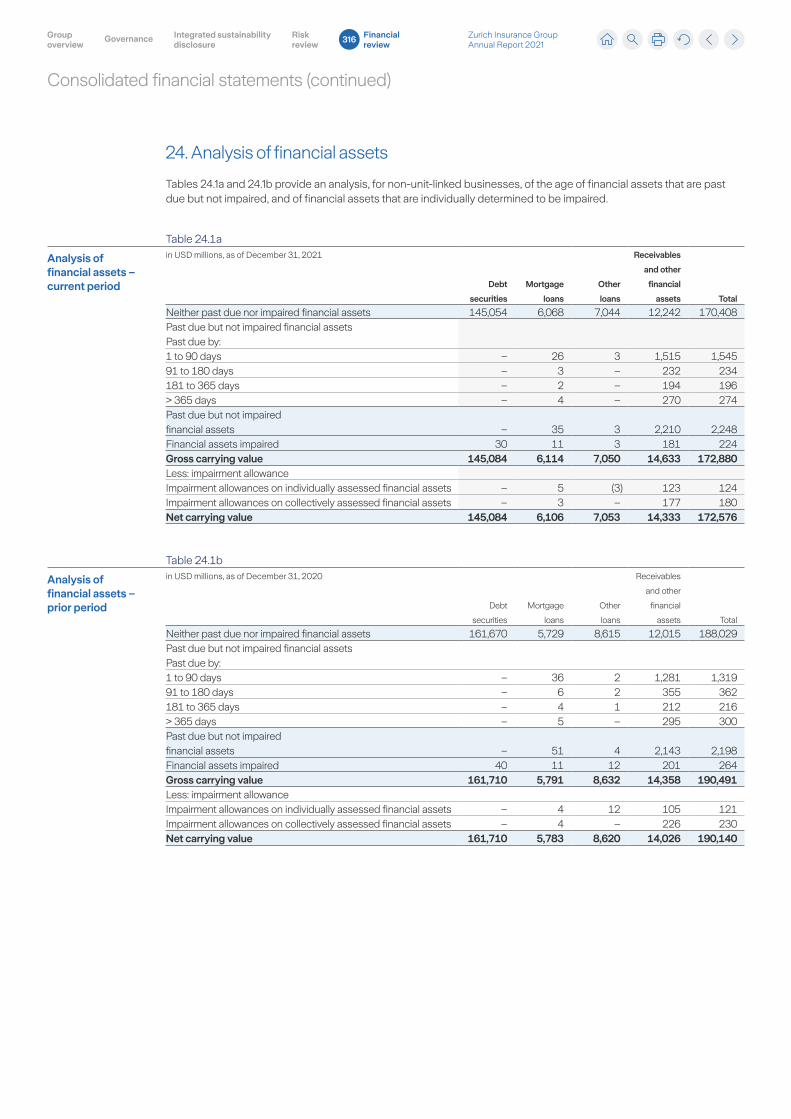
Consolidated financial statements (continued)
24. Analysis of financial assets
Tables 24.1a and 24.1b provide an analysis, for non-unit-linked businesses, of the age of financial assets that are past due but not impaired, and of financial assets that are individually determined to be impaired.
Table 24.1a
Analysis of financial assets – current period
in USD millions, as of December 31, 2021
Debt
securities
Mortgage
loans
Other
loans
Receivables
and other
financial
assets Total
Neither past due nor impaired financial assets 145,054 6,068 7,044 12,242 170,408Past due but not impaired financial assets Past due by:1 to 90 days – 26 3 1,515 1,54591 to 180 days – 3 – 232 234181 to 365 days – 2 – 194 196> 365 days – 4 – 270 274Past due but not impaired financial assets – 35 3 2,210 2,248Financial assets impaired 30 11 3 181 224Gross carrying value 145,084 6,114 7,050 14,633 172,880Less: impairment allowanceImpairment allowances on individually assessed financial assets – 5 (3) 123 124Impairment allowances on collectively assessed financial assets – 3 – 177 180Net carrying value 145,084 6,106 7,053 14,333 172,576
Table 24.1b
Analysis of financial assets – prior period
in USD millions, as of December 31, 2020
Debt
securities
Mortgage
loans
Other
loans
Receivables
and other
financial
assets Total
Neither past due nor impaired financial assets 161,670 5,729 8,615 12,015 188,029Past due but not impaired financial assets Past due by:1 to 90 days – 36 2 1,281 1,31991 to 180 days – 6 2 355 362181 to 365 days – 4 1 212 216> 365 days – 5 – 295 300Past due but not impaired financial assets – 51 4 2,143 2,198Financial assets impaired 40 11 12 201 264Gross carrying value 161,710 5,791 8,632 14,358 190,491Less: impairment allowanceImpairment allowances on individually assessed financial assets – 4 12 105 121Impairment allowances on collectively assessed financial assets – 4 – 226 230Net carrying value 161,710 5,783 8,620 14,026 190,140
Zurich Insurance Group Annual Report 2021
Group overview
Integrated sustainability disclosure
Governance Risk review
Financial review
316
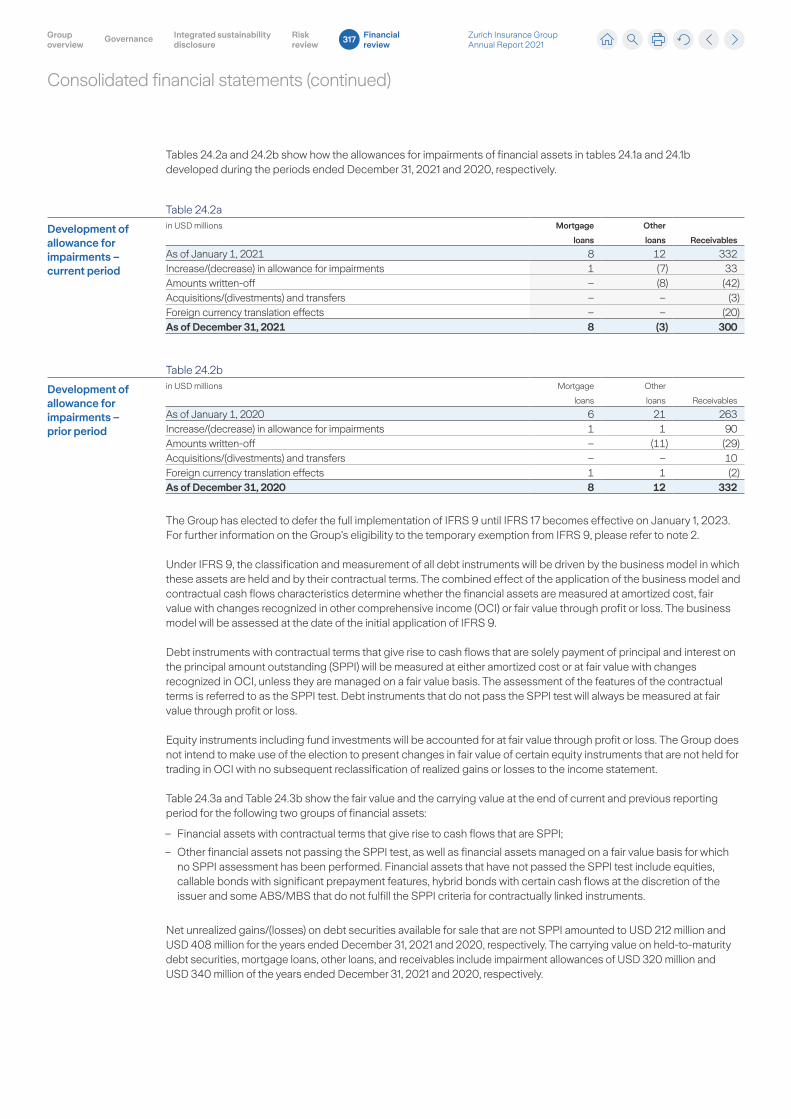
Consolidated financial statements (continued)
Tables 24.2a and 24.2b show how the allowances for impairments of financial assets in tables 24.1a and 24.1b developed during the periods ended December 31, 2021 and 2020, respectively.
Table 24.2a
Development of allowance for impairments – current period
in USD millions Mortgage
loans
Other
loans Receivables
As of January 1, 2021 8 12 332Increase/(decrease) in allowance for impairments 1 (7) 33Amounts written-off – (8) (42)Acquisitions/(divestments) and transfers – – (3)Foreign currency translation effects – – (20)As of December 31, 2021 8 (3) 300
Table 24.2b
Development of allowance for impairments – prior period
in USD millions Mortgage
loans
Other
loans Receivables
As of January 1, 2020 6 21 263Increase/(decrease) in allowance for impairments 1 1 90Amounts written-off – (11) (29)Acquisitions/(divestments) and transfers – – 10Foreign currency translation effects 1 1 (2)As of December 31, 2020 8 12 332
The Group has elected to defer the full implementation of IFRS 9 until IFRS 17 becomes effective on January 1, 2023. For further information on the Group’s eligibility to the temporary exemption from IFRS 9, please refer to note 2.
Under IFRS 9, the classification and measurement of all debt instruments will be driven by the business model in which these assets are held and by their contractual terms. The combined effect of the application of the business model and contractual cash flows characteristics determine whether the financial assets are measured at amortized cost, fair value with changes recognized in other comprehensive income (OCI) or fair value through profit or loss. The business model will be assessed at the date of the initial application of IFRS 9.
Debt instruments with contractual terms that give rise to cash flows that are solely payment of principal and interest on the principal amount outstanding (SPPI) will be measured at either amortized cost or at fair value with changes recognized in OCI, unless they are managed on a fair value basis. The assessment of the features of the contractual terms is referred to as the SPPI test. Debt instruments that do not pass the SPPI test will always be measured at fair value through profit or loss.
Equity instruments including fund investments will be accounted for at fair value through profit or loss. The Group does not intend to make use of the election to present changes in fair value of certain equity instruments that are not held for trading in OCI with no subsequent reclassification of realized gains or losses to the income statement.
Table 24.3a and Table 24.3b show the fair value and the carrying value at the end of current and previous reporting period for the following two groups of financial assets:
– Financial assets with contractual terms that give rise to cash flows that are SPPI;
– Other financial assets not passing the SPPI test, as well as financial assets managed on a fair value basis for which no SPPI assessment has been performed. Financial assets that have not passed the SPPI test include equities, callable bonds with significant prepayment features, hybrid bonds with certain cash flows at the discretion of the issuer and some ABS/MBS that do not fulfill the SPPI criteria for contractually linked instruments.
Net unrealized gains/(losses) on debt securities available for sale that are not SPPI amounted to USD 212 million and USD 408 million for the years ended December 31, 2021 and 2020, respectively. The carrying value on held-to-maturity debt securities, mortgage loans, other loans, and receivables include impairment allowances of USD 320 million and USD 340 million of the years ended December 31, 2021 and 2020, respectively.
Zurich Insurance Group Annual Report 2021
Group overview
Integrated sustainability disclosure
Governance Risk review
Financial review
317
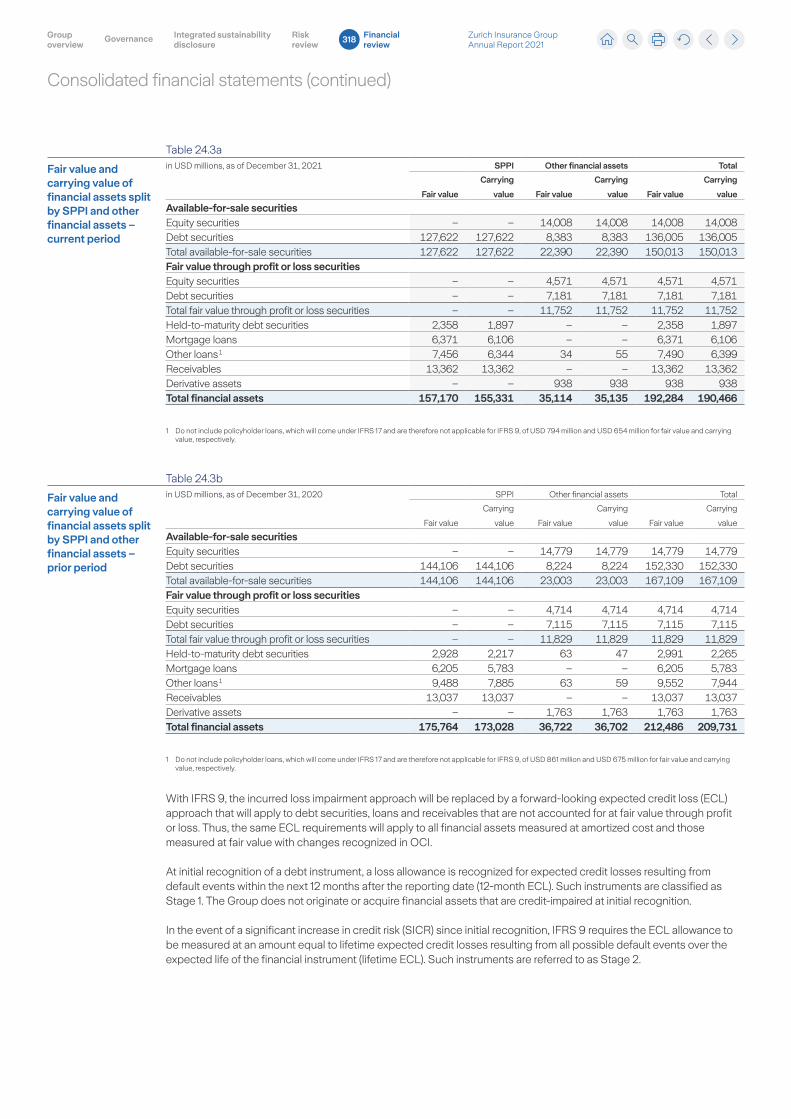
Consolidated financial statements (continued)
Table 24.3a
Fair value and carrying value of financial assets split by SPPI and other financial assets – current period
in USD millions, as of December 31, 2021 SPPI Other financial assets Total
Fair value
Carrying
value Fair value
Carrying
value Fair value
Carrying
value
Available-for-sale securitiesEquity securities – – 14,008 14,008 14,008 14,008Debt securities 127,622 127,622 8,383 8,383 136,005 136,005Total available-for-sale securities 127,622 127,622 22,390 22,390 150,013 150,013Fair value through profit or loss securitiesEquity securities – – 4,571 4,571 4,571 4,571Debt securities – – 7,181 7,181 7,181 7,181Total fair value through profit or loss securities – – 11,752 11,752 11,752 11,752Held-to-maturity debt securities 2,358 1,897 – – 2,358 1,897Mortgage loans 6,371 6,106 – – 6,371 6,106Other loans 1 7,456 6,344 34 55 7,490 6,399Receivables 13,362 13,362 – – 13,362 13,362Derivative assets – – 938 938 938 938Total financial assets 157,170 155,331 35,114 35,135 192,284 190,466
1 Do not include policyholder loans, which will come under IFRS 17 and are therefore not applicable for IFRS 9, of USD 794 million and USD 654 million for fair value and carrying value, respectively.
Table 24.3b
Fair value and carrying value of financial assets split by SPPI and other financial assets – prior period
in USD millions, as of December 31, 2020 SPPI Other financial assets Total
Fair value
Carrying
value Fair value
Carrying
value Fair value
Carrying
value
Available-for-sale securitiesEquity securities – – 14,779 14,779 14,779 14,779Debt securities 144,106 144,106 8,224 8,224 152,330 152,330Total available-for-sale securities 144,106 144,106 23,003 23,003 167,109 167,109Fair value through profit or loss securitiesEquity securities – – 4,714 4,714 4,714 4,714Debt securities – – 7,115 7,115 7,115 7,115Total fair value through profit or loss securities – – 11,829 11,829 11,829 11,829Held-to-maturity debt securities 2,928 2,217 63 47 2,991 2,265Mortgage loans 6,205 5,783 – – 6,205 5,783Other loans 1 9,488 7,885 63 59 9,552 7,944Receivables 13,037 13,037 – – 13,037 13,037Derivative assets – – 1,763 1,763 1,763 1,763Total financial assets 175,764 173,028 36,722 36,702 212,486 209,731
1 Do not include policyholder loans, which will come under IFRS 17 and are therefore not applicable for IFRS 9, of USD 861 million and USD 675 million for fair value and carrying value, respectively.
With IFRS 9, the incurred loss impairment approach will be replaced by a forward-looking expected credit loss (ECL) approach that will apply to debt securities, loans and receivables that are not accounted for at fair value through profit or loss. Thus, the same ECL requirements will apply to all financial assets measured at amortized cost and those measured at fair value with changes recognized in OCI.
At initial recognition of a debt instrument, a loss allowance is recognized for expected credit losses resulting from default events within the next 12 months after the reporting date (12-month ECL). Such instruments are classified as Stage 1. The Group does not originate or acquire financial assets that are credit-impaired at initial recognition.
In the event of a significant increase in credit risk (SICR) since initial recognition, IFRS 9 requires the ECL allowance to be measured at an amount equal to lifetime expected credit losses resulting from all possible default events over the expected life of the financial instrument (lifetime ECL). Such instruments are referred to as Stage 2.
Zurich Insurance Group Annual Report 2021
Group overview
Integrated sustainability disclosure
Governance Risk review
Financial review
318
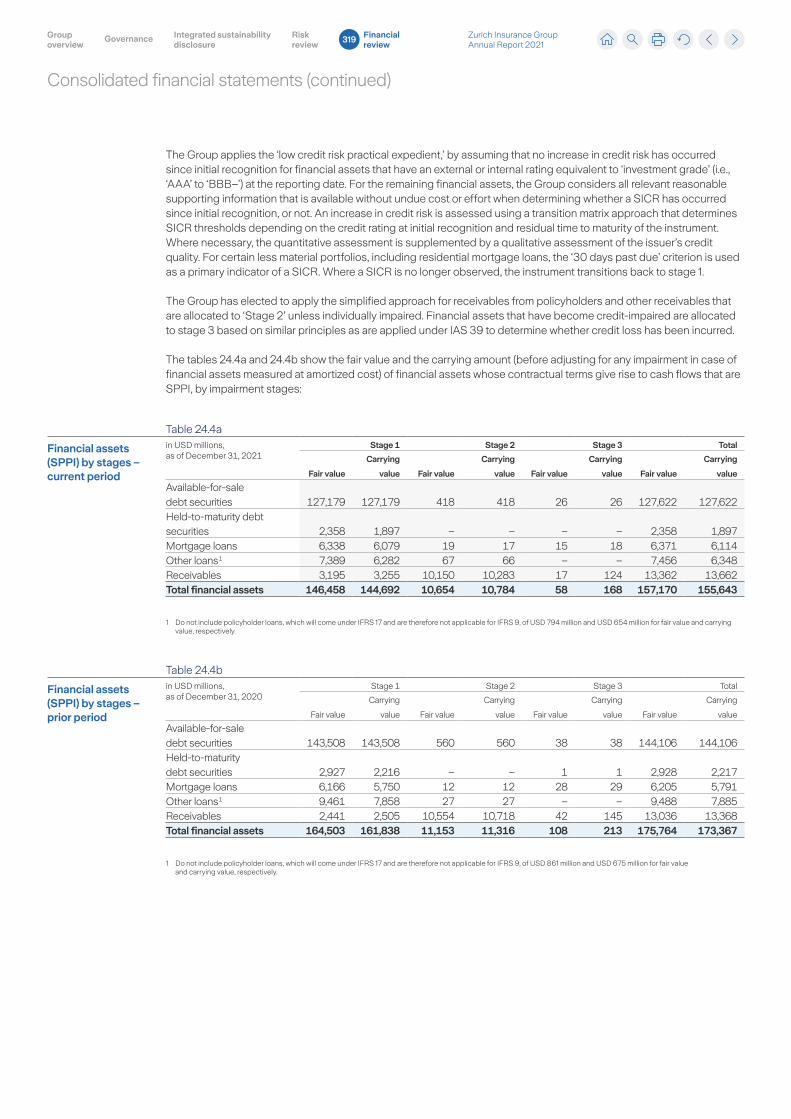
Consolidated financial statements (continued)
The Group applies the ‘low credit risk practical expedient,’ by assuming that no increase in credit risk has occurred since initial recognition for financial assets that have an external or internal rating equivalent to ‘investment grade’ (i.e., ‘AAA’ to ‘BBB–’) at the reporting date. For the remaining financial assets, the Group considers all relevant reasonable supporting information that is available without undue cost or effort when determining whether a SICR has occurred since initial recognition, or not. An increase in credit risk is assessed using a transition matrix approach that determines SICR thresholds depending on the credit rating at initial recognition and residual time to maturity of the instrument. Where necessary, the quantitative assessment is supplemented by a qualitative assessment of the issuer’s credit quality. For certain less material portfolios, including residential mortgage loans, the ‘30 days past due’ criterion is used as a primary indicator of a SICR. Where a SICR is no longer observed, the instrument transitions back to stage 1.
The Group has elected to apply the simplified approach for receivables from policyholders and other receivables that are allocated to ‘Stage 2’ unless individually impaired. Financial assets that have become credit-impaired are allocated to stage 3 based on similar principles as are applied under IAS 39 to determine whether credit loss has been incurred.
The tables 24.4a and 24.4b show the fair value and the carrying amount (before adjusting for any impairment in case of financial assets measured at amortized cost) of financial assets whose contractual terms give rise to cash flows that are SPPI, by impairment stages:
Table 24.4a
Financial assets (SPPI) by stages – current period
in USD millions, as of December 31, 2021
Stage 1 Stage 2 Stage 3 Total
Fair value
Carrying
value Fair value
Carrying
value Fair value
Carrying
value Fair value
Carrying
value
Available-for-sale debt securities 127,179 127,179 418 418 26 26 127,622 127,622Held-to-maturity debt securities 2,358 1,897 – – – – 2,358 1,897Mortgage loans 6,338 6,079 19 17 15 18 6,371 6,114Other loans 1 7,389 6,282 67 66 – – 7,456 6,348Receivables 3,195 3,255 10,150 10,283 17 124 13,362 13,662Total financial assets 146,458 144,692 10,654 10,784 58 168 157,170 155,643
1 Do not include policyholder loans, which will come under IFRS 17 and are therefore not applicable for IFRS 9, of USD 794 million and USD 654 million for fair value and carrying value, respectively.
Table 24.4b
Financial assets (SPPI) by stages – prior period
in USD millions, as of December 31, 2020
Stage 1 Stage 2 Stage 3 Total
Fair value
Carrying
value Fair value
Carrying
value Fair value
Carrying
value Fair value
Carrying
value
Available-for-sale debt securities 143,508 143,508 560 560 38 38 144,106 144,106Held-to-maturity debt securities 2,927 2,216 – – 1 1 2,928 2,217Mortgage loans 6,166 5,750 12 12 28 29 6,205 5,791Other loans 1 9,461 7,858 27 27 – – 9,488 7,885Receivables 2,441 2,505 10,554 10,718 42 145 13,036 13,368Total financial assets 164,503 161,838 11,153 11,316 108 213 175,764 173,367
1 Do not include policyholder loans, which will come under IFRS 17 and are therefore not applicable for IFRS 9, of USD 861 million and USD 675 million for fair value and carrying value, respectively.
Zurich Insurance Group Annual Report 2021
Group overview
Integrated sustainability disclosure
Governance Risk review
Financial review
319
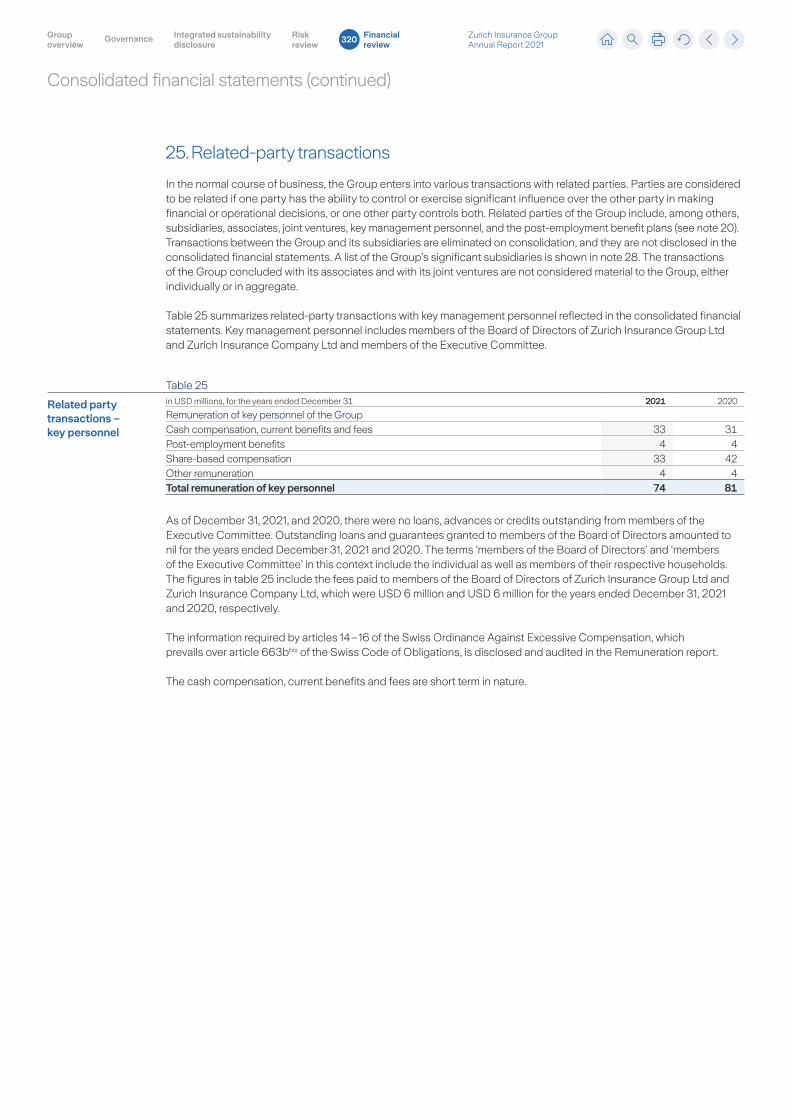
Consolidated financial statements (continued)
25. Related-party transactions
In the normal course of business, the Group enters into various transactions with related parties. Parties are considered to be related if one party has the ability to control or exercise significant influence over the other party in making financial or operational decisions, or one other party controls both. Related parties of the Group include, among others, subsidiaries, associates, joint ventures, key management personnel, and the post-employment benefit plans (see note 20). Transactions between the Group and its subsidiaries are eliminated on consolidation, and they are not disclosed in the consolidated financial statements. A list of the Group’s significant subsidiaries is shown in note 28. The transactions of the Group concluded with its associates and with its joint ventures are not considered material to the Group, either individually or in aggregate.
Table 25 summarizes related-party transactions with key management personnel reflected in the consolidated financial statements. Key management personnel includes members of the Board of Directors of Zurich Insurance Group Ltd and Zurich Insurance Company Ltd and members of the Executive Committee.
Table 25
Related party transactions – key personnel
in USD millions, for the years ended December 31 2021 2020
Remuneration of key personnel of the GroupCash compensation, current benefits and fees 33 31Post-employment benefits 4 4Share-based compensation 33 42Other remuneration 4 4Total remuneration of key personnel 74 81
As of December 31, 2021, and 2020, there were no loans, advances or credits outstanding from members of the Executive Committee. Outstanding loans and guarantees granted to members of the Board of Directors amounted to nil for the years ended December 31, 2021 and 2020. The terms ‘members of the Board of Directors’ and ‘members of the Executive Committee’ in this context include the individual as well as members of their respective households. The figures in table 25 include the fees paid to members of the Board of Directors of Zurich Insurance Group Ltd and Zurich Insurance Company Ltd, which were USD 6 million and USD 6 million for the years ended December 31, 2021 and 2020, respectively.
The information required by articles 14 – 16 of the Swiss Ordinance Against Excessive Compensation, which prevails over article 663bbis of the Swiss Code of Obligations, is disclosed and audited in the Remuneration report.
The cash compensation, current benefits and fees are short term in nature.
Zurich Insurance Group Annual Report 2021
Group overview
Integrated sustainability disclosure
Governance Risk review
Financial review
320
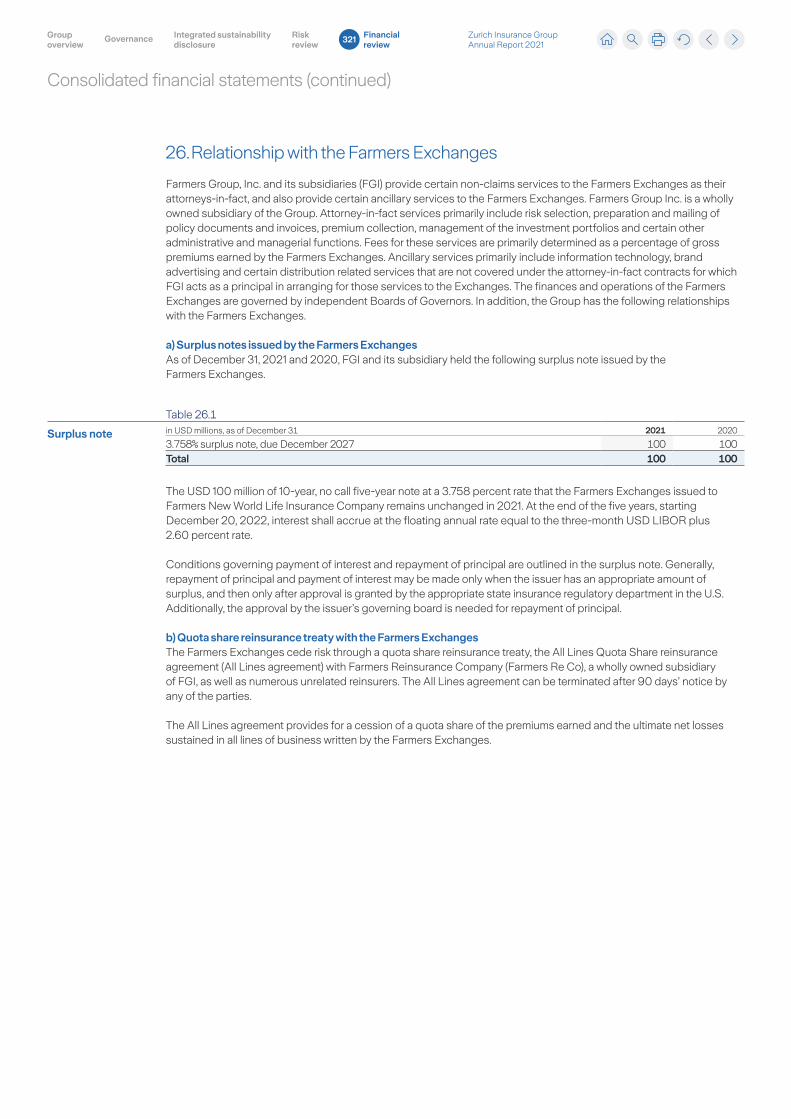
Consolidated financial statements (continued)
26. Relationship with the Farmers Exchanges
Farmers Group, Inc. and its subsidiaries (FGI) provide certain non-claims services to the Farmers Exchanges as their attorneys-in-fact, and also provide certain ancillary services to the Farmers Exchanges. Farmers Group Inc. is a wholly owned subsidiary of the Group. Attorney-in-fact services primarily include risk selection, preparation and mailing of policy documents and invoices, premium collection, management of the investment portfolios and certain other administrative and managerial functions. Fees for these services are primarily determined as a percentage of gross premiums earned by the Farmers Exchanges. Ancillary services primarily include information technology, brand advertising and certain distribution related services that are not covered under the attorney-in-fact contracts for which FGI acts as a principal in arranging for those services to the Exchanges. The finances and operations of the Farmers Exchanges are governed by independent Boards of Governors. In addition, the Group has the following relationships with the Farmers Exchanges.
a) Surplus notes issued by the Farmers ExchangesAs of December 31, 2021 and 2020, FGI and its subsidiary held the following surplus note issued by the Farmers Exchanges.
Table 26.1
Surplus note in USD millions, as of December 31 2021 2020
3.758% surplus note, due December 2027 100 100Total 100 100
The USD 100 million of 10-year, no call five-year note at a 3.758 percent rate that the Farmers Exchanges issued to Farmers New World Life Insurance Company remains unchanged in 2021. At the end of the five years, starting December 20, 2022, interest shall accrue at the floating annual rate equal to the three-month USD LIBOR plus 2.60 percent rate.
Conditions governing payment of interest and repayment of principal are outlined in the surplus note. Generally, repayment of principal and payment of interest may be made only when the issuer has an appropriate amount of surplus, and then only after approval is granted by the appropriate state insurance regulatory department in the U.S. Additionally, the approval by the issuer’s governing board is needed for repayment of principal.
b) Quota share reinsurance treaty with the Farmers ExchangesThe Farmers Exchanges cede risk through a quota share reinsurance treaty, the All Lines Quota Share reinsurance agreement (All Lines agreement) with Farmers Reinsurance Company (Farmers Re Co), a wholly owned subsidiary of FGI, as well as numerous unrelated reinsurers. The All Lines agreement can be terminated after 90 days’ notice by any of the parties.
The All Lines agreement provides for a cession of a quota share of the premiums earned and the ultimate net losses sustained in all lines of business written by the Farmers Exchanges.
Zurich Insurance Group Annual Report 2021
Group overview
Integrated sustainability disclosure
Governance Risk review
Financial review
321
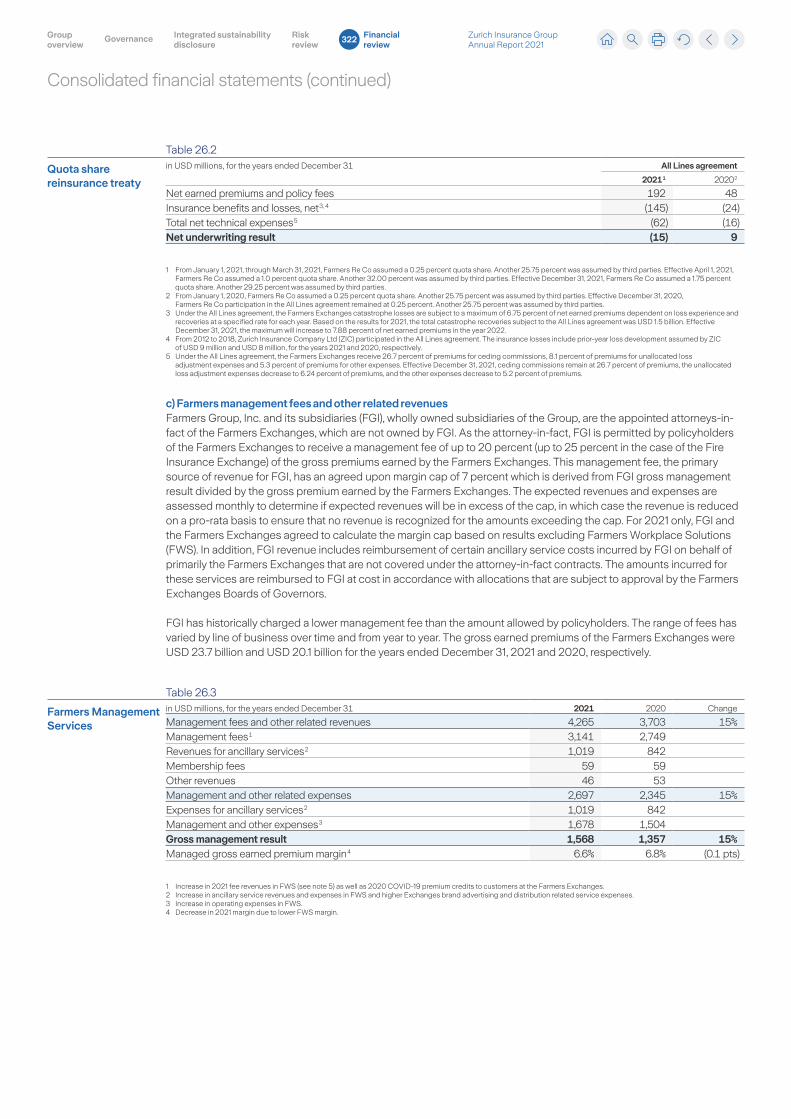
Consolidated financial statements (continued)
Table 26.2
Quota share reinsurance treaty
in USD millions, for the years ended December 31 All Lines agreement
2021 1 2020 2
Net earned premiums and policy fees 192 48Insurance benefits and losses, net 3, 4 (145) (24)Total net technical expenses 5 (62) (16)Net underwriting result (15) 9
1 From January 1, 2021, through March 31, 2021, Farmers Re Co assumed a 0.25 percent quota share. Another 25.75 percent was assumed by third parties. Effective April 1, 2021, Farmers Re Co assumed a 1.0 percent quota share. Another 32.00 percent was assumed by third parties. Effective December 31, 2021, Farmers Re Co assumed a 1.75 percent quota share. Another 29.25 percent was assumed by third parties.
2 From January 1, 2020, Farmers Re Co assumed a 0.25 percent quota share. Another 25.75 percent was assumed by third parties. Effective December 31, 2020, Farmers Re Co participation in the All Lines agreement remained at 0.25 percent. Another 25.75 percent was assumed by third parties.
3 Under the All Lines agreement, the Farmers Exchanges catastrophe losses are subject to a maximum of 6.75 percent of net earned premiums dependent on loss experience and recoveries at a specified rate for each year. Based on the results for 2021, the total catastrophe recoveries subject to the All Lines agreement was USD 1.5 billion. Effective December 31, 2021, the maximum will increase to 7.88 percent of net earned premiums in the year 2022.
4 From 2012 to 2018, Zurich Insurance Company Ltd (ZIC) participated in the All Lines agreement. The insurance losses include prior-year loss development assumed by ZIC of USD 9 million and USD 8 million, for the years 2021 and 2020, respectively.
5 Under the All Lines agreement, the Farmers Exchanges receive 26.7 percent of premiums for ceding commissions, 8.1 percent of premiums for unallocated loss adjustment expenses and 5.3 percent of premiums for other expenses. Effective December 31, 2021, ceding commissions remain at 26.7 percent of premiums, the unallocated loss adjustment expenses decrease to 6.24 percent of premiums, and the other expenses decrease to 5.2 percent of premiums.
c) Farmers management fees and other related revenuesFarmers Group, Inc. and its subsidiaries (FGI), wholly owned subsidiaries of the Group, are the appointed attorneys-in-fact of the Farmers Exchanges, which are not owned by FGI. As the attorney-in-fact, FGI is permitted by policyholders of the Farmers Exchanges to receive a management fee of up to 20 percent (up to 25 percent in the case of the Fire Insurance Exchange) of the gross premiums earned by the Farmers Exchanges. This management fee, the primary source of revenue for FGI, has an agreed upon margin cap of 7 percent which is derived from FGI gross management result divided by the gross premium earned by the Farmers Exchanges. The expected revenues and expenses are assessed monthly to determine if expected revenues will be in excess of the cap, in which case the revenue is reduced on a pro-rata basis to ensure that no revenue is recognized for the amounts exceeding the cap. For 2021 only, FGI and the Farmers Exchanges agreed to calculate the margin cap based on results excluding Farmers Workplace Solutions (FWS). In addition, FGI revenue includes reimbursement of certain ancillary service costs incurred by FGI on behalf of primarily the Farmers Exchanges that are not covered under the attorney-in-fact contracts. The amounts incurred for these services are reimbursed to FGI at cost in accordance with allocations that are subject to approval by the Farmers Exchanges Boards of Governors.
FGI has historically charged a lower management fee than the amount allowed by policyholders. The range of fees has varied by line of business over time and from year to year. The gross earned premiums of the Farmers Exchanges were USD 23.7 billion and USD 20.1 billion for the years ended December 31, 2021 and 2020, respectively.
Table 26.3
Farmers Management Services
in USD millions, for the years ended December 31 2021 2020 Change
Management fees and other related revenues 4,265 3,703 15%Management fees 1 3,141 2,749 Revenues for ancillary services 2 1,019 842 Membership fees 59 59 Other revenues 46 53 Management and other related expenses 2,697 2,345 15%Expenses for ancillary services 2 1,019 842 Management and other expenses 3 1,678 1,504 Gross management result 1,568 1,357 15%Managed gross earned premium margin 4 6.6% 6.8% (0.1 pts)
1 Increase in 2021 fee revenues in FWS (see note 5) as well as 2020 COVID-19 premium credits to customers at the Farmers Exchanges. 2 Increase in ancillary service revenues and expenses in FWS and higher Exchanges brand advertising and distribution related service expenses.3 Increase in operating expenses in FWS.4 Decrease in 2021 margin due to lower FWS margin.
Zurich Insurance Group Annual Report 2021
Group overview
Integrated sustainability disclosure
Governance Risk review
Financial review
322
Consolidated financial statements (continued)
27. Segment information
The Group pursues a customer-centric strategy, where the Property & Casualty (P&C) and Life businesses are managed on a regional basis. The Group’s reportable segments have been identified on the basis of the businesses operated by the Group and how these are strategically managed to offer different products and services to specific customer groups. The Group has identified 13 reportable segments in accordance with IFRS 8 ‘Operating Segments’ and segment information is presented accordingly as follows:
– Property & Casualty regions
– Life regions
– Farmers
– Group Functions and Operations
– Non-Core Businesses
The Group’s reportable segments comprise the following:
Property & Casualty and Life regions
– Europe, Middle East & Africa
– North America
– Asia Pacific
– Latin America
– Group Reinsurance
Property & Casualty regions provide a variety of motor, home and commercial products and services for individuals as well as small and large businesses on both a local and global basis. Products are sold through multiple distribution channels including agents, brokers and bank distribution.
Life regions provide a comprehensive range of life and health insurance products on both an individual and a group basis, including annuities, endowment and term insurance, unit-linked and investment-oriented products, as well as full private health, supplemental health and long-term care insurance. In addition to the agent distribution channel, certain of these products are offered via bank distribution channels.
Farmers, through Farmers Group, Inc. and its subsidiaries (FGI), provides certain non-claims services and ancillary services to the Farmers Exchanges, which are owned by their policyholders. This segment also includes all reinsurance assumed from the Farmers Exchanges by the Group. Farmers Exchanges are prominent writers of personal and small commercial lines of business in the U.S. In addition, this segment includes the activities of Farmers Life, a writer of individual life insurance business in the U.S.
Group Functions and Operations comprise the Group’s Holding and Financing, Headquarters and the new digital ventures of the Zurich Global Ventures. Certain alternative investment positions not allocated to business operating segments are included within Holding and Financing. In addition, this segment includes operational technical governance activities relating to technology, underwriting, claims, actuarial and pricing.
Non-Core Businesses include insurance and reinsurance businesses that the Group does not consider core to its operations and that are therefore mostly managed to achieve a beneficial run-off. Non-Core Businesses are mainly situated in the U.S., Bermuda, and in Europe.
Zurich Insurance Group Annual Report 2021
Group overview
Integrated sustainability disclosure
Governance Risk review
Financial review
323
Consolidated financial statements (continued)
Aggregations and additional informationRegional Property & Casualty and Life results are further aggregated to show a total Property & Casualty and total Life business view.
– Property & Casualty – total
– Life – total
For additional informational purposes, the Group also discloses income statement information for
– Property & Casualty Commercial Insurance
– Property & Casualty Retail and SME
Business operating profitThe segment information includes the Group’s internal performance measure, business operating profit (BOP). This measure is the basis on which the Group manages all of its business units. It indicates the underlying performance of the Group’s business units, after non-controlling interests, by eliminating the impact of financial market volatility and other non-operational variables. BOP reflects adjustments for shareholders’ taxes, net capital gains/(losses) and impairments on investments (except for certain non-insurance operations included in Non-Core Businesses, investments in hedge funds as at fair value through profit or loss, certain securities held for specific economic hedging purposes and policyholders’ share of investment results for the life businesses) and non-operational foreign exchange movements. Significant items arising from special circumstances, including restructuring charges, legal matters or large one-off regulatory projects outside the ordinary course of business, gains and losses on divestment of businesses, certain business combination integration costs and impairments of goodwill are also excluded from BOP.
Zurich Insurance Group Annual Report 2021
Group overview
Integrated sustainability disclosure
Governance Risk review
Financial review
324

THIS PAGE HAS INTENTIONALLY BEEN LEFT BLANK
Zurich Insurance Group Annual Report 2021
Group overview
Integrated sustainability disclosure
Governance Risk review
Financial review
325
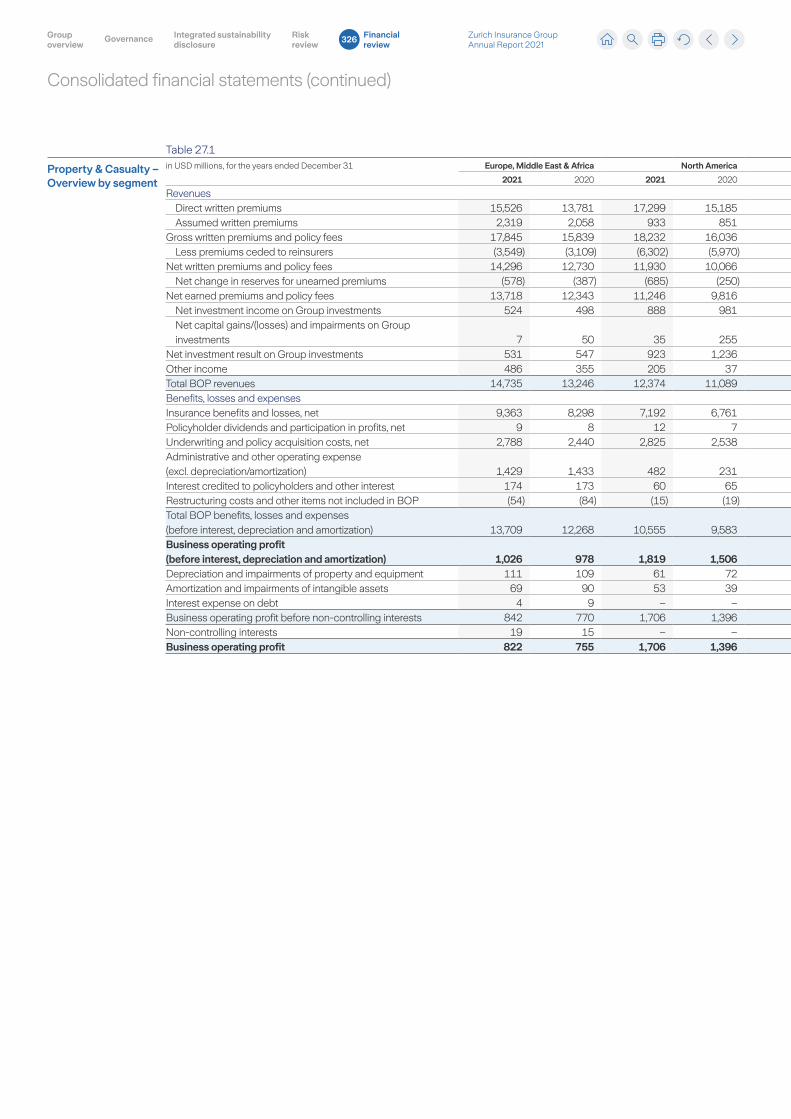
Consolidated financial statements (continued)
Table 27.1
Property & Casualty – Overview by segment
in USD millions, for the years ended December 31 Europe, Middle East & Africa North America Asia Pacific Latin America Group Reinsurance Eliminations Total
2021 2020 2021 2020 2021 2020 2021 2020 2021 2020 2021 2020 2021 2020
RevenuesDirect written premiums 15,526 13,781 17,299 15,185 2,989 2,719 2,499 2,242 – – – – 38,314 33,926Assumed written premiums 2,319 2,058 933 851 233 207 89 57 696 597 (2,462) (2,178) 1,809 1,592
Gross written premiums and policy fees 17,845 15,839 18,232 16,036 3,223 2,926 2,589 2,299 696 597 (2,462) (2,178) 40,123 35,518Less premiums ceded to reinsurers (3,549) (3,109) (6,302) (5,970) (638) (567) (637) (565) (580) (568) 2,462 2,178 (9,244) (8,601)
Net written premiums and policy fees 14,296 12,730 11,930 10,066 2,585 2,359 1,951 1,734 117 28 – – 30,879 26,918Net change in reserves for unearned premiums (578) (387) (685) (250) (67) 80 (72) 37 (17) (3) – – (1,418) (522)
Net earned premiums and policy fees 13,718 12,343 11,246 9,816 2,519 2,439 1,879 1,771 100 26 – – 29,461 26,396Net investment income on Group investments 524 498 888 981 86 92 178 160 12 10 – – 1,688 1,740Net capital gains/(losses) and impairments on Group investments 7 50 35 255 – – – – – – – – 42 305
Net investment result on Group investments 531 547 923 1,236 86 92 178 160 12 10 – – 1,731 2,045Other income 486 355 205 37 82 136 46 41 16 3 – – 836 573Total BOP revenues 14,735 13,246 12,374 11,089 2,686 2,668 2,104 1,972 128 38 – – 32,028 29,014Benefits, losses and expensesInsurance benefits and losses, net 9,363 8,298 7,192 6,761 1,383 1,476 744 641 (88) 360 – – 18,593 17,536Policyholder dividends and participation in profits, net 9 8 12 7 1 – 1 – – – – – 23 15Underwriting and policy acquisition costs, net 2,788 2,440 2,825 2,538 577 601 716 719 (19) (9) – – 6,886 6,288Administrative and other operating expense (excl. depreciation/amortization) 1,429 1,433 482 231 424 487 312 260 108 36 – – 2,755 2,447Interest credited to policyholders and other interest 174 173 60 65 4 2 36 32 6 7 – – 279 278Restructuring costs and other items not included in BOP (54) (84) (15) (19) (15) (23) (54) (14) – – – – (138) (140)Total BOP benefits, losses and expenses (before interest, depreciation and amortization) 13,709 12,268 10,555 9,583 2,374 2,543 1,754 1,638 6 393 – – 28,398 26,425Business operating profit (before interest, depreciation and amortization) 1,026 978 1,819 1,506 312 124 350 335 122 (355) – – 3,630 2,589Depreciation and impairments of property and equipment 111 109 61 72 49 51 15 17 1 1 – – 236 251Amortization and impairments of intangible assets 69 90 53 39 25 23 14 11 – – – – 161 162Interest expense on debt 4 9 – – – – – – – 1 – – 4 10Business operating profit before non-controlling interests 842 770 1,706 1,396 239 51 322 306 121 (357) – – 3,229 2,166Non-controlling interests 19 15 – – 3 3 85 68 – – – – 108 86Business operating profit 822 755 1,706 1,396 235 48 236 239 121 (357) – – 3,121 2,080
Zurich Insurance Group Annual Report 2021
Group overview
Integrated sustainability disclosure
Governance Risk review
Financial review
326
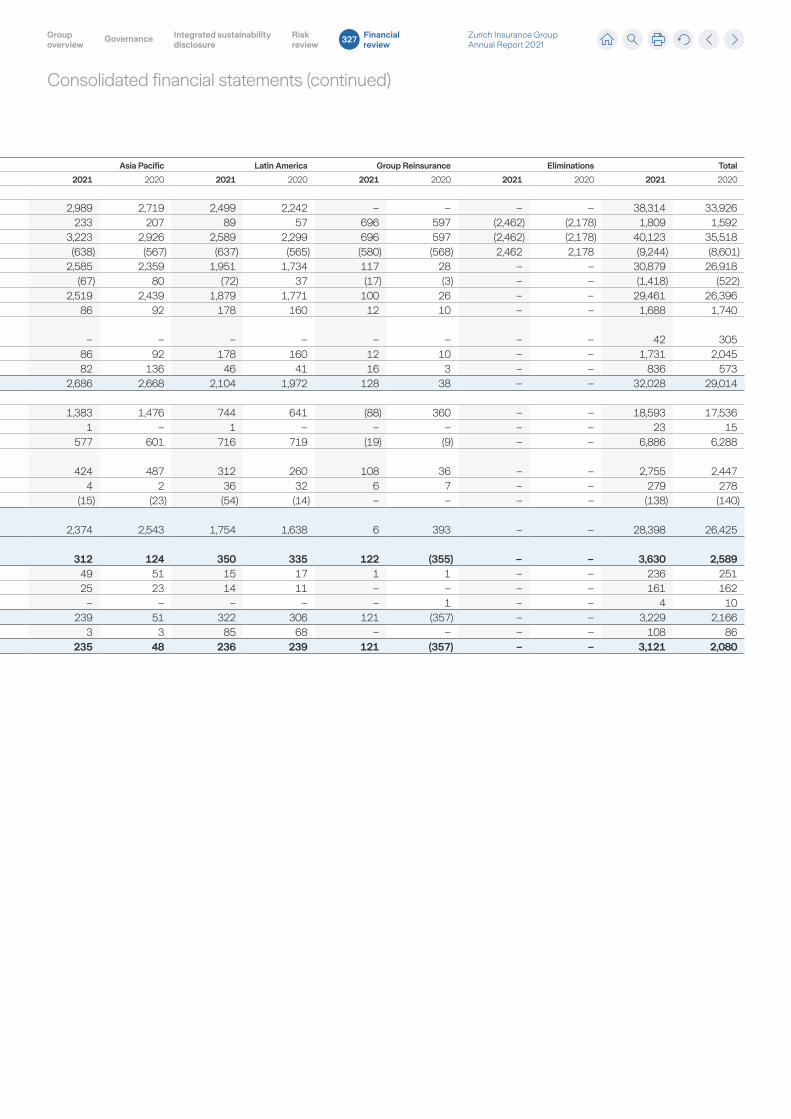
Consolidated financial statements (continued)
Table 27.1
Property & Casualty – Overview by segment
in USD millions, for the years ended December 31 Europe, Middle East & Africa North America Asia Pacific Latin America Group Reinsurance Eliminations Total
2021 2020 2021 2020 2021 2020 2021 2020 2021 2020 2021 2020 2021 2020
RevenuesDirect written premiums 15,526 13,781 17,299 15,185 2,989 2,719 2,499 2,242 – – – – 38,314 33,926Assumed written premiums 2,319 2,058 933 851 233 207 89 57 696 597 (2,462) (2,178) 1,809 1,592
Gross written premiums and policy fees 17,845 15,839 18,232 16,036 3,223 2,926 2,589 2,299 696 597 (2,462) (2,178) 40,123 35,518Less premiums ceded to reinsurers (3,549) (3,109) (6,302) (5,970) (638) (567) (637) (565) (580) (568) 2,462 2,178 (9,244) (8,601)
Net written premiums and policy fees 14,296 12,730 11,930 10,066 2,585 2,359 1,951 1,734 117 28 – – 30,879 26,918Net change in reserves for unearned premiums (578) (387) (685) (250) (67) 80 (72) 37 (17) (3) – – (1,418) (522)
Net earned premiums and policy fees 13,718 12,343 11,246 9,816 2,519 2,439 1,879 1,771 100 26 – – 29,461 26,396Net investment income on Group investments 524 498 888 981 86 92 178 160 12 10 – – 1,688 1,740Net capital gains/(losses) and impairments on Group investments 7 50 35 255 – – – – – – – – 42 305
Net investment result on Group investments 531 547 923 1,236 86 92 178 160 12 10 – – 1,731 2,045Other income 486 355 205 37 82 136 46 41 16 3 – – 836 573Total BOP revenues 14,735 13,246 12,374 11,089 2,686 2,668 2,104 1,972 128 38 – – 32,028 29,014Benefits, losses and expensesInsurance benefits and losses, net 9,363 8,298 7,192 6,761 1,383 1,476 744 641 (88) 360 – – 18,593 17,536Policyholder dividends and participation in profits, net 9 8 12 7 1 – 1 – – – – – 23 15Underwriting and policy acquisition costs, net 2,788 2,440 2,825 2,538 577 601 716 719 (19) (9) – – 6,886 6,288Administrative and other operating expense (excl. depreciation/amortization) 1,429 1,433 482 231 424 487 312 260 108 36 – – 2,755 2,447Interest credited to policyholders and other interest 174 173 60 65 4 2 36 32 6 7 – – 279 278Restructuring costs and other items not included in BOP (54) (84) (15) (19) (15) (23) (54) (14) – – – – (138) (140)Total BOP benefits, losses and expenses (before interest, depreciation and amortization) 13,709 12,268 10,555 9,583 2,374 2,543 1,754 1,638 6 393 – – 28,398 26,425Business operating profit (before interest, depreciation and amortization) 1,026 978 1,819 1,506 312 124 350 335 122 (355) – – 3,630 2,589Depreciation and impairments of property and equipment 111 109 61 72 49 51 15 17 1 1 – – 236 251Amortization and impairments of intangible assets 69 90 53 39 25 23 14 11 – – – – 161 162Interest expense on debt 4 9 – – – – – – – 1 – – 4 10Business operating profit before non-controlling interests 842 770 1,706 1,396 239 51 322 306 121 (357) – – 3,229 2,166Non-controlling interests 19 15 – – 3 3 85 68 – – – – 108 86Business operating profit 822 755 1,706 1,396 235 48 236 239 121 (357) – – 3,121 2,080
Zurich Insurance Group Annual Report 2021
Group overview
Integrated sustainability disclosure
Governance Risk review
Financial review
327
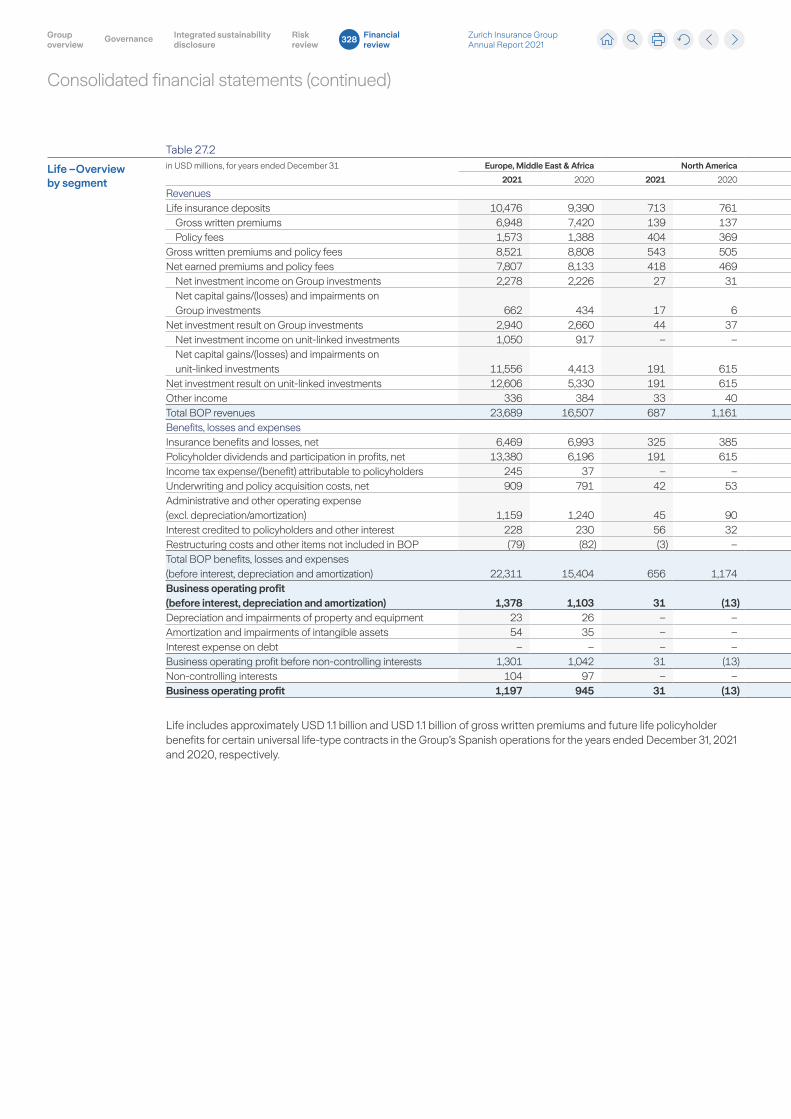
Consolidated financial statements (continued)
Table 27.2
Life –Overview by segment
in USD millions, for years ended December 31 Europe, Middle East & Africa North America Asia Pacific Latin America Group Reinsurance Eliminations Total
2021 2020 2021 2020 2021 2020 2021 2020 2021 2020 2021 2020 2021 2020
RevenuesLife insurance deposits 10,476 9,390 713 761 145 112 3,023 3,401 – – – – 14,357 13,663
Gross written premiums 6,948 7,420 139 137 2,467 2,242 2,236 2,193 35 33 (35) (45) 11,791 11,980Policy fees 1,573 1,388 404 369 132 147 95 69 – – – – 2,205 1,973
Gross written premiums and policy fees 8,521 8,808 543 505 2,599 2,389 2,332 2,262 35 33 (35) (45) 13,995 13,953Net earned premiums and policy fees 7,807 8,133 418 469 2,006 2,021 2,042 1,977 26 24 – – 12,299 12,624
Net investment income on Group investments 2,278 2,226 27 31 204 167 480 331 – – (1) (2) 2,987 2,753Net capital gains/(losses) and impairments on Group investments 662 434 17 6 (63) 34 4 12 – – – – 621 486
Net investment result on Group investments 2,940 2,660 44 37 141 201 484 343 – – (1) (2) 3,608 3,239Net investment income on unit-linked investments 1,050 917 – – 139 107 27 31 – – – – 1,217 1,055Net capital gains/(losses) and impairments on unit-linked investments 11,556 4,413 191 615 38 (4) 908 715 – – – – 12,693 5,739
Net investment result on unit-linked investments 12,606 5,330 191 615 177 104 935 746 – – – – 13,909 6,794Other income 336 384 33 40 25 23 93 68 – – (1) (2) 486 513Total BOP revenues 23,689 16,507 687 1,161 2,349 2,348 3,554 3,133 26 24 (3) (3) 30,301 23,169Benefits, losses and expensesInsurance benefits and losses, net 6,469 6,993 325 385 1,087 1,094 978 825 4 10 – – 8,863 9,306Policyholder dividends and participation in profits, net 13,380 6,196 191 615 143 124 946 756 – – – – 14,660 7,691Income tax expense/(benefit) attributable to policyholders 245 37 – – 30 10 – – – – – – 275 46Underwriting and policy acquisition costs, net 909 791 42 53 174 324 999 937 7 9 (1) (2) 2,129 2,112Administrative and other operating expense (excl. depreciation/amortization) 1,159 1,240 45 90 600 522 250 162 – 1 – – 2,054 2,015Interest credited to policyholders and other interest 228 230 56 32 1 13 29 22 – – – – 315 297Restructuring costs and other items not included in BOP (79) (82) (3) – (58) (40) (33) 41 – – – – (173) (81)Total BOP benefits, losses and expenses (before interest, depreciation and amortization) 22,311 15,404 656 1,174 1,977 2,048 3,169 2,742 10 20 (1) (2) 28,123 21,387Business operating profit (before interest, depreciation and amortization) 1,378 1,103 31 (13) 371 300 385 391 15 4 (1) (2) 2,178 1,782Depreciation and impairments of property and equipment 23 26 – – 8 9 11 10 – – – – 42 45Amortization and impairments of intangible assets 54 35 – – 8 9 9 9 – – – – 71 52Interest expense on debt – – – – 11 16 – 1 – – (1) (2) 10 16Business operating profit before non-controlling interests 1,301 1,042 31 (13) 344 266 365 371 15 4 – – 2,055 1,670Non-controlling interests 104 97 – – (4) (3) 143 152 – – – – 243 246Business operating profit 1,197 945 31 (13) 347 269 222 219 15 4 – – 1,812 1,423
Life includes approximately USD 1.1 billion and USD 1.1 billion of gross written premiums and future life policyholder benefits for certain universal life-type contracts in the Group’s Spanish operations for the years ended December 31, 2021 and 2020, respectively.
Zurich Insurance Group Annual Report 2021
Group overview
Integrated sustainability disclosure
Governance Risk review
Financial review
328
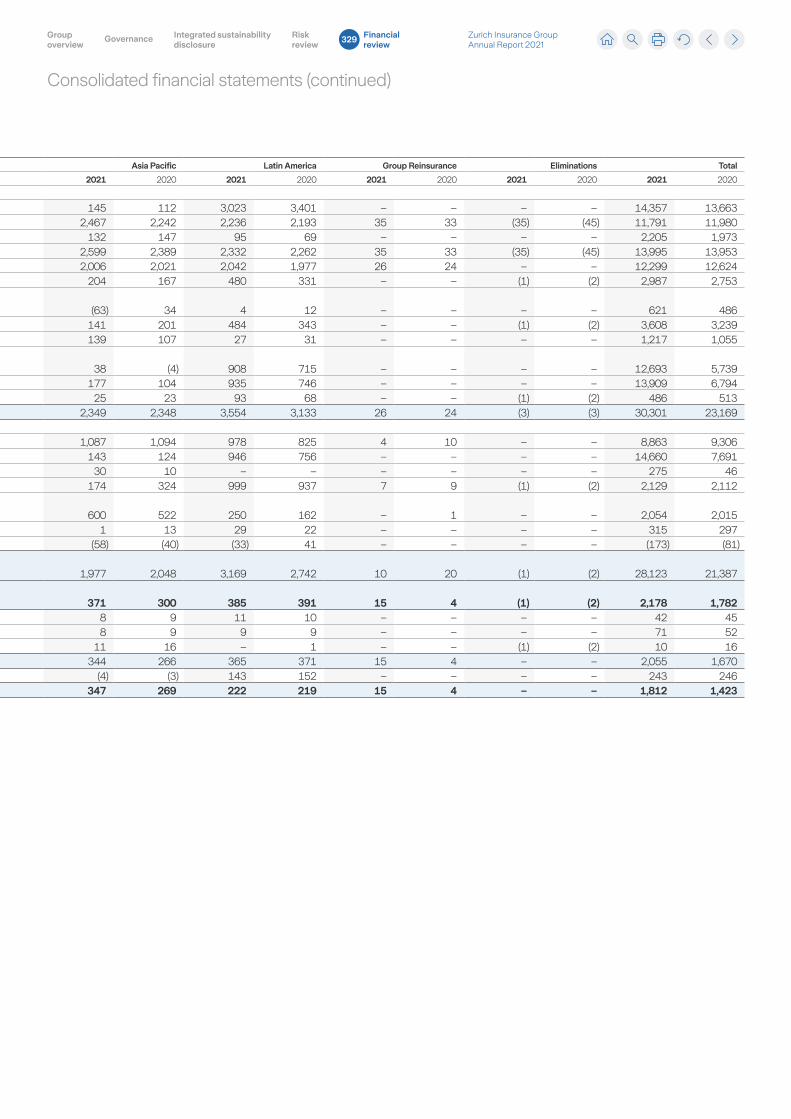
Consolidated financial statements (continued)
Table 27.2
Life –Overview by segment
in USD millions, for years ended December 31 Europe, Middle East & Africa North America Asia Pacific Latin America Group Reinsurance Eliminations Total
2021 2020 2021 2020 2021 2020 2021 2020 2021 2020 2021 2020 2021 2020
RevenuesLife insurance deposits 10,476 9,390 713 761 145 112 3,023 3,401 – – – – 14,357 13,663
Gross written premiums 6,948 7,420 139 137 2,467 2,242 2,236 2,193 35 33 (35) (45) 11,791 11,980Policy fees 1,573 1,388 404 369 132 147 95 69 – – – – 2,205 1,973
Gross written premiums and policy fees 8,521 8,808 543 505 2,599 2,389 2,332 2,262 35 33 (35) (45) 13,995 13,953Net earned premiums and policy fees 7,807 8,133 418 469 2,006 2,021 2,042 1,977 26 24 – – 12,299 12,624
Net investment income on Group investments 2,278 2,226 27 31 204 167 480 331 – – (1) (2) 2,987 2,753Net capital gains/(losses) and impairments on Group investments 662 434 17 6 (63) 34 4 12 – – – – 621 486
Net investment result on Group investments 2,940 2,660 44 37 141 201 484 343 – – (1) (2) 3,608 3,239Net investment income on unit-linked investments 1,050 917 – – 139 107 27 31 – – – – 1,217 1,055Net capital gains/(losses) and impairments on unit-linked investments 11,556 4,413 191 615 38 (4) 908 715 – – – – 12,693 5,739
Net investment result on unit-linked investments 12,606 5,330 191 615 177 104 935 746 – – – – 13,909 6,794Other income 336 384 33 40 25 23 93 68 – – (1) (2) 486 513Total BOP revenues 23,689 16,507 687 1,161 2,349 2,348 3,554 3,133 26 24 (3) (3) 30,301 23,169Benefits, losses and expensesInsurance benefits and losses, net 6,469 6,993 325 385 1,087 1,094 978 825 4 10 – – 8,863 9,306Policyholder dividends and participation in profits, net 13,380 6,196 191 615 143 124 946 756 – – – – 14,660 7,691Income tax expense/(benefit) attributable to policyholders 245 37 – – 30 10 – – – – – – 275 46Underwriting and policy acquisition costs, net 909 791 42 53 174 324 999 937 7 9 (1) (2) 2,129 2,112Administrative and other operating expense (excl. depreciation/amortization) 1,159 1,240 45 90 600 522 250 162 – 1 – – 2,054 2,015Interest credited to policyholders and other interest 228 230 56 32 1 13 29 22 – – – – 315 297Restructuring costs and other items not included in BOP (79) (82) (3) – (58) (40) (33) 41 – – – – (173) (81)Total BOP benefits, losses and expenses (before interest, depreciation and amortization) 22,311 15,404 656 1,174 1,977 2,048 3,169 2,742 10 20 (1) (2) 28,123 21,387Business operating profit (before interest, depreciation and amortization) 1,378 1,103 31 (13) 371 300 385 391 15 4 (1) (2) 2,178 1,782Depreciation and impairments of property and equipment 23 26 – – 8 9 11 10 – – – – 42 45Amortization and impairments of intangible assets 54 35 – – 8 9 9 9 – – – – 71 52Interest expense on debt – – – – 11 16 – 1 – – (1) (2) 10 16Business operating profit before non-controlling interests 1,301 1,042 31 (13) 344 266 365 371 15 4 – – 2,055 1,670Non-controlling interests 104 97 – – (4) (3) 143 152 – – – – 243 246Business operating profit 1,197 945 31 (13) 347 269 222 219 15 4 – – 1,812 1,423
Life includes approximately USD 1.1 billion and USD 1.1 billion of gross written premiums and future life policyholder benefits for certain universal life-type contracts in the Group’s Spanish operations for the years ended December 31, 2021 and 2020, respectively.
Zurich Insurance Group Annual Report 2021
Group overview
Integrated sustainability disclosure
Governance Risk review
Financial review
329
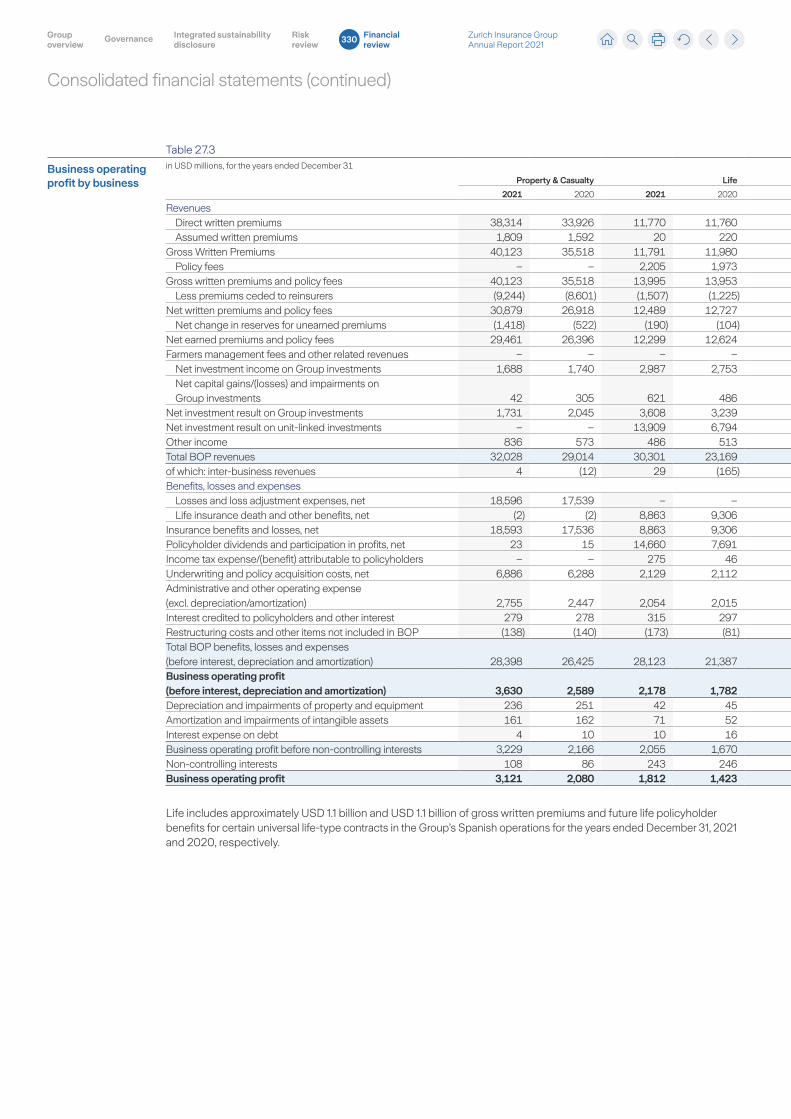
Consolidated financial statements (continued)
Table 27.3
Business operating profit by business
in USD millions, for the years ended December 31
Property & Casualty Life Farmers
Group Functions
and Operations
Non-Core
Businesses Eliminations Total
2021 2020 2021 2020 2021 2020 2021 2020 2021 2020 2021 2020 2021 2020
RevenuesDirect written premiums 38,314 33,926 11,770 11,760 638 610 3 (7) 34 34 – – 50,759 46,323Assumed written premiums 1,809 1,592 20 220 353 49 357 – 52 54 (165) (17) 2,426 1,899
Gross Written Premiums 40,123 35,518 11,791 11,980 992 659 359 (7) 86 88 (165) (17) 53,185 48,221Policy fees – – 2,205 1,973 359 337 – – 27 24 – – 2,592 2,334
Gross written premiums and policy fees 40,123 35,518 13,995 13,953 1,351 996 359 (7) 113 112 (165) (17) 55,777 50,555Less premiums ceded to reinsurers (9,244) (8,601) (1,507) (1,225) (175) (174) (194) – (16) (5) 165 17 (10,970) (9,988)
Net written premiums and policy fees 30,879 26,918 12,489 12,727 1,176 822 165 (7) 98 107 – – 44,806 40,567Net change in reserves for unearned premiums (1,418) (522) (190) (104) (161) (1) (11) 2 4 2 – – (1,776) (623)
Net earned premiums and policy fees 29,461 26,396 12,299 12,624 1,015 821 154 (5) 102 109 – – 43,031 39,944Farmers management fees and other related revenues – – – – 4,265 3,703 – – – – – – 4,265 3,703
Net investment income on Group investments 1,688 1,740 2,987 2,753 176 189 155 163 131 167 (90) (109) 5,047 4,903Net capital gains/(losses) and impairments on Group investments 42 305 621 486 5 2 – – (177) 174 – – 491 966
Net investment result on Group investments 1,731 2,045 3,608 3,239 180 191 155 163 (46) 340 (90) (109) 5,538 5,869Net investment result on unit-linked investments – – 13,909 6,794 203 163 – – 276 433 – – 14,388 7,389Other income 836 573 486 513 73 89 123 133 31 (9) (266) (342) 1,283 957Total BOP revenues 32,028 29,014 30,301 23,169 5,736 4,967 432 291 362 873 (356) (451) 68,504 57,863of which: inter-business revenues 4 (12) 29 (165) (7) (18) (377) (245) (6) (11) 356 451 – –Benefits, losses and expenses
Losses and loss adjustment expenses, net 18,596 17,539 – – 145 24 2 – 57 18 – – 18,800 17,581Life insurance death and other benefits, net (2) (2) 8,863 9,306 590 522 105 (3) (71) 338 – – 9,484 10,160
Insurance benefits and losses, net 18,593 17,536 8,863 9,306 735 545 107 (3) (14) 356 – – 28,284 27,741Policyholder dividends and participation in profits, net 23 15 14,660 7,691 213 173 12 – 287 446 – – 15,195 8,325Income tax expense/(benefit) attributable to policyholders – – 275 46 – – – – – – – – 275 46Underwriting and policy acquisition costs, net 6,886 6,288 2,129 2,112 175 145 25 4 5 5 (7) – 9,213 8,555Administrative and other operating expense (excl. depreciation/amortization) 2,755 2,447 2,054 2,015 2,702 2,372 471 380 59 88 5 (74) 8,047 7,228Interest credited to policyholders and other interest 279 278 315 297 111 108 124 121 25 26 (262) (250) 591 581Restructuring costs and other items not included in BOP (138) (140) (173) (81) (29) (64) (70) (78) – – – – (411) (363)Total BOP benefits, losses and expenses (before interest, depreciation and amortization) 28,398 26,425 28,123 21,387 3,908 3,280 669 424 362 921 (265) (323) 61,195 52,113Business operating profit (before interest, depreciation and amortization) 3,630 2,589 2,178 1,782 1,829 1,687 (237) (132) – (49) (91) (127) 7,310 5,750Depreciation and impairments of property and equipment 236 251 42 45 59 72 14 12 – – – – 351 380Amortization and impairments of intangible assets 161 162 71 52 141 114 23 70 – – – – 396 398Interest expense on debt 4 10 10 16 12 – 532 495 2 5 (91) (127) 469 399Business operating profit before non-controlling interests 3,229 2,166 2,055 1,670 1,617 1,501 (806) (709) (1) (54) – – 6,094 4,574Non-controlling interests 108 86 243 246 – – 1 – – – – – 352 332Business operating profit 3,121 2,080 1,812 1,423 1,617 1,501 (806) (709) (1) (54) – – 5,742 4,241
Life includes approximately USD 1.1 billion and USD 1.1 billion of gross written premiums and future life policyholder benefits for certain universal life-type contracts in the Group’s Spanish operations for the years ended December 31, 2021 and 2020, respectively.
Zurich Insurance Group Annual Report 2021
Group overview
Integrated sustainability disclosure
Governance Risk review
Financial review
330
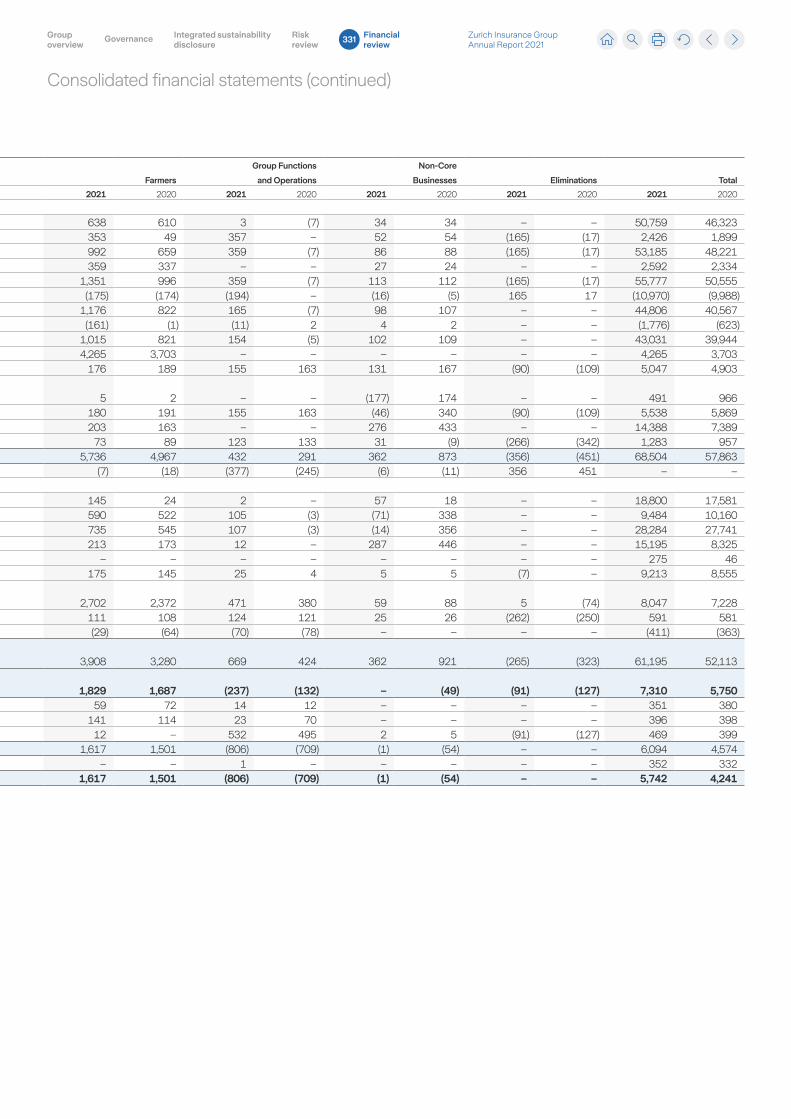
Consolidated financial statements (continued)
Table 27.3
Business operating profit by business
in USD millions, for the years ended December 31
Property & Casualty Life Farmers
Group Functions
and Operations
Non-Core
Businesses Eliminations Total
2021 2020 2021 2020 2021 2020 2021 2020 2021 2020 2021 2020 2021 2020
RevenuesDirect written premiums 38,314 33,926 11,770 11,760 638 610 3 (7) 34 34 – – 50,759 46,323Assumed written premiums 1,809 1,592 20 220 353 49 357 – 52 54 (165) (17) 2,426 1,899
Gross Written Premiums 40,123 35,518 11,791 11,980 992 659 359 (7) 86 88 (165) (17) 53,185 48,221Policy fees – – 2,205 1,973 359 337 – – 27 24 – – 2,592 2,334
Gross written premiums and policy fees 40,123 35,518 13,995 13,953 1,351 996 359 (7) 113 112 (165) (17) 55,777 50,555Less premiums ceded to reinsurers (9,244) (8,601) (1,507) (1,225) (175) (174) (194) – (16) (5) 165 17 (10,970) (9,988)
Net written premiums and policy fees 30,879 26,918 12,489 12,727 1,176 822 165 (7) 98 107 – – 44,806 40,567Net change in reserves for unearned premiums (1,418) (522) (190) (104) (161) (1) (11) 2 4 2 – – (1,776) (623)
Net earned premiums and policy fees 29,461 26,396 12,299 12,624 1,015 821 154 (5) 102 109 – – 43,031 39,944Farmers management fees and other related revenues – – – – 4,265 3,703 – – – – – – 4,265 3,703
Net investment income on Group investments 1,688 1,740 2,987 2,753 176 189 155 163 131 167 (90) (109) 5,047 4,903Net capital gains/(losses) and impairments on Group investments 42 305 621 486 5 2 – – (177) 174 – – 491 966
Net investment result on Group investments 1,731 2,045 3,608 3,239 180 191 155 163 (46) 340 (90) (109) 5,538 5,869Net investment result on unit-linked investments – – 13,909 6,794 203 163 – – 276 433 – – 14,388 7,389Other income 836 573 486 513 73 89 123 133 31 (9) (266) (342) 1,283 957Total BOP revenues 32,028 29,014 30,301 23,169 5,736 4,967 432 291 362 873 (356) (451) 68,504 57,863of which: inter-business revenues 4 (12) 29 (165) (7) (18) (377) (245) (6) (11) 356 451 – –Benefits, losses and expenses
Losses and loss adjustment expenses, net 18,596 17,539 – – 145 24 2 – 57 18 – – 18,800 17,581Life insurance death and other benefits, net (2) (2) 8,863 9,306 590 522 105 (3) (71) 338 – – 9,484 10,160
Insurance benefits and losses, net 18,593 17,536 8,863 9,306 735 545 107 (3) (14) 356 – – 28,284 27,741Policyholder dividends and participation in profits, net 23 15 14,660 7,691 213 173 12 – 287 446 – – 15,195 8,325Income tax expense/(benefit) attributable to policyholders – – 275 46 – – – – – – – – 275 46Underwriting and policy acquisition costs, net 6,886 6,288 2,129 2,112 175 145 25 4 5 5 (7) – 9,213 8,555Administrative and other operating expense (excl. depreciation/amortization) 2,755 2,447 2,054 2,015 2,702 2,372 471 380 59 88 5 (74) 8,047 7,228Interest credited to policyholders and other interest 279 278 315 297 111 108 124 121 25 26 (262) (250) 591 581Restructuring costs and other items not included in BOP (138) (140) (173) (81) (29) (64) (70) (78) – – – – (411) (363)Total BOP benefits, losses and expenses (before interest, depreciation and amortization) 28,398 26,425 28,123 21,387 3,908 3,280 669 424 362 921 (265) (323) 61,195 52,113Business operating profit (before interest, depreciation and amortization) 3,630 2,589 2,178 1,782 1,829 1,687 (237) (132) – (49) (91) (127) 7,310 5,750Depreciation and impairments of property and equipment 236 251 42 45 59 72 14 12 – – – – 351 380Amortization and impairments of intangible assets 161 162 71 52 141 114 23 70 – – – – 396 398Interest expense on debt 4 10 10 16 12 – 532 495 2 5 (91) (127) 469 399Business operating profit before non-controlling interests 3,229 2,166 2,055 1,670 1,617 1,501 (806) (709) (1) (54) – – 6,094 4,574Non-controlling interests 108 86 243 246 – – 1 – – – – – 352 332Business operating profit 3,121 2,080 1,812 1,423 1,617 1,501 (806) (709) (1) (54) – – 5,742 4,241
Life includes approximately USD 1.1 billion and USD 1.1 billion of gross written premiums and future life policyholder benefits for certain universal life-type contracts in the Group’s Spanish operations for the years ended December 31, 2021 and 2020, respectively.
Zurich Insurance Group Annual Report 2021
Group overview
Integrated sustainability disclosure
Governance Risk review
Financial review
331
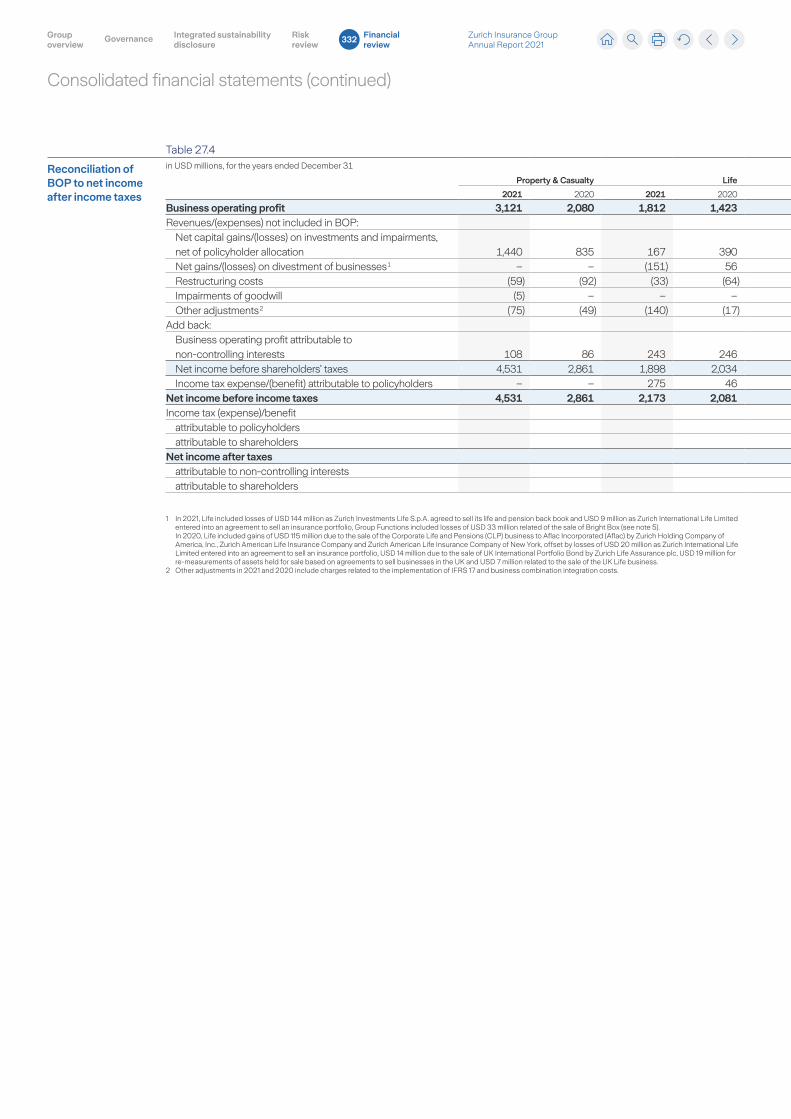
Consolidated financial statements (continued)
Table 27.4
Reconciliation of BOP to net income after income taxes
in USD millions, for the years ended December 31
Property & Casualty Life Farmers
Group Functions
and Operations
Non-Core
Businesses Total
2021 2020 2021 2020 2021 2020 2021 2020 2021 2020 2021 2020
Business operating profit 3,121 2,080 1,812 1,423 1,617 1,501 (806) (709) (1) (54) 5,742 4,241Revenues/(expenses) not included in BOP:
Net capital gains/(losses) on investments and impairments, net of policyholder allocation 1,440 835 167 390 18 9 (58) (172) (19) 18 1,547 1,080Net gains/(losses) on divestment of businesses 1 – – (151) 56 – – (33) 1 – – (185) 57Restructuring costs (59) (92) (33) (64) (4) (55) (10) (3) – – (106) (214)Impairments of goodwill (5) – – – – – – (33) – – (5) (33)Other adjustments 2 (75) (49) (140) (17) (26) (8) (60) (42) – – (301) (116)
Add back:Business operating profit attributable to non-controlling interests 108 86 243 246 – – 1 – – – 352 332Net income before shareholders’ taxes 4,531 2,861 1,898 2,034 1,605 1,446 (967) (957) (21) (37) 7,046 5,348Income tax expense/(benefit) attributable to policyholders – – 275 46 – – – – – – 275 46
Net income before income taxes 4,531 2,861 2,173 2,081 1,605 1,446 (967) (957) (21) (37) 7,321 5,395Income tax (expense)/benefit (1,895) (1,323)
attributable to policyholders (275) (46)attributable to shareholders (1,621) (1,277)
Net income after taxes 5,425 4,071attributable to non-controlling interests 223 238attributable to shareholders 5,202 3,834
1 In 2021, Life included losses of USD 144 million as Zurich Investments Life S.p.A. agreed to sell its life and pension back book and USD 9 million as Zurich International Life Limited entered into an agreement to sell an insurance portfolio, Group Functions included losses of USD 33 million related of the sale of Bright Box (see note 5). In 2020, Life included gains of USD 115 million due to the sale of the Corporate Life and Pensions (CLP) business to Aflac Incorporated (Aflac) by Zurich Holding Company of America, Inc., Zurich American Life Insurance Company and Zurich American Life Insurance Company of New York, offset by losses of USD 20 million as Zurich International Life Limited entered into an agreement to sell an insurance portfolio, USD 14 million due to the sale of UK International Portfolio Bond by Zurich Life Assurance plc, USD 19 million for re-measurements of assets held for sale based on agreements to sell businesses in the UK and USD 7 million related to the sale of the UK Life business.
2 Other adjustments in 2021 and 2020 include charges related to the implementation of IFRS 17 and business combination integration costs.
Zurich Insurance Group Annual Report 2021
Group overview
Integrated sustainability disclosure
Governance Risk review
Financial review
332
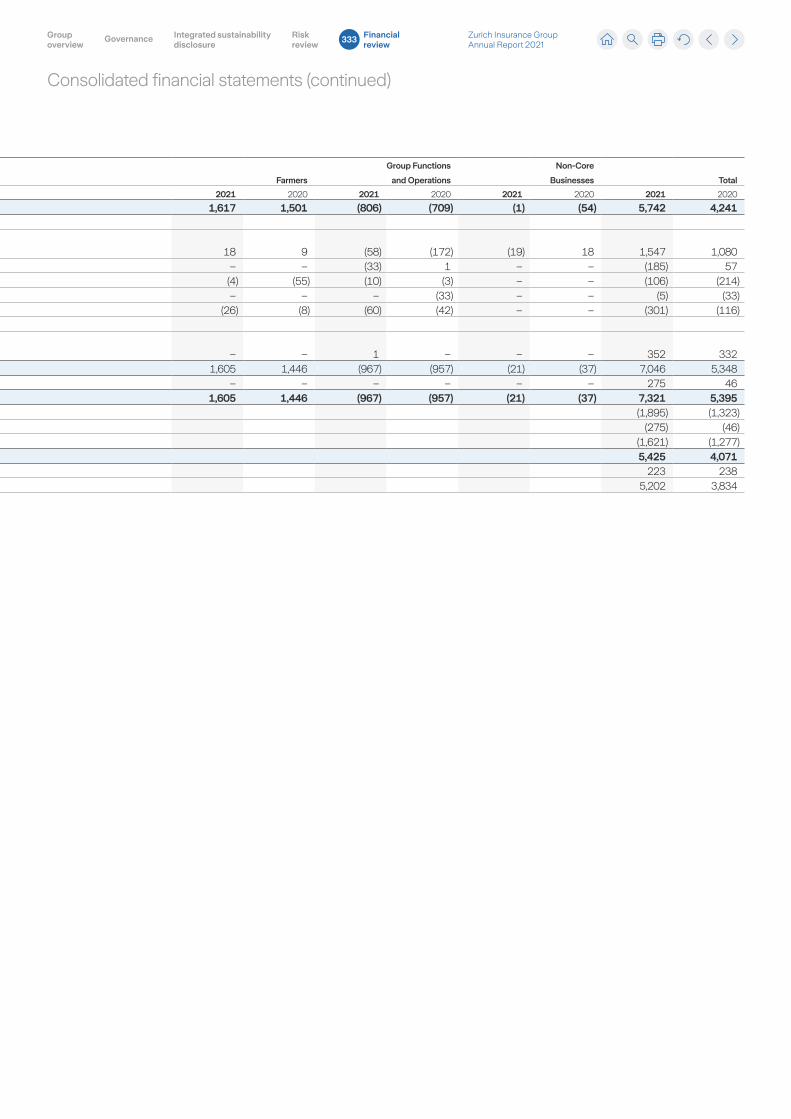
Consolidated financial statements (continued)
Table 27.4
Reconciliation of BOP to net income after income taxes
in USD millions, for the years ended December 31
Property & Casualty Life Farmers
Group Functions
and Operations
Non-Core
Businesses Total
2021 2020 2021 2020 2021 2020 2021 2020 2021 2020 2021 2020
Business operating profit 3,121 2,080 1,812 1,423 1,617 1,501 (806) (709) (1) (54) 5,742 4,241Revenues/(expenses) not included in BOP:
Net capital gains/(losses) on investments and impairments, net of policyholder allocation 1,440 835 167 390 18 9 (58) (172) (19) 18 1,547 1,080Net gains/(losses) on divestment of businesses 1 – – (151) 56 – – (33) 1 – – (185) 57Restructuring costs (59) (92) (33) (64) (4) (55) (10) (3) – – (106) (214)Impairments of goodwill (5) – – – – – – (33) – – (5) (33)Other adjustments 2 (75) (49) (140) (17) (26) (8) (60) (42) – – (301) (116)
Add back:Business operating profit attributable to non-controlling interests 108 86 243 246 – – 1 – – – 352 332Net income before shareholders’ taxes 4,531 2,861 1,898 2,034 1,605 1,446 (967) (957) (21) (37) 7,046 5,348Income tax expense/(benefit) attributable to policyholders – – 275 46 – – – – – – 275 46
Net income before income taxes 4,531 2,861 2,173 2,081 1,605 1,446 (967) (957) (21) (37) 7,321 5,395Income tax (expense)/benefit (1,895) (1,323)
attributable to policyholders (275) (46)attributable to shareholders (1,621) (1,277)
Net income after taxes 5,425 4,071attributable to non-controlling interests 223 238attributable to shareholders 5,202 3,834
1 In 2021, Life included losses of USD 144 million as Zurich Investments Life S.p.A. agreed to sell its life and pension back book and USD 9 million as Zurich International Life Limited entered into an agreement to sell an insurance portfolio, Group Functions included losses of USD 33 million related of the sale of Bright Box (see note 5). In 2020, Life included gains of USD 115 million due to the sale of the Corporate Life and Pensions (CLP) business to Aflac Incorporated (Aflac) by Zurich Holding Company of America, Inc., Zurich American Life Insurance Company and Zurich American Life Insurance Company of New York, offset by losses of USD 20 million as Zurich International Life Limited entered into an agreement to sell an insurance portfolio, USD 14 million due to the sale of UK International Portfolio Bond by Zurich Life Assurance plc, USD 19 million for re-measurements of assets held for sale based on agreements to sell businesses in the UK and USD 7 million related to the sale of the UK Life business.
2 Other adjustments in 2021 and 2020 include charges related to the implementation of IFRS 17 and business combination integration costs.
Zurich Insurance Group Annual Report 2021
Group overview
Integrated sustainability disclosure
Governance Risk review
Financial review
333
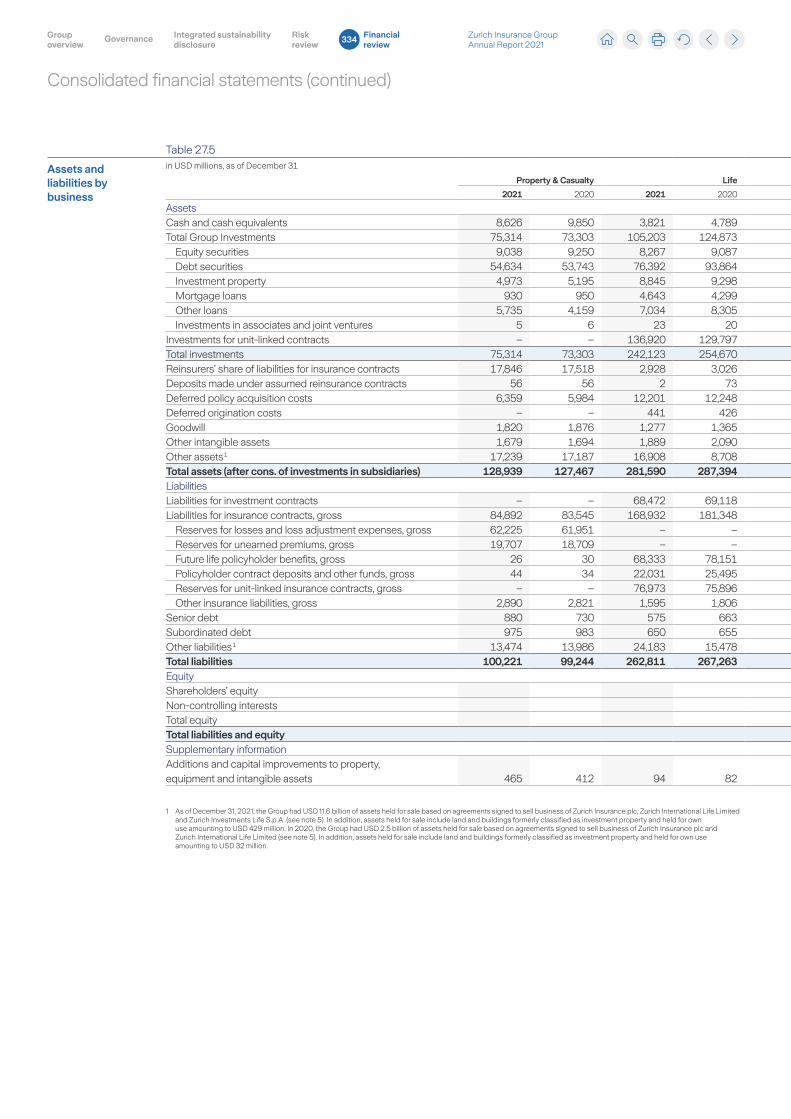
Consolidated financial statements (continued)
Table 27.5
Assets and liabilities by business
in USD millions, as of December 31
Property & Casualty Life Farmers
Group Functions
and Operations
Non-Core
Businesses Eliminations Total
2021 2020 2021 2020 2021 2020 2021 2020 2021 2020 2021 2020 2021 2020
AssetsCash and cash equivalents 8,626 9,850 3,821 4,789 823 818 5,191 5,926 796 637 (10,559) (10,914) 8,698 11,106Total Group Investments 75,314 73,303 105,203 124,873 5,855 5,802 11,300 9,986 5,222 5,779 (11,935) (9,345) 190,959 210,398
Equity securities 9,038 9,250 8,267 9,087 71 71 1,105 946 97 139 – – 18,578 19,493Debt securities 54,634 53,743 76,392 93,864 4,212 4,150 5,825 5,762 4,338 4,551 (317) (360) 145,084 161,710Investment property 4,973 5,195 8,845 9,298 159 159 – – 94 96 – – 14,070 14,749Mortgage loans 930 950 4,643 4,299 533 534 – – – – – – 6,106 5,783Other loans 5,735 4,159 7,034 8,305 880 887 4,329 3,260 694 993 (11,618) (8,985) 7,053 8,620Investments in associates and joint ventures 5 6 23 20 – – 41 17 – – – – 68 43
Investments for unit-linked contracts – – 136,920 129,797 1,286 1,086 – – 4,265 4,175 – – 142,470 135,058Total investments 75,314 73,303 242,123 254,670 7,140 6,887 11,300 9,986 9,487 9,954 (11,935) (9,345) 333,429 345,456Reinsurers’ share of liabilities for insurance contracts 17,846 17,518 2,928 3,026 1,992 2,074 189 – 2,937 2,936 (212) (30) 25,680 25,523Deposits made under assumed reinsurance contracts 56 56 2 73 98 142 135 – 220 283 (68) (52) 444 503Deferred policy acquisition costs 6,359 5,984 12,201 12,248 1,885 1,788 – – – – 1 1 20,446 20,021Deferred origination costs – – 441 426 – – – – – – – – 441 426Goodwill 1,820 1,876 1,277 1,365 1,237 819 9 29 – – – – 4,344 4,089Other intangible assets 1,679 1,694 1,889 2,090 879 383 37 64 – – – – 4,484 4,230Other assets 1 17,239 17,187 16,908 8,708 3,477 1,812 1,374 1,327 2,571 2,664 (3,708) (3,753) 37,861 27,944Total assets (after cons. of investments in subsidiaries) 128,939 127,467 281,590 287,394 17,531 14,723 18,235 17,332 16,011 16,475 (26,481) (24,092) 435,826 439,299LiabilitiesLiabilities for investment contracts – – 68,472 69,118 247 235 – – 137 153 – – 68,855 69,507Liabilities for insurance contracts, gross 84,892 83,545 168,932 181,348 7,915 7,484 410 – 10,882 11,182 (326) (62) 272,707 283,497
Reserves for losses and loss adjustment expenses, gross 62,225 61,951 – – 186 198 1 – 1,196 1,203 (32) (26) 63,577 63,327Reserves for unearned premiums, gross 19,707 18,709 – – 182 21 1 – 22 (2) (4) (4) 19,909 18,724Future life policyholder benefits, gross 26 30 68,333 78,151 2,359 2,304 374 – 3,061 3,474 (176) (1) 73,977 83,958Policyholder contract deposits and other funds, gross 44 34 22,031 25,495 3,914 3,885 5 – 2,058 2,083 – – 28,052 31,497Reserves for unit-linked insurance contracts, gross – – 76,973 75,896 1,286 1,086 – – 4,265 4,175 – – 82,524 81,157Other insurance liabilities, gross 2,890 2,821 1,595 1,806 (12) (10) 29 – 280 248 (114) (32) 4,668 4,834
Senior debt 880 730 575 663 – – 11,754 10,440 279 276 (8,162) (6,638) 5,327 5,470Subordinated debt 975 983 650 655 1,058 – 10,755 9,248 – – (3,655) (2,580) 9,782 8,306Other liabilities 1 13,474 13,986 24,183 15,478 2,238 2,112 10,392 11,724 4,038 4,185 (14,339) (14,813) 39,985 32,673Total liabilities 100,221 99,244 262,811 267,263 11,458 9,831 33,311 31,411 15,336 15,797 (26,482) (24,093) 396,656 399,453EquityShareholders’ equity 37,881 38,278Non-controlling interests 1,289 1,568Total equity 39,170 39,846Total liabilities and equity 435,826 439,299Supplementary informationAdditions and capital improvements to property, equipment and intangible assets 465 412 94 82 144 128 54 92 – – – – 757 715
1 As of December 31, 2021, the Group had USD 11.6 billion of assets held for sale based on agreements signed to sell business of Zurich Insurance plc, Zurich International Life Limited and Zurich Investments Life S.p.A. (see note 5). In addition, assets held for sale include land and buildings formerly classified as investment property and held for own use amounting to USD 429 million. In 2020, the Group had USD 2.5 billion of assets held for sale based on agreements signed to sell business of Zurich Insurance plc and Zurich International Life Limited (see note 5). In addition, assets held for sale include land and buildings formerly classified as investment property and held for own use amounting to USD 32 million.
Zurich Insurance Group Annual Report 2021
Group overview
Integrated sustainability disclosure
Governance Risk review
Financial review
334
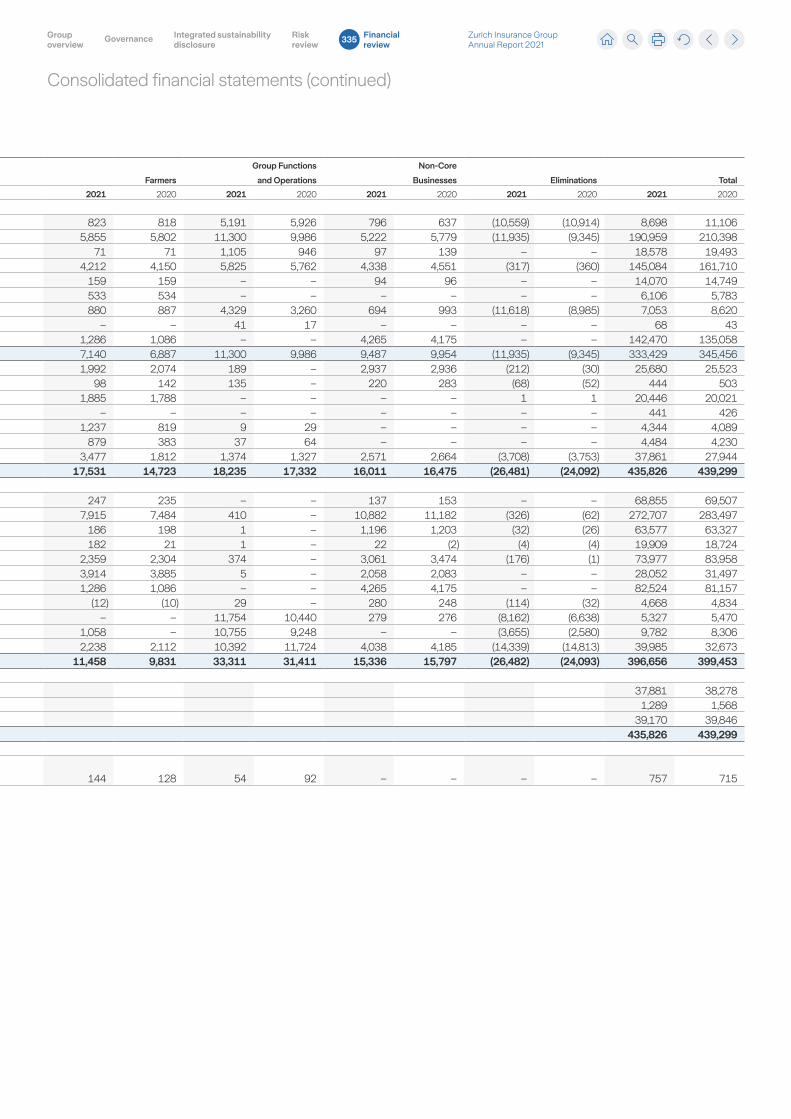
Consolidated financial statements (continued)
Table 27.5
Assets and liabilities by business
in USD millions, as of December 31
Property & Casualty Life Farmers
Group Functions
and Operations
Non-Core
Businesses Eliminations Total
2021 2020 2021 2020 2021 2020 2021 2020 2021 2020 2021 2020 2021 2020
AssetsCash and cash equivalents 8,626 9,850 3,821 4,789 823 818 5,191 5,926 796 637 (10,559) (10,914) 8,698 11,106Total Group Investments 75,314 73,303 105,203 124,873 5,855 5,802 11,300 9,986 5,222 5,779 (11,935) (9,345) 190,959 210,398
Equity securities 9,038 9,250 8,267 9,087 71 71 1,105 946 97 139 – – 18,578 19,493Debt securities 54,634 53,743 76,392 93,864 4,212 4,150 5,825 5,762 4,338 4,551 (317) (360) 145,084 161,710Investment property 4,973 5,195 8,845 9,298 159 159 – – 94 96 – – 14,070 14,749Mortgage loans 930 950 4,643 4,299 533 534 – – – – – – 6,106 5,783Other loans 5,735 4,159 7,034 8,305 880 887 4,329 3,260 694 993 (11,618) (8,985) 7,053 8,620Investments in associates and joint ventures 5 6 23 20 – – 41 17 – – – – 68 43
Investments for unit-linked contracts – – 136,920 129,797 1,286 1,086 – – 4,265 4,175 – – 142,470 135,058Total investments 75,314 73,303 242,123 254,670 7,140 6,887 11,300 9,986 9,487 9,954 (11,935) (9,345) 333,429 345,456Reinsurers’ share of liabilities for insurance contracts 17,846 17,518 2,928 3,026 1,992 2,074 189 – 2,937 2,936 (212) (30) 25,680 25,523Deposits made under assumed reinsurance contracts 56 56 2 73 98 142 135 – 220 283 (68) (52) 444 503Deferred policy acquisition costs 6,359 5,984 12,201 12,248 1,885 1,788 – – – – 1 1 20,446 20,021Deferred origination costs – – 441 426 – – – – – – – – 441 426Goodwill 1,820 1,876 1,277 1,365 1,237 819 9 29 – – – – 4,344 4,089Other intangible assets 1,679 1,694 1,889 2,090 879 383 37 64 – – – – 4,484 4,230Other assets 1 17,239 17,187 16,908 8,708 3,477 1,812 1,374 1,327 2,571 2,664 (3,708) (3,753) 37,861 27,944Total assets (after cons. of investments in subsidiaries) 128,939 127,467 281,590 287,394 17,531 14,723 18,235 17,332 16,011 16,475 (26,481) (24,092) 435,826 439,299LiabilitiesLiabilities for investment contracts – – 68,472 69,118 247 235 – – 137 153 – – 68,855 69,507Liabilities for insurance contracts, gross 84,892 83,545 168,932 181,348 7,915 7,484 410 – 10,882 11,182 (326) (62) 272,707 283,497
Reserves for losses and loss adjustment expenses, gross 62,225 61,951 – – 186 198 1 – 1,196 1,203 (32) (26) 63,577 63,327Reserves for unearned premiums, gross 19,707 18,709 – – 182 21 1 – 22 (2) (4) (4) 19,909 18,724Future life policyholder benefits, gross 26 30 68,333 78,151 2,359 2,304 374 – 3,061 3,474 (176) (1) 73,977 83,958Policyholder contract deposits and other funds, gross 44 34 22,031 25,495 3,914 3,885 5 – 2,058 2,083 – – 28,052 31,497Reserves for unit-linked insurance contracts, gross – – 76,973 75,896 1,286 1,086 – – 4,265 4,175 – – 82,524 81,157Other insurance liabilities, gross 2,890 2,821 1,595 1,806 (12) (10) 29 – 280 248 (114) (32) 4,668 4,834
Senior debt 880 730 575 663 – – 11,754 10,440 279 276 (8,162) (6,638) 5,327 5,470Subordinated debt 975 983 650 655 1,058 – 10,755 9,248 – – (3,655) (2,580) 9,782 8,306Other liabilities 1 13,474 13,986 24,183 15,478 2,238 2,112 10,392 11,724 4,038 4,185 (14,339) (14,813) 39,985 32,673Total liabilities 100,221 99,244 262,811 267,263 11,458 9,831 33,311 31,411 15,336 15,797 (26,482) (24,093) 396,656 399,453EquityShareholders’ equity 37,881 38,278Non-controlling interests 1,289 1,568Total equity 39,170 39,846Total liabilities and equity 435,826 439,299Supplementary informationAdditions and capital improvements to property, equipment and intangible assets 465 412 94 82 144 128 54 92 – – – – 757 715
1 As of December 31, 2021, the Group had USD 11.6 billion of assets held for sale based on agreements signed to sell business of Zurich Insurance plc, Zurich International Life Limited and Zurich Investments Life S.p.A. (see note 5). In addition, assets held for sale include land and buildings formerly classified as investment property and held for own use amounting to USD 429 million. In 2020, the Group had USD 2.5 billion of assets held for sale based on agreements signed to sell business of Zurich Insurance plc and Zurich International Life Limited (see note 5). In addition, assets held for sale include land and buildings formerly classified as investment property and held for own use amounting to USD 32 million.
Zurich Insurance Group Annual Report 2021
Group overview
Integrated sustainability disclosure
Governance Risk review
Financial review
335
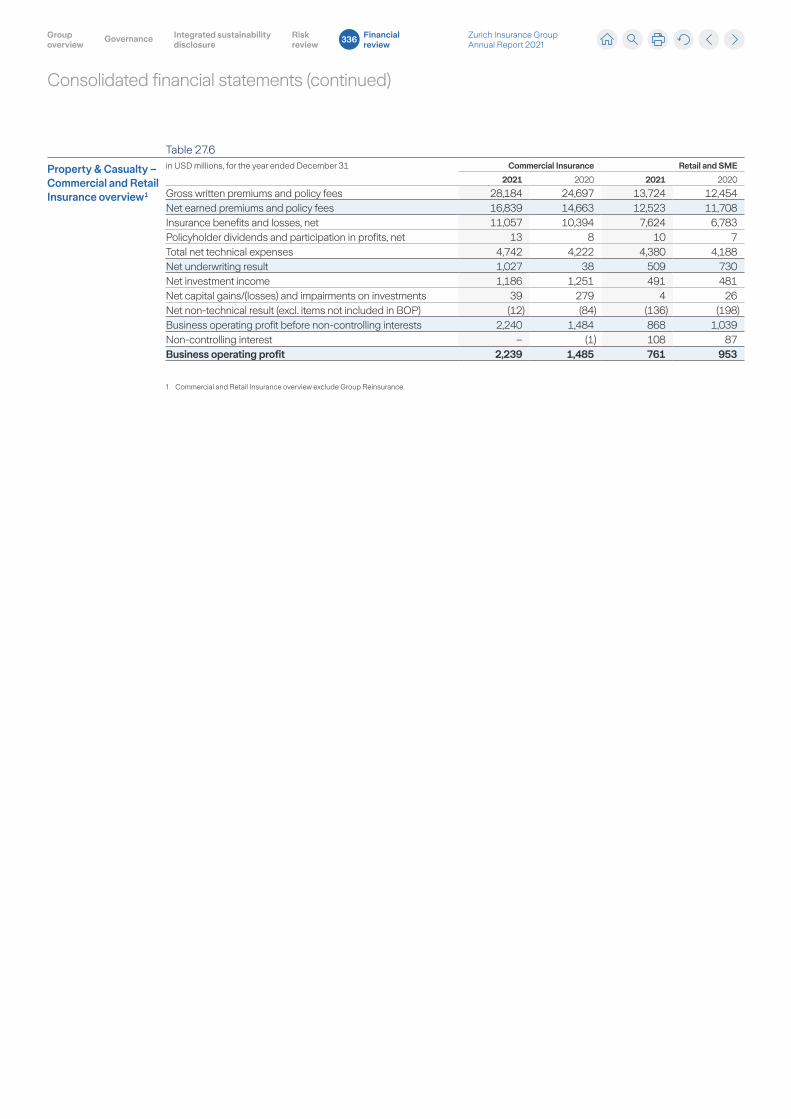
Consolidated financial statements (continued)
Table 27.6
Property & Casualty – Commercial and Retail Insurance overview 1
in USD millions, for the year ended December 31 Commercial Insurance Retail and SME
2021 2020 2021 2020
Gross written premiums and policy fees 28,184 24,697 13,724 12,454Net earned premiums and policy fees 16,839 14,663 12,523 11,708Insurance benefits and losses, net 11,057 10,394 7,624 6,783Policyholder dividends and participation in profits, net 13 8 10 7Total net technical expenses 4,742 4,222 4,380 4,188Net underwriting result 1,027 38 509 730Net investment income 1,186 1,251 491 481Net capital gains/(losses) and impairments on investments 39 279 4 26Net non-technical result (excl. items not included in BOP) (12) (84) (136) (198)Business operating profit before non-controlling interests 2,240 1,484 868 1,039Non-controlling interest – (1) 108 87Business operating profit 2,239 1,485 761 953
1 Commercial and Retail Insurance overview exclude Group Reinsurance.
Zurich Insurance Group Annual Report 2021
Group overview
Integrated sustainability disclosure
Governance Risk review
Financial review
336
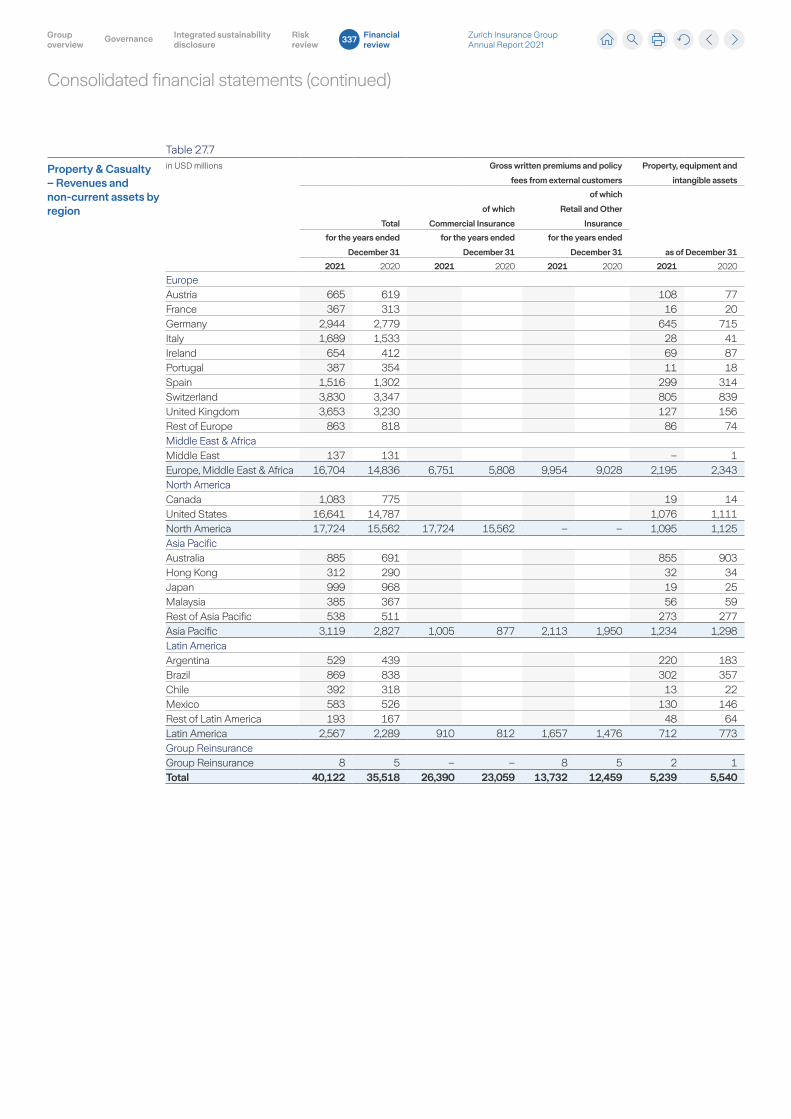
Consolidated financial statements (continued)
Table 27.7
Property & Casualty – Revenues and non-current assets by region
in USD millions Gross written premiums and policy
fees from external customers
Property, equipment and
intangible assets
Total
of which
Commercial Insurance
of which
Retail and Other
Insurance
as of December 31
for the years ended
December 31
for the years ended
December 31
for the years ended
December 31
2021 2020 2021 2020 2021 2020 2021 2020
EuropeAustria 665 619 108 77France 367 313 16 20Germany 2,944 2,779 645 715Italy 1,689 1,533 28 41Ireland 654 412 69 87Portugal 387 354 11 18Spain 1,516 1,302 299 314Switzerland 3,830 3,347 805 839United Kingdom 3,653 3,230 127 156Rest of Europe 863 818 86 74Middle East & AfricaMiddle East 137 131 – 1Europe, Middle East & Africa 16,704 14,836 6,751 5,808 9,954 9,028 2,195 2,343North AmericaCanada 1,083 775 19 14United States 16,641 14,787 1,076 1,111North America 17,724 15,562 17,724 15,562 – – 1,095 1,125Asia PacificAustralia 885 691 855 903Hong Kong 312 290 32 34Japan 999 968 19 25Malaysia 385 367 56 59Rest of Asia Pacific 538 511 273 277Asia Pacific 3,119 2,827 1,005 877 2,113 1,950 1,234 1,298Latin AmericaArgentina 529 439 220 183Brazil 869 838 302 357Chile 392 318 13 22Mexico 583 526 130 146Rest of Latin America 193 167 48 64Latin America 2,567 2,289 910 812 1,657 1,476 712 773Group ReinsuranceGroup Reinsurance 8 5 – – 8 5 2 1Total 40,122 35,518 26,390 23,059 13,732 12,459 5,239 5,540
Zurich Insurance Group Annual Report 2021
Group overview
Integrated sustainability disclosure
Governance Risk review
Financial review
337
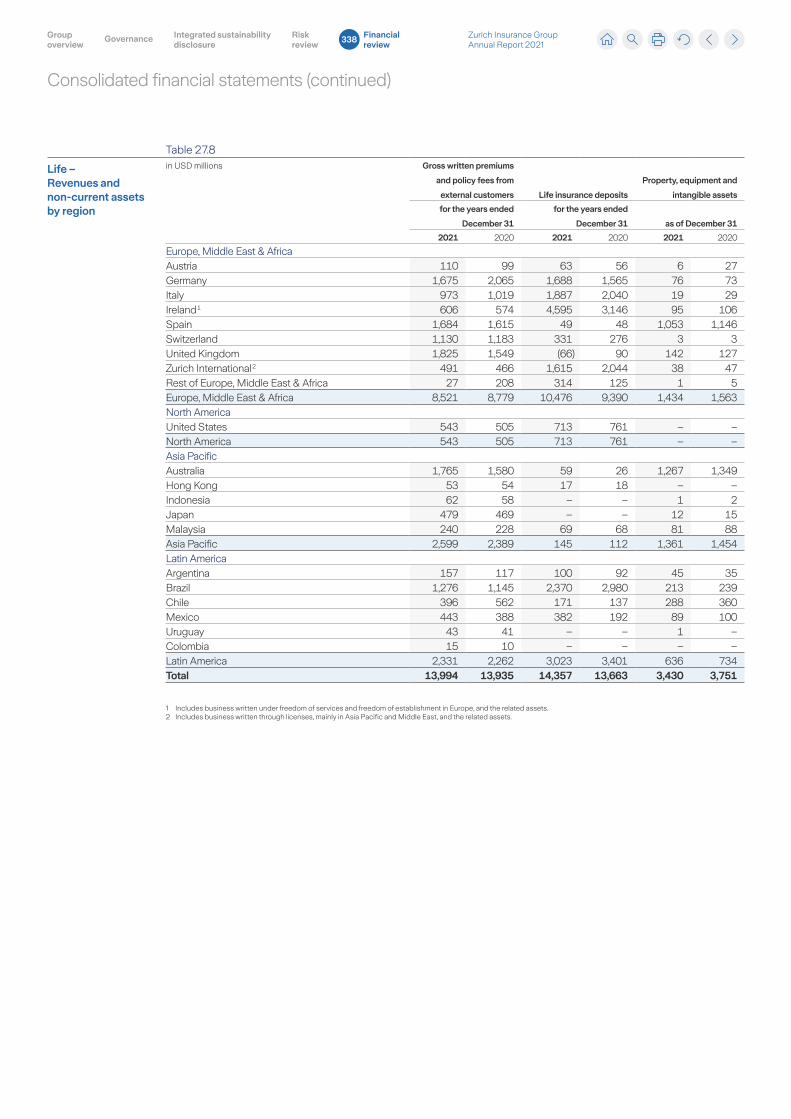
Consolidated financial statements (continued)
Table 27.8
Life – Revenues and non-current assets by region
in USD millions Gross written premiums
and policy fees from
external customers Life insurance deposits
Property, equipment and
intangible assets
for the years ended
December 31
for the years ended
December 31 as of December 31
2021 2020 2021 2020 2021 2020
Europe, Middle East & AfricaAustria 110 99 63 56 6 27Germany 1,675 2,065 1,688 1,565 76 73Italy 973 1,019 1,887 2,040 19 29Ireland 1 606 574 4,595 3,146 95 106Spain 1,684 1,615 49 48 1,053 1,146Switzerland 1,130 1,183 331 276 3 3United Kingdom 1,825 1,549 (66) 90 142 127Zurich International 2 491 466 1,615 2,044 38 47Rest of Europe, Middle East & Africa 27 208 314 125 1 5Europe, Middle East & Africa 8,521 8,779 10,476 9,390 1,434 1,563North AmericaUnited States 543 505 713 761 – –North America 543 505 713 761 – –Asia PacificAustralia 1,765 1,580 59 26 1,267 1,349Hong Kong 53 54 17 18 – –Indonesia 62 58 – – 1 2Japan 479 469 – – 12 15Malaysia 240 228 69 68 81 88Asia Pacific 2,599 2,389 145 112 1,361 1,454Latin AmericaArgentina 157 117 100 92 45 35Brazil 1,276 1,145 2,370 2,980 213 239Chile 396 562 171 137 288 360Mexico 443 388 382 192 89 100Uruguay 43 41 – – 1 –Colombia 15 10 – – – –Latin America 2,331 2,262 3,023 3,401 636 734Total 13,994 13,935 14,357 13,663 3,430 3,751
1 Includes business written under freedom of services and freedom of establishment in Europe, and the related assets.2 Includes business written through licenses, mainly in Asia Pacific and Middle East, and the related assets.
Zurich Insurance Group Annual Report 2021
Group overview
Integrated sustainability disclosure
Governance Risk review
Financial review
338
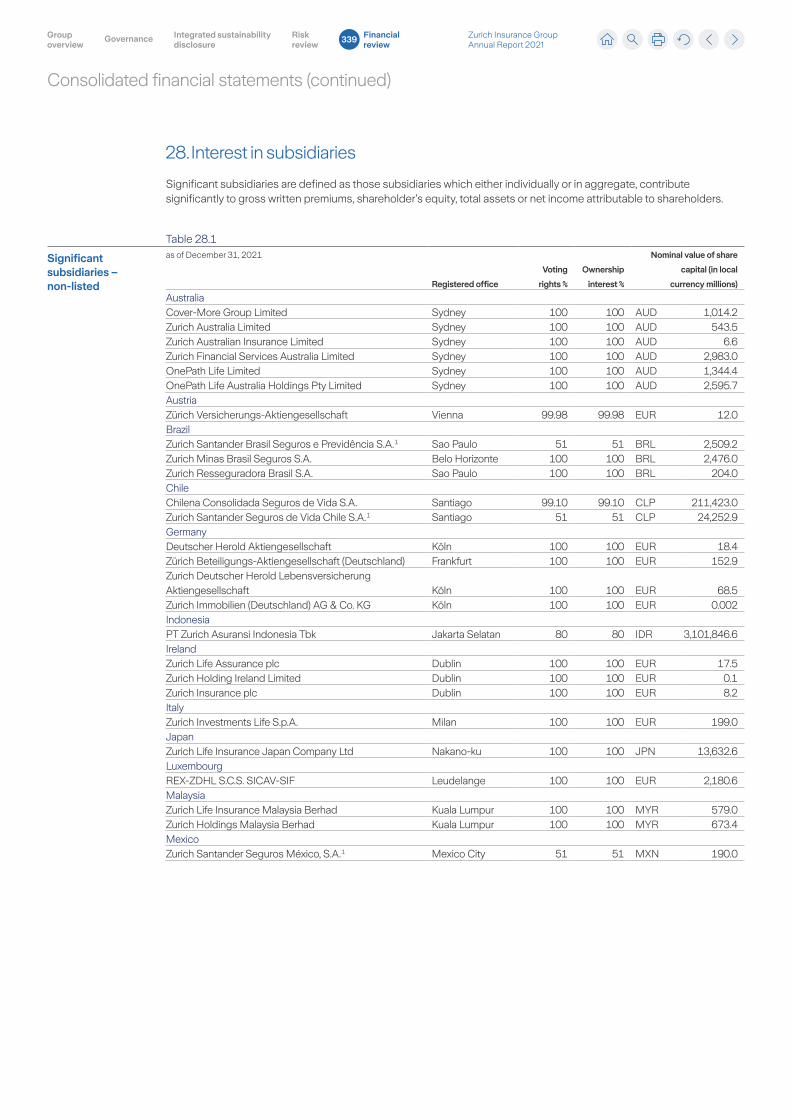
Consolidated financial statements (continued)
28. Interest in subsidiaries
Significant subsidiaries are defined as those subsidiaries which either individually or in aggregate, contribute significantly to gross written premiums, shareholder’s equity, total assets or net income attributable to shareholders.
Table 28.1
Significant subsidiaries – non-listed
as of December 31, 2021
Registered office
Voting
rights %
Ownership
interest %
Nominal value of share
capital (in local
currency millions)
AustraliaCover-More Group Limited Sydney 100 100 AUD 1,014.2Zurich Australia Limited Sydney 100 100 AUD 543.5Zurich Australian Insurance Limited Sydney 100 100 AUD 6.6Zurich Financial Services Australia Limited Sydney 100 100 AUD 2,983.0OnePath Life Limited Sydney 100 100 AUD 1,344.4OnePath Life Australia Holdings Pty Limited Sydney 100 100 AUD 2,595.7AustriaZürich Versicherungs-Aktiengesellschaft Vienna 99.98 99.98 EUR 12.0BrazilZurich Santander Brasil Seguros e Previdência S.A. 1 Sao Paulo 51 51 BRL 2,509.2Zurich Minas Brasil Seguros S.A. Belo Horizonte 100 100 BRL 2,476.0Zurich Resseguradora Brasil S.A. Sao Paulo 100 100 BRL 204.0ChileChilena Consolidada Seguros de Vida S.A. Santiago 99.10 99.10 CLP 211,423.0Zurich Santander Seguros de Vida Chile S.A. 1 Santiago 51 51 CLP 24,252.9GermanyDeutscher Herold Aktiengesellschaft Köln 100 100 EUR 18.4Zürich Beteiligungs-Aktiengesellschaft (Deutschland) Frankfurt 100 100 EUR 152.9Zurich Deutscher Herold Lebensversicherung Aktiengesellschaft Köln 100 100 EUR 68.5Zurich Immobilien (Deutschland) AG & Co. KG Köln 100 100 EUR 0.002IndonesiaPT Zurich Asuransi Indonesia Tbk Jakarta Selatan 80 80 IDR 3,101,846.6IrelandZurich Life Assurance plc Dublin 100 100 EUR 17.5Zurich Holding Ireland Limited Dublin 100 100 EUR 0.1Zurich Insurance plc Dublin 100 100 EUR 8.2ItalyZurich Investments Life S.p.A. Milan 100 100 EUR 199.0JapanZurich Life Insurance Japan Company Ltd Nakano-ku 100 100 JPN 13,632.6LuxembourgREX-ZDHL S.C.S. SICAV-SIF Leudelange 100 100 EUR 2,180.6MalaysiaZurich Life Insurance Malaysia Berhad Kuala Lumpur 100 100 MYR 579.0Zurich Holdings Malaysia Berhad Kuala Lumpur 100 100 MYR 673.4MexicoZurich Santander Seguros México, S.A. 1 Mexico City 51 51 MXN 190.0
Zurich Insurance Group Annual Report 2021
Group overview
Integrated sustainability disclosure
Governance Risk review
Financial review
339
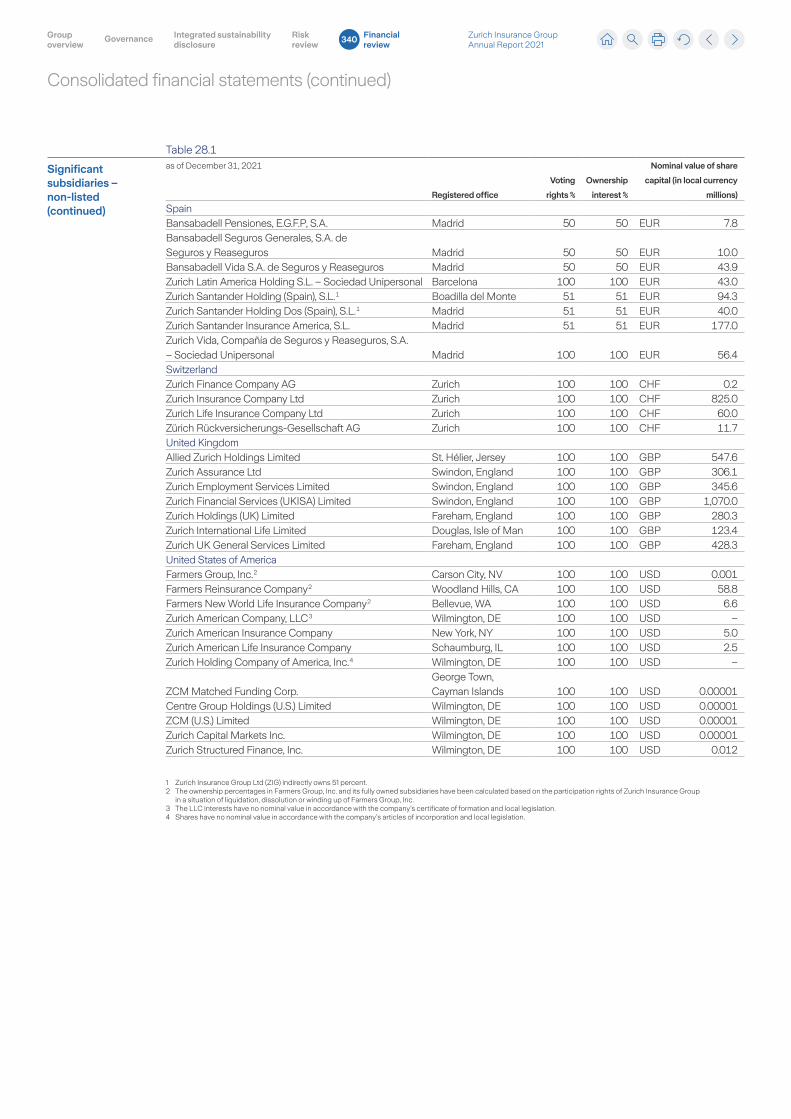
Consolidated financial statements (continued)
Table 28.1
Significant subsidiaries – non-listed (continued)
as of December 31, 2021
Registered office
Voting
rights %
Ownership
interest %
Nominal value of share
capital (in local currency
millions)
SpainBansabadell Pensiones, E.G.F.P, S.A. Madrid 50 50 EUR 7.8Bansabadell Seguros Generales, S.A. de Seguros y Reaseguros Madrid 50 50 EUR 10.0Bansabadell Vida S.A. de Seguros y Reaseguros Madrid 50 50 EUR 43.9Zurich Latin America Holding S.L. – Sociedad Unipersonal Barcelona 100 100 EUR 43.0Zurich Santander Holding (Spain), S.L. 1 Boadilla del Monte 51 51 EUR 94.3Zurich Santander Holding Dos (Spain), S.L. 1 Madrid 51 51 EUR 40.0Zurich Santander Insurance America, S.L. Madrid 51 51 EUR 177.0Zurich Vida, Compañía de Seguros y Reaseguros, S.A. – Sociedad Unipersonal Madrid 100 100 EUR 56.4SwitzerlandZurich Finance Company AG Zurich 100 100 CHF 0.2Zurich Insurance Company Ltd Zurich 100 100 CHF 825.0Zurich Life Insurance Company Ltd Zurich 100 100 CHF 60.0Zürich Rückversicherungs-Gesellschaft AG Zurich 100 100 CHF 11.7United KingdomAllied Zurich Holdings Limited St. Hélier, Jersey 100 100 GBP 547.6Zurich Assurance Ltd Swindon, England 100 100 GBP 306.1Zurich Employment Services Limited Swindon, England 100 100 GBP 345.6Zurich Financial Services (UKISA) Limited Swindon, England 100 100 GBP 1,070.0Zurich Holdings (UK) Limited Fareham, England 100 100 GBP 280.3Zurich International Life Limited Douglas, Isle of Man 100 100 GBP 123.4Zurich UK General Services Limited Fareham, England 100 100 GBP 428.3United States of AmericaFarmers Group, Inc. 2 Carson City, NV 100 100 USD 0.001Farmers Reinsurance Company 2 Woodland Hills, CA 100 100 USD 58.8Farmers New World Life Insurance Company 2 Bellevue, WA 100 100 USD 6.6Zurich American Company, LLC 3 Wilmington, DE 100 100 USD –Zurich American Insurance Company New York, NY 100 100 USD 5.0Zurich American Life Insurance Company Schaumburg, IL 100 100 USD 2.5Zurich Holding Company of America, Inc. 4 Wilmington, DE 100 100 USD –
ZCM Matched Funding Corp.George Town, Cayman Islands 100 100 USD 0.00001
Centre Group Holdings (U.S.) Limited Wilmington, DE 100 100 USD 0.00001ZCM (U.S.) Limited Wilmington, DE 100 100 USD 0.00001Zurich Capital Markets Inc. Wilmington, DE 100 100 USD 0.00001Zurich Structured Finance, Inc. Wilmington, DE 100 100 USD 0.012
1 Zurich Insurance Group Ltd (ZIG) indirectly owns 51 percent.2 The ownership percentages in Farmers Group, Inc. and its fully owned subsidiaries have been calculated based on the participation rights of Zurich Insurance Group
in a situation of liquidation, dissolution or winding up of Farmers Group, Inc.3 The LLC interests have no nominal value in accordance with the company’s certificate of formation and local legislation.4 Shares have no nominal value in accordance with the company’s articles of incorporation and local legislation.
Zurich Insurance Group Annual Report 2021
Group overview
Integrated sustainability disclosure
Governance Risk review
Financial review
340
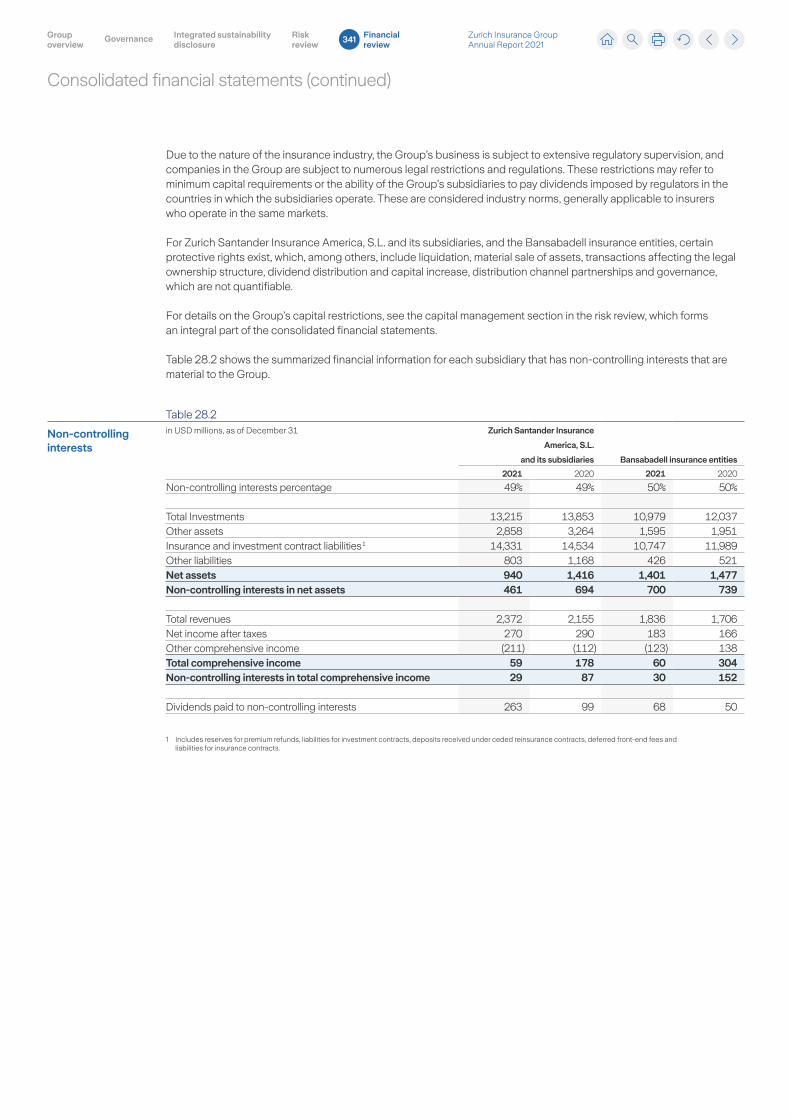
Consolidated financial statements (continued)
Due to the nature of the insurance industry, the Group’s business is subject to extensive regulatory supervision, and companies in the Group are subject to numerous legal restrictions and regulations. These restrictions may refer to minimum capital requirements or the ability of the Group’s subsidiaries to pay dividends imposed by regulators in the countries in which the subsidiaries operate. These are considered industry norms, generally applicable to insurers who operate in the same markets.
For Zurich Santander Insurance America, S.L. and its subsidiaries, and the Bansabadell insurance entities, certain protective rights exist, which, among others, include liquidation, material sale of assets, transactions affecting the legal ownership structure, dividend distribution and capital increase, distribution channel partnerships and governance, which are not quantifiable.
For details on the Group’s capital restrictions, see the capital management section in the risk review, which forms an integral part of the consolidated financial statements.
Table 28.2 shows the summarized financial information for each subsidiary that has non-controlling interests that are material to the Group.
Table 28.2
Non-controlling interests
in USD millions, as of December 31 Zurich Santander Insurance
America, S.L.
and its subsidiaries Bansabadell insurance entities
2021 2020 2021 2020
Non-controlling interests percentage 49% 49% 50% 50%
Total Investments 13,215 13,853 10,979 12,037Other assets 2,858 3,264 1,595 1,951Insurance and investment contract liabilities 1 14,331 14,534 10,747 11,989Other liabilities 803 1,168 426 521Net assets 940 1,416 1,401 1,477Non-controlling interests in net assets 461 694 700 739
Total revenues 2,372 2,155 1,836 1,706Net income after taxes 270 290 183 166Other comprehensive income (211) (112) (123) 138Total comprehensive income 59 178 60 304Non-controlling interests in total comprehensive income 29 87 30 152
Dividends paid to non-controlling interests 263 99 68 50
1 Includes reserves for premium refunds, liabilities for investment contracts, deposits received under ceded reinsurance contracts, deferred front-end fees and liabilities for insurance contracts.
Zurich Insurance Group Annual Report 2021
Group overview
Integrated sustainability disclosure
Governance Risk review
Financial review
341

Consolidated financial statements (continued)
29. Events after the balance sheet date
On January 2, 2022, the Group announced that Zurich Investments Life S.p.A. agreed to sell a part of its life and pension back book to the Portuguese insurance company GamaLife – Companhia de Seguros de Vida S.A. (see note 5).
On January 4, 2022, the Group announced that Zurich Insurance Company Ltd was exercising its option to redeem USD 1 billion of subordinated notes that had been issued in 2016. The notes were redeemed in full at par on January 20, 2022.
On January 7, 2022, the Group announced a placement of subordinated notes by Zurich Insurance Company Ltd. The subordinated notes, in a total principal amount of CHF 300 million and with a maturity date of May 3, 2052, were issued on January 18, 2022.
Zurich Insurance Group Annual Report 2021
Group overview
Integrated sustainability disclosure
Governance Risk review
Financial review
342

THIS PAGE HAS INTENTIONALLY BEEN LEFT BLANK
Zurich Insurance Group Annual Report 2021
Group overview
Integrated sustainability disclosure
Governance Risk review
Financial review
343
Report of the statutory auditor
Report of the statutory auditor Ernst & Young LtdMaagplatz 1P.O. BoxCH-8010 Zurich
Phone: +41 58 286 31 11Fax: +41 58 286 30 04www.ey.com/ch
To the General Meeting ofZurich Insurance Group Ltd, Zurich
Zurich, February 9, 2022
Statutory auditor’s report on the audit of the consolidated financial statements
OpinionWe have audited the consolidated financial statements of Zurich Insurance Group Ltd and itssubsidiaries (the Group), which comprise the consolidated statement of financial position as atDecember 31, 2021, and the consolidated statement of income, consolidated statement ofcomprehensive income, consolidated statement of changes in equity and consolidated statement ofcash flows for the year then ended, and notes to the consolidated financial statements, including asummary of significant accounting policies.
In our opinion, the accompanying consolidated financial statements (pages 233 to 342 and the auditedsections of the risk review on pages 187 to 214) give a true and fair view of the consolidated financialposition of the Group as at December 31, 2021, and its consolidated financial performance and itsconsolidated cash flows for the year then ended in accordance with International Financial ReportingStandards (IFRS) and comply with Swiss law.
Basis for opinionWe conducted our audit in accordance with Swiss law, International Standards on Auditing (ISAs)and Swiss Auditing Standards. Our responsibilities under those provisions and standards are furtherdescribed in the Auditor’s Responsibilities for the Audit of the Consolidated Financial Statementssection of our report.
We are independent of the Group in accordance with the provisions of Swiss law and the requirementsof the Swiss audit profession, as well as the International Code of Ethics for Professional Accountants(including International Independence Standards) of the International Ethics Standards Board forAccountants (IESBA Code) and we have fulfilled our other ethical responsibilities in accordance withthese requirements.
We believe that the audit evidence we have obtained is sufficient and appropriate to provide a basis forour opinion.
Key audit mattersKey audit matters are those matters that, in our professional judgment, were of most significance in ouraudit of the consolidated financial statements of the current period. These matters were addressed inthe context of our audit of the consolidated financial statements as a whole, and in forming our opinionthereon, and we do not provide a separate opinion on these matters. For each matter below, ourdescription of how our audit addressed the matter is provided in that context.
We have fulfilled the responsibilities described in the Auditor’s responsibilities for the audit of theconsolidated financial statements section of our report, including in relation to these matters.Accordingly, our audit included the performance of procedures designed to respond to our assessmentof the risks of material misstatement of the consolidated financial statements. The results of our auditprocedures, including the procedures performed to address the matters below, provide the basis for ouraudit opinion on the consolidated financial statements.
Zurich Insurance Group Annual Report 2021
Group overview
Integrated sustainability disclosure
Governance Risk review
Financial review
344
Report of the statutory auditor (continued)
2
Valuation of certain Property & Casualty reserves
Area of focus Out of the total consolidated liabilities, reserves for losses and loss adjustmentexpenses is a material item of the liabilities for insurance contracts financialstatement line and amounted to USD 63,577 million as of December 31, 2021.
As described in the Notes to the consolidated financial statement, reservesfor losses and loss adjustment expenses are estimates of future payments forreported and unreported claims losses and related expenses with respect to insuredevents that have occurred.
Reserving for incurred but not reported claims is a complex process applyingactuarial and statistical methods over historical data and patterns requiring the use ofinformed estimates and judgments. It requires the use of complex formulas andcomputational tools that may be incorrectly configured, and for which inaccurate orincomplete input data may be used.
This is specifically the case for Property & Casualty lines of business that areconsidered longer-tail such as worker’s compensation, general and professionalliability, and other specialty lines where certain longer-term assumptions are requiredas part of the projection technics. These projection techniques also considerexposures to the prolonged impacts of the COVID-19 pandemic including uncertaintyaround claims litigation, timeliness of claims reporting, resultant impact of challengeswith supply chains and inflation.
Additionally, reserves for catastrophes events which are usually of less frequencybut higher severity, are more difficult to estimate and include expert judgments.
Accordingly, we have identified this as a key audit matter.
The accounting policies and critical accounting judgments and estimates of theGroup about the valuation of the loss and loss adjustment expense reserves aredescribed in Notes 3 and 4 respectively and additional information regarding thesereserves is presented in Note 8 to the consolidated financial statements.
Zurich Insurance Group Annual Report 2021
Group overview
Integrated sustainability disclosure
Governance Risk review
Financial review
345
Report of the statutory auditor (continued)
3
Our auditresponse
We assessed and tested the design effectiveness of selected key controls within theactuarial reserve valuation process. These included controls over methods selection,completeness and accuracy of the underlying data, assumption setting and thegovernance process used by management.
We executed our substantive procedures in relation to these reserves and relatedchanges as included in the consolidated statement of income using the work of ouractuarial specialists.
Our procedures included:- Performance of a country-based risk tiering assessment by line of business
based on multiple criteria including materiality, tail length and prior yeardevelopments.
- Analytical reviews considering separately current accident year loss ratiofrom prior years developments.
- Evaluation of the appropriateness of the loss reserve levels for significantcatastrophe events.
For selected lines of business, our procedures further included:- Testing the completeness and accuracy of data utilized by Zurich Insurance
actuaries in estimating the loss reserves by reconciling such amounts andrelated output to the underlying accounting records and the financialstatements as appropriate.
- Data-enabled audit procedures and claims data plausibility checks onselected samples to support completeness and accuracy of claimstriangles.
- Independent projections of ultimate losses and calculation of a reasonablerange for required loss reserves for selected lines of business. We alsoassessed of managements’ recorded loss reserves as compared to ourindependent developed loss reserve range.
- Analysis of actuarial methods and assessment of the reasonableness of thequantitative and qualitative assumptions used within projection technics byZurich Insurance actuaries for the valuation of property and casualtyreserves.
- Assessment of the prolonged COVID-19 pandemic impacts on property andcasualty reserves.
- Evaluation of the appropriateness of significant adjustments made bymanagement relating to the Actuarial reserve estimates.
Finally, we assessed the appropriateness of accounting policies used and adequacyof the disclosures in the consolidated financial statements.
Based on audit procedures performed, we did not identify any exceptions withregards to the valuation of property and casualty reserves.
Zurich Insurance Group Annual Report 2021
Group overview
Integrated sustainability disclosure
Governance Risk review
Financial review
346
Report of the statutory auditor (continued)
4
Valuation of certain actuarially determined life insurance assets and liabilities
Area of focus Out of total consolidated assets, life deferred policy acquisition costs(‘Life DAC’) is a material item of the deferred policy acquisition costs financialstatement line and amounted to USD 12,201 million as of December 31, 2021.
Out of total consolidated liabilities, future life policyholder benefit reserves is amaterial item of the liabilities for insurance contracts financial statement line andamounted to USD 73,977 million as of December 31, 2021.
The valuation of the above mentioned actuarially determined life insuranceassets and liabilities is associated with significant uncertainties requiring theuse of expert judgment within complex actuarial models relying on complexand subjective assumptions in relation to future events.
The assumptions and data used for calculations of these balances require botheconomic and non-economic assumptions, including interest rates, investmentreturns, mortality, morbidity, longevity, persistency, expenses, and the modeledfuture decisions of the policyholders. In addition, uncertainty triggered by theprolonged impact of the COVID-19 pandemic requires an additional layer ofanalysis and judgment.
Moreover, because of the long duration of many life insurance products,relatively small changes in key assumptions may have a significant impact onthe valuation of the actuarially determined life insurance assets and liabilities.Specifically, the continued low interest rate, and the related impacted topolicyholder behavior, creates a risk of accelerated amortization of deferredpolicy acquisition costs and a strain on the sufficiency of life reserves.
The valuation of these assets and liabilities requires the use of complexformulas and the construction of models and other computational tools that maybe incorrectly designed or configured, and for which inadequate assumptionsand or incomplete or inaccurate input data may be used.
Accordingly, we have identified this as a key audit matter.
The accounting policies and critical accounting judgments and estimates of theGroup about the valuation of the actuarially determined life insurance assetsand liabilities are described in Notes 3 and 4 respectively and additionalinformation regarding these assets and liabilities is presented respectively inNotes 11 and 8 to the consolidated financial statements.
Zurich Insurance Group Annual Report 2021
Group overview
Integrated sustainability disclosure
Governance Risk review
Financial review
347
Report of the statutory auditor (continued)
5
Our auditresponse
We assessed and tested the design effectiveness of selected key controlswithin the life insurance asset and liability actuarial valuation process. Theseincluded controls over methods selection, completeness and accuracy of theunderlying data, assumption setting and the governance process used bymanagement.
We executed our substantive procedures in relation to these balances andrelated changes as included in the consolidated income statements using thework of our actuarial specialists.
Our procedures included:- Performance of a country-based risk tiering assessment by product
based on multiple criteria including materiality, specific productfeatures and complexity, and liability adequacy test headroom.
- Reviewing liability adequacy testing, and related impact to Life DACrecoverability and sufficiency of the future life policyholder benefitreserves.
- Assessing the consistency of the life actuarial methods and bestestimate assumptions used across the Group’s significant businessunits.
For selected products, our procedures further included:- Testing of the completeness and accuracy of data, including in-force
policyholder data and experience studies, as utilized by ZurichInsurance actuaries to value these insurance assets and liabilities byreconciling such amounts and related output to the underlyingaccounting records and the financial statements as appropriate.
- Reviewing actuarial models used in the determination of these lifeinsurance assets and liabilities and their compliance with productsspecificities and related guarantees.
- Assessing certain quantitative and qualitative best estimateassumptions used in actuarial models, including considerations of theirreasonableness based on experience studies, our knowledge of theGroup and local markets, products offered, publicly available marketand macroeconomic data, and impacts of the prolonged COVID-19pandemic.
- On a sample basis, independent calculation of Life DAC and futurelife policyholder benefit reserves balances.
Finally, we assessed the appropriateness of accounting policies used andadequacy of the disclosures in the consolidated financial statements.
Based on audit procedures performed, we did not identify any exceptionsrelated to the valuation of actuarial determined life insurance assets andliabilities.
Zurich Insurance Group Annual Report 2021
Group overview
Integrated sustainability disclosure
Governance Risk review
Financial review
348
Report of the statutory auditor (continued)
6
Acquisition of MetLife’s Property & Casualty business in the United States
Area of focus As of April 7, 2021, the Group’s wholly-owned subsidiary Farmers Group Inc.(FGI) and the Farmers Exchanges successfully closed on an acquisition ofMetLife Property & Casualty business in the United States (MetLife P&C).As part of this acquisition, FGI in effect acquired MetLife P&C’s managementand administrative related assets and liabilities to conduct its responsibilitiesas attorney-in-fact of the Farmers Exchanges and the Farmers Exchangesunderlying insurance businesses. FGI acquired approximately USD 2,444million of net assets in this acquisition which led to the recognition of anadditional attorney-in-fact (AIF) intangible of approximately USD 1,625 millionand goodwill of USD 418 million. Accounting for this unique businesscombination was complex including identification of customer relationships,the valuation of identified intangibles (including the AIF), and assessing theindefinite life of the underlying AIF contracts.
Accordingly, we deemed the acquisition of MetLife’s P&C’s business in theUnited States as a key audit matter.
FGI’s acquisition is disclosed in Note 5 with additional information related to theAIF contracts in Note 14 and Relationship with Farmers Exchanges in Note 26to the consolidated financial statements.
Our auditresponse
We have inspected the underlying legal contracts provided to us bymanagement and considered the substance of the FGI acquisition as basis forrecognition as a business combination in the Group’s consolidated financialstatements.
We tested the consideration paid, and the identification and valuation of thetangible and intangible assets acquired.
With the assistance of our valuation specialists where appropriate, we testedand evaluated the valuations prepared by the Group for the separately identifiedintangible assets (including the value assigned to the AIF contracts).
Our procedures included:- Assessing the appropriateness of valuation methods and testing the
associated models used by management.- Evaluating the reasonableness of significant assumptions, including
projected financial information, used by management based on acomparison to historical source records as well as current industry andeconomic data; such procedures included evaluating current or futuretrends in discount rates, premium growth and retention rates andmanagement fee rates, among other assumptions.
- Performing sensitivity analyses to determine the impact of changes inkey assumptions including the discount rate and projected fee revenueto determine potential valuation impacts.
Finally, we assessed the appropriateness of accounting policies used andadequacy of the disclosures in the consolidated financial statements.
Based on audit procedures performed, we did not find any exceptions related tothe acquisition of MetLife’s Property and Casualty business in the United States.
Zurich Insurance Group Annual Report 2021
Group overview
Integrated sustainability disclosure
Governance Risk review
Financial review
349
Report of the statutory auditor (continued)
7
Area of focus As of December 31, 2021, the Group recognized goodwill and attorney-in-fact(AIF) contracts intangibles (including the value assigned to AIF intangibleassociated with the MetLife’s P&C business acquisition) with a net carryingamount of USD 6,994 million. Goodwill is allocated to the cash generating units(CGUs) that are identified generally at the segment level.
Management performs impairment testing of goodwill and intangible assets withindefinite useful life (i.e., the AIF intangible) at least once annually to ensure thatthe net carrying amount does not exceed the recoverable amount per CGU andthere is no impairment in the relevant CGU.
Estimation of the recoverable amount requires management to use complexmodels, expert judgment and is based on several complex and subjectiveassumptions, particularly in respect of:
- projections of future income based on prospective business plans,- perpetual growth rates, and- discount rates.
Accordingly, we deem the measurement of the recoverable amount of goodwilland attorney-in-fact contracts to be a key audit matter.
The accounting policies and critical accounting judgments and estimates relatedto goodwill and attorney-in-fact contracts are disclosed in Notes 3 and 4respectively and additional information on goodwill and attorney-in-factcontracts is presented in Note 14 to the consolidated financial statements.
Zurich Insurance Group Annual Report 2021
Group overview
Integrated sustainability disclosure
Governance Risk review
Financial review
350
Recoverability of goodwill and attorney-in-fact contracts
Report of the statutory auditor (continued)
8
Our auditresponse
We obtained an understanding of the Group’s goodwill impairment testing andassessed the design effectiveness of selected key controls related to theGroup’s goodwill and AIF intangible.
With the assistance of our valuation specialists where appropriate, oursubstantive testing procedures included:
- Evaluation whether the goodwill and AIF intangible allocation to CGUsas identified by management is supportable.
- Assessment of the valuation methodology and models used bymanagement to determine the goodwill and AIF recoverability amount.
- Performance of substantive procedures regarding key assumptionsincluding evaluation of:
o Consistency of projected future cash flows withmanagement’s most recent estimates including those used inthe Group’s budgeting and forecasting process,
o The assumptions made with respect to projected future cashflows are reasonable in terms of the applicable GCU’seconomic and financial outlook, including the impacts of theprolonged COVID-19 pandemic,
o The comparison of actual results versus historical projectedfinancial information,
o Consistency of key assumptions including discount andperpetual growth rates with market and industry specificreference values and that such assumptions are used in theGroup’s projected cash flows, and
o The completeness and accuracy of data used bymanagement to project future cash flows.
- Evaluation of the sensitivity analysis performed by management andperformance of additional procedures to assess the appropriateness ofkey assumptions used by management.
Finally, we assessed the appropriateness of accounting policies used andadequacy of the disclosures in the consolidated financial statements.
Based on audit procedures performed, we did not find any exceptions tothe recoverability of goodwill and attorney-in-fact contracts.
Other MatterThe consolidated financial statements of Zurich Insurance Group Ltd and its subsidiaries for theyear ended December 31, 2020, were audited by another statutory auditor who expressed anunmodified opinion on those consolidated financial statements on February 10, 2021.
Zurich Insurance Group Annual Report 2021
Group overview
Integrated sustainability disclosure
Governance Risk review
Financial review
351
Report of the statutory auditor (continued)
9
Other information in the annual reportThe Board of Directors is responsible for the other information in the annual report. The otherinformation comprises all information included in the annual report, but does not include theconsolidated financial statements, the stand-alone financial statements of Zurich Insurance GroupLtd, the audited sections of the risk review on pages 187 to 214, the Remuneration report of ZurichInsurance Group Ltd and our auditor’s reports thereon.
Our opinion on the consolidated financial statements does not cover the other information in theannual report and we do not express any form of assurance conclusion thereon.
In connection with our audit of the consolidated financial statements, our responsibility is to readthe other information in the annual report and, in doing so, consider whether the other informationis materially inconsistent with the consolidated financial statements or our knowledge obtained inthe audit, or otherwise appears to be materially misstated. If, based on the work we haveperformed, we conclude that there is a material misstatement of this other information, we arerequired to report that fact. We have nothing to report in this regard.
Responsibility of the Board of Directors for the consolidated financial statementsThe Board of Directors is responsible for the preparation of the consolidated financial statementsthat give a true and fair view in accordance with IFRS and the provisions of Swiss law, and forsuch internal control as the Board of Directors determines is necessary to enable the preparationof consolidated financial statements that are free from material misstatement, whether due to fraudor error.
In preparing the consolidated financial statements, the Board of Directors is responsiblefor assessing the Group’s ability to continue as a going concern, disclosing, as applicable, mattersrelated to going concern and using the going concern basis of accounting unless the Board ofDirectors either intends to liquidate the Group or to cease operations, or has no realistic alternativebut to do so.
Auditor’s responsibilities for the audit of the consolidated financial statementsOur objectives are to obtain reasonable assurance about whether the consolidated financialstatements as a whole are free from material misstatement, whether due to fraud or error, and toissue an auditor’s report that includes our opinion. Reasonable assurance is a high level ofassurance, but is not a guarantee that an audit conducted in accordance with Swiss law, ISAs andSwiss Auditing Standards will always detect a material misstatement when it exists. Misstatementscan arise from fraud or error and are considered material if, individually or in the aggregate, theycould reasonably be expected to influence the economic decisions of users taken on the basis ofthese consolidated financial statements.
A further description of our responsibilities for the audit of the consolidated financial statements islocated at the website of EXPERTsuisse: http://www.expertsuisse.ch/en/audit-report-for-public-companies. This description forms part of our auditor’s report.
Zurich Insurance Group Annual Report 2021
Group overview
Integrated sustainability disclosure
Governance Risk review
Financial review
352
Report of the statutory auditor (continued)
10
Report on other legal and regulatory requirementsIn accordance with article 728a para. 1 item 3 CO and the Swiss Auditing Standard 890, we confirm thatan internal control system exists, which has been designed for the preparation of consolidated financialstatements according to the instructions of the Board of Directors.
We recommend that the consolidated financial statements submitted to you be approved.
Ernst & Young Ltd
Isabelle Santenac Thomas FiepkeLicensed audit expert Certified Public Accountant (U.S.)(Auditor in charge)
Zurich Insurance Group Annual Report 2021
Group overview
Integrated sustainability disclosure
Governance Risk review
Financial review
353
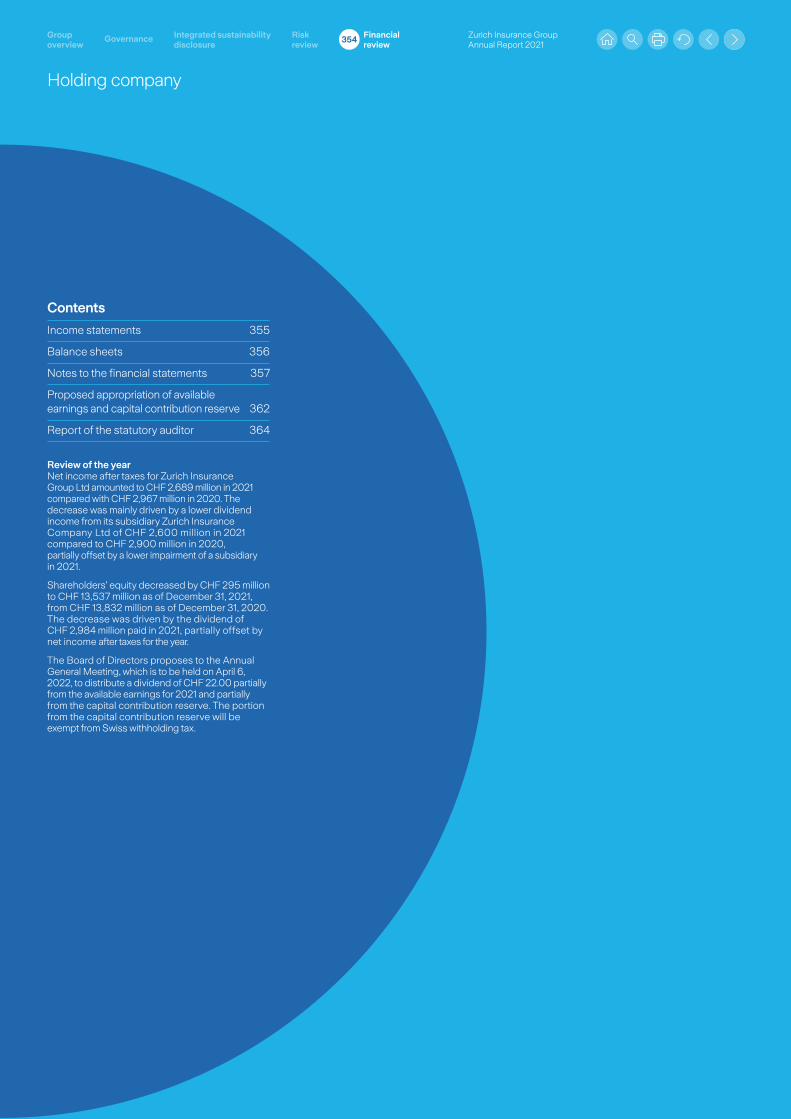
Holding company
Review of the yearNet income after taxes for Zurich Insurance Group Ltd amounted to CHF 2,689 million in 2021 compared with CHF 2,967 million in 2020. The decrease was mainly driven by a lower dividend income from its subsidiary Zurich Insurance Company Ltd of CHF 2,600 million in 2021 compared to CHF 2,900 million in 2020, partially offset by a lower impairment of a subsidiary in 2021.
Shareholders’ equity decreased by CHF 295 million to CHF 13,537 million as of December 31, 2021, from CHF 13,832 million as of December 31, 2020. The decrease was driven by the dividend of CHF 2,984 million paid in 2021, partially offset by net income after taxes for the year.
The Board of Directors proposes to the Annual General Meeting, which is to be held on April 6, 2022, to distribute a dividend of CHF 22.00 partially from the available earnings for 2021 and partially from the capital contribution reserve. The portion from the capital contribution reserve will be exempt from Swiss withholding tax.
Contents
Income statements 355
Balance sheets 356
Notes to the financial statements 357
Proposed appropriation of available earnings and capital contribution reserve 362
Report of the statutory auditor 364
Holding company
Zurich Insurance Group Annual Report 2021
Group overview
Integrated sustainability disclosure
Governance Risk review
Financial review
354
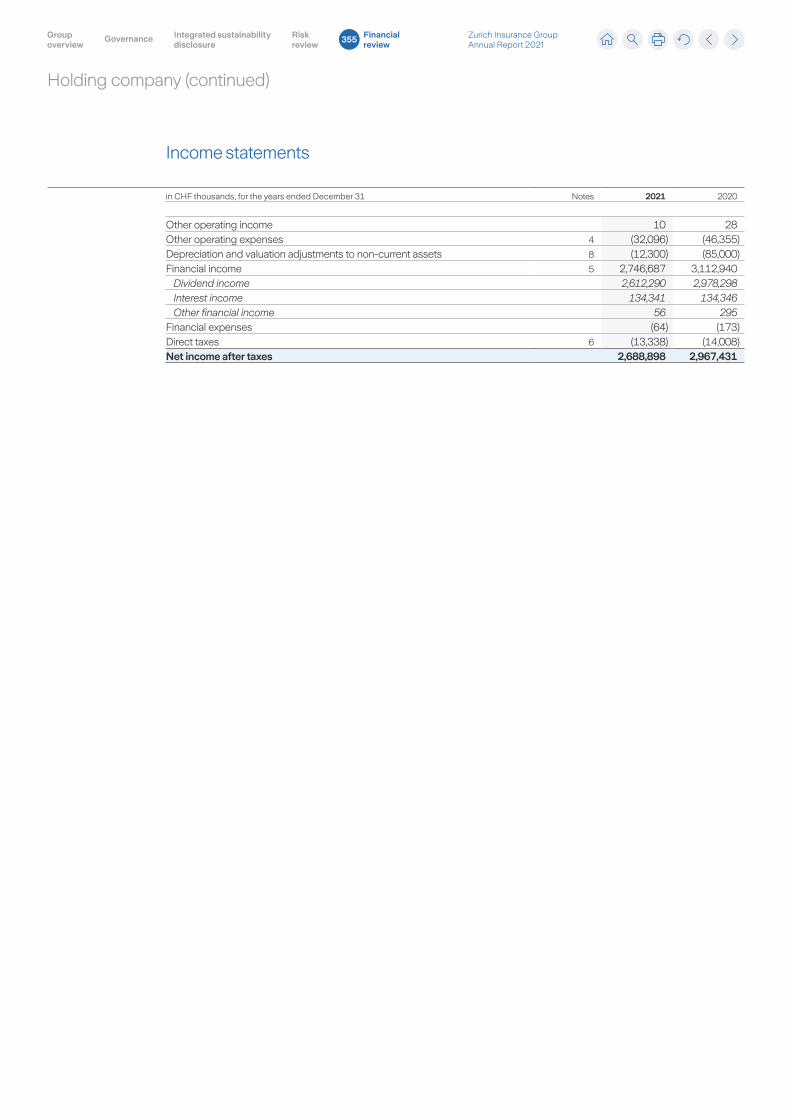
Holding company (continued)
Income statements
in CHF thousands, for the years ended December 31 Notes 2021 2020
Other operating income 10 28Other operating expenses 4 (32,096) (46,355)Depreciation and valuation adjustments to non-current assets 8 (12,300) (85,000)Financial income 5 2,746,687 3,112,940
Dividend income 2,612,290 2,978,298Interest income 134,341 134,346Other financial income 56 295
Financial expenses (64) (173)Direct taxes 6 (13,338) (14,008)Net income after taxes 2,688,898 2,967,431
Zurich Insurance Group Annual Report 2021
Group overview
Integrated sustainability disclosure
Governance Risk review
Financial review
355
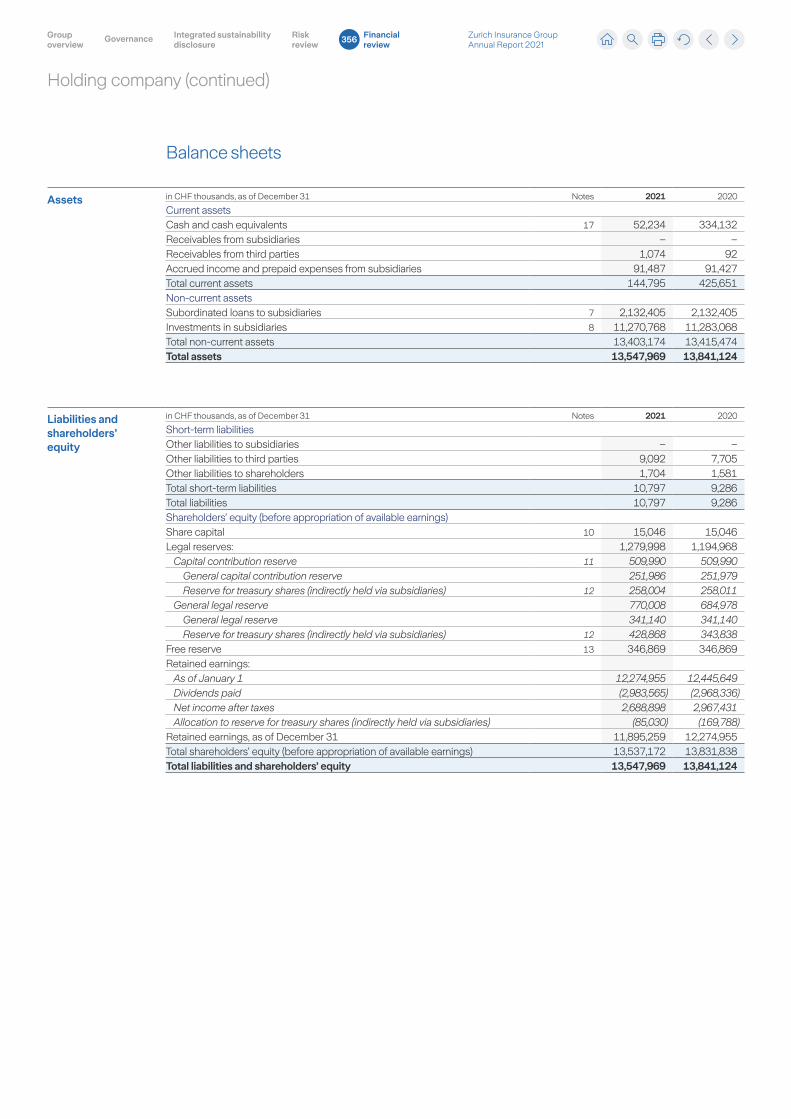
Holding company (continued)
Balance sheets
Assets in CHF thousands, as of December 31 Notes 2021 2020
Current assetsCash and cash equivalents 17 52,234 334,132Receivables from subsidiaries – –Receivables from third parties 1,074 92Accrued income and prepaid expenses from subsidiaries 91,487 91,427Total current assets 144,795 425,651Non-current assetsSubordinated loans to subsidiaries 7 2,132,405 2,132,405Investments in subsidiaries 8 11,270,768 11,283,068Total non-current assets 13,403,174 13,415,474Total assets 13,547,969 13,841,124
Liabilities and shareholders’ equity
in CHF thousands, as of December 31 Notes 2021 2020
Short-term liabilitiesOther liabilities to subsidiaries – –Other liabilities to third parties 9,092 7,705Other liabilities to shareholders 1,704 1,581Total short-term liabilities 10,797 9,286Total liabilities 10,797 9,286Shareholders’ equity (before appropriation of available earnings)Share capital 10 15,046 15,046Legal reserves: 1,279,998 1,194,968
Capital contribution reserve 11 509,990 509,990General capital contribution reserve 251,986 251,979Reserve for treasury shares (indirectly held via subsidiaries) 12 258,004 258,011
General legal reserve 770,008 684,978General legal reserve 341,140 341,140Reserve for treasury shares (indirectly held via subsidiaries) 12 428,868 343,838
Free reserve 13 346,869 346,869Retained earnings:
As of January 1 12,274,955 12,445,649Dividends paid (2,983,565) (2,968,336)Net income after taxes 2,688,898 2,967,431Allocation to reserve for treasury shares (indirectly held via subsidiaries) (85,030) (169,788)
Retained earnings, as of December 31 11,895,259 12,274,955Total shareholders’ equity (before appropriation of available earnings) 13,537,172 13,831,838Total liabilities and shareholders’ equity 13,547,969 13,841,124
Zurich Insurance Group Annual Report 2021
Group overview
Integrated sustainability disclosure
Governance Risk review
Financial review
356
Holding company (continued)
Notes to the financial statements
1. General informationZurich Insurance Group Ltd (the Company) is a corporation domiciled in Zurich, Switzerland, and its shares are listed on the SIX Swiss Exchange. It was incorporated on April 26, 2000, and is the holding company of the Zurich Insurance Group (Group) with the principal activity of holding subsidiary companies. The Company does not employ staff, as employees work in a joint capacity for Zurich Insurance Company Ltd (ZIC).
2. Basis of presentationThe Company presents its financial statements in accordance with Swiss law.
All amounts in these financial statements including the notes are shown in Swiss franc thousands, rounded to the nearest thousand, unless otherwise specified. All variances are calculated using the actual figures rather than the rounded amounts.
3. Summary of significant accounting policiesa) Exchange ratesUnless otherwise stated, assets and liabilities expressed in currencies other than Swiss francs are translated at year end exchange rates. Revenues and expenses are translated using the exchange rate at the date of the transaction. Net unrealized exchange losses are recorded in the income statements and net unrealized exchange gains are deferred until realized.
b) Investments in subsidiariesInvestments in subsidiaries are equity interests, held on a long-term basis for the purpose of the Company’s business activities. Each investment in subsidiaries is valued individually and carried at its cost less adjustments for impairments.
c) Accrued incomeIncome is accrued for interest which is earned but not yet due for payment at the end of the reporting period.
d) Reserves for treasury shares (indirectly held via subsidiaries)Reserves for treasury shares are accounted for at the acquisition costs of these shares held by the respective subsidiary.
4. Other operating expensesOther operating expenses for the year were CHF 32.1 million compared with CHF 46.4 million in 2020. The decrease of CHF 14.3 million is mainly driven by a lower contribution in 2021 of CHF 17.0 million to the Z Zurich Foundation, whereas the contribution paid in 2020 was CHF 26.0 million. In addition, directors’ fees of CHF 5.7 million and CHF 5.4 million for the years ended December 31, 2021, and December 31, 2020, respectively, are included in this line item. Overhead expenses decreased by CHF 3.7 million to CHF 5.5 million in 2021. Furthermore, fees paid to the Swiss Financial Market Supervisory Authority of CHF 3.1 million and CHF 3.0 million are included for the years ended December 31, 2021, and December 31, 2020. The line item also includes in 2020 stamp duty of CHF 2.2 million on the issue of new shares, whereas in 2021 no new shares were issued.
5. Financial incomeFinancial income for the year 2021 consists of dividend income of CHF 2,612 million mainly received from the Company’s subsidiary ZIC and interest income of CHF 134.3 million on the subordinated loan with ZIC. This interest income is recognized when ZIC declares its intention to pay a dividend to the Company.
Zurich Insurance Group Annual Report 2021
Group overview
Integrated sustainability disclosure
Governance Risk review
Financial review
357
Holding company (continued)
6. Direct taxesDirect taxes include Swiss income and capital tax expense.
7. Subordinated loans to subsidiariesSubordinated loans include a loan to ZIC of CHF 2,132 million as of December 31, 2021, and December 31, 2020, respectively.
8. Investments in subsidiaries
Investments in subsidiaries
as of December 31 2021 2020
Carrying
value 1
Voting rights
in %
Capital rights
in %
Carrying
value 1
Voting rights
in %
Capital rights
in %
Zurich Insurance Company Ltd 11,088,466 100.0 100.0 11,088,466 100.0 100.0Zurich Financial Services EUB Holdings Limited 24,136 99.9 99.9 36,436 99.9 99.9Farmers Group, Inc. 157,992 12.1 4.6 157,992 12.1 4.6Allied Zurich Limited 175 100.0 100.0 175 100.0 100.0Total 11,270,768 11,283,068
1 in CHF thousands.
The investment in Zurich Financial Services EUB Holdings Limited was impaired by CHF 12.3 million in 2021 compared with CHF 85.0 million in 2020, mainly due to a dividend payment.
In addition to the above mentioned directly held subsidiaries, the Company indirectly owns additional subsidiaries primarily through ZIC. Information regarding indirectly owned subsidiaries is included on pages 339 to 340 of this Annual Report.
9. Commitments and contingenciesThe Company has provided unlimited guarantees in support of entities belonging to the Zurich Capital Markets group of companies. The Company has also entered into support agreements and guarantees for the benefit of certain of its subsidiaries. They amounted to CHF 942 million as of December 31, 2021, and CHF 922 million as of December 31, 2020. The increase is solely due to a positive foreign exchange effect. Furthermore, the Company has issued an unlimited guarantee in favor of the Institute of London Underwriters in relation to business transferred to Zurich Insurance plc from a Group company which no longer has insurance licenses.
The Company is not aware of any event of default that would require it to satisfy any of these guarantees or to take action under a support agreement.
10. Share capital a) Changes to the share capitalOn April 7, 2021, the Annual General Meeting (AGM) of the Company approved an extension of the authorized share capital for another two years (from April 2021 to April 7, 2023). The extension of the authorized share capital required the corresponding extension of the validity of the combined dilution limitations for the authorized and contingent share capital (Art. 5bis 5 and 5ter 1d of the Articles of Association). Since April 2020, the authorized share capital (Art. 5bis 1 of the Articles of Association) is comprised of 44,882,400 shares and the contingent share capital for Financial Instruments (Art. 5ter 1a of the Articles of Association; term as defined in section b) below) is comprised of 29,921,600 shares. As of December 31, 2021, and as of December 31, 2020, the contingent share capital for Group employees (Art. 5ter 2a of the Articles of Association) was comprised of 4,095,092 shares. During the year 2021, no shares were issued to Group employees out of the contingent capital while during the year 2020, a total of 852,140 shares were issued to Group employees out of the contingent capital.
Zurich Insurance Group Annual Report 2021
Group overview
Integrated sustainability disclosure
Governance Risk review
Financial review
358
Holding company (continued)
b) Authorized share capital (as specified in Article 5bis of the Articles of Association)On April 7, 2021, the AGM approved a renewal of the authorized share capital for another two years (from April 2021 to April 7, 2023). The Board of the Company is authorized to increase the share capital of the Company by an amount not exceeding CHF 4,488,240 by issuing up to 44,882,400 fully paid registered shares with a nominal value of CHF 0.10 each until April 7, 2023. An increase in partial amounts is permitted. The Board would determine the date of issue of any such new shares, the issue price, type of payment, conditions for exercising subscription rights, and the commencement of entitlement to dividends.
The Board may issue such new shares by means of a firm underwriting by a banking institution or syndicate with a subsequent offer of those shares to current shareholders. The Board may allow the expiry of subscription rights which have not been exercised, or it may place these rights as well as shares, the subscription rights of which have not been exercised, at market conditions.
The Board is further authorized to restrict or exclude the subscription rights of shareholders and to allocate them to third parties, the Company or one of its Group companies, up to a maximum of 14,960,800 shares, if the shares are to be used:
– for the take-over of an enterprise, of parts of an enterprise or of participations or for investments by the Company or one of its Group companies, or the financing including re-financing of such transactions; or
– for the purpose of expanding the scope of shareholders in connection with the quotation of shares on foreign stock exchanges or issuance of shares on the national or international capital markets (including private placements to one or more selected investors); or
– for the conversion of loans, bonds, similar debt instruments, equity-linked instruments or other financial market instruments (collectively, the ‘Financial Instruments’) issued by the Company or one of its Group companies; or
– for the improvement of the regulatory and/or the rating capital position of the Company or one of its Group companies in a fast and expeditious manner.
Up to April 7, 2023, the total of new shares issued from (i) authorized share capital where the subscription rights were restricted or excluded, and (ii) contingent share capital in connection with Financial Instruments where the advance subscription rights were restricted or excluded, may not exceed 14,960,800 new shares.
c) Contingent share capital (as specified in Article 5ter of the Articles of Association)Financial InstrumentsThe share capital of the Company may be increased by an amount not exceeding CHF 2,992,160 by issuing of up to 29,921,600 fully paid registered shares with a nominal value of CHF 0.10 each by the voluntary or mandatory exercise of conversion and/or option rights which are granted in connection with the issuance of Financial Instruments by the Company or one of its Group companies or by mandatory conversion of Financial Instruments issued by the Company or one of its Group companies, that allow for contingent mandatory conversion into shares of the Company, or by exercising option rights which are granted to the shareholders. The subscription rights are excluded. The then-current owners of the Financial Instruments shall be entitled to subscribe for the new shares. The conversion and/or option conditions are to be determined by the Board.
The Board is authorized, when issuing Financial Instruments to restrict or exclude the advance subscription rights in cases where they are issued:
– for the financing including re-financing of a take-over of an enterprise, of parts of an enterprise, or of participations or of investments by the Company or one of its Group companies; or
– on national or international capital markets (including private placements to one or more selected investors); or
– for the improvement of the regulatory and/or the rating capital position of the Company or one of its Group companies in a fast and expeditious manner.
If the advance subscription rights are restricted or excluded by a resolution of the Board, the following applies: the Financial Instruments are to be issued at prevailing market conditions (including standard dilution protection clauses in accordance with market practice) and the setting of the conversion or issue price of the new shares must take due account of the stock market price of the shares and/or comparable instruments priced by the market at the time of issue or time of conversion.
Zurich Insurance Group Annual Report 2021
Group overview
Integrated sustainability disclosure
Governance Risk review
Financial review
359
Holding company (continued)
The conversion rights may be exercisable during a maximum of ten years and option rights during a maximum of seven years from the time of the respective issue; contingent conversion features may remain in place indefinitely.
Up to April 7, 2023, the total of new shares issued from (i) authorized share capital where the subscription rights were restricted or excluded, and (ii) contingent share capital in connection with Financial Instruments where the advance subscription rights were restricted or excluded, may not exceed 14,960,800 new shares.
Employee participationOn January 1, 2021, the contingent share capital, to be issued to Group employees, amounted to CHF 409,509.20 or 4,095,092 fully paid registered shares with a nominal value of CHF 0.10 each. On January 1, 2020, the contingent share capital, to be issued to Group employees, amounted to CHF 494,723.20 or 4,947,232 fully paid registered shares with a nominal value of CHF 0.10 each.
During 2021, no shares were issued to Group employees out of the contingent capital while during 2020, 852,140 shares were issued to Group employees out of the contingent capital. As of December 31, 2021 and as of December 31, 2020, the remaining contingent share capital available for issuance to Group employees amounted to CHF 409,509.20 or 4,095,092 fully paid registered shares with a nominal value of CHF 0.10 each. Subscription rights as well as advance subscription rights of the shareholders are excluded. The issuance of new shares or respective option rights to employees is subject to one or more regulations to be issued by the Board and taking into account performance, functions, levels of responsibility and criteria of profitability. New shares or option rights may be issued to employees at a price lower than that quoted on the stock exchange.
For further information, see Art. 5bis and 5ter of the Articles of Association (www.zurich.com/investor-relations/our-shares/articles-of-association).
11. Capital contribution reserve
Capital contribution reserve
in CHF thousands 2021 2020
As of January 1 509,990 287,506Transfer to free reserve (adjustment capital contribution reserve) – (2,226)Additional paid-in capital on share-based payment transactions – 224,709As of December 31 509,990 509,990
12. Reserves for treasury shares (indirectly held via subsidiaries)These reserves correspond to the purchase value of all Zurich Insurance Group Ltd shares held by companies of the Group as shown in the table below.
Reserves for treasury shares (indirectly held via subsidiaries)
Number of
shares 2021
Purchase
value 2021¹
Number of
shares 2020
Purchase
value 2020 ¹
As of January 1 1,964,106 601,848 1,549,714 432,061Purchases during the year 1,100,000 425,822 510,592 206,630Sales during the year (894,909) (340,799) (96,200) (36,842)As of December 31 2,169,197 686,872 1,964,106 601,848Thereof held in capital contribution reserveAs of January 1 1,057,654 258,011 1,057,654 258,011As of December 31 1,057,624 258,004 1,057,654 258,011Thereof held in general legal reserveAs of January 1 906,452 343,838 492,060 174,050As of December 31 1,111,573 428,868 906,452 343,838Average purchase price, in CHF 387 405Average selling price, in CHF 313 296
1 in CHF thousands.
Zurich Insurance Group Annual Report 2021
Group overview
Integrated sustainability disclosure
Governance Risk review
Financial review
360
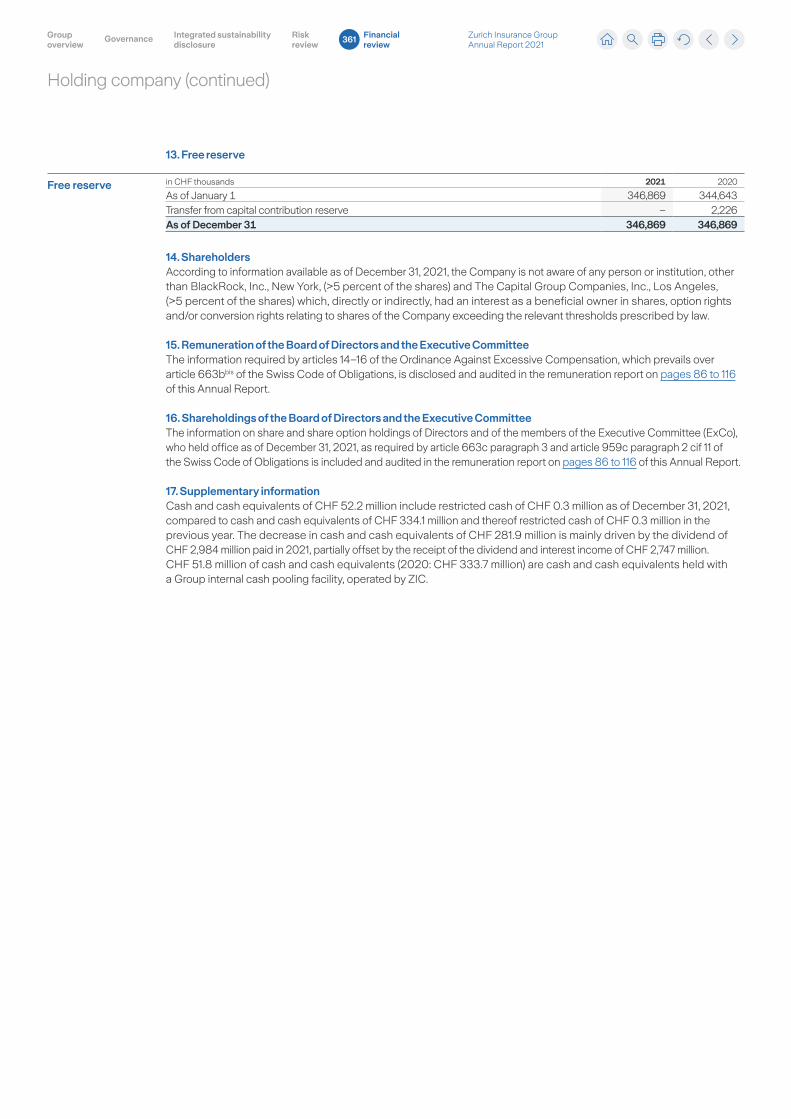
Holding company (continued)
13. Free reserve
Free reserve in CHF thousands 2021 2020
As of January 1 346,869 344,643Transfer from capital contribution reserve – 2,226As of December 31 346,869 346,869
14. ShareholdersAccording to information available as of December 31, 2021, the Company is not aware of any person or institution, other than BlackRock, Inc., New York, (>5 percent of the shares) and The Capital Group Companies, Inc., Los Angeles, (>5 percent of the shares) which, directly or indirectly, had an interest as a beneficial owner in shares, option rights and/or conversion rights relating to shares of the Company exceeding the relevant thresholds prescribed by law.
15. Remuneration of the Board of Directors and the Executive CommitteeThe information required by articles 14–16 of the Ordinance Against Excessive Compensation, which prevails over article 663bbis of the Swiss Code of Obligations, is disclosed and audited in the remuneration report on pages 86 to 116 of this Annual Report.
16. Shareholdings of the Board of Directors and the Executive CommitteeThe information on share and share option holdings of Directors and of the members of the Executive Committee (ExCo), who held office as of December 31, 2021, as required by article 663c paragraph 3 and article 959c paragraph 2 cif 11 of the Swiss Code of Obligations is included and audited in the remuneration report on pages 86 to 116 of this Annual Report.
17. Supplementary informationCash and cash equivalents of CHF 52.2 million include restricted cash of CHF 0.3 million as of December 31, 2021, compared to cash and cash equivalents of CHF 334.1 million and thereof restricted cash of CHF 0.3 million in the previous year. The decrease in cash and cash equivalents of CHF 281.9 million is mainly driven by the dividend of CHF 2,984 million paid in 2021, partially offset by the receipt of the dividend and interest income of CHF 2,747 million. CHF 51.8 million of cash and cash equivalents (2020: CHF 333.7 million) are cash and cash equivalents held with a Group internal cash pooling facility, operated by ZIC.
Zurich Insurance Group Annual Report 2021
Group overview
Integrated sustainability disclosure
Governance Risk review
Financial review
361
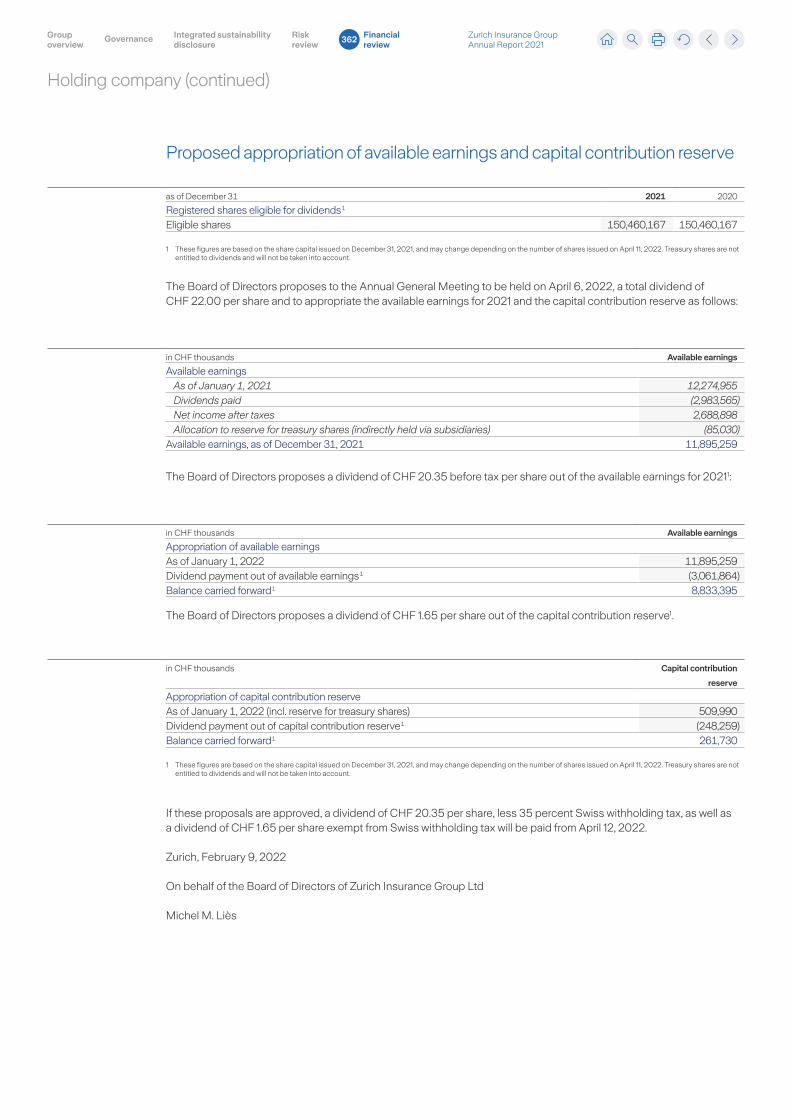
Holding company (continued)
Proposed appropriation of available earnings and capital contribution reserve
as of December 31 2021 2020
Registered shares eligible for dividends 1
Eligible shares 150,460,167 150,460,167
1 These figures are based on the share capital issued on December 31, 2021, and may change depending on the number of shares issued on April 11, 2022. Treasury shares are not entitled to dividends and will not be taken into account.
The Board of Directors proposes to the Annual General Meeting to be held on April 6, 2022, a total dividend of CHF 22.00 per share and to appropriate the available earnings for 2021 and the capital contribution reserve as follows:
in CHF thousands Available earnings
Available earningsAs of January 1, 2021 12,274,955Dividends paid (2,983,565)Net income after taxes 2,688,898Allocation to reserve for treasury shares (indirectly held via subsidiaries) (85,030)
Available earnings, as of December 31, 2021 11,895,259
The Board of Directors proposes a dividend of CHF 20.35 before tax per share out of the available earnings for 20211:
in CHF thousands Available earnings
Appropriation of available earningsAs of January 1, 2022 11,895,259Dividend payment out of available earnings 1 (3,061,864)Balance carried forward 1 8,833,395
The Board of Directors proposes a dividend of CHF 1.65 per share out of the capital contribution reserve1.
in CHF thousands Capital contribution
reserve
Appropriation of capital contribution reserveAs of January 1, 2022 (incl. reserve for treasury shares) 509,990Dividend payment out of capital contribution reserve 1 (248,259)Balance carried forward 1 261,730
1 These figures are based on the share capital issued on December 31, 2021, and may change depending on the number of shares issued on April 11, 2022. Treasury shares are not entitled to dividends and will not be taken into account.
If these proposals are approved, a dividend of CHF 20.35 per share, less 35 percent Swiss withholding tax, as well as a dividend of CHF 1.65 per share exempt from Swiss withholding tax will be paid from April 12, 2022.
Zurich, February 9, 2022
On behalf of the Board of Directors of Zurich Insurance Group Ltd
Michel M. Liès
Zurich Insurance Group Annual Report 2021
Group overview
Integrated sustainability disclosure
Governance Risk review
Financial review
362

THIS PAGE HAS INTENTIONALLY BEEN LEFT BLANK
Zurich Insurance Group Annual Report 2021
Group overview
Integrated sustainability disclosure
Governance Risk review
Financial review
363
Report of the statutory auditor
Ernst & Young LtdMaagplatz 1P.O. BoxCH-8010 Zurich
Phone: +41 58 286 31 11Fax: +41 58 286 30 04www.ey.com/ch
To the General Meeting ofZurich Insurance Group Ltd, Zurich
Zurich, February 9, 2022
Report of the statutory auditor on the financial statements
As statutory auditor, we have audited the financial statements of Zurich Insurance Group Ltd, whichcomprise the income statement, balance sheet and notes (pages 355 to 361), for the year endedDecember 31, 2021.
Board of Directors’ responsibilityThe Board of Directors is responsible for the preparation of the financial statements in accordance withthe requirements of Swiss law and the company’s articles of association. This responsibility includesdesigning, implementing and maintaining an internal control system relevant to the preparation offinancial statements that are free from material misstatement, whether due to fraud or error. The Boardof Directors is further responsible for selecting and applying appropriate accounting policies and makingaccounting estimates that are reasonable in the circumstances.
Auditor’s responsibilityOur responsibility is to express an opinion on these financial statements based on our audit. Weconducted our audit in accordance with Swiss law and Swiss Auditing Standards. Those standardsrequire that we plan and perform the audit to obtain reasonable assurance whether the financialstatements are free from material misstatement.
An audit involves performing procedures to obtain audit evidence about the amounts and disclosures inthe financial statements. The procedures selected depend on the auditor’s judgment, including theassessment of the risks of material misstatement of the financial statements, whether due to fraud orerror. In making those risk assessments, the auditor considers the internal control system relevant tothe entity’s preparation of the financial statements in order to design audit procedures that areappropriate in the circumstances, but not for the purpose of expressing an opinion on the effectivenessof the entity’s internal control system. An audit also includes evaluating the appropriateness of theaccounting policies used and the reasonableness of accounting estimates made, as well as evaluatingthe overall presentation of the financial statements. We believe that the audit evidence we haveobtained is sufficient and appropriate to provide a basis for our audit opinion.
OpinionIn our opinion, the financial statements for the year ended December 31, 2021 comply with Swiss lawand the company’s articles of association.
Report of the statutory auditor
Zurich Insurance Group Annual Report 2021
Group overview
Integrated sustainability disclosure
Governance Risk review
Financial review
364
Report of the statutory auditor (continued)
2
Report on key audit matters based on the circular 1/2015 of the Federal Audit OversightAuthorityKey audit matters are those matters that, in our professional judgment, were of most significance in ouraudit of the financial statements of the current period. These matters were addressed in the context ofour audit of the financial statements as a whole, and in forming our opinion thereon, and we do notprovide a separate opinion on these matters. For the matter below, our description of how our auditaddressed the matter is provided in that context.
We have fulfilled the responsibilities described in the Auditor’s responsibility section of our report,including in relation to these matters. Accordingly, our audit included the performance of proceduresdesigned to respond to our assessment of the risks of material misstatement of the financial statements.The results of our audit procedures, including the procedures performed to address the matter below,provide the basis for our audit opinion on the financial statements.
Recoverability of investments in subsidiaries
Area of focus We consider the investments in subsidiaries to be a key audit matter not onlydue to the judgment involved but also based on the magnitude of CHF 11.3billion, which makes up 83% of the company’s total assets.
Investments in subsidiaries are carried at cost less necessary impairments andvalued on an individual basis.
The determination whether an impairment is required includes assumptionsabout the profitability of the underlying business and growth, which involvesmanagement’s judgment. In addition, there is increased uncertainty surroundingthe projections of future income of certain businesses due to COVID-19.
Refer to Note 3, para b) (“Summary of significant accounting policies”) andNote 8 (“Investments in subsidiaries”) to the 2021 financial statements.
Our auditresponse
We obtained an understanding of management’s process and controls andassessed the design effectiveness of selected key controls over therecoverability of the carrying value of investments in subsidiaries.
In addition, we performed the following substantive testing procedures in orderto address the areas of focus above:
Assessing the appropriateness of the company’s impairment testingmethodology.
Testing the mathematical accuracy of management’s calculation. Testing the reasonableness of the assumptions used in the impairment
assessment. We have assessed the impact of COVID-19 on future income. Re-performing management’s impairment test on the carrying value of all
investments in subsidiaries and challenged the impairment decisions taken.
Finally, we assessed the adequacy of the disclosures in the financialstatements.
Based on audit procedures performed, we did not identify any exceptions withregards to the recoverability of investments in subsidiaries.
Zurich Insurance Group Annual Report 2021
Group overview
Integrated sustainability disclosure
Governance Risk review
Financial review
365
Report of the statutory auditor (continued)
3
Other matterThe financial statements of Zurich Insurance Group Ltd for the year ended December 31, 2020 wereaudited by another statutory auditor who expressed an unmodified opinion on those financialstatements on February 10, 2021.
Report on other legal requirementsWe confirm that we meet the legal requirements on licensing according to the Auditor Oversight Act(AOA) and independence (article 728 CO and article 11 AOA) and that there are no circumstancesincompatible with our independence.
In accordance with article 728a para. 1 item 3 CO and Swiss Auditing Standard 890, we confirm that aninternal control system exists, which has been designed for the preparation of financial statementsaccording to the instructions of the Board of Directors.
We further confirm that the proposed appropriation of available earnings and capital contributionreserve complies with Swiss law and the company’s articles of association. We recommend that thefinancial statements submitted to you be approved.
Ernst & Young Ltd
Isabelle Santenac Thomas FiepkeLicensed audit expert Certified Public Accountant (U.S.)(Auditor in charge)
Zurich Insurance Group Annual Report 2021
Group overview
Integrated sustainability disclosure
Governance Risk review
Financial review
366

THIS PAGE HAS INTENTIONALLY BEEN LEFT BLANK
Zurich Insurance Group Annual Report 2021
Group overview
Integrated sustainability disclosure
Governance Risk review
Financial review
367
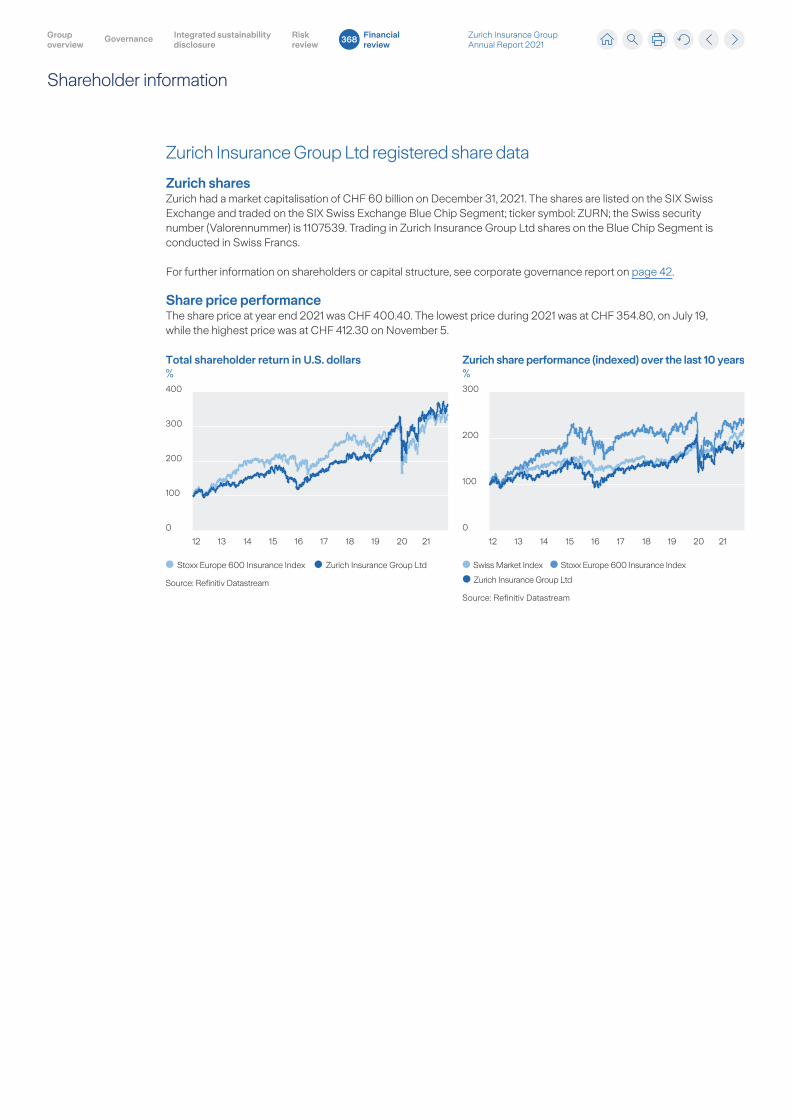
Zurich Insurance Group Ltd registered share data
Zurich sharesZurich had a market capitalisation of CHF 60 billion on December 31, 2021. The shares are listed on the SIX Swiss Exchange and traded on the SIX Swiss Exchange Blue Chip Segment; ticker symbol: ZURN; the Swiss security number (Valorennummer) is 1107539. Trading in Zurich Insurance Group Ltd shares on the Blue Chip Segment is conducted in Swiss Francs.
For further information on shareholders or capital structure, see corporate governance report on page 42.
Share price performanceThe share price at year end 2021 was CHF 400.40. The lowest price during 2021 was at CHF 354.80, on July 19, while the highest price was at CHF 412.30 on November 5.
Stoxx Europe 600 Insurance Index
Source: Refinitiv Datastream
Zurich Insurance Group Ltd
12 13 14 1615 18 1917 20 21 12 13 14 1615 18 1917 20 21
Total shareholder return in U.S. dollars%400
300
200
100
0
300
200
100
0
Zurich share performance (indexed) over the last 10 years%
Source: Refinitiv Datastream
Swiss Market Index Stoxx Europe 600 Insurance Index
Zurich Insurance Group Ltd
Shareholder information
Integrated sustainability disclosure
Governance Risk review
Financial review
368 Zurich Insurance Group Annual Report 2021
Group overview
Dividend policyThe Group intends to maintain its current attractive dividend policy and proposes a target payout ratio of around 75 percent of net income attributable to shareholders, subject to a minimum of the prioryear dividend per share, with dividend increases based on sustainable earnings growth.
Share data (CHF) as of December 31, 2021 2021 2020
Dividend per share 22.001 20.00Share price at end of period 400.40 373.50Price period high 412.30 439.90Price period low 354.80 266.90Market capitalization (CHF millions) 60,244 56,197
1 Proposed dividend, subject to approval by shareholders at the Annual General Meeting, expected payment date as from April 12, 2022. Gross dividend, subject to 35 percent Swiss withholding tax.
Further details are available online:www.zurich.com/en/investorrelations/calendar
Dividend
Financial Year
Total dividend
per registered
share in CHF
Paid from available
earnings in CHF1
Paid from capital
contribution
reserve in CHF
Payment date
as from
Dividend 2021 22.002 20.35 1.65 April 12, 2022 2
Dividend 2020 20.00 20.00 – April 13, 2021
Dividend 2019 20.00 20.00 – April 7, 2020
Dividend 2018 19.00 19.00 – April 9, 2019
Dividend 2017 18.00 16.60 1.40 April 10, 2018
Dividend 2016 17.00 11.30 5.70 April 4, 2017
Dividend 2015 17.00 – 17.00 April 5, 2016
Dividend 2014 17.00 – 17.00 April 9, 2015
Dividend 2013 17.00 – 17.00 April 9, 2014
Dividend 2012 17.00 – 17.00 April 11, 2013
1 Gross dividend, subject to 35% Swiss withholding tax. 2 Proposed total dividend, subject to approval by shareholders at the Annual General Meeting 2022; expected payment date as from April 12, 2022.
Shareholder information (continued)
Integrated sustainability disclosure
Governance Risk review
Financial review
369 Zurich Insurance Group Annual Report 2021
Group overview
Gruppe
Buchwert je AktieDiese Kennzahl wird berechnet, indem das den Aktionären zurechenbare Eigenkapital durch die Anzahl ausgegebener Aktien abzüglich eigener Aktien zum Ende des Berichtszeitraums geteilt wird.
Betriebsgewinn (BOP)ist die interne Leistungskennzahl, womit die Gruppe alle Geschäftseinheiten führt. Es zeigt das Ergebnis nach Minderheitsbeteiligungen, welches um den Einfluss der Finanzmarktvolatilität und anderer nichtoperativer Var i ablen bereinigt wurde. Daher wird der BOP um Ertragssteuern, realisierte Gewinne/(Verluste) und Wertminderungen aus Kapitalanlagen (mit Ausnahme bestimmter in NonCore Businesses enthaltener nichtversicherungsbezogener Geschäfte, erfolgswirksam zum beizulegenden Zeitwert bewerteter HedgeFundAnlagen, bestimmter zu konkreten ökonomischen Sicherungszwecken gehaltener Wertpapiere und der Anteile der Versicherungsnehmer am Anlageergebnis des Lebensversicherungsgeschäfts) sowie nichtoperative Wechselkursveränderungen bereinigt. Zudem werden auf besondere Umstände zurückzuführende Positionen wie Restrukturierungskosten, Rechts streitigkeiten oder grosse einmalige regulatorische Projekte ausserhalb der gewöhnlichen Geschäftstätig keit, Gewinne und Verluste aus der Veräusserung von Geschäften, bestimmte Kosten für die Integration von Unternehmenszusammenschlüssen und Wertminderungen auf Goodwill nicht in die Berechnung des BOP eingeschlossen. Der BOPBIDA (Business Operating Profit before Interest, Depreciation and Amorti zation) ist der BOP vor Zins aufwand für Darlehen und Anleihen, Abschreibungen und Wertminderungen auf Liegenschaften und Sachanlagen sowie Abschreibungen und Wertminderungen auf immaterielle Aktiven, wohin gegen Abschreibungen auf akti vierte Abschlussaufwendungen für Versicherungsverträge und Investmentver träge sowie Betriebsvereinbarungen berücksichtigt werden. Weitere Informationen finden Sie in den «Consolidated Financial Statements, Note 27. Segment Information, Table 27.4».
Den Aktionären zurechenbare Eigenkapitalrendite, basierend auf dem Business Operating Profit nach Steuern (BOPAT ROE)Diese Kennzahl gibt die Höhe des BOP im Verhältnis zu den von den Aktionären bereitgestellten Mitteln an. Zur Berechnung wird der BOP linear annualisiert und um die Steuern bereinigt. Anschliessend erfolgt eine Teilung durch den Durchschnittswert des den Aktionären zu rechenbaren Eigenkapitals – bereinigt um nicht realisierte Gewinne/(Verluste) aus zur Veräusserung verfügbaren Finanzinvestitionen und CashflowHedges – der aus dem Wert zu Beginn und zum Ende eines jeden Quartals des Berichtszeitraums ermittelt wird. Die Durchschnittswerte des den Aktionären zurechenbaren Eigenkapitals der einzelnen Quartale werden anschliessend addiert und durch die Anzahl der Quartale geteilt. Wird die Dividende an der ordentlichen Generalversammlung innerhalb der ersten zehn Arbeitstage im April genehmigt, erfolgt ein Abzug der Dividende von dem den Aktionären zu Beginn des zweiten Quartals zurechenbaren Eigenkapital. Weitere Informationen finden Sie in «Supplementary Information (unaudited)/ROE, EPS and BVPS».
Mittelzuflüssesind Nettokapitalentnahmen aus allen Geschäftseinheiten (P&C, Life, Farmers und NonCore Business) an Group Functions & Operations (GF&O) nach Abzug aller zentralen Kosten in GF&O. Mittelzuflüsse von den Tochtergesellschaften erfolgen üblicherweise via Dividenden, Kapitalherabsetzungen, Rückzahlungen von gruppeninternen Verbindlichkeiten und Rückversicherungsgewinnen.
KapitalanlagenDie in der konsolidierten Bilanz ausgewiesenen Kapitalanlagen umfassen die Kapitalanlagen der Gruppe sowie Kapitalanlagen für Rechnung und Risiko Dritter. Kapital-anlagen der Gruppe sind Anlagen, deren Anlagerisiko ganz oder teilweise von der Gruppe getragen wird. Dazu gehören auch Kapitalanlagen im Zusammenhang mit Kapitalanlageverträgen, die ermessensabhängige Überschussbeteiligungen vorsehen. In den durchschnittlichen Kapitalanlagen sind flüssige Anlagemittel, aber keine als Sicherheit dienenden flüssigen Mittel aus Securities LendingProgrammen enthalten. Die Gruppe managt ihr diversifiziertes Anlageportfolio, um für ihre Aktionäre und Versicherungsnehmer optimale Ergebnisse zu erzielen und gleichzeitig die Einhaltung der lokalen aufsichtsrechtlichen und geschäftlichen Anforderungen, unter Führung des Asset/Liability Management and InvestmentAusschusses der Gruppe, sicherzustellen. Die Kapitalanlagen für Rechnung und Risiko Dritter umfassen Kapitalanlagen, bei denen die Versicherungsnehmer das Anlagerisiko tragen. Sie werden als Verbindlichkeiten aus fondsgebundenen (unitlinked) Anlage verträgen und Reserven für fondsgebundene Verträge gehalten. Gemanagt werden sie gemäss den Anlage zielen der einzelnen UnitlinkedFonds. Das Anlageergebnis der fondsgebundenen Produkte wird den Versicherungsnehmern durch eine Verbuchung als Aufwand unter Überschuss und Gewinnanteile der Versicherten gutgeschrieben.
Like-for-likeLikeforlike gibt die Veränderung einer zugrunde liegenden Kennzahl über einen bestimmten Zeitraum, bereinigt um die Auswirkungen von Wechselkursschwankungen sowie von Akquisitionen und Veräusserungen, an.
Den Aktionären zurechenbare Eigenkapitalrendite (ROE)Diese Kennzahl gibt die Höhe des Gewinns/Verlusts im Verhältnis zu den von den Aktionären bereitgestellten Mitteln an. Zu ihrer Berechnung wird der den Aktionären zurechenbare Reingewinn/verlust nach Steuern linear annualisiert und durch den Durchschnittswert des den Aktionären zurechenbaren Eigenkapitals geteilt – bereinigt um nicht realisierte Gewinne/(Verluste) aus zur Veräusserung verfügbaren Finanzinvestitionen und Cashflow Hedges – der aus dem Wert zu Beginn und zum Ende eines jeden Quartals des Berichtszeitraums ermittelt wird. Die Durchschnittswerte des den Aktionären zurechenbaren Eigenkapitals der einzelnen Quartale werden anschliessend addiert und durch die Anzahl der Quartale geteilt. Wird die Dividende an der ordentlichen Generalversammlung innerhalb der ersten zehn Arbeitstage im April genehmigt, erfolgt ein Abzug der Dividende von dem den Aktionären zu Beginn des zweiten Quartals zurechen baren
Glossar
Glossar
Zurich Insurance Group Geschäftsbericht 2021
Konzern-überblick
Integrated sustainability disclosure
Governance Risk review
Financial review
370
Eigenkapital. Weitere Informationen finden Sie in «Supplementary Information (unaudited)/ROE, EPS and BVPS».
Z-ECM (Zurich Economic Capital Model)Das interne ökonomische Kapitalmodell von Zurich definiert das ZECMKapital, welches zum Schutz der Versicherungsnehmer der Gruppe erforderlich ist, damit jegliche Schadensansprüche mit einem Konfidenzniveau von 99,95% über einen Einjahreszeitraum erfüllt werden können. Unter der ZECMQuote versteht man das Verhältnis der der Gruppe zur Verfügung stehenden finanziellen Mittel, welche im ZECM definiert sind, zum erforderlichen ZECMKapital des Kapitalmodells. Weitere Informationen finden Sie im «Risk Review» des Geschäftsberichts.
Schaden und Unfallversicherung (P&C)
Die folgenden Kennzahlen für das Segment Schaden und Unfallversicherung werden als Nettowert für eigene Rechnung angegeben.
Versicherungstechnisches ErgebnisDiese Kennzahl wird berechnet als Differenz aus den verdienten Nettoprämien und Policengebühren und der Summe der Schäden, Versicherungsleistungen (netto) sowie des versicherungstechnischen Nettoaufwands. Weitere Informationen finden Sie in «Supplementary Information (unaudited)/P&C by segment & customer units».
Total versicherungstechnischer NettoaufwandDiese Kennzahl umfasst die Kosten für die Geschäftsaufbringung sowie die versicherungstechnischen Bestandteile der übrigen Betriebs und Verwaltungsaufwendungen, der Abschreibungen auf immaterielle Aktiven, der Zinsgutschriften an Versicherungsnehmer und der übrigen Zinsaufwendungen sowie der übrigen Erträge. Weitere Informationen finden Sie in «Supplementary Information (unaudited)/P&C by segment & customer units».
Schaden-Kosten-Satz (Combined Ratio)Diese Kennzahl gibt die Höhe der Schadensfälle und des versicherungstechnischen Nettoaufwands im Berichtszeitraum im Verhältnis zu den verdienten Nettoprämien und Policengebühren an. Die Berechnung erfolgt aus der Summe von Schadensatz und Kostensatz. Weitere Informationen finden Sie in «Supplementary Information (unaudited)/P&C by segment & customer units».
SchadensatzDiese Kennzahl gibt die Höhe der Schadensfälle im Berichtszeitraum im Verhältnis zu den verdienten Nettoprämien und Policengebühren an. Sie wird berechnet aus den Schäden und Versicherungsleistungen (netto), einschliesslich eingetretener Schäden, sowohl bezahlte als auch zurückgestellte, sowie Schadenbearbeitungskosten, geteilt durch die verdienten Nettoprämien und Policengebühren. Weitere Informationen finden Sie in «Supplementary Information (unaudited)/P&C by segment & customer units».
KostensatzDiese Kennzahl gibt die Höhe des versicherungstechnischen Nettoaufwands im Berichtszeitraum im Verhältnis zu den verdienten Nettoprämien und Policengebühren an. Sie wird berechnet als Summe des versicherungstechnischen Nettoaufwands und der Überschuss und Gewinnanteile der Versicherten, geteilt durch die verdienten Nettoprämien und Policengebühren. Weitere Informationen finden Sie in «Supplementary Information (unaudited)/ P&C by segment & customer units».
Nichttechnisches NettoergebnisDiese Kennzahl umfasst Aufwendungen oder Erträge, die nicht direkt an die operative Performance im Versicherungsgeschäft gekoppelt sind, wie z.B. Gewinne/Verluste aus der Währungsumrechnung und der Zinsaufwand auf Darlehen und Anleihen. Sie umfasst den Einfluss der Finanzmarktvolatilität und anderer nichtoperativer Variablen, die die laufende Geschäftsperformance verzerren. Weitere Informationen finden Sie in «Supplementary Information (unaudited)/P&C by segment & customer units».
Glossar (continued)
Zurich Insurance Group Geschäftsbericht 2021
Konzern-überblick
Integrated sustainability disclosure
Governance Risk review
Financial review
371
Lebensversicherung
Embedded-Value-(EV-)GrundsätzeBei dieser Methode handelt es sich um einen marktkonformen BottomupAnsatz, der Marktrisiken explizit berücksichtigt. Insbesondere werden Asset und LiabilityCashflows mittels Risikodiskontierungssätzen bewertet, die bei ähnlichen Cashflows an den Kapitalmärkten zur Anwendung kommen. Die Bewertung von Optionen und Garantien erfolgt unter Anwendung von marktkonformen Modellen, die auf tatsächliche Marktwerte abgestimmt sind.
Beiträge mit AnlagecharakterHierbei handelt es sich um Einlagen ähnlich wie Kontoguthaben von Kunden, die nicht in den Erträgen berücksichtigt werden. Allerdings werden die Gebühren auf Beiträge mit Anlagecharakter in der Position Bruttoprämien und Policengebühren als Erträge verbucht. Die Einlagen ergeben sich aus Kapitalanlageverträgen und Versicherungs verträgen, die nach der Methode des «Deposit Accounting» verbucht werden. Sie stellen den reinen Sparanteil dar, der angelegt wird.
Jahresprämienäquivalent aus Neugeschäft (APE)ist ein Umsatzindex, der das Volumen neu abgeschlossener Lebensversicherungsverträge im Berichtszeitraum angibt. APE wird berechnet anhand der jährlichen Prämien des Neugeschäfts plus 10% neuer Einmalprämien im Berichtszeitraum, wobei die Einflüsse von Minderheitsanteilen unberücksichtigt bleiben. Der Barwert der Prä-mien aus Neugeschäft (PVNBP) wird berechnet als der Wert der Prämien des Neugeschäfts, die mit dem risikofreien Zinssatz abgezinst werden, wobei die Einflüsse von Minder heitsanteilen unberücksichtigt bleiben.
Marge des Neugeschäfts (NBM)Diese Kennzahl stellt die Rentabilität des Neugeschäfts dar und entspricht dem Wert des Neugeschäfts geteilt durch APE, nach Berücksichtigung von Minderheitsanteilen.
Wert des Neugeschäfts (NBV), nach SteuernDiese Kennzahl gibt die Wertschöpfung durch das während des Berichtszeitraums abgeschlossene Neugeschäft, unter Berücksichtigung von Friktionskosten, dem Zeitwert von Optionen und Garantien und den Kosten von nicht marktbezogenen Risiken an. Die Bewertung erfolgt zum Zeitpunkt des Verkaufs. Der Wert des Neu geschäfts entspricht dem Barwert des prognostizierten Gewinns nach Steuern aus den im Berichtszeitraum ver kauften Lebensversicherungsverträgen, wobei eine mit den EVGrundsätzen konforme Bewertungsmethode verwendet wird, nach den Auswirkungen von Minderheitsanteilen.
Farmers
BruttomanagementergebnisDiese Kennzahl von Farmers Management Services wird anhand der Managementgebühren und sonstigen verbundenen Erträge abzüglich der Manage ment aufwendungen und sonstigen verbundenen Aufwendungen, einschliesslich Abschreibungen und Wertminderungen auf immaterielle Aktiven, berechnet. Weitere Informationen finden Sie in «Supplementary Information (unaudited)/Farmers».
Marge aus den verdienten Bruttoprämien, die von der Gruppe verwaltet werdenDiese Kennzahl wird berechnet aus dem Bruttomanagementergebnis von Farmers Management Services, geteilt durch die verdienten Bruttoprämien von Farmers Exchanges, die Eigentum von deren Versicherungsnehmern sind. Farmers Group, Inc., eine hundertprozentige Tochtergesellschaft der Gruppe, erbringt als Bevollmäch tigte bestimmte nicht auf die Schadenabwicklung bezogene Dienstleistungen und Nebendienstleistungen für die Farmers Exchanges.
Glossar (continued)
Zurich Insurance Group Geschäftsbericht 2021
Konzern-überblick
Integrated sustainability disclosure
Governance Risk review
Financial review
372
Kontakt
Für weitere Informationen wenden Sie sich bitte an die zuständige Kontaktstelle oder besuchen Sie unsere Website unter www.zurich.com.
SitzZurich Insurance Group AG Mythenquai 2 8002 Zürich, Schweiz
Media RelationsZurich Insurance Group AG, Schweiz Telefon: +41 (0)44 625 21 00 EMail: [email protected]
Investor RelationsZurich Insurance Group AG, Schweiz Telefon: +41 (0)44 625 22 99 EMail: [email protected]
AktienregisterZurich Insurance Group AG, Schweiz Telefon: +41 (0)44 625 22 55 EMail: [email protected] Website: www.zurich.com/dede/aktionaersinformationen
SustainabilityZurich Insurance Group AG, Schweiz EMail: [email protected]
ImpressumDer Geschäftsbericht wird in Englisch und Deutsch publiziert. Sollte die deutsche Übersetzung gegenüber dem englischen Originaltext abweichen, ist die englische Version verbindlich.
Unsere Berichterstattung besteht aus dem Geschäftsbericht, der in den Konzernüberblick, die Governance, die Integrated Sustainability Disclosure, den Risk Review und den Financial Review aufgeteilt ist und die Jahres rechnung (Holding Company) und die konsolidierte Konzernrechnung enthält. Der Lagebericht besteht aus den genannten Berichten ohne den Vergütungsbericht.
Gestaltung: Radley Yeldar, www.ry.com
Übersetzung: Lionbridge Switzerland AG
Fotografien: Titelbild, Philippe Lemarchand; Seite 1, Instituto Terra; Seiten 2, 33, Alexander Boëthius; Seite 5, Speedycat Photo Studio; Seiten 5, 17, 26, A:SEV7N; Seiten 6, 17, 22, Henrik Nielsen; Seiten 9, 24, 30, 31, 38, 40, 50, 51, 66, 67, 84, 118, 120, 123, 134, 146, 153, 167, 182, 184, 217, 218, 230, Jorma Müller; Seite 10, Florian Kalotay; Seiten 12, 15, 32, Cyrill Matter; Seiten 17, 27, Vaneesha Krishnasamy; Seiten 17, 35, George Brooks; Seite 23, Voirrey Barron; Seite 25, Christian Husar; Seite 28, Daniel Bürgisser; Seite 29, Andrew Zuckerman; Seite 29, BASF; Seite 29, ZTalks by Zurich; Seite 30, PwC Switzerland; Seite 33, Lukas Roth; Seite 34, Science Museum Group; Seite 35, CoverMore; Seite 37, Ivan Stefania; Seite 67, Zurich UK; Seite 172, John Sauer, Zurich North America.
Layout: NeidhartSchön AG, Zürich, www.neidhartschoen.ch
Publishingsystem: ns.publish von mms solutions AG, Zürich, www.mmssolutions.io
Disclaimer und Cautionary Statement Diese Publikation enthält gewisse zukunftsgerichtete Aussagen, die u. a. Voraussagen von zukunftsgerichteten Ereignissen, Trends, Massnahmen oder Zielen der Zurich Insurance Group AG oder Zurich Insurance Group (die Gruppe) beschreiben. Zukunftsgerichtete Aussagen enthalten Meinungen zur angestrebten Gewinnentwicklung, zur Eigenkapitalrendite, zu Kosten, zu Preisbedingungen, zur Dividendenpolitik, zu den Ergebnissen in den Bereichen Underwriting und Schadenbearbeitung sowie Aussagen bezüglich des Verständnisses der Gruppe über die allgemeine Wirtschaftslage, die Finanz und Versicherungsmärkte und die zu erwartenden Entwicklungen. Solche zukunftsgerichteten Aussagen sind mit der gebotenen Vorsicht zur Kenntnis zu nehmen, da sie naturgemäss bekannte und unbekannte Risiken beinhalten, Unsicherheiten bergen und von anderen Faktoren beeinträchtigt werden können. Dies könnte dazu führen, dass die Ergebnisse sowie die Pläne und Ziele von Zurich Insurance Group AG oder der Gruppe deutlich (von früheren Ergebnissen oder) von denjenigen abweichen, die explizit oder implizit in diesen zukunftsgerichteten Aussagen beschrieben werden. Faktoren wie (i) die allgemeine Wirtschaftslage und Wettbewerbsfaktoren, insbesondere in Schlüsselmärkten; (ii) die Risiken des globalen Wirtschaftsabschwungs, insbesondere in der Finanzdienstleistungsbranche; (iii) die Performance der Finanzmärkte; (iv) Zinshöhe und Wechselkurse; (v) Häufigkeit, Schwere und Entwicklung von Versicherungsschäden; (vi) Sterblichkeit und Erkrankungshäufigkeit; (vii) PolicenErneuerungen und StornoRaten; (viii) erhöhte Anzahl von Rechtsstreitigkeiten und regulatorischen Massnahmen; und (ix) veränderte gesetzliche und regulatorische Bedingungen und veränderte Richtlinien der Aufsichtsbehörden können das Ergebnis von Zurich Insurance Group AG und der Gruppe sowie die Erreichung der Ziele unmittelbar beeinflussen. Spezifisch mit Bezug auf die COVID19 bezogenen Aussagen ist zu beachten, dass diese auf Basis der Umstände zu einem bestimmten Zeitpunkt und auf Basis von spezifischen Bestimmungen (insbesondere anwendbare Ausschlüsse) von Versicherungspolicen in der abgeschlossenen Form und wie von der Gruppe interpretiert basieren; diese könnten durch regulatorische, gesetzliche, staatliche oder gerichtsbezogene Entwicklungen beeinflusst werden, welche das Ausmass des durch die Gruppe zu deckenden Schadens erhöhen oder, sollten bestehende Vertragsbestimmungen rückwirkend durch Gesetz oder Verordnung ergänzt werden, zusätzlich verursachen könnte. Zurich Insurance Group AG ist nicht verpflichtet, diese zukunftsgerichteten Aussagen zu aktualisieren oder zu revidieren, um neuen Informationen, künftigen Ereignissen oder Umständen etc. Rechnung zu tragen.
Sämtliche Verweise auf «Farmers Exchanges» beziehen sich auf Farmers Insurance Exchange, Fire Insurance Exchange, Truck Insurance Exchange sowie deren Tochtergesellschaften und verbundenen Unternehmen. Die drei Exchanges sind genossenschaftlich organisierte Versicherungen mit Sitz in Kalifornien. Sie sind Eigentum ihrer Versicherungsnehmer und stehen unter der Oberleitung ihrer Boards of Governors. Farmers Group, Inc. und ihre Tochtergesellschaften sind Bevollmächtigte der drei Exchanges und erbringen in dieser Funktion bestimmte nicht auf die Schadenabwicklung bezogene Dienstleistungen und Nebendienstleistungen für die Farmers Exchanges.Weder Farmers Group, Inc. noch ihre Muttergesellschaften Zürich VersicherungsGesellschaft AG und Zurich Insurance Group AG sind an den Farmers Exchanges beteiligt. Finanzinformationen zu den Farmers Exchanges sind Eigentum der Farmers Exchanges, werden aber zur Verfügung gestellt, um ein besseres Verständnis für die Leistung von Farmers Group, Inc. und Farmers Reinsurance Company zu vermitteln.
Zurich weist darauf hin, dass die Wertentwicklung in der Vergangenheit nicht aussagekräftig bezüglich zukünftiger Ergebnisse ist. Weiterhin indizieren Zwischenergebnisse nicht die Ergebnisse des Gesamtjahres.
Personen, die hinsichtlich einer Anlage im Zweifel sind, sollten sich an einen unabhängigen Finanzberater wenden.
Die vorliegende Mitteilung ist weder ein Angebot noch eine Aufforderung zum Verkauf oder Kauf von Wertschriften.
THIS COMMUNICATION DOES NOT CONTAIN AN OFFER OF SECURITIES FOR SALE IN THE UNITED STATES; SECURITIES MAY NOT BE OFFERED OR SOLD IN THE UNITED STATES ABSENT REGISTRATION OR EXEMPTION FROM REGISTRATION, AND ANY PUBLIC OFFERING OF SECURITIES TO BE MADE IN THE UNITED STATES WILL BE MADE BY MEANS OF A PROSPECTUS THAT MAY BE OBTAINED FROM THE ISSUER AND THAT WILL CONTAIN DETAILED INFORMATION ABOUT THE COMPANY AND MANAGEMENT, AS WELL AS FINANCIAL STATEMENTS.
Finanzkalender
Informationen auf unserer Website: www.zurich.com/en/investorrelations/calendar
Zurich Insurance Group Geschäftsbericht 2021
Konzern-überblick
Integrated sustainability disclosure
Governance Risk review
Financial review
373
Zurich Insurance GroupMythenquai 2 8002 Zürich, Schweiz Telefon +41 (0) 44 625 25 25
www.zurich.com
Related Documents