Imagination at work. GE 2016 second quarter performance Financial results & Company highlights July 22, 2016 CAUTION CONCERNING FORWARD-LOOKING STATEMENTS: This document contains "forward-looking statements" – that is, statements related to future events that by their nature address matters that are, to different degrees, uncertain. For details on the uncertainties that may cause our actual future results to be materially different than those expressed in our forward-looking statements, see http://www.ge.com/investor-relations/disclaimer-caution-concerning-forward- looking-statements as well as our annual reports on Form 10-K and quarterly reports on Form 10-Q. We do not undertake to update our forward-looking statements. This document also includes certain forward-looking projected financial information that is based on current estimates and forecasts. Actual results could differ materially. NON-GAAP FINANCIAL MEASURES: In this document, we sometimes use information derived from consolidated financial data but not presented in our financial statements prepared in accordance with U.S. generally accepted accounting principles (GAAP). Certain of these data are considered “non-GAAP financial measures” under the U.S. Securities and Exchange Commission rules. These non-GAAP financial measures supplement our GAAP disclosures and should not be considered an alternative to the GAAP measure. The reasons we use these non-GAAP financial measures and the reconciliations to their most directly comparable GAAP financial measures are posted to the investor relations section of our website at www.ge.com. We use non-GAAP financial measures including the following. • Operating earnings and EPS, which is earnings from continuing operations excluding non-service-related pension costs of our principal pension plans. • GE Industrial operating & Verticals earnings and EPS, which is operating earnings of our industrial businesses and the GE Capital businesses that we expect to retain. • Industrial segment organic revenue, which is the sum of revenue from all of our industrial segments less the effects of acquisitions/dispositions and currency exchange. • Industrial segment organic operating profit, which is the sum of segment profit from all of our industrial segments less the effects of acquisitions/dispositions and currency exchange. • Industrial cash flows from operating activities (Industrial CFOA), which is GE’s cash flow from operating activities excluding dividends received from GE Capital. • Capital ending net investment (ENI), excluding liquidity, which is a measure we use to measure the size of our Capital segment. General Electric Capital Corporation (GECC) has been merged into GE and our financial services business is now operated by GE Capital Global Holdings LLC (GECGH). In this document, we refer to GECC and GECGH as “GE Capital”. We refer to the industrial businesses of the Company including GE Capital on an equity basis as “GE”. “GE (ex-GE Capital)” and /or “Industrial” refer to GE excluding GE Capital. GE’s Investor Relations website at www.ge.com/investor and our corporate blog at www.gereports.com, as well as GE’s Facebook page and Twitter accounts, contain a significant amount of information about GE, including financial and other information for investors. GE encourages investors to visit these websites from time to time, as information is updated and new information is posted.

Welcome message from author
This document is posted to help you gain knowledge. Please leave a comment to let me know what you think about it! Share it to your friends and learn new things together.
Transcript

Imagination at work.
GE 2016 second quarter performance
Financial results & Company highlightsJuly 22, 2016
CAUTION CONCERNING FORWARD-LOOKING STATEMENTS:This document contains "forward-looking statements" – that is, statements related to future events that by their nature address matters that are, to different degrees, uncertain. For details on the uncertainties that may cause our actual future results to be materially different than those expressed in our forward-looking statements, see http://www.ge.com/investor-relations/disclaimer-caution-concerning-forward-looking-statements as well as our annual reports on Form 10-K and quarterly reports on Form 10-Q. We do not undertake to update our forward-looking statements. This document also includes certain forward-looking projected financial information that is based on current estimates and forecasts. Actual results could differ materially.
NON-GAAP FINANCIAL MEASURES:In this document, we sometimes use information derived from consolidated financial data but not presented in our financial statements prepared in accordance with U.S. generally accepted accounting principles (GAAP). Certain of these data are considered “non-GAAP financial measures” under the U.S. Securities and Exchange Commission rules. These non-GAAP financial measures supplement our GAAP disclosures and should not be considered an alternative to the GAAP measure. The reasons we use these non-GAAP financial measures and the reconciliations to their most directly comparable GAAP financial measures are posted to the investor relations section of our website at www.ge.com. We use non-GAAP financial measures including the following. • Operating earnings and EPS, which is earnings from continuing operations excluding non-service-related pension costs of our principal pension plans.• GE Industrial operating & Verticals earnings and EPS, which is operating earnings of our industrial businesses and the GE Capital businesses that we expect to retain.• Industrial segment organic revenue, which is the sum of revenue from all of our industrial segments less the effects of acquisitions/dispositions and currency exchange. • Industrial segment organic operating profit, which is the sum of segment profit from all of our industrial segments less the effects of acquisitions/dispositions and currency exchange. • Industrial cash flows from operating activities (Industrial CFOA), which is GE’s cash flow from operating activities excluding dividends received from GE Capital.• Capital ending net investment (ENI), excluding liquidity, which is a measure we use to measure the size of our Capital segment.
General Electric Capital Corporation (GECC) has been merged into GE and our financial services business is now operated by GE Capital Global Holdings LLC (GECGH). In this document, we refer to GECC and GECGH as “GE Capital”. We refer to the industrial businesses of the Company including GE Capital on an equity basis as “GE”. “GE (ex-GE Capital)” and /or “Industrial” refer to GE excluding GE Capital.
GE’s Investor Relations website at www.ge.com/investor and our corporate blog at www.gereports.com, as well as GE’s Facebook page and Twitter accounts, contain a significant amount of information about GE, including financial and other information for investors. GE encourages investors to visit these websites from time to time, as information is updated and new information is posted.
2
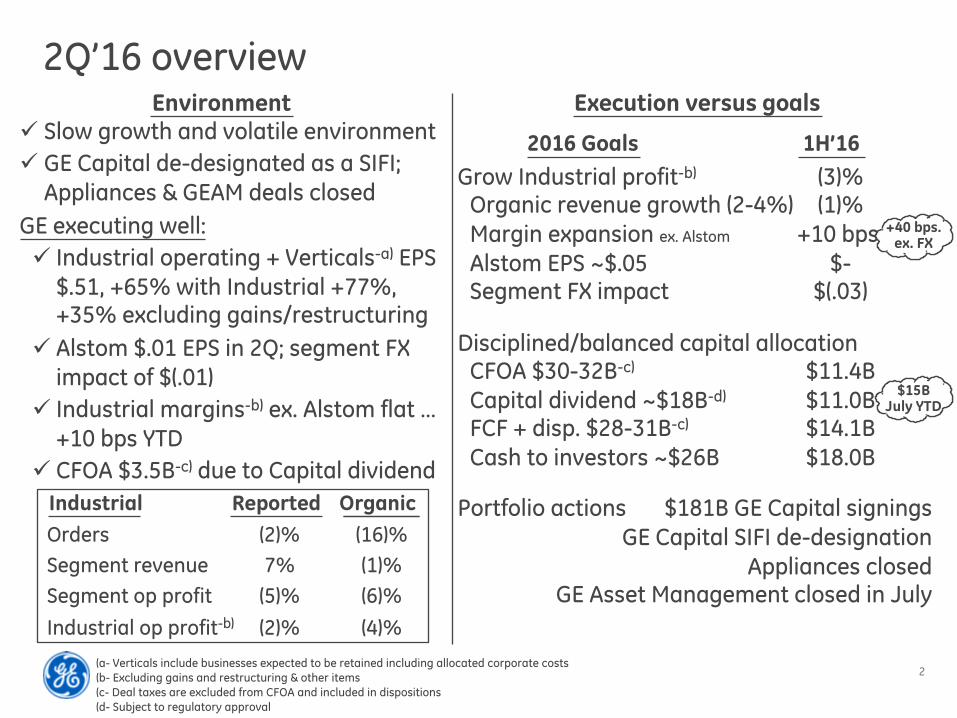
Grow Industrial profit-b) (3)%Organic revenue growth (2-4%) (1)%Margin expansion ex. Alstom +10 bps.Alstom EPS ~$.05 $-Segment FX impact $(.03)
Disciplined/balanced capital allocationCFOA $30-32B-c) $11.4BCapital dividend ~$18B-d) $11.0BFCF + disp. $28-31B-c) $14.1BCash to investors ~$26B $18.0B
Portfolio actions $181B GE Capital signingsGE Capital SIFI de-designation
Appliances closedGE Asset Management closed in July
2Q’16 overviewEnvironment
1H’162016 Goals
Execution versus goalsü Slow growth and volatile environmentü GE Capital de-designated as a SIFI;
Appliances & GEAM deals closed GE executing well:ü Industrial operating + Verticals-a) EPS
$.51, +65% with Industrial +77%, +35% excluding gains/restructuring
ü Alstom $.01 EPS in 2Q; segment FX impact of $(.01)
ü Industrial margins-b) ex. Alstom flat … +10 bps YTD
ü CFOA $3.5B-c) due to Capital dividend
(a- Verticals include businesses expected to be retained including allocated corporate costs (b- Excluding gains and restructuring & other items(c- Deal taxes are excluded from CFOA and included in dispositions(d- Subject to regulatory approval
OrganicReportedOrdersSegment revenueSegment op profitIndustrial op profit-b)
(2)%7%
(5)%(2)%
(16)%(1)%(6)%(4)%
Industrial
+40 bps. ex. FX
$15B July YTD

3
2Q’16 orders $26.6B, (2)% … (16)% organic
Orders (V%) Backlog Orders price
Company highlights
Equipment (11)% (10)%
Services 9 10
Total (2)% -%
Organic (16)% (12)%
2Q 1H
Equip.
Services 195 226 228 233
7189 88 86
'14 '15 1Q'16 2Q'16
$266$315 $316 $320
O&G Av. Trans.HCECPower Ren.
0.9%
(0.4)%
(2.8)%
0.4% 0.6%
(1.3)%
0.3%
Total orders price (0.3)%
ü Equipment orders (30)% organically driven by market pressure in O&G and Transportation; Power (27)% & Aviation (37)% on tough comps
ü Alstom orders $4.5B: Power $2.9B, Renewables $0.2B, Grid $1.4B
ü Service orders +9%, organically (1)% and +1% YTD
ü Core backlog +6% with service +11%
ü International orders flat including Alstom
Digital highlightsü Digital orders ex. AGP +15%, revenue +17%
ü AGP revenues +2%, orders down due to timing
ü Revenue of $1.3B, +12%
ü 54 partners on Predix … ahead of plan
ü 12K developers … on track for 20K
ü $250M digital thread productivity through 1H’16
ü Opened digital foundry in Paris and Shanghai
Alstom backlog +$1.6B since acquisition

4
Revenue dynamics
Organic revenue growth(Industrial segments)
4%
1%
3%
1H 2H TY
5%
2-4%
2HE TYE
(1)%
Power
O&G
Other
12%
(2)%
4%
(2)%
(7)%
4%
4%
(5)%
4%
1H
2015 2016
(6)%
(18)%
5%
~15%
~(7)%
~5%
~5%
~(12)%
~5%
• Core services revenue grew by 5% organically … strength in Aviation (+17%) & Power (+7%) offset by O&G and Transportation
• Solid Healthcare organic growth +6% … Life Sciences +12%, China +19%
• Renewables organic growth of 27% … global expansion
• Excellent global project pipeline
1H revenue highlights
+ 1H’16 organic growth +3% ex. O&G … comparisons get easier+ Power backend loaded … HDGT +65%, AGPs 50%+ in 2H

5
Industrial execution
(a- Excluding Alstom (b- Industrial includes Corporate with the exception of non-operating pension, gains and restructuring & other
Segment gross margins-a)
+70 bps.
Segment OP margins-a)
Mix (0.4) pts. - pts.Value gap (price/inflation) 0.3 0.2Cost productivity 0.8 0.2Gross Margins-a) 0.7 pts. 0.4 pts.Simplification (SG&A) (0.2) 0.1Base inflation/other (1.1) (0.9)Op Profit Margins-a) (0.6) pts. (0.4) pts.Alstom (1.2) (1.5)Op Profit Margins (1.8) pts. (1.9) pts.
2QSegment OP margins
27.3%
2Q
Industrial-b)
OP margins-a)
YTD
26.8%
+40 bps.
14.2%
2Q YTD
13.5%
(60) bps.
15.6%
2Q YTD
15.1%
(40) bps.- bps.
+10 bps.
+0.5 pts. ex. FX
Segment equipment (280) bps.-a), Services flat-a)
1H
Total w/ Alstom
26.5% 26.0% 13.1 % 12.2%14.4 % 13.6%
flat ex. FX
Alstom on track for ~$.05 EPS for
the year
Alstom update
• Won Hassyan clean coal plant: first ultra-supercritical power plant in the Middle East … 4x ST, 4x boilers, 4x generators
• 10 HRSGs ordered through first half
• 2Q EPS $.01 … segment operating profit $138MM, Corporate $(341)MM, tax benefits
• Synergy benefits $0.4B through the first half … on track for ~$1.1B for the year
• Goodwill +$0.6B to $14.8B in 2Q driven mainly by customer contracts
Orders
$4.5
2Q performance
Revenue
$3.2
Segment op profit
$0.1
EPS
$.01
($ in billions except EPS)

6
TotalBeginning balance 1/1/16 $10.4
CFOA ex. deal taxes 11.4
Dividends (4.3)
Net P&E (1.4)
Acquisitions (0.2)
Dispositions incl. deal taxes 4.1
Buyback (13.7)
Change in debt/FX/other 3.7
June 2016 $9.9
Generating cashGE cash balance walkV%2QYTD CFOA
($ in billions)
2015 2016
F
$2.4
3.50.5
$3.9
$10.7
11.0
(89)%
FCF ex. deal taxes F$10.0-a)
Industrial
GE Capitaldividend
$2.0Ind’l FCFex. deal tax
U$(1.0)-a)
0.4UDeal taxes (0.7)
$18B returned to investors … $14B in buyback and $4B in dividends
2H income + depreciation & amortization
Working capital reduction from 2H shipments
Other timing differences
2H Industrial CFOA dynamics
~$8B
~$3-4B
~$1-2B
(a-Including deal taxes: FCF $9.3B, Industrial FCF $(1.7)B
+$4B in July

7
Installed base
Revenue
Op profit
R&D
Strategic imperatives
• Grow installed base and services
• Lead in next-generation products
• Position supply chain for new product volume growth
• Build out digital services for customer productivity
$2.4B
$21.9
$24.0
~63,000
$2.9B
$24.7
~65,000
$2.9B
Op% 19.8% 20.7% 22.3%
~67,500
-1)
(1- Represents company engineering effort; customer, company and deferred engineeringDeliveries and installed base includes GE and JV partners volume.
$4.3
$5.0
$5.5
2013 2014 2015
‘16 Est.
+
++
GE Aviation investing and delivering($ in billions)
-
+
+
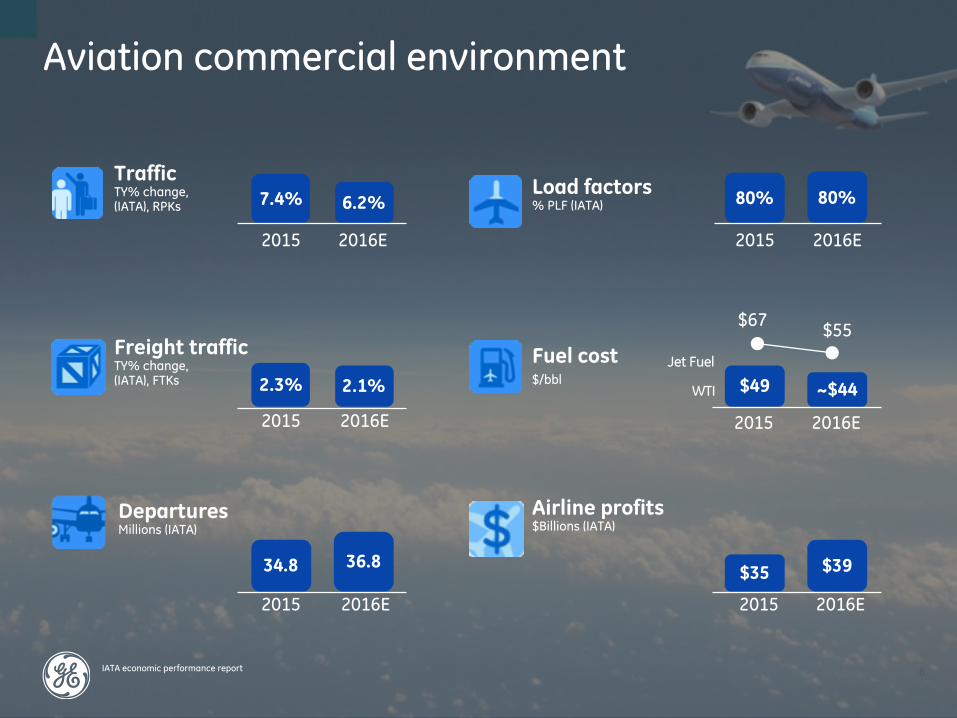
8IATA economic performance report
TrafficTY% change, (IATA), RPKs
Load factors% PLF (IATA)
Fuel cost$/bbl
Freight trafficTY% change, (IATA), FTKs
Departures Millions (IATA)
Airline profits$Billions (IATA)
WTI
Jet Fuel
2016E
2016E
6.2%
2.1%
2016E
2016E
80%80%
2015
2015
7.4%
2.3%
2015
2015
34.8
2015
$55
~$44
$67
$49
2016E
$39$35
2015
36.8
2016E
Aviation commercial environment

9
Aviation military environment
‘15
9%
1H’16
~6%
2015
27
2020
31
Environment Recent wins/milestones
• US Defense budget flat thru ‘17 … $580B
• International defense spending up 4%
• Spares growth
In-service fleet# of engines in ‘000s
• USAF Adaptive Technology … $1B
• F414 Korea indigenous fighter … $2B
• T700 UK Apache re-engine … $200M
• USAF F110 service agreement … $100M/year
• T408 Heavy lift helo production and F414 for Saab Gripen rollout … $7.5B
CFM56 is a 50/50 JV between GE and Safran Engines

10
Unprecedented backlogSuccessful new product launches … strong services growth
$156B-a)
GE AVIATION BACKLOG
+$46BOVER 3 YEAR PERIOD
2Q’13
$85
2Q’16
$122
Services
2Q’13
$25
2Q’16
$34
Equipment
13%
11%
(a – Includes JV backlogCFM is a 50/50 JV between GE and SafranEA is a 50/50 JV between GE and Pratt & Whitney
Farnborough ’16
• Over 800 GE and CFM engines
• Surpassed 11,000 LEAP engines in total
• Introduced first Digital Industrial co-creation lab at airshow
CAGR
11
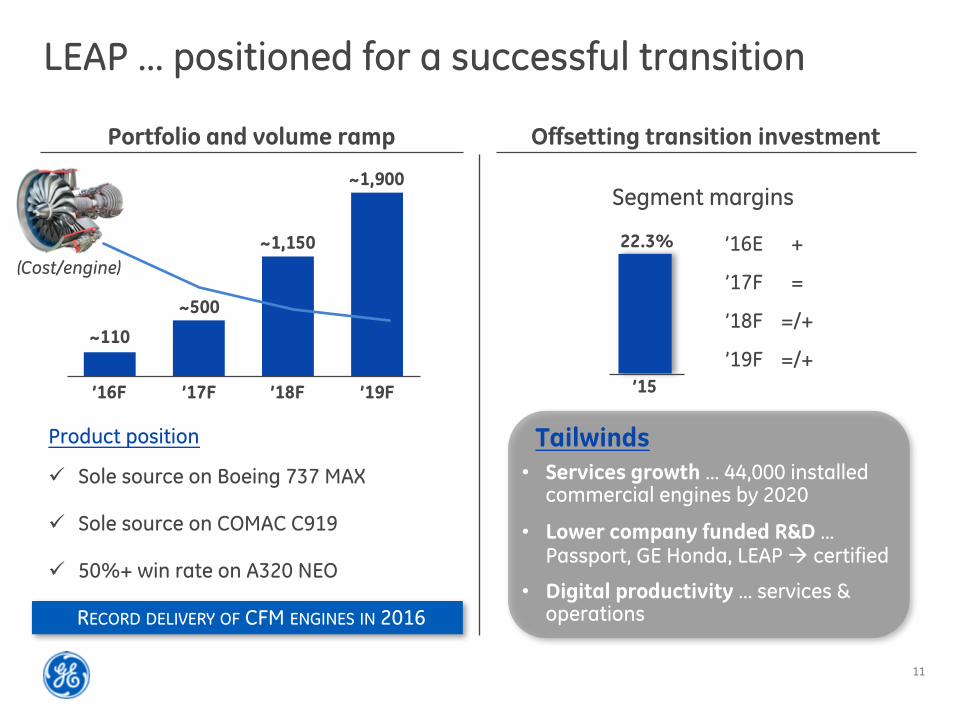
LEAP … positioned for a successful transition
Portfolio and volume ramp Offsetting transition investment
Segment margins
’16E
’17F
’18F
’19F’15
+
=
=/+
=/+
22.3%(Cost/engine)
’16F ’17F ’18F ’19F
~110
~500
~1,150
~1,900
ü Sole source on COMAC C919
ü 50%+ win rate on A320 NEO
ü Sole source on Boeing 737 MAX
RECORD DELIVERY OF CFM ENGINES IN 2016
Product position Tailwinds
• Lower company funded R&D … Passport, GE Honda, LEAP à certified
• Services growth … 44,000 installed commercial engines by 2020
• Digital productivity … services & operations
12
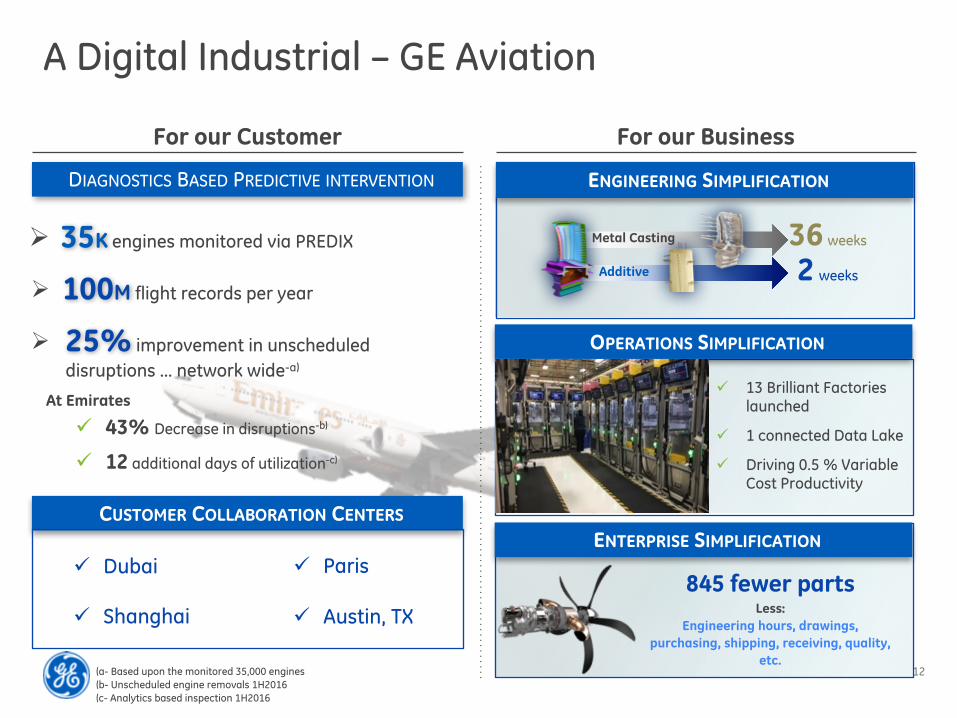
A Digital Industrial – GE Aviation
For our Customer For our Business
35K engines monitored via PREDIX
DIAGNOSTICS BASED PREDICTIVE INTERVENTION
845 fewer parts Less:
Engineering hours, drawings, purchasing, shipping, receiving, quality,
etc.
36 weeks
2 weeksAdditive
Metal Casting
ENGINEERING SIMPLIFICATION
ENTERPRISE SIMPLIFICATION
OPERATIONS SIMPLIFICATION
100M flight records per year
ü 43% Decrease in disruptions-b)
ü 12 additional days of utilization-c)
ü 13 Brilliant Factories launched
ü 1 connected Data Lake
ü Driving 0.5 % Variable Cost Productivity
(a- Based upon the monitored 35,000 engines(b- Unscheduled engine removals 1H2016 (c- Analytics based inspection 1H2016
25% improvement in unscheduled disruptions ... network wide-a)
Ø
Ø
Ø
CUSTOMER COLLABORATION CENTERS
ü Dubai
ü Shanghai ü Austin, TX
ü Paris
At Emirates

13
Revenues $33.5 15%– Industrial-a) 30.7 16– Verticals-b) 2.6 (8)– Other Capital-c) 0.2 F
Industrial + Verticals EPS .51 65Operating EPS .39 86Continuing EPS .36 FNet EPS .30 F
CFOA YTD $10.7 F- Industrial CFOA ex. deal taxes 0.4 (89)
Consolidated tax rate 13% 31% – GE (ex. Capital) 15 21– Capital 27 U
2Q’16 consolidated results
2Q’16 V%
Power $6,639 31% $1,140 9% - %
Renewable Energy 2,094 28 128 (11) (12)%
Oil & Gas 3,219 (22) 320 (48)
Energy Connections 2,734 55 35 (57) U
Aviation 6,511 4 1,348 6
Healthcare 4,525 4 782 11
Transportation 1,240 (13) 273 (18)
Appliances & Lighting 1,667 (25) 96 (42)
Industrial Segments 28,630 7/(1) 4,122 (5)/(6) (9)%
Corporate-d) (1,036) (31) (456) 23
Industrial-d) $27,595 6% $3,667 (2)/(4)%
Op profitRevenues$ V% $ V%
($ in billions – except EPS)
2Q’16
($ in millions)
Industrial operatingCapital Verticals-b)
2Q’16 V%$.46 77%
.05 -
Industrial + Verticals EPS
Organic2Q’15
$.51 65%
(a- Includes GE-GE Capital eliminations(b- Verticals include businesses expected to be retained including allocated corporate costs
Organic
ex. Alstom
Organic
Adj.-d) V%$.35 35%
.05 -$.40 29%
(c- Other Capital includes HQ run-off & exit-related items(d- Excludes gains and restructuring & other

14
2Q’16 Industrial other itemsEPSEPS
Restructuring & other items
$(.09) ü $(1.2)B pre-tax, $(0.8)B after-tax at Corporate including Alstom cost synergy investments
Gains $.20 ü $3.1B pre-tax, $1.8B after-tax Appliances gain at Corporate
Gains = restructuring for the year but quarterly variability in timing
Summary 3QE 4QE1H 2016E
Restructuring & other items ~$(.05) ~$(.06)$(.14) ~$(.25)
Total ~$(.02) ~$(.04)$.06 ~$-
Gains ~$.03 ~$.02$.20 ~$.25
Gains and restructuring & other items after-tax impacts are based on estimated transactional tax rates

15
($ in millions)
Industrial segments
Strong services quarter in Power; Renewables NPI traction
Power
Revenues $6,639 31% 2%
Segment profit $1,140 9% 0%
Op profit % 17.2% (3.5) pts. (0.4) pts.
$ V%2Q’16
Renewable Energy
2Q dynamics
• $7.7B orders, +41% reported … core (11)% with equipment (26)% and services (4)%; Alstom orders $2.9B
• Revenue … core equipment (5)% driven by GPS (7)%; core services +7% driven by Power Services +12%
• Core segment profit flat … positive value gap and cost out partially offset by H mix
2Q dynamics
• $2.0B orders, (6)% ... core (16)% on lower wind units, â 251 versus prior year; 1H core orders +15%
• Revenue … core +14% driven by higher wind turbine shipments and mix shift to larger MW units
• Core segment profit (12)% primarily driven by NPI launch costs and mix
V%ex. Alstom
Revenues $2,094 28% 14%
Segment profit $128 (11)% (12)%
Op profit % 6.1% (2.7) pts. (2.0) pts.
$ V%2Q’16 V%ex. Alstom
16
Industrial segments($ in millions)
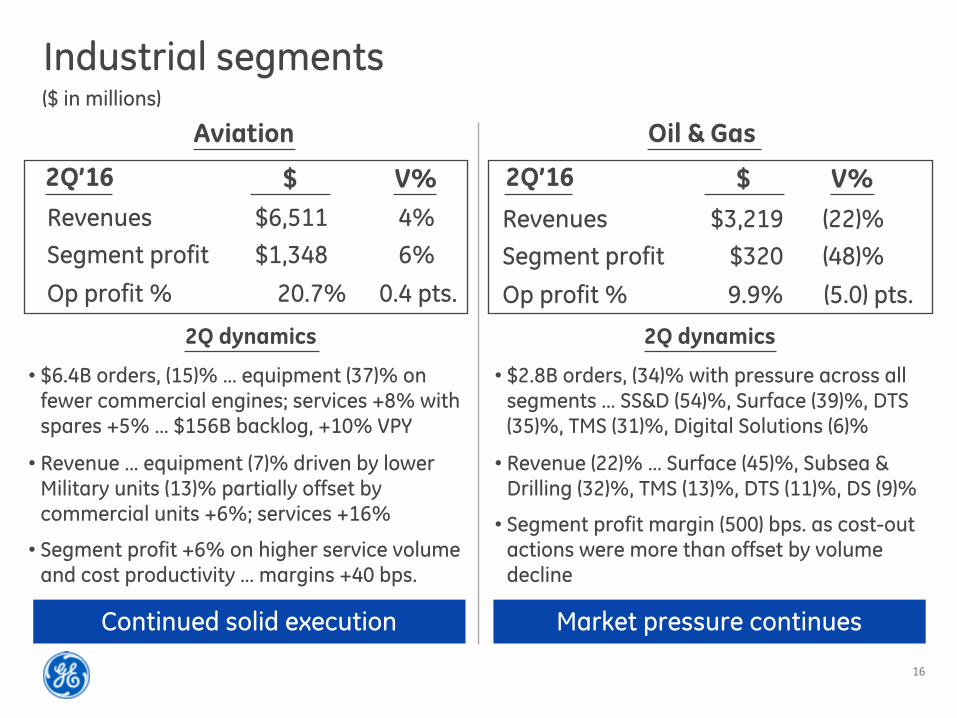
Oil & Gas
2Q dynamics
2Q’16
Revenues $3,219 (22)%Segment profit $320 (48)%
Op profit % 9.9% (5.0) pts.
$ V%
Market pressure continues
• $2.8B orders, (34)% with pressure across all segments … SS&D (54)%, Surface (39)%, DTS (35)%, TMS (31)%, Digital Solutions (6)%
• Revenue (22)% … Surface (45)%, Subsea & Drilling (32)%, TMS (13)%, DTS (11)%, DS (9)%
• Segment profit margin (500) bps. as cost-out actions were more than offset by volume decline
Aviation
Continued solid execution
Revenues $6,511 4%Segment profit $1,348 6%
Op profit % 20.7% 0.4 pts.
• $6.4B orders, (15)% … equipment (37)% on fewer commercial engines; services +8% with spares +5% … $156B backlog, +10% VPY
• Revenue … equipment (7)% driven by lower Military units (13)% partially offset by commercial units +6%; services +16%
• Segment profit +6% on higher service volume and cost productivity … margins +40 bps.
2Q dynamics
$ V%2Q’16
17
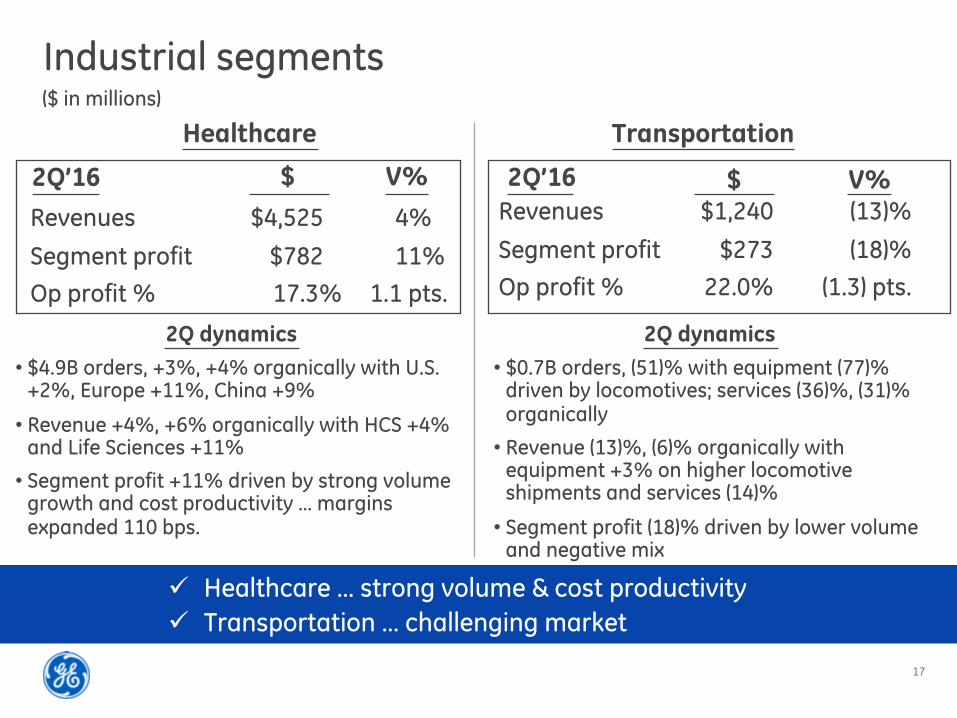
Industrial segments
ü Healthcare … strong volume & cost productivityü Transportation … challenging market
($ in millions)
Healthcare Transportation
• $0.7B orders, (51)% with equipment (77)% driven by locomotives; services (36)%, (31)% organically
• Revenue (13)%, (6)% organically with equipment +3% on higher locomotive shipments and services (14)%
• Segment profit (18)% driven by lower volume and negative mix
2Q dynamics
Revenues $4,525 4%
Segment profit $782 11%Op profit % 17.3% 1.1 pts.
• $4.9B orders, +3%, +4% organically with U.S. +2%, Europe +11%, China +9%
• Revenue +4%, +6% organically with HCS +4% and Life Sciences +11%
• Segment profit +11% driven by strong volume growth and cost productivity … margins expanded 110 bps.
2Q dynamics
$ V%2Q’16Revenues $1,240 (13)%
Segment profit $273 (18)%Op profit % 22.0% (1.3) pts.
$ V%2Q’16

18
Industrial segments($ in millions)
ü EC … strong Grid performance; PC impacted by oil & gas marketü Appliances transaction closed June 6th
Energy Connections
• $3.0B orders, +45% … Alstom $1.4B; core (2)% organically with Power Conversion (17)% on softer oil & gas and Industrial Solutions +1%
• Revenue +55%, (4)% organically with Power Conversion +1%, Industrial Solutions (6)%
• Segment profit of $35MM with core $(9)MM driven by lower volume, digital investment, and disposition impacts; Alstom Grid $45MM
2Q dynamics
2Q’16
Revenues $2,734 55% (4)%
Segment profit $35 (57)% U
Op profit % 1.3% (3.3) pts. (3.7) pts.
$ V% V%Organic
Appliances & Lighting
Revenues $1,667 (25)%
Segment profit $96 (42)%Op profit % 5.8% (1.6) pts.
• Appliances revenue (31)% driven by partial quarter … deal closed June 6th
• Lighting revenue (11)% with LED +4% and traditional (23)% … LED 42% of total revenues
• Segment profit (42)% driven by partial Appliances quarter and continued traditional lighting pressure; margins (160) bps.
2Q dynamics
$ V%2Q’16
19
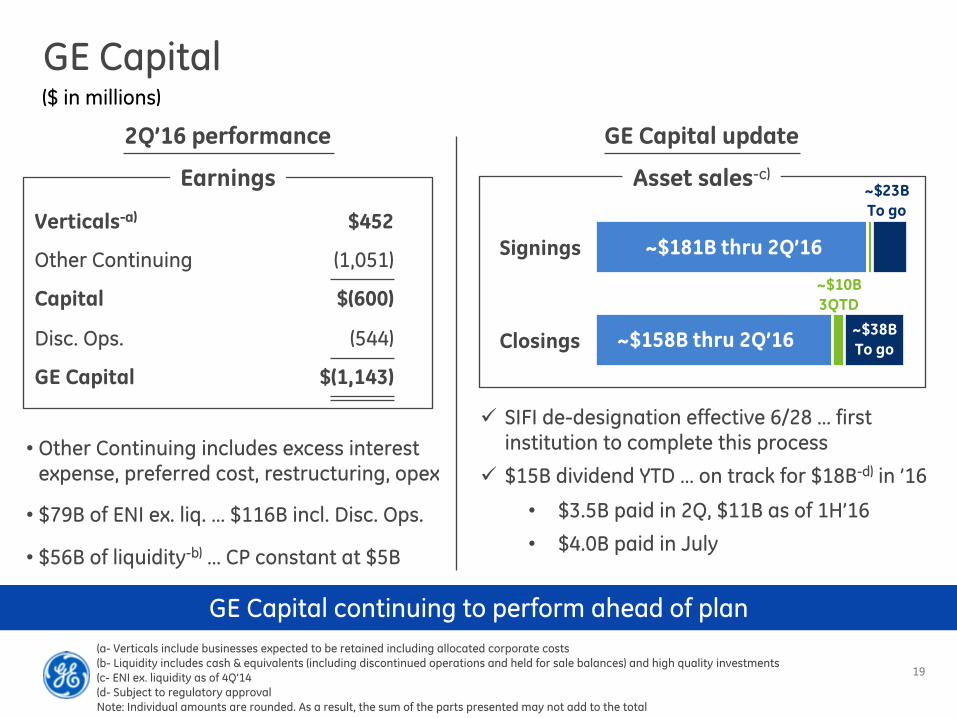
GE Capital
GE Capital update2Q’16 performance
• Other Continuing includes excess interest expense, preferred cost, restructuring, opex
• $79B of ENI ex. liq. … $116B incl. Disc. Ops.
• $56B of liquidity-b) … CP constant at $5B
Verticals-a) $452
Other Continuing (1,051)
Capital $(600)
Disc. Ops. (544)
GE Capital $(1,143)
($ in millions)
GE Capital continuing to perform ahead of plan(a- Verticals include businesses expected to be retained including allocated corporate costs (b- Liquidity includes cash & equivalents (including discontinued operations and held for sale balances) and high quality investments(c- ENI ex. liquidity as of 4Q’14(d- Subject to regulatory approvalNote: Individual amounts are rounded. As a result, the sum of the parts presented may not add to the total
ü SIFI de-designation effective 6/28 … first institution to complete this process
ü $15B dividend YTD … on track for $18B-d) in ’16
• $3.5B paid in 2Q, $11B as of 1H’16
• $4.0B paid in July
Signings
Closings
Asset sales-c)Earnings
~$38BTo go~$158B thru 2Q’16
~$181B thru 2Q’16
~$23BTo go
~$10B3QTD
20
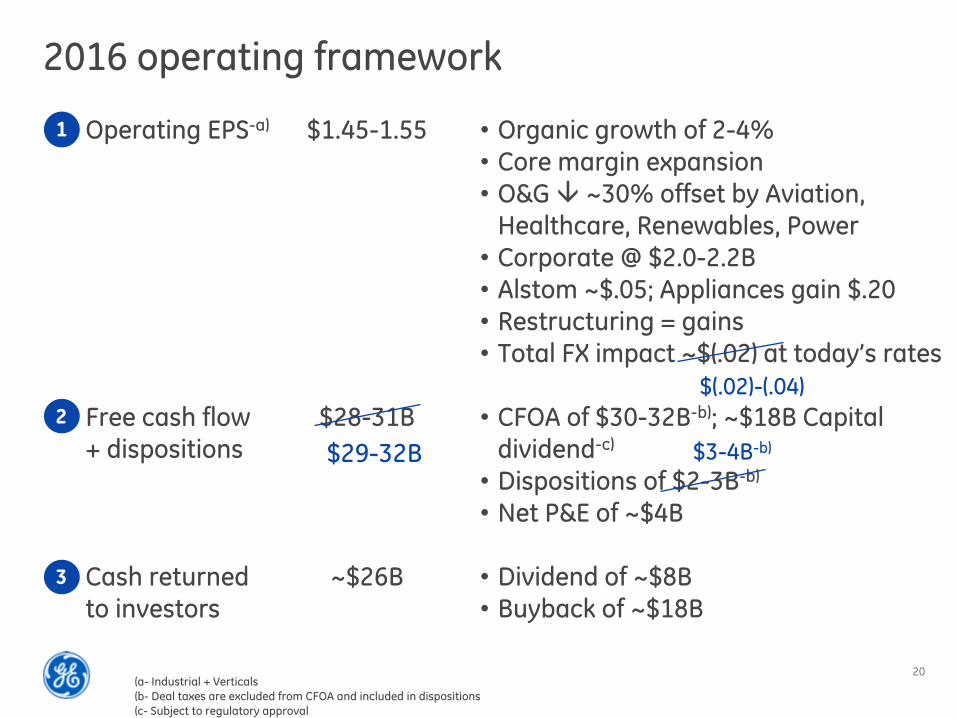
2016 operating framework
Operating EPS-a) $1.45-1.55
Free cash flow $28-31B+ dispositions
Cash returned ~$26Bto investors
1
2
3
• Organic growth of 2-4%• Core margin expansion • O&G â ~30% offset by Aviation,
Healthcare, Renewables, Power• Corporate @ $2.0-2.2B• Alstom ~$.05; Appliances gain $.20• Restructuring = gains• Total FX impact ~$(.02) at today’s rates
• CFOA of $30-32B-b); ~$18B Capital dividend-c)
• Dispositions of $2-3B-b)
• Net P&E of ~$4B
• Dividend of ~$8B• Buyback of ~$18B
(a- Industrial + Verticals (b- Deal taxes are excluded from CFOA and included in dispositions(c- Subject to regulatory approval
$(.02)-(.04)
$29-32B $3-4B-b)

Related Documents