Vote In 2010 Region General Election Voting Intention Social Class Age Gender NET: Eng- NET: land & Eng- Mid- Scot- Lib Lib Fe- Wales land South lands North Wales land Dem Lab Con Other UKIP Dem Lab Con DE C2 C1 AB 65+ 35-64 25-34 18-24 male Male Total 952 900 370 269 261 52 90 142 217 274 99 64 56 239 280 257 133 242 410 233 525 164 120 554 488 1042 Unweighted base 950 898 370 271 257 52 92 138 189 224 92 60 48 234 267 236 225 307 274 211 531 169 131 543 499 1042 Weighted base 598 560 235 159 166 39 66 108 143 179 71 37 31 163 204 157 139 173 196 171 353 90 51 348 316 664 10 - Absolutely certain 63% 62% 63% 59% 65% 74% 72% 79% 76% 80% 77% 61% 65% 70% 76% 67% 62% 56% 72% 81% 67% 53% 39% 64% 63% 64% to vote 65 61 25 22 14 3 4 9 13 18 3 5 5 16 24 12 10 22 25 3 37 15 13 26 43 69 9 7% 7% 7% 8% 5% 7% 5% 7% 7% 8% 3% 8% 10% 7% 9% 5% 4% 7% 9% 2% 7% 9% 10% 5% 9% 7% 72 68 27 25 16 4 1 7 16 9 2 6 7 20 8 14 23 24 13 13 35 11 14 40 33 73 8 8% 8% 7% 9% 6% 7% 2% 5% 8% 4% 2% 10% 15% 9% 3% 6% 10% 8% 5% 6% 7% 7% 11% 7% 7% 7% 46 44 17 17 10 2 7 7 7 7 6 3 1 11 16 12 13 19 9 10 21 10 11 26 27 53 7 5% 5% 5% 6% 4% 3% 7% 5% 4% 3% 6% 4% 2% 5% 6% 5% 6% 6% 3% 5% 4% 6% 9% 5% 5% 5% 28 28 12 11 4 * 7 - - 1 7 1 - 12 1 2 14 15 3 - 10 16 9 17 18 35 6 3% 3% 3% 4% 2% 1% 7% - - * 8% 1% - 5% * 1% 6% 5% 1% - 2% 9% 7% 3% 4% 3% 44 44 12 18 13 - 4 4 4 4 2 4 4 5 12 12 7 16 12 6 24 6 11 33 14 47 5 5% 5% 3% 7% 5% - 4% 3% 2% 2% 3% 7% 8% 2% 4% 5% 3% 5% 4% 3% 5% 4% 8% 6% 3% 5% 14 12 7 3 2 2 - * 3 1 - - - * * 4 3 6 * * 9 2 3 5 9 14 4 2% 1% 2% 1% 1% 4% - * 1% 1% - - - * * 2% 1% 2% * * 2% 1% 2% 1% 2% 1% 14 13 2 1 11 * - - 2 * * 5 * 7 * 7 1 5 1 - 7 1 5 7 7 14 3 1% 1% * * 4% * - - 1% * * 8% * 3% * 3% * 1% 1% - 1% 1% 4% 1% 1% 1% 9 9 3 1 5 - - - - * * - - - 3 * - 5 3 * 8 1 - 4 5 9 2 1% 1% 1% * 2% - - - - * 1% - - - 1% * - 2% 1% * 2% * - 1% 1% 1% 58 56 28 12 16 2 3 2 2 5 - - - - - 13 14 23 11 7 26 15 14 36 25 61 1 - Certain not to vote 6% 6% 8% 4% 6% 4% 3% 1% 1% 2% - - - - - 5% 6% 8% 4% 3% 5% 9% 10% 7% 5% 6% - - - - - - - - - - - - - - - - - - - - - - - - - - Refused - - - - - - - - - - - - - - - - - - - - - - - - - - 3 3 2 - 1 - * - * - - - - - - 2 * - 1 * 1 2 - 1 2 3 Don't know * * 1% - * - * - * - - - - - - 1% * - * * * 1% - * * * 8.47 8.43 8.44 8.51 8.34 9.02 8.95 9.39 9.33 9.41 9.21 8.67 9.11 9.10 9.35 8.57 8.48 8.09 8.96 9.26 8.63 8.07 7.37 8.43 8.60 8.51 Mean 2.63 2.65 2.72 2.37 2.83 2.22 2.06 1.51 1.57 1.65 1.61 2.19 1.53 1.70 1.48 2.59 2.51 2.85 2.25 1.90 2.53 2.82 2.99 2.68 2.49 2.59 Standard deviation 0.09 0.09 0.14 0.14 0.18 0.31 0.22 0.13 0.11 0.10 0.16 0.27 0.20 0.11 0.09 0.16 0.22 0.18 0.11 0.13 0.11 0.22 0.27 0.11 0.11 0.08 Standard error Page 1 Opinion Poll CATI Fieldwork : 10th-12th April 2015 Absolutes/col percents Table 1 Q.A Some people have said they would not vote in a new General Election, while others have said they would vote. I would like to know how certain it is that you would actually vote in a general election? Base: All respondents Prepared on behalf of The Guardian by ICMUnlimited - Confidential

Gdn:ICMApr2015CampaignPoll1
Dec 21, 2015
First Guardian/ICM poll of the 2015 general election campaign
Welcome message from author
This document is posted to help you gain knowledge. Please leave a comment to let me know what you think about it! Share it to your friends and learn new things together.
Transcript

Vote In 2010RegionGeneral ElectionVoting IntentionSocial ClassAgeGender
NET:Eng-NET:
land &Eng-Mid-Scot-LibLibFe-WaleslandSouthlandsNorthWaleslandDemLabConOtherUKIPDemLabConDEC2C1AB65+35-6425-3418-24maleMaleTotal
95290037026926152901422172749964562392802571332424102335251641205544881042Unweighted base
95089837027125752921381892249260482342672362253072742115311691315434991042Weighted base
5985602351591663966108143179713731163204157139173196171353905134831666410 - Absolutely certain63%62%63%59%65%74%72%79%76%80%77%61%65%70%76%67%62%56%72%81%67%53%39%64%63%64%to vote
65612522143491318355162412102225337151326436997%7%7%8%5%7%5%7%7%8%3%8%10%7%9%5%4%7%9%2%7%9%10%5%9%7%
7268272516417169267208142324131335111440337388%8%7%9%6%7%2%5%8%4%2%10%15%9%3%6%10%8%5%6%7%7%11%7%7%7%
464417171027777631111612131991021101126275375%5%5%6%4%3%7%5%4%3%6%4%2%5%6%5%6%6%3%5%4%6%9%5%5%5%
282812114*7--171-121214153-1016917183563%3%3%4%2%1%7%--*8%1%-5%*1%6%5%1%-2%9%7%3%4%3%
4444121813-4444244512127161262461133144755%5%3%7%5%-4%3%2%2%3%7%8%2%4%5%3%5%4%3%5%4%8%6%3%5%
14127322-*31---**436**923591442%1%2%1%1%4%-*1%1%---**2%1%2%**2%1%2%1%2%1%
14132111*--2**5*7*7151-715771431%1%**4%*--1%**8%*3%*3%*1%1%-1%1%4%1%1%1%
99315----**---3*-53*81-45921%1%1%*2%----*1%---1%*-2%1%*2%*-1%1%1%
585628121623225-----1314231172615143625611 - Certain not to vote6%6%8%4%6%4%3%1%1%2%-----5%6%8%4%3%5%9%10%7%5%6%
--------------------------Refused--------------------------
332-1-*-*------2*-1*12-123Don't know**1%-*-*-*------1%*-***1%-***
8.478.438.448.518.349.028.959.399.339.419.218.679.119.109.358.578.488.098.969.268.638.077.378.438.608.51Mean
2.632.652.722.372.832.222.061.511.571.651.612.191.531.701.482.592.512.852.251.902.532.822.992.682.492.59Standard deviation
0.090.090.140.140.180.310.220.130.110.100.160.270.200.110.090.160.220.180.110.130.110.220.270.110.110.08Standard error
Page 1
Opinion PollCATI Fieldwork : 10th-12th April 2015
Absolutes/col percents
Table 1Q.A Some people have said they would not vote in a new General Election, while others have said they would vote. I would like toknow how certain it is that you would actually vote in a general election?Base: All respondents
Prepared on behalf of The Guardian by ICMUnlimited - Confidential

Constituency categorySafe
SafeLabourConser(i.e.
AllvativeLabLab-(i.e.heldConLabConConANDheldheld
marginheld>1Lab>10LD-ANDANDals5.1%,.1%,heldCON<15LAB<10
(1+2)Scotlaininseats% in%, inabove.OtherndE&W)E&W)in E&WE&W.E&W.Total
21989034925279130891042Unweighted base
18579237825185110751042Weighted base
11456623815663724266410 - Absolutely certain62%71%72%63%62%74%65%56%64%to vote
15*4281421056998%3%5%7%6%2%9%7%7%
132131157767387%26%2%8%6%9%7%8%7%
16-71711-1155379%-7%4%4%-10%6%5%
10-779-283565%-7%2%4%-2%10%3%
5-422112144753%-4%6%4%2%1%6%5%
---66---144---1%2%---1%
2--210-2-1431%--*4%-2%-1%
4--23*3*922%--1%1%*3%*1%
6-324151115611 - Certain not to vote3%-3%6%6%13%1%6%6%
---------Refused---------
*-*-2--*3Don't know*-*-1%--**
8.659.458.958.518.288.558.888.308.51Mean
2.290.952.062.592.783.042.082.552.59Standard deviation
0.160.340.220.140.180.340.180.270.08Standard error
Page 2
Opinion PollCATI Fieldwork : 10th-12th April 2015
Absolutes/col percents
Table 1Q.A Some people have said they would not vote in a new General Election, while others have said they would vote. I would like toknow how certain it is that you would actually vote in a general election?Base: All respondents
Prepared on behalf of The Guardian by ICMUnlimited - Confidential

Page 3
Opinion PollCATI Fieldwork : 10th-12th April 2015
Absolutes/col percents
Table 2Q.B The Conservatives, Labour, the Liberal Democrats and other parties would fight a new election in your area. If there were ageneral election tomorrow which party do you think you would vote for?Base: All respondents
Prepared on behalf of The Guardian by ICMUnlimited - Confidential
Vote In 2010RegionGeneral ElectionVoting IntentionSocial ClassAgeGender
NET:Eng-NET:
land &Eng-Mid-Scot-LibLibFe-WaleslandSouthlandsNorthWaleslandDemLabConOtherUKIPDemLabConDEC2C1AB65+35-6425-3418-24maleMaleTotal
95290037026926152901422172749964562392802571332424102335251641205544881042Unweighted base
95089837027125752921381892249260482342672362253072742115311691315434991042Weighted base
2512451006778716267158----26757596883751492915102165267Conservative26%27%27%25%30%13%17%19%4%70%----100%24%26%22%30%36%28%17%11%19%33%26%
2252158672571092612111---234-51358167321064056126109234Labour24%24%23%27%22%20%10%19%64%5%---100%-22%15%26%25%15%20%24%43%23%22%22%
464518198*335*1--48--1111141262994242448Liberal Democrat/5%5%5%7%3%1%3%25%**--100%--5%5%5%4%3%5%6%3%4%5%5%Liberal
------3014-30----7108511289121830Scottish National------33%*2%-33%----3%4%2%2%*2%5%7%2%4%3%Party/SNP
6----6-3--6------33-6--246Plaid Cymru1%----12%-2%--7%------1%1%-1%--*1%1%
49452011144-1211-49----382612720166361349Green Party5%5%5%4%5%8%-9%6%-53%----1%4%8%4%3%4%10%5%7%3%5%
5853201517629810-60---1924108163383184260UK Independence Party6%6%5%6%7%11%2%6%4%4%-100%---8%11%3%3%8%6%5%3%3%8%6%(UKIP)
**-*------*-----*---*---**British National Party**-*------1%-----*---*---**(BNP)
65*131*-1-6----2--4-421526Other1%1%**1%2%*-1%-7%----1%--1%-1%1%1%1%*1%
585628121623225-----131423117261514362561Will not vote6%6%8%4%6%4%3%1%1%2%-----5%6%8%4%3%5%9%10%7%5%6%
1761655856511119182434-----5347445143102321813164195Don't know19%18%16%21%20%20%21%13%13%15%-----22%21%14%19%21%19%19%14%24%13%19%
74694017124106106-----201731162346105513384Refused8%8%11%6%5%9%11%4%5%3%-----9%7%10%6%11%9%6%3%9%7%8%

Constituency categorySafe
SafeLabourConser(i.e.
AllvativeLabLab-(i.e.heldConLabConConANDheldheld
marginheld>1Lab>10LD-ANDANDals5.1%,.1%,heldCON<15LAB<10
(1+2)Scotlaininseats% in%, inabove.OtherndE&W)E&W)in E&WE&W.E&W.Total
21989034925279130891042Unweighted base
18579237825185110751042Weighted base
54*1611937263916267Conservative29%4%17%32%15%31%35%21%26%
53195710082924234Labour29%11%10%15%40%10%26%32%22%
6-3134201548Liberal Democrat/3%-3%3%1%24%1%7%5%Liberal
--30-----30Scottish National--33%-----3%Party/SNP
61----236Plaid Cymru3%13%----2%4%1%
51-211542349Green Party3%18%-5%6%5%2%4%5%
622271833360UK Independence Party3%26%2%7%7%3%3%4%6%(UKIP)
---*----*British National Party---*----*(BNP)
2-*1**-26Other1%-****-2%1%
6-32415111561Will not vote3%-3%6%6%13%1%6%6%
40*196650112614195Don't know22%3%21%17%20%13%23%19%19%
8210491317184Refused4%26%11%13%5%2%6%2%8%
Page 4
Opinion PollCATI Fieldwork : 10th-12th April 2015
Absolutes/col percents
Table 2Q.B The Conservatives, Labour, the Liberal Democrats and other parties would fight a new election in your area. If there were ageneral election tomorrow which party do you think you would vote for?Base: All respondents
Prepared on behalf of The Guardian by ICMUnlimited - Confidential

Page 5
Opinion PollCATI Fieldwork : 10th-12th April 2015
Absolutes/col percents
Table 3Data derived from:-Q.A Some people have said they would not vote in a new General Election, while others have said they would vote. I would like toknow how certain it is that you would actually vote in a general election?Q.B The Conservatives, Labour, the Liberal Democrats and other parties would fight a new election in your area. If there were ageneral election tomorrow which party do you think you would vote for?Data excludes those who definitely will not vote (6%), don't know who they would vote for (19%) or refuse to answer (8%)THIS TABLE DOES NOT INCLUDE ADJUSTMENT FOR DON'T KNOW/REFUSERS
Prepared on behalf of The Guardian by ICMUnlimited - Confidential
Vote In 2010RegionGeneral ElectionVoting IntentionSocial ClassAgeGender
NET:Eng-NET:
land &Eng-Mid-Scot-LibLibFe-WaleslandSouthlandsNorthWaleslandDemLabConOtherUKIPDemLabConDEC2C1AB65+35-6425-3418-24maleMaleTotal
5675312191411703657100168218805445203242139721422711483369050300324624Unweighted base
52349119914714533441061461747246391882231201111681691203059052263305568Weighted base
208202795568516247153----223474758716112926688135223Conservative40%41%40%38%47%16%35%23%5%88%----100%39%42%35%42%51%42%28%12%34%44%39%
1821727453451052511610---188-41236757309530339791188Labour35%35%37%36%31%31%12%24%80%6%---100%-34%21%40%34%25%31%33%63%37%30%33%
363615147*333*1--39--710111162472182139Liberal Democrat/7%7%7%10%5%1%6%31%**--100%--6%9%6%6%5%8%8%4%7%7%7%Liberal
------1914-19----4545195591119Scottish National------44%1%3%-27%----4%5%2%3%*3%5%10%3%4%3%Party/SNP
6----6-3--6------33-6--246Plaid Cymru1%----19%-3%--9%------2%2%-2%--1%1%1%
42381610124-1211-42----28201261915233942Green Party8%8%8%7%8%13%-11%8%-58%----2%7%12%7%5%6%17%4%12%3%7%
4539161311618610-46---171757162163133346UK Independence Party9%8%8%9%7%17%3%8%4%6%-100%---14%16%3%4%13%7%7%7%5%11%8%(UKIP)
**-*------*-----*---*---**British National Party**-*------1%-----*---*---**(BNP)
43*121*-1-4----1--2-21*214Other1%1%*1%1%3%*-1%-5%----1%--1%-1%1%*1%*1%

Constituency categorySafe
SafeLabourConser(i.e.
AllvativeLabLab-(i.e.heldConLabConConANDheldheld
marginheld>1Lab>10LD-ANDANDals5.1%,.1%,heldCON<15LAB<10
(1+2)Scotlaininseats% in%, inabove.OtherndE&W)E&W)in E&WE&W.E&W.Total
128657196157557256624Unweighted base
109544193137546642568Weighted base
48*169527233514223Conservative45%5%35%49%20%42%52%32%39%
4115498082516188Labour38%16%12%25%58%15%38%38%33%
5-393171439Liberal Democrat/4%-6%5%2%32%1%9%7%Liberal
--19-----19Scottish National--44%-----3%Party/SNP
61----236Plaid Cymru5%18%----3%8%1%
31-171432242Green Party3%25%-9%10%5%3%4%7%
521211322346UK Independence Party4%37%3%11%9%5%3%7%8%(UKIP)
---*----*British National Party---*----*(BNP)
1-*1**-14Other1%-***1%-2%1%
Page 6
Opinion PollCATI Fieldwork : 10th-12th April 2015
Absolutes/col percents
Table 3Data derived from:-Q.A Some people have said they would not vote in a new General Election, while others have said they would vote. I would like toknow how certain it is that you would actually vote in a general election?Q.B The Conservatives, Labour, the Liberal Democrats and other parties would fight a new election in your area. If there were ageneral election tomorrow which party do you think you would vote for?Data excludes those who definitely will not vote (6%), don't know who they would vote for (19%) or refuse to answer (8%)THIS TABLE DOES NOT INCLUDE ADJUSTMENT FOR DON'T KNOW/REFUSERS
Prepared on behalf of The Guardian by ICMUnlimited - Confidential

Total
39%Conservative
33%Labour
8%Liberal Democrat
7%UKIP
7%Green
6%Other
Page 7
Opinion PollCATI Fieldwork : 10th-12th April 2015
Col percents
Table 4Published Vote Intention FiguresPercentages derived from the responses of 813 respondents
Prepared on behalf of The Guardian by ICMUnlimited - Confidential

Vote In 2010RegionGeneral ElectionVoting IntentionSocial ClassAgeGender
NET:Eng-NET:
land &Eng-Mid-Scot-LibLibFe-WaleslandSouthlandsNorthWaleslandDemLabConOtherUKIPDemLabConDEC2C1AB65+35-6425-3418-24maleMaleTotal
95290037026926152901422172749964562392802571332424102335251641205544881042Unweighted base
95089837027125752921381892249260482342672362253072742115311691315434991042Weighted base
32530211097942425339254397119967897510383871655642225125350NHS34%34%30%36%37%46%27%24%49%24%42%12%22%42%25%38%33%34%30%41%31%33%32%41%25%34%
1661637142503131816424355184839564736399723209485179Immigration18%18%19%16%19%6%14%13%8%19%4%58%11%8%18%17%25%15%13%18%18%13%15%17%17%17%
16115061553311162725381959643623416350898343776101177Jobs, prices and wages17%17%17%20%13%21%17%20%13%17%20%9%19%27%13%10%18%20%18%4%18%20%28%14%20%17%
848343231711215221110*83419191730297392623573896Education9%9%12%8%7%1%13%11%12%5%11%*16%14%7%8%7%10%11%3%7%15%17%11%8%9%
625931121721114929431445942535243694244973The government deficit6%7%8%4%7%4%12%10%5%13%5%5%1%2%17%4%2%8%13%11%7%6%3%4%10%7%
31299812267511158281211410717112132437Europe3%3%2%3%5%4%6%5%3%5%1%8%17%1%3%5%1%5%4%3%3%6%2%2%5%4%
262314553*228-*12151681215101-121426Pensions3%3%4%2%2%5%*2%1%3%-1%3%1%5%7%4%*1%7%2%*-2%3%3%
111072*11*42*211**354110*12911Crime and disorder1%1%2%1%*1%1%*2%1%*3%1%***1%2%1%*2%***2%1%
716719232548181326143582522201820185182304979Other7%7%5%9%10%8%9%13%7%12%16%5%10%4%9%9%9%6%7%9%10%5%2%6%10%8%
121153321213*-*237*2458*19514Don't know1%1%1%1%1%3%1%2%*2%*-*1%1%3%*1%2%2%1%*1%2%1%1%
Page 8
Opinion PollCATI Fieldwork : 10th-12th April 2015
Absolutes/col percents
Table 5Q2. Thinking about the single issue that will concern you most when it comes to casting your vote, which SINGLE ONE of the following would you say will be the most important?Base: All respondents
Prepared on behalf of The Guardian by ICMUnlimited - Confidential

Constituency categorySafe
SafeLabourConser(i.e.
AllvativeLabLab-(i.e.heldConLabConConANDheldheld
marginheld>1Lab>10LD-ANDANDals5.1%,.1%,heldCON<15LAB<10
(1+2)Scotlaininseats% in%, inabove.OtherndE&W)E&W)in E&WE&W.E&W.Total
21989034925279130891042Unweighted base
18579237825185110751042Weighted base
60325137103163921350NHS33%42%27%36%41%19%36%29%34%
20213703532154179Immigration11%26%14%19%14%38%14%6%17%
45-16494942322177Jobs, prices and wages24%-17%13%20%5%21%30%17%
17-122528811696Education9%-13%7%11%10%10%8%9%
9-1135865473The government deficit5%-12%9%3%7%5%5%7%
10*610262837Europe5%4%6%3%1%7%2%10%4%
7-*11626126Pensions4%-*3%3%2%5%2%3%
11181-1*11Crime and disorder1%11%1%2%*-1%*1%
13182715107779Other7%18%9%7%6%12%6%9%8%
2-16311114Don't know1%-1%2%1%1%1%1%1%
Page 9
Opinion PollCATI Fieldwork : 10th-12th April 2015
Absolutes/col percents
Table 5Q2. Thinking about the single issue that will concern you most when it comes to casting your vote, which SINGLE ONE of the following would you say will be the most important?Base: All respondents
Prepared on behalf of The Guardian by ICMUnlimited - Confidential

Vote In 2010RegionGeneral ElectionVoting IntentionSocial ClassAgeGender
NET:Eng-NET:
land &Eng-Mid-Scot-LibLibFe-WaleslandSouthlandsNorthWaleslandDemLabConOtherUKIPDemLabConDEC2C1AB65+35-6425-3418-24maleMaleTotal
95290037026926152901422172749964562392802571332424102335251641205544881042Unweighted base
95089837027125752921381892249260482342672362253072742115311691315434991042Weighted base
49346419314312829487749191232435612551231191481511412746659236305541Good job52%52%52%53%50%55%53%56%26%85%25%40%73%26%95%52%53%48%55%67%52%39%45%44%61%52%
336317131919420234611618543281465797611688521797355220139359Bad job35%35%35%34%37%37%25%33%62%8%58%53%17%62%2%33%34%38%32%25%34%43%42%41%28%34%
121117463734420142315154427734304434187829178755142Don't know13%13%13%14%13%7%22%11%12%7%17%7%9%11%3%14%13%14%12%8%15%17%13%16%11%14%
Page 10
Opinion PollCATI Fieldwork : 10th-12th April 2015
Absolutes/col percents
Table 6Q3. From what you have seen or heard, do you think the Prime Minister David Cameron has done a good job or a bad job?Base: All respondents
Prepared on behalf of The Guardian by ICMUnlimited - Confidential

Constituency categorySafe
SafeLabourConser(i.e.
AllvativeLabLab-(i.e.heldConLabConConANDheldheld
marginheld>1Lab>10LD-ANDANDals5.1%,.1%,heldCON<15LAB<10
(1+2)Scotlaininseats% in%, inabove.OtherndE&W)E&W)in E&WE&W.E&W.Total
21989034925279130891042Unweighted base
18579237825185110751042Weighted base
10554820698526738541Good job57%68%53%55%39%62%61%52%52%
70223124111173634359Bad job38%29%25%33%44%20%33%45%34%
9*2048431572142Don't know5%3%22%13%17%18%6%3%14%
Page 11
Opinion PollCATI Fieldwork : 10th-12th April 2015
Absolutes/col percents
Table 6Q3. From what you have seen or heard, do you think the Prime Minister David Cameron has done a good job or a bad job?Base: All respondents
Prepared on behalf of The Guardian by ICMUnlimited - Confidential

Vote In 2010RegionGeneral ElectionVoting IntentionSocial ClassAgeGender
NET:Eng-NET:
land &Eng-Mid-Scot-LibLibFe-WaleslandSouthlandsNorthWaleslandDemLabConOtherUKIPDemLabConDEC2C1AB65+35-6425-3418-24maleMaleTotal
95290037026926152901422172749964562392802571332424102335251641205544881042Unweighted base
95089837027125752921381892249260482342672362253072742115311691315434991042Weighted base
236221966065152040813420751294155557077561253145130127257Good job25%25%26%22%25%29%22%29%43%15%22%12%10%55%15%23%25%23%28%27%24%19%34%24%25%25%
52549418714915832477077168595227572011351151721501292889857274298573Bad job55%55%51%55%61%61%52%51%41%75%64%87%57%24%75%57%51%56%55%61%54%58%44%50%60%55%
1881838762345242831231311648254554664626118393013973212Don't know20%20%23%23%13%10%26%21%16%10%14%1%33%21%9%19%24%22%17%12%22%23%23%26%15%20%
Page 12
Opinion PollCATI Fieldwork : 10th-12th April 2015
Absolutes/col percents
Table 7Q3. From what you have seen or heard, do you think the leader of the opposition Ed Miliband has done a good job or a bad job?Base: All respondents
Prepared on behalf of The Guardian by ICMUnlimited - Confidential

Constituency categorySafe
SafeLabourConser(i.e.
AllvativeLabLab-(i.e.heldConLabConConANDheldheld
marginheld>1Lab>10LD-ANDANDals5.1%,.1%,heldCON<15LAB<10
(1+2)Scotlaininseats% in%, inabove.OtherndE&W)E&W)in E&WE&W.E&W.Total
21989034925279130891042Unweighted base
18579237825185110751042Weighted base
471208272173116257Good job25%18%22%22%29%20%28%22%25%
117547218119426551573Bad job63%82%52%58%47%50%59%69%55%
21-24786025147212Don't know12%-26%21%24%30%13%10%20%
Page 13
Opinion PollCATI Fieldwork : 10th-12th April 2015
Absolutes/col percents
Table 7Q3. From what you have seen or heard, do you think the leader of the opposition Ed Miliband has done a good job or a bad job?Base: All respondents
Prepared on behalf of The Guardian by ICMUnlimited - Confidential

Vote In 2010RegionGeneral ElectionVoting IntentionSocial ClassAgeGender
NET:Eng-NET:
land &Eng-Mid-Scot-LibLibFe-WaleslandSouthlandsNorthWaleslandDemLabConOtherUKIPDemLabConDEC2C1AB65+35-6425-3418-24maleMaleTotal
95290037026926152901422172749964562392802571332424102335251641205544881042Unweighted base
95089837027125752921381892249260482342672362253072742115311691315434991042Weighted base
30929412991741531664510223114052129708376110771913933147192339Good job32%33%35%34%29%28%33%48%24%45%25%18%83%22%48%30%37%25%40%36%36%23%25%27%38%33%
513481189142150324260135108594681571231231091851371172719968289265555Bad job54%54%51%52%58%61%46%44%71%48%64%77%16%67%46%52%48%60%50%55%51%59%52%53%53%53%
1291235138336191291510312615433347261869313110741148Don't know14%14%14%14%13%11%21%9%5%7%11%5%2%11%6%18%14%15%9%8%13%18%23%20%8%14%
Page 14
Opinion PollCATI Fieldwork : 10th-12th April 2015
Absolutes/col percents
Table 8Q3. From what you have seen or heard, do you think the leader of the Liberal Democrats, Nick Clegg has done a good job or a bad job?Base: All respondents
Prepared on behalf of The Guardian by ICMUnlimited - Confidential

Constituency categorySafe
SafeLabourConser(i.e.
AllvativeLabLab-(i.e.heldConLabConConANDheldheld
marginheld>1Lab>10LD-ANDANDals5.1%,.1%,heldCON<15LAB<10
(1+2)Scotlaininseats% in%, inabove.OtherndE&W)E&W)in E&WE&W.E&W.Total
21989034925279130891042Unweighted base
18579237825185110751042Weighted base
5223116144352824339Good job28%29%33%43%18%41%26%32%33%
108442171163386742555Bad job59%67%46%45%65%44%61%56%53%
24*19454513159148Don't know13%4%21%12%18%15%14%13%14%
Page 15
Opinion PollCATI Fieldwork : 10th-12th April 2015
Absolutes/col percents
Table 8Q3. From what you have seen or heard, do you think the leader of the Liberal Democrats, Nick Clegg has done a good job or a bad job?Base: All respondents
Prepared on behalf of The Guardian by ICMUnlimited - Confidential

Vote In 2010RegionGeneral ElectionVoting IntentionSocial ClassAgeGender
NET:Eng-NET:
land &Eng-Mid-Scot-LibLibFe-WaleslandSouthlandsNorthWaleslandDemLabConOtherUKIPDemLabConDEC2C1AB65+35-6425-3418-24maleMaleTotal
95290037026926152901422172749964562392802571332424102335251641205544881042Unweighted base
95089837027125752921381892249260482342672362253072742115311691315434991042Weighted base
3273091251008418203755939531450108857910380822054416137210347Good job34%34%34%37%33%35%21%27%29%41%10%87%30%21%41%36%35%33%29%39%39%26%12%25%42%33%
45942917612812530548911598767291601171058316416110222010091292222513Bad job48%48%48%47%49%58%59%64%61%44%83%12%59%68%44%45%37%53%59%48%42%59%69%54%45%49%
1641616944483181219347*524424563413227106252411567182Don't know17%18%19%16%19%6%20%9%10%15%7%1%11%10%16%19%28%13%12%13%20%15%18%21%13%17%
Page 16
Opinion PollCATI Fieldwork : 10th-12th April 2015
Absolutes/col percents
Table 9Q3. From what you have seen or heard, do you think the leader of UKIP Nigel Farage has done a good job or a bad job?Base: All respondents
Prepared on behalf of The Guardian by ICMUnlimited - Confidential

Constituency categorySafe
SafeLabourConser(i.e.
AllvativeLabLab-(i.e.heldConLabConConANDheldheld
marginheld>1Lab>10LD-ANDANDals5.1%,.1%,heldCON<15LAB<10
(1+2)Scotlaininseats% in%, inabove.OtherndE&W)E&W)in E&WE&W.E&W.Total
21989034925279130891042Unweighted base
18579237825185110751042Weighted base
5132016362312724347Good job28%42%21%43%25%37%25%32%33%
113454148126456647513Bad job61%58%59%39%50%53%60%63%49%
21-1866639173182Don't know11%-20%18%25%10%16%5%17%
Page 17
Opinion PollCATI Fieldwork : 10th-12th April 2015
Absolutes/col percents
Table 9Q3. From what you have seen or heard, do you think the leader of UKIP Nigel Farage has done a good job or a bad job?Base: All respondents
Prepared on behalf of The Guardian by ICMUnlimited - Confidential

Vote In 2010RegionGeneral ElectionVoting IntentionSocial ClassAgeGender
NET:Eng-NET:
land &Eng-Mid-Scot-LibLibFe-WaleslandSouthlandsNorthWaleslandDemLabConOtherUKIPDemLabConDEC2C1AB65+35-6425-3418-24maleMaleTotal
95290037026926152901422172749964562392802571332424102335251641205544881042Unweighted base
95089837027125752921381892249260482342672362253072742115311691315434991042Weighted base
3673451428611722637494827423201001119171118150952236943177253430Good job39%38%38%32%46%42%68%54%50%36%81%38%41%43%42%39%32%38%55%45%42%41%33%33%51%41%
28126410091741717355095819105610871739164851344039163136298Bad job30%29%27%34%29%32%19%25%26%43%9%31%20%24%40%30%32%30%23%40%25%24%30%30%27%29%
3022881299466131229464791919794874829959321736049203110314Don't know32%32%35%35%26%26%13%21%24%21%10%31%39%34%18%31%36%32%22%15%33%36%37%37%22%30%
Page 18
Opinion PollCATI Fieldwork : 10th-12th April 2015
Absolutes/col percents
Table 10Q3. From what you have seen or heard, do you think the leader of the SNP, Nicola Sturgeon has done a good job or a bad job?Base: All respondents
Prepared on behalf of The Guardian by ICMUnlimited - Confidential

Constituency categorySafe
SafeLabourConser(i.e.
AllvativeLabLab-(i.e.heldConLabConConANDheldheld
marginheld>1Lab>10LD-ANDANDals5.1%,.1%,heldCON<15LAB<10
(1+2)Scotlaininseats% in%, inabove.OtherndE&W)E&W)in E&WE&W.E&W.Total
21989034925279130891042Unweighted base
18579237825185110751042Weighted base
7636315777274037430Good job41%52%68%41%31%32%36%49%41%
61-1711177245010298Bad job33%-19%29%31%29%46%14%29%
4831211097342028314Don't know26%48%13%29%39%40%18%37%30%
Page 19
Opinion PollCATI Fieldwork : 10th-12th April 2015
Absolutes/col percents
Table 10Q3. From what you have seen or heard, do you think the leader of the SNP, Nicola Sturgeon has done a good job or a bad job?Base: All respondents
Prepared on behalf of The Guardian by ICMUnlimited - Confidential

Vote In 2010RegionGeneral ElectionVoting IntentionSocial ClassAgeGender
NET:Eng-NET:
land &Eng-Mid-Scot-LibLibFe-WaleslandSouthlandsNorthWaleslandDemLabConOtherUKIPDemLabConDEC2C1AB65+35-6425-3418-24maleMaleTotal
95290037026926152901422172749964562392802571332424102335251641205544881042Unweighted base
95089837027125752921381892249260482342672362253072742115311691315434991042Weighted base
27325010671742326617939521418776362599484791265736169129298Good job29%28%29%26%29%43%28%44%42%17%56%23%38%33%24%26%26%31%31%38%24%34%27%31%26%29%
338319136948919265159109223312721267382109101811945336154211365Bad job36%36%37%35%35%37%29%37%31%49%24%55%26%31%47%31%36%35%37%38%37%32%27%28%42%35%
33932912810794104025507618131886781018510489512105860220158379Don't know36%37%35%39%37%19%43%18%27%34%19%22%37%37%29%43%38%34%33%24%40%34%45%41%32%36%
Page 20
Opinion PollCATI Fieldwork : 10th-12th April 2015
Absolutes/col percents
Table 11Q3. From what you have seen or heard, do you think the leader of the Green Party, Natalie Bennett has done a good job or a bad job?Base: All respondents
Prepared on behalf of The Guardian by ICMUnlimited - Confidential

Constituency categorySafe
SafeLabourConser(i.e.
AllvativeLabLab-(i.e.heldConLabConConANDheldheld
marginheld>1Lab>10LD-ANDANDals5.1%,.1%,heldCON<15LAB<10
(1+2)Scotlaininseats% in%, inabove.OtherndE&W)E&W)in E&WE&W.E&W.Total
21989034925279130891042Unweighted base
18579237825185110751042Weighted base
54-2611461313321298Good job29%-28%30%24%36%30%29%29%
6952614174284821365Bad job38%74%29%37%29%33%44%29%35%
61240122116262932379Don't know33%26%43%32%46%30%27%43%36%
Page 21
Opinion PollCATI Fieldwork : 10th-12th April 2015
Absolutes/col percents
Table 11Q3. From what you have seen or heard, do you think the leader of the Green Party, Natalie Bennett has done a good job or a bad job?Base: All respondents
Prepared on behalf of The Guardian by ICMUnlimited - Confidential

Vote In 2010RegionGeneral ElectionVoting IntentionSocial ClassAgeGender
NET:Eng-NET:
land &Eng-Mid-Scot-LibLibFe-WaleslandSouthlandsNorthWaleslandDemLabConOtherUKIPDemLabConDEC2C1AB65+35-6425-3418-24maleMaleTotal
95290037026926152901422172749964562392802571332424102335251641205544881042Unweighted base
95089837027125752921381892249260482342672362253072742115311691315434991042Weighted base
461437166141130245275113776138201411021131101541371182438468257257513Yes48%49%45%52%51%46%57%54%60%34%66%62%42%60%38%48%49%50%50%56%46%50%52%47%51%49%
40037816310810622365463133282128811519499131111742337257223212436No42%42%44%40%41%43%39%39%34%59%30%35%57%35%57%40%44%43%41%35%44%43%44%41%43%42%
908441222064912144211214291722251955136633093Don't know9%9%11%8%8%11%4%6%7%6%4%2%1%5%5%12%7%7%9%9%10%8%5%12%6%9%
Page 22
Opinion PollCATI Fieldwork : 10th-12th April 2015
Absolutes/col percents
Table 12Q4. Thinking about David Cameron, would you say he... Has more style than substanceBase: All respondents
Prepared on behalf of The Guardian by ICMUnlimited - Confidential

Constituency categorySafe
SafeLabourConser(i.e.
AllvativeLabLab-(i.e.heldConLabConConANDheldheld
marginheld>1Lab>10LD-ANDANDals5.1%,.1%,heldCON<15LAB<10
(1+2)Scotlaininseats% in%, inabove.OtherndE&W)E&W)in E&WE&W.E&W.Total
21989034925279130891042Unweighted base
18579237825185110751042Weighted base
100252177121355445513Yes54%36%57%47%48%41%49%61%49%
7643616389495026436No41%64%39%43%36%57%45%35%42%
9-4374116393Don't know5%-4%10%16%1%5%4%9%
Page 23
Opinion PollCATI Fieldwork : 10th-12th April 2015
Absolutes/col percents
Table 12Q4. Thinking about David Cameron, would you say he... Has more style than substanceBase: All respondents
Prepared on behalf of The Guardian by ICMUnlimited - Confidential

Vote In 2010RegionGeneral ElectionVoting IntentionSocial ClassAgeGender
NET:Eng-NET:
land &Eng-Mid-Scot-LibLibFe-WaleslandSouthlandsNorthWaleslandDemLabConOtherUKIPDemLabConDEC2C1AB65+35-6425-3418-24maleMaleTotal
95290037026926152901422172749964562392802571332424102335251641205544881042Unweighted base
95089837027125752921381892249260482342672362253072742115311691315434991042Weighted base
34432414087962028343214114101033208878496105921874945166206372Yes36%36%38%32%38%39%30%25%17%63%15%16%21%14%78%37%37%31%38%44%35%29%34%31%41%36%
559529210166153305899154757450382004913813219914910831511283351266617No59%59%57%61%60%57%63%72%82%34%80%83%79%85%18%59%58%65%54%51%59%66%63%65%53%59%
474519187264374*-21011101220112984262653Don't know5%5%5%7%3%4%6%3%1%3%4%1%-1%4%5%4%4%7%5%6%5%3%5%5%5%
Page 24
Opinion PollCATI Fieldwork : 10th-12th April 2015
Absolutes/col percents
Table 13Q4. Thinking about David Cameron, would you say he... Understands people like meBase: All respondents
Prepared on behalf of The Guardian by ICMUnlimited - Confidential

Constituency categorySafe
SafeLabourConser(i.e.
AllvativeLabLab-(i.e.heldConLabConConANDheldheld
marginheld>1Lab>10LD-ANDANDals5.1%,.1%,heldCON<15LAB<10
(1+2)Scotlaininseats% in%, inabove.OtherndE&W)E&W)in E&WE&W.E&W.Total
21989034925279130891042Unweighted base
18579237825185110751042Weighted base
6732814876334126372Yes36%52%30%39%30%39%37%35%36%
114358201166506846617No62%48%63%53%66%59%62%62%59%
3-6291021253Don't know2%-6%8%4%2%1%3%5%
Page 25
Opinion PollCATI Fieldwork : 10th-12th April 2015
Absolutes/col percents
Table 13Q4. Thinking about David Cameron, would you say he... Understands people like meBase: All respondents
Prepared on behalf of The Guardian by ICMUnlimited - Confidential

Vote In 2010RegionGeneral ElectionVoting IntentionSocial ClassAgeGender
NET:Eng-NET:
land &Eng-Mid-Scot-LibLibFe-WaleslandSouthlandsNorthWaleslandDemLabConOtherUKIPDemLabConDEC2C1AB65+35-6425-3418-24maleMaleTotal
95290037026926152901422172749964562392802571332424102335251641205544881042Unweighted base
95089837027125752921381892249260482342672362253072742115311691315434991042Weighted base
55652722414915328508053193302437692541361431621651383208563290316606Yes58%59%61%55%60%54%55%58%28%86%32%39%76%30%95%58%63%53%60%65%60%50%48%53%63%58%
359338139103962140541302961368160139176133100651917963230169399No38%38%37%38%38%41%43%39%69%13%67%59%16%68%5%38%34%43%36%31%36%47%48%42%34%38%
35337197324621145*9712981955231437Don't know4%4%2%7%3%5%2%3%3%1%1%2%8%2%*4%3%4%3%4%4%3%4%4%3%4%
Page 26
Opinion PollCATI Fieldwork : 10th-12th April 2015
Absolutes/col percents
Table 14Q4. Thinking about David Cameron, would you say he... Could make a good prime ministerBase: All respondents
Prepared on behalf of The Guardian by ICMUnlimited - Confidential

Constituency categorySafe
SafeLabourConser(i.e.
AllvativeLabLab-(i.e.heldConLabConConANDheldheld
marginheld>1Lab>10LD-ANDANDals5.1%,.1%,heldCON<15LAB<10
(1+2)Scotlaininseats% in%, inabove.OtherndE&W)E&W)in E&WE&W.E&W.Total
21989034925279130891042Unweighted base
18579237825185110751042Weighted base
102550242127556834606Yes55%68%55%64%50%65%61%46%58%
77240126109264037399No42%32%43%33%43%31%36%49%38%
6-2101633337Don't know3%-2%3%6%4%2%5%4%
Page 27
Opinion PollCATI Fieldwork : 10th-12th April 2015
Absolutes/col percents
Table 14Q4. Thinking about David Cameron, would you say he... Could make a good prime ministerBase: All respondents
Prepared on behalf of The Guardian by ICMUnlimited - Confidential

Vote In 2010RegionGeneral ElectionVoting IntentionSocial ClassAgeGender
NET:Eng-NET:
land &Eng-Mid-Scot-LibLibFe-WaleslandSouthlandsNorthWaleslandDemLabConOtherUKIPDemLabConDEC2C1AB65+35-6425-3418-24maleMaleTotal
95290037026926152901422172749964562392802571332424102335251641205544881042Unweighted base
95089837027125752921381892249260482342672362253072742115311691315434991042Weighted base
344320133939423233854893121117989881059281841717240213154366Yes36%36%36%34%37%44%25%28%29%40%34%34%23%34%33%37%46%30%30%40%32%43%30%39%31%35%
494473185147141215381125115533733135147120791841631112937666249298547No52%53%50%54%55%41%58%59%66%52%57%62%68%58%55%51%35%60%60%53%55%45%50%46%60%53%
113105513122816181019825203127413129166720258147128Don't know12%12%14%12%9%15%17%13%5%9%9%4%9%9%12%12%18%10%11%8%13%12%19%15%9%12%
Page 28
Opinion PollCATI Fieldwork : 10th-12th April 2015
Absolutes/col percents
Table 15Q5. Thinking about Ed Miliband, would you say he... Has more style than substanceBase: All respondents
Prepared on behalf of The Guardian by ICMUnlimited - Confidential

Constituency categorySafe
SafeLabourConser(i.e.
AllvativeLabLab-(i.e.heldConLabConConANDheldheld
marginheld>1Lab>10LD-ANDANDals5.1%,.1%,heldCON<15LAB<10
(1+2)Scotlaininseats% in%, inabove.OtherndE&W)E&W)in E&WE&W.E&W.Total
21989034925279130891042Unweighted base
18579237825185110751042Weighted base
7732311696365027366Yes42%51%25%31%38%42%45%36%35%
92353211121415042547No50%49%58%56%48%48%46%56%53%
16-1650348106128Don't know8%-17%13%14%10%9%8%12%
Page 29
Opinion PollCATI Fieldwork : 10th-12th April 2015
Absolutes/col percents
Table 15Q5. Thinking about Ed Miliband, would you say he... Has more style than substanceBase: All respondents
Prepared on behalf of The Guardian by ICMUnlimited - Confidential

Vote In 2010RegionGeneral ElectionVoting IntentionSocial ClassAgeGender
NET:Eng-NET:
land &Eng-Mid-Scot-LibLibFe-WaleslandSouthlandsNorthWaleslandDemLabConOtherUKIPDemLabConDEC2C1AB65+35-6425-3418-24maleMaleTotal
95290037026926152901422172749964562392802571332424102335251641205544881042Unweighted base
95089837027125752921381892249260482342672362253072742115311691315434991042Weighted base
42039816411711722296212273391320180959590142122732387663245205450Yes44%44%44%43%46%43%32%45%65%33%42%21%40%77%36%40%40%46%45%35%45%45%48%45%41%43%
44141516312512726506359138514824431561151071411281182387956232259491No46%46%44%46%50%50%54%46%31%62%55%79%50%18%58%49%48%46%47%56%45%47%42%43%52%47%
8985432912413138132-4121727282423205513136734101Don't know9%9%12%11%5%8%14%9%4%6%2%-9%5%6%11%12%8%8%10%10%8%10%12%7%10%
Page 30
Opinion PollCATI Fieldwork : 10th-12th April 2015
Absolutes/col percents
Table 16Q5. Thinking about Ed Miliband, would you say he... Understands people like meBase: All respondents
Prepared on behalf of The Guardian by ICMUnlimited - Confidential

Constituency categorySafe
SafeLabourConser(i.e.
AllvativeLabLab-(i.e.heldConLabConConANDheldheld
marginheld>1Lab>10LD-ANDANDals5.1%,.1%,heldCON<15LAB<10
(1+2)Scotlaininseats% in%, inabove.OtherndE&W)E&W)in E&WE&W.E&W.Total
21989034925279130891042Unweighted base
18579237825185110751042Weighted base
85229155122345133450Yes46%29%32%41%49%40%47%45%43%
90350180104405337491No49%45%54%48%41%48%48%50%47%
1021342251064101Don't know5%26%14%11%10%12%5%5%10%
Page 31
Opinion PollCATI Fieldwork : 10th-12th April 2015
Absolutes/col percents
Table 16Q5. Thinking about Ed Miliband, would you say he... Understands people like meBase: All respondents
Prepared on behalf of The Guardian by ICMUnlimited - Confidential

Vote In 2010RegionGeneral ElectionVoting IntentionSocial ClassAgeGender
NET:Eng-NET:
land &Eng-Mid-Scot-LibLibFe-WaleslandSouthlandsNorthWaleslandDemLabConOtherUKIPDemLabConDEC2C1AB65+35-6425-3418-24maleMaleTotal
95290037026926152901422172749964562392802571332424102335251641205544881042Unweighted base
95089837027125752921381892249260482342672362253072742115311691315434991042Weighted base
282265110787717264310622286151682563748784501505256162146308Yes30%30%30%29%30%32%29%31%56%10%30%10%30%72%9%27%33%28%31%24%28%31%42%30%29%30%
563536217160160265882601915952293923715112518416114131810755301320620No59%60%59%59%62%51%63%59%32%85%64%86%60%17%89%64%56%60%59%67%60%63%42%55%64%60%
106974333209813231163528622263729206310208033113Don't know11%11%12%12%8%17%8%10%12%5%6%4%10%12%2%9%11%12%10%10%12%6%15%15%7%11%
Page 32
Opinion PollCATI Fieldwork : 10th-12th April 2015
Absolutes/col percents
Table 17Q5. Thinking about Ed Miliband, would you say he... Could make a good prime ministerBase: All respondents
Prepared on behalf of The Guardian by ICMUnlimited - Confidential

Constituency categorySafe
SafeLabourConser(i.e.
AllvativeLabLab-(i.e.heldConLabConConANDheldheld
marginheld>1Lab>10LD-ANDANDals5.1%,.1%,heldCON<15LAB<10
(1+2)Scotlaininseats% in%, inabove.OtherndE&W)E&W)in E&WE&W.E&W.Total
21989034925279130891042Unweighted base
18579237825185110751042Weighted base
4812693111172721308Yes26%18%29%25%44%20%25%28%30%
122358238108617250620No66%45%63%63%43%72%66%67%60%
142846327104113Don't know8%37%8%12%13%8%9%5%11%
Page 33
Opinion PollCATI Fieldwork : 10th-12th April 2015
Absolutes/col percents
Table 17Q5. Thinking about Ed Miliband, would you say he... Could make a good prime ministerBase: All respondents
Prepared on behalf of The Guardian by ICMUnlimited - Confidential

Vote In 2010RegionGeneral ElectionVoting IntentionSocial ClassAgeGender
NET:Eng-NET:
land &Eng-Mid-Scot-LibLibFe-WaleslandSouthlandsNorthWaleslandDemLabConOtherUKIPDemLabConDEC2C1AB65+35-6425-3418-24maleMaleTotal
95290037026926152901422172749964562392802571332424102335251641205544881042Unweighted base
95089837027125752921381892249260482342672362253072742115311691315434991042Weighted base
1611475048501334296375753853413757611883464812174195Labour forms a17%16%13%18%20%26%37%21%33%3%62%8%7%36%1%17%16%18%22%8%16%27%37%22%15%19%coalition including the
SNP AND the Greens
194182805349112343109633214127544160635313124999118217The Conservatives form20%20%22%19%19%22%25%31%5%43%3%5%44%2%48%23%18%19%23%25%25%14%7%18%24%21%another coalition with
Liberal Democrats
148146405651176860337125531444238368524106689155The Conservatives form16%16%11%21%20%3%8%4%4%27%3%61%1%1%21%13%20%14%14%17%16%14%7%12%18%15%a coalition with UKIP
1161074632299319569331176120184239246212216356119Labour forms a12%12%12%12%11%17%4%14%30%4%4%4%23%33%1%8%8%14%14%12%12%7%16%12%11%11%coalition with the
Liberal Democrats
10095402629541418145*335241320442724442885648104Labour and the11%11%11%10%11%9%4%10%9%6%6%1%6%15%9%5%9%14%10%11%8%16%6%10%10%10%Conservatives form a
grand coalitiontogether
736835122157114271142439212317193533210265480The Conservatives try8%8%9%4%8%9%8%8%2%12%11%6%5%2%15%9%10%5%7%17%6%1%8%5%11%8%to form a minority
government
9589462816561218658716122620351995427107130101Other10%10%12%10%6%10%7%9%10%3%5%13%15%7%4%11%9%11%7%4%10%16%8%13%6%10%
101072112121*--213513381121012None of these1%1%2%1%*1%2%1%1%**--1%*1%2%*1%1%1%*1%*2%1%
55532616112549452-952617115831615411959Don't know6%6%7%6%4%4%5%3%5%2%5%3%-4%2%11%8%4%2%4%6%4%11%8%4%6%
Page 34
Opinion PollCATI Fieldwork : 10th-12th April 2015
Absolutes/col percents
Table 18Q6. Many people currently think that no single party will win the 2015 General Election in May, and another coalition will need to be formed,or one party will have to try and run a minority government ON ITS OWN, without having a majority of seats in Parliament.Putting aside your own party preference, IN THE EVENT THAT THERE IS NO CLEAR WINNER, which one of the following do you think would be best for Britain?Base: All respondents
Prepared on behalf of The Guardian by ICMUnlimited - Confidential

Constituency categorySafe
SafeLabourConser(i.e.
AllvativeLabLab-(i.e.heldConLabConConANDheldheld
marginheld>1Lab>10LD-ANDANDals5.1%,.1%,heldCON<15LAB<10
(1+2)Scotlaininseats% in%, inabove.OtherndE&W)E&W)in E&WE&W.E&W.Total
21989034925279130891042Unweighted base
18579237825185110751042Weighted base
30*34397351614195Labour forms a16%3%37%10%29%6%14%19%19%coalition including the
SNP AND the Greens
453238131232916217The Conservatives form24%48%25%21%12%27%26%21%21%another coalition with
Liberal Democrats
30*7713510228155The Conservatives form16%4%8%19%14%11%20%10%15%a coalition with UKIP
2613423212197119Labour forms a14%11%4%11%13%14%17%9%11%coalition with the
Liberal Democrats
18-445313711104Labour and the10%-4%12%12%3%7%14%10%Conservatives form a
grand coalitiontogether
1417365136880The Conservatives try8%13%8%10%2%16%6%10%8%to form a minority
government
1616392015610101Other9%21%7%10%8%18%5%14%10%
1-23611-12None of these*-2%1%2%1%*-1%
5-5231933259Don't know3%-5%6%8%3%3%2%6%
Page 35
Opinion PollCATI Fieldwork : 10th-12th April 2015
Absolutes/col percents
Table 18Q6. Many people currently think that no single party will win the 2015 General Election in May, and another coalition will need to be formed,or one party will have to try and run a minority government ON ITS OWN, without having a majority of seats in Parliament.Putting aside your own party preference, IN THE EVENT THAT THERE IS NO CLEAR WINNER, which one of the following do you think would be best for Britain?Base: All respondents
Prepared on behalf of The Guardian by ICMUnlimited - Confidential

Vote In 2010RegionGeneral ElectionVoting IntentionSocial ClassAgeGender
NET:Eng-NET:
land &Eng-Mid-Scot-LibLibFe-WaleslandSouthlandsNorthWaleslandDemLabConOtherUKIPDemLabConDEC2C1AB65+35-6425-3418-24maleMaleTotal
95290037026926152901422172749964562392802571332424102335251641205544881042Unweighted base
95089837027125752921381892249260482342672362253072742115311691315434991042Weighted base
430408168117123222957291751623223424099881411311302295446190269459David Cameron & George45%45%45%43%48%42%32%41%15%78%17%39%45%15%90%42%39%46%48%62%43%32%35%35%54%44%Osborne
164151614347131428851022641162393551532983273910177178Ed Miliband & Ed Balls17%17%17%16%18%25%15%20%45%4%23%9%8%49%1%16%16%16%19%14%16%16%29%19%15%17%
3042861121007417444971324931227324838210477481838333210137347Neither32%32%30%37%29%33%48%35%38%14%54%52%46%31%9%35%36%34%28%23%35%49%25%39%28%33%
5353281113-54475-*12216191112535414421658Don't know6%6%8%4%5%-5%3%2%3%6%-*5%1%7%9%4%4%2%7%2%11%8%3%6%
Page 36
Opinion PollCATI Fieldwork : 10th-12th April 2015
Absolutes/col percents
Table 19Q7. Irrespective of which party you yourself support, which team do you think is better able to manage the economy properly?Base: All respondents
Prepared on behalf of The Guardian by ICMUnlimited - Confidential

Constituency categorySafe
SafeLabourConser(i.e.
AllvativeLabLab-(i.e.heldConLabConConANDheldheld
marginheld>1Lab>10LD-ANDANDals5.1%,.1%,heldCON<15LAB<10
(1+2)Scotlaininseats% in%, inabove.OtherndE&W)E&W)in E&WE&W.E&W.Total
21989034925279130891042Unweighted base
18579237825185110751042Weighted base
8852919975435632459David Cameron & George48%68%32%53%30%50%51%43%44%Osborne
38114406682711178Ed Miliband & Ed Balls21%11%15%11%26%9%25%15%17%
5414411688342628347Neither29%18%48%31%35%40%24%38%33%
3*5232311358Don't know2%3%5%6%9%1%1%3%6%
Page 37
Opinion PollCATI Fieldwork : 10th-12th April 2015
Absolutes/col percents
Table 19Q7. Irrespective of which party you yourself support, which team do you think is better able to manage the economy properly?Base: All respondents
Prepared on behalf of The Guardian by ICMUnlimited - Confidential

Vote In 2010RegionGeneral ElectionVoting IntentionSocial ClassAgeGender
NET:Eng-NET:
land &Eng-Mid-Scot-LibLibFe-WaleslandSouthlandsNorthWaleslandDemLabConOtherUKIPDemLabConDEC2C1AB65+35-6425-3418-24maleMaleTotal
95290037026926152901422172749964562392802571332424102335251641205544881042Unweighted base
95089837027125752921381892249260482342672362253072742115311691315434991042Weighted base
49046219714012528446315551492022211731141021701497928110272295240535Yes52%51%53%52%49%54%48%46%82%23%53%34%46%90%27%48%46%55%54%37%53%61%55%54%48%51%
40538616011011620426730154424024181841061101131181182176250204243447No43%43%43%40%45%37%45%48%16%69%45%66%50%8%69%45%49%37%43%56%41%37%38%38%49%43%
55501322155684192-25111713247143359451660Don't know6%6%3%8%6%9%6%6%2%8%2%-4%2%4%7%6%8%3%7%6%3%7%8%3%6%
Page 38
Opinion PollCATI Fieldwork : 10th-12th April 2015
Absolutes/col percents
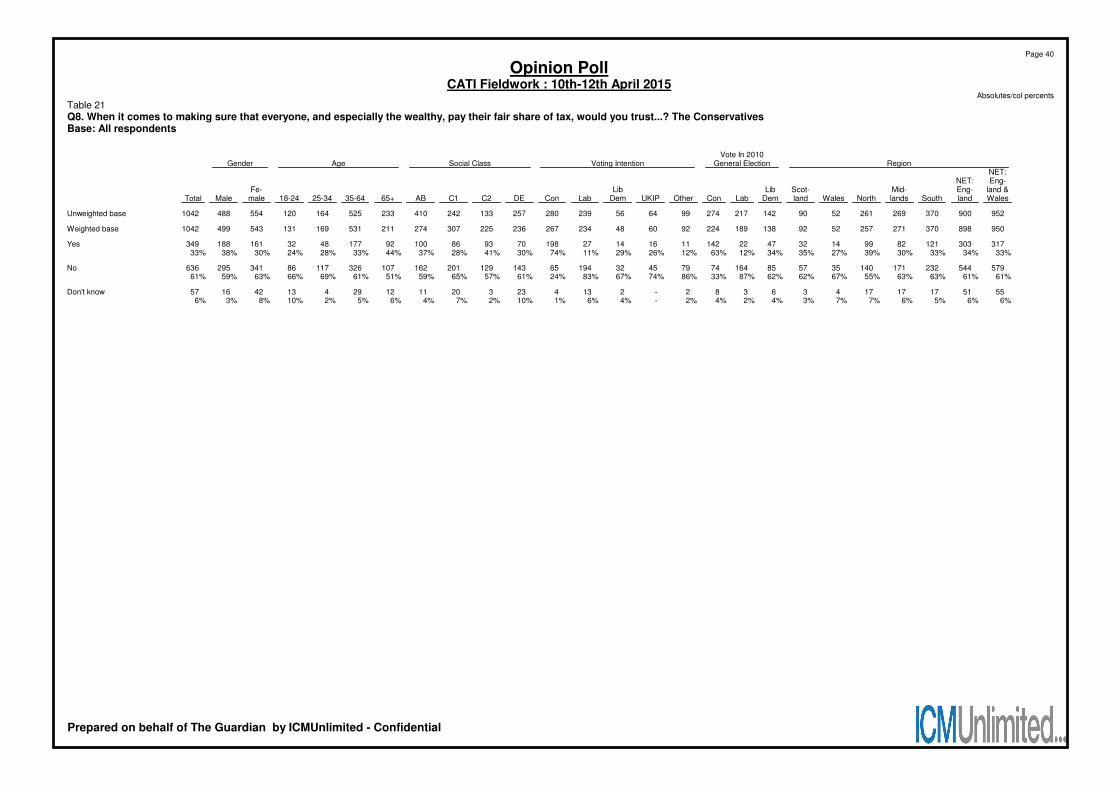
Table 20Q8. When it comes to making sure that everyone, and especially the wealthy, pay their fair share of tax, would you trust...? LabourBase: All respondents
Prepared on behalf of The Guardian by ICMUnlimited - Confidential

Constituency categorySafe
SafeLabourConser(i.e.
AllvativeLabLab-(i.e.heldConLabConConANDheldheld
marginheld>1Lab>10LD-ANDANDals5.1%,.1%,heldCON<15LAB<10
(1+2)Scotlaininseats% in%, inabove.OtherndE&W)E&W)in E&WE&W.E&W.Total
21989034925279130891042Unweighted base
18579237825185110751042Weighted base
99244195134365644535Yes54%32%48%52%53%43%51%58%51%
7934216098465030447No43%42%45%42%39%55%45%40%43%
626232025160Don't know3%26%6%6%8%2%4%1%6%
Page 39
Opinion PollCATI Fieldwork : 10th-12th April 2015
Absolutes/col percents
Table 20Q8. When it comes to making sure that everyone, and especially the wealthy, pay their fair share of tax, would you trust...? LabourBase: All respondents
Prepared on behalf of The Guardian by ICMUnlimited - Confidential
Vote In 2010RegionGeneral ElectionVoting IntentionSocial ClassAgeGender
NET:Eng-NET:
land &Eng-Mid-Scot-LibLibFe-WaleslandSouthlandsNorthWaleslandDemLabConOtherUKIPDemLabConDEC2C1AB65+35-6425-3418-24maleMaleTotal
95290037026926152901422172749964562392802571332424102335251641205544881042Unweighted base
95089837027125752921381892249260482342672362253072742115311691315434991042Weighted base
31730312182991432472214211161427198709386100921774832161188349Yes33%34%33%30%39%27%35%34%12%63%12%26%29%11%74%30%41%28%37%44%33%28%24%30%38%33%
579544232171140355785164747945321946514312920116210732611786341295636No61%61%63%63%55%67%62%62%87%33%86%74%67%83%24%61%57%65%59%51%61%69%66%63%59%61%
5551171717436382-213423320111229413421657Don't know6%6%5%6%7%7%3%4%2%4%2%-4%6%1%10%2%7%4%6%5%2%10%8%3%6%
Page 40
Opinion PollCATI Fieldwork : 10th-12th April 2015
Absolutes/col percents
Table 21Q8. When it comes to making sure that everyone, and especially the wealthy, pay their fair share of tax, would you trust...? The ConservativesBase: All respondents
Prepared on behalf of The Guardian by ICMUnlimited - Confidential

Constituency categorySafe
SafeLabourConser(i.e.
AllvativeLabLab-(i.e.heldConLabConConANDheldheld
marginheld>1Lab>10LD-ANDANDals5.1%,.1%,heldCON<15LAB<10
(1+2)Scotlaininseats% in%, inabove.OtherndE&W)E&W)in E&WE&W.E&W.Total
21989034925279130891042Unweighted base
18579237825185110751042Weighted base
6633213362363630349Yes36%38%35%35%25%43%32%40%33%
113257227165467043636No61%36%62%60%66%54%63%57%61%
623172434257Don't know3%26%3%5%10%4%4%3%6%
Page 41
Opinion PollCATI Fieldwork : 10th-12th April 2015
Absolutes/col percents
Table 21Q8. When it comes to making sure that everyone, and especially the wealthy, pay their fair share of tax, would you trust...? The ConservativesBase: All respondents
Prepared on behalf of The Guardian by ICMUnlimited - Confidential

Vote In 2010RegionGeneral ElectionVoting IntentionSocial ClassAgeGender
NET:Eng-NET:
land &Eng-Mid-Scot-LibLibFe-WaleslandSouthlandsNorthWaleslandDemLabConOtherUKIPDemLabConDEC2C1AB65+35-6425-3418-24maleMaleTotal
95290037026926152901422172749964562392802571332424102335251641205544881042Unweighted base
95089837027125752921381892249260482342672362253072742115311691315434991042Weighted base
423409151132126143988771153219391161549087147138862586652218245462Yes45%46%41%49%49%27%43%64%41%51%35%31%81%50%58%38%39%48%51%41%49%39%40%40%49%44%
44641618511911230414210497533791091011171251241211082239660255232487No47%46%50%44%44%58%45%30%55%43%58%61%18%47%38%50%56%40%44%51%42%57%46%47%47%47%
8172342018812881365*912291336141750619712192Don't know8%8%9%8%7%15%13%6%4%6%7%8%*4%5%12%6%12%5%8%9%4%15%13%4%9%
Page 42
Opinion PollCATI Fieldwork : 10th-12th April 2015
Absolutes/col percents
Table 22Q8. When it comes to making sure that everyone, and especially the wealthy, pay their fair share of tax, would you trust...? The Liberal DemocratsBase: All respondents
Prepared on behalf of The Guardian by ICMUnlimited - Confidential

Constituency categorySafe
SafeLabourConser(i.e.
AllvativeLabLab-(i.e.heldConLabConConANDheldheld
marginheld>1Lab>10LD-ANDANDals5.1%,.1%,heldCON<15LAB<10
(1+2)Scotlaininseats% in%, inabove.OtherndE&W)E&W)in E&WE&W.E&W.Total
21989034925279130891042Unweighted base
18579237825185110751042Weighted base
94*3918776445638462Yes51%6%43%50%30%52%51%51%44%
85341165139364936487No46%45%45%44%55%43%45%48%47%
6312253645192Don't know3%48%13%7%14%5%5%1%9%
Page 43
Opinion PollCATI Fieldwork : 10th-12th April 2015
Absolutes/col percents
Table 22Q8. When it comes to making sure that everyone, and especially the wealthy, pay their fair share of tax, would you trust...? The Liberal DemocratsBase: All respondents
Prepared on behalf of The Guardian by ICMUnlimited - Confidential

WeightedUnweightedTotalTotal
10421042Unweighted base
10421042Weighted base
224274Conservative21%26%
189217Labour18%21%
138142Liberal Democrat/13%14%Liberal
1419Scottish National1%2%Party/SNP
33Plaid Cymru**
1914Green Party2%1%
1927UKIP2%3%
12BNP**
37Other*1%
312262Did not vote30%25%
7647Refused7%5%
4528Don't know4%3%
Page 44
Opinion PollCATI Fieldwork : 10th-12th April 2015
Absolutes/col percents
Table 23Q.C/D Voting in May 6th 2010 General ElectionBase: All respondents
Prepared on behalf of The Guardian by ICMUnlimited - Confidential

WeightedUnweightedTotalTotal
10421042Unweighted base
10421042Weighted base
Gender
499488Male48%47%
543554Female52%53%
Age
13112018-24 (21)13%12%
16916425-34 (29.5)16%16%
20316035-44 (39.5)19%15%
17619645-54 (49.5)17%19%
15216955-64 (59.5)15%16%
21123365+ (70)20%22%
46.3347.74Average age
Page 45
Opinion PollCATI Fieldwork : 10th-12th April 2015
Absolutes/col percents
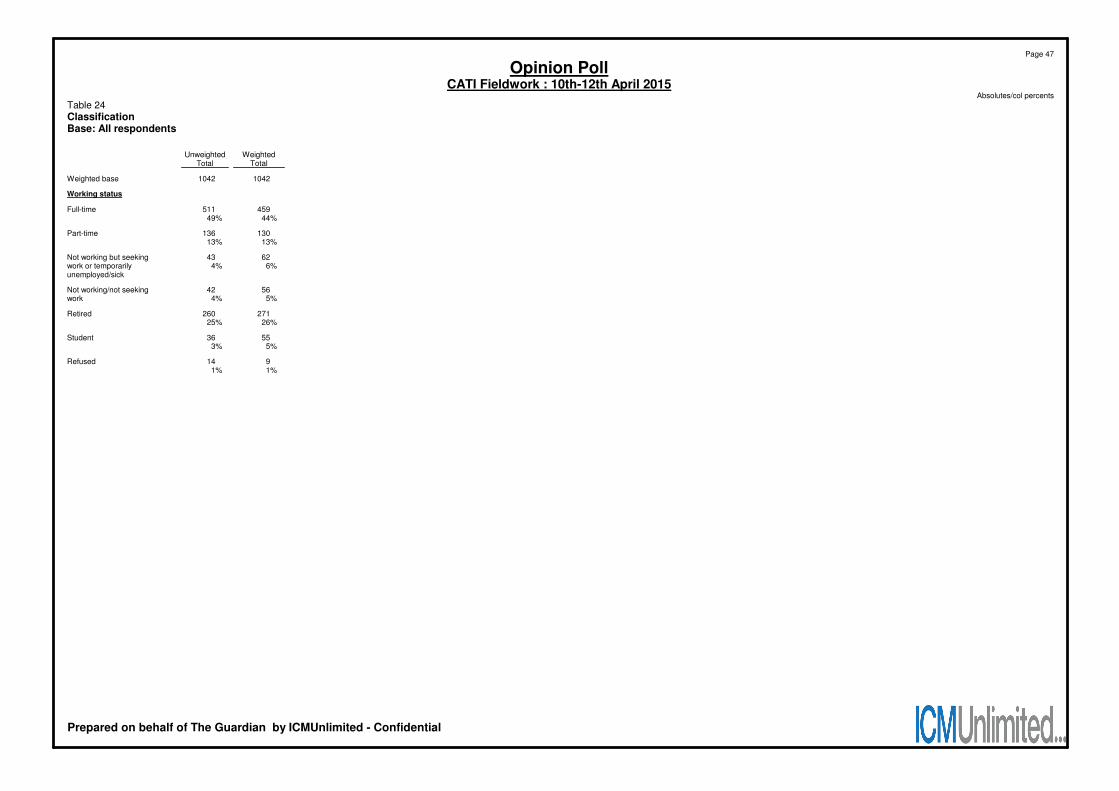
Table 24ClassificationBase: All respondents
Prepared on behalf of The Guardian by ICMUnlimited - Confidential

WeightedUnweightedTotalTotal
10421042Weighted base
Social Grade
274410AB26%39%
307242C129%23%
225133C222%13%
236257DE23%25%
Region
349351North33%34%
323321Midlands31%31%
370370South35%36%
Page 46
Opinion PollCATI Fieldwork : 10th-12th April 2015
Absolutes/col percents
Table 24ClassificationBase: All respondents
Prepared on behalf of The Guardian by ICMUnlimited - Confidential
WeightedUnweightedTotalTotal
10421042Weighted base
Working status
459511Full-time44%49%
130136Part-time13%13%
6243Not working but seeking6%4%work or temporarily
unemployed/sick
5642Not working/not seeking5%4%work
271260Retired26%25%
5536Student5%3%
914Refused1%1%
Page 47
Opinion PollCATI Fieldwork : 10th-12th April 2015
Absolutes/col percents
Table 24ClassificationBase: All respondents
Prepared on behalf of The Guardian by ICMUnlimited - Confidential

WeightedUnweightedTotalTotal
10421042Weighted base
Tenure
339351Own outright33%34%
362378Own with a mortgage35%36%
13577Council13%7%
4051Housing Ass.4%5%
144153Rented from someone14%15%else
12Rent free**
2230Refused2%3%
Page 48
Opinion PollCATI Fieldwork : 10th-12th April 2015
Absolutes/col percents
Table 24ClassificationBase: All respondents
Prepared on behalf of The Guardian by ICMUnlimited - Confidential